Exhibit 99.1
Business Update September—October 2005
CAUTIONARY NOTE ABOUT FORWARD-LOOKING STATEMENTS
FORWARD-LOOKING STATEMENTS
Certain statements in this presentation constitute “forward looking statements” within the meaning of the Private Securities Litigation Reform Act of 1995. Such statements involve risks, uncertainties and other factors which may cause actual results, performance or achievements of the Company and its subsidiaries to be materially different from any future results, performance or achievements expressed or implied by such forward-looking statements. For a discussion of these factors, we refer you to the Company’s Annual Report on Form 10-K as of and for the year ended December 31, 2004 and all other reports filed by the Company thereafter.
In light of the significant uncertainties inherent in the forward-looking statements included herein, the inclusion of such information should not be regarded as a representation by the Company or by any other person or entity that the objectives and plans of the Company will be achieved.
1
Background
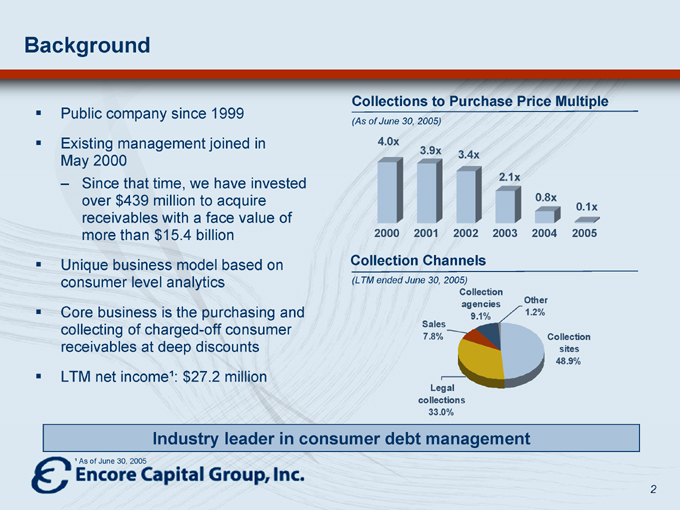
Public company since 1999 Existing management joined in May 2000
– Since that time, we have invested over $439 million to acquire receivables with a face value of more than $15.4 billion Unique business model based on consumer level analytics Core business is the purchasing and collecting of charged-off consumer receivables at deep discounts LTM net income¹: $27.2 million
Collections to Purchase Price Multiple
(As of June 30, 2005)
4.0x
3.9x
3.4x
2.1x
0.8x
0.1x
2000 2001 2002 2003 2004 2005
Collection Channels
(LTM ended June 30, 2005)
Legal collections 33.0%
Sales 7.8%
Collection agencies 9.1%
Other 1.2%
Collection sites 48.9%
Industry leader in consumer debt management
¹ As of June 30, 2005
2
Strategic Vision
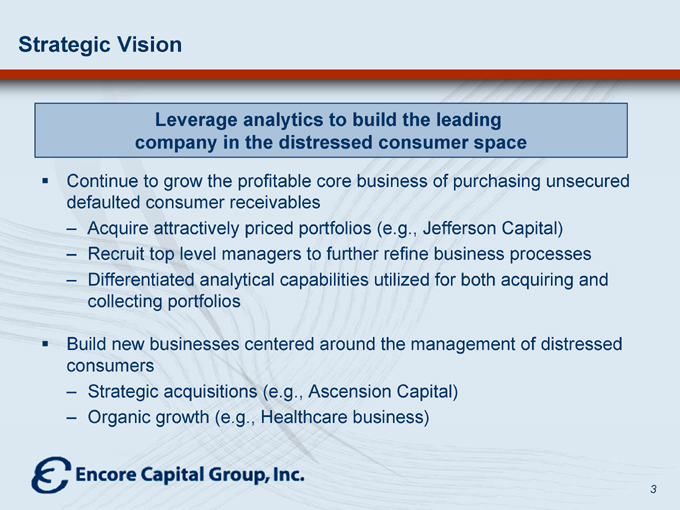
Leverage analytics to build the leading company in the distressed consumer space
Continue to grow the profitable core business of purchasing unsecured defaulted consumer receivables
– Acquire attractively priced portfolios (e.g., Jefferson Capital)
– Recruit top level managers to further refine business processes
– Differentiated analytical capabilities utilized for both acquiring and collecting portfolios
Build new businesses centered around the management of distressed consumers
– Strategic acquisitions (e.g., Ascension Capital)
– Organic growth (e.g., Healthcare business)
3
Investment Highlights
Recent acquisitions diversify asset base and enhance growth Attractive industry dynamics Differentiated analytical acquisition and collections approach Track record of generating superior financial returns Experienced management team
4
Experienced Management Team
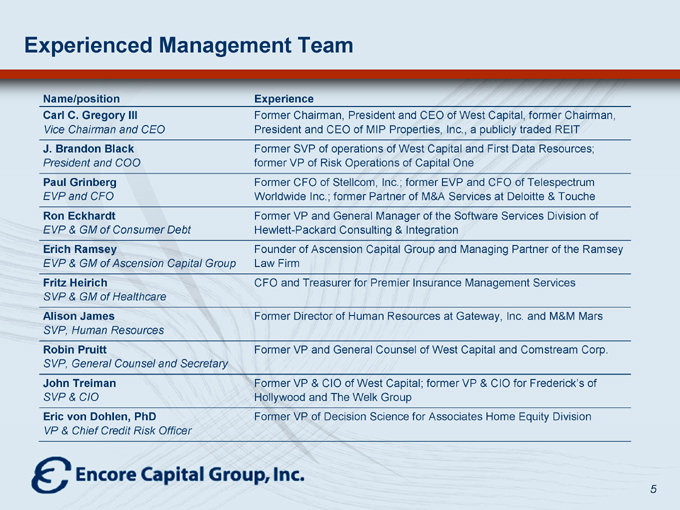
Name/position Experience
Carl C. Gregory III Former Chairman, President and CEO of West Capital, former Chairman,
Vice Chairman and CEO President and CEO of MIP Properties, Inc., a publicly traded REIT
J. Brandon Black Former SVP of operations of West Capital and First Data Resources;
President and COO former VP of Risk Operations of Capital One
Paul Grinberg Former CFO of Stellcom, Inc.; former EVP and CFO of Telespectrum
EVP and CFO Worldwide Inc.; former Partner of M&A Services at Deloitte & Touche
Ron Eckhardt Former VP and General Manager of the Software Services Division of
EVP & GM of Consumer Debt Hewlett-Packard Consulting & Integration
Erich Ramsey Founder of Ascension Capital Group and Managing Partner of the Ramsey
EVP & GM of Ascension Capital Group Law Firm
Fritz Heirich CFO and Treasurer for Premier Insurance Management Services
SVP & GM of Healthcare
Alison James Former Director of Human Resources at Gateway, Inc. and M&M Mars
SVP, Human Resources
Robin Pruitt Former VP and General Counsel of West Capital and Comstream Corp.
SVP, General Counsel and Secretary
John Treiman Former VP & CIO of West Capital; former VP & CIO for Frederick’s of
SVP & CIO Hollywood and The Welk Group
Eric von Dohlen, PhD Former VP of Decision Science for Associates Home Equity Division
VP & Chief Credit Risk Officer
5
Industry Dynamics
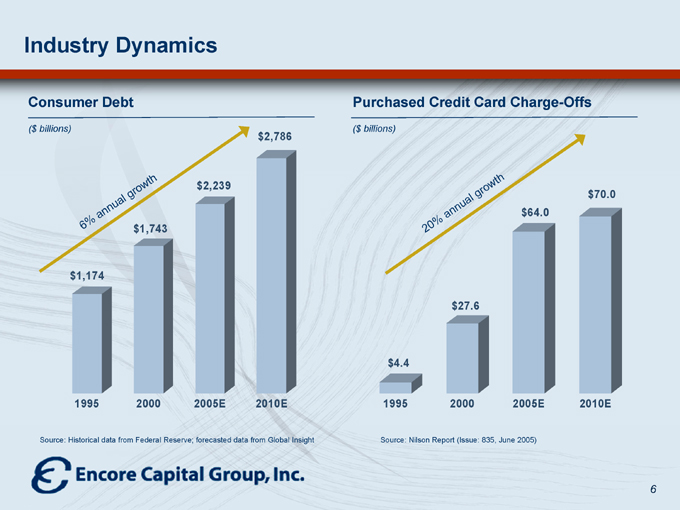
Consumer Debt
($ billions) $1,174 $1,743 $2,239 $2,786
1995 2000 2005E 2010E
6% annual growth
Source: Historical data from Federal Reserve; forecasted data from Global Insight
Purchased Credit Card Charge-Offs
($ billions)
20% annual growth
$4.4 $27.6 $64.0 $70.0
1995 2000 2005E 2010E
Source: Nilson Report (Issue: 835, June 2005)
6
Industry Dynamics
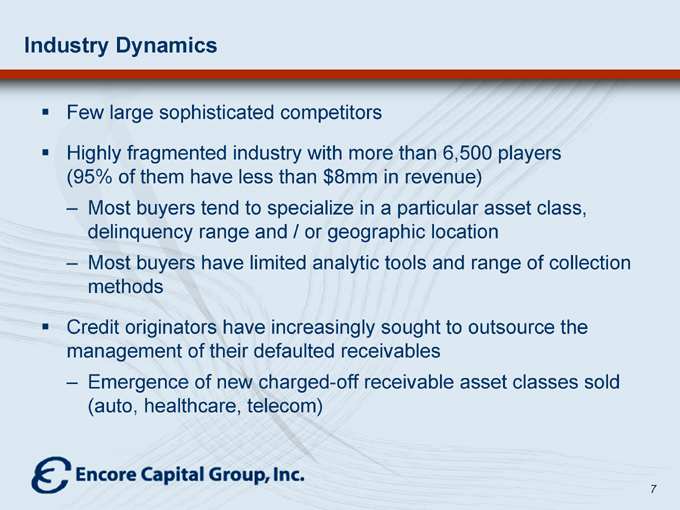
Few large sophisticated competitors
Highly fragmented industry with more than 6,500 players (95% of them have less than $8mm in revenue)
– Most buyers tend to specialize in a particular asset class, delinquency range and / or geographic location
– Most buyers have limited analytic tools and range of collection methods
Credit originators have increasingly sought to outsource the management of their defaulted receivables
– Emergence of new charged-off receivable asset classes sold (auto, healthcare, telecom)
7
Industry Dynamics
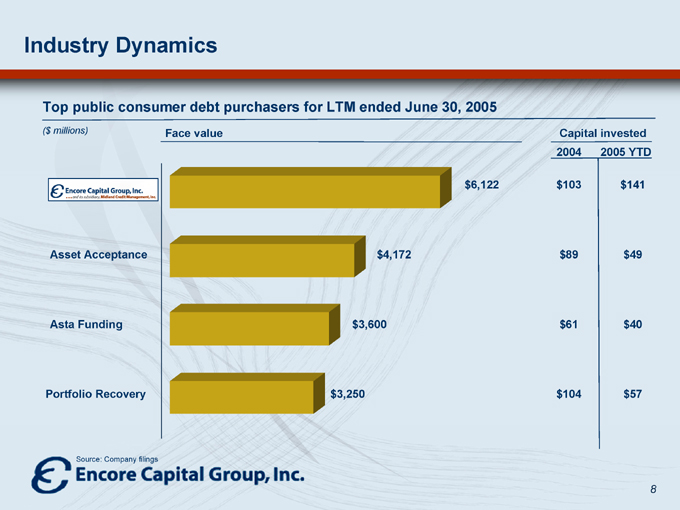
Top public consumer debt purchasers for LTM ended June 30, 2005
($ millions)
Asset Acceptance
Asta Funding
Portfolio Recovery
Face value $6,122 $4,172 $3,600 $3,250
Capital invested
2004 2005 YTD
$103 $141
$89 $49
$61 $40
$104 $57
Source: Company filings
8
Encore’s Differentiated Approach to Business
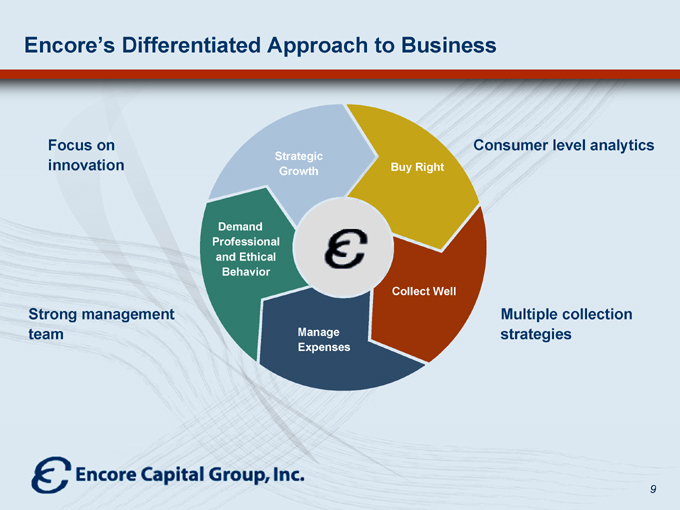
Focus on innovation
Strong management team
Consumer level analytics
Multiple collection strategies
Strategic Growth
Buy Right
Collect Well
Manage Expenses
Demand Professional and Ethical Behavior
9
Buy Right
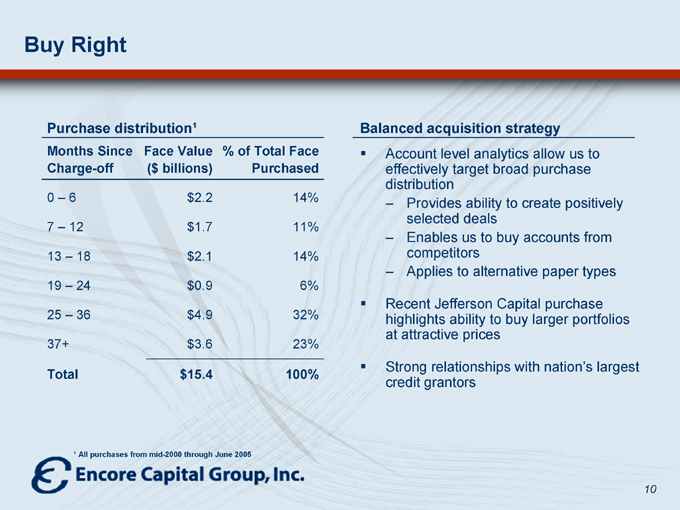
Purchase distribution¹
Months Since Charge-off Face Value ($ billions) % of Total Face Purchased
0 – 6 $2.2 14%
7 – 12 $1.7 11%
13 – 18 $2.1 14%
19 – 24 $0.9 6%
25 – 36 $4.9 32%
37+ $3.6 23%
Total $15.4 100%
Balanced acquisition strategy
Account level analytics allow us to effectively target broad purchase distribution
– Provides ability to create positively selected deals
– Enables us to buy accounts from competitors
– Applies to alternative paper types
Recent Jefferson Capital purchase highlights ability to buy larger portfolios at attractive prices
Strong relationships with nation’s largest credit grantors
¹ All purchases from mid-2000 through June 2005
10
Recent Jefferson Capital Portfolio Acquisition
Deal Overview
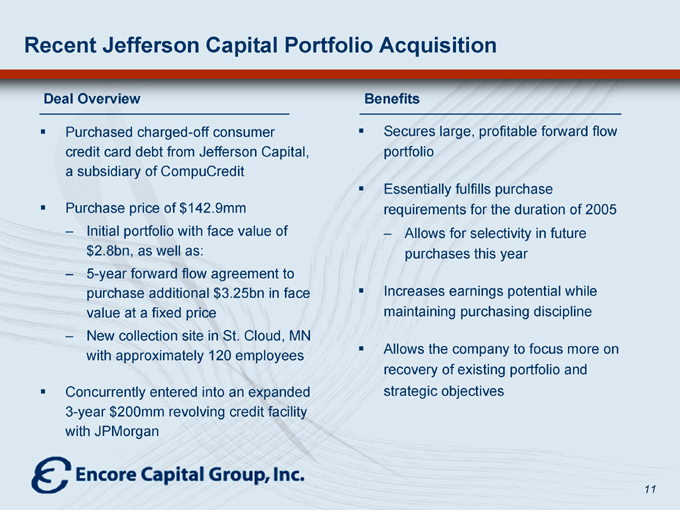
Purchased charged-off consumer credit card debt from Jefferson Capital, a subsidiary of CompuCredit
Purchase price of $142.9mm
– Initial portfolio with face value of $2.8bn, as well as:
– 5-year forward flow agreement to purchase additional $3.25bn in face value at a fixed price
– New collection site in St. Cloud, MN with approximately 120 employees
Concurrently entered into an expanded 3-year $200mm revolving credit facility with JPMorgan
Benefits
Secures large, profitable forward flow portfolio
Essentially fulfills purchase requirements for the duration of 2005
– Allows for selectivity in future purchases this year
Increases earnings potential while maintaining purchasing discipline
Allows the company to focus more on recovery of existing portfolio and strategic objectives
11
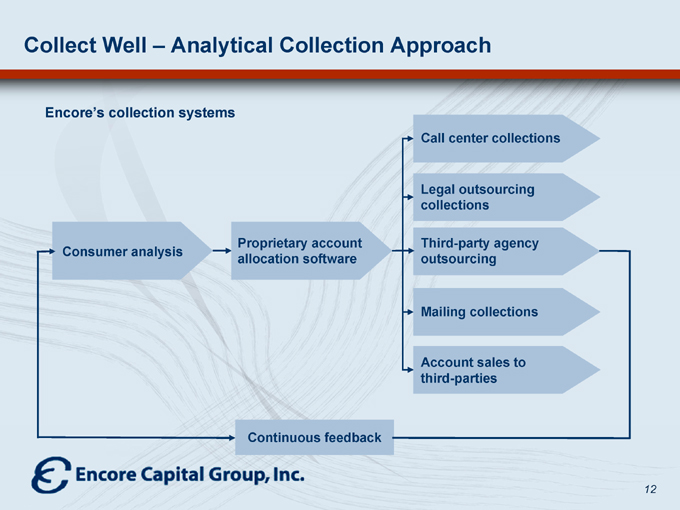
Collect Well – Analytical Collection Approach
Encore’s collection systems
Consumer analysis
Proprietary account allocation software
Call center collections
Legal outsourcing collections
Third-party agency outsourcing
Mailing collections
Account sales to third-parties
Continuous feedback
12
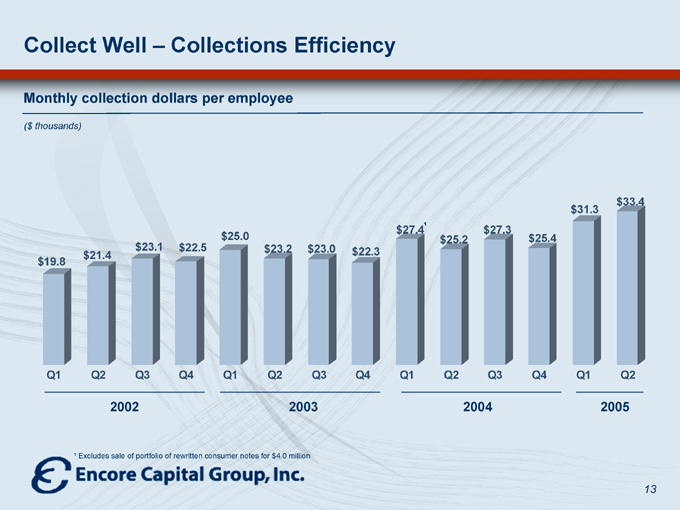
Collect Well – Collections Efficiency
Monthly collection dollars per employee
($ thousands) $19.8 $21.4 $23.1 $22.5 $25.0 $23.2 $23.0 $22.3 $27.4¹ $25.2 $27.3 $25.4 $31.3 $33.4
Q1 Q2 Q3 Q4 Q1 Q2 Q3 Q4 Q1 Q2 Q3 Q4 Q1 Q2
2002 2003 2004 2005
¹ Excludes sale of portfolio of rewritten consumer notes for $4.0 million
13
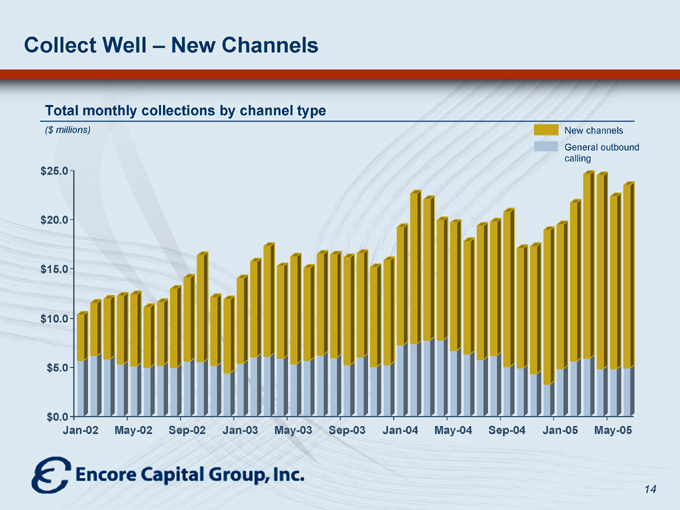
Collect Well – New Channels
Total monthly collections by channel type
($ millions) $25.0 $20.0 $15.0 $10.0 $5.0 $0.0
Jan-02 May-02 Sep-02 Jan-03 May-03 Sep-03 Jan-04 May-04 Sep-04 Jan-05 May-05
New channels General outbound calling
14
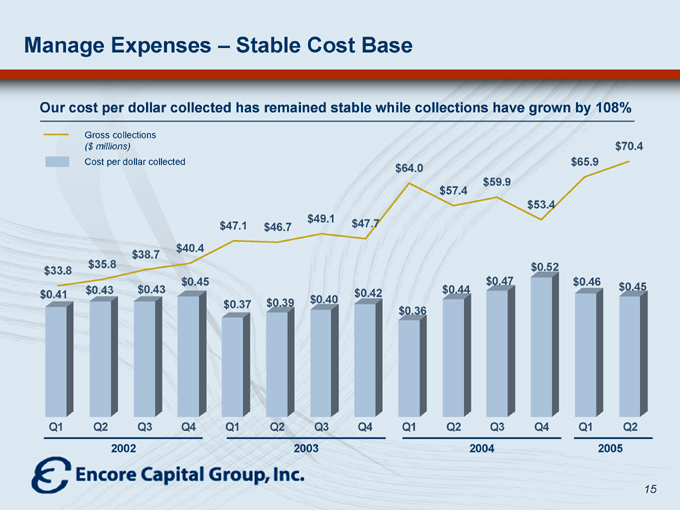
Manage Expenses – Stable Cost Base
Our cost per dollar collected has remained stable while collections have grown by 108%
Gross collections
($ millions)
Cost per dollar collected $33.8 $35.8 $38.7 $40.4 $47.1 $46.7 $49.1 $47.7 $64.0 $57.4 $59.9 $53.4 $65.9 $70.4 $0.41 $0.43 $0.43 $0.45 $0.37 $0.39 $0.40 $0.42 $0.36 $0.44 $0.47 $0.52 $0.46 $0.45
Q1 Q2 Q3 Q4 Q1 Q2 Q3 Q4 Q1 Q2 Q3 Q4 Q1 Q2
2002 2003 2004 2005
15
Professional and Ethical Behavior
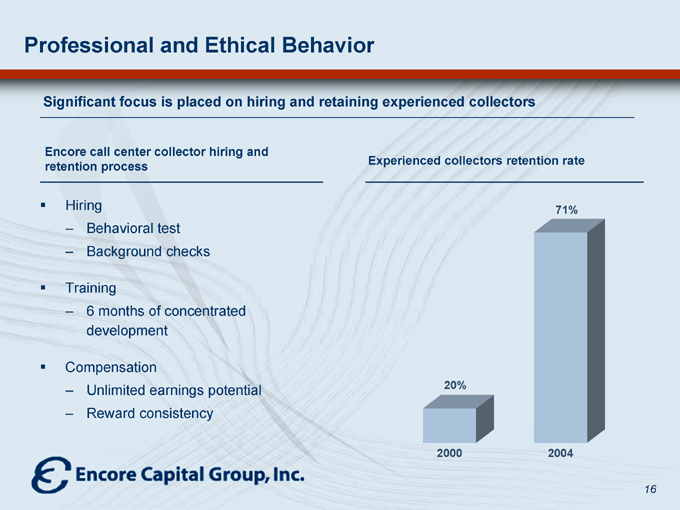
Significant focus is placed on hiring and retaining experienced collectors
Encore call center collector hiring and retention process
Hiring
– Behavioral test
– Background checks
Training
– 6 months of concentrated development
Compensation
– Unlimited earnings potential
– Reward consistency
Experienced collectors retention rate
20%
71%
2000
2004
16
Strategic Growth
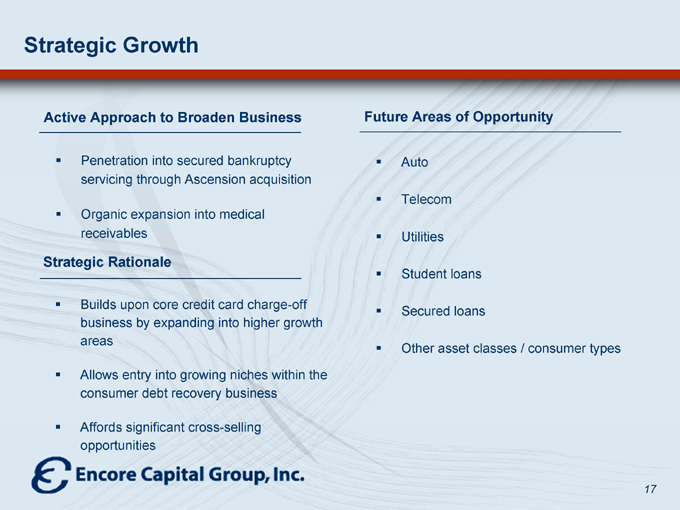
Active Approach to Broaden Business
Penetration into secured bankruptcy servicing through Ascension acquisition
Organic expansion into medical receivables
Strategic Rationale
Builds upon core credit card charge-off business by expanding into higher growth areas
Allows entry into growing niches within the consumer debt recovery business
Affords significant cross-selling opportunities
Future Areas of Opportunity
Auto Telecom Utilities Student loans Secured loans
Other asset classes / consumer types
17
Ascension Acquisition Provides Entry into Growing Bankruptcy Servicing Opportunity
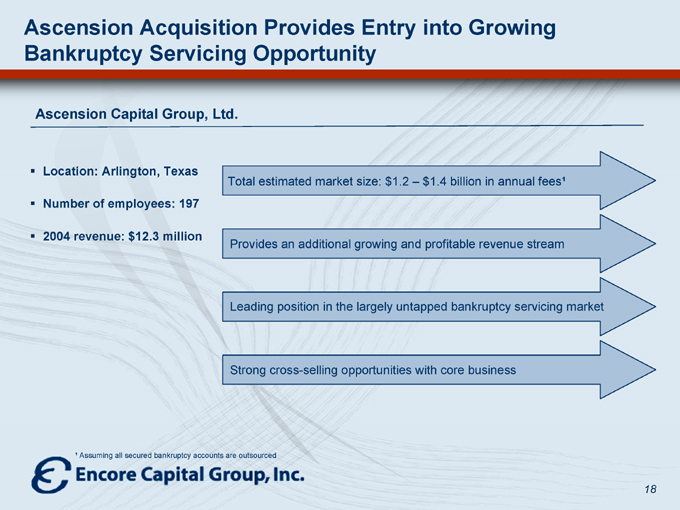
Ascension Capital Group, Ltd.
Location: Arlington, Texas Number of employees: 197 2004 revenue: $12.3 million
Total estimated market size: $1.2 – $1.4 billion in annual fees¹
Provides an additional growing and profitable revenue stream
Leading position in the largely untapped bankruptcy servicing market
Strong cross-selling opportunities with core business
¹ Assuming all secured bankruptcy accounts are outsourced
18
Healthcare Opportunity
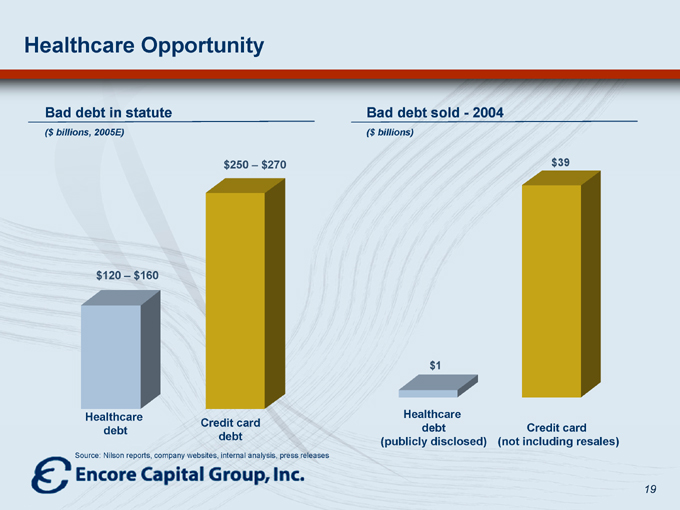
Bad debt in statute
($ billions, 2005E) $120 – $160 $250 – $270
Healthcare debt
Credit card debt
Bad debt sold—2004
($ billions) $1 $39
Healthcare debt (publicly disclosed)
Credit card (not including resales)
Source: Nilson reports, company websites, internal analysis, press releases
19
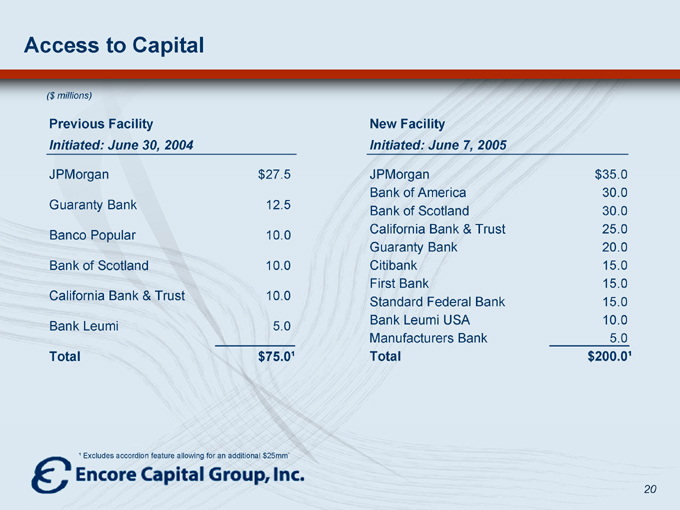
Access to Capital
($ millions)
Previous Facility
Initiated: June 30, 2004
JPMorgan $27.5
Guaranty Bank 12.5
Banco Popular 10.0
Bank of Scotland 10.0
California Bank & Trust 10.0
Bank Leumi 5.0
Total $75.0¹
New Facility
Initiated: June 7, 2005
JPMorgan $35.0
Bank of America 30.0
Bank of Scotland 30.0
California Bank & Trust 25.0
Guaranty Bank 20.0
Citibank 15.0
First Bank 15.0
Standard Federal Bank 15.0
Bank Leumi USA 10.0
Manufacturers Bank 5.0
Total $200.0¹
¹ Excludes accordion feature allowing for an additional $25mm`
20
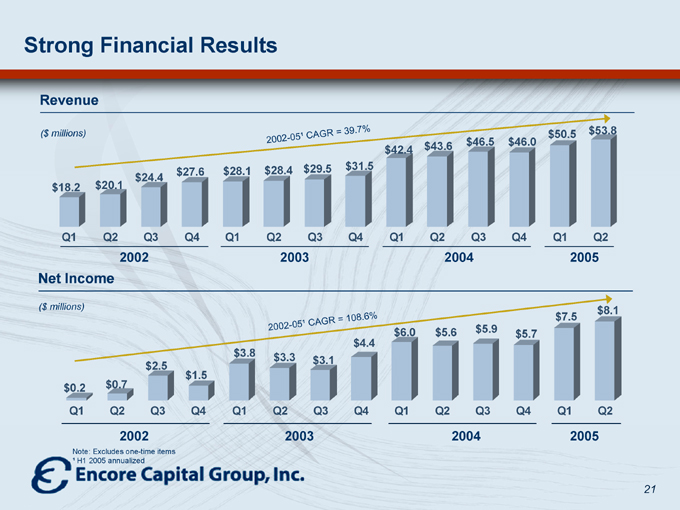
Strong Financial Results
Revenue
($ millions)
2002-05¹ CAGR = 39.7%
$18.2 $20.1 $24.4 $27.6 $28.1 $28.4 $29.5 $31.5 $42.4 $43.6 $46.5 $46.0 $50.5 $53.8
Q1 Q2 Q3 Q4 Q1 Q2 Q3 Q4 Q1 Q2 Q3 Q4 Q1 Q2
2002 2003 2004 2005
Net Income
($ millions)
2002-05¹ CAGR = 108.6%
$0.2 $0.7 $2.5 $1.5 $3.8 $3.3 $3.1 $4.4 $6.0 $5.6 $5.9 $5.7 $7.5 $8.1
Q1 Q2 Q3 Q4 Q1 Q2 Q3 Q4 Q1 Q2 Q3 Q4 Q1 Q2
2002 2003 2004 2005
Note: Excludes one-time items
¹ H1 2005 annualized
21
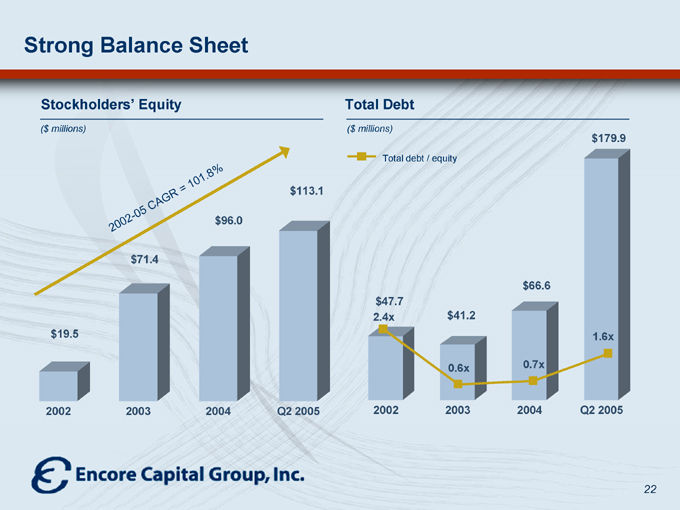
Strong Balance Sheet
Stockholders’ Equity
($ millions)
2002-05 CAGR = 101.8%
$19.5 $71.4 $96.0 $113.1
2002 2003 2004 Q2 2005
Total Debt
($ millions)
Total debt / equity $47.7 2.4x $41.2
0.6x $66.6
0.7x $179.9
1.6x
2002 2003 2004 Q2 2005
22
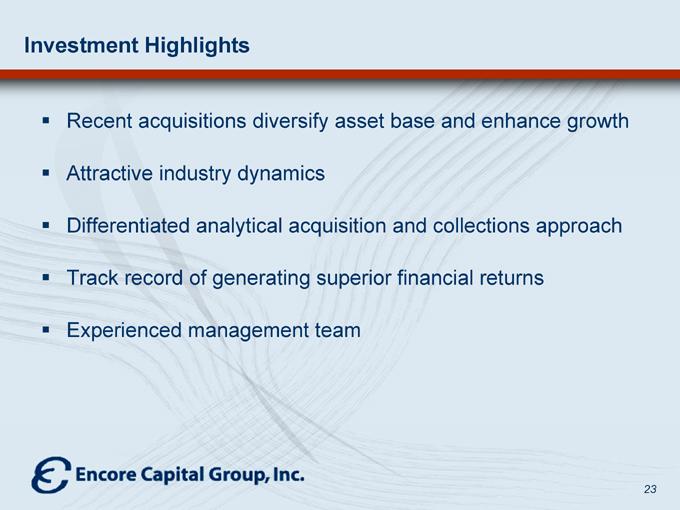
Investment Highlights
Recent acquisitions diversify asset base and enhance growth Attractive industry dynamics Differentiated analytical acquisition and collections approach Track record of generating superior financial returns Experienced management team
23


