 2010 Investor Day June 16, 2010 Exhibit 99.1 |
 CAUTIONARY NOTE ABOUT FORWARD-LOOKING STATEMENTS 1 The statements in this presentation that are not historical facts, including, most importantly, those statements preceded by, or that include, the words “may,” “believe,” “projects,” “expects,” “anticipates” or the negation thereof, or similar expressions, constitute “forward-looking statements” within the meaning of the Private Securities Litigation Reform Act of 1995 (the “Reform Act”). These statements may include, but are not limited to, statements regarding our future operating results and growth, ability to expand and utilize flexibility under our new credit facility, and the repurchase of our securities. For all “forward-looking statements,” the Company claims the protection of the safe harbor for forward-looking statements contained in the Reform Act. Such forward-looking statements involve risks, uncertainties and other factors which may cause actual results, performance or achievements of the Company and its subsidiaries to be materially different from any future results, performance or achievements expressed or implied by such forward-looking statements. These risks, uncertainties and other factors are discussed in the reports filed by the Company with the Securities and Exchange Commission, including the most recent reports on Forms 10-K, 10-Q and 8-K, each as it may be amended from time to time. The Company disclaims any intent or obligation to update these forward-looking statements. FORWARD-LOOKING STATEMENTS |
 HIGHLIGHTS 2 • Significant market opportunity • Highly differentiated business model • Disciplined and conservative underwriting strategy • Successful long-term track record • Well positioned to take advantage of growth prospects |
 OUR LONG-TERM FINANCIAL MODEL GIVES THE CONSUMER TIME TO RECOVER 3 CONSUMER Opens unsecured credit line, credit card or consumer loan Consumer either cannot or will not make payments ISSUER Delinquency cycle (days 30-180) Attempt rehabilitation and escalate consequences Consumer is “charged-off” by issuer on day 181 Issuer offers to sell unsecured, charged-off debt to Encore ENCORE Price portfolio using industry-leading models Based on consumer behavior at the account level Focused on willingness and ability-to-pay Create liquidation strategy and set goals Effort sloping through empirical and statistical modeling Collect debt through the application of unique collections platforms and unrivaled collection professionals (84 month window) Legal Outsourcing Call Centers Direct Mail Collection Agency Outsourcing Sales channel No/Low effort |
 THE INDUSTRY HAS GONE THROUGH SEVERAL DISTINCT STAGES OVER THE LAST 10 YEARS 4 Demand Supply • Issuers are relatively naïve about the value of consumer debt • Modest demand for delinquent consumer paper leads to low prices An emerging market 2002 2004 • Issuers improve their delinquent credit card valuation methods • The number of buyers increases dramatically as private equity enters and small players borrow and invest heavily for growth • Buyers fall prey to the “winner’s curse” as they price portfolios well outside reasonable collection expectations Overconfidence and irrational pricing 2006 2008 • As credit markets closed, buyers were unable to fund new and existing contracts • Consumer charge-off rates near all-time highs • Banks begin to manage the pace at which they sell receivables Significant opportunity 2010 |
 Several competitors are now known to have overpaid for portfolios and are in financial distress or have exited the industry Between 2005 and 2007, we remained disciplined and avoided high priced portfolios that did not meet internal hurdle rates In late 2005, we established call center in India We believe it is the only successful late-stage collections platform in India, at approximately 1/3 the cost of our U.S. operations We have maintained our analytic leadership position, and have strengthened it, with novel models and technologies Conserved capital until portfolio prices decreased to a point where we could achieve consistent profitability Credit markets continue to offer liquidity only to the best players in our industry In 2008, we built and implemented industry’s first known ability-to-pay (Capability) model In February 2010, we entered into a new $327.5 million revolving credit facility In 2009, we ramped up purchasing to take advantage of the favorable market environment WE ARE WELL POSITIONED TODAY BECAUSE OF KEY STRATEGIC DECISIONS WE MADE 5 |
 2010 Q1 2009 Q1 Q1 YOY Growth Variance $141,267 $26,034 23% $115,233 Collections $87,338 $10,892 14% $76,446 Revenue $82,588 $18,791 29% $63,797 Adjusted EBITDA* $81,632 $25,719 46% $55,913 Purchases $0.44 $0.06 16% $0.38 EPS ($000s, except EPS and ratios) OUR STRATEGIC DECISIONS LED TO STRONG Q1 RESULTS 6 * Adjusted EBITDA is a non-GAAP number. The Company considers Adjusted EBITDA to be a meaningful indicator of operating performance and uses it as a measure to assess the operating performance of the Company. See Reconciliation of Adjusted EBITDA to GAAP Net Income at the end of the presentation. |
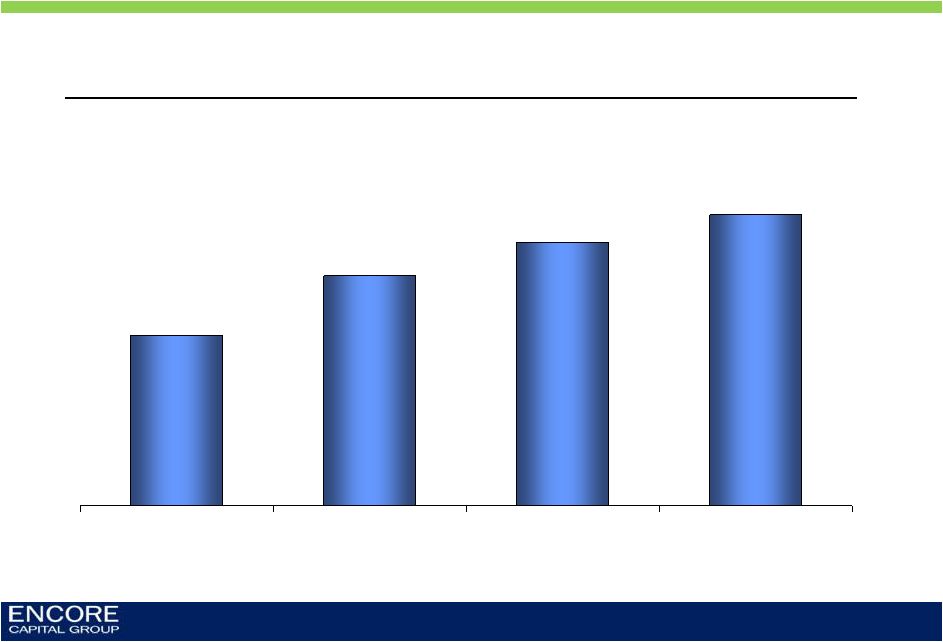
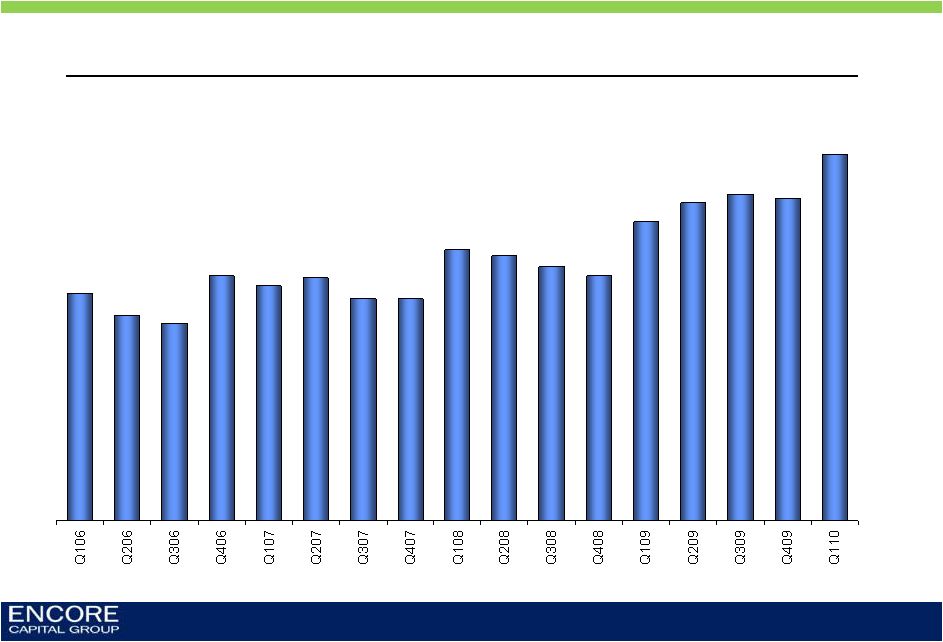 2010 MARKS OUR 10 TH CONSECUTIVE YEAR OF INCREASING COLLECTIONS 7 Quarterly gross collections ($ millions) $141.3 $87.6 $90.5 $104.4 $115.2 |
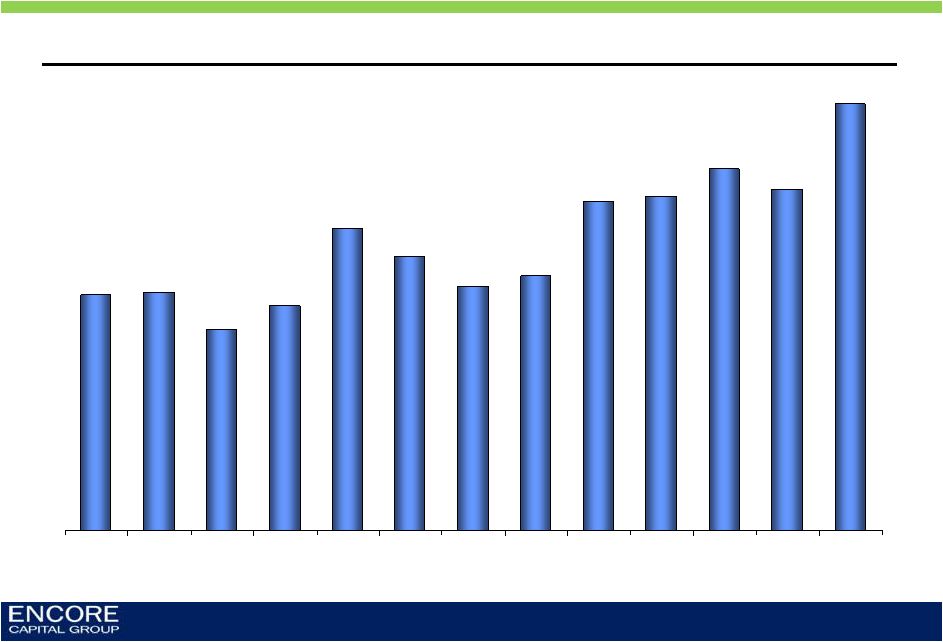 $45.6 $46.1 $39.0 $43.5 $58.5 $53.0 $47.3 $49.3 $63.8 $64.7 $70.0 $66.1 $82.6 Q1 07 Q2 07 Q3 07 Q4 07 Q1 08 Q2 08 Q3 08 Q4 08 Q1 09 Q2 09 Q3 09 Q4 09 Q1 10 WE ARE INCREASING OUR OPERATING CASH FLOWS (ADJUSTED EBITDA) AT A FASTER RATE THAN COLLECTIONS Adjusted EBITDA* by quarter ($ millions) * Adjusted EBITDA is a non-GAAP number. The Company considers Adjusted EBITDA to be a meaningful indicator of operating performance and uses it as a measure to assess the operating performance of the Company. See Reconciliation of Adjusted EBITDA to GAAP Net Income at the end of the presentation. 8 |
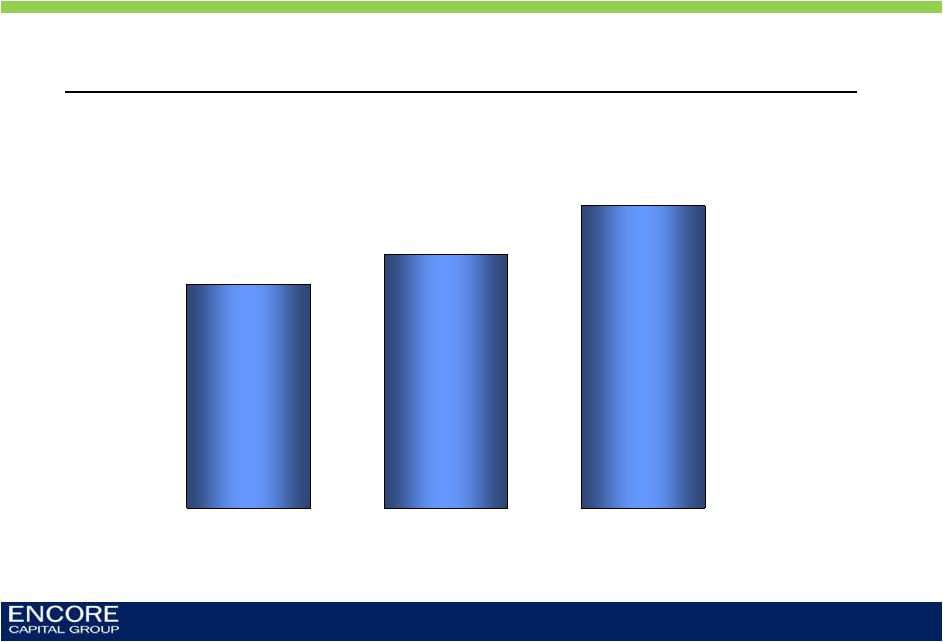 Full year purchases for 2008 and 2009; Estimate for 2010 ($ millions) WE ARE REINVESTING CASH BACK INTO THE BUSINESS THROUGH INCREASED PURCHASING VOLUMES $230.3 $300.0 $256.6 2008 2009 2010E 9 |
 Collection sites’ direct cost per dollar collected A MAJOR CONTRIBUTOR TO THE IMPROVING CASH FLOW IS OUR LOWER CALL CENTER COST STRUCTURE, DRIVEN BY EXPANSION INTO INDIA 10 |
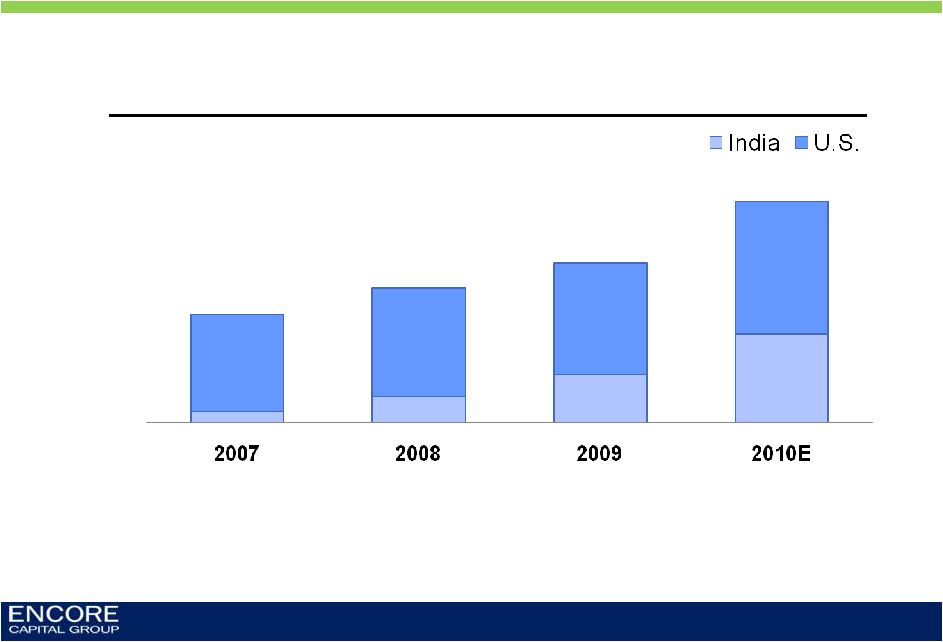 THE INCREASED CONTRIBUTION FROM INDIA TRANSLATES INTO SIGNIFICANT ANNUAL COST SAVINGS 11 Collections from all call centers India contribution 10% 19% 30% 40% ($ millions) $126 $157 $186 ~$250 |
 $892 $1,063 $1,160 $1,240 Y/E 2007 Y/E 2008 Y/E 2009 Q1 2010 Estimated remaining gross collections ($ millions) NOT ONLY HAVE WE IMPROVED OPERATING RESULTS, WE HAVE ALSO ADDED SIGNIFICANTLY TO THE COMPANY’S EMBEDDED VALUE 12 |
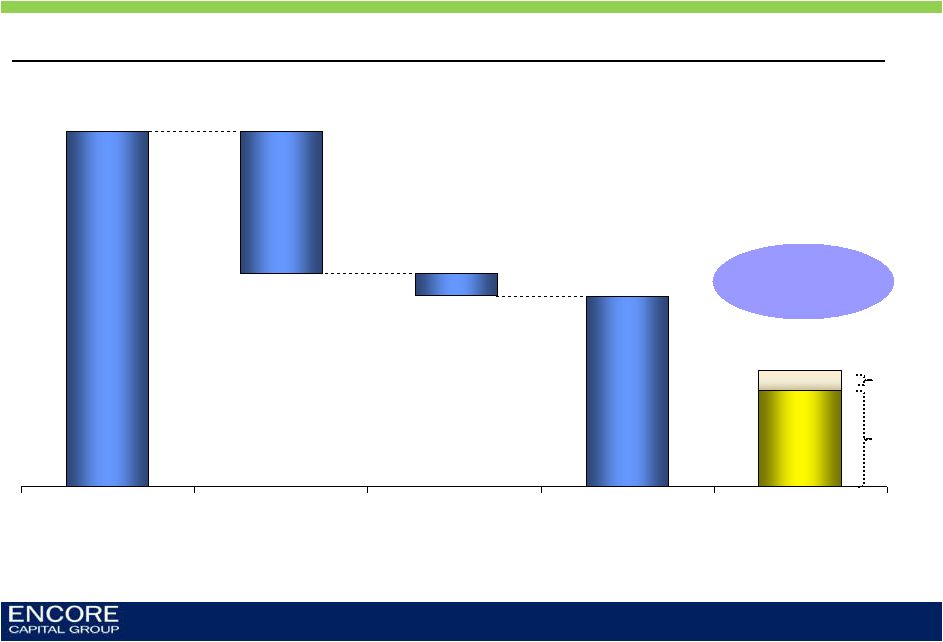 WE HAVE BEEN ABLE TO ACCOMPLISH THIS WITH MODEST LEVERAGE, LEAVING ROOM FOR FUTURE EXPANSION 13 Estimated remaining net collections ($ millions, Q1 2010) $1,240 Gross Estimated Remaining Collections ($496) 40% Cost to Collect $667 Net Estimated Remaining Collections Taxes (40% Rate) ($77) * DTL = Deferred Tax Liability $327 Net Debt + DTL* $17 $310 Net Debt DTL* We are 2Xover- collateralized |
 $- $250 $500 $750 $1,000 $1,250 $1,500 $1,750 $2,000 $2,250 $2,500 $2,750 AND WE BELIEVE THAT OUR CURRENT ESTIMATE OF REMAINING COLLECTIONS IS CONSERVATIVE GIVEN OUR HISTORY 14 Cumulative collections (initial expectation vs. actual) ($ millions, Jan 01 – Mar 10) Actual cash collections Initial projections |
 WE APPLY THIS SAME CONSERVATISM IN OTHER AREAS 15 Our general financial approach is conservative, and reinforces our efforts to reduce risk, build future value, and set the standard for our industry PORTFOLIO LIQUIDATION ESTIMATES TAX REVENUE RECOGNITION COVENANT COMPLIANCE |
 WE HAVE SIGNIFICANT ROOM TO GROW THE BUSINESS 16 ($ millions) Cash flow leverage ratio Debt Trailing 4-quarter adjusted EBITDA Debt/Adj. EBITDA [Maximum 1.75x] Minimum net worth Total stockholders' equity Minimum net worth Excess room Interest coverage ratio Trailing 4-quarter EBIT Trailing 4-quarter consolidated interest expense EBIT/Interest expense [Minimum 2.0x] 311.3 211.1 1.47 195.9 146.2 49.7 47.2 15.6 3.0 2009 303.1 264.6 1.15 243.1 183.0 60.1 69.9 16.2 4.3 *Not adjusted for ASC 470-20, prior to 2009 * * * Q1 2010 318.0 283.4 1.12 257.2 188.5 68.7 72.5 16.4 4.4 2008 Based on our cash flow and LTM Adj. EBITDA, our leverage ratio would allow us to increase total debt to $495 million Covenant analysis |
 MARKET DYNAMICS HAVE INFLUENCED OUR APPROACH TO THE BUSINESS 17 Charge-offs remain elevated Consumer credit continues to experience losses at near record levels Supply more closely managed by the issuers Demand increasing, albeit slowly Few players with access to significant amounts of capital Continued exit of large players, but others starting to gain traction Consumer performance remains predictable Our models continue to predict consumer behavior with a high degree of accuracy Significant regulatory and legislative scrutiny Both in our industry and in the financial services sector at large |
 Moody’s Credit Card Charge-off Index 18 CHARGE-OFFS REMAIN NEAR HISTORICAL PEAKS 0.0% 2.0% 4.0% 6.0% 8.0% 10.0% 12.0% Mar-90 Jul-91 Nov-92 Mar-94 Jul-95 Nov-96 Mar-98 Jul-99 Nov-00 Mar-02 Jul-03 Nov-04 Mar-06 Jul-07 Nov-08 Mar-10 |
 4.3% 4.3% 4.5% 5.3% 9.8% 12.5% 12.6% 9.0% 6.5% 7.0% 2001 2002 2003 2004 2005 2006 2007 2008 2009 2010 PRICING IS UP MODERATELY IN 2010 AND WE ARE STILL DEPLOYING CAPITAL AT VERY PROFITABLE LEVELS 19 Pricing trend from one issuer through time (% on a dollar of face) Active market buyer Intentionally absent EXAMPLE |
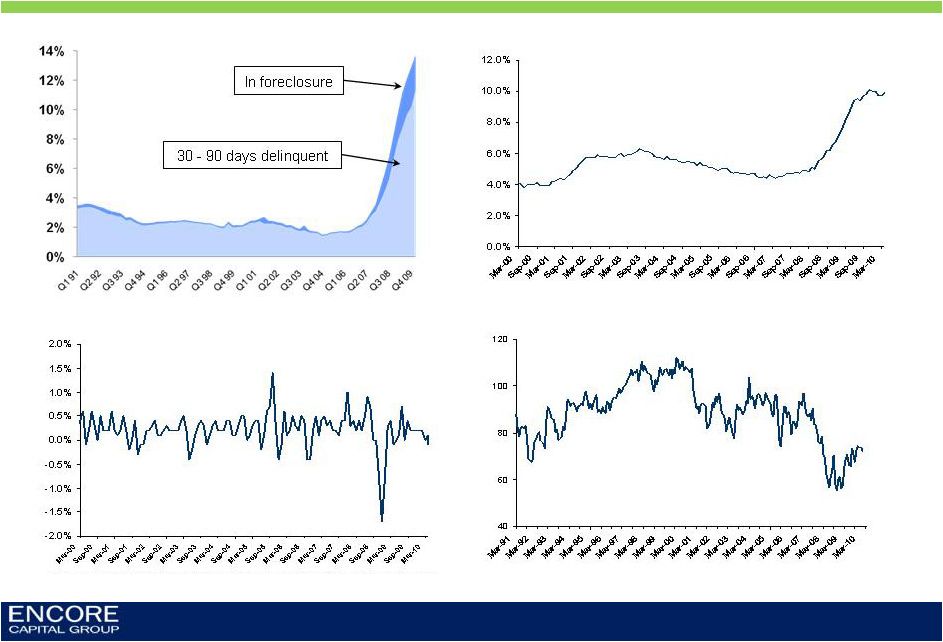 THE AVAILABLE DATA AROUND THE AVERAGE CONSUMER SHOWS THAT THEY REMAIN CHALLENGED 20 High mortgage defaults Near all-time high unemployment rate Low consumer sentiment Volatile consumer price index Source: Federal Reserve, University of Michigan, U.S. Bureau of Labor Statistics |
 HOWEVER, OUR CONSUMERS’ PAYMENT BEHAVIOR AND OUR PERFORMANCE REMAIN CONSISTENT 21 Metric Recent trend • Payer rates • Slightly upward • Average payment size • Stable • Single vs. multi-payers • More payment plans • Broken payer rates • Mild improvement • Settlement rates • Upward trend |
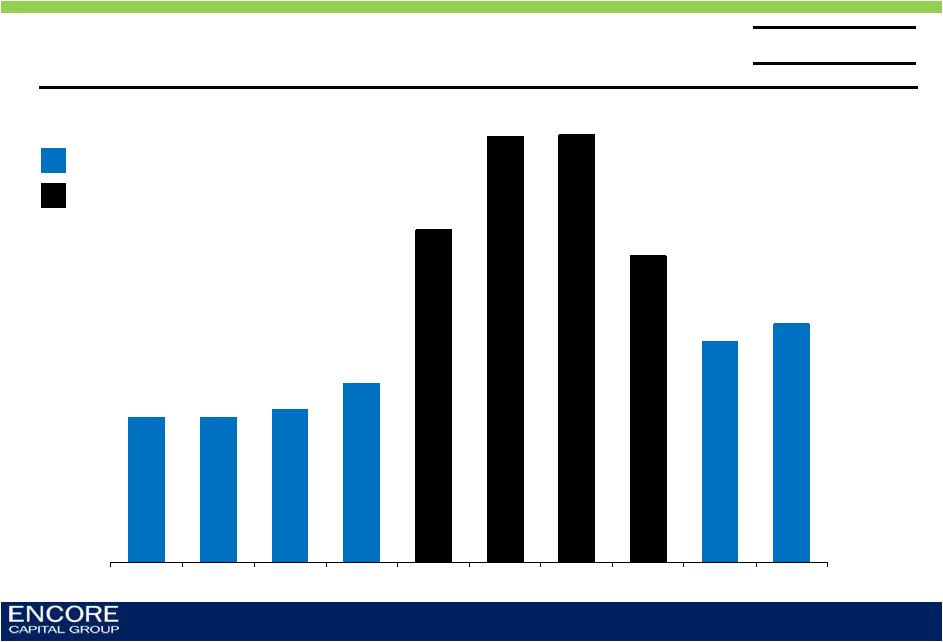
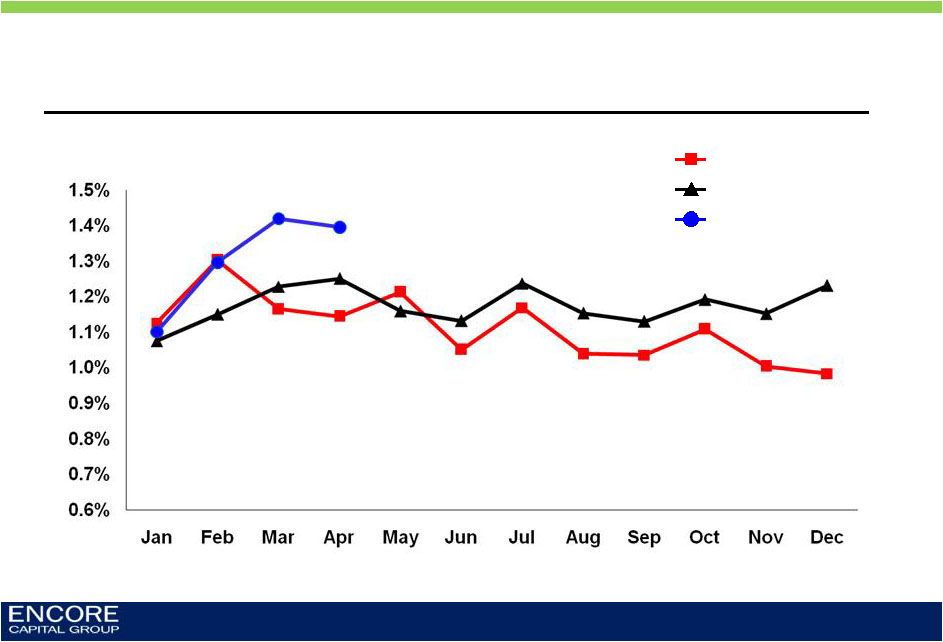 OUR OVERALL PAYER RATES HAVE IMPROVED 22 Overall payer rate for all active inventory 2008 2009 2010 |
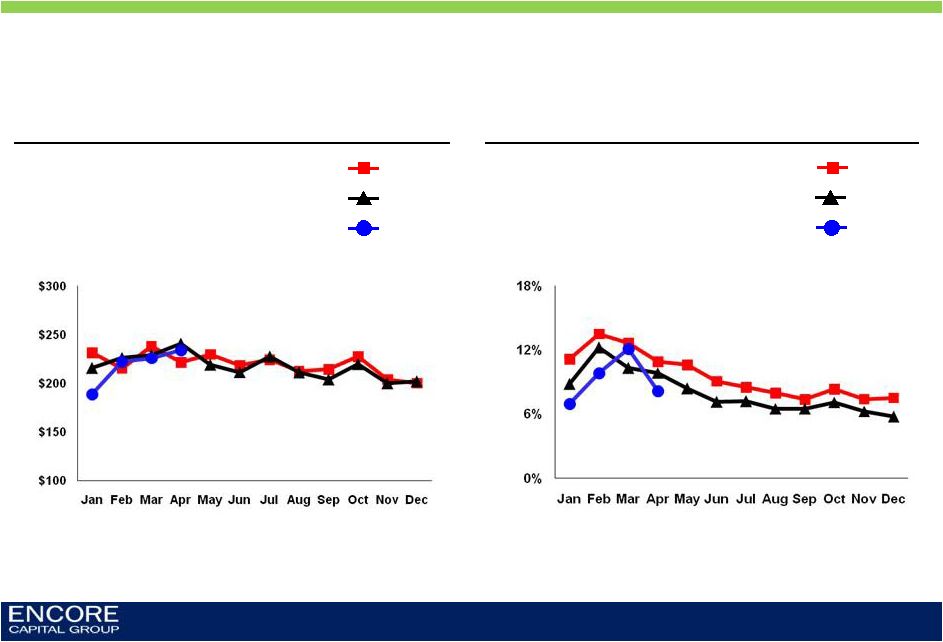 AVERAGE PAYMENT SIZE REMAINS CONSISTENT, EVEN AS PAYMENT PLANS CONTINUE TO BE THE NORM 23 Average payment size for all paying accounts 2008 2009 2010 Single settlement payers as a percentage of total payers 2008 2009 2010 |
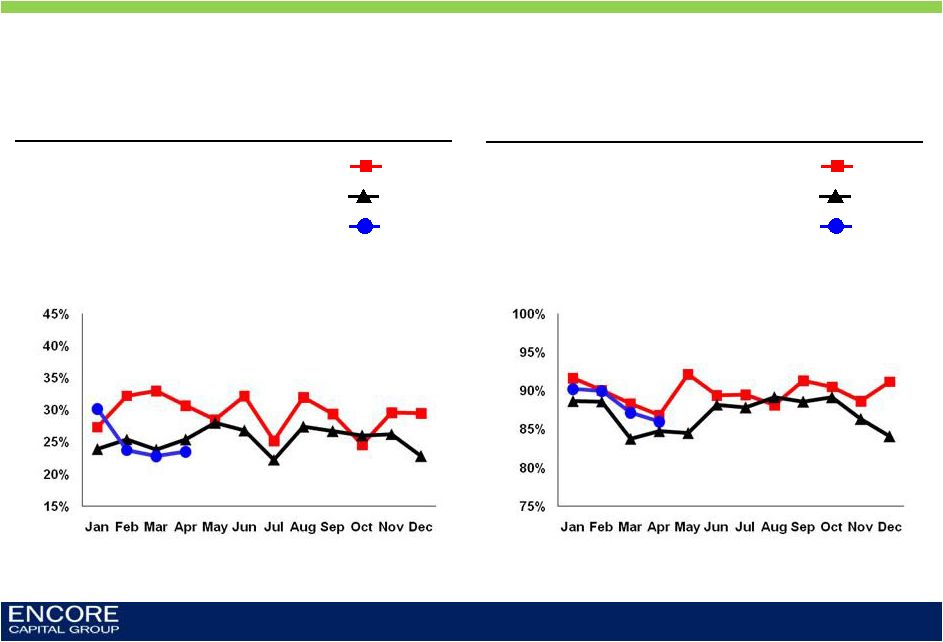 OUR CONSUMERS ARE HONORING THEIR OBLIGATIONS AND SETTLING THEIR ACCOUNTS AT CONSTANT RATES 24 Overall broken payer rate, excluding settled accounts through time 2008 2009 2010 Legal settlement rate 2008 2009 2010 |
 WE ARE POSITIONED TO RESPOND TO THE CHANGING REGULATORY ENVIRONMENT 25 Technology Proprietary software platforms allow the company to make changes as new regulations and laws emerge Sophisticated software and analytics platforms ensure that all data-driven activities are compliant Data management Expanded legal and quality assurance teams partner with training department to keep account managers abreast of changes Training Zero tolerance policy in place to address errors by account managers Self-discipline |
 WE ALSO LOOK FOR WAYS TO BOTH PROTECT AND PARTNER WITH OUR CONSUMERS ACROSS A RANGE OF OPERATIONAL ACTIVITIES 26 Operational practices Activity • Interest policy • Discounts • Outbound communication • Work segmentation • We do not charge interest during the course of payment plans to improve the likelihood that a consumer will be able to fulfill their obligations • We consistently provide significant discounts to consumers in an effort to establish a mutually beneficial negotiation • It is our policy not to leave messages on answering machines (unless previous contact made) or intentionally contact third- parties out of respect for our consumers’ privacy • We use our suite of powerful analytic scores to identify those consumers that are unable to repay their obligations, and we proactively choose to forgo all work effort either temporarily or permanently |
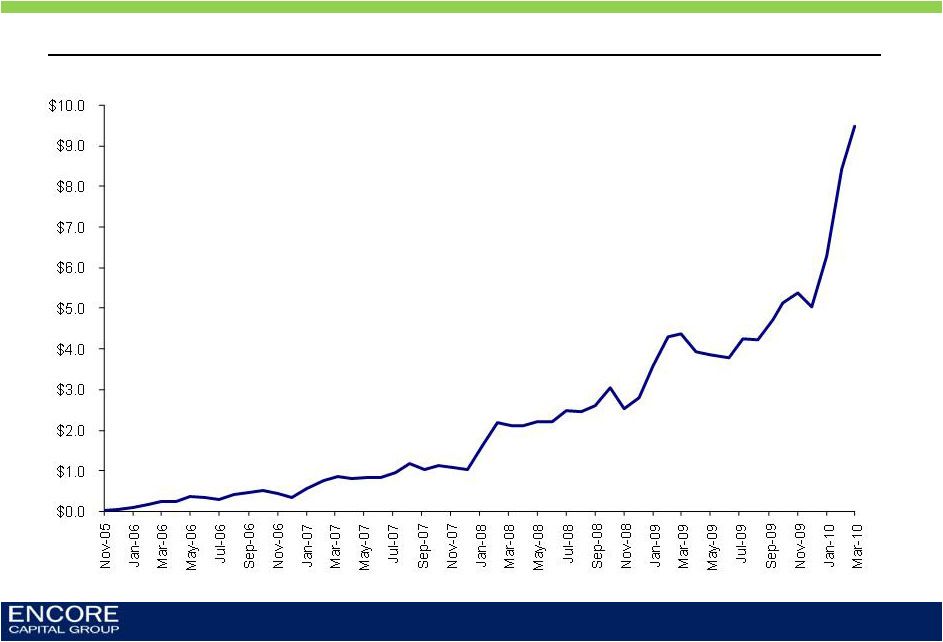
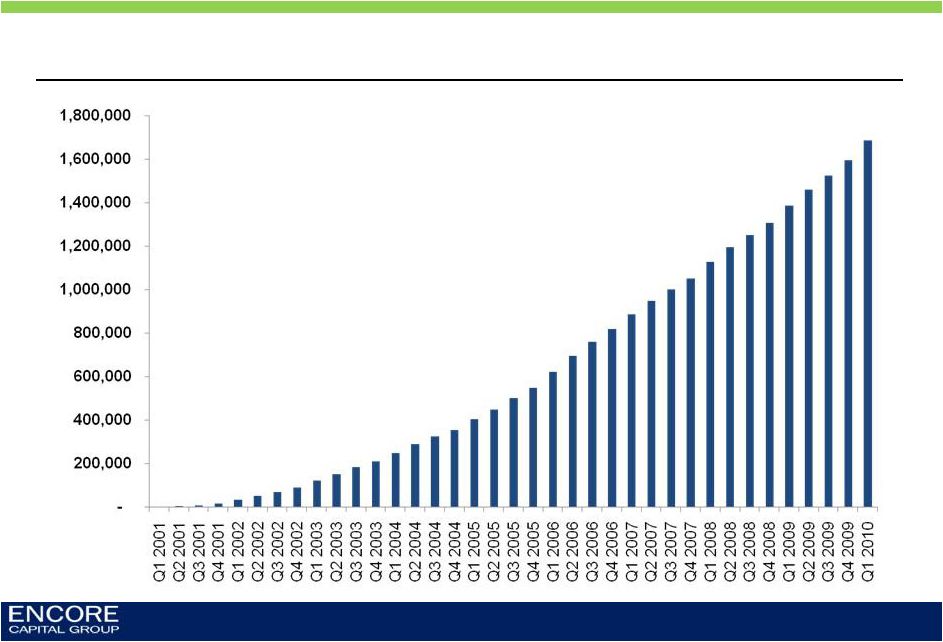 THESE PRACTICES HAVE ALLOWED US TO EFFECTIVELY WORK WITH MILLIONS OF CONSUMERS Consumers with whom we have partnered to retire their debt (cumulative) 27 |
 ENCORE’S STRATEGIC PILLARS COST LEADERSHIP PRINCIPLED INTENT CONSUMER INTELLIGENCE ANALYTIC STRENGTH OUR OPERATIONAL SUCCESS IS BASED UPON FOUR STRATEGIC PRIORITIES 28 |
 |
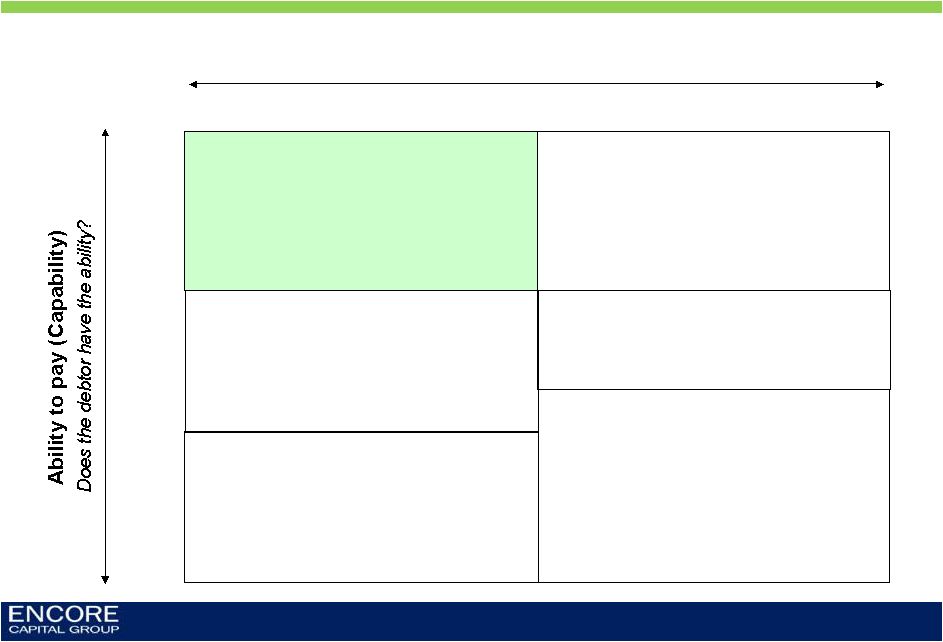                Strong partnership opportunities with willing and able consumers Our attempts to contact or work with consumers are typically ignored, and the legal option becomes necessary Hardship strategies Offer significant discounts and plans that accommodate many small payments Remind consumers of their obligation through legal communications Focus on payment plans and opportunities to build longer relationships with consumers Willingness to pay Is the debtor willing to resolve the debt on fair terms? HIGH HIGH LOW LOW OUR ANALYTIC INSIGHT ALLOWS US TO MATCH OUR COLLECTION APPROACH TO THE INDIVIDUAL CONSUMER’S PAYMENT BEHAVIOR 30 |
 2006 Behavioral science and macroeconomics 2000 Early statistical modeling • Hired first statisticians • Created account-level valuation model • Created 1 st and 2 nd generation forecasting models • Created 1 st generation operational models (mail channel and call center) • Introduced Capability- Willingness framework • Developed industry’s first ability-to-pay model • Developed account level, activity-based cost database • Developed 3 rd generation forecasting model • Created industry-leading legal model • Developed 3 rd generation valuation model • Developed 2 nd generation mail and call center models 2009 Strategy and optimization 2003 Forecasting and predictive modeling OUR LEVEL OF SOPHISTICATION HAS SIGNIFICANTLY INCREASED OUR COMPETITIVE ADVANTAGE 31 |
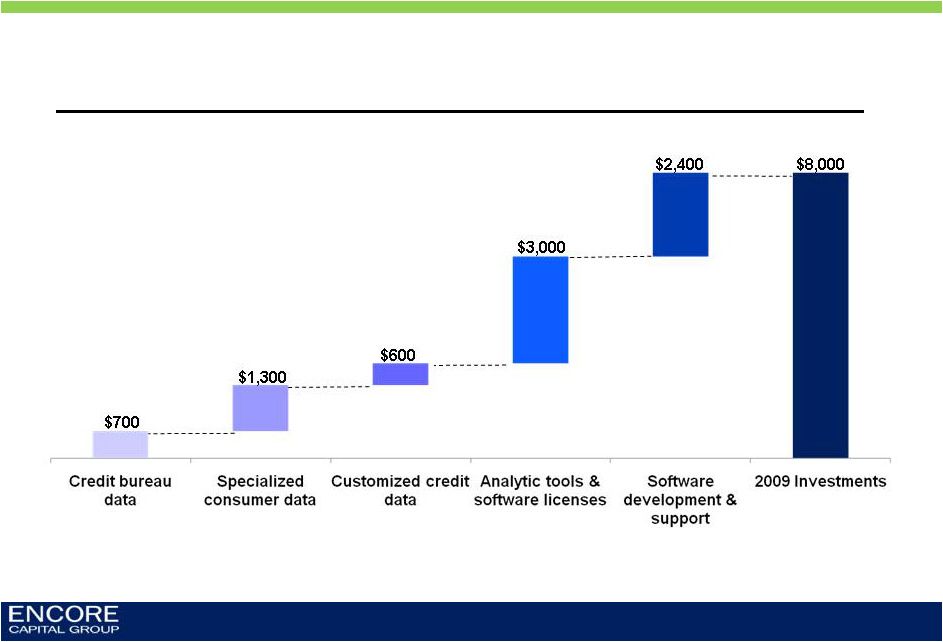 AS HAVE OUR INVESTMENTS IN DATA AND TECHNOLOGY 32 Investments to support consumer analytics (2009 only) ($000s) |
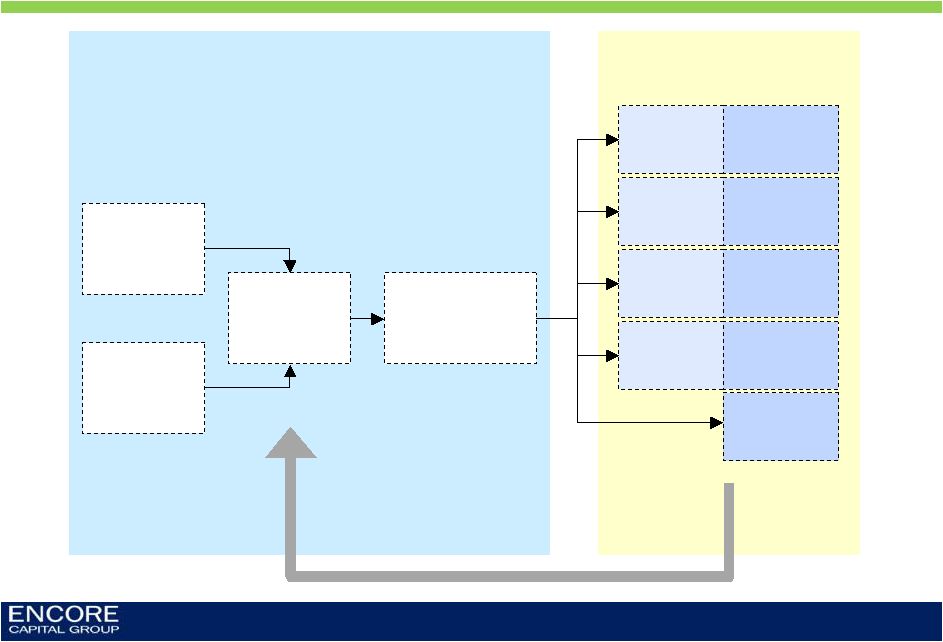 Core competency in understanding the payer behavior of distressed consumers Cross-channel coordination and optimization Consumer behavior research Market data and insight Portfolio valuation Pre-purchase model No effort Legal Outsourcing Legal effort model with Capability Call Centers Call effort model with Capability Direct Mail Letter effort model with Capability Collection Agency Outsourcing Agency effort model with Capability Collections operations that optimize effort and profitability OUR ANALYTIC REACH EXTENDS FROM PRE-PURCHASE THROUGHOUT OUR ENTIRE OWNERSHIP PERIOD 33 Continuous feedback between operations and valuation |
 Collections lift over deciles, comparing Encore’s ability-to-pay model against both competitor scores and random servicing strategies Commercial score 1 Random servicing Commercial score 2 Encore AND IS SUPERIOR TO WHAT CAN BE ACQUIRED COMMERCIALLY 34 |
 OUR SUCCESS IN INDIA IS A TESTAMENT TO OUR PERSEVERANCE 35 2006 Year of growing pains • Only working low balance accounts • Limited connection to the U.S. • High attrition and low performance 147 staff 2005 Journey begins 33 staff 2007 First taste of success • Shifted to higher balance accounts drives strong performance • Started competing with U.S. on paper of similar balance and age 207 staff |
 AS A RESULT, THE INDIA TEAM IS NOW AN INTEGRAL PART OF THE COMPANY 36 2010 Enabling future growth • India now accounting for more than 40% of all call center collections • Fundamentally improved internal cost to collect • Enhancing our ability to purchase portfolios and win new bankruptcy servicing contracts 900+ staff 2008 Accelerating confidence and trust • Successfully ramped up hiring without compromising performance • New work groups established • Meaningfully reduced attrition 333 staff 2009 Expansion of influence and impact • Significant involvement in collection strategy • Built analytics, IT and bankruptcy servicing teams • Invested in world-class facility 625 staff |
 Monthly gross collections (India) ($ millions) THE GREATEST EVIDENCE OF THIS CAN BE SEEN IN THE DRAMATIC INCREASE IN MONTHLY CONTRIBUTION 37 Nov - Jan - Mar - May - Jul - Sep - Nov - Jan - Mar - May - Jul - Sep - Nov - Jan - Mar - May - Jul - Sep - Nov - Jan - Mar - May - Jul - Sep - Nov - Jan - Mar - |
 GOING FORWARD, WE ARE FOCUSED ON MAINTAINING PERFORMANCE AND TAKING A LEADING ROLE IN COLLECTION INNOVATION 38 Expertise and process support for corporate initiatives Sustain strengths as we grow Push innovation Co-create global synergies |
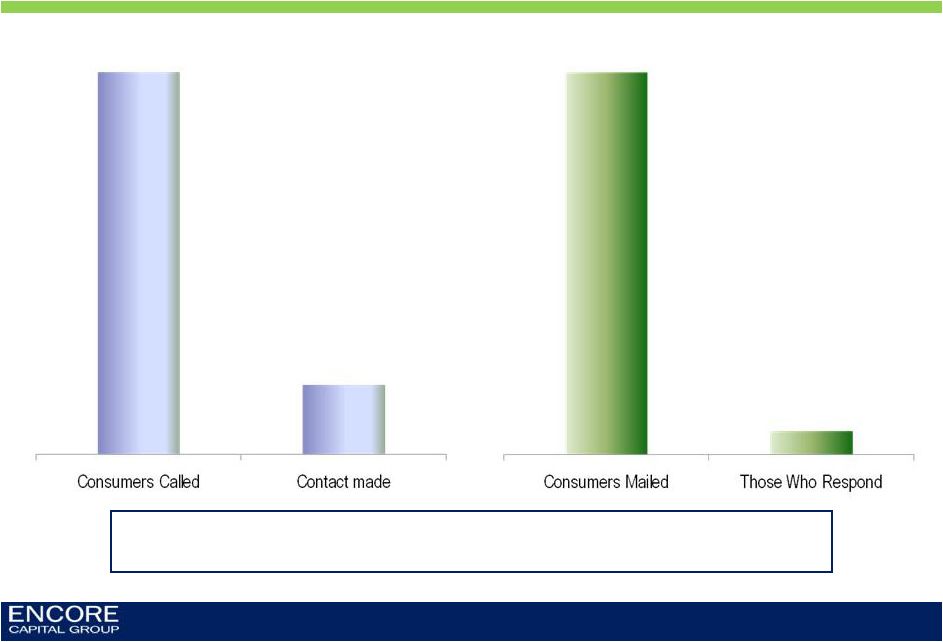 ONE OF OUR GREATEST CHALLENGES IS THAT OUR CONSUMERS GENERALLY DO NOT RESPOND TO OUR ATTEMPTS TO CONTACT THEM 39 7.22M in 2009 18.1% or 1.30M 7.20M in 2009 6.1% or 440K As a result, we often find ourselves with no recourse other than to pursue litigation, a decision we do not take lightly |
 56.4 57.2 Q1 09 Q1 10 Legal collections and costs as a percentage of collections 53.1% 46.2% $ $ ($ millions) OUR SUCCESS IN THE CHANNEL VALIDATES OUR DECISION TO PURSUE THIS STRATEGY AND WE ARE BECOMING MORE EFFICIENT OVER TIME 40 |
 SUMMARY 41 • Favorable supply and demand dynamics are expected to drive a strong purchasing year • Strong financial performance is expected to continue • Operational and financial leverage is increasing, largely due to our successful operating center in India • Insights revealed through rigorous analytics inform our strategy and allow for a closer partnership with consumers |
 QUESTIONS & ANSWERS |
 APPENDIX |
 APPENDIX: ENCORE IS A LEADING PLAYER IN THE DEBT RECOVERY INDUSTRY Distressed consumer debt purchasing (95% of revenue) •Purchase and collection of charged-off consumer receivables (primarily credit card) •Robust business model emphasizing consumer intelligence and operational specialization •Invested ~$1.5B to acquire receivables with a face value of ~$46B •Acquired ~29MM consumer accounts since inception Bankruptcy servicing (5% of revenue) •Process secured consumer bankruptcy accounts for leading auto lenders and other financial institutions •Proprietary software dedicated to bankruptcy servicing •Operational platform that integrates lenders, trustees, and consumers 44 |
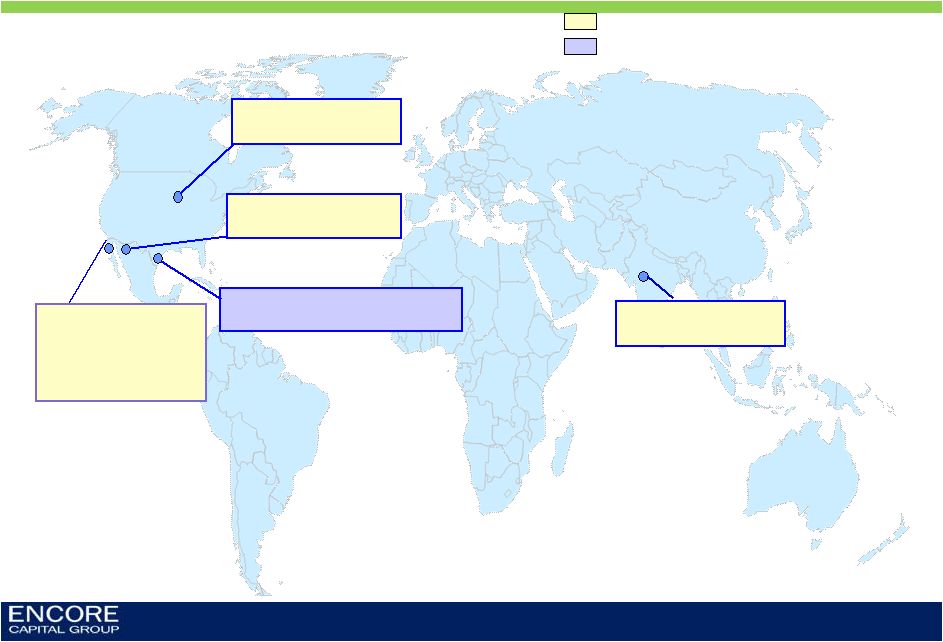 APPENDIX: WE OPERATE IN FIVE DIFFERENT SITES ACROSS THE U.S. AND INDIA 45 San Diego, CA • Headquarters • Call center site St Cloud, MN • Call center site Arlington, TX • Bankruptcy servicing Phoenix, AZ Delhi, India Defaulted consumer debt purchasing Bankruptcy servicing business • Call center site • Call center site |
 APPENDIX: AT THE PEAK OF THE CYCLE, WE WILL GENERATE PAYMENTS FROM FEWER THAN 1% OF OUR ACCOUNTS PER MONTH 46 Portfolio Face Amount $15,000,000 Average Balance $3,000 Number of Accounts 5,000 Purchase Factor $0.05 Purchase Price $750,000 Projected Return (2.7x) $2,025,000 Only requires 20% payers, at a 67.5% settlement rate, to achieve expected returns over a seven year period. This equates to: – Year 1: ~ 7.0% (350 consumers) – Year 2: ~ 5.5% (270 consumers) – Year 3: ~ 4.5% (220 consumers) – Year 4: ~ 2.0% (100 consumers) – Years 5+: ~1.0% (60 consumers) ILLUSTRATIVE |
 Cumulative Collections through March 31, 2010 (000’s) Year of Purchase Purchase Price <2004 2004 2005 2006 2007 2008 2009 2010 Total CCM <2004 $284,164 $517,451 $192,940 $144,775 $109,379 $50,708 $26,777 $16,345 $3,139 $1,061,514 3.7 2004 101,329 39,400 79,845 54,832 34,625 19,116 11,363 2,140 241,321 2.4 2005 192,591 66,491 129,809 109,078 67,346 42,387 7,721 422,832 2.2 2006 141,969 42,354 92,265 70,743 44,553 7,425 257,340 1.8 2007 204,298 68,048 145,272 111,117 20,888 345,325 1.7 2008 227,935 69,049 165,164 35,578 269,791 1.2 2009 254,127 96,529 55,927 152,456 0.6 2010 81,621 8,354 8,354 0.1 Total $1,488,034 $517,451 $232,340 $291,111 $336,374 $354,724 $398,303 $487,458 $141,172 $2,758,933 1.9 APPENDIX A: CUMULATIVE COLLECTIONS BY PORTFOLIO VINTAGE 47 |
 Reconciliation of Adjusted EBITDA to GAAP Net Income (Unaudited, In Thousands) Three Months Ended Note: The periods 3/31/07 through 12/31/08 have been adjusted to reflect the retrospective application of ASC 470-20 3/31/07 6/30/07 9/30/07 12/31/07 3/31/08 6/30/08 9/30/08 12/31/08 3/31/09 6/30/09 9/30/09 12/31/09 3/31/10 GAAP net income, as reported 4,991 (1,515) 4,568 4,187 6,751 6,162 3,028 (2,095) 8,997 6,641 9,004 8,405 10,861 Interest expense 4,042 4,506 4,840 5,260 5,200 4,831 5,140 5,401 4,273 3,958 3,970 3,959 4,538 Contingent interest expense 3,235 888 - - - - - - - - - - - Pay-off of future contingent interest - 11,733 - - - - - - - - - - - Provision for income taxes 3,437 (1,031) 1,315 2,777 4,509 4,225 2,408 (1,442) 5,973 4,166 5,948 4,609 6,490 Depreciation and amortization 869 840 833 810 722 766 674 652 623 620 652 697 673 Amount applied to principal on receivable portfolios 28,259 29,452 26,114 29,498 40,212 35,785 35,140 46,364 42,851 48,303 49,188 47,384 58,265 Stock-based compensation expense 801 1,204 1,281 1,001 1,094 1,228 860 382 1,080 994 1,261 1,049 1,761 Adjusted EBITDA 45,634 46,077 38,951 43,533 58,488 52,997 47,250 49,262 63,797 64,682 70,023 66,103 82,588 APPENDIX B: RECONCILIATION OF ADJUSTED EBITDA 48 |