Exhibit 99.1
ENCORE
CAPITAL GROUP
Encore Capital Group Investor Presentation
May 11, 2011
CAUTIONARY NOTE ABOUT FORWARD-LOOKING STATEMENTS
FORWARD-LOOKING STATEMENTS
The statements in this presentation that are not historical facts, including, most importantly, those statements preceded by, or that include, the words “may,” “believe,” “projects,” “expects,” “anticipates” or the negation thereof, or similar expressions, constitute “forward-looking statements” within the meaning of the Private Securities Litigation Reform Act of 1995 (the “Reform Act”). These statements may include, but are not limited to, statements regarding our future operating results and growth. For all “forward-looking statements,” the Company claims the protection of the safe harbor for forward-looking statements contained in the Reform Act. Such forward-looking statements involve risks, uncertainties and other factors which may cause actual results, performance or achievements of the Company and its subsidiaries to be materially different from any future results, performance or achievements expressed or implied by such forward-looking statements. These risks, uncertainties and other factors are discussed in the reports filed by the Company with the Securities and Exchange Commission, including the most recent reports on Forms 10-K, 10-Q and 8-K, each as it may be amended from time to time. The Company disclaims any intent or obligation to update these forward-looking statements.
ENCORE
CAPITAL GROUP
2
INVESTMENT HIGHLIGHTS
• Favorable supply and demand dynamics have existed since 2008, with a few credible, large buyers
• Analytic insights inform our valuation and operating strategies and allow for a closer partnership with consumers
• Operational and financial leverage is increasing, largely due to the success of our operating center in India
• Strong performance is expected to continue
ENCORE
CAPITAL GROUP
3
ENCORE IS A LEADING PLAYER IN THE CONSUMER DEBT BUYING AND RECOVERY INDUSTRY
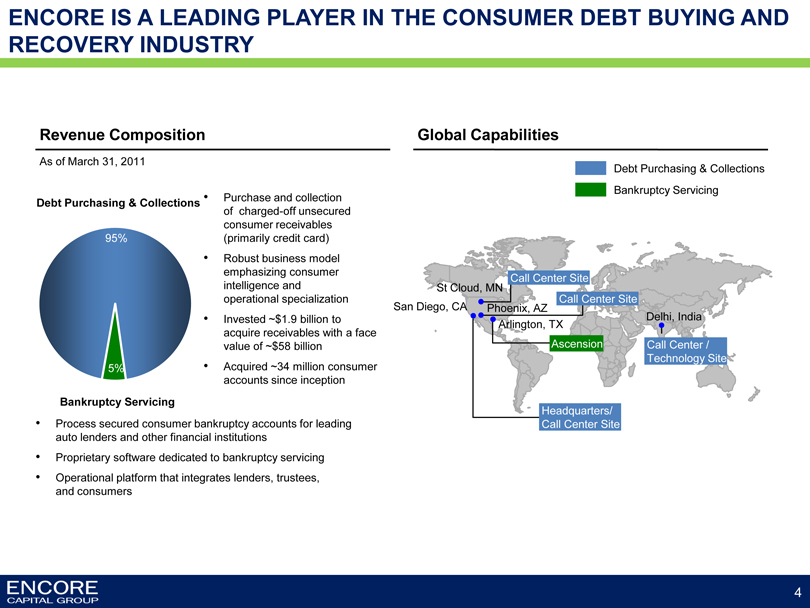
Revenue Composition
As of March 31, 2011
Debt Purchasing & Collections
95%
5%
• Purchase and collection of charged-off unsecured consumer receivables (primarily credit card)
• Robust business model emphasizing consumer intelligence and operational specialization
• Invested ~$1.9 billion to acquire receivables with a face value of ~$58 billion
• Acquired ~34 million consumer accounts since inception
Bankruptcy Servicing
• Process secured consumer bankruptcy accounts for leading auto lenders and other financial institutions
• Proprietary software dedicated to bankruptcy servicing
• Operational platform that integrates lenders, trustees, and consumers
Global Capabilities
Debt Purchasing & Collections
Bankruptcy Servicing
St Cloud, MN
Call Center Site
Call Center Site
San Diego, CA
Phoenix, AZ
Delhi, India
Arlington, TX
Ascension
Call Center / Technology Site
Headquarters/ Call Center Site
ENCORE
CAPITAL GROUP
4
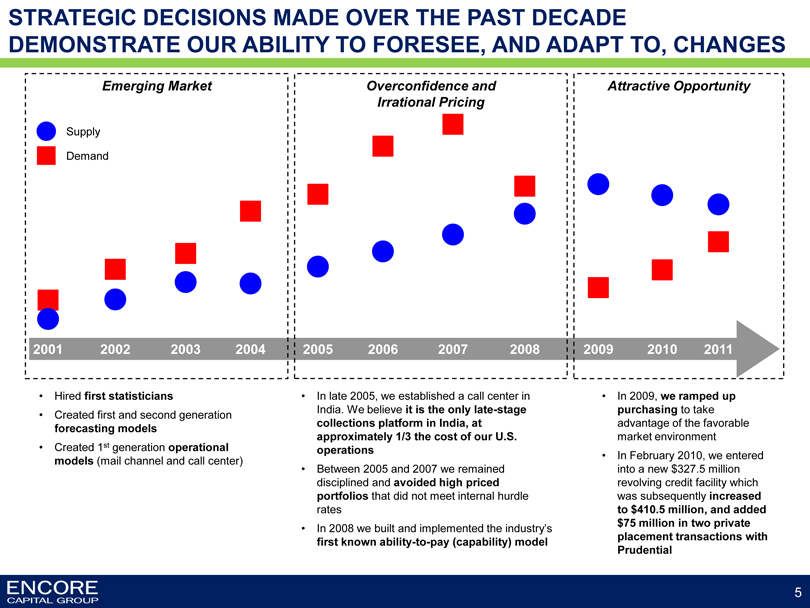
STRATEGIC DECISIONS MADE OVER THE PAST DECADE DEMONSTRATE OUR ABILITY TO FORESEE, AND ADAPT TO, CHANGES
Emerging Market
Overconfidence and Irrational Pricing
Attractive Opportunity
Supply
Demand
2001 2002 2003 2004 2005 2006 2007 2008 2009 2010 2011
• Hired first statisticians
• Created first and second generation forecasting models
• Created 1st generation operational models (mail channel and call center)
• In late 2005, we established a call center in India. We believe it is the only late-stage collections platform in India, at approximately 1/3 the cost of our U.S. operations
• Between 2005 and 2007 we remained disciplined and avoided high priced portfolios that did not meet internal hurdle rates
• In 2008 we built and implemented the industry’s first known ability-to-pay (capability) model
• In 2009, we ramped up purchasing to take advantage of the favorable market environment
• In February 2010, we entered into a new $327.5 million revolving credit facility which was subsequently increased to $410.5 million, and added $75 million in two private placement transactions with Prudential
ENCORE
CAPITAL GROUP
5
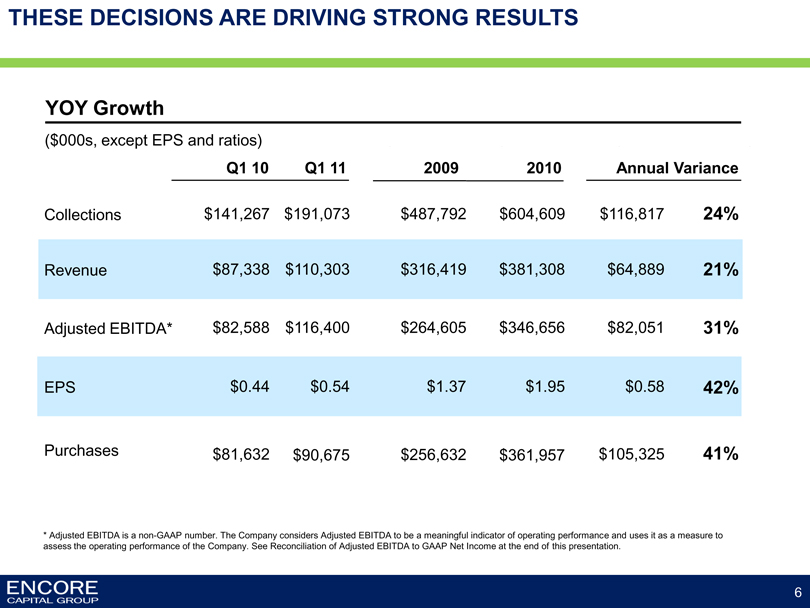
THESE DECISIONS ARE DRIVING STRONG RESULTS
YOY Growth
($000s, except EPS and ratios)
Q1 10 Q1 11 2009 2010 Annual Variance
Collections $141,267 $191,073 $487,792 $604,609 $116,817 24%
Revenue $87,338 $110,303 $316,419 $381,308 $64,889 21%
Adjusted EBITDA* $82,588 $116,400 $264,605 $346,656 $82,051 31%
EPS $0.44 $0.54 $1.37 $1.95 $0.58 42%
Purchases $81,632 $90,675 $256,632 $361,957 $105,325 41%
* Adjusted EBITDA is a non-GAAP number. The Company considers Adjusted EBITDA to be a meaningful indicator of operating performance and uses it as a measure to assess the operating performance of the Company. See Reconciliation of Adjusted EBITDA to GAAP Net Income at the end of this presentation.
ENCORE
CAPITAL GROUP
6
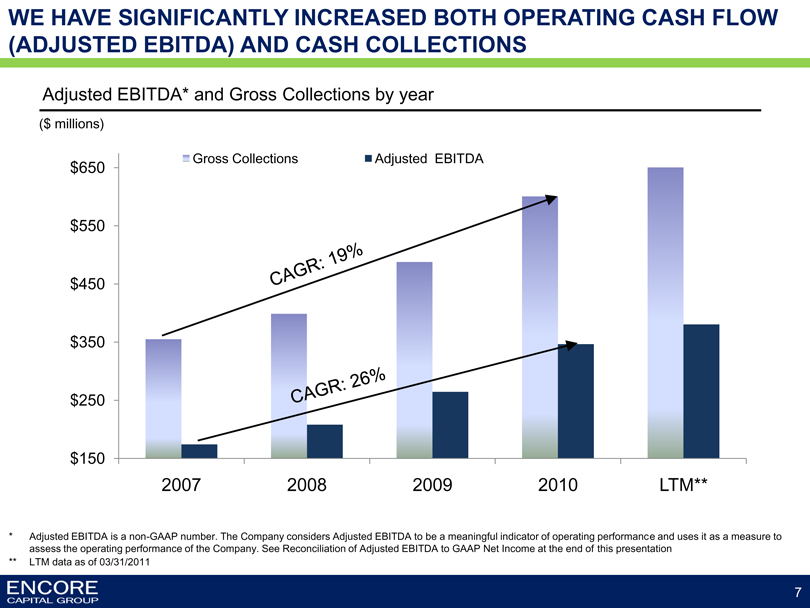
WE HAVE SIGNIFICANTLY INCREASED BOTH OPERATING CASH FLOW (ADJUSTED EBITDA) AND CASH COLLECTIONS
Adjusted EBITDA* and Gross Collections by year
($ millions)
$650 $550 $450 $350 $250 $150
Gross Collections Adjusted EBITDA
CAGR: 19%
CAGR: 26%
2007 2008 2009 2010 LTM**
* Adjusted EBITDA is a non-GAAP number. The Company considers Adjusted EBITDA to be a meaningful indicator of operating performance and uses it as a measure to assess the operating performance of the Company. See Reconciliation of Adjusted EBITDA to GAAP Net Income at the end of this presentation
** LTM data as of 03/31/2011
ENCORE
CAPITAL GROUP
7
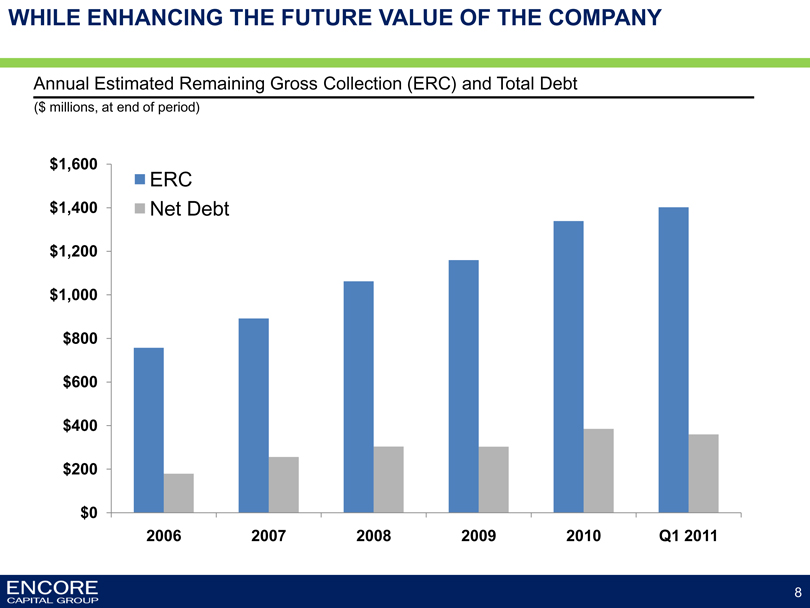
WHILE ENHANCING THE FUTURE VALUE OF THE COMPANY
Annual Estimated Remaining Gross Collection (ERC) and Total Debt
($ millions, at end of period)
$1,600 $1,400 $1,200 $1,000 $800 $600 $400 $200 $0
ERC Net Debt
2006 2007 2008 2009 2010 Q1 2011
ENCORE
CAPITAL GROUP
8
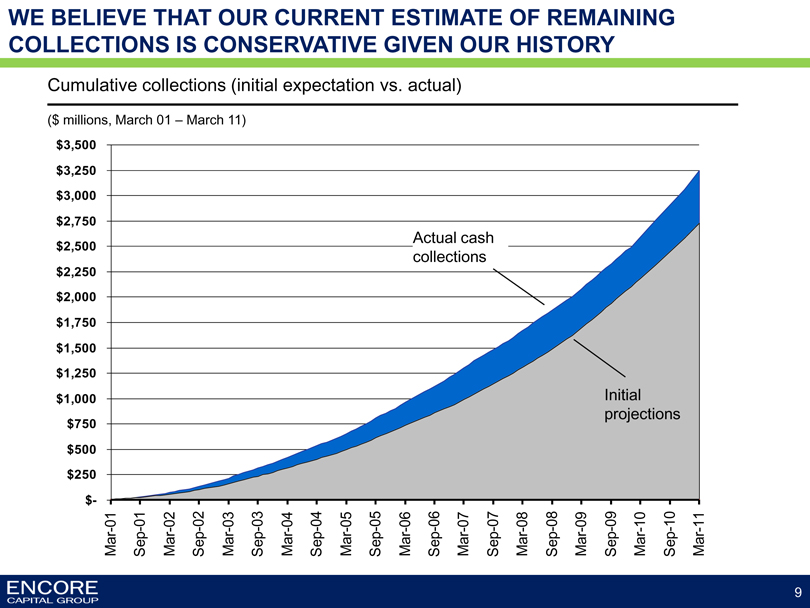
WE BELIEVE THAT OUR CURRENT ESTIMATE OF REMAINING COLLECTIONS IS CONSERVATIVE GIVEN OUR HISTORY
Cumulative collections (initial expectation vs. actual)
($ millions, March 01 – March 11)
$3,500
$3,250
$3,000
$2,750
$2,500
$2,250
$2,000
$1,750
$1,500
$1,250
$1,000
$750
$500
$250
$-
Actual cash collections
Initial projections
Mar-01 Sep-01
Mar-02 Sep-02
Mar-03 Sep-03
Mar-04 Sep-04
Mar-05 Sep-05
Mar-06 Sep-06
Mar-07 Sep-07
Mar-08 Sep-08
Mar-09 Sep-09
Mar-10 Sep-10
Mar-11
ENCORE
CAPITAL GROUP
9
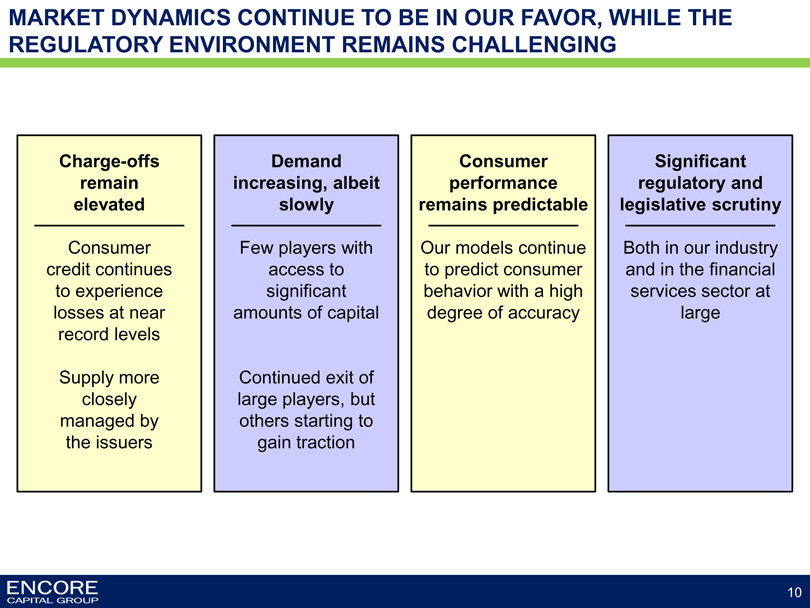
MARKET DYNAMICS CONTINUE TO BE IN OUR FAVOR, WHILE THE REGULATORY ENVIRONMENT REMAINS CHALLENGING
Charge-offs remain elevated
Consumer credit continues to experience losses at near record levels
Supply more closely managed by the issuers
Demand increasing, albeit slowly
Few players with access to significant amounts of capital
Continued exit of large players, but others starting to gain traction
Consumer performance remains predictable
Our models continue to predict consumer behavior with a high degree of accuracy
Significant regulatory and legislative scrutiny
Both in our industry and in the financial services sector at large
ENCORE
CAPITAL GROUP
10
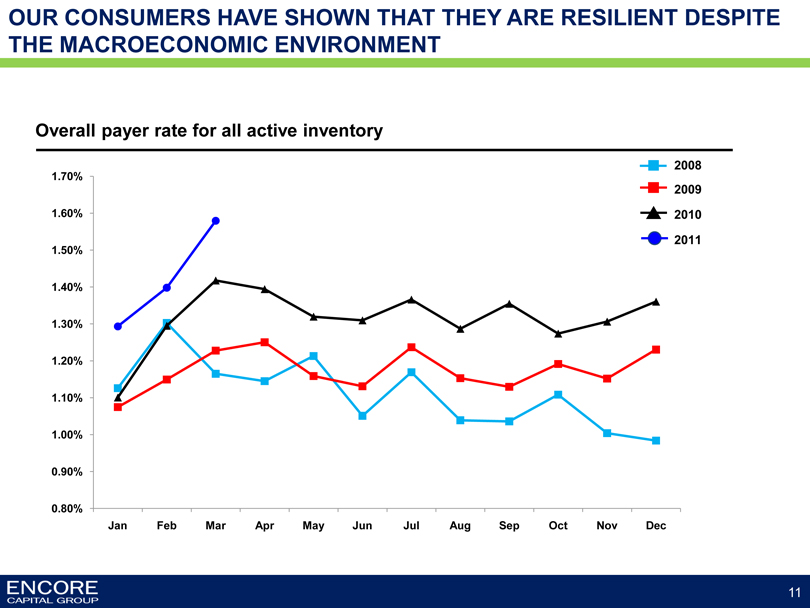
OUR CONSUMERS HAVE SHOWN THAT THEY ARE RESILIENT DESPITE THE MACROECONOMIC ENVIRONMENT
Overall payer rate for all active inventory
1.70%
1.60%
1.50%
1.40%
1.30%
1.20%
1.10%
1.00%
0.90%
0.80%
2008
2009
2010
2011
Jan
Feb
Mar
Apr
May
Jun
Jul
Aug
Sep
Oct
Nov
Dec
11
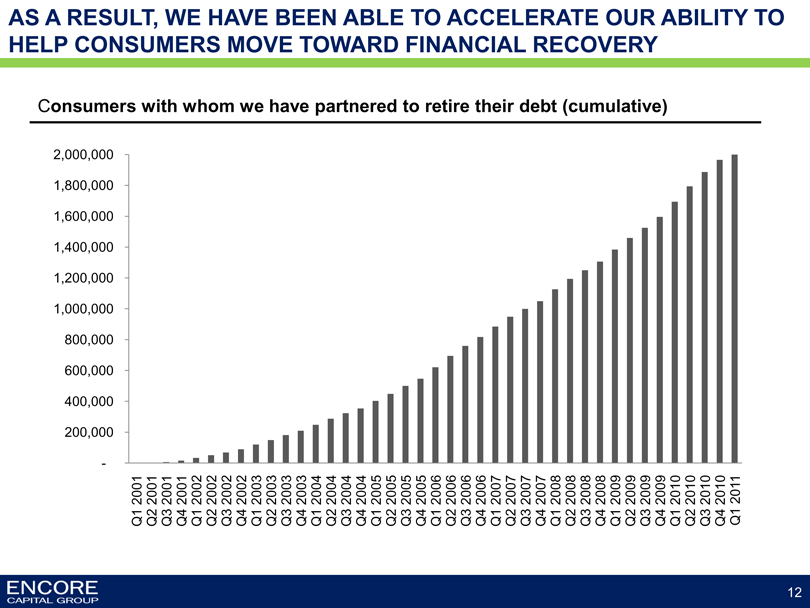
AS A RESULT, WE HAVE BEEN ABLE TO ACCELERATE OUR ABILITY TO HELP CONSUMERS MOVE TOWARD FINANCIAL RECOVERY
Consumers with whom we have partnered to retire their debt (cumulative)
2,000,000
1,800,000
1,600,000
1,400,000
1,200,000
1,000,000
800,000
600,000
400,000
200,000
-
Q1 2001 Q2 2001 Q3 2001 Q4 2001 Q1 2002 Q2 2002 Q3 2002 Q4 2002 Q1 2003 Q2 2003 Q3 2003 Q4 2003 Q1 2004 Q2 2004 Q3 2004 Q4 2004 Q1 2005 Q2 2005 Q3 2005 Q4 2005 Q1 2006 Q2 2006 Q3 2006 Q4 2006 Q1 2007 Q2 2007 Q3 2007 Q4 2007 Q1 2008 Q2 2008 Q3 2008 Q4 2008 Q1 2009 Q2 2009 Q3 2009 Q4 2009 Q1 2010 Q2 2010 Q3 2010 Q4 2010 Q1 2011
ENCORE
CAPITAL GROUP
12
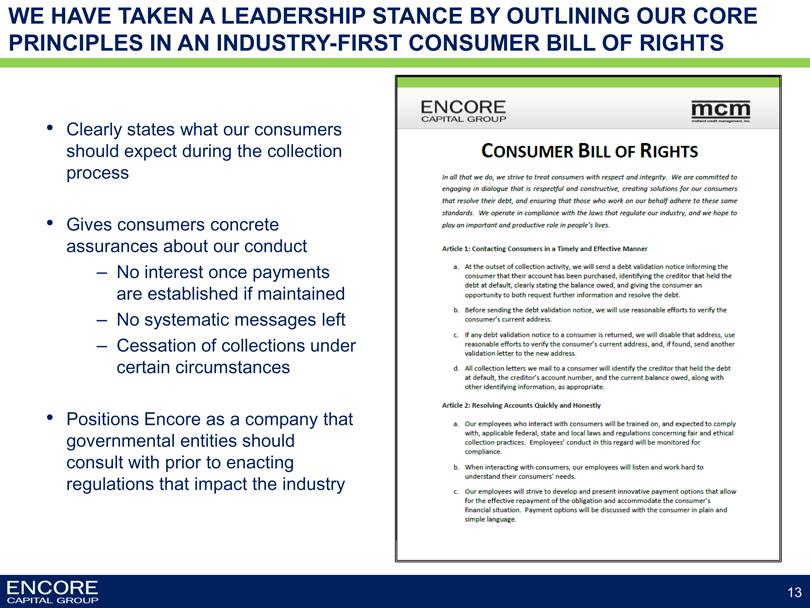
WE HAVE TAKEN A LEADERSHIP STANCE BY OUTLINING OUR CORE PRINCIPLES IN AN INDUSTRY-FIRST CONSUMER BILL OF RIGHTS
• Clearly states what our consumers should expect during the collection process
• Gives consumers concrete assurances about our conduct
– No interest once payments are established if maintained
– No systematic messages left
– Cessation of collections under certain circumstances
• Positions Encore as a company that governmental entities should consult with prior to enacting regulations that impact the industry
ENCORE
CAPITAL GROUP
mcm
midland credit management, inc.
CONSUMER BILL OF RIGHTS
In all that we do, we strive to treat consumers with respect and integrity. We are committed to engaging in dialogue that is respectful and constructive, creating solutions for our consumers that resolve their debt, and ensuring that those who work on our behalf adhere to these same standards. We operate in compliance with the laws that regulate our industry, and we hope to play an important and productive role in people’s lives.
Article 1: Contacting Consumers in a Timely and Effective Manner
a. At the outset of collection activity, we will send a debt validation notice informing the consumer that their account has been purchased, identifying the creditor that held the debt at default, clearly stating the balance owed, and giving the consumer an opportunity to both request further information and resolve the debt.
b. Before sending the debt validation notice, we will use reasonable efforts to verity the consumer’s current address.
c. if any debt validation notice to a consumer is returned, we will disable that address, use reasonable efforts to verity the consumer’s current address, and, if found, send another validation letter to the new address.
d. All collection letters we mail to a consumer will identify the creditor that held the debt at default, the creditor’s account number, and the current balance owed, along with other identifying information, as appropriate.
Article 2: Resolving Accounts Quickly and Honestly
a. Our employees who interact with consumers will be trained on, and expected to comply with, applicable federal, state and local laws and regulations concerning fair and ethical collection practices. Employees’ conduct in this regard will be monitored for compliance.
b. When interacting with consumers, our employees will listen and work hard to understand their consumers’ needs.
c. Our employees will strive to develop and present innovative payment options that allow for the effective repayment of the obligation and accommodate the consumer’s financial situation. Payment options will be discussed with the consumer in plain and simple language.
ENCORE
CAPITAL GROUP
13
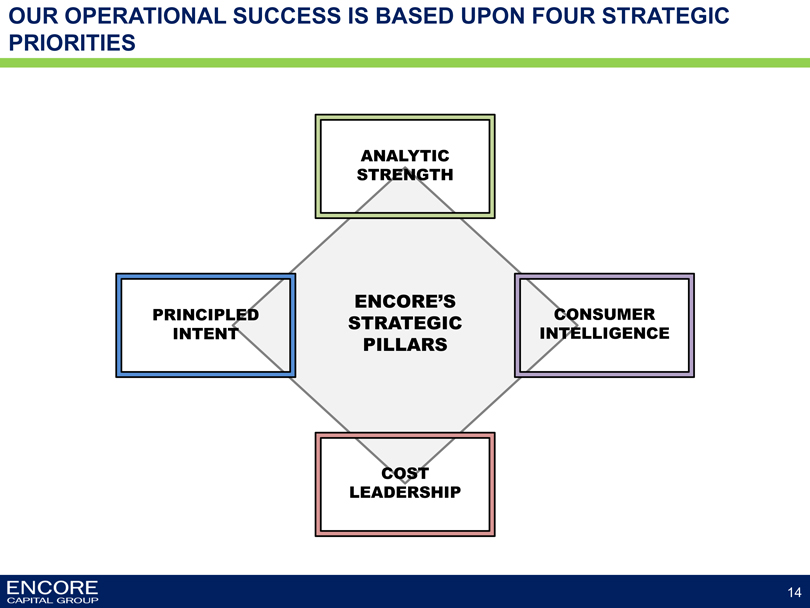
OUR OPERATIONAL SUCCESS IS BASED UPON FOUR STRATEGIC PRIORITIES
ENCORE’S STRATEGIC PILLARS
ANALYTIC STRENGTH
CONSUMER INTELLIGENCE
COST LEADERSHIP
PRINCIPLED INTENT
ENCORE
CAPITAL GROUP
14
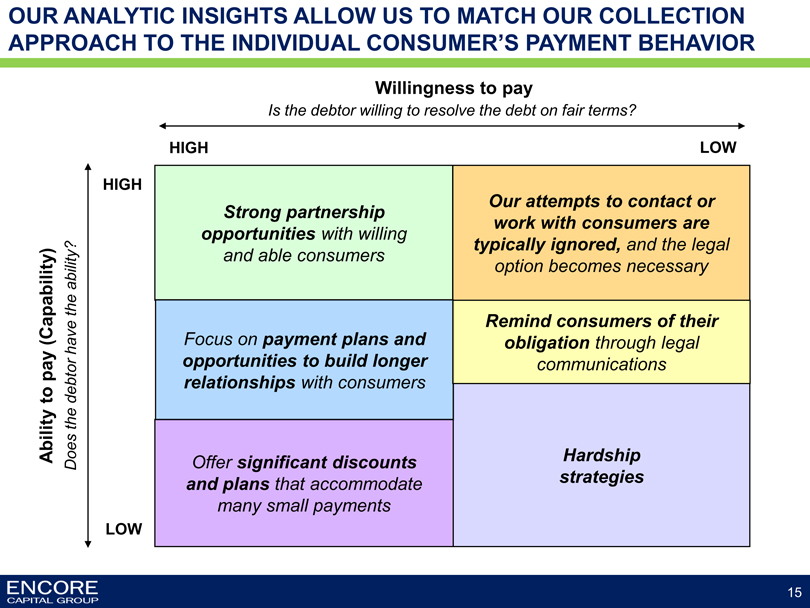
OUR ANALYTIC INSIGHTS ALLOW US TO MATCH OUR COLLECTION APPROACH TO THE INDIVIDUAL CONSUMER’S PAYMENT BEHAVIOR
Willingness to pay
Is the debtor willing to resolve the debt on fair terms?
HIGH
LOW
Ability to pay (Capability)
Does the debtor have the ability?
HIGH
LOW
Strong partnership opportunities with willing and able consumers
Focus on payment plans and opportunities to build longer relationships with consumers
Offer significant discounts and plans that accommodate many small payments
Our attempts to contact or work with consumers are typically ignored, and the legal option becomes necessary
Remind consumers of their obligation through legal communications
Hardship strategies
ENCORE
CAPITAL GROUP
15
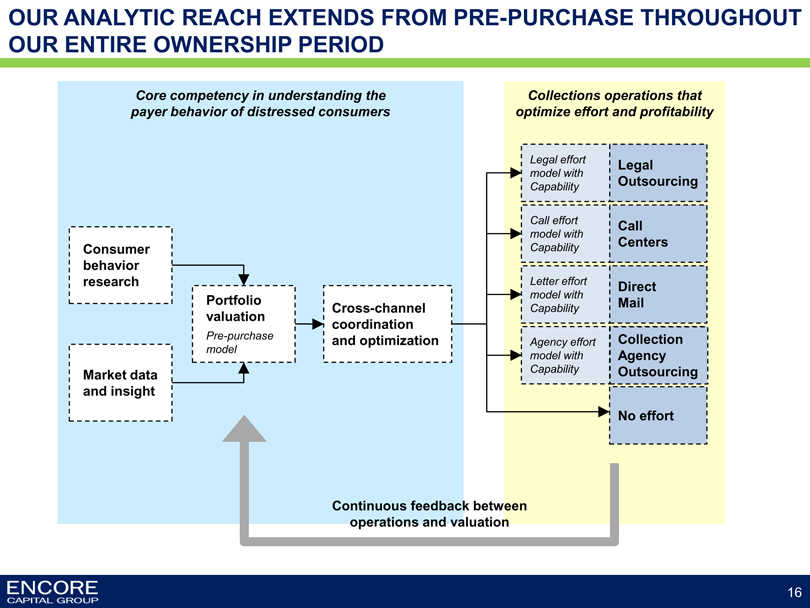
OUR ANALYTIC REACH EXTENDS FROM PRE-PURCHASE THROUGHOUT OUR ENTIRE OWNERSHIP PERIOD
Core competency in understanding the payer behavior of distressed consumers
Collections operations that optimize effort and profitability
Consumer behavior research
Market data and insight
Portfolio valuation
Pre-purchase model
Cross-channel coordination and optimization
Legal effort model with Capability
Call effort model with Capability
Letter effort model with Capability
Agency effort model with Capability
Legal Outsourcing
Call Centers
Direct Mail
Collection Agency Outsourcing
No effort
Continuous feedback between operations and valuation
ENCORE
CAPITAL GROUP
16
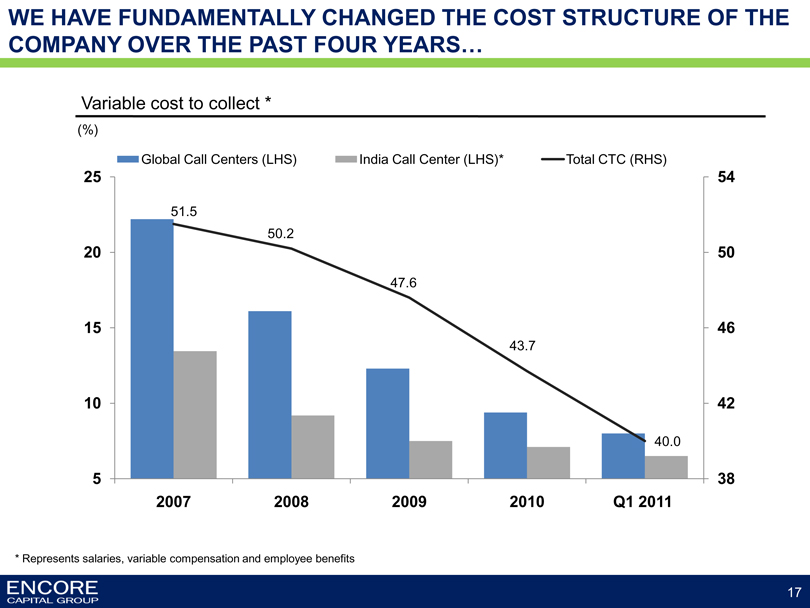
WE HAVE FUNDAMENTALLY CHANGED THE COST STRUCTURE OF THE COMPANY OVER THE PAST FOUR YEARS…
Variable cost to collect *
(%)
Global Call Centers (LHS)
India Call Center (LHS)*
Total CTC (RHS)
25 54
51.5
50.2
20 50
47.6
15 46
43.7
10 42
40.0
5 38
2007 2008 2009 2010 Q1 2011
* Represents salaries, variable compensation and employee benefits
ENCORE
CAPITAL GROUP
17
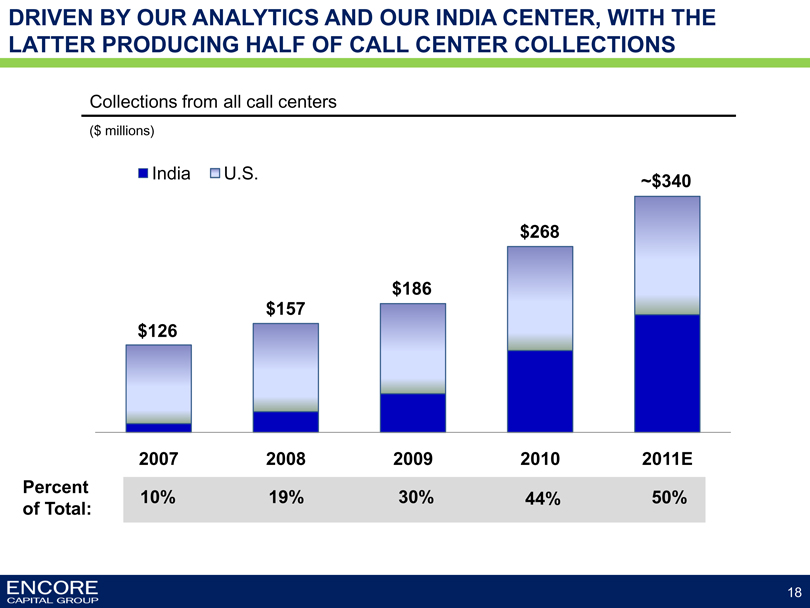
DRIVEN BY OUR ANALYTICS AND OUR INDIA CENTER, WITH THE LATTER PRODUCING HALF OF CALL CENTER COLLECTIONS
Collections from all call centers
($ millions)
India
U.S.
~$340
$268
$186
$157
$126
2007 2008 2009 2010 2011E
Percent of Total: 10% 19% 30% 44% 50%
ENCORE
CAPITAL GROUP
18
SUMMARY
• Favorable supply and demand dynamics have existed since 2008, with a few credible, large buyers
• Analytic insights inform our valuation and operating strategies and allow for a closer partnership with consumers
• Operational and financial leverage is increasing, largely due to the success of our operating center in India
• Strong performance is expected to continue
ENCORE
CAPITAL GROUP
19
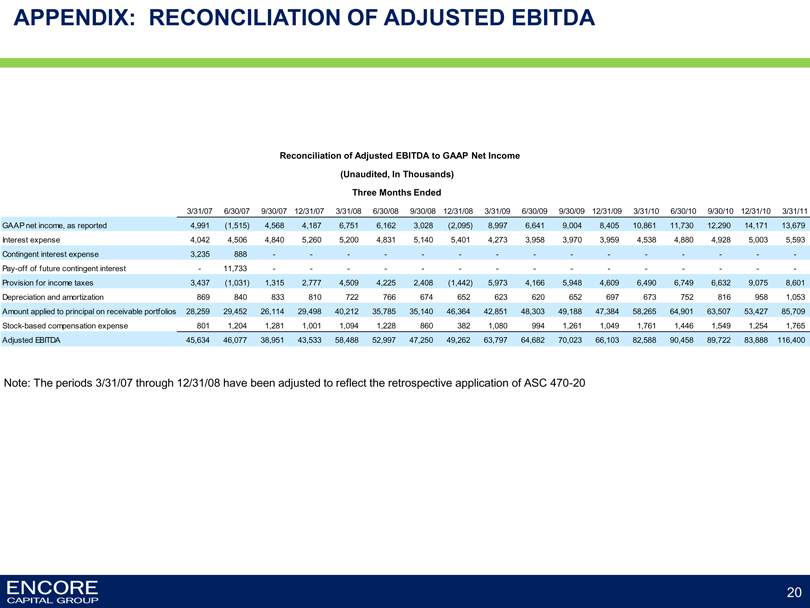
APPENDIX: RECONCILIATION OF ADJUSTED EBITDA
Reconciliation of Adjusted EBITDA to GAAP Net Income
(Unaudited, In Thousands)
Three Months Ended
GAAP net income, as reported
Interest expense
Contingent interest expense
Pay-off of future contingent interest
Provision for income taxes
Depreciation and amortization
Amount applied to principal on receivable portfolios
Stock-based compensation expense
Adjusted EBITDA
3/31/07 4,991 4,042 3,235 - 3,437 869 28,259 801 45,634
6/30/07 (1,515) 4,506 888 11,733 (1,031) 840 29,452 1,204 46,077
9/30/07 4,568 4,840 - - 1,315 833 26,114 1,281 38,951
12/31/07 4,187 5,260 - - 2,777 810 29,498 1,001 43,533
3/31/08 6,751 5,200 - - 4,509 722 40,212 1,094 58,488
6/30/08 6,162 4,831 - - 4,225 766 35,785 1,228 52,997
9/30/08 3,028 5,140 - - 2,408 674 35,140 860 47,250
12/31/08 (2,095) 5,401 - - (1,442) 652 46,364 382 49,262
3/31/09 8,997 4,273 - - 5,973 623 42,851 1,080 63,797
6/30/09 6,641 3,958 - - 4,166 620 48,303 994 64,682
9/30/09 9,004 3,970 - - 5,948 652 49,188 1,261 70,023
12/31/09 8,405 3,959 - - 4,609 697 47,384 1,049 66,103
3/31/10 10,861 4,538 - - 6,490 673 58,265 1,761 82,588
6/30/10 11,730 4,880 - - 6,749 752 64,901 1,446 90,458
9/30/10 12,290 4,928 - - 6,632 816 63,507 1,549 89,722
12/31/10 14,171 5,003 - - 9,075 958 53,427 1,254 83,888
3/31/11 13,679 5,593 - - 8,601 1,053 85,709 1,765 116,400
Note: The periods 3/31/07 through 12/31/08 have been adjusted to reflect the retrospective application of ASC 470-20
ENCORE
CAPITAL GROUP
20