 ENCORE CAPITAL GROUP, INC. JMP Securities Financial Services and Real Estate Conference September 13, 2012 Exhibit 99.1 |
 PROPRIETARY 2 CAUTIONARY NOTE ABOUT FORWARD-LOOKING STATEMENTS The statements in this presentation that are not historical facts, including, most importantly, those statements preceded by, or that include, the words “will,” “may,” “believe,” “projects,” “expects,” “anticipates” or the negation thereof, or similar expressions, constitute “forward-looking statements” within the meaning of the Private Securities Litigation Reform Act of 1995 (the “Reform Act”). These statements may include, but are not limited to, statements regarding our future operating results and growth. For all “forward-looking statements,” the Company claims the protection of the safe harbor for forward-looking statements contained in the Reform Act. Such forward- looking statements involve risks, uncertainties and other factors which may cause actual results, performance or achievements of the Company and its subsidiaries to be materially different from any future results, performance or achievements expressed or implied by such forward-looking statements. These risks, uncertainties and other factors are discussed in the reports filed by the Company with the Securities and Exchange Commission, including the most recent reports on Forms 10-K, 10-Q and 8-K, each as it may be amended from time to time. The Company disclaims any intent or obligation to update these forward-looking statements. |
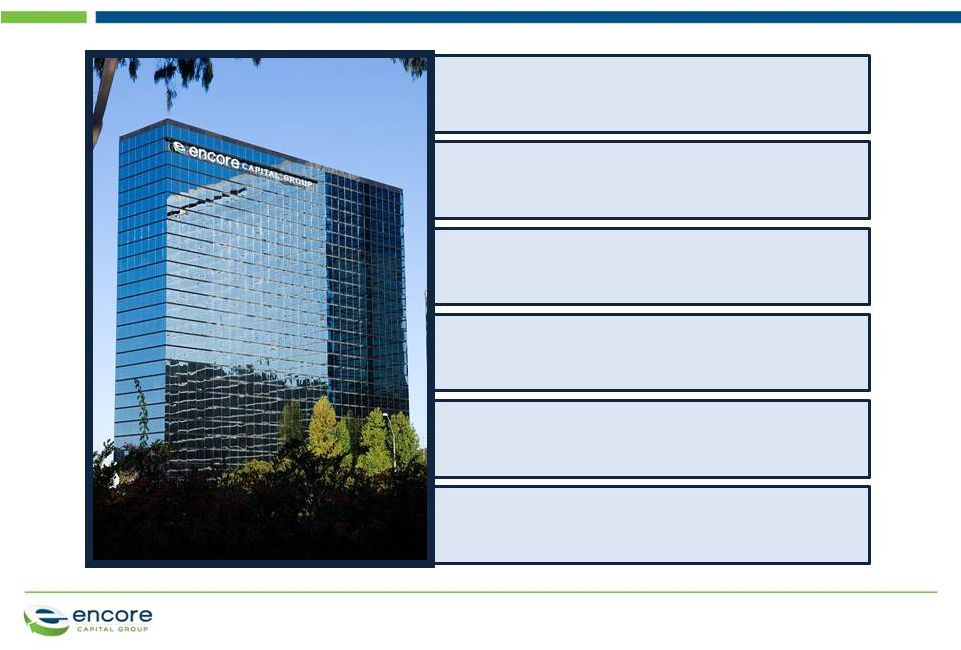 PROPRIETARY ENCORE IS A GROWING COMPANY WITH SOPHISTICATED OPERATIONS AND DEEP CONSUMER EXPERTISE 3 † See endnote 1 in 9 American consumers have accounts with us 2.6 million consumers have satisfied their obligations $850 million collected in the last twelve months $2 billion in estimated remaining collections Adjusted EBITDA † 5-year compound annual growth rate 2,700 employees worldwide 30% |
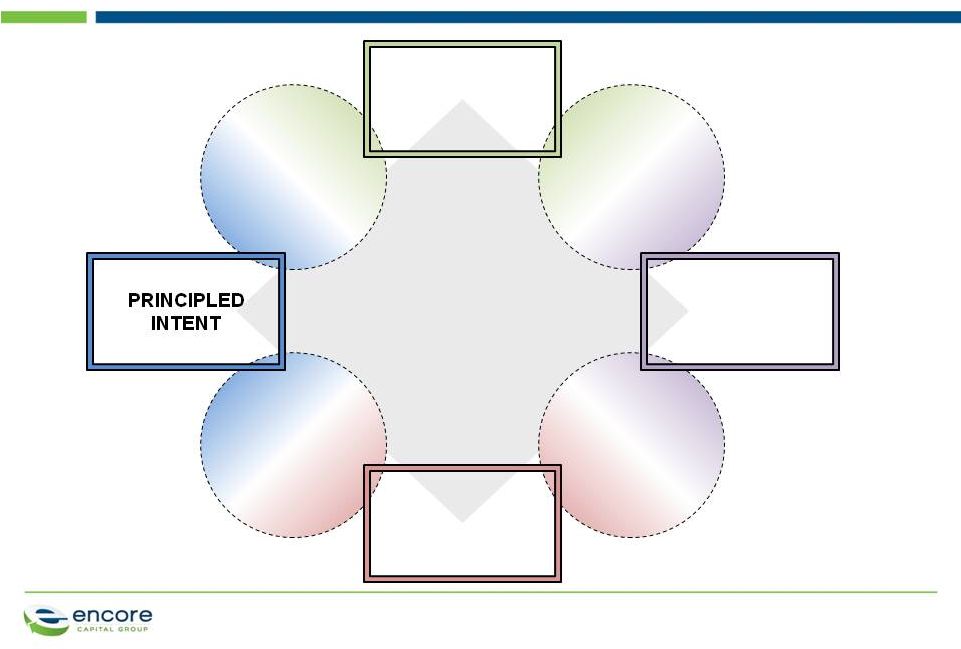 PROPRIETARY OUR SUCCESS IS DRIVEN BY OUR CORE COMPETENCIES 4 ENCORE’S KEY COMPETITIVE ADVANTAGES Legal collections Consumer Credit Research Institute Marketing analytics ANALYTIC STRENGTH International operations Account Manager expertise COST LEADERSHIP Portfolio valuation and purchasing Operational modeling CONSUMER INTELLIGENCE |
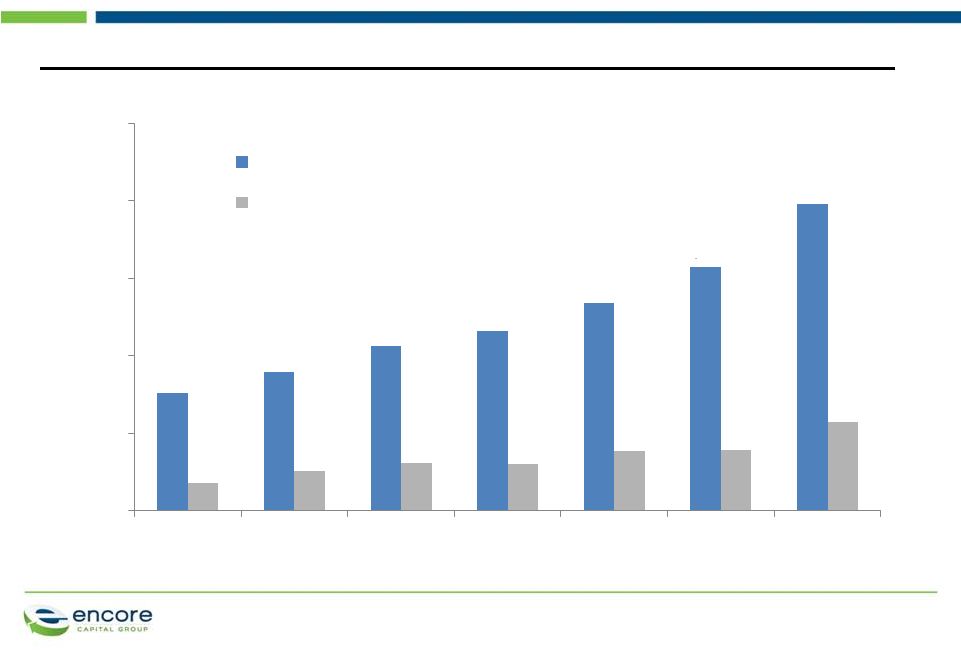
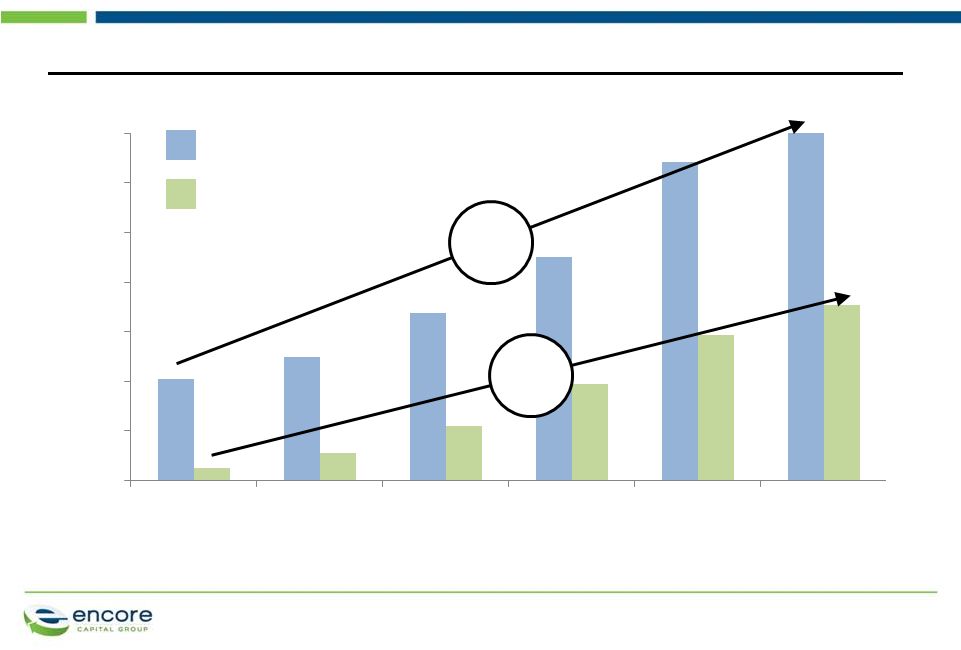 5 WE HAVE SIGNIFICANTLY INCREASED OPERATING CASH FLOW (ADJUSTED EBITDA) AND CASH COLLECTIONS ($M) * Adjusted EBITDA is a non-GAAP number. The Company considers Adjusted EBITDA to be a meaningful indicator of operating performance and uses it as a measure to assess the operating performance of the Company. See Reconciliation of Adjusted EBITDA to GAAP Net Income at the end of this presentation. Adjusted EBITDA* and gross collections by year PROPRIETARY 25% CAGR 30% CAGR Gross collections Adjusted EBITDA 150 250 350 450 550 650 750 850 2007 2008 2009 2010 2011 Q2 2012 TTM |
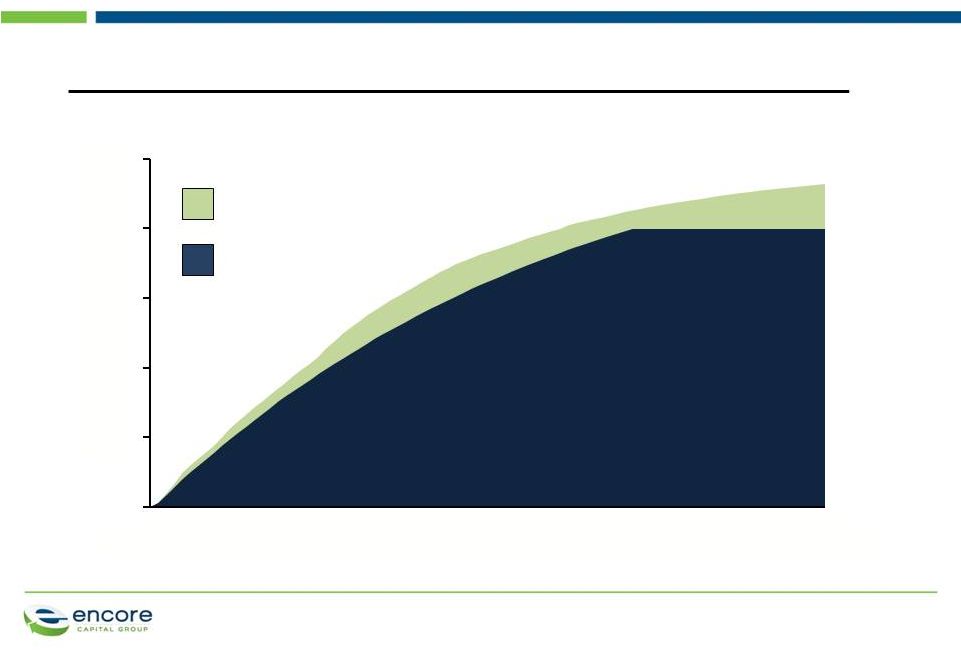
 6 AND WE CONTINUE TO BUILD A SUBSTANTIAL RESERVOIR FOR THE FUTURE Annual estimated remaining gross collection (ERC) and total debt ($M, End of period) PROPRIETARY * Total debt excludes Propel credit facility 2006 2007 2008 2009 2010 2011 Q2 2012 0 500 1,000 1,500 2,000 2,500 ERC Total Debt * 1,571 1,983 389 574 |
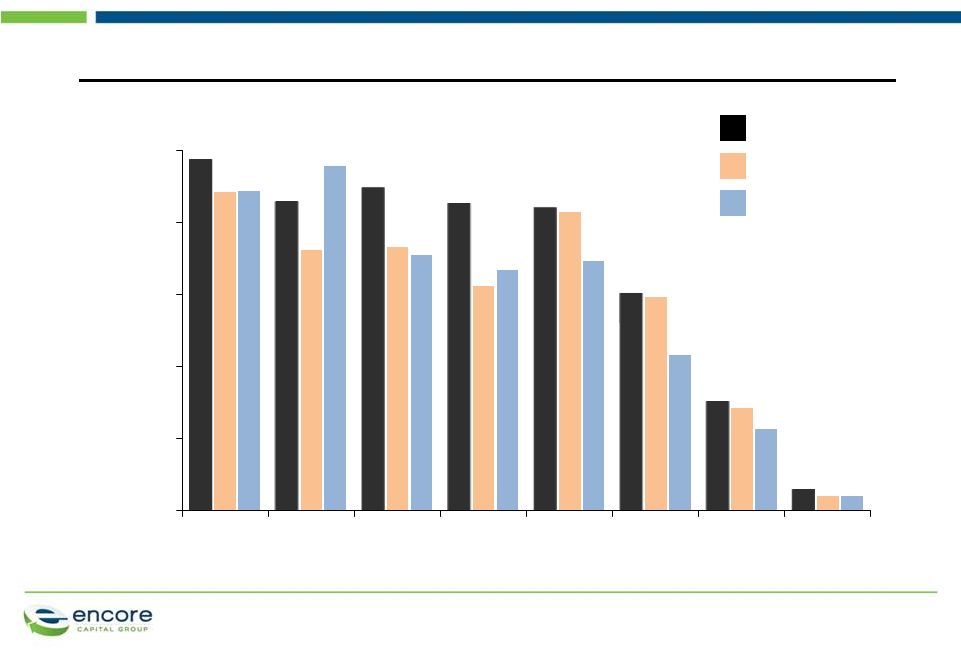 PROPRIETARY OUR VALUATION AND OPERATING CAPABILITIES HAVE ESTABLISHED ENCORE AS THE INDUSTRY LEADER 7 Cumulative actual collection multiples by vintage year, as of June 30, 2012 (Total collections / Purchase price) Source: SEC filings 0.00x 0.50x 1.00x 1.50x 2.00x 2.50x 2005 2006 2007 2008 2009 2010 2011 2012 ECPG Peer 1 Peer 2 |
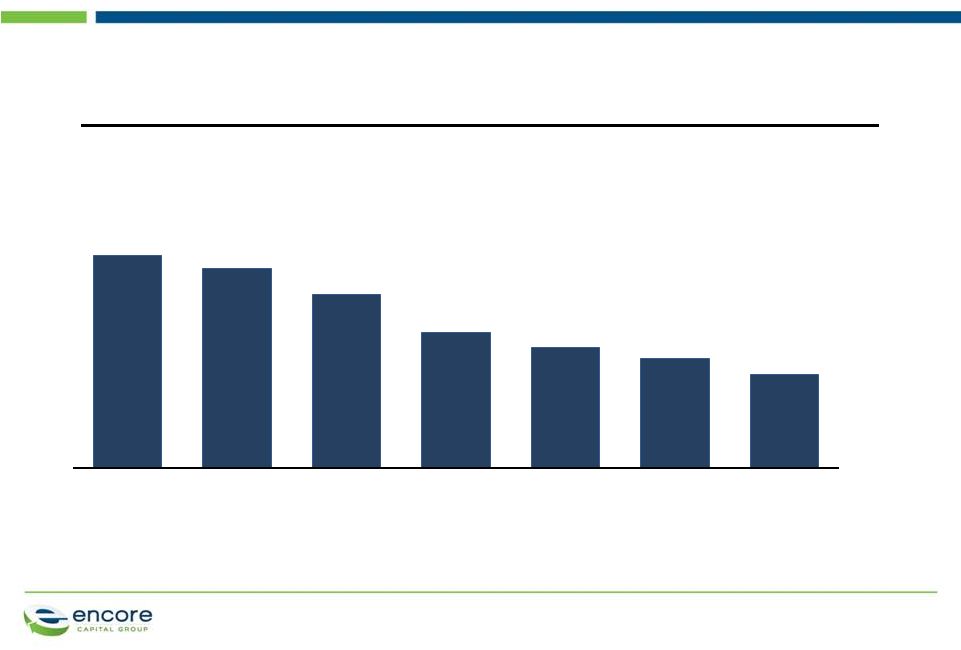 PROPRIETARY AND THE DRAMATIC IMPROVEMENT IN OUR COST TO COLLECT HAS GIVEN US A KEY COMPETITIVE ADVANTAGE 8 Overall cost to collect (%) 2007 2008 2009 2010 2011 Q2 2012 TTM Q2 2012 51.5 50.2 47.6 43.7 42.2 41.1 39.5 |
 PROPRIETARY OUR OPERATING MODEL AND COST ADVANTAGES ALLOW US TO REMAIN PROFITABLE WHEN OTHERS CANNOT 9 2.5 2.2 2.0 Interplay of multiples with the costs of debt and collection (Unlevered IRR) Cost to collect Cost of debt: 7% 40% 45% 50% 15.7 10.6 8.3 5.2 2.9 3.4 (2.5) (2.5) (9.0) Cost of debt: 4% 40% 45% 50% 17.4 12.5 7.4 5.8 5.3 10.3 0.9 0.9 (4.1) Cost to collect Cost of debt: 10% 40% 45% 50% 13.9 6.0 2.6 8.5 0.3 (7.7) (0.3) (7.7) (18.1) Cost to collect |
 PROPRIETARY OPERATIONALLY, WE'RE BUILDING A PLATFORM THAT ENCOURAGES A DIFFERENT KIND OF RELATIONSHIP WITH OUR CONSUMERS 10 Addressing debt cycles • Acknowledging the limitations of our consumers’ household balance sheets • Living the Consumer Bill of Rights Making focused investments • Creating specialized work groups • Leveraging our industry-leading cost efficiency • Increasing direct control over consumer experience Improving consumer experience • Using market-based surveys and tests to understand consumer satisfaction • Partnering to develop new products and services • Pointing consumers to the best external references |
 PROPRIETARY WE’VE SEEN A SIGNIFICANT INCREASE IN THE NUMBER OF CONSUMERS WITH MULTIPLE OBLIGATIONS 11 Multiple obligations held within new portfolios, by purchase vintage (% of unique consumers) 17 25 37 44 45 2008 2009 2010 2011 2012(E) |
 PROPRIETARY WE’VE ESTABLISHED SPECIALIZED COLLECTION TEAMS TO OPTIMIZE REPAYMENT RATES AND CONSUMER EXPERIENCE 12 73 79 88 89 Internal call center share of non-legal collections (%) Increasing work group specialization and control allows for: 10 11 15 17 (Number of distinct teams) Increasing call center specialization 2009 2010 2011 2012(E) 2009 2010 2011 2012(E) Discounts that are better customized to consumer circumstance Increasing numbers of deep discounts for those consumers most in need |
 PROPRIETARY OUR CALL CENTER PRODUCTIVITY HAS STEADILY IMPROVED THROUGH SPECIALIZATION 13 Productivity of Phoenix Call Center (Dollars collected per paid hour) 148 207 252 359 422 497 2007 2008 2009 2010 H1 2012 2011 |
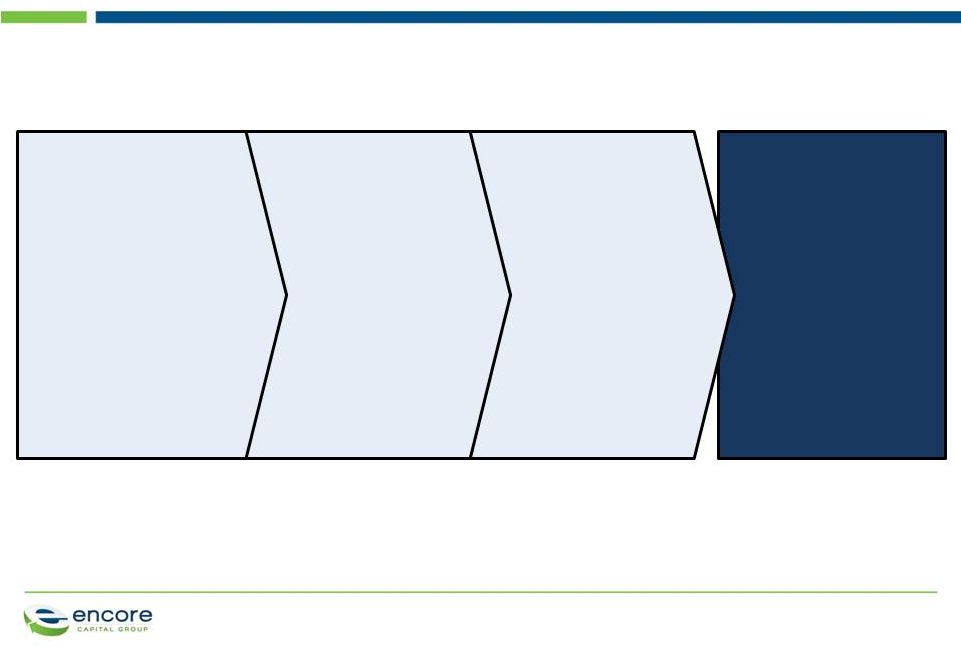
 PROPRIETARY UNDERSTANDING FINANCIALLY STRESSED CONSUMER BEHAVIOR IS AT THE HEART OF OUR COMPANY’S EVOLUTION • Valuation based on individual consumer characteristics • Basic business functionality focused on public company needs • Early technology investment in large databases and analysis software • Significant investment in credit bureau and skip tracing data 1999 2001 • First-mover advantage created through development of advanced operational models focused on consumer behavior and financial ability • Industry-first investment to understand financially stressed consumers' decisions, choices, and activities • Data critical mass achieved through owned consumer accounts and specialized data vendor programs • Access to unique data held by private companies and agencies, and analyzed by academic experts 2005 2011 14 Reporting and alerts Statistical analysis and forecasting Predictive modeling and optimization Data Behavioral science field studies Analytics |
 PROPRIETARY THIS IS CLEARLY SEEN IN OUR APPROACH TO ASSET VALUATION 15 The standard industry view of a consumer debt portfolio High willingness High capability Low willingness High ability High willingness Moderate capability Low willingness Low ability High willingness Low capability • Hardship strategies and warehousing • Significant discounts and many small payments • Enforce legal contract through formal channels • Strong partnership and recovery opportunities • Remind consumers through legal messaging • Payment plans and opportunities to build longer relationships Encore’s individual underwriting approach to portfolio valuation accommodates our specialized operational strengths Low willingness Moderate ability |
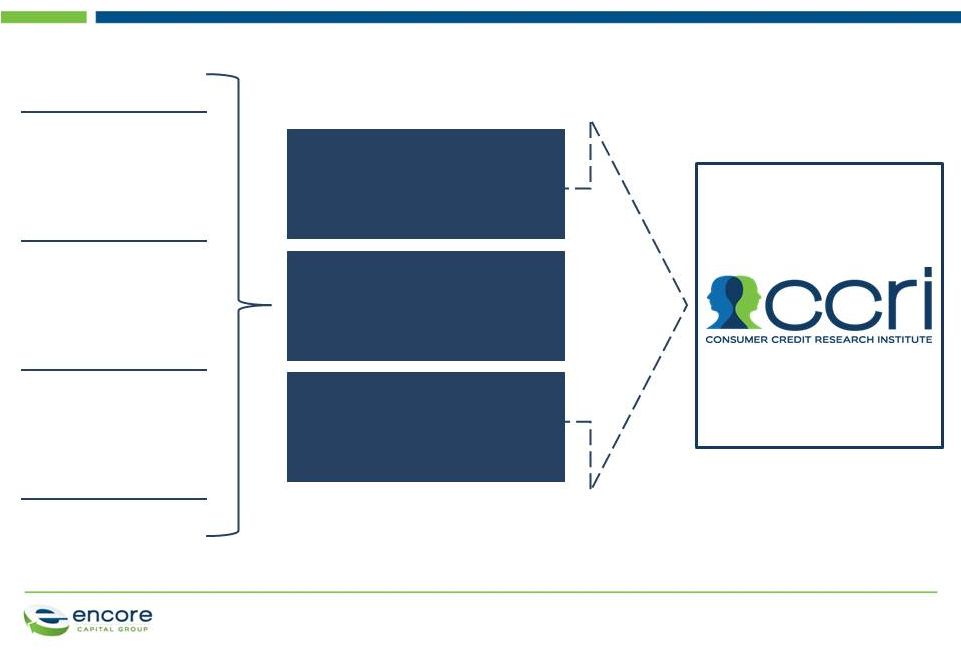 PROPRIETARY WE MAXIMIZE OUR IMPACT BY ASKING IMPORTANT QUESTIONS ABOUT CONSUMERS AND THEIR CIRCUMSTANCES What can we do to ethically promote repayment behavior? How do consumers prioritize their spending and saving options? When do we nudge consumers using behavioral economics? 16 Integrate experimental psychology and behavioral finance with operational strategy Promote financial literacy and recovery through a tailored suite of products and services Conduct research to understand financially stressed consumers’ financial decision-making |
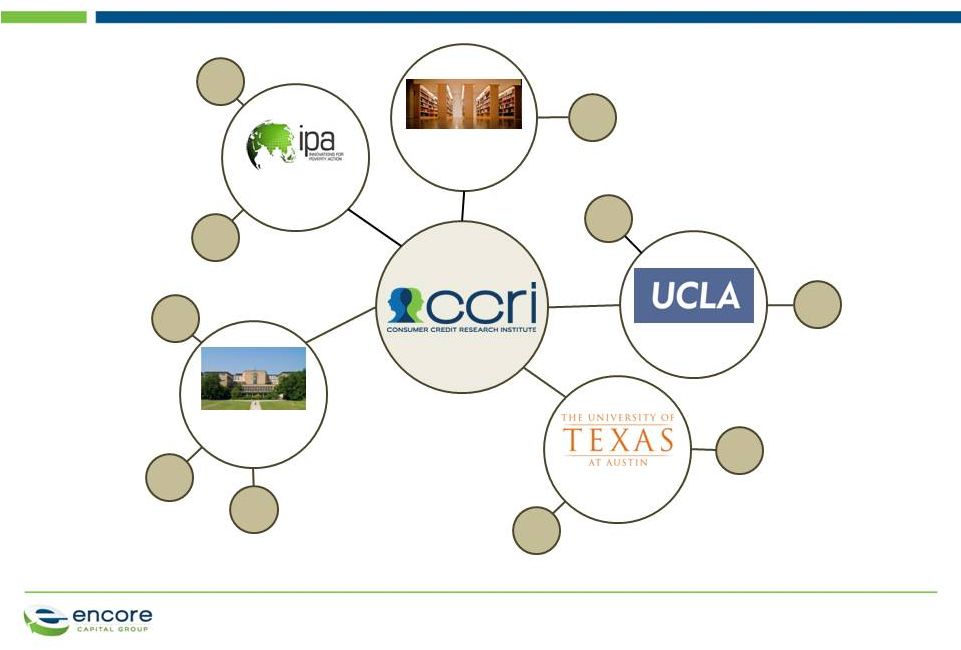 PROPRIETARY WE ARE COLLABORATING WITH LEADING INSTITUTIONS TO AUGMENT OUR SCIENTIFIC EXPERTISE Consumer payments Econometrics Credit availability Governmental agencies Behavioral decision theory Risk and uncertainty Fox Poldrack Brain systems for decision-making and executive function Cognitive Neuroscience Microeconomic analysis of social and economic challenges Public policy centers Household finance Behavioral Economics Zinman Karlan 17 |
 PROPRIETARY International Expand geographically New asset classes Expand core footprint Bankrupt accounts Focus on bankruptcy Outsourcing services Expand along value system Secured loans Cover different type of debt Performing loans Expand along the debt life cycle AS WE LOOK TO THE FUTURE, WE ARE EXPLORING WAYS TO LEVERAGE OUR CORE COMPETENCIES 18 Chapter 13 Chapter 7 Pre-charge off delinquencies Early delinquencies Auto debt Tax liens Mortgage debt Countries with mature credit systems Emerging markets Credit cards Telecom and other utilities Penetrate existing market Consumer loans Contingency collections First party collection services Municipal obligations Student loans Utilities National Existing asset classes Purchase Unsecured International Expand geographically New asset classes Expand core footprint Bankrupt accounts Focus on bankruptcy Outsourcing services Expand along value system Secured loans Cover different type of debt Performing loans Expand along the debt life cycle Chapter 13 Chapter 7 Pre-charge off delinquencies Early delinquencies Tax liens Mortgage debt Countries with mature credit systems Emerging markets Credit cards Telecom and other utilities Penetrate existing market Consumer loans Contingency collections First party collection services Municipal obligations Student loans Utilities Defaulted National Existing asset classes Purchase Unsecured Defaulted |
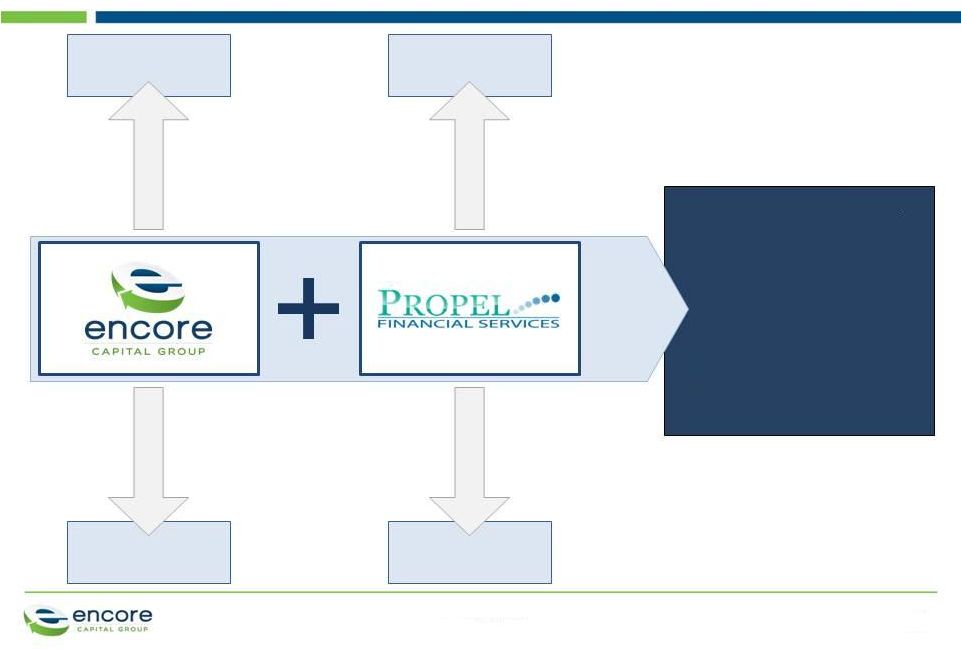
 PROPRIETARY LAST QUARTER, WE MADE THREE KEY STRATEGIC MOVES 19 Encore’s largest portfolio acquisition Our analytical and operating advantages enabled the successful valuation and integration of the large purchase Divestiture of our bankruptcy servicing subsidiary We transitioned Ascension Capital Group to a capable owner with expertise in the bankruptcy space Acquisition of Propel Financial Services We identified and pursued a strong cultural and strategic fit that lends itself to strong long-term growth |
 PROPRIETARY Acquisition of large competitor’s assets Significant history of acquiring assets in the resale market gave us an analytic advantage when conducting operational due diligence Practice makes perfect Industry-leading models used to estimate individual consumer willingness and ability to pay • Enabled us to identify and acquire the most valuable pools Careful consumer segmentation ENCORE IS WELL POSITIONED TO PROVIDE A SOLUTION FOR COMPETITORS WHO EXIT THE MARKET 20 Our operational advantages insulate us against overpaying • Powerful operational models and practices • Superior forecasting methodology Protection from the “winner’s curse” |
 OUR CONFIDENCE IS TIED TO THE SUCCESSFUL COMPLETION OF ONE OF THE INDUSTRY’S FEW DEALS OF THIS SIZE 21 $90M portfolio purchase in 2005, cumulative collections ($M) Initial expectations: $199M Results to date: $232M Actual collections Estimated collections 50 100 150 200 250 Jun-05 Jun-06 Jun-07 Jun- 08 Jun- 09 Jun-10 Jun-11 Jun-12 PROPRIETARY |
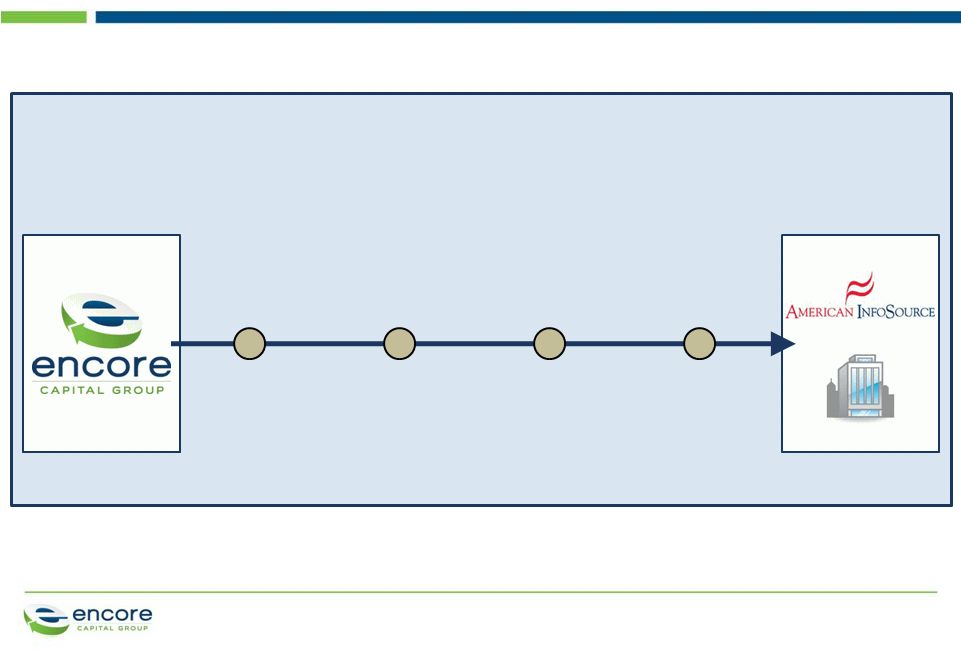 PROPRIETARY WE HAVE TRANSITIONED OUR BANKRUPTCY BUSINESS TO A BETTER-SUITED OWNER 22 Bankruptcy volumes have declined ACG has not been, and would not be, material to Encore Business requires a significant technology investment Buyer has focused IT and bankruptcy expertise, and currently serves large, financial institutions |
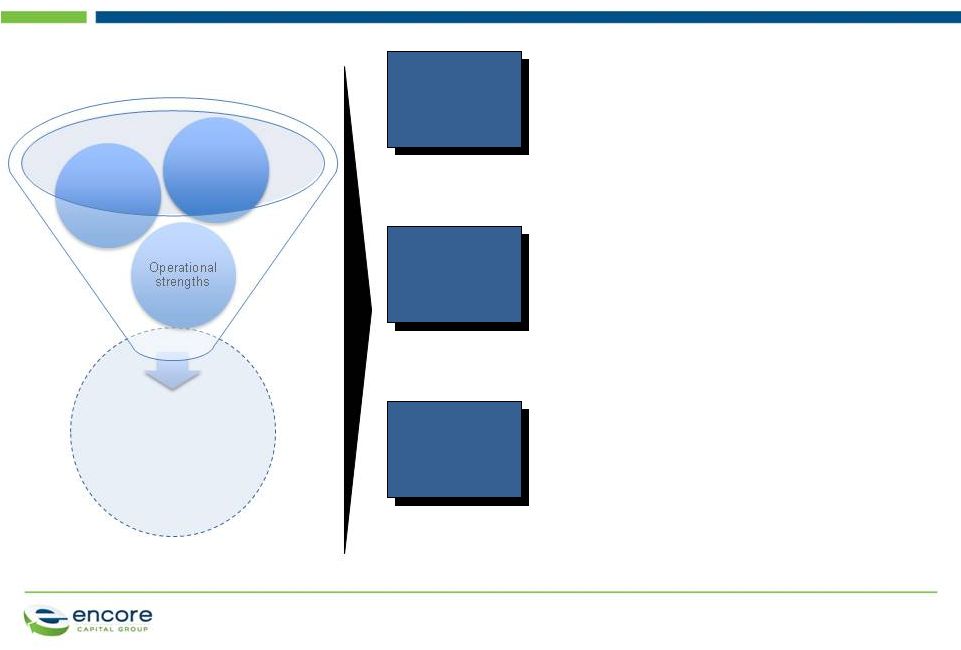 PROPRIETARY WE STUDIED MANY MARKETS AND GEOGRAPHIES BEFORE FINDING AN OPPORTUNITY THAT SATISFIED OUR ACQUISITION CRITERIA 23 • Used to fund essential services • Allows consumers to protect home from foreclosure and avoid financial penalties • Propel was recognized as a 2011 “Top Workplace” by San Antonio Express-News Consumer focused model Meaningful market opportunity • Between $7B and $10B sold each year • Advantageous timing as large players exit the market for non-financial reasons Leverage Encore’s strengths • Consumer intelligence platform focused on helping financially stressed individuals • Industry-leading asset valuation methodology • Low-cost operational platform Asset class diversification Geography Acquisition of dominant player in the tax lien space |
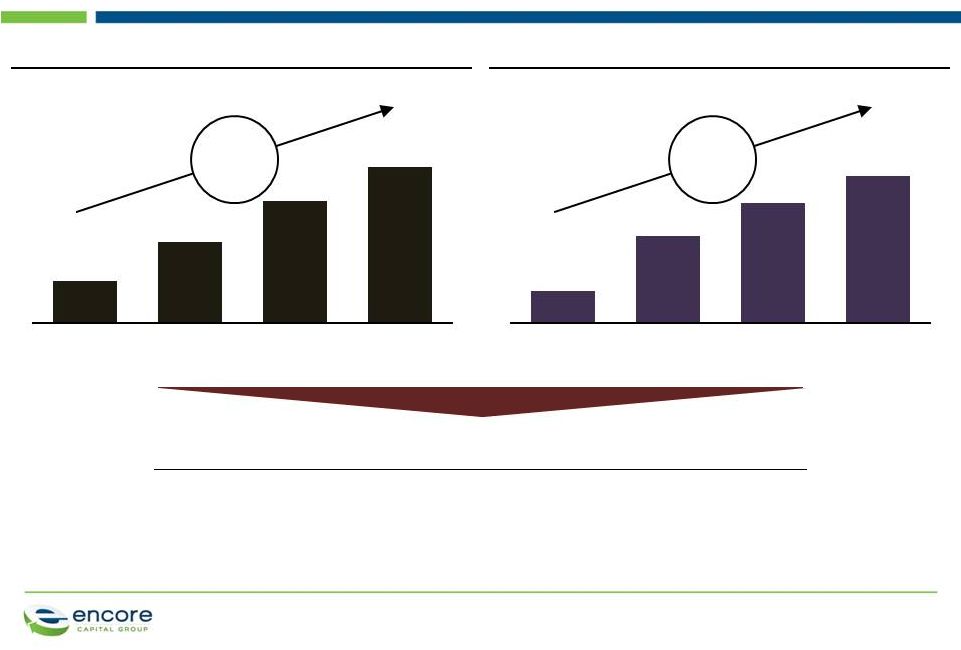 PROPRIETARY WHICH HAS ALLOWED US TO GROW OUR PORTFOLIO WHILE MAINTAINING AN EXCEPTIONALLY LOW RISK PROFILE 24 Propel originations ($M) 18 35 53 68 Propel portfolio size ($M) 26 72 99 121 • $6,000 average balance • 7-year term • 3.5-year weighted average life • 13-14% typical interest rate Residential portfolio characteristics • $180,000 average property value • 4% average LTV at origination • 0.3% foreclosure rate • Zero losses CAGR 55% CAGR 67% 2008 2009 2010 2011 2008 2009 2010 2011 |
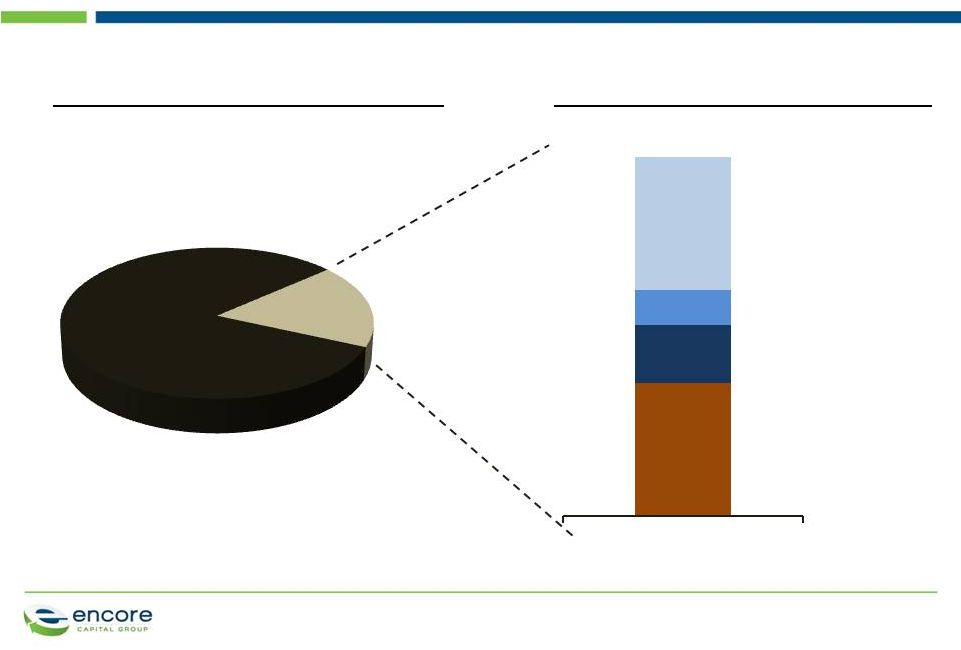 PROPRIETARY THE COMPETITIVE LANDSCAPE IS FAVORABLE AND THE TEXAS MARKET IS LARGE AND RELATIVELY UNTAPPED 25 Propel Financial Services Largest competitor 2 nd largest competitor All other competitors 82 18 2011 market penetration (%) Propel market share (Originations, %) 37 16 10 37 Unserved market Funded tax liens |
 THE BUSINESS MODELS ARE VERY SIMILAR, AS BOTH PROVIDE ESSENTIAL SERVICES FOR CONSUMERS AND CREDITORS 26 Leading provider of debt management and recovery solutions for consumers and property owners across a broad range of asset classes Property Owners Structured payment plans to help residential and commercial property owners settle tax obligations and avoid foreclosure Consumer Debt Holders Robust collection plans to maximize ability of consumers to repay obligations and ensure that consumers are treated fairly Financial Institutions Payment for consumer debt obligations Local Tax Authorities Payment for residential and commercial property tax obligations PROPRIETARY |
 PROPRIETARY OUR BALANCE SHEET REMAINS STRONG ($M) Covenant analysis Cash flow leverage ratio Debt Trailing 4-quarter Adjusted EBITDA † Debt/Adjusted EBITDA (maximum 2.0x) Minimum net worth Excess room Interest coverage ratio EBIT/interest expense (minimum 2.0x) 2010 385.3 345.0 1.12 95.1 5.0 2011 389.0 444.9 0.87 133.5 5.7 Q2 2012 702.3 490.9 1.43 151.6 5.8 27 † See endnote |
 PROPRIETARY 28 ENCORE’S LONG-TERM PROSPECTS CONTINUE TO BE STRONG AND ARE GAINING STRENGTH • Operating results continue to be strong and are exceeding our internal projections • Acquisition of the market leader in tax lien transfer business provides flexibility for future purchase needs • Working collaboratively with legislators and policymakers to shape the future of the collection industry • Significant purchases in the second quarter will drive growth throughout 2012 and into 2013 |
 PROPRIETARY ENDNOTE † The Company has included information concerning Adjusted EBITDA because management utilizes this information in the evaluation of its operations and believes that this measure is a useful indicator of the Company's ability to generate cash collections in excess of operating expenses through the liquidation of its receivable portfolios. Adjusted EBITDA has not been prepared in accordance with generally accepted accounting principles (GAAP). The Company has included a reconciliation of Adjusted EBITDA to reported earnings under GAAP, in the financial tables included in the Appendix. 29 |
 PROPRIETARY 30 APPENDIX |
 APPENDIX A: RECONCILIATION OF ADJUSTED EBITDA Reconciliation of Adjusted EBITDA to GAAP Net Income (Unaudited, In Thousands) Three Months Ended Note: The periods 3/31/07 through 12/31/08 have been adjusted to reflect the retrospective application of ASC 470-20. All periods have been adjusted to show discontinued ACG operations. PROPRIETARY 3/31/07 6/30/07 9/30/07 12/31/07 3/31/08 6/30/08 9/30/08 12/31/08 3/31/09 6/30/09 9/30/09 12/31/09 GAAP net income, as reported 4,991 (1,515) 4,568 4,187 6,751 6,162 3,028 (2,095) 8,997 6,641 9,004 8,405 (Gain) loss from discontinued operations, net of tax 550 491 401 63 (422) (89) 46 (483) (457) (365) (410) (901) Interest expense 4,042 4,506 4,840 5,260 5,200 4,831 5,140 5,401 4,273 3,958 3,970 3,959 Contingent interest expense 3,235 888 - - - - - - - - - - Pay-off of future contingent interest - 11,733 - - - - - - - - - - Provision for income taxes 3,815 (689) 1,262 2,909 4,227 4,161 2,429 (1,781) 5,670 3,936 5,676 4,078 Depreciation and amortization 527 496 486 464 438 482 396 391 410 402 443 516 Amount applied to principal on receivable portfolios 28,259 29,452 26,114 29,498 40,212 35,785 35,140 46,364 42,851 48,303 49,188 47,384 Stock-based compensation expense 801 1,204 1,281 1,001 1,094 1,228 860 382 1,080 994 1,261 1,049 Acquisition related expense - - - - - - - - - - - - Adjusted EBITDA 46,220 46,566 38,952 43,382 57,500 52,560 47,039 48,179 62,824 63,869 69,132 64,490 3/31/10 6/30/10 9/30/10 12/31/10 3/31/11 6/30/11 9/30/11 12/31/11 3/31/12 6/30/12 GAAP net income, as reported 10,861 11,730 12,290 14,171 13,679 14,775 15,370 17,134 11,406 16,596 (Gain) loss from discontinued operations, net of tax (687) (684) (315) 28 (397) (9) (60) 101 6,702 2,392 Interest expense 4,538 4,880 4,928 5,003 5,593 5,369 5,175 4,979 5,515 6,497 Contingent interest expense - - - - - - - - - - Pay-off of future contingent interest - - - - - - - - - - Provision for income taxes 6,080 6,356 6,474 9,057 8,349 9,475 9,834 10,418 11,660 12,846 Depreciation and amortization 522 591 650 789 904 958 1,054 1,165 1,240 1,420 Amount applied to principal on receivable portfolios 58,265 64,901 63,507 53,427 85,709 83,939 73,187 69,462 104,603 101,813 Stock-based compensation expense 1,761 1,446 1,549 1,254 1,765 1,810 2,405 1,729 2,266 2,539 Acquisition related expense - - - - - - - - 489 3,774 Adjusted EBITDA 81,340 89,220 89,083 83,729 115,602 116,317 106,965 104,988 143,881 147,877 31 |