 ENCORE CAPITAL GROUP, INC. 2013 INVESTOR DAY Exhibit 99.1 |
 PROPRIETARY CAUTIONARY NOTE ABOUT FORWARD-LOOKING STATEMENTS 2 The statements in this presentation that are not historical facts, including, most importantly, those statements preceded by, or that include, the words “will,” “may,” “believe,” “projects,” “expects,” “anticipates” or the negation thereof, or similar expressions, constitute “forward-looking statements” within the meaning of the Private Securities Litigation Reform Act of 1995 (the “Reform Act”). These statements may include, but are not limited to, statements regarding our future operating results, earnings per share, and growth. For all “forward-looking statements,” the Company claims the protection of the safe harbor for forward-looking statements contained in the Reform Act. Such forward-looking statements involve risks, uncertainties and other factors which may cause actual results, performance or achievements of the Company and its subsidiaries to be materially different from any future results, performance or achievements expressed or implied by such forward-looking statements. These risks, uncertainties and other factors are discussed in the reports filed by the Company with the Securities and Exchange Commission, including the most recent reports on Forms 10-K, 10-Q and 8-K, each as it may be amended from time to time. The Company disclaims any intent or obligation to update these forward-looking statements. |
 PROPRIETARY PRESENTING TODAY Brandon Black Former CEO Ken Vecchione Chief Executive Officer Paul Grinberg Chief Financial Officer Ashish Masih SVP, Legal Collections / AACC Integration Lead 3 |
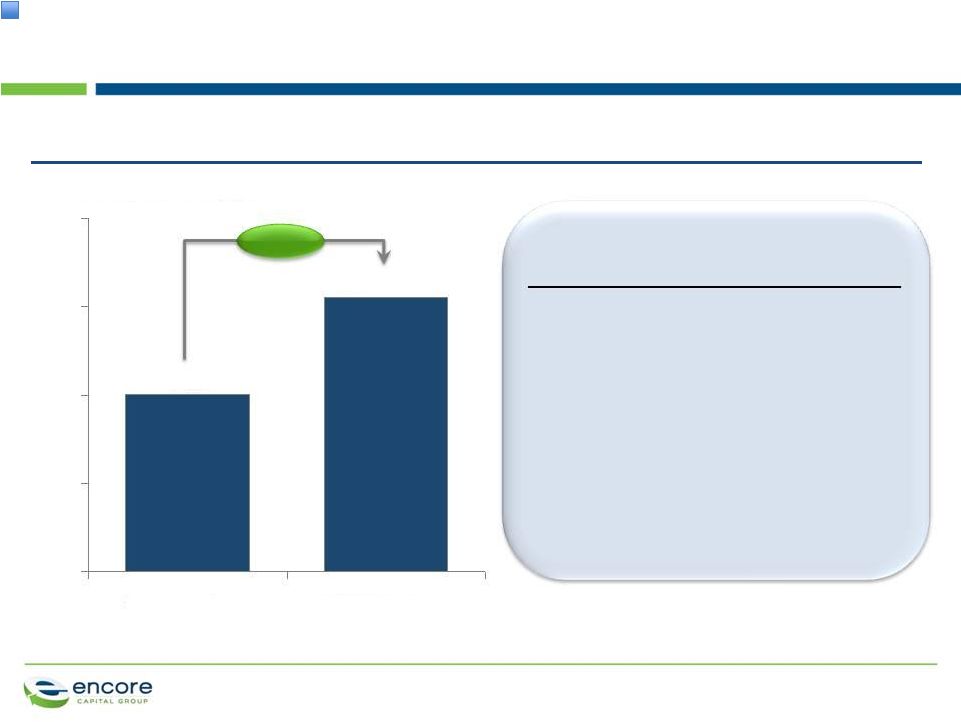
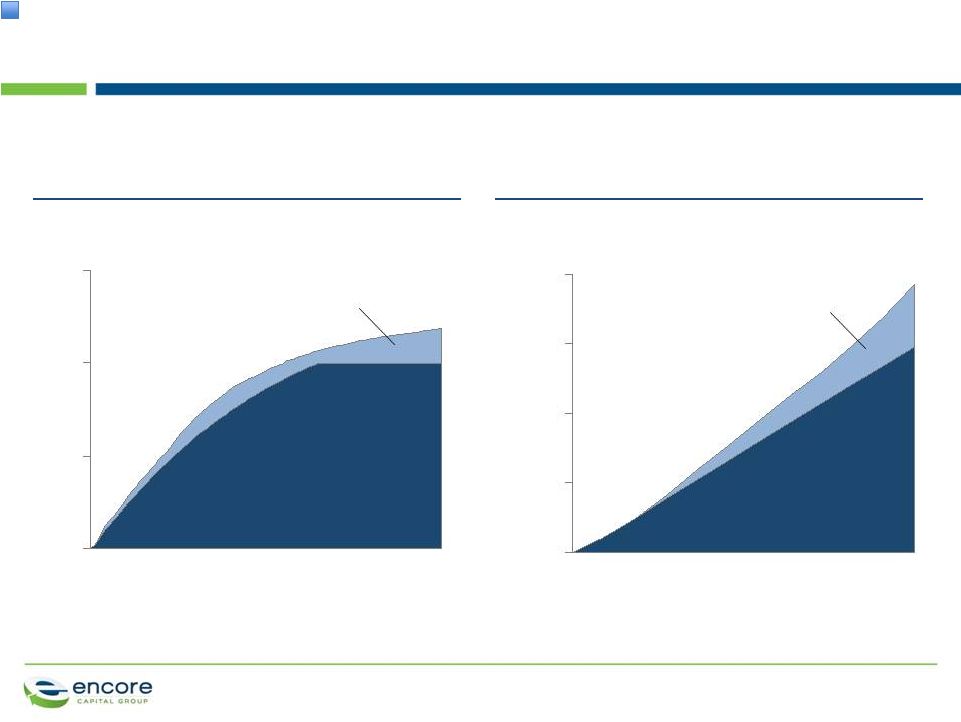
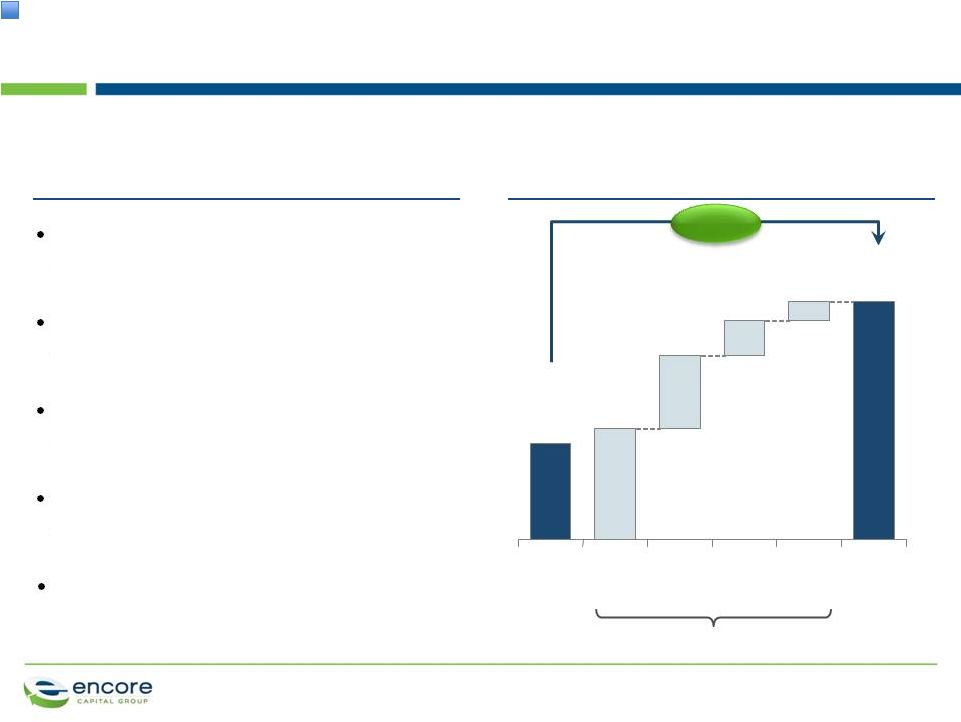 PROPRIETARY ENCORE IS A LEADING PLAYER IN THE CONSUMER DEBT BUYING AND RECOVERY INDUSTRY 4 We deploy capital to acquire delinquent consumer receivables... Purchaser of defaulted consumer credit portfolios & delinquent tax liens Work with consumers to help them repay their obligations over time Employ analytics to segment consumers on an individual basis Have relationships with 1 in 7 American consumers Collected $987M in total cash collections TTM through Q12013 ... and generate predictable cash flows over a multi-year time horizon Total Cash Collections Portfolio Purchase Price Illustrative yearly cash collections Years 1-2 Years 3-4 Years 5-6 Years 7-8 2-3x |
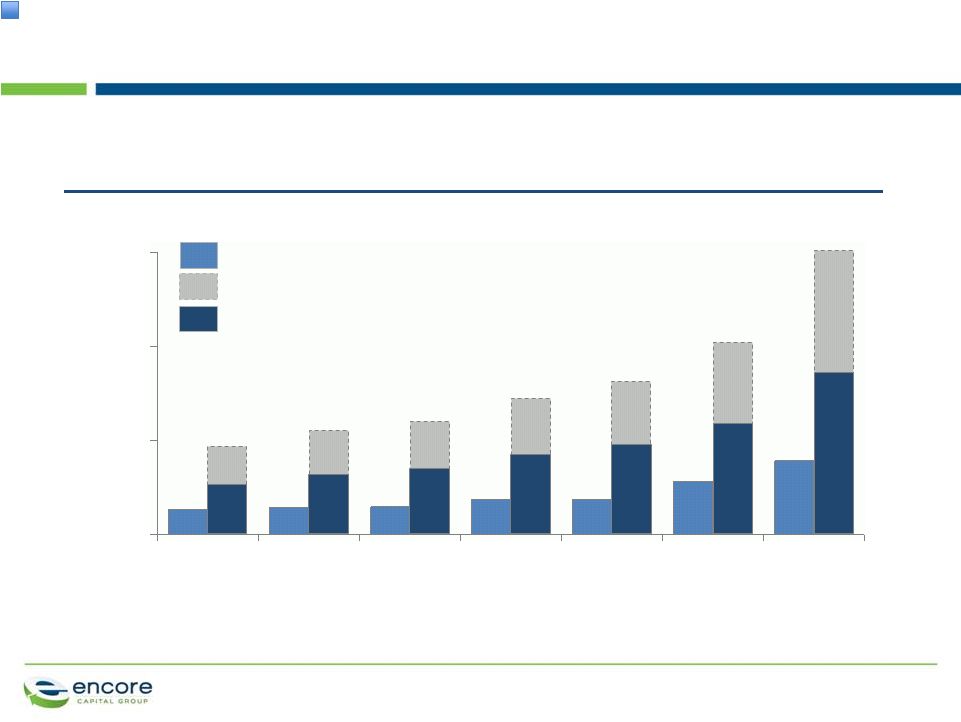
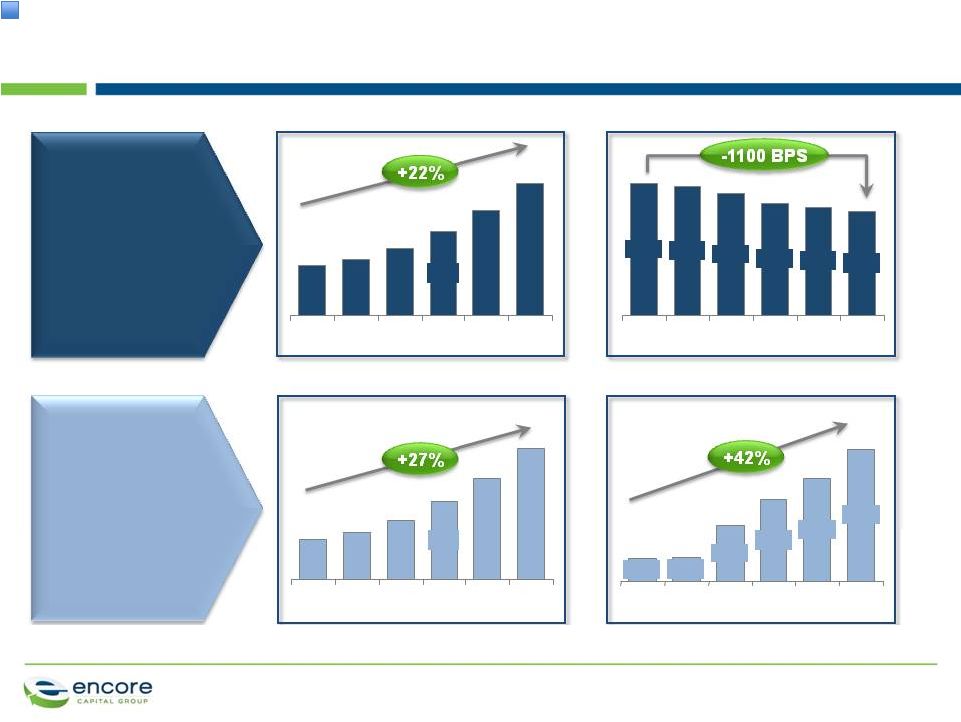 PROPRIETARY ENCORE HAS REALIZED STRONG, SUSTAINABLE FINANCIAL RESULTS 5 Cash Collections ($M) Cost to Collect (%) Adjusted EBITDA ($M) Earnings Per Share ($) 12 948 11 761 10 09 487 08 398 07 355 12 40.4 11 42.2 10 43.7 09 47.6 08 07 51.5 12 577 11 444 10 343 09 260 08 205 07 175 12 3.04 11 2.36 10 1.89 09 1.28 08 0.55 07 0.52 Strong business fundamentals... ...driving profitable growth 1 2 604 50.2 1. Adjusted EBITDA is a non-GAAP number which the Company considers to be and utilizes as a meaningful indicator of operating performance See Reconciliation of Adjusted EBITDA to GAAP Net Income at the end of this presentation. 2. Per Fully Diluted Share from Continuing Operations Note: Growth rate percentages for Cash Collections, Adjusted EBITDA, and EPS signify compounded annual growth rate from 2007 - 2012 |
 ENCORE HAS GROWN TO BE THE INDUSTRY LEADER 6 • Continuously refining analytics • Relentlessly lowering cost to collect • Constantly testing different asset classes Consistent earnings growth with ability to succeed in any market environment Heritage and history Today and our path forward • Gaining scale and critical regulatory expertise Industry consolidator • Underpinning every action with principled intent Continued leadership in improving consumer experience PROPRIETARY |
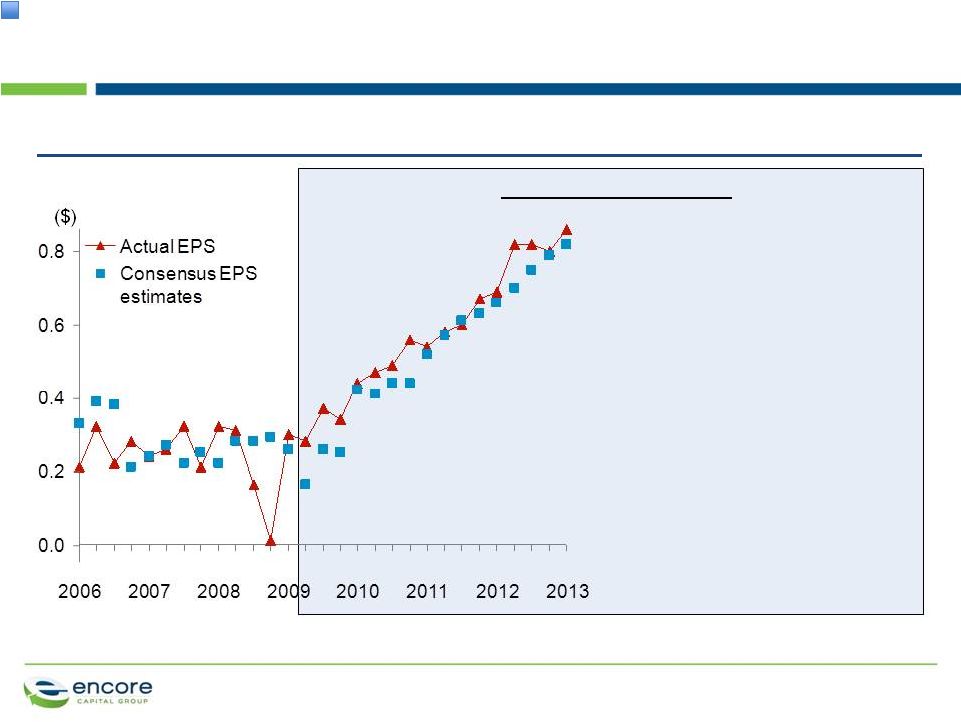 PROPRIETARY WE DRIVE CONSISTENT EARNINGS GROWTH 7 1. Consensus estimates from Zacks and taken from 90 days before earnings announcement Note: Q2 2007 actual EPS includes the add back of a one time after tax payment of $6.9M to eliminate future Contingent Interest payments under its Secured Financing Facility. Charge represented a $.30 reduction in EPS for the quarter Encore EPS vs. Consensus The Encore of today • Disciplined purchases at returns in excess of hurdle rates • Enhanced analytics to drive improving liquidations • Improved cost to collect through efficient operations • Expansion into other asset classes 1 |
 ENCORE PROVIDES A PRINCIPLED AND ESSENTIAL SERVICE Contingency collection agency Collection time frame • 4-6 months Consumer experience Pressure • Artificial deadlines • Multiple exchanges of sensitive data • Counter productive incentives Outcome • Consumer is confused and frustrated 8 • 84 months to recover financially Partnership • Create partnership strategy and set goals • Tailor solutions to individuals • Single point of contact • Maximizes repayment likelihood, and ensures fair treatment vs. Relationship is transactional • Attempt to collect during initial delinquency cycle • Consumer is "charged- off" by issuer on day 181 of cycle • No longer considered a 'customer' by creditor Original creditor PROPRIETARY |
 PROPRIETARY OUR INVESTMENTS REFLECT OUR PRINCIPLES AND DESIRE TO TREAT CONSUMERS FAIRLY AND WITH RESPECT 9 • Acknowledging limitations of our consumers’ household balance sheets to align recovery plans • Deploying specialized surveys to test consumer satisfaction • Built specialized non-collections work groups to serve consumer needs • Established Consumer Credit Research Institute to better understand the financially stressed consumer • Living the Consumer Bill of Rights • Creating resources and directing financially stressed consumers to best external references • Founded Consumer Experience Council Understanding our consumers Making focused investments Improving consumer experience |
 PROPRIETARY WELCOMING KEN VECCHIONE Ken Vecchione Chief Executive Officer 10 |
 PROPRIETARY ENCORE HAS DELIVERED INDUSTRY LEADING TOTAL SHAREHOLDER RETURN OVER THE PAST 5 YEARS 11 Total Shareholder Return (Dec. 2007-Dec. 2012) 0 100 200 300 2010 2009 2008 2013 2012 2011 10% S&P Top Quartile 1 : (2%) Nasdaq Finance: 26% Encore Capital: 2% S&P Index: (%) 1. Top Quartile tracks the dollar weighted average of the companies which fall in the 70th – 80th percentile range of the S&P 500 |
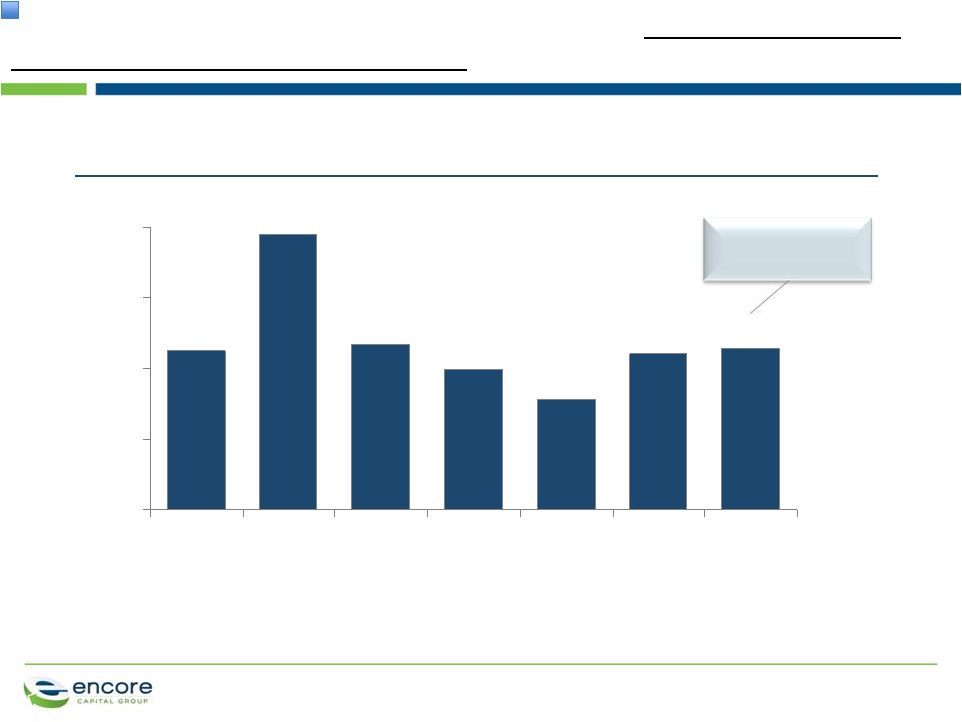
 PROPRIETARY 1,967 1,571 1,389 1,160 1,063 892 0 500 1,000 1,500 2,000 ($M) 2012 2011 2010 2009 2008 2007 ENCORE HAS RAPIDLY GAINED SCALE AND POSITIONED ITSELF FOR SUSTAINED GROWTH 12 Note: Excludes the ~$1B in Estimated Remaining Collections of AACC Estimated Remaining Collections in core receivables +17% |
 200 400 600 0 ($M) 2012 562 2011 387 2010 362 2009 257 2008 230 2007 209 THIS SCALE HAS BEEN CREATED BY MARKET LEADING INVESTMENTS 13 +22% Capital deployed in core receivables PROPRIETARY |
 PROPRIETARY ENCORE HAS CONSISTENTLY IMPROVED OPERATIONS BY MASTERING THE DETAILS 14 Proactive investments in compliance & engagement with regulators has enhanced effectiveness Operating with principled intent Investing to build industry leading compliance functions and practices Proactively engaging with the CFPB on policy matters Persistent focus on operating efficiencies have lowered costs 40.4 42.2 43.7 47.6 50.2 51.5 2012 2011 2010 2009 2008 2007 Total Cost to Collect (%) |
 ENCORE HAS A STRONG MANAGEMENT TEAM WITH A LONG TRACK RECORD OF SUCCESS 15 Amy Anuk SVP, Business Development Jack Nelson CEO, Propel Ken Vecchione Chief Executive Officer Paul Grinberg Chief Financial Officer Ashish Masih SVP, Legal Collections Jim Syran SVP, Operations & Marketing Carl Eberling Chief Information Officer Steve Gonabe SVP, Human Resources Brandon Homuth SVP, Global Operations Sheryl Wright SVP, External Affairs Greg Call SVP, General Counsel Christopher Trepel Chief Scientific Officer Manu Rikhye SVP, Indian Operations GK Sinha SVP, Human Resources PROPRIETARY |
 ENCORE IS WELL POSITIONED TO MAINTAIN ITS MOMENTUM AND CONTINUE DELIVERING TOP QUARTILE TSR 16 Management Team • Learning Organization • Principled Intent Growth, Margin Expansion, Free Cash Flow, PE Multiple Expansion Top Quartile Total Shareholder Return • Specialized call centers • Efficient international operations • Internal legal platform Operational Scale & Cost Leadership 2 Strong Capital Stewardship 3 • Consumer intelligence • Data driven, predictive modeling • Portfolio valuation at consumer level • Consumer Credit Research Institute Superior Analytics 1 • Uniquely scalable platform • Strategic investment opportunities in near- in geographic and paper type adjacencies Extendable Business Model 4 • Sustained success at raising capital - Low cost of debt - Sustainable borrowing capacity and cash flow generation • Prudent capital deployment PROPRIETARY |
 PROPRIETARY WE ARE POISED FOR CONTINUED GROWTH Paul Grinberg Chief Financial Officer 17 |
 PROPRIETARY SUPERIOR ANALYTICS DRIVES PROFITABLE GROWTH 18 Management Team • Learning Organization • Principled Intent Growth, Margin Expansion, Free Cash Flow, PE Multiple Expansion Top Quartile Total Shareholder Return Operational Scale & Cost Leadership 2 Strong Capital Stewardship 3 • Consumer intelligence • Data driven, predictive modeling • Portfolio valuation at consumer level • Consumer Credit Research Institute Superior Analytics 1 Extendable Business Model 4 |
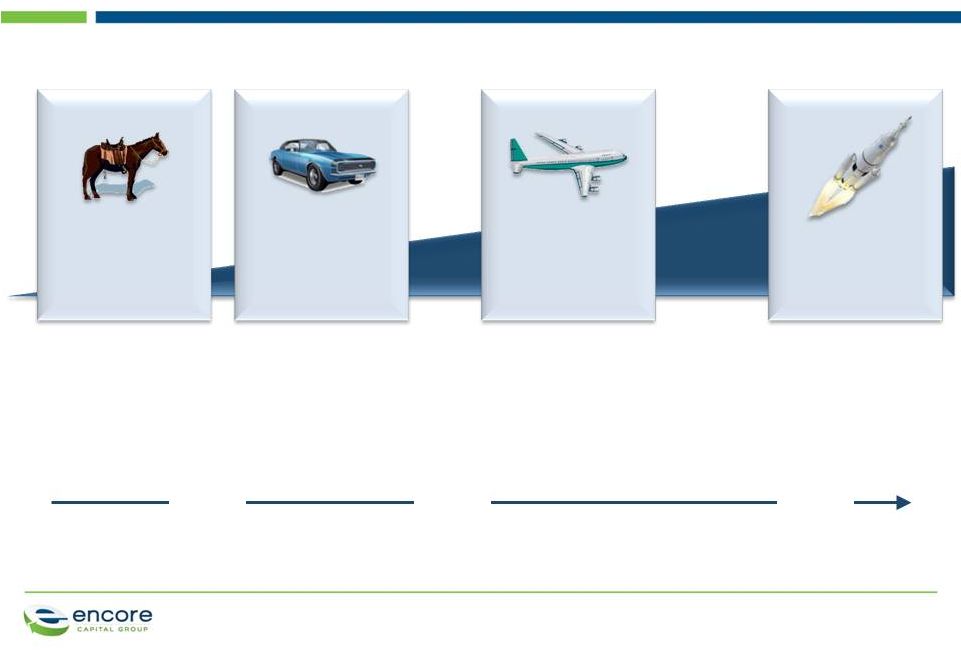 OUR SUPERIOR ANALYTICS STEM FROM OUR INVESTMENTS TO BETTER UNDERSTAND CONSUMERS... 19 Industrialized behavioral science R&D that includes field experiments and new theory development Reporting and alerts Basic consumer segmentation and targeting Statistical analysis and forecasting Simple models to increase collection returns Predictive modeling and optimization Advanced models focused on consumer behavior and financial ability 2001 2005 2012 PROPRIETARY |
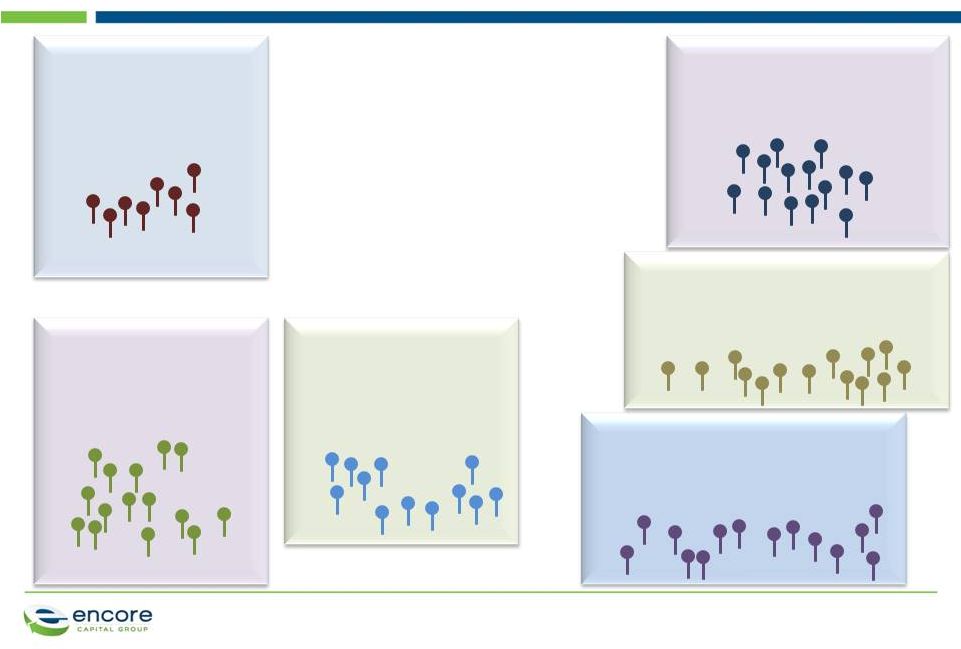 PROPRIETARY Encore’s individual underwriting approach to portfolio valuation accommodates our specialized operational strengths Low willingness Low ability High willingness High capability High willingness Moderate capability High willingness Low capability Low willingness High ability Low willingness Moderate ability ...WHICH IS CLEARLY SEEN IN OUR APPROACH TO CONSUMER LEVEL PORTFOLIO VALUATION 20 • Enforce legal contract through formal channels • Remind consumers through legal messaging • Hardship strategies and removal from the collections process • Significant discounts and many small payments • Payment plans and opportunities to build longer relationships • Strong partnership and recovery opportunities |
 PROPRIETARY 0 500 1,000 1,500 # of transactions Total profitable deals 2 ~1,200 Principal recovered, but not all servicing costs ~80 Principal not fully recoverd ~10 Total purchase transactions ~1,290 OUR SUPERIOR ANALYTICS HAVE LED TO A STRONG PORTFOLIO PURCHASING TRACK RECORD 21 Deal accuracy since 2000 (~1290 total deals ) ~93% of total 1. Actual and forecast 2. Defined as deals where principal and servicing cost were recovered. 1 |
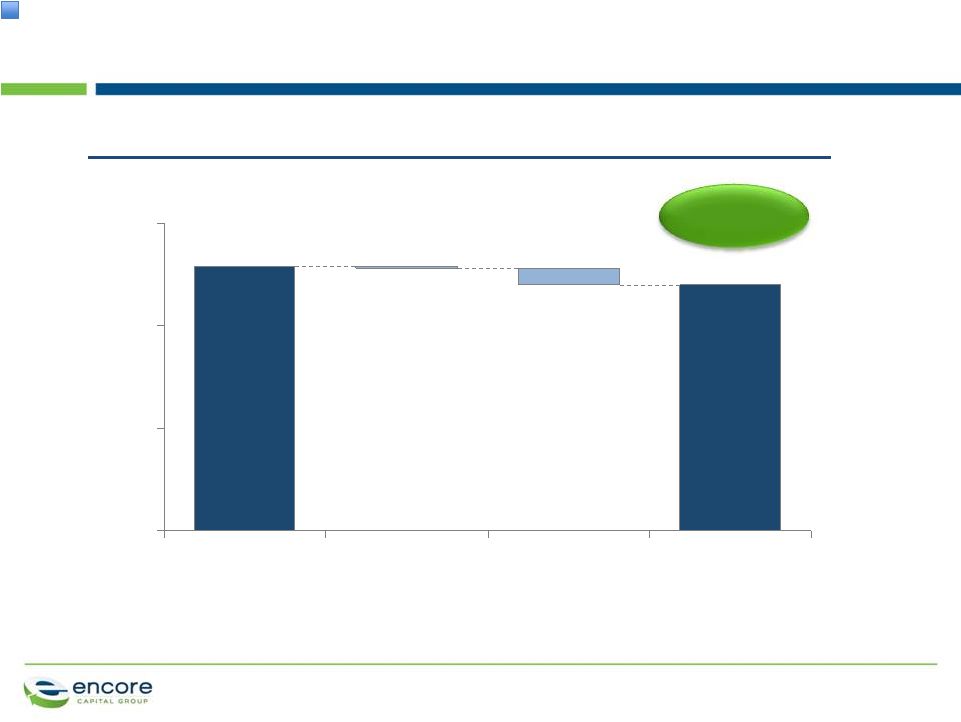
 PROPRIETARY THROUGH OUR INVESTMENTS IN ANALYTICS OUR EFFECTIVENESS HAS INCREASED BY 11% 22 Improved liquidation in our call center channel 1. Of like portfolios through call center channel 2. 2008 = 100 Note: Assumes 8% marginal cost to collect through call center channel, 40% tax rate, 2.3x CCM, 25M diluted shares outstanding Indexed liquidation rate 2 +11% 111 100 80 90 100 110 120 2012 Vintage 2008 Vintage Impact of 11% improvement in liquidation (2008-2012) • In 2012, we collected $442M through our call center channel • In 2008, we would have only collected $398M • ~$44M in incremental cash collections • ~$0.50 in incremental EPS 1 |
 PROPRIETARY OPERATIONAL SCALE & COST LEADERSHIP EXPAND MARGINS 23 Management Team • Learning Organization • Principled Intent Growth, Margin Expansion, Free Cash Flow, PE Multiple Expansion Top Quartile Total Shareholder Return • Specialized call centers • Efficient international operations • Internal legal platform Operational Scale & Cost Leadership 2 Strong Capital Stewardship 3 Superior Analytics 1 Extendable Business Model 4 |
 PROPRIETARY 36.5 40.4 42.2 43.7 47.6 50.2 51.5 2007 Q1 2013 2012 2011 2010 2009 2008 Internal Legal investments WE HAVE THE INDUSTRY LEADING COST PLATFORM, DRIVEN BY CONTINUING OPERATIONAL IMPROVEMENTS 24 Increased specialization in call centers Scaling Indian call center Improving analytics Overall Cost to Collect (%) |
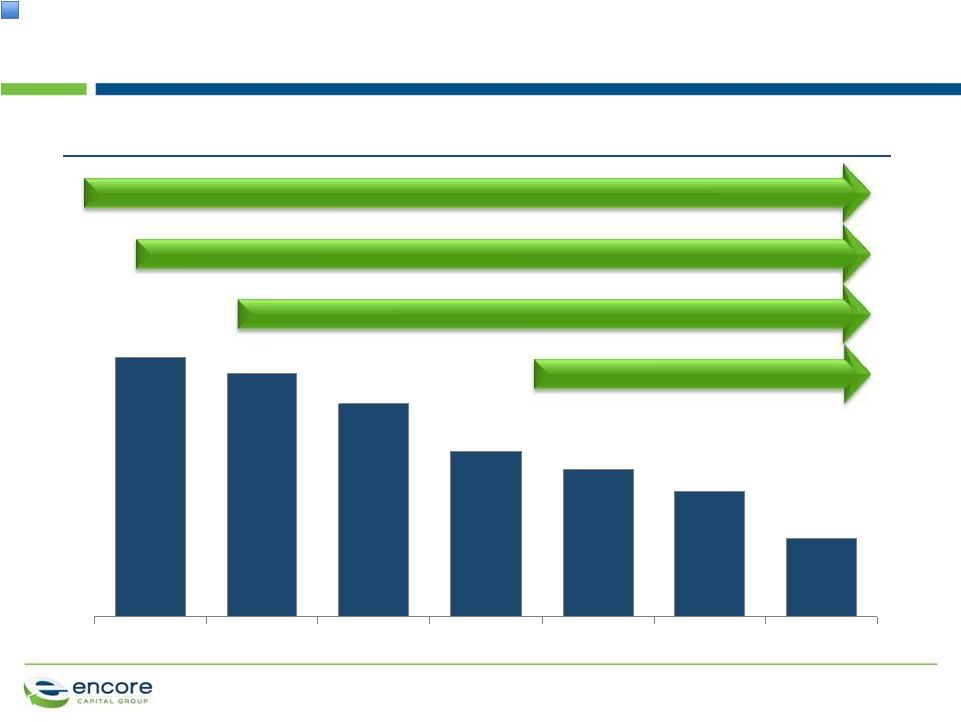
 PROPRIETARY CONTINUING INVESTMENTS IN LOWER-COST INTERNAL LEGAL COLLECTIONS EXPECTED TO FURTHER DRIVE DOWN COSTS 25 Quicker ability to respond to new regulation Increased control over consumer experience Enhanced liquidation Additional benefits from Internal Legal investments Internal Legal channel expected to lower costs once scale achieved ’17E ’16E ’15E ’14E ’13E ’12 ’11 Internal Legal Collections ($M) Internal Legal Cost to Collect (%) $2 $19 $50 $90 $140 $175 $200 164% 53% 37% 29% 24% 19% 18% |
 PROPRIETARY STRONG CAPITAL STEWARDSHIP ENHANCES RETURNS 26 Management Team • Learning Organization • Principled Intent Growth, Margin Expansion, Free Cash Flow, PE Multiple Expansion Top Quartile Total Shareholder Return Operational Scale & Cost Leadership 2 Strong Capital Stewardship 3 Superior Analytics 1 Extendable Business Model 4 • Sustained success at raising capital - Low cost of debt - Sustainable borrowing capacity and cash flow generation • Prudent capital deployment |
 PROPRIETARY • Debt is our working capital – Capital deployment business which generates strong cash flows EFFICIENT CAPITAL STEWARDSHIP IS CRITICAL TO ENCORE'S SUCCESS 27 • Strong cash flow allows for TSR driving investments – Reinvest in wide range of receivables – Return capital to shareholders when it is highest return option Prudent investment in adjacencies to supplement core growth • Reinvest in core • Adjacent Spaces External capital Portfolio purchases Collections process Cash flow • Return to shareholders |
 PROPRIETARY Estimated Remaining Collections (ERC) vs. Net Debt WE HAVE A STRONG ABILITY TO QUICKLY RAISE CAPITAL WHICH IS SUPPORTED BY OUR ESTIMATED REMAINING COLLECTIONS 28 1. Assumes liquidation cost to collect of 30% and a tax rate of 39.2%; Q1 2013 values as of 10-q filings; Assumes pro forma $1B of ERC from AACC 2. Includes revolver, senior, and net convertible debt less cash Net Debt 3,000 2,000 1,000 0 ($M) 2007 2008 2009 2010 2011 2012 Q1 2013 w/AACC Gross ERC less Cost to Collect and Taxes 1 Gross ERC |
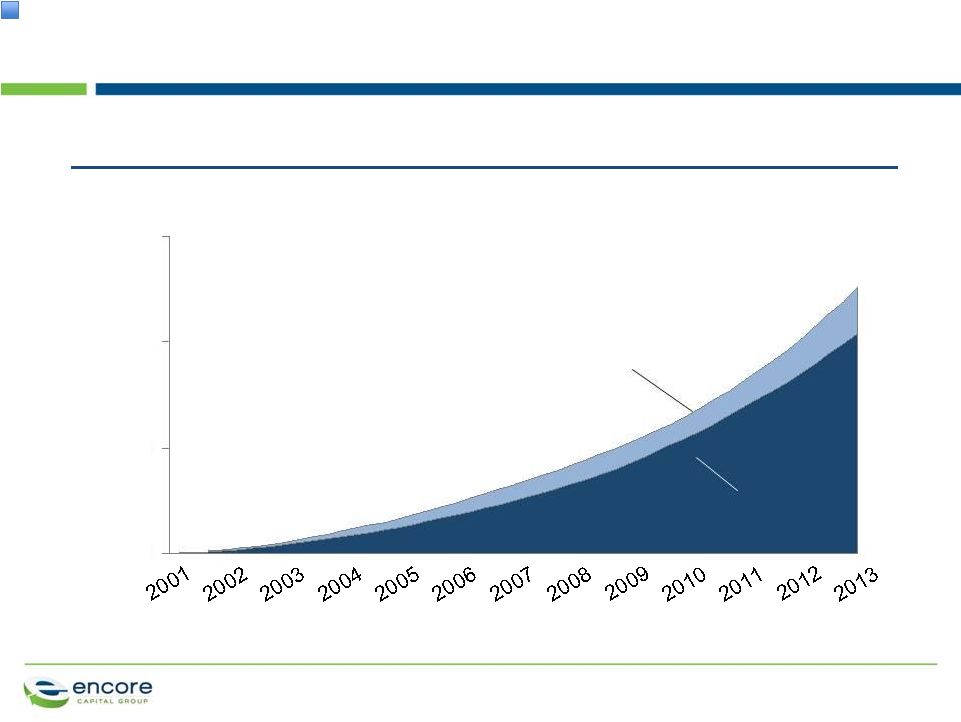 PROPRIETARY Initial projections WE BELIEVE THAT OUR CURRENT ESTIMATE OF REMAINING COLLECTIONS IS CONSERVATIVE 29 Cumulative Collections - initial expectation vs. actual ($M) 0 2,000 4,000 6,000 Actual cash collections |
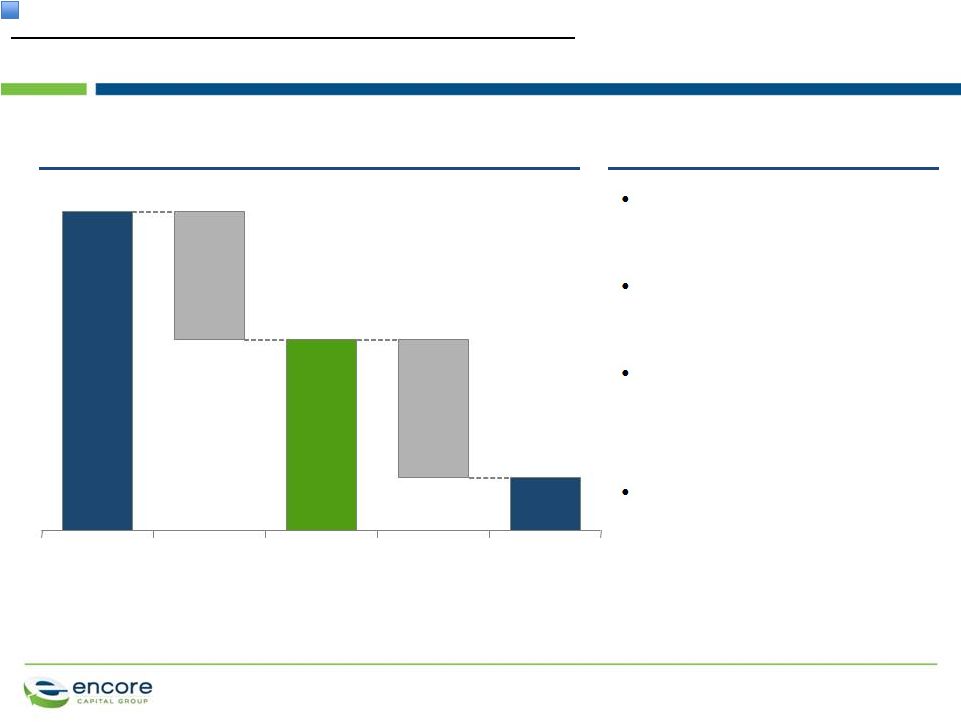
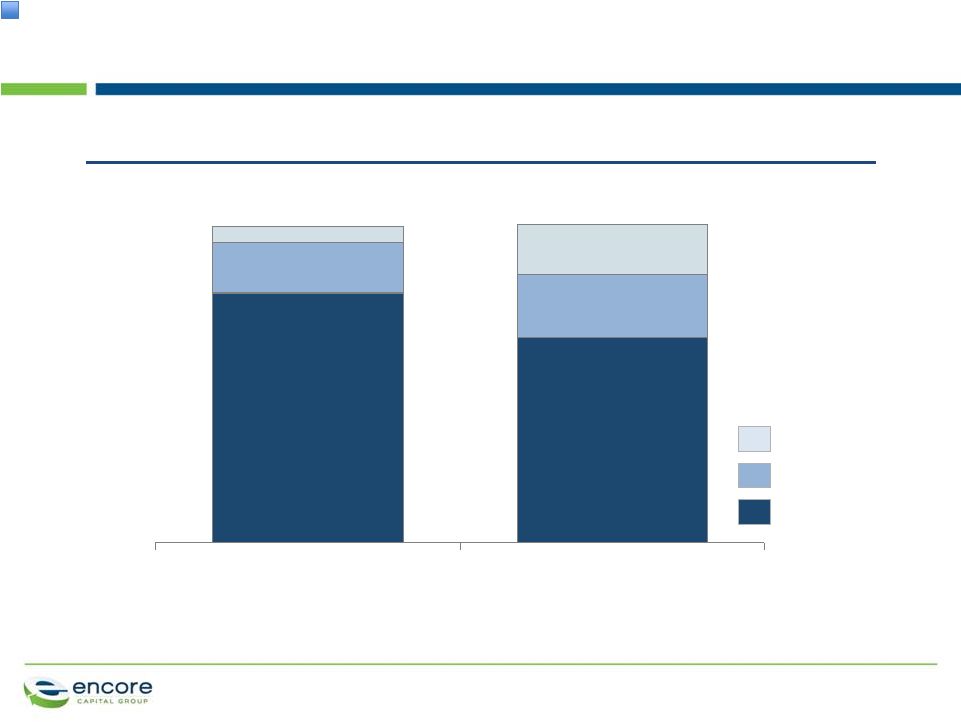
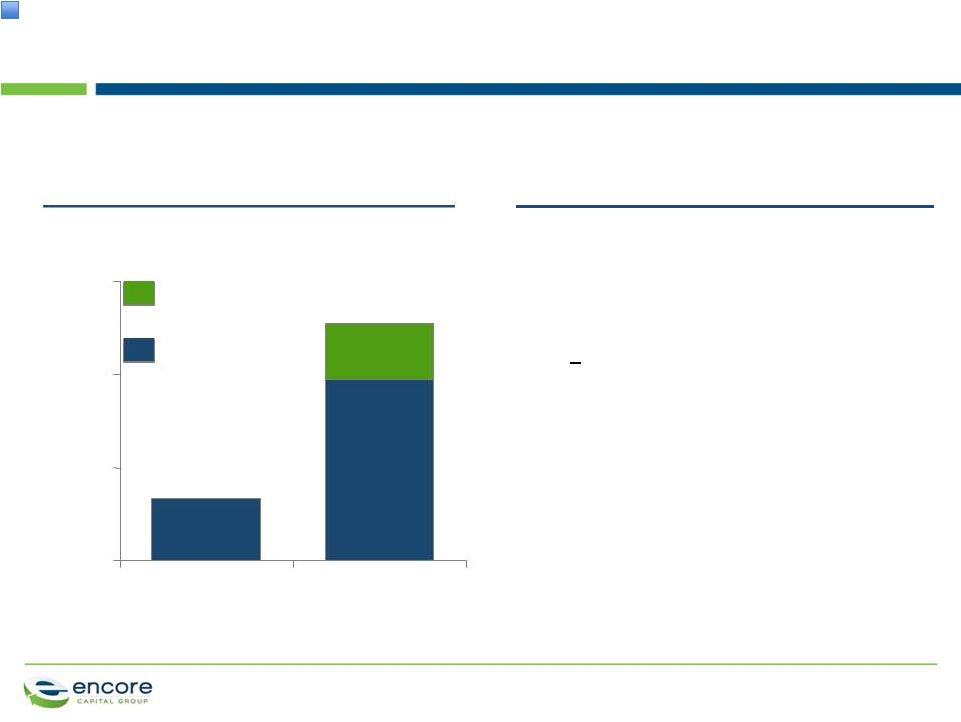 PROPRIETARY OUR ABILITY TO RAISE ADDITIONAL CAPITAL ALLOWS US TO PURSUE SUPPLEMENTAL GROWTH IN ADJACENT SPACES 30 ...and structure our debt to maximize flexibility for future growth No impact on ability to purchase core US receivables • Propel facilities are incremental to, and separate from, our core debt facilities • We will continue to pursue and deploy separate pools of capital Note: Core debt includes revolver, term loan, Prudential notes, and convertible notes plus accordion We have the debt markets expertise to fund new opportunities... 1,500 1,000 500 0 Total debt availability ($M) Current 975 2007 330 Core debt 1,275 300 Separate Propel facilities |
 PROPRIETARY THE TRADITIONAL DEBT TO EBITDA METRIC IS NOT THE CORRECT WAY TO LOOK AT OUR LEVERAGE 31 Debt / EBITDA multiple Note: Does not include Debt / EBITDA resulting from Cabot 4.6x 4.4x 3.1x 4.0x 4.7x 7.8x 4.5x 0.0x 2.0x 4.0x 6.0x 8.0x 2010 Q12013 TTM 2012 2011 2009 2008 2007 Pro forma with AACC |
 PROPRIETARY Getting to Adjusted EBITDA ($M) ADJUSTED EBITDA IS THE BEST MEASURE OF THE FUNDAMENTAL ECONOMICS OF OUR BUSINESS 32 Adjusted EBITDA explained Cash Collections less adj. operating cost True measure of cash generation Metric our lenders use to evaluate our business and write our covenants Recovery of the portfolio purchase price taken out to get to EBITDA ³ 1. Includes ~$12M of tax liens income. 2. Includes ~$15M of one time charges such as stock based compensation expense, acquisition related expenses, and cash inflow of other services income from tax lien transfer operation segment. 3. See end of presentation for reconciliation of Adjusted EBITDA to GAAP Net Income Note: Represents 2012 performance; Tax Liens Cash includes $1.7 M of cash inflow of other service income from tax lien transfer operation segment. Recovery of principal & other ² Operating costs 383 Cash Collections ¹ 960 160 EBITDA 417 Adjusted EBITDA 577 |
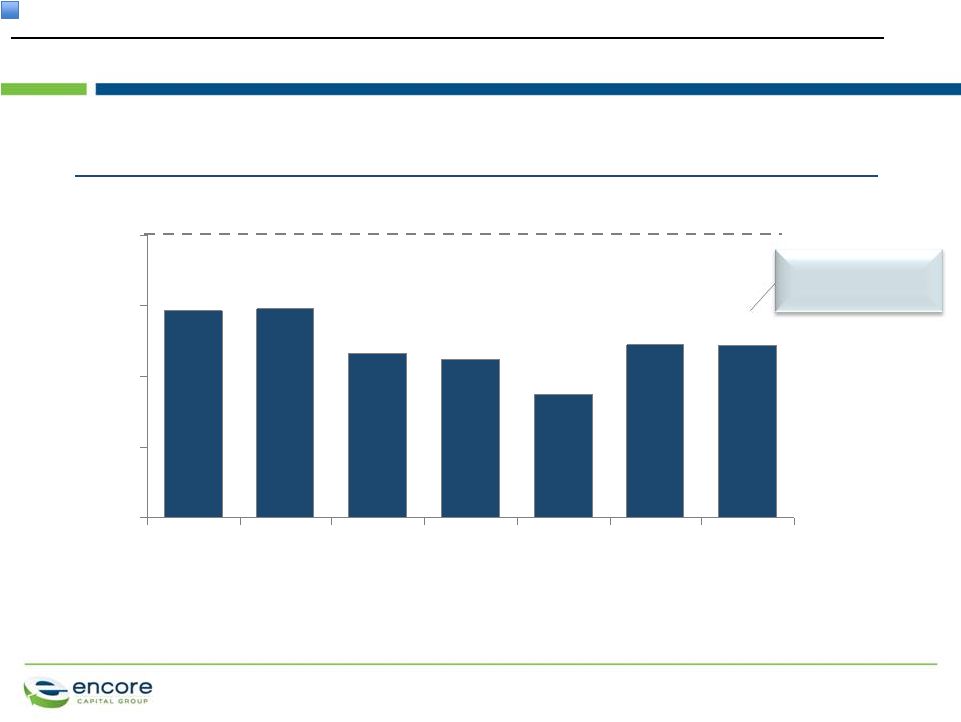 PROPRIETARY 1.2x 1.2x 0.9x 1.1x 1.2x 1.5x 1.5x 0.0x 0.5x 1.0x 1.5x 2.0x Q12013 TTM 2012 2011 2010 2009 2008 2007 DEBT TO ADJUSTED EBITDA IS THE CORRECT LEVERAGE METRIC AND IS THE BASIS FOR HOW LENDERS UNDERWRITE OUR DEBT 33 Note: Does not include Debt / Adjusted EBITDA resulting from Cabot; See end of presentation for reconciliation of Adjusted EBITDA to GAAP Net Income Debt / Adjusted EBITDA multiple 2.0x leverage capacity Pro forma with AACC |
 PROPRIETARY ENCORE'S CAPITAL DEPLOYMENT IS FOCUSED ON DELIVERING ATTRACTIVE AND SUSTAINABLE TOTAL SHAREHOLDER RETURN 34 All investments viewed through lens of Total Shareholder Return Deployment priorities Reinvestments in core receivables business • All investments bound by IRR guidelines • Maintain operational flexibility with a range of core asset classes Principles for capital deployment Investments in near-in adjacent spaces • Prudent investment in adjacent spaces which leverage our core competencies Return of capital to shareholders • Recognize there are times when best investment is to return cash |
 PROPRIETARY OUR CORE MARKET REMAINS ATTRACTIVE 35 • Competitors driven from marketplace by increasing operating costs, high costs of capital, and lower liquidation levels • Issuers selling to a smaller, more select group of buyers Market demand Continued consolidation • Issuers expected to resume normal selling patterns once audits are complete • Resale market is robust as competitors leave the industry Market supply Favorable dynamics |
 PROPRIETARY 2014 Expected $620 – $700M $400 – $450M $120 – $140M $100 – $110M 2013 Expected $550M $110M $695M GOING FORWARD, WE EXPECT TO DEPLOY $620 – $700 MILLION PER YEAR 36 Encore capital deployment (2013-2014) Cabot ¹ Propel Core US $35M 1. Represents only Encore's economic interest in Cabot, which is 42.8% of total. 2013 figure represents only last 5 months of Cabot capital deployment in 2013. Total amount of expected capital deployment for Cabot is $200M and $230 - $250M for 2013 and 2014 respectively. |
 EXTENDABLE BUSINESS MODEL EXPANDS REVENUE OPPORTUNITIES 37 Management Team • Learning Organization • Principled Intent Growth, Margin Expansion, Free Cash Flow, PE Multiple Expansion Top Quartile Total Shareholder Return Operational Scale & Cost Leadership 2 Strong Capital Stewardship 3 Superior Analytics 1 • Uniquely scalable platform • Strategic investment opportunities in near- in geographic and paper type adjacencies Extendable Business Model 4 PROPRIETARY |
 PROPRIETARY International New asset classes Expand core footprint Bankrupt accounts Focus on bankruptcy Outsourcing services Expand along value system Secured loans Cover different type of debt Performing loans Expand along the debt life cycle Chapter 13 Chapter 7 Pre-charge off delinquencies Early delinquencies Auto debt Tax liens Mortgage debt Countries with mature credit systems Emerging markets Contingency collections First party collection services Municipal obligations Student loans Utilities Expand geographically WE CONTINUE TO EXPLORE ADJACENCIES TO SUPPLEMENT OUR GROWTH 38 Defaulted National Existing asset classes Purchase Unsecured Defaulted Credit cards Telecom and other utilities Penetrate existing market Consumer loans |
 PROPRIETARY New asset classes Bankrupt accounts Outsourcing services International Secured loans Performing loans AND HAVE FOCUSED ON DEALS AND INITIATIVES THAT ALIGN WITH OUR CORE BUSINESS 39 $83.6M investment in BK paper in 2012 Expand geographically Focus on bankruptcy Cover different type of debt |
 WE HAVE MADE SIGNIFICANT PROGRESS EXECUTING OUR PLANS FOR PROPEL 40 Our plan Existing market • Working to penetrate the 80% of the Texas market that doesn't use tax lien transfers 1 What we've delivered • Developed & implemented model for direct mailing • Started outbound calling w/existing Encore facilities • Lobbying to introduce legislation in other states that will create new markets 2 • Successfully worked with Nevada to pass legislation • Advancing legislative push to other states • Purchased tax lien certificates in three states New opportunities • Exploring alternative tax lien models that will allow us to expand into new markets 3 New markets PROPRIETARY |
 PROPRIETARY RESULTING IN GROWTH IN THE SIZE OF OUR PORTFOLIO WHILE MAINTAINING AN EXCEPTIONALLY LOW RISK PROFILE 41 $8,750 average balance 8-year term 6-year weighted average life 13-15% typical interest rate Texas portfolio characteristics $230,000 average property value 4.6% average LTV at origination 1.0% foreclosure rate Zero losses Propel portfolio size 154 137 121 99 0 100 200 Q1 2013 2012 2011 2010 ($M) |
 PROPRIETARY AACC INTEGRATION Ashish Masih SVP, Legal Collections / AACC Integration Lead 42 |
 PROPRIETARY Acquisition of competitors’ assets Practice makes perfect Operational advantages WE ARE POISED TO BE INDUSTRY LEADERS AS CONSOLIDATION OCCURS 43 Accurate valuations |
 PROPRIETARY WE HAVE A STRONG TRACK RECORD ACQUIRING PORTFOLIOS FROM OTHER DEBT PURCHASERS SIMILAR TO AACC 44 $90M portfolio purchased in 2005 $100+M portfolio purchased in 2012 Initial expectations: $59M Results to date: $77M Initial expectations: $199M Results to date: $237M 2005 2007 2009 2011 Jun-12 Sep-12 Dec-12 Mar-13 2013 100 0 300 200 Cash Collections ($M) 80 60 40 20 0 Cash Collections ($M) |
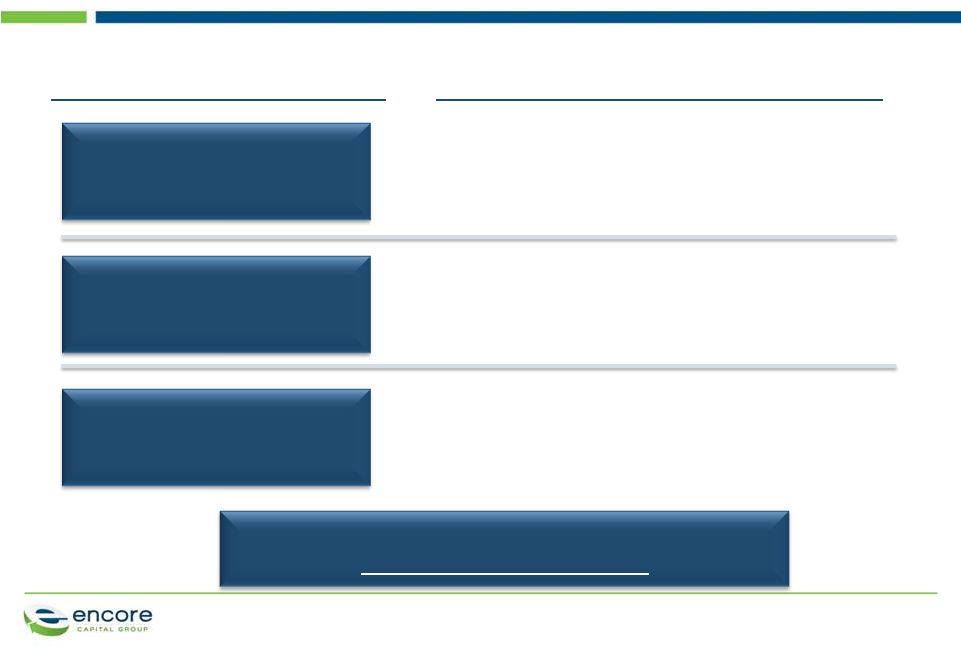
 Largely satisfies our 2013 purchasing goals with attractive vintages 45 THE ASSET ACCEPTANCE DEAL IS WELL ALIGNED WITH OUR STRATEGY AND ADDS $1 BILLION TO ERC Allows us to be selective in purchases for the remainder of the year Able to leverage best practices across the two platforms to drive synergies PROPRIETARY |
 WE CAN LEVERAGE OUR PLATFORM AND CAPABILITIES TO REALIZE SUBSTANTIAL SYNERGY VALUE AT AACC : Leverage Encore's lower cost platform to expand margins on cash collections 2 Match Encore's lower collection cost in 9 months : Integrate AACC's strong internal legal platform to drive additional overall operating efficiencies 3 Accelerate migration to internal legal platform by ~2 years Source of value Impact Deeper consumer insight and analytics: More focused segmentation and targeting, resulting in better collections CCM target of ~2.0 – 2.5x 1 46 PROPRIETARY Lower cost structure Internal legal collections |
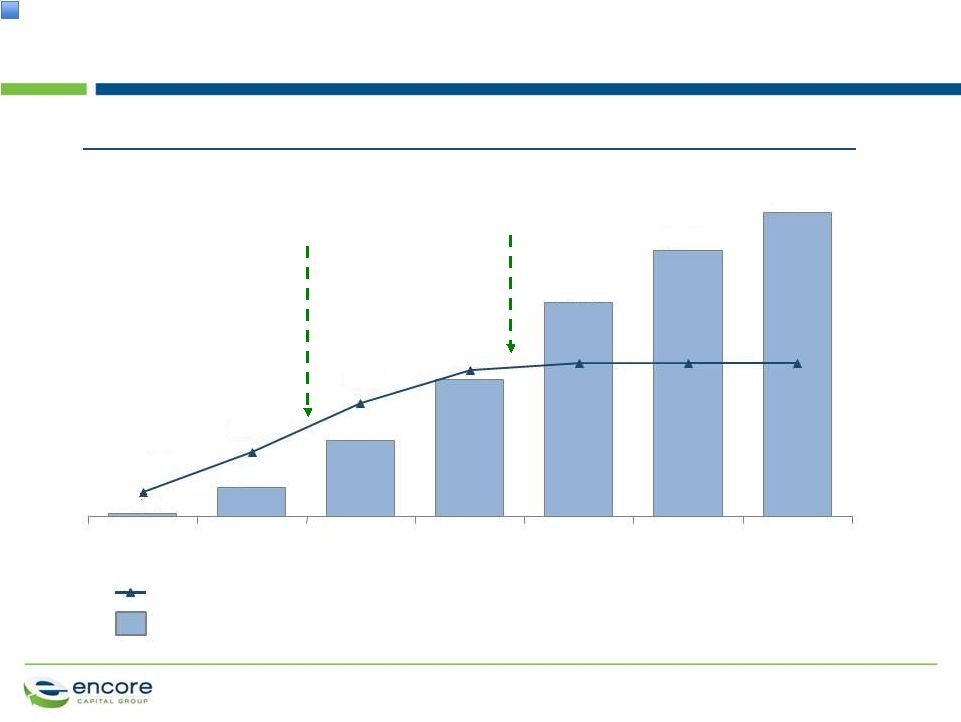 PROPRIETARY AACC'S INTERNAL LEGAL PLATFORM ACCELERATES ROLLOUT OF OUR PLATFORM AND HELPS US ACHIEVE END-STATE FASTER 47 Encore today Combined company today Encore internal legal placement forecast Internal legal collections during year ($M) % of total legal placements at end of year $2 $90 $19 $50 $140 $175 $200 8% 21% 37% 48% 50% 50% 50% 2011 2017 2016 2015 2014 2013 2012 |
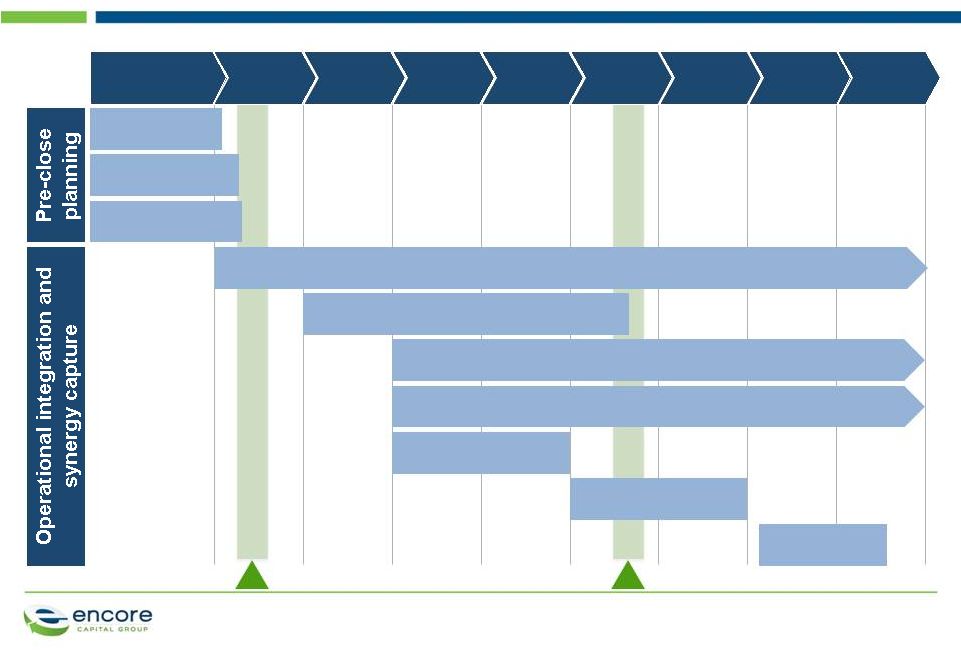 WE HAVE A PLAN FOR A SEAMLESS INTEGRATION WITH AACC 48 Jul Aug Sep Oct Retention agreements Synergy identification Integration planning Nov Dec Jan Pre-close Jun Call center rationalization Support function rationalization Law firm management Internal Legal platform integration Finance integration HR integration Consolidated Internal Legal platform Close of AACC transaction Collections agency rationalization PROPRIETARY |
 PROPRIETARY CABOT ACQUISITION Ken Vecchione Chief Executive Officer 49 |
 WE WAITED UNTIL WE FOUND AN OPPORTUNITY THAT FIT OUR CRITERIA 50 Growth potential • Cabot specializes in the growing semi-performing debt segment, which has very favorable repayment characteristics Market leader • Cabot is the leading player in the U.K. debt purchase market • Cabot purchased ~£130M of charged off debt in 2012 Leverages Encore's capabilities • Cabot can further benefit from Encore's strength in analytics • Opportunity to leverage our Indian operations for U.K collections Strong management team • Cabot has an experienced and skilled management team that can continue to grow its U.K. operations Available for the right price • Partnership with J.C. Flowers enables Encore to purchase a controlling interest in Cabot at a reasonable price PROPRIETARY |
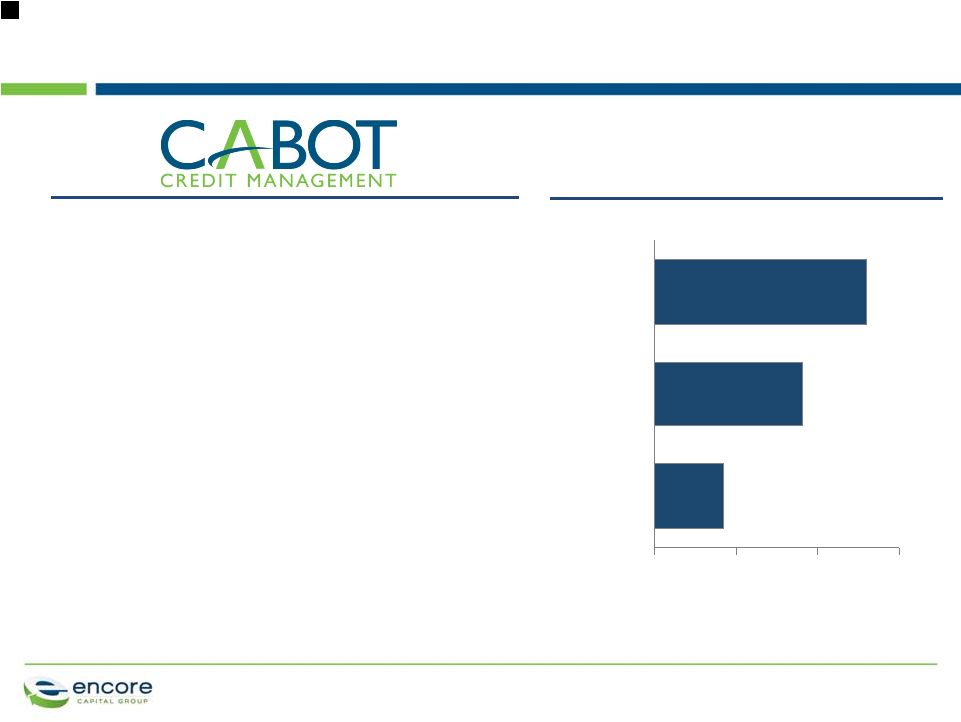 PROPRIETARY Market leader in U.K. debt management • Over 14 years of collections growth • Operations in Great Britain and Ireland Specializes in higher balance, “semi- performing” (i.e., paying) accounts • Favorable repayment characteristics Key statistics as of March 31, 2013: • £7.7B face-value of debt acquired for £706M • ERC = £934M • 3.6M customer accounts • 2012 collections = £161M • 2012 capital deployment = £130M 1 Cabot was the leading purchaser of debt in the U.K. in 2012 CABOT IS THE LEADING PURCHASER OF DEBT IN THE U.K. 1. £31M funded by Anacap For FY 2012 51 91 42 0 50 100 150 (£M) Arrow Lowell Cabot 130 1 |
 PROPRIETARY ENCORE PROVIDES CABOT WITH SEVERAL SYNERGY OPPORTUNITIES Leverage Encore's operations and know- how • Enhance collections by leveraging Encore's efficient operations, including our operations in India • Leverage Encore's experience in secondary and tertiary debt to pursue new investments in the U.K. • Leverage Encore’s favorable financing to fund growth Leverage Encore's analytics • Deploy Encore's superior analytical capabilities to the Cabot platform • Focus on improving account segmentation and specialized collection strategies 52 Invest in different segments |
 PROPRIETARY ENCORE'S ACQUISITION OF CABOT WILL PROVIDE A VEHICLE TO CONTINUE ITS STRONG EARNINGS GROWTH Growing market • Encore can deploy capital in a growing market Profitable market • Portfolio IRRs are strong and favorable Timeline • Deal expected to close in Q3 of 2013 Encore EPS • Supports Encore's 15% long-term EPS growth ¹ 53 1. Calculation of EPS excludes one-time transaction and integration costs and non-cash interest associated with the Company’s 2012 convertible debt offering. For forward-looking EPS projections, such one-time costs or charges are not presently quantified |
 PROPRIETARY ENCORE IS WELL POSITIONED TO MAINTAIN MOMENTUM AND CONTINUE DELIVERING TOP QUARTILE TSR 54 Management Team • Learning Organization • Principled Intent Growth, Margin Expansion, Free Cash Flow, PE Multiple Expansion Top Quartile Total Shareholder Return Specialized call centers Efficient international operations Internal legal platform Operational Scale & Cost Leadership 2 Sustained success at raising capital Strong Capital Stewardship 3 Consumer intelligence Data driven, predictive modeling Portfolio valuation at consumer level Consumer Credit Research Institute Superior Analytics 1 Uniquely scalable platform Strategic investment opportunities in near- in geographic and paper type adjacencies Extendable Business Model 4 - Low cost of debt - Sustainable borrowing capacity and cash flow generation Prudent capital deployment |
 PROPRIETARY 55 APPENDIX |
 PROPRIETARY RECONCILIATION OF ADJUSTED EBITDA Reconciliation of Adjusted EBITDA to GAAP Net Income (Unaudited, In Thousands) Three Months Ended PROPRIETARY 56 3/31/08 6/30/08 9/30/08 12/31/08 3/31/09 6/30/09 9/30/09 12/31/09 3/31/10 6/30/10 9/30/10 12/31/10 GAAP net income, as reported 6,751 6,162 3,028 (2,095) 8,997 6,641 9,004 8,405 10,861 11,730 12,290 14,171 (Gain) loss from discontinued operations, net of tax (422) (89) 46 (483) (457) (365) (410) (901) (687) (684) (315) 28 Interest expense 5,200 4,831 5,140 5,401 4,273 3,958 3,970 3,959 4,538 4,880 4,928 5,003 Contingent interest expense - - - - - - - - - - - - Pay-off of future contingent interest - - - - - - - - - - - - Provision for income taxes 4,227 4,161 2,429 (1,781) 5,670 3,936 5,676 4,078 6,080 6,356 6,474 9,057 Depreciation and amortization 438 482 396 391 410 402 443 516 522 591 650 789 Amount applied to principal on receivable portfolios 40,212 35,785 35,140 46,364 42,851 48,303 49,188 47,384 58,265 64,901 63,507 53,427 Stock-based compensation expense 1,094 1,228 860 382 1,080 994 1,261 1,049 1,761 1,446 1,549 1,254 Adjusted EBITDA 57,500 52,560 47,039 48,179 62,824 63,869 69,132 64,490 81,340 89,220 89,083 83,729 3/31/11 6/30/11 9/30/11 12/31/11 3/31/12 6/30/12 9/30/12 12/31/12 3/31/13 GAAP net income, as reported 13,679 14,775 15,310 17,134 11,406 16,596 21,308 20,167 19,448 (Gain) loss from discontinued operations, net of tax (397) (9) (60) 101 6,702 2,392 - - - Interest expense 5,593 5,369 5,175 4,979 5,515 6,497 7,012 6,540 6,854 Provision for income taxes 8,349 9,475 9,834 10,418 11,660 12,846 13,887 13,361 12,571 Depreciation and amortization 904 958 1,054 1,165 1,240 1,420 1,533 1,647 1,846 Amount applied to principal on receivable portfolios 85,709 83,939 73,187 69,462 104,603 101,813 105,283 90,895 129,487 Stock-based compensation expense 1,765 1,810 2,405 1,729 2,266 2,539 1,905 2,084 3,001 Acquisition related expense - - - - 489 3,774 - - 1,276 Adjusted EBITDA 115,602 116,317 106,905 104,988 143,881 147,877 150,928 134,694 174,483 Note: The periods 3/31/08 through 12/31/08 have been adjusted to reflect the retrospective application of ASC 470-20. All periods have been adjusted to show discontinued ACG operations. |