 ENCORE CAPITAL GROUP, INC. JMP SECURITIES FINANCIAL SERVICES & REAL ESTATE CONFERENCE October 1, 2013 Exhibit 99.1 |
 PROPRIETARY CAUTIONARY NOTE ABOUT FORWARD-LOOKING STATEMENTS 2 The statements in this presentation that are not historical facts, including, most importantly, those statements preceded by, or that include, the words “will,” “may,” “believe,” “projects,” “expects,” “anticipates” or the negation thereof, or similar expressions, constitute “forward-looking statements” within the meaning of the Private Securities Litigation Reform Act of 1995 (the “Reform Act”). These statements may include, but are not limited to, statements regarding our future operating results, earnings per share, and growth. For all “forward-looking statements,” the Company claims the protection of the safe harbor for forward-looking statements contained in the Reform Act. Such forward-looking statements involve risks, uncertainties and other factors which may cause actual results, performance or achievements of the Company and its subsidiaries to be materially different from any future results, performance or achievements expressed or implied by such forward-looking statements. These risks, uncertainties and other factors are discussed in the reports filed by the Company with the Securities and Exchange Commission, including the most recent reports on Forms 10-K and 10-Q, as they may be amended from time to time. The Company disclaims any intent or obligation to update these forward-looking statements. |
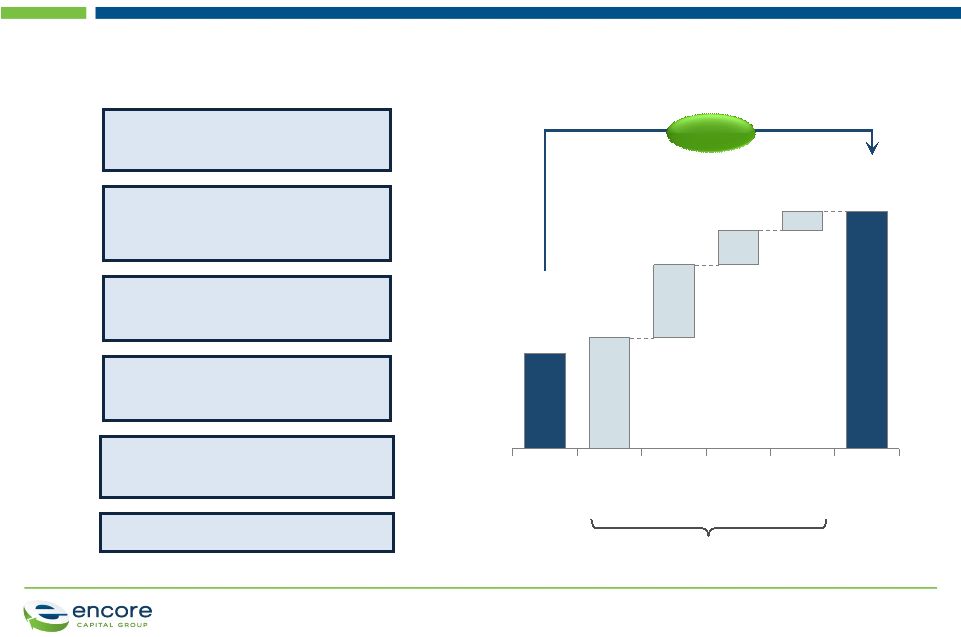 PROPRIETARY ENCORE IS A LEADING PLAYER IN THE CONSUMER DEBT BUYING AND RECOVERY INDUSTRY 3 We deploy capital to acquire delinquent consumer receivables... ... and generate predictable cash flows over a multi-year time horizon Total Cash Collections Portfolio Purchase Price Illustrative cash collections 2-3x Years 1-2 Years 3-4 Years 5-6 Years 7-8 1 in 7 American consumers have accounts with us 3.1 million consumers have satisfied their obligations $2.7 billion in estimated remaining collections 27% Adjusted EBITDA † 5-year compound annual growth rate 3,530 employees worldwide $1 billion collected in the last twelve months † Adjusted EBITDA is a non-GAAP number which the Company considers to be and utilizes as a meaningful indicator of operating performance. See Reconciliation of Adjusted EBITDA to GAAP Net Income at the end of this presentation. |
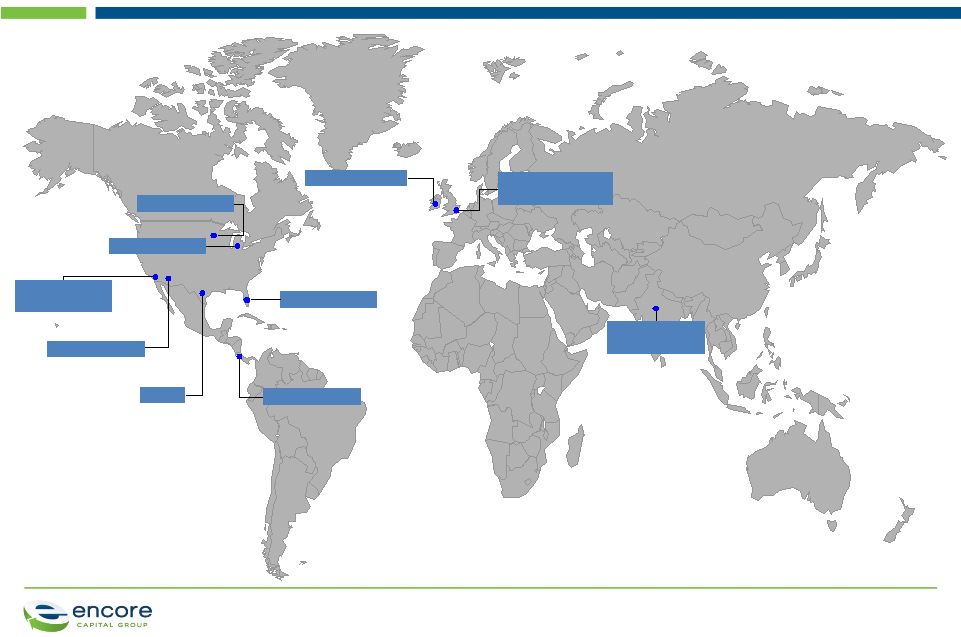 PROPRIETARY WITH A STRONG DOMESTIC AND INTERNATIONAL PRESENCE 4 St Cloud, MN Phoenix, AZ New Delhi, India Call Center / Technology Site Call Center Site Call Center Site San Diego, CA Headquarters / Call Center Site Call Center Site Costa Rica San Antonio, TX Propel Cabot HQ / Call Center Sites West Malling, UK Stratford-upon-Avon, UK Call Center Site Dublin, Ireland Tampa, FL Call Center Site Warren, MI Call Center Site |
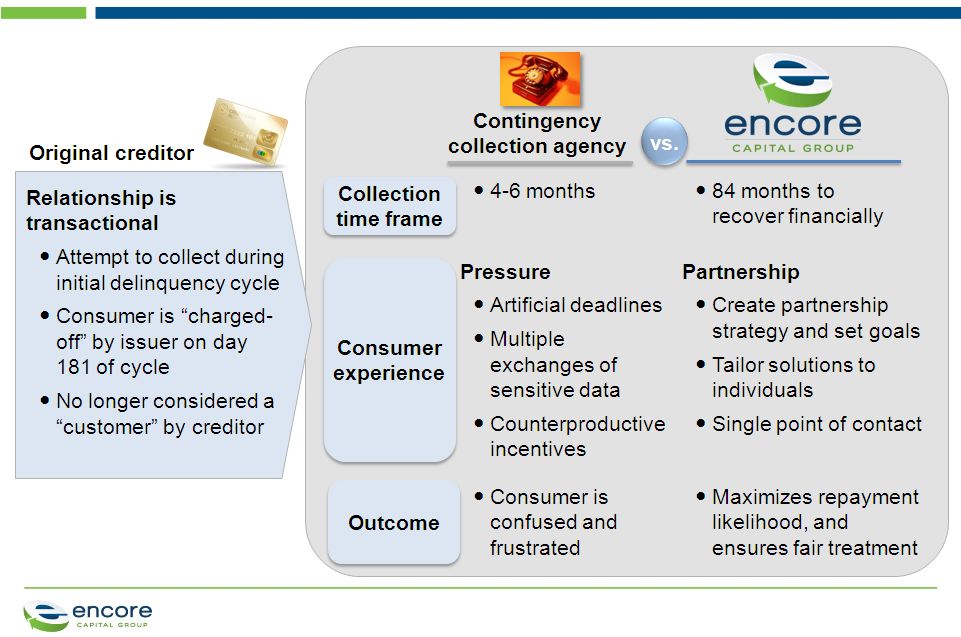 PROPRIETARY ENCORE PROVIDES A PRINCIPLED AND ESSENTIAL SERVICE 5 |
 PROPRIETARY OUR BUSINESS PRINCIPLES ARE BUILT ON TREATING CONSUMERS FAIRLY AND WITH RESPECT 6 Understanding our consumers • Acknowledging limitations of our consumers’ household balance sheets to align recovery plans • Deploying specialized surveys to test consumer satisfaction Making focused investments • Built specialized non-collections work groups to serve consumer needs • Established Consumer Credit Research Institute to better understand the financially stressed consumer Improving consumer experience • Living the Consumer Bill of Rights • Creating resources and directing financially stressed consumers to best external references • Founded Consumer Experience Council |
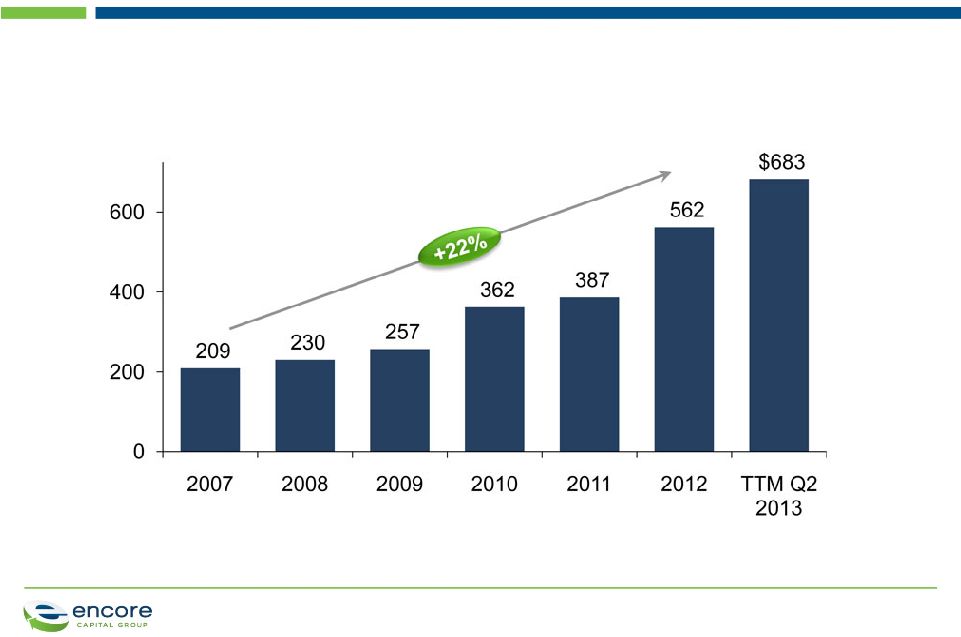
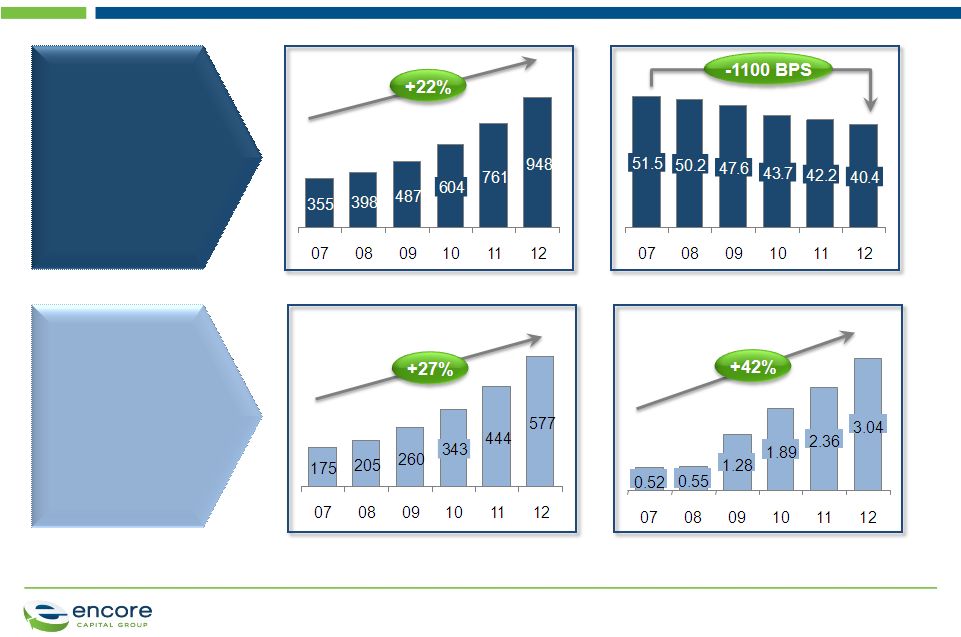 PROPRIETARY ENCORE HAS DELIVERED A TRACK RECORD OF STRONG, SUSTAINABLE FINANCIAL RESULTS 7 Strong business fundamentals... Cash Collections ($M) Cost to Collect (%) ...driving profitable growth Adjusted EBITDA ($M) Earnings Per Share ($) 1 3 2 1. Cost to Collect is Adjusted Operating Expenses / Dollar Collected. See Reconciliation of Adjusted Operating Expenses to GAAP Total Operating Expenses at the end of this presentation. 2. Adjusted EBITDA is a non-GAAP number which the Company considers to be and utilizes as a meaningful indicator of operating performance. See Reconciliation of Adjusted EBITDA to GAAP Net Income at the end of this presentation. 3. Per Fully Diluted Share from Continuing Operations Note: Growth rate percentages for Cash Collections, Adjusted EBITDA, and EPS signify compounded annual growth rate from 2007 - 2012 |
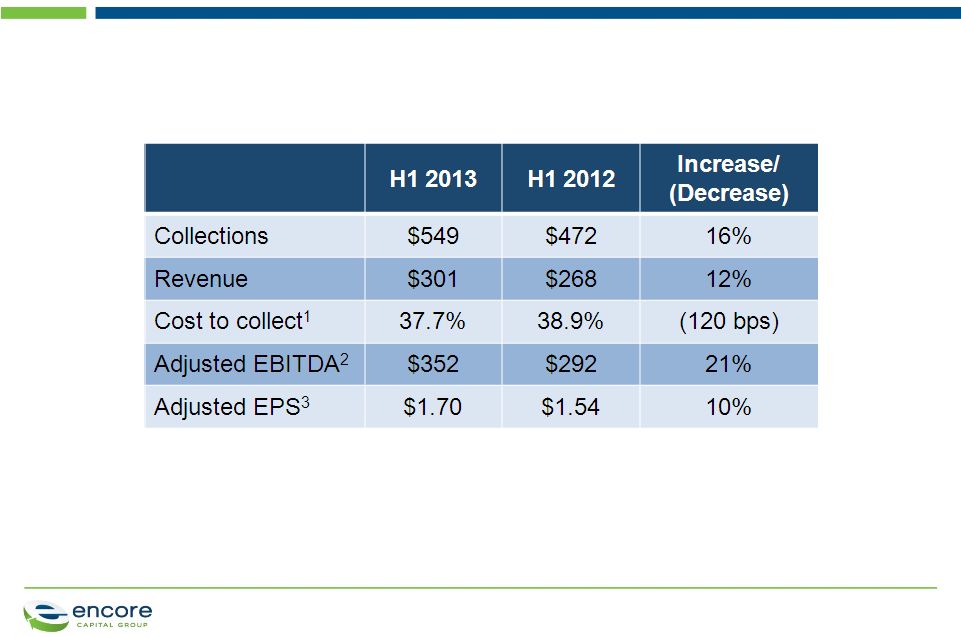 PROPRIETARY AND HAS CONTINUED TO BUILD UPON THIS PERFORMANCE WITH STRONG RESULTS THIS YEAR 8 Year over year financial results 1. Cost to Collect is Adjusted Operating Expenses / Dollar Collected. See Reconciliation of Adjusted Operating Expenses to GAAP Total Operating Expenses at the end of this presentation. 2. Adjusted EBITDA is a non-GAAP number which the Company considers to be and utilizes as a meaningful indicator of operating performance. See Reconciliation of Adjusted EBITDA to GAAP Net Income at the end of this presentation. 3. See reconciliation of Adjusted EPS to GAAP EPS at the end of this presentation. |
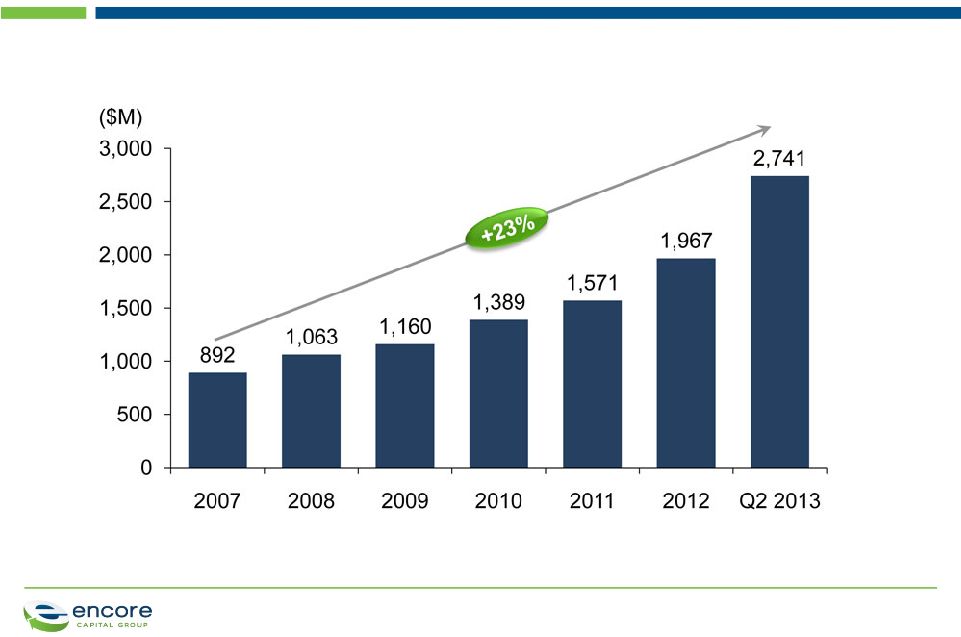 PROPRIETARY Estimated Remaining Collections in core receivables ENCORE HAS RAPIDLY GAINED SCALE AND POSITIONED ITSELF FOR SUSTAINED GROWTH 9 |
 PROPRIETARY THIS SCALE HAS BEEN CREATED BY MARKET LEADING INVESTMENTS 10 Capital deployed in core receivables ($M) |
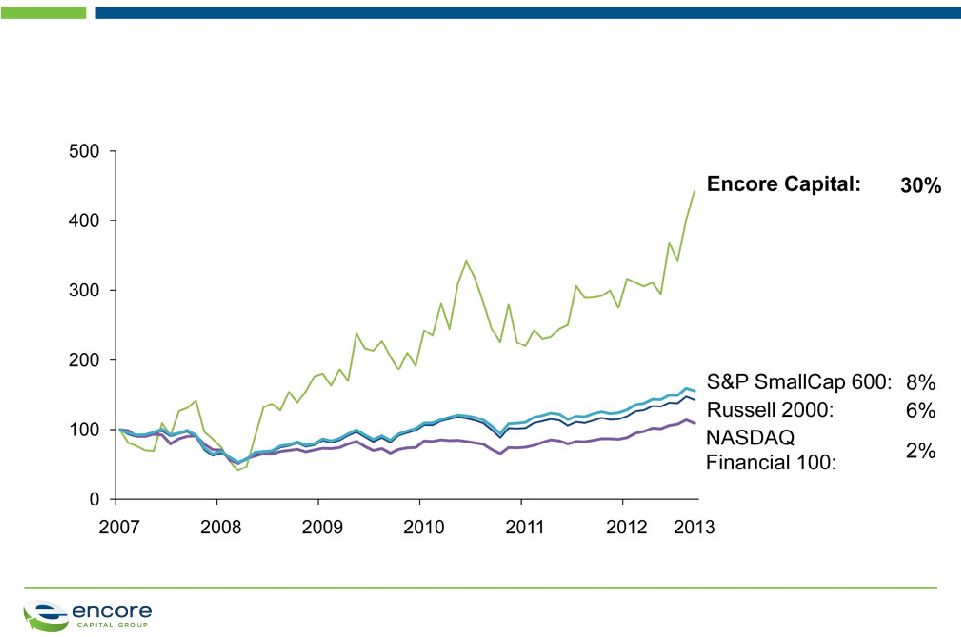 PROPRIETARY ENCORE HAS DELIVERED INDUSTRY LEADING TOTAL SHAREHOLDER RETURN OVER THE PAST 5+ YEARS 11 Total Shareholder Return (Dec. 2007- Aug. 2013) (%) |
 PROPRIETARY WE ARE WELL POSITIONED TO MAINTAIN OUR MOMENTUM AND CONTINUE DELIVERING TOP QUARTILE TSR 12 Management Team • Learning Organization • Principled Intent Growth, Margin Expansion, Free Cash Flow, PE Multiple Expansion Top Quartile Total Shareholder Return • Specialized call centers • Efficient international operations • Internal legal platform Operational Scale & Cost Leadership 2 Strong Capital Stewardship 3 • Consumer intelligence • Data driven, predictive modeling • Portfolio valuation at consumer level • Consumer Credit Research Institute Superior Analytics 1 • Uniquely scalable platform • Strategic investment opportunities in geographic and paper type adjacencies Extendable Business Model 4 • Sustained success at raising capital - Low cost of debt - Sustainable borrowing capacity and cash flow generation • Prudent capital deployment |
 PROPRIETARY OUR SUPERIOR ANALYTICS STEM FROM OUR INVESTMENTS TO BETTER UNDERSTAND CONSUMERS... 13 Industrialized behavioral science R&D that includes field experiments and new theory development Reporting and alerts Basic consumer segmentation and targeting Statistical analysis and forecasting Simple models to increase collection returns Predictive modeling and optimization Advanced models focused on consumer behavior and financial ability 2001 2005 2012 |
 PROPRIETARY Encore’s individual underwriting approach to portfolio valuation accommodates our specialized operational strengths Low willingness Low ability High willingness High capability High willingness Moderate capability High willingness Low capability Low willingness High ability Low willingness Moderate ability ...WHICH IS CLEARLY SEEN IN OUR APPROACH TO CONSUMER LEVEL PORTFOLIO VALUATION 14 • Strong partnership and recovery opportunities • Enforce legal contract through formal channels • Payment plans and opportunities to build longer relationships • Significant discounts and many small payments • Remind consumers through legal messaging • Hardship strategies and removal from the collections process |
 PROPRIETARY OUR EFFECTIVENESS HAS IMPROVED SIGNIFICANTLY THROUGH OUR INVESTMENTS IN ANALYTICS 15 Improved liquidation in our call center channel 1 1. Of like portfolios through call center channel 2. 2008 = 100 Note: Assumes 8% marginal cost to collect through call center channel, 40% tax rate, 2.3x cumulative collections multiple, 25M diluted shares outstanding Indexed liquidation rate +11% • In 2012, we collected $442M through our call center channel • In 2008, we would have only collected $398M • ~$44M in incremental cash collections • ~$0.50 in incremental EPS Impact of 11% improvement in liquidation (2008-2012) 111 100 80 90 100 110 120 2012 Vintage 2008 Vintage 2 |
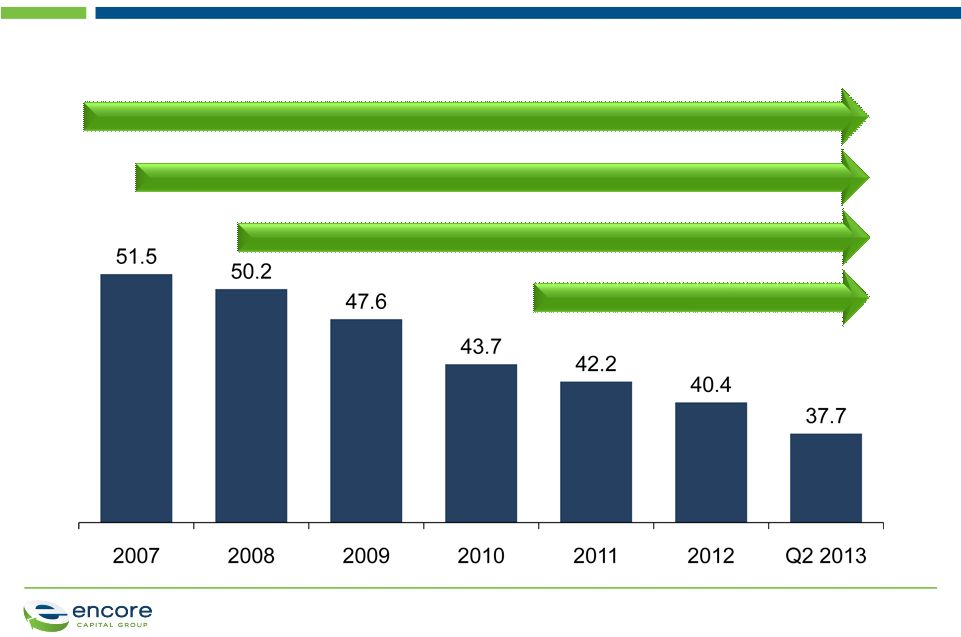 PROPRIETARY Internal Legal investments WE HAVE THE INDUSTRY LEADING COST PLATFORM, DRIVEN BY CONTINUING OPERATIONAL IMPROVEMENTS 16 Increased specialization in call centers Scaling Indian call center Improving analytics Overall Cost to Collect (%) 1. Cost to Collect is Adjusted Operating Cost / Dollar Collected. See Reconciliation of Adjusted Operating Cost to GAAP Total Operating Expenses at the end of this presentation. 1 |
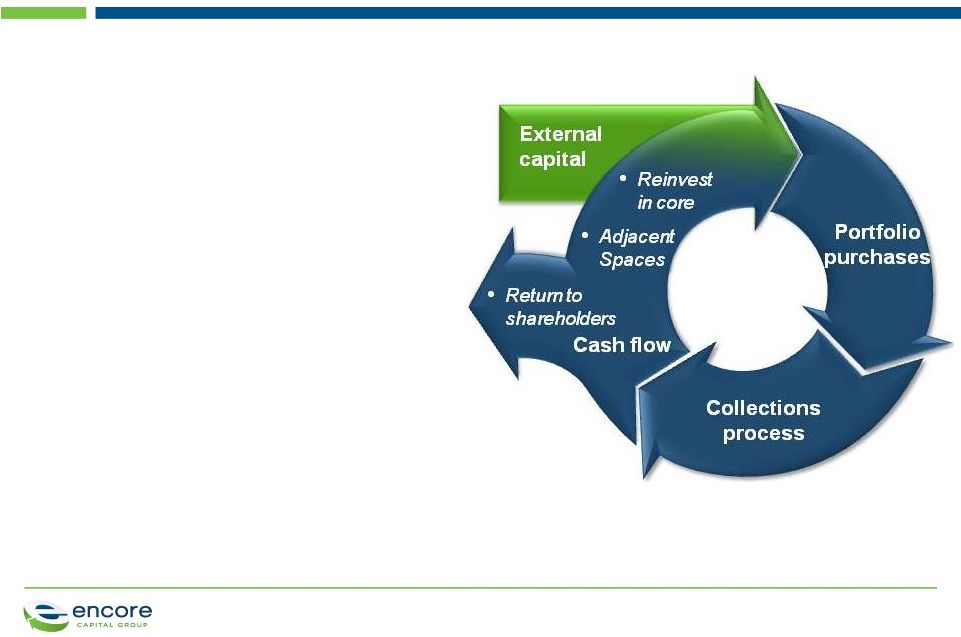 PROPRIETARY • Debt is our working capital – Capital deployment business which generates strong cash flows EFFICIENT CAPITAL STEWARDSHIP IS CRITICAL TO ENCORE'S SUCCESS 17 • Strong cash flow allows for TSR driving investments – Reinvest in wide range of receivables – Prudent investment in adjacencies to supplement core growth – Return capital to shareholders when it is highest return option |
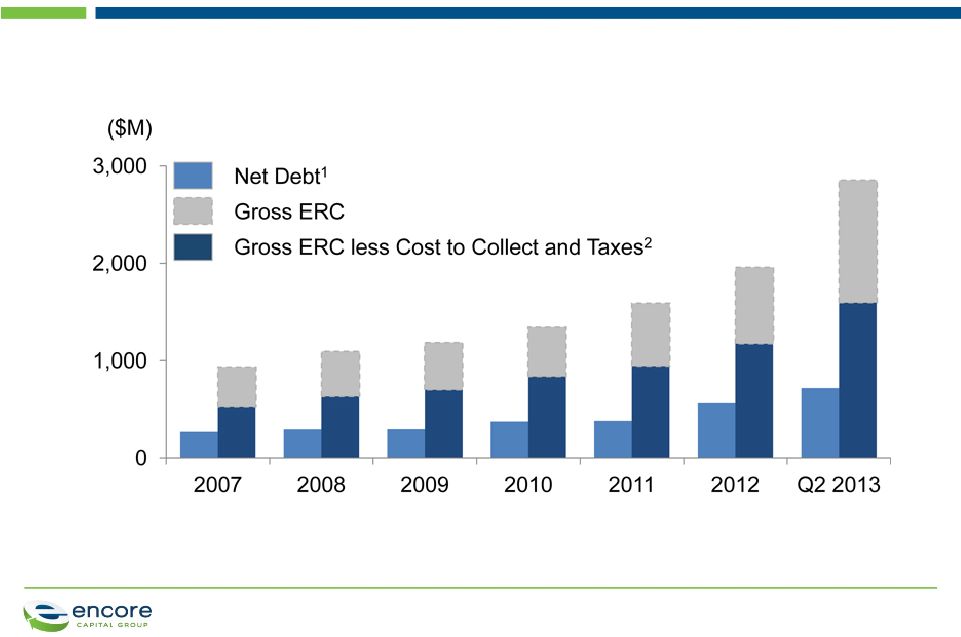 PROPRIETARY WE HAVE A STRONG ABILITY TO QUICKLY RAISE CAPITAL WHICH IS SUPPORTED BY OUR ESTIMATED REMAINING COLLECTIONS 18 Estimated Remaining Collections (ERC) vs. Net Debt 1. Includes revolver, term loan, senior, and net convertible debt less cash (excludes Propel debt) 2. Assumes liquidation cost to collect of 30% and a tax rate of 39.2%; Q2 2013 values as of June 30, 2013. |
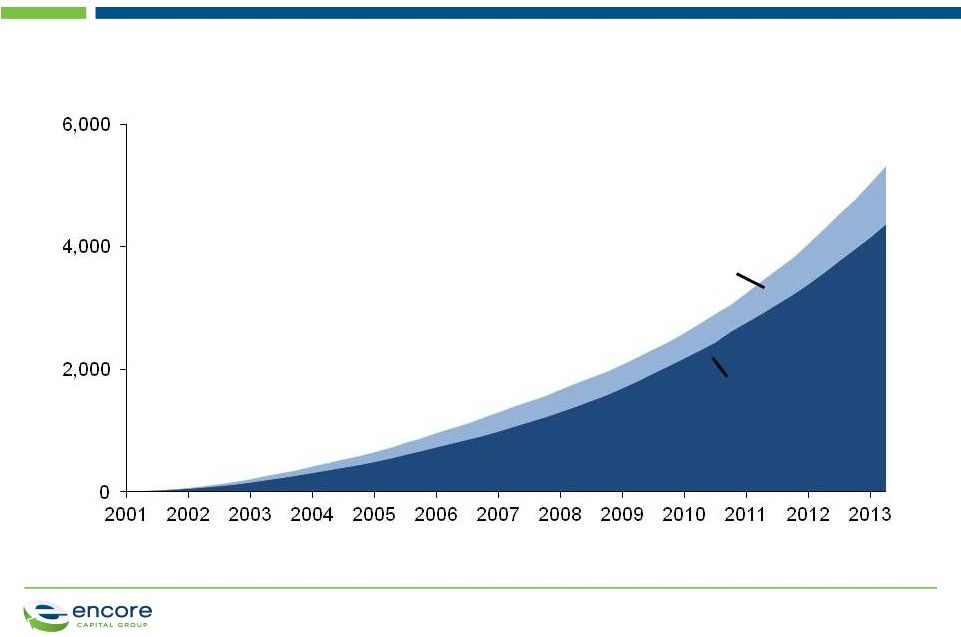 PROPRIETARY WE BELIEVE THAT OUR CURRENT ESTIMATE OF REMAINING COLLECTIONS IS CONSERVATIVE 19 Cumulative Collections - initial expectation vs. actual Actual Cash Collections Initial Projections ($M) |
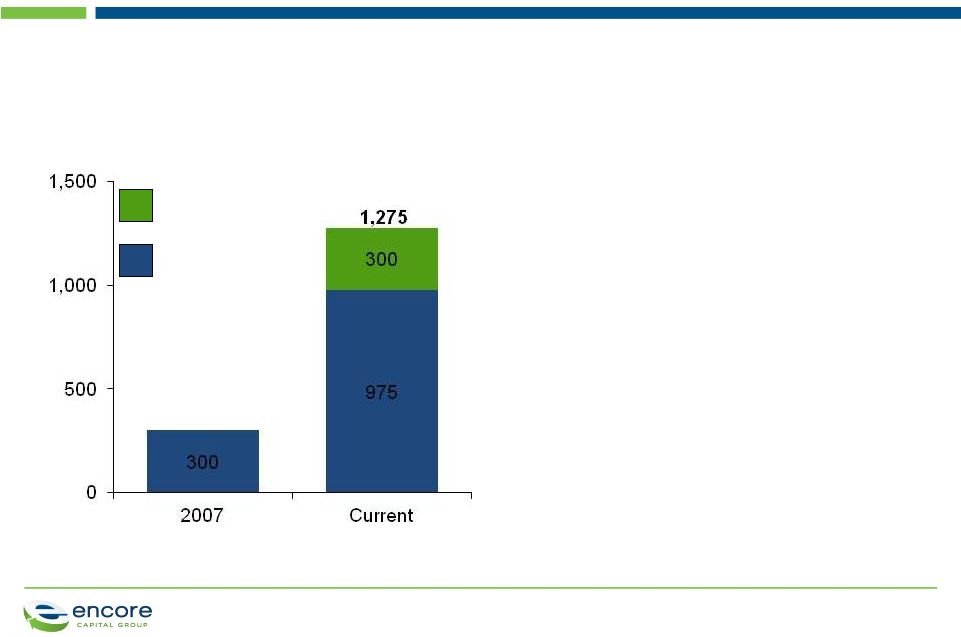 PROPRIETARY OUR ABILITY TO RAISE ADDITIONAL CAPITAL ALLOWS US TO PURSUE SUPPLEMENTAL GROWTH IN ADJACENT SPACES 20 – No impact on ability to purchase core US receivables • Propel facilities are incremental to, and separate from, our core debt facilities • We will continue to pursue and deploy separate pools of capital Note: Core debt includes the credit facility plus accordion We have the debt markets expertise to fund new opportunities... …and structure our debt to maximize flexibility for future growth Separate Propel facilities Core debt Total debt availability ($M) |
 PROPRIETARY OUR CAPITAL DEPLOYMENT STRATEGY FOCUSES ON DELIVERING ATTRACTIVE AND SUSTAINABLE TOTAL SHAREHOLDER RETURN 21 All investments viewed through lens of Total Shareholder Return Deployment priorities Reinvestments in core receivables business • All investments bound by IRR guidelines • Maintain operational flexibility with a range of core asset classes Principles for capital deployment Investments in adjacent spaces • Prudent investment in adjacent spaces which leverage our core competencies Return of capital to shareholders • Recognize there are times when best investment is to return cash |
 PROPRIETARY New asset classes Bankrupt accounts Outsourcing services International Secured assets Performing assets WE HAVE PURSUED DEALS AND INITIATIVES THAT ALIGN WITH OUR CORE BUSINESS 22 Expand geographically Focus on bankruptcy Cover different type of debt $83.6M investment in BK paper in 2012 |
 PROPRIETARY Largely satisfies our 2013 purchasing goals with attractive returns 23 THE ASSET ACCEPTANCE DEAL IS WELL ALIGNED WITH OUR STRATEGY AND ADDS $1 BILLION TO OUR ERC Allows us to be selective in purchases for the remainder of the year Able to leverage best practices across the two platforms to drive synergies |
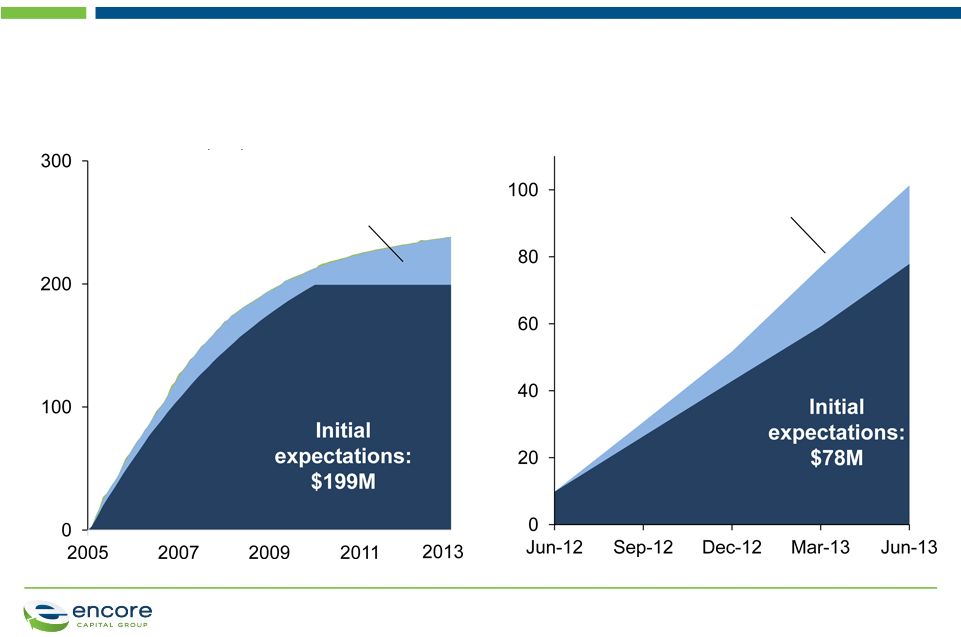 PROPRIETARY WE HAVE A STRONG TRACK RECORD ACQUIRING PORTFOLIOS FROM OTHER DEBT PURCHASERS SIMILAR TO AACC 24 $100+M portfolio purchased in 2012 Results to date: $238M Results to date: $101M $90M portfolio purchased in 2005 Cash Collections ($M) Cash Collections ($M) |
 PROPRIETARY WE BELIEVE WE CAN LEVERAGE OUR PLATFORM AND CAPABILITIES TO REALIZE SUBSTANTIAL SYNERGY VALUE AT AACC Lower cost structure: Leverage Encore's lower cost platform to expand margins on cash collections 2 Match Encore's lower collection cost in 9-12 months Internal legal collections: Integrate AACC's strong internal legal platform to drive additional overall operating efficiencies 3 Accelerate migration to internal legal platform by ~2 years Source of value Expected Impact Deeper consumer insight and analytics: More focused segmentation and targeting, resulting in better collections CCM target of > 2.5x 1 25 |
 PROPRIETARY WE HAVE MADE SIGNIFICANT PROGRESS EXECUTING OUR PLANS FOR PROPEL 26 Our plan Existing market • Working to penetrate the 80% of the Texas market that doesn't use tax lien transfers 1 What we've delivered • Developed & implemented model for direct mailing • Started outbound calling w/existing Encore facilities New markets • Lobbying to introduce legislation in other states that will create new markets 2 • Successfully worked with Nevada to pass legislation • Advancing legislative push to other states • Purchased tax lien certificates in three states New opportunities • Exploring alternative tax lien models that will allow us to expand into new markets 3 |
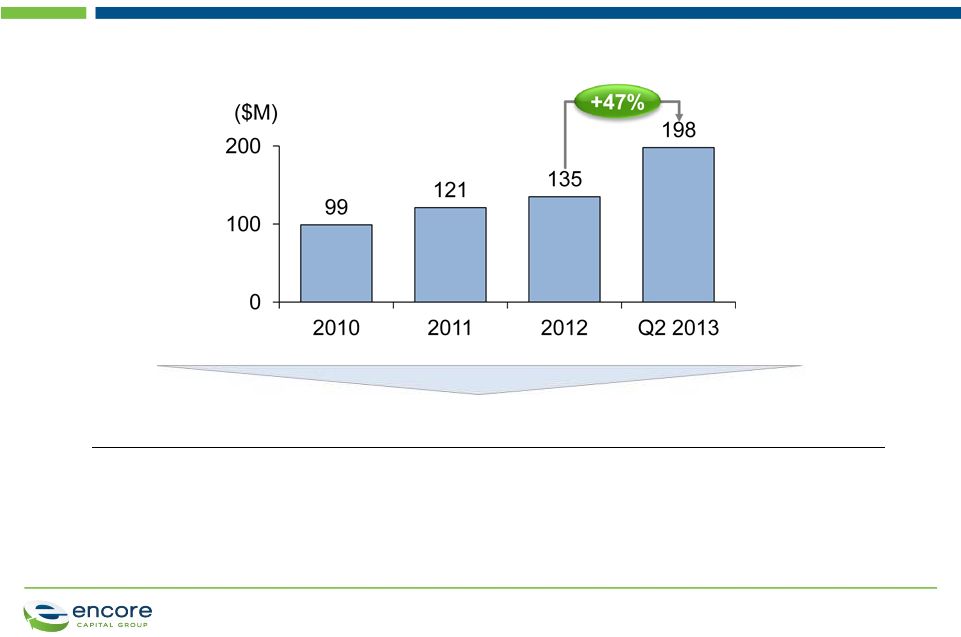 PROPRIETARY RESULTING IN GROWTH IN THE SIZE OF OUR PORTFOLIO WHILE MAINTAINING AN EXCEPTIONALLY LOW RISK PROFILE 27 • $8,600 average balance • 8-year term • 6-year weighted average life • 13-15% typical interest rate Texas portfolio characteristics • $227,000 average property value • 3.9% average LTV at origination • Less than 1% foreclosure rate • Zero losses Propel portfolio size |
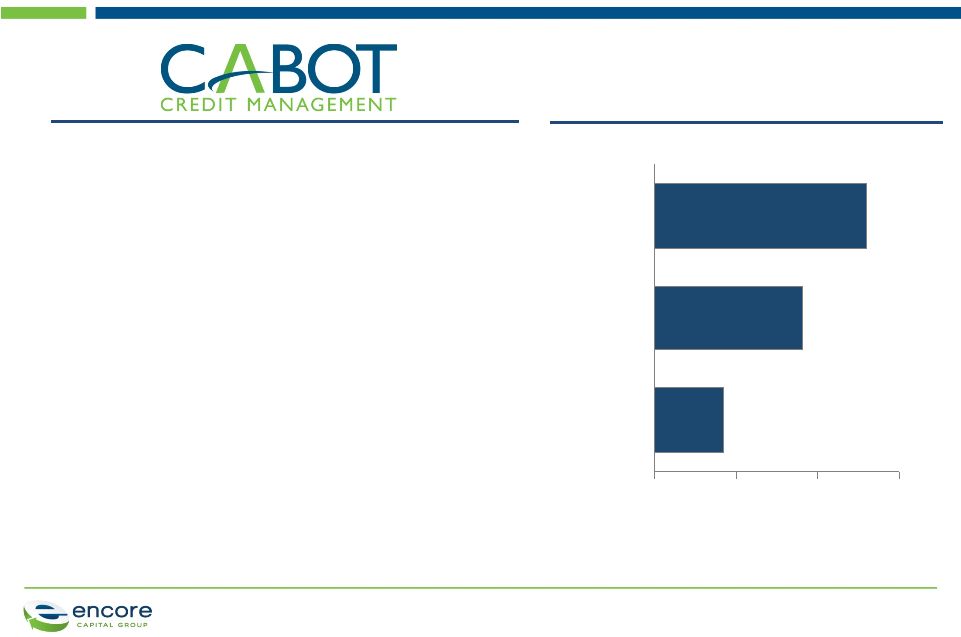 PROPRIETARY Market leader in U.K. debt management • Over 14 years of collections growth • Operations in Great Britain and Ireland Specializes in higher balance, “semi-performing” (i.e., paying) accounts • Favorable repayment characteristics Key statistics as of June 30, 2013: • £8.4B face-value of debt acquired for £761M • Statutory ERC of £1,043M • 3.8M customer accounts • 2013 H1 collections of £81M • 2013 H1 capital deployment of £84M Cabot was the leading purchaser of debt in the U.K. in 2012 CABOT IS THE LEADING PURCHASER OF DEBT IN THE U.K. 1. £31M funded by Anacap For FY 2012 28 91 42 0 50 100 150 (£M) Arrow Lowell Cabot 130 1 |
 PROPRIETARY ENCORE PROVIDES CABOT WITH SEVERAL SYNERGY OPPORTUNITIES Leverage Encore's operations and know- how • Enhance collections by leveraging Encore's efficient operations, including our operations in India • Leverage Encore's experience in secondary and tertiary debt to pursue new investments in the U.K. • Leverage Encore’s favorable financing to fund growth Leverage Encore's analytics • Deploy Encore's superior analytical capabilities to the Cabot platform • Focus on improving account segmentation and specialized collection strategies 29 |
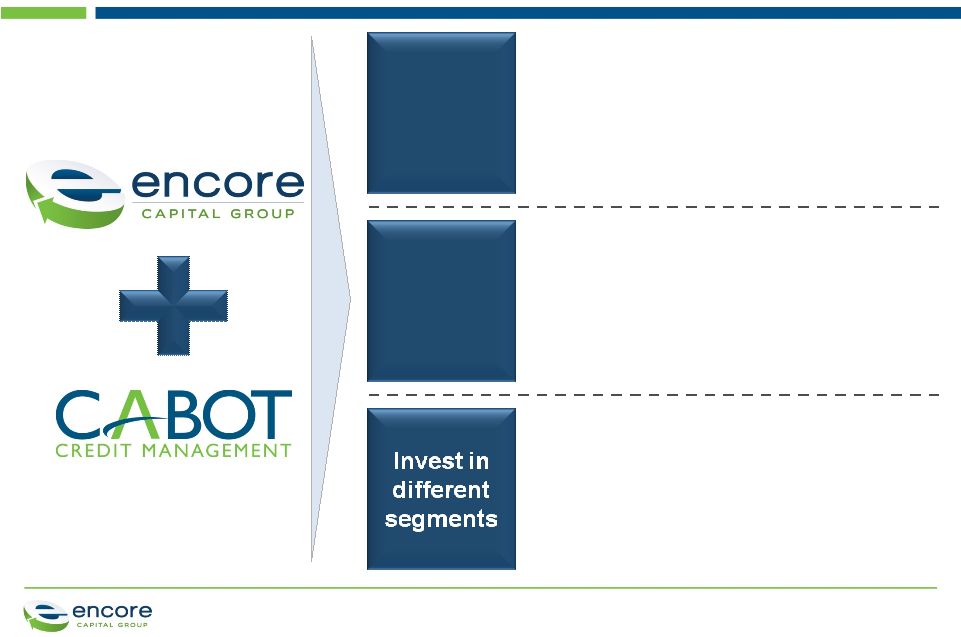
 PROPRIETARY ENCORE'S ACQUISITION OF CABOT WILL PROVIDE A VEHICLE TO CONTINUE ITS STRONG EARNINGS GROWTH Growing market • Encore can deploy capital in a growing market Profitable market • Portfolio IRRs are strong and favorable Timeline • Deal closed in Q3 of 2013 Encore Adjusted EPS • Supports Encore's 15% long-term Adjusted EPS growth 1 30 1. Calculation of Adjusted EPS excludes one-time transaction and integration costs and non-cash interest associated with the Company’s convertible debt offerings. For forward- looking Adjusted EPS projections, such one-time costs or charges are not presently quantified |
 PROPRIETARY WE ARE WELL POSITIONED TO MAINTAIN OUR MOMENTUM AND CONTINUE DELIVERING TOP QUARTILE TSR 31 Management Team • Learning Organization • Principled Intent Growth, Margin Expansion, Free Cash Flow, PE Multiple Expansion Top Quartile Total Shareholder Return • Specialized call centers • Efficient international operations • Internal legal platform Operational Scale & Cost Leadership 2 • Sustained success at raising capital - Low cost of debt - Sustainable borrowing capacity and cash flow generation • Prudent capital deployment Strong Capital Stewardship 3 • Consumer intelligence • Data driven, predictive modeling • Portfolio valuation at consumer level • Consumer Credit Research Institute Superior Analytics 1 • Uniquely scalable platform • Strategic investment opportunities in geographic and paper type adjacencies Extendable Business Model 4 |
 PROPRIETARY 32 APPENDIX |
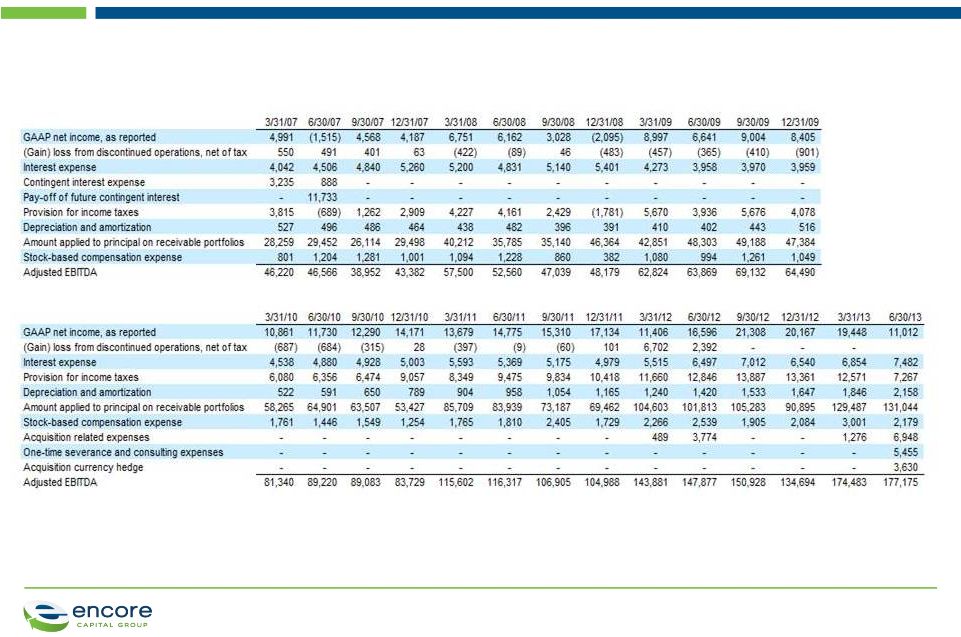 PROPRIETARY RECONCILIATION OF ADJUSTED EBITDA Reconciliation of Adjusted EBITDA to GAAP Net Income (Unaudited, In Thousands) Three Months Ended Note: The periods 3/31/07 through 12/31/08 have been adjusted to reflect the retrospective application of ASC 470-20. All periods have been adjusted to show discontinued ACG operations. PROPRIETARY 33 |
 PROPRIETARY RECONCILIATION OF ADJUSTED EPS TO GAAP EPS Six Months Ended June 30, 2013 2012 $ Per Diluted Share $ Per Diluted Share Net income from continuing operations 30,460 $1.24 37,096 $1.44 Adjustments: Convertible notes non-cash interest and issuance cost amortization, net of tax 1,000 $0.04 Acquisition related legal and advisory fees, net of tax 4,980 $0.20 2,567 $0.10 Acquisition related integration and severance costs, and consulting fees, net of tax 3,304 $0.13 Acquisition related other expenses, net of tax 2,198 $0.09 Adjusted income from continuing operations 41,942 $1.70 39,663 $1.54 34 |
 PROPRIETARY RECONCILIATION OF ADJUSTED OPERATING EXPENSES 2007 2008 2009 2010 2011 2012 H1 2012 H1 2013 GAAP total operating expenses, as reported $201,849 $216,900 249,782 $269,952 $328,566 $401,696 $194,203 $232,110 Adjustments: Ascension Operating Costs (14,801) (13,369) (13,218) Stock-based compensation expense (4,287) (3,564) (4,384) (6,010) (7,709) (8,794) (4,805) (5,180) Tax lien business segment operating expenses (5,681) (1,513) (6,526) Acquisition related legal and advisory fees (4,263) (4,263) (8,224) Acquisition related integration and severance costs, and consulting fees (5,455) Adjusted operating expenses $182,761 $199,967 $232,180 $263,942 $320,857 $382,958 $183,622 $206,725 35 Reconciliation of Adjusted Operating Cost to GAAP Operating Expenses (Unaudited, In Thousands) |