Table of Contents
Filed pursuant to Rule 424(b)(1)
Registration No. 333-132182
333-130879
PROSPECTUS
2,850,000 Shares

NATURAL GAS SERVICES GROUP, INC.
Common Stock
We are selling 2,468,000 shares of our common stock and the selling stockholders are selling 382,000 shares of our common stock. We will not receive any proceeds from the sale of our common stock by the selling stockholders.
Our common stock trades on the American Stock Exchange under the symbol “NGS”. On March 2, 2006, the last sale price reported for our common stock on the American Stock Exchange was $18.43 per share.
Investing in our common stock involves risks. See “Risk Factors” beginning on page 9.
Neither the Securities and Exchange Commission nor any state securities commission has approved or disapproved of these securities or determined if this prospectus is truthful or complete. Any representation to the contrary is a criminal offense.
| Per Share | Total | |||||||
| Public offering price | $ | 17.50 | $ | 49,875,000 | ||||
| Underwriting discount | $ | 1.01 | $ | 2,867,813 | ||||
| Proceeds to us before expenses | $ | 16.49 | $ | 40,706,575 | ||||
| Proceeds to selling stockholders | $ | 16.49 | $ | 6,300,613 | ||||
We have granted Morgan Keegan & Company, Inc. a30-day option to purchase up to an aggregate of 427,500 shares of common stock, solely to cover over-allotments, if any.
Morgan Keegan & Company, Inc. expects to deliver the shares of common stock to purchasers on or about March 8, 2006.
MORGAN KEEGAN & COMPANY, INC.
The date of this prospectus is March 2, 2006.
Table of Contents
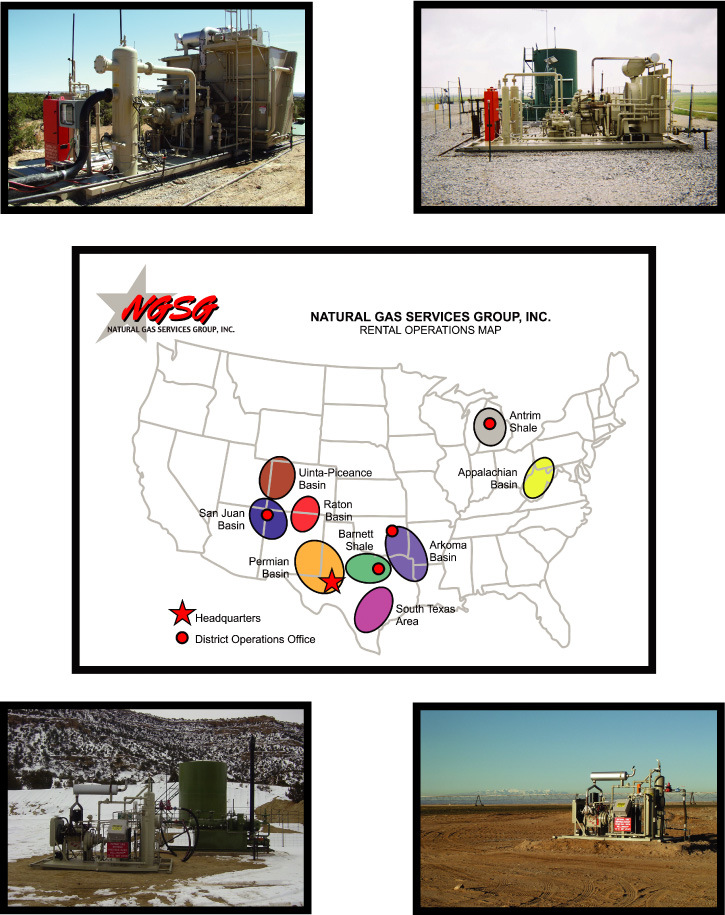
| NATURAL GAS SERVICES GROUP, INC. RENTAL OPERATIONS MAP |
| Headquarters District Operations Office Uinta-Piceance Basin Barnett Shale Appalachian Basin Antrim Shale Raton Basin San Juan Basin Permian Basin South Texas Area Arkoma Basin |
TABLE OF CONTENTS
| Page | ||||
| 1 | ||||
| 9 | ||||
| 18 | ||||
| 18 | ||||
| 19 | ||||
| 20 | ||||
| 21 | ||||
| 22 | ||||
| 25 | ||||
| 27 | ||||
| 40 | ||||
| 48 | ||||
| 57 | ||||
| 59 | ||||
| 62 | ||||
| 64 | ||||
| 65 | ||||
| 66 | ||||
| 66 | ||||
| 67 | ||||
| F-1 | ||||
You should rely only on the information contained in this prospectus. We have not authorized any other person to provide you with different information. If anyone provides you with different or inconsistent information, you should not rely on it. You should not assume that the information in this prospectus is accurate as of any date other than the date on the front of this prospectus.
Unless the context otherwise requires, references in this prospectus to “Natural Gas Services Group,” “we,” “us,” “our” or “ours” refer to Natural Gas Services Group, Inc., together with our operating subsidiary. When the context requires, we refer to these entities separately. References in this prospectus to the “selling stockholders” refer to the selling stockholders identified under “Principal and Selling Stockholders.” Certain specialized terms used in describing our natural gas compressor business are defined in “Glossary of Industry Terms”. Unless otherwise indicated, the information in this prospectus assumes that the underwriter does not exercise its over-allotment option.
i
Table of Contents
PROSPECTUS SUMMARY
This summary highlights selected information contained elsewhere in this prospectus. This summary is not complete and does not contain all of the information you should consider before investing in our common stock. You should read this entire prospectus carefully, including the information under the heading “Risk Factors,” our consolidated financial statements and the notes to those consolidated financial statements included elsewhere in this prospectus.
The Company
We are a leading provider of small to medium horsepower compression equipment to the natural gas industry. We focus primarily on the non-conventional natural gas production business in the United States (such as coalbed methane, gas shales and tight gas), which, according to data from the Energy Information Administration, is the single largest and fastest growing segment of U.S. gas production. We manufacture, fabricate and rent natural gas compressors that enhance the production of natural gas wells and provide maintenance services for those compressors. In addition, we sell custom fabricated natural gas compressors to meet customer specifications dictated by well pressures, production characteristics and particular applications. We also manufacture and sell flare systems for gas plant and production facilities.
The vast majority of our rental operations are in non-conventional natural gas areas which typically have lower initial reservoir pressures and faster well decline rates. These areas usually require compression to be installed sooner and with greater frequency.
Historically, the majority of our revenue has been derived from our compressor rental business. In January 2005, we acquired Screw Compression Systems, Inc., or “SCS,” which predominantly focuses on the custom fabrication sales business. By acquiring SCS, we increased our fabrication capacity by over 91,000 square feet. We intend to use this capacity to expand our rental fleet while continuing SCS’ core business of custom fabrication.
Natural gas compressors are used in a number of applications for the production and enhancement of gas wells and in gas transportation lines and processing plants. Compression equipment is often required to boost a well’s production to economically viable levels and enable gas to continue to flow in the pipeline to its destination. We believe that most producing gas wells in North America, at some point, will utilize compression. The World Oil Magazine reported that, as of December 31, 2004, there were approximately 395,000 producing gas wells in the United States. The states of New Mexico, Texas, Michigan, Colorado, Wyoming, Utah, Oklahoma, Pennsylvania, West Virginia and Kansas, our present areas of operation, account for approximately 297,000 of these wells.
We increased our revenue to $49.3 million in 2005 from $10.3 million in 2002, the year we completed our initial public offering. During the same period, income from operations increased to $8.9 million from $1.8 million. Our compressor rental fleet has grown from 302 compressors at the end of 2002 to 865 compressors at December 31, 2005.
Our Operating Units
Gas Compressor Rental. Our rental business is primarily focused on non-conventional gas production. We provide rental of small to medium horsepower compression equipment to customers via contracts typically having minimum initial terms of six to 24 months. Historically, in our experience, most customers retain the equipment beyond the expiration of the initial term. By outsourcing their compression needs, we believe our customers are able to increase their revenues by producing a higher volume of natural gas due to greater equipment run-time. Outsourcing also allows our customers to reduce their compressor downtime, operating and maintenance costs and capital investments and more efficiently meet their changing compression needs. As of December 31, 2005, approximately 94.8% of our rental fleet was utilized. In 2006, we intend to increase the number of units in our rental fleet by 30% to 40%.
1
Table of Contents
Engineered Equipment Sales
| • | Compressor fabrication. Fabrication involves the assembly of compressor components manufactured by us or other third parties into compressor units that are ready for rental or sale. In addition to fabricating compressors for our rental fleet, we engineer and fabricate natural gas compressors for sale to customers to meet their specifications based on well pressure, production characteristics and the particular applications for which compression is sought. | |
| • | Compressor manufacturing. We design and manufacture our own proprietary line of reciprocating compressor frames, cylinders and parts known as our “CiP”, orCylinder-in-Plane, product line. We use the finished components to fabricate compressor units for our rental fleet or for sale to third parties. We also sell finished components to other fabricators. | |
| • | Flare fabrication. We design, fabricate, sell, install and service flare stacks and related ignition and control devices for the onshore and offshore incineration of gas compounds such as hydrogen sulfide, carbon dioxide, natural gas and liquefied petroleum gases. Applications for this equipment are often environmentally and regulatory driven, and we believe we are a leading supplier to this market. | |
| • | Parts sales and compressor rebuilds. To provide customer support for our compressor and flare sales businesses, we stock varying levels of replacement parts at our Midland, Texas facility and at field service locations. We also provide an exchange and rebuild program for screw compressors and maintain an inventory of new and used compressors to facilitate this part of our business. |
Service and Maintenance. We service and maintain compressors owned by our customers on an “as needed” or contractual basis. Natural gas compressors require routine maintenance and periodic refurbishing to prolong their useful life. Routine maintenance includes physical and visual inspections and other parametric checks that indicate a change in the condition of the compressors. We perform wear-particle analysis on all packages and perform overhauls on a condition-based interval or a time-based schedule. Based on our past experience, these maintenance procedures maximize component life and unit availability and minimize downtime.
Business Strategy
We intend to grow our revenue and profitability by pursuing the following business strategies:
| • | Expand rental fleet. With a portion of the proceeds from this offering and using the additional fabrication capacity gained with the SCS acquisition, we intend to increase our market share by expanding our rental fleet 30% to 40% by the end of 2006. We believe our growth will continue to be primarily driven through our placement of small to medium horsepower wellhead gas compressors for non-conventional gas production, which is the single largest and fastest growing segment of U.S. gas production according to data from the Energy Information Administration. As of December 31, 2005, we had 820 natural gas compressors rented to third parties. | |
| • | Operational expansion. With the planned increase in our rental fleet, we intend to expand our operations in existing areas, as well as pursue focused expansion into new geographic regions. We have recently entered new markets in Appalachia and the Rocky Mountains. | |
| • | Expand CiP(Cylinder-in-Plane) product line. The CiP, orCylinder-in-Plane, is our proprietary reciprocating compressor product line. This product line has allowed us to expand our compressor rentals and sales into higher pressure gas gathering and transmission lines. We intend to establish new distributorship relationships and after-market sales and services networks. | |
| • | Selectively pursue acquisitions. We intend to evaluate potential acquisitions that would provide us with access to new markets or enhance our current market position. |
2
Table of Contents
Competitive Strengths
We believe we are well positioned to execute our business strategy because of the following competitive strengths:
| • | Superior customer service. Our emphasis on the small to medium horsepower markets has enabled us to effectively meet the evolving needs of our customers. We believe these markets have been under-serviced by our larger competitors which, coupled with our personalized services and in-depth knowledge of our customers’ operating needs and growth plans, have allowed us to enhance our relationships with existing customers as well as attract new customers. The size, type and geographic diversity of our rental fleet enables us to provide customers with a range of compression units that can serve a wide variety of applications. We are able to select the correct equipment for the job, rather than the customer trying to fit its application to our equipment. | |
| • | Diversified product line. Our compressors are available as high and low pressure rotary screw and reciprocating packages. They are designed to meet a number of applications, including wellhead production, natural gas gathering, natural gas transmission, vapor recovery and gas and plunger lift. In addition, our compressors can be built to handle a variety of gas mixtures, including air, nitrogen, carbon dioxide, hydrogen sulfide and hydrocarbon gases. A diversified product line helps us compete by being able to satisfy widely varying pressure, volume and production conditions that customers encounter. | |
| • | Purpose built rental compressors. Our rental compressor packages have been designed and built to address the primary requirements of our customers in the producing regions in which we operate. Our units are compact in design and are easy, quick and inexpensive to move, install andstart-up. Our control systems are technically advanced and allow the operator to start and stop our units remotely and/or in accordance with well conditions. We believe our rental fleet is also one of the newest with an average age of less than three years old. | |
| • | Experienced management team. On average, our executive and operating management team has over 20 years of oilfield services industry experience. We believe our management team has successfully demonstrated its ability to grow our business both organically and through selective acquisitions. | |
| • | Broad geographic presence. We presently provide our products and services to a customer base of oil and natural gas exploration and production companies operating in New Mexico, Texas, Michigan, Colorado, Wyoming, Utah, Oklahoma, Pennsylvania, West Virginia and Kansas. Our footprint allows us to service many of the natural gas producing regions in the United States. We believe that operating in diverse geographic regions allows us better utilization of our compressors, minimal incremental expenses, operating synergies, volume-based purchasing, leveraged inventories and cross-trained personnel. | |
| • | Long-standing customer relationships. We have developed long-standing relationships providing compression equipment to many major and independent oil and natural gas companies. Our customers generally continue to rent our compressors after the expiration of the initial terms of our rental agreements, which we believe reflects their satisfaction with the reliability and performance of our services and products. |
Recent Developments
We have included below a summary of our unaudited results of operations and financial condition for the year ended December 31, 2005. This summary should be read in conjunction with our unaudited consolidated financial statements as of and for the year ended December 31, 2005 included elsewhere in
3
Table of Contents
this prospectus, which financial statements have not been reviewed by our independent auditors, but have been prepared on a basis consistent with our audited consolidated financial statements.
Total revenues for the year ended December 31, 2005 increased 209.0% to $49.3 million, as compared to $16.0 million for the year ended December 31, 2004. The increase in revenue reflects the increase in our rental revenue and the addition of revenue from our acquisition of SCS.
Sales revenue increased from $3.6 million to $30.3 million, or 742.7%, for the year ended December 31, 2005, compared to the year ended December 31, 2004. The increase is mainly the result of the sale of compressor units to outside third parties by SCS.
Service and maintenance revenue increased from $1.9 million to $2.4 million, or 29.3%, for the year ended December 31, 2005, compared to the year ended December 31, 2004. The increase is mainly the result of additional third party labor sales in our New Mexico and Michigan branches.
Rental revenue increased from $10.5 million to $16.6 million, or 58.3%, for the year ended December 31, 2005, compared to the year ended December 31, 2004. The increase is mainly the result of units added to our rental fleet and rented to third parties. At December 31, 2005, we had 865 compressor packages in our rental fleet, up from 586 units at December 31, 2004. The average monthly rental rate per unit at December 31, 2005 was $2,075, as compared to $1,962 at December 31, 2004.
Net income for the year ended December 31, 2005 increased 33.9% to $4.4 million ($.52 per diluted share), as compared to $3.3 million ($.52 per diluted share) for the year ended December 31, 2004. Our 2004 net income included life insurance proceeds in the amount of $1.5 million we received upon the death in March 2004 of our former President and Chief Executive Officer.
At December 31, 2005, current assets were $24.6 million, which included $3.3 million of cash. Current liabilities were $11.2 million, and long-term debt was $22.2 million. Our stockholders’ equity as of December 31, 2005 was $45.7 million.
Corporate Information
We were incorporated in Colorado on December 17, 1998. We maintain our executive offices at 2911 South County Road 1260, Midland, Texas 79706, and our telephone number is (432) 563-3974. Our website is located athttp://www.ngsgi.com. The information on or that can be accessed through our website is not part of this prospectus.
4
Table of Contents
The Offering
| Common stock offered by us(1) | 2,468,000 shares. | |
| Common stock offered by the selling stockholders | 382,000 shares. | |
| Shares outstanding prior to the offering(2) | 9,031,783 shares as of February 13, 2006. | |
| Shares to be outstanding after the offering(1)(2) | 11,499,783 shares. | |
| Use of proceeds | We intend to use the net proceeds from the sale of shares of our common stock by us for capital expenditures, including expansion of our rental fleet, debt reduction, working capital and general corporate purposes. We will not receive any proceeds from the sale of shares by the selling stockholders. | |
| American Stock Exchange symbol | NGS | |
| Risk factors | Please read “Risk Factors” for a discussion of factors you should consider carefully before deciding to invest in shares of our common stock. |
| (1) | Assuming no exercise by the underwriter of its over-allotment option to purchase an additional 427,500 shares of common stock from us. |
| (2) | Excludes 146,668 shares issuable upon the exercise of outstanding stock options and 133,028 shares issuable upon the exercise of outstanding warrants. |
5
Table of Contents
Summary Historical and Pro Forma Consolidated Financial Information
The following summary historical consolidated financial information for each of the years in the three year period ended December 31, 2004, has been derived from our audited consolidated financial statements. The following summary historical consolidated financial information for the year ended December 31, 2005 has been derived from our unaudited consolidated financial statements, which have not been reviewed by our independent auditors, but have been prepared on a basis consistent with our audited consolidated financial statements. The following summary historical consolidated financial information has been derived from our unaudited consolidated financial statements and, in the opinion of our management, includes all adjustments, consisting only of normal recurring adjustments, necessary for a fair presentation. The summary pro forma consolidated statement of income and other information for the year ended December 31, 2004 gives effect to our acquisition of SCS, as if the acquisition was consummated on January 1, 2004. This information is only a summary and you should read it in conjunction with “Management’s Discussion and Analysis of Financial Condition and Results of Operations,” which discusses factors affecting the comparability of the information presented, and in conjunction with our financial statements and related notes included elsewhere in this prospectus, including the pro forma financial statements. Results for interim periods may not be indicative of results for full fiscal years.
| Year Ended December 31, | |||||||||||||||||||||
| Pro Forma | |||||||||||||||||||||
| 2002 | 2003 | 2004 | 2004 | 2005(1) | |||||||||||||||||
| (unaudited) | (unaudited) | ||||||||||||||||||||
| (in thousands, except per share amounts, compressor | |||||||||||||||||||||
| units andutilization) | |||||||||||||||||||||
CONSOLIDATED STATEMENTS OF INCOME AND OTHER INFORMATION: | |||||||||||||||||||||
| Revenues | $ | 10,297 | $ | 12,750 | $ | 15,958 | $ | 37,382 | $ | 49,311 | |||||||||||
| Costs of revenues, exclusive of depreciation shown separately below | 5,572 | 6,057 | 6,951 | 23,123 | 31,338 | ||||||||||||||||
| Gross profit | 4,725 | 6,693 | 9,007 | 14,259 | 17,973 | ||||||||||||||||
| Depreciation and amortization | 1,166 | 1,726 | 2,444 | 2,772 | 4,224 | ||||||||||||||||
| Other operating expenses | 1,718 | 2,292 | 2,652 | 5,167 | 4,890 | ||||||||||||||||
| Operating income | 1,841 | 2,675 | 3,911 | 6,320 | 8,859 | ||||||||||||||||
Total other income (expense)(2) | (471 | ) | (671 | ) | 603 | (39 | ) | (1,798 | ) | ||||||||||||
| Income before income taxes | 1,370 | 2,004 | 4,514 | 6,281 | 7,061 | ||||||||||||||||
| Total income tax expense | 584 | 697 | 1,140 | 2,080 | 2,615 | ||||||||||||||||
| Net income | 786 | 1,307 | 3,374 | 4,201 | 4,446 | ||||||||||||||||
| Preferred dividends | 107 | 121 | 53 | 53 | — | ||||||||||||||||
| Net income available to common stockholders | $ | 679 | $ | 1,186 | $ | 3,321 | $ | 4,148 | $ | 4,446 | |||||||||||
| Net income per common share: | |||||||||||||||||||||
| Basic | $ | 0.19 | $ | 0.24 | $ | 0.59 | $ | 0.67 | $ | 0.59 | |||||||||||
| Diluted | $ | 0.16 | $ | 0.23 | $ | 0.52 | $ | 0.59 | $ | 0.52 | |||||||||||
| Weighted average shares of common stock outstanding: | |||||||||||||||||||||
| Basic | 3,649 | 4,947 | 5,591 | 6,201 | 7,564 | ||||||||||||||||
| Diluted | 4,305 | 5,253 | 6,383 | 6,993 | 8,481 | ||||||||||||||||
EBITDA(3) | $ | 3,511 | $ | 4,397 | $ | 7,796 | $ | 10,903 | $ | 13,282 | |||||||||||
| Total compressor units in rental fleet (end of period) | 302 | 399 | 586 | 587 | 865 | ||||||||||||||||
Compressor utilization (end of period)(4) | 79.1% | 90.7% | 95.9% | 95.9% | 94.8% | ||||||||||||||||
6
Table of Contents
| As of | ||||||||
| December 31, 2005 | ||||||||
| As | ||||||||
| Actual | Adjusted(5) | |||||||
| (unaudited) | ||||||||
| (in thousands) | ||||||||
BALANCE SHEET INFORMATION: | ||||||||
| Cash and cash equivalents | $ | 3,271 | $ | 38,553 | ||||
| Total assets | 86,369 | 121,651 | ||||||
| Long-term debt (including current portion) | 28,205 | 23,205 | ||||||
| Stockholders’ equity | 45,690 | 85,972 | ||||||
| (1) | The information for the periods presented may not be comparable because of our acquisition of SCS in January 2005. For additional information regarding this acquisition, you should read the information under “Management’s Discussion and Analysis of Financial Condition and Results of Operations” and “Transactions with Selling Stockholders and Other Related Parties — Acquisition of Screw Compression Systems, Inc.” in this prospectus. |
| (2) | Total other income (expense) for the year ended December 31, 2004 includes $1.5 million in life insurance proceeds paid to us upon the death of our former Chief Executive Officer. |
| (3) | “EBITDA” is a non-GAAP financial measure of earnings (net income) before interest, taxes, depreciation, and amortization. This term, as used and defined by us, may not be comparable to similarly titled measures employed by other companies and is not a measure of performance calculated in accordance with GAAP. EBITDA should not be considered in isolation or as a substitute for operating income, net income or loss, cash flows provided by operating, investing and financing activities, or other income or cash flow statement data prepared in accordance with GAAP. However, management believes EBITDA is useful to an investor in evaluating our operating performance because: |
| • | it is widely used by investors in the energy industry to measure a company’s operating performance without regard to items excluded from the calculation of EBITDA, which can vary substantially from company to company depending upon accounting methods and book value of assets, capital structure and the method by which assets were acquired, among other factors; | |
| • | it helps investors to more meaningfully evaluate and compare the results of our operations from period to period by removing the impact of our capital structure and asset base from our operating structure; and | |
| • | it is used by our management for various purposes, including as a measure of operating performance, in presentations to our Board of Directors, as a basis for strategic planning and forecasting, and as a component for setting incentive compensation. |
7
Table of Contents
| There are material limitations to using EBITDA as a measure of performance, including the inability to analyze the impact of certain recurring items that materially affect our net income or loss, and the lack of comparability of results of operations of different companies. The following table reconciles EBITDA to our net income, the most directly comparable GAAP financial measure: |
| Year Ended December 31, | ||||||||||||||||||||
| Pro Forma | ||||||||||||||||||||
| 2002 | 2003 | 2004 | 2004 | 2005 | ||||||||||||||||
| (unaudited) | (unaudited) | |||||||||||||||||||
| (in thousands) | ||||||||||||||||||||
| EBITDA | $ | 3,511 | $ | 4,397 | $ | 7,796 | $ | 10,903 | $ | 13,282 | ||||||||||
| Depreciation and amortization | 1,166 | 1,726 | 2,444 | 3,071 | 4,224 | |||||||||||||||
| Interest expense, net | 975 | 667 | 838 | 1,551 | 1,997 | |||||||||||||||
| Income taxes | 584 | 697 | 1,140 | 2,080 | 2,615 | |||||||||||||||
| Net income | $ | 786 | $ | 1,307 | $ | 3,374 | $ | 4,201 | $ | 4,446 | ||||||||||
| (4) | Compressor utilization is the percentage of compressors within our rental fleet that are rented to third parties. |
| (5) | Gives effect to this offering and our receipt of net proceeds of approximately $40.3 million, and the use of $5.0 million of net proceeds for the repayment of debt, as if this offering had been completed on December 31, 2005. Assumes no exercise of the underwriter’s over-allotment option. |
8
Table of Contents
RISK FACTORS
You should carefully consider the following risks before you decide to buy our common stock. If any of the following risks actually occur, our business, financial condition or results of operations would likely suffer. If this occurs, the trading price of our common stock could decline, and you could lose all or part of the money you paid to buy our common stock. Although the risks described below are the risks that we believe are material, they are not the only risks relating to our industry, our business and our common stock. Additional risks and uncertainties, including those that are not yet identified or that we currently believe are immaterial, may also adversely affect our business, financial condition or results of operations.
Risks Associated With Our Industry
Decreased oil and natural gas prices and oil and gas industry expenditure levels would adversely affect our revenue.
Our revenue is derived from expenditures in the oil and natural gas industry which, in turn, are based on budgets to explore for, develop and produce oil and natural gas. If these expenditures decline, our revenue will suffer. The industry’s willingness to explore for, develop and produce oil and natural gas depends largely upon the prevailing view of future oil and natural gas prices. Prices for oil and gas historically have been, and are likely to continue to be, highly volatile. Many factors affect the supply and demand for oil and natural gas and, therefore, influence oil and natural gas prices, including:
| • | the level of oil and natural gas production; | |
| • | the level of oil and natural gas inventories; | |
| • | domestic and worldwide demand for oil and natural gas; | |
| • | the expected cost of developing new reserves; | |
| • | the cost of producing oil and natural gas; | |
| • | the level of drilling and producing activity; | |
| • | inclement weather; | |
| • | domestic and worldwide economic activity; | |
| • | regulatory and other federal and state requirements in the United States; | |
| • | the ability of the Organization of Petroleum Exporting Countries to set and maintain production levels and prices for oil; | |
| • | political conditions in or affecting oil and natural gas producing countries; | |
| • | terrorist activities in the United States and elsewhere; | |
| • | the cost of developing alternate energy sources; | |
| • | environmental regulation; and | |
| • | tax policies. |
If the demand for oil and natural gas decreases, then demand for our compressors likely will decrease.
Depending on the market prices of oil and natural gas, companies exploring for oil and natural gas may cancel or curtail their drilling programs, thereby reducing demand for our equipment and services. Our rental contracts are generally short-term, and oil and natural gas companies tend to respond quickly to upward or downward changes in prices. Any reduction in drilling and production activities may materially erode both pricing and utilization rates for our equipment and services and adversely affect our financial results. As a result, we may suffer losses, be unable to make necessary capital expenditures and be unable to meet our financial obligations.
9
Table of Contents
The intense competition in our industry could result in reduced profitability and loss of market share for us.
In our business segments, we compete with the oil and natural gas industry’s largest equipment and service providers who have greater name recognition than we do. These companies also have substantially greater financial resources, larger operations and greater budgets for marketing, research and development than we do. They may be better able to compete because of their broader geographic dispersion, the greater number of compressors in their fleet or their product and service diversity. As a result, we could lose customers and market share to those competitors. These companies may also be better positioned than us to successfully endure downturns in the oil and natural gas industry.
Our operations may be adversely affected if our current competitors or new market entrants introduce new products or services with better prices, features, performance or other competitive characteristics than our products and services. Competitive pressures or other factors also may result in significant price competition that could harm our revenue and our business. Additionally, we may face competition in our efforts to acquire other businesses.
Our industry is highly cyclical, and our results of operations may be volatile.
Our industry is highly cyclical, with periods of high demand and high pricing followed by periods of low demand and low pricing. Periods of low demand intensify the competition in the industry and often result in rental equipment being idle for long periods of time. We may be required to enter into lower rate rental contracts in response to market conditions in the future, and our sales may decrease as a result of such conditions.
Due to the short-term nature of most of our rental contracts, changes in market conditions can quickly affect our business. As a result of the cyclicality of our industry, our results of operations may be volatile in the future.
We are subject to extensive environmental laws and regulations that could require us to take costly compliance actions that could harm our financial condition.
Our fabrication and maintenance operations are significantly affected by stringent and complex federal, state and local laws and regulations governing the discharge of substances into the environment or otherwise relating to environmental protection. In these operations, we generate and manage hazardous wastes such as solvents, thinner, waste paint, waste oil, washdown wastes, and sandblast material. We attempt to use generally accepted operating and disposal practices and, with respect to acquisitions, will attempt to identify and assess whether there is any environmental risk before completing an acquisition. Based on the nature of the industry, however, hydrocarbons or other wastes may have been disposed of or released on or under properties owned or leased by us or on or under other locations where such wastes have been taken for disposal. The waste on these properties may be subject to federal or state environmental laws that could require us to remove the wastes or remediate sites where they have been released. We could be exposed to liability for cleanup costs, natural resource and other damages as a result of our conduct or the conduct of, or conditions caused by, prior owners, lessees or other third parties. Environmental laws and regulations have changed in the past, and they are likely to change in the future. If existing regulatory requirements or enforcement policies change, we may be required to make significant unanticipated capital and operating expenditures.
Any failure by us to comply with applicable environmental laws and regulations may result in governmental authorities taking actions against our business that could harm our operations and financial condition, including the:
| • | issuance of administrative, civil and criminal penalties; | |
| • | denial or revocation of permits or other authorizations; | |
| • | reduction or cessation in operations; and | |
| • | performance of site investigatory, remedial or other corrective actions. |
10
Table of Contents
Risks Associated With Our Company
We might be unable to employ adequate technical personnel, which could hamper our plans for expansion or increase our costs.
Many of the compressors that we sell or rent are mechanically complex and often must perform in harsh conditions. We believe that our success depends upon our ability to employ and retain a sufficient number of technical personnel who have the ability to design, utilize, enhance and maintain these compressors. Our ability to expand our operations depends in part on our ability to increase our skilled labor force. The demand for skilled workers is high and supply is limited. A significant increase in the wages paid by competing employers could result in a reduction of our skilled labor force or cause an increase in the wage rates that we must pay or both. If either of these events were to occur, our cost structure could increase and our operations and growth potential could be impaired.
We could be subject to substantial liability claims that could harm our financial condition.
Our products are used in hazardous drilling and production applications where an accident or a failure of a product can cause personal injury, loss of life, damage to property, equipment or the environment, or suspension of operations.
While we maintain insurance coverage, we face the following risks under our insurance coverage:
| • | we may not be able to continue to obtain insurance on commercially reasonable terms; | |
| • | we may be faced with types of liabilities that will not be covered by our insurance, such as damages from significant product liabilities and from environmental contamination; | |
| • | the dollar amount of any liabilities may exceed our policy limits; and | |
| • | we do not maintain coverage against the risk of interruption of our business. |
Any claims made under our policy will likely cause our premiums to increase. Any future damages caused by our products or services that are not covered by insurance, are in excess of policy limits or are subject to substantial deductibles, would reduce our earnings and our cash available for operations.
We will require a substantial amount of capital to expand our compressor rental fleet and grow our business.
During 2006, we plan to spend approximately $25.0 million to $30.0 million in capital expenditures to expand our rental fleet. The amount and timing of these capital expenditures may vary depending on a variety of factors, including the level of activity in the oil and natural gas exploration and production industry and the presence of alternative uses for our capital, including any acquisitions that we may pursue.
Historically, we have funded our capital expenditures through internally generated funds, borrowings under bank credit facilities and the proceeds of equity financings. Although we believe that the proceeds of this offering, cash flows from our operations and borrowings under our existing bank credit facility will provide us with sufficient cash to fund our planned capital expenditures for 2006, we cannot assure you that these sources will be sufficient. We may require additional capital to fund any unanticipated capital expenditures, including any acquisitions, and to fund our growth beyond 2006, and necessary capital may not be available to us when we need it or on acceptable terms. Our ability to raise additional capital will depend on the results of our operations and the status of various capital and industry markets at the time we seek such capital. Failure to generate sufficient cash flow, together with the absence of alternative sources of capital, could have a material adverse effect on our business, consolidated financial condition, results of operations or cash flows.
11
Table of Contents
Our current debt level is high and may negatively impact our current and future financial stability.
As of December 31, 2005, we had an aggregate of approximately $28.2 million of outstanding indebtedness, not including outstanding letters of credit in the aggregate face amount of $2.0 million, and accounts payable and accrued expenses of approximately $5.1 million. As a result of our significant indebtedness, we might not have the ability to incur any substantial additional indebtedness. The level of our indebtedness could have several important effects on our future operations, including:
| • | our ability to obtain additional financing for working capital, acquisitions, capital expenditures and other purposes may be limited; | |
| • | a significant portion of our cash flow from operations may be dedicated to the payment of principal and interest on our debt, thereby reducing funds available for other purposes; and | |
| • | our significant leverage could make us more vulnerable to economic downturns. |
If we are unable to service our debt, we will likely be forced to take remedial steps that are contrary to our business plan.
As of December 31, 2005, our principal payments for our debt service requirements were approximately $473,000 on a monthly basis; $1.4 million on a quarterly basis; and $5.7 million on an annual basis. It is possible that our business will not generate sufficient cash flow from operations to meet our debt service requirements and the payment of principal when due. If this were to occur, we may be forced to:
| • | sell assets at disadvantageous prices; | |
| • | obtain additional financing; or | |
| • | refinance all or a portion of our indebtedness on terms that may be less favorable to us. |
Our current bank loan agreement contains covenants that limit our operating and financial flexibility and, if breached, could expose us to severe remedial provisions.
Under the terms of our loan agreement, we must:
| • | comply with a minimum current ratio; | |
| • | maintain minimum levels of tangible net worth; | |
| • | not exceed specified levels of debt; | |
| • | comply with a debt service coverage ratio; and | |
| • | comply with a debt to tangible net worth ratio. |
Our ability to meet the financial ratios and tests under our bank loan agreement can be affected by events beyond our control, and we may not be able to satisfy those ratios and tests. A breach of any one of these covenants could permit the bank to accelerate the debt so that it is immediately due and payable. If a breach occurred, no further borrowings would be available under our loan agreement. If we were unable to repay the debt, the bank could proceed against and foreclose on our assets.
If we fail to acquire or successfully integrate additional businesses, our growth may be limited and our results of operations may suffer.
As part of our business strategy, we intend to evaluate potential acquisitions of other businesses or assets. However, there can be no assurance that we will be successful in consummating any such acquisitions. Successful acquisition of businesses or assets will depend on various factors, including, but not limited to, our ability to obtain financing and the competitive environment for acquisitions. In addition, we may not be able to successfully integrate any businesses or assets that we acquire in the future. The integration of acquired businesses is likely to be complex and time consuming and place a significant strain
12
Table of Contents
on management and may disrupt our business. We also may be adversely impacted by any unknown liabilities of acquired businesses, including environmental liabilities. We may encounter substantial difficulties, costs and delays involved in integrating common accounting, information and communication systems, operating procedures, internal controls and human resources practices, including incompatibility of business cultures and the loss of key employees and customers. These difficulties may reduce our ability to gain customers or retain existing customers, and may increase operating expenses, resulting in reduced revenues and income and a failure to realize the anticipated benefits of acquisitions.
As of December 31, 2005, a significant majority of our compressor rentals were for terms of six months or less which, if terminated or not renewed, would adversely impact our revenue and our ability to recover our initial equipment costs.
The length of our compressor rental agreements with our customers varies based on customer needs, equipment configurations and geographic area. In most cases, under currently prevailing rental rates, the initial rental periods are not long enough to enable us to fully recoup the average cost of acquiring or fabricating the equipment. We cannot be sure that a substantial number of our customers will continue to renew their rental agreements or that we will be able tore-rent the equipment to new customers or that any renewals orre-rentals will be at comparable rental rates. The inability to timely renew orre-rent a substantial portion of our compressor rental fleet would have a material adverse effect upon our business, consolidated financial condition, results of operations and cash flows.
The loss of one or more of our current customers could adversely affect our results of operations. It is likely that we will not continue to receive the same level of revenues we have received in the past from one of our customers.
Our business is dependent not only on securing new customers but also on maintaining current customers. In connection with our acquisition in March 2001 of the compression related assets of Dominion Michigan Petroleum Services, Inc., an affiliate of Dominion Michigan, Dominion Exploration & Production, Inc., committed to purchase compressors from us or enter into five year rental contracts with us for compression totaling five-thousand horsepower. This obligation expired December 31, 2005. In August 2005, we and competing third parties were invited to submit bids for providing continued rental and maintenance services to Dominion. In October 2005, we were advised that we will retain Dominion’s screw compressor rental business and the associated maintenance and service business, but that an unaffiliated third party will maintain and service Dominion’s reciprocating compressors. We estimate that the screw compressor rental, maintenance and service business we have retained from Dominion Exploration represented approximately 78% and 86% of our revenues from Dominion Exploration in the year ended December 31, 2004 and the nine months ended September 30, 2005, respectively. Dominion Exploration & Production, Inc. accounted for approximately 21% of our consolidated revenue for the year ended December 31, 2004, and approximately 10% of our consolidated revenue for the nine months ended September 30, 2005. XTO Energy, Inc. accounted for approximately 31% of our consolidated revenue for the nine months ended September 30, 2005. Unless we are able to retain our existing customers, or secure new customers if we lose one or more of our significant customers, our revenue and results of operations would be adversely affected.
Loss of key members of our management could adversely affect our business.
We depend on the continued employment and performance of Stephen C. Taylor, our Chairman of the Board of Directors, President and Chief Executive Officer, and other key members of our management. If any of our key managers resigns or becomes unable to continue in his present role and is not adequately replaced, our business operations could be materially adversely affected.
13
Table of Contents
Failure to effectively manage our growth and expansion could adversely affect our business and operating results and our internal controls.
We have rapidly and significantly expanded our operations in recent years and anticipate that our growth will continue if we are able to execute our strategy. Our rapid growth has placed significant strain on our management and other resources which, given our expected future growth rate, is likely to continue. To manage our future growth, we must, among other things:
| • | accurately assess the number of additional officers and employees we will require and the areas in which they will be required; | |
| • | attract, hire and retain additional highly skilled and motivated officers and employees; | |
| • | train and manage our work force in a timely and effective manner; | |
| • | upgrade and expand our office infrastructure so that it is appropriate for our level of activity; and | |
| • | improve our financial and management controls, reporting systems and procedures. |
Liability to customers under warranties may materially and adversely affect our earnings.
We provide warranties as to the proper operation and conformance to specifications of the equipment we manufacture. Our equipment is complex and often deployed in harsh environments. Failure of this equipment to operate properly or to meet specifications may increase our costs by requiring additional engineering resources and services, replacement of parts and equipment or monetary reimbursement to a customer. We have in the past received warranty claims and we expect to continue to receive them in the future. To the extent that we incur substantial warranty claims in any period, our reputation, our ability to obtain future business and our earnings could be materially and adversely affected.
Failure to maintain effective internal controls could have a material adverse effect on our operations.
We are in the process of documenting and testing our internal control procedures in order to satisfy the requirements of Section 404 of the Sarbanes-Oxley Act, which requires annual management assessments of the effectiveness of our internal control over financial reporting and a report by our independent auditors addressing these assessments. During the course of our testing we may identify deficiencies which we may not be able to remediate in time to meet the deadline imposed by SEC rules under the Sarbanes-Oxley Act for compliance with the requirements of Section 404. In addition, if we fail to achieve and maintain the adequacy of our internal controls, we may not be able to ensure that we can conclude on an ongoing basis that we have effective internal controls over financial reporting in accordance with Section 404 of the Sarbanes-Oxley Act. Moreover, effective internal controls are necessary for us to produce reliable financial reports and to help prevent financial fraud. If, as a result of deficiencies in our internal controls, we cannot provide reliable financial reports or prevent fraud, our business decision process may be adversely affected, our business and operating results could be harmed, investors could lose confidence in our reported financial information, and the price of our stock could decrease as a result.
We must evaluate our intangible assets annually for impairment.
Our intangible assets are recorded at cost less accumulated amortization and consist of goodwill and patent costs and other identifiable intangibles acquired as part of the SCS acquisition. Through December 31, 2001, goodwill was amortized using the straight-line method over 15 years and patent costs were amortized over 13 to 15 years.
In June 2001, the Financial Accounting Standards Board issued Statement of Financial Accounting Standards No. 142, “Goodwill and Other Intangible Assets.” FAS 142 provides that: (1) goodwill and intangible assets with indefinite lives will no longer be amortized; (2) goodwill and intangible assets with indefinite lives must be tested for impairment at least annually; and (3) the amortization period for intangible assets with finite lives will no longer be limited to 40 years. If we determine that our intangible assets with indefinite lives have been impaired, we must record a write-down of those assets on our
14
Table of Contents
consolidated statements of income during the period of impairment. Our determination of impairment will be based on various factors, including any of the following factors, if they materialize:
| • | significant underperformance relative to expected historical or projected future operating results; | |
| • | significant changes in the manner of our use of the acquired assets or the strategy for our overall business; | |
| • | significant negative industry or economic trends; | |
| • | significant decline in our stock price for a sustained period; and | |
| • | our market capitalization relative to net book value. |
We adopted FAS 142 as of January 1, 2002. Based on an independent valuation in July 2002 and June 2003 and an internal evaluation in December 2004 and June 2005 of our reporting units with goodwill, adoption of FAS 142 did not have a material adverse effect on us in 2003 or 2004. In the future it could result in impairments of our intangible assets or goodwill. We expect to continue to amortize our intangible assets with finite lives over the same time periods as previously used, and we will test our intangible assets with indefinite lives for impairment at least once each year. In addition, we are required to assess the consumptive life, or longevity, of our intangible assets with finite lives and adjust their amortization periods accordingly. Our net intangible assets were recorded on our balance sheet at approximately $2.7 million as of December 31, 2004, and at September 30, 2005, the carrying value of net intangible assets had increased to approximately $12.2 million with the acquisition of Screw Compression Systems, Inc. in January 2005. Any impairment in future periods of those assets, or a reduction in their consumptive lives, could materially and adversely affect our consolidated statements of income and financial position.
Risks Associated With Our Common Stock and the Offering
The price of our common stock may fluctuate which may cause our common stock to trade at a substantially lower price than the price which you paid for our common stock.
The trading price of our common stock and the price at which we may sell securities in the future is subject to substantial fluctuations in response to various factors, including our ability to successfully accomplish our business strategy, the trading volume of our stock, changes in governmental regulations, actual or anticipated variations in our quarterly or annual financial results, our involvement in litigation, general market conditions, the prices of oil and natural gas, announcements by us and or competitors, our liquidity, our ability to raise additional funds, and other events.
Future sales of our common stock could adversely affect our stock price.
Substantial sales of our common stock in the public market following this offering, or the perception by the market that those sales could occur, may lower our stock price or make it difficult for us to raise additional equity capital in the future. These potential sales could include sales of shares of our common stock by our Directors and officers, who beneficially owned approximately 18.51% of the outstanding shares of our common stock as of February 13, 2006. We have filed registration statements with the Securities and Exchange Commission registering the resale of approximately 649,574 shares of our currently outstanding common stock and approximately 297,195 shares of common stock that may be issued upon exercise of outstanding stock options and warrants. In January 2005, we issued a total of 609,756 shares of our common stock to the former stockholders of SCS in partial payment of the total purchase price for SCS. These shares are “restricted” securities within the meaning of Rule 144 under the Securities Act of 1933, as amended. Under Rule 144, shares of our common stock that have been held for at least one year may generally be sold in brokers transactions if the amount of shares sold by any stockholder (and the stockholder’s transferees under certain circumstances) in any three-month period does not exceed the greater of 1% of the outstanding stock (currently approximately 90,157 shares) or the
15
Table of Contents
four-week average weekly trading volume of the common stock. The 609,756 shares of common stock we issued to the former stockholders of SCS became eligible for sale under Rule 144 on January 3, 2006. Substantially all other outstanding shares of common stock held by non-affiliates are freely tradable.
If securities analysts downgrade our stock or cease coverage of us, the price of our stock could decline.
The trading market for our common stock relies in part on the research and reports that industry or financial analysts publish about us or our business. We do not control these analysts. Furthermore, there are many large, well-established, publicly traded companies active in our industry and market, which may mean that it is less likely that we will receive widespread analyst coverage. If one or more of the analysts who do cover us downgrade our stock, our stock price would likely decline rapidly. If one or more of these analysts cease coverage of our company, we could lose visibility in the market, which in turn could cause our stock price to decline.
We may invest or spend the net proceeds of this offering in a manner with which you do not agree or in ways that may not earn a profit.
We intend to use the net proceeds from this offering for capital expenditures, including expansion of our rental fleet, and for debt reduction. However, we will retain broad discretion over the use of the proceeds from this offering, and may use the proceeds for other purposes. You may not agree with the ways we decide to use the proceeds, and our use of the proceeds may not yield any profits.
If we issue debt or equity securities, you may lose certain rights and be diluted.
If we raise funds in the future through the issuance of debt or equity securities, the securities issued may have rights and preferences and privileges senior to those of holders of our common stock, and the terms of the securities may impose restrictions on our operations or dilute your ownership in Natural Gas Services Group, Inc.
We do not intend to pay, and have restrictions upon our ability to pay, dividends on our common stock.
We have not paid cash dividends in the past and do not intend to pay dividends on our common stock in the foreseeable future. Net income from our operations, if any, will be used for the development of our business, including capital expenditures, and to retire debt. In addition, our bank loan agreement contains restrictions on our ability to pay cash dividends on our common stock.
We have a comparatively low number of shares of common stock outstanding and, therefore, our common stock may suffer from limited liquidity and its prices will likely be volatile and its value may be adversely affected.
Because of our relatively low number of outstanding shares of common stock, the trading price of our common stock will likely be subject to significant price fluctuations and limited liquidity. This may adversely affect the value of your investment. In addition, our common stock price could be subject to fluctuations in response to variations in quarterly operating results, changes in management, future announcements concerning us, general trends in the industry and other events or factors as well as those described above.
Provisions contained in our governing documents could hinder a change in control of us.
Our articles of incorporation and bylaws contain provisions that may discourage acquisition bids and may limit the price investors are willing to pay for our common stock. Our articles of incorporation and bylaws provide that:
| • | directors will be elected for three-year terms, with approximately one-third of the board of directors standing for election each year; |
16
Table of Contents
| • | cumulative voting is not allowed, which limits the ability of minority shareholders to elect any directors; | |
| • | the unanimous vote of the board of directors or the affirmative vote of the holders of not less than 80% of the votes entitled to be cast by the holders of all shares entitled to vote in the election of directors is required to change the size of the board of directors; and | |
| • | directors may be removed only for cause and only by holders of not less than 80% of the votes entitled to be cast on the matter. |
Our Board of Directors has the authority to issue up to five million shares of preferred stock. The Board of Directors can fix the terms of the preferred stock without any action on the part of our stockholders. The issuance of shares of preferred stock may delay or prevent a change in control transaction. In addition, preferred stock could be used in connection with the Board of Directors’ adoption of a shareholders’ rights plan (also known as a poison pill), which would make it much more difficult to effect a change in control of our company through acquiring or controlling blocks of stock. Also, after completion of this offering, our Directors and officers as a group will continue to beneficially own stock. Although this is not a majority of our stock, it confers substantial voting power in the election of Directors and management of our company. This would make it difficult for other minority stockholders, such as the investors in this offering, to effect a change in control or otherwise extend any significant control over the management of our company. This may adversely affect the market price and interfere with the voting and other rights of our common stock.
17
Table of Contents
USE OF PROCEEDS
Our net proceeds from the sale of the 2,468,000 shares of common stock in this offering will be approximately $40.3 million. If the underwriter exercises its over-allotment option in full, our net proceeds will be approximately $47.3 million. Our net proceeds is the amount we expect to receive from this offering after deducting the underwriting discounts and estimated offering expenses payable by us. We intend to use the net proceeds for the following purposes:
| • | $5.0 million to reduce bank indebtedness; and | |
| • | $27.0 million to $32.0 million for our 2006 capital expenditure budget; and | |
| • | the remainder for working capital and general corporate purposes. |
We intend to use $5.0 million of the net proceeds to reduce bank debt. As of December 31, 2005, the interest rate on our bank borrowings was 7.75%, and the principal amounts outstanding have maturity dates between December 2006 and January 2012. The borrowings under our loan agreement, which are secured by substantially all of our assets, were incurred to finance the addition of compressors to our rental fleet and for the acquisition of SCS.
The previous paragraphs describe our present estimates of our use of the net proceeds of this offering based on our current plans and estimates of anticipated expenses. Our actual expenditures may vary from these estimates. We may also find it necessary or advisable to reallocate the net proceeds within the uses outlined above or to use portions of the net proceeds for other purposes, which may include acquisitions.
Pending these uses, we will invest the net proceeds of this offering primarily in cash equivalents or direct or guaranteed obligations of the United States government.
No part of the proceeds from the sale of the common stock offered by the selling stockholders will be received by us.
DIVIDEND POLICY
We have never declared or paid any dividends on our common stock. We currently intend to continue our policy of retaining earnings for use in our business and we do not anticipate paying cash dividends on our common stock. Our ability to pay cash dividends in the future on the common stock will be dependent upon our:
| • | financial condition; | |
| • | results of operations; | |
| • | current and anticipated cash requirements; | |
| • | plans for expansion; and | |
| • | restrictions under our debt obligations, |
as well as other factors that our Board of Directors deems relevant. The loan agreement with our bank lender contains provisions that restrict us from paying dividends on our common stock.
18
Table of Contents
PRICE RANGE OF COMMON STOCK
Our common stock is traded on the American Stock Exchange under the symbol “NGS.” The following table sets forth for the periods indicated the high and low sales prices for our common stock as reported by the American Stock Exchange.
| Common Stock | ||||||||
| Low | High | |||||||
| Year Ended | ||||||||
| December 31, 2003 | ||||||||
| First Quarter | $ | 3.70 | $ | 4.30 | ||||
| Second Quarter | 3.65 | 7.25 | ||||||
| Third Quarter | 5.45 | 6.75 | ||||||
| Fourth Quarter | 5.25 | 6.24 | ||||||
| Year Ended | ||||||||
| December 31, 2004 | ||||||||
| First Quarter | $ | 5.41 | $ | 7.20 | ||||
| Second Quarter | 7.20 | 10.04 | ||||||
| Third Quarter | 7.12 | 9.45 | ||||||
| Fourth Quarter | 8.07 | 9.43 | ||||||
| Year Ended | ||||||||
| December 31, 2005 | ||||||||
| First Quarter | $ | 9.08 | $ | 11.11 | ||||
| Second Quarter | 9.51 | 11.85 | ||||||
| Third Quarter | 11.55 | 36.00 | ||||||
| Fourth Quarter | 15.67 | 39.99 | ||||||
| Year Ending | ||||||||
| December 31, 2006 | ||||||||
| First Quarter (through March 2, 2006) | $ | 15.86 | $ | 25.40 | ||||
As of February 13, 2006, there were approximately 36 holders of record of our common stock. The number of holders of record does not include holders whose securities are held in street name. On March 2, 2006, the last reported sale price of our common stock as reported by the American Stock Exchange was $18.43 per share.
19
Table of Contents
CAPITALIZATION
The following table sets forth our unaudited cash and capitalization as of December 31, 2005 on an actual basis and as adjusted basis to reflect our receipt of the estimated net proceeds from the sale of 2,468,000 shares of common stock, after deducting underwriting discounts and other estimated offering expenses, and the use of $5.0 million of such proceeds for the repayment of bank debt. You should read this table in conjunction with our consolidated financial statements included elsewhere in this prospectus.
| At December 31, 2005 | ||||||||||
| Actual | As Adjusted | |||||||||
| (unaudited) | ||||||||||
| (in thousands) | ||||||||||
| Cash and cash equivalents | $ | 3,271 | $ | 38,553 | ||||||
| Long-term debt, including current maturities: | ||||||||||
| Term notes payable to bank | $ | 24,905 | $ | 19,905 | ||||||
Revolving note payable to bank(1) | 300 | 300 | ||||||||
| Subordinated notes | 3,000 | 3,000 | ||||||||
| Total long-term debt | 28,205 | 23,205 | ||||||||
| Stockholders’ equity: | ||||||||||
| Preferred stock, $0.01 par value; 5,000 shares authorized | — | — | ||||||||
| Common stock, $0.01 par value; 30,000 shares authorized; 9,022 shares issued and outstanding, 11,490 shares issued and outstanding, as adjusted | 90 | 115 | ||||||||
| Additional paid-in capital | 34,667 | 74,924 | ||||||||
| Retained earnings | 10,933 | 10,933 | ||||||||
| Total stockholders’ equity | 45,690 | 85,972 | ||||||||
| Total capitalization | $ | 73,895 | $ | 109,177 | ||||||
| (1) | On January 5, 2006, we entered into a Sixth Amended and Restated Loan Agreement with our bank lender. Under this agreement, our revolving line of credit was renewed, the maturity was extended from January 1, 2006 to December 1, 2006, and the principal amount we are able to borrow under this revolving facility was increased from $2.0 million to $10.0 million, subject to borrowing base limitations. |
20
Table of Contents
SPECIAL NOTE REGARDING FORWARD-LOOKING STATEMENTS
This prospectus contains certain forward-looking statements, within the meaning of Section 27A of the Securities Act of 1933, and information pertaining to us, our industry and the oil and natural gas industry that is based on the beliefs of our management, as well as assumptions made by and information currently available to our management. All statements, other than statements of historical facts contained in this prospectus, including statements regarding our future financial position, growth strategy, budgets, projected costs, plans and objectives of management for future operations, are forward-looking statements. We use the words “may,” “will,” “expect,” “anticipate,” “estimate,” “believe,” “continue,” “intend,” “plan,” “budget” and other similar words to identify forward-looking statements. You should read statements that contain these words carefully and should not place undue reliance on these statements because they discuss future expectations, contain projections of results of operations or of our financial condition and/or state other “forward-looking” information. We do not undertake any obligation to update or revise publicly any forward-looking statements. Although we believe our expectations reflected in these forward-looking statements are based on reasonable assumptions, no assurance can be given that these expectations or assumptions will prove to have been correct. Important factors that could cause actual results to differ materially from the expectations reflected in the forward-looking statements include, but are not limited to, the following factors and the other factors described in this prospectus under the caption “Risk Factors”:
| • | conditions in the oil and natural gas industry, including the demand for natural gas and fluctuations in the prices of oil and natural gas; | |
| • | competition among the various providers of compression services and products; | |
| • | changes in safety, health and environmental regulations; | |
| • | changes in economic or political conditions in the markets in which we operate; | |
| • | failure of our customers to continue to rent equipment after expiration of the primary rental term; | |
| • | the inherent risks associated with our operations, such as equipment defects, malfunctions and natural disasters; | |
| • | our inability to comply with covenants in our debt agreements and the decreased financial flexibility associated with our substantial debt; | |
| • | future capital requirements and availability of financing; | |
| • | general economic conditions; | |
| • | events similar to September 11, 2001; and | |
| • | fluctuations in interest rates. |
We believe that it is important to communicate our expectations of future performance to our investors. However, events may occur in the future that we are unable to accurately predict or that we are unable to control. When considering our forward-looking statements, you should keep in mind the risk factors and other cautionary statements in this prospectus.
21
Table of Contents
UNAUDITED CONSOLIDATED FINANCIAL STATEMENTS AS OF AND FOR
THE YEAR ENDED DECEMBER 31, 2005
The following unaudited consolidated financial statements as of and for the year ended December 31, 2005 have not been reviewed by our independent auditors, but have been prepared on a basis consistent with our historical audited consolidated financial statements, but omit all footnotes that normally accompany and are an integral part of the audited consolidated financial statements.
NATURAL GAS SERVICES GROUP, INC. AND SUBSIDIARIES
UNAUDITED CONSOLIDATED BALANCE SHEET
(all amounts in thousands, except per-share amounts)
| December 31, | ||||||
| 2005 | ||||||
| ASSETS | ||||||
CURRENT ASSETS: | ||||||
| Cash and cash equivalents | $ | 3,271 | ||||
| Trade accounts receivable, net of doubtful accounts of $75 | 6,192 | |||||
| Inventory | 14,723 | |||||
| Prepaid expenses and other | 456 | |||||
| Total current assets | 24,642 | |||||
RENTAL EQUIPMENT,net of accumulated depreciation of $7,598 | 41,201 | |||||
PROPERTY AND EQUIPMENT,net of accumulated depreciation of $2,458 | 6,424 | |||||
GOODWILL,net of accumulated amortization of $325 | 10,039 | |||||
INTANGIBLES,net of accumulated amortization of $326 | 3,978 | |||||
OTHER ASSETS | 85 | |||||
| Total assets | $ | 86,369 | ||||
| LIABILITIES AND STOCKHOLDERS’ EQUITY | ||||||
CURRENT LIABILITIES: | ||||||
| Current portion of long-term debt | $ | 5,680 | ||||
| Line of credit | 300 | |||||
| Accounts payable and accrued liabilities | 5,124 | |||||
| Deferred income | 103 | |||||
| Total current liabilities | 11,207 | |||||
LONG-TERM DEBT,less current portion | 20,225 | |||||
SUBORDINATED NOTES | 2,000 | |||||
DEFERRED TAX LIABILITY | 7,247 | |||||
COMMITMENTS | ||||||
STOCKHOLDERS’ EQUITY: | ||||||
| Common stock, 30,000 shares authorized, par value $0.01; 9,022 shares issued and outstanding | 90 | |||||
| Additional paid-in capital | 34,667 | |||||
| Retained earnings | 10,933 | |||||
| Total stockholders’ equity | $ | 45,690 | ||||
| Total liabilities and stockholders’ equity | $ | 86,369 | ||||
22
Table of Contents
NATURAL GAS SERVICES GROUP, INC. AND SUBSIDIARIES
UNAUDITED CONSOLIDATED STATEMENT OF INCOME
(all amounts in thousands, except per-share amounts)
| For the Year Ended | ||||||
| December 31, 2005 | ||||||
REVENUE: | ||||||
| Sales, net | $ | 30,278 | ||||
| Service and maintenance income | 2,424 | |||||
| Rental income | 16,609 | |||||
| Total revenue | 49,311 | |||||
OPERATING COSTS AND EXPENSES: | ||||||
| Cost of sales, exclusive of depreciation shown separately below | 23,331 | |||||
| Cost of service, exclusive of depreciation shown separately below | 1,479 | |||||
| Cost of rental, exclusive of depreciation shown separately below | 6,528 | |||||
| Selling expenses | 1,034 | |||||
| General and administrative | 3,856 | |||||
| Depreciation and amortization | 4,224 | |||||
| Total operating costs and expenses | 40,452 | |||||
OPERATING INCOME | 8,859 | |||||
OTHER INCOME (EXPENSE): | ||||||
| Interest expense | (1,997 | ) | ||||
| Other income (expense) | 199 | |||||
| Total other income (expense) | (1,798 | ) | ||||
INCOME BEFORE PROVISION FOR INCOME TAXES | 7,061 | |||||
PROVISION FOR INCOME TAXES: | ||||||
| Current | 207 | |||||
| Deferred | 2,408 | |||||
| Total income tax expense | 2,615 | |||||
NET INCOME | 4,446 | |||||
INCOME AVAILABLE TO COMMON STOCKHOLDERS | $ | 4,446 | ||||
EARNINGS PER COMMON SHARE: | ||||||
| Basic | $ | 0.59 | ||||
| Diluted | $ | 0.52 | ||||
WEIGHTED AVERAGE COMMON SHARES OUTSTANDING: | ||||||
| Basic | 7,564 | |||||
| Diluted | 8,481 | |||||
23
Table of Contents
NATURAL GAS SERVICES GROUP, INC. AND SUBSIDIARIES
UNAUDITED CONSOLIDATED STATEMENT OF CASH FLOWS
(all amounts in thousands)
| For the Year Ended | ||||||||
| December 31, 2005 | ||||||||
CASH FLOWS FROM OPERATING ACTIVITIES: | ||||||||
| Net income | $ | 4,446 | ||||||
| Adjustments to reconcile net income to net cash provided by operating activities: | ||||||||
| Depreciation and amortization | 4,224 | |||||||
| Deferred taxes | 2,408 | |||||||
| Amortization of debt issuance costs | 49 | |||||||
| Employee stock option expense | 135 | |||||||
| Loss (gain) on disposal of assets | (28 | ) | ||||||
| Changes in current assets: | ||||||||
| Trade and other receivables | (1,352 | ) | ||||||
| Inventory | (5,699 | ) | ||||||
| Prepaid expenses and other | (362 | ) | ||||||
| Changes in current liabilities: | ||||||||
| Accounts payable and accrued liabilities | 524 | |||||||
| Deferred income | (855 | ) | ||||||
| Other assets | 299 | |||||||
| Net cash provided by operating activities | 3,789 | |||||||
CASH FLOWS FROM INVESTING ACTIVITIES: | ||||||||
| Purchase of property and equipment | (17,708 | ) | ||||||
| Assets acquired, net of cash | (7,584 | ) | ||||||
| Proceeds from sale of property and equipment | 264 | |||||||
| Change in restricted cash | 2,000 | |||||||
| Net cash used in investing activities | (23,028 | ) | ||||||
CASH FLOWS FROM FINANCING ACTIVITIES: | ||||||||
| Net proceeds from lines of credit | 300 | |||||||
| Proceeds from long-term debt | 21,517 | |||||||
| Repayments of long-term debt | (13,077 | ) | ||||||
| Proceeds from exercise of stock options and warrants, net of transaction costs | 13,085 | |||||||
| Net cash provided by financing activities | 21,825 | |||||||
NET CHANGE IN CASH | 2,586 | |||||||
CASH AT BEGINNING OF PERIOD | 685 | |||||||
CASH AT END OF PERIOD | $ | 3,271 | ||||||
24
Table of Contents
SELECTED HISTORICAL CONSOLIDATED FINANCIAL INFORMATION
The following selected historical consolidated financial information for each of the years in the five-year period ended December 31, 2004, has been derived from our audited consolidated financial statements. The following selected historical consolidated financial information for the nine months ended September 30, 2004 and 2005 has been derived from our unaudited consolidated financial statements, and, in the opinion of our management, includes all adjustments, consisting only of normal recurring adjustments, necessary for a fair presentation. This information is only a summary and you should read it in conjunction with “Management’s Discussion and Analysis of Financial Condition and Results of Operations,” which discusses factors affecting the comparability of the information presented, and in conjunction with our consolidated financial statements and related notes included elsewhere in this prospectus. Results for interim periods may not be indicative of results for full fiscal years.
| Nine Months Ended | |||||||||||||||||||||||||||||
| Year Ended December 31, | September 30, | ||||||||||||||||||||||||||||
| 2000 | 2001 | 2002 | 2003 | 2004 | 2004 | 2005(1) | |||||||||||||||||||||||
| (unaudited) | |||||||||||||||||||||||||||||
| (in thousands, except per share amounts) | |||||||||||||||||||||||||||||
CONSOLIDATED STATEMENTS OF INCOME AND OTHER INFORMATION: | |||||||||||||||||||||||||||||
| Revenues | $ | 3,652 | $ | 8,762 | $ | 10,297 | $ | 12,750 | $ | 15,958 | $ | 11,220 | $ | 35,532 | |||||||||||||||
| Costs of revenue, exclusive of depreciation shown separately below | 1,535 | 4,942 | 5,572 | 6,057 | 6,951 | 4,903 | 22,661 | ||||||||||||||||||||||
| Gross profit | 2,117 | 3,820 | 4,725 | 6,693 | 9,007 | 6,317 | 12,871 | ||||||||||||||||||||||
| Depreciation and amortization | 356 | 901 | 1,166 | 1,726 | 2,444 | 1,751 | 3,026 | ||||||||||||||||||||||
| Other operating expenses | 1,238 | 1,720 | 1,718 | 2,292 | 2,652 | 1,998 | 3,600 | ||||||||||||||||||||||
| Operating income | 523 | 1,199 | 1,841 | 2,675 | 3,911 | 2,568 | 6,245 | ||||||||||||||||||||||
Total other income (expense)(2) | (159 | ) | (503 | ) | (471 | ) | (671 | ) | 603 | 916 | (1,388 | ) | |||||||||||||||||
| Income before income taxes | 364 | 696 | 1,370 | 2,004 | 4,514 | 3,484 | 4,857 | ||||||||||||||||||||||
| Income tax expense | 147 | 314 | 584 | 697 | 1,140 | 774 | 1,797 | ||||||||||||||||||||||
| Income before discontinued operations | 217 | 382 | 786 | 1,307 | 3,374 | 2,710 | 3,060 | ||||||||||||||||||||||
Discontinued operations(3) | 692 | — | — | — | — | — | — | ||||||||||||||||||||||
| Net income | 909 | 382 | 786 | 1,307 | 3,374 | 2,710 | 3,060 | ||||||||||||||||||||||
| Preferred dividends | — | 11 | 107 | 121 | 53 | 53 | — | ||||||||||||||||||||||
| Net income available to common stockholders | $ | 909 | $ | 371 | $ | 679 | $ | 1,186 | $ | 3,321 | $ | 2,657 | $ | 3,060 | |||||||||||||||
| Net income per common share: | |||||||||||||||||||||||||||||
| Basic | $ | 0.27 | $ | 0.11 | $ | 0.19 | $ | 0.24 | $ | 0.59 | $ | 0.49 | $ | 0.43 | |||||||||||||||
| Diluted | $ | 0.27 | $ | 0.11 | $ | 0.16 | $ | 0.23 | $ | 0.52 | $ | 0.43 | $ | 0.37 | |||||||||||||||
| Weighted average shares of common stock outstanding: | |||||||||||||||||||||||||||||
| Basic | 3,358 | 3,358 | 3,649 | 4,947 | 5,591 | 5,428 | 7,078 | ||||||||||||||||||||||
| Diluted | 3,358 | 3,484 | 4,305 | 5,253 | 6,383 | 6,217 | 8,213 | ||||||||||||||||||||||
EBITDA(4) | $ | 927 | $ | 2,523 | $ | 3,511 | $ | 4,397 | $ | 7,796 | $ | 5,815 | $ | 9,322 | |||||||||||||||
| As of December 31, | As of | |||||||||||||||||||||||
| September 30, | ||||||||||||||||||||||||
| 2000 | 2001 | 2002 | 2003 | 2004 | 2005 | |||||||||||||||||||
| (unaudited) | ||||||||||||||||||||||||
| (in thousands) | ||||||||||||||||||||||||
BALANCE SHEET INFORMATION: | ||||||||||||||||||||||||
| Current assets | $ | 1,893 | $ | 3,248 | $ | 5,084 | $ | 3,654 | $ | 7,295 | $ | 27,230 | ||||||||||||
| Total assets | 8,009 | 18,810 | 23,937 | 28,270 | 43,255 | 85,583 | ||||||||||||||||||
| Long-term debt (including current portion) | 2,644 | 10,009 | 8,847 | 10,724 | 15,017 | 28,013 | ||||||||||||||||||
| Stockholders’ equity | 4,387 | 5,781 | 13,001 | 14,425 | 22,903 | 43,897 | ||||||||||||||||||
25
Table of Contents
| (1) | The information for the periods presented may not be comparable because of our acquisition of SCS in January 2005. For additional information regarding this acquisition, you should read the information under “Management’s Discussion and Analysis of Financial Condition and Results of Operations” and “Transactions with Selling Stockholders and Other Related Parties — Acquisition of Screw Compression Systems, Inc.” in this prospectus. |
| (2) | Total other income (expense) for the year ended December 31, 2004 and the nine months ended September 30, 2004 includes $1.5 million in life insurance proceeds paid to us upon the death of our former Chief Executive Officer. |
| (3) | On March 31, 2000, we disposed of a former subsidiary, CNG Engine Co., or “CNG,” through a transfer of all of the common stock of CNG to the former owner of CNG in exchange for 692,368 shares of common stock of Natural Gas Services Group held by the former owner and a promissory note from the former owner in the amount of $350,000. During the year ended December 31, 2000, the former owner defaulted on all payments due to us under the note, and the entire amount was reserved and reflected as a reduction in the gain from discontinued operations. |
| (4) | “EBITDA” is a non-GAAP financial measure of earnings (net income) from continuing operations before interest, taxes, depreciation, and amortization. This term, as used and defined by us, may not be comparable to similarly titled measures employed by other companies and is not a measure of performance calculated in accordance with GAAP. EBITDA should not be considered in isolation or as a substitute for operating income, net income or loss, cash flows provided by operating, investing and financing activities, or other income or cash flow statement data prepared in accordance with GAAP. However, management believes EBITDA is useful to an investor in evaluating our operating performance because: |
| • | it is widely used by investors in the energy industry to measure a company’s operating performance without regard to items excluded from the calculation of EBITDA, which can vary substantially from company to company depending upon accounting methods and book value of assets, capital structure and the method by which assets were acquired, among other factors; | |
| • | it helps investors to more meaningfully evaluate and compare the results of our operations from period to period by removing the impact of our capital structure and asset base from our operating structure; and | |
| • | it is used by our management for various purposes, including as a measure of operating performance, in presentations to our Board of Directors, as a basis for strategic planning and forecasting, and as a component for setting incentive compensation. |
| There are material limitations to using EBITDA as a measure of performance, including the inability to analyze the impact of certain recurring items that materially affect our net income or loss, and the lack of comparability of results of operations of different companies. The following table reconciles EBITDA to our net income, the most directly comparable GAAP financial measure: |
| Nine Months Ended | ||||||||||||||||||||||||||||
| Year Ended December 31, | September 30, | |||||||||||||||||||||||||||
| 2000 | 2001 | 2002 | 2003 | 2004 | 2004 | 2005 | ||||||||||||||||||||||
| (unaudited) | (unaudited) | |||||||||||||||||||||||||||
| (in thousands) | ||||||||||||||||||||||||||||
| EBITDA | $ | 927 | $ | 2,523 | $ | 3,511 | $ | 4,397 | $ | 7,796 | $ | 5,815 | $ | 9,322 | ||||||||||||||
| Depreciation and amortization | 356 | 903 | 1,166 | 1,726 | 2,444 | 1,751 | 3,026 | |||||||||||||||||||||
| Interest expense, net | 207 | 924 | 975 | 667 | 838 | 580 | 1,439 | |||||||||||||||||||||
| Income taxes | 147 | 314 | 584 | 697 | 1,140 | 774 | 1,797 | |||||||||||||||||||||
| Discontinued operations | (692 | ) | — | — | — | — | — | — | ||||||||||||||||||||
| Net income | $ | 909 | $ | 382 | $ | 786 | $ | 1,307 | $ | 3,374 | $ | 2,710 | $ | 3,060 | ||||||||||||||
26
Table of Contents
MANAGEMENT’S DISCUSSION AND ANALYSIS OF
FINANCIAL CONDITION AND RESULTS OF OPERATIONS
The discussion and analysis of our financial condition and results of operations are based on, and should be read in conjunction with, our consolidated financial statements and the related notes included elsewhere in this prospectus.
Overview
We fabricate, manufacture, rent and sell natural gas compressors and related equipment. Our primary focus is on the rental of natural gas compressors. Our rental contracts generally provide for initial terms of six to 24 months. After the initial term of our rental contracts, most of our customers have continued to rent our compressors on amonth-to-month basis. Rental amounts are paid monthly in advance and include maintenance of the rented compressors. As of September 30, 2005, we had 756 natural gas compressors totaling 83,702 horsepower rented to 70 third parties, compared to 493 natural gas compressors totaling 55,120 horsepower rented to 51 third parties at September 30, 2004. Of the 756 natural gas compressors rented as of September 30, 2005, 97 were rented to Dominion Exploration & Production, Inc. and its affiliates.
We also fabricate natural gas compressors for sale to our customers, designing compressors to meet unique specifications dictated by well pressures, production characteristics and particular applications for which compression is sought. Fabrication of compressors involves the purchase by us of engines, compressors, coolers and other components, and then assembling these components on skids for delivery to customer locations. These major components of our compressors are acquired through periodic purchase orders placed with third-party suppliers on an “as needed” basis, which presently requires a three to four month lead time with delivery dates scheduled to coincide with our estimated production schedules. Although we do not have formal continuing supply contracts with any major supplier, we believe we have adequate alternative sources available. In the past, we have not experienced any sudden and dramatic increases in the prices of the major components for our compressors. However, the occurrence of such an event could have a material adverse effect on the results of our operations and financial condition, particularly if we were unable to increase our rental rates and sales prices proportionate to any such component price increases.
We also manufacture a proprietary line of compressor frames, cylinders and parts, known as our CiP(Cylinder-in-Plane) product line. We use finished CiP component products in the fabrication of compressor units for sale or rental by us or sell the finished component products to other compressor fabricators. We also design, fabricate, sell, install and service flare stacks and related ignition and control devices for onshore and offshore incineration of gas compounds such as hydrogen sulfide, carbon dioxide, natural gas and liquefied petroleum gases. To provide customer support for our compressor and flare sales businesses, we stock varying levels of replacement parts at our Midland, Texas facility and at field service locations. We also provide an exchange and rebuild program for screw compressors and maintain an inventory of new and used compressors to facilitate this business.
We provide service and maintenance to our customers under written maintenance contracts or on an as required basis in the absence of a service contract. Maintenance agreements typically have terms of six months to one year and require payment of a monthly fee.
27
Table of Contents
The following table sets forth our revenues from each of our three business segments for the periods presented:
| Year Ended | Nine Months Ended | |||||||||||||||||||
| December 31, | September 30, | |||||||||||||||||||
| 2002 | 2003 | 2004 | 2004 | 2005 | ||||||||||||||||
| (unaudited) | ||||||||||||||||||||
| (in thousands) | ||||||||||||||||||||
| Sales | $ | 4,336 | $ | 3,865 | $ | 3,593 | $ | 2,445 | $ | 22,066 | ||||||||||
| Service and maintenance | 1,563 | 1,773 | 1,874 | 1,370 | 1,770 | |||||||||||||||
| Rental | 4,398 | 7,112 | 10,491 | 7,405 | 11,696 | |||||||||||||||
| Total | $ | 10,297 | $ | 12,750 | $ | 15,958 | $ | 11,220 | $ | 35,532 | ||||||||||
On January 3, 2005, we completed the acquisition of Screw Compression Systems, Inc., or “SCS,” for consideration consisting of $8.0 million in cash, subordinated promissory notes payable by us to the former stockholders of SCS in the aggregate principal amount of $3.0 million, and 609,756 shares of our common stock. As a result of this acquisition, our results of operations for periods before and after the completion of the acquisition may not be comparable.
Historically, the majority of our revenues and income from operations has come from our compressor rental business. The acquisition of SCS, which is engaged primarily in the business of custom fabrication of compressors for sale to third parties, significantly altered the mix of our revenues, with compressor sales now contributing the largest percentage of our revenues. Margins for our rental business have recently averaged 60% to 65%, while margins for the compressor sales business have recently averaged approximately 20%. As a result of the SCS acquisition, therefore, our overall margins have declined in the first nine months of 2005 compared to prior periods because of the difference in our product mix. Our strategy for growth is focused on our compressor rental business, and we intend to use the additional fabrication capacity now available through SCS to expand our rental fleet while continuing SCS’s core custom fabrication business. As our rental business grows and contributes a larger percentage of our total revenues, we expect our overall margins to improve from those experienced in the first nine months of 2005.
The oil and gas equipment rental and services industry is cyclical in nature. The most critical factor in assessing the outlook for the industry is the worldwide supply and demand for natural gas and the corresponding changes in commodity prices. As demand and prices increase, oil and gas producers increase their capital expenditures for drilling, development and production activities. Generally, the increased capital expenditures ultimately result in greater revenues and profits for services and equipment companies.
In general, we expect our overall business activity and revenues to track the level of activity in the natural gas industry, with changes in domestic natural gas production and consumption levels and prices more significantly affecting our business than changes in crude oil and condensate production and consumption levels and prices. We also believe that demand for compression services and products is driven by declining reservoir pressure in maturing natural gas producing fields and, more recently, by increased focus by producers on non-conventional natural gas production, such as coalbed methane, gas shales and tight gas, which typically requires more compression than production from conventional natural gas reservoirs.
Demand for our products and services has been strong throughout 2004 and 2005. We believe demand will remain strong throughout 2006 due to high oil and gas prices and increased demand for natural gas. Because of these market fundamentals for natural gas, we believe the long-term trend of activity in our markets is favorable. However, these factors could be more than offset by other developments affecting the worldwide supply and demand for natural gas. Additionally, activity created by recent increases in the price of natural gas may make it difficult to meet the demands of our markets.
Our five-year rental and maintenance agreement with Dominion Exploration expired on December 31, 2005. Dominion Exploration accounted for approximately 21% and 10% of our consolidated revenues in the
28
Table of Contents
year ended December 31, 2004 and the nine months ended September 30, 2005, respectively. In August 2005, we were advised by Dominion Exploration that it would seek competing proposals from us as well as other third parties to continue the rental and maintenance services required for its northern Michigan operations. We submitted a bid to rent screw compressors to Dominion Exploration and to provide maintenance and service on certain screw compressors owned by Dominion Exploration. We also submitted a proposal to continue service and maintenance of reciprocating compressors owned by Dominion Exploration. In October 2005, we were advised by Dominion Exploration that we will retain the screw compressor rental, maintenance and service businesses, but that a third party was successful in bidding for the maintenance and service of Dominion Exploration’s reciprocating compressors. We estimate that the screw compressor rental, maintenance and service business we have retained from Dominion Exploration represented approximately 78% and 86% of our revenues from Dominion Exploration in the year ended December 31, 2004 and the nine months ended September 30, 2005, respectively.
For fiscal year 2006, our forecasted capital expenditures are approximately $27 to $32 million, primarily for additions to our compressor rental fleet. We believe that the proceeds of this offering, together with funds available to us under our bank credit facility and cash flows from operations will be sufficient to satisfy our capital and liquidity requirements through 2006. We may further require additional capital to fund any unanticipated expenditures, including any acquisitions of other businesses. Additional capital may not be available to us when we need it or on acceptable terms.
Results of Operations
Nine Months Ended September 30, 2005 Compared to the Nine Months Ended September 30, 2004
The table below shows our revenues, percentage of total revenues, gross profit and gross profit margin of each of our segments for the nine months ended September 30, 2005 and September 30, 2004. The gross profit margin is the ratio, expressed as a percentage, of gross profit, exclusive of depreciation, to total revenue.
| Revenue | Gross Profit | |||||||||||||||||||||||||||||||
| Nine Months Ended | Nine Months Ended | |||||||||||||||||||||||||||||||
| September 30, | September 30, | |||||||||||||||||||||||||||||||
| 2004 | 2005 | 2004 | 2005 | |||||||||||||||||||||||||||||
| unaudited | ||||||||||||||||||||||||||||||||
| (dollars in thousands) | ||||||||||||||||||||||||||||||||
| Sales | $ | 2,445 | 22% | $ | 22,066 | 62% | $ | 746 | 31% | $ | 5,089 | 23% | ||||||||||||||||||||
| Service and maintenance | 1,370 | 12% | 1,770 | 5% | 340 | 25% | 625 | 35% | ||||||||||||||||||||||||
| Rental | 7,405 | 66% | 11,696 | 33% | 5,231 | 71% | 7,157 | 61% | ||||||||||||||||||||||||
| Total | $ | 11,220 | $ | 35,532 | $ | 6,317 | 56% | $ | 12,871 | 36% | ||||||||||||||||||||||
Total revenue increased from approximately $11.2 million to $35.5 million, or 216.7%, for the nine months ended September 30, 2005, compared to the same period ended September 30, 2004. This was mainly the result of increased rental revenue and the addition of revenue from the acquisition of SCS.
Sales revenue increased from $2.4 million to $22.1 million, or 802.5%, for the nine months ended September 30, 2005, compared to the same period ended September 30, 2004. This increase was mainly the result of the sale of compressor units to outside third parties by SCS.
Service and maintenance revenue increased from approximately $1.4 million to $1.8 million, or 29.2%, for the nine months ended September 30, 2005, compared to the same period ended September 30, 2004. This was mainly the result of additional third party labor sales in our New Mexico area and Michigan branches.
Rental revenue increased from $7.4 million to $11.7 million, or 57.9%, for the nine months ended September 30, 2005, compared to the same period ended September 30, 2004. This increase was the result of units added to our rental fleet and rented to third parties. We ended the period with 805 compressor packages in our rental fleet, up from 586 units at December 31, 2004, and 533 units at September 30,
29
Table of Contents
2004. The average monthly rental rate per unit at September 30, 2005 was $2,015, as compared to $1,909 at September 30, 2004.
The overall gross margin percentage decreased to 36.0% for the nine months ended September 30, 2005, as compared to 56.0% for the same period ended September 30, 2004. This decrease resulted mainly from the relative increase in compressor sales revenue as a percentage of the total revenue. Our rental fleet carried a gross margin averaging 61.0% for the first nine months of 2005, and compressor and parts sales margins averaged 23.0%.
Selling, general and administrative expense increased from $2.0 million to $3.6 million or 80.2%, for the nine months ended September 30, 2005, as compared to the same period ended September 30, 2004. This was mainly the result of the increased expenses attributed to the acquisition of SCS. SCS accounted for $1.1 million of the total selling, general and administrative expenses for the nine months ended September 30, 2005.
Depreciation and amortization expense increased 72.8% from $1.8 million to $3.0 million for the nine months ended September 30, 2005, compared to the same period ended September 30, 2004. This increase was the result of 272 new gas compressor rental units being added to rental equipment from September 30, 2004 to September 30, 2005, thus increasing the depreciable base.
Other income decreased approximately $1.4 million for the nine months ended September 30, 2005, compared to the same period in 2004. This decrease was due mainly to the $1.5 million that was received in the nine months ended September 30, 2004 as life insurance proceeds from the death of our former Chief Executive Officer, offset by additional interest income from our money market accounts in 2005.
Interest expense increased to $1.4 million, or 148.1%, for the nine months ended September 30, 2005, compared to the same period ended September 30, 2004, mainly due to increased debt incurred to finance rental equipment additions, debt related to the acquisition of SCS and increased interest rates.
Provision for income tax increased to $1.8 million, or 132.1%, because taxable income increased after giving effect to the non-taxable life insurance proceeds received in 2004.
Year Ended December 31, 2004 Compared to the Year Ended December 31, 2003
The table below shows our revenues, percentage of total revenues, gross profit, exclusive of depreciation, and gross profit margin of each of our segments for the years ended December 31, 2003 and December 31, 2004.
| Revenue | Gross Profit | ||||||||||||||||||||||||||||||||
| Year Ended December 31, | Year Ended December 31, | ||||||||||||||||||||||||||||||||
| 2003 | 2004 | 2003 | 2004 | ||||||||||||||||||||||||||||||
| (dollars in thousands) | |||||||||||||||||||||||||||||||||
| Sales | $ | 3,865 | 30% | $ | 3,593 | 23% | $ | 1,005 | 26% | $ | 1,037 | 29% | |||||||||||||||||||||
| Service and maintenance | 1,773 | 14% | 1,874 | 11% | 530 | 30% | 517 | 28% | |||||||||||||||||||||||||
| Rental | 7,112 | 56% | 10,491 | 66% | 5,158 | 73% | 7,453 | 71% | |||||||||||||||||||||||||
| Total | $ | 12,750 | $ | 15,958 | $ | 6,693 | 53% | $ | 9,007 | 56% | |||||||||||||||||||||||
Total revenue increased from $12.8 million to $16.0 million, or 25.2%, for the twelve months ended December 31, 2004 compared to the same period ended December 31, 2003. This was mainly the result of increased rental income as discussed below.
Sales revenue decreased from $3.9 million to $3.6 million, or 7.0%, for the twelve months ended December 31, 2004 compared to the same period ended December 31, 2003. Sales included compressor unit sales, flare sales, parts sales and compressor rebuilds. This decrease was mainly the result of a reduction in the sale of compressor units to outside third parties. Because our products are custom-built, fluctuations in revenue from outside sources are not unusual and our focus has been more on building a rental base than on the sale of equipment.
30
Table of Contents
Service and maintenance revenue increased from $1.8 million to $1.9 million, or 5.7%, for the twelve months ended December 31, 2004 compared to the same period ended December 31, 2003. This was mainly the result of increased revenue from third party overhaul and maintenance labor billings.
Rental revenue increased from $7.1 million to $10.5 million, or 47.5%, for the twelve months ended December 31, 2004 compared to the same period ended December 31, 2003. This increase was the result of additional units added to our rental fleet and rented to third parties. We ended the 2004 year with 586 compressor packages in our rental fleet, up from 399 units at December 31, 2003.
The gross margin percentage increased from 52.5% for the twelve months ended December 31, 2003, to 56.4% for the same period ended December 31, 2004. This improvement resulted mainly from the relative increase in rental revenue as a percentage of the total revenue and improvement in rental gross margins.
Selling, general and administrative expenses increased from $2.3 million to $2.7 million, or 15.7%, for the twelve months ended December 31, 2004, as compared to the same period ended December 31, 2003. This was mainly the result of the increase in commissions from additional rental contracts on gas compressors to third parties, and an increase in professional fees related to regulatory filings and Sarbanes-Oxley compliance matters.
Depreciation and amortization expense increased 41.6% from $1.7 million to $2.4 million for the twelve months ended December 31, 2004, compared to the same period ended December 31, 2003. This increase was the result of 187 new gas compressor rental units being added to our rental fleet for the year.
Interest expense increased approximately $171,000, or 25.6%, for the twelve months ended December 31, 2004, compared to the same period ended December 31, 2003, mainly due to the increased debt incurred to finance vehicles and rental equipment.
Other income and expense increased approximately $1.4 million for the twelve months ended December 31, 2004, compared to the same period ended December 31, 2003. This increase was due mainly to the receipt of $1.5 million in life insurance proceeds payable in connection with the death of Mr. Wayne L. Vinson, our former Chief Executive Officer.
Provision for income tax increased approximately $443,000, or 63.6%, primarily due to the increase in net taxable income. The income from the life insurance proceeds described above is not subject to federal income tax.
For the year ended December 31, 2004, total preferred stock dividends of $53,000 were reflected in our net income attributable to common stockholders. Each holder of our 10.0% Convertible Series A Preferred Stock was entitled to receive cumulative dividends in preference to any dividend on the common stock at the rate of 10.0% of the liquidation value ($3.25 per share plus accrued and unpaid dividends) of the 10.0% Convertible Series A Preferred Stock. Dividends were payable in arrears thirty days after the end of each calendar quarter. As of March 31, 2004, all of the preferred stock had been converted into 1,177,000 shares of common stock.
Net income available to common stockholders for the year increased 180.0% mainly from increased rental activity and life insurance proceeds.
31
Table of Contents
Year Ended December 31, 2003 Compared to the Year Ended December 31, 2002
The table below shows our revenues, percentage of total revenues, gross profit, exclusive of depreciation, and gross profit margin of each of our segments for the years ended December 31, 2002 and December 31, 2003.
| Revenue | Gross Profit | ||||||||||||||||||||||||||||||||
| Year Ended December 31, | Year Ended December 31, | ||||||||||||||||||||||||||||||||
| 2002 | 2003 | 2002 | 2003 | ||||||||||||||||||||||||||||||
| (dollars in thousands) | |||||||||||||||||||||||||||||||||
| Sales | $ | 4,336 | 42% | $ | 3,865 | 30% | $ | 1,258 | 29% | $ | 1,005 | 26% | |||||||||||||||||||||
| Service and maintenance | 1,563 | 15% | 1,773 | 14% | 236 | 15% | 530 | 30% | |||||||||||||||||||||||||
| Rental | 4,398 | 43% | 7,112 | 56% | 3,231 | 73% | 5,158 | 73% | |||||||||||||||||||||||||
| Total | $ | 10,297 | $ | 12,750 | $ | 4,725 | 46% | $ | 6,693 | 52% | |||||||||||||||||||||||
Total revenue increased from $10.3 million to $12.7 million, or 23.8%, for the twelve months ended December 31, 2003 compared to the same period ended December 31, 2002. This was mainly the result of compressor units being added to our rental fleet as discussed below.
Sales revenue decreased from $4.3 million to $3.9 million, or 10.9%, for the twelve months ended December 31, 2003 compared to the same period ended December 31, 2002. Sales included compressor unit sales, flare sales, parts sales and compressor rebuilds. This decrease was mainly the result of a reduction in the sale of compressor units to third parties. Because our products are custom-built, fluctuations in revenue from outside sources are not unusual.
Service and maintenance revenue increased from $1.6 million to $1.8 million, or 13.4%, for the twelve months ended December 31, 2003 compared to the same period ended December 31, 2002. This was mainly the result of increased revenue from third party overhaul and maintenance labor billings.
Rental revenue increased from $4.4 million to $7.1 million, or 61.7%, for the twelve months ended December 31, 2003 compared to the same period ended December 31, 2002. This increase was the result of compressor units added to our rental fleet. From December 31, 2002 to December 31, 2003, we added 97 natural gas compressor units to our rental fleet, which included 28 units we purchased fromHy-Bon Rotary Compression LLC on March 31, 2003.
The gross margin percentage increased from 45.9% for the twelve months ended December 31, 2002, to 52.5% for the same period ended December 31, 2003. This improvement resulted mainly from the increase in rental revenue which has a higher gross profit margin and improvement in service and maintenance gross margins.
Selling, general and administrative expenses increased from $1.7 million to $2.3 million, or 33.4%, for the twelve months ended December 31, 2003, as compared to the same period ended December 31, 2002. This was mainly the result of the added expense associated with being a publicly held company such as legal fees, auditor fees and public relations fees.
Depreciation and amortization expense increased 48.0% from $1.2 million to $1.7 million for the twelve months ended December 31, 2003, compared to the same period ended December 31, 2002. This increase was the result of new gas compressor rental units being added to the rental fleet during the period.
Interest expense increased approximately $308,000, or 31.6%, for the twelve months ended December 31, 2003, compared to the same period ended December 31, 2002, mainly due to an increase in bank debt used to purchase equipment for the rental fleet and service vehicles.
Other income and expense increased approximately $23,000 for the twelve months ended December 31, 2003, compared to the same period ended December 31, 2002. This increase was due mainly to gains on the sale of assets.
32
Table of Contents
Provision for income tax increased approximately $113,000, or 19.3%, primarily due to the increase in net taxable income.
For the year ended December 31, 2003, total preferred stock dividends of $121,000 were reflected in our net income attributable to common stockholders. Each holder of our 10.0% Convertible Series A Preferred Stock was entitled to receive cumulative dividends in preference to any dividend on the common stock at the rate of 10.0% of the liquidation value ($3.25 per share plus accrued and unpaid dividends) of the 10.0% Convertible Series A Preferred Stock. Dividends were payable in arrears thirty days after the end of each calendar quarter.
Net income available to common stockholders for the year increased 74.7% mainly from the growth in our rental fleet activity.
Critical Accounting Policies and Practices
We have identified the policies below as critical to our business operations and the understanding of our results of operations. In the ordinary course of business, we have made a number of estimates and assumptions relating to the reporting of results of operations and financial condition in the preparation of our consolidated financial statements in conformity with accounting principles generally accepted in the United States. Actual results could differ significantly from those estimates under different assumptions and conditions. We believe that the following discussion addresses our most critical accounting policies, which are those that are most important to the portrayal of our financial condition and results of operations and require our most difficult, subjective, and complex judgments, often as a result of the need to make estimates about the effect of matters that are inherently uncertain.
Our critical accounting policies are as follows:
| • | revenue recognition; | |
| • | estimating the allowance for doubtful accounts; | |
| • | accounting for income taxes; | |
| • | valuation of long-lived and intangible assets and goodwill; and | |
| • | valuation of inventory |
| Revenue Recognition |
Revenue from the sales of custom and fabricated compressors, and flare systems is recognized upon shipment of the equipment to customers. Exchange and rebuild compressor revenue is recognized when both the replacement compressor has been delivered and the rebuild assessment has been completed. Revenue from compressor services is recognized upon providing services to the customer. Maintenance agreement revenue is recognized as services are rendered. Rental revenue is recognized over the terms of the respective rental agreements based upon the classification of the rental agreement. Deferred income represents payments received before a product is shipped.
| Allowance for Doubtful Accounts Receivable |
We perform ongoing credit evaluations of our customers and adjust credit limits based upon payment history and the customer’s current credit worthiness, as determined by our review of their current credit information. We continuously monitor collections and payments from our customers and maintain a provision for estimated credit losses based upon our historical experience and any specific customer collection issues that we have identified. While such credit losses have historically been within our expectations and the provisions established, we cannot guarantee that we will continue to experience the same credit loss rates that we have in the past. At December 31, 2004, approximately 22% of our accounts receivable were concentrated in two of our customers, Devon Energy Corporation and Pogo Producing Company. At September 30, 2005, Equipos y Sistemas Dinamicos Mexico, S.A. de C.V., or “ESDM”,
33
Table of Contents
and XTO Energy, Inc. accounted for approximately 46% and 21%, respectively, of our accounts receivable. We do not expect our accounts receivable from ESDM in 2006 to continue at or near the same percentage that ESDM accounted for at September 30, 2005. A significant change in the liquidity or financial position of either one of these customers could have a material adverse impact on the collectibility of our accounts receivables and our future operating results.
| Accounting for Income Taxes |
As part of the process of preparing our consolidated financial statements we are required to estimate our Federal income taxes as well as income taxes in each of the states in which we operate. This process involves us estimating our actual current tax exposure together with assessing temporary differences resulting from differing treatment of items for tax and accounting purposes. These differences result in deferred tax assets and liabilities, which are included in our consolidated balance sheet. We must then assess the likelihood that our deferred tax assets will be recovered from future taxable income and to the extent we believe that recovery is not probable, we must establish a valuation allowance. To the extent we establish a valuation allowance or increase this allowance in a period, we must include an expense in the tax provision in the statement of operations.
Significant management judgment is required in determining our provision for income taxes, our deferred tax assets and liabilities and any valuation allowance recorded against our net deferred tax assets.
| Valuation of Long-Lived and Intangible Assets and Goodwill |
We assess the impairment of identifiable intangibles, long-lived assets and related goodwill whenever events or changes in circumstances indicate that the carrying value may not be recoverable. Factors we consider important which could trigger an impairment review include the following:
| • | significant underperformance relative to expected historical or projected future operating results; | |
| • | significant changes in the manner of our use of the acquired assets or the strategy for our overall business; and | |
| • | significant negative industry or economic trends. |
When we determine that the carrying value of intangibles, long-lived assets and related goodwill may not be recoverable based upon the existence of one or more of the above indicators of impairment, we measure any impairment based on a projected discounted cash flow method using a discount rate determined by our management to be commensurate with the risk inherent in our current business model.
In 2002, Statement of Financial Accounting Standards (“FAS”) No. 142, “Goodwill and Other Intangible Assets” became effective and as a result, we ceased to amortize approximately $2.6 million of goodwill as of January 1, 2002. In lieu of amortization, we are required to perform an annual impairment review of our goodwill. Based upon valuations in June 2003, December 2004 and June 2005 of our reporting units with goodwill, we did not record an impairment charge during either year.
| Inventories |
We value our inventory at the lower of the actual cost to purchase and/or manufacture the inventory or the current estimated market value of the inventory. We regularly review inventory quantities on hand and record a provision for excess and obsolete inventory based primarily on our estimated forecast of product demand and production requirements.
Recently Issued Accounting Pronouncements
On December 16, 2004, the FASB published FASB Statement No. 123 (revised 2004),Share-Based Payment (“Statement 123(R)”), requiring that the compensation cost relating to share-based payment transactions be recognized in financial statements. That cost will be measured based on the fair value of the equity or liability instruments issued. We will be required to apply Statement 123(R) as of January 1,
34
Table of Contents
2006. Statement 123(R) replaces FASB Statement No. 123,Accounting for Stock-Based Compensation, and supersedes APB Opinion No. 25,Accounting for Stock Issued to Employees. Statement 123, as originally issued in 1995, established as preferable a fair-value-based method of accounting for share-based payment transactions with employees. However, that Statement permitted entities the option of continuing to apply the guidance in Opinion 25, as long as the footnotes to financial statements disclosed what net income would have been had the preferable fair-value-based method been used.
In November 2004, the FASB issued SFAS No 151,Inventory Costs — an Amendment of ARB No. 43, Chapter 4 (“SFAS 151”). This standard provides clarification that abnormal amounts of idle facility expense, freight, handling costs, and spoilage should be recognized as current-period charges. Additionally, this standard requires that allocation of fixed production overhead to the costs of conversion be based on the normal capacity of the production facilities. The provisions of this standard are effective for inventory costs incurred during fiscal years beginning after June 15, 2005. We do not expect the adoption of the new standard to have a material effect on our consolidated results of operations, cash flows or financial position.
Environmental Regulations
Various federal, state and local laws and regulations covering the discharge of materials into the environment, or otherwise relating to protection of human safety and health and the environment, affect our operations and costs. Compliance with these laws and regulations could cause us to incur remediation or other corrective action costs or result in the assessment of administrative, civil and criminal penalties and the issuance of injunctions delaying or prohibiting operations. In addition, we have acquired certain properties and plant facilities from third parties whose actions with respect to the management and disposal or release of hydrocarbons or other wastes were not under our control. Under environmental laws and regulations, we could be required to remove or remediate wastes disposed of or released by prior owners. In addition, we could be responsible under environmental laws and regulations for properties and plant facilities we lease, but do not own. Compliance with such laws and regulations increases our overall cost of business, but has not had a material adverse effect on our operations or financial condition. It is not anticipated, based on current laws and regulations, that we will be required in the near future to expend amounts that are material in relation to our total expenditure budget in order to comply with environmental laws and regulations but, such laws and regulations are frequently changed and we are unable to predict the ultimate cost of compliance. We also could incur costs related to the clean up of sites to which we send equipment and for damages to natural resources or other claims related to releases of regulated substances at such sites.
Liquidity and Capital Resources
Historically, we have funded our operations through public and private offerings of our equity securities, subordinated debt, bank borrowings and cash flow from operations. Proceeds of financings were primarily used to repay debt, to fund the manufacture and fabrication of additional units for our rental fleet of natural gas compressors and for acquisitions. At December 31, 2004, we had cash and cash equivalents of approximately $0.7 million, working capital of approximately $0.6 million, and total debt of approximately $13.6 million, of which approximately $4.3 million was classified as current. We had approximately $4.7 million of net cash flow from operating activities during the twelve months ending December 31, 2004. This was primarily from net income of approximately $3.4 million, plus depreciation and amortization of approximately $2.4 million and increases in deferred taxes of approximately $1.1 million, offset by an increase in accounts receivable and inventory of approximately $1.2 million and $1.9 million, respectively.
At September 30, 2005, we had cash and cash equivalents of approximately $5.7 million, working capital of $13.8 million and total debt of $28.0 million, of which approximately $4.1 million was classified as current. The subordinated debt is secured by letters of credit in the aggregate face amount of $2.0 million. We had positive net cash flow from operating activities of approximately $4.1 million during the first nine months of 2005. This was primarily from net income of $3.0 million, plus depreciation and
35
Table of Contents
amortization of $3.0 million, an increase in deferred taxes of $1.7 million, an increase in accounts payable and accrued liabilities of $4.1 million, a decrease in accounts receivable-trade of $2.1 million, offset by a decrease in deferred income of $723,000, and an increase in inventory of $5.3 million.
For the nine months ended September 30, 2005, we invested approximately $13.1 million in equipment for our rental fleet and in service vehicles. We financed this activity with bank debt and cash flow from operations. We borrowed approximately $20.8 million from our bank in the first nine months of 2005, which included $8.0 million to finance the acquisition of SCS. We also repaid $12.3 million of our existing debt during this period.
At December 31, 2005, we had cash and cash equivalents of approximately $3.3 million, working capital of $13.4 million and total debt of $28.2 million, of which approximately $6.0 million was classified as current. We had positive net cash flow from operating activities of approximately $3.8 million during the year ended December 31, 2005. This was primarily from net income of $4.4 million, plus depreciation and amortization of $4.2 million, an increase in deferred taxes of $2.4 million, an increase in accounts payable and accrued liabilities of $0.5 million, an increase in accounts receivable-trade of $1.4 million, offset by an increase in deferred income of $0.9 million, and an increase in inventory of $5.7 million.
We do not expect to pay federal income taxes for 2005 or 2006 because of our existing net operating loss carryforwards and the additional tax benefit anticipated due to book/tax differences on the depreciation of our rental fleet.
| Contractual Obligations and Commitments |
We have contractual obligations and commitments that affect our consolidated results of operations, financial condition and liquidity. The following table is a summary of our significant cash contractual obligations:
| Obligation Due in Period | |||||||||||||||||||||||||||||
| After | |||||||||||||||||||||||||||||
| Cash Contractual Obligations | 2005(1) | 2006 | 2007 | 2008 | 2009 | 5 Years | Total | ||||||||||||||||||||||
| (in thousands) | |||||||||||||||||||||||||||||
| Credit facility (secured) | $ | 1,166 | $ | 4,623 | $ | 4,623 | $ | 4,622 | $ | 4,623 | $ | 5,356 | $ | 25,013 | |||||||||||||||
| Interest on credit facility | 478 | 1,706 | 1,357 | 980 | 573 | 144 | 5,238 | ||||||||||||||||||||||
| Subordinated debt | — | 1,000 | 1,000 | 1,000 | — | — | 3,000 | ||||||||||||||||||||||
| Facilities and office leases | 52 | 146 | 129 | 62 | 29 | 134 | 552 | ||||||||||||||||||||||
| Purchase obligations | — | — | — | — | — | — | — | ||||||||||||||||||||||
| Total | $ | 1,696 | $ | 7,475 | $ | 7,109 | $ | 6,664 | $ | 5,225 | $ | 5,634 | $ | 33,803 | |||||||||||||||
| (1) | For the three months ended December 31, 2005. |
| Senior Bank Borrowings |
On January 5, 2006, we entered into a Sixth Amended and Restated Loan Agreement, or “Loan Agreement,” with Western National Bank, Midland, Texas. This Loan Agreement (1) continued and carried forward, without change, our previously existing advancing line of credit and term loan facilities, and (2) modified our revolving line of credit facility. Our revolving line of credit, term loan and advancing line of credit facilities are described below.
Revolving Line of Credit Facility. Our revolving line of credit facility allows us to borrow, repay and reborrow funds drawn under this facility. Before entering into the Sixth Amended and Restated Loan Agreement, the total amount that we could borrow and have outstanding at any one time was limited to the lesser of $2.0 million or the amount available for advances under a “borrowing base” calculation established by the bank. As of December 31, 2005, the amount available for revolving line of credit advances under our borrowing base was $1.7 million, and the principal amount outstanding under the
36
Table of Contents
revolving line of credit at the same date was $300,000. The amount of the borrowing base is based primarily upon our receivables, equipment and inventory. The borrowing base is redetermined by the bank on a monthly basis. If, as a result of the redetermination of the borrowing base, the aggregate outstanding principal amount of the notes payable to the bank under the Loan Agreement exceeds the borrowing base, we must first prepay the principal of the revolving line of credit note in an amount equal to such excess, and if the excess is not eliminated by the prepayment, we must then prepay the principal of the other notes payable under the Loan Agreement until the excess is eliminated. Interest only on borrowings under our revolving line of credit facility is payable monthly on the first day of each month. Loans made to us under the revolving line of credit bear interest at the prime rate plus 0.5%. As of December 31, 2005, our interest rate on the revolving line of credit was 7.75%. The outstanding principal balance and all unpaid interest on the revolving line of credit facility was originally due and payable on January 1, 2006. Upon entering into the Sixth Amended and Restated Loan Agreement, the revolving line of credit was renewed, the maturity was extended from January 1, 2006 to December 1, 2006, and the principal amount we are able to borrow under this revolving facility was increased from $2.0 million to $10.0 million, subject to borrowing base limitations. At February 14, 2006, we had available approximately $9.7 million of additional borrowing capacity under this facility.
$10.0 Million Multiple Advance Term Loan Facility. This multiple advance term loan facility allows us to request advances from time to time through March 14, 2006 in an aggregate amount not to exceed the lesser of $10.0 million or the amount available for advances under the borrowing base established by the bank. Reborrowings are not permitted under this facility. As of December 31, 2005, no additional amounts were available for advance under this facility, and the principal amount outstanding under this multiple term advance loan facility at December 31, 2005 was $10.0 million. Loans made to us under this facility bear interest at the greater of (1) the prime rate plus 0.5% or (2) 6.25%. As of December 31, 2005, our interest rate on the multiple advance term loan facility was 7.75%. Interest only under this credit facility is due and payable on the first day of each month commencing May 1, 2005 and continuing through April 1, 2006. Principal under this credit facility is due and payable in 59 monthly installments in an amount equal to1/60th of the outstanding principal balance on May 1, 2006 with a like installment due on the first day of each succeeding month through March 1, 2011, with interest on the unpaid principal balance being due and payable on the same dates as principal payments. All outstanding principal and unpaid interest is due on April 1, 2011.
Advancing Line of Credit Facility. This advancing line of credit facility allowed us to request advances in an aggregate amount not to exceed the lesser of $10.0 million or the amount available for advances under the borrowing base established by the bank. Reborrowings are not permitted under this facility. As of December 31, 2005, additional advances under this facility were not permitted. The principal amount outstanding under this facility at that same date was $7.9 million. Loans made to us under this facility bear interest at the greater of (1) the prime rate plus 0.5% or (2) 5.25%. As of December 31, 2005, our interest rate on this facility was 7.75%. Interest only under this credit facility was due and payable on the 15th day of each month commencing December 15, 2003 and continuing through November 15, 2004. Principal under this credit facility is due and payable in 59 monthly installments of $166,667 each, commencing December 15, 2004 and continuing through October 15, 2009. Principal payments also include payments of1/60th of the sum of all advances made between December 15, 2004 and December 15, 2005, such amounts calculated quarterly. Interest on the unpaid principal balance is due and payable on the same dates as principal payments. All outstanding principal and unpaid interest is due on November 15, 2009.
$8.0 Million Term Loan. This term loan is a traditional term loan facility. We may not request additional advances under this facility and reborrowings are not permitted. As of December 31, 2005, the principal amount outstanding under this term loan was $6.95 million. Loans made to us under this credit facility bear interest at the greater of (1) the prime rate plus 0.5% or (2) 6.0%. As of December 31, 2005, our interest rate on this term loan facility was 7.75%. Principal under this credit facility is due and payable in 84 monthly installments of $95,000 each, commencing February 1, 2005 and continuing through
37
Table of Contents
December 1, 2011. Interest on the unpaid principal balance is due and payable on the same dates as principal payments. All outstanding principal and unpaid interest is due on January 1, 2012.
During the nine months ended September 30, 2005, we paid the principal amount of three term loan facilities and other debt in the aggregate amount of approximately $12.3 million.
SCS has guaranteed payment of all of the above loans.
Our obligations under the Loan Agreement are secured by substantially all of our properties and assets, including our equipment, trade accounts receivable and other personal property, the stock we own in SCS, and by the real estate and related plant facilities owned by SCS.
The maturity dates of the loan facilities may be accelerated by the bank upon the occurrence of an event of default under the Loan Agreement.
The Loan Agreement contains various restrictive covenants and compliance requirements. These requirements provide that we must have:
| • | at the end of each month, a consolidated current ratio (as defined in the Loan Agreement) of at least 1.4 to 1.0; | |
| • | at the end of each month, consolidated tangible net worth (as defined in the Loan Agreement) of at least $14.5 million; | |
| • | at the end of each fiscal quarter, a debt service coverage ratio (as defined in the Loan Agreement) of at least 1.25 to 1.00; and | |
| • | at the end of each month, a ratio of consolidated debt to consolidated tangible net worth (as such terms are defined in the Loan Agreement) of less than 1.5 to 1.0. |
The Loan Agreement also contains restrictions on incurring additional debt and paying dividends.
As of December 31, 2005, we were in compliance with all material covenants in our Loan Agreement. A default under our bank credit facility could trigger the acceleration of our bank debt so that it is immediately due and payable. Such default would have a material adverse effect on our liquidity, financial position and operations.
| Subordinated Debt and Related Letters of Credit |
The principal amounts of the promissory notes issued to the three stockholders of SCS in the SCS acquisition are payable in three equal annual installments, commencing on January 3, 2006. Accrued and unpaid interest on the unpaid principal balance of the notes is payable on the same dates as, and in addition to, the installments of principal. Subject to the consent of the holder of each respective note, principal payments may be made by us in shares of our common stock valued at the average daily closing prices of the common stock on the American Stock Exchange for the twenty consecutive trading days commencing thirty trading days before the due date of the principal payment, or by combination of cash and shares of common stock. Under the terms of our Loan Agreement with our bank lender, we are prohibited from making payments on these notes if at the time of any such payment we are then in default under the Loan Agreement or if any such payment would cause or result in a default under the Loan Agreement.
To secure payment of these notes, our bank lender issued for our account three separate letters of credit for the benefit of the holders of the notes in the aggregate face amount of $2.0 million. The letters of credit expire February 3, 2008. Drafts for payment under the letters of credit may be made by the beneficiaries only upon our default in payment of the notes. If a draft for payment is not presented on or before February 3, 2007, the face amount of the letter of credit will automatically be reduced by one-half.
38
Table of Contents
Components of Our Principal Capital Expenditures
The table below sets out components of our principal capital expenditures for the three years ended December 31, 2005, along with the total budgeted for 2006, excluding acquisitions:
| Actual | ||||||||||||||||
| Budgeted 2006 | ||||||||||||||||
| Expenditure Category | 2003 | 2004 | 2005 | (excluding acquisitions) | ||||||||||||
| (unaudited) | ||||||||||||||||
| (in thousands) | ||||||||||||||||
| Rental equipment, vehicles and shop equipment | $ | 7,882 | $ | 11,596 | $ | 17,708 | $ | 27,000 to $32,000 | ||||||||
The level of our expenditures will vary in future periods depending on energy market conditions and other related economic factors. Based upon existing economic and market conditions, we believe that the proceeds from this offering, our operating cash flow and available bank borrowings will be sufficient to fully fund our net investing cash requirements for 2006. We also believe we have significant flexibility with respect to our financing alternatives and adjustment of our expenditure plans if circumstances warrant. When considered in relation to our total financial capacity, we do not have any material continuing commitments associated with expenditure plans related to our current operations.
Market Risk
We are exposed to market risk primarily from changes in interest rates.
We rely heavily upon debt financing provided by our bank lender. Most of these instruments contain interest provisions that are at least a one-half percentage point above the published prime rate. This creates a vulnerability to us relative to the movement of the prime rate. As the prime rate increases, our cost of funds will increase and affect our ability to obtain additional debt. We have not engaged in any hedging activities to offset these risks.
At December 31, 2005, we were exposed to interest rate fluctuations on approximately $25.2 million of bank borrowings carrying adjustable interest rates. A hypothetical one hundred basis point increase in interest rates for these notes payable would increase our annual interest expense by approximately $252,000. Due to the uncertainty of fluctuations in interest rates and the specific actions that might be taken by us to mitigate the impact of such fluctuations and their possible effects, the foregoing sensitivity analysis assumes no changes in our financial structure.
Off-Balance Sheet Arrangements
We do not participate in financial transactions, including guaranties of debt, that generate relationships with unconsolidated entities or financial partnerships. Such entities, often referred to as variable interest entities or special purpose entities, are generally established for the purpose of facilitating off-balance sheet arrangements or other contractually narrow or limited purposes. We were not involved in any unconsolidated financial transactions with variable interest or special purpose entities during any of the reporting periods in this prospectus and have no intention to participate in such transactions in the foreseeable future.
39
Table of Contents
BUSINESS AND PROPERTIES
The Company
We are a leading provider of small to medium horsepower compression equipment to the natural gas industry. We focus primarily on the non-conventional natural gas production business in the United States (such as coalbed methane, gas shales and tight gas), which, according to data from the Energy Information Administration, is the single largest and fastest growing segment of U.S. gas production. We manufacture, fabricate and rent natural gas compressors that enhance the production of natural gas wells and provide maintenance services for those compressors. In addition, we sell custom fabricated natural gas compressors to meet customer specifications dictated by well pressures, production characteristics and particular applications. We also manufacture and sell flare systems for oil and gas plant and production facilities.
The vast majority of our rental operations are in non-conventional natural gas regions which typically have lower initial reservoir pressures and faster well decline rates. These areas usually require compression to be installed sooner and with greater frequency.
Historically, the majority of our revenue has been derived from our compressor rental business. In January 2005, we acquired Screw Compression Systems, Inc., or “SCS,” which predominantly focuses on the custom fabrication sales business. By acquiring SCS, we increased our fabrication capacity by over 91,000 square feet. We intend to use this capacity to expand our rental fleet while continuing SCS’ core business of custom fabrication.
Natural gas compressors are used in a number of applications for the production and enhancement of gas wells and in gas transportation lines and processing plants. Compression equipment is often required to boost a gas well’s production to economically viable levels and enable gas to continue to flow in the pipeline to its destination. We believe that most producing gas wells in North America, at some point, will utilize compression. The World Oil Magazine reported that, as of December 31, 2004, there were approximately 395,000 producing gas wells in the United States. The states of New Mexico, Texas, Michigan, Colorado, Wyoming, Utah, Oklahoma, Pennsylvania, West Virginia and Kansas, our present areas of operation, account for approximately 297,000 of these wells.
We were incorporated in Colorado on December 17, 1998 and initially operated through wholly or partly owned subsidiaries, all of which have either been merged into us or dissolved. However, a portion of our operations are currently conducted through SCS.
As a part of our rental business, in 2000 we and another third party formedHy-Bon Rotary Compression LLC, or “HBRC”, for the purpose of renting natural gas compressors. Although we each owned a 50% interest in HBRC, profits realized by HBRC were shared by us in proportion to amounts received by HBRC from the lease of natural gas compressors that were contributed to HBRC by us and by the third party. We contributed 40 compressors and the third party contributed 28 compressors to HBRC. Effective January 1, 2003, HBRC sold to us the 28 compressor packages contributed by the third party for the cash purchase price of $2.2 million and we retained all of HBRC’s assets upon the other party’s withdrawal from HBRC. In March 2001, we acquired, through one of our former subsidiaries, all of the compression related assets of Dominion Michigan Petroleum Services, Inc., an unaffiliated subsidiary of Dominion Resources, Inc., that was in the business of manufacturing, fabricating, selling, renting and maintaining natural gas compressors.
We maintain our principal offices at 2911 South County Road 1260, Midland, Texas 79706 and our telephone number is (432) 563-3974. Our website is located athttp://www.ngsgi.com. The information on or that can be accessed through our website is not part of this prospectus.
Industry Trends
Natural gas prices historically have been volatile, and this volatility is expected to continue. Uncertainty continues to exist as to the direction of future United States and worldwide natural gas and
40
Table of Contents
crude oil price trends. In our opinion, overall natural gas production in the United States is declining, and the increasing recognition of natural gas as a more environmentally friendly source of energy is likely to result in increases in demand. Being primarily a provider of services and equipment to natural gas producers, we are more significantly impacted by changes in natural gas prices than by changes in crude oil and condensate prices. Longer term natural gas prices will be determined by the supply and demand for natural gas as well as the prices of competing fuels, such as oil and coal.
We believe part of the growth of the rental compression capacity in the U.S. market has been driven by the trend toward outsourcing by energy producers and processors. Renting does not require the purchaser to make large capital expenditures for new equipment or to obtain financing through a lending institution. This allows the customer’s capital to be used for additional exploration and production of natural gas and oil.
We believe that there will continue to be a growing demand for natural gas. We expect demand for our products and services to continue to rise as a result of:
| • | the increasing demand for and limited supply of energy, both domestically and abroad; | |
| • | continued non-conventional gas exploration and production; | |
| • | environmental considerations which provide strong incentives to use natural gas in place of other carbon fuels; | |
| • | the cost savings of using natural gas rather than electricity for heat generation; | |
| • | implementation of international environmental and conservation laws; | |
| • | the aging of producing natural gas reserves worldwide; and | |
| • | the extensive supply of undeveloped natural gas reserves. |
Our Operating Units
Gas Compressor Rental. Our rental business is primarily focused on non-conventional gas production. We provide rental of small to medium horsepower compression equipment to customers via contracts typically having minimum initial terms of six to 24 months. Historically, in our experience, most customers retain the equipment beyond the expiration of the initial term. By outsourcing their compression needs, we believe our customers are able to increase their revenues by producing a higher volume of natural gas due to greater equipment run-time. Outsourcing also allows our customers to reduce their compressor downtime, operating and maintenance costs and capital investments and more efficiently meet their changing compression needs. As of December 31, 2005, approximately 94.8% of our rental fleet was utilized. In 2006, we intend to increase the number of units in our rental fleet by 30% to 40%.
The size, type and geographic diversity of our rental fleet enables us to provide our customers with a range of compression units that can serve a wide variety of applications, and to select the correct equipment for the job, rather than the customer trying to fit the job to its own equipment. We base our gas compressor rental rates on several factors, including the cost and size of the equipment, the type and complexity of service desired by the customer, the length of contract and the inclusion of any other services desired, such as rental, installation, transportation and daily operation.
As of December 31, 2005, we had 865 natural gas compressors totaling approximately 97,275 horsepower rented to 75 third parties, compared to 586 natural gas compressors totaling approximately 64,928 horsepower rented to 54 third parties at December 31, 2004. Of the 865 natural gas compressors, 97 were rented to Dominion Exploration and its affiliates.
Engineered Equipment Sales
| • | Compression fabrication. Fabrication involves the assembly of compressor components manufactured by us or other third parties into compressor units that are ready for rental or sale. In addition |
41
Table of Contents
| to fabricating compressors for our rental fleet, we engineer and fabricate natural gas compressors for sale to customers to meet their specifications based on well pressure, production characteristics and the particular applications for which compression is sought. | ||
| • | Compressor manufacturing. We design and manufacture our own proprietary line of reciprocating compressor frames, cylinders and parts known as our “CiP”, orCylinder-in-Plane, product line. We use the finished components to fabricate compressor units for our rental fleet or for sale to third parties. We also sell finished components to other fabricators. | |
| • | Flare fabrication. We design, fabricate, sell, install and service flare stacks and related ignition and control devices for the onshore and offshore incineration of gas compounds such as hydrogen sulfide, carbon dioxide, natural gas and liquefied petroleum gases. Applications for this equipment are often environmentally and regulatory driven, and we believe we are a leading supplier to this market. | |
| • | Parts sales and compressor rebuilds. To provide customer support for our compressor and flare sales businesses, we stock varying levels of replacement parts at our Midland, Texas facility and at field service locations. We also provide an exchange and rebuild program for screw compressors and maintain an inventory of new and used compressors to facilitate this part of our business. |
Service and Maintenance. We service and maintain compressors owned by our customers on an “as needed” basis. Natural gas compressors require routine maintenance and periodic refurbishing to prolong their useful life. Routine maintenance includes physical and visual inspections and other parametric checks that indicate a change in the condition of the compressors. We perform wear-particle analysis on all packages and perform overhauls on a condition-based interval or a time-based schedule. Based on our past experience, these maintenance procedures maximize component life and unit availability and minimize downtime.
Business Strategy
We intend to grow our revenue and profitability by pursuing the following business strategies:
| • | Expand rental fleet. With a portion of the proceeds from this offering and using the additional fabrication capacity gained with the SCS acquisition, we intend to increase our market share by expanding our rental fleet 30% to 40% by the end of 2006. We believe our growth will continue to be primarily driven through our placement of small to medium horsepower wellhead natural gas compressors for non-conventional natural gas production, which is the single largest and fastest growing segment of U.S. natural gas production business according to data from the Energy Information Administration. As of December 31, 2005, we had 820 natural gas compressors rented to third parties. | |
| • | Operational expansion. With the planned increase in our rental fleet, we intend to expand our operations in existing areas, as well as pursue focused expansion into new geographic regions. We have recently entered new markets in Appalachia and the Rocky Mountains. | |
| • | Expand CiP(Cylinder-in-Plane) product line. The CiP, orCylinder-in-Plane, is our proprietary reciprocating compressor product line. This product line has allowed us to expand our compressor rentals and sales into higher pressure natural gas gathering and transmission lines. We intend to establish new distributorship relationships and after-market sales and services networks. | |
| • | Selectively pursue acquisitions. We intend to evaluate potential acquisitions that would provide us with access to new markets or enhance our current market position. |
42
Table of Contents
Competitive Strengths
We believe we are well positioned to execute our business strategy because of the following competitive strengths:
| • | Superior customer service. Our emphasis on the small to medium horsepower markets has enabled us to effectively meet the evolving needs of our customers. We believe these markets have been under-serviced by our larger competitors which, coupled with our personalized services and in-depth knowledge of our customers’ operating needs and growth plans, have allowed us to enhance our relationships with existing customers as well as attract new customers. The size, type and geographic diversity of our rental fleet enables us to provide customers with a range of compression units that can serve a wide variety of applications. We are able to select the correct equipment for the job, rather than the customer trying to fit its application to our equipment. | |
| • | Diversified product line. Our compressors are available as high and low pressure rotary screw and reciprocating packages. They are designed to meet a number of applications, including wellhead production, natural gas gathering, natural gas transmission, vapor recovery and gas and plunger lift. In addition, our compressors can be built to handle a variety of gas mixtures, including air, nitrogen, carbon dioxide, hydrogen sulfide and hydrocarbon gases. A diversified product line helps us compete by being able to satisfy widely varying pressure, volume and production conditions that customers encounter. | |
| • | Purpose built rental compressors. Our rental compressor packages have been designed and built to address the primary requirements of our customers in the producing regions in which we operate. Our units are compact in design and are easy, quick and inexpensive to move, install andstart-up. Our control systems are technically advanced and allow the operator to start and stop our units remotely and/or in accordance with well conditions. We believe our rental fleet is also one of the newest with an average age of less than three years old. | |
| • | Experienced management team. On average, our executive and operating management team has over 20 years of oilfield services industry experience. We believe our management team has successfully demonstrated its ability to grow our business both organically and through selective acquisitions. | |
| • | Broad geographic presence. We presently provide our products and services to a customer base of oil and natural gas exploration and production companies operating in New Mexico, Texas, Michigan, Colorado, Wyoming, Utah, Oklahoma, Pennsylvania, West Virginia and Kansas. Our footprint allows us to service many of the natural gas producing regions in the United States. We believe that operating in diverse geographic regions allows us better utilization of our compressors, minimal incremental expenses, operating synergies, volume-based purchasing, leveraged inventories and cross-trained personnel. | |
| • | Long-standing customer relationships. We have developed long-standing relationships providing compression equipment to many major and independent oil and natural gas companies. Our customers generally continue to rent our compressors after the expiration of the initial terms of our rental agreements, which we believe reflects their satisfaction with the reliability and performance of our services and products. |
Major Customers
During the nine-month period ended September 30, 2005, revenues from Dominion Exploration & Production, Inc. and XTO Energy, Inc. amounted to approximately 10% and 31%, respectively, of consolidated revenue. No other single customer accounted for more than approximately 10% of our consolidated revenues during the nine-month period ended September 30, 2005. Sales to Dominion Exploration & Production, Inc. and Devon Energy Corporation during the year ended December 31, 2004 amounted to a total of approximately 21% and 17%, respectively, of consolidated revenue. During the year ended December 31, 2003, sales to Dominion Exploration amounted to approximately 28% of consolidated
43
Table of Contents
revenue and sales to Devon Energy Corporation amounted to approximately 10% of consolidated revenue. No other single customer accounted for more than 10% of our revenues in 2003 or 2004. At December 31, 2004, Devon Energy Corporation and Pogo Producing Company accounted for approximately 12% and 10%, respectively, of our trade accounts receivable. At September 30, 2005, ESDM accounted for approximately 46% of our trade accounts receivable and XTO Energy, Inc. accounted for approximately 21% of our trade accounts receivable. The loss of any one or more of the above customers could have a material adverse effect on our business, consolidated financial condition, results of operations and cash flows, depending upon the demand for our compressors at the time of such loss and our ability to attract new customers. Our top six customers accounted for approximately 87% of our trade accounts receivable at September 30, 2005.
Sales and Marketing
Our salespeople pursue the rental and sales market for compressors and flare equipment and other services in their respective territories. Additionally, our personnel coordinate with each other to develop relationships with customers who operate in multiple regions. Our sales and marketing strategy is focused on communication with current customers and potential customers through frequent direct contact, technical assistance, print literature, direct mail and referrals. Our sales and marketing personnel coordinate with our operations personnel in order to promptly respond to and address customer needs. Our overall sales and marketing efforts concentrate on demonstrating our commitment to enhancing the customer’s cash flow through enhanced product design, fabrication, manufacturing, installation, customer service and support.
Competition
We have a number of competitors in the natural gas compression segment, some of which have greater financial resources. We believe that we compete effectively on the basis of price; customer service, including the ability to place personnel in remote locations; flexibility in meeting customer needs; and quality and reliability of our compressors and related services.
Compressor industry participants can achieve significant advantages through increased size and geographic breadth. As the number of rental compressors in our rental fleet increases, the number of sales, support, and maintenance personnel required and the minimum level of inventory does not increase commensurately.
Backlog
As of December 31, 2005, we had a sales backlog of approximately $27.5 million. We expect to fulfill substantially all of this backlog in 2006. Sales backlog consists of firm customer orders for which a purchase or work order has been received, satisfactory credit or a financing arrangement exists, and delivery is scheduled. Our backlog has increased over the past year as a result of higher activity levels and longer supplier delivery schedules. There can be no assurance, however, that the orders representing such backlog will not be cancelled.
Employees
As of December 31, 2005, we had 236 total employees. No employees are represented by a labor union, and we believe we have good relations with our employees.
Liability and Other Insurance Coverage
Our equipment and services are provided to customers who are subject to hazards inherent in the oil and gas industry, such as blowouts, explosions, craterings, fires and oil spills. We maintain liability insurance that we believe is customary in the industry. We also maintain insurance with respect to our facilities. Based on our historical experience, we believe that our insurance coverage is adequate. However, there is a risk that our insurance may not be sufficient to cover any particular loss or that insurance may
44
Table of Contents
not cover all losses. In addition, insurance rates have in the past been subject to wide fluctuation, and changes in coverage could result in less coverage, increases in cost or higher deductibles and retentions.
Government Regulation
All of our operations and facilities are subject to numerous federal, state, foreign and local laws, rules and regulations related to various aspects of our business, including containment and disposal of hazardous materials, oilfield waste, other waste materials and acids.
To date, we have not been required to expend significant resources in order to satisfy applicable environmental laws and regulations. We do not anticipate any material capital expenditures for environmental control facilities or extraordinary expenditures to comply with environmental rules and regulations in the foreseeable future. However, compliance costs under existing laws or under any new requirements could become material and we could incur liabilities for noncompliance.
Our business is generally affected by political developments and by federal, state, foreign and local laws and regulations which relate to the oil and natural gas industry. The adoption of laws and regulations affecting the oil and natural gas industry for economic, environmental and other policy reasons could increase our costs and could have an adverse effect on our operations. The state and federal environmental laws and regulations that currently apply to our operations could become more stringent in the future.
We have utilized operating and disposal practices that were or are currently standard in the industry. However, materials such as solvents, thinner, waste paint, waste oil, washdown waters and sandblast material may have been disposed of or released in or under properties currently or formerly owned or operated by us or our predecessors. In addition, some of these properties have been operated by third parties over whom we have no control either as to such entities’ treatment of materials or the manner in which such materials may have been disposed of or released.
The federal Comprehensive Environmental Response Compensation and Liability Act of 1980, commonly known as CERCLA, and comparable state statutes impose strict liability on:
| • | owners and operators of sites, | |
| • | persons who disposed of or arranged for the disposal of “hazardous substances” found at sites. |
The federal Resource Conservation and Recovery Act and comparable state statutes govern the disposal of “hazardous wastes.” Although CERCLA currently excludes certain materials from the definition of “hazardous substances,” and the Resource Conservation and Recovery Act also excludes certain materials from regulation, such exemptions by Congress under both CERCLA and the Resource Conservation and Recovery Act may be deleted, limited or modified in the future. We could become subject to requirements to remove and remediate previously disposed of materials (including materials disposed of or released by prior owners or operators) from properties.
The Federal Water Pollution Control Act and the Oil Pollution Act of 1990 and implementing regulations govern:
| • | the prevention of discharges, including oil and produced water spills, and | |
| • | liability for drainage into waters. |
Our operations are also subject to federal, state, and local regulations for the control of air emissions. The federal Clean Air Act and various state and local laws impose on us certain air quality requirements. Amendments to the Clean Air Act revised the definition of “major source” such that emissions from both wellhead and associated equipment involved in oil and natural gas production may be added to determine if a source is a “major source”. As a consequence, more facilities may become major sources and thus may require us to make increased compliance expenditures.
We believe that our existing environmental control procedures are adequate and that we are in substantial compliance with environmental laws and regulations, and the phasing in of emission controls
45
Table of Contents
and other known regulatory requirements should not have a material adverse affect on our financial condition or operational results. However, it is possible that future developments, such as new or increasingly strict requirements and environmental laws and enforcement policies thereunder, could lead to material costs of environmental compliance by us. While we may be able to pass on the additional cost of complying with such laws to our customers, there can be no assurance that attempts to do so will be successful. Some risk of environmental liability and other costs are inherent in the nature of our business, however, and there can be no assurance that environmental costs will not rise.
Patents, Trademarks and Other Intellectual Property
We believe that the success of our business depends more on the technical competence, creativity and marketing abilities of our employees than on any individual patent, trademark, or copyright. Nevertheless, as part of our ongoing research, development and manufacturing activities, we may seek patents when appropriate on inventions concerning new products and product improvements. We currently own two United States patents covering certain flare system technologies, which expire in May 2006 and in January 2010, respectively. We do not own any foreign patents. Although we continue to use the patented technology and consider it useful in certain applications, we do not consider these patents to be material to our business as a whole.
Suppliers and Raw Materials
Fabrication of our rental compressors involves the purchase by us of engines, compressors, coolers and other components, and the assembly of these components on skids for delivery to customer locations. These major components of our compressors are acquired through periodic purchase orders placed with third-party suppliers on an “as needed” basis, which typically requires a three to four month lead time with delivery dates scheduled to coincide with our estimated production schedules. Although we do not have formal continuing supply contracts with any major supplier, we believe we have adequate alternative sources available. In the past, we have not experienced any sudden and dramatic increases in the prices of the major components for our compressors. However, the occurrence of such an event could have a material adverse effect on the results of our operations and financial condition, particularly if we were unable to increase our rental rates and sales prices proportionate to any such component price increases.
46
Table of Contents
Executive Offices and Manufacturing and Fabrication Facilities
The table below describes the material facilities owned or leased by Natural Gas Services Group and SCS as of February 1, 2006:
| Square | ||||||||||
| Location | Status | Feet | Uses | |||||||
| Tulsa, Oklahoma | Owned and Leased | 91,780 | (1) | Executive offices of SCS and compressor fabrication, manufacturing, rental and services | ||||||
| Midland, Texas | Owned | 24,600 | Compressor fabrication, rental and services | |||||||
| Lewiston, Michigan | Owned | 15,360 | Compressor fabrication, rental and services | |||||||
| Bridgeport, Texas | Leased | 4,500 | Office and parts and services | |||||||
| Midland, Texas | Owned | 4,100 | Executive offices and parts and services | |||||||
| Bloomfield, New Mexico | Leased | 4,672 | Office and parts and services | |||||||
| 145,012 | ||||||||||
| (1) | Includes 52,780 square feet owned by SCS on which its executive offices are located and on which compressor fabrication, rental and service operations are conducted; 19,500 square feet leased by SCS for manufacturing CiP compressors; and 19,500 square feet leased by SCS for compressor fabrication. |
We believe that our properties are generally well maintained and in good condition and adequate for our purposes.
Legal Proceedings
We are currently a defendant in a lawsuit, Karifico v. Natural Gas Services Group, Inc., filed on September 21, 2005 in District Court, Jefferson County, Colorado, Case No. 05 CV 3161. The lawsuit is in the nature of a complaint for breach of contract and for money for services rendered. According to the complaint filed by Karifico, under terms of an agreement dated November 3, 2003 between Karifico and us, Karifico was retained by us to “find a company for sale that Defendant could purchase if it fit into its financial and operational plans.” Karifico claims that it is entitled to a fee in the amount of $300,000 as the result of our acquisition of Screw Compression Systems, Inc. We have paid $150,000 to Karifico and Karifico seeks the additional sum of $150,000, together with interest and costs, and has alleged further damages in an unspecified amount. We believe that we have valid defenses to Karifico’s claims and that our potential liability, if any, with respect to this matter is not material in the aggregate to our financial position, results of operations or cash flows. Accordingly, we have not established a reserve for loss in connection with this proceeding. Subject to the entry of a final order to be approved by the Court, we have agreed with Karifico to the dismissal of the lawsuit without liability to either party, except that each party will pay its own expenses associated with the lawsuit.
From time to time, we are a party to various other legal proceedings in the ordinary course of our business. While management is unable to predict the ultimate outcome of these actions, it believes that any ultimate liability arising from these actions will not have a material adverse effect on our consolidated financial position, results of operations or cash flow. Except as discussed herein, we are not currently a party to any other material legal proceedings and we are not aware of any other threatened litigation.
47
Table of Contents
MANAGEMENT
Executive Officers and Directors
Our executive officers and Directors are:
| Name | Age | Position | ||||
| Stephen C. Taylor | 52 | Chairman, President and Chief Executive Officer | ||||
| Earl R. Wait | 62 | Vice President — Accounting and Treasurer | ||||
| Paul D. Hensley | 53 | Director, President of SCS | ||||
| S. Craig Rogers | 43 | Vice President — Operations | ||||
| William R. Larkin | 40 | Vice President — Sales and Marketing | ||||
| James R. Hazlett | 50 | Vice President — Technical Services | ||||
| Ronald D. Bingham | 61 | Vice President — Northern Operations | ||||
| Scott W. Sparkman | 44 | Secretary and Assistant Treasurer | ||||
Charles G. Curtis(1)(2)(3) | 72 | Director | ||||
William F. Hughes, Jr.(1)(2)(3) | 53 | Director | ||||
Gene A. Strasheim(1)(2)(3) | 65 | Director | ||||
Richard L. Yadon(1)(2)(3) | 47 | Director | ||||
| (1) | Member of our audit committee |
| (2) | Member of our compensation committee |
| (3) | Member of our nominating committee |
Stephen C. Taylor was elected by the Board of Directors of Natural Gas Services Group to assume the position of President and Chief Executive Officer in January, 2005. Mr. Taylor was elected as a Director at the annual meeting of stockholders in June 2005. Effective January 1, 2006, Mr. Taylor was appointed Chairman of the Board of Directors. Immediately prior to joining Natural Gas Services Group, Mr. Taylor held the position of General Manager — US Operations for Trican Production Services, Inc. from 2002 through 2004. Mr. Taylor joined Halliburton Resource Management in 1976, becoming its Vice President — Operations in 1989. Beginning in 1993, he held multiple senior level management positions with Halliburton Energy Services until 2000 when he was elected Senior Vice President/ Chief Operating Officer of Enventure Global Technology, LLC, a joint-venture deep water drilling technology company owned by Halliburton Company and Shell Oil Company. Mr. Taylor elected early retirement from Halliburton Company in 2002 to join Trican Production Services, Inc. Mr. Taylor holds a Bachelor of Science degree in Mechanical Engineering from Texas Tech University and a Master of Business Administration degree from the University of Texas at Austin.
Earl R. Wait became Vice President — Accounting in January 2006. He served as our Chief Financial Officer from May 2000 to January 2006. He has also served as our Treasurer since 1998. Mr. Wait was our Chief Accounting Officer from 1998 to May 2000. During the period from 1993 to 2003, he also served as an officer or director of our former subsidiaries. Mr. Wait is a certified public accountant, has a Bachelor of Business Administration degree from Texas A&M University — Kingsville and holds a Master of Business Administration degree from Texas A&M University — Corpus Christi and has more than 25 years of experience in the energy industry.
Paul D. Hensley was appointed as a Director of Natural Gas Services Group in January, 2005 to fill a vacancy on the Board of Directors and was elected as a Director at the annual meeting of stockholders held in June 2005. He founded SCS in 1997 and is the president and a director of SCS. Mr. Hensley has over 30 years of industry experience.
S. Craig Rogers has served as Vice President — Operations since June 2003. He served as Operations Manager for a former subsidiary from 1995 to December 31, 2003, and Vice President of a former
48
Table of Contents
subsidiary from April 2002 to December 31, 2003. From March 1987 to January 1995, Mr. Rogers was the Shop Manager for Compressor Systems, Inc., a major manufacturer of natural gas compressors. Mr. Rogers has over 25 years of industry experience.
William R. Larkin has served as Vice President — Sales and Marketing since June 2004. He held various positions with Compressor Systems, Inc. from 1993 until his employment with Natural Gas Services Group. Mr. Larkin’s positions with Compressor Systems, Inc. included those of Business Unit Manager, Manager of Engineering, Asset Manager and Regional Sales Manager. Mr. Larkin holds a Bachelor of Science degree in Mechanical Engineering from the University of Texas at Austin and has over 19 years of industry experience.
James R. Hazlett has served as Vice President — Technical Services since June 2005. Mr. Hazlett has served as vice president of sales for Screw Compression Systems, Inc. since 1997, a position he continues to hold. Mr. Hazlett holds an Industrial Engineering degree from Texas A&M University and has over 27 years of industry experience.
Ronald D. Bingham has served as Vice President — Northern Operations since December 2003 and was the President of Great Lakes Compression from 2001 to December 31, 2003. From March 2001 to July 2001, Mr. Bingham was the General Manager of Great Lakes Compression. From January 1989 to March 2001, Mr. Bingham was the District Manager for Waukesha Pearce Industries, Inc., a distributor of Waukesha natural gas engines. Mr. Bingham holds a Bachelor of Arts degree from Sam Houston State University and has over 29 years of industry experience.
Scott W. Sparkman has served as Secretary and Assistant Treasurer since December 1998. Between 1998 and 2003, Mr. Sparkman held various positions as an officer and as a director of two former subsidiaries of Natural Gas Services Group. He also served as a Director of Natural Gas Services Group from 1998 to 2003. Mr. Sparkman holds a Bachelor of Business Administration degree from Texas A&M University and a Master of Business Administration degree from West Texas A&M University. Mr. Sparkman is the son of Wallace C. Sparkman, the former Chairman of the Board of Directors of Natural Gas Services Group, Inc. until his retirement in December 2005.
Charles G. Curtis has served as a Director since April 2001. Since 2002, substantially all of Mr. Curtis’ business activities have been devoted to managing personal investments. From 1992 until 2002, Mr. Curtis was the President and Chief Executive Officer of Curtis One, Inc., a manufacturer of aluminum and steel mobile stools and mobile ladders. From 1988 to 1992, Mr. Curtis was the President and Chief Executive Officer of Cramer, Inc. a manufacturer of office furniture. Mr. Curtis holds a Bachelor of Science degree from the United States Naval Academy and a Master of Science in Aeronautical Engineering degree from the University of Southern California.
William F. Hughes, Jr. has served as a Director since December 2003. Since 1983, Mr. Hughes has been co-owner of The Whole Wheatery, LLC, a natural foods store located in Lancaster, California. Mr. Hughes holds a Bachelor of Science degree in Civil Engineering from the United States Air Force Academy and a Master of Science in Engineering from the University of California at Los Angeles.
Gene A. Strasheim has served as a Director since 2003. Since 2001, Mr. Strasheim has been a financial consultant to Skyline Electronics/ Products, a manufacturer of circuit boards and large remotely controlled digital interstate highway signs. From 1992 to 2001, Mr. Strasheim was the Chief Financial Officer of Skyline Electronics/ Products. From 1985 to 1992, Mr. Strasheim was the Vice President — Finance and Treasurer of CF&I Steel Corporation. Prior to that, Mr. Strasheim was the Vice President — Finance for two companies and was a partner with the public accounting firm of Deloitte Haskins & Sells. Mr. Strasheim has practiced as a certified public accountant in three states. Mr. Strasheim holds a Bachelor degree in Business from the University of Wyoming.
Richard L. Yadon has served as a Director since 2003. Mr. Yadon is one of the founders of Rotary Gas Systems, Inc., a former subsidiary of Natural Gas Services Group, and served as an advisor to the Board of Directors of Natural Gas Services Group from June 2002 to June 2003. Since 1981, Mr. Yadon has owned and operated Yadeco Pipe & Equipment. Since December 1994, he has co-owned and served
49
Table of Contents
as President of Midland Pipe & Equipment, Inc. Both companies are engaged in the business of providing oil and gas well drilling and completion services and equipment to oil and gas producers conducting operations in Texas, New Mexico, Louisiana and Oklahoma. Since 1981, he has owned Yadon Properties, which owns and operates real estate in Midland, Texas. Mr. Yadon has 22 years of experience in the energy service industry.
Board of Directors
The Board of Directors is divided into three classes with directors serving staggered three-year terms. Mr. Hughes’ term expires in 2006; the terms of Messrs. Hensley and Yadon expire in 2007; and the terms of Messrs. Curtis, Strasheim and Taylor expire in 2008.
Audit Committee
Our Audit Committee is composed of Gene A. Strasheim (Chairman), Charles G. Curtis, William F. Hughes, Jr., and Richard L. Yadon. Under rules of the American Stock Exchange, the Audit Committee is to be comprised of three or more directors, each of whom must be “independent”. Our Board has determined that all of the members of the Audit Committee are independent, as defined in the listing standards of AMEX and the rules of the SEC, and that Gene A. Strasheim is qualified as an “audit committee financial expert” as that term is defined in the rules of the SEC.
The functions of the Audit Committee include:
| • | assisting the Board in fulfilling its oversight responsibilities as they relate to our accounting policies, internal controls, financial reporting practices and legal and regulatory compliance; | |
| • | hiring independent auditors; | |
| • | monitoring the independence and performance of our independent auditors; | |
| • | maintaining, through regularly scheduled meetings, a line of communication between the Board, our financial management and independent auditors; and | |
| • | overseeing compliance with our policies for conducting business, including ethical business standards. |
Compensation Committee
The Compensation Committee of the Board of Directors includes William F. Hughes, Jr. (Chairman), Charles G. Curtis, Gene A. Strasheim and Richard L. Yadon. Our Board has determined that all of the members of the Compensation Committee are independent, as defined in the listing standards of AMEX and the rules of the SEC.
The functions of the Compensation Committee include:
| • | assisting the Board in overseeing the management of our human resources, including compensation and benefits programs and evaluating the performance and compensation of our chief executive officer; and | |
| • | overseeing the evaluation of management. |
The Compensation Committee’s policy is to offer the executive officers competitive compensation packages that will permit us to attract and retain individuals with superior abilities and to motivate and reward such individuals in an appropriate fashion in the long-term interests of Natural Gas and its shareholders. Currently, executive compensation is comprised of salary and cash bonuses and other compensation that may be awarded from time to time such as long-term incentive opportunities in the form of stock options under our 1998 Stock Option Plan.
50
Table of Contents
Governance, Personnel Development and Nominating Committee
Our Governance, Personnel Development and Nominating Committee is composed of Charles G. Curtis (Chairman), William F. Hughes, Jr., Gene A. Strasheim and Richard L. Yadon.
The functions of this Committee include:
| • | identifying individuals qualified to become board members, consistent with the criteria approved by the Board; | |
| • | recommending director nominees and individuals to fill vacant positions; | |
| • | assisting the Board in interpreting the Board Governance Guidelines, the Board’s Principles of Conduct and any other similar governance documents adopted by the Board; | |
| • | overseeing the evaluation of the Board and its committees; | |
| • | generally overseeing the governance of the Board; and | |
| • | overseeing executive development and succession and diversity efforts. |
Our Governance, Personnel Development, and Nominating Committee will consider director candidates recommended by stockholders. The Committee evaluates nominees for directors recommended by stockholders in the same manner in which it evaluates other nominees for directors. Our Board of Directors has determined that all of the members of the Governance, Personnel Development and Nominating Committee are independent, as defined in the listing standards of AMEX and the rules of the SEC.
51
Table of Contents
Executive Compensation
The following table sets forth information regarding the compensation we paid for the fiscal years ended December 31, 2005, 2004 and 2003 to (1) each person who served as our Chief Executive Officer during 2005 and (2) each of our other four most highly compensated executive officers in 2005 (collectively, the “named executive officers”).
Summary Compensation Table
| Long-Term Compensation | |||||||||||||||||||||||||
| Annual Compensation | Awards | ||||||||||||||||||||||||
| Restricted | Securities | ||||||||||||||||||||||||
| Stock | Underlying | All Other | |||||||||||||||||||||||
| Name and Principal Position | Year | Salary ($) | Bonus ($) | Awards ($) | Options/SARs (#) | Compensation ($)(1) | |||||||||||||||||||
| Stephen C. Taylor | 2005 | (2) | 149,462 | 69,750 | — | 45,000 | 3,726 | ||||||||||||||||||
| Chairman, President and Chief Executive Officer | |||||||||||||||||||||||||
| Wallace C. Sparkman | 2005 | 121,027 | (3) | 44,000 | — | — | — | ||||||||||||||||||
| Former Director, | 2004 | 120,000 | 53,500 | — | — | — | |||||||||||||||||||
| Chairman and Chief Executive Officer | |||||||||||||||||||||||||
| Paul D. Hensley | 2005 | (4) | 129,681 | 50,680 | — | — | 6,772 | ||||||||||||||||||
| Director, President of SCS | |||||||||||||||||||||||||
| Earl R. Wait | 2005 | 94,720 | 35,000 | — | — | 4,326 | |||||||||||||||||||
| Vice President — | 2004 | 90,000 | 40,250 | — | — | 6,135 | |||||||||||||||||||
| Accounting | 2003 | 90,000 | 41,256 | — | — | 3,600 | |||||||||||||||||||
| James R. Hazlett | 2005 | (5) | 105,000 | 36,750 | — | — | — | ||||||||||||||||||
| Vice President — | |||||||||||||||||||||||||
| Technical Services | |||||||||||||||||||||||||
| S. Craig Rogers | 2005 | 98,764 | 35,000 | — | — | 4,270 | |||||||||||||||||||
| Vice President — | 2004 | 95,000 | 42,750 | — | — | 3,980 | |||||||||||||||||||
| Operations | 2003 | 88,500 | 37,669 | — | — | 3,444 | |||||||||||||||||||
| (1) | The amounts shown represent voluntary contributions made by Natural Gas Services Group to the 401(k) Plan in which all employees are generally eligible to participate. |
| (2) | Mr. Taylor was first employed by us on January 13, 2005. |
| (3) | On January 1, 2004, we employed Mr. Sparkman as our Director of Investor Relations. He served in this capacity until March 2004 when he was elected to serve as interim President and Chief Executive Officer following the death of Mr. Vinson. The salary paid to Mr. Sparkman during 2004 was paid under an oral arrangement between Mr. Sparkman and us. As a result of Mr. Taylor’s employment by us and the increase in his responsibilities following his employment, Mr. Sparkman’s annual salary was reduced to $110,000 in August 2005. Mr. Sparkman retired from his employment with us and as Chairman effective as of December 31, 2005. |
| (4) | When we acquired SCS on January 3, 2005, Mr. Hensley retained and has continued in his position as President of SCS. |
| (5) | Mr. Hazlett became an executive officer in June 2005. |
Between October and December 2005, the annual base salaries of each of Messrs. Wait, Larkin and Rogers were increased by the Compensation Committee to $100,000 per year.
Bonus Program
We have established a cash bonus program for our officers and selected senior managers. For annual periods beginning after December 31, 2004, program participants will be eligible for cash awards based upon the attainment of certain pre-determined financial, operational and personal performance parameters.
52
Table of Contents
Our Compensation Committee will review our operating history, each participant’s bonus-based performance and the recommendations of the President and determine whether or not any bonuses should be paid under the program. If so, the Board of Directors, upon recommendation of the Compensation Committee, will determine the amounts to be paid, with any bonus being paid after the completion of the final audit of the fiscal year. The Board of Directors may discontinue the bonus program at any time.
Option Grants in Last Fiscal Year
Although we use stock options as part of the overall compensation of Directors, officers and employees, Stephen C. Taylor was the only named executive officer that was granted a stock option during 2005. In the following table, we show certain information about the stock option granted to Mr. Taylor.
Option/ SAR Grants in Last Fiscal Year
| Potential Realizable | ||||||||||||||||||||||
| Individual Grants | Value at Assumed | |||||||||||||||||||||
| Annual Rates of | ||||||||||||||||||||||
| Number of | Percent of Total | Stock Price | ||||||||||||||||||||
| Securities | Options/SARs | Appreciation for | ||||||||||||||||||||
| Underlying | Granted to | Exercise or | Option Term(1) | |||||||||||||||||||
| Options/SARs | Employees in | Base Price | ||||||||||||||||||||
| Name | Granted (#) | Fiscal Year | ($/Sh) | Expiration Date | 5%($) | 10%($) | ||||||||||||||||
| Stephen C. Taylor | 45,000 | (2) | 100 | % | 9.22 | August 24, 2015 | 260,929 | 661,244 | ||||||||||||||
| (1) | These amounts are calculated based on the indicated annual rates of appreciation and annual compounding from the date of grant to the end of the option term. Actual gains, if any, on stock option exercises are dependent on the future performance of the common stock and overall stock market conditions. There is no assurance that the amounts reflected in this table will be achieved. |
| (2) | A nonstatutory stock option to purchase 45,000 shares of common stock was granted to Mr. Taylor on August 24, 2005. The option is exercisable in three equal annual installments, commencing on January 13, 2006. For additional information about the stock option granted to Mr. Taylor and our compensation agreement with him, you should refer to “— Compensation Agreements with Management” below. |
Aggregate Option Exercises in Last Fiscal Year and Fiscal Year End Option Values
The following table sets forth, as of and for the year ended December 31, 2005, information pertaining to option exercises and fiscal year end values of options held by the named executive officers.
| Number of Unexercised | Value of Unexercised | |||||||||||||||||||||||
| Securities Underlying | In-the-Money | |||||||||||||||||||||||
| Options/SARs at | Options/SARs at | |||||||||||||||||||||||
| Shares | Value | Fiscal Year End | Fiscal Year End ($)(2) | |||||||||||||||||||||
| Acquired | Realized(1) | |||||||||||||||||||||||
| Name | On Exercise | ($) | Exercisable | Unexercisable | Exercisable | Unexercisable | ||||||||||||||||||
| Stephen C. Taylor | — | — | — | 45,000 | — | 348,300 | ||||||||||||||||||
| Wallace C. Sparkman | — | — | — | — | — | — | ||||||||||||||||||
| Paul D. Hensley | — | — | — | — | — | — | ||||||||||||||||||
| Earl R. Wait | — | — | 15,000 | — | 205,650 | — | ||||||||||||||||||
| James R. Hazlett | — | — | — | — | — | — | ||||||||||||||||||
| S. Craig Rogers | — | — | 12,000 | — | 164,520 | — | ||||||||||||||||||
| (1) | The value realized is equal to the fair market value of a share of common stock on the date of exercise, less the exercise price of the stock options exercised. |
| (2) | The value ofin-the-money options is equal to the fair market value of a share of common stock at fiscal year-end ($16.96 per share), based on the closing price of the common stock, less the exercise price. |
53
Table of Contents
Equity Compensation Plans
The following is a table with information regarding our equity compensation plans as of December 31, 2005:
| Number of Securities | ||||||||||||
| Remaining Available for | ||||||||||||
| Number of Securities to | Weighted-average | Future Issuance Under | ||||||||||
| be Issued Upon Exercise | Exercise Price of | Equity Compensation Plans | ||||||||||
| of Outstanding Options, | Outstanding Options, | (Excluding Securities | ||||||||||
| Plan Category | Warrants and Rights | Warrants and Rights | Reflected in Column (a)) | |||||||||
| (a) | (b) | (c) | ||||||||||
| Equity compensation plans approved by security holders | 101,668 | $ | 7.01 | 9,500 | ||||||||
| Equity compensation plans not approved by security holders | 99,028 | $ | 5.61 | — | ||||||||
| Total | 200,696 | $ | 6.32 | 9,500 | ||||||||
Compensation of Directors
Our Directors who are not employees are paid $2,500 per quarter, and the Chairman of the Audit Committee receives an additional $1,250 per quarter. As additional compensation for their services during the preceding year, our non-employee Directors are also granted, on or about December 31 of each year, a non-statutory stock option to purchase 2,500 shares of our common stock at the then market value. Under this stock option policy, on December 30, 2005, we granted an option to each of our five non-employee Directors to purchase 2,500 shares of our common stock at an exercise price of $16.96 per share, the fair market value of our stock on the date of grant. The Directors’ stock options granted on December 30, 2005 are exercisable immediately and expire ten years from the date of grant. We also reimburse our Directors for accountable expenses incurred on our behalf.
1998 Stock Option Plan
Our 1998 Stock Option Plan provides for the issuance of options to purchase up to 150,000 shares of our common stock. The purpose of the plan is to attract and retain the best available personnel for positions of substantial responsibility and to provide additional incentive to employees and consultants and to promote the success of our business. The plan is administered by a compensation committee consisting of two or more non-employee Directors. At its discretion, the administrator of the plan may determine the persons to whom options may be granted and the terms upon which such options will be granted. In addition, the administrator of the plan may interpret the plan and may adopt, amend and rescind rules and regulations for its administration. At January 2, 2006, stock options to purchase a total of 109,167 shares of our common stock were outstanding under the 1998 Stock Option Plan, which includes 10,000 shares underlying stock options granted on December 30, 2005 to our four non-employee Directors under the compensation arrangements described above under “— Compensation of Directors.” As described below under “— Compensation Agreements with Management”, one additional stock option to purchase 45,000 shares of common stock, which was not granted under the 1998 Stock Option Plan, and which was granted without stockholder approval, was also outstanding at that same date. A total of 9,500 shares of common stock were available at December 31, 2005 for future grants of stock options under the 1998 Stock Option Plan.
Compensation Agreements With Management
On August 24, 2005, we entered into a three year employment agreement with Stephen C. Taylor to serve as our President and Chief Executive Officer. The employment agreement provides for an annual base salary of $155,000; an annual bonus of up to 45% of Mr. Taylor’s annual base salary; four weeks of vacation each year; a vehicle allowance; moving expense reimbursement of up to $20,000; reimbursement for three monthly mortgage payments made by Mr. Taylor for his prior residence in Houston, Texas; and
54
Table of Contents
standard medical and other benefits provided to all of our employees. The agreement contains provisions restricting the use of confidential information, requiring that business opportunities and intellectual property developed by Mr. Taylor become our property; and prohibiting Mr. Taylor from competing with us during his employment and for the two years following the date he ceases to be employed by us within the areas consisting of Midland and Ector Counties, Texas, Tulsa County, Oklahoma and all adjacent counties. The agreement is subject to termination upon certain “fundamental changes;” the death or mental or physical incapacity or inability of Mr. Taylor; the voluntary resignation or retirement of Mr. Taylor; or the termination of Mr. Taylor’s employment for “cause”, within the meaning of the agreement. If Mr. Taylor’s employment is terminated as the result of a fundamental change or other than for cause, he is entitled to receive a single lump sum cash payment equal to 200% of his base salary. As an inducement to obtain Mr. Taylor’s services, we also agreed to grant to Mr. Taylor a stock option to purchase 45,000 shares of common stock. We granted the option to Mr. Taylor, without stockholder approval, on August 24, 2005. The option is exercisable in three equal annual installments, commencing on January 13, 2006. The exercise price of the options is $9.22, the fair market value of our common stock on January 13, 2005, the date we initially hired Mr. Taylor. The option expires ten years from the date of grant. Effective January 19, 2006, Mr. Taylor’s base salary was increased to $175,000 per year. The adjustment of Mr. Taylor’s base salary was recommended and approved by the Compensation Committee under terms of the employment agreement between Mr. Taylor and us.
When we acquired SCS on January 3, 2005, Paul D. Hensley, one of the former stockholders of SCS, entered into a three year employment agreement with SCS to serve as the President of SCS. Mr. Hensley is also currently a director of SCS and a Director of Natural Gas Services Group, Inc. The employment agreement provides for an annual base salary in the amount of $126,700 and participation by Mr. Hensley in our employee benefit plans as in effect from time to time. The agreement also contains provisions restricting the use of confidential information; requiring that business opportunities and intellectual property developed by Mr. Hensley become the property of SCS; and prohibiting Mr. Hensley from competing with us within an area consisting of Tulsa County, Oklahoma and all adjacent counties. The agreement may be terminated by us for “cause”, within the meaning of the agreement, and automatically terminates upon the occurrence of any “fundamental change” with respect to SCS or Natural Gas Services Group. The agreement also automatically terminates upon the death, voluntary resignation or retirement of Mr. Hensley or the inability of Mr. Hensley to perform his duties for a consecutive period of 120 days or a non-consecutive period of 180 days during any twelve month period.
On January 3, 2005, James R. Hazlett, one of the former stockholders of SCS, also entered into a three year employment agreement with SCS to continue in his position as a Vice President of SCS. In June 2005, Mr. Hazlett also became Vice President-Technical Services of Natural Gas Services Group. The employment agreement provides for an annual base salary in the amount of $105,000 and participation by Mr. Hazlett in our employee benefit plans. The agreement contains provisions restricting the use of confidential information; requiring that business opportunities and intellectual property developed by Mr. Hazlett becomes the property of SCS; and prohibiting Mr. Hazlett from competing with us within an area consisting of Tulsa County, Oklahoma and all adjacent counties. The agreement may be terminated by us for “cause”, within the meaning of the agreement, and automatically terminates upon the occurrence of any “fundamental change” with respect to SCS or Natural Gas Services Group. The agreement also automatically terminates upon the death, voluntary resignation or retirement of Mr. Hazlett or the inability of Mr. Hazlett to perform his duties for a consecutive period of 120 days or a non-consecutive period of 180 days during any twelve month period.
On October 13, 2003, we entered into an employment agreement with William R. Larkin. The contract’s initial term of employment was from October 13, 2003 to April 13, 2005, and currently continues until terminated by either party upon thirty days advance written notice. The contract provides for an annual base salary of not less than $90,000 per year, participation in our bonus program and other normal company benefits. In addition to customary confidentiality provisions, the contract further provides that any and all inventions, designs, improvements and discoveries made by Mr. Larkin will belong to us. If terminated, Mr. Larkin is entitled to severance pay in an amount equal to three months of base salary.
55
Table of Contents
On January 1, 2004, we employed Wallace C. Sparkman as our Director of Investor Relations. Upon the death of Wayne L. Vinson in March 2004, Mr. Sparkman was elected to serve as our interim President and Chief Executive Officer. Mr. Sparkman served as our President and Chief Executive Officer until January 13, 2005, when we hired Stephen C. Taylor to serve in these capacities. After January 13, 2005, Mr. Sparkman assisted us with the transition of Mr. Taylor into the roles of President and Chief Executive Officer and resumed his investor relations duties. On June 14, 2005, Mr. Sparkman was elected to replace Wallace D. Sellers as Chairman of the Board of Directors following Mr. Seller’s retirement. Under our oral arrangement with Mr. Sparkman, he served as an at-will employee with a base salary of $120,000 per year. This arrangement was terminated on December 31, 2005, when Mr. Sparkman retired from employment with us and as Chairman of the Board and a member of our Board of Directors. Upon the announcement of his retirement, we entered into a Retirement Agreement with Mr. Sparkman. Under this agreement, we agreed that Mr. Sparkman would remain eligible for the 2005 fiscal year for participation in our cash bonus program. We also agreed to pay Mr. Sparkman a one-time cash bonus in the amount of $30,000, and pay six months of insurance premiums to maintain supplemental medicare insurance coverage for himself and his wife. We estimate that the amount of these insurance premium reimbursements will be approximately $4,700. Having expressed interest in pursuing other business ventures, we requested, and Mr. Sparkman agreed, that he would not compete with us for a period of one year following the date he retired within the areas consisting of Midland and Ector Counties, Texas, Tulsa County, Oklahoma and all adjacent counties.
Limitations on Directors’ and Officers’ Liability
Our Articles of Incorporation provide our officers and directors with certain limitations on liability to us or any of our shareholders for damages for breach of fiduciary duty as a director or officer involving certain acts or omissions of any such director or officer.
This limitation on liability may have the effect of reducing the likelihood of derivative litigation against directors and officers and may discourage or deter shareholders or management from bringing a lawsuit against directors and officers for breach of their duty of care even though such an action, if successful, might otherwise have benefited our shareholders and us.
Our Articles of Incorporation and bylaws provide certain indemnification privileges to our directors, employees, agents and officers against liabilities incurred in legal proceedings. Also, our directors, employees, agents or officers who are successful, on the merits or otherwise, in defense of any proceeding to which he or she was a party, are entitled to receive indemnification against expenses, including attorneys’ fees, incurred in connection with the proceeding.
We are not aware of any pending litigation or proceeding involving any of our directors, officers, employees or agents as to which indemnification is being or may be sought, and we are not aware of any other pending or threatened litigation that may result in claims for indemnification by any of our directors, officers, employees or agents.
Even though we maintain directors and officers liability insurance, the indemnification provisions contained in the Articles of Incorporation and bylaws of Natural Gas Services Group, Inc. remain in place.
Insofar as indemnification for liabilities arising under the Securities Act may be permitted to our directors, officers and controlling persons pursuant to the foregoing provisions, or otherwise, we have been advised that in the opinion of the Securities and Exchange Commission such indemnification is against public policy as expressed in the Securities Act and is, therefore, unenforceable.
56
Table of Contents
PRINCIPAL AND SELLING STOCKHOLDERS
The following table sets forth, as of February 13, 2006, for each selling stockholder, for each other stockholder who beneficially owns more than 5% of our common stock, for each executive officer and director and for all executive officers and directors as a group, (1) the number of shares and (if one percent or more) the percentage of our outstanding common stock beneficially owned by the stockholder (or group of stockholders), including all shares of common stock which may be issued upon the exercise of warrants or options exercisable within 60 days of February 13, 2006; (2) the number of shares of our common stock offered by each selling stockholder pursuant to this prospectus; and (3) the number of shares and (if one percent or more) the percentage of the total of the outstanding shares of our common stock to be beneficially owned by each such person or group after this offering, assuming no exercise by the underwriter of its over-allotment option; that all of the shares of our common stock beneficially owned by each selling stockholder and offered pursuant to this prospectus are sold; and that each such stockholder acquires no additional shares of our common stock prior to the completion of this offering.
| Shares Owned After Offering | ||||||||||||||||||||
| Shares Owned | Shares | |||||||||||||||||||
| Prior to Offering | Being | Shares | % | |||||||||||||||||
| Offered | Beneficially | Beneficially | ||||||||||||||||||
| Shares | % | Pursuant | Owned Upon | Owned Upon | ||||||||||||||||
| Beneficially | Beneficially | to this | Completion of | Completion of | ||||||||||||||||
| Name | Owned(1) | Owned(1) | Prospectus | this Offering | this Offering | |||||||||||||||
Selling Stockholders: | ||||||||||||||||||||
| James R. Hazlett | 60,976 | (2) | * | 10,000 | 50,976 | * | ||||||||||||||
| Paul D. Hensley | 426,829 | (3) | 4.73 | % | 100,000 | 326,829 | 2.84 | % | ||||||||||||
| William F. Hughes | 249,500 | (4) | 2.76 | % | 50,000 | 199,500 | 1.73 | % | ||||||||||||
| Scott W. Sparkman | 516,134 | (5) | 5.70 | % | 50,000 | 466,134 | 4.04 | % | ||||||||||||
| Wallace C. Sparkman | 167,691 | (6) | 1.86 | % | 150,000 | 17,691 | * | |||||||||||||
| Tony Vohjesus | 121,951 | (7) | 1.35 | % | 22,000 | 99,951 | * | |||||||||||||
Total Number of Shares to be Sold by Selling Stockholders: | 382,000 | |||||||||||||||||||
Other Officers and Directors: | ||||||||||||||||||||
| Charles G. Curtis | 83,000 | (8) | * | — | 83,000 | * | ||||||||||||||
| Gene A. Strasheim | 8,500 | (9) | * | — | 8,500 | * | ||||||||||||||
| Stephen C. Taylor | 15,000 | (10) | * | — | 15,000 | * | ||||||||||||||
| Richard L. Yadon | 276,683 | (11) | 3.06 | % | — | 276,683 | 2.40 | % | ||||||||||||
| Ronald D. Bingham | 4,000 | (12) | * | — | 4,000 | * | ||||||||||||||
| William R. Larkin | — | (13) | — | — | — | — | ||||||||||||||
| S. Craig Rogers | 14,125 | (14) | * | — | 14,125 | * | ||||||||||||||
| Earl R. Wait | 45,520 | (15) | * | — | 45,520 | * | ||||||||||||||
| All directors and executive officers as a group (12 persons) | 1,700,267 | (16) | 18.51 | % | 210,000 | 1,490,267 | 12.79 | % | ||||||||||||
Other Stockholders: | ||||||||||||||||||||
| Charles L. Barney | 490,800 | (17) | 5.43 | % | — | 490,800 | 4.27 | % | ||||||||||||
| * | Less than one percent |
| (1) | The number of shares listed includes all shares of common stock owned by, or which may be acquired within 60 days of February 13, 2006 upon the exercise of warrants and options held by the stockholder (or group). Beneficial ownership is calculated in accordance with the rules of the Securities and Exchange Commission. | |
| (2) | Mr. Hazlett’s address is 2911 South County Road 1260, Midland, Texas 79706. | |
| (3) | Mr. Hensley’s address is 3005 N. 15th Street, Broken Arrow, Oklahoma 74012. | |
| (4) | Includes 240,500 shares indirectly owned by Mr. Hughes through the William and Cheryl Hughes Family Trust and 7,500 shares that may be acquired upon the exercise of stock options granted under our 1998 Stock Option Plan. Mr. and Mrs. Hughes are co-trustees of the William and Cheryl Hughes Family Trust and have shared voting and investment powers with respect to the shares held |
57
Table of Contents
| by the trust. Mr. and Mrs. Hughes are beneficiaries of the trust along with their two children. Of the shares beneficially owned by Mr. Hughes, 50,000 shares are being offered pursuant to this prospectus by the William and Cheryl Hughes Family Trust. Mr. Hughes’ address is 42921 Normandy Lane, Lancaster, California 93536. | ||
| (5) | Includes 167 shares indirectly owned by Mr. Sparkman through our 401(k) Plan; 21,467 shares that may be acquired upon the exercise of warrants; 1,000 shares that may be acquired upon the exercise of a stock option granted under our 1998 Stock Option Plan; and 475,000 shares held in the Diamond SDGT Trust, a trust for which Mr. Sparkman is sole trustee and a co-beneficiary with his sister. Of the shares beneficially owned by Mr. Sparkman, 50,000 shares are being offered pursuant to this prospectus by the Diamond SDGT Trust. Mr. Sparkman’s address is 2911 South County Road 1260, Midland, Texas 79706. | |
| (6) | Includes 105,691 shares indirectly owned by Mr. Sparkman through Diamente Investments, L.P., a Texas limited partnership of which Mr. Sparkman is a general and limited partner. Of the shares beneficially owned by Mr. Sparkman, 100,000 shares are being offered pursuant to this prospectus by Diamente Investments, L.P. Mr. Sparkman’s address is 4906 Oakwood Court, Midland, Texas 79707. | |
| (7) | Mr. Vohjesus’ address is 5725 Bird Creek Avenue, Catoosa, Oklahoma 74015. | |
| (8) | Includes 40,000 shares that may be acquired upon the exercise of warrants and 10,000 shares that may be acquired upon the exercise of stock options granted under our 1998 Stock Option Plan. Mr. Curtis’ address is 1 Penrose Lane, Colorado Springs, Colorado 80906. | |
| (9) | Includes 5,000 shares that may be acquired upon exercise of stock options granted under our 1998 Stock Option Plan. Mr. Strasheim’s address is 165 Huntington Place, Colorado Springs, Colorado 80906. |
| (10) | Includes 15,000 shares that may be acquired upon exercise of a stock option granted to Mr. Taylor as an inducement for his employment. Mr. Taylor’s address is 2911 South County Road 1260, Midland, Texas 79706. |
| (11) | Includes 14,683 shares that may be acquired upon the exercise of warrants and 7,500 shares that may be acquired upon the exercise of stock options granted under our 1998 Stock Option Plan. Mr. Yadon’s address is 4444 Verde Glen Ct., Midland, Texas 79707. |
| (12) | Includes 4,000 shares that may be acquired upon the exercise of a stock option granted under our 1998 Stock Option Plan. Mr. Bingham’s address is 3690 County Road 491, Lewiston, Michigan 49756. |
| (13) | Mr. Larkin’s address is 2911 South County Road 1260, Midland, Texas 79706. |
| (14) | Includes 12,000 shares that may be acquired upon the exercise of a stock option granted under our 1998 Stock Option Plan. Mr. Rogers’ address is 2911 South County Road 1260, Midland, Texas 79706. |
| (15) | Includes 15,000 shares that may be acquired upon exercise of a stock option granted under our 1998 Stock Option Plan. Mr. Wait’s address is 2911 South County Road 1260, Midland, Texas 79706. |
| (16) | Includes 77,000 shares of common stock that may be acquired upon the exercise of stock options and 76,150 shares that may be acquired upon the exercise of warrants to purchase common stock. |
| (17) | Based on Amendment No. 4 to Schedule 13D filed with the SEC on January 24, 2006, Charles L. Barney, the sole indirect owner of CBarney Investments, Ltd. and Mark X Energy Company, reported beneficial ownership of 490,800 shares of common stock. Mr. Barney reported shared voting and dispositive power with (i) CBarney Investments, Ltd. with respect to the 89,698 shares it owns and (ii) Mark X Energy Company with respect to the 401,102 shares it owns, due to his ownership control of those entities. The address of Charles L. Barney, CBarney Investments, Ltd. and Mark X Energy Company is 952 Echo Lane, Suite 364, Houston, Texas 77024. |
58
Table of Contents
TRANSACTIONS WITH SELLING STOCKHOLDERS
AND OTHER RELATED PARTIES
Sale of Common Stock
On July 20, 2004, we entered into a Securities Purchase Agreement with CBarney Investments, Ltd. Under terms of this agreement, on August 4, 2004 we sold a total of 549,574 shares of our common stock to CBarney Investments, Ltd. and 100,000 shares to Mark X Energy Company, an affiliate of CBarney Investments, Ltd. for a total of $5.0 million. The per share price was determined by multiplying (x) $8.747, the average closing market price of the common stock on the American Stock Exchange for the twenty consecutive trading days ended July 15, 2004, times (y) eighty-eight percent.
Net proceeds from the sale of the shares, approximately $4.9 million, were used to advance the growth of our rental fleet of natural gas compressors, for working capital and general corporate purposes.
Under the agreement, for a period of twenty-four months following the closing, CBarney has the right, subject to certain limitations, to participate with respect to the issuance of (a) future equity or equity-linked securities, and (b) debt which is convertible into equity or in which there is an equity component, called “Additional Securities”, on the same terms and conditions as offered by us to other purchasers of such Additional Securities. CBarney’s participation right does not apply to:
| • | the issuance or sale of securities to our employees, officers, directors, or consultants for the primary purpose of soliciting or retaining their employment or service pursuant to a stock option plan (or similar equity incentive plan) approved by the Board of Directors and our stockholders; | |
| • | the conversion of any convertible or exercisable securities outstanding as of the closing; | |
| • | our issuance of shares of common stock in connection with an underwritten public offering; or | |
| • | the issuance of securities in connection with mergers, acquisitions, strategic business partnerships or joint ventures. |
CBarney and its representatives and agents have the right, no more than twice in any year, to visit and inspect any of our properties, to examine our books of account and records, and to discuss the affairs, finances and accounts of Natural Gas Services Group with our officers, employees and independent public accountants. We also agreed to permit a representative selected by CBarney to attend and observe our Board meetings, subject to certain conditions.
As required by the Securities Purchase Agreement, we filed a registration statement with the Securities and Exchange Commission to register the resale of the 649,574 shares of common stock we sold to CBarney Investments, Ltd. and Mark X Energy Company.
Acquisition of Screw Compression Systems, Inc.
In October 2004, we entered into a Stock Purchase Agreement with Screw Compression Systems, Inc., or “SCS”, and the three stockholders of SCS, Paul D. Hensley, James R. Hazlett and Tony Vohjesus. Under this agreement, we purchased all of the outstanding shares of capital stock of SCS from Messrs. Hensley, Hazlett and Vohjesus. Mr. Hensley is currently the president of SCS and a Director of Natural Gas Services Group. Mr. Hazlett became Vice President — Technical Services of Natural Gas Services Group in June 2005 and also continues to serve as a vice president of SCS. Mr. Vohjesus remains employed by SCS as a vice president. The acquisition was completed on January 3, 2005 and SCS is now operated as a wholly owned subsidiary of Natural Gas Services Group.
Under terms of the Stock Purchase Agreement, we appointed Mr. Hensley as a Director of Natural Gas in January, 2005 to fill a vacancy existing on its Board of Directors, to hold office until the 2005 annual meeting of stockholders. Mr. Hensley was nominated for election as a Director at the 2005 annual meeting of stockholders and was elected as a Director at the annual meeting of stockholders held in June 2005.
59
Table of Contents
Based on Mr. Hensley’s pro rata ownership of SCS, he received $5.6 million in cash; 426,829 shares of Natural Gas Services Group common stock; and a promissory note issued by Natural Gas Services Group in the principal amount of $2.1 million, bearing interest at the rate of 4.00% per annum, maturing January 3, 2008 and secured by a letter of credit in the aggregate face amount of $1.4 million. Mr. Hazlett received $800,000 in cash; 60,976 shares of Natural Gas Services Group common stock; and a promissory note in the principal amount of $300,000, bearing interest at the rate of 4.00% per annum, maturing January 3, 2008 and secured by a letter of credit in the aggregate face amount of $200,000. Mr. Vohjesus received $1,600,000 in cash; 121,951 shares of Natural Gas Services Group, Inc. common stock; and a promissory note in the principal amount of $600,000, bearing interest at the rate of 4.00% per annum, maturing January 3, 2008 and secured by a letter of credit in the aggregate face amount of $400,000. The promissory notes are payable in three equal annual installments, with the first installments being due and payable on January 3, 2006. Subject to the consent of the holder of each respective note, principal payments may be made by Natural Gas Services Group in shares of common stock valued at the average daily closing prices of the common stock on the American Stock Exchange for the twenty consecutive trading days commencing thirty trading days before the due date of the principal payment, or by combination of cash and shares of common stock.
Under terms of a Stockholders’ Agreement entered into as required by the Stock Purchase Agreement, for a period of two years following the closing, each of Messrs. Hensley, Hazlett and Vohjesus has the right, subject to certain limitations, to include or “piggyback” the shares of common stock he received in the transaction in any registration statement we file with the Securities and Exchange Commission. The Stockholders’ Agreement also provides that Messrs. Hensley, Hazlett and Vohjesus will not for a period of three years acquire or agree, offer, seek or propose to acquire beneficial ownership of any assets or businesses or any additional securities issued by us, or any rights or options to acquire such ownership; contest any election of directors by the stockholders of Natural Gas Services Group; or induce or attempt to induce any other person to initiate any stockholder proposal or a tender offer for any of our voting securities; or enter into any discussions, negotiations, arrangements or understandings with any third party with respect to any of the foregoing.
Guarantees of Indebtedness
In March 2001, we issued warrants that will expire on December 31, 2006 to purchase shares of our common stock at $2.50 per share to the following persons for guaranteeing the amount of our debt indicated:
| Number of Shares | Amount of Debt | |||||||
| Name | Underlying Warrants | Guaranteed | ||||||
Wallace O. Sellers(1) | 21,936 | $ | 548,399 | |||||
| Wallace C. Sparkman | 21,467 | (2) | $ | 536,671 | ||||
CAV-RDV, Ltd.(3) | 15,756 | $ | 393,902 | |||||
| Richard L. Yadon | 9,365 | $ | 234,121 | |||||
| (1) | Mr. Sellers served as a Director from December 1998 until June 2005 after declining to stand for re-election at the 2005 annual meeting of stockholders because of health reasons. |
| (2) | Mr. Sparkman transferred such warrants to Diamond S DGT Trust, a trust of which Scott W. Sparkman is the trustee and a beneficiary. Mr. Sparkman has represented to us that he has no beneficial interest in Diamond S DGT Trust. |
| (3) | CAV-RDV, Ltd. is a limited partnership that was controlled by Wayne L. Vinson, our former President and Chief Executive Officer. |
All of the guaranties were released by our bank lender upon completion of our initial public offering in October 2002.
60
Table of Contents
In April 2002, we issued five year warrants to purchase shares of our common stock at $3.25 per share to each of the following persons for guaranteeing a portion of our bank debt as follows:
| Number of Shares | Amount of | |||||||
| Name | Underlying Warrants | Debt Guaranteed | ||||||
| Wallace O. Sellers | 9,032 | $ | 451,601 | |||||
| CAV-RDV, Ltd. | 2,122 | $ | 106,098 | |||||
| Richard L. Yadon | 5,318 | $ | 265,879 | |||||
All of the guaranties were released by our bank lender in June 2003.
During the period from March 2001 to September 2005, Wayne L. Vinson, Earl R. Wait and Wallace C. Sparkman also guaranteed payment of approximately $197,000, $84,000 and $92,000, respectively, of additional obligations to third party vendors when we acquired vehicles, equipment and software. The last of these obligations was satisfied in September 2005, and none of the guaranties remain in effect. No warrants or other consideration was given by us to Messrs. Vinson, Wait or Sparkman in exchange for their guaranties of these vendor obligations.
Consulting Fees
During 2002 and 2003, we paid management consulting fees to LaSabre Services, Inc., a corporation owned and controlled by Wallace C. Sparkman, the former Chairman of the Board of Directors and Director. We paid approximately $110,000 for these services in 2002 and approximately $109,000 in 2003. We terminated these payments to LaSabre at the end of December 2003 when Mr. Sparkman became an employee of Natural Gas Services Group in January 2004, as described under “Management — Compensation Agreements With Management”.
61
Table of Contents
DESCRIPTION OF CAPITAL STOCK
The following description of Natural Gas Services Group’s common stock, preferred stock, articles of incorporation and bylaws is a summary only and is qualified by the complete text of Natural Gas Services Group’s articles of incorporation and bylaws, which we have filed as exhibits to the registration statement, of which this prospectus is a part. You should read those documents for provisions that may be important to you.
General
Our authorized capital stock consists of 30,000,000 shares of common stock, $.01 par value per share, and 5,000,0000 shares of preferred stock, $.01 par value per share.
As of February 13, 2006, 9,031,783 shares of common stock were outstanding and no shares of preferred stock were outstanding.
Common Stock
All shares of our common stock have equal voting rights and, when validly issued and outstanding, have one vote per share in all matters to be voted upon by stockholders. The shares of common stock have no preemptive, subscription, conversion or redemption rights and may be issued only as fully paid and non-assessable shares. Cumulative voting in the election of directors is not allowed, which means that the holders of a majority of the outstanding shares represented at any meeting at which a quorum is present will be able to elect all of the directors if they choose to do so and, in such event, the holders of the remaining shares will not be able to elect any directors. On liquidation, each common stockholder is entitled to receive a pro rata share of the assets available for distribution to holders of common stock.
Preferred Stock
The shares of preferred stock may be issued in one or more series from time to time with such designations, rights, preferences and limitations as our Board of Directors may determine without the approval of our shareholders. The rights, preferences and limitations of separate series of preferred stock may differ with respect to such matters as may be determined by our Board of Directors, including, without limitation, the rate of dividends, method or nature or prepayment of dividends, terms of redemption, amounts payable on liquidation, sinking fund provisions, conversion rights and voting rights. The ability of our Board of Directors to issue preferred stock could also be used by it as a means for resisting a change in our control and can therefore be considered an “anti-takeover” device. We currently have no plans to issue any shares of preferred stock.
Anti-Takeover Provisions
Our Articles of Incorporation and bylaws contain provisions that may discourage acquisition bids and may limit the price investors are willing to pay for our common stock. Our Articles of Incorporation and bylaws provide that:
| • | directors will be elected for staggered three-year terms, with approximately one-third of the board of directors standing for election each year, and the staggered term provision cannot be amended or repealed without the affirmative vote of the holders of at least 80% of the votes entitled to be cast in the election of directors; |
62
Table of Contents
| • | the unanimous vote of the board of directors or the affirmative vote of the holders of not less than 80% of the votes entitled to be cast by the holders of all shares entitled to vote in the election of directors is required to change the size of the board of directors; and | |
| • | directors may be removed only for cause and only by holders of not less than 80% of the votes entitled to be cast on the matter at a special meeting of the stockholders expressly called for that purpose. |
Our Board of Directors has the authority to issue up to five million shares of preferred stock. The Board of Directors can fix the terms of the preferred stock without any action on the part of our stockholders. The issuance of shares of preferred stock may delay or prevent a change in control transaction or could be used to put in place a poison pill. This may adversely affect the market price and interfere with the voting and other rights of our common stock.
Transfer Agent and Registrar
The transfer agent and registrar for our common stock is Computershare Trust Company, Inc., 350 Indiana Street, Suite 800, Golden, Colorado 80401.
63
Table of Contents
UNDERWRITING
Subject to the terms and conditions set forth in the underwriting agreement among us, the selling stockholders and Morgan Keegan & Company, Inc., Morgan Keegan & Company, Inc. has agreed to purchase, and we and the selling stockholders have agreed to sell to Morgan Keegan & Company, Inc., 2,850,000 shares of our common stock.
The underwriting agreement provides that the obligation of Morgan Keegan & Company, Inc. to purchase the shares included in this offering is subject to approval of legal matters by counsel and to other conditions. Morgan Keegan & Company, Inc. is obligated to purchase all of the shares (other than those covered by the over-allotment option described below) if it purchases any of the shares.
The underwriting agreement provides that Morgan Keegan & Company, Inc. will purchase the shares of common stock from us and the selling stockholders at the public offering price shown on the cover page of this prospectus less the underwriting discount shown on the cover page of this prospectus.
The following table summarizes the underwriting discounts Morgan Keegan & Company, Inc. is to receive on a per share basis and in total from us and the selling stockholders. The information is presented assuming either no exercise or full exercise of the underwriter’s option to purchase additional shares of stock to cover over-allotments.
| Per Share | Total | |||||||||||
| Without Option | With Option | |||||||||||
| Underwriting discount paid by us | $ | 1.01 | $ | 2,483,425 | $ | 2,913,597 | ||||||
| Underwriting discount paid by selling stockholders | $ | 1.01 | $ | 384,388 | $ | 384,388 | ||||||
We estimate that the total expenses of this offering will be approximately $425,000, excluding underwriter’s discounts. We will pay all expenses associated with this offering, other than certain expenses incurred by Morgan Keegan & Company, Inc.
Morgan Keegan & Company, Inc. proposes to offer the shares of our common stock to the public at the offering price set forth on the cover page of this prospectus. The underwriter may allow a discount not in excess of $0.10 per share to dealers. After the offering, Morgan Keegan & Company, Inc. may change the offering price and other selling terms. Morgan Keegan & Company, Inc. reserves the right to reject an order for the purchase of shares, in whole or in part.
We have granted to Morgan Keegan & Company, Inc. the option, exercisable for thirty (30) days from the date of this prospectus, to purchase up to 427,500 additional shares of common stock at the price set forth on the cover of this prospectus. Morgan Keegan & Company, Inc. may exercise the option solely for the purpose of covering over-allotments, if any, in connection with the offering. If any additional shares are purchased, Morgan Keegan & Company, Inc. will offer the additional shares on the same terms as those on which the shares are being offered.
We, each of our executive officers and Directors and each of the selling stockholders have agreed that none of us will issue, sell, transfer or dispose of any shares of our common stock or securities convertible into or exercisable for any shares of our common stock, without the prior written consent of Morgan Keegan & Company, Inc., for a period of ninety (90) days after the date of the underwriting agreement, other than in this offering in accordance with the terms of the underwriting agreement.
Our shares of common stock are listed on the American Stock Exchange under the symbol “NGS”.
In connection with this offering, Morgan Keegan & Company, Inc. may purchase and sell shares of our common stock in the open market. These transactions may include short sales, syndicate covering transactions and stabilizing transactions in accordance with Regulation M. Short sales involve syndicate sales of shares in excess of the number of shares to be purchased by Morgan Keegan & Company, Inc. in this offering, which creates a syndicate short position. “Covered” short sales are sales made in an amount up to the number of shares represented by the underwriter’s over-allotment option. In determining the source of shares to close out the covered syndicate short position, Morgan Keegan & Company, Inc. will
64
Table of Contents
consider, among other things, the price of shares available for purchase in the open market as compared to the price at which Morgan Keegan & Company, Inc. may purchase shares through the over-allotment option. Transactions to close out the covered syndicate short position involve either purchases in the open market after the distribution has been completed or the exercise of the over-allotment option. Morgan Keegan & Company, Inc. may also make “naked” short sales of shares in excess of the over-allotment option. Morgan Keegan & Company, Inc. must close out any naked short position by purchasing shares of common stock in the open market. A naked short position is more likely to be created if Morgan Keegan & Company, Inc. is concerned that there may be downward pressure on the price of the shares in the open market after pricing that could adversely affect investors who purchase in the offering. Stabilizing transactions consist of bids for, or purchases of, shares in the open market while the offering is in progress, subject to a specified maximum price.
Any of these activities may have the effect of preventing or retarding a decline in the market price of our common stock. They may also cause the price of the shares of our common stock to be higher than the price that would otherwise exist on the open market in the absence of these transactions. Morgan Keegan & Company, Inc. may conduct these transactions on the American Stock Exchange or otherwise. If Morgan Keegan & Company, Inc. commences any of these transactions, it may discontinue them at any time.
We and the selling stockholders have agreed to indemnify Morgan Keegan & Company, Inc. against certain liabilities, including liabilities under the Securities Act, or to contribute to payments Morgan Keegan & Company, Inc. may be required to make because of any of those liabilities.
Under terms of an agreement among Bathgate Capital Partners, LLC, Morgan Keegan & Company, Inc. and us, Bathgate Capital Partners, LLC is entitled to receive $300,000 of the underwriting discount in connection with this offering as consideration for financial advisory and consulting services provided to us by Bathgate Capital Partners, LLC and its affiliates in connection with this offering. Accordingly, Morgan Keegan & Company, Inc. will pay this amount to Bathgate Capital Partners, LLC upon completion of this offering.
WHERE YOU CAN FIND MORE INFORMATION
We file annual, quarterly and current reports, proxy statements and other information with the Securities and Exchange Commission. We have also filed with the SEC under the Securities Act a Registration Statement on Form S-1 with respect to the common stock offered by this prospectus. This prospectus, which constitutes part of the Registration Statement, does not contain all the information set forth in the Registration Statement or the exhibits and schedules which are part of the Registration Statement, portions of which are omitted as permitted by the rules and regulations of the SEC. Statements made in this prospectus regarding the contents of any contract or other document are summaries of the material terms of the contract or document. With respect to each contract or document filed as an exhibit to the Registration Statement, reference is made to the corresponding exhibit. For further information pertaining to us and the common stock offered by this prospectus, reference is made to the Registration Statement, including the exhibits and schedules thereto, copies of which may be inspected without charge at the public reference facilities of the SEC at 100 F Street, N.E., Room 1580, Washington, D.C. 20549, as may the other reports, statements and information we file with the SEC. Copies of all or any portion of the Registration Statement may be obtained from the SEC at prescribed rates. Information on the public reference facilities may be obtained by calling the SEC at1-800-SEC-0330. In addition, the SEC maintains a website that contains reports, proxy and information statements and other information that is filed through the SEC’s EDGAR System. The website can be accessed athttp://www.sec.gov.
65
Table of Contents
LEGAL MATTERS
The validity of the common stock and certain other legal matters will be passed upon for us by Lynch, Chappell & Alsup, P.C., Midland, Texas, and Jackson Kelly PLLC, Denver, Colorado. Bracewell & Giuliani LLP, Houston, Texas, has advised the underwriter as to certain legal matters relating to the offering.
EXPERTS
Our consolidated balance sheets as of December 31, 2004 and 2003 and the consolidated statements of income and stockholders’ equity and cash flows for the three years ended December 31, 2004, 2003 and 2002 and the consolidated balance sheets as of December 31, 2004 and December 31, 2003 and the consolidated statements of income, stockholders’ equity and cash flows for the two years ended December 31, 2004 and 2003 of Screw Compression Systems, Inc. included in this prospectus have been included herein in reliance on the report of Hein & Associates LLP, an independent registered public accounting firm, given on the authority of that firm as experts in auditing and accounting.
66
Table of Contents
GLOSSARY OF INDUSTRY TERMS
“coalbed methane” — A natural gas generated during coal formation and provided from coal seams or adjacent sandstones.
“gas shales” — Fine grained rocks where the predominant gas storage mechanism is sorption and gas is stored in volumes that are potentially economic.
“reciprocating compressors” — A reciprocating compressor is a type of compressor which compresses vapor by using a piston in a cylinder and a back-and-forth motion.
“screw compressors” — A type of compressor used in vapor compression where two intermesh rotors create pockets of continuously decreasing volume, in which the vapor is compressed and its pressure is increased.
“tight gas” — A gas bearing sandstone or carbonate matrix (which may or may not contain natural fractures) which exhibits a low-permeability (tight) reservoir.
67
Table of Contents
INDEX TO FINANCIAL STATEMENTS
| Page | ||||
| NATURAL GAS SERVICES GROUP, INC. | ||||
| F-2 | ||||
| F-3 | ||||
| F-4 | ||||
| F-5 | ||||
| F-6 | ||||
| F-7 | ||||
| F-20 | ||||
| F-21 | ||||
| F-22 | ||||
| F-23 | ||||
| F-24 | ||||
| F-25 | ||||
| F-37 | ||||
| F-38 | ||||
| F-39 | ||||
| F-40 | ||||
| SCREW COMPRESSION SYSTEMS, INC. | ||||
| F-46 | ||||
| F-47 | ||||
| F-48 | ||||
| F-49 | ||||
| F-50 | ||||
| F-51 | ||||
| F-56 | ||||
F-1
Table of Contents
REPORT OF INDEPENDENT REGISTERED PUBLIC ACCOUNTING FIRM
The Board of Directors
Natural Gas Services Group, Inc.
We have audited the accompanying consolidated balance sheet of Natural Gas Services Group, Inc. and Subsidiaries (the “Company”) as of December 31, 2004, and the related consolidated statements of income, stockholders’ equity and cash flows for the years ended December 31, 2003 and 2004. These financial statements are the responsibility of the Company’s management. Our responsibility is to express an opinion on these financial statements based on our audits.
We conducted our audits in accordance with the standards of the Public Company Accounting Oversight Board (United States). Those standards require that we plan and perform the audits to obtain reasonable assurance about whether the financial statements are free of material misstatement. An audit includes examining, on a test basis, evidence supporting the amounts and disclosures in the financial statements. An audit also includes assessing the accounting principles used and significant estimates made by management as well as evaluating the overall financial statement presentation. We believe that our audits provide a reasonable basis for our opinion.
In our opinion, the consolidated financial statements referred to above present fairly, in all material respects, the financial position of the Company as of December 31, 2004, and the results of its operations and its cash flows for the years ended December 31, 2003 and 2004 in conformity with U.S. generally accepted accounting principles.
| /s/Hein & Associates llp |
Dallas, Texas
February 11, 2005
F-2
Table of Contents
NATURAL GAS SERVICES GROUP, INC. AND SUBSIDIARIES
CONSOLIDATED BALANCE SHEET
(all amounts in thousands, except per-share amounts)
| December 31, | ||||||
| 2004 | ||||||
| ASSETS | ||||||
CURRENT ASSETS: | ||||||
| Cash and cash equivalents | $ | 685 | ||||
| Trade accounts receivable, net of doubtful accounts of $25 | 1,999 | |||||
| Inventory | 4,470 | |||||
| Prepaid expenses and other | 141 | |||||
| Total current assets | 7,295 | |||||
RENTAL EQUIPMENT,net of accumulated depreciation of $4,827 | 27,734 | |||||
PROPERTY AND EQUIPMENT,net of accumulated depreciation of $1,446 | 3,134 | |||||
GOODWILL,net of accumulated amortization of $325 | 2,590 | |||||
PATENTS,net of accumulated amortization of $165 | 86 | |||||
RESTRICTED CASH | 2,000 | |||||
OTHER ASSETS | 416 | |||||
| Total assets | $ | 43,255 | ||||
| LIABILITIES AND STOCKHOLDERS’ EQUITY | ||||||
CURRENT LIABILITIES: | ||||||
| Current portion of long-term debt | $ | 3,728 | ||||
| Line of credit | 550 | |||||
| Accounts payable and accrued liabilities | 2,355 | |||||
| Deferred income | 22 | |||||
| Total current liabilities | 6,655 | |||||
LONG-TERM DEBT,less current portion | 9,290 | |||||
SUBORDINATED NOTES,net of discount of $90 | 1,449 | |||||
DEFERRED TAX LIABILITY | 2,958 | |||||
COMMITMENTS(Note 11) | ||||||
STOCKHOLDERS’ EQUITY: | ||||||
| Preferred stock, 5,000 shares authorized, no shares issued | — | |||||
| Common stock, 30,000 shares authorized, par value $0.01; 6,104 shares issued and outstanding | 61 | |||||
| Additional paid-in capital | 16,355 | |||||
| Retained earnings | 6,487 | |||||
| Total stockholders’ equity | 22,903 | |||||
| Total liabilities and stockholders’ equity | $ | 43,255 | ||||
See accompanying notes to these consolidated financial statements.
F-3
Table of Contents
NATURAL GAS SERVICES GROUP, INC. AND SUBSIDIARIES
CONSOLIDATED STATEMENTS OF INCOME
(all amounts in thousands, except per-share amounts)
| For the Years Ended | ||||||||||
| December 31, | ||||||||||
| 2003 | 2004 | |||||||||
REVENUE: | ||||||||||
| Sales, net | $ | 3,865 | $ | 3,593 | ||||||
| Service and maintenance income | 1,773 | 1,874 | ||||||||
| Rental income | 7,112 | 10,491 | ||||||||
| Total revenue | 12,750 | 15,958 | ||||||||
OPERATING COSTS AND EXPENSES: | ||||||||||
| Cost of sales, exclusive of depreciation shown separately below | 2,860 | 2,556 | ||||||||
| Cost of service, exclusive of depreciation shown separately below | 1,243 | 1,357 | ||||||||
| Cost of rental, exclusive of depreciation shown separately below | 1,954 | 3,038 | ||||||||
| Selling expenses | 679 | 875 | ||||||||
| General and administrative | 1,613 | 1,777 | ||||||||
| Depreciation and amortization | 1,726 | 2,444 | ||||||||
| Total operating costs and expenses | 10,075 | 12,047 | ||||||||
OPERATING INCOME | 2,675 | 3,911 | ||||||||
OTHER INCOME (EXPENSE): | ||||||||||
| Interest expense | (667 | ) | (838 | ) | ||||||
| Other income (expense) | (4 | ) | 1,441 | |||||||
| Total other income (expense) | (671 | ) | 603 | |||||||
INCOME BEFORE PROVISION FOR INCOME TAXES | 2,004 | 4,514 | ||||||||
PROVISION FOR INCOME TAXES: | ||||||||||
| Current | 25 | 20 | ||||||||
| Deferred | 672 | 1,120 | ||||||||
| Total income tax expense | 697 | 1,140 | ||||||||
NET INCOME | 1,307 | 3,374 | ||||||||
PREFERRED DIVIDENDS | 121 | 53 | ||||||||
INCOME AVAILABLE TO COMMON STOCKHOLDERS | $ | 1,186 | $ | 3,321 | ||||||
EARNINGS PER COMMON SHARE: | ||||||||||
| Basic | $ | 0.24 | $ | 0.59 | ||||||
| Diluted | $ | 0.23 | $ | 0.52 | ||||||
WEIGHTED AVERAGE COMMON SHARES OUTSTANDING: | ||||||||||
| Basic | 4,947 | 5,591 | ||||||||
| Diluted | 5,253 | 6,383 | ||||||||
See accompanying notes to these consolidated financial statements.
F-4
Table of Contents
NATURAL GAS SERVICES GROUP, INC. AND SUBSIDIARIES
CONSOLIDATED STATEMENTS OF STOCKHOLDERS’ EQUITY
For the Years Ended December 31, 2003 and 2004
(all amounts in thousands)
| Preferred Stock | Common Stock | Additional | Total | |||||||||||||||||||||||||
| Paid-in | Retained | Stockholders’ | ||||||||||||||||||||||||||
| Shares | Amount | Shares | Amount | Capital | Earnings | Equity | ||||||||||||||||||||||
BALANCES, January 1, 2003 | 382 | $ | 4 | 4,858 | $ | 49 | $ | 10,968 | $ | 1,980 | $ | 13,001 | ||||||||||||||||
| Exercise of common stock options and warrants | — | — | 135 | 1 | 237 | — | 238 | |||||||||||||||||||||
| Conversion of preferred stock to common stock | (38 | ) | — | 38 | — | — | — | — | ||||||||||||||||||||
| Dividends on preferred stock | — | — | — | — | — | (121 | ) | (121 | ) | |||||||||||||||||||
| Net income | — | — | — | — | — | 1,307 | 1,307 | |||||||||||||||||||||
BALANCES, January 1, 2004 | 344 | 4 | 5,031 | 50 | 11,205 | 3,166 | 14,425 | |||||||||||||||||||||
| Exercise of common stock options and warrants | — | — | 80 | 1 | 245 | — | 246 | |||||||||||||||||||||
| Conversion of preferred stock to common stock | (344 | ) | (4 | ) | 344 | 4 | — | — | — | |||||||||||||||||||
| Transaction costs of private placement of common stock | — | — | — | — | (39 | ) | — | (39 | ) | |||||||||||||||||||
| Issuance of common stock | — | — | 649 | 6 | 4,944 | — | 4,950 | |||||||||||||||||||||
| Dividends on preferred stock | — | — | — | — | — | (53 | ) | (53 | ) | |||||||||||||||||||
| Net income | — | — | — | — | — | 3,374 | 3,374 | |||||||||||||||||||||
BALANCES, December 31, 2004 | — | $ | — | 6,104 | $ | 61 | $ | 16,355 | $ | 6,487 | $ | 22,903 | ||||||||||||||||
See accompanying notes to these consolidated financial statements.
F-5
Table of Contents
NATURAL GAS SERVICES GROUP, INC. AND SUBSIDIARIES
CONSOLIDATED STATEMENTS OF CASH FLOWS
(all amounts in thousands)
| For the Years Ended | ||||||||||||
| December 31, | ||||||||||||
| 2003 | 2004 | |||||||||||
CASH FLOWS FROM OPERATING ACTIVITIES: | ||||||||||||
| Net income | $ | 1,307 | $ | 3,374 | ||||||||
| Adjustments to reconcile net income to net cash provided by operating activities: | ||||||||||||
| Depreciation and amortization | 1,726 | 2,444 | ||||||||||
| Deferred taxes | 672 | 1,120 | ||||||||||
| Amortization of debt issuance costs | 65 | 65 | ||||||||||
| Loss on disposal of assets | 18 | 71 | ||||||||||
| Changes in current assets: | ||||||||||||
| Trade and other receivables | (392 | ) | (1,182 | ) | ||||||||
| Inventory | (1,078 | ) | (1,915 | ) | ||||||||
| Prepaid expenses and other | 66 | (34 | ) | |||||||||
| Changes in current liabilities: | ||||||||||||
| Accounts payable and accrued liabilities | 543 | 1,284 | ||||||||||
| Deferred income | 174 | (185 | ) | |||||||||
| Other changes | (77 | ) | (344 | ) | ||||||||
| Net cash provided by operating activities | 3,024 | 4,698 | ||||||||||
CASH FLOWS FROM INVESTING ACTIVITIES: | ||||||||||||
| Purchase of property and equipment | (7,882 | ) | (11,596 | ) | ||||||||
| Proceeds from sale of property and equipment | 120 | 50 | ||||||||||
| Increase in restricted cash | — | (2,000 | ) | |||||||||
| Distribution from equity method investment | 108 | — | ||||||||||
| Decrease in lease receivable | 210 | — | ||||||||||
| Net cash used in investing activities | (7,444 | ) | (13,546 | ) | ||||||||
CASH FLOWS FROM FINANCING ACTIVITIES: | ||||||||||||
| Net proceeds from lines of credit | 300 | 550 | ||||||||||
| Proceeds from long-term debt | 3,479 | 6,592 | ||||||||||
| Repayments of long-term debt | (2,014 | ) | (2,589 | ) | ||||||||
| Repayment of line of credit | — | (300 | ) | |||||||||
| Dividends on preferred stock | (121 | ) | (53 | ) | ||||||||
| Proceeds from sale of stock and exercise of stock options and warrants, net of transaction costs | 238 | 5,157 | ||||||||||
| Net cash provided by financing activities | 1,882 | 9,357 | ||||||||||
NET CHANGE IN CASH | (2,538 | ) | 509 | |||||||||
CASH,beginning of year | 2,714 | 176 | ||||||||||
CASH,end of year | $ | 176 | $ | 685 | ||||||||
SUPPLEMENTAL DISCLOSURES OF CASH FLOW INFORMATION: | ||||||||||||
| Interest paid | $ | 667 | $ | 775 | ||||||||
| Income taxes paid | $ | 35 | $ | 31 | ||||||||
See accompanying notes to these consolidated financial statements.
F-6
Table of Contents
NATURAL GAS SERVICES GROUP, INC. AND SUBSIDIARIES
NOTES TO CONSOLIDATED FINANCIAL STATEMENTS
| 1. | Summary of Significant Accounting Policies |
Organization and Principles of Consolidation
Natural Gas Services Group, Inc. (the “Company” or “NGSG”) (a Colorado corporation) was formed on December 18, 1998 for the purposes of combining the operations of certain manufacturing, service and leasing entities.
During 2003, NGSG conducted its operations through the following wholly-owned subsidiaries:
| • | Rotary Gas Systems, Inc. (“RGS”) (a Texas corporation) was engaged in the manufacturing and distribution of natural gas compressor packages for use in the petroleum industry and natural gas flare stacks and ignition systems for use in oilfield, refinery, petrochemical plant, and landfill applications in New Mexico, California and Texas. | |
| • | NGE Leasing, Inc. (“NGE”) (a Texas corporation) was engaged in leasing natural gas compressor packages to entities in the petroleum industry and irrigation motor units to entities in the agricultural industry. NGE’s leasing income is concentrated in New Mexico, California and Texas. | |
| • | Great Lakes Compression, Inc., (“GLC”) (a Colorado corporation) was formed in March 2001 and acquired the assets and certain operations of a business that fabricates, rents, and services natural gas compressors to producers of oil and natural gas, primarily in Michigan. |
Effective January 1, 2004, RGS, GLC and NGE were merged into NGSG.
Cash Equivalents
For purposes of reporting cash flows, the Company considers all short-term investments with an original maturity of three months or less to be cash equivalents.
Restricted Cash
The Company has a Certificate of Deposit for $2 million which is used to secure certain promissory notes issued in the aggregate principal amount of $3 million maturing three years from the date of closing of the acquisition of Screw Compression Systems, Inc. (“SCS”) at January 3, 2005 and secured by a letter of credit in the face amount of $2 million.
Accounts Receivable
The Company’s trade receivables consist of customer obligations for the sale of compressors and flare systems due under normal trade terms and operating leases for the use of the Company’s compressors. The receivables are not collateralized except as provided for under lease agreements. However, the Company requires deposits of as much as 50% for large custom contracts. The Company extends credit based on management’s assessment of the customer’s financial condition, receivable aging, customer disputes and general business and economic conditions. Management believes the allowance for doubtful accounts for trade receivables of $25,000 at December 31, 2004 is adequate.
F-7
Table of Contents
NATURAL GAS SERVICES GROUP, INC. AND SUBSIDIARIES
NOTES TO CONSOLIDATED FINANCIAL STATEMENTS — (Continued)
Inventory
Inventory is valued at the lower of cost or market. The cost of inventories is determined by the weighted average method. At December 31, 2004, inventory consisted of the following (in thousands):
| Raw materials | $ | 3,034 | ||
| Work in process | 1,436 | |||
| $ | 4,470 | |||
Property and Equipment
Property and equipment are recorded at cost less accumulated depreciation and amortization. Depreciation and amortization are computed using the straight-line method over the estimated useful lives of the assets, which range from five to thirty years.
Gains and losses resulting from sales and dispositions of property and equipment are included in current operations. Maintenance and repairs are charged to operations as incurred.
Patents
The Company has patents for a flare tip ignition device and flare tip burner pilot. The costs of the patents are being amortized on a straight-line basis over nine years, the remaining life of the patents when acquired. Amortization expense for patents of $27,000 was recognized for each of the years ended December 31, 2003 and 2004. Amortization expense for each of the next four years is expected to be $27,000 per year.
Goodwill
Goodwill represents the cost in excess of fair value of the identifiable net assets acquired in two acquisitions. Goodwill was being amortized on a straight-line basis over 20 years, but the Company ceased amortization of goodwill effective January 1, 2002 in accordance with Statement of Financial Accounting Standards (“FAS”) No. 142.
FAS 142 requires that goodwill be tested for impairment at least annually. The Company completed its most recent test for goodwill impairment as of December 31, 2004, at which time no impairment was indicated.
Long-Lived Assets
The Company’s policy is to periodically review the net realizable value of its long-lived assets, other than goodwill, through an assessment of the estimated future cash flows related to such assets. In the event that assets are found to be carried at amounts in excess of estimated undiscounted future cash flows, then the assets will be adjusted for impairment to a level commensurate with a discounted cash flow analysis of the underlying assets. Based upon its most recent analysis, the Company believes no impairment of long-lived assets exists at December 31, 2004.
Advertising Costs
Advertising costs are expensed as incurred. Total advertising expense was $46,000 in 2003 and $38,000 in 2004.
F-8
Table of Contents
NATURAL GAS SERVICES GROUP, INC. AND SUBSIDIARIES
NOTES TO CONSOLIDATED FINANCIAL STATEMENTS — (Continued)
Financial Instruments
Management believes that generally the fair value of the Company’s notes payable at December 31, 2004 approximate their carrying values due to the short-term nature of the instruments or the use of prevailing market interest rates.
Revenue Recognition
Revenue from the sales of custom and fabricated compressors, and flare systems is recognized upon shipment of the equipment to customers. Exchange and rebuilt compressor revenue is recognized when both the replacement compressor has been delivered and the rebuild assessment has been completed. Revenue from compressor service and retrofitting services is recognized upon providing services to the customer. Maintenance agreement revenue is recognized as services are rendered. Rental revenue is recognized over the terms of the respective rental agreements. Deferred income represents payments received before a product is shipped.
Per Share Data
Basic earnings per common share is computed using the weighted average number of common shares outstanding during the period. Diluted earnings per common share is computed using the weighted average number of common and common stock equivalent shares outstanding during the period. Common stock equivalent shares are excluded from the computation if their effect is anti-dilutive. In 2003 anti-dilutive shares related to common stock options and warrants and convertible preferred stock totaled 2,156,154. There was no anti-dilutive effect in 2004 since all preferred shares were converted to common shares in 2004.
The following table sets forth the computation of basic and diluted earnings per share (in thousands, except per share amounts):
| Year Ended | ||||||||||
| December 31, | ||||||||||
| 2003 | 2004 | |||||||||
| Numerator: | ||||||||||
| Net income | $ | 1,307 | $ | 3,374 | ||||||
| Less preferred dividends | 121 | 53 | ||||||||
| Income available to common stockholders | 1,186 | 3,321 | ||||||||
| Denominator for basic net income per share: | ||||||||||
| Weighted average common shares outstanding | 4,947 | 5,591 | ||||||||
| Denominator for diluted net income per share: | ||||||||||
| Weighted average common shares outstanding | �� | 4,947 | 5,591 | |||||||
| Dilutive effect of stock options and warrants | 306 | 792 | ||||||||
| Diluted weighted average shares | 5,253 | 6,383 | ||||||||
| Earnings per share: | ||||||||||
| Basic | $ | 0.24 | $ | 0.59 | ||||||
| Diluted | $ | 0.23 | $ | 0.52 | ||||||
F-9
Table of Contents
NATURAL GAS SERVICES GROUP, INC. AND SUBSIDIARIES
NOTES TO CONSOLIDATED FINANCIAL STATEMENTS — (Continued)
Stock-Based Compensation
The Company accounts for stock-based awards to employees using the intrinsic value method described in Accounting Principles Board Opinion (APB) No. 25,Accounting for Stock Issued to Employees, and its related interpretations. Accordingly, no compensation expense has been recognized in the accompanying consolidated financial statements for stock-based awards to employees or directors when the exercise price of the award is equal to or greater than the quoted market price of the stock on the date of the grant.
FAS No. 123,Accounting for Stock-Based Compensationas amended for transition and disclosure by FAS No. 148, requires disclosures as if the Company had applied the fair value method to employee awards rather than the intrinsic value method. The fair value of stock-based awards to employees is calculated through the use of option pricing models, which were developed for use in estimating the fair value of traded options, which have no vesting restrictions and are fully transferable. These models also require subjective assumptions, including future stock price volatility and expected time to exercise, which greatly affect the calculated values. The Company’s fair value calculations for awards from stock option plans in 2003 and 2004 were made using the Black-Scholes option pricing model with the following weighted average assumptions: expected term, ten years from the date of grant; stock price volatility 44% in 2003 and 2004; risk free interest rate of 4.0% in 2003 and 5.25% in 2004 and no dividends during the expected term as the Company does not have a history of paying cash dividends on common stock.
If the computed fair values of the stock-based awards had been amortized to expense over the vesting period of the awards, net income and net income per share, basic and diluted, would have been as follows (in thousands, except per-share amounts):
| Years Ended | ||||||||
| December 31 | ||||||||
| 2003 | 2004 | |||||||
| Net income | $ | 1,307 | $ | 3,374 | ||||
| Less preferred dividends | 121 | 53 | ||||||
| Income available to common stockholders | 1,186 | 3,321 | ||||||
| Deduct: Total stock-based employee compensation expense determined under fair value method for all awards (net of tax) | (39 | ) | (38 | ) | ||||
| Net income, pro forma | $ | 1,147 | $ | 3,283 | ||||
| Net income per share: | ||||||||
| Basic, as reported | $ | 0.24 | $ | 0.59 | ||||
| Basic, pro forma | $ | 0.23 | $ | 0.59 | ||||
| Diluted, as reported | $ | 0.23 | $ | 0.52 | ||||
| Diluted, pro forma | $ | 0.21 | $ | 0.51 | ||||
| Weighted average fair value of options granted during the year | $ | 3.35 | $ | 4.75 | ||||
Description of Rental Arrangements
The Company’s rental operations principally consist of the leasing of natural gas compressor packages and flare stacks. These arrangements are classified as operating leases. See Note 4.
F-10
Table of Contents
NATURAL GAS SERVICES GROUP, INC. AND SUBSIDIARIES
NOTES TO CONSOLIDATED FINANCIAL STATEMENTS — (Continued)
Income Taxes
The Company files a consolidated tax return with its subsidiaries. Deferred tax assets and liabilities are recognized for the future tax consequences attributable to temporary differences between the financial statement carrying amounts of assets and liabilities and their respective tax bases, and operating losses and tax credit carry-forwards. Deferred tax assets and liabilities are measured using enacted tax rates expected to apply to taxable income in the years in which those temporary differences are expected to be recovered or settled.
Use of Estimates
The preparation of the Company’s financial statements in conformity with generally accepted accounting principles requires the Company’s management to make estimates and assumptions that affect the amounts reported in these financial statements and accompanying notes. Actual results could differ from those estimates. Significant estimates include the valuation of assets and goodwill acquired in acquisitions. It is at least reasonably possible these estimates could be revised in the near term and the revisions would be material.
Recently Issued Accounting Pronouncements
On December 16, 2004, the FASB published FASB Statement No. 123 (revised 2004),Share-Based Payment. Statement 123(R) requiring that the compensation cost relating to share-based payment transactions be recognized in financial statements. That cost will be measured based on the fair value of the equity or liability instruments issued. Public entities (other than those filing as small business issuers) will be required to apply Statement 123(R) as of the first interim or annual reporting period that begins after June 15, 2005. Public entities that file as small business issuers will be required to apply Statement 123(R) in the first interim or annual reporting period that begins after December 15, 2005. Statement 123(R) replaces FASB Statement No. 123,Accounting for Stock-Based Compensation, and supersedes APB Opinion No. 25,Accounting for Stock Issued to Employees. Statement 123, as originally issued in 1995, established as preferable a fair-value-based method of accounting for share-based payment transactions with employees. However, that Statement permitted entities the option of continuing to apply the guidance in Opinion 25, as long as the footnotes to financial statements disclosed what net income would have been had the preferable fair-value-based method been used.
| 2. | Property and Equipment |
Property and equipment consists of the following at December 31, 2004 (in thousands):
| Land and building | $ | 1,346 | ||
| Leasehold improvements | 207 | |||
| Office equipment and furniture | 200 | |||
| Software | 143 | |||
| Machinery and equipment | 507 | |||
| Vehicles | 2,177 | |||
| Less accumulated depreciation | (1,446 | ) | ||
| $ | 3,134 | |||
Depreciation expense for property and equipment and the compressors described in Note 4 was $1,681,000 and $2,411,000 for the years ended December 31, 2003 and 2004, respectively.
F-11
Table of Contents
NATURAL GAS SERVICES GROUP, INC. AND SUBSIDIARIES
NOTES TO CONSOLIDATED FINANCIAL STATEMENTS — (Continued)
| 3. | Acquisitions |
On March 31, 2003, the Company acquired 28 gas compressor packages fromHy-Bon Engineering Company, Inc.(“Hy-Bon”). The adjusted purchase price amounted to approximately $2,150,000. As part of the purchase and sale agreement, Hy-Bon withdrew as a member of Hy-Bon Rotary Compression, L.L.C. (“Joint Venture”) effective as of January 1, 2003. The Company, as the other member, retained all assets of the Joint Venture, which had an unaudited aggregate value of $347,000 as of December 31, 2002. The Company dissolved the Joint Venture and agreed not to operate under the name Hy-Bon. The Company consolidated the operations of the Joint Venture beginning January 1, 2003 and began recording its share of the profit of the acquired interest beginning April 1, 2003. Prior to the acquisition, the Company had owned a non-controlling 50% interest in the Joint Venture and accounted for it on the equity method.
On October 18, 2004, Natural Gas Services Group, Inc. entered into a Stock Purchase Agreement with Screw Compression Systems, Inc., or “SCS”, and the stockholders of SCS. Under this agreement, Natural Gas Services Group agreed to purchase all of the outstanding shares of capital stock of SCS.
SCS is a privately owned manufacturer of natural gas compressors, with its principal offices located in Tulsa, Oklahoma.
The stockholders of SCS will receive, in proportionate shares (based on their stock ownership of SCS), total consideration consisting of:
| • | $8 million in cash; | |
| • | promissory notes issued by Natural Gas Services in the aggregate principal amount of $3 million bearing interest at the rate of 4.00% per annum, maturing three years from the date of closing and secured by a letter of credit in the face amount of $2 million; and | |
| • | 609,756 shares of Natural Gas Services common stock. All of the shares, upon issuance, will be “restricted” securities within the meaning of Rule 144 under the Securities Act of 1933, as amended, and will bear a legend to that effect. |
This transaction was completed January 3, 2005 and Natural Gas Services Group Inc will begin reporting combined financial information with SCS in January 2005.
| 4. | Rental Activity |
The Company rents natural gas compressor packages to entities in the petroleum industry. The Company’s cost and accumulated depreciation for the rented compressors as of December 31, 2004 was $27,734,000 and $4,821,000, respectively. These rental arrangements are classified as operating leases and generally have original terms of six months to five years and continue on amonth-to-month basis thereafter. Future minimum rent payments for arrangements not on amonth-to-month basis at December 31, 2004 are as follows (in thousands):
| Year Ended December 31, | ||||
| 2005 | $ | 3,292 | ||
| 2006 | 856 | |||
| 2007 | 342 | |||
| 2008 | 179 | |||
| Total | $ | 4,669 | ||
F-12
Table of Contents
NATURAL GAS SERVICES GROUP, INC. AND SUBSIDIARIES
NOTES TO CONSOLIDATED FINANCIAL STATEMENTS — (Continued)
| 5. | Line of Credit |
The Company has a line of credit with a financial institution that allows for borrowings up to $750,000, bears interest at the prime rate plus 1% and requires monthly interest payments with principal due at maturity on May 15, 2005. The line of credit is collateralized by substantially all of the assets of the Company. At December 31, 2004, there was a $550 outstanding balance on this line of credit.
The Company entered into a new Line of Credit on January 3, 2005 with the same financial institution which allows for borrowings up to $2,000,000, bears interest at the prime rate plus 1% and requires monthly interest payments with principal due at maturity on January 1, 2006. The line of credit is collateralized by substantially all of the assets of the Company. At December 31, 2004, there was no outstanding balance on this line of credit.
The line of credit and first three notes listed in Note 6 below are with the same bank and include certain covenants, the most restrictive of which require the Company to maintain certain working capital, debt to equity and cash flow ratios and certain minimum net worth. The Company was in compliance with all covenants at December 31, 2004.
| 6. | Long-term Debt |
Long-term debt at December 31, 2004 consisted of the following (in thousands):
| Note payable to a bank, interest at bank’s prime rate plus 1.0% but not less than 5.25% (6.25% at December 31, 2004), monthly payments of principal of $170,801 plus interest until maturity on September 15, 2007. The note is collateralized by substantially all of the assets of the Company. See Note 5 regarding loan covenants | $ | 5,301 | ||
| Note payable to a bank, interest at bank’s prime rate plus 1% but not less than 5.25% (6.25% at December 31, 2004). This is an advance line of credit note for $10,000,000. Interest is payable monthly. Principal is due in 60 consecutive payments beginning December 15, 2004 until November 15, 2009. The note is collateralized by substantially all of the assets of the Company. See Note 5 regarding loan covenants | 7,133 | |||
| Note payable to a bank, interest at 7%, monthly payments of principal and interest totaling $2,614 until maturity in September 2010, collateralized by a building | 182 | |||
| Various notes payable to a bank, interest rates ranging from prime plus 1% (6.25% at December 31, 2004) to 7.50% | 177 | |||
| Capital lease | 13 | |||
| Other notes payable for vehicles, various terms | 212 | |||
| Total | 13,018 | |||
| Less current portion | (3,728 | ) | ||
| $ | 9,290 | |||
F-13
Table of Contents
NATURAL GAS SERVICES GROUP, INC. AND SUBSIDIARIES
NOTES TO CONSOLIDATED FINANCIAL STATEMENTS — (Continued)
Maturities of long-term debt based on contractual requirements for the years ending December 31 are as follows (in thousands):
| 2005 | $ | 3,728 | ||
| 2006 | 3,615 | |||
| 2007 | 2,667 | |||
| 2008 | 1,438 | |||
| 2009 | 1,439 | |||
| Thereafter | 131 | |||
| $ | 13,018 | |||
| 7. | Subordinated Notes |
In 2001, the Company completed an offering of units consisting of subordinated debt and warrants. The balance of the subordinated debt, net of unamortized discount of $89,962, is $1,449,299 at December 31, 2004. Each unit consists of a $25,000 10% subordinated note due December 31, 2006 and a five-year warrant to purchase 10,000 shares of the Company’s common stock at $3.25 per share. Interest only is payable annually, with all principal due at maturity. Warrants to purchase 61,570 shares were also granted on the same terms to a placement agent in connection with the offering. Certain stockholders, officers and directors purchased units in the subordinated debt offering, (totaling $259,261 in notes and warrants representing 103,704 shares) on the same terms and conditions as non-affiliated purchasers in the offering. As of December 31, 2004, warrants were outstanding from the offering for the purchase of a total of 548,175 shares.
| 8. | Income Taxes |
The provision for income taxes consists of the following (in thousands):
| 2003 | 2004 | ||||||||
| Current provision: | |||||||||
| Federal | $ | — | $ | — | |||||
| State | 25 | 20 | |||||||
| 25 | 20 | ||||||||
| Deferred provision: | |||||||||
| Federal | 593 | 1,029 | |||||||
| State | 79 | 91 | |||||||
| 672 | 1,120 | ||||||||
| $ | 697 | $ | 1,140 | ||||||
F-14
Table of Contents
NATURAL GAS SERVICES GROUP, INC. AND SUBSIDIARIES
NOTES TO CONSOLIDATED FINANCIAL STATEMENTS — (Continued)
The income tax effects of temporary differences that give rise to significant portions of deferred income tax assets and (liabilities) are as follows (in thousands):
| 2003 | 2004 | |||||||||
| Deferred income tax assets: | ||||||||||
| Net operating loss | $ | 727 | $ | 2,669 | ||||||
| Other | 5 | 7 | ||||||||
| Total deferred income tax assets | 732 | 2,676 | ||||||||
| Deferred income tax liabilities: | ||||||||||
| Property and equipment | (2,410 | ) | (5,483 | ) | ||||||
| Goodwill and other intangible assets | (154 | ) | (142 | ) | ||||||
| Other | (11 | ) | (9 | ) | ||||||
| Total deferred income tax liabilities | (2,575 | ) | (5,634 | ) | ||||||
| Net deferred income tax liabilities | $ | (1,843 | ) | $ | (2,958 | ) | ||||
The effective tax rate differs from the statutory rate as follows:
| 2003 | 2004 | |||||||
| Statutory rate | 34 | % | 34 | % | ||||
| State and local taxes | 5 | % | 3 | % | ||||
| Nontaxable life insurance proceeds | — | (12 | )% | |||||
| Other | (4 | )% | — | |||||
| Effective rate | 35 | % | 25 | % | ||||
At December 31, 2004, the Company had available federal net operating loss (“NOL”) carryforwards of approximately $7,200,000, which may be used to reduce future taxable income and expire in 2020 through 2024. The company also had alternative minimum tax NOL carryforwards of approximately $5,000,000. The company has also accumulated charitable contribution carryforwards of approximately $9,000.
| 9. | Stockholders’ Equity |
Initial Public Offering
In October, 2002, the Company closed an initial public offering in which it sold 1,500,000 shares of common stock and warrants to purchase 1,500,000 shares of common stock for a total of $7,875,000. Costs and commissions associated with the offering totaled $1,346,000. The warrants are exercisable anytime through October 21, 2006 at $6.25 per share. In connection with this offering, the underwriter received options to purchase 150,000 shares of common stock at $6.25 per share and warrants at $0.3125 per share. The warrants, if purchased by the underwriter, will contain an exercise price of $7.81 per share. The underwriter’s options expire in October 2007 and include a cashless exercise provision utilizing the Company’s common stock.
Conversion
We may redeem the warrants upon 30 days’ prior written notice at a price of $.25 per warrant if the closing price of our common stock equals or exceeds $10.9375 for 20 consecutive trading days.
F-15
Table of Contents
NATURAL GAS SERVICES GROUP, INC. AND SUBSIDIARIES
NOTES TO CONSOLIDATED FINANCIAL STATEMENTS — (Continued)
Warrants
In March 2001 and April 2002, five-year warrants to purchase 68,524 shares of common stock at $2.50 per share and 16,472 shares at $3.25 per share, respectively, were issued to certain board members and stockholders as compensation for their debt guarantees. These warrants were immediately exercisable and were recorded at their estimated fair values of $42,025 in 2002 and $23,137 in 2001. All of these warrants remained outstanding as of December 31, 2004.
Preferred Stock
The Company has a total of 5,000,000 authorized preferred shares, with rights and preferences as designated by the Board of Directors. The Company had a private placement of Series A shares in 2001 and 2002. In connection with the offering, the underwriter received warrants to purchase 38,165 shares of common stock at $3.25 per share through December 1, 2006. The Series A shares had a cumulative annual dividend rate of 10%, when and if declared by the Board of Directors payable thirty days after the end of each quarter. Holders were entitled to one vote per share and the Series A shares were convertible into common stock initially at a price of $3.25 per share, subject to adjustment based on the market price and various other contingencies. In addition, Series A shares automatically converted to common stock on a one-for-one basis when the Company’s common stock traded on a public exchange at a price of $6.50 per share or greater for twenty consecutive days. The Series A shares had a liquidation preference of $3.25 per share plus accrued and unpaid dividends over common stock.
In 2003, 38,000 Series A shares were converted to common stock. Total Series A shares outstanding at December 31, 2003 were 343,654.
In accordance with the provisions of the Convertible Series A Preferred Stock, on March 26, 2004 each share of Preferred Stock automatically converted to one share of Common Stock. The conversion occurred after the closing market price of the stock was equal to or higher than $6.50 for 20 consecutive trading days. 343,654 Preferred shares were converted at that time. Dividends payable at the conversion date were approximately $25,355.
Common Stock Private Placement
On July 20, 2004, the Company and CBarney Investments, Ltd. entered into a Securities Purchase Agreement. Under this agreement, the Company issued and sold 649,574 shares of its common stock to CBarney at $7.69736 per share. The per share price was determined by multiplying (x) $8.747, the average closing market price of the common stock on the American Stock Exchange for the twenty consecutive trading days ended July 15, 2004, times (y) eighty-eight percent. The Company received aggregate gross proceeds of $5,000,000 and net proceeds of $4,950,000.
| 10. | Stock-Based Compensation |
Stock Options
In December 1998, the Board of Directors adopted the 1998 Stock Option Plan (the “Plan”). 150,000 shares of common stock have been reserved for issuance under the Plan. All options granted under the Plan will expire ten years after date of grant. The option price is to be determined by the Board of Directors on date of grant. The Company has also issued options that are not subject to the Plan.
In December 2003, the Company granted a total of 12,500 non-qualified stock options to its outside directors to purchase the Company’s common stock at $5.55 per share any time through December 2013. At December 31, 2004, 10,000 of these options were outstanding. Also, in December 2003, options were
F-16
Table of Contents
NATURAL GAS SERVICES GROUP, INC. AND SUBSIDIARIES
NOTES TO CONSOLIDATED FINANCIAL STATEMENTS — (Continued)
granted to employees to purchase 15,000 shares of common stock at $5.58 per share. The employee options vest over three years and expire in December 2013.
In August 2004, options were granted to employees to purchase 38,000 shares of common stock at $7.50 per share. The employee options vest over three years and expire in December 2014.
The following is a summary of activity for the stock options outstanding for the years ended December 31, 2004 and 2003:
| December 31, 2003 | December 31, 2004 | ||||||||||||||||
| Weighted | Weighted | ||||||||||||||||
| Number | Average | Number | Average | ||||||||||||||
| of | Exercise | of | Exercise | ||||||||||||||
| Shares | Price | Shares | Price | ||||||||||||||
| Outstanding, beginning of year | 161,500 | $ | 2.41 | 80,000 | $ | 3.92 | |||||||||||
| Canceled or expired | (9,000 | ) | 3.25 | — | — | ||||||||||||
| Granted | 27,500 | 5.57 | 38,000 | 7.50 | |||||||||||||
| Exercised | (100,000 | ) | 2.00 | (11,000 | ) | 3.23 | |||||||||||
| Outstanding, end of year | 80,000 | $ | 3.92 | 107,000 | $ | 5.26 | |||||||||||
| Exercisable, end of year | 43,000 | $ | 3.68 | 46,000 | $ | 5.06 | |||||||||||
| 11. | Commitments |
401(k) Plan
The Company offers a 401(k) Plan (the “401(k) Plan”) to all employees that have reached the age of eighteen and have completed six months of service. The participants may contribute up to 15% of their salary. Employer contributions are subject to Board discretion and are subject to a vesting schedule of 20% each year after the first year and 100% after six years. The Company contributed $61,000 and $78,000 to the 401(k) Plan in 2003 and 2004, respectively.
Rented Facilities
The facility in Bloomfield, New Mexico is an approximately 4,000 square foot building that is leased at a current rate of $2,650 per month pursuant to a lease that terminates in May 2008. Approximately 1,000 square feet are used as office space and approximately 3,000 square feet are used for shop space. The facility in Bridgeport, Texas is an approximately 4,500 square foot building that is leased at a current rate of $1,500 per month pursuant to a lease that terminates in August 2006. Approximately 4,000 square feet is used as office space and approximately 500 square feet is used as shop space. Future rental payments under these leases for the years ended December 31 are as follows:
| 2005 | $ | 50,000 | ||
| 2006 | 44,000 | |||
| 2007 | 32,000 | |||
| 2008 | 13,000 | |||
| $ | 139,000 | |||
| 12. | Major Customers and Concentration of Credit Risk |
Sales to two customers in the year ended December 31, 2003 amounted to 28% and 10% respectively of consolidated revenue. Sales to two customers in the year ended December 31, 2004 amounted to a total
F-17
Table of Contents
NATURAL GAS SERVICES GROUP, INC. AND SUBSIDIARIES
NOTES TO CONSOLIDATED FINANCIAL STATEMENTS — (Continued)
of 21% and 17% respectively of consolidated revenue. No other single customer accounted for more than 10% of the Company’s sales in 2003 or 2004. At December 31, 2004, two customers accounted for 12% and 10% respectively, of the Company’s trade accounts receivable. The Company generally does not obtain collateral, but requires deposits of as much as 50% on large custom contracts.
| 13. | Other Income |
On March 15, 2004 the President and C.E.O. of the Company, Mr. Wayne L. Vinson, passed away after a battle with cancer. The Company held two life insurance policies on him, one for $1,000,000 and one for $500,000, with the Company as the beneficiary. The proceeds of $1,500,000 were recorded as other income.
| 14. | Segment Information |
FAS No. 131,Disclosures About Segments of an Enterprise and Related Information, establishes standards for public companies relating to the reporting of financial and descriptive information about their operating segments in financial statements. Operating segments are components of an enterprise about which separate financial information is available that is evaluated regularly by chief operating decision makers in deciding how to allocate resources and in assessing performance.
The Company identifies its segments based upon major revenue sources as follows:
For the Year Ended December 31, 2003
| Service & | ||||||||||||||||||||
| Sales | Maintenance | Rental | Corporate | Total | ||||||||||||||||
| (in thousands of dollars) | ||||||||||||||||||||
| Revenue | $ | 3,865 | $ | 1,773 | $ | 7,112 | — | $ | 12,750 | |||||||||||
| Cost of Sales | 2,860 | 1,243 | 1,954 | — | 6,057 | |||||||||||||||
| Gross Margin | $ | 1,005 | $ | 530 | $ | 5,158 | — | $ | 6,693 | |||||||||||
| Operating Expenses | — | — | — | (4,018 | ) | (4,018 | ) | |||||||||||||
| Other Income/(Expense) | — | — | — | (671 | ) | (671 | ) | |||||||||||||
| Net Income before Provision for Income Taxes | $ | 1,005 | $ | 530 | $ | 5,158 | $ | (4,689 | ) | $ | 2,004 | |||||||||
| *Segment Assets | — | — | — | $ | 28,270 | $ | 28,270 | |||||||||||||
F-18
Table of Contents
NATURAL GAS SERVICES GROUP, INC. AND SUBSIDIARIES
NOTES TO CONSOLIDATED FINANCIAL STATEMENTS — (Continued)
For the Year Ended December 31, 2004
| Service & | ||||||||||||||||||||
| Sales | Maintenance | Rental | Corporate | Total | ||||||||||||||||
| (in thousands of dollars) | ||||||||||||||||||||
| Revenue | $ | 3,593 | $ | 1,874 | $ | 10,491 | — | $ | 15,958 | |||||||||||
| Cost of Sales | 2,556 | 1,357 | 3,038 | — | 6,951 | |||||||||||||||
| Gross Margin | $ | 1,037 | $ | 517 | $ | 7,453 | — | $ | 9,007 | |||||||||||
| Operating Expenses | — | — | — | (5,096 | ) | (5,096 | ) | |||||||||||||
| Other Income/(Expense) | — | — | — | 603 | 603 | |||||||||||||||
| Income before Provision for Income Taxes | $ | 1,037 | $ | 517 | $ | 7,453 | $ | (4,493 | ) | $ | 4,514 | |||||||||
| *Segment Assets | — | — | — | $ | 43,255 | $ | 43,255 | |||||||||||||
| * | Management does not track assets by segment. |
| 15. | Subsequent Events |
As described in Note 3, on January 3, 2005 the Company completed the acquisition of Screw Compression Systems, Inc (“SCS”). In connection with the acquisition of SCS, on January 3, 2005 the Company, as borrower, and SCS, as guarantor, entered into a Third Amended and Restated Loan Agreement with Western National Bank (or WNB) for the following purposes:
| • | to facilitate the purchase of SCS | |
| • | to refinance SCS’ existing real estate debt; | |
| • | to increase the amount of funds available for general working capital purposes; | |
| • | to modify our existing term loan facility; and | |
| • | to reflect the availability of additional funds for the construction of new compressor units for rent and resale. |
The Loan Agreement provides for three term loan facilities, a revolving line of credit facility and an advancing term loan facility. The three term loan facilities are evidenced by three separate notes, two of which reflect new loans in the original principal amounts of $8,000,000 and $1,415,836, respectively, and one of which reflects our existing term loan evidenced by the $7,521,109 Term Note, as modified by the Modification Agreement. All outstanding principal under the $8,000,000 note is due and payable on January 1, 2012, and all outstanding principal under the $1,415,836 note is due and payable on January 1, 2010. The $7,521,109 Term Note evidences our existing term loan facility.
F-19
Table of Contents
NATURAL GAS SERVICES GROUP, INC. AND SUBSIDIARIES
NOTES TO CONSOLIDATED FINANCIAL STATEMENTS — (Continued)
REPORT OF INDEPENDENT REGISTERED PUBLIC ACCOUNTING FIRM
The Board of Directors
Natural Gas Services Group, Inc.
We have audited the accompanying consolidated balance sheet of Natural Gas Services Group, Inc. and Subsidiaries (the “Company”) as of December 31, 2003, and the related consolidated statements of income, stockholders’ equity and cash flows for the years ended December 31, 2002 and 2003. These financial statements are the responsibility of the Company’s management. Our responsibility is to express an opinion on these financial statements based on our audits.
We conducted our audits in accordance with the standards of the Public Company Accounting Oversight Board (United States). Those standards require that we plan and perform the audits to obtain reasonable assurance about whether the financial statements are free of material misstatement. An audit includes examining, on a test basis, evidence supporting the amounts and disclosures in the financial statements. An audit also includes assessing the accounting principles used and significant estimates made by management as well as evaluating the overall financial statement presentation. We believe that our audits provide a reasonable basis for our opinion.
In our opinion, the consolidated financial statements referred to above present fairly, in all material respects, the financial position of the Company as of December 31, 2003, and the results of its operations and its cash flows for the years ended December 31, 2002 and 2003 in conformity with U.S. generally accepted accounting principles.
| /s/Hein & Associates llp |
Dallas, Texas
February 13, 2004
F-20
Table of Contents
NATURAL GAS SERVICES GROUP, INC. AND SUBSIDIARIES
CONSOLIDATED BALANCE SHEET
(all amounts in thousands, except per-share amounts)
| December 31, | ||||||
| 2003 | ||||||
| ASSETS | ||||||
CURRENT ASSETS: | ||||||
| Cash and cash equivalents | $ | 176 | ||||
| Trade accounts receivable, net of doubtful accounts of $5 | 817 | |||||
| Inventory | 2,554 | |||||
| Prepaid expense and other | 107 | |||||
| Total current assets | 3,654 | |||||
RENTAL EQUIPMENT,net of accumulated depreciation of $2,979 | 18,986 | |||||
PROPERTY AND EQUIPMENT,net of accumulated depreciation of $907 | 2,818 | |||||
GOODWILL,net of accumulated amortization of $325 | 2,590 | |||||
PATENTS,net of accumulated amortization of $137 | 114 | |||||
OTHER ASSETS | 108 | |||||
| Total assets | $ | 28,270 | ||||
| LIABILITIES AND STOCKHOLDERS’ EQUITY | ||||||
CURRENT LIABILITIES: | ||||||
| Current portion of long-term debt and capital lease | $ | 2,364 | ||||
| Line of credit | 300 | |||||
| Accounts payable and accrued liabilities | 1,071 | |||||
| Deferred income | 207 | |||||
| Total current liabilities | 3,942 | |||||
LONG-TERM DEBT AND CAPITAL LEASE,less current portion | 6,651 | |||||
SUBORDINATED NOTES,net of discount of $130 | 1,409 | |||||
DEFERRED TAX LIABILITY | 1,843 | |||||
COMMITMENT(Note 11) | ||||||
STOCKHOLDERS’ EQUITY: | ||||||
| Preferred stock, 5,000 shares authorized, par value $0.01: | ||||||
| 10% Convertible Series A: 382 shares authorized, 344 shares outstanding; 10% cumulative, liquidation preference of $1,117 | 4 | |||||
| Common stock, 30,000 shares authorized, par value $0.01; 5,031 shares issued and outstanding | 50 | |||||
| Additional paid-in capital | 11,205 | |||||
| Retained earnings | 3,166 | |||||
| Total stockholders’ equity | 14,425 | |||||
| Total liabilities and stockholders’ equity | $ | 28,270 | ||||
See accompanying notes to these consolidated financial statements.
F-21
Table of Contents
NATURAL GAS SERVICES GROUP, INC. AND SUBSIDIARIES
CONSOLIDATED STATEMENTS OF INCOME
(all amounts in thousands, except per-share amounts)
| For the Years Ended | ||||||||||
| December 31, | ||||||||||
| 2002 | 2003 | |||||||||
REVENUE: | ||||||||||
| Sales, net | $ | 4,336 | $ | 3,865 | ||||||
| Service and maintenance income | 1,563 | 1,773 | ||||||||
| Rental income and interest | 4,398 | 7,112 | ||||||||
| Total revenue | 10,297 | 12,750 | ||||||||
OPERATING COSTS AND EXPENSES: | ||||||||||
| Cost of sales, exclusive of depreciation shown separately below | 3,078 | 2,860 | ||||||||
| Cost of service, exclusive of depreciation shown separately below | 1,327 | 1,243 | ||||||||
| Cost of leasing, exclusive of depreciation shown separately below | 1,167 | 1,954 | ||||||||
| Selling expenses | 500 | 679 | ||||||||
| General and administrative | 1,218 | 1,613 | ||||||||
| Depreciation and amortization | 1,166 | 1,726 | ||||||||
| Total operating costs and expenses | 8,456 | 10,075 | ||||||||
OPERATING INCOME | 1,841 | 2,675 | ||||||||
OTHER INCOME (EXPENSE): | ||||||||||
| Interest Expense | (975 | ) | (667 | ) | ||||||
| Equity in earnings of joint venture | 485 | — | ||||||||
| Other income (expense) | 19 | (4 | ) | |||||||
| Total other income (expense) | (471 | ) | (671 | ) | ||||||
INCOME BEFORE PROVISION FOR INCOME TAXES | 1,370 | 2,004 | ||||||||
PROVISION FOR INCOME TAXES: | ||||||||||
| Current | 26 | 25 | ||||||||
| Deferred | 558 | 672 | ||||||||
| Total income tax expense | 584 | 697 | ||||||||
NET INCOME | 786 | 1,307 | ||||||||
PREFERRED DIVIDENDS | 107 | 121 | ||||||||
INCOME AVAILABLE TO COMMON STOCKHOLDERS | $ | 679 | $ | 1,186 | ||||||
EARNINGS PER COMMON SHARE: | ||||||||||
| Basic | $ | 0.19 | $ | 0.24 | ||||||
| Diluted | $ | 0.16 | $ | 0.23 | ||||||
WEIGHTED AVERAGE COMMON SHARES OUTSTANDING: | ||||||||||
| Basic | 3,649 | 4,947 | ||||||||
| Diluted | 4,305 | 5,253 | ||||||||
See accompanying notes to these consolidated financial statements.
F-22
Table of Contents
NATURAL GAS SERVICES GROUP, INC. AND SUBSIDIARIES
CONSOLIDATED STATEMENTS OF STOCKHOLDERS’ EQUITY
For the Years Ended December 31, 2002 and 2003
(all amounts in thousands)
| Preferred Stock | Common Stock | Additional | Total | |||||||||||||||||||||||||
| Paid-In | Retained | Stockholders’ | ||||||||||||||||||||||||||
| Shares | Amount | Shares | Amount | Capital | Earnings | Equity | ||||||||||||||||||||||
BALANCES, January 1, 2002 | 377 | $ | 4 | 3,358 | $ | 34 | $ | 4,443 | $ | 1,300 | $ | 5,781 | ||||||||||||||||
| Issuance of preferred stock | 5 | — | — | — | 12 | — | 12 | |||||||||||||||||||||
| Issuance of common stock and warrants | — | — | 1,500 | 15 | 6,514 | — | 6,529 | |||||||||||||||||||||
| Warrants issued for debt guaranty | — | — | — | — | 42 | — | 42 | |||||||||||||||||||||
| Repurchase of warrants | — | — | — | — | (43 | ) | — | (43 | ) | |||||||||||||||||||
| Dividends on preferred stock | — | — | — | — | — | (106 | ) | (106 | ) | |||||||||||||||||||
| Net income | — | — | — | — | — | 786 | 786 | |||||||||||||||||||||
BALANCES, January 1, 2003 | 382 | 4 | 4,858 | 49 | 10,968 | 1,980 | 13,001 | |||||||||||||||||||||
| Exercise of common stock options and warrants | — | — | 135 | 1 | 237 | — | 238 | |||||||||||||||||||||
| Conversion of preferred stock to common stock | (38 | ) | — | 38 | — | — | — | — | ||||||||||||||||||||
| Dividends on preferred stock | — | — | — | — | — | (121 | ) | (121 | ) | |||||||||||||||||||
| Net Income | — | — | — | — | — | 1,307 | 1,307 | |||||||||||||||||||||
BALANCES, December 31, 2003 | 344 | $ | 4 | 5,031 | $ | 50 | $ | 11,205 | $ | 3,166 | $ | 14,425 | ||||||||||||||||
See accompanying notes to these consolidated financial statements.
F-23
Table of Contents
NATURAL GAS SERVICES GROUP, INC. AND SUBSIDIARIES
CONSOLIDATED STATEMENTS OF CASH FLOWS
(all amounts in thousands)
| For the Years Ended | ||||||||||||
| December 31, | ||||||||||||
| 2002 | 2003 | |||||||||||
CASH FLOWS FROM OPERATING ACTIVITIES: | ||||||||||||
| Net income | $ | 786 | $ | 1,307 | ||||||||
| Adjustments to reconcile net income to net cash provided by operating activities: | ||||||||||||
| Depreciation and amortization | 1,166 | 1,726 | ||||||||||
| Deferred taxes | 558 | 672 | ||||||||||
| Amortization of debt issuance costs | 70 | 65 | ||||||||||
| Gain on disposal of assets | (15 | ) | 18 | |||||||||
| Warrants issued for debt guarantee | 42 | — | ||||||||||
| Equity in earnings of joint venture | (485 | ) | — | |||||||||
| Changes in current assets: | ||||||||||||
| Trade and other receivables | 277 | (392 | ) | |||||||||
| Inventory | 140 | (1,078 | ) | |||||||||
| Prepaid expenses and other | (12 | ) | 66 | |||||||||
| Changes in current liabilities: | ||||||||||||
| Accounts payable and accrued liabilities: | (349 | ) | 543 | |||||||||
| Deferred income | 134 | 174 | ||||||||||
| Other changes | (106 | ) | (77 | ) | ||||||||
| Net cash provided by operating activities | 2,206 | 3,024 | ||||||||||
CASH FLOWS FROM INVESTING ACTIVITIES: | ||||||||||||
| Purchase of property and equipment | (4,415 | ) | (7,882 | ) | ||||||||
| Proceeds from sale of property and equipment | 40 | 120 | ||||||||||
| Distribution from equity method investment | 405 | 108 | ||||||||||
| Decrease in lease receivable | 85 | 210 | ||||||||||
| Net cash used in investing activities | (3,885 | ) | (7,444 | ) | ||||||||
CASH FLOWS FROM FINANCING ACTIVITIES: | ||||||||||||
| Net proceeds from lines of credit | — | 300 | ||||||||||
| Proceeds from long-term debt | 1,957 | 3,479 | ||||||||||
| Repayments of long-term debt | (4,463 | ) | (2,014 | ) | ||||||||
| Dividends on preferred stock | (107 | ) | (121 | ) | ||||||||
| Proceeds from sale of stock and exercise of stock options and warrants | 6,529 | 238 | ||||||||||
| Net proceeds from preferred stock sales | 13 | — | ||||||||||
| Purchase of warrants from underwriter | (43 | ) | — | |||||||||
| Net cash provided by financing activities | 3,886 | 1,882 | ||||||||||
NET CHANGE IN CASH | 2,207 | (2,538 | ) | |||||||||
CASH,beginning of year | 507 | 2,714 | ||||||||||
CASH,end of year | $ | 2,714 | $ | 176 | ||||||||
SUPPLEMENTAL DISCLOSURES OF CASH FLOW INFORMATION: | ||||||||||||
| Interest paid | $ | 976 | $ | 667 | ||||||||
| Income taxes paid | $ | 4 | $ | 35 | ||||||||
See accompanying notes to these consolidated financial statements.
F-24
Table of Contents
NATURAL GAS SERVICES GROUP, INC. AND SUBSIDIARIES
NOTES TO CONSOLIDATED FINANCIAL STATEMENTS
| 1. | Summary of Significant Accounting Policies |
Organization and Principles of Consolidation
Natural Gas Services Group, Inc. (the “Company” or “NGSG”) (a Colorado corporation) was formed on December 18, 1998 for the purposes of combining the operations of certain manufacturing, service and leasing entities.
As of December 31, 2003, NGSG conducted its operations through the following wholly-owned subsidiaries:
| • | Rotary Gas Systems, Inc. (“RGS”) (a Texas corporation) is engaged in the manufacturing and distribution of natural gas compressor packages for use in the petroleum industry and natural gas flare stacks and ignition systems for use in oilfield, refinery, petrochemical plant, and landfill applications in New Mexico, California and Texas. | |
| • | NGE Leasing, Inc. (“NGE”) (a Texas corporation) is engaged in leasing natural gas compressor packages to entities in the petroleum industry and irrigation motor units to entities in the agricultural industry. NGE’s leasing income is concentrated in New Mexico, California and Texas. | |
| • | Great Lakes Compression, Inc., (“GLC”) (a Colorado corporation) was formed in March 2001 and acquired the assets and certain operations of a business that fabricates, rents, and services natural gas compressors to producers of oil and natural gas, primarily in Michigan. |
Effective January 1, 2004, RGS, GLC and NGE were merged into NGSG.
The accompanying financial statements present the consolidated results of the Company and its wholly-owned subsidiaries. Investments in joint ventures in which the Company does not have majority voting control are accounted for by the equity method. All intercompany balances and transactions have been eliminated in consolidation.
Cash Equivalents
For purposes of reporting cash flows, the Company considers all short-term investments with an original maturity of three months or less to be cash equivalents.
Accounts Receivable
The Company’s trade receivables consist of customer obligations for the sale of compressors and flare systems due under normal trade terms and operating leases for the use of the Company’s compressors. The receivables are not collateralized except as provided for under lease agreements. However, the Company requires deposits of as much as 50% for large custom contracts. The Company extends credit based on management’s assessment of the customer’s financial condition, receivable aging, customer disputes and general business and economic conditions. Management believes the allowance for doubtful accounts for trade receivables of $5,000 at December 31, 2003 is adequate.
F-25
Table of Contents
NATURAL GAS SERVICES GROUP, INC. AND SUBSIDIARIES
NOTES TO CONSOLIDATED FINANCIAL STATEMENTS — (Continued)
Inventory
Inventory is valued at the lower of cost or market. The cost of inventories in 2003 was determined by the weighted average method and previously by thefirst-in, first-out method. The effect of changing the inventory method in 2003 was not material. At December 31, 2003, inventory consisted of the following (in thousands):
| Raw materials | $ | 1,970 | ||
| Work in process | 584 | |||
| $ | 2,554 | |||
Property and Equipment
Property and equipment are recorded at cost less accumulated depreciation and amortization. Depreciation and amortization are computed using the straight-line method over the estimated useful lives of the assets, which range from five to thirty years.
Gains and losses resulting from sales and dispositions of property and equipment are included in current operations. Maintenance and repairs are charged to operations as incurred.
Patents
The Company has patents for a flare tip ignition device and flare tip burner pilot. The costs of the patents are being amortized on a straight-line basis over nine years, the remaining life of the patents when acquired. Amortization expense for patents of $27,000 was recognized for each of the years ended December 31, 2002 and 2003. Amortization expense for each of the next four years is expected to be $27,000 per year.
Goodwill
Goodwill represents the cost in excess of fair value of the identifiable net assets acquired in two acquisitions. Goodwill was being amortized on a straight-line basis over 20 years, but the Company ceased amortization of goodwill effective January 1, 2002 in accordance with Statement of Financial Accounting Standards (“FAS”) No. 142.
FAS 142 requires that goodwill be tested for impairment at least annually. The Company completed its most recent test for goodwill impairment as of June 30, 2003, at which time no impairment was indicated.
Long-Lived Assets
The Company’s policy is to periodically review the net realizable value of its long-lived assets, other than goodwill, through an assessment of the estimated future cash flows related to such assets. In the event that assets are found to be carried at amounts in excess of estimated undiscounted future cash flows, then the assets will be adjusted for impairment to a level commensurate with a discounted cash flow analysis of the underlying assets. Based upon its most recent analysis, the Company believes no impairment of long-lived assets exists at December 31, 2003.
Advertising Costs
Advertising costs are expensed as incurred. Total advertising expense was $50,000 in 2002 and $46,000 in 2003.
F-26
Table of Contents
NATURAL GAS SERVICES GROUP, INC. AND SUBSIDIARIES
NOTES TO CONSOLIDATED FINANCIAL STATEMENTS — (Continued)
Financial Instruments
Management believes that generally the fair value of the Company’s notes payable at December 31, 2003 approximate their carrying values due to the short-term nature of the instruments or the use of prevailing market interest rates.
Revenue Recognition
Revenue from the sales of custom and fabricated compressors, and flare systems is recognized upon shipment of the equipment to customers. Exchange and rebuilt compressor revenue is recognized when both the replacement compressor has been delivered and the rebuild assessment has been completed. Revenue from compressor service, and retrofitting services is recognized upon providing services to the customer. Maintenance agreement revenue is recognized as services are rendered. Rental revenue is recognized over the terms of the respective agreements. Deferred income represents payments received before a product is shipped.
Per Share Data
Basic earnings per common share is computed using the weighted average number of common shares outstanding during the period. Diluted earnings per common share is computed using the weighted average number of common and common stock equivalent shares outstanding during the period. Common stock equivalent shares are excluded from the computation if their effect is antidilutive. In 2002 and 2003, antidilutive shares related to common stock options and warrants and convertible preferred stock totaled 2,181,654 and 2,156,154, respectively.
The following table sets forth the computation of basic and diluted earnings per share (in thousands, except per share amounts):
| Year Ended | ||||||||||
| December 31, | ||||||||||
| 2002 | 2003 | |||||||||
| Numerator: | ||||||||||
| Net income | $ | 786 | $ | 1,307 | ||||||
| Less preferred dividends | 107 | 121 | ||||||||
| Income available to common stockholders | 679 | 1,186 | ||||||||
| Denominator for basic net income per share: | ||||||||||
| Weighted average common shares outstanding | 3,649 | 4,947 | ||||||||
| Denominator for diluted net income per share: | ||||||||||
| Weighted average common shares outstanding | 3,649 | 4,947 | ||||||||
| Dilutive effect of stock options and warrants | 656 | 306 | ||||||||
| Diluted weighted average shares | 4,305 | 5,253 | ||||||||
| Earnings per share: | ||||||||||
| Basic | $ | 0.19 | $ | 0.24 | ||||||
| Diluted | $ | 0.16 | $ | 0.23 | ||||||
Stock-Based Compensation
The Company accounts for stock-based awards to employees using the intrinsic value method described in Accounting Principles Board Opinion (APB) No. 25, Accounting for Stock Issued to
F-27
Table of Contents
NATURAL GAS SERVICES GROUP, INC. AND SUBSIDIARIES
NOTES TO CONSOLIDATED FINANCIAL STATEMENTS — (Continued)
Employees, and its related interpretations. Accordingly, no compensation expense has been recognized in the accompanying consolidated financial statements for stock-based awards to employees or directors when the exercise price of the award is equal to or greater than the quoted market price of the stock on the date of the grant.
FAS No. 123, Accounting for Stock-Based Compensation, and FAS No. 148, Accounting for Stock-Based Compensation — Transition and Disclosure — an Amendment of FASB Statement No. 123, requires disclosures as if the Company had applied the fair value method to employee awards rather than the intrinsic value method. The fair value of stock-based awards to employees is calculated through the use of option pricing models, which were developed for use in estimating the fair value of traded options, which have no vesting restrictions and are fully transferable. These models also require subjective assumptions, including future stock price volatility and expected time to exercise, which greatly affect the calculated values. The Company’s fair value calculations for awards from stock option plans in 2003 and 2002 were made using the Black-Scholes option pricing model with the following weighted average assumptions: expected term, ten years from the date of grant; stock price volatility 50% in 2002 and 44% in 2003; risk free interest rate 5.2% in 2002 and 4.0% in 2003 and no dividends during the expected term as the Company does not have a history of paying cash dividends.
If the computed fair values of the stock-based awards had been amortized to expense over the vesting period of the awards, net income and net income per share, basic and diluted, would have been as follows (in thousands, except per share amounts):
| Years Ended | ||||||||
| December 31, | ||||||||
| 2002 | 2003 | |||||||
| Net income | $ | 786 | $ | 1,307 | ||||
| Less: preferred dividends | 107 | 121 | ||||||
| Income available to common stockholders | 679 | 1,186 | ||||||
| Add: Stock-based employee compensation included in reported net income | — | — | ||||||
| Deduct: Total stock-based employee compensation expense determined under fair value method for all awards | (39 | ) | (39 | ) | ||||
| Net income, pro forma | $ | 640 | $ | 1,147 | ||||
| Net income per share: | ||||||||
| Basic, as reported | $ | 0.19 | $ | 0.24 | ||||
| Basic, pro forma | $ | 0.18 | $ | 0.23 | ||||
| Diluted, as reported | $ | 0.16 | $ | 0.23 | ||||
| Diluted, pro forma | $ | 0.15 | $ | 0.21 | ||||
| Weighted average fair value of options granted during the year | $ | 2.24 | $ | 3.35 | ||||
Description of Rental Arrangements
The Company’s rental operations principally consist of the leasing of natural gas compressor packages and flare stacks. These arrangements are classified as operating leases. See Note 4.
F-28
Table of Contents
NATURAL GAS SERVICES GROUP, INC. AND SUBSIDIARIES
NOTES TO CONSOLIDATED FINANCIAL STATEMENTS — (Continued)
Income Taxes
The Company files a consolidated tax return with its subsidiaries. Deferred tax assets and liabilities are recognized for the future tax consequences attributable to temporary differences between the financial statement carrying amounts of assets and liabilities and their respective tax bases, and operating losses and tax credit carryforwards. Deferred tax assets and liabilities are measured using enacted tax rates expected to apply to taxable income in the years in which those temporary differences are expected to be recovered or settled.
Use of Estimates
The preparation of the Company’s financial statements in conformity with generally accepted accounting principles requires the Company’s management to make estimates and assumptions that affect the amounts reported in these financial statements and accompanying notes. Actual results could differ from those estimates. Significant estimates include the valuation of assets and goodwill acquired in acquisitions. It is at least reasonably possible these estimates could be revised in the near term and the revisions would be material.
Recently Issued and Accounting Pronouncements
In December 2002, the FASB issued FAS No. 148, Accounting for Stock-Based Compensation — Transition and Disclosure — an Amendment of FASB Statement 123. For entities that change their accounting for stock-based compensation from the intrinsic method to the fair value method under FAS 123, the fair value method is to be applied. Two transition methods are permitted for adoption of the fair value method. The entity can choose to either (i) restate all periods presented (retroactive restatement method) or (ii) recognize compensation cost from the beginning of the fiscal year of adoption as if the fair value method had been used to account for awards (modified prospective method). The Company currently accounts for its stock-based compensation using the intrinsic value method as proscribed by APB Opinion No. 25, Accounting for Stock Issued to Employees, and plans on continuing using this method to account for stock options; therefore, it does not intend to adopt the transition requirements as specified in FAS 148.
In June 2003, the FASB approved SFAS 150, Accounting for Certain Financial Instruments with Characteristics of Both Liabilities and Equity. SFAS 150 establishes standards for how an issuer classifies and measures certain financial instruments with characteristics of both liabilities and equity. This statement is effective for financial instruments entered into or modified after May 31, 2003, and otherwise was effective at the beginning of the Company’s third quarter of fiscal 2003. Implementation of SFAS 150 did not affect the Company’s financial position.
F-29
Table of Contents
NATURAL GAS SERVICES GROUP, INC. AND SUBSIDIARIES
NOTES TO CONSOLIDATED FINANCIAL STATEMENTS — (Continued)
| 2. | Property and Equipment |
Property and equipment consists of the following at December 31, 2003 (in thousands):
| Land and building | $ | 1,346 | ||
| Leasehold improvements | 150 | |||
| Office equipment and furniture | 153 | |||
| Software | 126 | |||
| Machinery and equipment | 424 | |||
| Vehicles | 1,526 | |||
| Less accumulated depreciation | (907 | ) | ||
| $ | 2,818 | |||
Depreciation expense for property and equipment and the compressors described in Note 4 was $1,138,000 and $1,681,000 for the years ended December 31, 2002 and 2003, respectively.
| 3. | Acquisition |
On March 31, 2003, the Company acquired 28 gas compressor packages from Hy-Bon Engineering Company, Inc. (“Hy-Bon”). The adjusted purchase price amounted to approximately $2,150,000. As part of the purchase and sale agreement, Hy-Bon withdrew as a member of Hy-Bon Rotary Compression, L.L.C. (“Joint Venture”) effective as of January 1, 2003. The Company, as the other member, retained all assets of the Joint Venture, which had an unaudited aggregate value of $346,000 as of December 31, 2002. The Company dissolved the Joint Venture and agreed not to operate under the name Hy-Bon. The Company consolidated the operations of the Joint Venture beginning January 1, 2003 and began recording its share of the profit of the acquired interest beginning April 1, 2003. Prior to the acquisition, the Company had owned a non-controlling 50% interest in the Joint Venture and accounted for it on the equity method.
| 4. | Rental Activity |
The Company rents natural gas compressor packages to entities in the petroleum industry. The Company’s cost and accumulated depreciation for the leased compressors as of December 31, 2003 was $21,965,000 and $2,979,000, respectively. These leases are classified as operating leases and generally have original terms of one to five years and continue on amonth-to-month basis thereafter. Future minimum rent payments for arrangements not on amonth-to-month basis at December 31, 2003 are as follows (in thousands):
| Year Ended December 31, | ||||
| 2004 | $ | 3,549 | ||
| 2005 | 1,935 | |||
| 2006 | 235 | |||
| 2007 | 85 | |||
| Total | $ | 5,804 | ||
| 5. | Line of Credit |
The Company has a line of credit with a financial institution that allows for borrowings up to $750,000, bears interest at the prime rate plus 1% (5.00% at December 31, 2003) and requires monthly
F-30
Table of Contents
NATURAL GAS SERVICES GROUP, INC. AND SUBSIDIARIES
NOTES TO CONSOLIDATED FINANCIAL STATEMENTS — (Continued)
interest payments with principal due at maturity on March 26, 2004. The line of credit is collateralized by substantially all of the assets of the Company. At December 31, 2003, $300,000 was outstanding under this line of credit.
The line of credit and first three notes listed in Note 6 below are with the same bank and include certain covenants, the most restrictive of which require the Company to maintain certain working capital, debt to equity and cash flow ratios and certain minimum net worth. The Company was in compliance with all covenants at December 31, 2003.
| 6. | Long-Term Debt |
Long-term debt at December 31, 2003 consisted of the following (in thousands):
| Note payable to a bank, interest at bank’s prime rate plus 1.0% but not less than 5.25% (5.25% at December 31, 2003), monthly payments of principal of $170,801 plus interest until maturity on September 15, 2007. The note is collateralized by substantially all of the assets | $ | 7,350 | ||
| Note payable to a bank, interest at bank’s prime rate plus 1% but not less than 5.25% (5.25% at December 31, 2003). This is an advance line credit note for $10,000,000. Interest is payable monthly. Principal is due in 60 consecutive payments beginning December 15, 2004 until November 15, 2009. The note is collateralized by substantially all of the assets of the Company. See Note 5 regarding loan covenants | 750 | |||
| Note payable to a bank, interest at 7%, monthly payments of principal and interest totaling $2,614 until maturity in September 2010, collateralized by a building | 200 | |||
| Note payable to an individual, interest at 7%, monthly payments of principal and interest totaling $1,255 until maturity in October 2009. This note is collateralized by a building | 72 | |||
| Various notes payable to a bank, interest rates ranging from prime plus 1% (5.00% at December 31, 2003) to 7.50% | 312 | |||
| Capital lease | 29 | |||
| Other notes payable for vehicles, various terms | 302 | |||
| Total | 9,015 | |||
| Less current portion | (2,364 | ) | ||
| $ | 6,651 | |||
Maturities of long-term debt based on contractual requirements for the years ending December 31 are as follows (in thousands):
| 2004 | $ | 2,364 | ||
| 2005 | 2,451 | |||
| 2006 | 2,337 | |||
| 2007 | 1,377 | |||
| 2008 | 174 | |||
| Thereafter | 312 | |||
| $ | 9,015 | |||
F-31
Table of Contents
NATURAL GAS SERVICES GROUP, INC. AND SUBSIDIARIES
NOTES TO CONSOLIDATED FINANCIAL STATEMENTS — (Continued)
| 7. | Subordinated Notes |
In 2001, the Company completed an offering of units consisting of subordinated debt and warrants. The balance of the subordinated debt, net of unamortized discount of $130,000, is $1,409,000 at December 31, 2003. Each unit consists of a $25,000 10% subordinated note due December 31, 2006 and a five-year warrant to purchase 10,000 shares of the Company’s common stock at $3.25 per share. Interest only is payable annually, with all principal due at maturity. Warrants to purchase 61,570 shares were also granted on the same terms to a placement agent in connection with the offering. Certain stockholders, officers and directors purchased units in the subordinated debt offering (totaling $259,261 in notes and warrants representing 103,704 shares), on the same terms and conditions as non-affiliated purchasers in the offering. As of December 31, 2003, warrants were outstanding from the offering for the purchase of a total of 626,175 shares.
| 8. | Income Taxes |
The provision for income taxes consists of the following (in thousands):
| 2002 | 2003 | ||||||||
| Current provision: | |||||||||
| Federal | $ | — | $ | — | |||||
| State | 26 | 25 | |||||||
| 26 | 25 | ||||||||
| Deferred provision: | |||||||||
| Federal | 492 | 593 | |||||||
| State | 66 | 79 | |||||||
| 558 | 672 | ||||||||
| $ | 584 | $ | 697 | ||||||
The income tax effects of temporary differences that give rise to significant portions of deferred income tax assets and (liabilities) are as follows (in thousands):
| 2002 | 2003 | |||||||||
| Deferred income tax assets: | ||||||||||
| Net operating loss | $ | 892 | $ | 727 | ||||||
| Other | 48 | 5 | ||||||||
| Total deferred income tax assets | 940 | 732 | ||||||||
| Deferred income tax liabilities: | ||||||||||
| Property and equipment | (1,962 | ) | (2,410 | ) | ||||||
| Goodwill and other intangible assets | (149 | ) | (154 | ) | ||||||
| Other | — | (11 | ) | |||||||
| Total deferred income tax liabilities | (2,111 | ) | (2,575 | ) | ||||||
| Net deferred income tax liabilities | $ | (1,171 | ) | $ | (1,843 | ) | ||||
F-32
Table of Contents
NATURAL GAS SERVICES GROUP, INC. AND SUBSIDIARIES
NOTES TO CONSOLIDATED FINANCIAL STATEMENTS — (Continued)
The effective tax rate differs from the statutory rate as follows:
| 2002 | 2003 | |||||||
| Statutory rate | 34 | % | 34 | % | ||||
| State and local taxes | 7 | % | 5 | % | ||||
| Other | 2 | % | (4 | )% | ||||
| Effective rate | 43 | % | 35 | % | ||||
At December 31, 2003, the Company had available federal net operating loss (“NOL”) carryforwards of approximately $1,970,000, which may be used to reduce future taxable income and expire in 2020 through 2023.
| 9. | Stockholders’ Equity |
Initial Public Offering
In October 2002, the Company closed an initial public offering in which it sold 1,500,000 shares of common stock and warrants to purchase 1,500,000 shares of common stock for a total of $7,875,000. Costs and commissions associated with the offering totaled $1,346,000. The warrants are exercisable anytime through October 2006 at $6.25 per share. In connection with this offering, the underwriter received options to purchase 150,000 shares of common stock at $6.25 per share and warrants at $0.3125 per share. The warrants, if purchased by the underwriter, will contain an exercise price of $7.81 per share. The underwriter’s options expire in October 2007 and include a cashless exercise provision utilizing the Company’s common stock.
Warrants
In April 2002 and March 2001, five-year warrants to purchase 16,472 shares of common stock at $3.25 per share and 68,524 shares at $2.50 per share, respectively, were issued to certain board members and stockholders as compensation for their debt guarantees. These warrants were immediately exercisable and were recorded at their estimated fair values of $23,137 in 2001 and $42,025 in 2002. All of these warrants remained outstanding as of December 31, 2003.
Preferred Stock
The Company has a total of 5,000,000 authorized preferred shares, with rights and preferences as designated by the Board of Directors. Of the preferred shares, 381,654 shares are designated 10% Convertible Series A Preferred Stock. (The number of Series A shares authorized was reduced from 1,177,000 to 381,654 in 2003.) The Series A shares have a cumulative annual dividend rate of 10%, when and if declared by the Board of Directors payable thirty days after the end of each quarter. Holders are entitled to one vote per share and the Series A shares are convertible into common stock initially at a price of $3.25 per share, subject to adjustment based on the market price and various other contingencies. In addition, Series A shares will automatically be converted to common stock on a one-for-one basis if or when the Company’s common stock trades on a public exchange at a price of $6.50 per share or greater for twenty consecutive days. The Series A shares have a liquidation preference of $3.25 per share plus accrued and unpaid dividends over common stock. In connection with the offering, the underwriter received warrants to purchase 38,165 shares of common stock at $3.25 per share through December 1, 2006.
F-33
Table of Contents
NATURAL GAS SERVICES GROUP, INC. AND SUBSIDIARIES
NOTES TO CONSOLIDATED FINANCIAL STATEMENTS — (Continued)
The Company had a private placement of its Series A shares in 2001 and 2002. In 2003, 38,000 Series A shares were converted to common stock. Total Series A shares outstanding at December 31, 2003 were 343,654.
A total of 18,000 and 12,000 Series A shares were issued in the offering to a director and a stockholder, respectively, on the same terms and conditions as those sold to non-affiliated purchasers in the private offering.
| 10. | Stock-Based Compensation |
Stock Options
In December 1998, the Board of Directors adopted the 1998 Stock Option Plan (the “Plan”). 150,000 shares of common stock have been reserved for issuance under the Plan. All options granted under the Plan will expire ten years after date of grant. The option price is to be determined by the Board of Directors on date of grant. The Company has also issued options that are not subject to the Plan.
In December 2003, the Company granted a total of 12,500 non-qualified stock options to its outside directors to purchase the Company’s common stock at $5.55 per share any time through December 2013. Also, in December 2003, options were granted to employees to purchase 15,000 shares of common stock at $5.58 per share. The employee options vest over three years and expire in December 2013.
In April 2002, the Company granted 42,000 non-qualified stock options to certain employees to purchase the Company’s common stock at $3.25 per share. The options vest over three years and expire in April 2012. At December 31, 2003, 33,000 of these options were outstanding. In December 2002, the Company granted a total of 7,500 non-qualified stock options to its outside directors to purchase the Company’s common stock at $3.88 per share any time through December 2012. All of these options were outstanding at December 31, 2003.
The following is a summary of activity for the stock options outstanding for the years ended December 31, 2002 and 2003:
| December 31, 2002 | December 31, 2003 | ||||||||||||||||
| Weighted | Weighted | ||||||||||||||||
| Number | Average | Number | Average | ||||||||||||||
| of | Exercise | of | Exercise | ||||||||||||||
| Shares | Price | Shares | Price | ||||||||||||||
| Outstanding, beginning of year | 112,000 | $ | 2.00 | 161,500 | $ | 2.41 | |||||||||||
| Canceled or expired | — | — | (9,000 | ) | 3.25 | ||||||||||||
| Granted | 49,500 | 3.35 | 27,500 | 5.57 | |||||||||||||
| Exercised | — | — | (100,000 | ) | 2.00 | ||||||||||||
| Outstanding, end of year | 161,500 | $ | 2.41 | 80,000 | $ | 3.92 | |||||||||||
| Exercisable, end of year | 128,800 | $ | 2.21 | 43,000 | $ | 3.68 | |||||||||||
| 11. | Commitment |
401(k) Plan
The Company offers a 401(k) Plan (the “401(k) Plan”) to all employees that have reached the age of eighteen and have completed six months of service. The participants may contribute up to 15% of their salary. Employer contributions are subject to Board discretion and are subject to a vesting schedule of 20% each year after the first year and 100% after six years. The Company contributed $50,000 and $61,000 to the 401(k) Plan in 2002 and 2003, respectively.
F-34
Table of Contents
NATURAL GAS SERVICES GROUP, INC. AND SUBSIDIARIES
NOTES TO CONSOLIDATED FINANCIAL STATEMENTS — (Continued)
| 12. | Major Customers and Concentration of Credit Risk |
Sales to two customers in the year ended December 31, 2002 and one customer in the year ended December 31, 2003 amounted to a total of 30% and 38% of consolidated revenue, respectively. No other single customer accounted for more than 10% of the Company’s sales in 2002 or 2003. At December 31, 2003, no customer accounted for as much as 10% of the Company’s trade accounts receivable. The Company generally does not obtain collateral, but requires deposits of as much as 50% on large custom contracts.
| 13. | Segment Information |
FAS No. 131, Disclosures About Segments of an Enterprise and Related Information, establishes standards for public companies relating to the reporting of financial and descriptive information about their operating segments in financial statements. Operating segments are components of an enterprise about which separate financial information is available that is evaluated regularly by chief operating decision makers in deciding how to allocate resources and in assessing performance.
The Company identifies its segments based on its subsidiary entities.
F-35
Table of Contents
NATURAL GAS SERVICES GROUP, INC. AND SUBSIDIARIES
NOTES TO CONSOLIDATED FINANCIAL STATEMENTS — (Continued)
The Company’s reportable operating segments have been determined as separately identifiable business units. The Company measures segment earnings as income before income taxes. The following amounts are expressed in thousands of dollars:
For the Year Ended December 31, 2003
| Service & | ||||||||||||||||||||
| Sales | Maintenance | Rental | Corporate | Total | ||||||||||||||||
| (in thousands of dollars) | ||||||||||||||||||||
| Revenue | $ | 3,865 | $ | 1,773 | $ | 7,112 | — | $ | 12,750 | |||||||||||
| Cost of Sales | 2,860 | 1,243 | 1,954 | — | 6,057 | |||||||||||||||
| Gross Margin | $ | 1,005 | $ | 530 | $ | 5,158 | — | $ | 6,693 | |||||||||||
| Operating Expenses | — | — | — | (4,018 | ) | (4,018 | ) | |||||||||||||
| Other Income/(Expense) | — | — | — | (671 | ) | (671 | ) | |||||||||||||
| Net Income before Provision for Income Taxes | $ | 1,005 | $ | 530 | $ | 5,158 | $ | (4,689 | ) | $ | 2,004 | |||||||||
| *Segment Assets | — | — | — | $ | 28,270 | $ | 28,270 | |||||||||||||
| * | Management does not track assets by segment. |
For the Year Ended December 31, 2002
| Service & | ||||||||||||||||||||
| Sales | Maintenance | Rental | Corporate | Total | ||||||||||||||||
| (in thousands of dollars) | ||||||||||||||||||||
| Revenue | $ | 4,336 | $ | 1,563 | $ | 4,398 | — | $ | 10,297 | |||||||||||
| Cost of Sales | 3,078 | 1,327 | 1,167 | — | 5,572 | |||||||||||||||
| Gross Margin | $ | 1,258 | $ | 236 | $ | 3,231 | — | $ | 4,725 | |||||||||||
| Operating Expenses | — | — | — | (2,884 | ) | (2,884 | ) | |||||||||||||
| Other Income/(Expense) | — | — | — | (471 | ) | (471 | ) | |||||||||||||
| Net Income before Provisions for Income Taxes | $ | 1,258 | $ | 236 | $ | 3,231 | $ | (3,355 | ) | $ | 1,370 | |||||||||
| *Segment Assets | — | — | — | $ | 23,937 | $ | 23,937 | |||||||||||||
| * | Management does not track assets by segment. |
F-36
Table of Contents
NATURAL GAS SERVICES GROUP, INC.
CONDENSED CONSOLIDATED BALANCE SHEET
| September 30, | ||||||
| 2005 | ||||||
| (unaudited) | ||||||
| (in thousands | ||||||
| of dollars) | ||||||
| ASSETS | ||||||
Current Assets: | ||||||
| Cash and cash equivalents | $ | 5,729 | ||||
| Accounts receivable — trade, net of allowance | 6,894 | |||||
| Inventory | 14,369 | |||||
| Prepaid expenses | 238 | |||||
| Total current assets | 27,230 | |||||
| Rental equipment, net of accumulated depreciation | 37,357 | |||||
| Other property, plant and equipment, net of depreciation | 6,691 | |||||
| Goodwill, net of accumulated amortization | 8,154 | |||||
| Intangibles, net of accumulated amortization | 4,059 | |||||
| Restricted cash | 2,000 | |||||
| Other assets | 92 | |||||
| Total Assets | $ | 85,583 | ||||
| LIABILITIES AND SHAREHOLDERS’ EQUITY | ||||||
Current Liabilities: | ||||||
| Current portion of long term debt | $ | 4,103 | ||||
| Bank line of credit | 300 | |||||
| Accounts payable and accrued liabilities | 8,780 | |||||
| Unearned Income | 235 | |||||
| Total current liabilities | 13,418 | |||||
| Long term debt, less current portion | 21,610 | |||||
| Subordinated notes, less current portion | 2,000 | |||||
| Deferred income tax payable | 4,658 | |||||
| Total liabilities | 41,686 | |||||
| Common stock | 90 | |||||
| Paid in capital | 34,260 | |||||
| Retained earnings | 9,547 | |||||
| Shareholders’ Equity | 43,897 | |||||
| Total Liabilities and Shareholders’ Equity | $ | 85,583 | ||||
See accompanying notes to these condensed consolidated financial statements.
F-37
Table of Contents
NATURAL GAS SERVICES GROUP, INC.
CONDENSED CONSOLIDATED INCOME STATEMENTS
(all amounts in thousands, except earnings per-share)
| Nine Months Ended | |||||||||||
| September 30, | |||||||||||
| 2004 | 2005 | ||||||||||
| (unaudited) | |||||||||||
Revenue: | |||||||||||
| Sales | $ | 2,445 | $ | 22,066 | |||||||
| Service and maintenance income | 1,370 | 1,770 | |||||||||
| Rental income | 7,405 | 11,696 | |||||||||
| Total revenue | 11,220 | 35,532 | |||||||||
Operating costs and expenses: | |||||||||||
| Cost of sales, exclusive of depreciation shown separately below | 1,699 | 16,977 | |||||||||
| Cost of service and maintenance, exclusive of depreciation shown separately below | 1,030 | 1,145 | |||||||||
| Cost of rentals, exclusive of depreciation shown separately below | 2,174 | 4,539 | |||||||||
| Selling expense | 630 | 750 | |||||||||
| General and administrative expense | 1,368 | 2,850 | |||||||||
| Depreciation and amortization | 1,751 | 3,026 | |||||||||
| Total operating costs and expenses | 8,652 | 29,287 | |||||||||
Operating Income | 2,568 | 6,245 | |||||||||
Other Income (Expense) | |||||||||||
| Interest expense | (580 | ) | (1,439 | ) | |||||||
| Other | 1,496 | 51 | |||||||||
| Total other income (expense) | 916 | (1,388 | ) | ||||||||
Income before income taxes | 3,484 | 4,857 | |||||||||
| Provision for income tax | 774 | 1,797 | |||||||||
Net Income | 2,710 | 3,060 | |||||||||
| Preferred dividends | 53 | — | |||||||||
Income available to common shareholders | $ | 2,657 | $ | 3,060 | |||||||
Earnings per share: | |||||||||||
| Basic | $ | 0.49 | $ | 0.43 | |||||||
| Diluted | $ | 0.43 | $ | 0.37 | |||||||
Weighted average Shares: | |||||||||||
| Basic | 5,428 | 7,078 | |||||||||
| Diluted | 6,217 | 8,213 | |||||||||
See accompanying notes to these condensed consolidated financial statements.
F-38
Table of Contents
NATURAL GAS SERVICES GROUP, INC.
CONDENSED CONSOLIDATED STATEMENTS OF CASH FLOWS
| Nine Months | Nine Months | ||||||||||
| Ended | Ended | ||||||||||
| September 30, | September 30, | ||||||||||
| 2004 | 2005 | ||||||||||
| (unaudited) | |||||||||||
| (in thousands of dollars) | |||||||||||
CASH FLOWS FROM OPERATING ACTIVITIES: | |||||||||||
| Net income | $ | 2,710 | $ | 3,060 | |||||||
Adjustments to reconcile net income to net cash provided by operating activities: | |||||||||||
| Depreciation and amortization | 1,751 | 3,026 | |||||||||
| Deferred taxes | 770 | 1,700 | |||||||||
| Amortization of debt issuance costs | 49 | 49 | |||||||||
| Gain on disposal of assets | 7 | (47 | ) | ||||||||
Changes in current assets and liabilities: | |||||||||||
| Trade and other receivables | (371 | ) | (2,057 | ) | |||||||
| Inventory and work in progress | (625 | ) | (5,345 | ) | |||||||
| Prepaid expenses and other | (72 | ) | (32 | ) | |||||||
| Accounts payable and accrued liabilities | 575 | 4,180 | |||||||||
| Deferred income | (89 | ) | (723 | ) | |||||||
| Other assets | (16 | ) | 323 | ||||||||
NET CASH PROVIDED BY OPERATING ACTIVITIES | 4,689 | 4,134 | |||||||||
CASH FLOWS FROM INVESTING ACTIVITIES: | |||||||||||
| Purchase of property and equipment | (8,937 | ) | (13,107 | ) | |||||||
| Assets acquired, net of cash | — | (7,584 | ) | ||||||||
| Proceeds from sale of property and equipment | 50 | 239 | |||||||||
NET CASH USED IN INVESTING ACTIVITIES | (8,887 | ) | (20,452 | ) | |||||||
CASH FLOWS FROM FINANCING ACTIVITIES: | |||||||||||
| Net proceeds from bank loans | 5,031 | 20,517 | |||||||||
| Net proceeds from line of credit | 521 | 300 | |||||||||
| Repayments of long term debt | (1,821 | ) | (12,268 | ) | |||||||
| Repayments of line of credit | (300 | ) | — | ||||||||
| Dividends paid on preferred stock | (53 | ) | — | ||||||||
| Proceeds from exercise of warrants and stock options | 5,052 | 12,813 | |||||||||
NET CASH PROVIDED BY FINANCING ACTIVITIES | 8,430 | 21,362 | |||||||||
NET INCREASE IN CASH | 4,232 | 5,044 | |||||||||
CASH AT BEGINNING OF PERIOD | 176 | 685 | |||||||||
CASH AT END OF PERIOD | $ | 4,408 | $ | 5,729 | |||||||
SUPPLEMENTAL DISCLOSURE OF CASH FLOW INFORMATION: | |||||||||||
| Interest paid | $ | 580 | $ | 1,396 | |||||||
SUPPLEMENTAL DISCLOSURE OF NON-CASH INVESTING AND FINANCING ACTIVITIES: | |||||||||||
| Assets acquired for issuance of subordinated debt | $ | — | $ | 3,000 | |||||||
| Assets acquired for issuance of common stock | $ | — | $ | 5,120 | |||||||
See accompanying notes to these condensed consolidated financial statements.
F-39
Table of Contents
NATURAL GAS SERVICES GROUP, INC.
NOTES TO CONDENSED CONSOLIDATED FINANCIAL STATEMENTS
(UNAUDITED)
(1) Basis of Presentation
The accompanying unaudited condensed consolidated financial statements present the condensed consolidated results of our company taken from our books and records. In our opinion, such information includes all adjustments, consisting of only normal recurring adjustments, which are necessary to make our financial position at September 30, 2004 and September 30, 2005 and the results of our operations for the nine month periods ended September 30, 2004 and September 30, 2005 not misleading. As permitted by the rules and regulations of the Securities and Exchange Commission (SEC) the accompanying condensed consolidated financial statements do not include all disclosures normally required by accounting principles generally accepted in the United States of America. These condensed consolidated financial statements should be read in conjunction with the financial statements included in our Annual Report on Form 10-KSB for the year ended December 31, 2004 on file with the SEC. In our opinion, the condensed consolidated financial statements are a fair presentation of the financial position, results of operations and cash flows for the periods presented.
The results of operations for the nine month period ended September 30, 2005 are not necessarily indicative of the results of operations to be expected for the full fiscal year ending December 31, 2005.
Unless otherwise noted, amounts reported in tables are in thousands, except earnings per share data.
(2) Recently Issued Accounting Pronouncements
On December 16, 2004, the FASB published FASB Statement No. 123 (revised 2004),Share-Based Payment. Statement 123(R) requiring that the compensation cost relating to share-based payment transactions be recognized in financial statements. That cost will be measured based on the fair value of the equity or liability instruments issued. We will be required to apply Statement 123(R) as of January 1, 2006. Statement 123(R) replaces FASB Statement No. 123,Accounting for Stock-Based Compensation,and supersedes APB Opinion No. 25,Accounting for Stock Issued to Employees. Statement 123, as originally issued in 1995, established as preferable a fair-value-based method of accounting for share-based payment transactions with employees. However, that Statement permitted entities the option of continuing to apply the guidance in Opinion 25, as long as the footnotes to financial statements disclosed what net income would have been had the preferable fair-value-based method been used. We are currently assessing the impact of Statement 123(R).
In November 2004, the FASB issued SFAS No 151,Inventory Costs — an Amendment of ARB No. 43, Chapter 4(“SFAS 151”). This standard provides clarification that abnormal amounts of idle facility expense, freight, handling costs, and spoilage should be recognized as current-period charges. Additionally, this standard requires that allocation of fixed production overhead to the costs of conversion be based on the normal capacity of the production facilities. The provisions of this standard are effective for inventory costs incurred during fiscal years beginning after June 15, 2005. We do not expect the adoption of the new standard to have a material effect on our condensed consolidated results of operations, cash flows or financial position.
(3) Stock-Based Compensation
Statement of Financial Accounting Standards No. 123 (“SFAS 123”), “Accounting for Stock-Based Compensation,” encourages, but does not require, the adoption of a fair value-based method of accounting for employee stock-based compensation transactions. However we have elected to apply the provisions of Accounting Principles Board Opinion No. 25 (“Opinion 25”), “Accounting for Stock Issued to Employees,” and related interpretations, in accounting for our employee stock-based compensation plans.
F-40
Table of Contents
NATURAL GAS SERVICES GROUP, INC.
NOTES TO CONDENSED CONSOLIDATED FINANCIAL STATEMENTS — (Continued)
Under Opinion 25, compensation cost is measured as the excess, if any, of the quoted market price of our stock at the date of the grant above the amount an employee must pay to acquire the stock.
Had compensation costs for options granted to our employees been determined based on the fair value at the grant dates consistent with the method prescribed by SFAS No. 123, our net income and earnings per share would have been reduced to the pro forma amounts listed below:
| Nine Months Ended | ||||||||
| September 30, | ||||||||
| 2004 | 2005 | |||||||
Pro forma impact of fair value method | ||||||||
| Income applicable to common shares, as reported | $ | 2,657 | $ | 3,060 | ||||
| Compensation expenses regained under Opinion 25 | 21 | |||||||
| Pro-forma stock-based compensation costs under the fair value method, net of related tax | (20 | ) | (106 | ) | ||||
| Pro-forma income applicable to common shares under the fair-value method | $ | 2,637 | $ | 2,975 | ||||
Earnings per common share | ||||||||
| Basic earnings per share reported | $ | 0.49 | $ | 0.43 | ||||
| Diluted earnings per share reported | $ | 0.43 | $ | 0.37 | ||||
| Pro-forma basic earnings per share under the fair value method | $ | 0.49 | $ | 0.42 | ||||
| Pro-forma diluted earnings per share under the fair value method | $ | 0.42 | $ | 0.36 | ||||
Weighted average Black-Scholes fair value assumptions: | ||||||||
| Risk free rate | 4.0%- 5.2 | % | 6.75%- 7.25 | % | ||||
| Expected life | 5-10 yrs | 5-10 yrs | ||||||
| Expected volatility | 50.0 | % | 39.0 | % | ||||
| Expected dividend yield | 0.0 | % | 0.0 | % | ||||
(4) Acquisition
On October 18, 2004, we entered into a Stock Purchase Agreement with Screw Compression Systems, Inc., or “SCS”, and the stockholders of SCS. Under this agreement, we agreed to purchase all of the outstanding shares of capital stock of SCS for the purpose of expanding our product line, production capacity and customer base.
SCS is a manufacturer of natural gas compressors, with its principal offices located in Tulsa, Oklahoma.
The stockholders of SCS received, in proportionate shares (based on their stock ownership of SCS), a total of $16.1 million.
| • | $8 million in cash; | |
| • | promissory notes issued by Natural Gas Services Group, Inc. in the aggregate principal amount of $3 million bearing interest at the rate of 4.00% per annum, maturing three years from the date of closing and secured by a letter of credit in the face amount of $2 million; and | |
| • | 609,756 shares of Natural Gas Services Group, Inc. common stock valued at $5.1 million. All of the shares are “restricted” securities within the meaning of Rule 144 under the Securities Act of 1933, as amended, and bear a legend to that effect. |
F-41
Table of Contents
NATURAL GAS SERVICES GROUP, INC.
NOTES TO CONDENSED CONSOLIDATED FINANCIAL STATEMENTS — (Continued)
This transaction was completed January 3, 2005 and we began reporting condensed consolidated financial results for the first quarter 2005 included in this report. The total purchase price was $16.1 million and we recorded goodwill of approximately $5 million and intangible assets of approximately $4.2.
The following table represents the combined results of operations on a pro-forma basis with Natural Gas Services Group, Inc. and Screw Compression Systems, Inc. as if the acquisition had occurred on January 1, 2004.
Pro Forma Results
| Nine Months Ended | ||||
| September 30, 2004 | ||||
| (unaudited) | ||||
| Revenue | $ | 27,217 | ||
| Net income available to common shareholders | $ | 4,672 | ||
| Net Income per share, basic | $ | 0.77 | ||
| Net Income per share, diluted | $ | 0.68 | ||
(5) Long Term Debt
On January 3, 2005, we amended our existing loan agreement with Western National Bank to provide additional borrowings for the cash portion of the SCS acquisition of $8 million for 84 months and interest of 1% over the prime rate. This funding was provided by entering into a Third Amended and Restated Loan Agreement made and entered into by and among Natural Gas Services Group, Inc., Screw Compression Systems, Inc., and Western National Bank.
On March 14, 2005, we amended our existing loan agreement with Western National Bank to provide additional borrowings of $10 million for 60 months and interest of 1% over the prime rate. This funding will be used to invest in the growth of our rental fleet for the current year. This funding was provided by entering into a Fourth Amended and Restated Loan Agreement made and entered into by and among Natural Gas Services Group, Inc., Screw Compression Systems, Inc., and Western National Bank.
On May 1, 2005, we modified our existing loan agreement with Western National Bank to reduce the current interest rate from 1% over prime to 1/2% over prime and change the current ratio calculation from 1.5 to 1.4. This modification also allowed us to add the $2 million restricted cash item on our balance sheet to our current assets for calculating the bank covenants.
On August 26, 2005, we prepaid all of the outstanding 10% subordinate notes that were due December 31, 2006. The principal amount of the payoff was $1.5 million. Each of these notes included a five-year warrant to purchase shares of the Company’s common stock at $3.25 per share. During the three months ending September 30, 2005, we collected receipts for the exercise of 493,704 of the debt warrants for a total of $1.6 million. As of September 30, 2005, 80,000 of these warrants are still outstanding.
Between September 20, 2005 and September 30, 2005, we prepaid $4.5 million of our notes with Western National bank, GMAC and Ford Motor Credit with the proceeds from the exercise of our publicly held common stock purchase warrants that we collected during the three month period ended September 30, 2005.
On October 20, 2005, we modified our existing loan agreement with Western National Bank which allowed us to free up the $2 million restricted cash item on the balance sheet, a portion of which cash was used to retire debt on the SCS facility.
F-42
Table of Contents
NATURAL GAS SERVICES GROUP, INC.
NOTES TO CONDENSED CONSOLIDATED FINANCIAL STATEMENTS — (Continued)
Our Revolving Line of Credit Facility matures on January 1, 2006; however, we are currently negotiating to renew and extend this facility for an additional year and to increase the principal amount of the facility from $2.0 million to $10.0 million.
Our obligations under the Loan Agreement continue to be secured by substantially all of our assets, including our equipment, trade accounts receivable and other personal property, the stock we own in SCS, and by the real estate and related plant facilities owned by SCS.
(6) Common Stock Purchase Warrants and Options
On July 28, 2005, Natural Gas Services Group, Inc. announced that it would redeem its outstanding common stock purchase warrants that were issued in connection with its initial public offering in October 2002 (the “IPO Warrants”). Holders of the IPO Warrants were required to exercise the IPO Warrants by 5:00 p.m., Mountain Daylight Savings Time on Tuesday, September 6, 2005 (the “Redemption Date”). The IPO Warrants had an exercise price of $6.25 per share and were subject to redemption at the redemption price of $0.25 per IPO Warrant. IPO Warrants not properly exercised by the Redemption Date ceased to be exercisable and were redeemed for $0.25 per IPO Warrant, without interest. A total of 1.5 million IPO Warrants were initially issued in conjunction with our initial public offering. Before we announced the redemption of the IPO Warrants on July 28, 2005, a total of 227,800 IPO Warrants had been exercised. Between July 28, 2005, the date we announced the redemption of the IPO Warrants, and the Redemption Date, a total of 1.3 million IPO Warrants were exercised and 1.3 million shares of common stock were issued upon exercise of the IPO Warrants. We have received a total of $9.4 million in proceeds from all IPO Warrant exercises, of which $8 million was received after announcing our intention to redeem the remaining outstanding IPO Warrants. A total of 2,417 IPO Warrants were not exercised by the Redemption Date and were redeemed for the aggregate redemption amount of $604.25.
In 2001, the Company completed an offering of units consisting of subordinated debt and warrants. Each unit consisted of a $25,000 10% subordinated note due December 31, 2006 and a five-year warrant to purchase 10,000 shares of the Company’s common stock at $3.25 per share. On August 26, 2005, we prepaid all of the outstanding 10% subordinate notes that were due December 31, 2006. During the three months ending September 30, 2005 we collected receipts for the exercise of 493,704 of these warrants for a total of $1.6 million. As of September 30, 2005, 80,000 of these warrants are still outstanding.
On August 26, 2005, we entered into a non-statutory Stock Option Agreement with Mr. Steve C. Taylor, our CEO and President. The Stock Option Agreement grants to Mr. Taylor a ten-year option to purchase 45,000 shares of our common stock at an exercise price equal to $9.22 (the fair market value of our common stock on January 13, 2005, the date we initially hired Mr. Taylor), with 15,000 shares vesting on each of January 13, 2006, 2007, and 2008. The options expire ten years from the date of grant. Compensation expense of $21,000 was recognized related to these options in the three and nine month periods ended September 30, 2005.
F-43
Table of Contents
NATURAL GAS SERVICES GROUP, INC.
NOTES TO CONDENSED CONSOLIDATED FINANCIAL STATEMENTS — (Continued)
(7) Earnings per common share
The following table reconciles the numerators and denominators of the basic and diluted earnings per share computation.
| Nine Months | ||||||||||
| Ended | ||||||||||
| September 30 | ||||||||||
| 2004 | 2005 | |||||||||
| Basic earnings per share | ||||||||||
| Numerator: | ||||||||||
| Net income | $ | 2,710 | $ | 3,060 | ||||||
| Less: dividends on preferred shares | (53 | ) | — | |||||||
| Income available to common shareholders | $ | 2,657 | $ | 3,060 | ||||||
| Denominator: | ||||||||||
| Weighted average common shares outstanding | 5,428 | 7,077 | ||||||||
| Basic earnings per share | $ | 0.49 | $ | 0.43 | ||||||
| Diluted earnings per share | ||||||||||
| Numerator: | ||||||||||
| Net income | $ | 2,710 | $ | 3,060 | ||||||
| Less: dividends on preferred shares | (53 | ) | — | |||||||
| Income available to common shareholders | $ | 2,657 | $ | 3,060 | ||||||
| Denominator: | ||||||||||
| Weighted average common shares outstanding | 5,428 | 7,077 | ||||||||
| Dilutive effect of common stock options and warrants | 789 | 1,136 | ||||||||
| Diluted weighted average shares | 6,217 | 8,213 | ||||||||
| Diluted earnings per share | $ | 0.43 | $ | 0.37 | ||||||
(8) Segment Information
FAS No. 131,Disclosures About Segments of an Enterprise and Related Information, establishes standards for public companies relating to the reporting of financial and descriptive information about their operating segments in financial statements. Operating segments are components of an enterprise about which separate financial information is available that is evaluated regularly by chief operating decision makers in deciding how to allocate resources and in assessing performance.
The Company identifies its segments based upon major revenue sources as follows:
For the Nine Months Ended September 30, 2004
| Service & | ||||||||||||||||||||
| Sales | Maintenance | Rental | Corporate | Total | ||||||||||||||||
| Revenue | $ | 2,445 | $ | 1,370 | $ | 7,405 | $ | 11,220 | ||||||||||||
| Operating costs and expenses | 1,699 | 1,030 | 2,174 | 3,749 | 8,652 | |||||||||||||||
| Operating income | $ | 746 | $ | 340 | $ | 5,231 | $ | (3,749 | ) | $ | 2,568 | |||||||||
| *Segment Assets | — | — | — | $ | 40,691 | $ | 40,691 | |||||||||||||
F-44
Table of Contents
NATURAL GAS SERVICES GROUP, INC.
NOTES TO CONDENSED CONSOLIDATED FINANCIAL STATEMENTS — (Continued)
For the Nine Months Ended September 30, 2005
| Service & | ||||||||||||||||||||
| Sales | Maintenance | Rental | Corporate | Total | ||||||||||||||||
| Revenue | $ | 22,066 | $ | 1,770 | $ | 11,696 | $ | 35,532 | ||||||||||||
| Operating costs and expenses | 16,977 | 1,145 | 4,539 | 6,626 | 29,287 | |||||||||||||||
| Operating income | $ | 5,089 | $ | 625 | $ | 7,157 | $ | (6,626 | ) | $ | 6,245 | |||||||||
| *Segment Assets | — | — | — | $ | 85,583 | $ | 85,583 | |||||||||||||
| * | Management does not track assets by segment |
(9) Subsequent Event
Our five-year rental and maintenance agreement with Dominion Exploration & Production (“Dominion Exploration”) expires on December 31, 2005. In August 2005, we were advised by Dominion Exploration that it would seek competing proposals from us as well as other third parties to continue the rental and maintenance services required for their Northern Michigan operations. We submitted a bid to rent screw compressors to Dominion Exploration and to provide maintenance and service on certain screw compressors owned by Dominion Exploration. We also submitted a proposal to continue service and maintenance of reciprocating compressors owned by Dominion Exploration. In October 2005, we were advised by Dominion Exploration that we will retain the screw compressor rental, maintenance and service business, but that a third party was successful in bidding for the maintenance and service of Dominion Exploration’s larger reciprocating compressors. We estimate that the screw compressor rental, maintenance and service business we have retained from Dominion Exploration represented approximately 78% and 86% of our revenues from Dominion Exploration in the year ended December 31, 2004 and the nine months ended September 30, 2005, respectively.
(10) Legal Proceedings
We are currently a defendant in a lawsuit, Karifico v. Natural Gas Services Group, Inc., filed on September 21, 2005 in District Court, Jefferson County, Colorado, Case No. 05 CV 3161. The lawsuit is in the nature of a complaint for breach of contract and for money for services rendered. According to the complaint filed by Karifico, under terms of an agreement dated November 3, 2003 between Karifico and us, Karifico was retained by us to “find a company for sale that Defendant could purchase if it fit into its financial and operational plans.” Karifico claims that it is entitled to a fee in the amount of $300,000 as the result of our acquisition of Screw Compression Systems, Inc. We have paid $150,000 to Karifico and Karifico seeks the additional sum of $150,000, together with interest and costs, and for alleged further damages in an unspecified amount. We believe that we have valid defenses to Karifico’s claims to our financial position, results of operations or cash flows. Accordingly, we have not established a reserve for loss in connection with this proceeding.
From time to time, we are a party to various other legal proceedings in the ordinary course of our business. While management is unable to predict the ultimate outcome of these actions, it believes that any ultimate liability arising from these actions will not have a material adverse effect on our consolidated financial position, results of operations or cash flow. Except as discussed herein, we are not currently a party to any other legal proceedings and we are not aware of any other threatened litigation.
F-45
Table of Contents
REPORT OF INDEPENDENT REGISTERED PUBLIC ACCOUNTING FIRM
The Board of Directors
Screw Compression Systems, Inc.
We have audited the accompanying consolidated balance sheet of Screw Compression Systems, Inc. (the “Company”) as of December 31, 2004, and the related consolidated statements of income, stockholders’ equity, and cash flows for the years ended December 31, 2003 and 2004. These consolidated financial statements are the responsibility of the Company’s management. Our responsibility is to express an opinion on these consolidated financial statements based on our audits.
We conducted our audits in accordance with the standards of the Public Company Accounting Oversight Board (United States). Those standards require that we plan and perform the audits to obtain reasonable assurance about whether the financial statements are free of material misstatement. An audit includes examining, on a test basis, evidence supporting the amounts and disclosures in the financial statements. An audit also includes assessing the accounting principles used and significant estimates made by management, as well as evaluating the overall financial statement presentation. We believe that our audits provide a reasonable basis for our opinion.
In our opinion, the consolidated financial statements referred to above present fairly, in all material respects, the financial position of the Company as of December 31, 2004, and the results of its operations and its cash flows for the years ended December 31, 2003 and 2004 in conformity with U.S. generally accepted accounting principles.
| /s/Hein & Associates llp |
Dallas, Texas
November 4, 2005
F-46
Table of Contents
SCREW COMPRESSION SYSTEMS, INC.
CONSOLIDATED BALANCE SHEET
(all amounts in thousands, except per-share data)
| December 31, | ||||||
| 2004 | ||||||
| ASSETS | ||||||
CURRENT ASSETS: | ||||||
| Cash and cash equivalents | $ | 834 | ||||
| Trade accounts receivable, net of allowance for doubtful accounts of $2 | 2,839 | |||||
| Inventory, net of allowance of $325 | 4,554 | |||||
| Prepaid expenses and other | 47 | |||||
| Total current assets | 8,274 | |||||
RENTAL EQUIPMENT,net of accumulated depreciation of $159 | 175 | |||||
PROPERTY AND EQUIPMENT,net of accumulated depreciation of $1,183 | 2,872 | |||||
GOODWILL | 550 | |||||
OTHER ASSETS | 19 | |||||
| Total assets | $ | 11,890 | ||||
| LIABILITIES AND STOCKHOLDERS’ EQUITY | ||||||
CURRENT LIABILITIES: | ||||||
| Current portion of long-term debt | $ | 81 | ||||
| Accounts payable and accrued liabilities | 2,244 | |||||
| Deferred revenue | 936 | |||||
| Total current liabilities | 3,261 | |||||
LONG-TERM DEBT,less current portion | 1,323 | |||||
COMMITMENTS(Notes 3, 7, & 8) | ||||||
STOCKHOLDERS’ EQUITY: | ||||||
| Common stock, 200 shares authorized, par value $0.01; 100 shares issued and outstanding | 1 | |||||
| Retained earnings | 7,305 | |||||
| Total stockholders’ equity | 7,306 | |||||
| Total liabilities and stockholders’ equity | $ | 11,890 | ||||
See accompanying notes to these consolidated financial statements.
F-47
Table of Contents
SCREW COMPRESSION SYSTEMS, INC.
CONSOLIDATED STATEMENTS OF INCOME
(all amounts in thousands, except per-share data)
| For the Years Ended | |||||||||||
| December 31, | |||||||||||
| 2003 | 2004 | ||||||||||
REVENUE: | |||||||||||
| Sales, net | $ | 10,573 | $ | 21,018 | |||||||
| Service and maintenance income | 207 | 311 | |||||||||
| Rental income | 95 | 95 | |||||||||
| Total revenue | 10,875 | 21,424 | |||||||||
OPERATING COSTS AND EXPENSES: | |||||||||||
| Cost of sales, exclusive of depreciation shown separately below | 7,977 | 16,037 | |||||||||
| Cost of service and maintenance, exclusive of depreciation shown separately below | 60 | 135 | |||||||||
| Selling expenses | 165 | 109 | |||||||||
| General and administrative | 1,308 | 2,107 | |||||||||
| Depreciation and amortization | 304 | 328 | |||||||||
| Total operating costs and expenses | 9,814 | 18,716 | |||||||||
OPERATING INCOME | 1,061 | 2,708 | |||||||||
OTHER INCOME (EXPENSE) | |||||||||||
| Interest income | 35 | 23 | |||||||||
| Interest expense | (119 | ) | (116 | ) | |||||||
| Other | 34 | 71 | |||||||||
| Total other income (expense) | (50 | ) | (22 | ) | |||||||
NET INCOME | $ | 1,011 | $ | 2,686 | |||||||
NET INCOME PER COMMON SHARE: | |||||||||||
| Basic and diluted | $ | 10.11 | $ | 26.86 | |||||||
WEIGHTED AVERAGE COMMON SHARES OUTSTANDING: | |||||||||||
| Basic and diluted | 100 | 100 | |||||||||
See accompanying notes to these consolidated financial statements.
F-48
Table of Contents
SCREW COMPRESSION SYSTEMS, INC.
CONSOLIDATED STATEMENTS OF STOCKHOLDERS’ EQUITY
For the Years Ended December 31, 2003 and 2004
(all amounts in thousands, except per-share data)
| Common Stock | Total | |||||||||||||||
| Retained | Stockholders’ | |||||||||||||||
| Shares | Amount | Earnings | Equity | |||||||||||||
BALANCES,January 1, 2003 | 100 | $ | 1 | $ | 5,378 | $ | 5,379 | |||||||||
| Distributions | — | — | (443 | ) | (443 | ) | ||||||||||
| Net income | — | — | 1,011 | 1,011 | ||||||||||||
BALANCES,January 1, 2004 | 100 | 1 | 5,946 | 5,947 | ||||||||||||
| Distributions | — | — | (1,327 | ) | (1,327 | ) | ||||||||||
| Net income | — | — | 2,686 | 2,686 | ||||||||||||
BALANCES,December 31, 2004 | 100 | $ | 1 | $ | 7,305 | $ | 7,306 | |||||||||
See accompanying notes to these consolidated financial statements.
F-49
Table of Contents
SCREW COMPRESSION SYSTEMS, INC.
CONSOLIDATED STATEMENTS OF CASH FLOWS
(all amounts in thousands, except per-share data)
| For the Years Ended | ||||||||||||
| December 31, | ||||||||||||
| 2003 | 2004 | |||||||||||
CASH FLOWS FROM OPERATING ACTIVITIES: | ||||||||||||
| Net income | $ | 1,011 | $ | 2,686 | ||||||||
| Adjustments to reconcile net income to net cash provided by operating activities: | ||||||||||||
| Depreciation and amortization | 304 | 328 | ||||||||||
| Gain on disposal of assets | (21 | ) | — | |||||||||
| Changes in current assets: | ||||||||||||
| Short-term investments | (23 | ) | 684 | |||||||||
| Trade accounts receivable | 404 | (1,523 | ) | |||||||||
| Inventory | 412 | (2,525 | ) | |||||||||
| Prepaid expenses and other | 64 | 26 | ||||||||||
| Changes in current liabilities: | ||||||||||||
| Accounts payable and accrued liabilities | (936 | ) | 1,546 | |||||||||
| Deferred revenue | 16 | 936 | ||||||||||
| Net cash provided by operating activities | 1,231 | 2,158 | ||||||||||
CASH FLOWS FROM INVESTING ACTIVITIES: | ||||||||||||
| Purchase of property and equipment | (272 | ) | (247 | ) | ||||||||
| Proceeds from sale of property and equipment | 45 | — | ||||||||||
| Acquisition of remaining interest in CIP | (550 | ) | ||||||||||
| Net cash used in investing activities | (227 | ) | (797 | ) | ||||||||
CASH FLOWS FROM FINANCING ACTIVITIES: | ||||||||||||
| Proceeds from long-term debt | — | 2,450 | ||||||||||
| Repayments of long-term debt | (121 | ) | (2,527 | ) | ||||||||
| Dividends on common stock | (298 | ) | (1,327 | ) | ||||||||
| Change in due to/from stockholder | 30 | (91 | ) | |||||||||
| Net cash used in financing activities | (389 | ) | (1,495 | ) | ||||||||
NET CHANGE IN CASH | 615 | (134 | ) | |||||||||
CASH,beginning of year | 353 | 968 | ||||||||||
CASH,end of year | $ | 968 | $ | 834 | ||||||||
SUPPLEMENTAL DISCLOSURES OF CASH FLOW INFORMATION: | ||||||||||||
| Interest paid | $ | 119 | $ | 116 | ||||||||
| Non-cash distribution | $ | 101 | $ | — | ||||||||
See accompanying notes to these consolidated financial statements.
F-50
Table of Contents
SCREW COMPRESSION SYSTEMS, INC.
NOTES TO CONSOLIDATED FINANCIAL STATEMENTS
(all amounts in thousands, except per-share data)
| 1. | Summary of Significant Accounting Policies |
| Organization |
Screw Compression Systems, Inc. (the “Company” or “SCS”) (a Texas corporation) is engaged in the customizing, manufacturing, and leasing of oil and natural gas compression systems.
| Principles of Consolidation |
The Company owned an interest in a Joint Venture, SCS/JALEX dba Cylinders in Plane (“CIP”). Under the terms of the Joint Venture agreement, SCS contributes all capital resources for the development of compressors and its partner contributed his expertise and services. All of the sales of CIP were to SCS. Proceeds from CIP go first to repay capital advances made by SCS. Remaining proceeds were split 50/50 among SCS and its venture partner. Based on the allocation of proceeds as stipulated in the agreement, there were no minority interests owed by the venture partner at December 31, 2003. SCS completed a transaction to purchase the remaining interest in the Joint Venture on January 1, 2004. All significant inter-company accounts and transactions have been eliminated in consolidation.
| Cash Equivalents |
For purposes of reporting cash flows, the Company considers all short-term investments with an original maturity of three months or less to be cash equivalents.
| Accounts Receivable |
The Company’s trade receivables consist primarily of customer obligations for the sale of compressors due under normal trade terms. The receivables are not collateralized. The Company extends credit based on management’s assessment of the customer’s financial condition, receivable aging, customer disputes and general business and economic conditions. Management believes the allowance for doubtful accounts for trade receivables of $2 at December 31, 2004 is adequate.
| Inventory |
Inventory is valued at the lower of cost or market. The cost of inventories was determined by the weighted average method. At December 31, 2004, inventory consisted of the following:
| Raw materials | $ | 3,177 | ||
| Work in process | 1,702 | |||
| 4,879 | ||||
| Less: inventory allowance | (325 | ) | ||
| $ | 4,554 | |||
| Property and Equipment |
Property and equipment are recorded at cost less accumulated depreciation and amortization. Depreciation and amortization are primarily computed using the straight-line method over the estimated useful lives of the assets, which range from three to forty years.
Gains and losses resulting from sales and dispositions of property and equipment are included in current operations. Maintenance and repairs are charged to operations as incurred.
F-51
Table of Contents
SCREW COMPRESSION SYSTEMS, INC.
NOTES TO CONSOLIDATED FINANCIAL STATEMENTS — (Continued)
(all amounts in thousands, except per-share data)
| Long-Lived Assets |
The Company’s policy is to periodically review the net realizable value of its long-lived assets through an assessment of the estimated future cash flows related to such assets. In the event that assets are found to be carried at amounts in excess of estimated undiscounted future cash flows, then the assets will be adjusted for impairment to a level commensurate with a discounted cash flow analysis of the underlying assets. Based upon its most recent analysis, the Company believes no impairment of long-lived assets exists at December 31, 2004.
| Goodwill |
We account for goodwill under Statement of Financial Accounting Standards No. 142, Goodwill and Other Intangible Assets (“Statement 142”). Under Statement 142, goodwill and indefinite-lived intangible assets are not amortized but are reviewed annually (or more frequently if impairment indicators arise) for impairment. Separable intangible assets that are not deemed to have an indefinite life are amortized over their useful lives (but with no maximum life). We will review annually the value of goodwill recorded as a result of the acquisition of CIP, or more frequently if impairment indicators arise. We recognized no goodwill impairment during 2004.
| Advertising Costs |
Advertising costs are expensed as incurred. Total advertising expense was $39 and $4 in 2003 and 2004 respectively.
| Financial Instruments |
Management believes that generally the fair value of the Company’s financial instruments at December 31, 2004 approximate their carrying value due to the short-term nature of the financial instruments and the use of prevailing market interest rates for notes payable.
| Revenue Recognition |
Revenue from the sales of compressors and parts are recognized upon shipment to customers. Revenue from compressor service is recognized upon providing services to the customer. Rental revenue is recognized over the term of the lease agreement. The Company’s only rental agreement in 2005 and 2004 is classified as an operating lease with no fixed term and is on amonth-to-month basis. Deferred revenue represents payments received before a product is shipped.
| Per Share Data |
Basic earnings per common share are computed using the weighted average number of common shares outstanding during the period. Diluted earnings per common share is computed using the weighted average number of common and common stock equivalent shares outstanding during the period. In 2003 and 2004, there were no common stock equivalent shares.
F-52
Table of Contents
SCREW COMPRESSION SYSTEMS, INC.
NOTES TO CONSOLIDATED FINANCIAL STATEMENTS — (Continued)
(all amounts in thousands, except per-share data)
The following table sets forth the computation of basic and diluted earnings per share:
| Year Ended | |||||||||
| December 31, | |||||||||
| 2003 | 2004 | ||||||||
| Numerator: | |||||||||
| Net income | $ | 1,011 | $ | 2,686 | |||||
| Denominator for basic and diluted net income per share: | |||||||||
| Weighted average common shares outstanding | 100 | 100 | |||||||
| Net income per share: | |||||||||
| Basic and diluted | $ | 10.11 | $ | 26.86 | |||||
| Income Taxes |
The Company, with the consent of its stockholders, has elected to be taxed under sections of federal and state income tax law which provide that, in lieu of corporation income taxes, the stockholders separately account for their pro rata shares of the Company’s items of income, deductions, losses and credits. As a result of this election, no income taxes have been recognized in the accompanying consolidated financial statements.
| Use of Estimates |
The preparation of the Company’s consolidated financial statements in conformity with generally accepted accounting principles requires the Company’s management to make estimates and assumptions that affect the amounts reported in these consolidated financial statements and accompanying notes. Actual results could differ from those estimates. Significant estimates include the valuation of goodwill and the allowance for doubtful accounts receivable. Significant estimates include the valuation of goodwill and the allowance for doubtful accounts receivable. It is at least reasonably possible these estimates could be revised in the near term and the revisions could be material.
| 2. | Property and Equipment |
Property and equipment consists of the following at December 31, 2004:
| Building | $ | 2,114 | ||
| Furniture and fixtures | 135 | |||
| Software | 98 | |||
| Machinery and equipment | 1,212 | |||
| Vehicles | 496 | |||
| 4,055 | ||||
| Less accumulated depreciation and amortization | (1,183 | ) | ||
| $ | 2,872 | |||
Depreciation expense for property and equipment and the rental compressor described in Note 1 was $304 and $328 for the years ended December 31, 2003 and 2004, respectively.
F-53
Table of Contents
SCREW COMPRESSION SYSTEMS, INC.
NOTES TO CONSOLIDATED FINANCIAL STATEMENTS — (Continued)
(all amounts in thousands, except per-share data)
| 3. | Line of Credit |
The Company has a line of credit with a financial institution that allows for borrowings up to $1,500, bears interest at the prime rate plus .25% (5.5% at December 31, 2004) and requires monthly interest payments with principal due at maturity on September 1, 2005. The line of credit is collateralized by substantially all of the assets of the Company. At December 31, 2004, the Company had not drawn on this line of credit.
| 4. | Long-Term Debt |
Long-term debt at December 31, 2004 consisted of the following:
| Note payable to a bank, interest at 6.50%, monthly payments of principal and interest of $14 with remaining principal due upon maturity in January 2008. The note is collateralized by a building and guaranteed by a stockholder | $ | 1,399 | ||
| Other notes payable for vehicles, various terms | 4 | |||
| Total | 1,403 | |||
| Less current portion | (80 | ) | ||
| $ | 1,323 | |||
Maturities of long-term debt based on contractual requirements for the years ending December 31 are as follows:
| 2005 | $ | 80 | ||
| 2006 | 82 | |||
| 2007 | 87 | |||
| 2008 | 1,154 | |||
| $ | 1,403 | |||
| 5. | 401(k) Plan |
The Company offers a 401(k) Plan (the “401(k) Plan”) to all employees that have reached the age of eighteen and have completed one year of service. The participants may contribute up to the maximum allowed by law. Employer contributions are subject to management discretion and are subject to a vesting schedule of 20% each year after the first year and 100% after six years. The Company contributed $21 and $15 to the 401(k) Plan in 2003 and 2004, respectively.
| 6. | Major Customers and Concentration of Credit Risk |
Sales to one customer in the year ended December 31, 2003 amounted to 80% of consolidated revenue. Sales to two customers in the year ended December 31, 2004 amounted to 70% and 14% of consolidated revenue. No other single customer accounted for more than 10% of the Company’s sales in 2003 or 2004. One customer accounted for 90% and 87% of the Company’s trade accounts receivable as of December 31, 2003 and 2004, respectively.
F-54
Table of Contents
SCREW COMPRESSION SYSTEMS, INC.
NOTES TO CONSOLIDATED FINANCIAL STATEMENTS — (Continued)
(all amounts in thousands, except per-share data)
| 7. | Operating Leases |
The Company leases land under a non-cancelable agreement that expires in May 2014 and requires monthly rental payments which are adjusted annually for consumer price index. The total minimum rental commitment as of December 31, 2004 is due in the future years as follows:
| 2005 | $ | 25 | |||
| 2006 | 26 | ||||
| 2007 | 27 | ||||
| 2008 | 27 | ||||
| 2009 | 28 | ||||
| Thereafter | 134 | ||||
| $ | 267 | ||||
The Company leases a building at 5757 Bird Creek, Port of Catoosa, OK under an agreement that expires in April 2008 and requires monthly rental payments. The total minimum commitment as of December 31, 2004 is due in the future years as follows:
| 2005 | $ | 62 | ||
| 2006 | 66 | |||
| 2007 | 66 | |||
| 2008 | 16 | |||
| $ | 210 | |||
The rent expense for the years ended December 31, 2003 and 2004 total $54 and $87, respectively.
| 8. | Subsequent Event |
On October 18, 2004, the Company entered into an agreement to sell all outstanding shares of the Company’s common stock to Natural Gas Services Group, Inc. (“NGSG”).
The stockholders of SCS received, in proportionate shares (based on their stock ownership of SCS), a total of $16.1 million.
| • | $8 million in cash; | |
| • | promissory notes issued by Natural Gas Services Group, Inc. in the aggregate principal amount of $3 million bearing interest at the rate of 4.00% per annum, maturing three years from the date of closing and secured by a letter of credit in the face amount of $2 million; and | |
| • | 609,756 shares of Natural Gas Services Group, Inc. common stock valued at $5.1 million. All of the shares are “restricted” securities within the meaning of Rule 144 under the Securities Act of 1933, as amended, and bear a legend to that effect. |
This transaction was completed January 3, 2005 and NGSG began reporting condensed consolidated financial results for the first quarter 2005.
*************
F-55
Table of Contents
NATURAL GAS SERVICES GROUP, INC.
UNAUDITED PRO FORMA COMBINED
STATEMENT OF INCOME
The unaudited pro forma combined statement of income was prepared to present the effect of the acquisition of Screw Compression Systems, Inc. (“SCS”) on January 3, 2005, by Natural Gas Services Group, Inc. (“Natural Gas”) for $8.0 million in cash, $3.0 million in promissory notes and 609,756 shares of Natural Gas common stock.
The unaudited pro forma combined statement of income of Natural Gas for the year ended December 31, 2004, gives effect to the transaction above as if it had occurred January 1, 2004. It combines the statement of income of Natural Gas for the year ended December 31, 2004 with the statement of income of SCS for the year ended December 31, 2004. The unaudited pro forma combined statement of income of Natural Gas has been included as required by the rules of the Securities and Exchange Commission and is provided for comparison purposes only.
The unaudited pro forma combined statement of income of Natural Gas should be read in conjunction with the historical financial statements of Natural Gas and SCS and the related notes thereto. The unaudited pro forma combined statement of income of Natural Gas is based upon assumptions and includes adjustments as explained in the notes to the unaudited pro forma combined financial statements, and the actual recording of the transactions could differ. The unaudited pro forma combined statement of income of Natural Gas is not necessarily indicative of the financial results that would have occurred had the acquisition been effective on and as of the date indicated and should not be viewed as indicative of operations in the future.
F-56
Table of Contents
UNAUDITED PRO FORMA COMBINED
STATEMENT OF INCOME
Year Ended December 31, 2004
(all amounts in thousands, except per-share data)
| NGS | SCS | Pro Forma | Combined | |||||||||||||||
| Historical | Historical | Adjustments | Pro Forma | |||||||||||||||
REVENUE: | ||||||||||||||||||
| Sales | $ | 3,593 | $ | 21,018 | $ | — | $ | 24,611 | ||||||||||
| Service and maintenance income | 1,874 | 311 | — | 2,185 | ||||||||||||||
| Rental income | 10,491 | 95 | — | 10,586 | ||||||||||||||
| Total revenue | 15,958 | 21,424 | — | 37,382 | ||||||||||||||
OPERATING COSTS AND EXPENSES: | ||||||||||||||||||
| Cost of sales, exclusive of depreciation shown separately below | 2,556 | 16,037 | — | 18,593 | ||||||||||||||
| Cost of service, exclusive of depreciation shown separately below | 1,357 | 135 | — | 1,492 | ||||||||||||||
| Cost of rental, exclusive of depreciation shown separately below | 3,038 | — | — | 3,038 | ||||||||||||||
| Selling expense | 875 | 109 | — | 984 | ||||||||||||||
| General and administrative expense | 1,777 | 2,107 | — | 3,884 | ||||||||||||||
| Depreciation and amortization | 2,444 | 328 | 299 | (a) | 3,071 | |||||||||||||
| Total operating costs and expenses | 12,047 | 18,716 | 299 | 31,062 | ||||||||||||||
OPERATING INCOME | 3,911 | 2,708 | (299 | ) | 6,320 | |||||||||||||
OTHER INCOME (EXPENSE) | ||||||||||||||||||
| Interest income | — | 23 | — | 23 | ||||||||||||||
| Interest expense | (838 | ) | (116 | ) | (620 | )(b) | (1,574 | ) | ||||||||||
| Other income | 1,441 | 71 | — | 1,512 | ||||||||||||||
| Total other income (expense) | 603 | (22 | ) | (620 | ) | (39 | ) | |||||||||||
INCOME BEFORE INCOME TAXES | 4,514 | 2,686 | (919 | ) | 6,281 | |||||||||||||
| Income tax expense (benefit) | 1,140 | — | 940 | (c) | 2,080 | |||||||||||||
NET INCOME | 3,374 | 2,686 | (1,859 | ) | 4,201 | |||||||||||||
PREFERRED DIVIDENDS | 53 | — | — | 53 | ||||||||||||||
INCOME AVAILABLE TO COMMON SHAREHOLDERS | $ | 3,321 | $ | 2,686 | $ | (1,859 | ) | $ | 4,148 | |||||||||
Basic earnings per share | $ | 0.59 | $ | 26.86 | $ | 0.67 | ||||||||||||
Diluted earnings per share | $ | 0.52 | $ | 26.86 | $ | 0.59 | ||||||||||||
Weighted Average Common Shares Outstanding | ||||||||||||||||||
| Basic | 5,591 | 100 | 610 | (d) | 6,201 | |||||||||||||
| Diluted | 6,383 | 100 | 610 | (d) | 6,993 | |||||||||||||
| (a) | To record a year’s amortization of intangible assets acquired from SCS based on estimated values and useful lives. | |
| (b) | To record a year’s interest expense on amounts borrowed to finance the purchase of SCS. | |
| (c) | To record income tax effect of acquisition of SCS, which was anS-Corporation until the acquisition, and these pro-forma adjustments. | |
| (d) | To record the issuance of 609,756 shares of common stock to the former stockholders of SCS as of January 1, 2004. |
F-57
Table of Contents
2,850,000 Shares
NATURAL GAS SERVICES GROUP, INC.
Common Stock
PROSPECTUS
MORGAN KEEGAN & COMPANY, INC.
March 2, 2006