Vision To Be the Transformative Partner for our customers, a Positive Force in our communities and earn exceptional returns
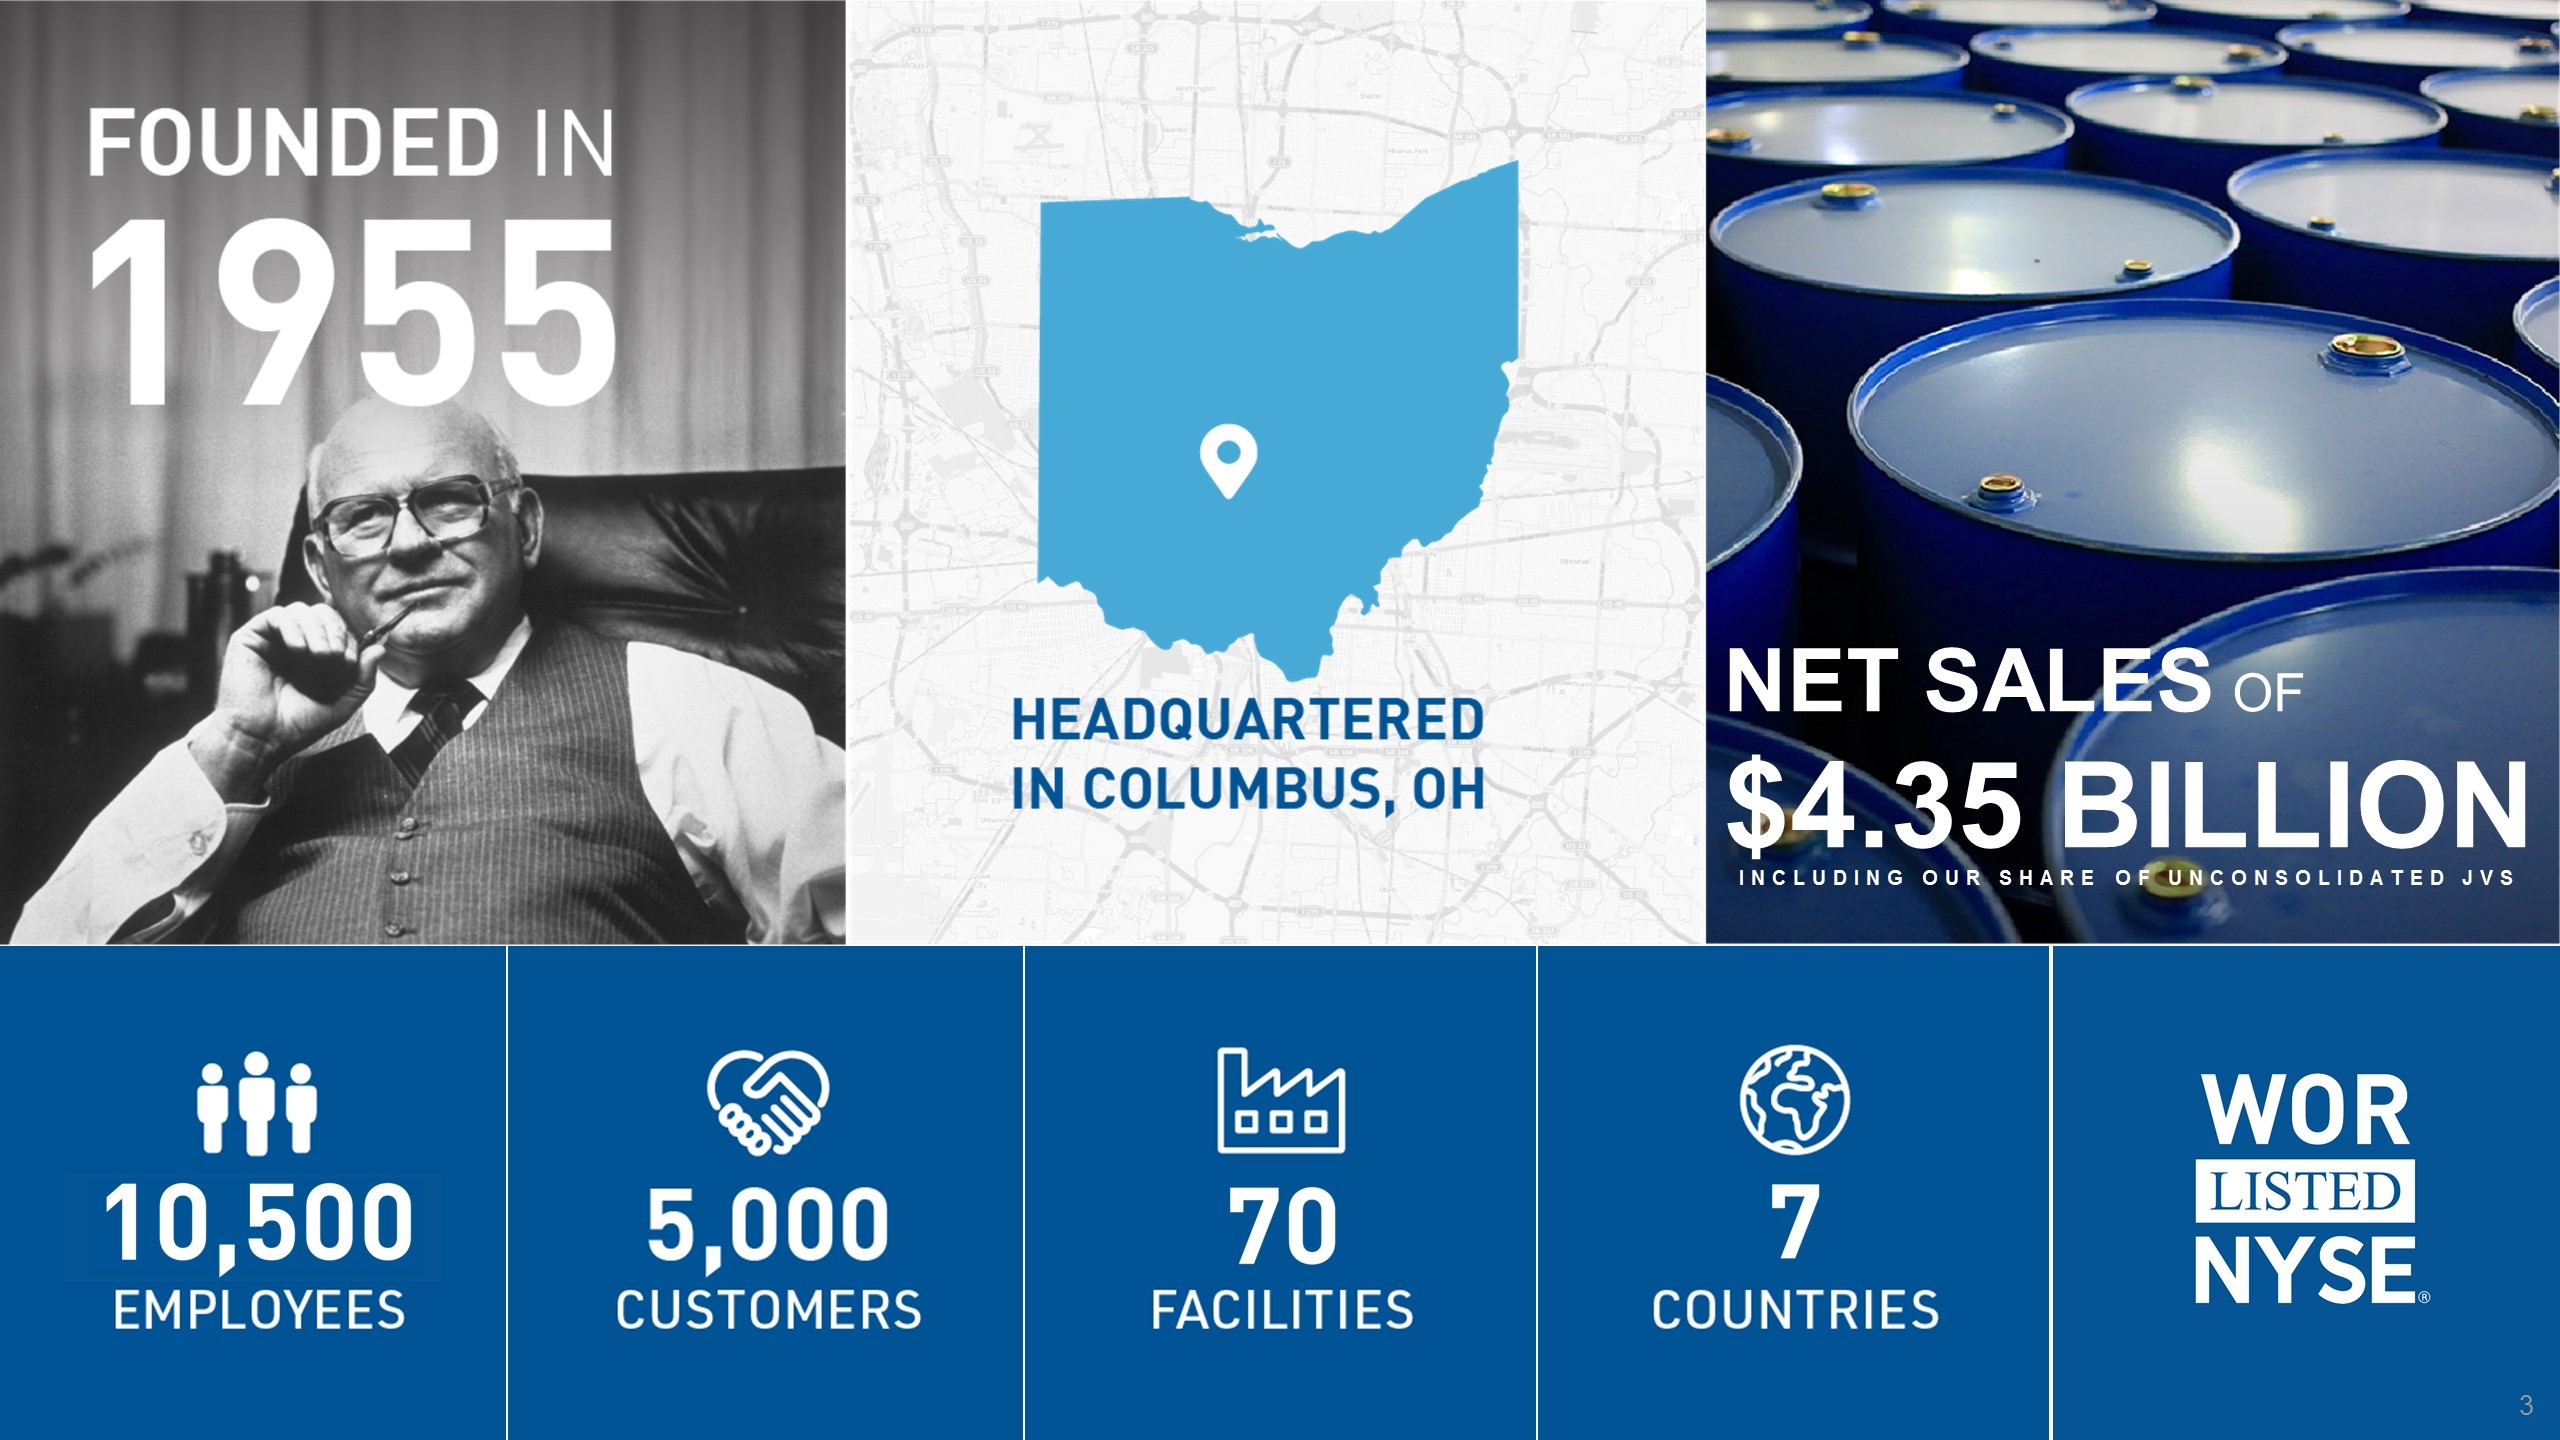
Net sales of $4.35 billion Including our share of unconsolidated JVs
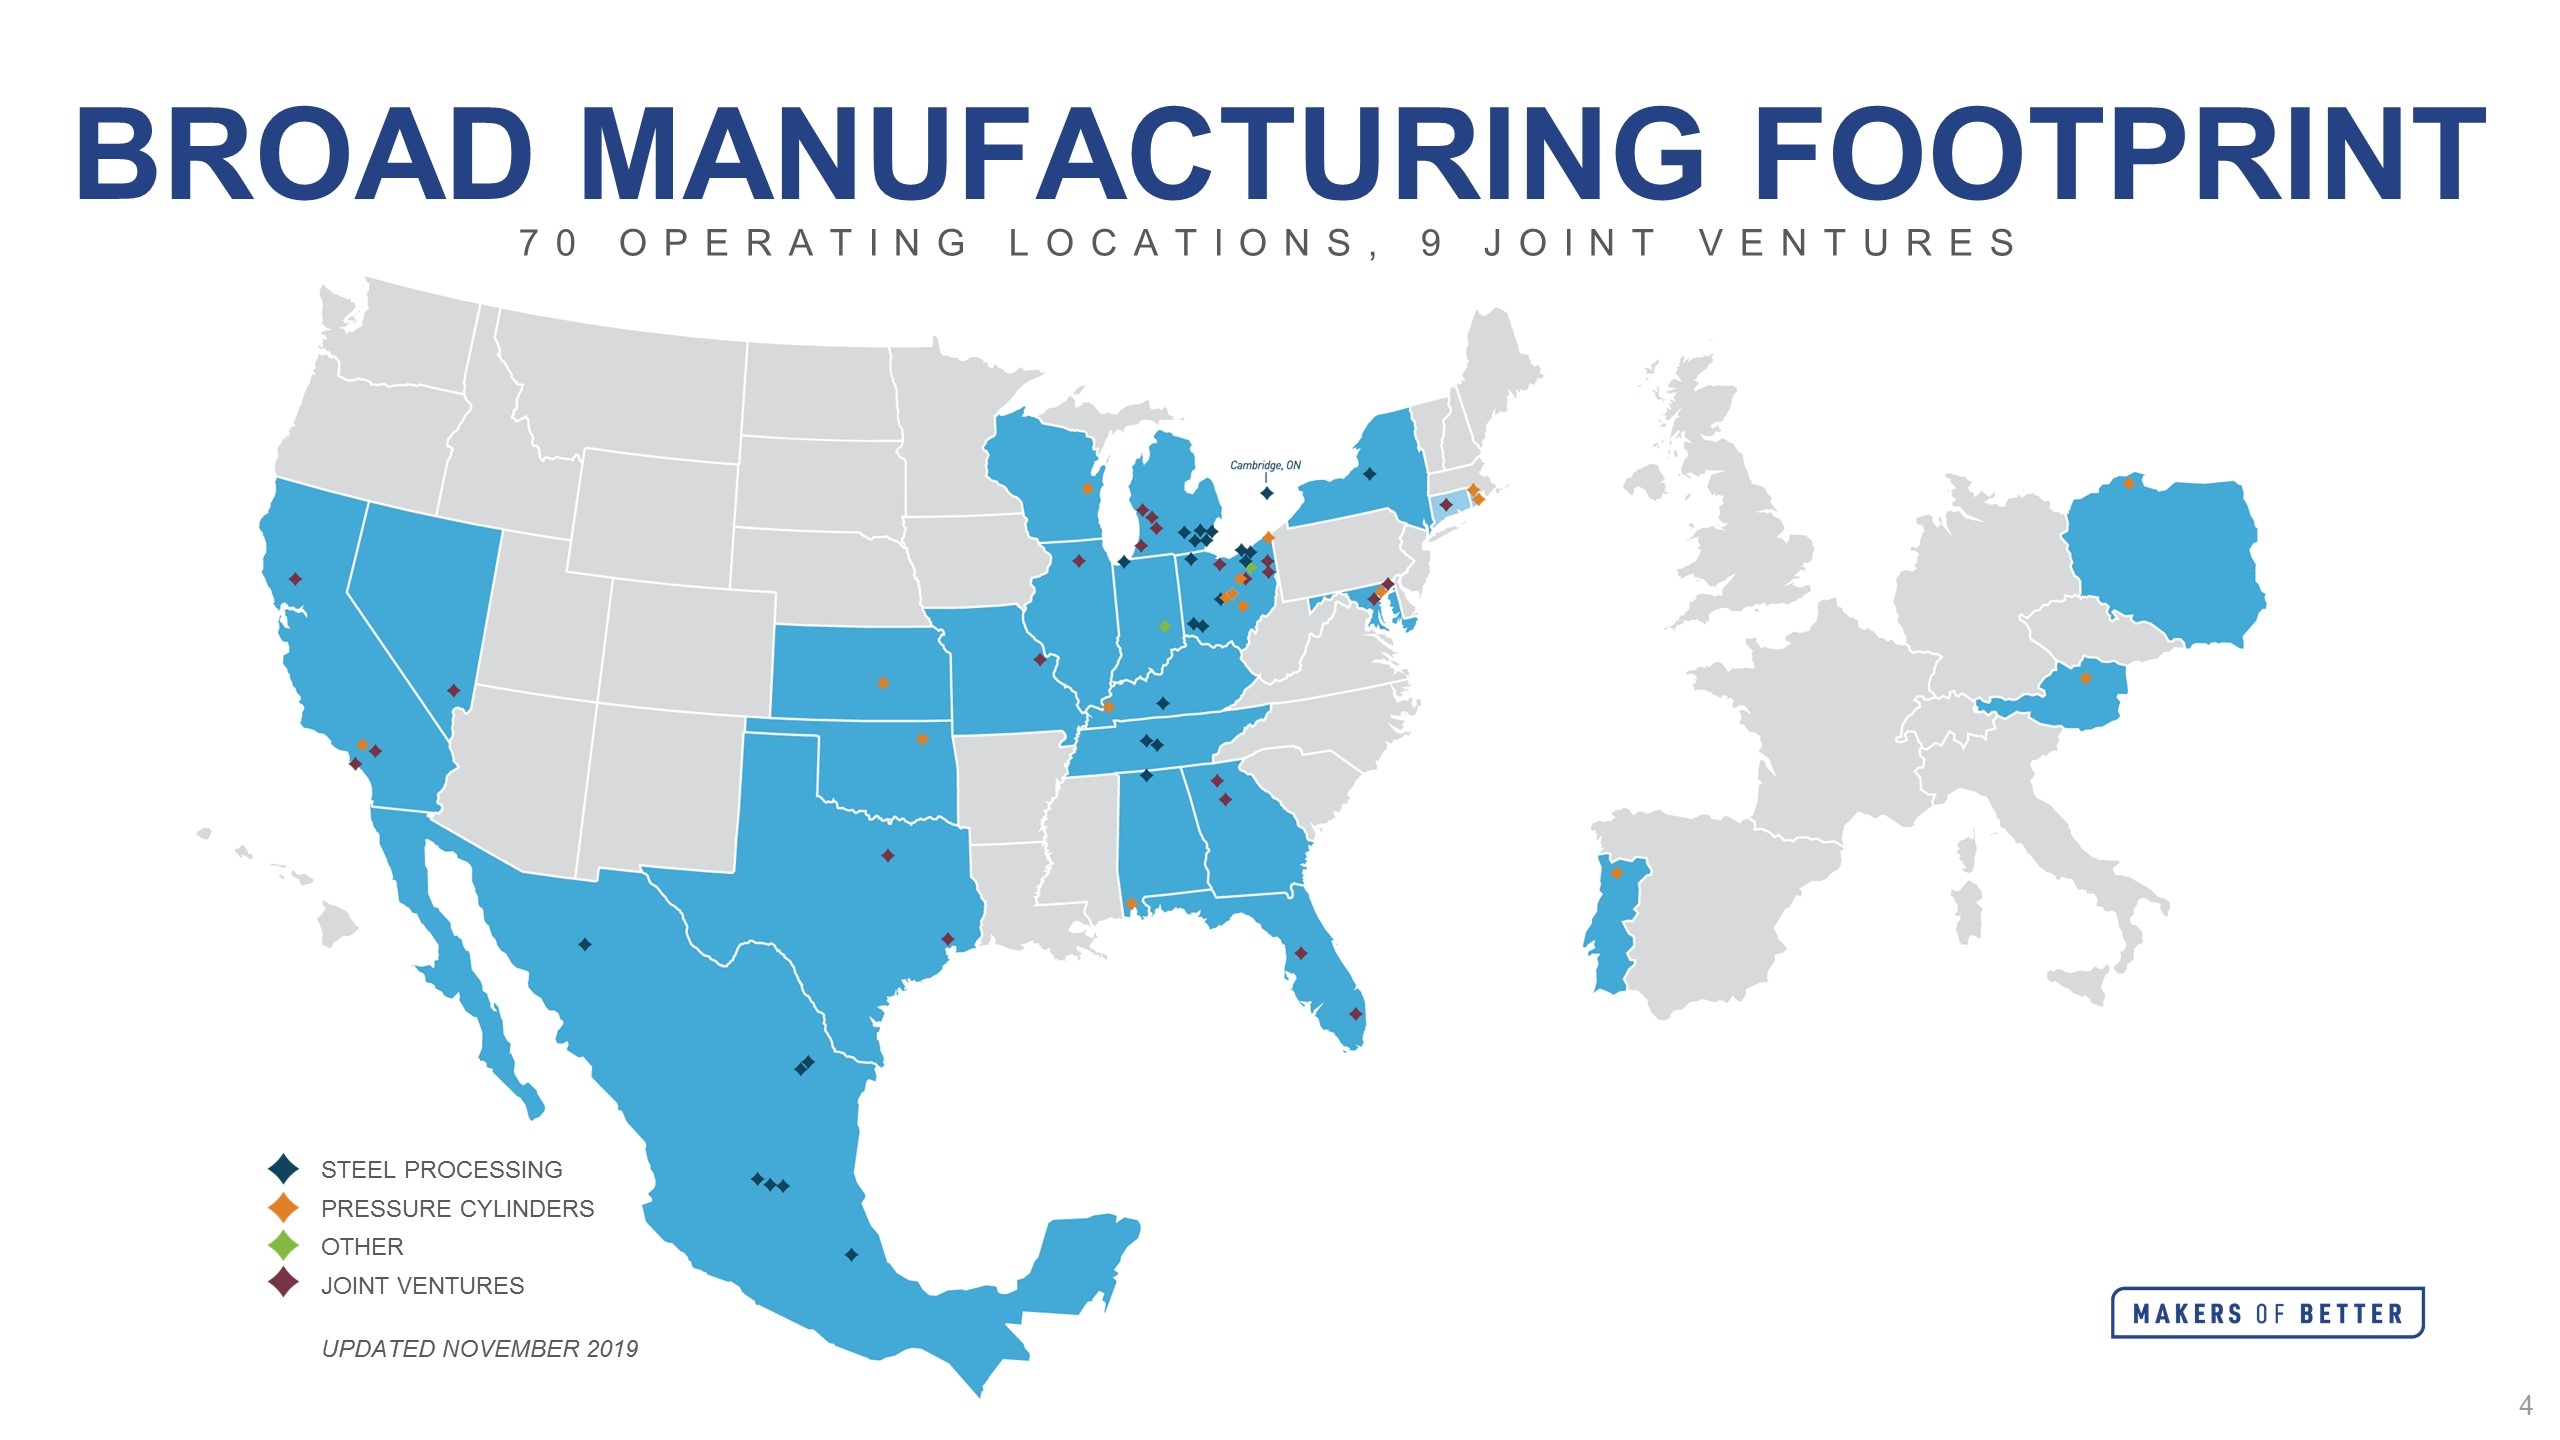
Broad Manufacturing Footprint 70 operating locations, 9 joint ventures Updated November 2019 STEEL PROCESSING PRESSURE CYLINDERS OTHER JOINT VENTURES
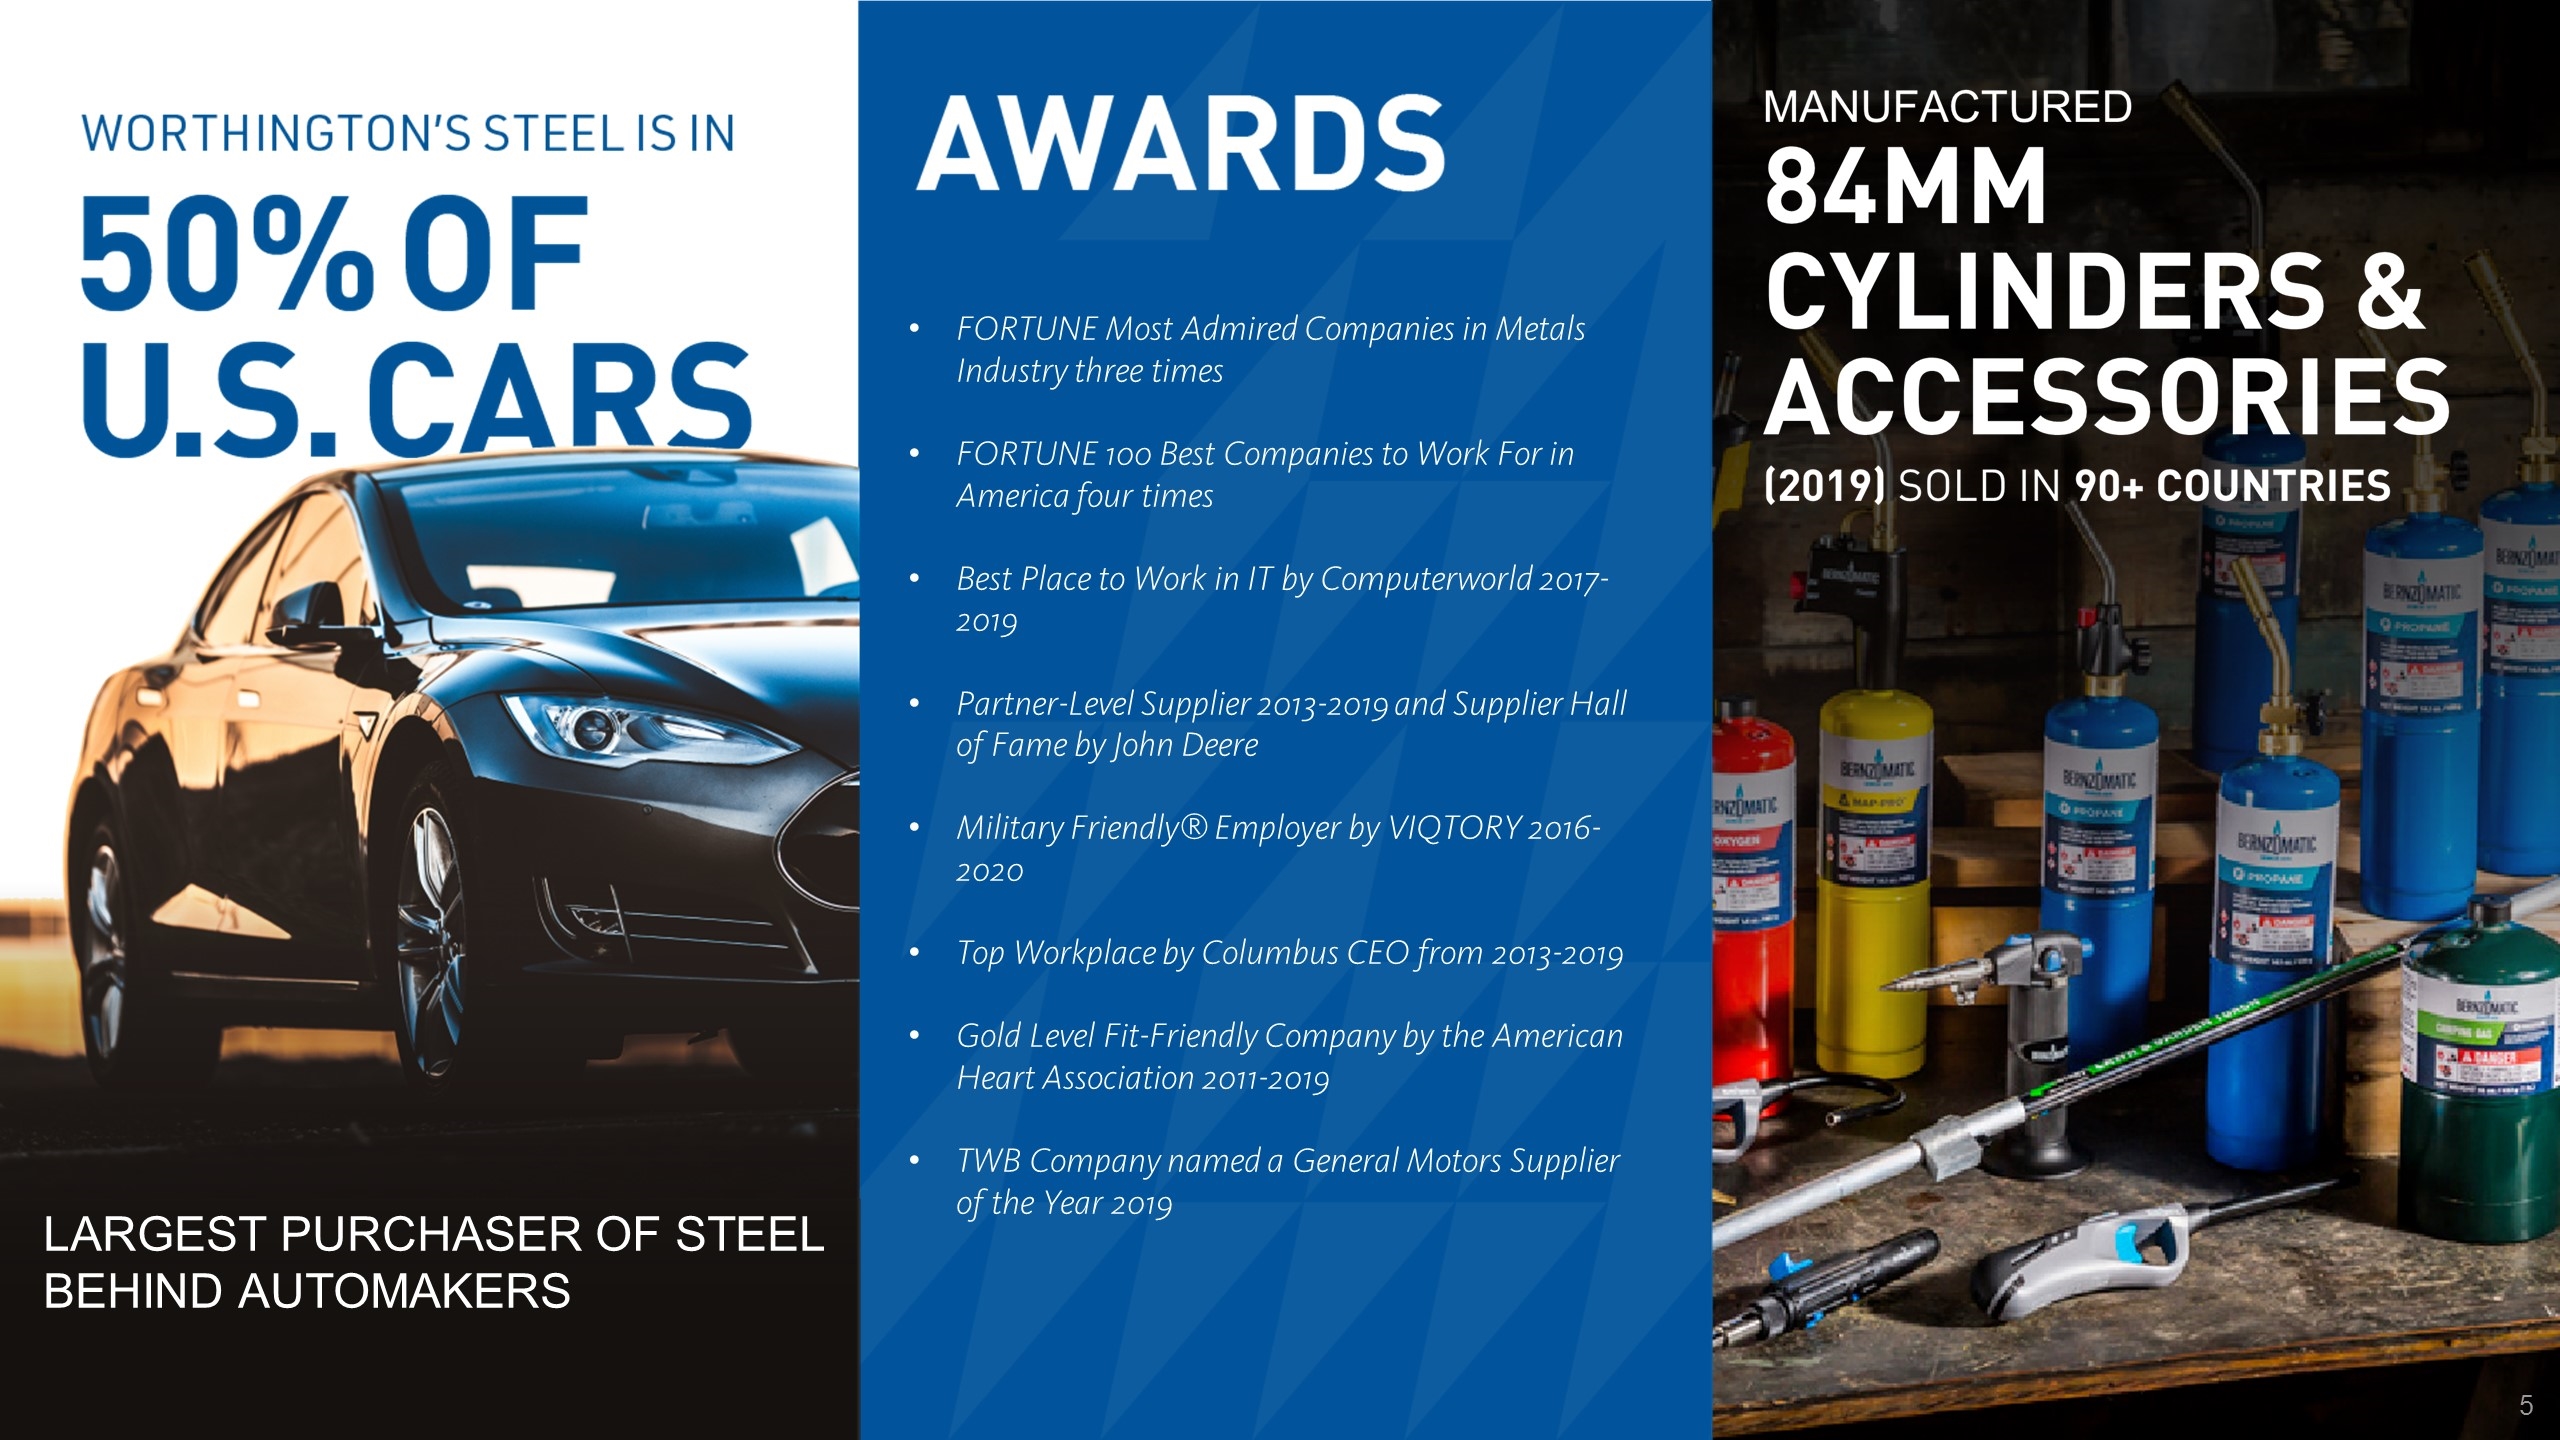
Largest purchaser of steel behind automakers FORTUNE Most Admired Companies in Metals Industry three times FORTUNE 100 Best Companies to Work For in America four times Best Place to Work in IT by Computerworld 2017-2019 Partner-Level Supplier 2013-2019 and Supplier Hall of Fame by John Deere Military Friendly® Employer by VIQTORY 2016-2020 Top Workplace by Columbus CEO from 2013-2019 Gold Level Fit-Friendly Company by the American Heart Association 2011-2019 TWB Company named a General Motors Supplier of the Year 2019
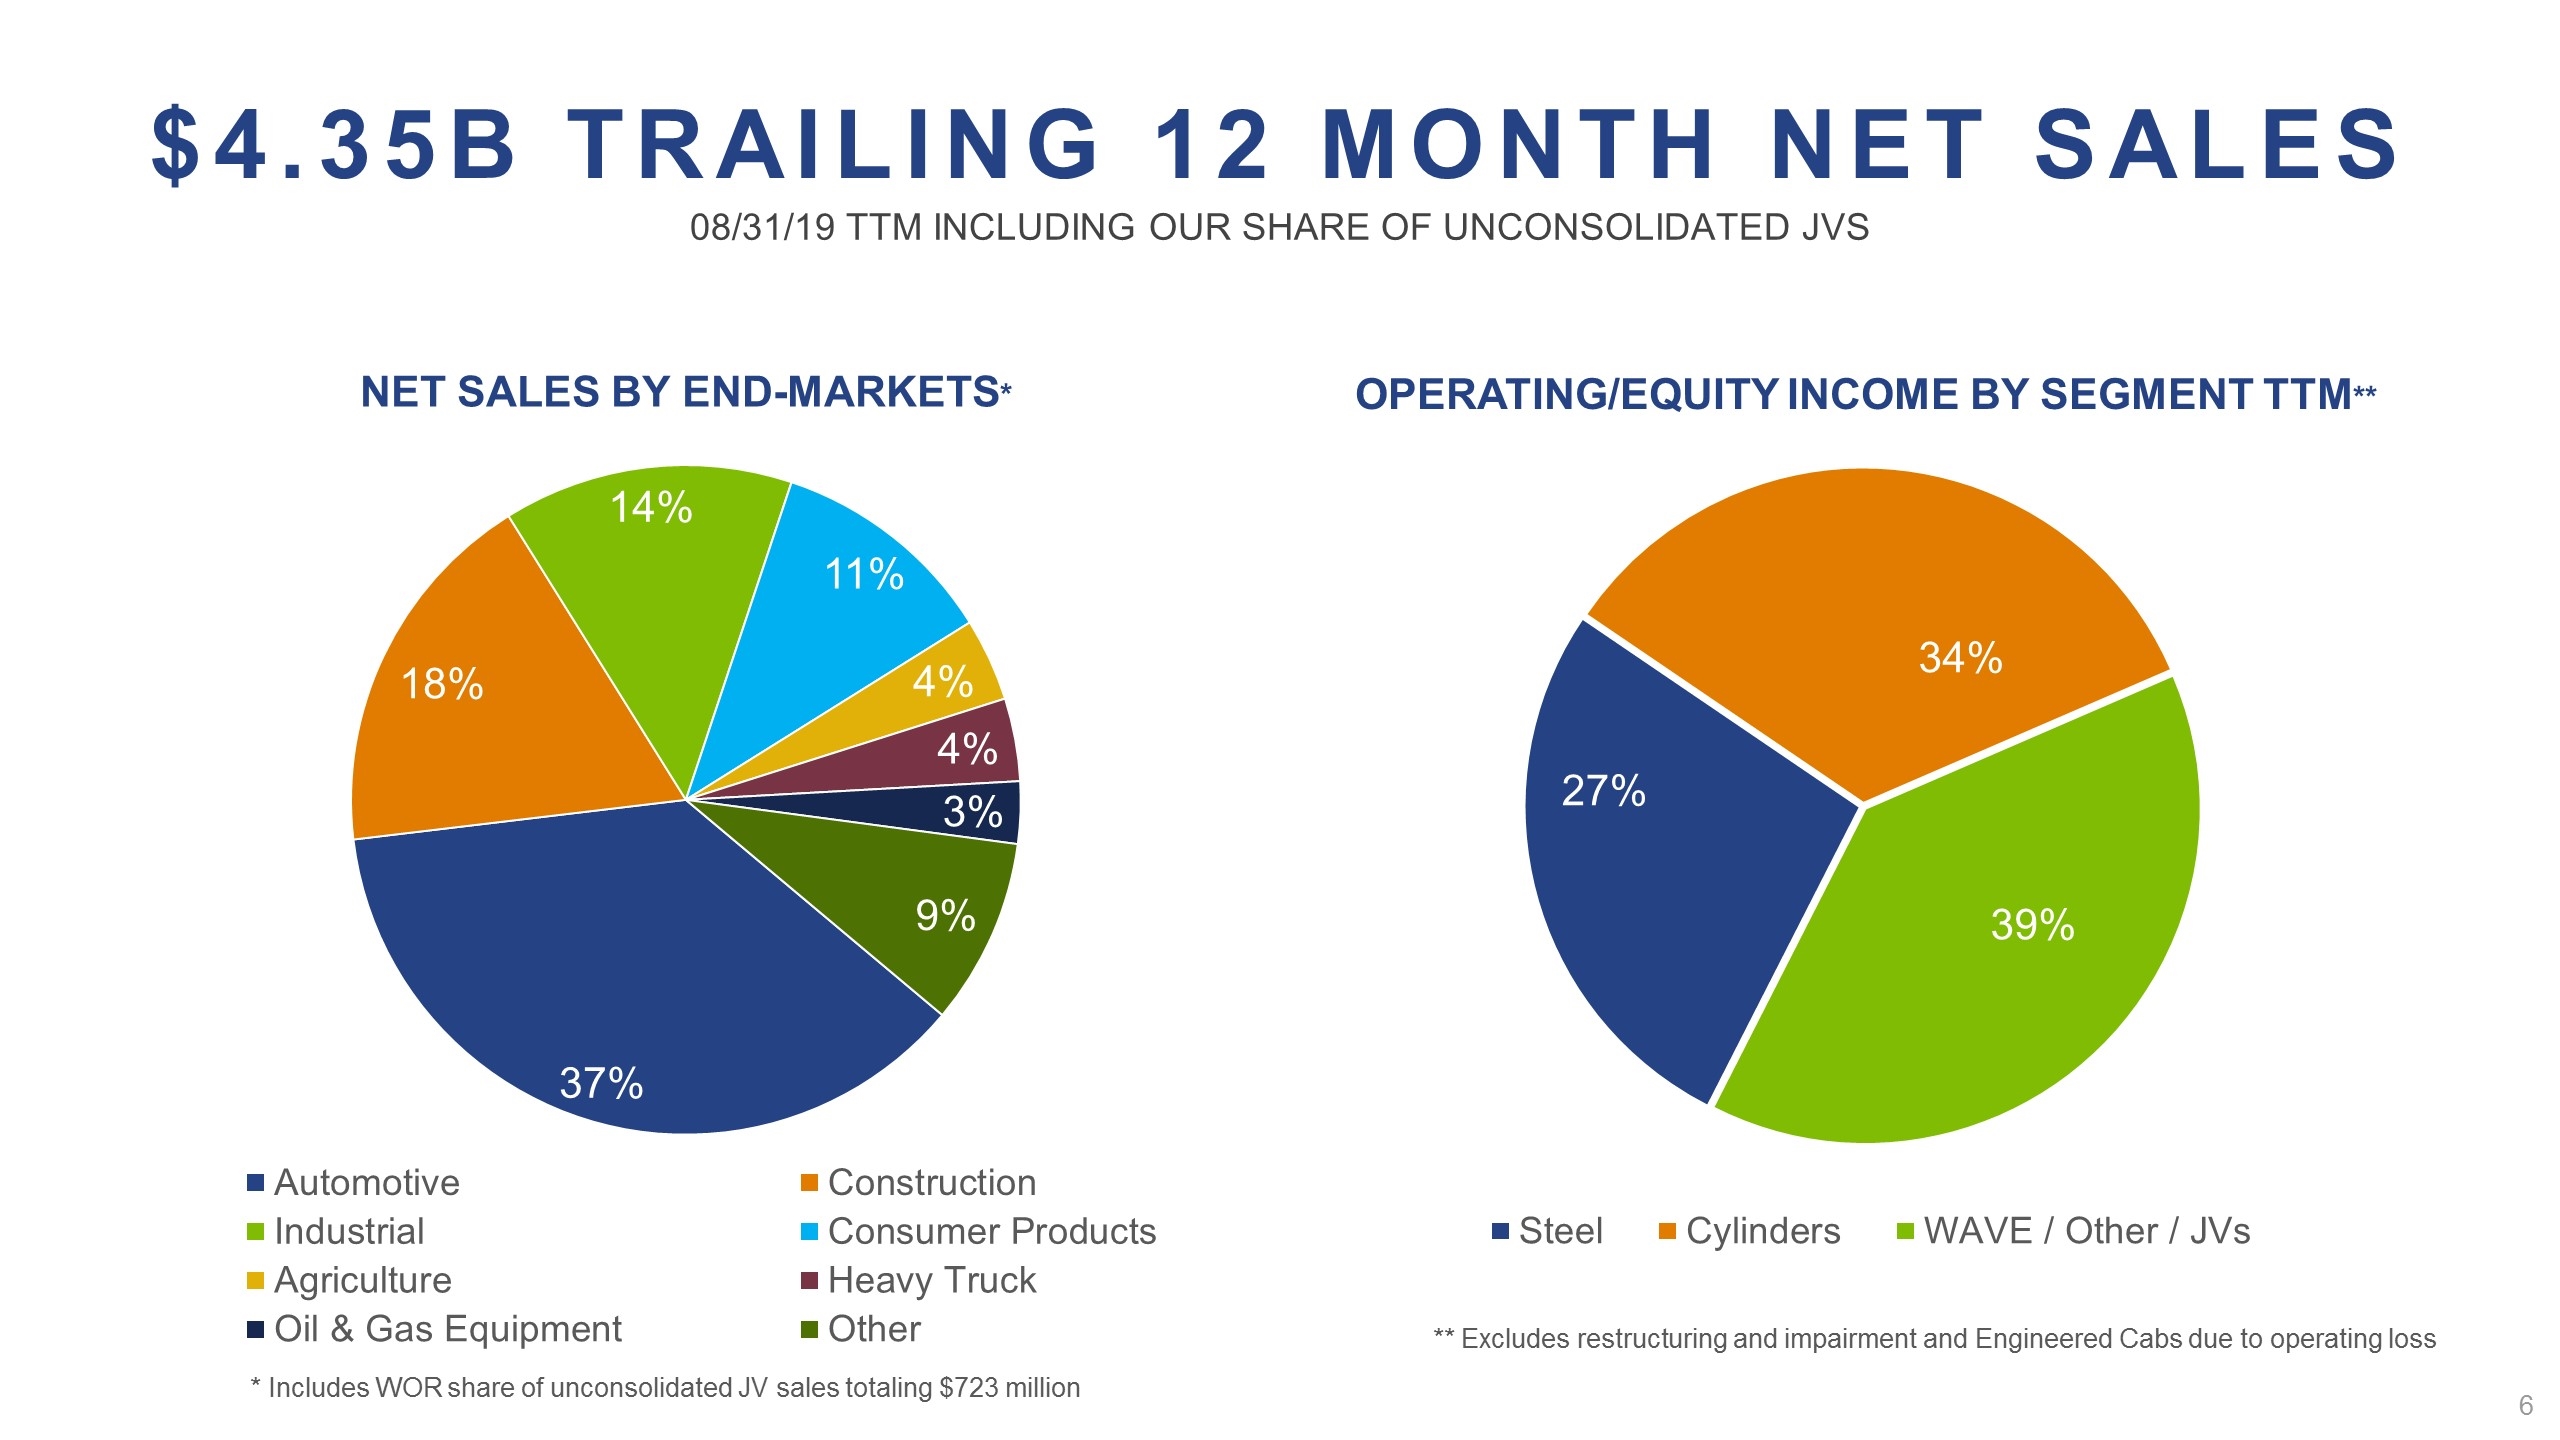
Net Sales by End-Markets* $4.35B Trailing 12 Month Net Sales 08/31/19 TTM Including our share of unconsolidated JVs Operating/Equity Income by Segment TTM** * Includes WOR share of unconsolidated JV sales totaling $723 million ** Excludes restructuring and impairment and Engineered Cabs due to operating loss
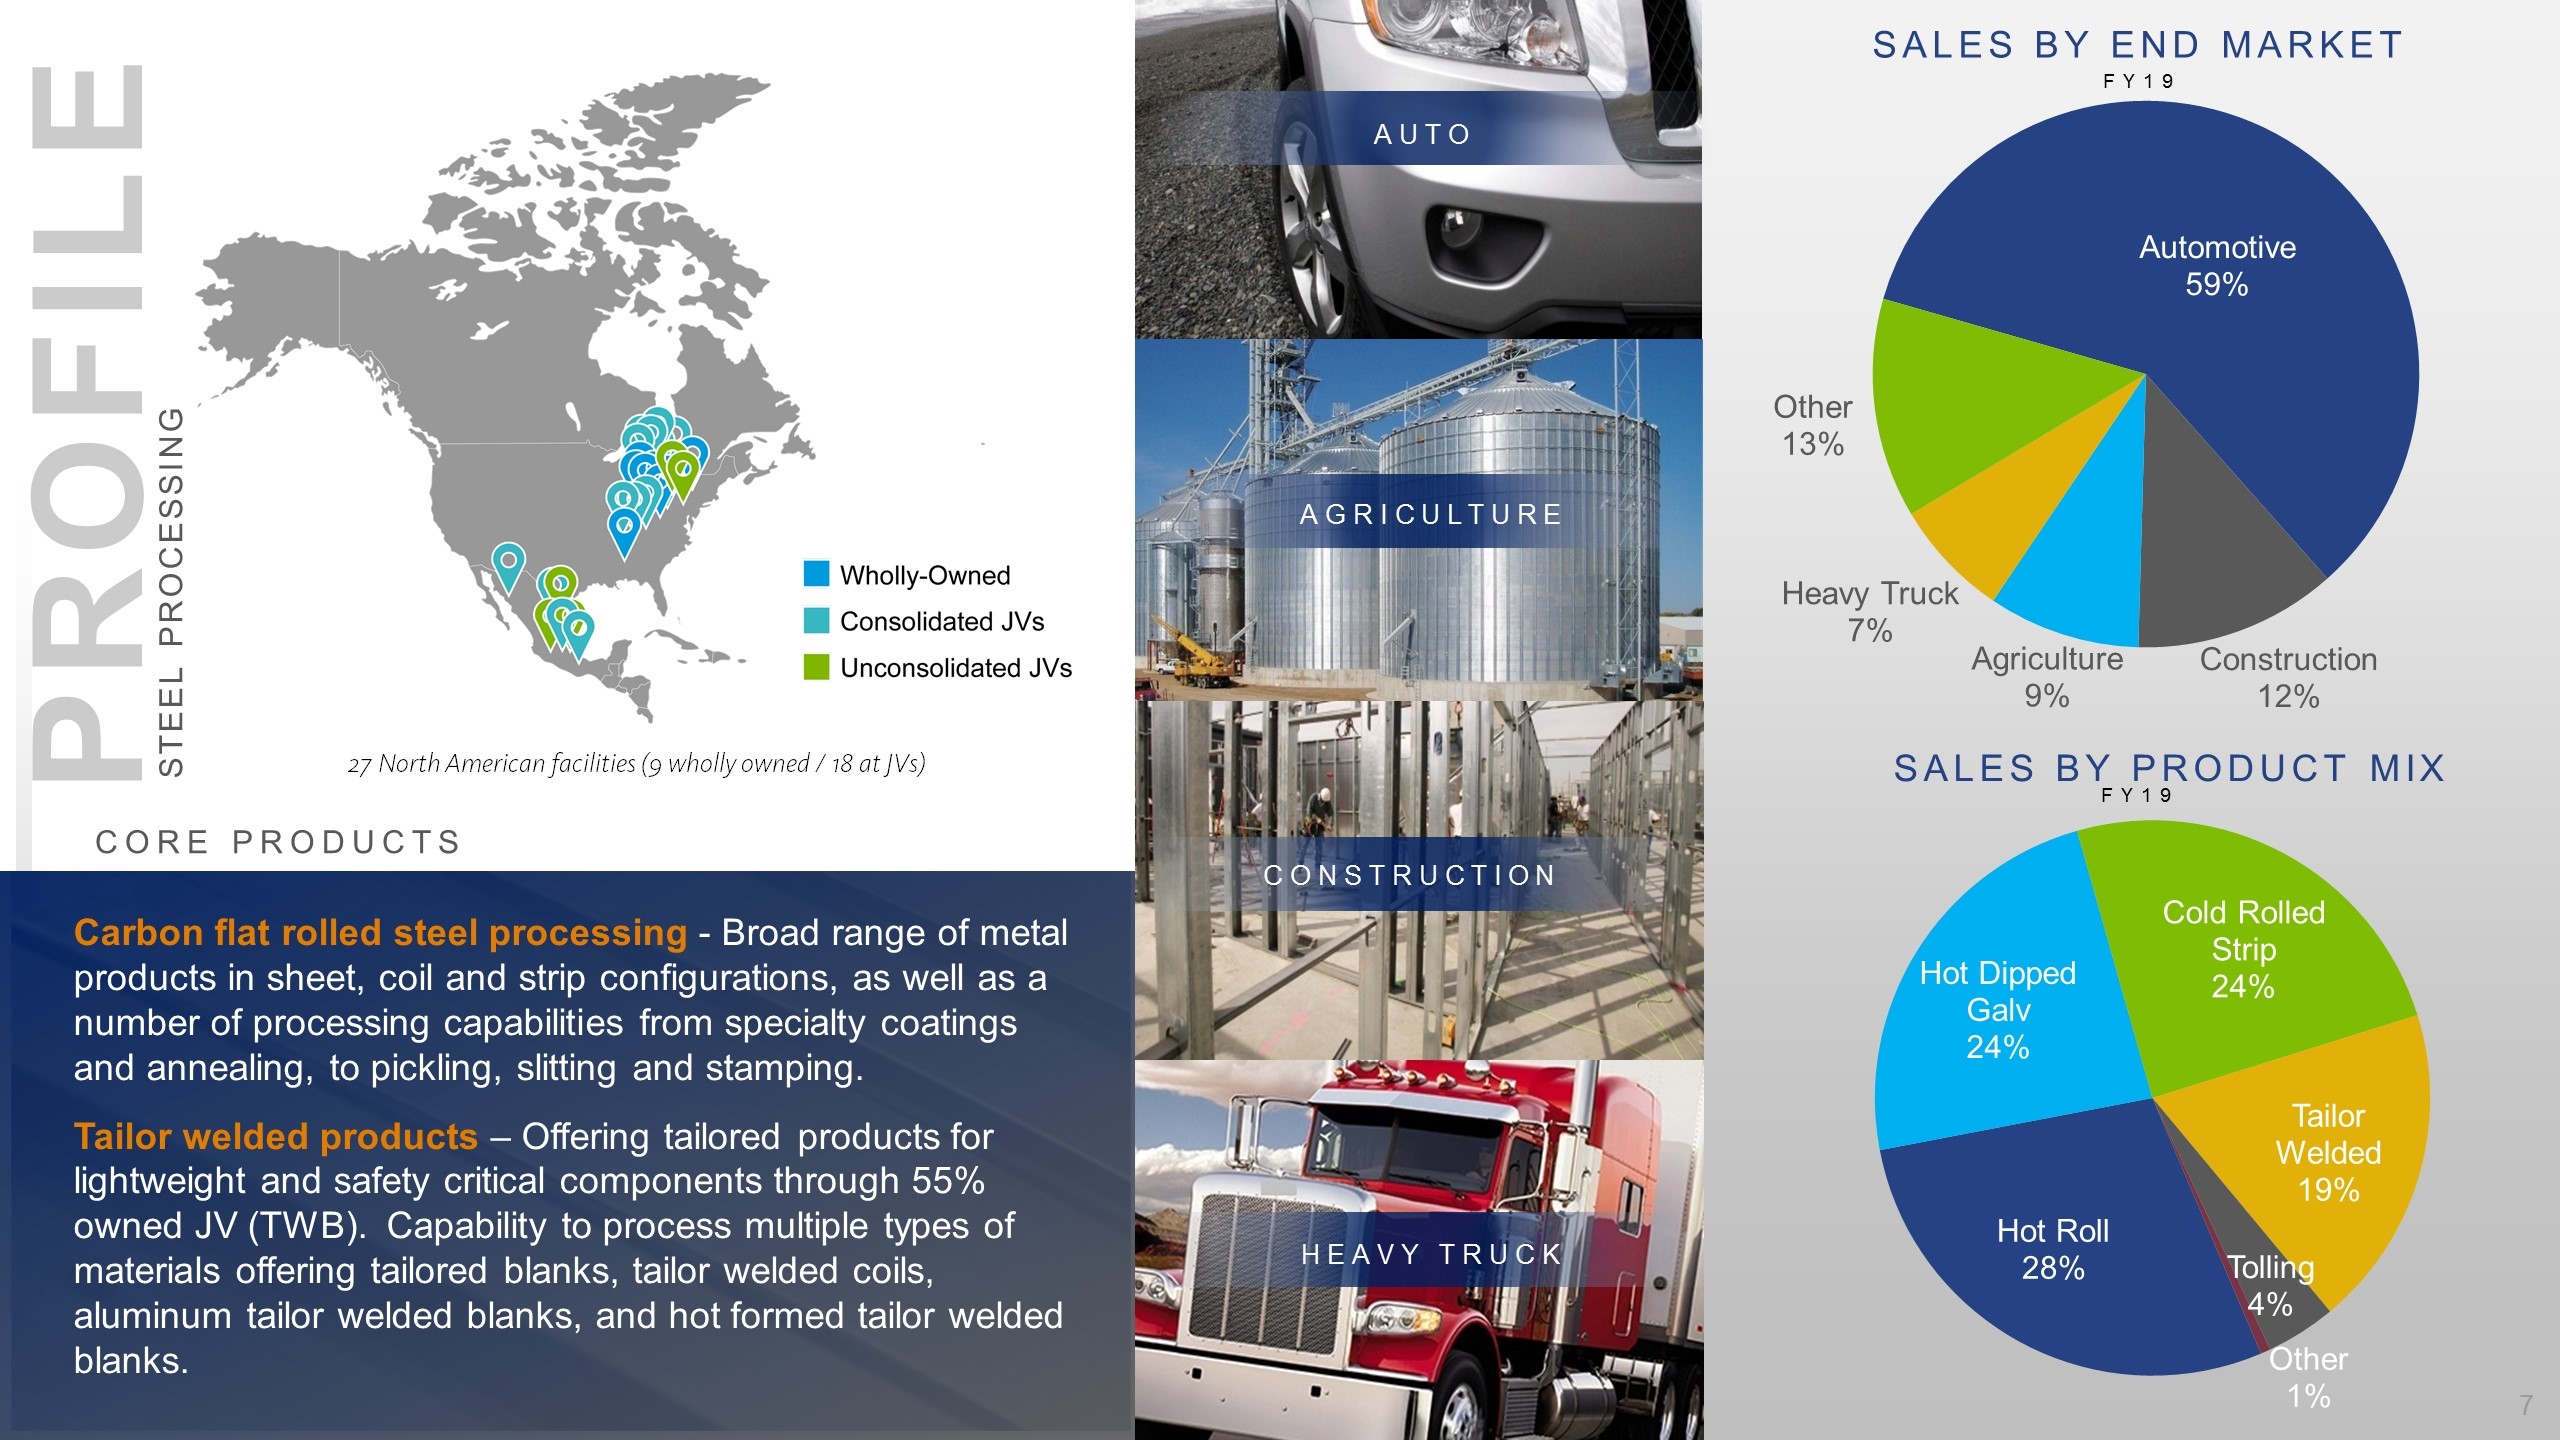
Sales By End Market Sales by Product Mix FY19 FY19 AUTO CORE PRODUCTS Profile STEEL PROCESSING AGRICULTURE CONSTRUCTION HEAVY TRUCK Carbon flat rolled steel processing - Broad range of metal products in sheet, coil and strip configurations, as well as a number of processing capabilities from specialty coatings and annealing, to pickling, slitting and stamping. Tailor welded products – Offering tailored products for lightweight and safety critical components through 55% owned JV (TWB). Capability to process multiple types of materials offering tailored blanks, tailor welded coils, aluminum tailor welded blanks, and hot formed tailor welded blanks. 27 North American facilities (9 wholly owned / 18 at JVs)
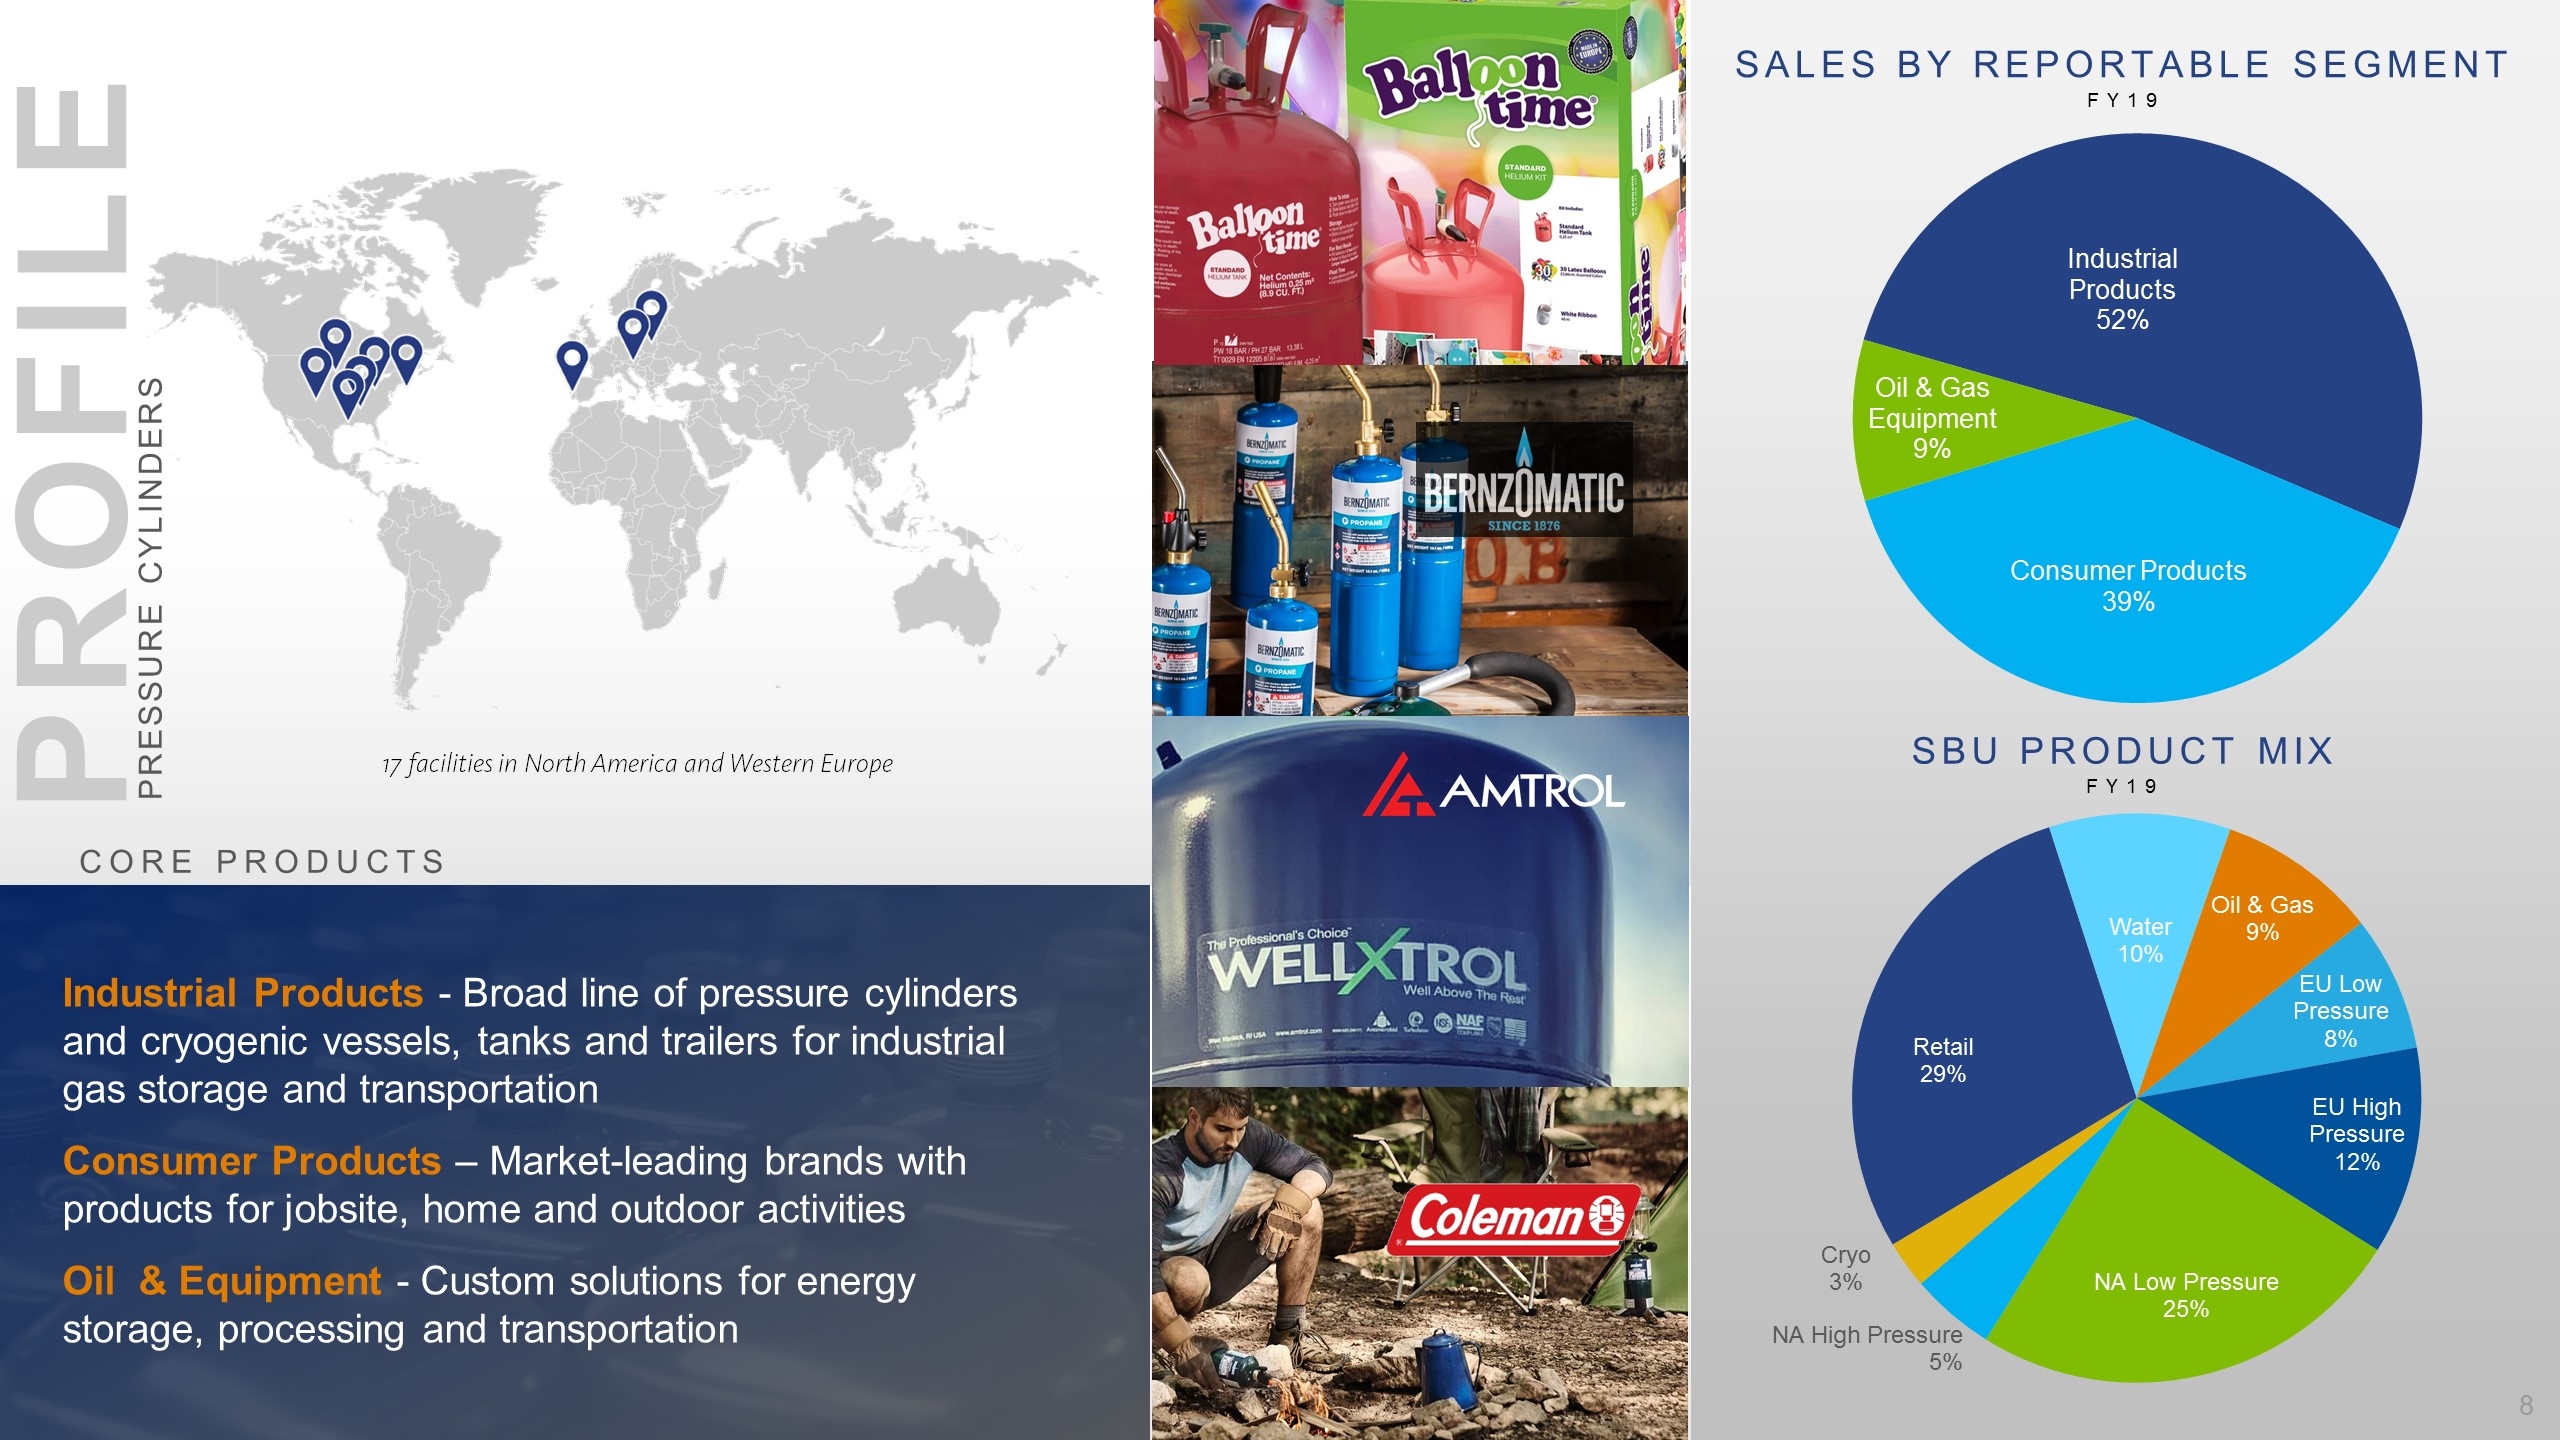
Profile Sales By Reportable Segment SBU Product Mix Industrial Products - Broad line of pressure cylinders and cryogenic vessels, tanks and trailers for industrial gas storage and transportation Consumer Products – Market-leading brands with products for jobsite, home and outdoor activities Oil & Equipment - Custom solutions for energy storage, processing and transportation FY19 FY19 CORE PRODUCTS PRESSURE CYLINDERS 17 facilities in North America and Western Europe
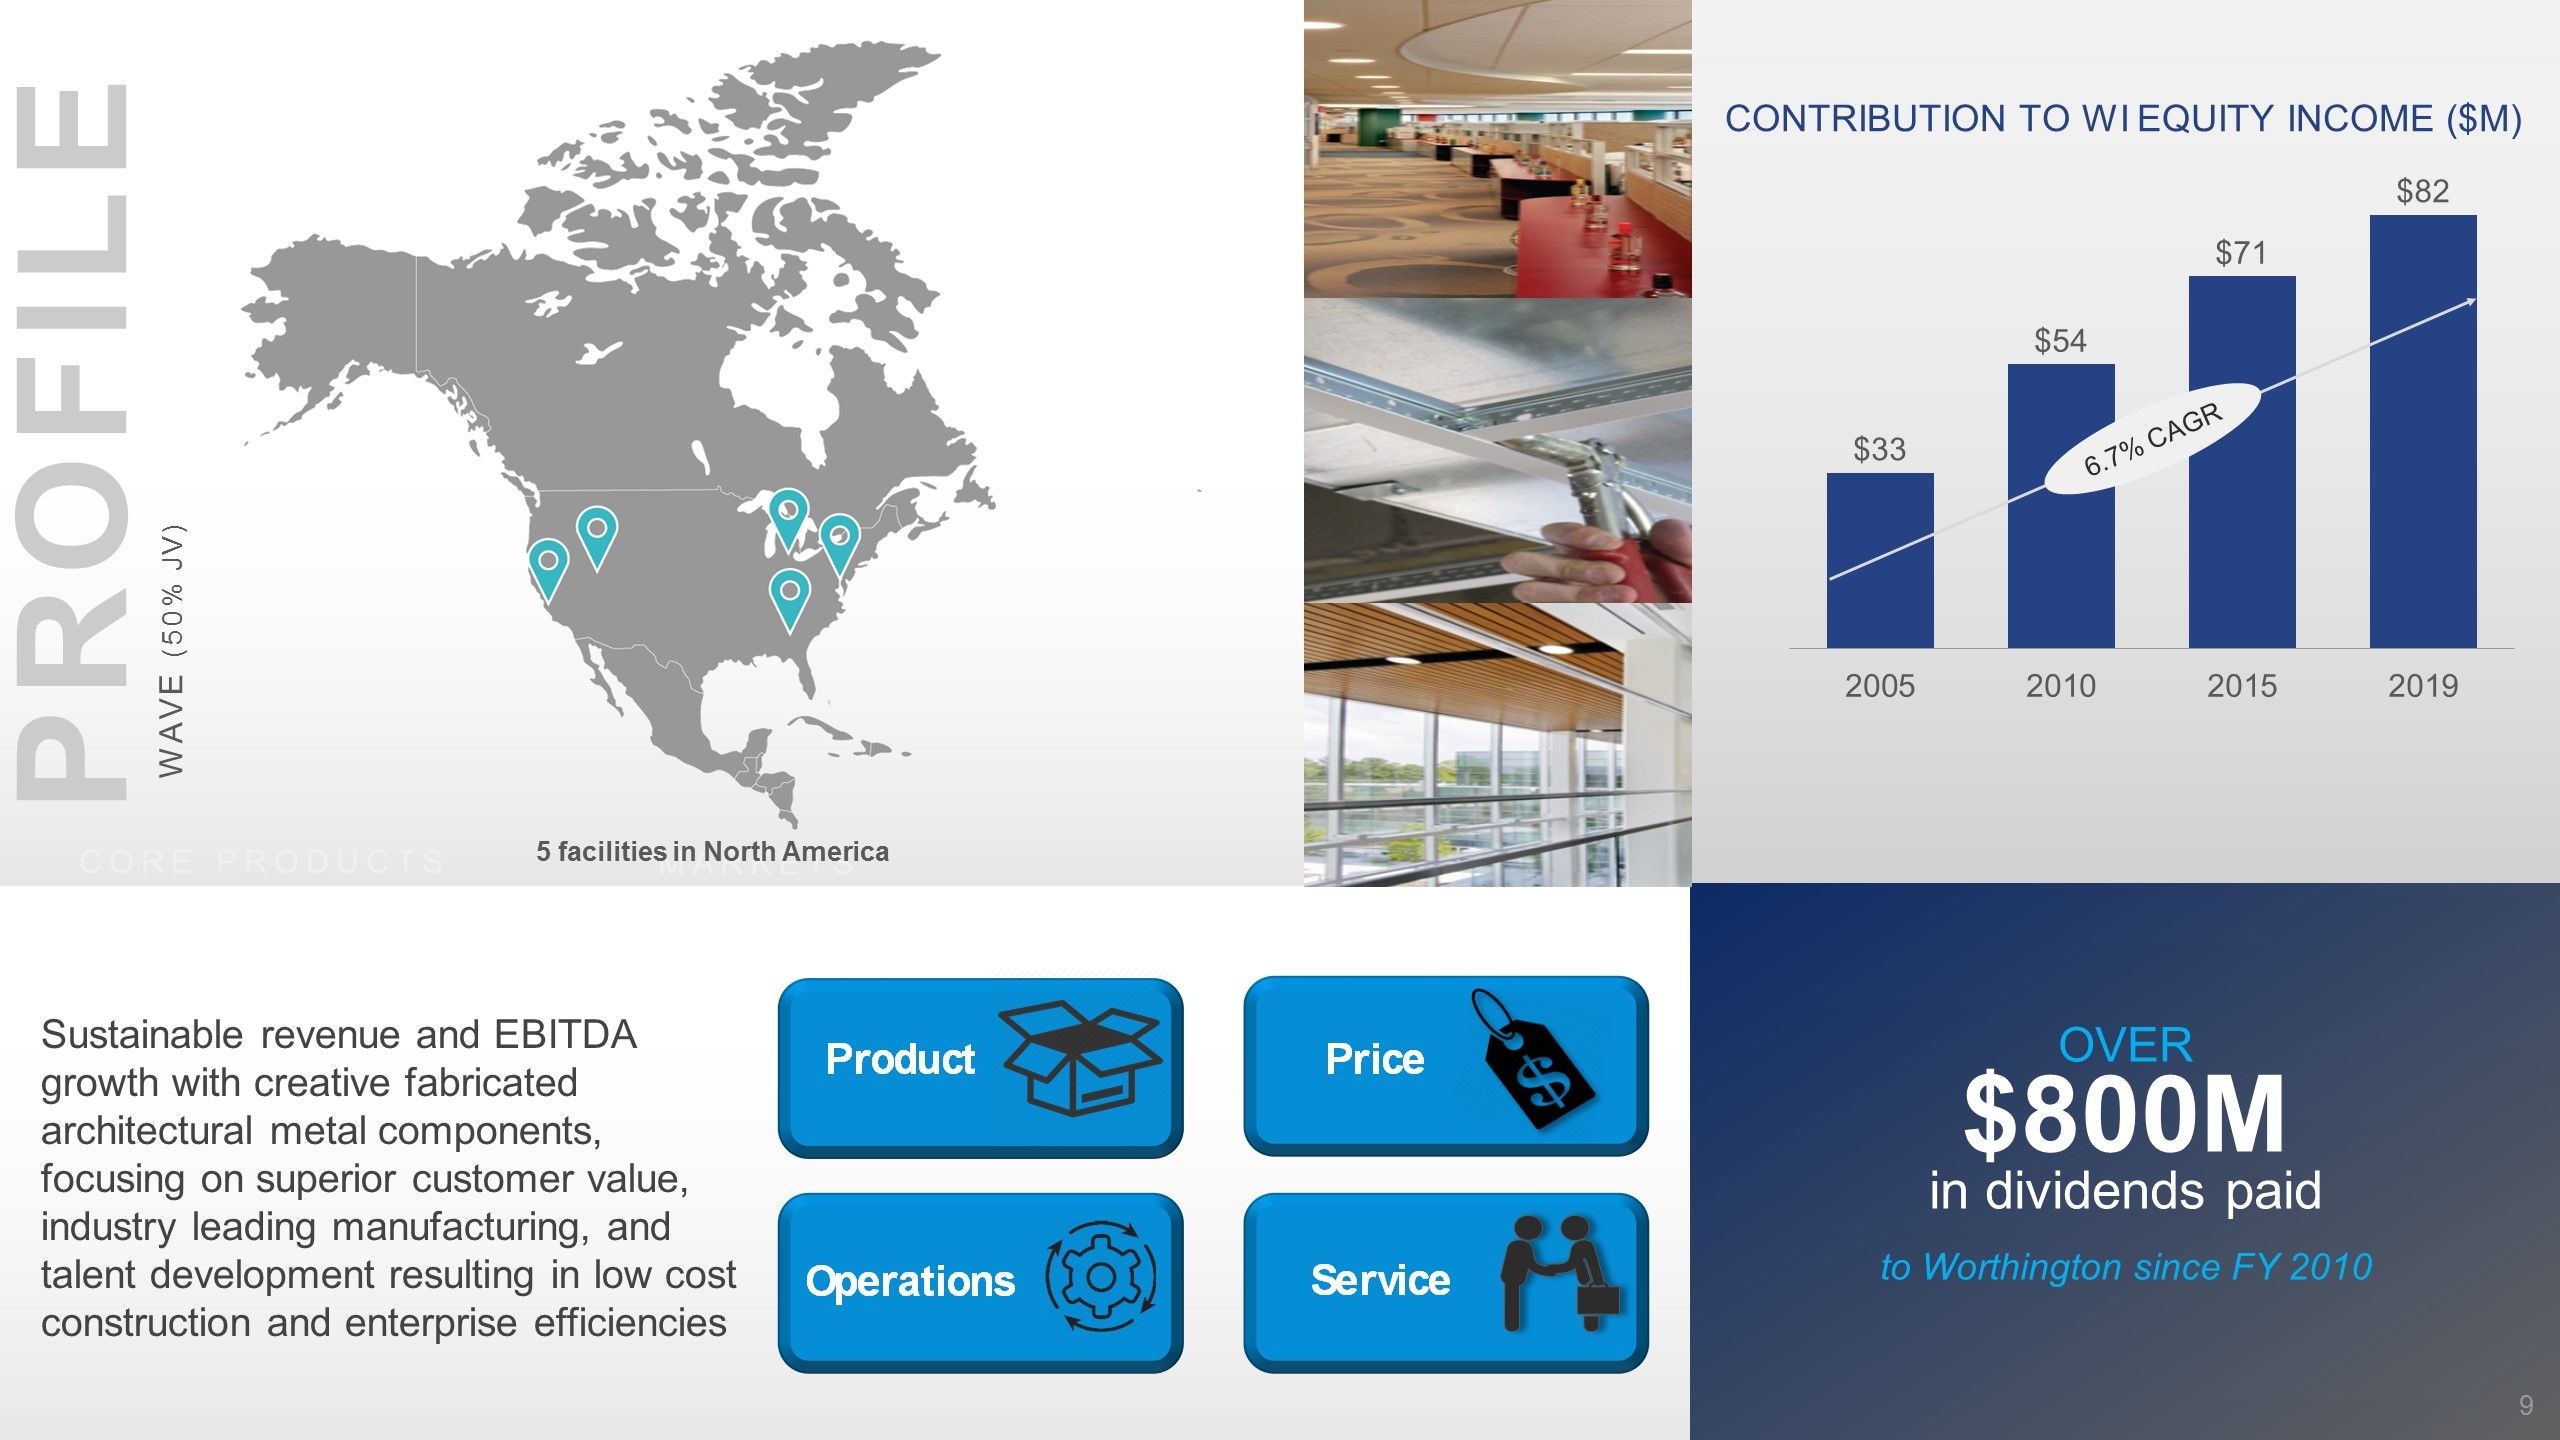
Profile Contribution to WI Equity Income ($M) MARKETS CORE PRODUCTS 6.7% CAGR Sustainable revenue and EBITDA growth with creative fabricated architectural metal components, focusing on superior customer value, industry leading manufacturing, and talent development resulting in low cost construction and enterprise efficiencies Over $800M in dividends paid to Worthington since FY 2010 WAVE (50% JV) 5 facilities in North America
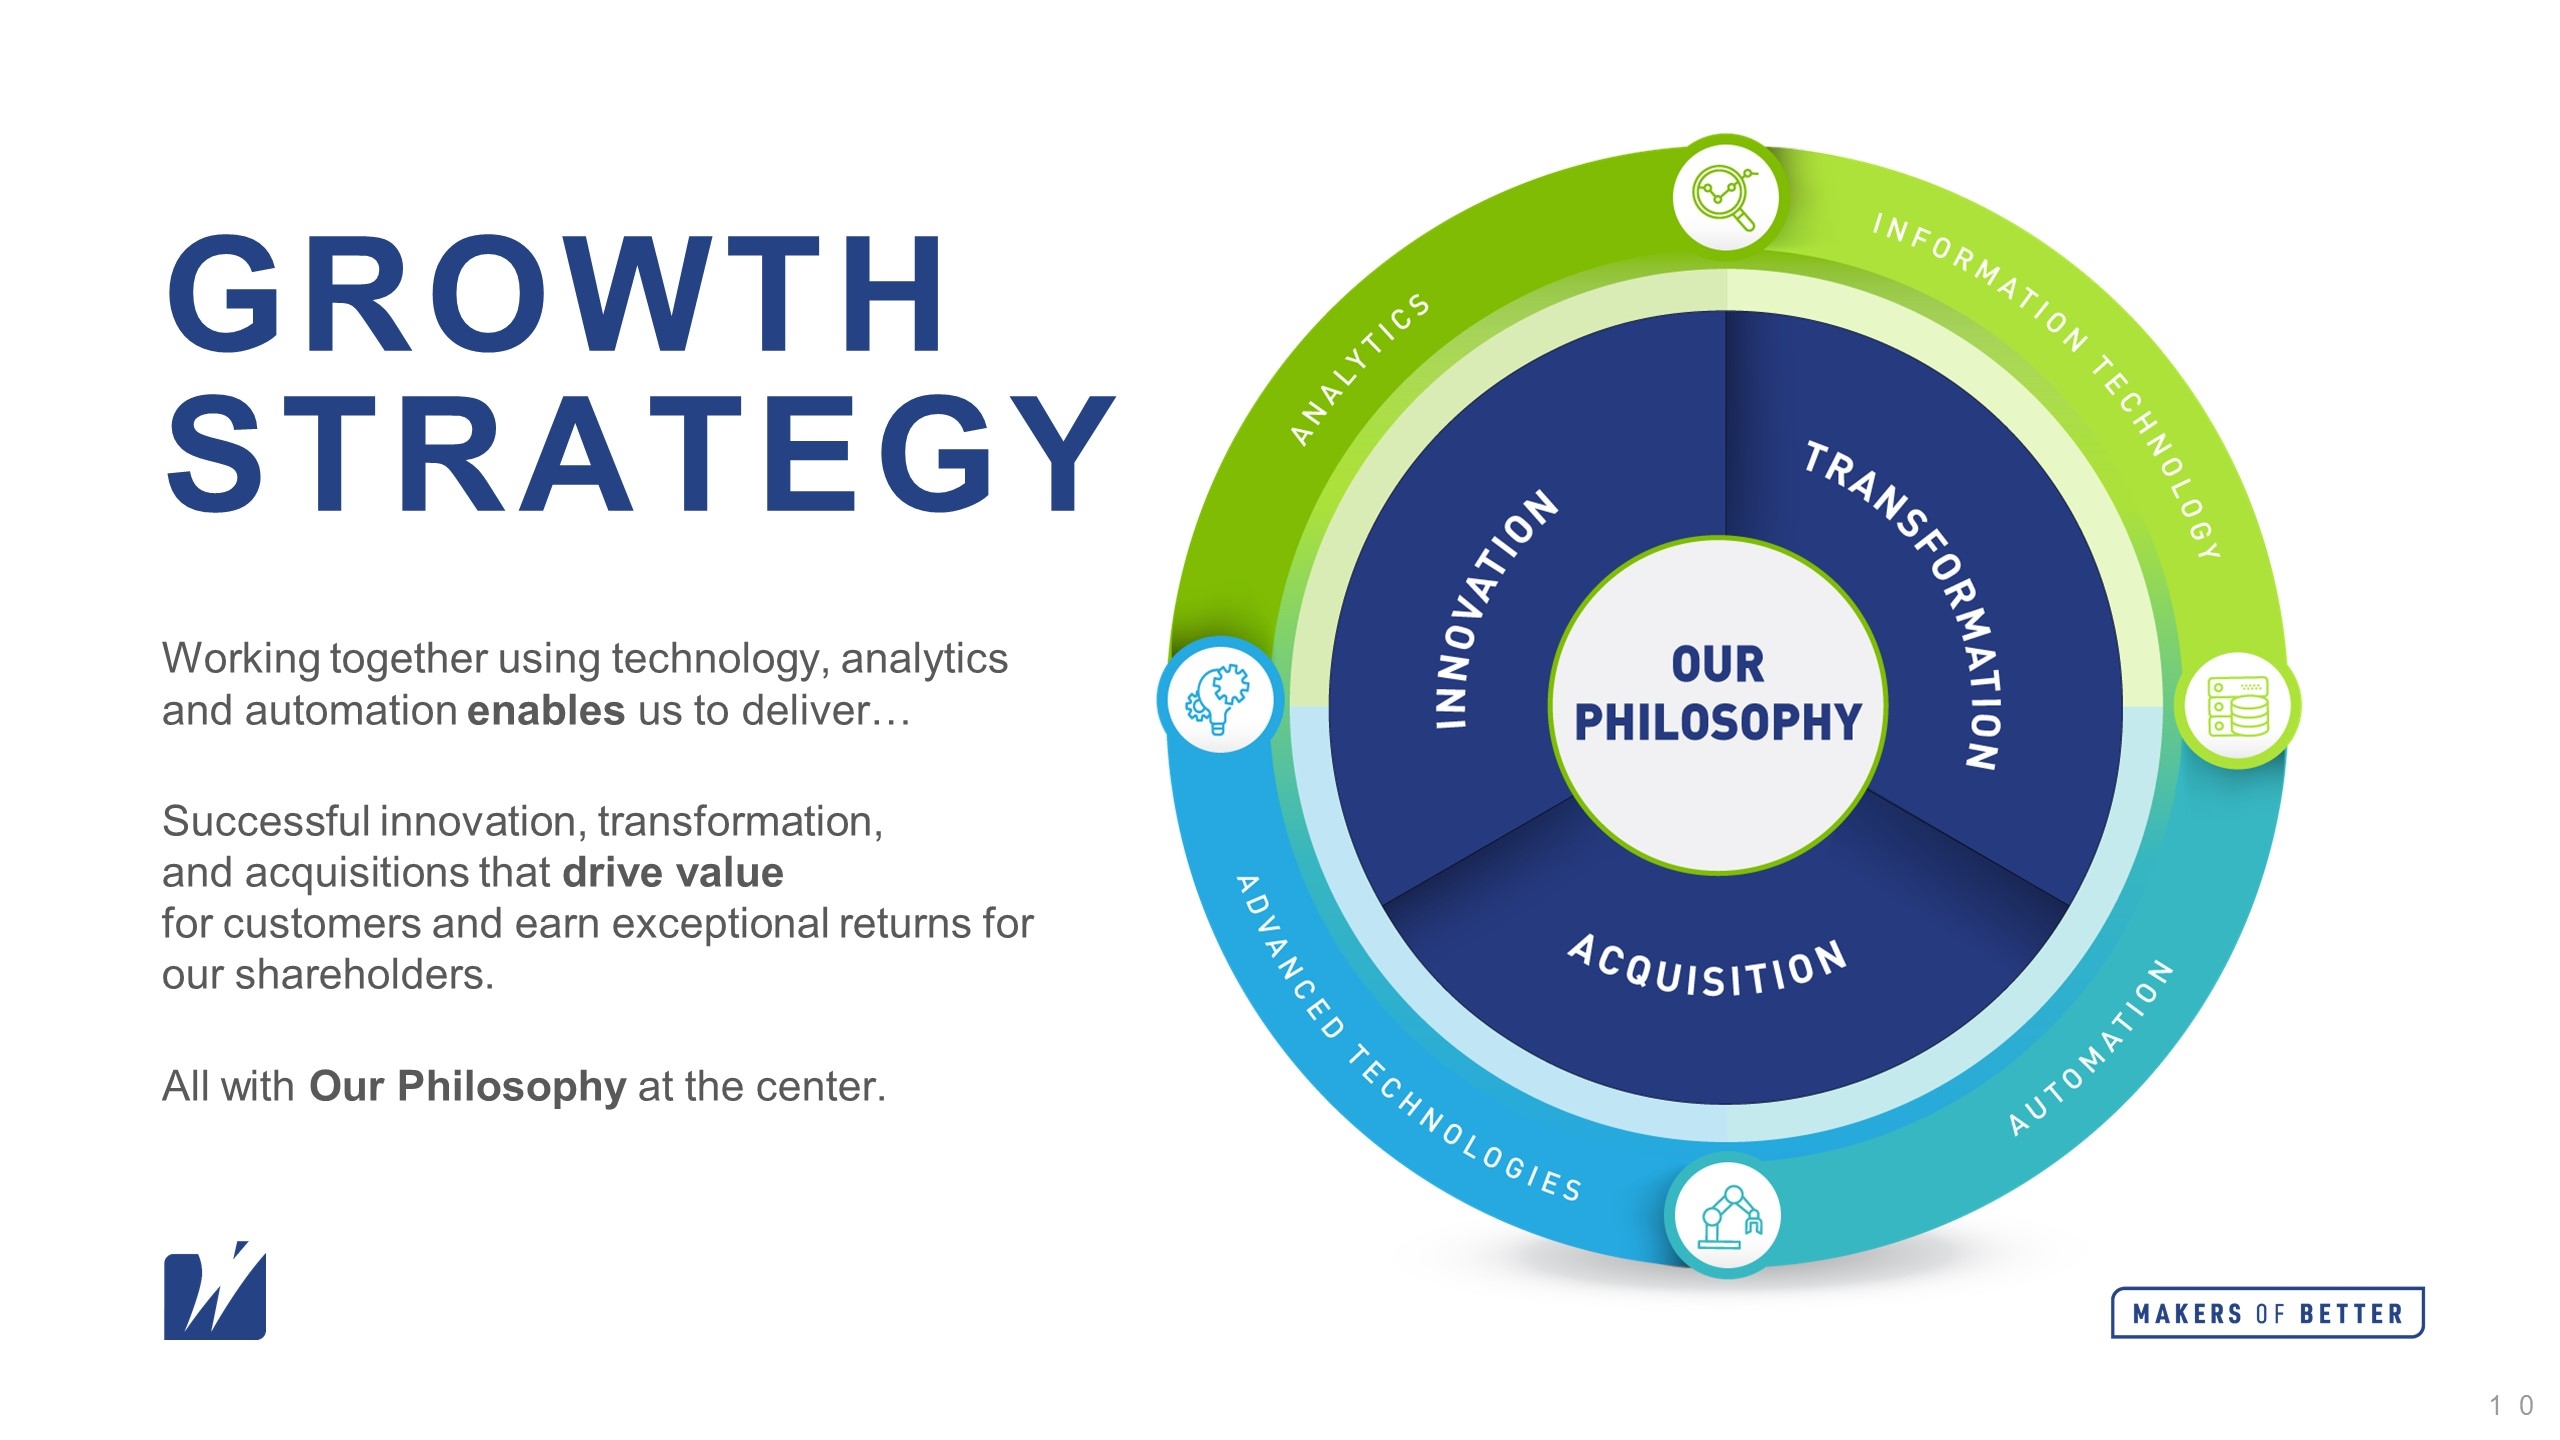
Growth Strategy Working together using technology, analytics and automation enables us to deliver… Successful innovation, transformation, and acquisitions that drive value for customers and earn exceptional returns for our shareholders. All with Our Philosophy at the center.

Value drivers in action: Transformation Focused data driven LEAN events to improve our businesses Example of Transformation project at core steel facility Issue: Sales & operations planning receiving inaccurate messages resulting in buying unneeded material and taking line time away from other orders What we did to drive improvements: Analyzed historical forecasts and shipment data Standardized processes for demand planning Controlled process for purchasing new material within facility Improved collaboration between commercial, supply chain, purchasing & operations functions What we achieved: 21 DOI Reduction in RM & WIP from Dec - Aug 96% On-time delivery (4% improvement) $5M Working capital freed up Productivity: tons/scheduled hour from 87 to 109 FG cycle time from 9 days to 6 days
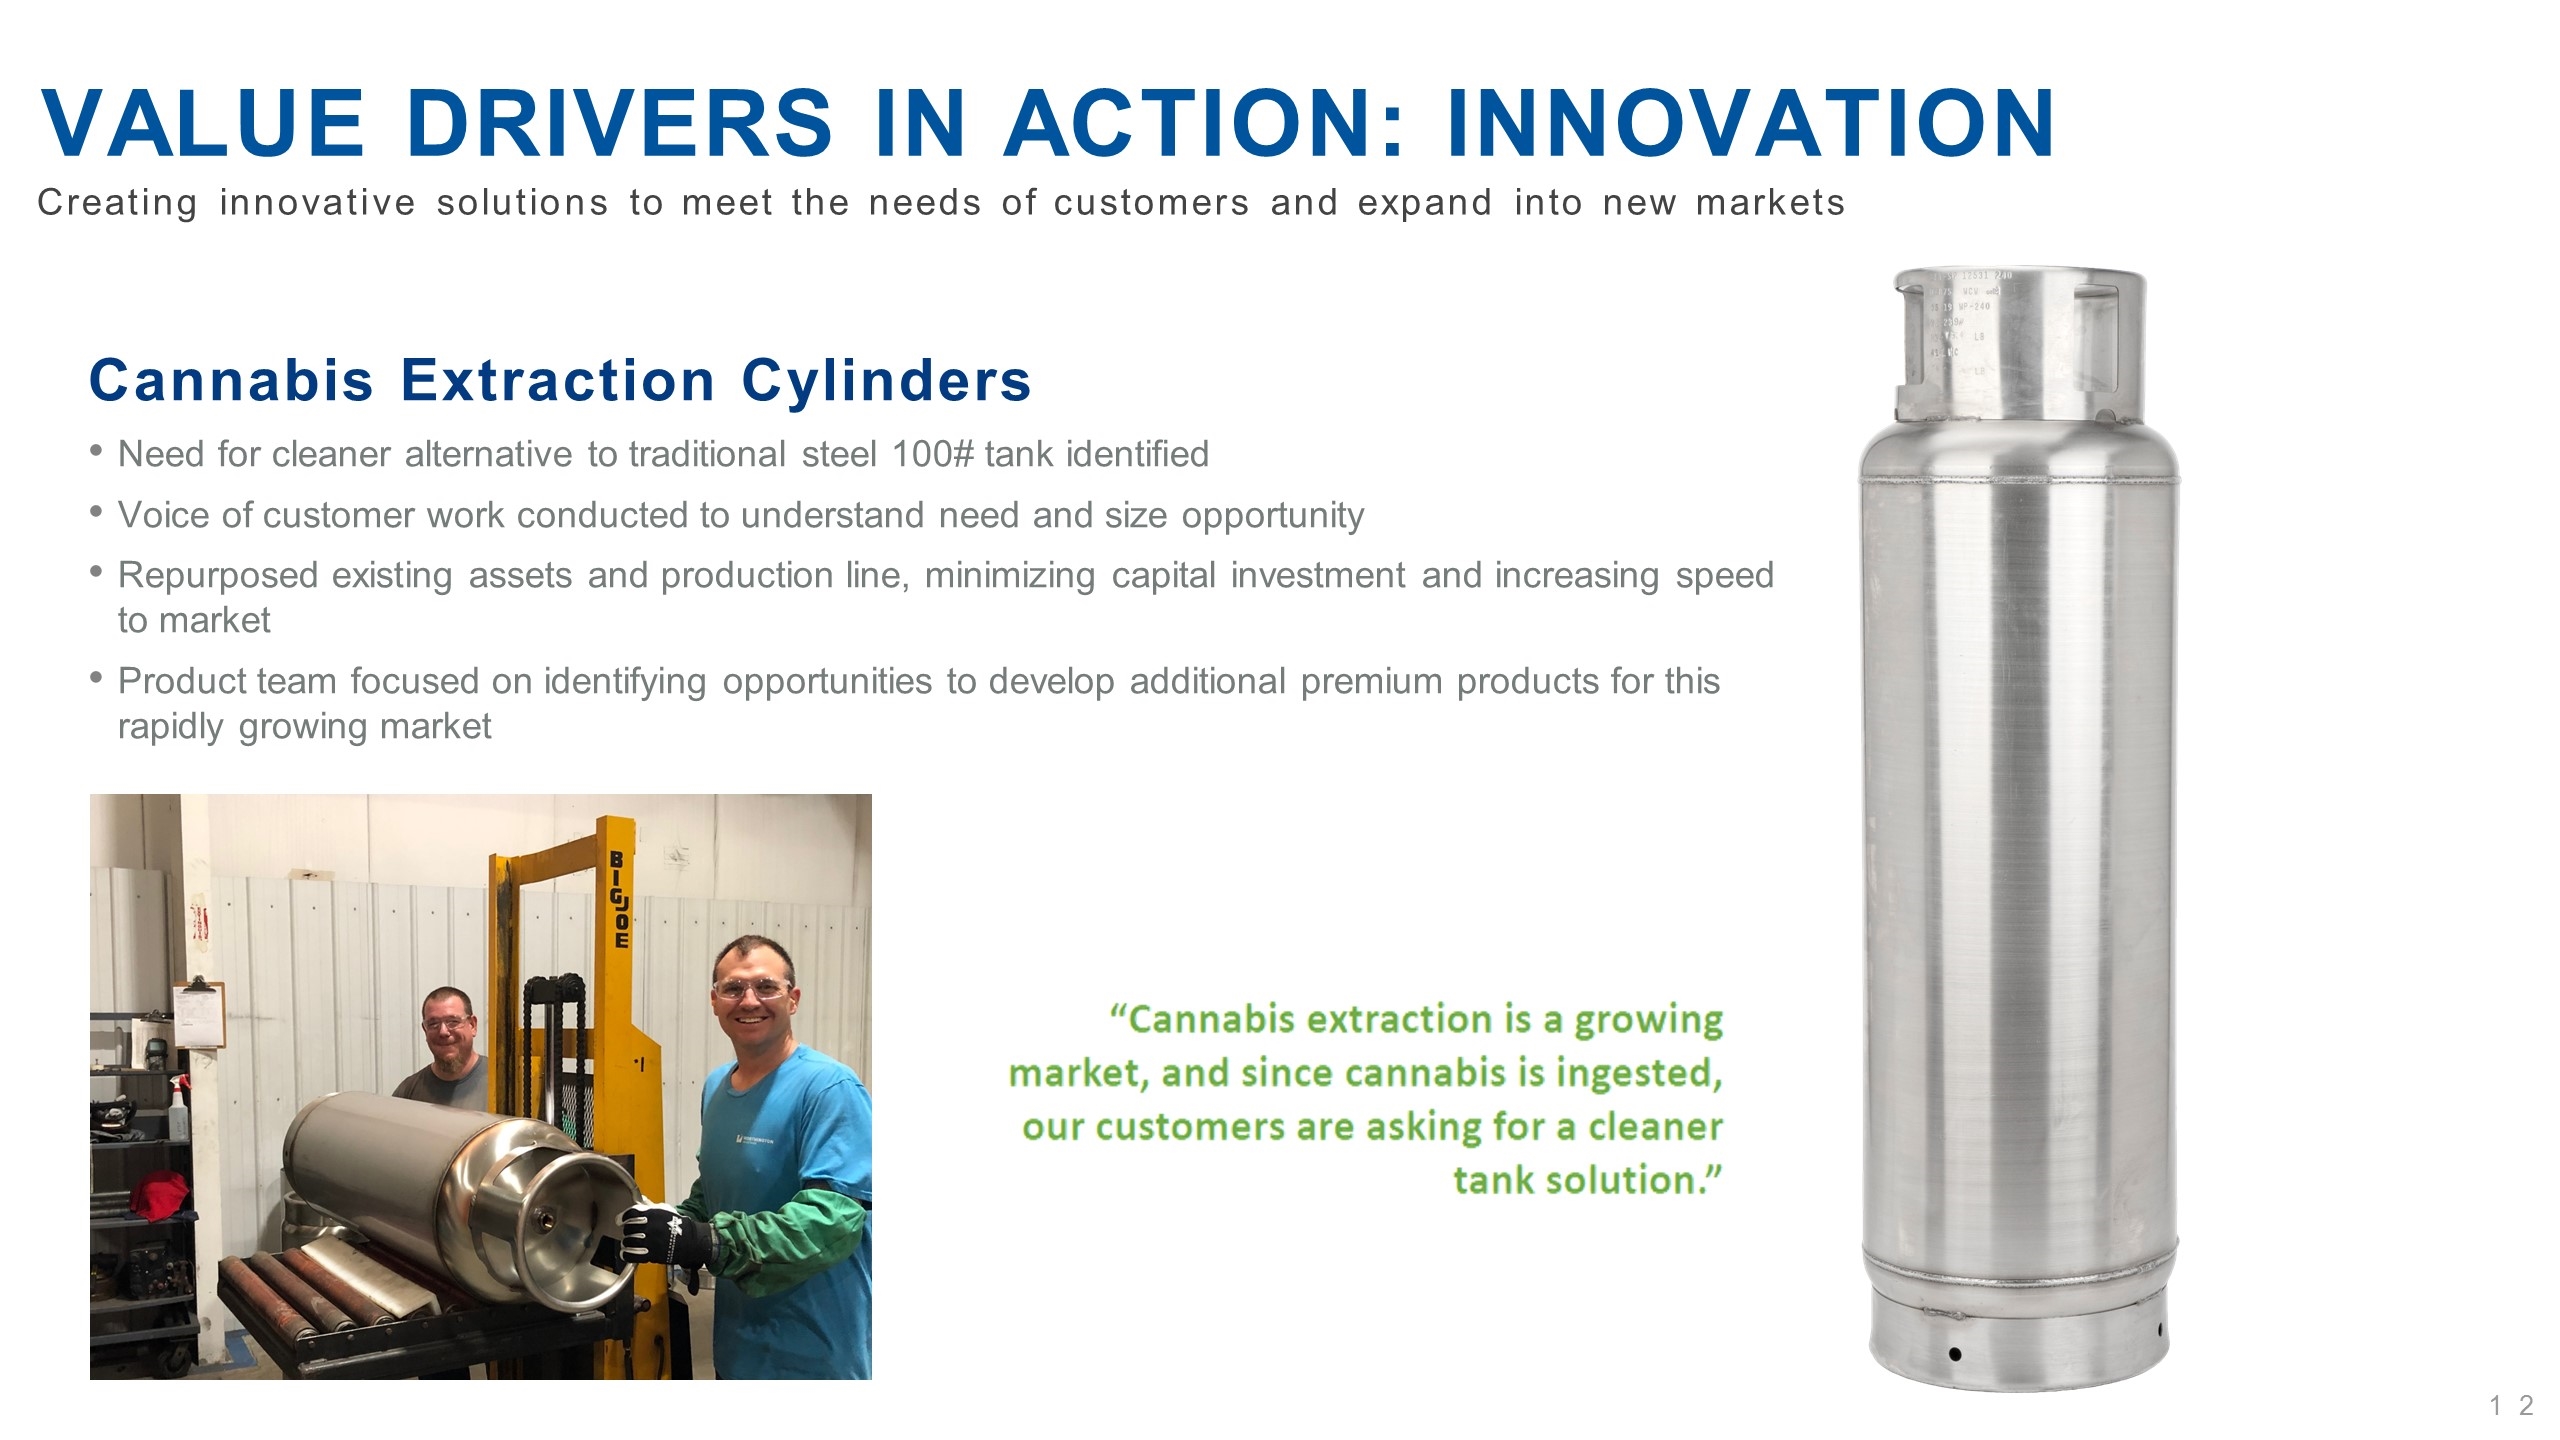
Creating innovative solutions to meet the needs of customers and expand into new markets Value drivers in action: innovation Cannabis Extraction Cylinders Need for cleaner alternative to traditional steel 100# tank identified Voice of customer work conducted to understand need and size opportunity Repurposed existing assets and production line, minimizing capital investment and increasing speed to market Product team focused on identifying opportunities to develop additional premium products for this rapidly growing market
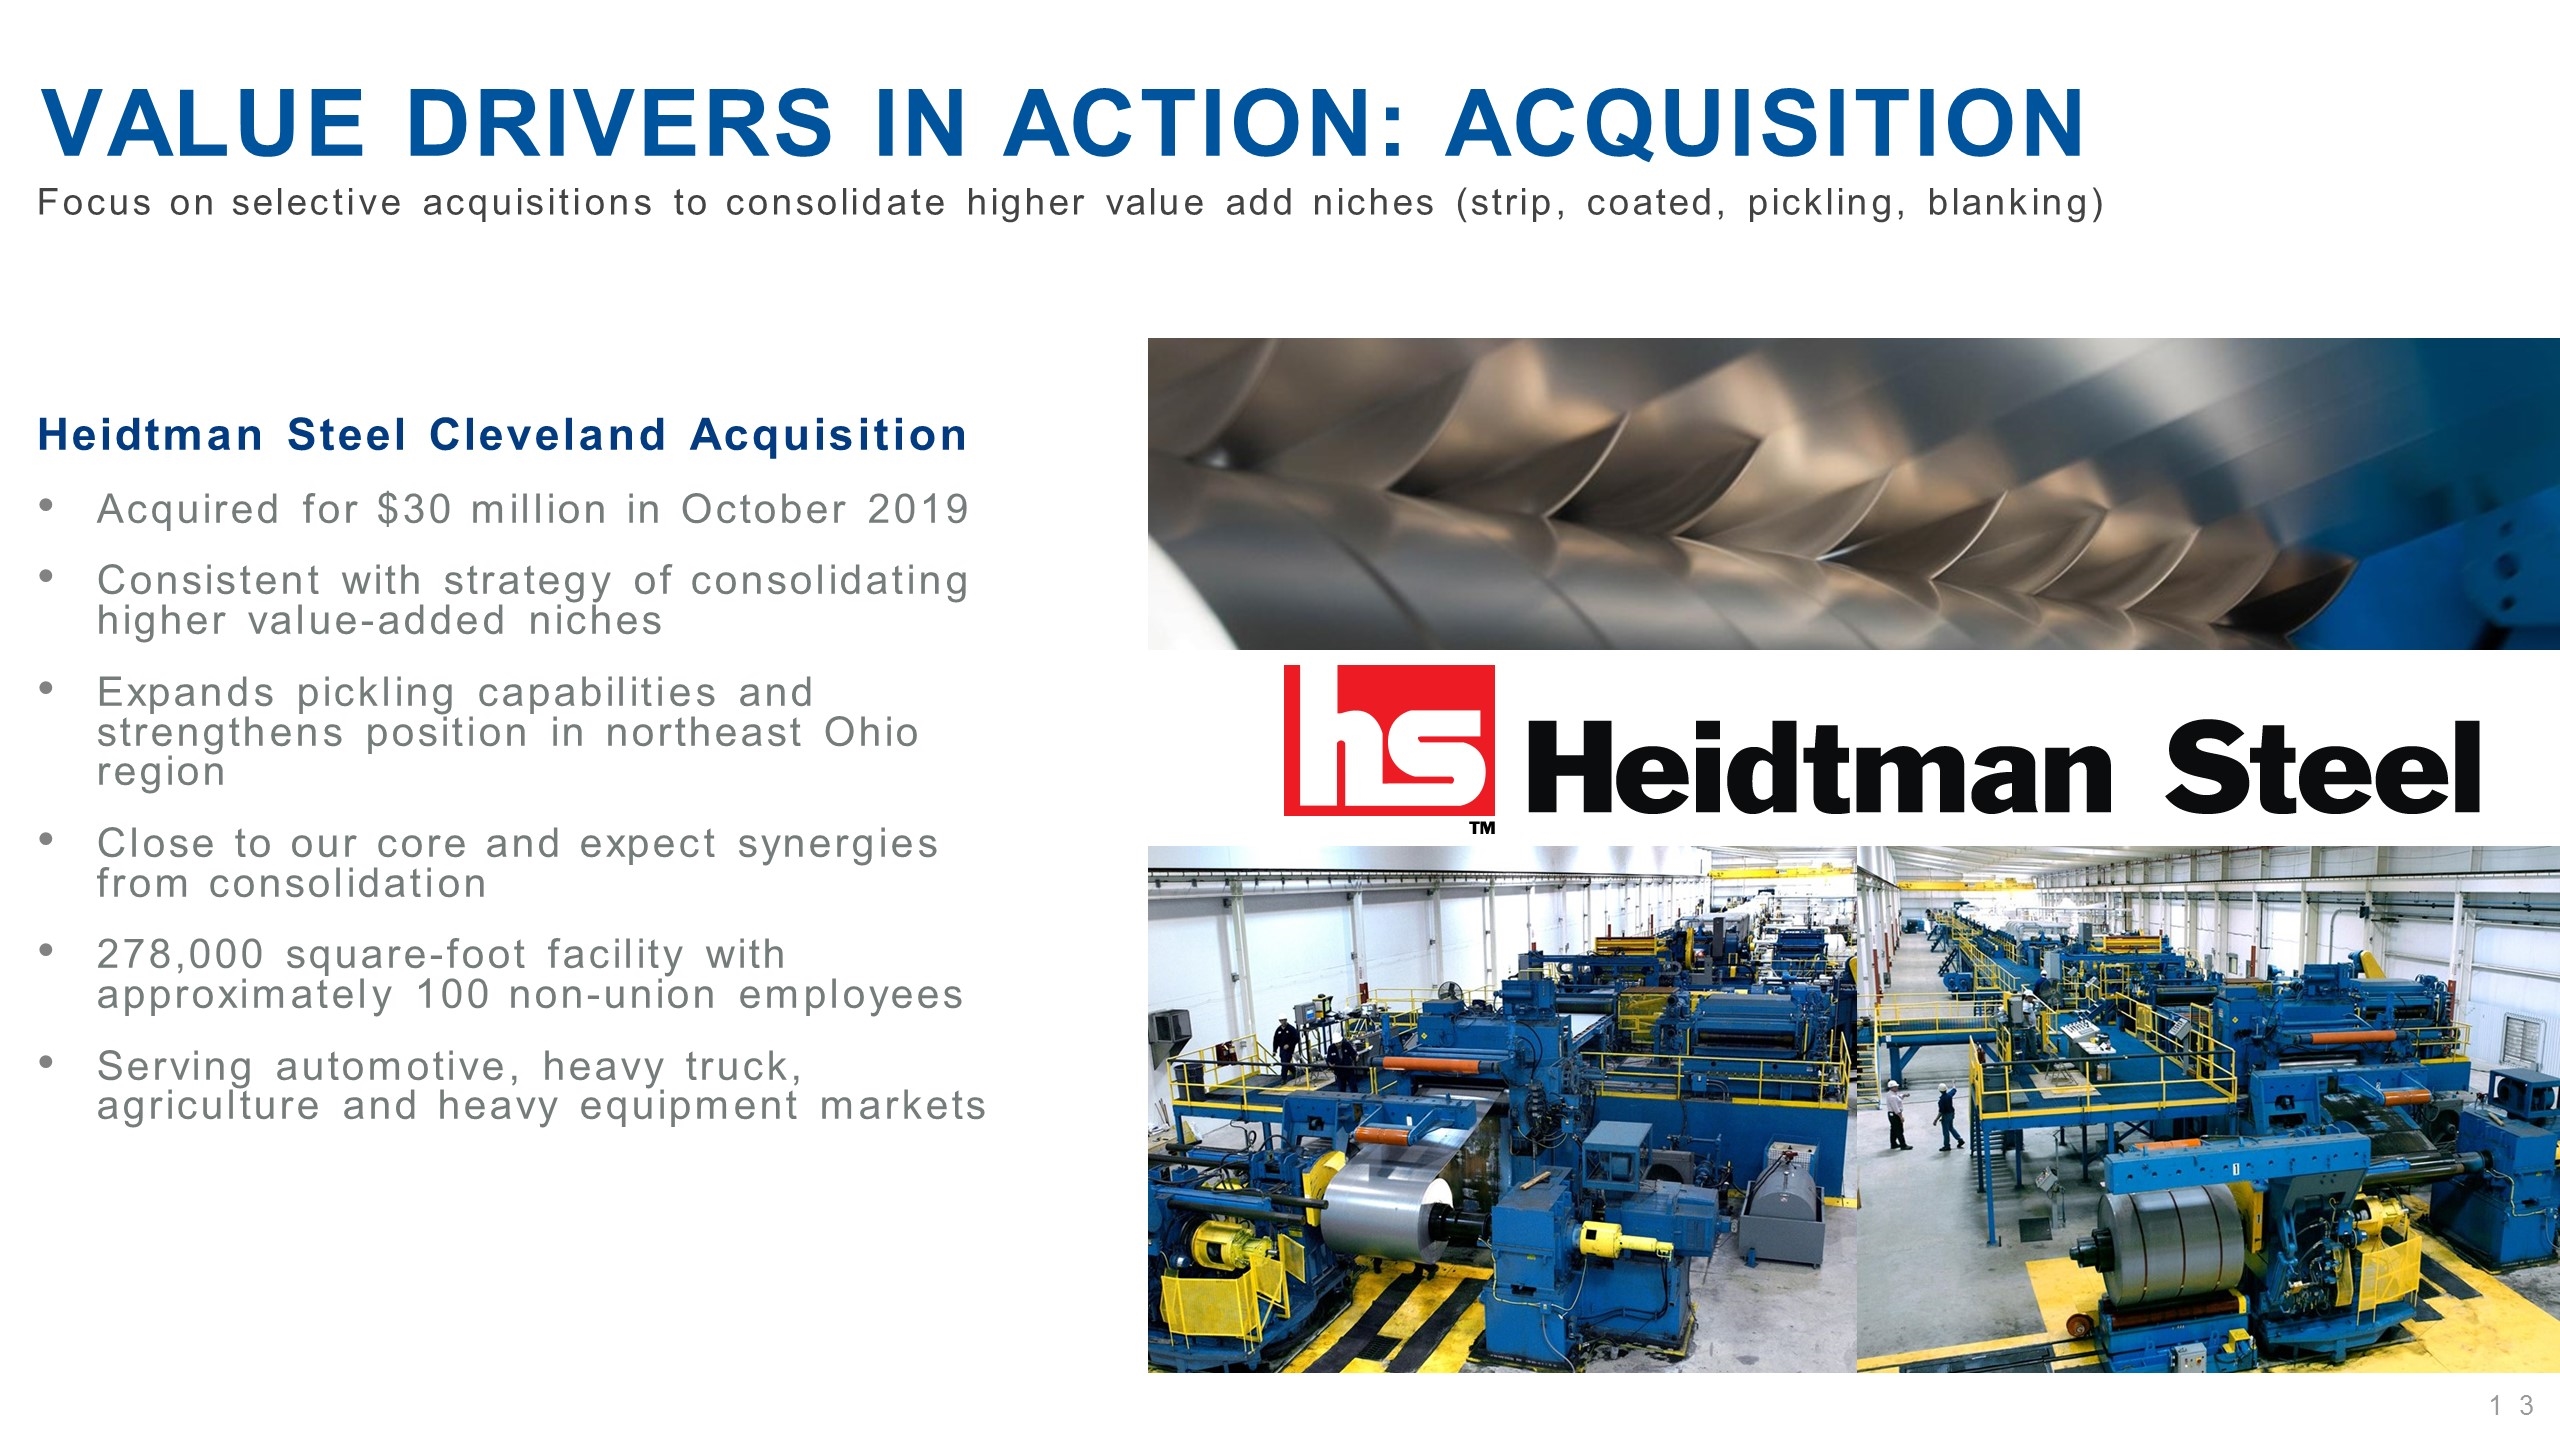
Heidtman Steel Cleveland Acquisition Acquired for $30 million in October 2019 Consistent with strategy of consolidating higher value-added niches Expands pickling capabilities and strengthens position in northeast Ohio region Close to our core and expect synergies from consolidation 278,000 square-foot facility with approximately 100 non-union employees Serving automotive, heavy truck, agriculture and heavy equipment markets Value drivers in action: ACQUISITION Focus on selective acquisitions to consolidate higher value add niches (strip, coated, pickling, blanking)
Financial goals Grow EBITDA & free cash flow every year 10%+ return on capital Raise margins Reduce earnings volatility Balanced capital allocation Modest leverage / ample liquidity (investment grade) Rigorous capital discipline
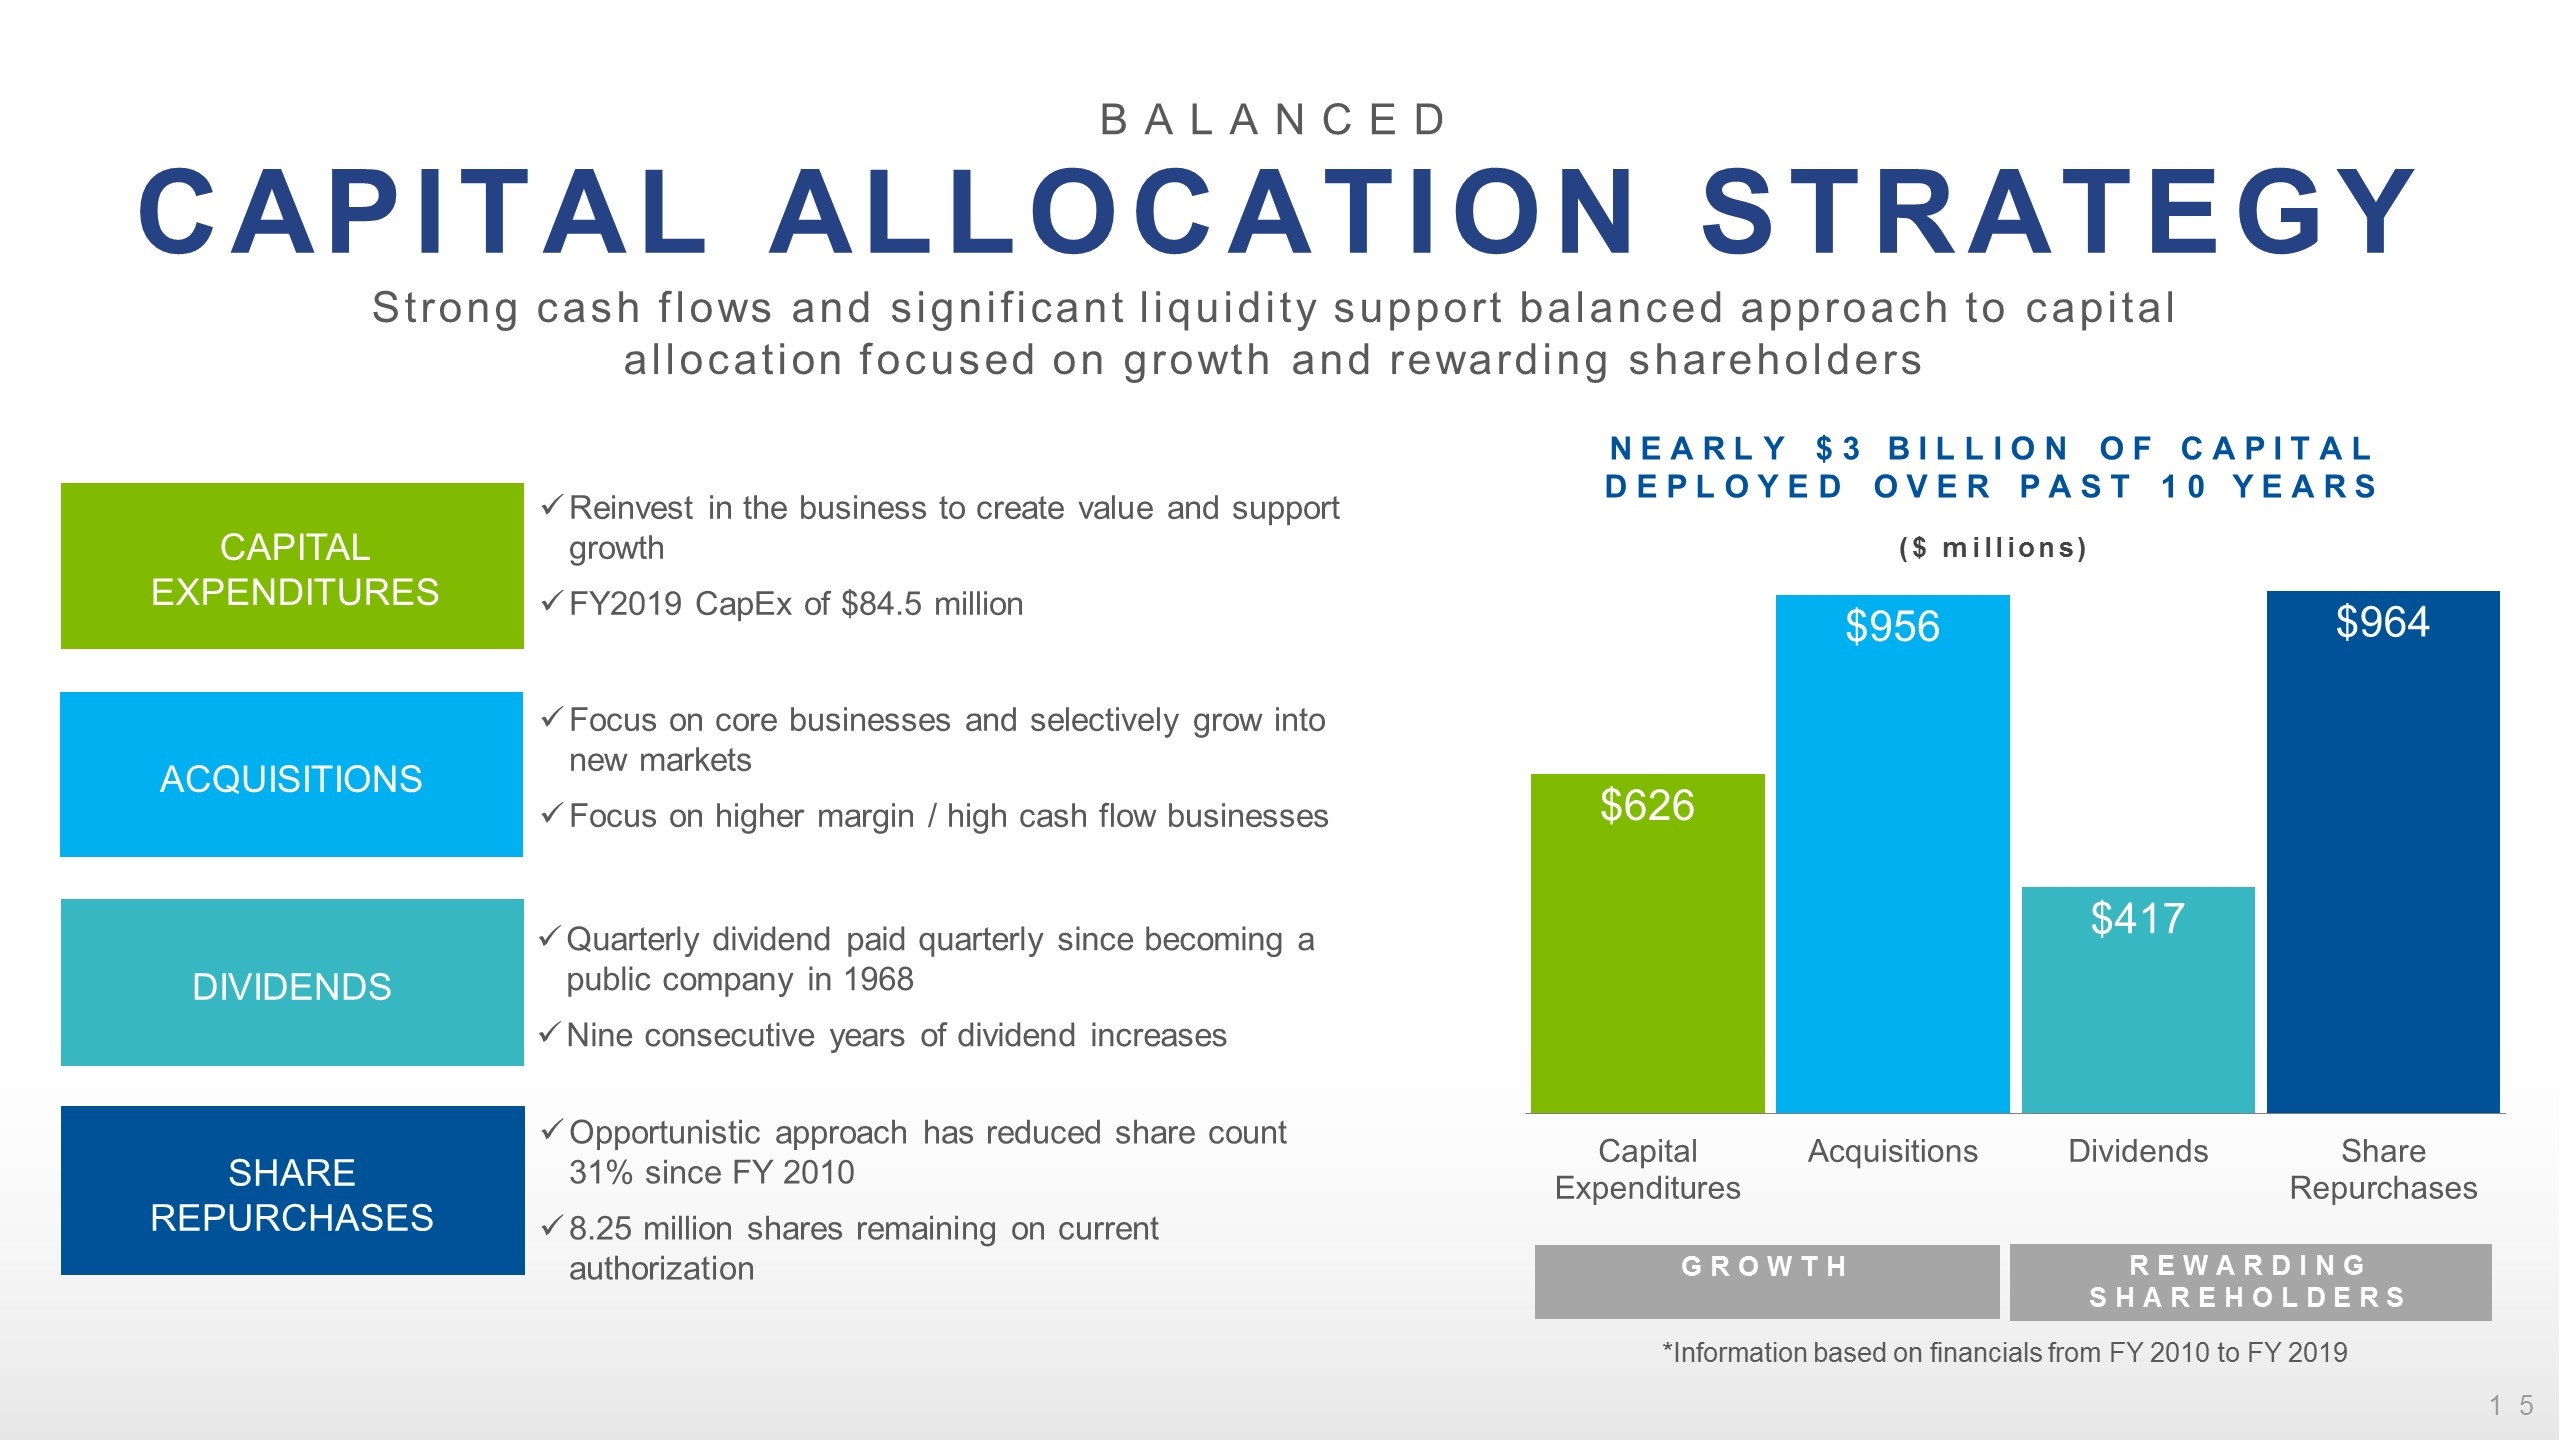
Balanced CAPITAL ALLOCATION STRATEGY Strong cash flows and significant liquidity support balanced approach to capital allocation focused on growth and rewarding shareholders Capital Expenditures Acquisitions Dividends Share Repurchases Reinvest in the business to create value and support growth FY2019 CapEx of $84.5 million Focus on core businesses and selectively grow into new markets Focus on higher margin / high cash flow businesses Quarterly dividend paid quarterly since becoming a public company in 1968 Nine consecutive years of dividend increases Opportunistic approach has reduced share count 31% since FY 2010 8.25 million shares remaining on current authorization Nearly $3 billion of capital deployed over past 10 years ($ millions) Growth Rewarding Shareholders *Information based on financials from FY 2010 to FY 2019
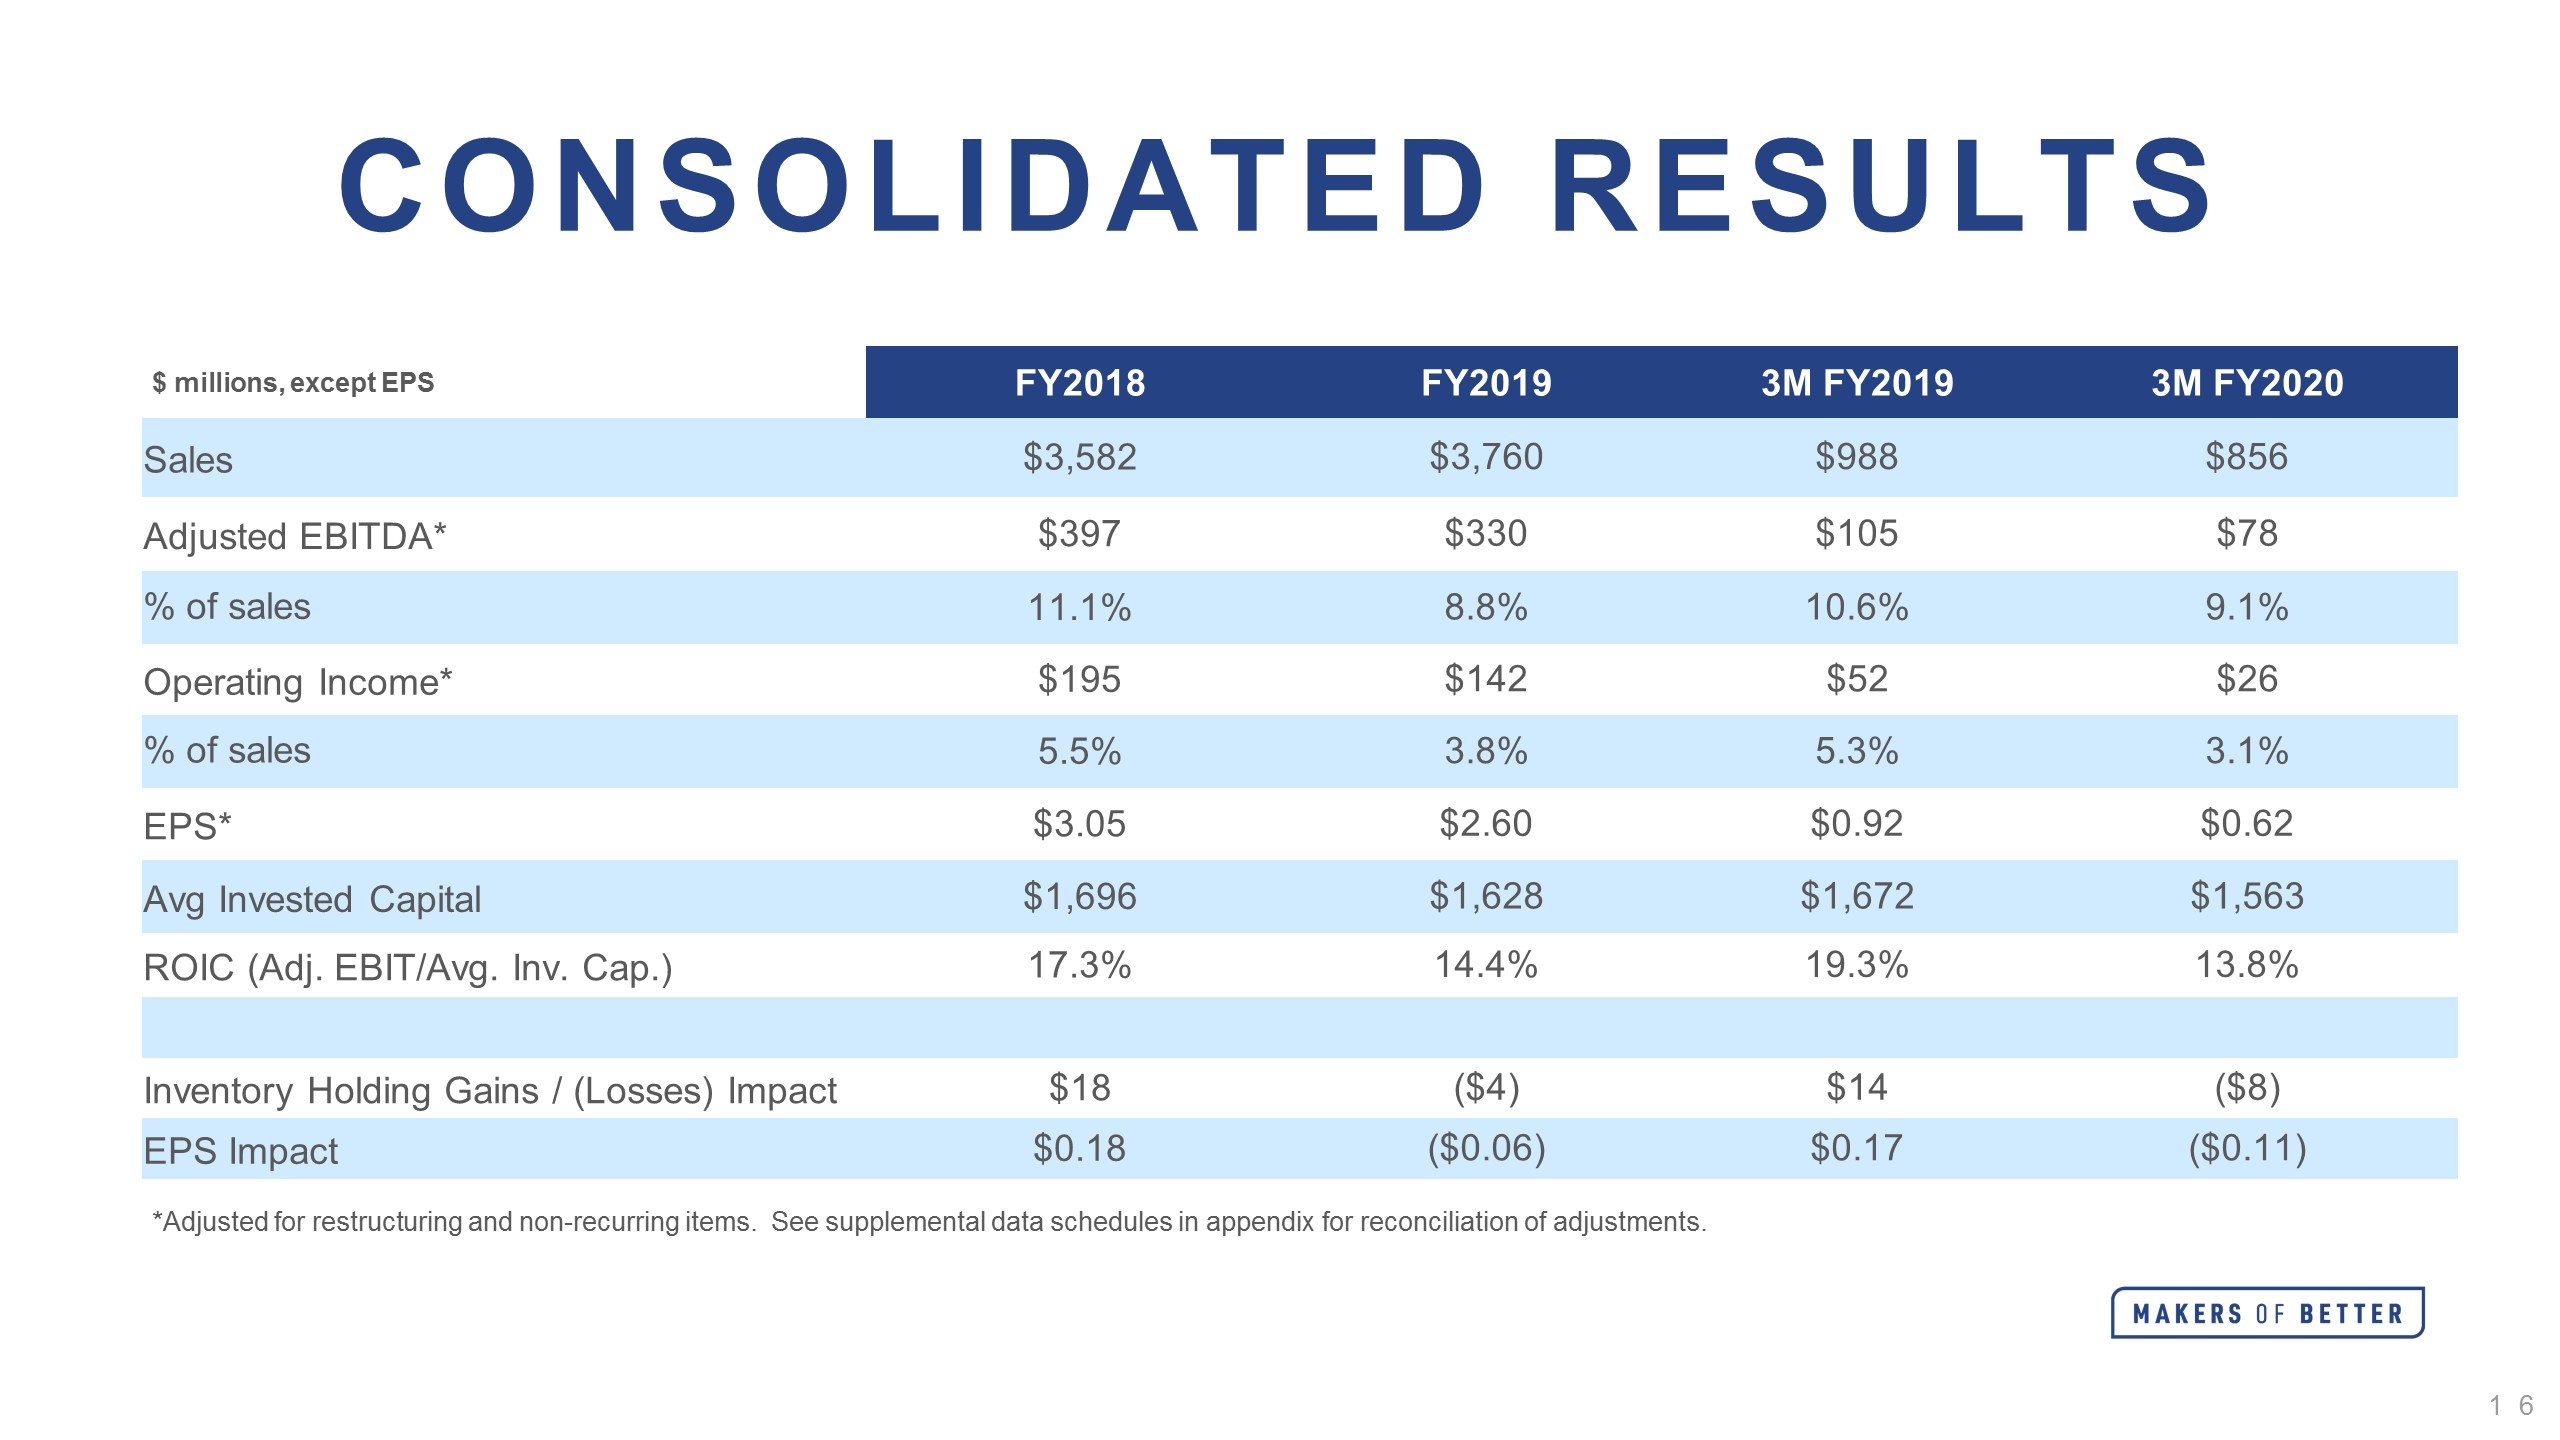
Consolidated Results *Adjusted for restructuring and non-recurring items. See supplemental data schedules in appendix for reconciliation of adjustments. $ millions, except EPS FY2018 FY2019 3M FY2019 3M FY2020 Sales $3,582 $3,760 $988 $856 Adjusted EBITDA* $397 $330 $105 $78 % of sales 11.1% 8.8% 10.6% 9.1% Operating Income* $195 $142 $52 $26 % of sales 5.5% 3.8% 5.3% 3.1% EPS* $3.05 $2.60 $0.92 $0.62 Avg Invested Capital $1,696 $1,628 $1,672 $1,563 ROIC (Adj. EBIT/Avg. Inv. Cap.) 17.3% 14.4% 19.3% 13.8% Inventory Holding Gains / (Losses) Impact $18 ($4) $14 ($8) EPS Impact $0.18 ($0.06) $0.17 ($0.11)
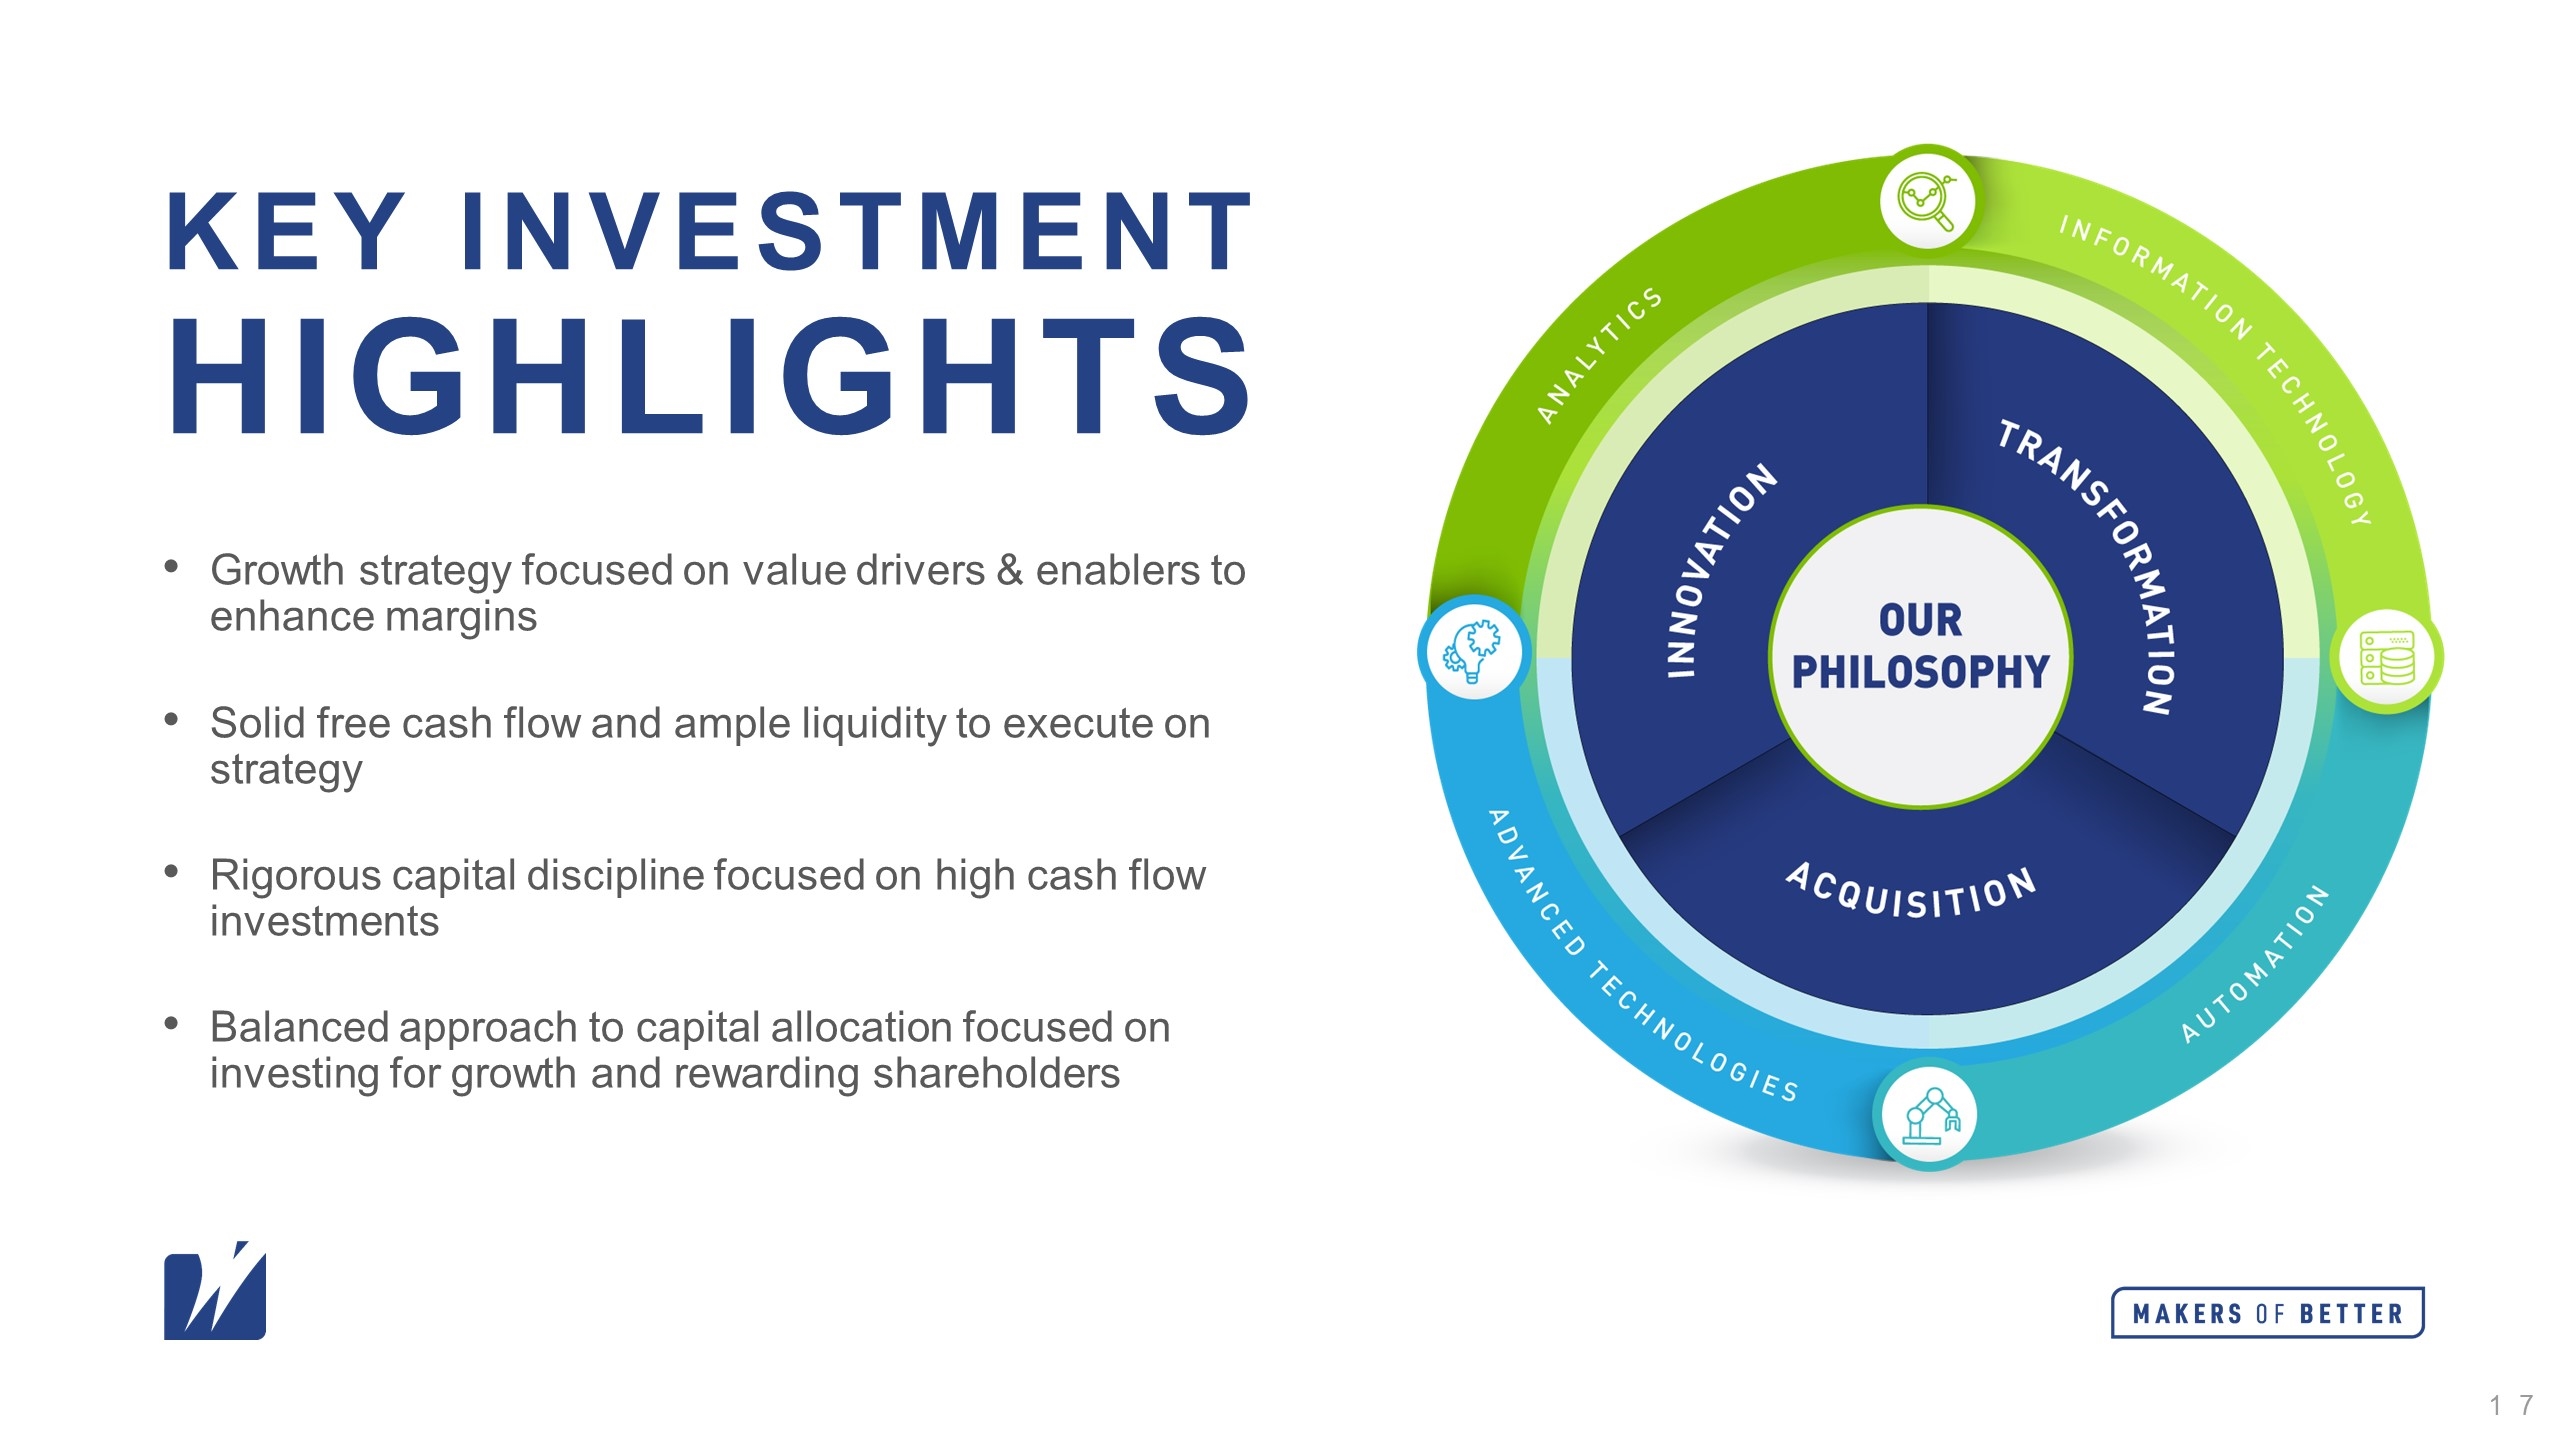
Key investment highlights Growth strategy focused on value drivers & enablers to enhance margins Solid free cash flow and ample liquidity to execute on strategy Rigorous capital discipline focused on high cash flow investments Balanced approach to capital allocation focused on investing for growth and rewarding shareholders
SUPPLEMENTAL DATA
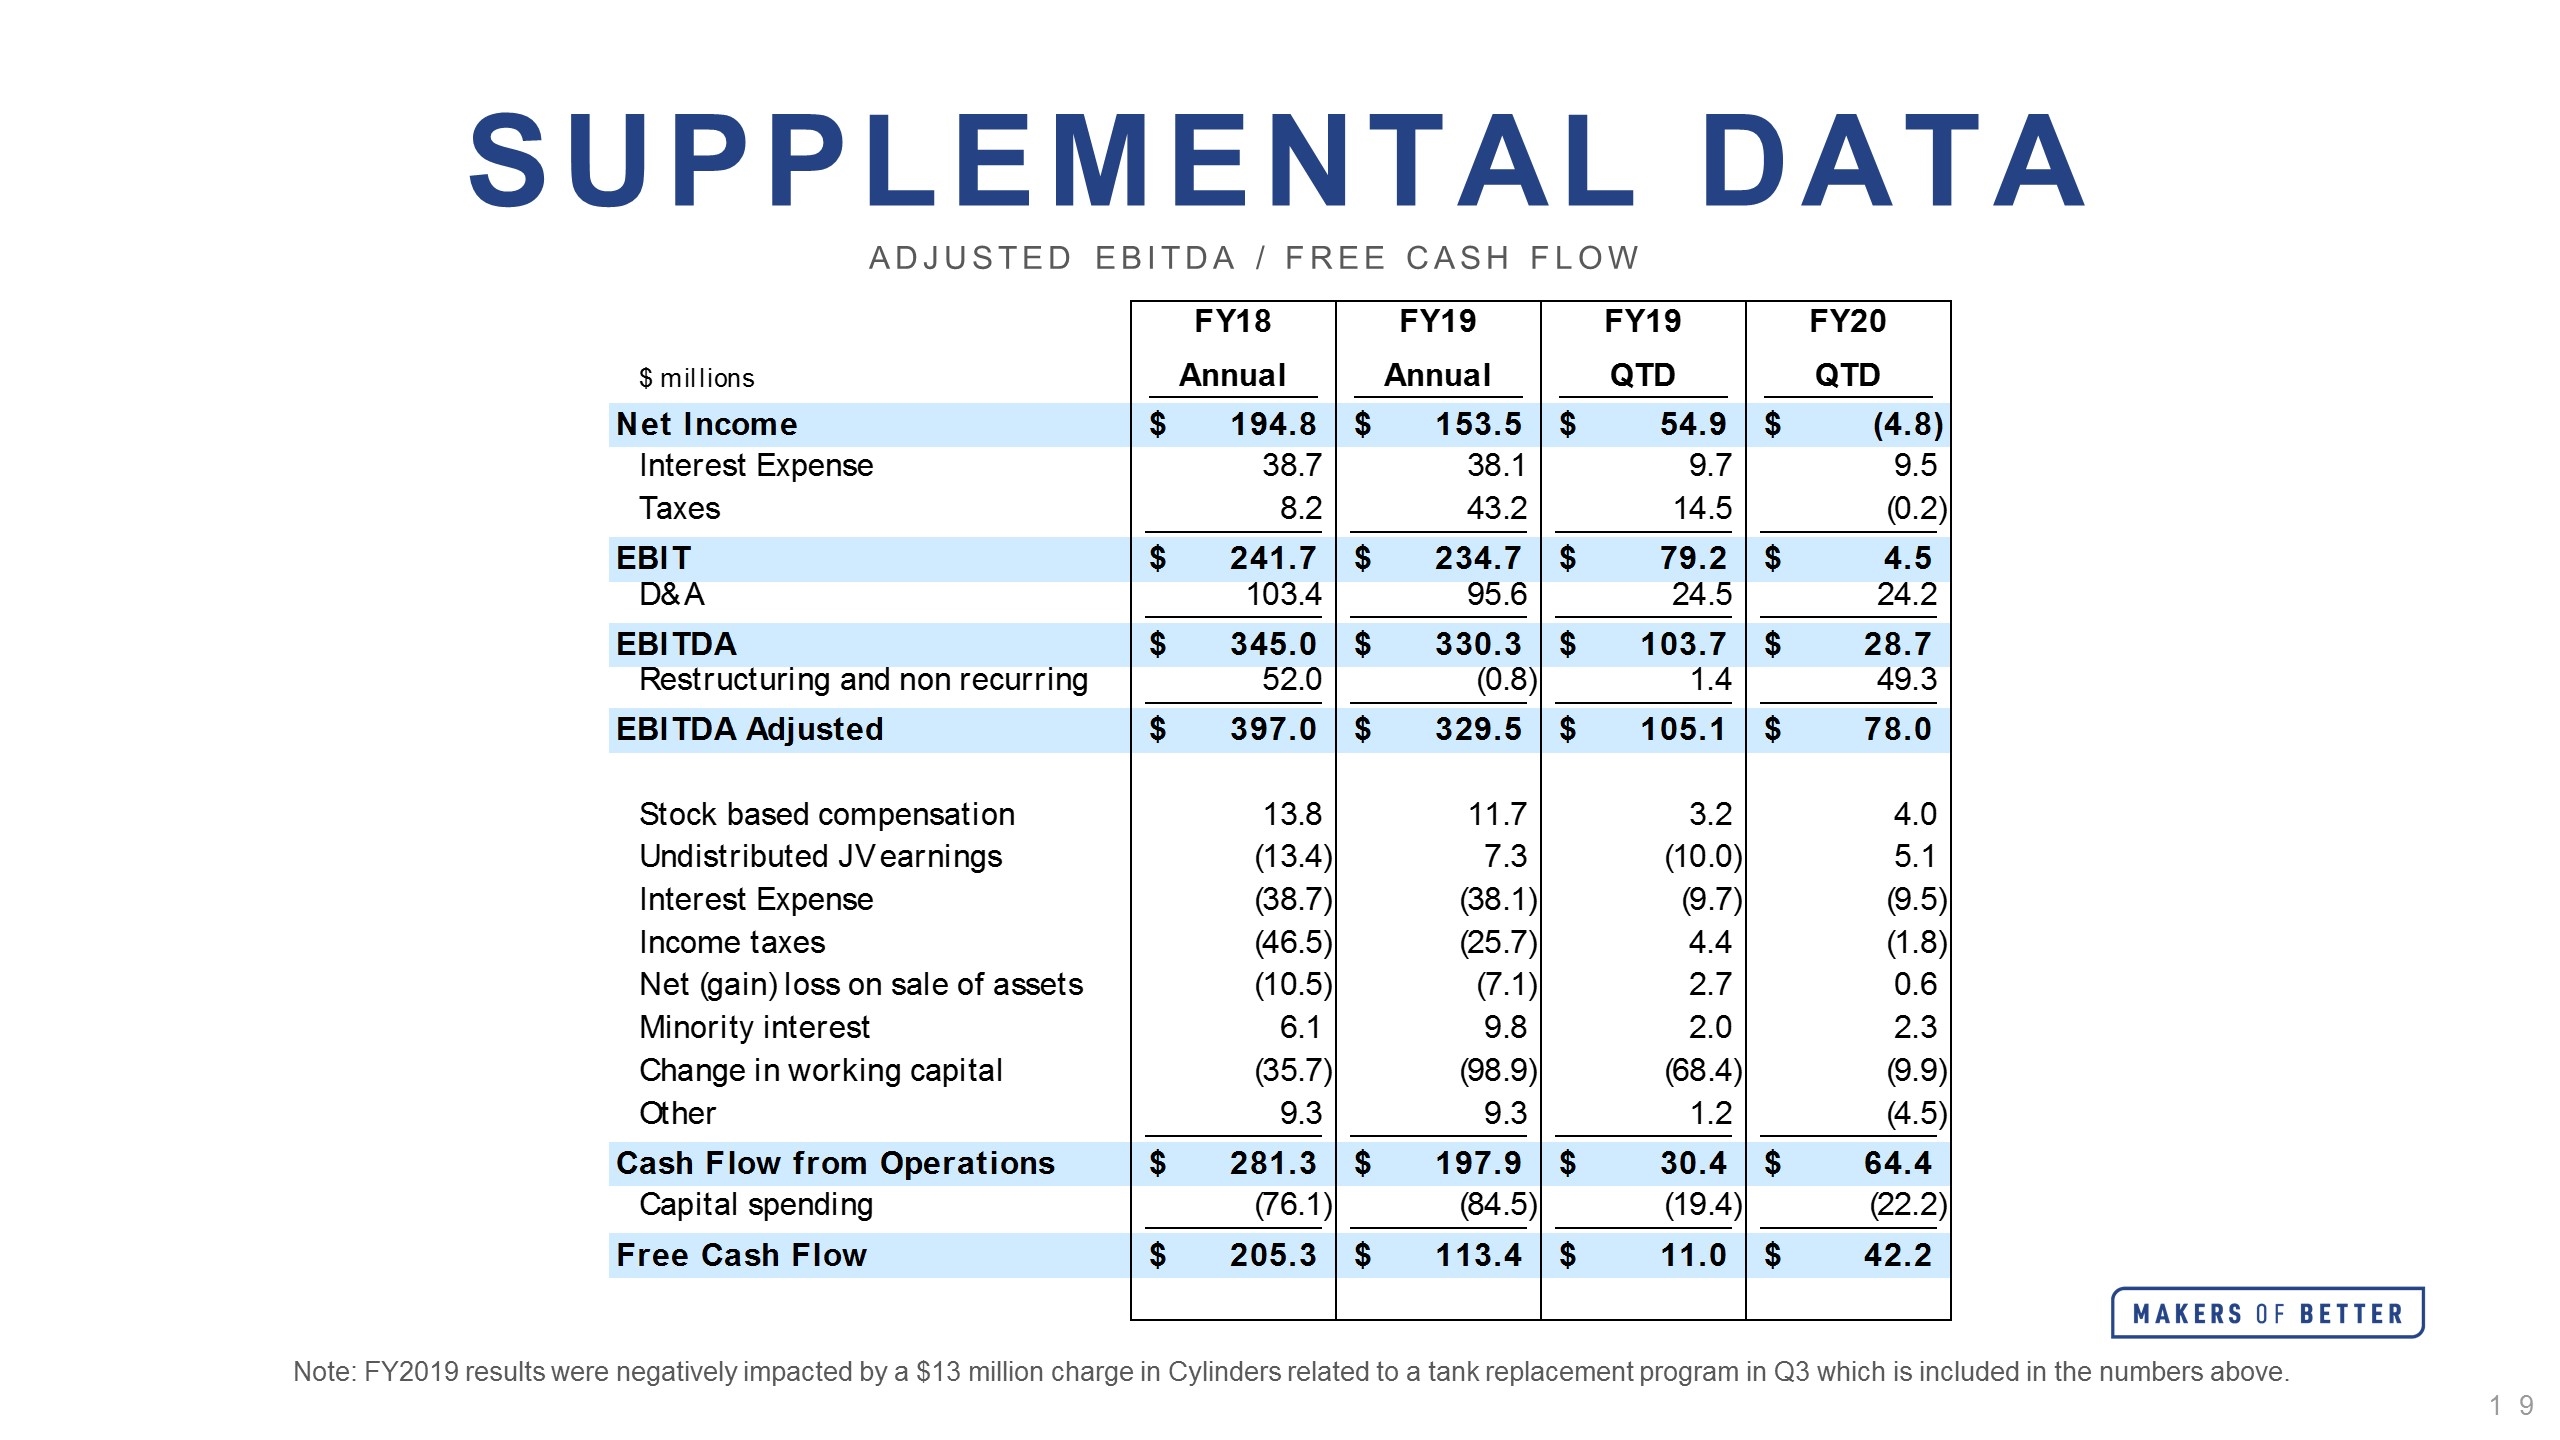
Supplemental Data Adjusted EBITDA / Free Cash Flow Note: FY2019 results were negatively impacted by a $13 million charge in Cylinders related to a tank replacement program in Q3 which is included in the numbers above. Cash Flow ($ in Millions) FY18 FY19 FY19 FY20 $ millions Annual Annual QTD QTD Net Income $,194,794,485.7699999 $,153,454,753.38600001 $54,941,628.5 $-4,775,778.7510000002 Interest Expense 38,675,487.564999998 38,062,649.381999999 9,727,911.5219999999 9,479,593.6459999997 Taxes 8,219,684.9929999998 43,183,492.6999999 14,498,314.153000001 -,184,598.38 EBIT $,241,689,657.63499999 $,234,700,894.77500001 $79,167,854.174999997 $4,519,216.5149999997 D&A ,103,358,983.388 95,602,469.376000002 24,492,876.635000002 24,177,186.620999999 EBITDA $,345,048,641.23 $,330,303,364.15100002 $,103,660,730.81 $28,696,403.136 Restructuring and non recurring 51,955,907.828000002 -,786,021.45099999988 1,445,254.7709999999 49,338,804.509999998 EBITDA Adjusted $,397,004,548.861 $,329,517,342.69999999 $,105,105,985.581 $78,035,207.644999996 Stock based compensation 13,757,523 11,732,828.300000001 3,155,656 3,995,355.22 Undistributed JV earnings ,-13,352,140.91 7,346,919.3200000003 ,-10,018,552.231000001 5,082,233.91 Interest Expense ,-38,675,487.564999998 ,-38,062,649.381999999 -9,727,911.5219999999 -9,479,593.6459999997 Income taxes ,-46,456,631.993000001 ,-25,748,754.6999999 4,435,736.8469999991 -1,761,322.56 Net (gain) loss on sale of assets ,-10,522,486.506999999 -7,058,865.429999996 2,714,823.79999999 ,618,295.80000000005 Minority interest 6,056,013.8609999996 9,818,024.9059999995 2,016,294.787 2,320,407.9750000001 Change in working capital ,-35,729,552.413000017 ,-98,948,757.792999983 ,-68,393,999.307999998 -9,906,255.879999883 Other 9,262,759.2990000024 9,262,757.2540000007 1,156,790.605 -4,535,356.1969999988 Cash Flow from Operations $,281,344,546.45200002 $,197,858,846.255 $30,444,823.767000001 $64,368,973.60000002 Capital spending ,-76,087,910.944999993 ,-84,498,302.790999994 ,-19,434,297.772999998 ,-22,174,061.269000001 Free Cash Flow $,205,256,635.50700003 $,113,360,543.464 $11,010,525.994000003 $42,194,911.791000001 Check- EBITDA Adjusted 9.9999904632568359E-3 0 0 -1.0000020265579224E-3 Check- Free Cash Flow 0 0 0 1.0000020265579224E-3
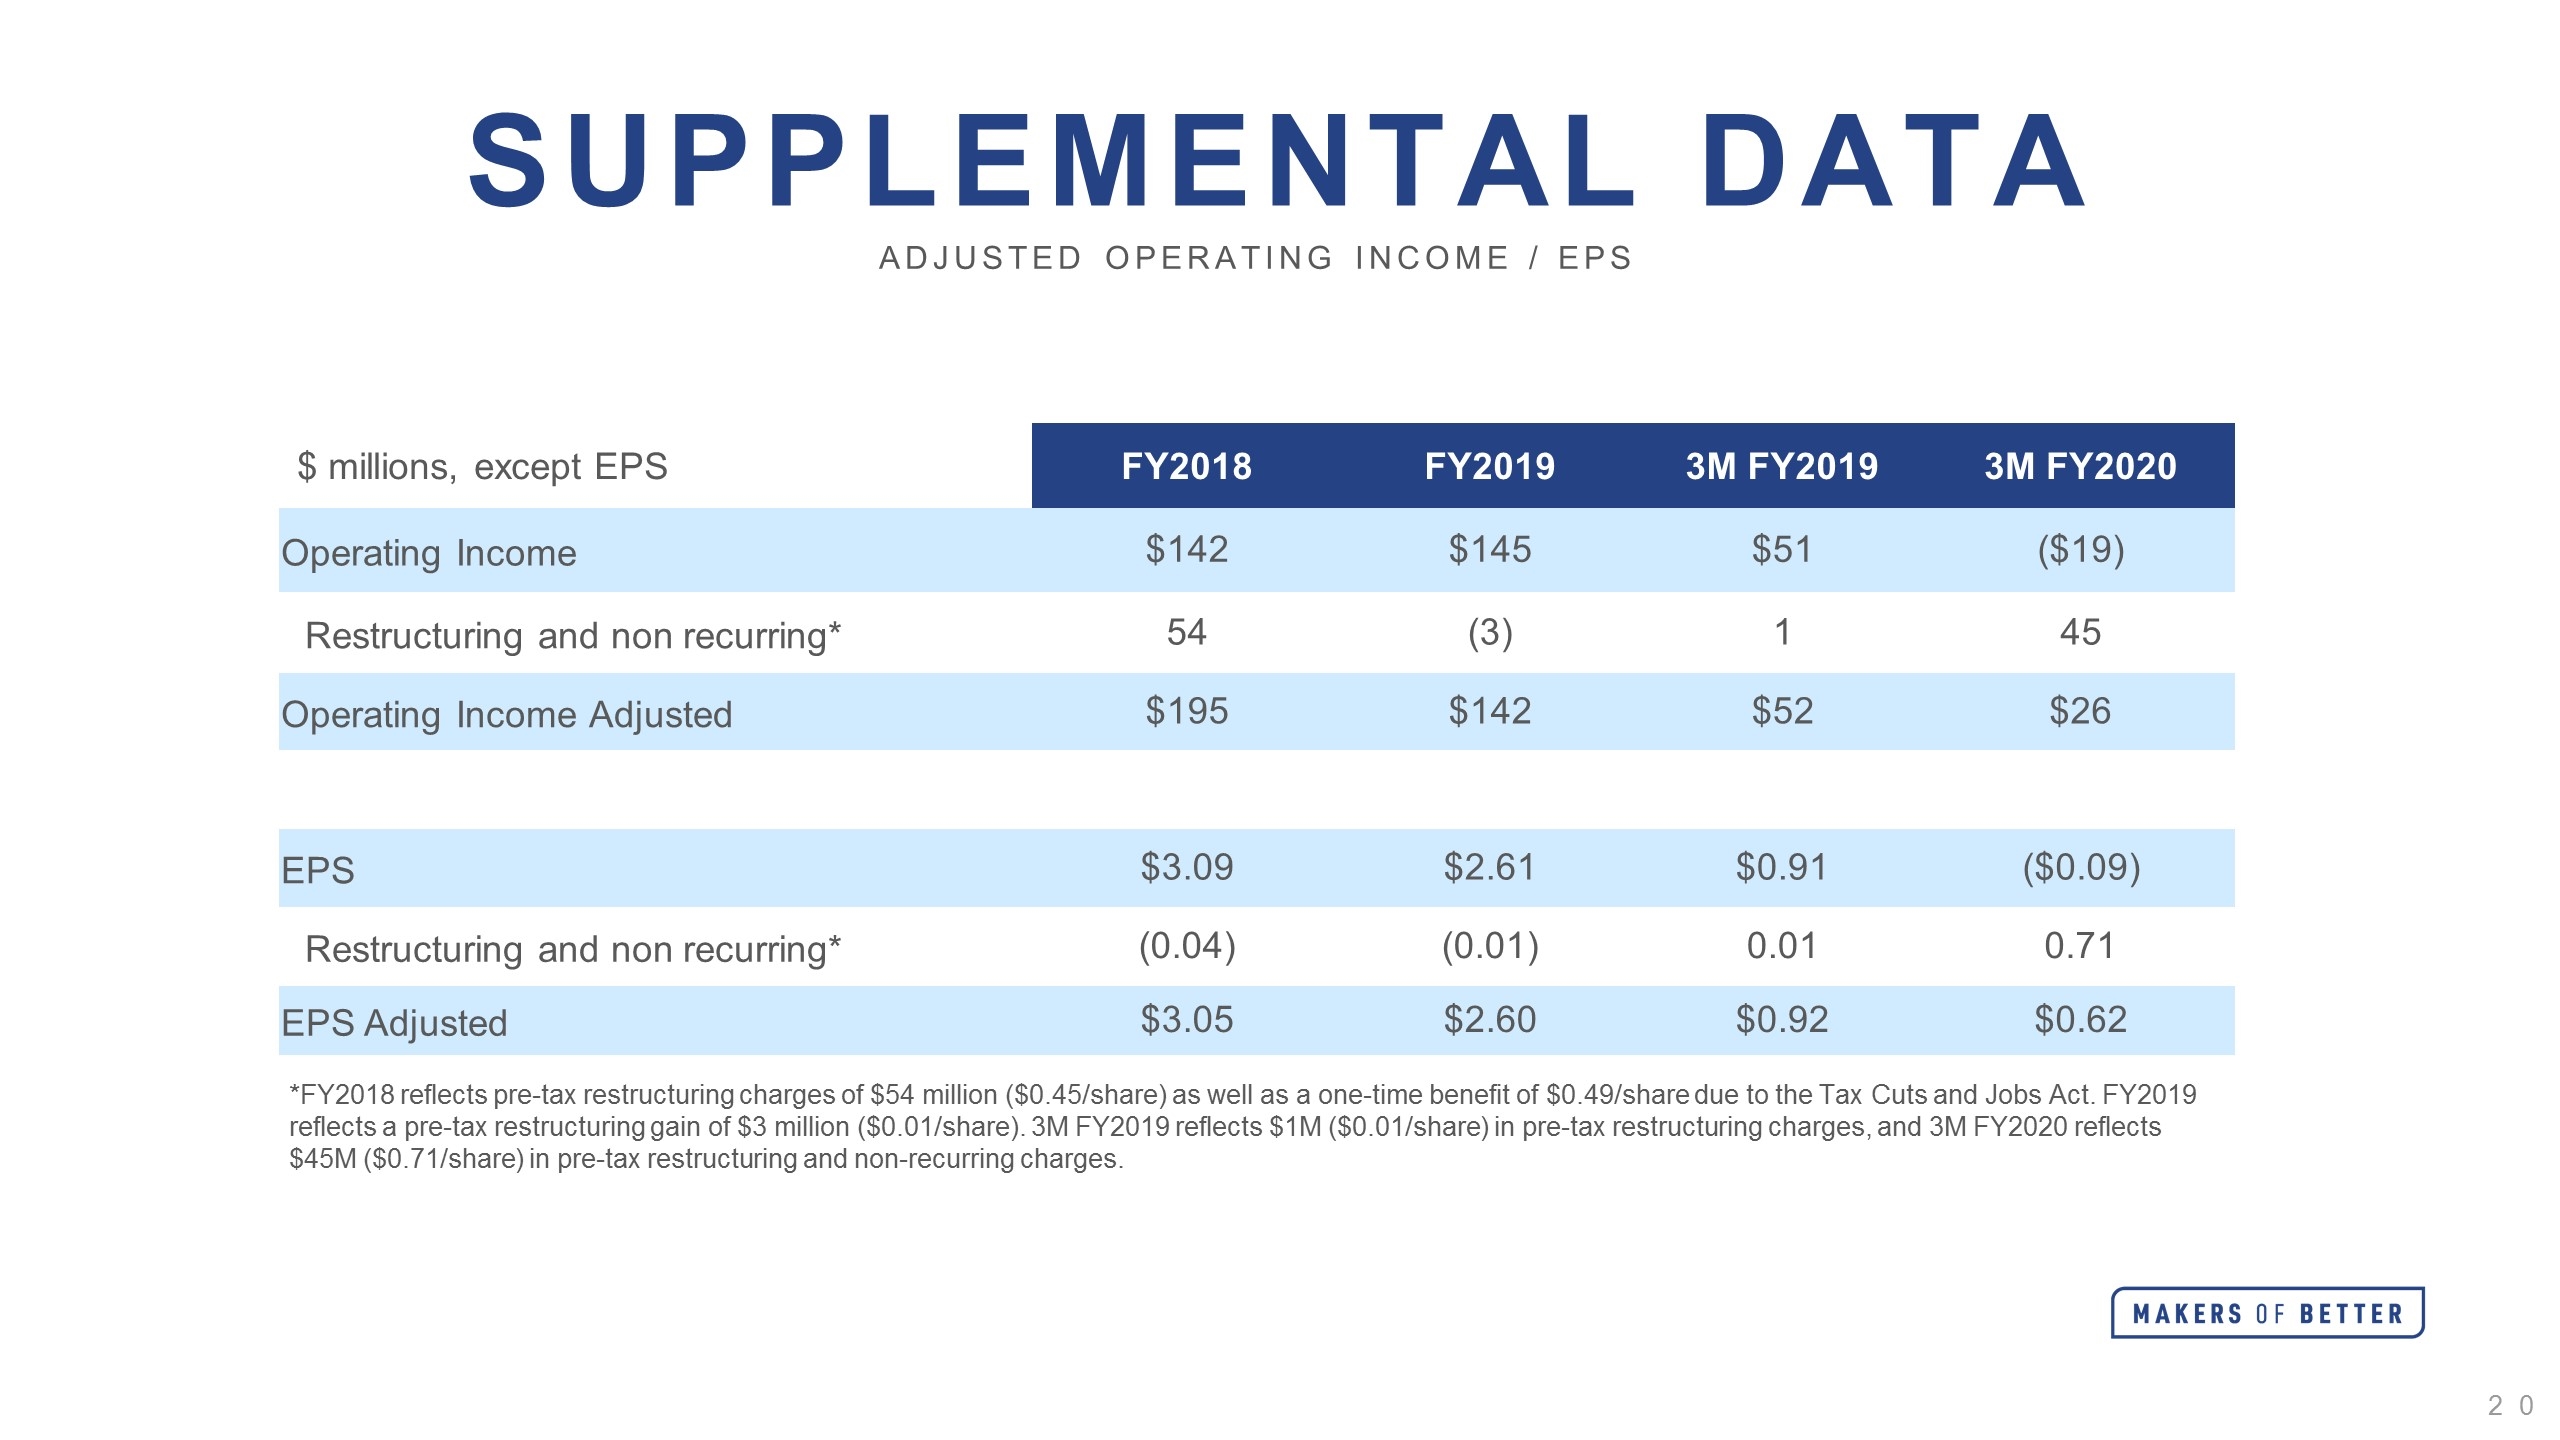
Supplemental Data Adjusted Operating Income / EPS *FY2018 reflects pre-tax restructuring charges of $54 million ($0.45/share) as well as a one-time benefit of $0.49/share due to the Tax Cuts and Jobs Act. FY2019 reflects a pre-tax restructuring gain of $3 million ($0.01/share). 3M FY2019 reflects $1M ($0.01/share) in pre-tax restructuring charges, and 3M FY2020 reflects $45M ($0.71/share) in pre-tax restructuring and non-recurring charges. $ millions, except EPS FY2018 FY2019 3M FY2019 3M FY2020 Operating Income $142 $145 $51 ($19) Restructuring and non recurring* 54 (3) 1 45 Operating Income Adjusted $195 $142 $52 $26 EPS $3.09 $2.61 $0.91 ($0.09) Restructuring and non recurring* (0.04) (0.01) 0.01 0.71 EPS Adjusted $3.05 $2.60 $0.92 $0.62
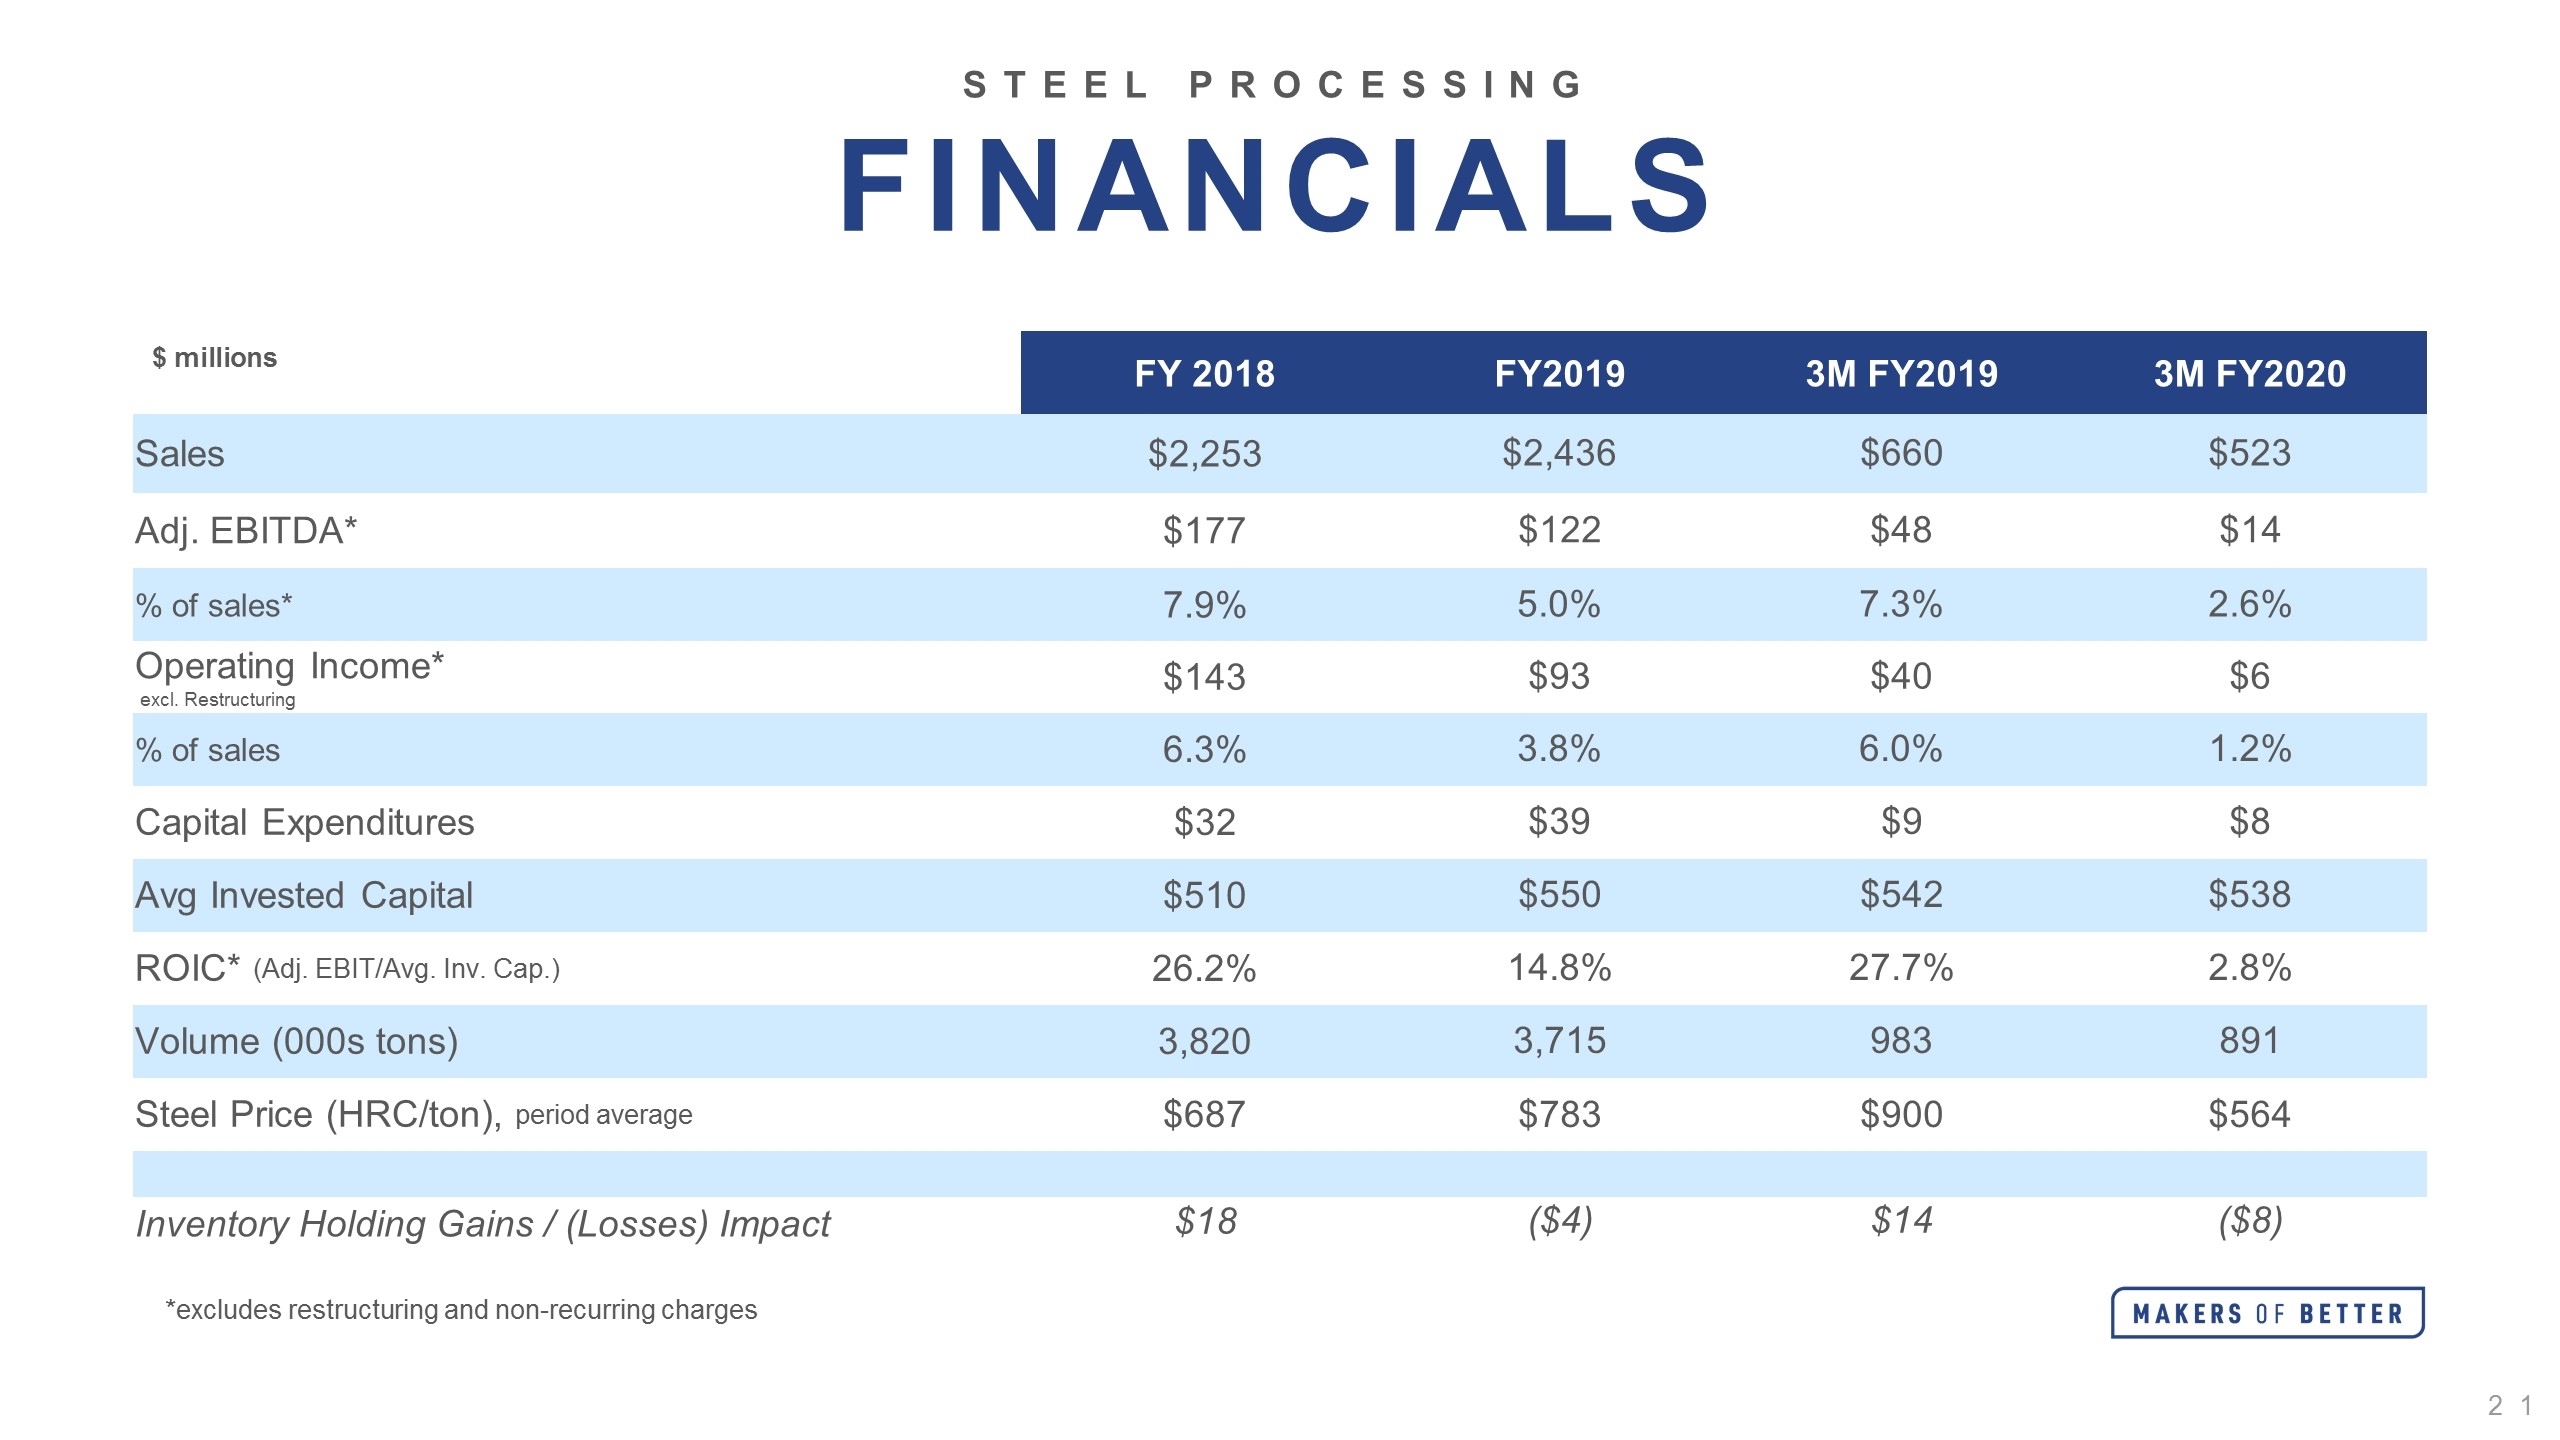
$ millions FY 2018 FY2019 3M FY2019 3M FY2020 Sales $2,253 $2,436 $660 $523 Adj. EBITDA* $177 $122 $48 $14 % of sales* 7.9% 5.0% 7.3% 2.6% Operating Income* excl. Restructuring $143 $93 $40 $6 % of sales 6.3% 3.8% 6.0% 1.2% Capital Expenditures $32 $39 $9 $8 Avg Invested Capital $510 $550 $542 $538 ROIC* (Adj. EBIT/Avg. Inv. Cap.) 26.2% 14.8% 27.7% 2.8% Volume (000s tons) 3,820 3,715 983 891 Steel Price (HRC/ton), period average $687 $783 $900 $564 Inventory Holding Gains / (Losses) Impact $18 ($4) $14 ($8) STEEL PROCESSING Financials *excludes restructuring and non-recurring charges
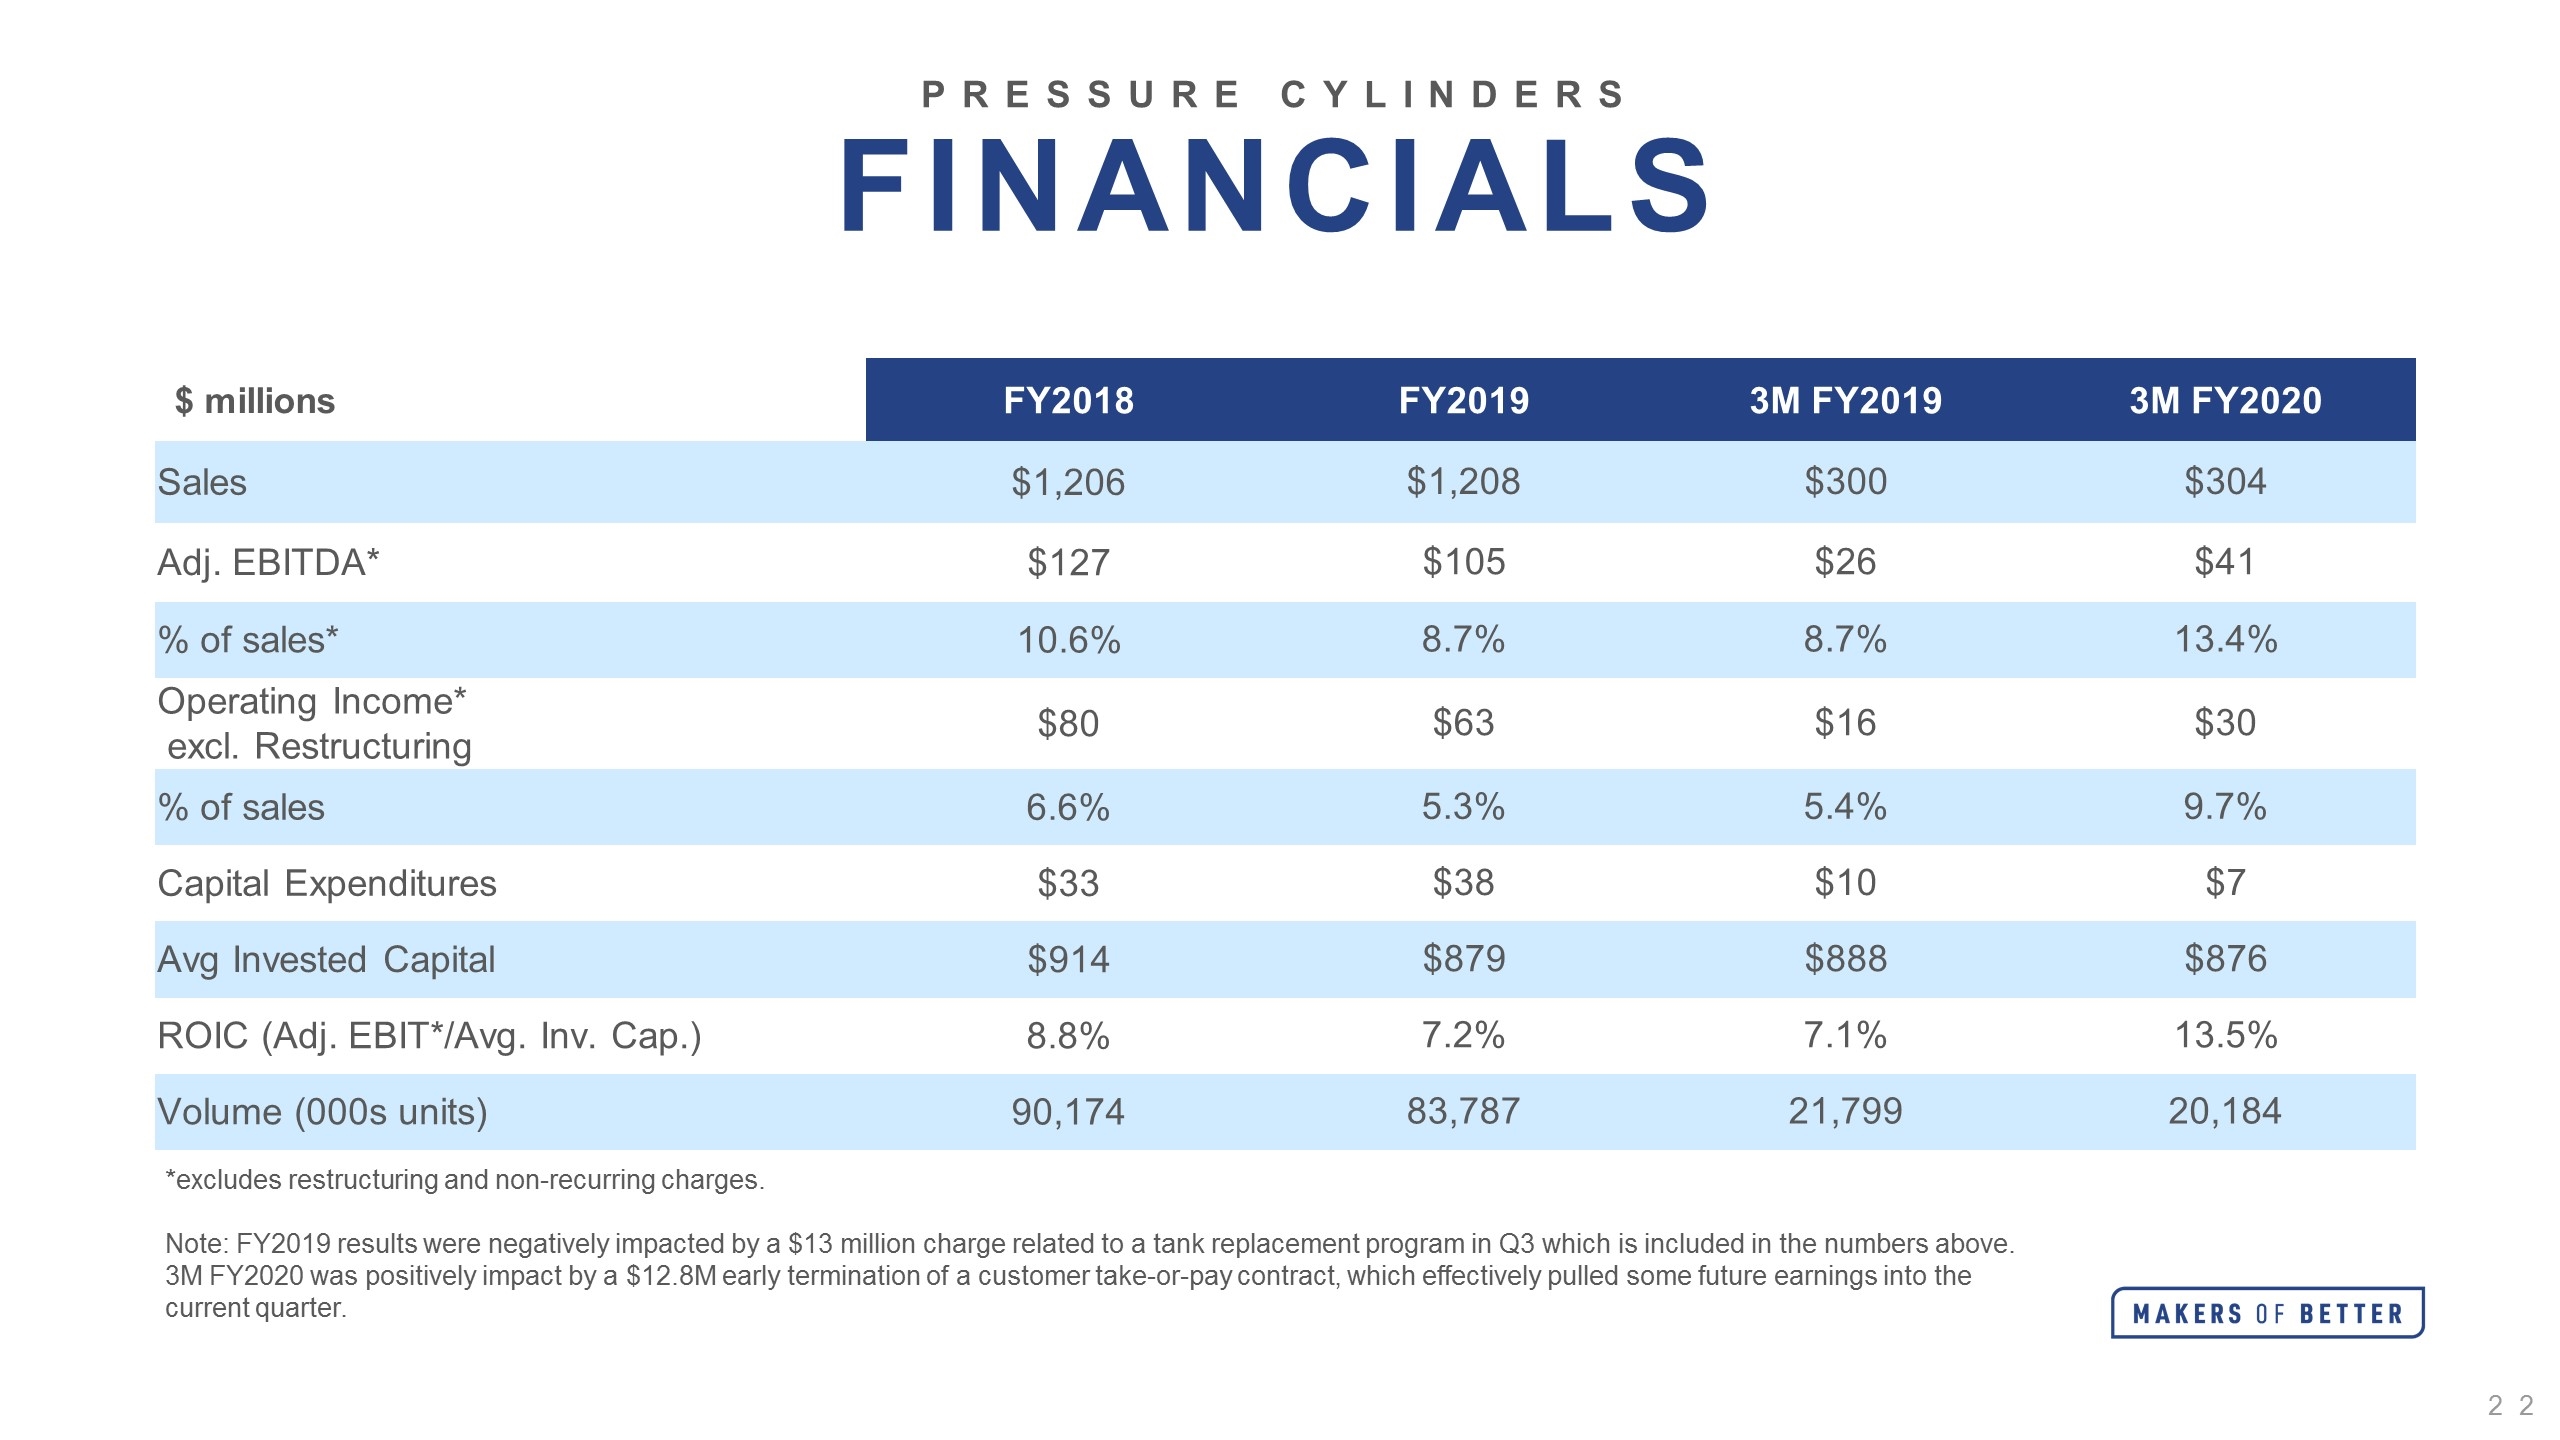
Pressure Cylinders Financials $ millions FY2018 FY2019 3M FY2019 3M FY2020 Sales $1,206 $1,208 $300 $304 Adj. EBITDA* $127 $105 $26 $41 % of sales* 10.6% 8.7% 8.7% 13.4% Operating Income* excl. Restructuring $80 $63 $16 $30 % of sales 6.6% 5.3% 5.4% 9.7% Capital Expenditures $33 $38 $10 $7 Avg Invested Capital $914 $879 $888 $876 ROIC (Adj. EBIT*/Avg. Inv. Cap.) 8.8% 7.2% 7.1% 13.5% Volume (000s units) 90,174 83,787 21,799 20,184 *excludes restructuring and non-recurring charges. Note: FY2019 results were negatively impacted by a $13 million charge related to a tank replacement program in Q3 which is included in the numbers above. 3M FY2020 was positively impact by a $12.8M early termination of a customer take-or-pay contract, which effectively pulled some future earnings into the current quarter.
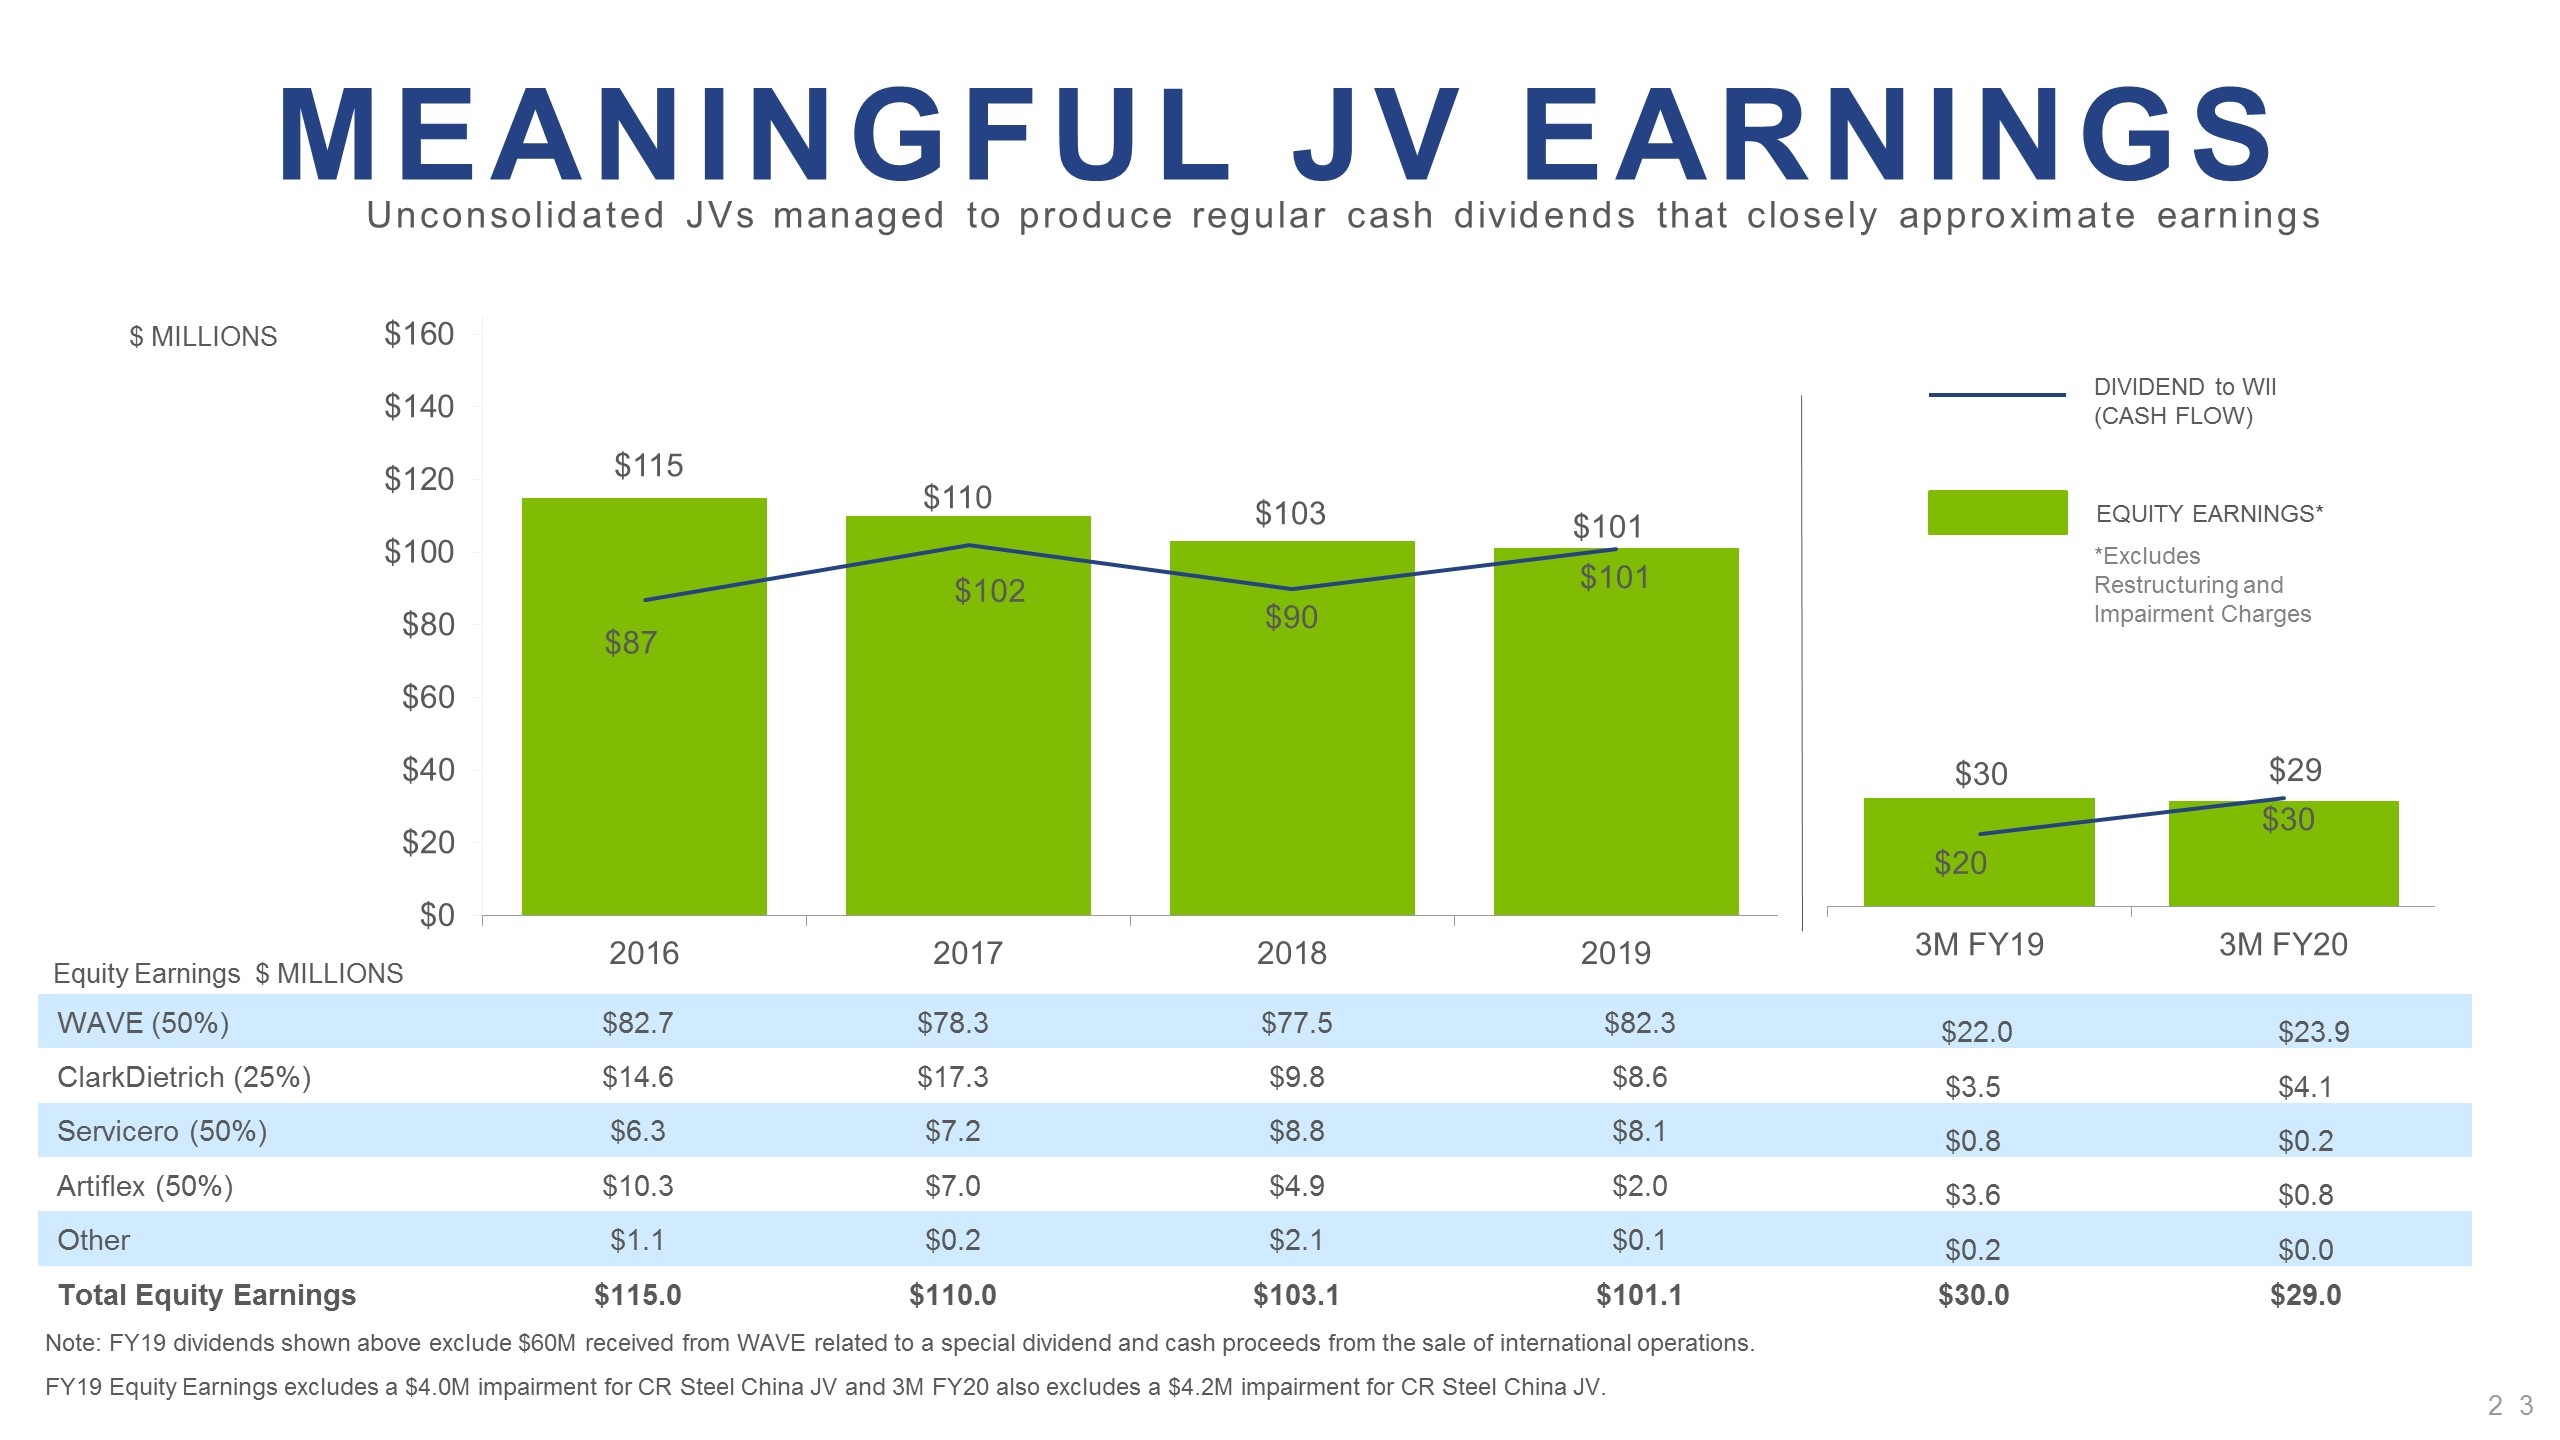
*Excludes Restructuring and Impairment Charges DIVIDEND to WII (CASH FLOW) EQUITY EARNINGS* Equity Earnings $ MILLIONS WAVE (50%) $82.7 $78.3 $77.5 $82.3 $22.0 $23.9 ClarkDietrich (25%) $14.6 $17.3 $9.8 $8.6 $3.5 $4.1 Servicero (50%) $6.3 $7.2 $8.8 $8.1 $0.8 $0.2 Artiflex (50%) $10.3 $7.0 $4.9 $2.0 $3.6 $0.8 Other $1.1 $0.2 $2.1 $0.1 $0.2 $0.0 Total Equity Earnings $115.0 $110.0 $103.1 $101.1 $30.0 $29.0 Note: FY19 dividends shown above exclude $60M received from WAVE related to a special dividend and cash proceeds from the sale of international operations. FY19 Equity Earnings excludes a $4.0M impairment for CR Steel China JV and 3M FY20 also excludes a $4.2M impairment for CR Steel China JV. $ MILLIONS Unconsolidated JVs managed to produce regular cash dividends that closely approximate earnings Meaningful JV Earnings
Safe Harbor Statement Worthington Industries wishes to take advantage of the Safe Harbor provisions included in the Private Securities Litigation Reform Act of 1995 (the “Act"). Statements by the Company which are not historical information constitute "forward looking statements" within the meaning of the Act. All forward-looking statements are subject to risks and uncertainties which could cause actual results to differ from those projected. Factors that could cause actual results to differ materially include risks described from time to time in the Company's filings with the Securities and Exchange Commission. 614.840.4663 Marcus.Rogier@WorthingtonIndustries.com CONTACT


