
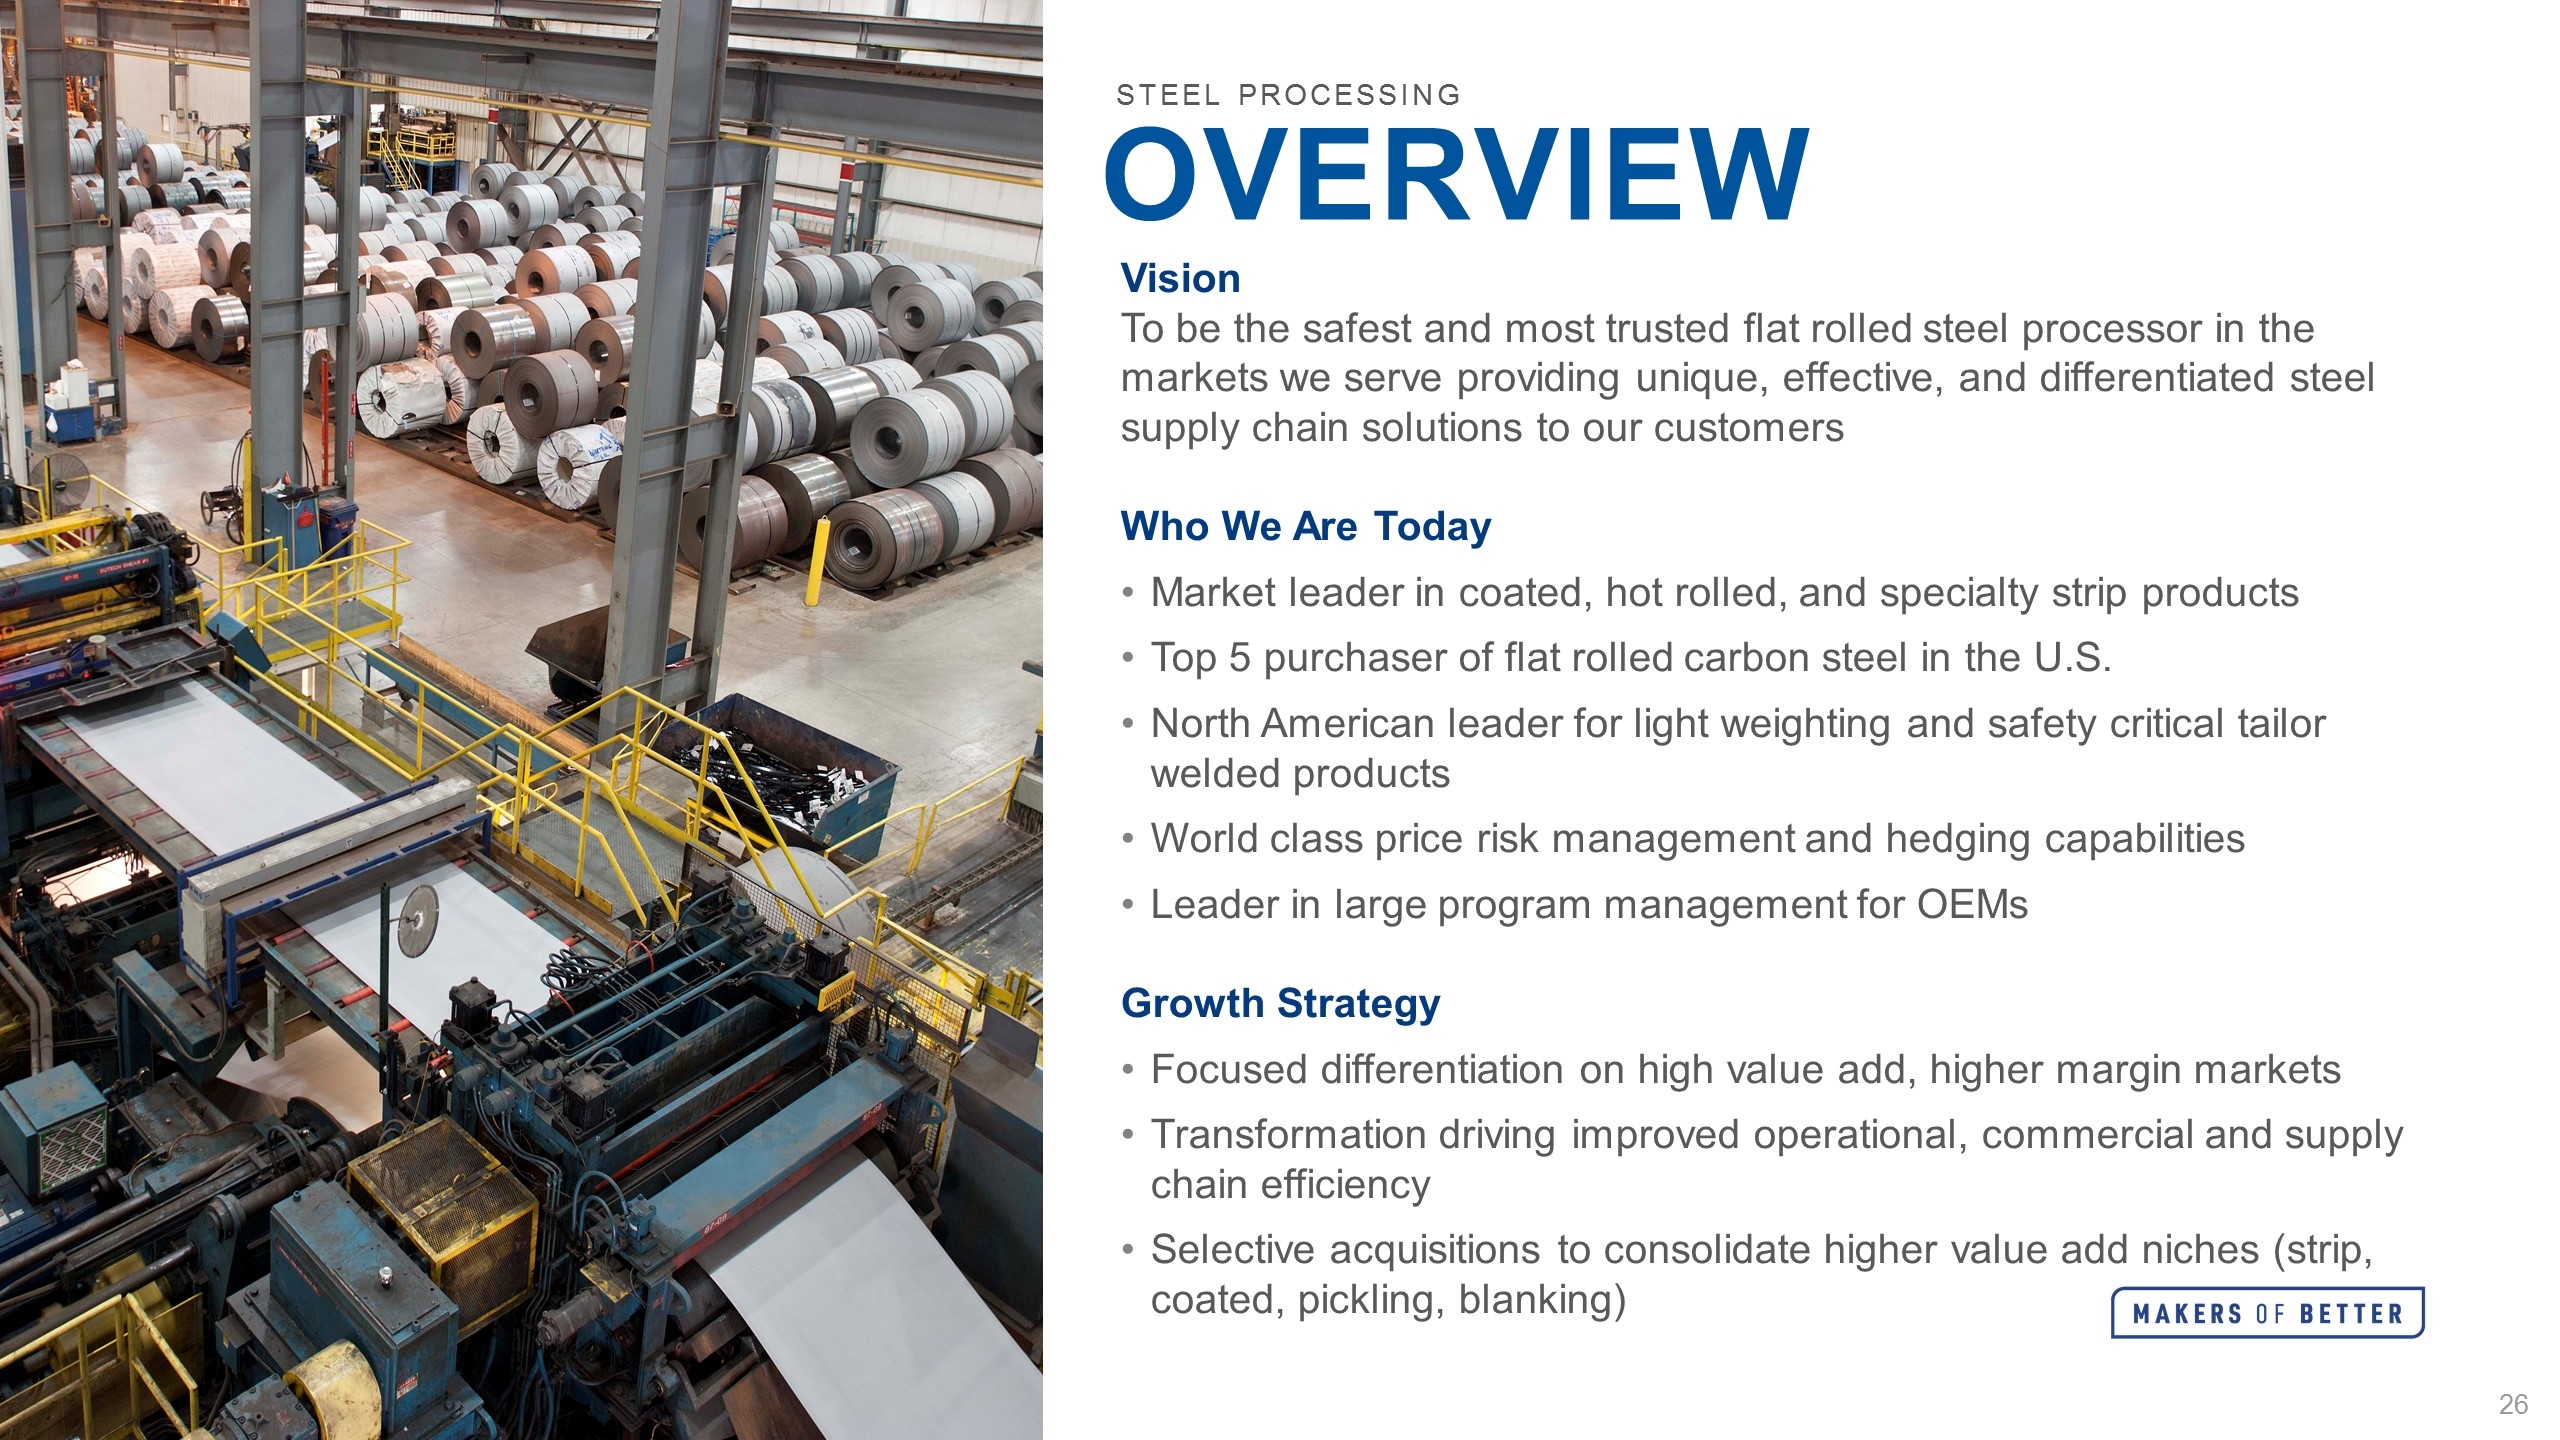
Vision To be the safest and most trusted flat rolled steel processor in the markets we serve providing unique, effective, and differentiated steel supply chain solutions to our customers Who We Are Today Market leader in coated, hot rolled, and specialty strip products Top 5 purchaser of flat rolled carbon steel in the U.S. North American leader for light weighting and safety critical tailor welded products World class price risk management and hedging capabilities Leader in large program management for OEMs Growth Strategy Focused differentiation on high value add, higher margin markets Transformation driving improved operational, commercial and supply chain efficiency Selective acquisitions to consolidate higher value add niches (strip, coated, pickling, blanking) OVERVIEW STEEL PROCESSING

Sales By End Market Sales by Product Mix FY19 FY19 AUTO CORE PRODUCTS Profile STEEL PROCESSING AGRICULTURE CONSTRUCTION HEAVY TRUCK Carbon flat rolled steel processing - Broad range of metal products in sheet, coil and strip configurations, as well as a number of processing capabilities from specialty coatings and annealing, to pickling, slitting and blanking. Tailor welded products – Offering tailored products for light weighting and safety critical components through 55% owned JV (TWB). Capability to process multiple types of materials offering tailored blanks, tailor welded coils, aluminum tailor welded blanks, and hot formed tailor welded blanks. 27 facilities in North America (9 wholly owned / 18 JV Owned) Wholly-Owned Consolidated JVs Unconsolidated JVs
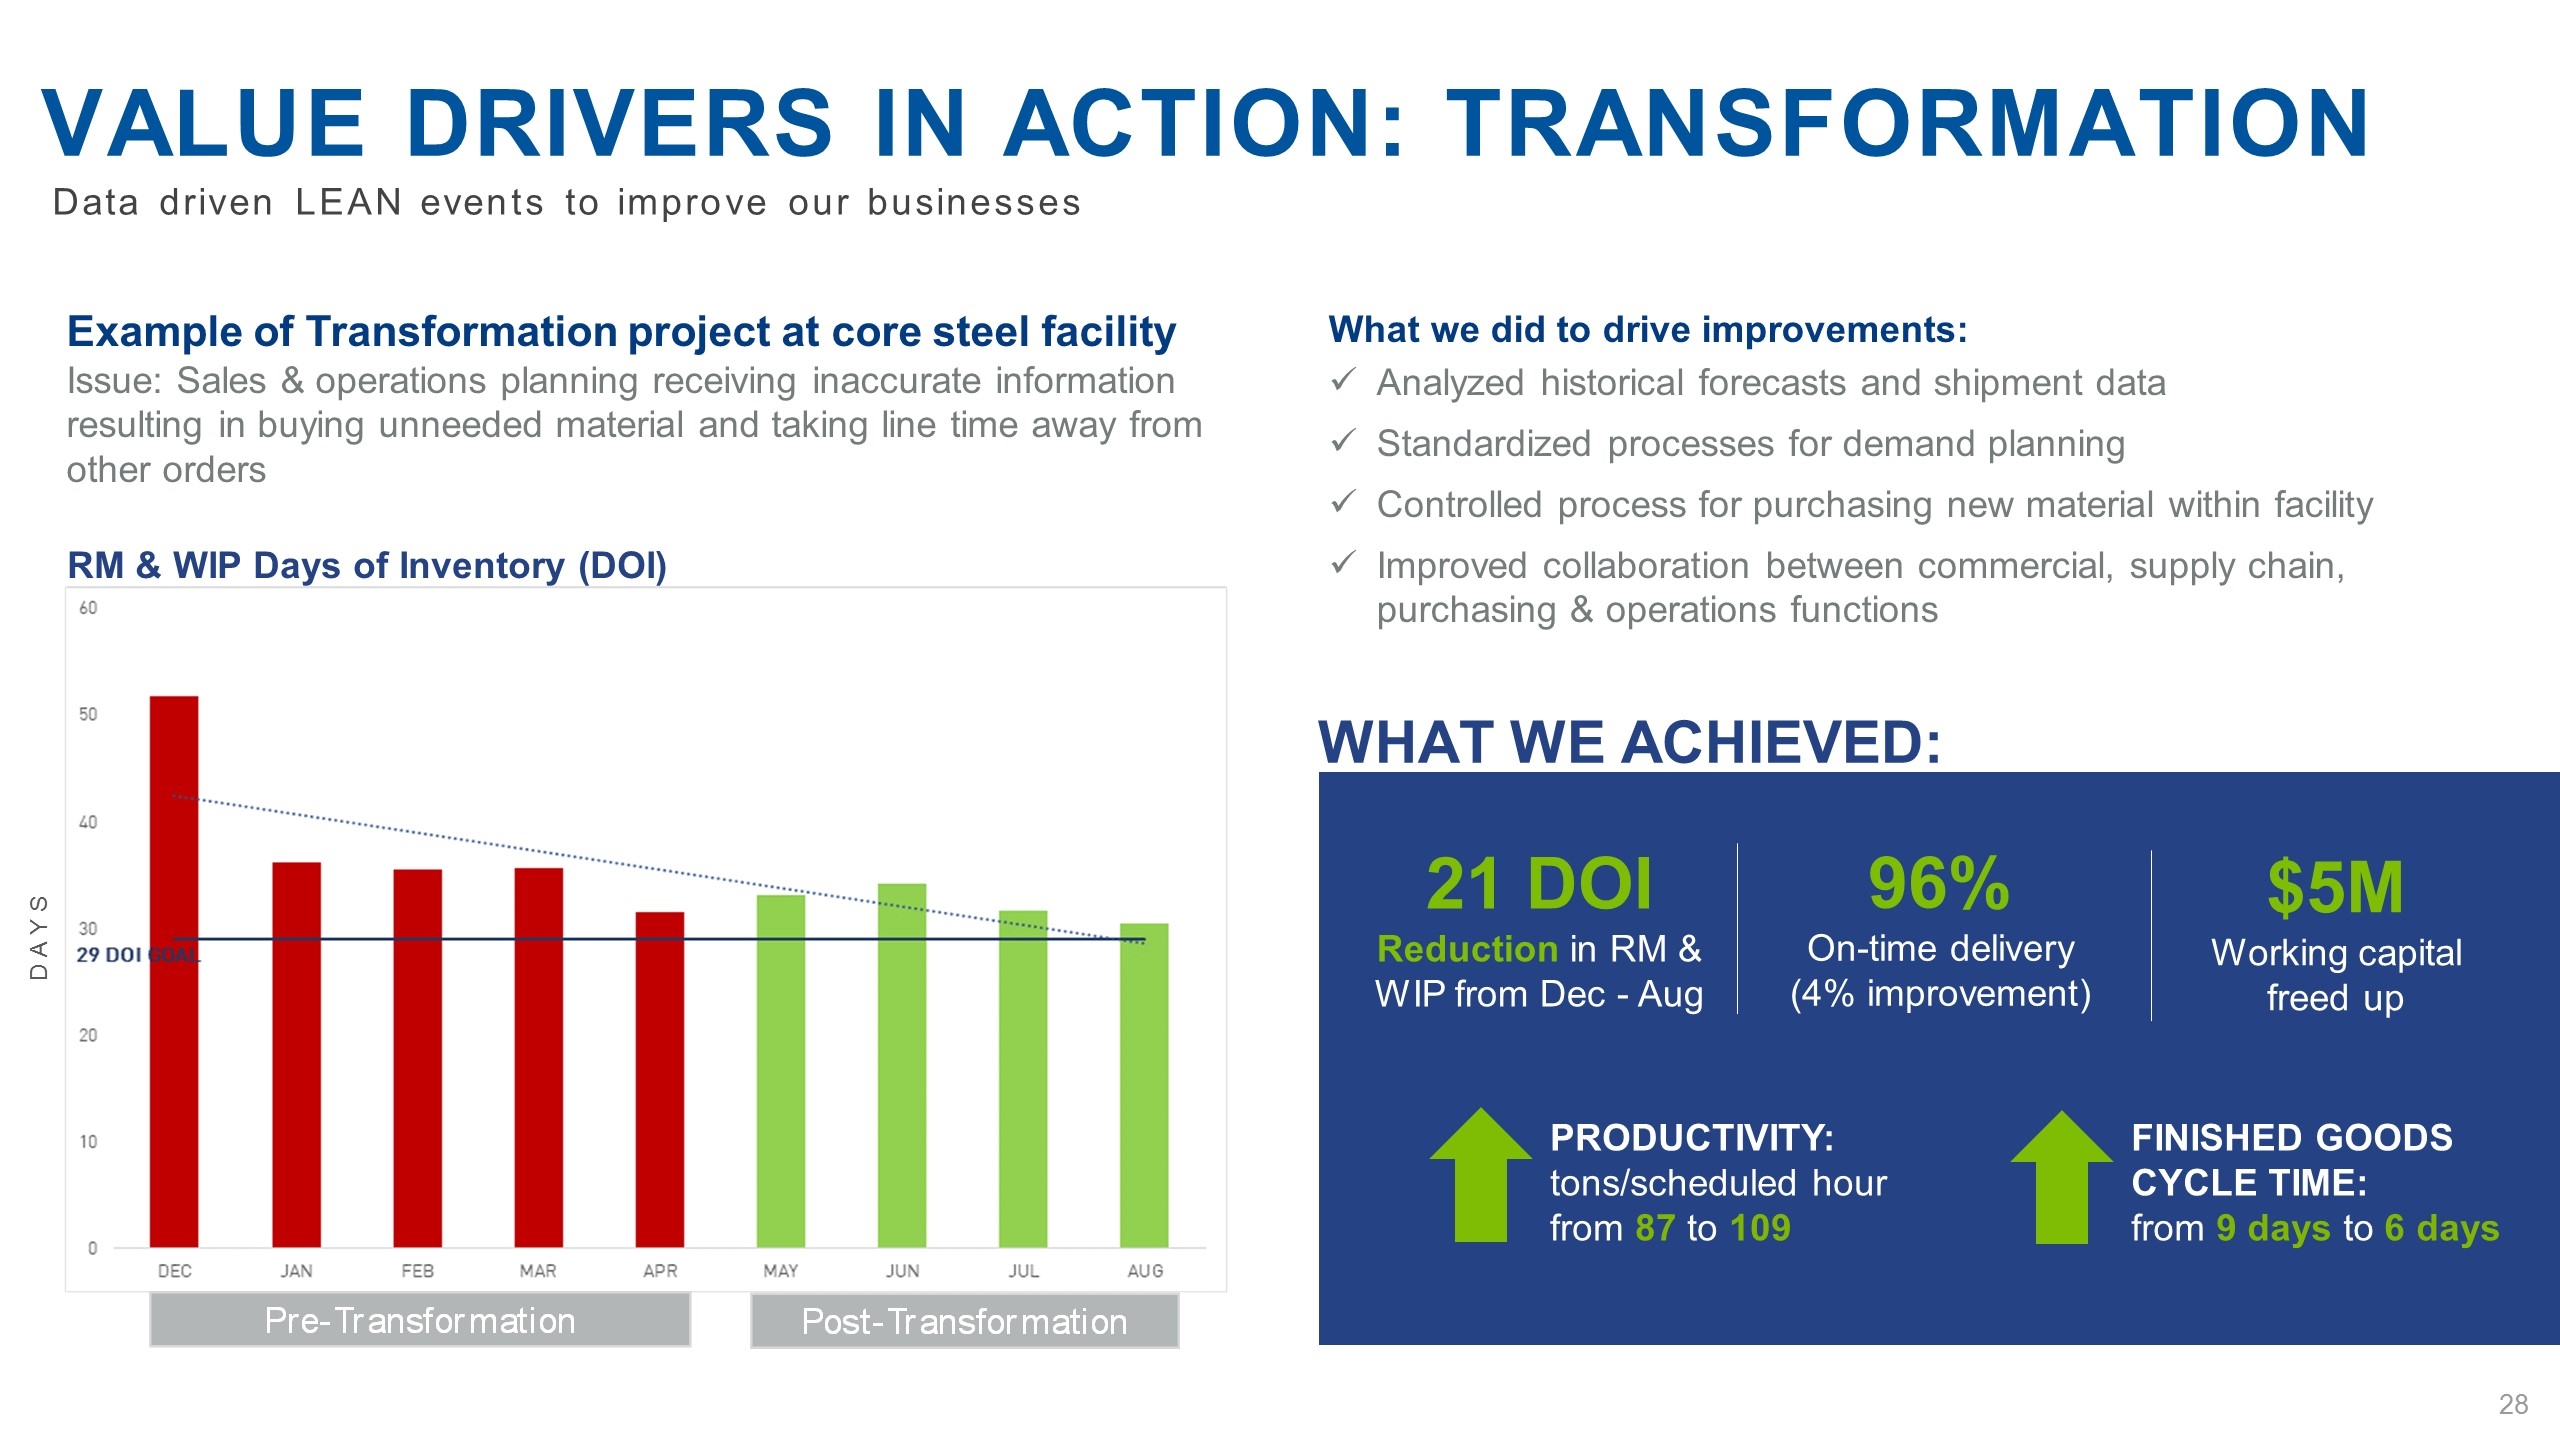
Value drivers in action: Transformation Data driven LEAN events to improve our businesses Example of Transformation project at core steel facility Issue: Sales & operations planning receiving inaccurate information resulting in buying unneeded material and taking line time away from other orders What we did to drive improvements: Analyzed historical forecasts and shipment data Standardized processes for demand planning Controlled process for purchasing new material within facility Improved collaboration between commercial, supply chain, purchasing & operations functions What we achieved: 21 DOI Reduction in RM & WIP from Dec - Aug $5M Working capital freed up 96% On-time delivery (4% improvement) Productivity: tons/scheduled hour from 87 to 109 Finished goods cycle time: from 9 days to 6 days RM & WIP Days of Inventory (DOI) DAYS
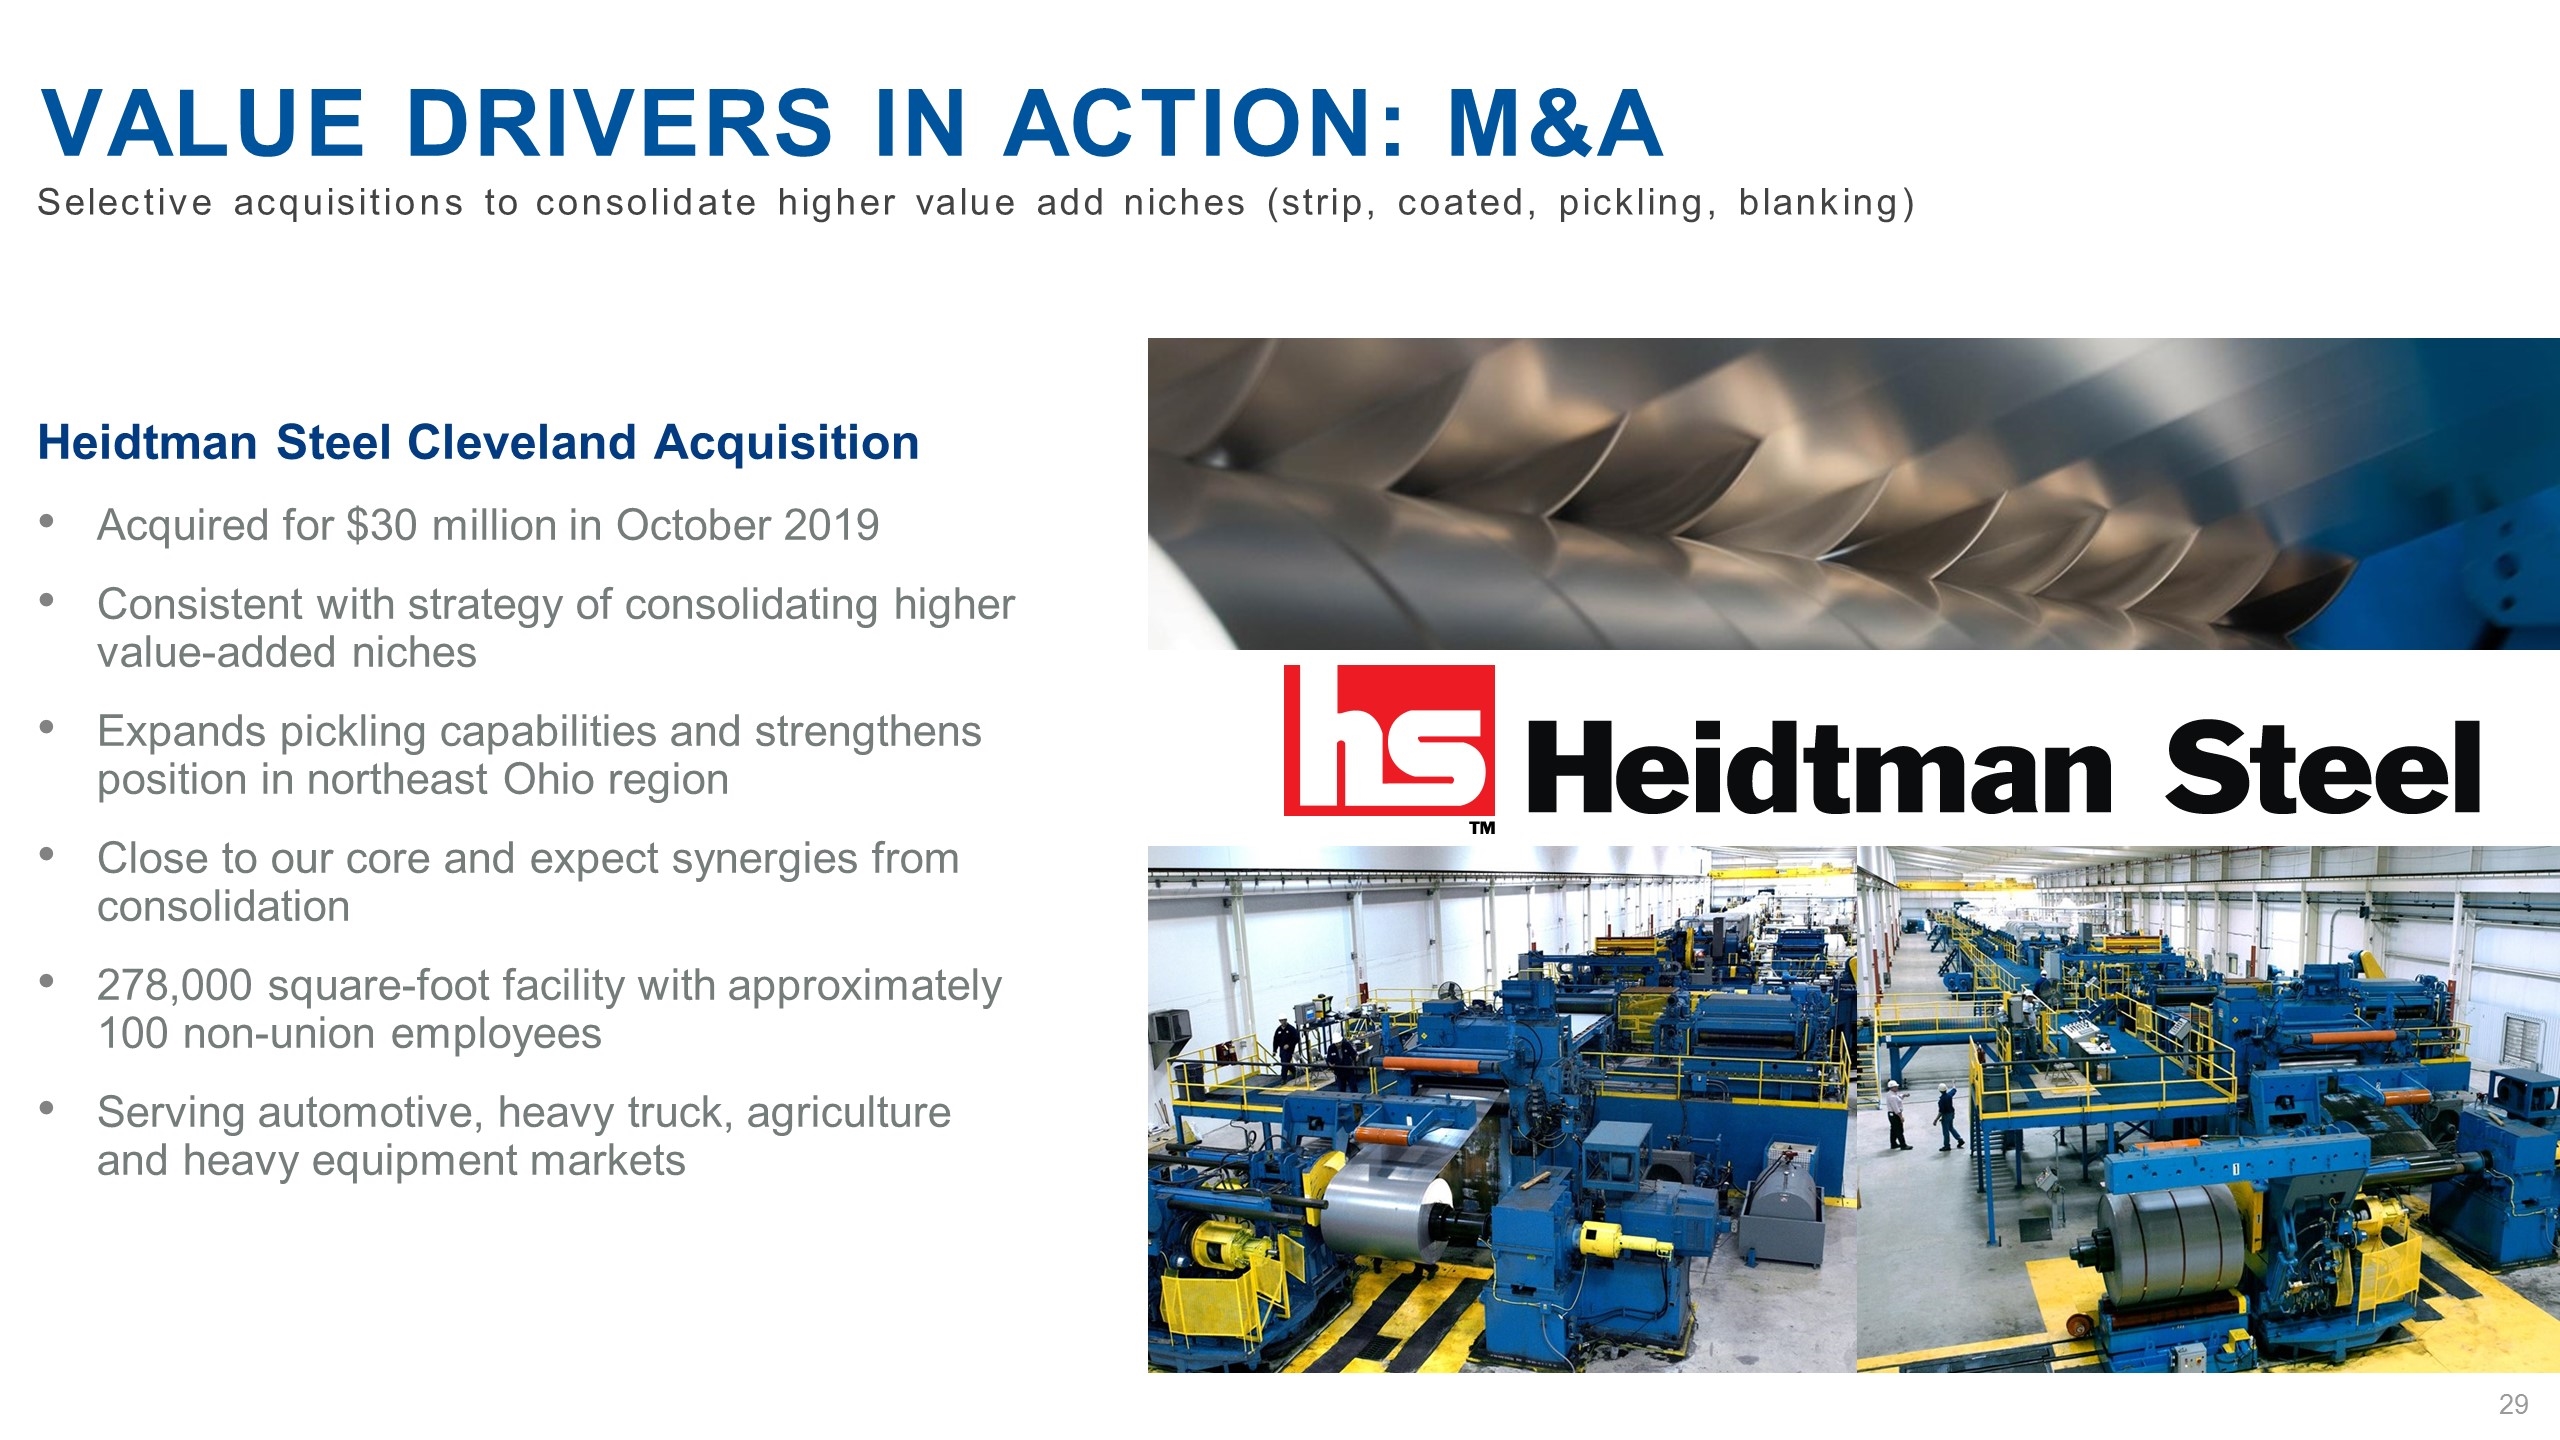
Heidtman Steel Cleveland Acquisition Acquired for $30 million in October 2019 Consistent with strategy of consolidating higher value-added niches Expands pickling capabilities and strengthens position in northeast Ohio region Close to our core and expect synergies from consolidation 278,000 square-foot facility with approximately 100 non-union employees Serving automotive, heavy truck, agriculture and heavy equipment markets Value drivers in action: m&a Selective acquisitions to consolidate higher value add niches (strip, coated, pickling, blanking)
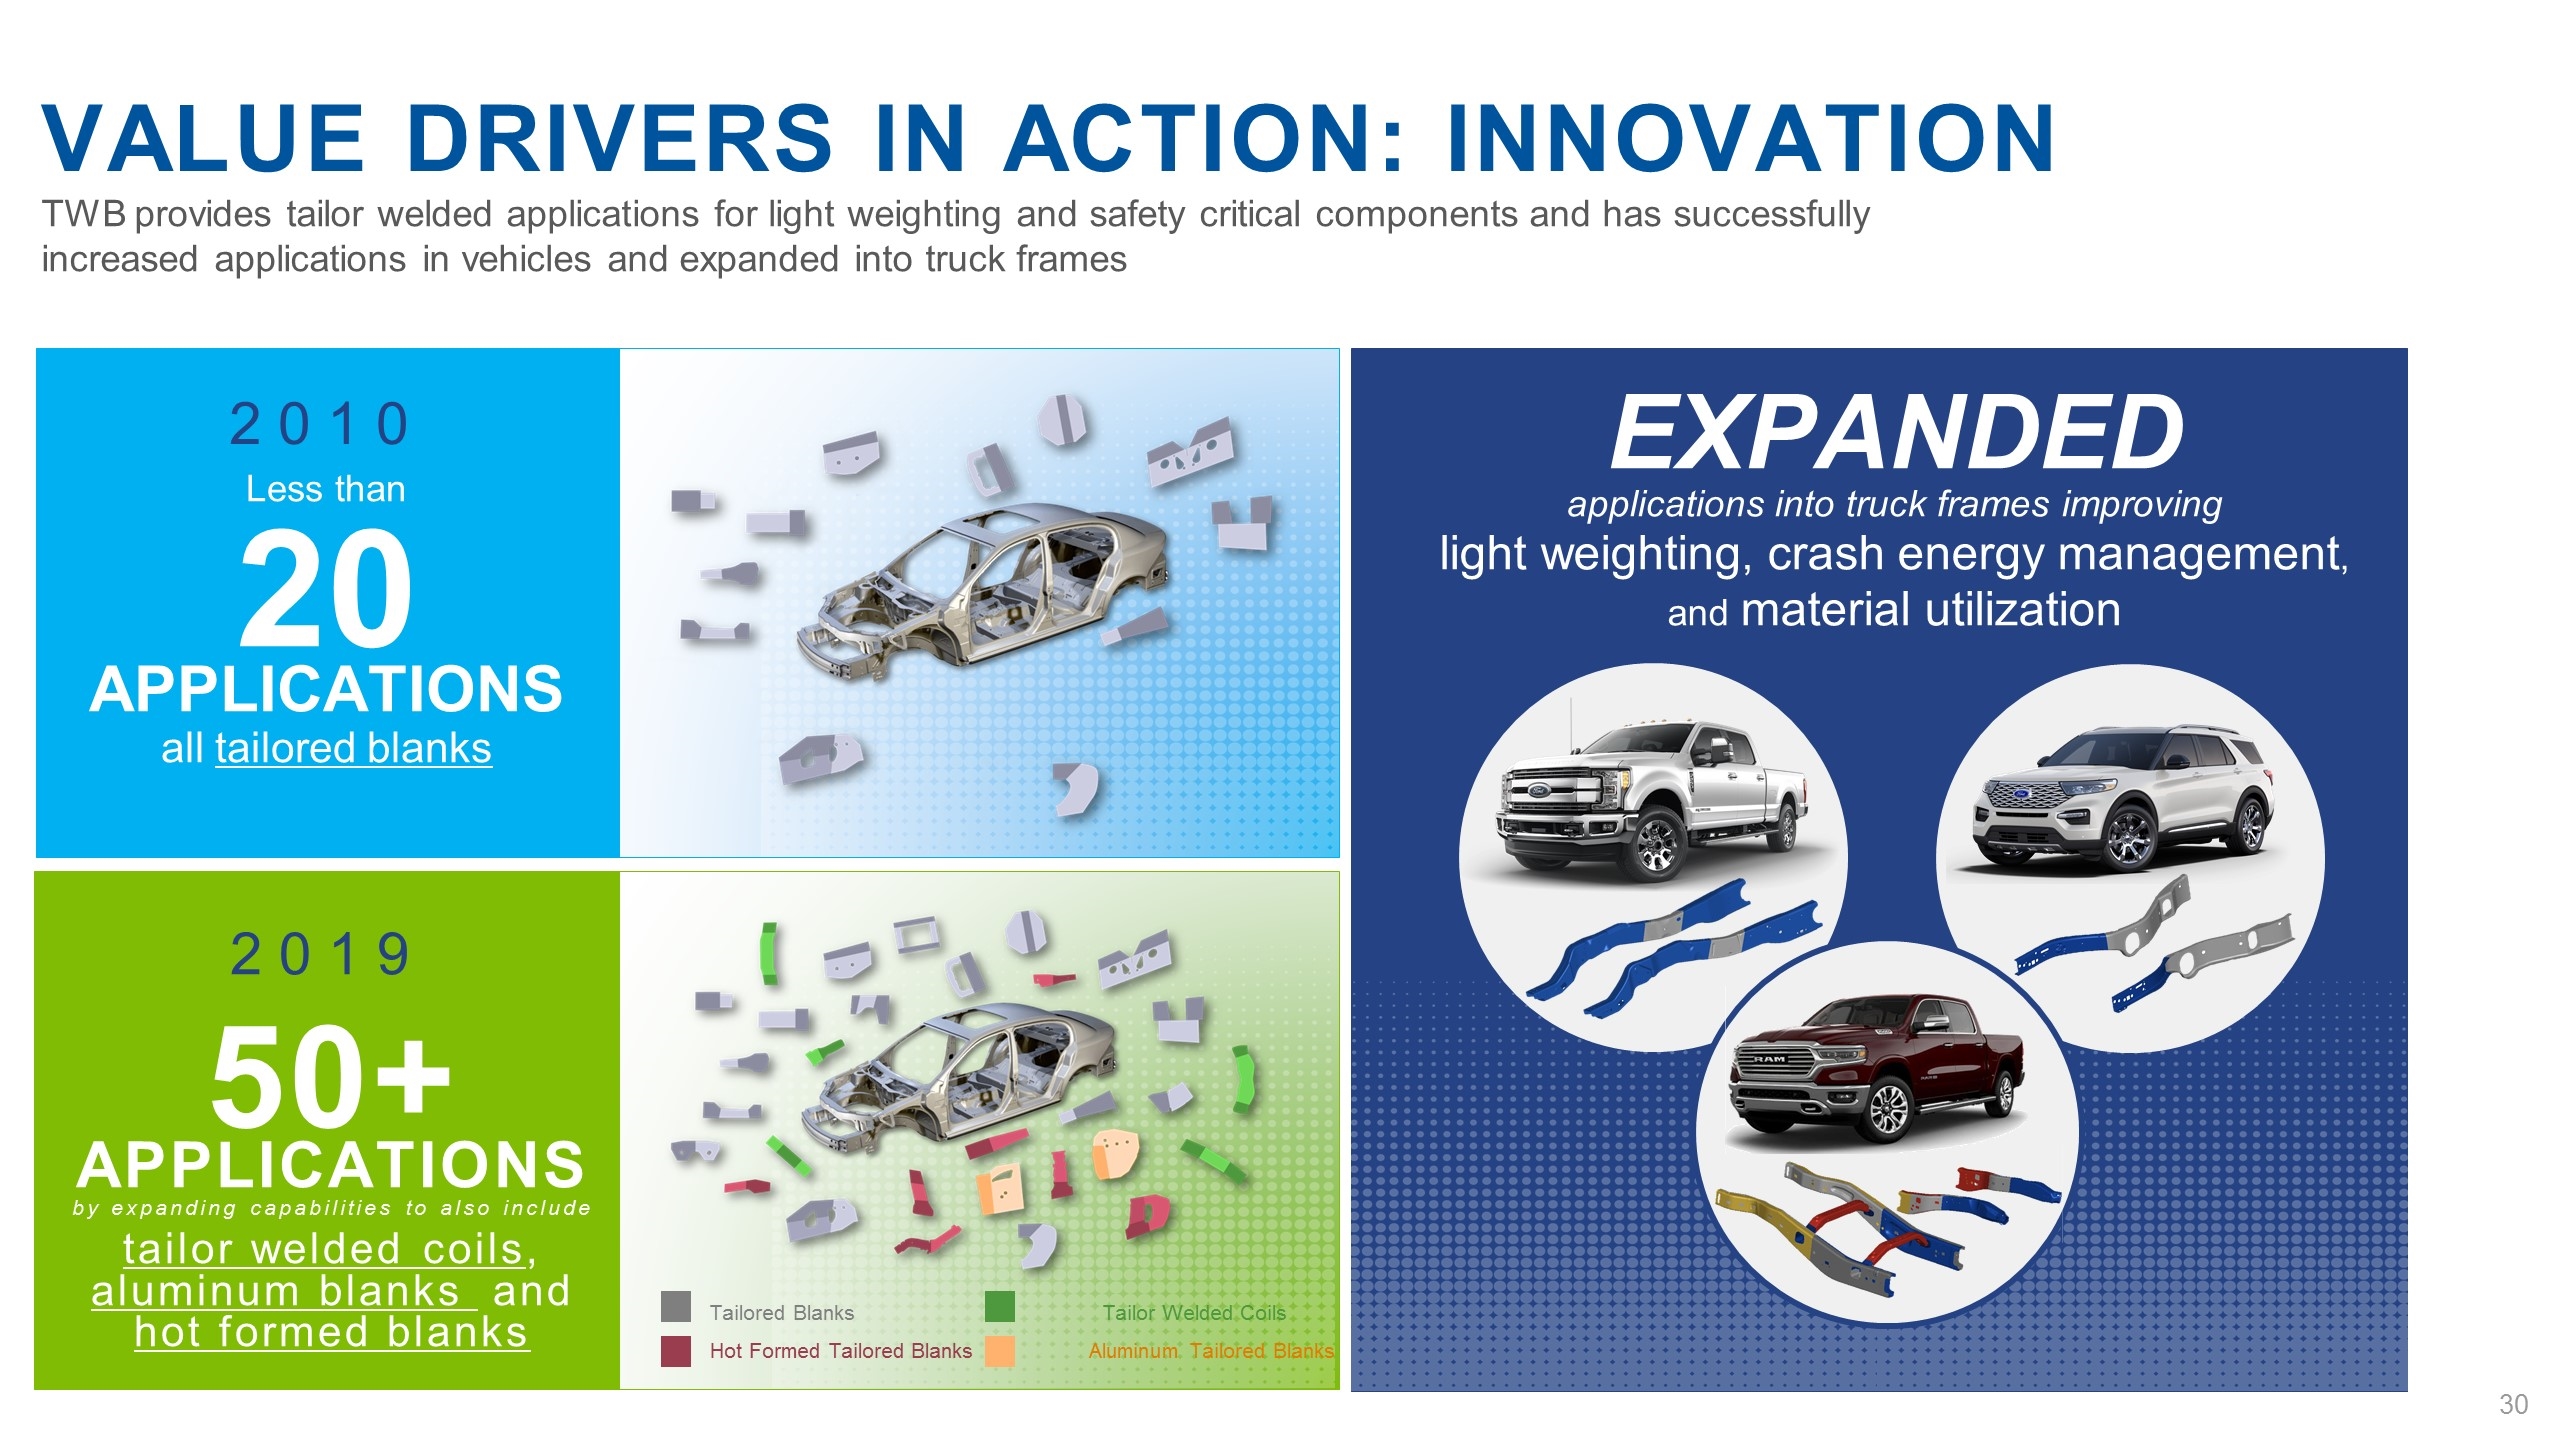
Expanded applications into truck frames improving light weighting, crash energy management, and material utilization Less than 20 applications all tailored blanks 50+ applications by expanding capabilities to also include tailor welded coils, aluminum blanks and hot formed blanks Value drivers in action: Innovation Tailored Blanks Tailor Welded Coils Hot Formed Tailored Blanks Aluminum Tailored Blanks 2010 2019 TWB provides tailor welded applications for light weighting and safety critical components and has successfully increased applications in vehicles and expanded into truck frames
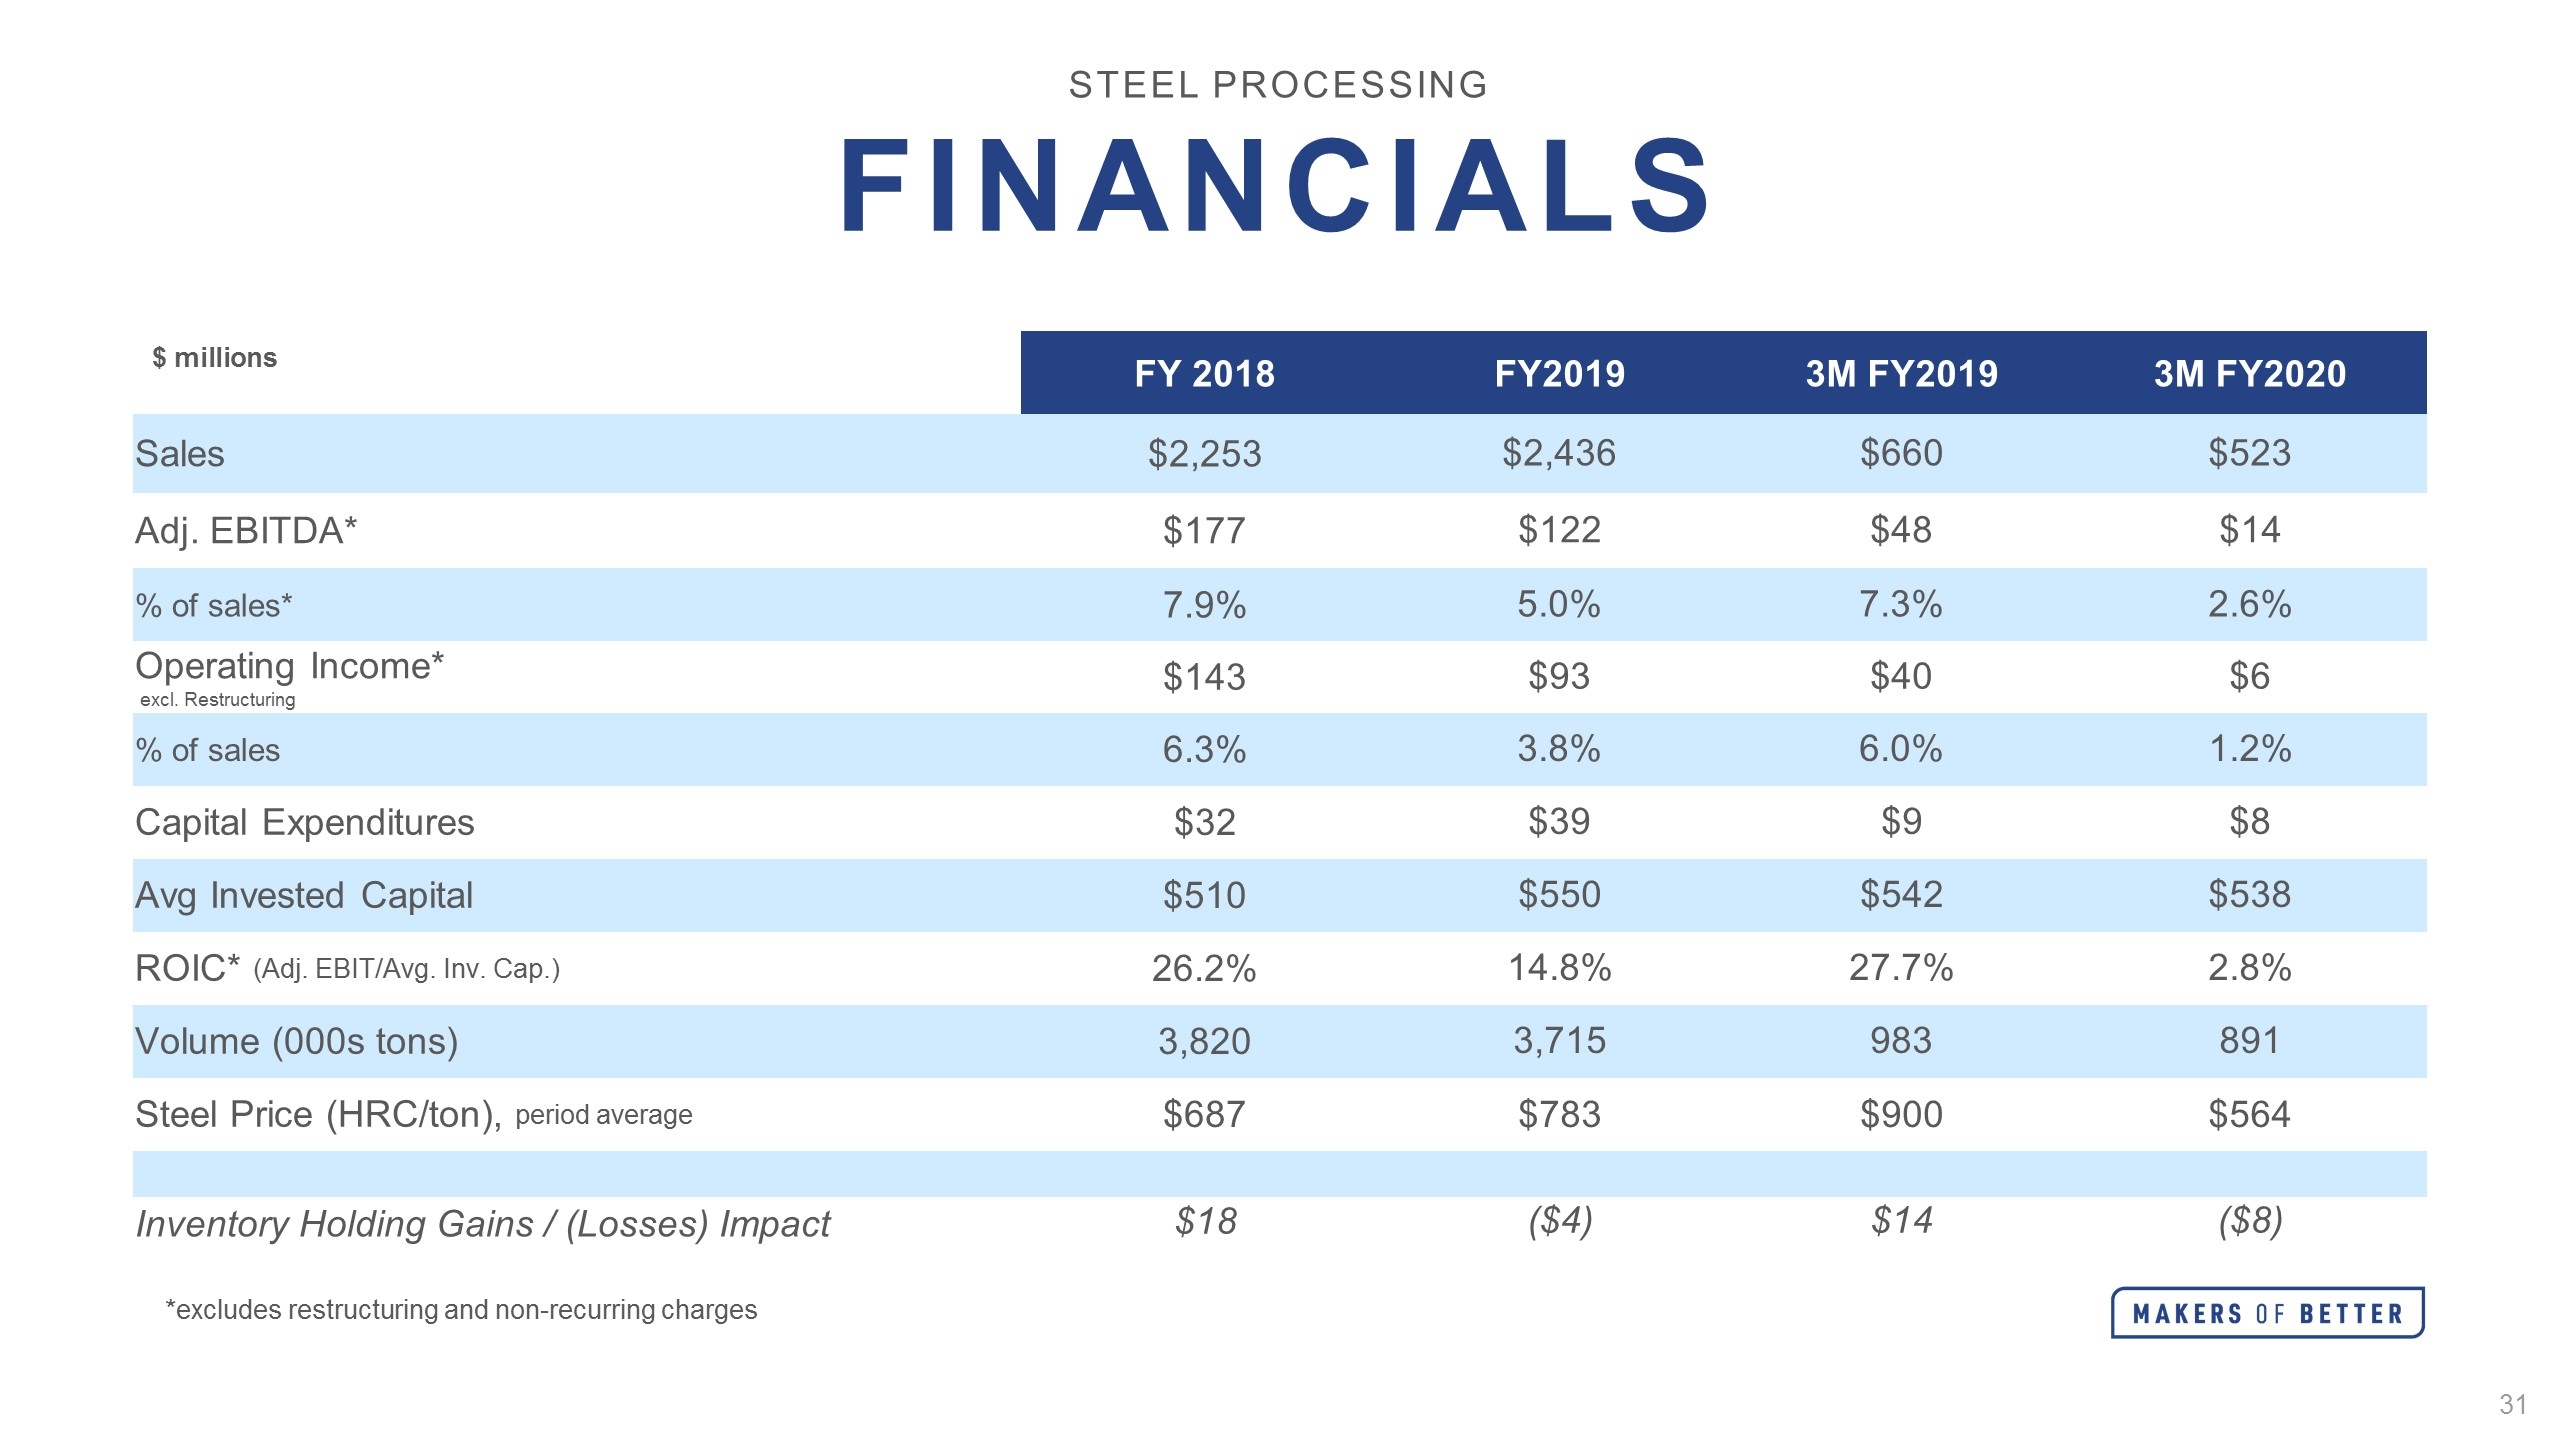
$ millions FY 2018 FY2019 3M FY2019 3M FY2020 Sales $2,253 $2,436 $660 $523 Adj. EBITDA* $177 $122 $48 $14 % of sales* 7.9% 5.0% 7.3% 2.6% Operating Income* excl. Restructuring $143 $93 $40 $6 % of sales 6.3% 3.8% 6.0% 1.2% Capital Expenditures $32 $39 $9 $8 Avg Invested Capital $510 $550 $542 $538 ROIC* (Adj. EBIT/Avg. Inv. Cap.) 26.2% 14.8% 27.7% 2.8% Volume (000s tons) 3,820 3,715 983 891 Steel Price (HRC/ton), period average $687 $783 $900 $564 Inventory Holding Gains / (Losses) Impact $18 ($4) $14 ($8) STEEL PROCESSING Financials *excludes restructuring and non-recurring charges

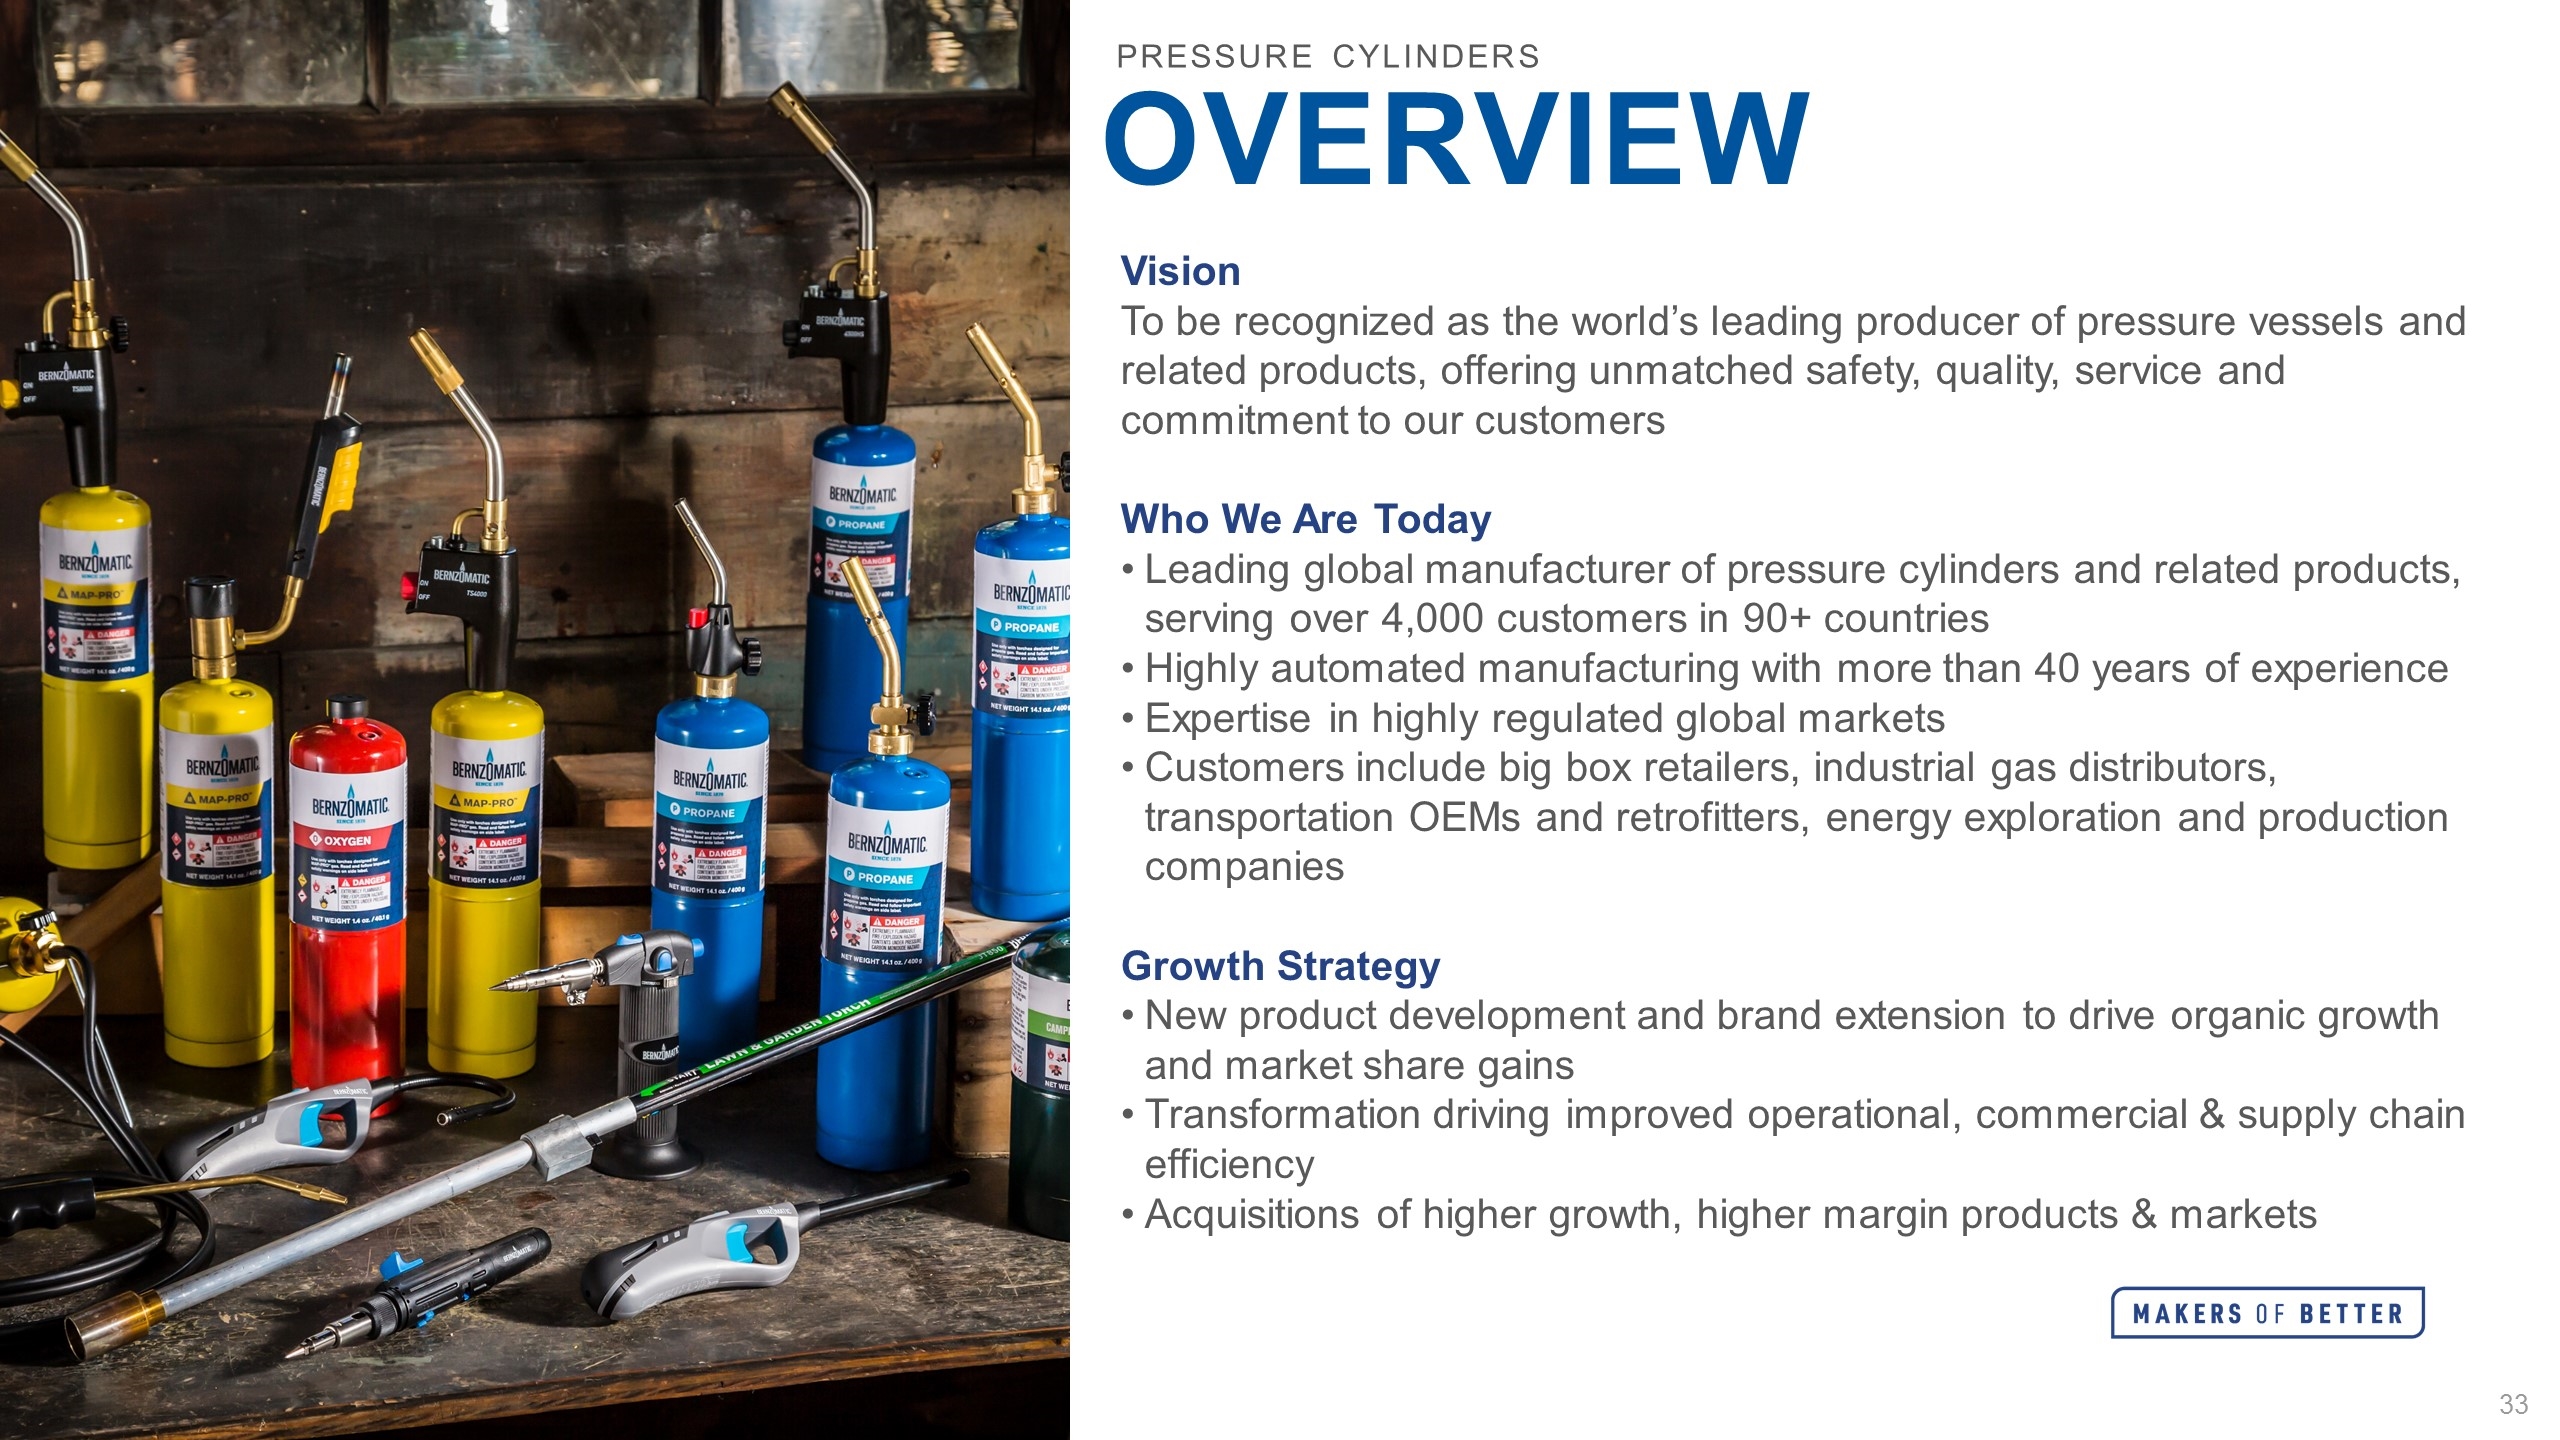
Vision To be recognized as the world’s leading producer of pressure vessels and related products, offering unmatched safety, quality, service and commitment to our customers Who We Are Today Leading global manufacturer of pressure cylinders and related products, serving over 4,000 customers in 90+ countries Highly automated manufacturing with more than 40 years of experience Expertise in highly regulated global markets Customers include big box retailers, industrial gas distributors, transportation OEMs and retrofitters, energy exploration and production companies Growth Strategy New product development and brand extension to drive organic growth and market share gains Transformation driving improved operational, commercial & supply chain efficiency Acquisitions of higher growth, higher margin products & markets OVERVIEW PRESSURE CYLINDERS
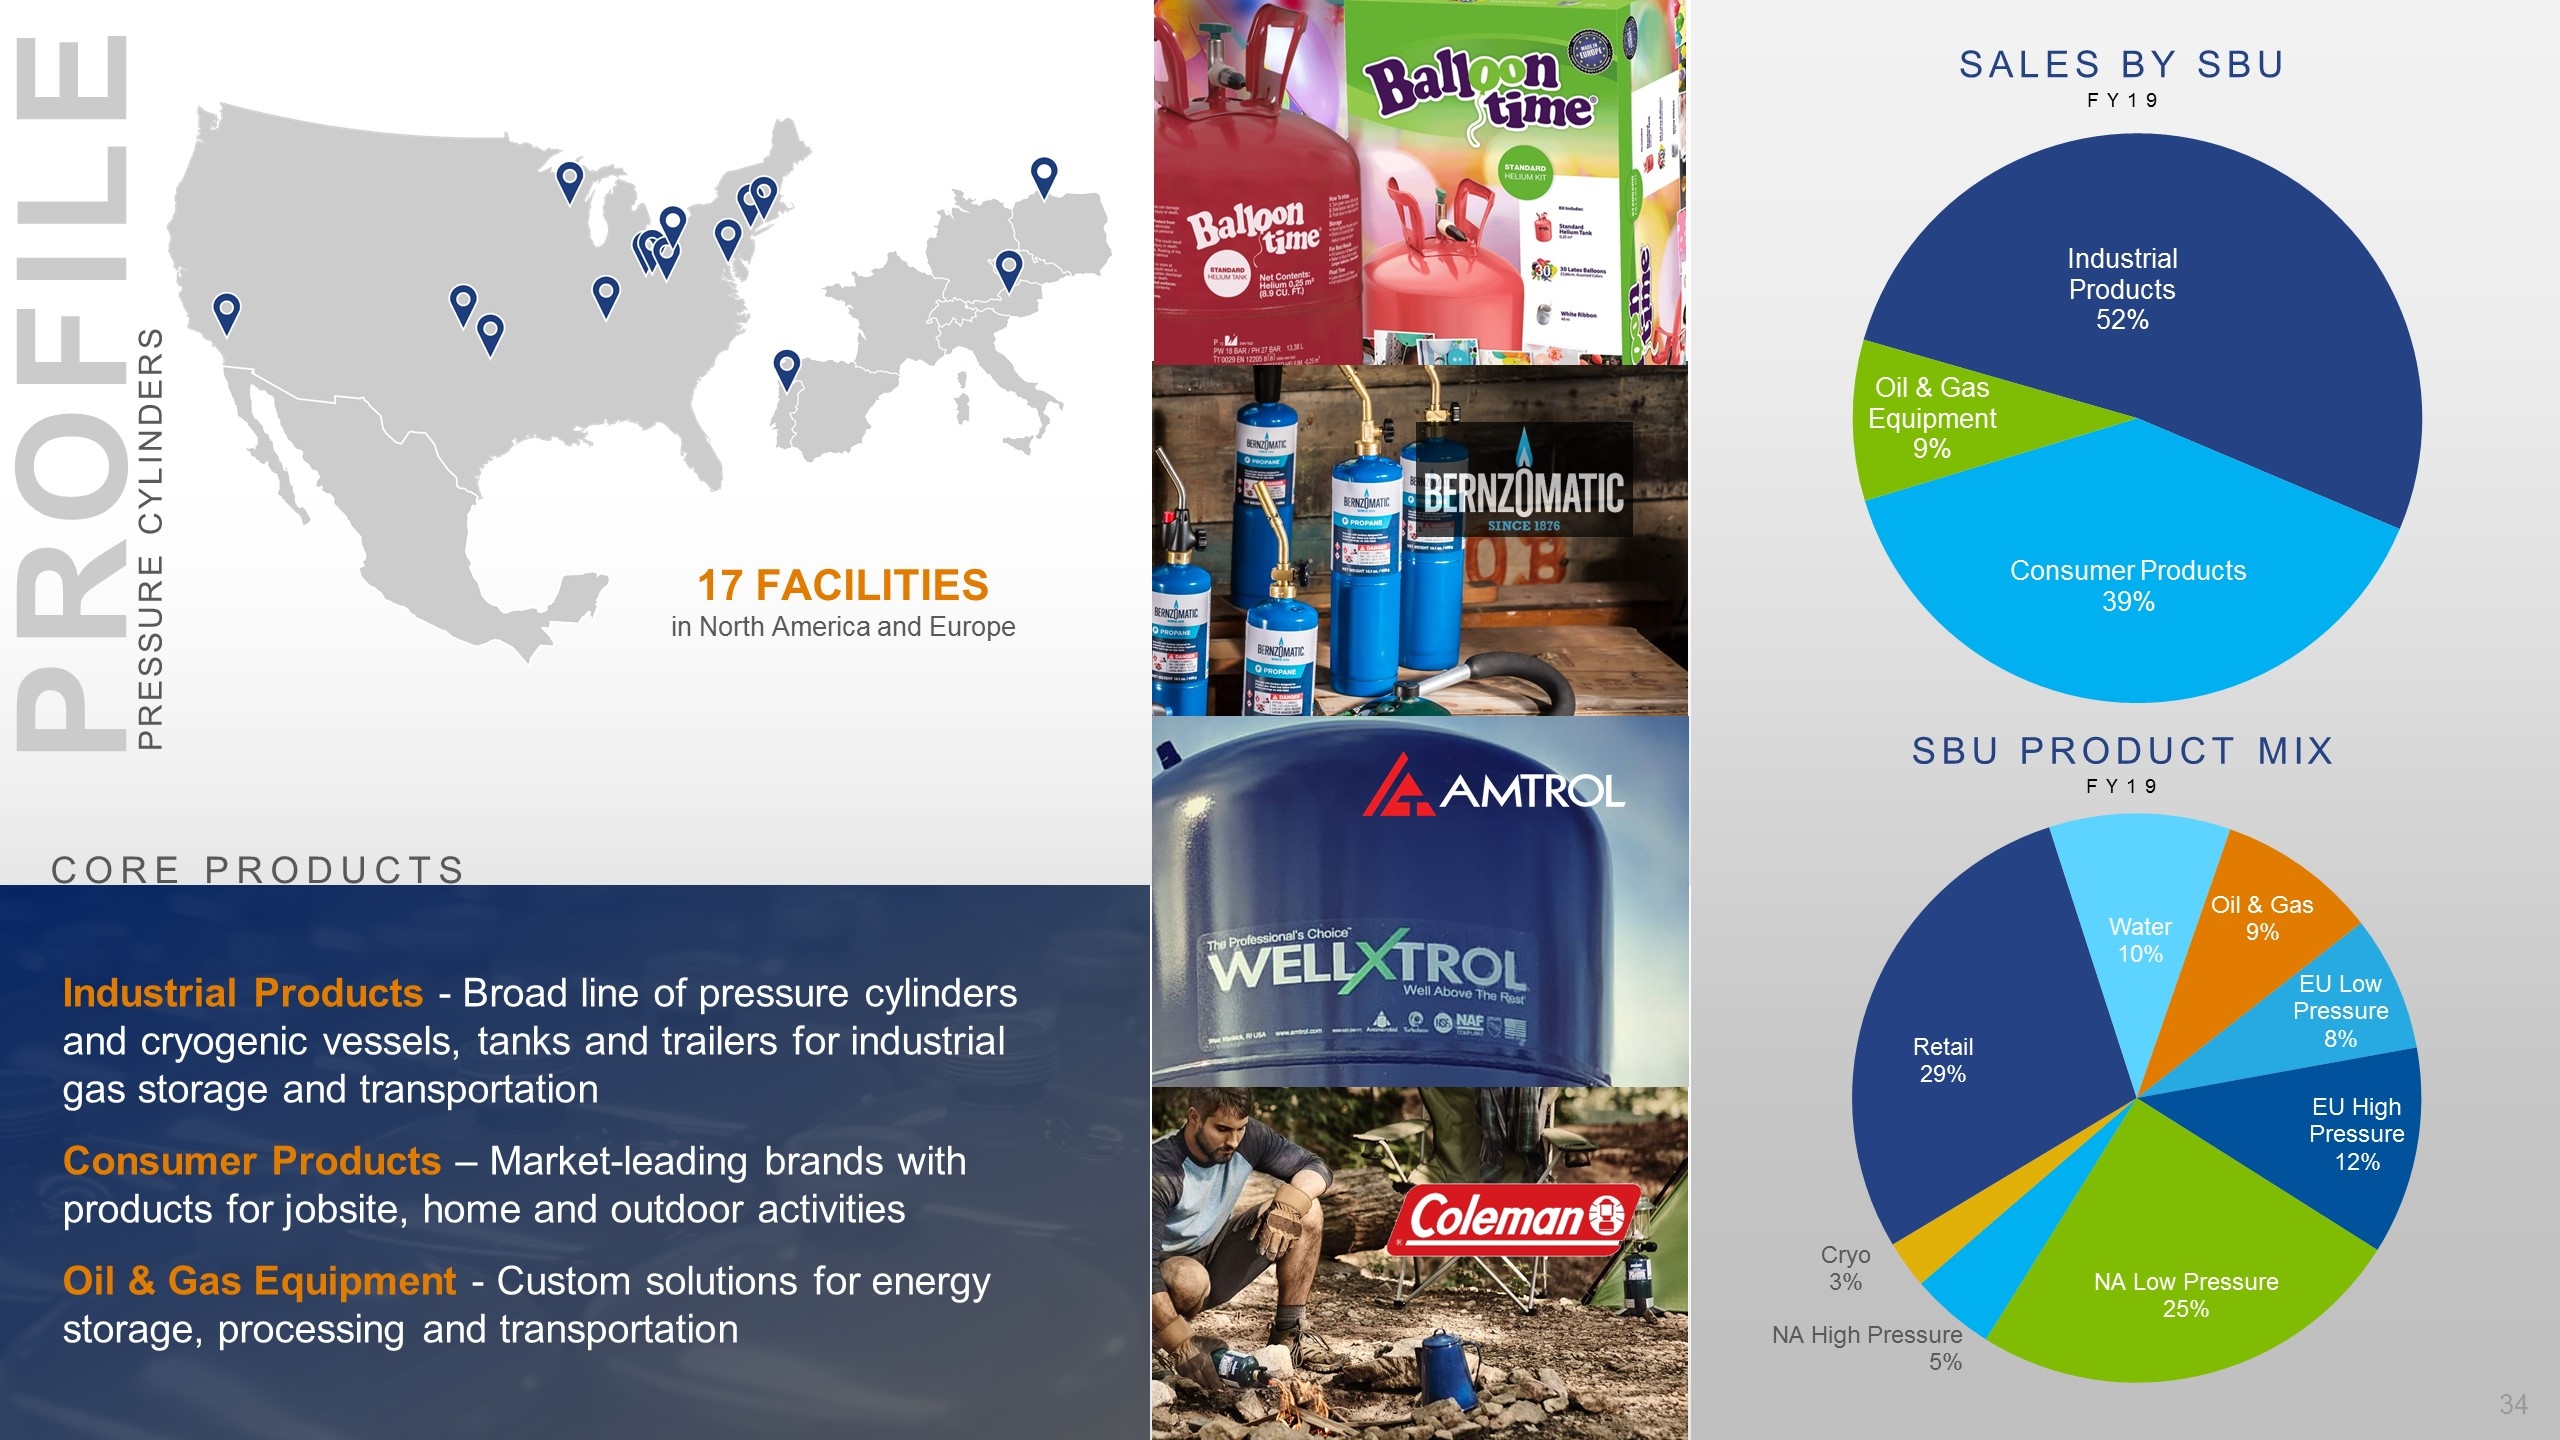
Profile Sales By SBU SBU Product Mix Industrial Products - Broad line of pressure cylinders and cryogenic vessels, tanks and trailers for industrial gas storage and transportation Consumer Products – Market-leading brands with products for jobsite, home and outdoor activities Oil & Gas Equipment - Custom solutions for energy storage, processing and transportation FY19 FY19 CORE PRODUCTS PRESSURE CYLINDERS 17 facilities in North America and Europe
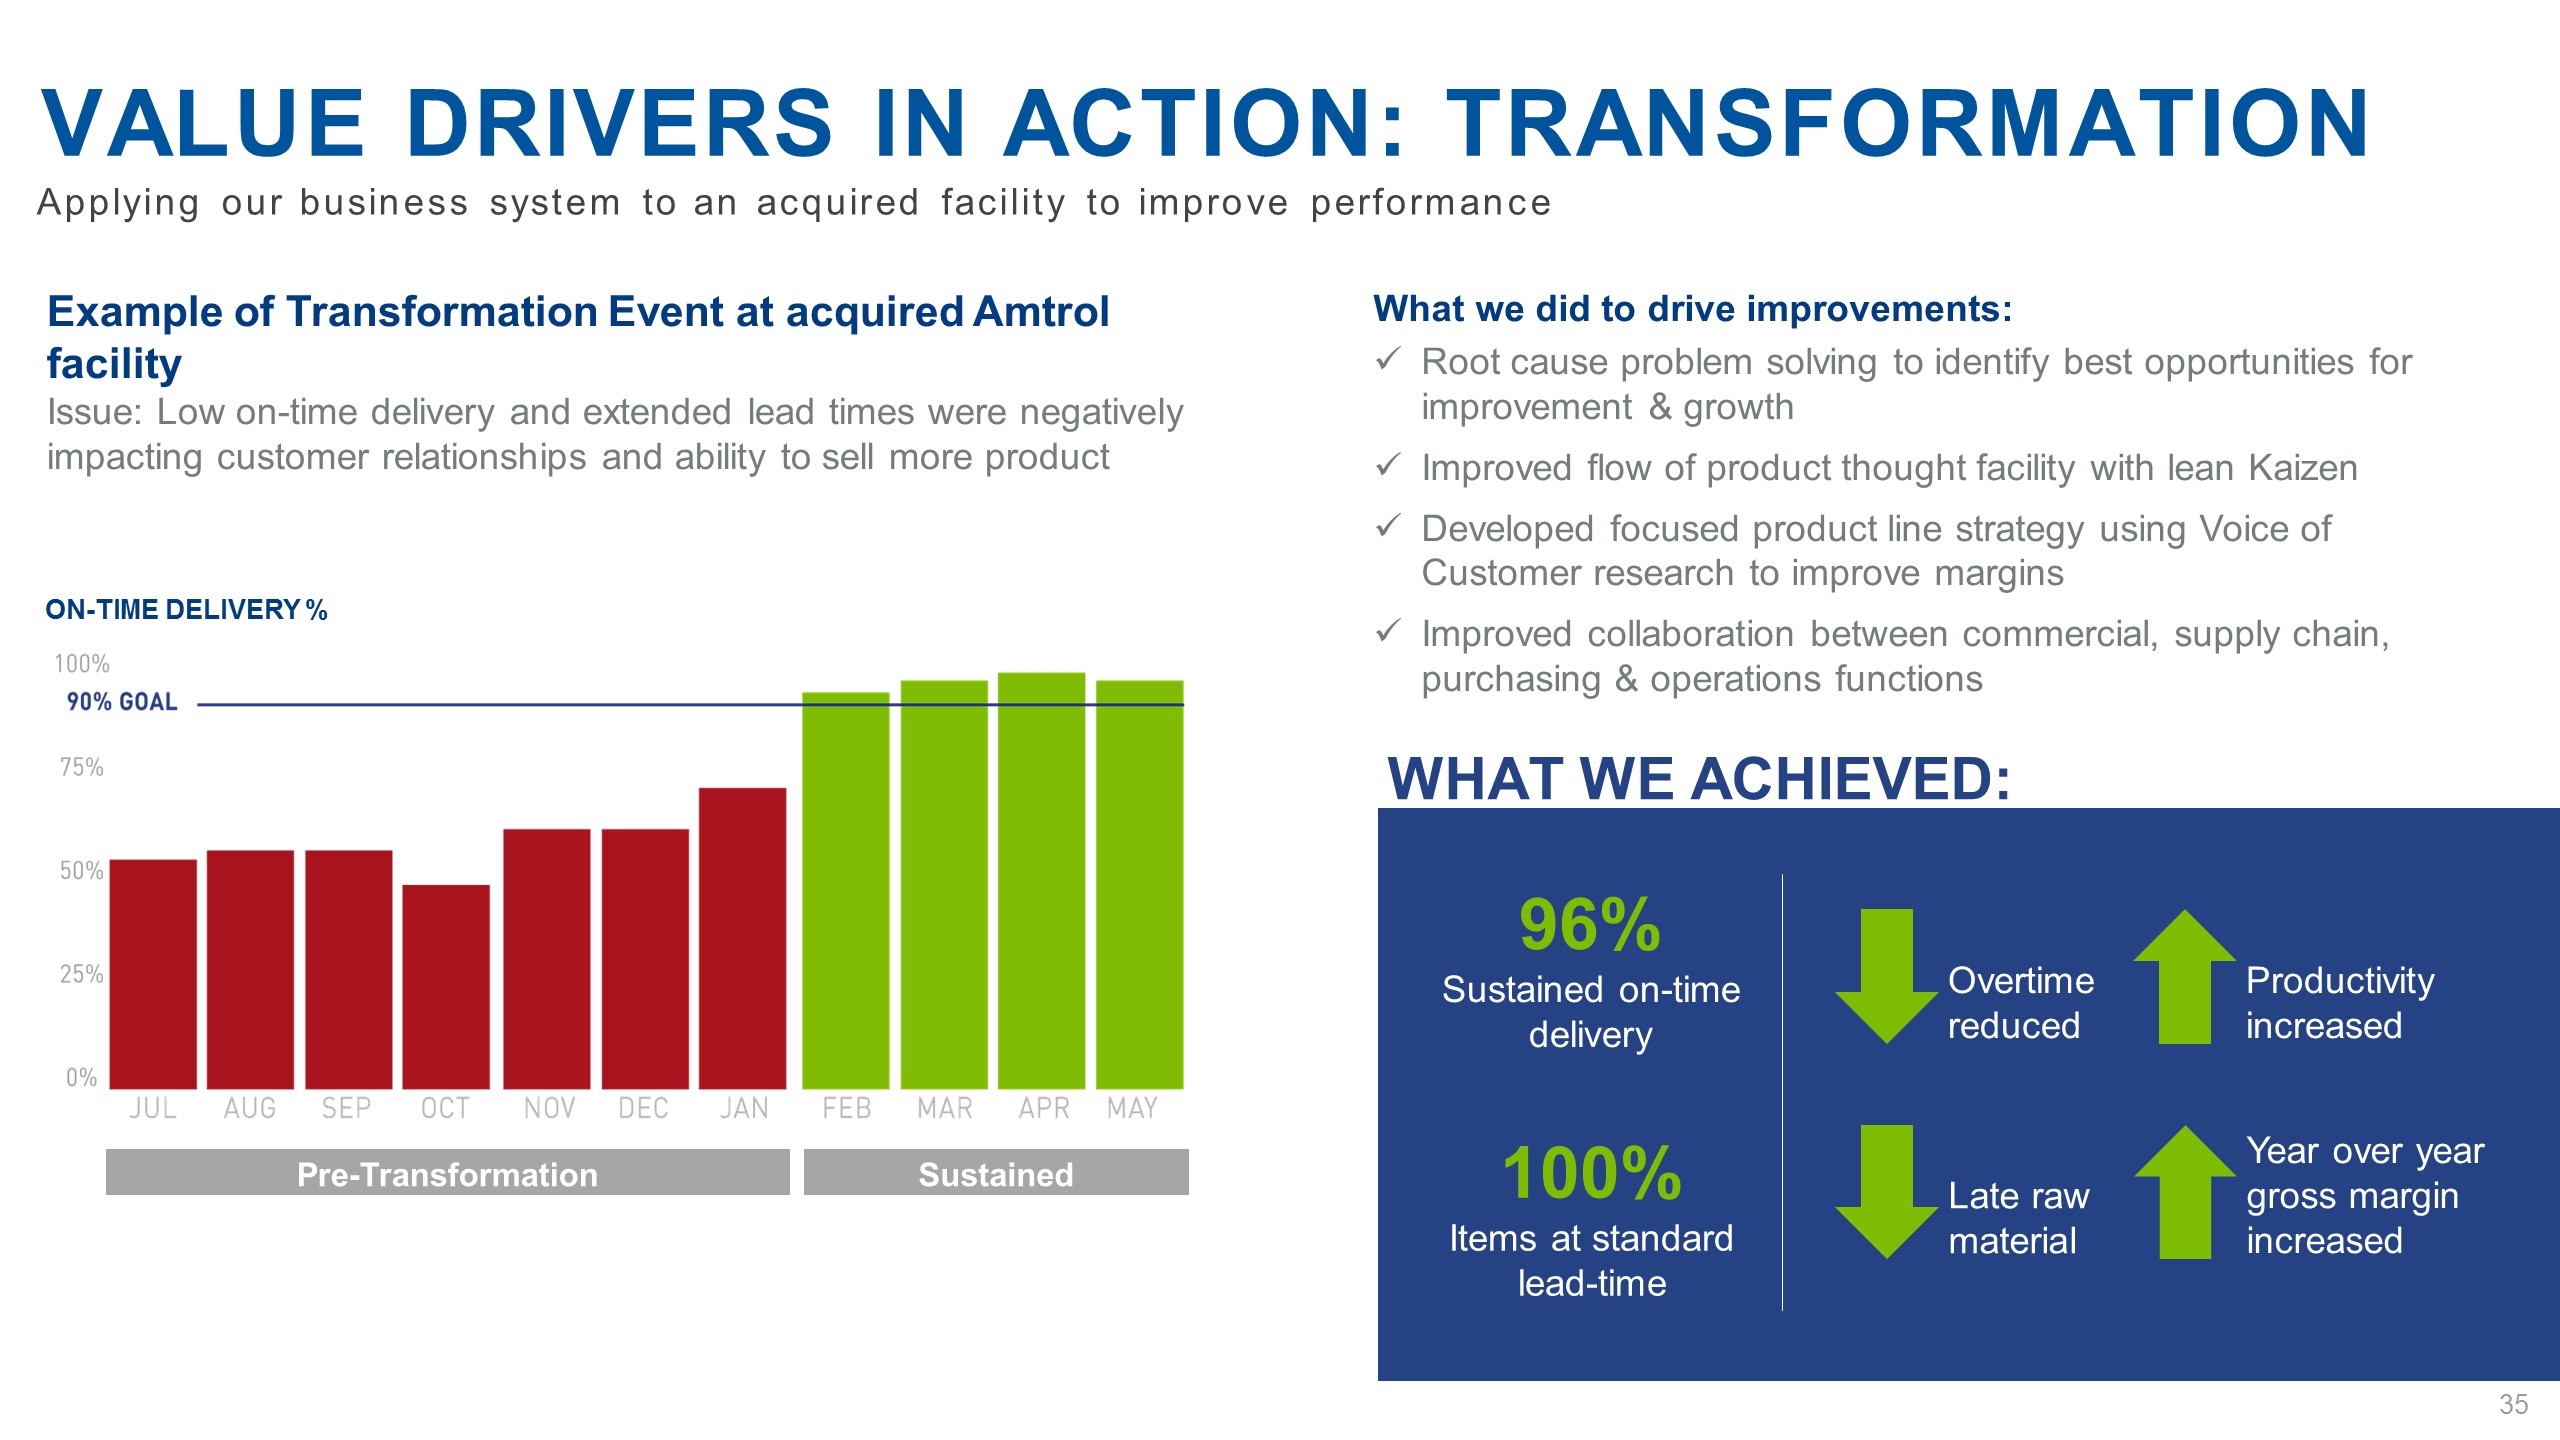
Value drivers in action: Transformation Applying our business system to an acquired facility to improve performance Example of Transformation Event at acquired Amtrol facility Issue: Low on-time delivery and extended lead times were negatively impacting customer relationships and ability to sell more product Pre-Transformation Sustained Improvements On-Time Delivery % What we did to drive improvements: Root cause problem solving to identify best opportunities for improvement & growth Improved flow of product thought facility with lean Kaizen Developed focused product line strategy using Voice of Customer research to improve margins Improved collaboration between commercial, supply chain, purchasing & operations functions 96% Sustained on-time delivery What we achieved: 100% Items at standard lead-time Overtime reduced Productivity increased Late raw material Year over year gross margin increased
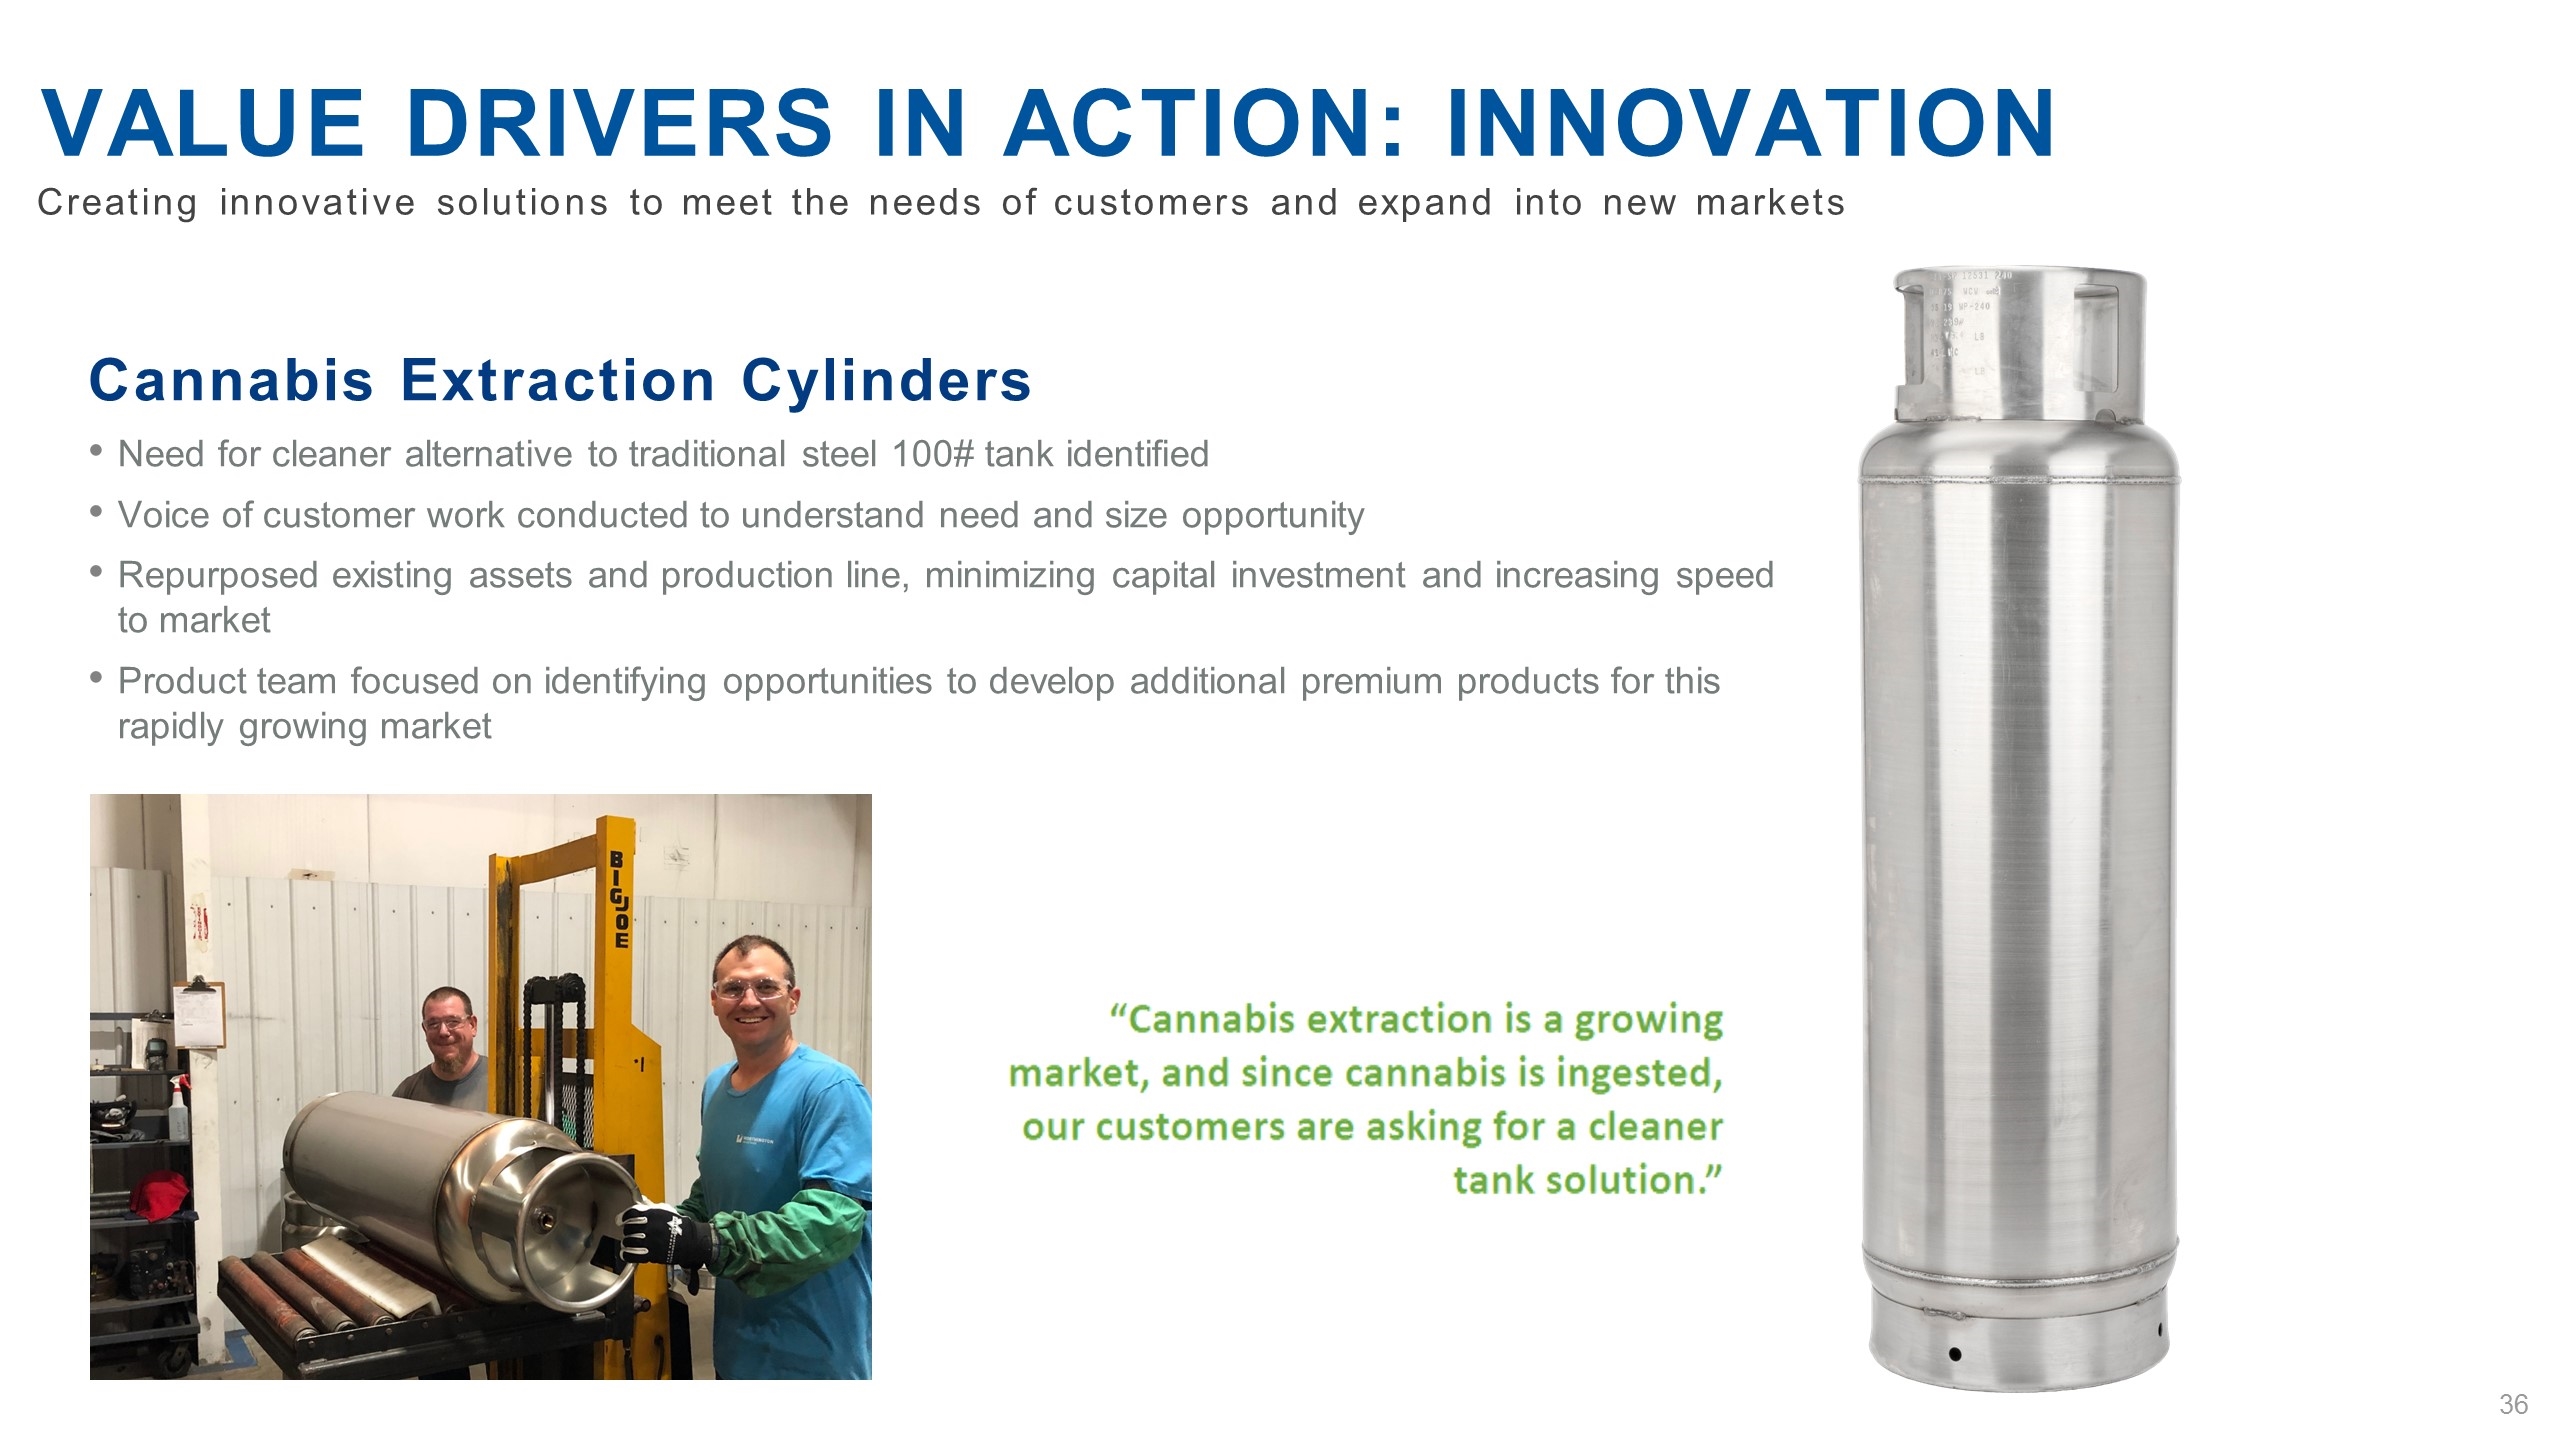
Creating innovative solutions to meet the needs of customers and expand into new markets Value drivers in action: innovation Cannabis Extraction Cylinders Need for cleaner alternative to traditional steel 100# tank identified Voice of customer work conducted to understand need and size opportunity Repurposed existing assets and production line, minimizing capital investment and increasing speed to market Product team focused on identifying opportunities to develop additional premium products for this rapidly growing market
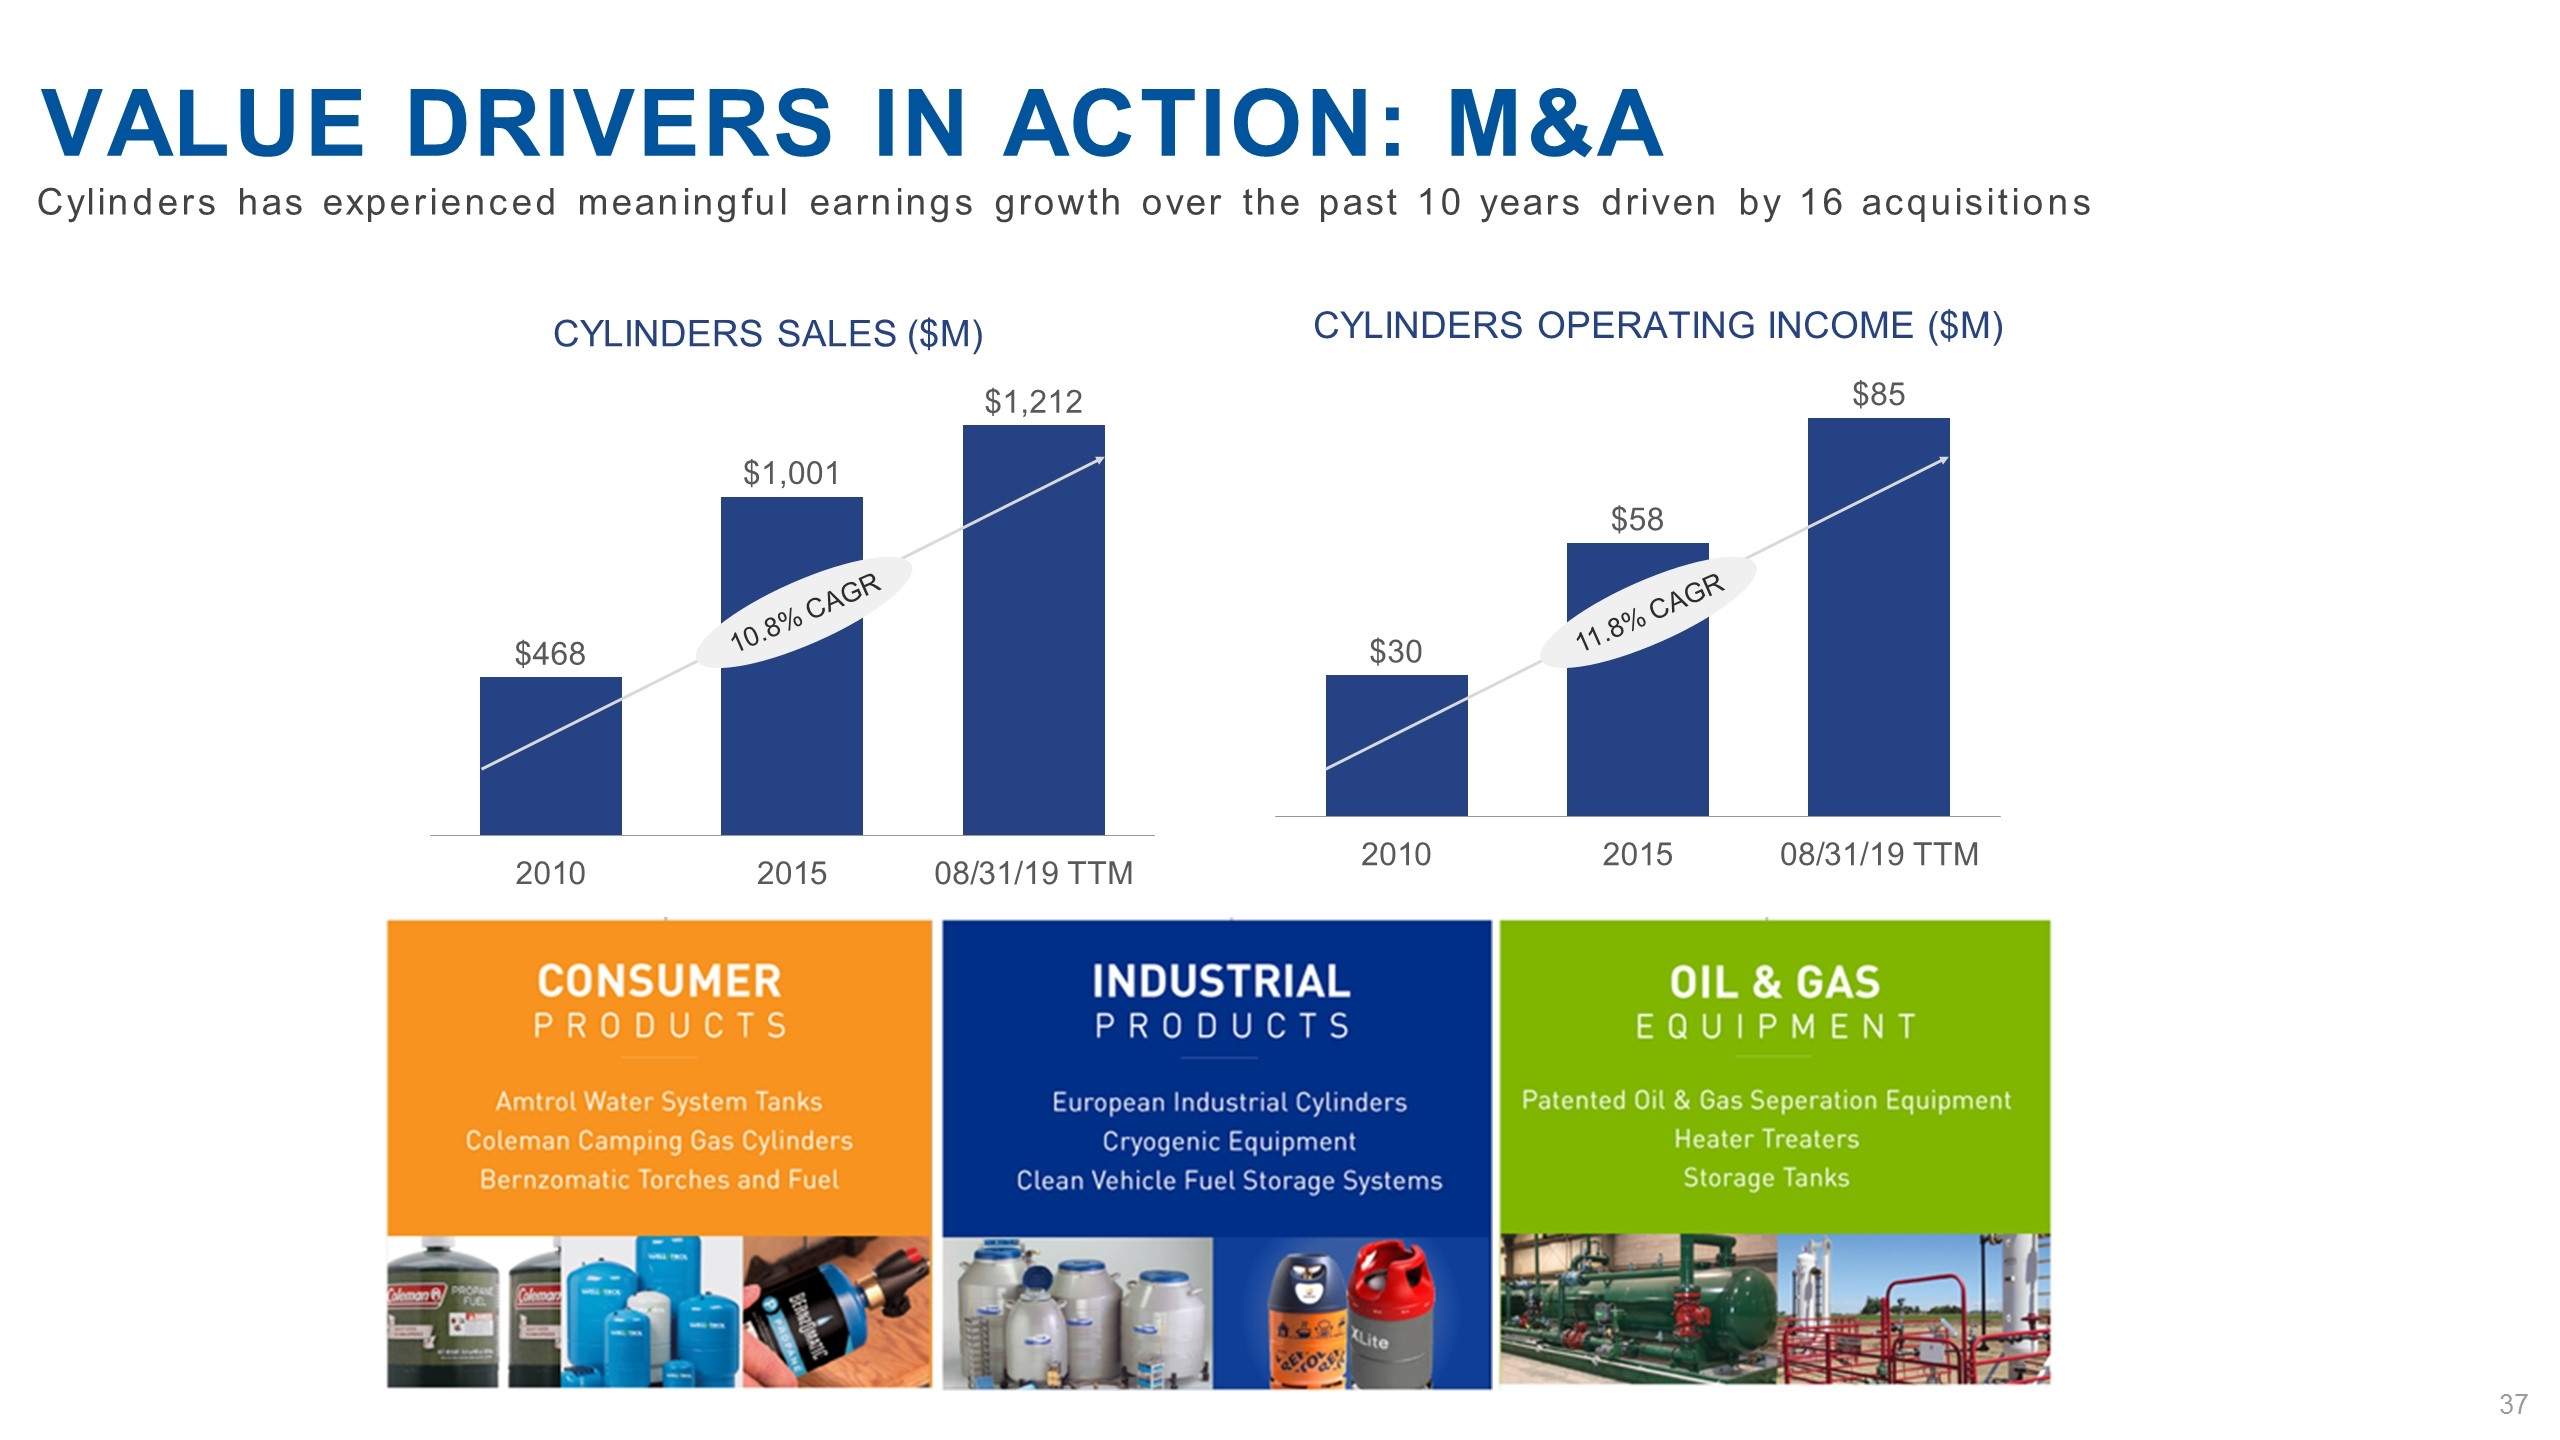
Cylinders has experienced meaningful earnings growth over the past 10 years driven by 16 acquisitions Value drivers in action: m&a Cylinders Sales ($M) 10.8% CAGR Cylinders Operating income ($M) 11.8% CAGR
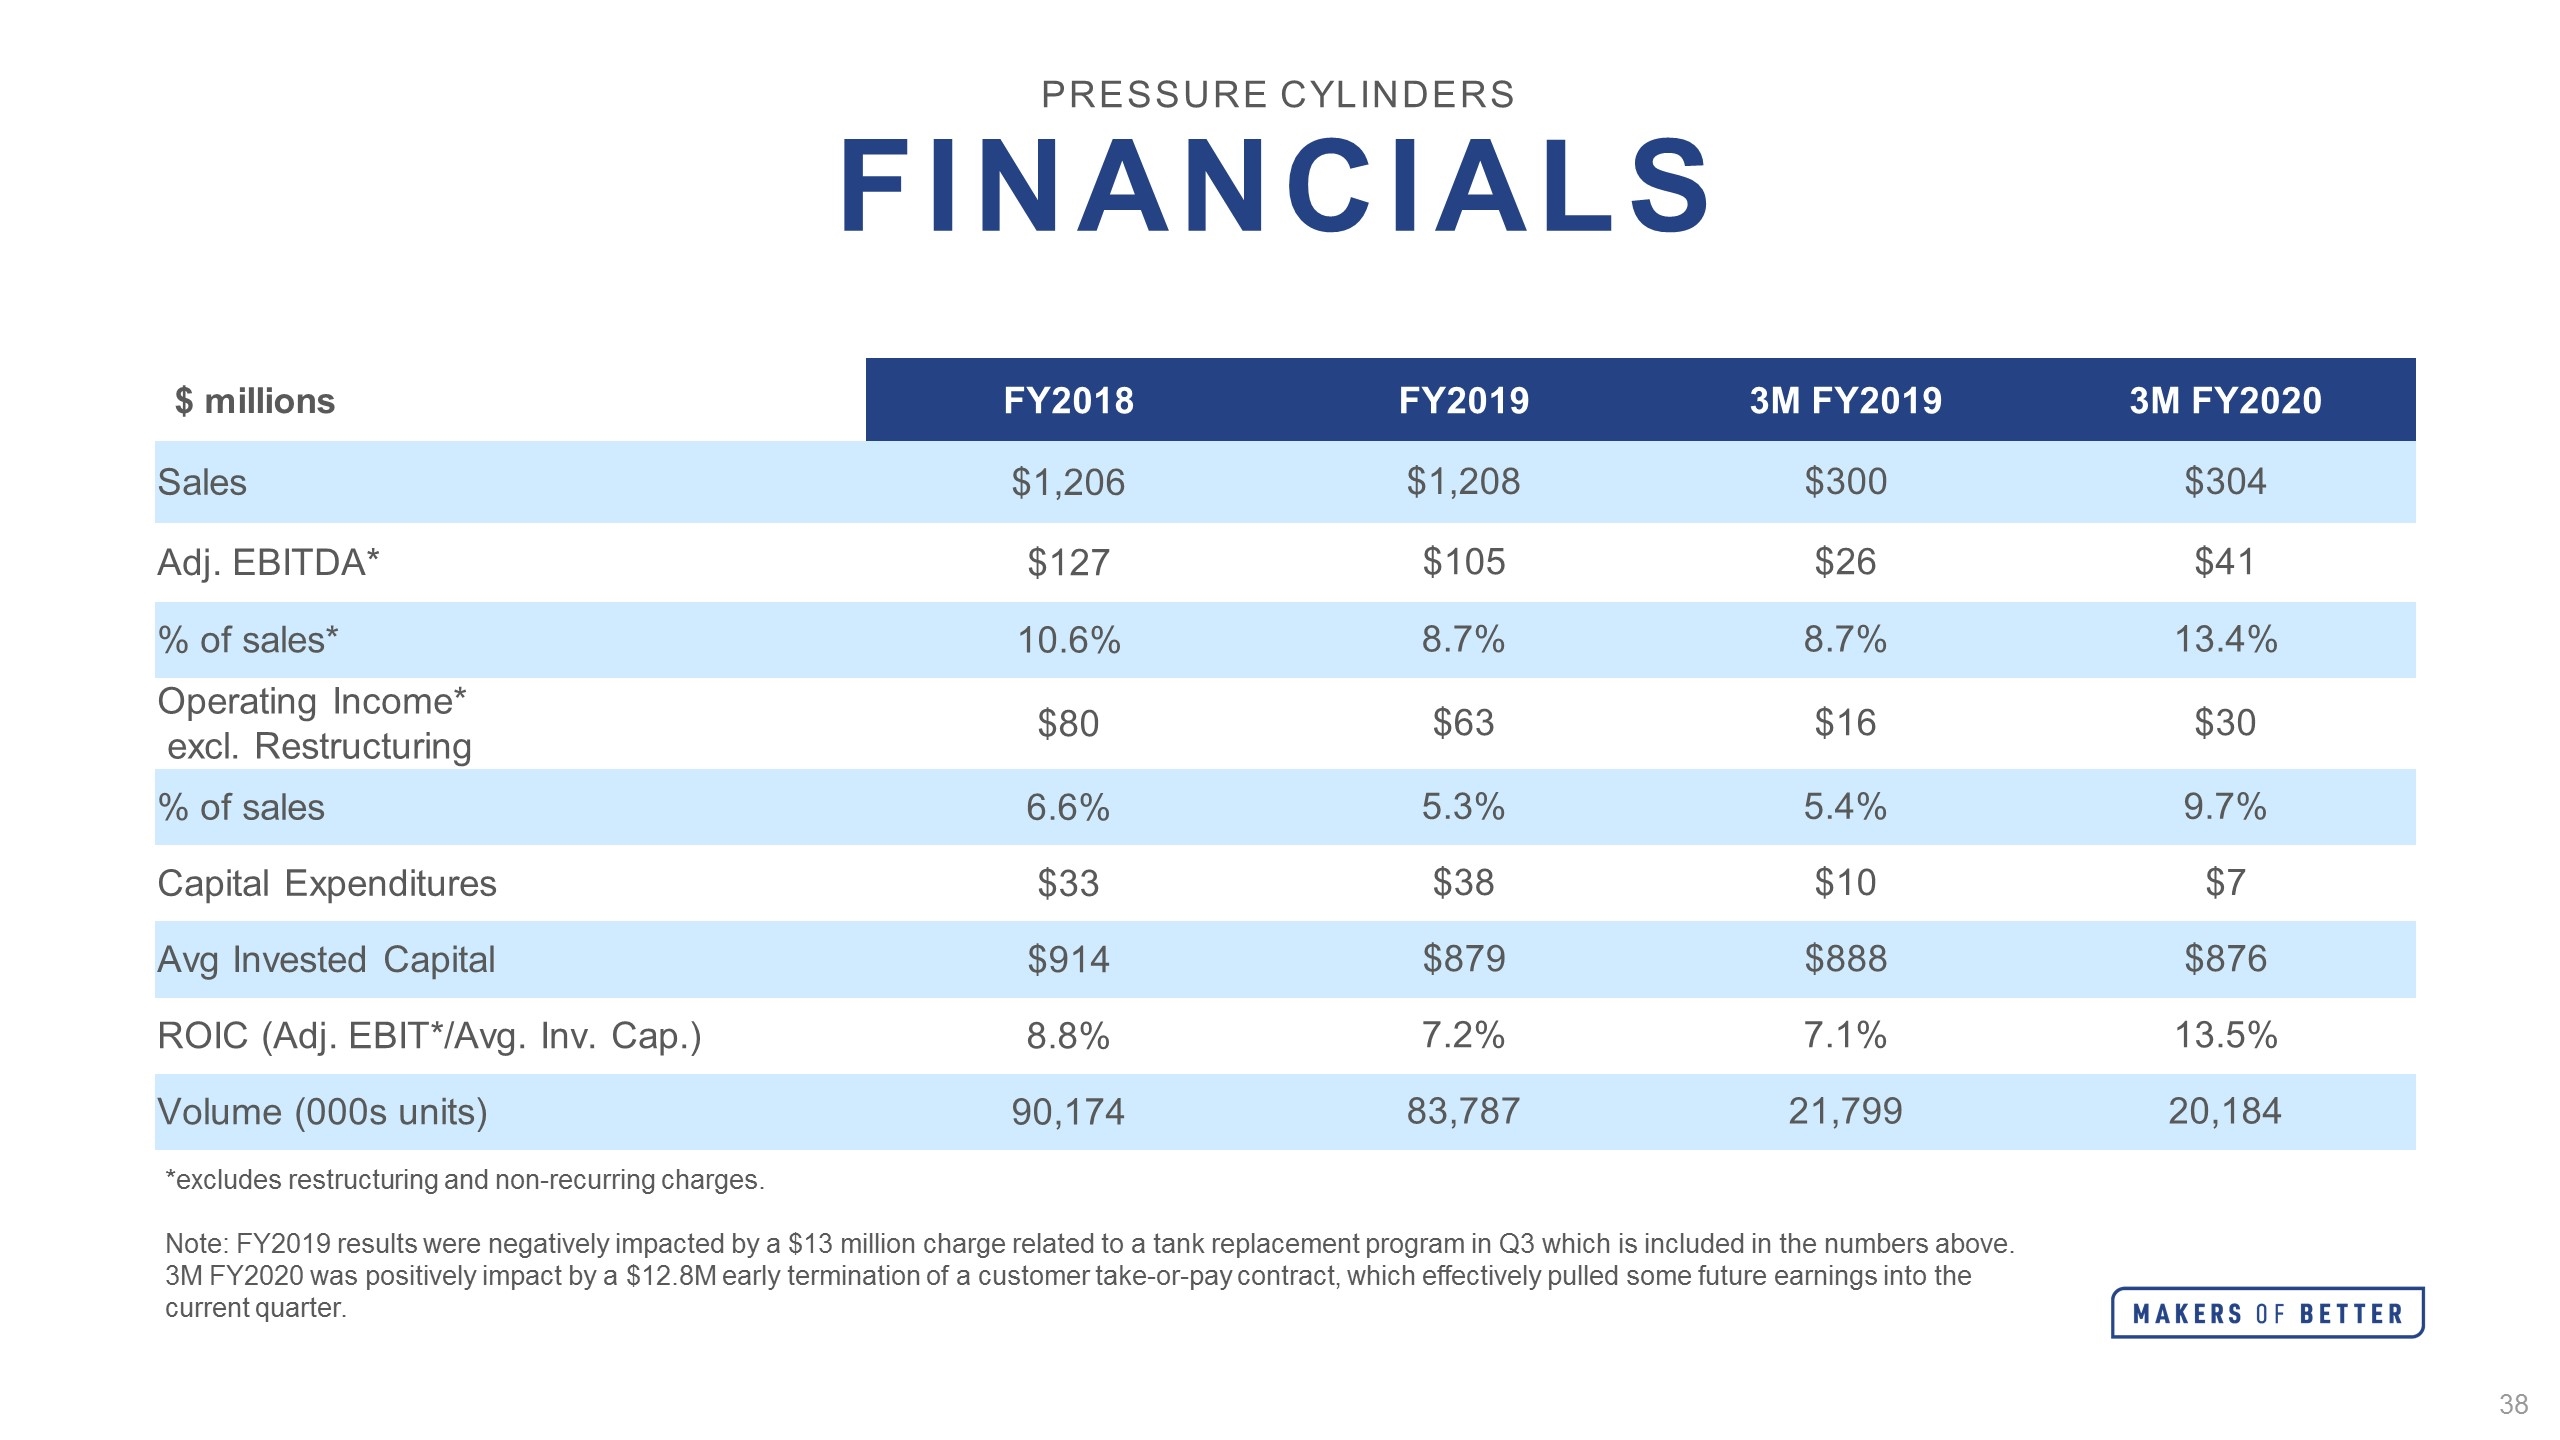
Pressure Cylinders Financials $ millions FY2018 FY2019 3M FY2019 3M FY2020 Sales $1,206 $1,208 $300 $304 Adj. EBITDA* $127 $105 $26 $41 % of sales* 10.6% 8.7% 8.7% 13.4% Operating Income* excl. Restructuring $80 $63 $16 $30 % of sales 6.6% 5.3% 5.4% 9.7% Capital Expenditures $33 $38 $10 $7 Avg Invested Capital $914 $879 $888 $876 ROIC (Adj. EBIT*/Avg. Inv. Cap.) 8.8% 7.2% 7.1% 13.5% Volume (000s units) 90,174 83,787 21,799 20,184 *excludes restructuring and non-recurring charges. Note: FY2019 results were negatively impacted by a $13 million charge related to a tank replacement program in Q3 which is included in the numbers above. 3M FY2020 was positively impact by a $12.8M early termination of a customer take-or-pay contract, which effectively pulled some future earnings into the current quarter.

BREAK
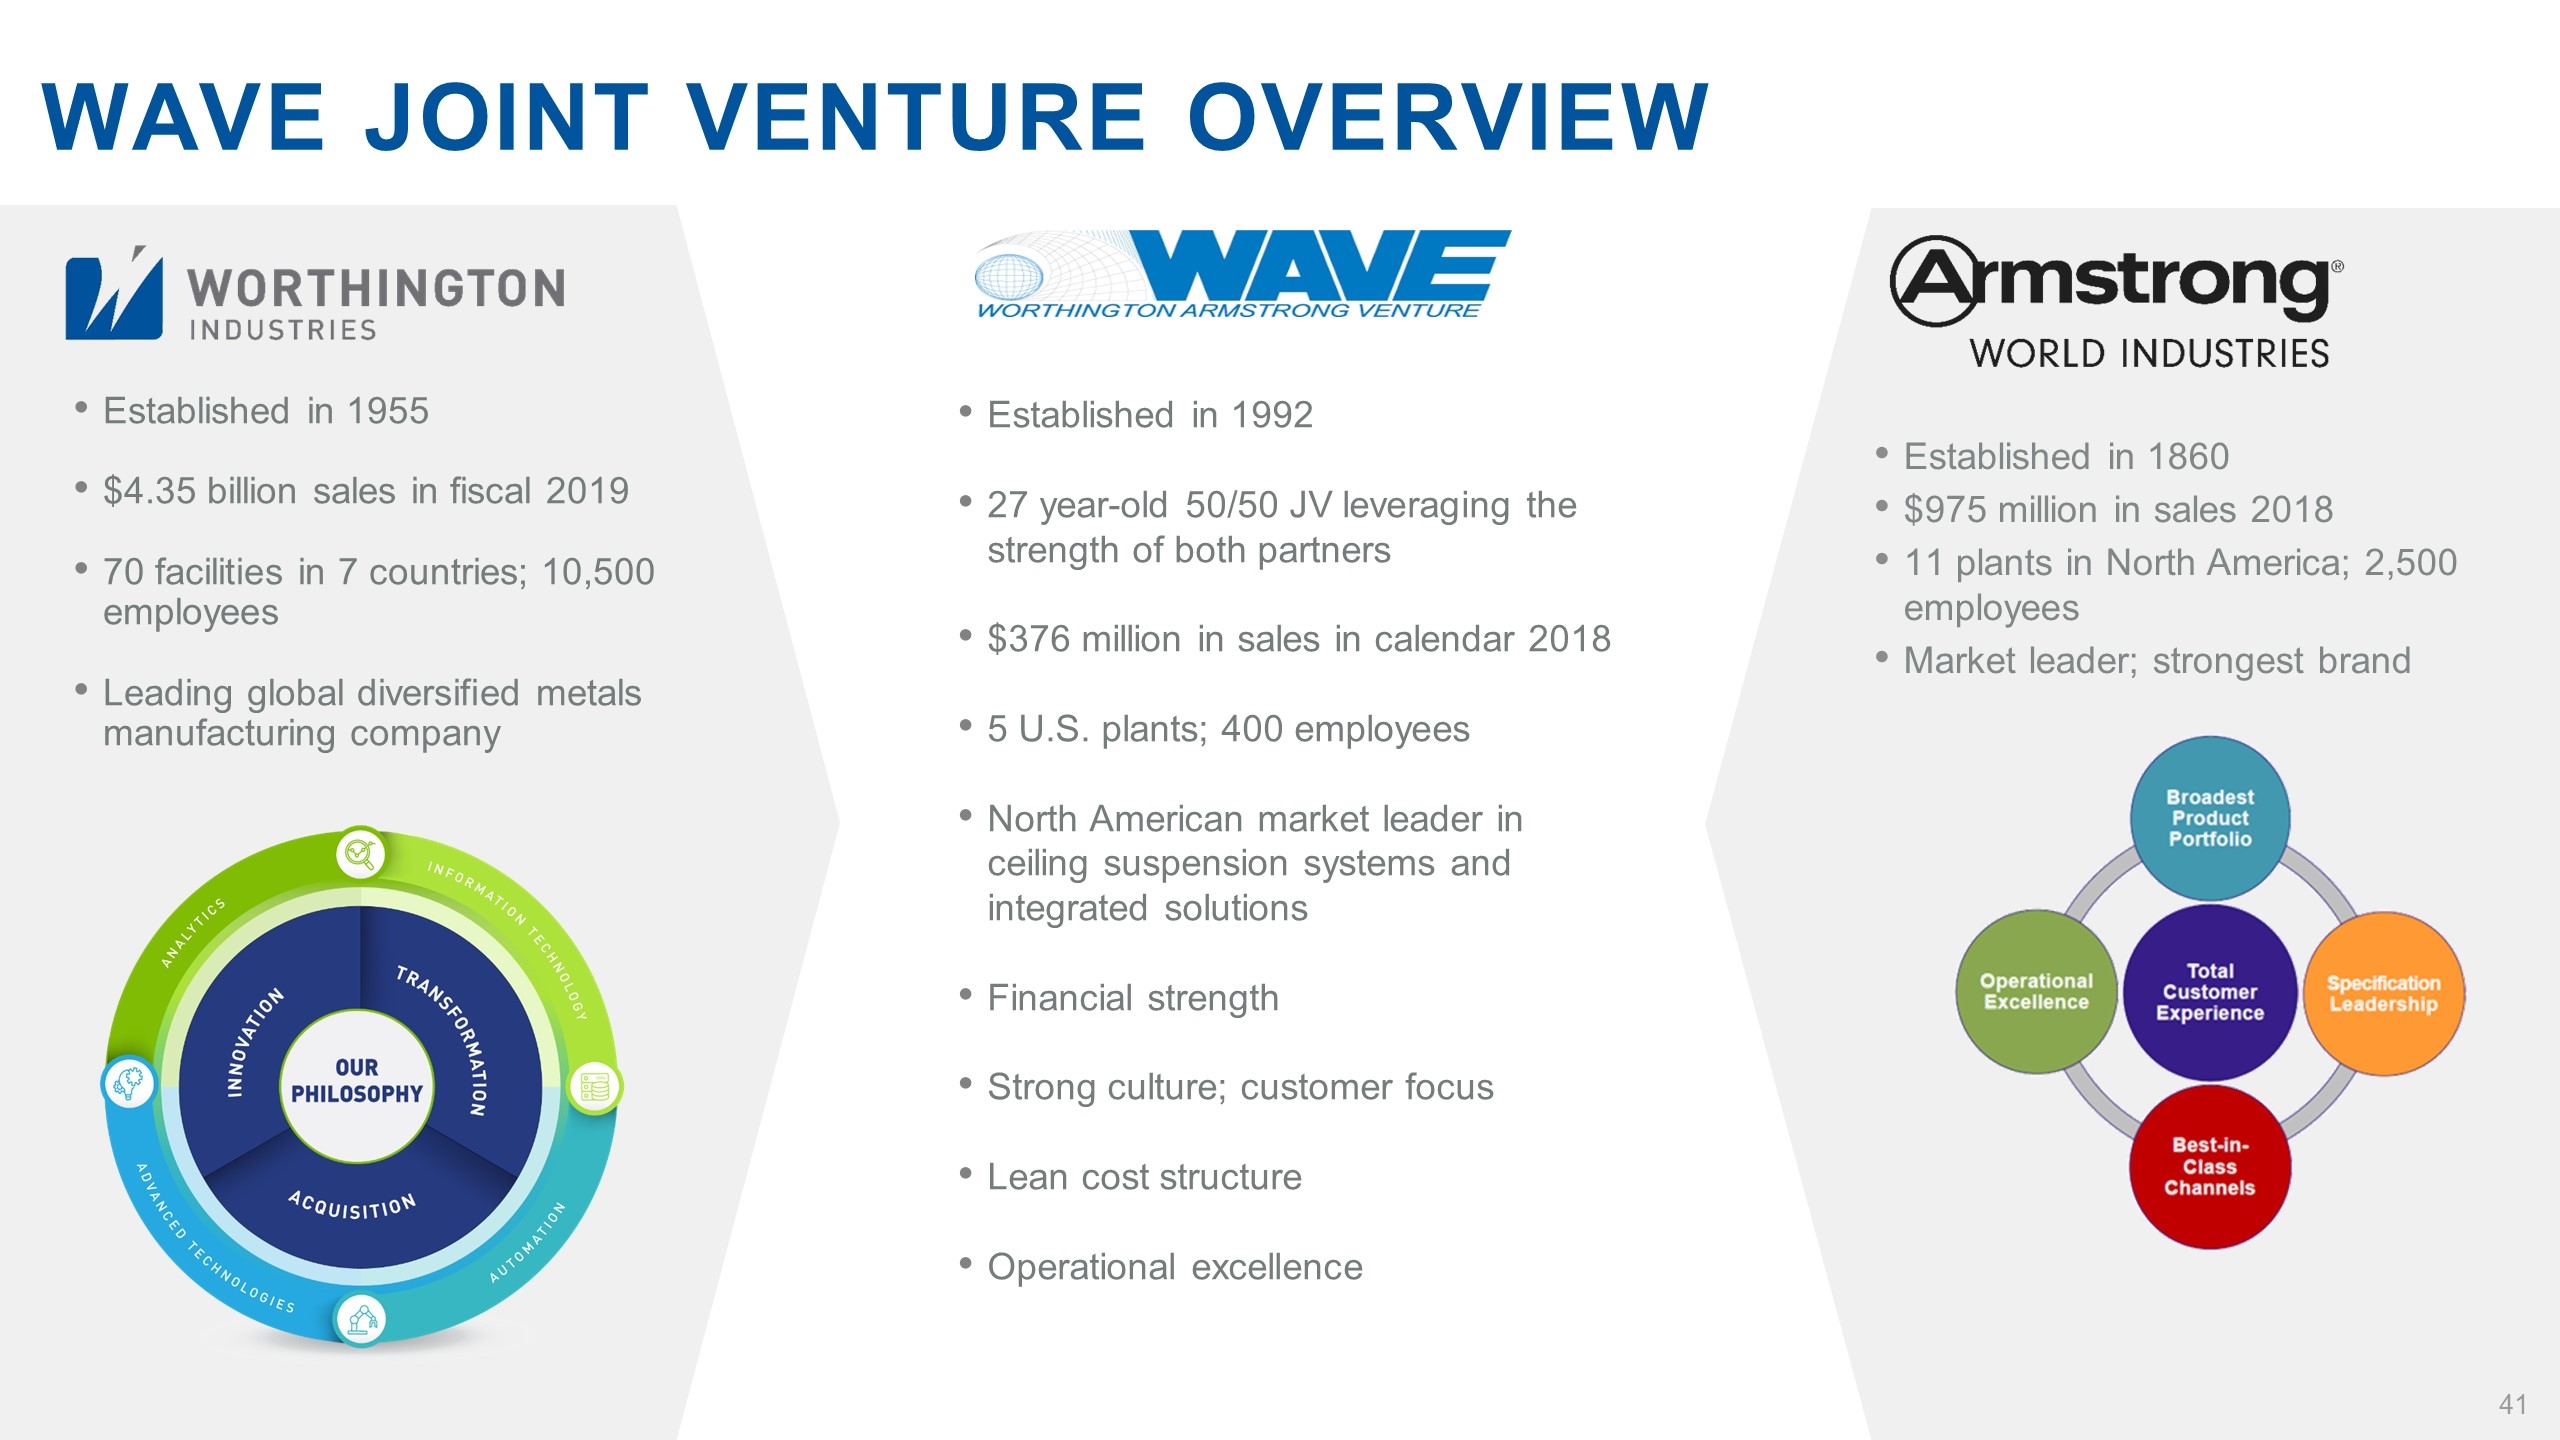
Established in 1860 $975 million in sales 2018 11 plants in North America; 2,500 employees Market leader; strongest brand Established in 1955 $4.35 billion sales in fiscal 2019 70 facilities in 7 countries; 10,500 employees Leading global diversified metals manufacturing company WAVE Joint Venture Overview Established in 1992 27 year-old 50/50 JV leveraging the strength of both partners $376 million in sales in calendar 2018 5 U.S. plants; 400 employees North American market leader in ceiling suspension systems and integrated solutions Financial strength Strong culture; customer focus Lean cost structure Operational excellence
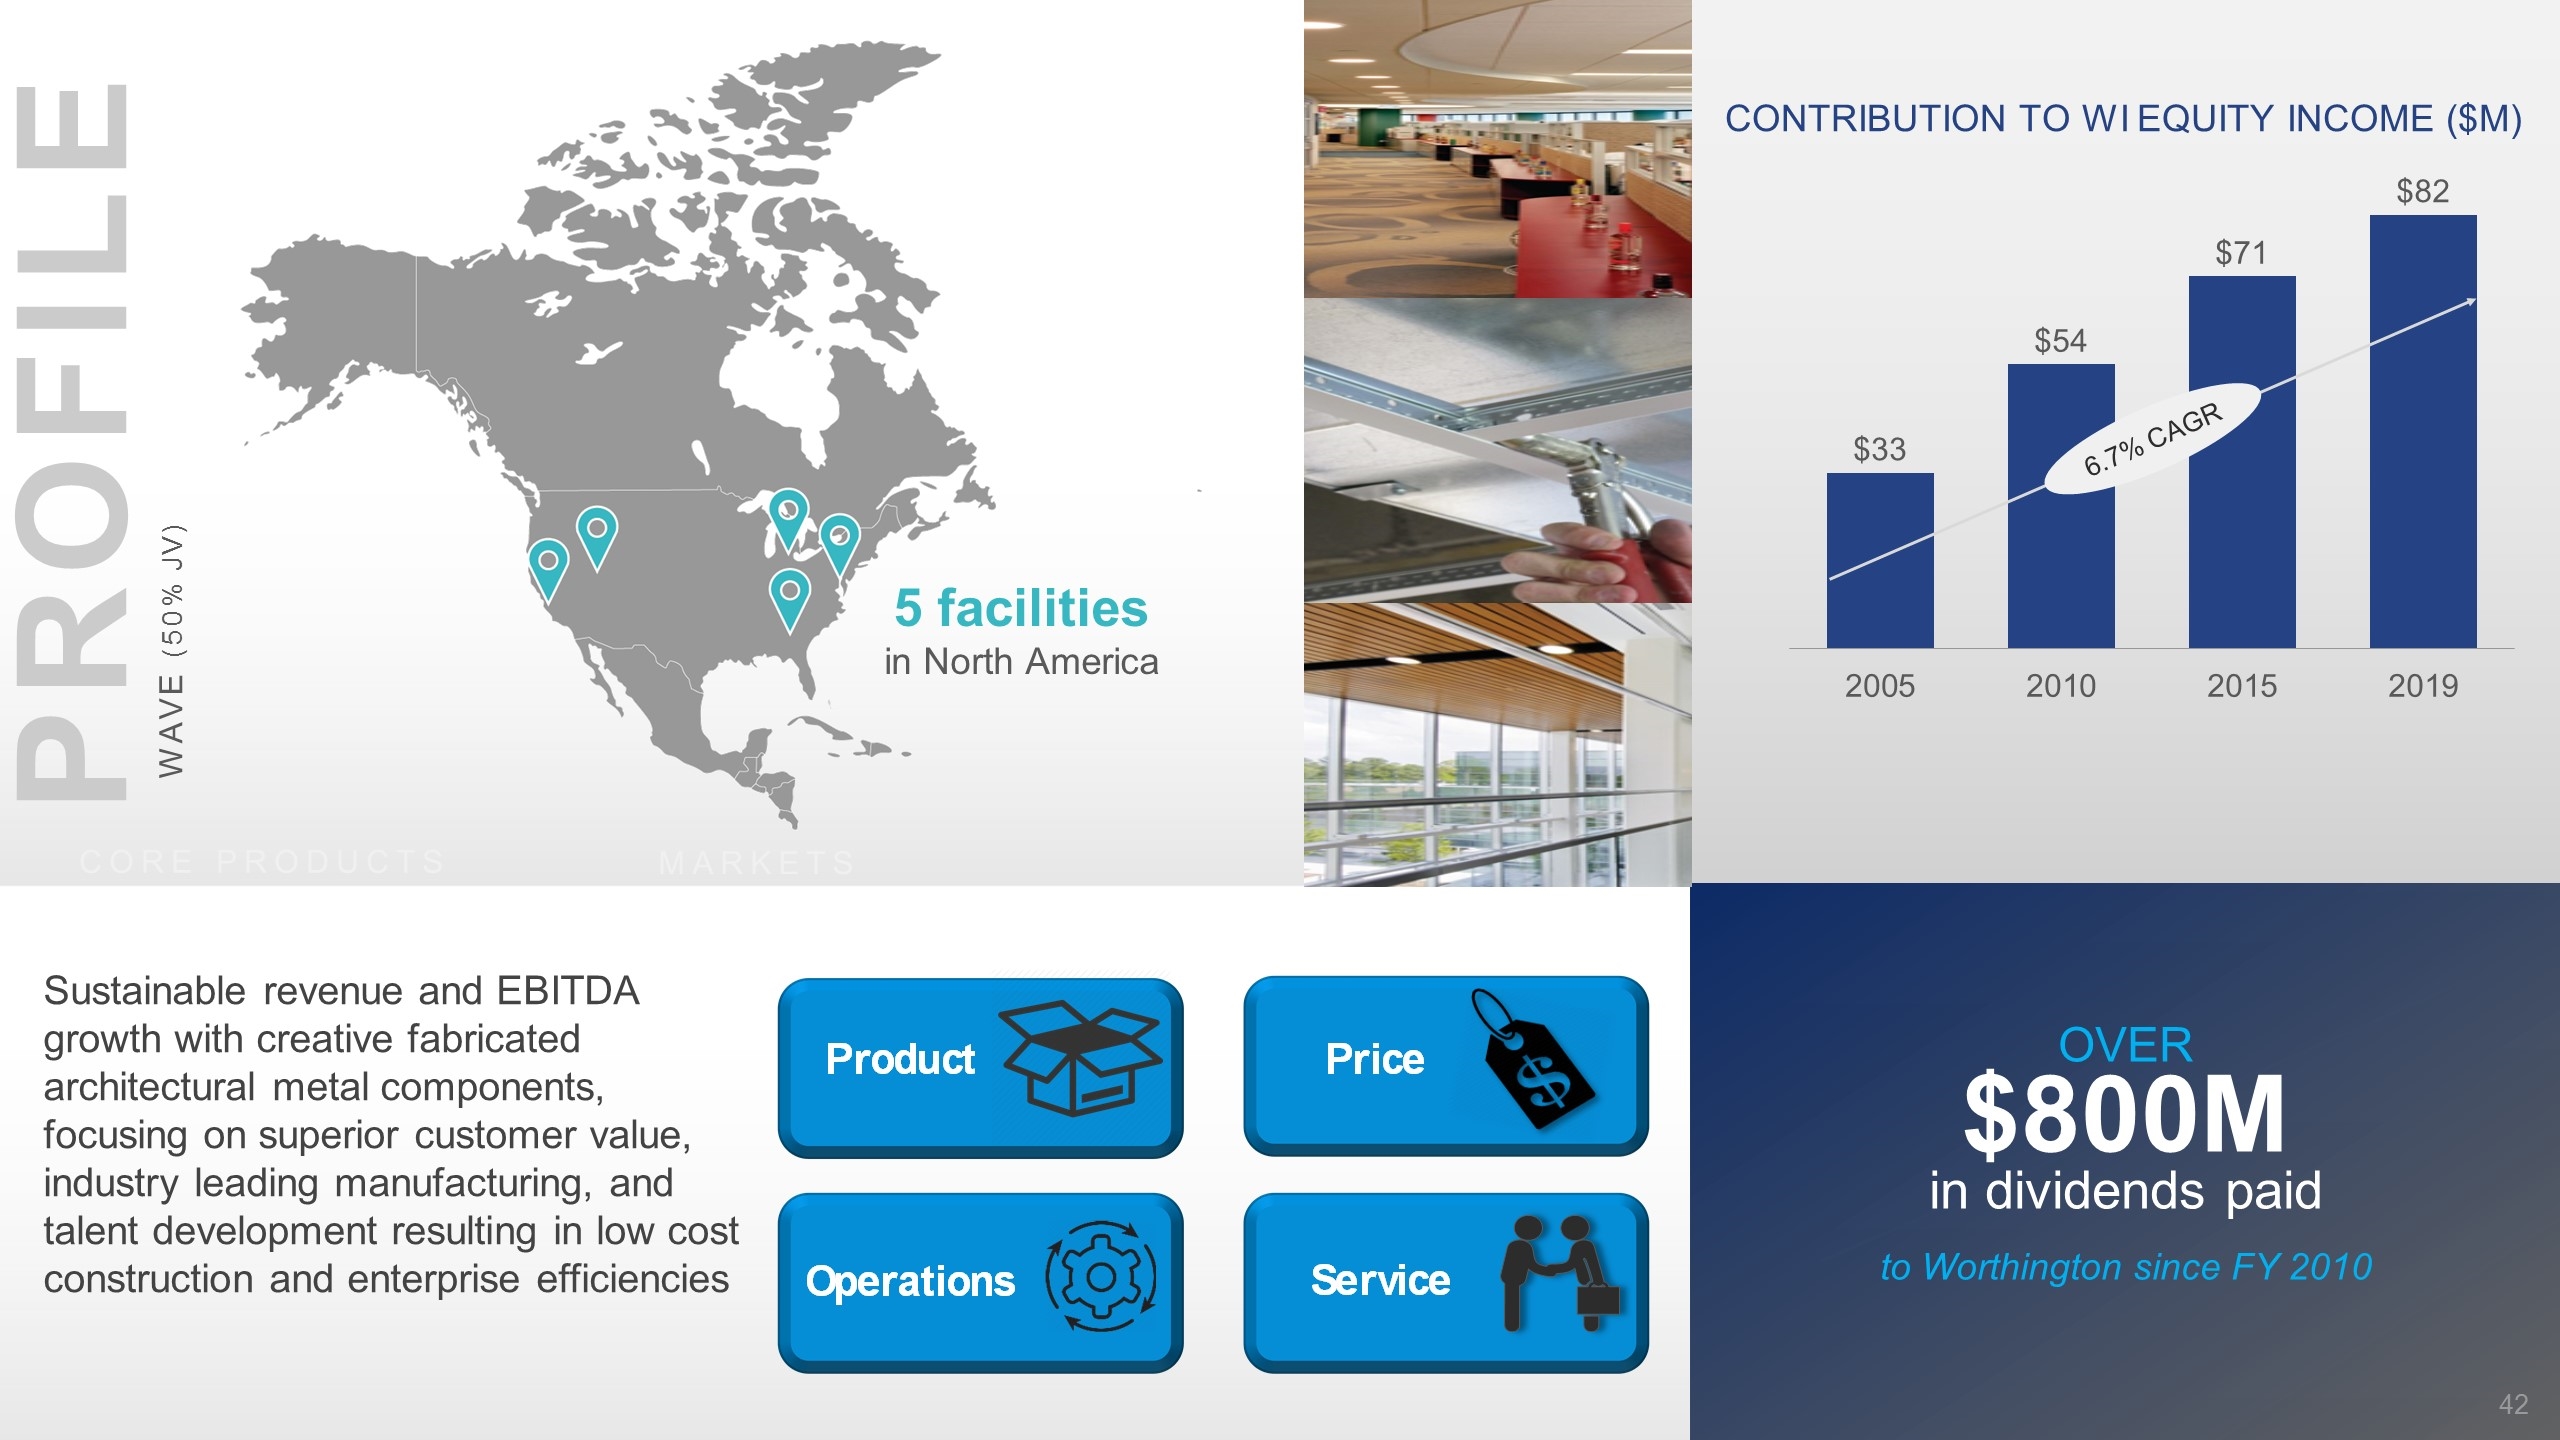
Profile Contribution to WI Equity Income ($M) MARKETS CORE PRODUCTS 6.7% CAGR Sustainable revenue and EBITDA growth with creative fabricated architectural metal components, focusing on superior customer value, industry leading manufacturing, and talent development resulting in low cost construction and enterprise efficiencies 5 facilities in North America Over $800M in dividends paid to Worthington since FY 2010 WAVE (50% JV)
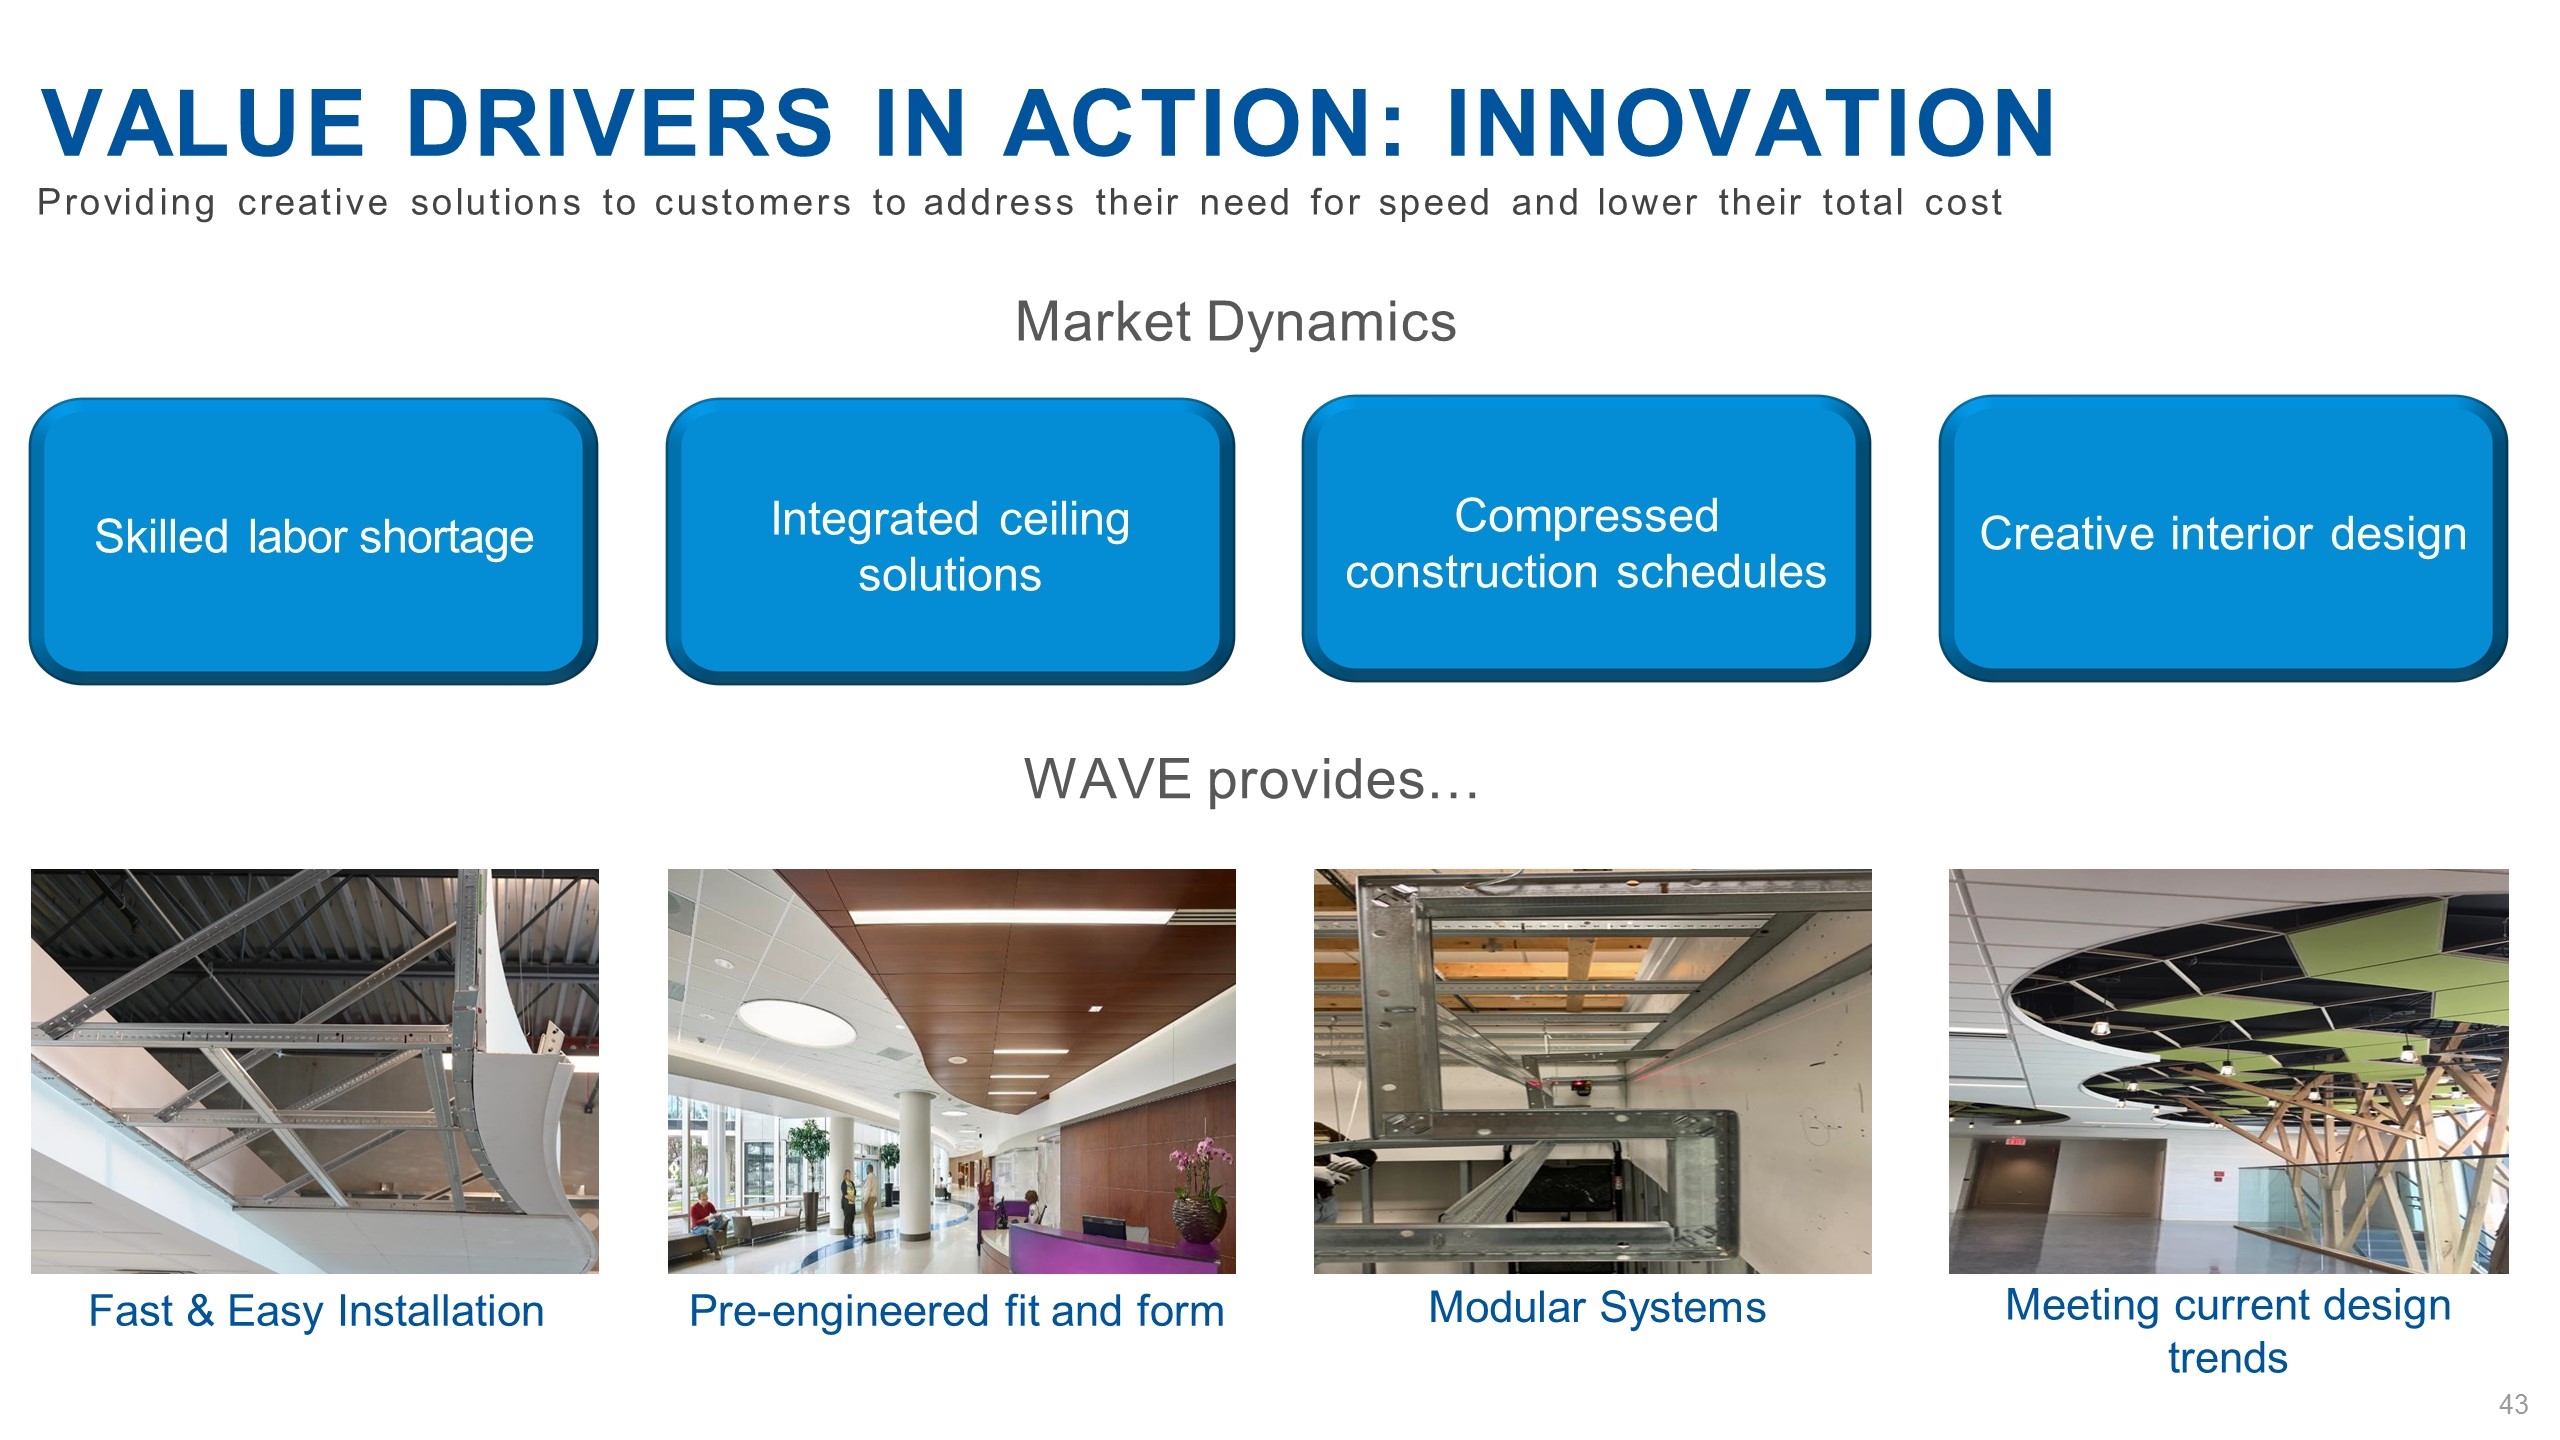
Meeting current design trends Value drivers in action: innovation Providing creative solutions to customers to address their need for speed and lower their total cost Market Dynamics Skilled labor shortage Integrated ceiling solutions Integrated ceiling solutions Compressed construction schedules Integrated ceiling solutions Creative interior design WAVE provides… Fast & Easy Installation Pre-engineered fit and form Modular Systems
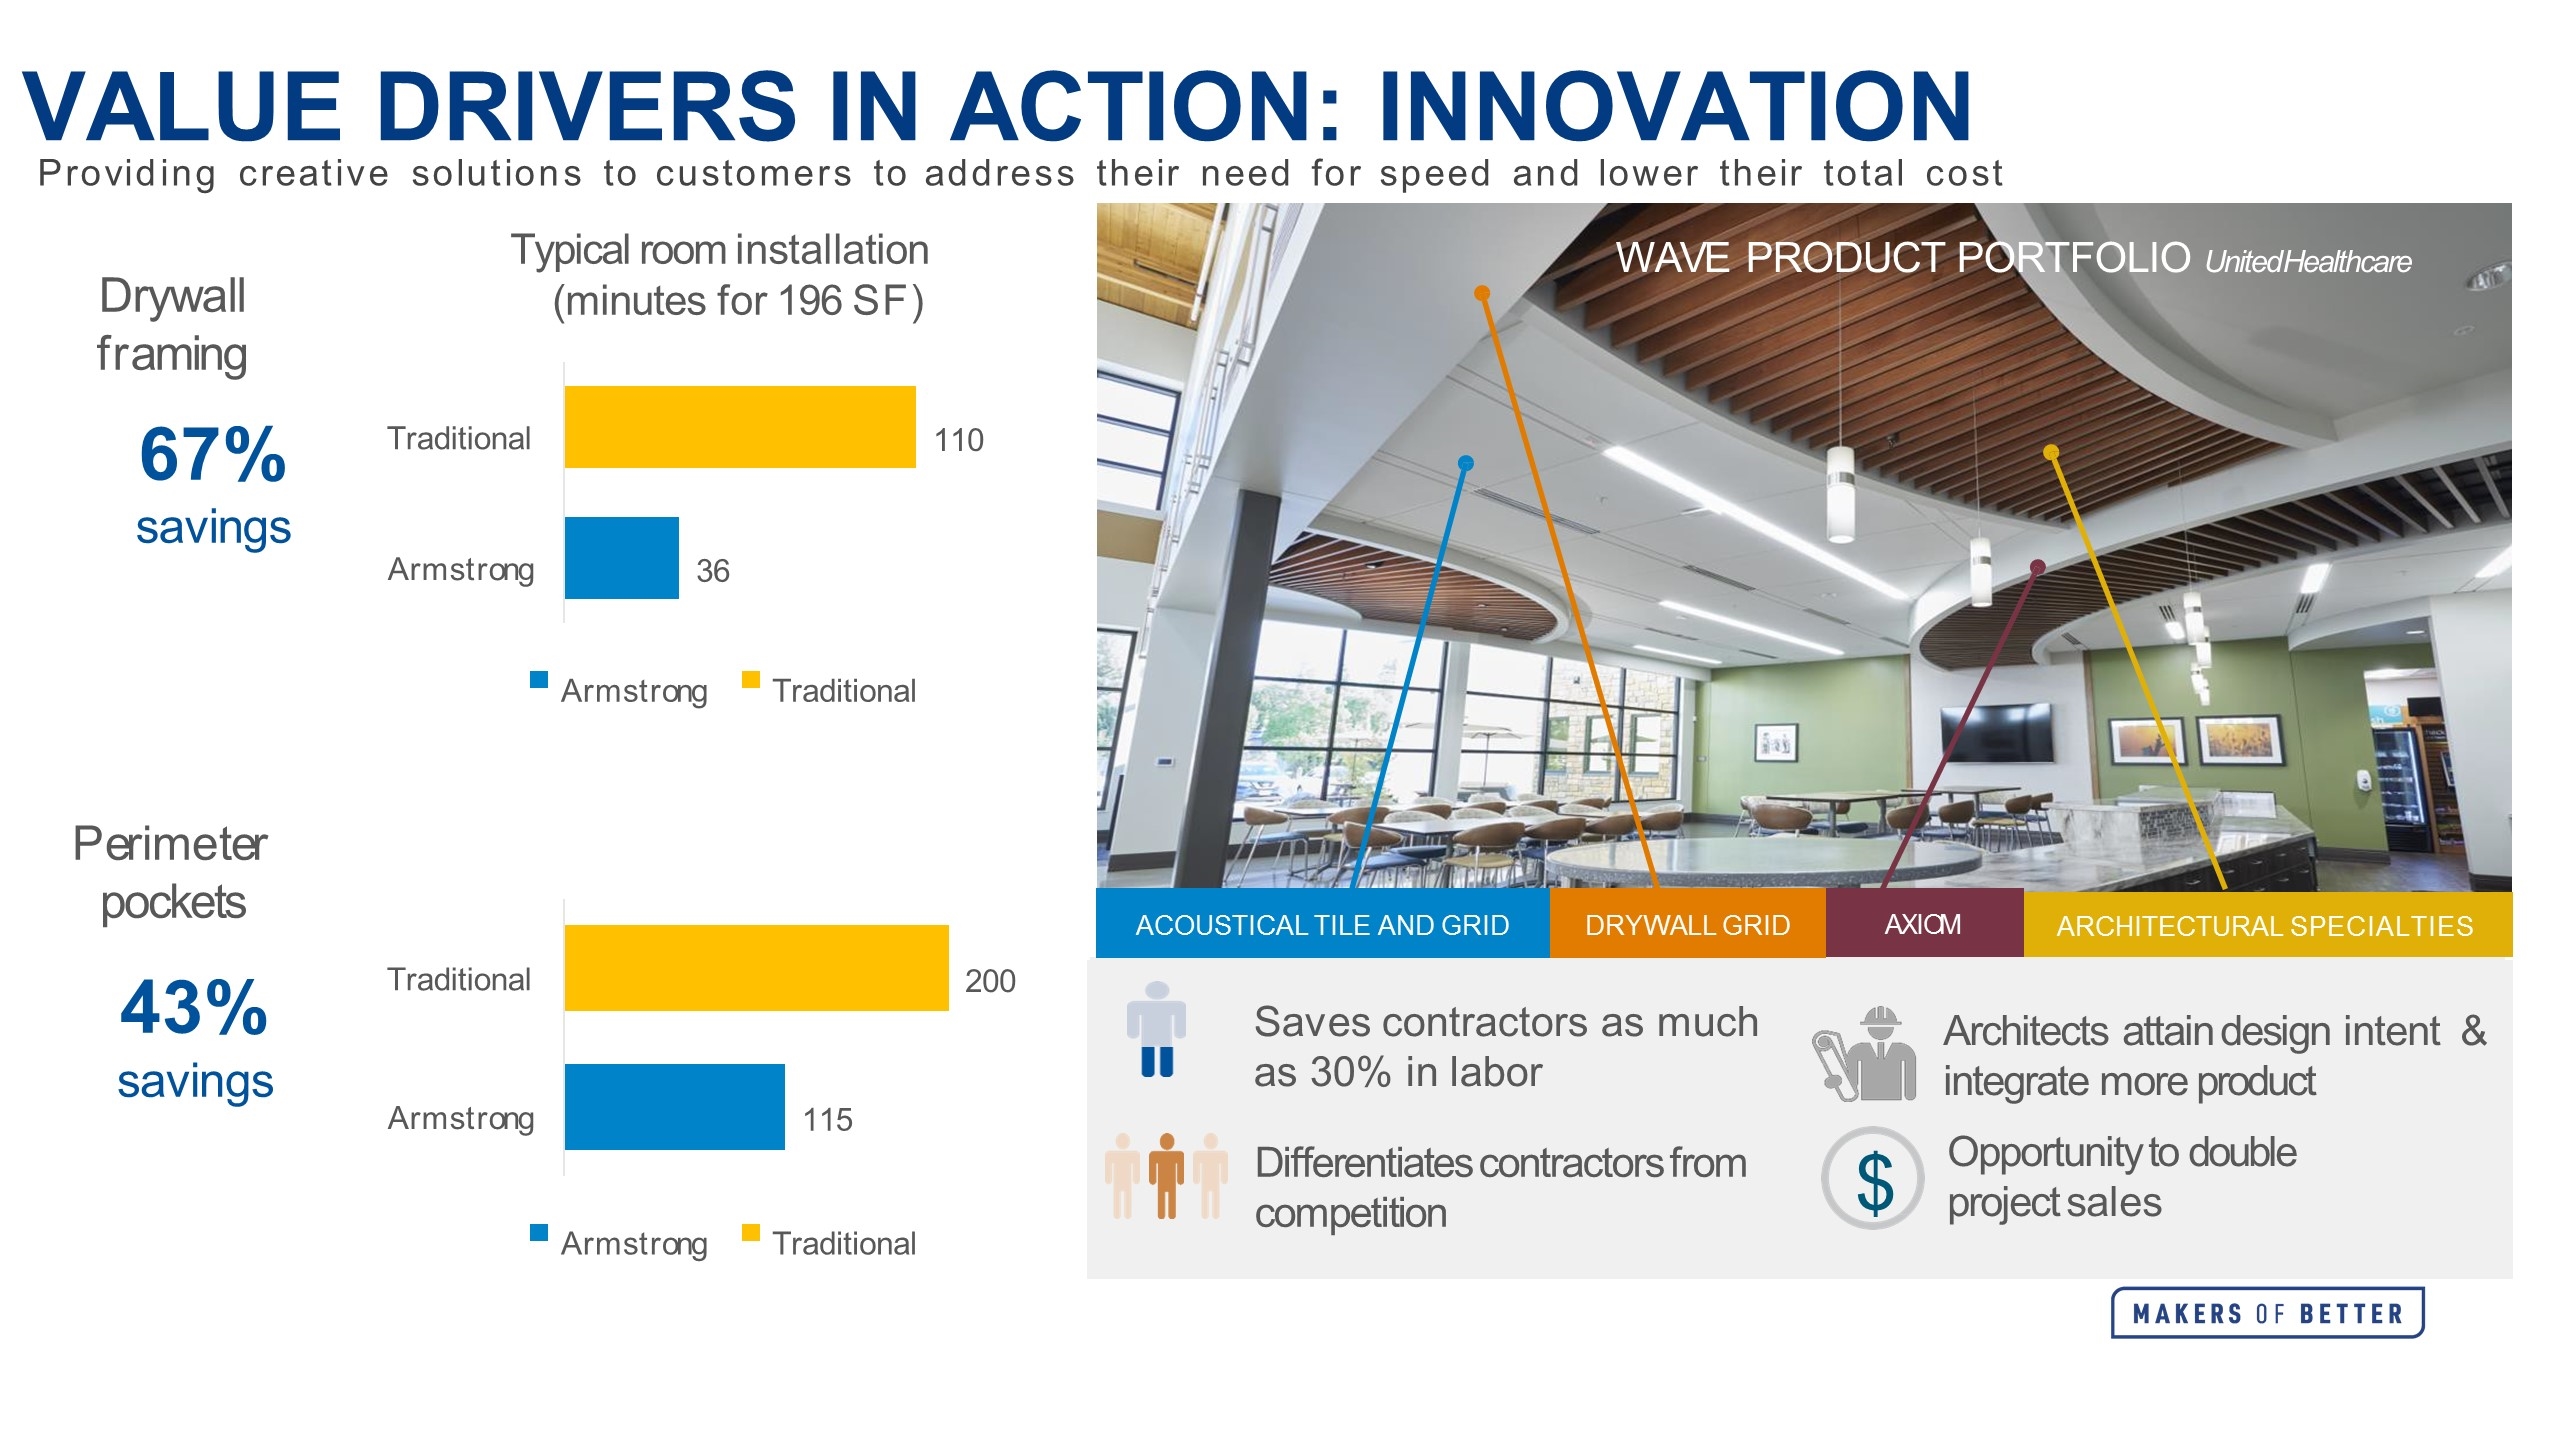
ARCHITECTURAL SPECIALTIES AXIOM $ WAVEPRODUCTPORTFOLIO United Healthcare 36 110 Armstrong Traditional Typical room installation (minutes for 196 SF) Armstrong Traditional 115 200 Armstrong Traditional Armstrong Traditional Drywall framing 67% savings Perimeter pockets 43% savings ACOUSTICAL TILE AND GRID DRYWALL GRID Architects attain design intent & integrate more product Opportunity to double project sales $ Saves contractors as much as 30% in labor Differentiates contractors from competition Value drivers in action: innovation Providing creative solutions to customers to address their need for speed and lower their total cost
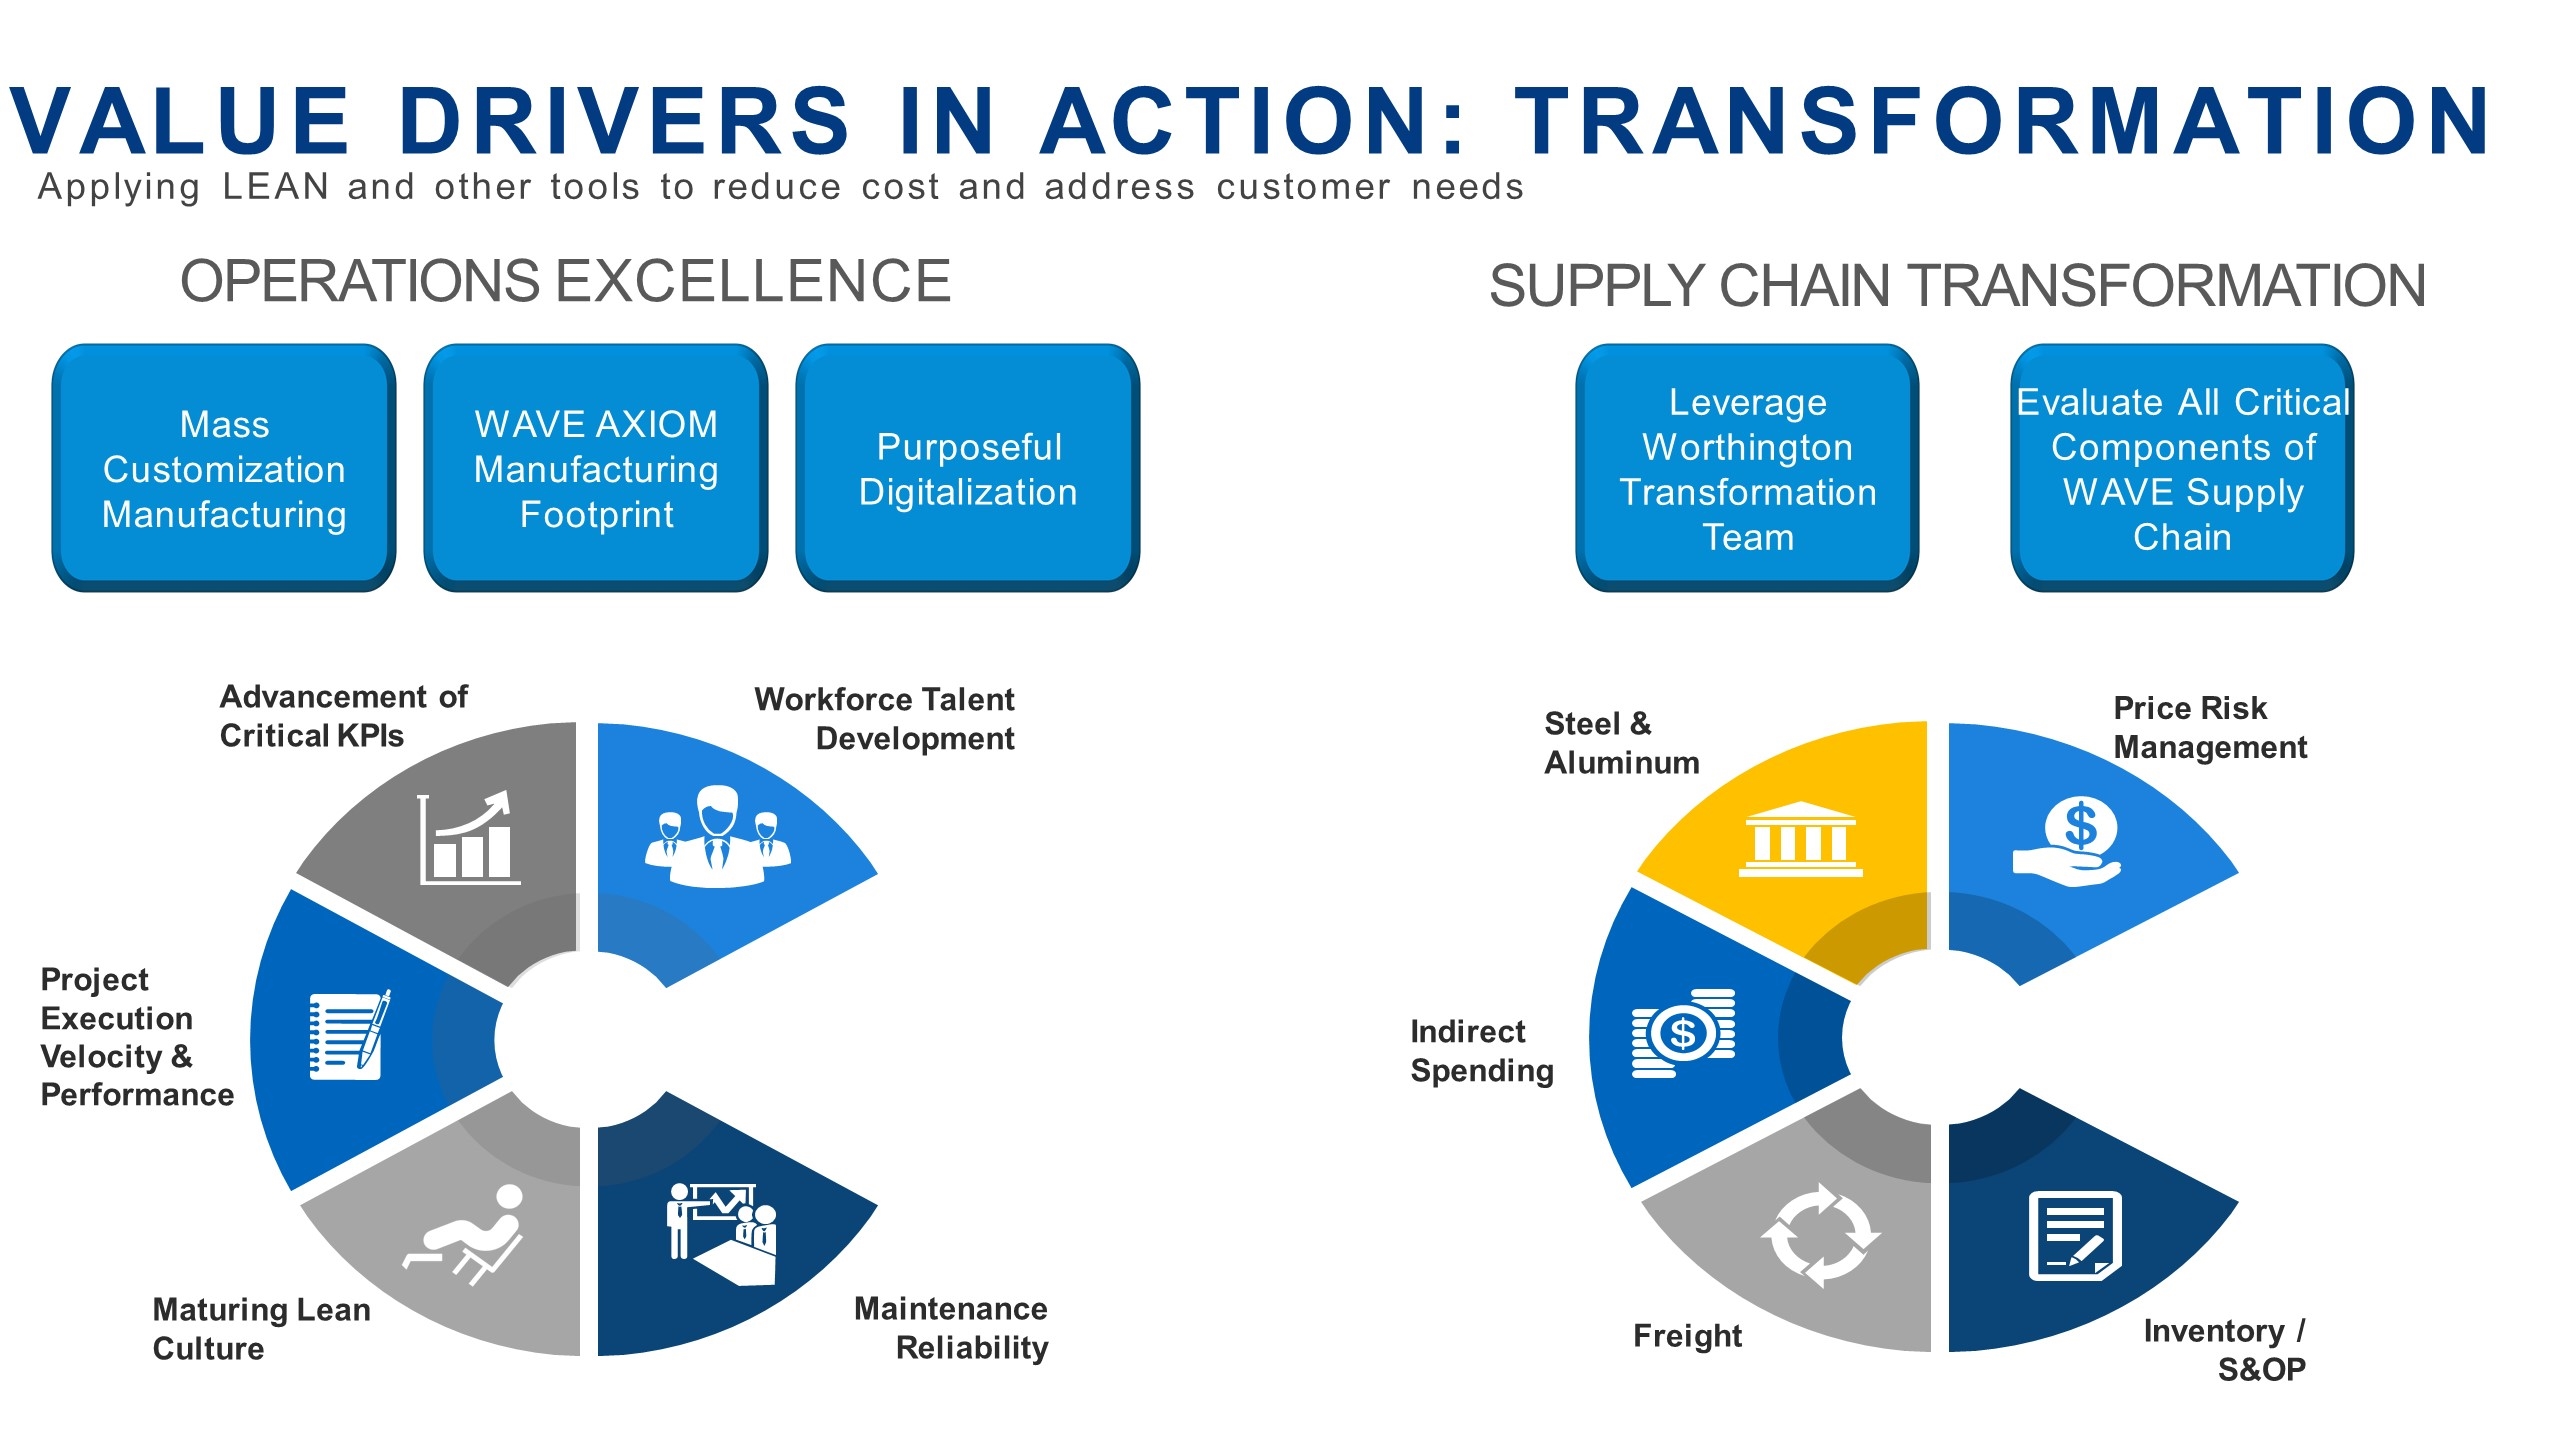
Workforce Talent Development Advancement of Critical KPIs Project Execution Velocity & Performance Maturing Lean Culture Maintenance Reliability Steel & Aluminum Price Risk Management Indirect Spending Freight Inventory / S&OP Mass Customization Manufacturing Purposeful Digitalization WAVE AXIOM Manufacturing Footprint OPERATIONS EXCELLENCE Leverage Worthington Transformation Team Evaluate All Critical Components of WAVE Supply Chain Supply chain transformation Value drivers in action: transformation Applying LEAN and other tools to reduce cost and address customer needs

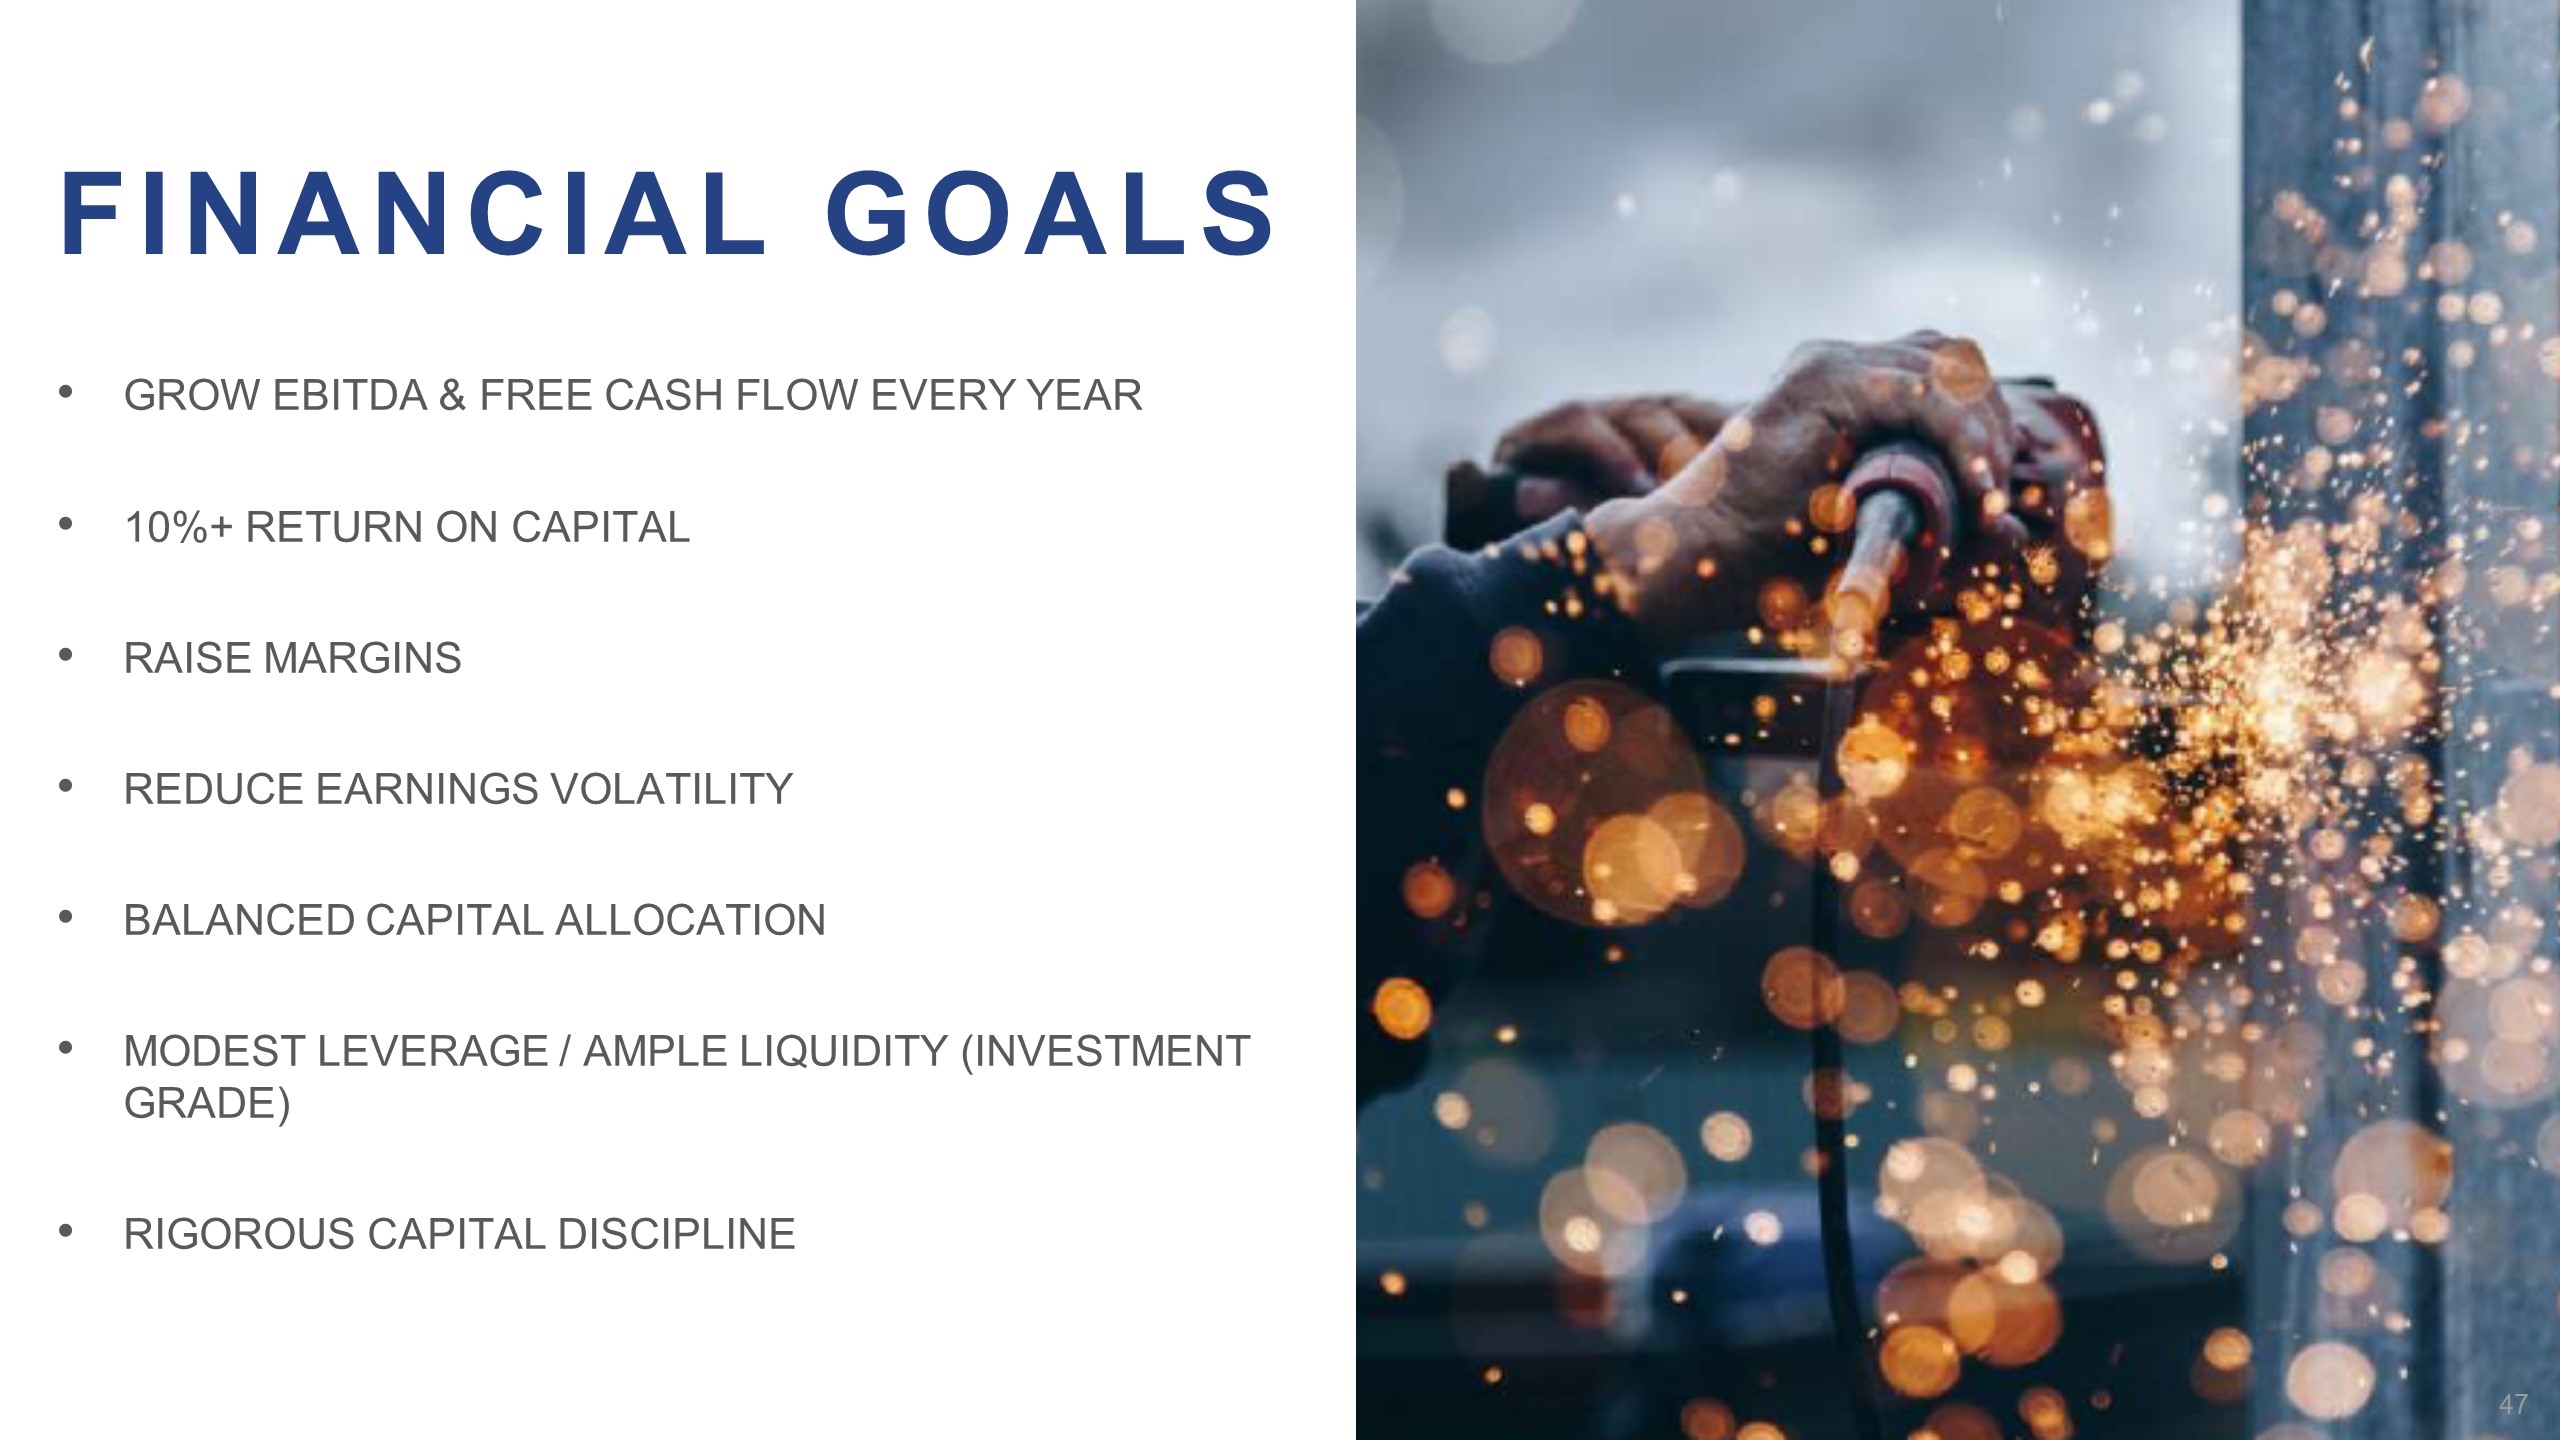
Financial goals Grow EBITDA & free cash flow every year 10%+ return on capital Raise margins Reduce earnings volatility Balanced capital allocation Modest leverage / ample liquidity (investment grade) Rigorous capital discipline
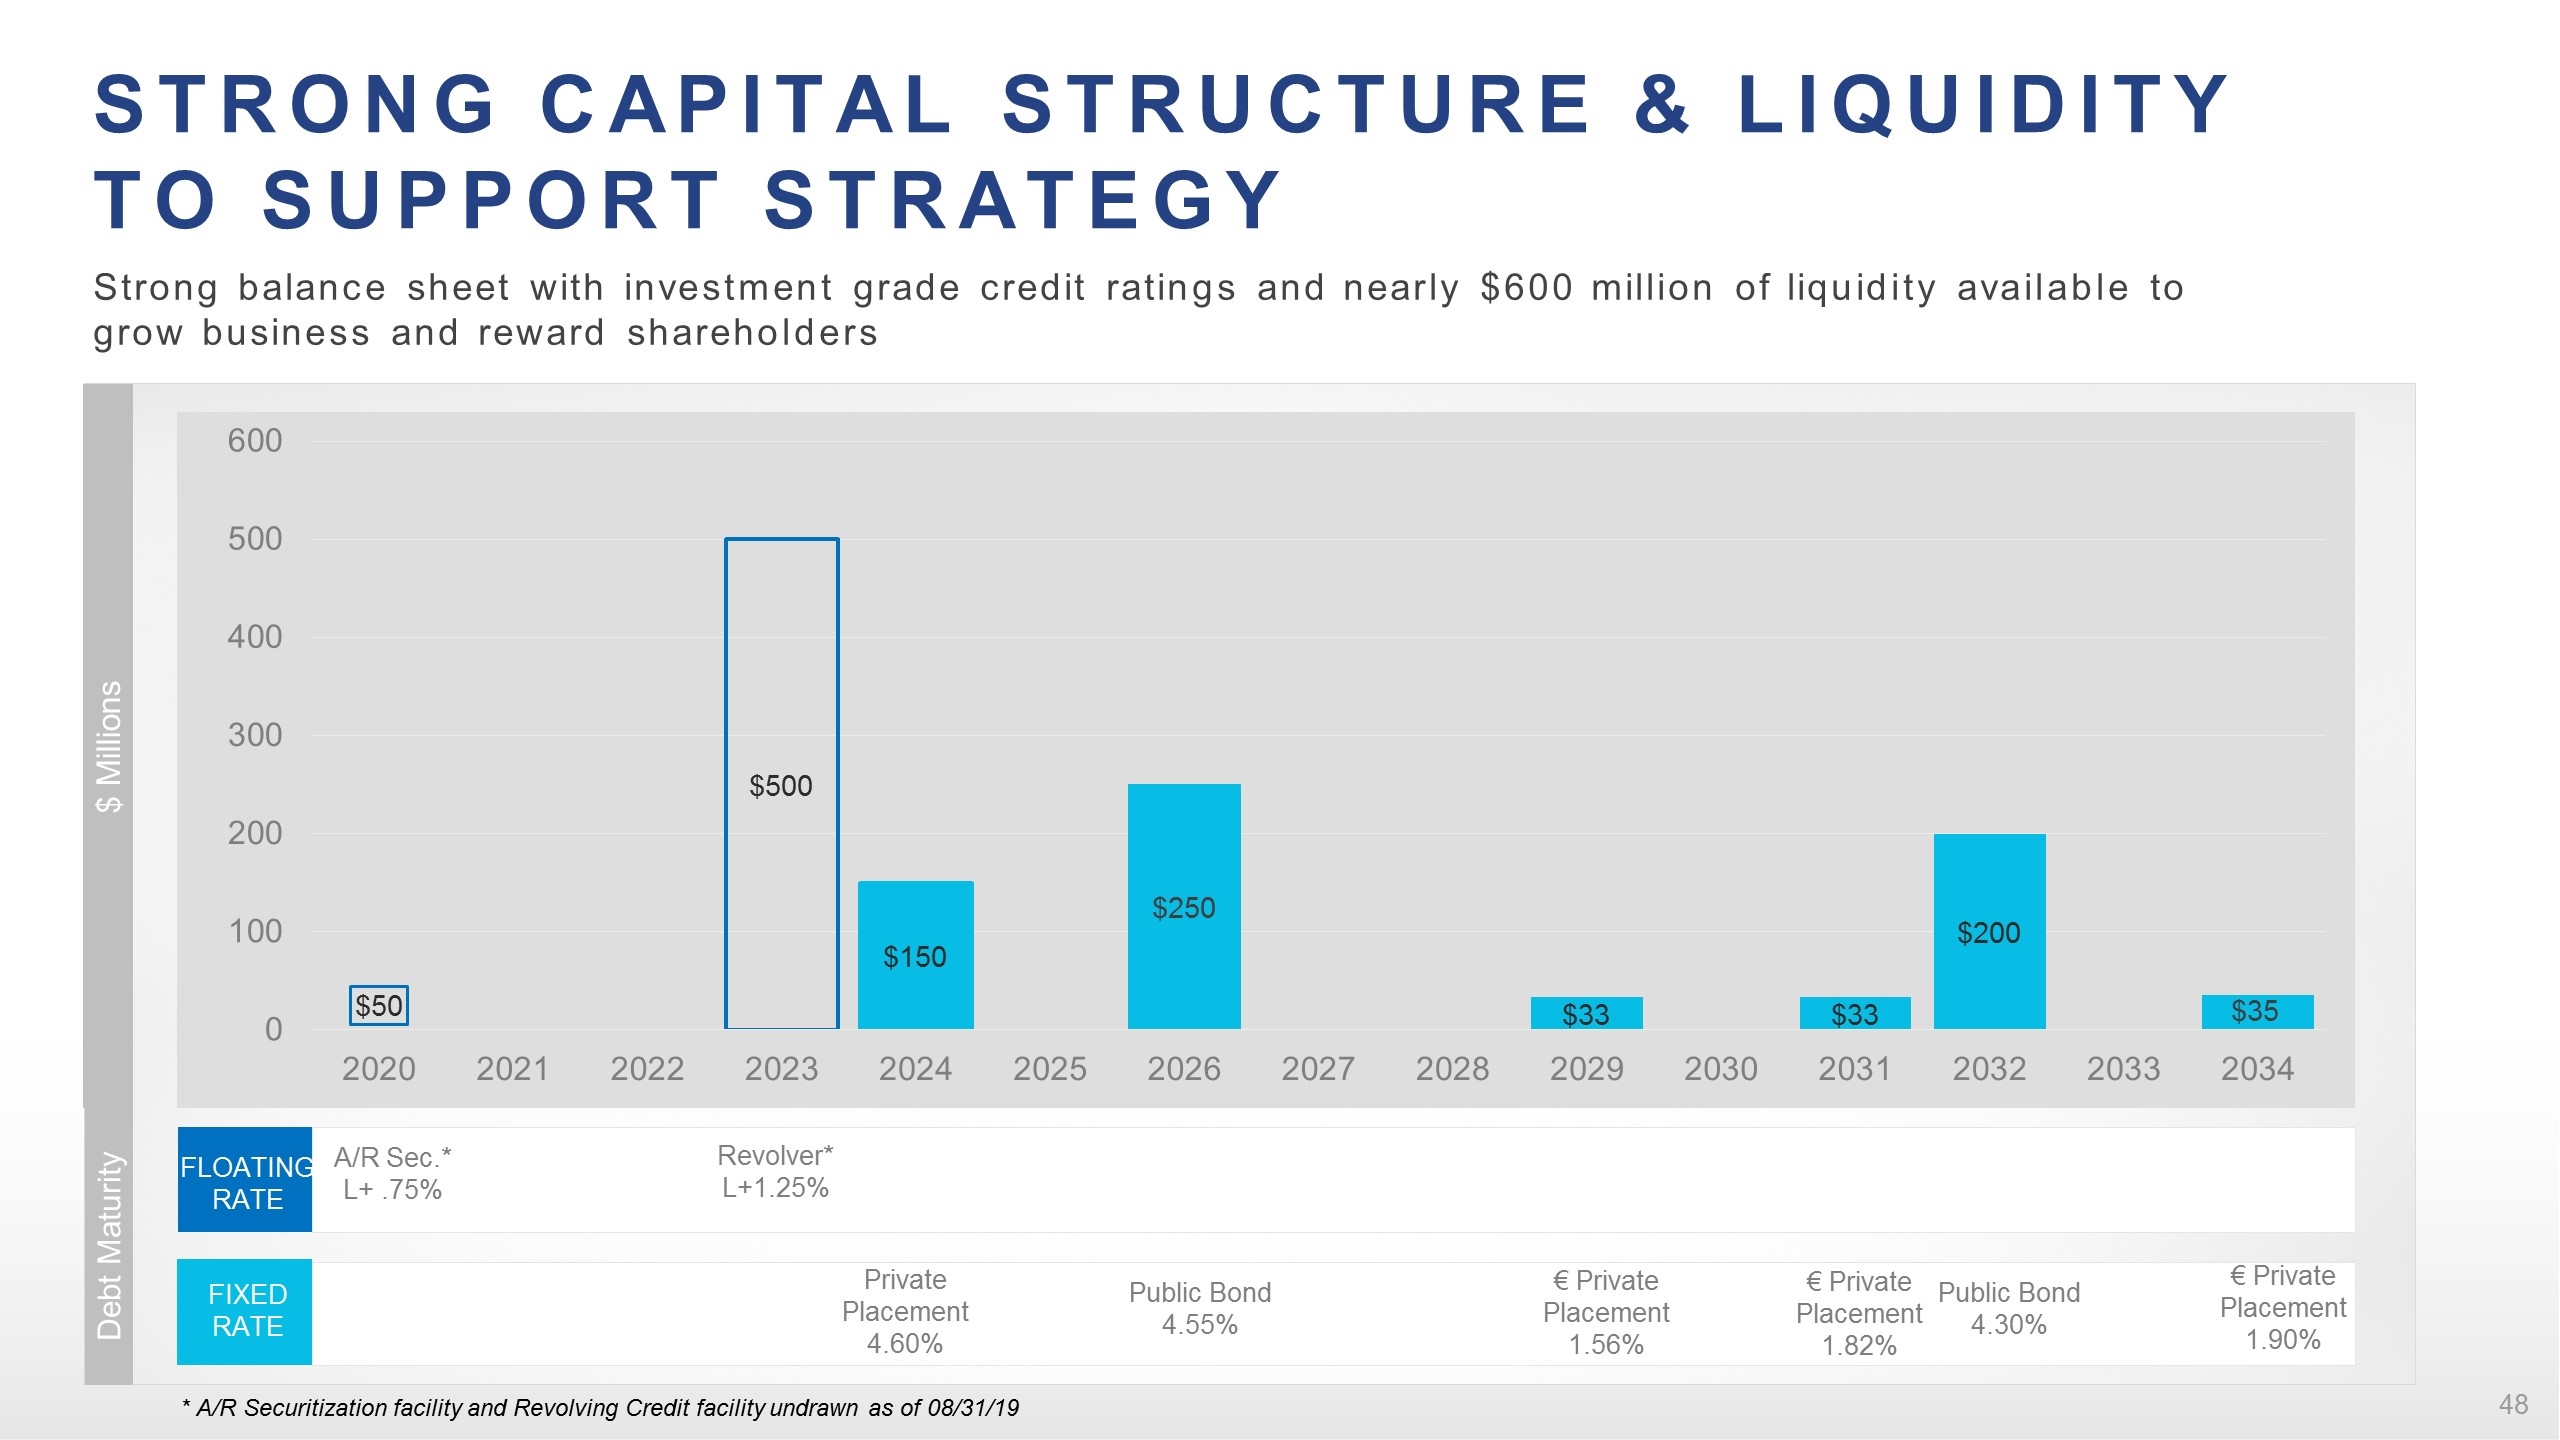
Strong capital structure & liquidity to support strategy Strong balance sheet with investment grade credit ratings and nearly $600 million of liquidity available to grow business and reward shareholders $ Millions Debt Maturity Private Placement 4.60% Public Bond 4.55% FIXED RATE A/R Sec.* L+ .75% Revolver* L+1.25% FLOATING RATE Public Bond 4.30% * A/R Securitization facility and Revolving Credit facility undrawn as of 08/31/19 € Private Placement 1.56% € Private Placement 1.82% € Private Placement 1.90%
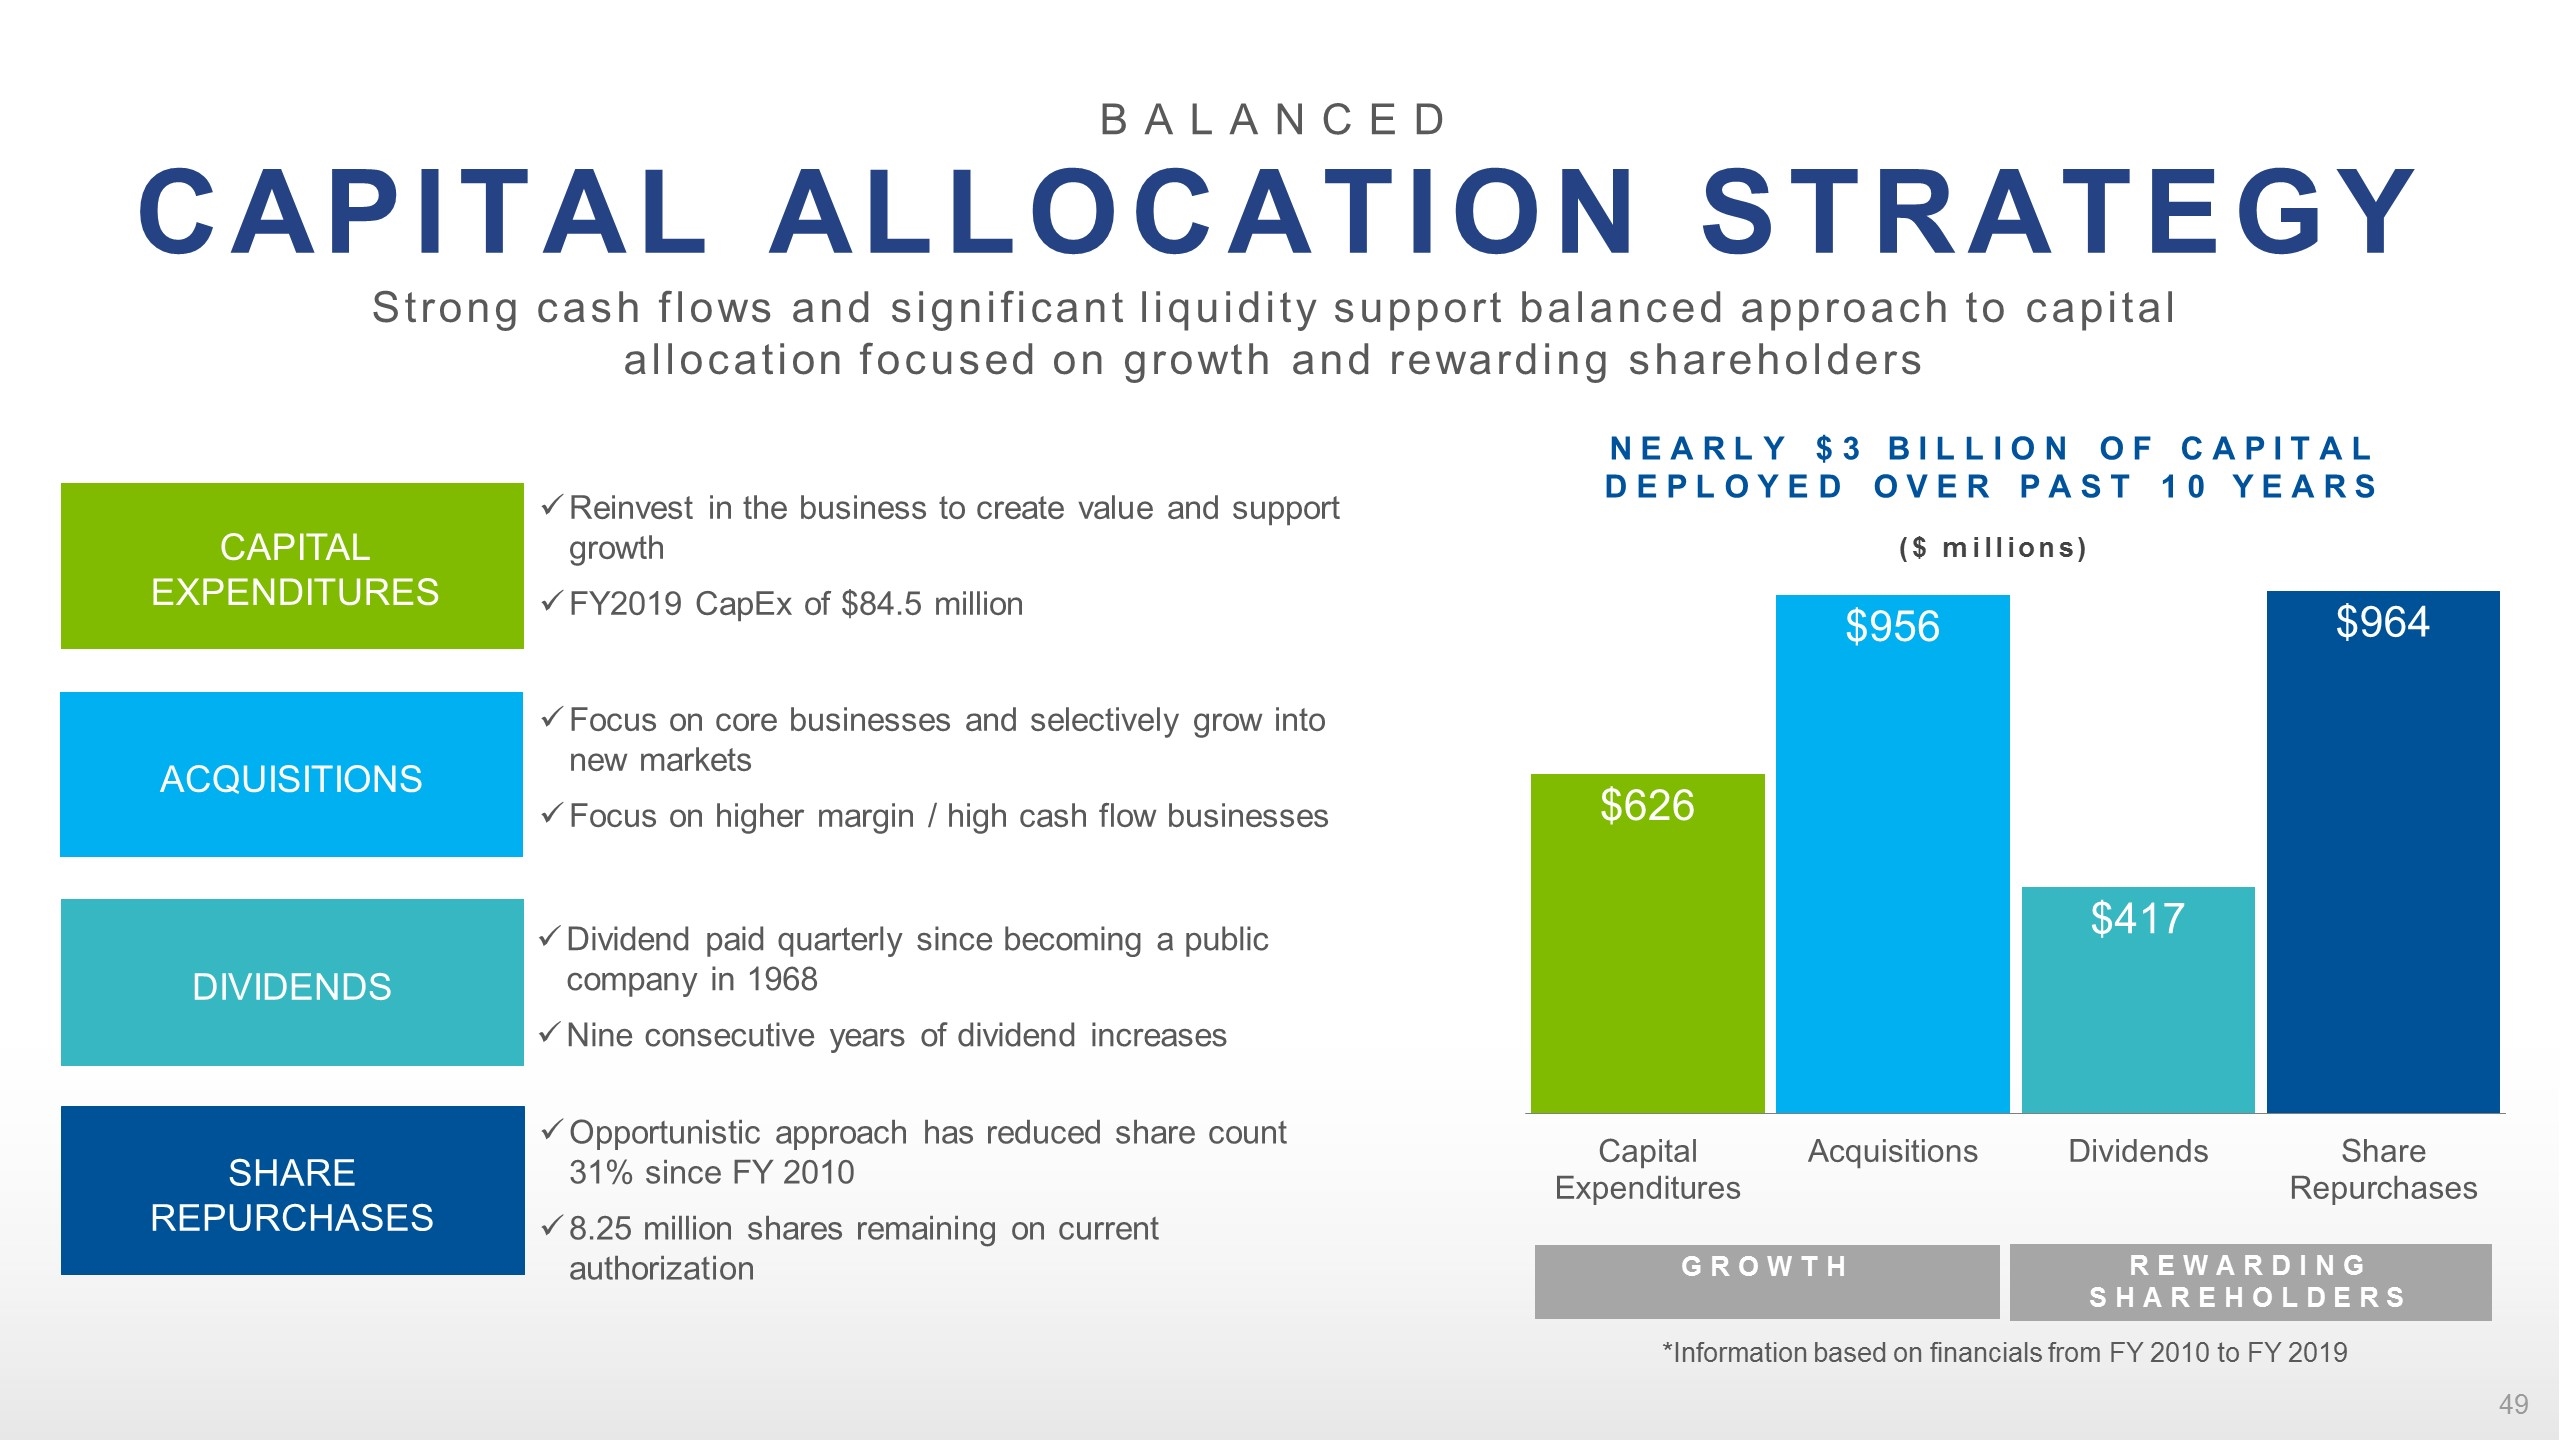
Balanced CAPITAL ALLOCATION STRATEGY Strong cash flows and significant liquidity support balanced approach to capital allocation focused on growth and rewarding shareholders Capital Expenditures Acquisitions Dividends Share Repurchases Reinvest in the business to create value and support growth FY2019 CapEx of $84.5 million Focus on core businesses and selectively grow into new markets Focus on higher margin / high cash flow businesses Dividend paid quarterly since becoming a public company in 1968 Nine consecutive years of dividend increases Opportunistic approach has reduced share count 31% since FY 2010 8.25 million shares remaining on current authorization Nearly $3 billion of capital deployed over past 10 years ($ millions) Growth Rewarding Shareholders *Information based on financials from FY 2010 to FY 2019
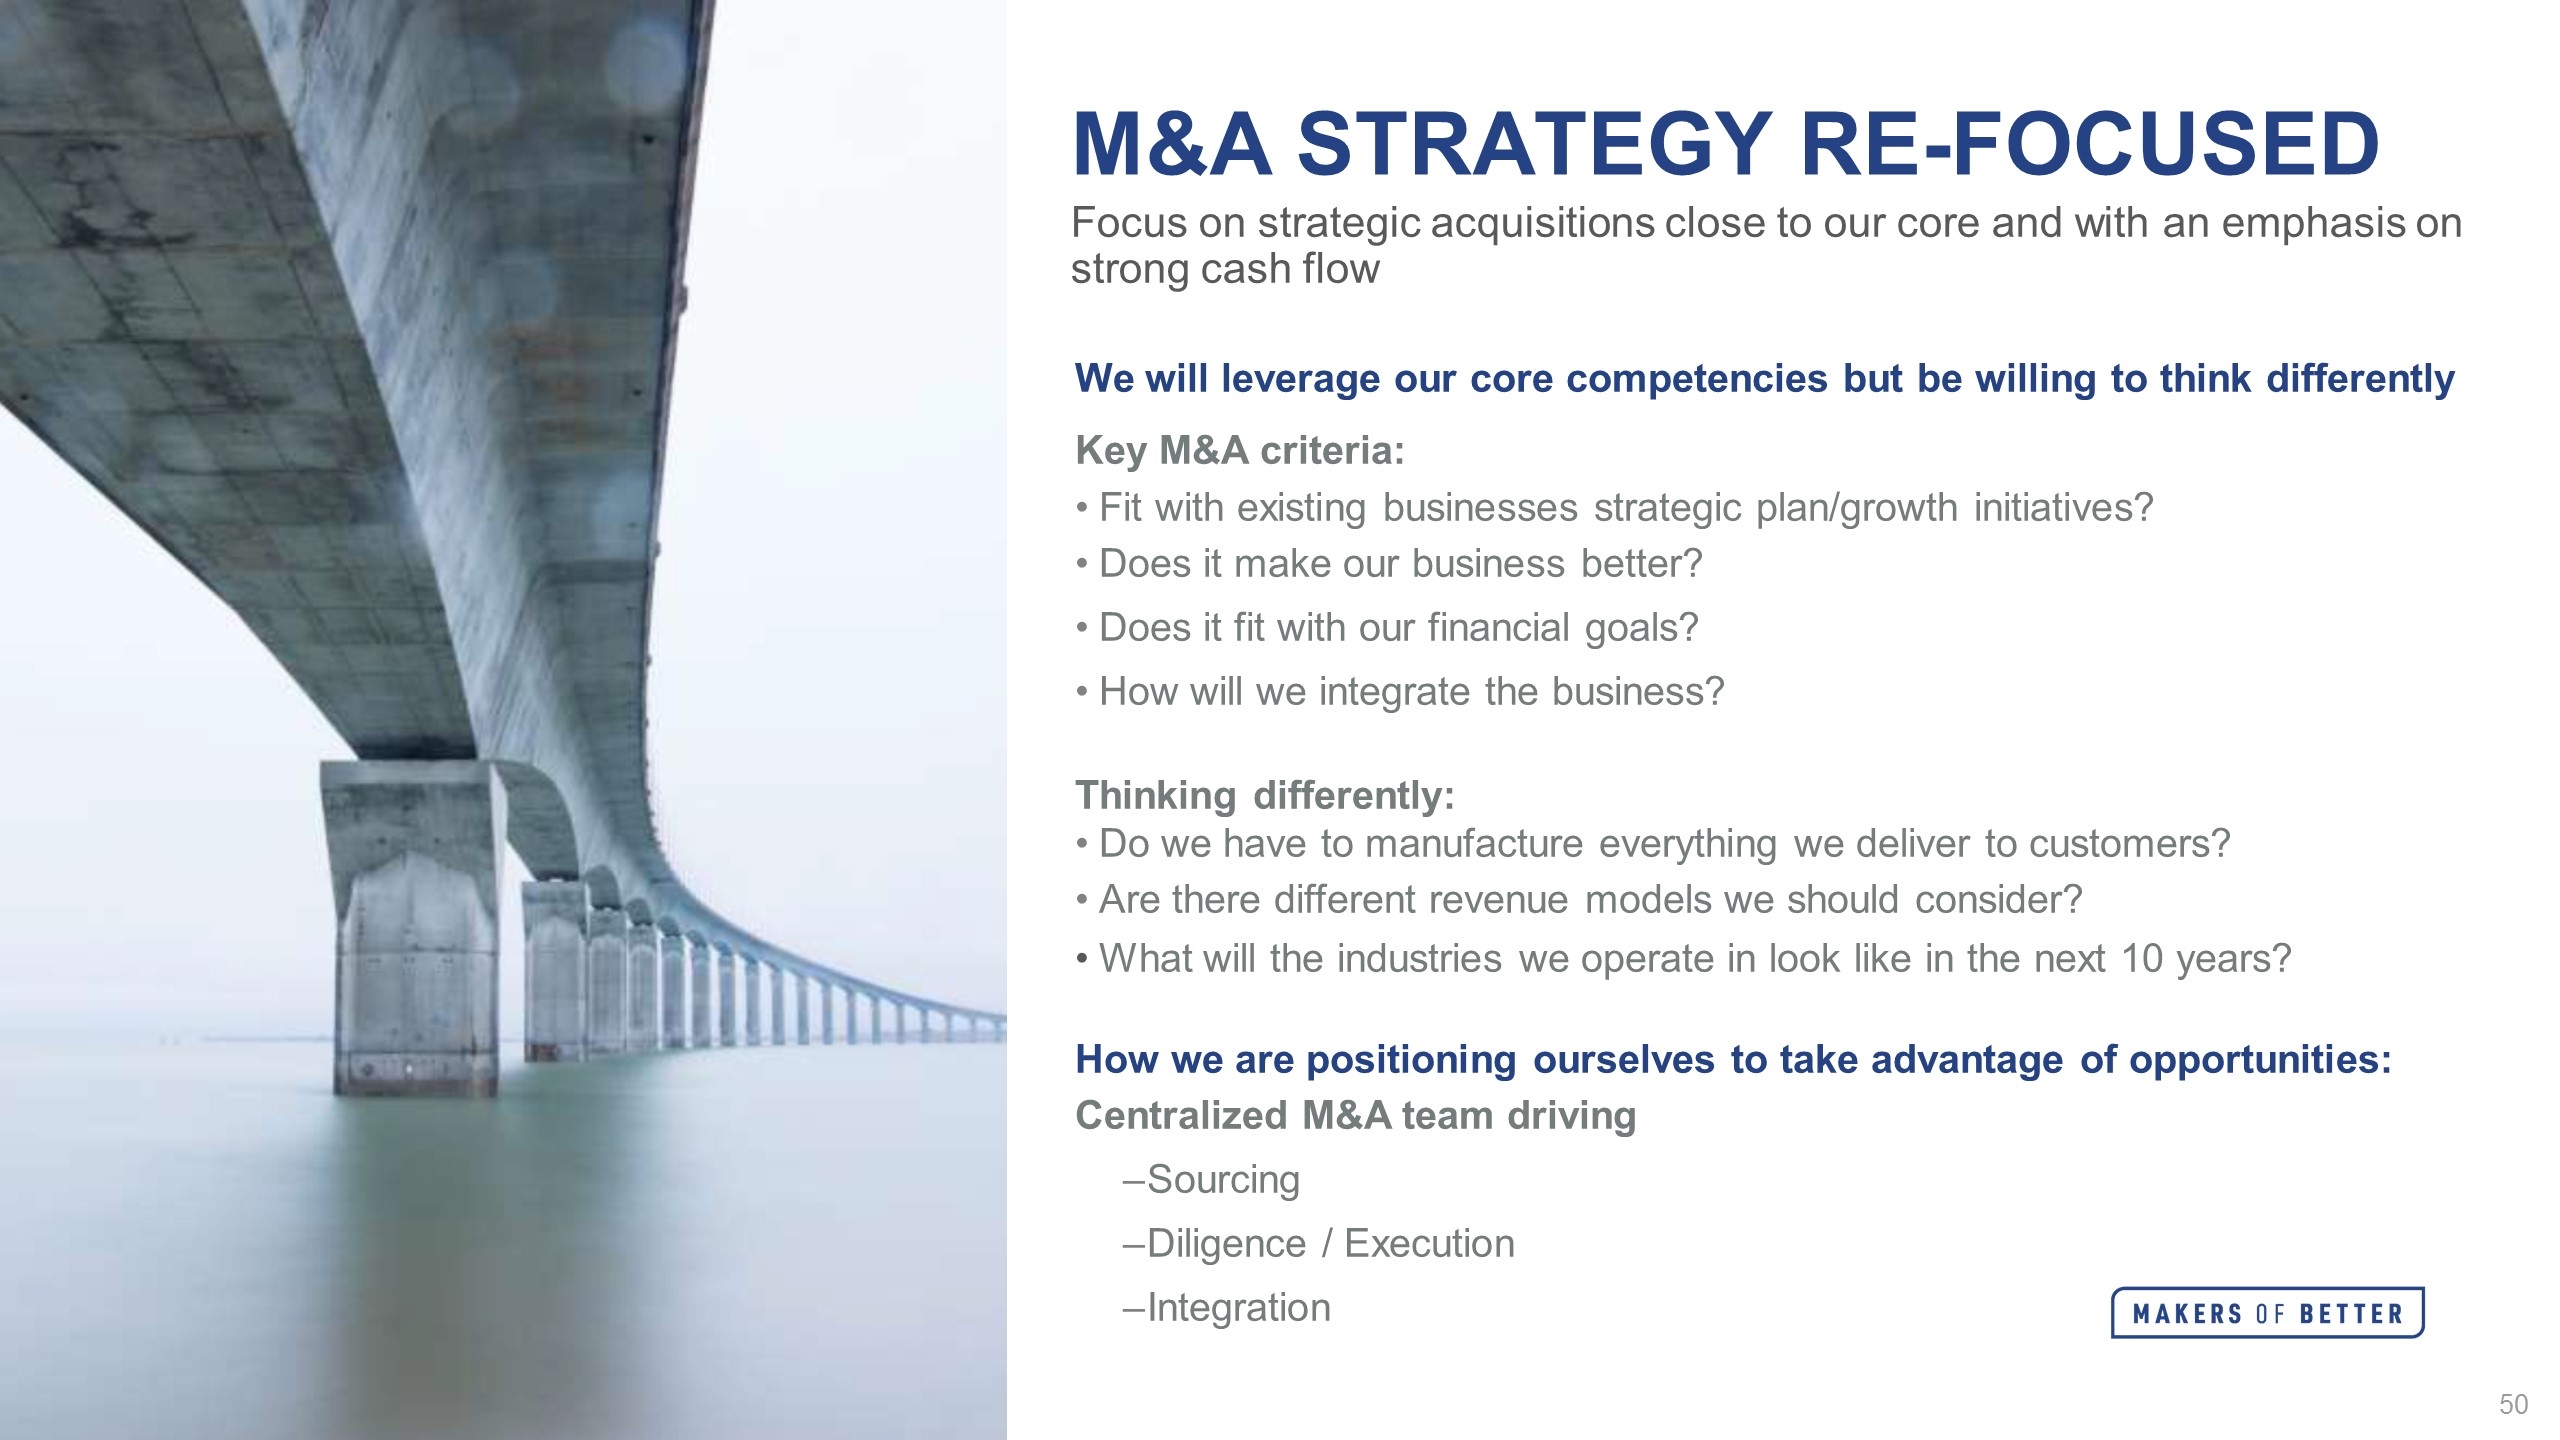
M&A Strategy Re-Focused Focus on strategic acquisitions close to our core and with an emphasis on strong cash flow We will leverage our core competencies but be willing to think differently Key M&A criteria: Fit with existing businesses strategic plan/growth initiatives? Does it make our business better? Does it fit with our financial goals? How will we integrate the business? Thinking differently: Do we have to manufacture everything we deliver to customers? Are there different revenue models we should consider? What will the industries we operate in look like in the next 10 years? How we are positioning ourselves to take advantage of opportunities: Centralized M&A team driving Sourcing Diligence / Execution Integration
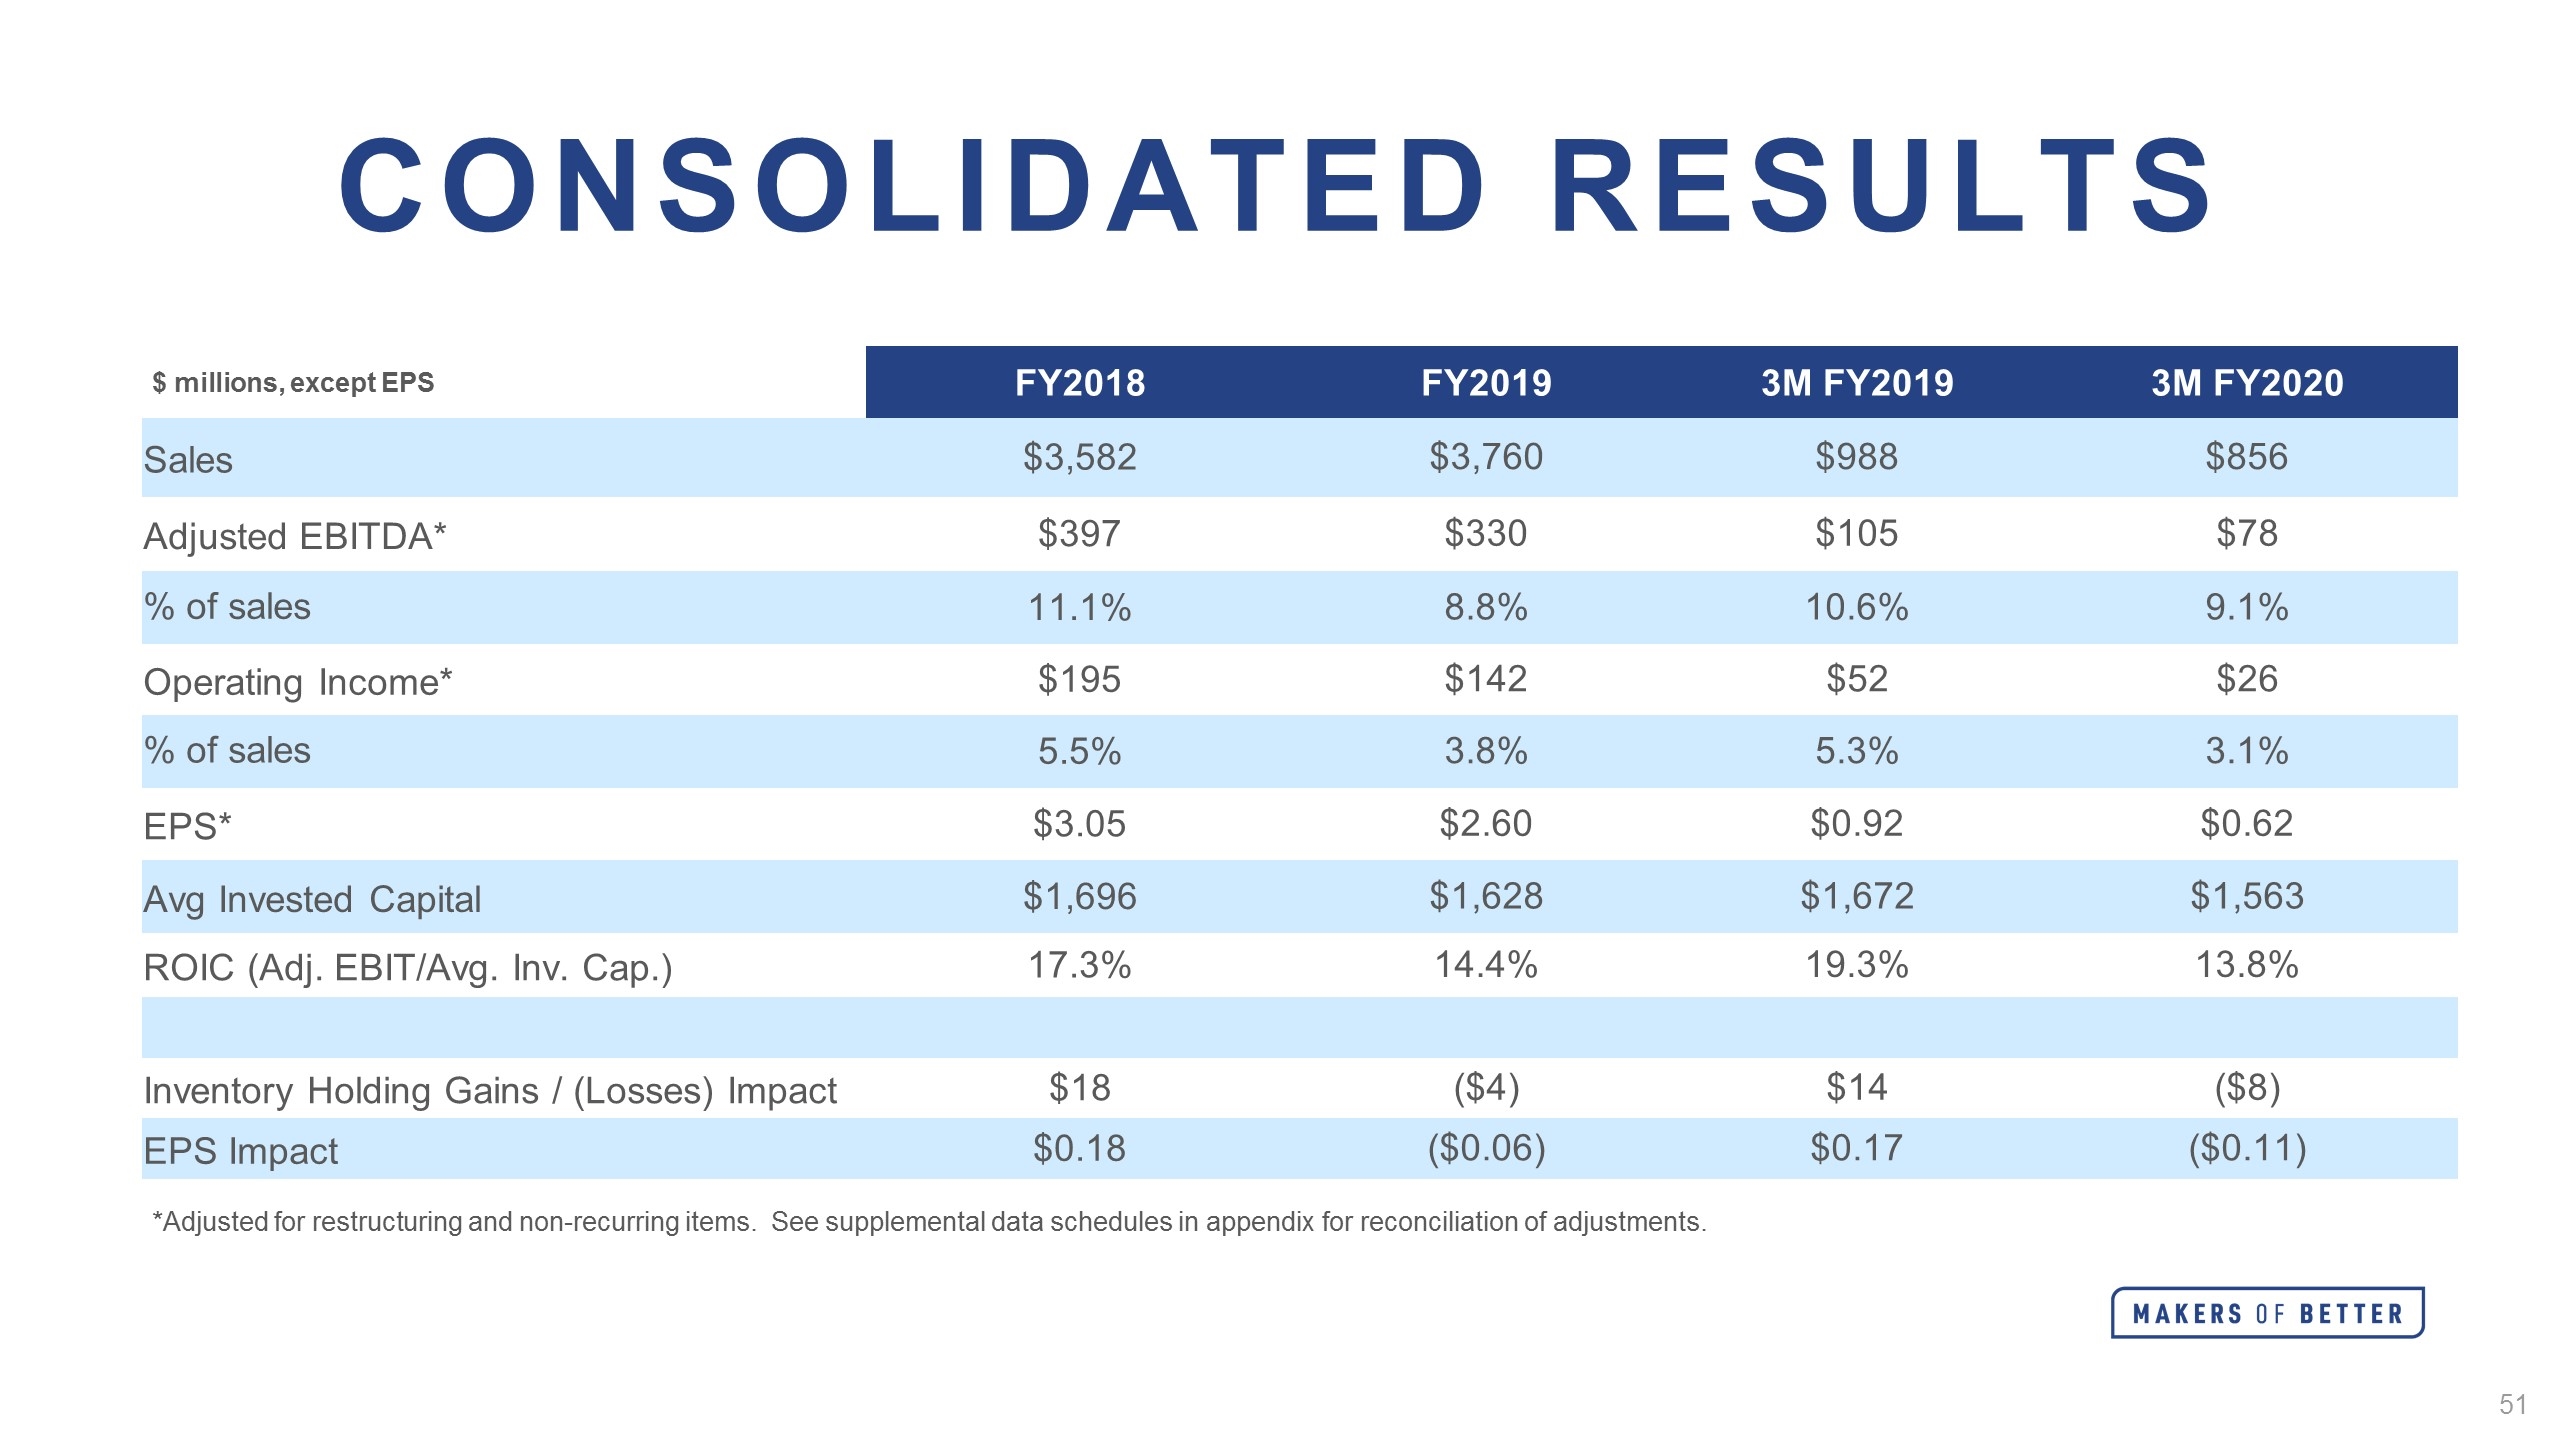
Consolidated Results *Adjusted for restructuring and non-recurring items. See supplemental data schedules in appendix for reconciliation of adjustments. $ millions, except EPS FY2018 FY2019 3M FY2019 3M FY2020 Sales $3,582 $3,760 $988 $856 Adjusted EBITDA* $397 $330 $105 $78 % of sales 11.1% 8.8% 10.6% 9.1% Operating Income* $195 $142 $52 $26 % of sales 5.5% 3.8% 5.3% 3.1% EPS* $3.05 $2.60 $0.92 $0.62 Avg Invested Capital $1,696 $1,628 $1,672 $1,563 ROIC (Adj. EBIT/Avg. Inv. Cap.) 17.3% 14.4% 19.3% 13.8% Inventory Holding Gains / (Losses) Impact $18 ($4) $14 ($8) EPS Impact $0.18 ($0.06) $0.17 ($0.11)
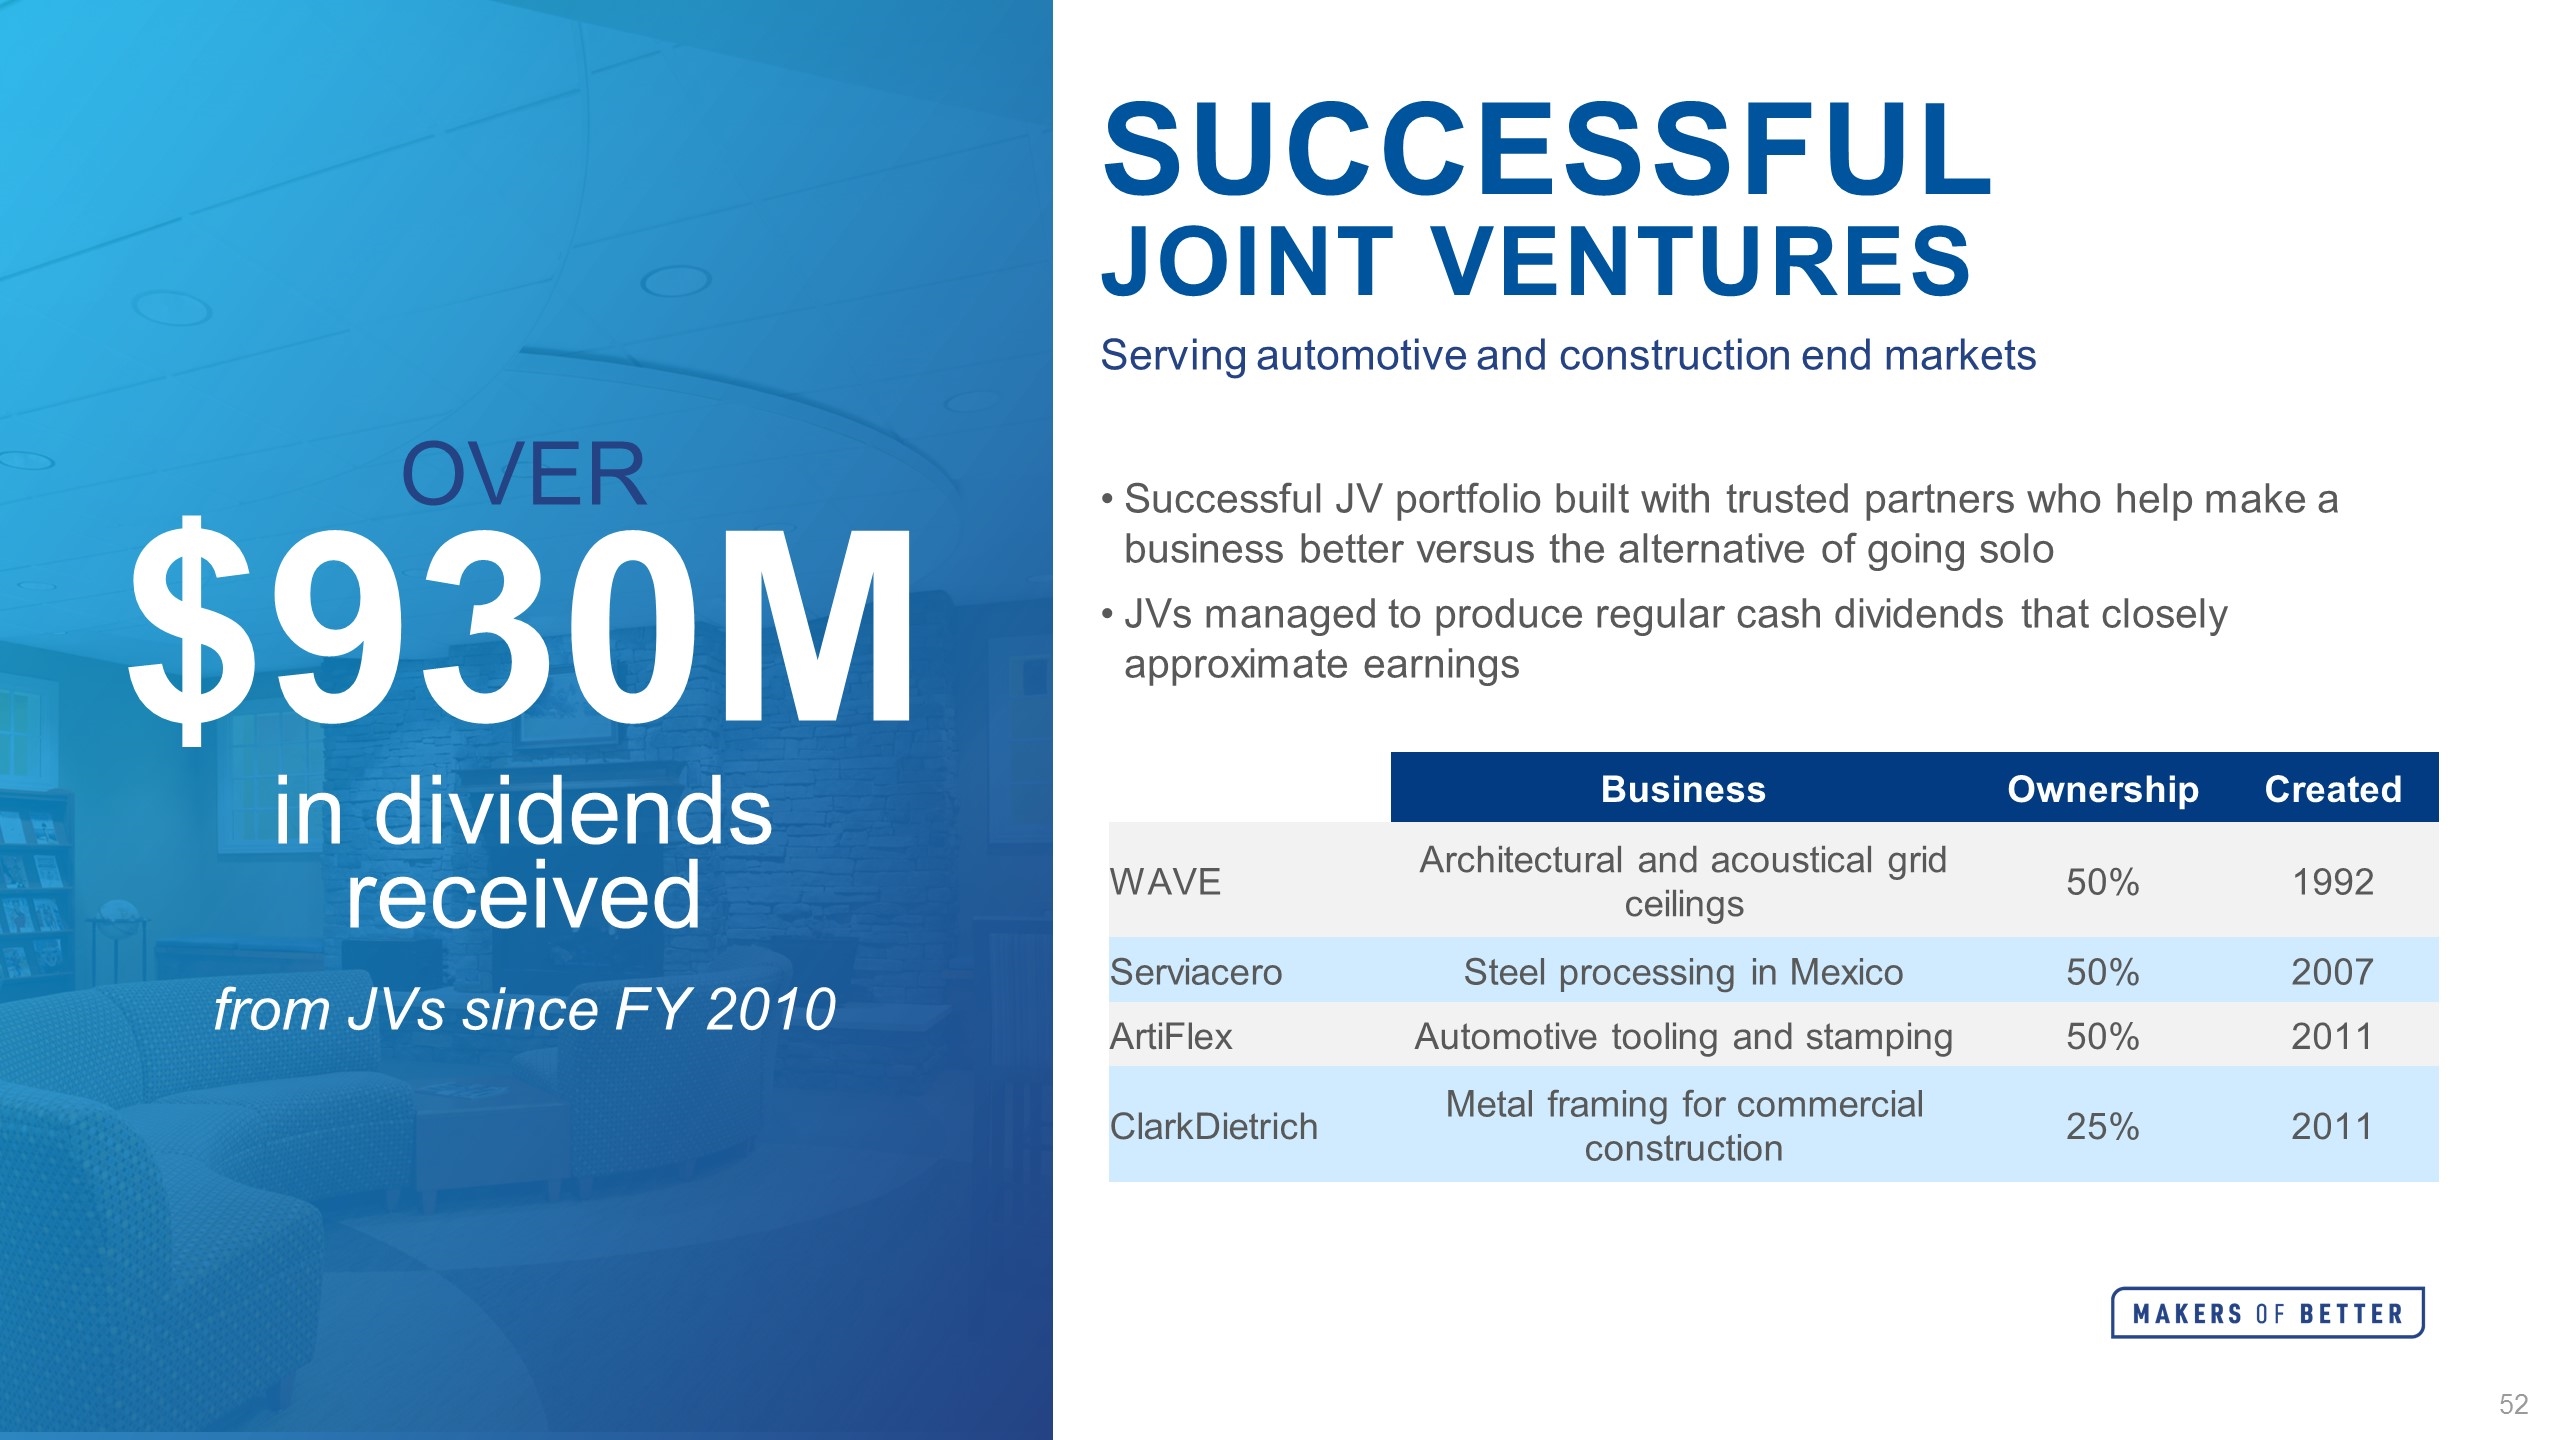
Successful JV portfolio built with trusted partners who help make a business better versus the alternative of going solo JVs managed to produce regular cash dividends that closely approximate earnings Successful Joint Ventures Business Ownership Created WAVE Architectural and acoustical grid ceilings 50% 1992 Serviacero Steel processing in Mexico 50% 2007 ArtiFlex Automotive tooling and stamping 50% 2011 ClarkDietrich Metal framing for commercial construction 25% 2011 Serving automotive and construction end markets Over $930M in dividends received from JVs since FY 2010
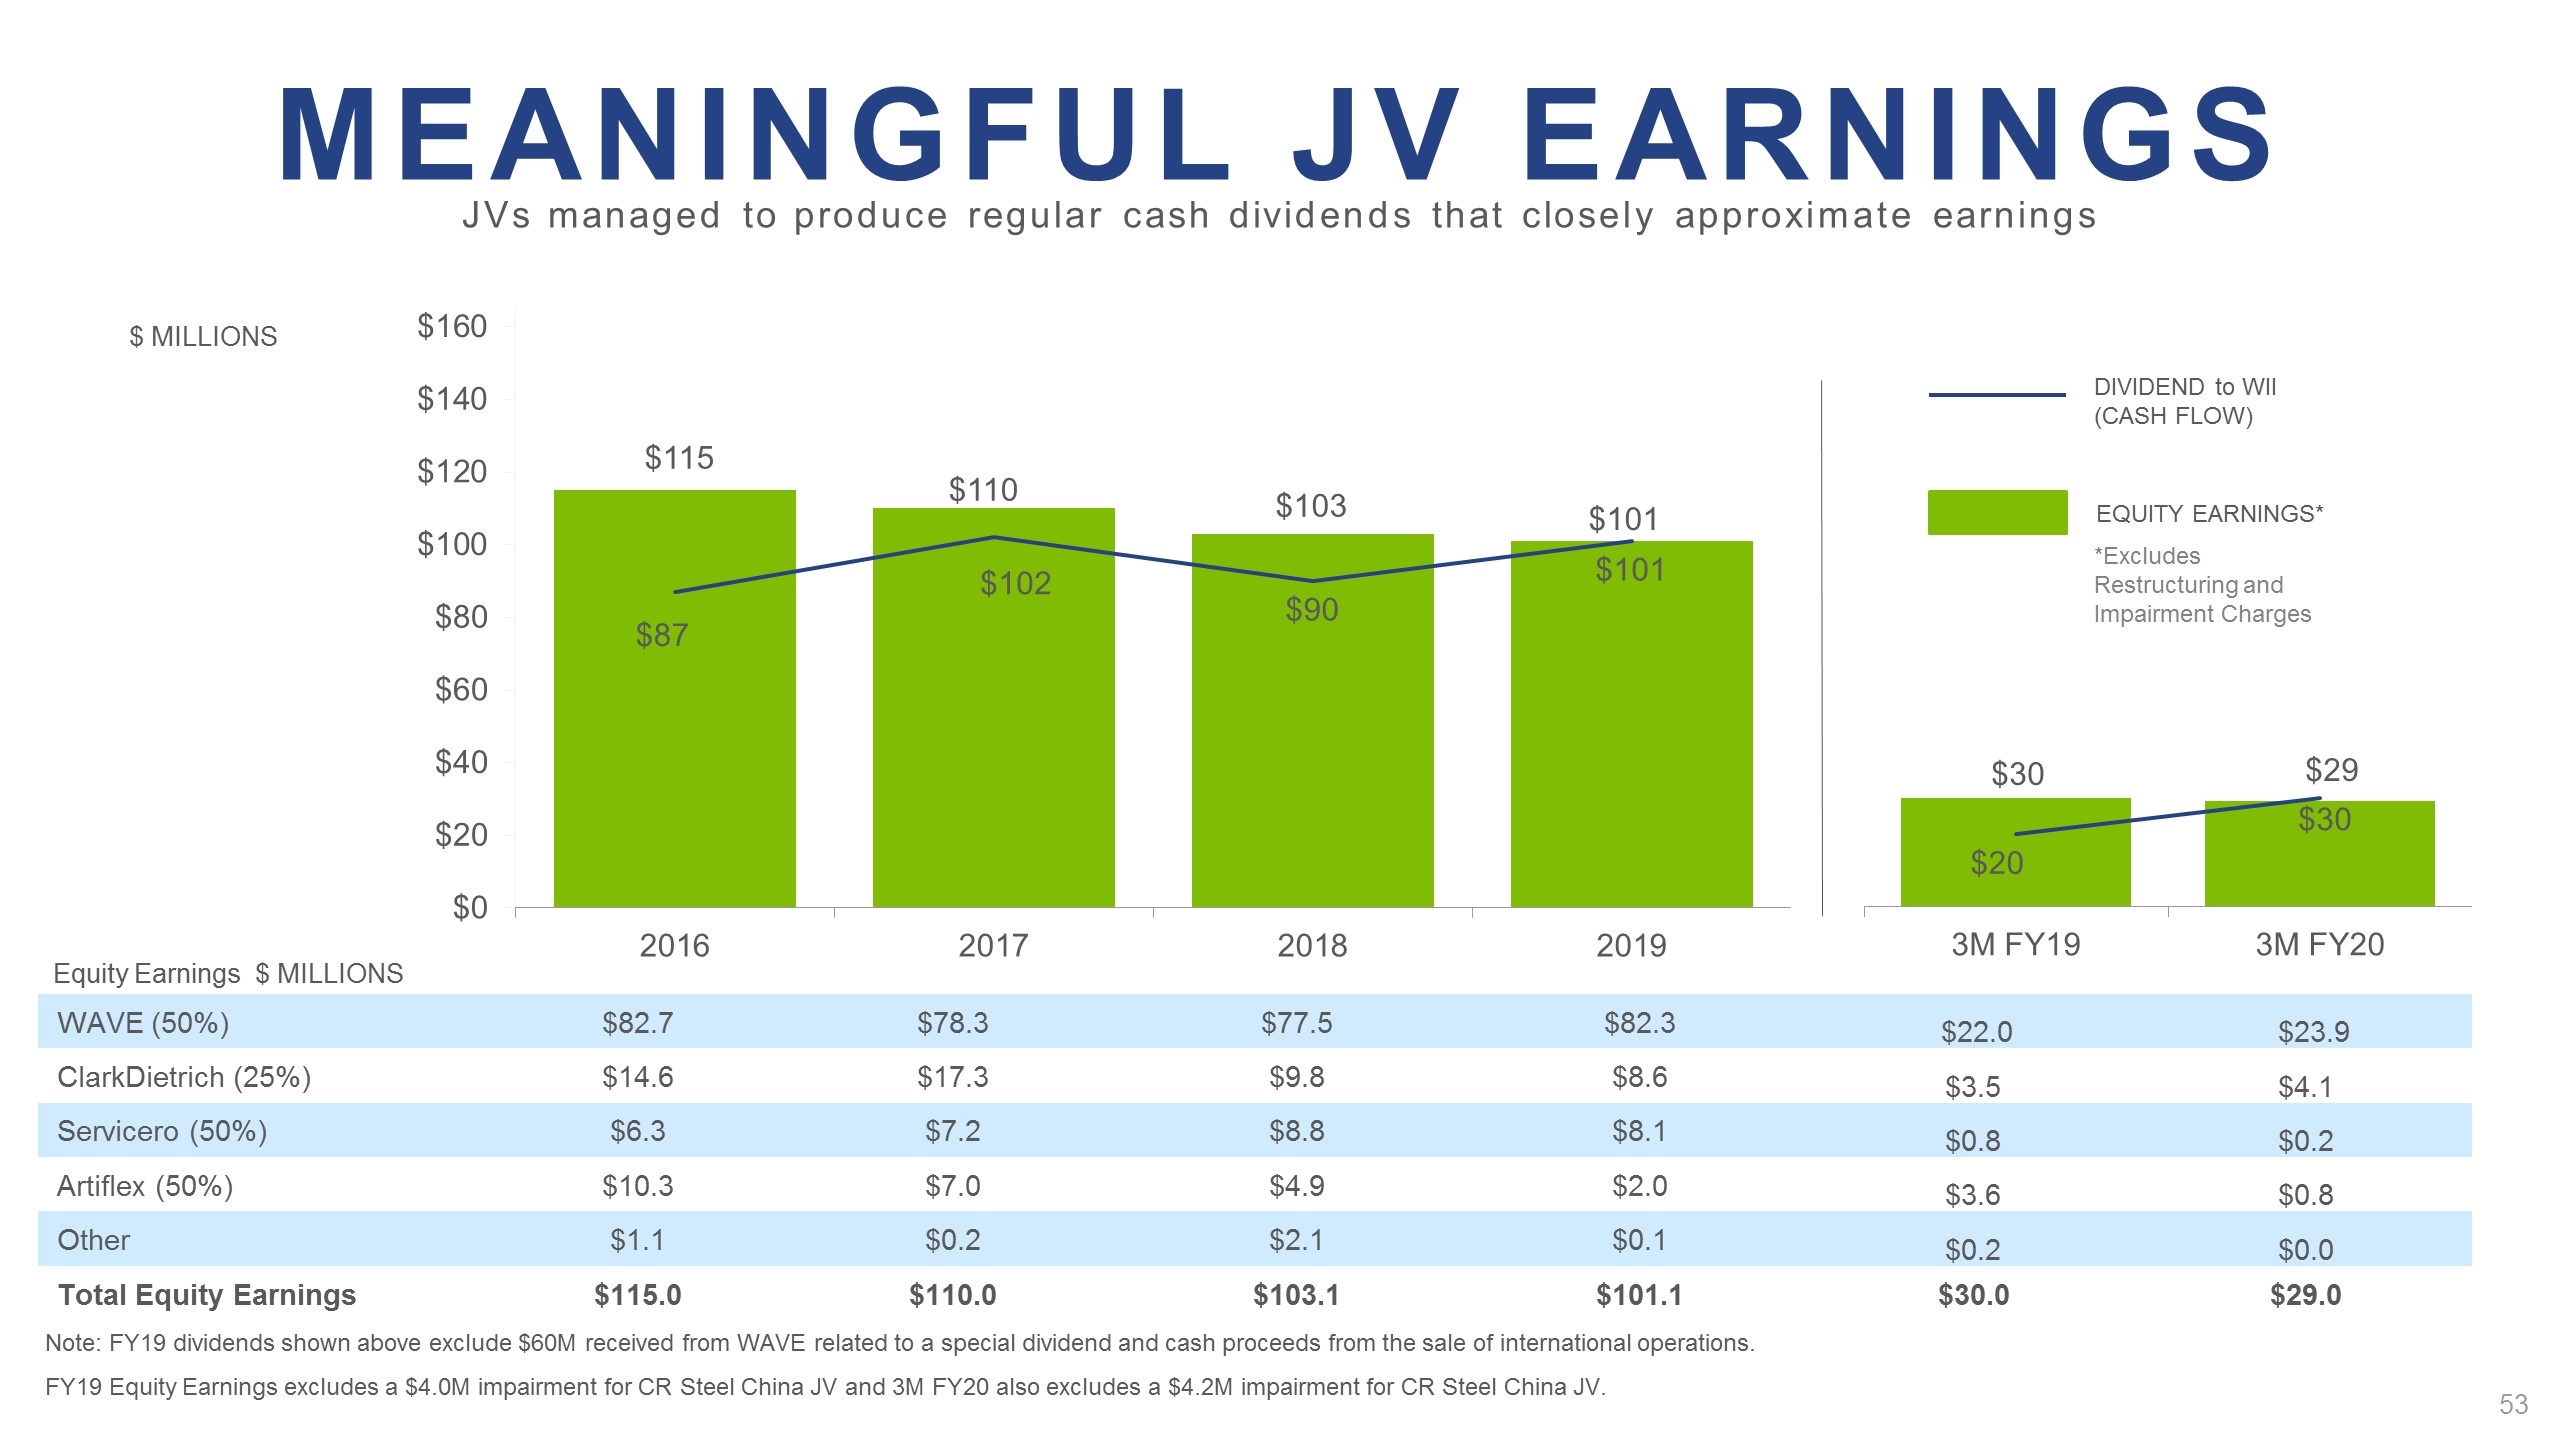
*Excludes Restructuring and Impairment Charges DIVIDEND to WII (CASH FLOW) EQUITY EARNINGS* Equity Earnings $ MILLIONS WAVE (50%) $82.7 $78.3 $77.5 $82.3 $22.0 $23.9 ClarkDietrich (25%) $14.6 $17.3 $9.8 $8.6 $3.5 $4.1 Servicero (50%) $6.3 $7.2 $8.8 $8.1 $0.8 $0.2 Artiflex (50%) $10.3 $7.0 $4.9 $2.0 $3.6 $0.8 Other $1.1 $0.2 $2.1 $0.1 $0.2 $0.0 Total Equity Earnings $115.0 $110.0 $103.1 $101.1 $30.0 $29.0 Note: FY19 dividends shown above exclude $60M received from WAVE related to a special dividend and cash proceeds from the sale of international operations. FY19 Equity Earnings excludes a $4.0M impairment for CR Steel China JV and 3M FY20 also excludes a $4.2M impairment for CR Steel China JV. $ MILLIONS JVs managed to produce regular cash dividends that closely approximate earnings Meaningful JV Earnings
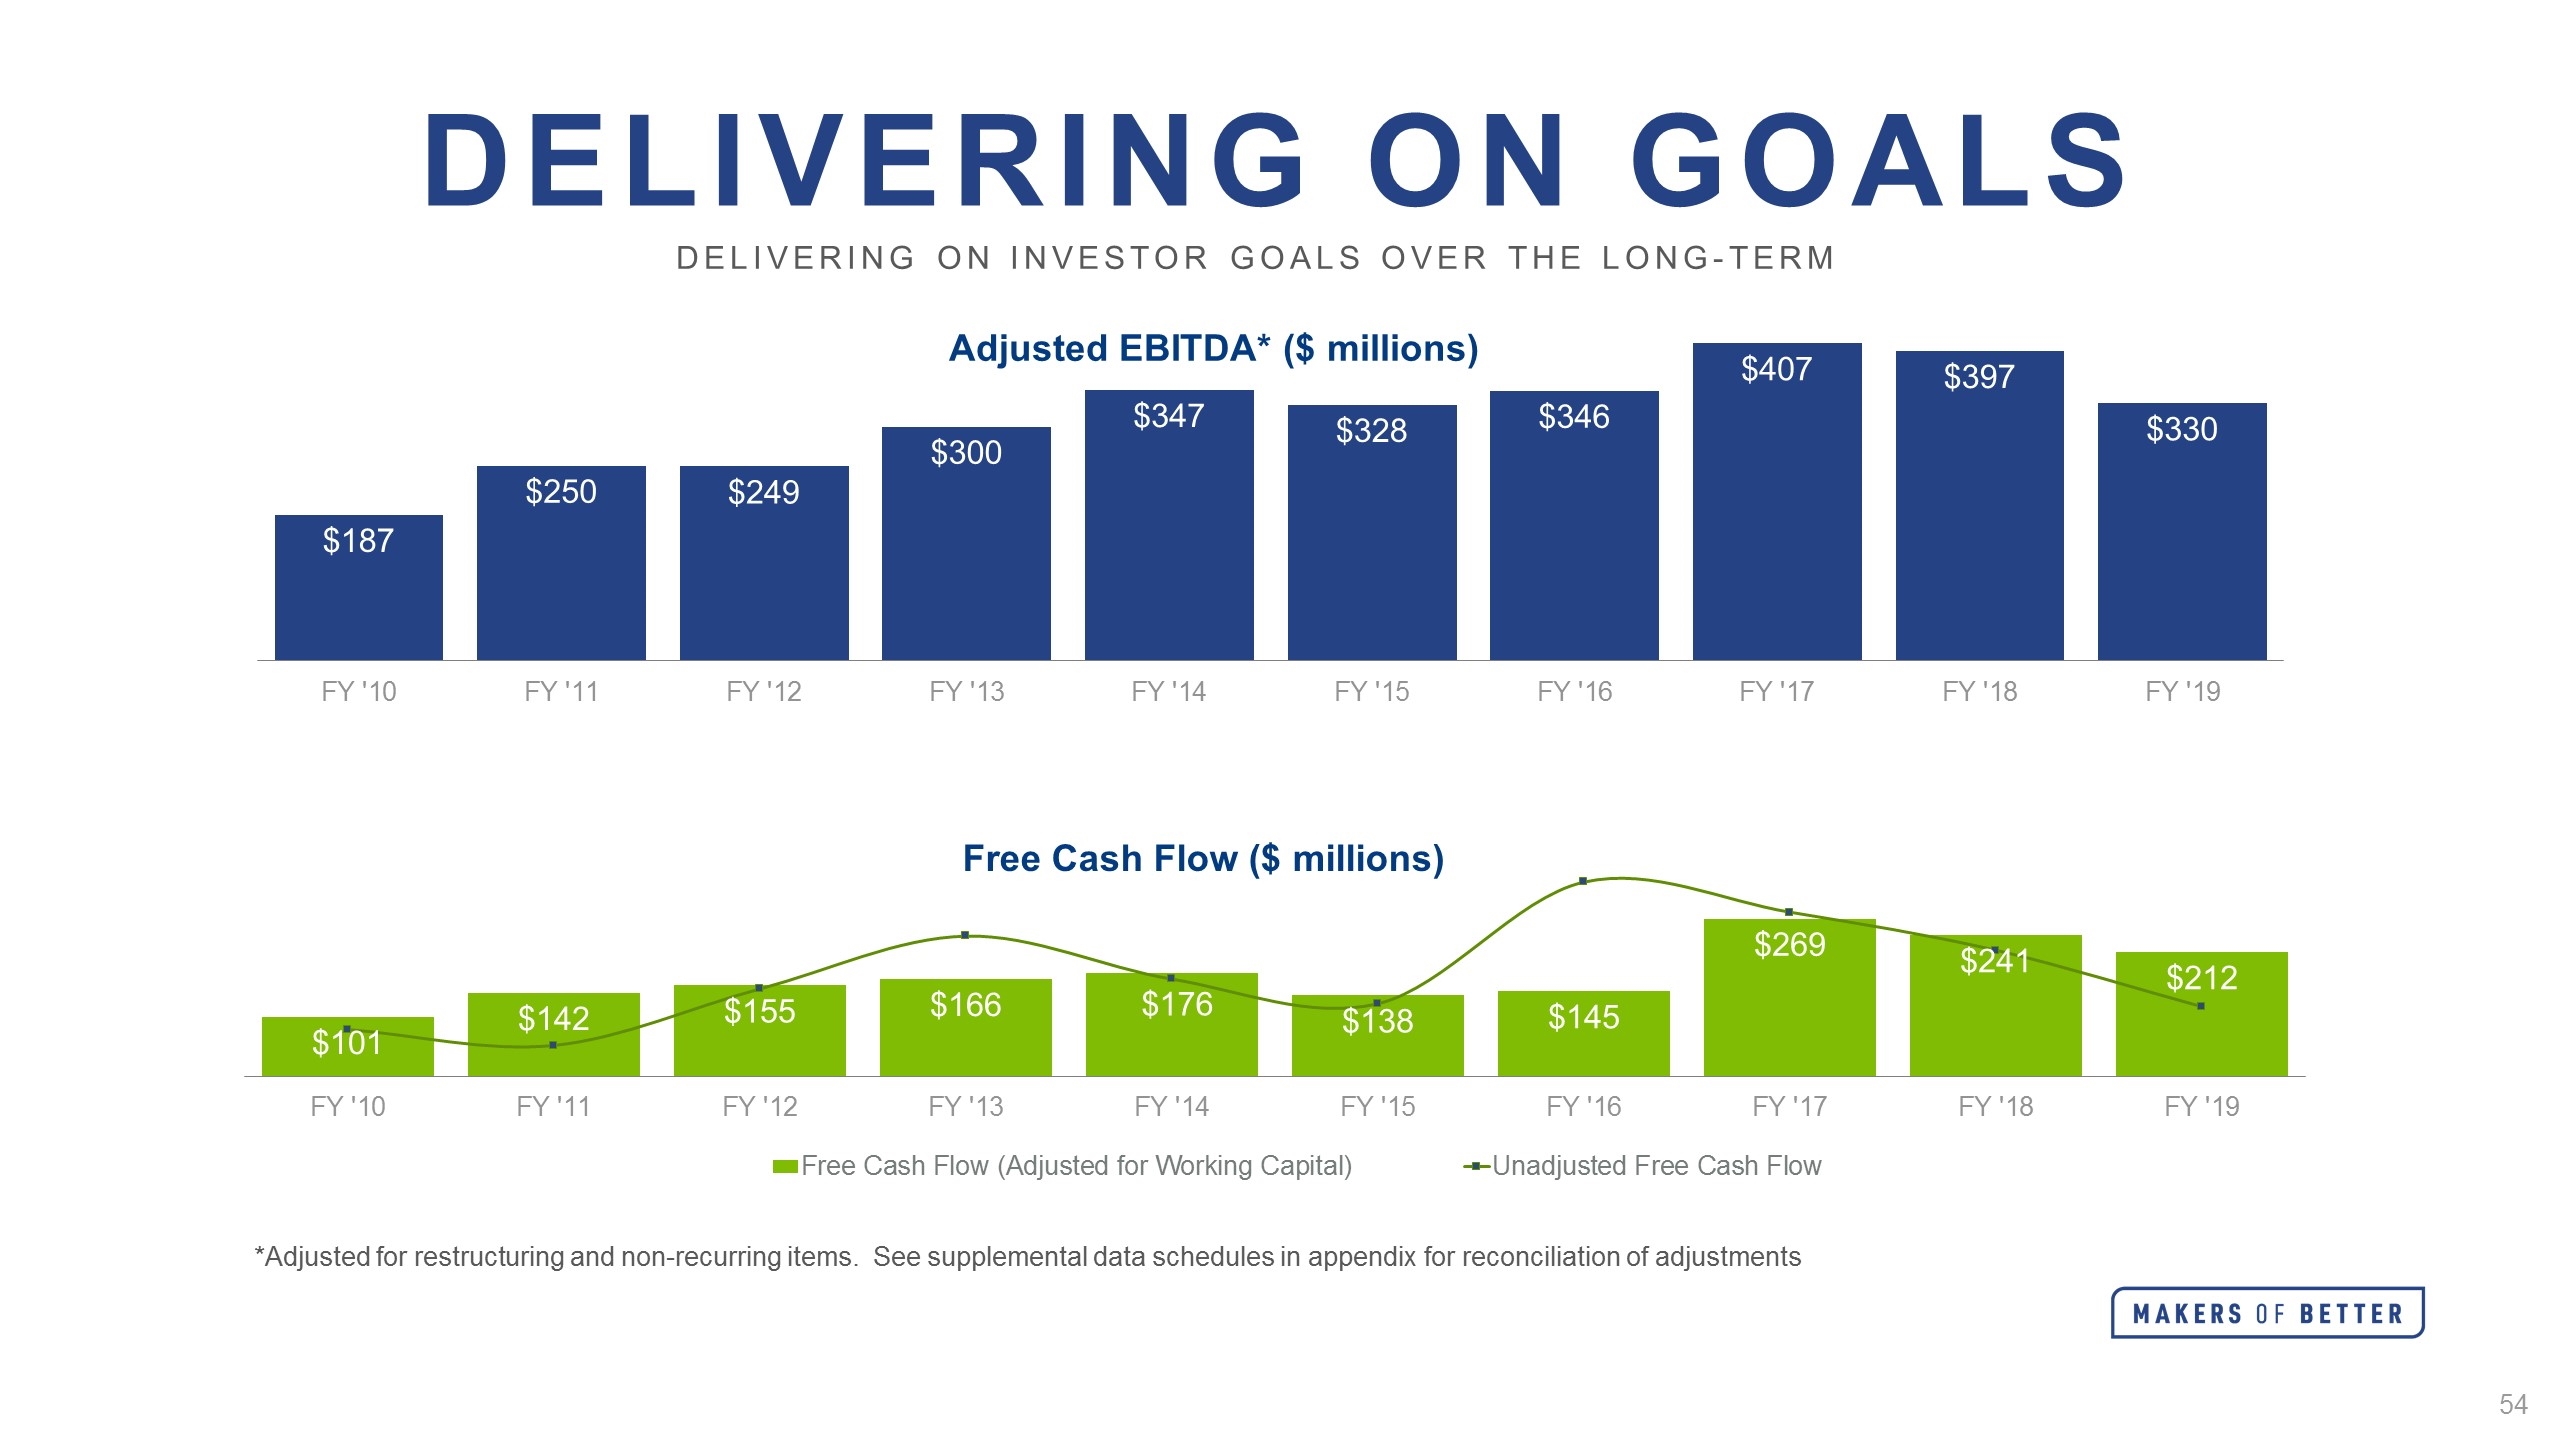
DELIVERING ON GOALS *Adjusted for restructuring and non-recurring items. See supplemental data schedules in appendix for reconciliation of adjustments Delivering on investor goals over the long-term Adjusted EBITDA* ($ millions) Free Cash Flow ($ millions)
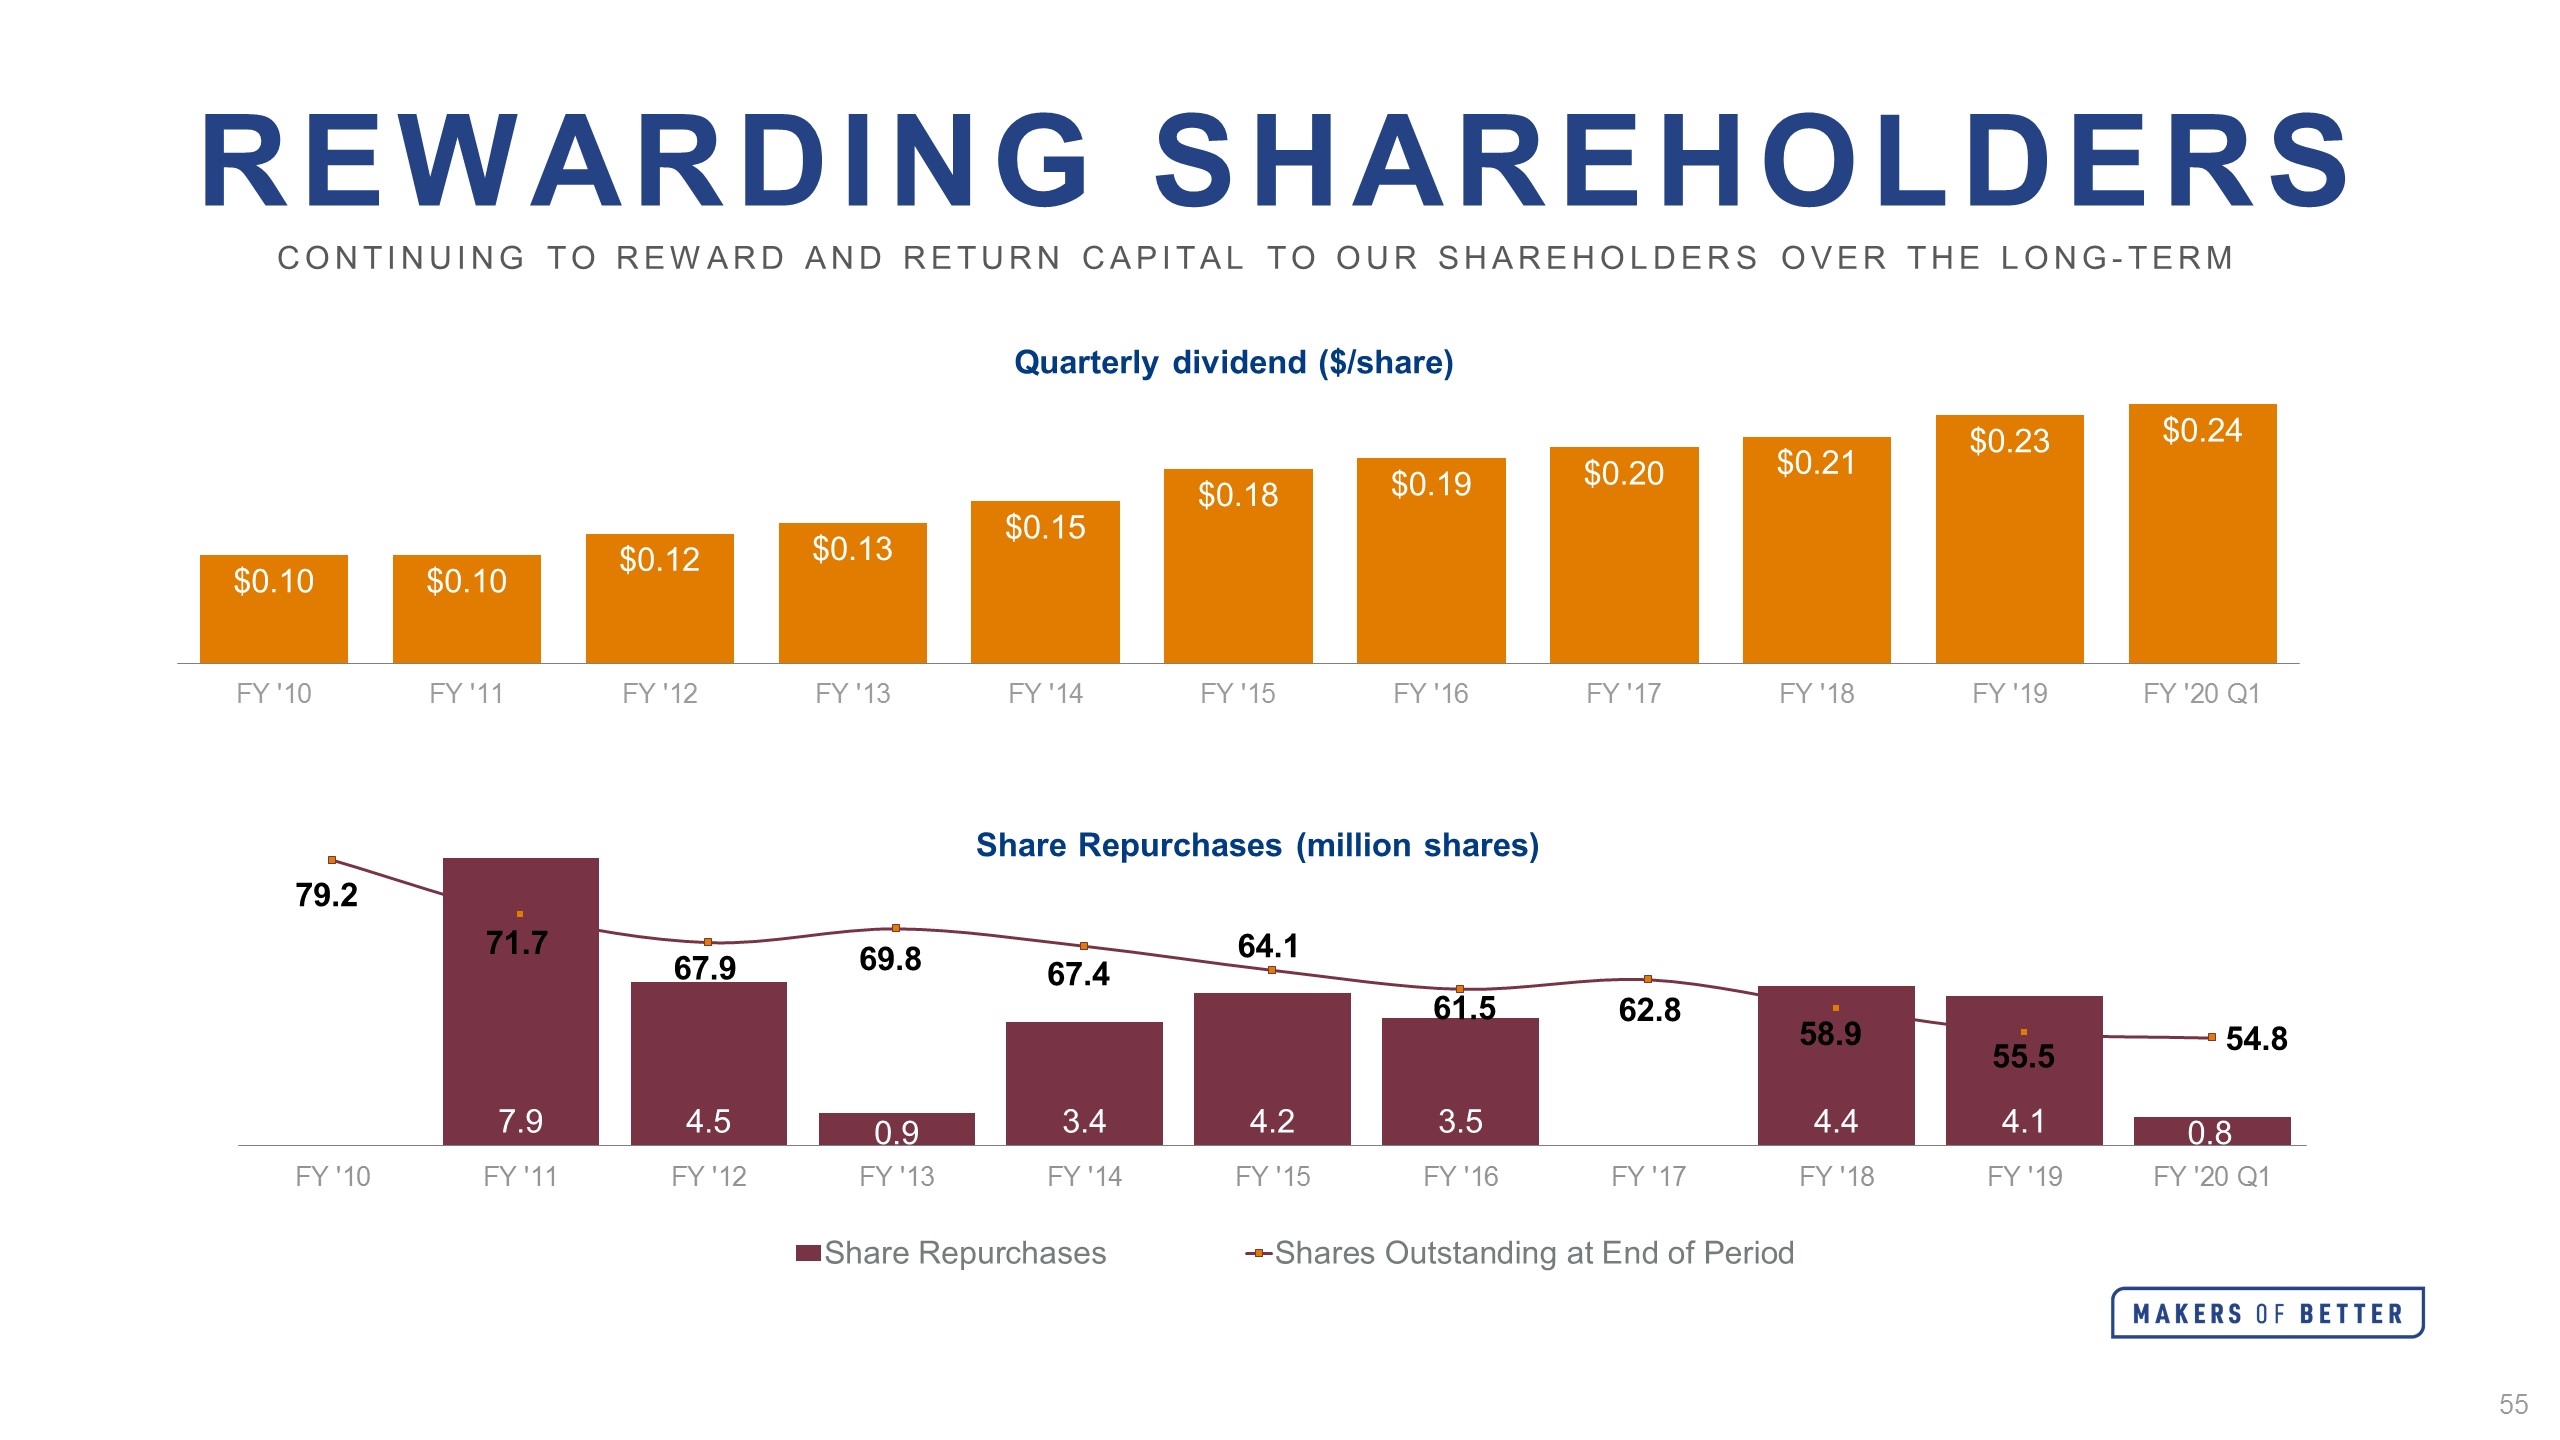
REWARDING SHAREHOLDERS Continuing to reward and return capital to our shareholders over the long-term Quarterly dividend ($/share) Share Repurchases (million shares)
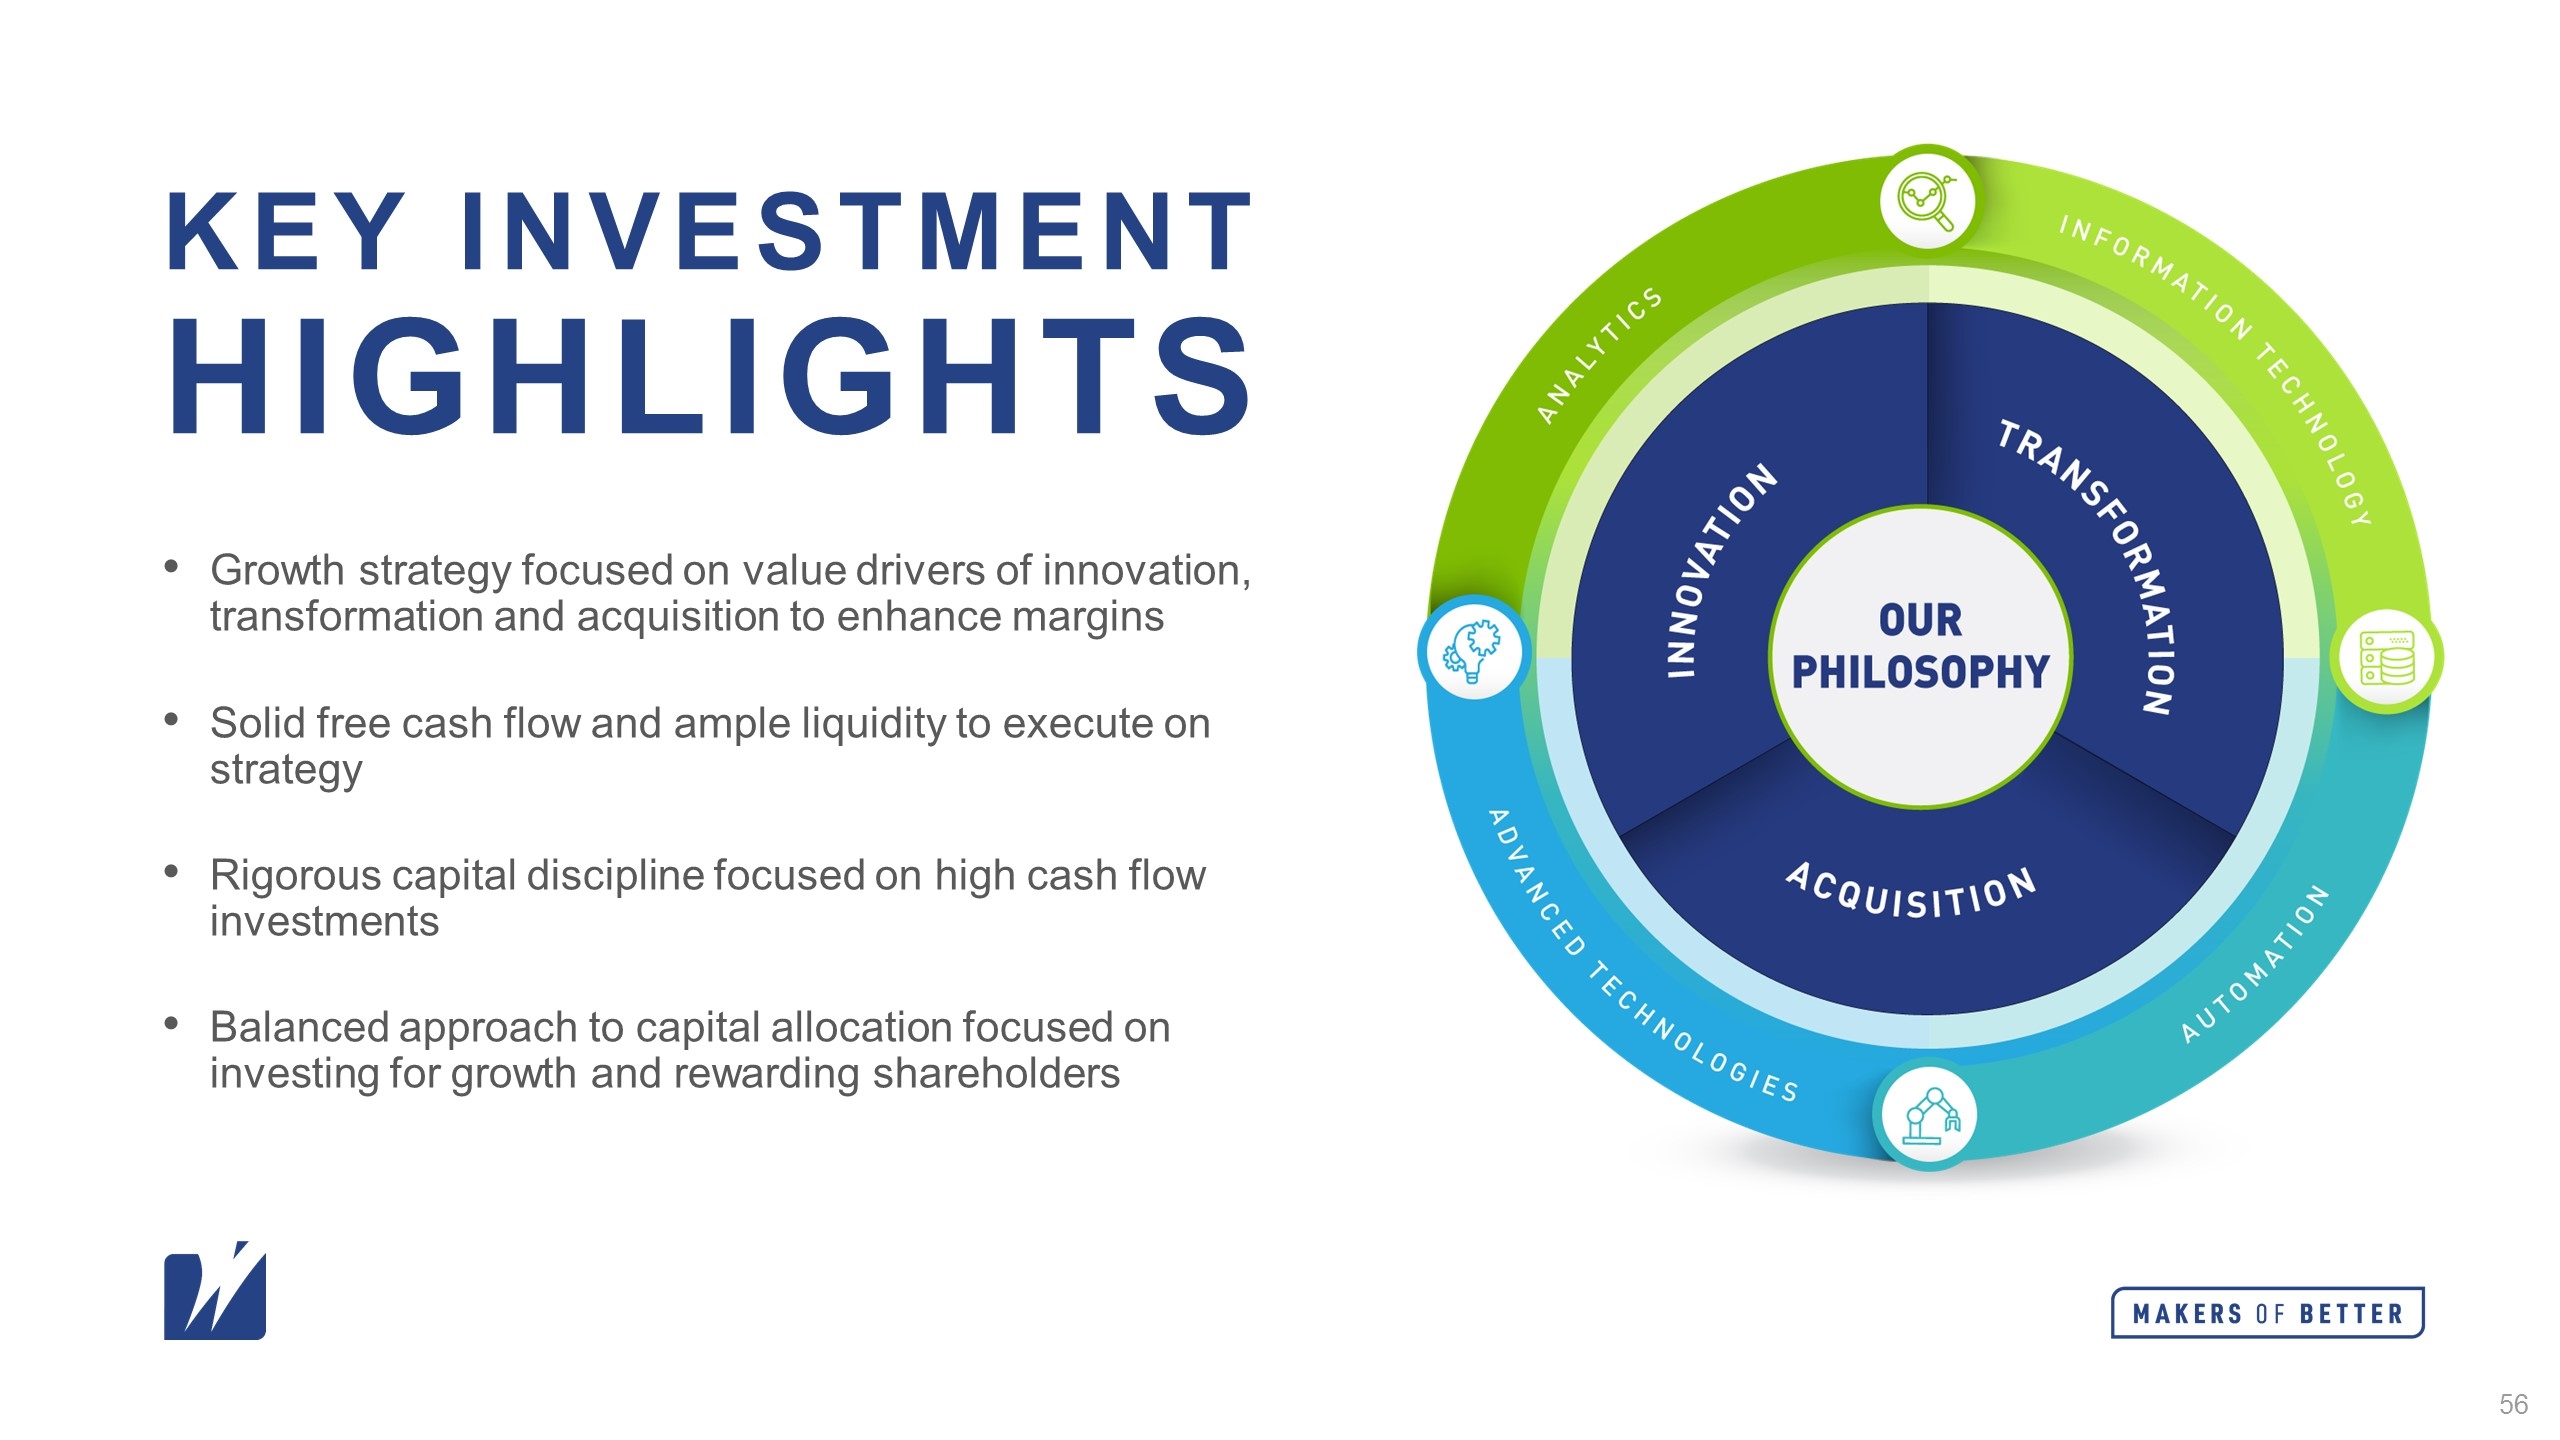
Key investment highlights Growth strategy focused on value drivers of innovation, transformation and acquisition to enhance margins Solid free cash flow and ample liquidity to execute on strategy Rigorous capital discipline focused on high cash flow investments Balanced approach to capital allocation focused on investing for growth and rewarding shareholders
Q&A
For Investor Day Replay
SUPPLEMENTAL DATA
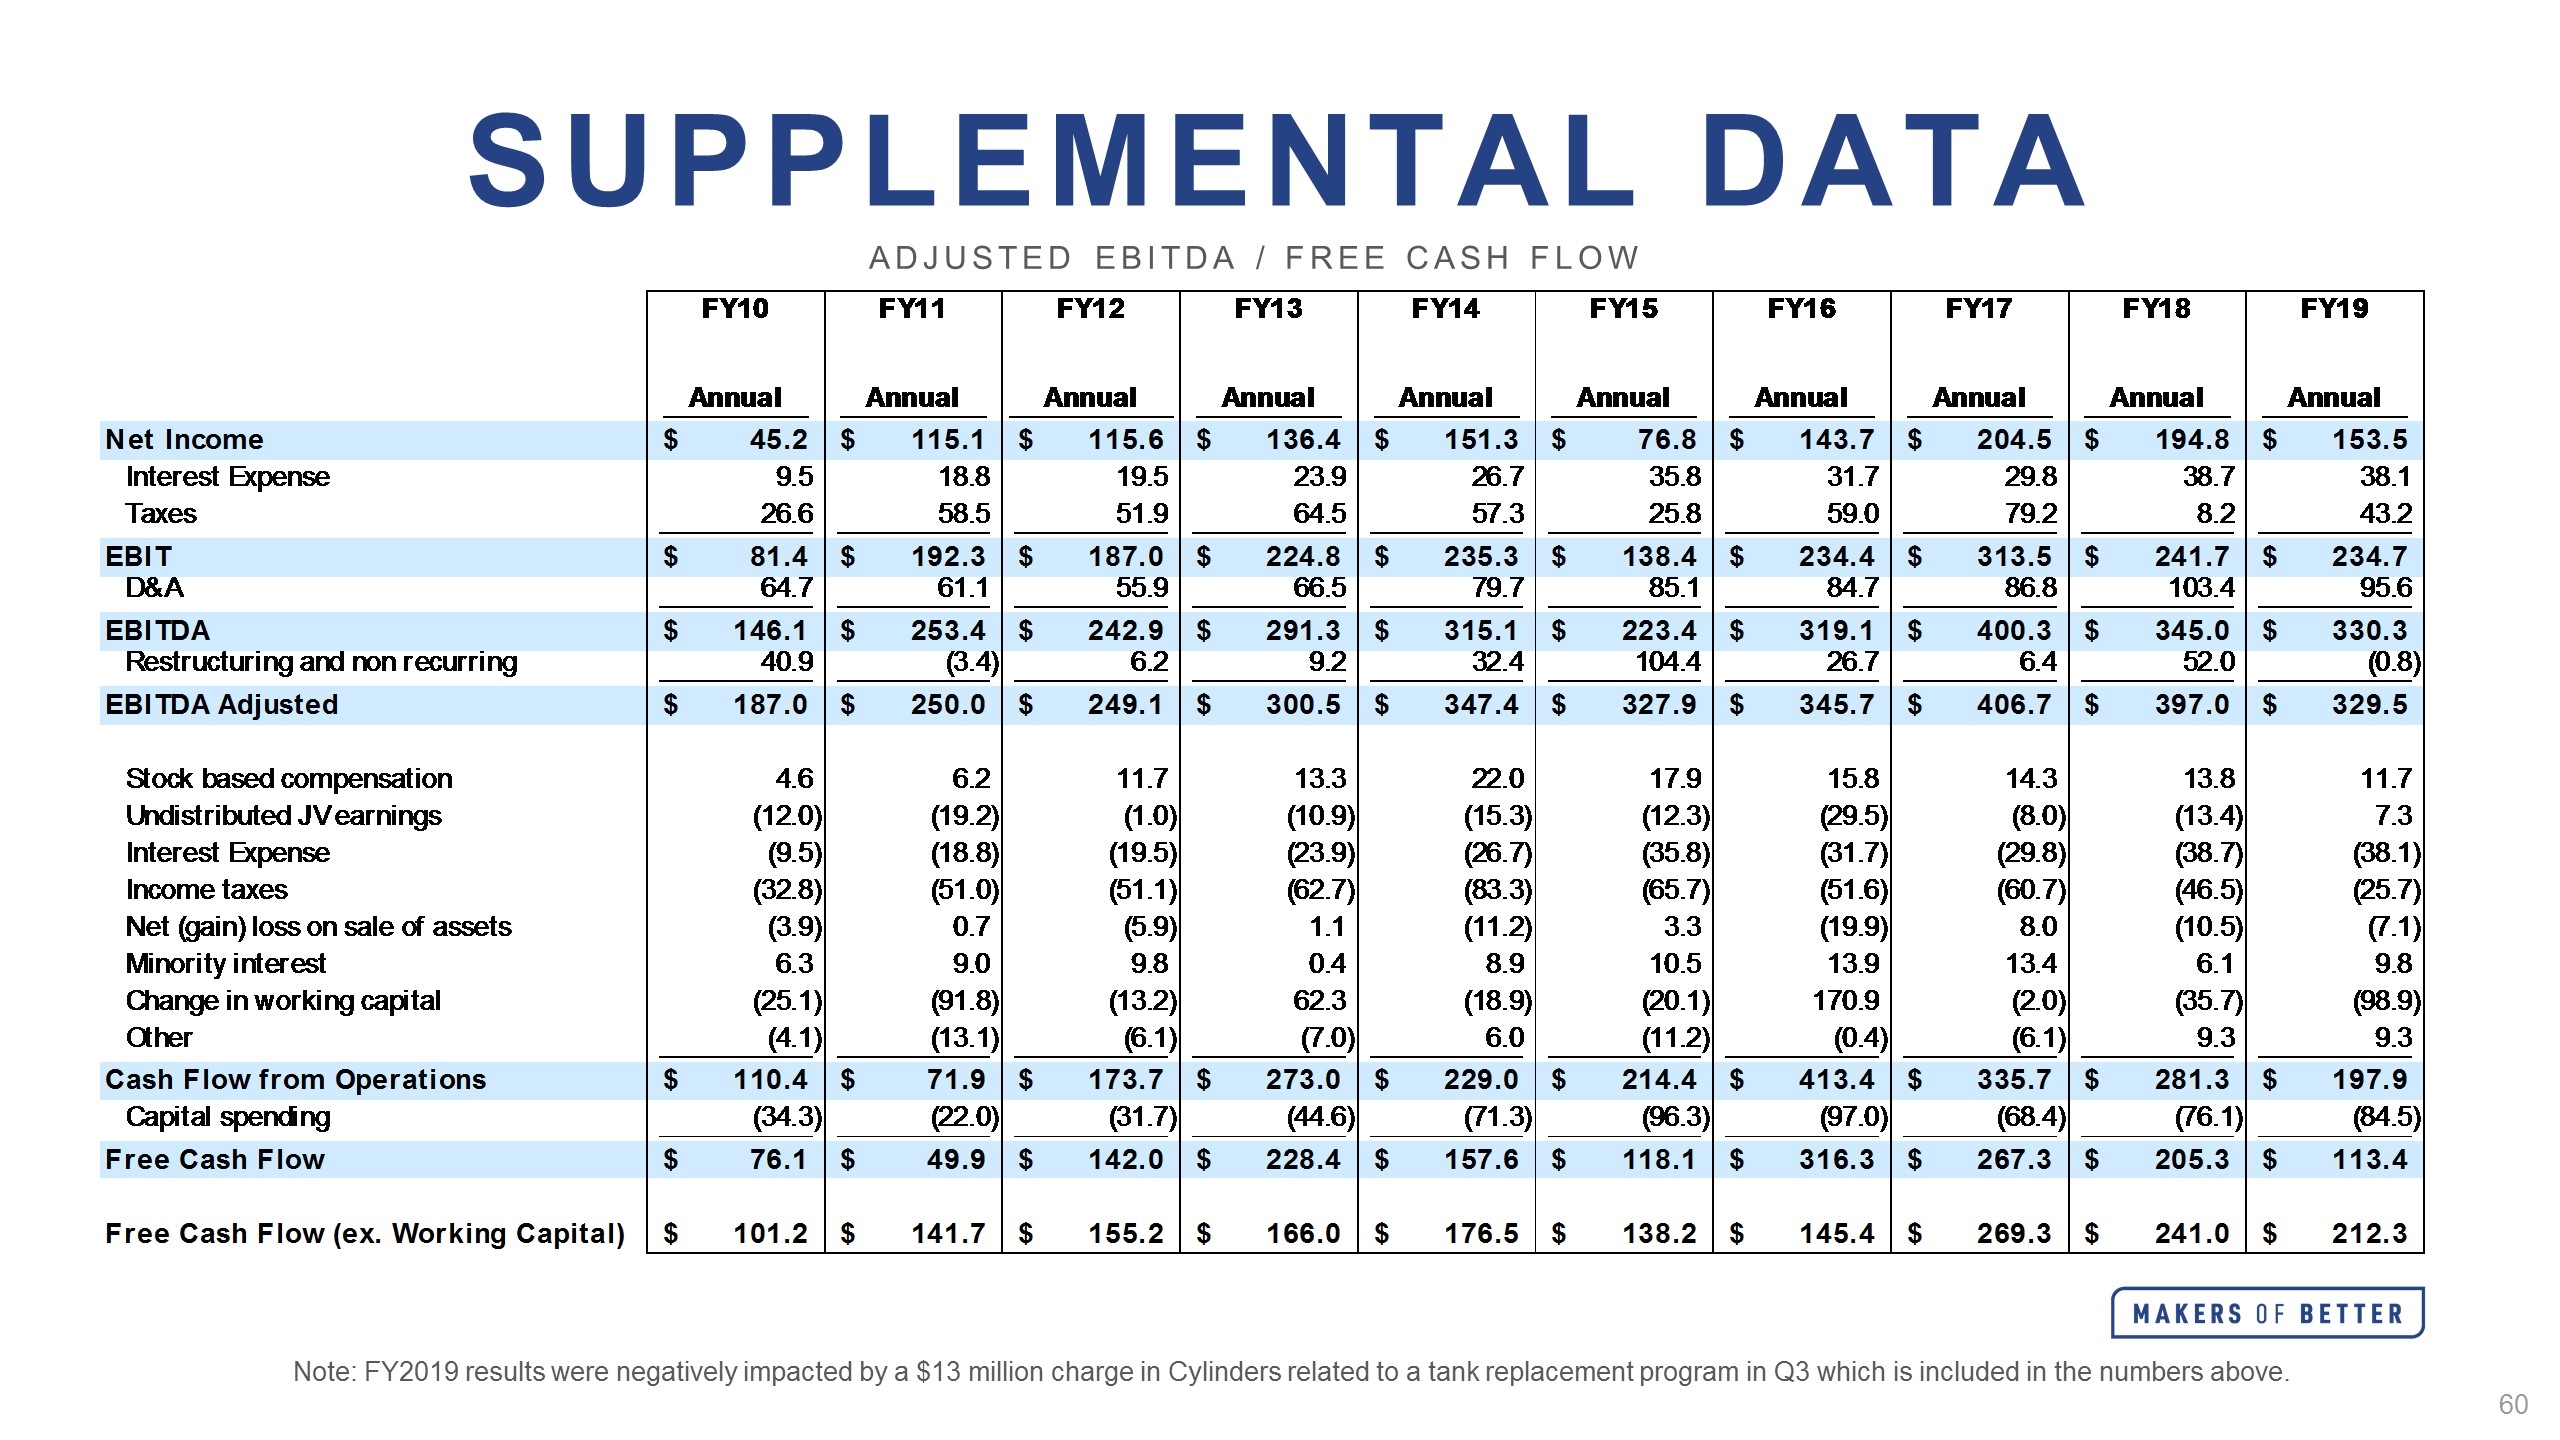
Supplemental Data Adjusted EBITDA / Free Cash Flow Note: FY2019 results were negatively impacted by a $13 million charge in Cylinders related to a tank replacement program in Q3 which is included in the numbers above. Cash Flow ($ in Millions) FY10 FY11 FY12 FY13 FY14 FY15 FY16 FY17 FY18 FY19 Annual Annual Annual Annual Annual Annual Annual Annual Annual Annual Net Income $45,241,267.960000001 $,115,065,076.18799999 $,115,594,666.336 $,136,441,653.42500001 $,151,299,717.89199999 $76,785,318.3999993 $,143,715,328.65799999 $,204,514,560.54699999 $,194,794,485.7699999 $,153,454,753.38600001 Interest Expense 9,534,098.8499999996 18,755,991.829999998 19,496,616.949999999 23,917,860.993999999 26,671,177.243999999 35,800,208.825000003 31,669,912.227000002 29,795,833.449000001 38,675,487.564999998 38,062,649.381999999 Taxes 26,649,998.2 58,496,120.1999997 51,904,481.869999997 64,465,326.114 57,349,113.138999999 25,771,735.557999998 58,987,280.924000002 79,190,410.8000001 8,219,684.9929999998 43,183,492.6999999 EBIT $81,425,364.829999998 $,192,317,188.1999998 $,186,995,765.15599999 $,224,824,840.53299999 $,235,320,008.27499998 $,138,357,262.38699999 $,234,372,521.80899999 $,313,500,804.400001 $,241,689,657.63499999 $,234,700,894.77500001 D&A 64,653,254.200000003 61,057,577.90000004 55,873,017.629000001 66,468,908.270999998 79,730,415.341000006 85,088,556.9000003 84,699,102.32000005 86,792,592.822999999 ,103,358,983.388 95,602,469.376000002 EBITDA $,146,078,619.3 $,253,374,765.10999998 $,242,868,782.785 $,291,293,748.80400002 $,315,050,423.616 $,223,445,818.396 $,319,071,623.84099996 $,400,293,396.82700002 $,345,048,641.23 $,330,303,364.15100002 Restructuring and non recurring 40,933,873.509999998 -3,397,430.676 6,189,073.3600000003 9,177,272 32,355,846.858000003 ,104,447,373.48800001 26,657,471.664999999 6,410,972.8430000003 51,955,907.828000002 -,786,021.45099999988 EBITDA Adjusted $,187,012,492.55000001 $,249,977,334.384 $,249,057,856.16499999 $,300,471,020.79400003 $,347,406,270.47399998 $,327,893,191.884 $,345,729,095.50599998 $,406,704,369.67000002 $,397,004,548.861 $,329,517,342.69999999 Stock based compensation 4,569,852.17 6,173,000 11,741,813.789999999 13,269,818.99 22,017,340.489999998 17,916,104.111000001 15,835,950.82 14,349,414 13,757,523 11,732,828.300000001 Undistributed JV earnings ,-12,007,071.109999999 ,-19,188,000 -1,018,963.34 ,-10,948,467.34 ,-15,333,091.65 ,-12,298,958.367000001 ,-29,473,054.390000001 -8,023,052.7699999996 ,-13,352,140.91 7,346,919.3200000003 Interest Expense -9,534,098.8499999996 ,-18,755,991.829999998 ,-19,496,616.949999999 ,-23,917,860.993999999 ,-26,671,177.243999999 ,-35,800,208.825000003 ,-31,669,912.227000002 ,-29,795,833.449000001 ,-38,675,487.564999998 ,-38,062,649.381999999 Income taxes ,-32,760,003.2 ,-51,014,120.1999997 ,-51,129,337.149999999 ,-62,667,192.114 ,-83,264,941.669 ,-65,732,018.118000001 ,-51,632,919.924000002 ,-60,747,550.8000001 ,-46,456,631.993000001 ,-25,748,754.6999999 Net (gain) loss on sale of assets -3,908,420.94 ,652,000 -5,918,409.7630000003 1,071,499.56 ,-11,211,687.598999999 3,277,209.9350000001 ,-19,872,941.184 7,950,822.9649999999 ,-10,522,486.506999999 -7,058,865.429999996 Minority interest 6,265,922.1299999999 8,968,255.557 9,758,399.2129999995 ,392,817.97399999999 8,852,436.7960000001 10,470,832.5999999 13,913,450.622 13,422,415.946 6,056,013.8609999996 9,818,024.9059999995 Change in working capital ,-25,147,471.710000008 ,-91,815,000 ,-13,187,233.432999995 62,345,481.252000004 ,-18,860,107.19999996 ,-20,111,930.773999989 ,170,904,207.73200002 -2,046,520.721999988 ,-35,729,552.413000017 ,-98,948,757.792999983 Other -4,072,409.7700000014 ,-13,103,156.704 -6,072,682.1250000009 -7,039,228.2440000009 6,041,585.9979999997 ,-11,238,220.347000001 -,350,189.81400000118 -6,142,375.7640000004 9,262,759.2990000024 9,262,757.2540000007 Cash Flow from Operations $,110,418,791.45 $71,894,321.405000031 $,173,734,826.40699998 $,272,977,889.88800001 $,228,976,628.57600001 $,214,376,001.505 $,413,383,687.14099997 $,335,671,689.86799997 $,281,344,546.45200002 $,197,858,846.255 Capital spending ,-34,318,267.75 ,-22,025,000 ,-31,712,717.370999999 ,-44,587,767.83999999 ,-71,338,214.481000006 ,-96,254,653.18999994 ,-97,036,280.723000005 ,-68,385,475.363999993 ,-76,087,910.944999993 ,-84,498,302.790999994 Free Cash Flow $76,100,523.700000003 $49,869,321.405000031 $,142,022,109.3599998 $,228,390,122.80400002 $,157,638,414.95 $,118,121,348.486 $,316,347,406.41799998 $,267,286,214.50399998 $,205,256,635.50700003 $,113,360,543.464 Free Cash Flow (ex. Working Capital) $,101,247,995.41000001 $,141,684,321.40500003 $,155,209,342.46899998 $,166,044,641.55200002 $,176,498,521.11500001 $,138,233,279.25999999 $,145,443,198.68599996 $,269,332,735.22599995 $,240,986,187.92000005 $,212,309,301.25699997 Check- EBITDA Adjusted 1.0000020265579224E-2 -4.9999982118606567E-2 1.9999980926513672E-2 -9.9999904632568359E-3 0 0 0 0 9.9999904632568359E-3 0 Check- Free Cash Flow 0 0 0 9.9999308586120605E-3 0 0 0 0 0 0
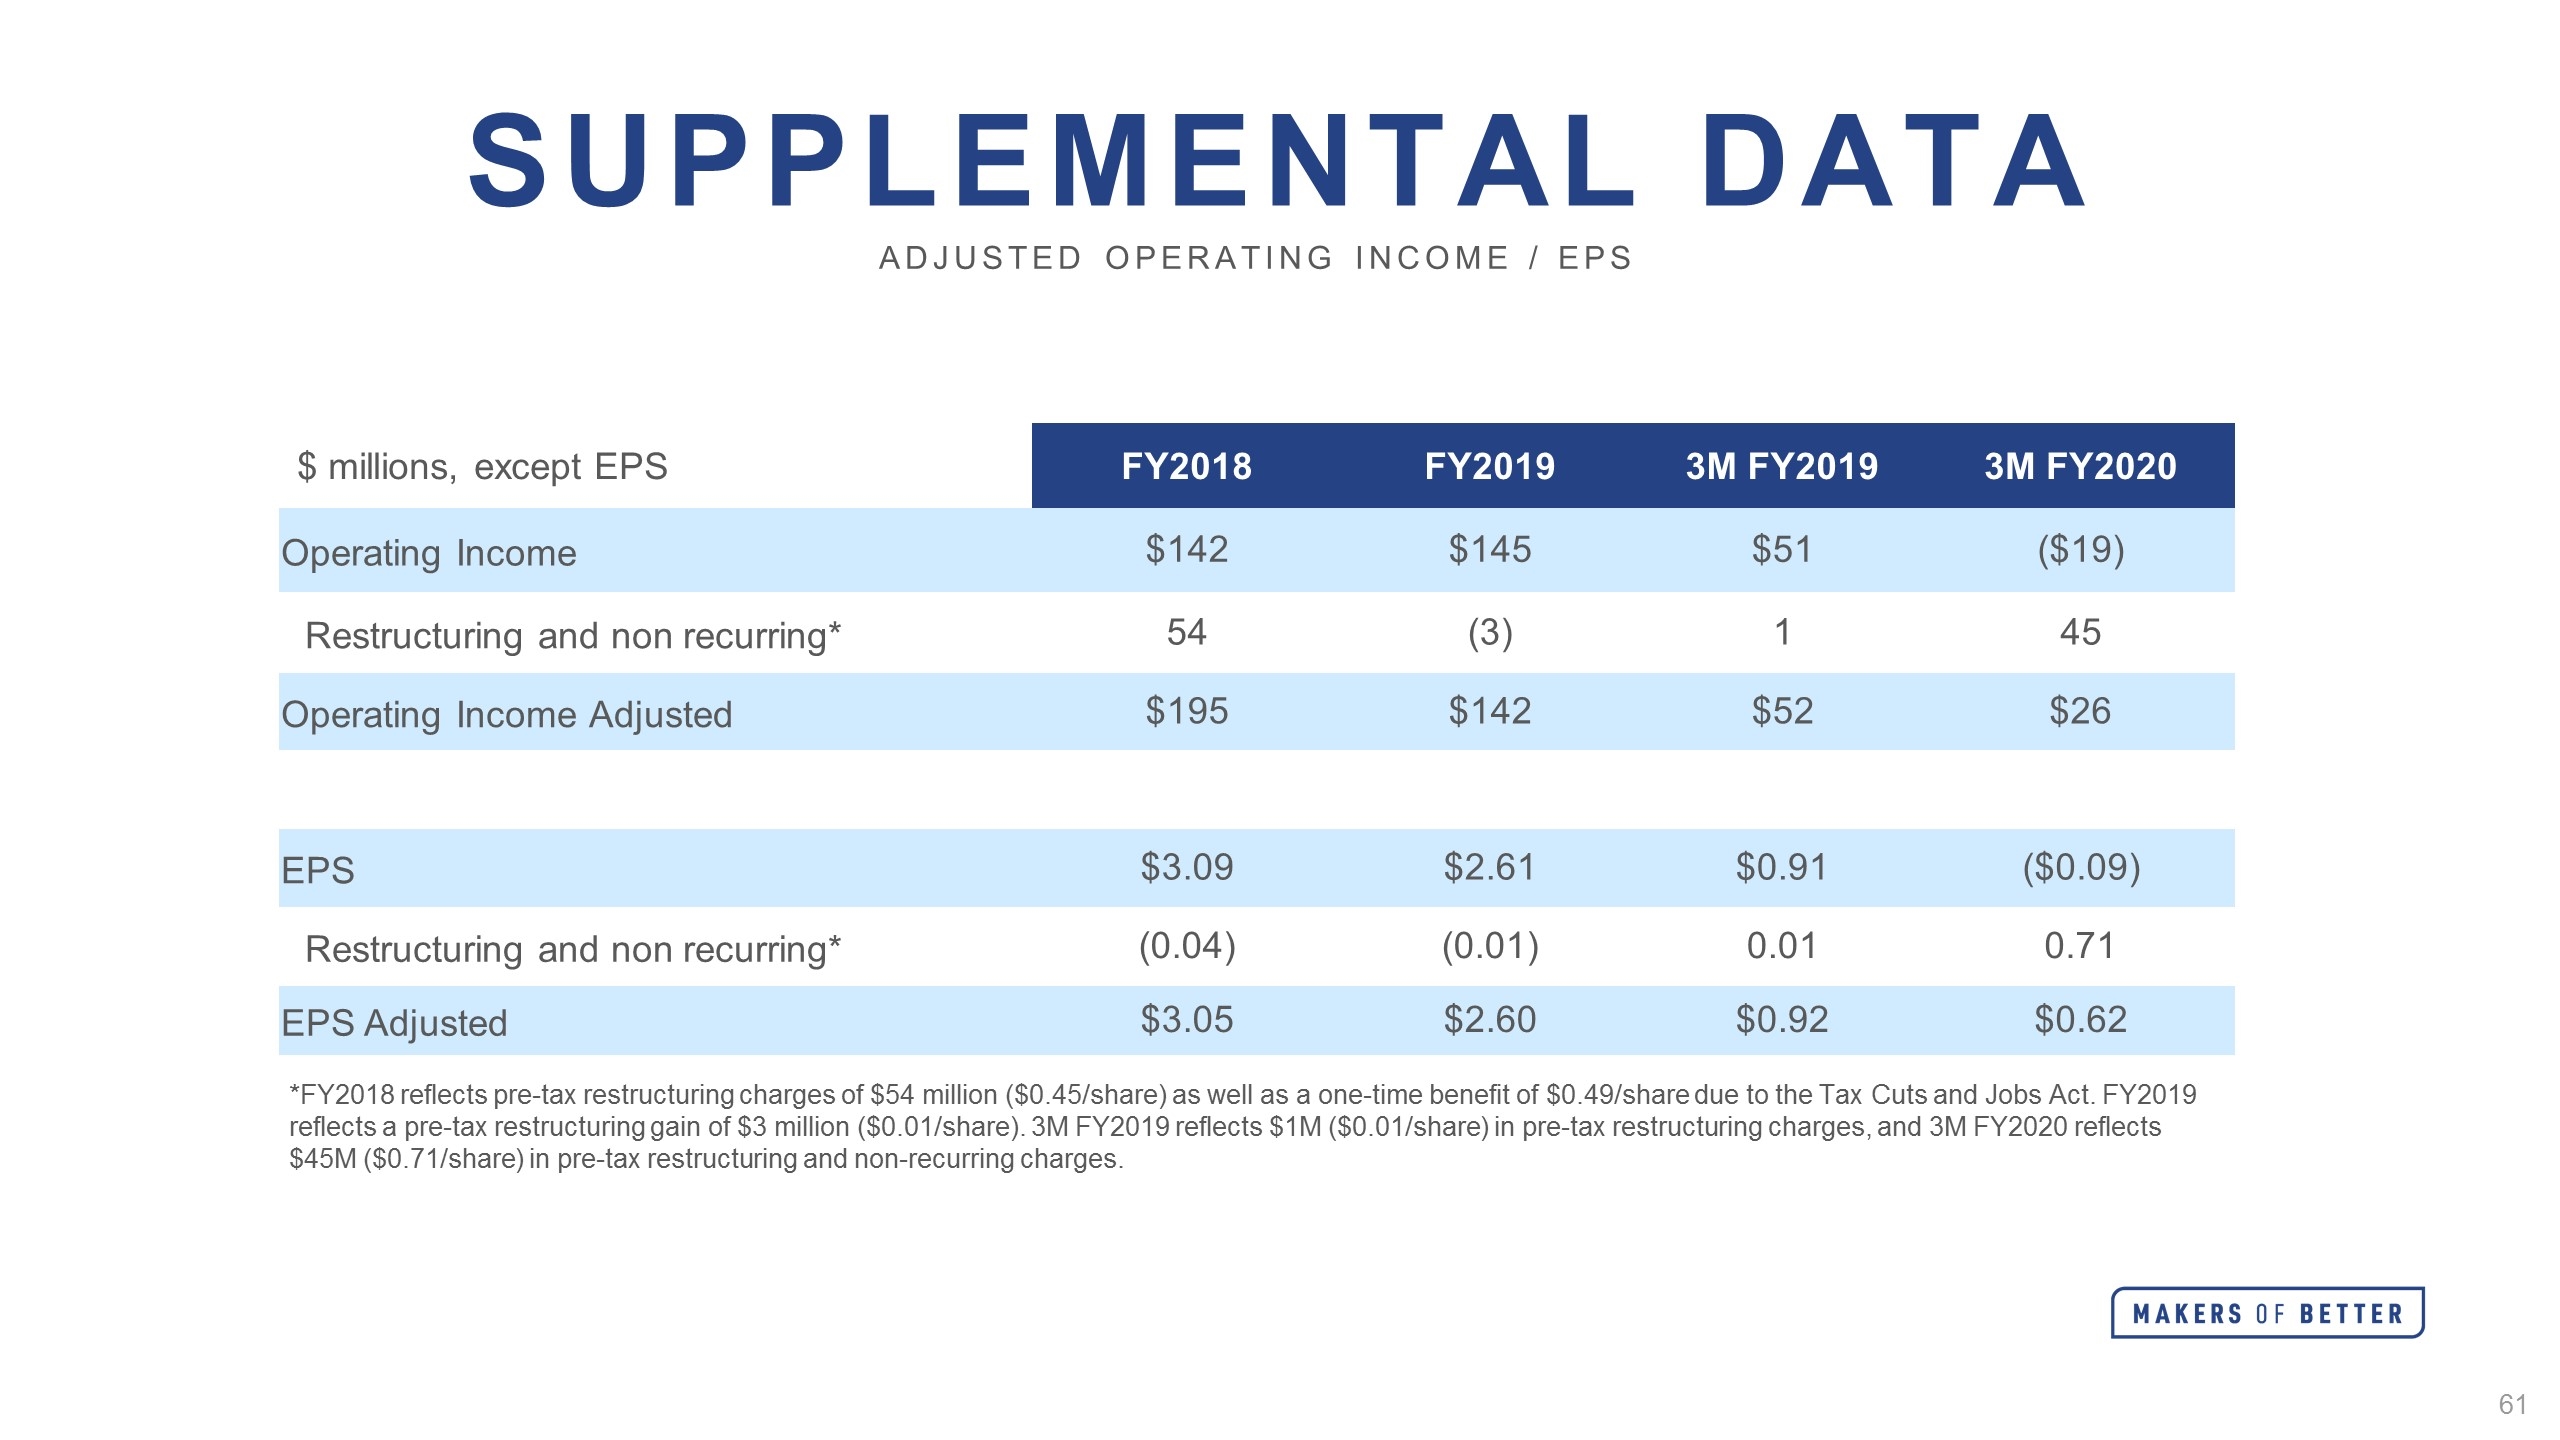
Supplemental Data Adjusted Operating Income / EPS *FY2018 reflects pre-tax restructuring charges of $54 million ($0.45/share) as well as a one-time benefit of $0.49/share due to the Tax Cuts and Jobs Act. FY2019 reflects a pre-tax restructuring gain of $3 million ($0.01/share). 3M FY2019 reflects $1M ($0.01/share) in pre-tax restructuring charges, and 3M FY2020 reflects $45M ($0.71/share) in pre-tax restructuring and non-recurring charges. $ millions, except EPS FY2018 FY2019 3M FY2019 3M FY2020 Operating Income $142 $145 $51 ($19) Restructuring and non recurring* 54 (3) 1 45 Operating Income Adjusted $195 $142 $52 $26 EPS $3.09 $2.61 $0.91 ($0.09) Restructuring and non recurring* (0.04) (0.01) 0.01 0.71 EPS Adjusted $3.05 $2.60 $0.92 $0.62
Safe Harbor Statement Worthington Industries wishes to take advantage of the Safe Harbor provisions included in the Private Securities Litigation Reform Act of 1995 (the “Act"). Statements by the Company which are not historical information constitute "forward looking statements" within the meaning of the Act. All forward-looking statements are subject to risks and uncertainties which could cause actual results to differ from those projected. Factors that could cause actual results to differ materially include risks described from time to time in the Company's filings with the Securities and Exchange Commission. 614.840.4663 Marcus.Rogier@WorthingtonIndustries.com CONTACT


