UNITED STATES
SECURITIES AND EXCHANGE COMMISSION
WASHINGTON, D.C. 20549
FORM 10-K
(Mark One)
x | ANNUAL REPORT PURSUANT TO SECTION 13 OR 15(d) OF THE SECURITIES EXCHANGE ACT OF 1934 |
For Fiscal Year Ended December 31, 2013.
or
¨ | TRANSITION REPORT PURSUANT TO SECTION 13 OR 15(d) OF THE SECURUTIES EXCHANGE ACT OF 1934 |
For the Transition Period from to .
Commission File Number 001-16249
ICG GROUP, INC.
(Exact Name of Registrant as Specified in Its Charter)
Delaware | | 23-2996071 |
(State or Other Jurisdiction of Incorporation or Organization) | | (I.R.S. Employer Identification Number) |
555 East Lancaster Ave., Suite 640, Radnor, PA | | 19087 |
(Address of Principal Executive Offices) | | (Zip Code) |
(610) 727-6900
(Registrant’s telephone number, including area code)
Securities registered pursuant to Section 12(b) of the Act:
Common stock, par value $0.001 per share | | The NASDAQ Stock Market LLC |
(Title of Each Class) | | (The NASDAQ Global Select Market) (Name of Each Exchange on Which Registered) |
Securities registered pursuant to Section 12(g) of the Act: None
Indicate by check mark if the Registrant is a well-known seasoned issuer, as defined in Rule 405 of the Securities Act. Yes ¨ No x
Indicate by check mark if the Registrant is not required to file reports pursuant to Section 13 or Section 15(d) of the Exchange Act. Yes ¨ No x
Indicate by check mark whether the Registrant (1) has filed all reports required to be filed by Section 13 or 15(d) of the Securities Exchange Act of 1934 during the preceding 12 months (or for such shorter period that the Registrant was required to file such reports) and (2) has been subject to such filing requirements for the past 90 days. Yes x No ¨
Indicate by check mark whether the Registrant has submitted electronically and posted on its corporate Website, if any, every Interactive Data File required to be submitted and posted pursuant to Rule 405 of Regulation S-T (§232.405 of this chapter) during the preceding 12 months (or for such shorter period that the Registrant was required to submit and post such files). Yes x No ¨
Indicate by check mark if disclosure of delinquent filers pursuant to Item 405 of Regulation S-K (§232.405 of this chapter) is not contained herein, and will not be contained, to the best of Registrant’s knowledge, in definitive proxy or information statements incorporated by reference in Part III of this Form 10-K or any amendment to this Form 10-K. ¨
Indicate by check mark whether the Registrant is a large accelerated filer, an accelerated filer, a non-accelerated filer or a smaller reporting company. See the definitions of “large accelerated filer,” “accelerated filer” and “smaller reporting company” in Rule 12b-2 of the Exchange Act.
Large accelerated filer | | ¨ | | Accelerated filer | | x |
| | | |
Non-accelerated filer | | ¨ (Do not check if a smaller reporting company) | | Smaller reporting company | | ¨ |
Indicate by check mark whether the Registrant is a shell company (as defined in Rule 12b-2 of the Act). Yes ¨ No x
The aggregate market value of the 36,738,970 shares of Common Stock held by non-affiliates of the Registrant as of March 12, 2014 was $418.8 million, based upon the closing price of $11.40 per share on the last business day of the Registrant’s most recently completed second fiscal quarter, June 28, 2013. (The Registrant has excluded the market value of all shares of its Common Stock held by its executive officers and directors; such exclusion shall not be deemed to constitute an admission that any such person is an “affiliate” of the Registrant.)
As of March 12, 2014, there were 40,915,520 shares of Common Stock outstanding.
DOCUMENTS INCORPORATED BY REFERENCE
Portions of the Registrant’s definitive proxy statement to be filed with the U.S. Securities and Exchange Commission (the “SEC”) relative to its 2014 Annual Meeting of Stockholders (the “Definitive Proxy Statement”) are incorporated by reference into Part III of this Form 10-K.
ICG GROUP, INC.
FORM 10-K
DECEMBER 31, 2013
INDEX
1
Forward-Looking Statements
Forward-looking statements made with respect to our financial condition, results of operations and business in this Annual Report on Form 10-K (this “Report”), and those made from time to time by us through our senior management, are made pursuant to the “safe harbor” provisions of the Private Securities Litigation Reform Act of 1995. Those forward-looking statements are based on our current expectations and projections about future events but are subject to known and unknown risks, uncertainties and assumptions that may cause our actual results, levels of activity, performance or achievements to be materially different from any future results, levels of activity, performance or achievements expressed or implied by those forward-looking statements.
Factors that could cause our actual results, levels of activity, performance or achievements to differ materially from those anticipated in forward-looking statements include, but are not limited to, factors discussed elsewhere in this Report and include, among other things:
— | continued development of the cloud-based software market; |
— | our ability to compete successfully against competitors and against alternative solutions; |
— | economic conditions generally; |
— | capital spending by the customers of our businesses; |
— | our ability to retain existing customer relationships (particularly significant customer relationships) and secure new ones; |
— | developments in the vertical markets in which we operate, and our ability to respond to such changes in a timely and effective manner; |
— | our ability to retain key personnel; |
— | our ability to consummate acquisitions on acceptable terms; |
— | our ability to successfully integrate any acquired business, and any other difficulties related to the acquisition of businesses; |
— | the impact of any potential acquisitions, dispositions or other strategic transactions, which may impact our operations, financial condition, capitalization or indebtedness; and |
— | our ability to have continued access to capital and to manage capital resources effectively. |
In light of those risks, uncertainties and assumptions, the forward-looking events discussed in this Report might not occur. In some cases, you can identify forward-looking statements by terminology such as “may,�� “will,” “should,” “could,” “would,” “expect,” “plan,” “anticipate,” “believe,” “estimate,” “continue” or the negative of such terms or other similar expressions. All forward-looking statements attributable to us or persons acting on our behalf are expressly qualified in their entirety by the cautionary statements included in this Report. We undertake no obligation to publicly update or revise any forward-looking statements, whether as a result of new information, future events or otherwise.
2
PART I
ITEM 1. Business
Overview
ICG Group, Inc. (referred to in this Report as “ICG,” the “Company,” “we,” “our,” or “us”) was formed on March 4, 1996 and is headquartered in Radnor, Pennsylvania. We are a multi-vertical cloud technology company with offerings that create unique and compelling value for our customers and provide transformative efficiency to vertical markets worldwide.
2013 was a watershed year for ICG. In December of last year, we sold our largest business, Procurian Inc. (“Procurian”), to an affiliate of Accenture plc (“Accenture”). The sale not only strengthened our balance sheet, as we realized approximately $314 million of cash in the sale, but, even more importantly, along with the dispositions of Freeborders, Inc. (“Freeborders”) and WhiteFence, Inc. (“WhiteFence”), the sale allows us to focus exclusively on our strategy of building market-leading, cloud-based companies that transform specific vertical markets.
Following the Procurian, Freeborders and WhiteFence transactions and our sales of Investor Force Holdings, Inc. (“InvestorForce”) to MSCI Inc. (“MSCI”) in January 2013 and Channel Intelligence, Inc. (“Channel Intelligence”) to Google Inc. (“Google”) in February 2013 (which together generated approximately $81 million of additional cash for ICG), we hold controlling majority equity stakes in three vertical, cloud-based businesses that we believe will generate sustained, meaningful returns for our stockholders through consistent revenue growth and earnings leverage over time. With our newly-fortified balance sheet, we have significantly expanded our capacity to both (1) drive growth at our existing cloud companies through, among other things, investment in research and development, sales and marketing and acquisitions and (2) acquire new cloud-based, recurring revenue businesses that bring transformative efficiency to specific vertical markets.
Despite the virtual omnipresence of the Internet in the global economy, there remain a surprisingly large number of vertical markets with outdated, offline business processes that could be vastly improved through cloud-based software and services. Our cloud-based solutions allow us to “re-imagine” those vertical markets, not only by transforming old business processes into new automated, streamlined ones but also by creating entirely new business processes that would not be possible without the cloud. In addition, our solutions frequently allow businesses to integrate across their partners, suppliers and customers in ways that were previously impossible, thereby expanding their markets and overall opportunity.
Aside from the transformative efficiency inherent in our solutions, the cloud delivery model that we employ provides tremendous benefits to our customers. The model provides customers with richer functionality and allows them to avoid large capital investment and enjoy faster set-up times and continuous upgrades at lower costs.
We feel that the expertise we have developed in connection with our seventeen-year active involvement in transforming markets through the adoption of cloud-based, B2B software and services allows us not only to identify cloud-based businesses that are positioned to succeed in their respective verticals, but also to accelerate the growth of those businesses through strategic guidance, operational support and financial capital. To that end, we manage our consolidated vertical cloud-based businesses, GovDelivery Holdings, Inc. (“GovDelivery”), MSDSonline Holdings, Inc. (“MSDSonline”) and BOLT Solutions Inc. (f/k/a SeaPass Solutions Inc.) (“Bolt”), which operate in the government, compliance and insurance markets, respectively, with a uniform set of industry-standard recurring revenue metrics and specifically look to drive growth at those businesses by:
— | continuously creating compelling, differentiated cloud-based products and services through investment in research and development; |
— | driving efficient long-term growth in recurring revenue through aggressive reinvestment in lead generation, marketing and sales; |
— | identifying, structuring and executing accretive acquisitions that accelerate strategic plans, increase revenue growth and, over time, improve margins; |
— | investing in and cultivating deep, vertical-expert management teams; and |
— | implementing strategies to obtain operational leverage and increased profitability while maintaining high revenue growth, particularly as a company scales. |
We believe that, through those and other measures, we are developing a set of leading businesses that possess unique assets which are hard to replicate and which provide competitive differentiation in the sizable vertical markets in which they operate. We believe further that our vertical cloud business model focus, which drives the compelling value proposition of our businesses, well-positions us to generate sustained, meaningful long-term returns for our stockholders, through, among other things:
— | high revenue visibility and predictability (and lower revenue volatility than traditional software companies); |
3
— | low customer acquisition costs and attractive lifetime customer values, which allow for efficient growth through investment in sales and marketing; |
— | economies of scale inherent in multi-tenancy software architecture, which allow a focus on innovation; and |
— | ultimately, long-term profitability and free cash flow. |
The results of operations of our businesses are reported in two segments: the “vertical cloud” reporting segment and the “vertical cloud (venture)” reporting segment. Our vertical cloud reporting segment reflects the aggregate financial results of our businesses (1) that share the economic and other characteristics described above, (2) in which our management takes a very active role in providing strategic direction and operational support and (3) towards which we devote relatively large proportions of our personnel, financial capital and other resources. As of the date of this Report, we own majority controlling equity positions in (and therefore consolidate the financial results of) each of the three businesses in our vertical cloud segment. Our vertical cloud (venture) reporting segment includes businesses with many characteristics similar to those of the businesses in our vertical cloud segment, but in which we take a less active role in terms of strategic direction and operational support, and, accordingly, towards which we devote relatively small amounts of personnel, financial capital and other resources.
Whenever we complete an acquisition or disposition, we evaluate the impact of the transaction on our reportable segments. For information regarding the results of operations of our reporting segments, as well as their respective contributions to our consolidated results of operations, see “Item 7—Management’s Discussion and Analysis of Financial Condition and Results of Operations” and “Item 8—Financial Statements and Supplementary Data,” including Note 17, “Segment Information,” to our Consolidated Financial Statements; that information is incorporated herein by reference.
Our Businesses
As of the date of this Report, we consolidated the following vertical cloud businesses:
Bolt
Bolt provides both captive and independent insurance agents a unique cloud-based platform that allows them to meet all of the commercial and personal property and casualty insurance needs of their customers. In turn, Bolt’s powerful sales and distribution platform provides insurance carriers a rich flow of business across all of their personal and small business property and casualty product lines.
GovDelivery
GovDelivery is a provider of communication solutions that allow governments and government organizations to reach more people and mobilize them to action. GovDelivery’s cloud-based digital communication management platform enables government organizations to provide citizens with access to new information, delivering updates through e-mail, mobile text alerts, RSS and social media channels from U.S. and U.K. government entities at the national, state and local levels.
MSDSonline
MSDSonline offers an integrated suite of cloud-based solutions that help companies manage a variety of global environmental, health and safety regulatory compliance requirements. MSDSonline’s products and services help businesses create safer work environments by identifying, managing and reducing potential workplace and environmental hazards that save time, lower costs and reduce the risk and liability associated with meeting compliance requirements.
As of the date of this Report, the following businesses are included in our vertical cloud (venture) segment:
CIML, LLC (“CIML”)
CIML owns mylist Corporation (“mylist”), a cloud-based publishing platform that allows manufacturers and retailers to share their products in a connected, contextual way among Facebook users. From May 2012 until February 20, 2013, CIML also owned Channel Intelligence; we consolidated CIML’s results with ours during this period. Since February 20, 2013, when Channel Intelligence was sold to Google and our equity ownership stake in CIML decreased as a result of the exercise of existing warrants and options; we have accounted for CIML under the equity method of accounting.
4
InstaMed Holdings, Inc. (“InstaMed”)
InstaMed operates a cloud-based healthcare payments network focused exclusively on healthcare providers, payers and patients. With its bank partners, InstaMed moves billions of dollars and information on its single, integrated network, connecting thousands of hospitals, practices and payers, and millions of patients for business. InstaMed’s innovative private cloud technology transforms the healthcare payment process by delivering new levels of payment assurance, simplicity, convenience and cost savings to the healthcare industry.
Parchment Inc. (“Parchment”)
Parchment is a leader in education credentials technology, allowing learners, educators and employers to collect, analyze, use and share credentials in simple and secure ways. Parchment’s cloud-based software offering is a transcript exchange and intelligence platform that enables the secure, rapid exchange of electronic transcripts and other student records among schools, universities, state education agencies and individuals. Through Parchment.com, students can research colleges and discover their chances of admission, see how they compare with peers, get college recommendations and send official transcripts when they are ready to apply. We account for Parchment under the cost method of accounting.
Concentration of Customer Base and Credit Risk
Some of our businesses have significant individual customer relationships. If any of our businesses is unable to retain one or more of its significant customers, or if our businesses’ customers collectively reduce by a significant amount the products or services that they purchase from our businesses, we could fail to achieve our internal financial forecasts and related earnings guidance, and our results of operations and financial condition could be negatively impacted.
GovDelivery’s customers are government entities, which generally have the right to terminate contracts at their election. Moreover, GovDelivery derives and will continue to derive the majority of its revenue from work performed under federal U.S. government contracts.
Competition Facing Our Businesses
Our businesses compete in rapidly evolving and intensely competitive cloud-based technology markets and are subject to ever-changing technology, shifting customer needs and preferences and frequent introduction of products and services; that competition is expected to continue to intensify in the coming years. Our businesses’ current and potential competitors range from large and established companies to emerging start-ups. Established companies, on the one hand, have longer operating histories and more established relationships with customers, and they can use their experience and resources against our businesses in a variety of competitive ways, including by making acquisitions, investing aggressively in research and development, and competing aggressively for customers, service providers and other strategic partners. Emerging start-ups, on the other hand, may be able to innovate and provide products and services faster than our businesses can. If our businesses’ competitors are collectively more successful than our businesses are in developing compelling products or in attracting and retaining customers, our consolidated revenues and growth rates could decline.
Our businesses’ customers face budget pressures and constraints that may cause them to (1) purchase a reduced amount of cloud-based software and services from our businesses, (2) purchase cloud-based software and services that are offered for a cheaper price (without regard to quality) to replace our businesses’ cloud-based software and services, (3) internally develop a solution to replace our businesses’ cloud-based software and services or (4) do without the cloud-based software and services offered by our businesses.
Employees
Corporate headcount at ICG as of March 1, 2014 was 19. Headcount at our consolidated businesses as of March 1, 2014 was 532 employees.
Financial Information About Geographic Areas
Financial information regarding geographic areas is contained in the notes to our Consolidated Financial Statements. See Note 17, “Segment Information,” in “Item 8—Financial Statements and Supplementary Data.”
Availability of Reports and Other Information
Our Internet website address is www.icg.com. Unless this Report explicitly states otherwise, neither the information on our website, nor the information on the website of any of our businesses, is incorporated by reference into this Report. Our Annual Reports on Form 10-K, Quarterly Reports on Form 10-Q, Current Reports on Form 8-K and all amendments to those reports filed by us with the
5
SEC pursuant to Sections 13(a) and 15(d) of the Securities Exchange Act of 1934, as amended (the “Exchange Act”), are accessible free of charge through our website as soon as reasonably practicable after we electronically file those documents with, or otherwise furnish them to, the SEC.
The public may read and copy any of the reports that are filed with the SEC at the SEC’s Public Reference Room at 100 F Street, N.E., Washington, D.C. 20549. The public may obtain information on the operation of the Public Reference Room by calling the SEC at 1-800-SEC-0330. The SEC maintains an Internet website (www.sec.gov) that contains reports, proxy and information statements, and other information regarding issuers that file electronically with the SEC.
ITEM 1A. Risk Factors
Our businesses involve a number of risks, some of which are beyond our control. You should carefully consider each of the risks and uncertainties we describe below and all of the other information in this Report before deciding to invest in our stock. The risks and uncertainties we describe below are not the only ones we face. Additional risks and uncertainties about which we currently do not know or that we currently believe to be immaterial may also adversely affect our businesses, financial condition or operating results.
If the market for cloud-based software develops more slowly than we expect or declines, our business could be adversely affected.
The market for cloud-based software is not as mature as the market for on-premise enterprise software, and it is uncertain whether cloud-based software will achieve and sustain high levels of customer demand and market acceptance. Our success will depend to a substantial extent on the widespread adoption of cloud-based software solutions. Many enterprises have invested substantial personnel and financial resources to integrate traditional enterprise software into their businesses and, therefore, may be reluctant or unwilling to migrate to cloud computing. Other enterprises have not elected to move from traditional processes that are not Web-based to automated cloud-based processes. It is difficult to predict customer adoption rates and demand for our businesses’ products, the future growth rate and size of the cloud-based software market or the entry of competitive applications. The expansion of the cloud-based software market depends on a number of factors, including the cost, performance, and perceived value associated with cloud-based software, as well as the ability of cloud-based software companies to address security and privacy concerns. If other cloud-based software providers experience security incidents, loss of customer data, disruptions in delivery or other problems, the market for cloud-based applications as a whole, including our applications, may be negatively affected. If cloud-based software does not achieve widespread adoption, or there is a reduction in demand for cloud-based software caused by a lack of customer acceptance, technological challenges, weakening economic conditions, security or privacy concerns, competing technologies and products, decreases in corporate spending or otherwise, it could result in decreased revenues and our business could be adversely affected.
If analysts, investors and other participants in public and/or private markets change the way that they currently value cloud-based businesses, such as those we currently own and those we could acquire, our stock price could be adversely affected.
At the present time, public and private cloud-based businesses are being valued based on relatively high multiples of their historical and/or forecasted revenues, with less of a focus on their current levels of profitability. Given the emphasis placed on the revenue growth of cloud-based businesses, we intend to continue to invest heavily in sales and marketing to drive revenue growth at our businesses. In the event that analysts, investors and other market participants begin to value cloud-based businesses, which comprise our core group of assets, based on lower revenue multiples or on profitability or some other metric, our stock price could be adversely affected, regardless of the performance of those businesses. Moreover, our strategy calls for us to deploy a significant amount of capital in the coming years to acquire cloud-based businesses. To the extent that we acquire any cloud-based business based on current valuation practices/metrics, and those practices/metrics change as contemplated above, our stock price could be adversely affected, regardless of the performance of the business or businesses that we acquire.
6
Our business strategy, which calls for the ownership and operation of a concentrated group of majority-owned cloud-based businesses, may subject us to additional risks.
In recent years, we have disposed of our interests in a number of businesses, including Procurian, which historically accounted for a significant amount of our revenue and earnings. We have opted to focus our human and financial capital on a smaller number of majority-owned businesses. We currently operate three relatively small majority-owned businesses, each of which offers cloud-based software and services. Because we have reduced the extent to which our holdings are diversified, we have concentrated the risk on our three majority-owned businesses. As a result, the occurrence of a material adverse event or existence of a material adverse condition at any one of our three majority-owned businesses could have a material adverse impact on our business as a whole. Moreover, our strategy calls for us to deploy a significant amount of capital in the coming years to acquire cloud-based businesses. To the extent that we acquire any such business, the occurrence of a material adverse event or existence of a material adverse condition at that business could have a material adverse impact on our business as a whole.
We face intense competition and may not be able to compete successfully.
Our businesses compete in rapidly evolving and intensely competitive cloud-based technology markets and are subject to ever-changing technology, shifting customer needs and preferences and frequent introduction of products and services. We expect competition in those markets to intensify in the coming years. Our businesses’ current and potential competitors range from large and established companies to emerging start-ups both horizontally and vertically focused. Established companies, on the one hand, have greater resources, more comprehensive and complementary product and service offerings, longer operating histories and more established relationships with customers. Those companies can use their experience and resources to compete with our businesses in a variety of ways, including by making acquisitions, investing aggressively in research and development and sales and marketing, and offering more attractive commercial terms to customers, service providers and other strategic partners. Emerging start-ups, on the other hand, may be able to innovate and provide products and services faster than our businesses can. If our businesses’ competitors are collectively more successful than our businesses are in developing compelling products and services or in attracting and retaining customers, our consolidated revenues and growth rates could decline.
Our inability to attract new customers could negatively affect our results of operations and our financial condition.
Our businesses may not be able to attract customers due to a variety of reasons, including increased competition, the unwillingness of potential customers to shift to cloud-based processes or spend money on non-core products and services, especially during periods of economic uncertainty, customer insolvency and the unavailability of credit for customers. If our businesses are unable to attract new customers, our results of operations and our financial condition could be negatively affected.
If our customers, including certain significant customers, do not renew their contracts for our products or if they do not renew them on terms that are favorable to us, our results of operations could be negatively impacted.
Our customer contracts have terms that generally range from one to three years. As the end of these terms approach, we seek to renew the agreements. Historically, renewals have represented a significant portion of our total revenue. Because of this characteristic of our business, if our customers, particularly our significant customers, choose not to renew their contracts on beneficial terms or at all, our business, operating results and financial condition could be harmed. Our customers’ renewal rates may decline or fluctuate as a result of a number of factors, including their level of satisfaction with our products and services and their ability to continue their operations and spending levels.
If we are unable to upsell additional or enhanced products and services to our existing customers, our results of operations could be negatively affected.
Our future success depends in part on our businesses’ ability to sell additional or enhanced products and services to their existing current customers. The rate at which our businesses’ customers purchase additional or enhanced products and services depends on a number of factors, including general economic conditions. If our businesses’ efforts to upsell to existing customers are not successful, our results of operations may be negatively affected.
The loss of or reduction in business from one or more significant customers could have a materially negative impact on our results of operations and financial condition.
Some of our businesses have significant individual customer relationships. If our businesses are unable to retain one or more significant customers, or if their customers collectively reduce by a significant amount the products or services that they purchase from our businesses, we could fail to achieve our internal financial forecasts and related revenue and earnings guidance, and our results of operations and financial condition could be negatively impacted.
7
Some of our businesses incur significant expenses in connection with long selling cycles and/or implementation cycles which may take time to recover or will not be recovered if they are unsuccessful in securing new customer contracts.
Some of our businesses face long selling cycles and/or implementation cycles in connection with securing new contracts and may incur significant expenses during the selling cycle and/or implementation cycles. Our businesses may not succeed in securing contractual relationships with prospective clients, in which case they would receive no revenues or reimbursement for those expenses and, even if they do secure new clients, they may incur significant implementation costs that take time to recover. The incurrence of such costs and the delay or inability to recover them could have an adverse effect on our results of operations and financial condition.
Some of our businesses’ long selling and implementation cycles make it difficult for us to prepare internal financial forecasts.
Long and varying selling and implementation cycles for our businesses, particularly Bolt, may make it difficult for us to accurately predict whether and when prospective customers will enter into contracts to purchase products or services and when our businesses will recognize revenue from those contracts. As a result, it is difficult for us to create precise internal financial forecasts, our actual results may vary from our internal financial forecasts, and our operating results in future reporting periods may be significantly below the expectations of the public market, securities analysts or investors.
Because we recognize subscription revenue from our customers over the terms of their agreements, downturns or upturns in bookings may not be immediately reflected in our operating results.
We recognize subscription revenue over the terms of our businesses’ customer agreements, which typically range from one to three years. As a result, most of our quarterly subscription revenue results from agreements entered into during previous quarters. Consequently, a shortfall in demand for our software and related services in any quarter may not significantly reduce our revenue for that quarter, but could negatively affect revenue in future quarters. We may not be able to adjust our cost structure to compensate for this potential shortfall in revenue. Accordingly, the effect of significant downturns in sales of subscriptions to our businesses’ software and related services may not be fully reflected in our results of operations until future periods. Our subscription model also makes it difficult for us to rapidly increase our subscription revenue through additional sales in any period, as subscription revenue from new customers must be recognized over the applicable subscription terms.
Potential customers may be unwilling to implement the business changes attendant to the use of some of our cloud-based software and services.
The use of our cloud-based software and services often requires customers to implement changes to their existing business process or to adapt new business processes with which they are unfamiliar. Some of our potential customers may continue to rely on existing internal solutions or other non-cloud-based solutions rather than implement the business changes called for by our solutions.
Our focus on vertical cloud solutions may make it more difficult for us to obtain customers and compete with providers of horizontal cloud solutions.
We serve vertical markets where we believe our cloud-based solutions can create unique and compelling value for customers. Although our focus on vertical markets is an important factor that differentiates us from our competitors, the narrow focus of our offerings could make it more difficult for us to compete with providers of horizontal cloud solutions, which, due to their focus on multiple markets, may be larger, better-capitalized and better known due to their focus on multiple markets.
The loss of key personnel, or our inability to attract additional key personnel, could result in significant business disruption and harm our results of operations and financial condition.
Our success is dependent upon our ability to attract and retain exceptional key personnel. If our key personnel, including the chief executives at our businesses, were unable or unwilling to continue in their present positions, or if we were unable to continue to hire exceptional personnel, our operations could be disrupted, and our operating results and financial condition could be seriously harmed.
Interruption of our businesses’ operations, infrastructures or systems upon which they rely could prevent them from delivering their products and services to their customers, which could significantly harm our business.
Because our businesses are primarily conducted over the Internet, they depend on their abilities to protect computer equipment and the information stored in computer equipment, offices and hosting facilities against damage from earthquake, floods, fires, power loss, telecommunications failures, unauthorized intrusion and other events. There can be no assurance that our businesses’ disaster preparedness will prevent significant interruption of their operations. In addition, our businesses engage third-party facility providers for their hosting facilities and related infrastructure that is essential for their subscription services. Service to our businesses’ customers could be interrupted in the event of a natural disaster, by a hosting provider decision to close a facility or terminate operations, or by other unanticipated problems. Similarly, our businesses use third-party telecommunications providers for Internet
8
and other telecommunication services. Any of those third-party providers may fail to perform their obligations adequately, and any third-party systems may fail to operate properly or become disabled for varying periods of time, causing business interruption, system damage, or inability to process funds on behalf of customers, which could reduce our businesses’ revenues, cause them to issue credits or pay penalties, cause customers to terminate their subscriptions, cause other liability to customers, or cause regulatory intervention or reputational damage.
Our businesses may become liable for damages to their customers for breaches of warranties and lose customers if they have errors, defects or disruptions in their service or if they provide poor service.
Our businesses deliver cloud-based software and services. Errors or defects in the software applications underlying those services, failures of the hosting infrastructures of our businesses, or errors in the delivery of services may make our businesses’ services unavailable to their customers, may cause disruptions in such customers’ operations and may cause such customers to suffer other harm. Because those customers use our businesses’ services to manage important aspects of their business, any errors, defects, disruptions in service or other performance problems with our businesses’ services could adversely impact our companies’ customers’ businesses. If there are any errors, defects, disruptions in service or other performance problems with our businesses’ services, our businesses’ customers could elect not to renew or delay or withhold payment, our businesses could lose future sales, or their customers could make warranty claims against them, which could result in an increase in our provision for doubtful accounts, an increase in collection cycles for accounts receivable, or costly litigation or the payment of damages.
Claims that we or our technologies infringe upon the intellectual property or other proprietary rights of a third party may require us to incur significant costs, enter into royalty or licensing agreements or develop or license substitute technology.
Our businesses may be subject to claims that the technologies in their products and services infringe upon the intellectual property or other proprietary rights of a third party. In addition, the vendors providing our businesses with technology for use in their technology could become subject to similar infringement claims. Although we believe that our businesses’ software and services do not infringe any intellectual property or other proprietary rights, we cannot be certain that such software and services do not, or that they will not in the future, infringe intellectual property or other proprietary rights held by others. Any claims of infringement could cause our businesses to incur substantial costs defending against the claim, even if the claim is without merit, and could distract management from their business. Moreover, any settlement or adverse judgment resulting from the claim could require our businesses to pay substantial amounts, or obtain a license to continue to use the software and services that are the subject of the claim, and/or otherwise restrict or prohibit our businesses’ use of the technology. There can be no assurance that our businesses would be able to obtain a license on commercially reasonable terms from the third party asserting any particular claim, or that they would be able to successfully develop alternative technology on a timely basis, or that they would be able to obtain a license from another provider of suitable alternative technology to permit them to continue offering, and their customers to continue using, the products and services. In addition, our businesses generally provide in their customer agreements for certain products and services that they will indemnify their customers against third-party infringement claims relating to technology they provide to those customers, which could obligate our businesses to pay damages if the products and services were found to be infringing. Infringement claims asserted against our businesses, our vendors or our businesses’ customers may have a material adverse effect on our business, prospects, financial condition and results of operations.
Third-party attempts to breach our businesses’ networks or data security, or the existence of any other security vulnerabilities, could damage the reputation of our businesses and adversely affect our financial condition and operating results.
Network and data security is particularly important for cloud-based software businesses, such as ours, which use Internet-based computing, storage, and connectivity technology to deliver their software products and services. Customers using our businesses’ products and services rely on the security of computer networks and infrastructure for achieving reliable service and the protection of their data. As part of our businesses’ subscription services, our businesses receive sensitive data. There can be no assurance that this information will not be subject to computer break-ins, theft and other improper activity that could jeopardize the security of information handled by our businesses’ products and services or cause interruptions in the operations of our businesses. Any such breach in security could expose us or our businesses to litigation, loss of customers, reputational damage and other business harm.
We devote significant resources and incur significant costs to protect against security threats. Despite those efforts, actual or perceived security vulnerabilities could cause us and our businesses to incur significant additional costs to alleviate problems caused by any such actual or perceived vulnerabilities. Those costs could reduce our operating margins and expose us and our businesses to litigation, loss of customers, reputational damage and other business harm.
Our GovDelivery business depends heavily on contracts with the United States federal government. Those contracts could be materially reduced, extended, or terminated as a result of the government’s continuing assessment of priorities, changes in government priorities or budget cuts. Those matters and/or delays in the budget process could adversely affect our results of operations or financial condition.
9
Our GovDelivery business derives the majority of its revenue from U.S. federal government customers; we expect that the business will continue to derive most of its sales from work performed under U.S. government contracts, which are conditioned upon the continuing availability of Congressional appropriations. Congress usually appropriates funds on a fiscal-year basis even though contract performance may extend over many years. The programs in which our GovDelivery business participates must compete with other programs and policy imperatives for consideration during the budget and appropriation process. Concerns about increased deficit spending, along with continued economic challenges, continue to place pressure on U.S. and international government-customer budgets. While we believe that our GovDelivery business’ programs are well aligned with the missions of our U.S. government customers, shifts in domestic spending, the affordability of GovDelivery’s products and services, general economic conditions and developments, and other factors may affect a decision to fund, or the level of funding, for existing or proposed contracts between GovDelivery and its U.S. federal government customers.
Our MSDSonline business provides its customers with cloud-based software to help them comply with federal employee health and safety regulations. If the federal government were to reduce the amount of regulation related to employee health and safety, it could adversely affect our results of operations or financial condition.
Our MSDSonline business provides cloud-based software that helps employers comply with Occupational Safety and Health Administration (OSHA) regulations related to employee health and safety. If the scope of OSHA’s regulation of employee health and safety were to decline or if OSHA were to reduce its enforcement efforts, MSDSonline’s customers and potential customers would be less likely purchase MSDSonline’s products and services, which could adversely affect our results of operations or financial condition.
Our Bolt business derives a meaningful portion of its revenue from commissions, which are dependent on premium rates charged by a limited number of insurance companies that can be difficult to predict.
In addition to its cloud software business, Bolt is engaged in insurance agency, wholesale brokerage, and insurance programs businesses, and, as such, derives a meaningful portion of its revenue from commissions paid by a limited number of insurance companies. Commissions are based upon a percentage of premiums paid by customers for insurance products. The amount of such commissions is therefore highly dependent on premium rates charged by a limited number of insurance companies. Bolt does not determine insurance premiums. Premium rates are determined by insurance companies based on a fluctuating market. Historically, property and casualty premiums have been cyclical in nature and have varied widely based on market conditions.
As traditional risk-bearing insurance companies continue to outsource the production of premium revenue to non-affiliated brokers or agents such as Bolt, those insurance companies may seek to further reduce their expenses by reducing the commission rates payable to such insurance agents or brokers. The reduction of commission rates, along with general volatility and/or declines in premiums, may adversely affect Bolt’s profitability and financial condition. Because Bolt does not determine the timing or extent of premium pricing changes, it may not be able to accurately forecast its commission revenues, including whether they will significantly decline.
Because our Bolt business competes with certain of its customers and potential customers with respect to its provision of insurance products and services, such customers and potential customers may be unwilling to enter into contract with our Bolt business, which could have an adverse effect on our results of operations.
Bolt provides a cloud-based platform used by insurance carriers, insurance agents and consumers. Some of Bolt’s offerings may compete with offerings of insurance carriers that are existing customers or potential customers, and these insurance carriers could decide not to use the Bolt platform, which could affect Bolt’s ability to execute on its strategy and have an adverse effect on our results of operations.
Our businesses are experiencing relatively rapid growth. If we fail to effectively manage that growth, our businesses and operating results could be harmed.
As a general matter, our businesses have experienced and are expected to continue to experience relatively rapid growth in terms of headcount and operations, which has placed, and will continue to place, significant demands on our and our businesses’ combined management, operational and financial infrastructure. If we and our businesses do not effectively manage that growth, the quality of our businesses’ cloud-based software and services could suffer, which could negatively affect our brands and operating results. The potential expansion of some of our businesses into international markets would heighten those risks as a result of the particular challenges of supporting businesses in an environment of multiple languages, cultures, customs, legal systems, alternative dispute resolution systems, regulatory systems and commercial infrastructures. To effectively manage growth, we and our businesses will need to continue to improve our operational, financial and management processes. Those systems enhancements and improvements may require additional capital expenditures and management resources. Failure to implement those improvements could hurt our ability to manage the growth of our businesses and our financial position.
10
Fluctuations in our quarterly results and our inability to meet financial guidance may adversely affect our stock price.
Our investors are increasingly evaluating our company based on our quarterly performance against stated financial targets. If our operating results in one or more quarters do not meet our stated financial guidance or our securities analysts’ or investors’ expectations, the price of our stock could decrease.
We expect that our quarterly results could fluctuate significantly due to many factors, including:
— | general economic conditions, including economic downturns or uncertainty; |
— | the timing of customer signings and implementations at our businesses; |
— | the pace of development or a decline in growth of cloud-based software and services markets; |
— | competition for the products and services offered by our businesses. |
— | our acquisition of interests in new businesses; |
— | the operating results, including growth rates, of our businesses; |
— | changes in our estimated quarterly revenue, earnings and other performance metrics; and |
— | changes in the accounting methods that we use to account for our interests in businesses that may result from changes in our ownership percentages in those businesses. |
If we are not able to consummate acquisitions on acceptable terms, we may not be able to execute our business strategy.
Our business strategy of owning and operating majority-owned, cloud-based technology software and services businesses in various vertical markets may, from time to time, require (1) the ability to strategically acquire new businesses on favorable terms and (2) the ability to strategically consummate “tuck-in” acquisitions at our existing businesses on favorable terms. We may not be able to identify attractive acquisition candidates that fit our business strategies. Furthermore, even if we are able to identify suitable acquisition candidates, it may not be possible or prudent to acquire interests in certain of those companies because of the robust valuations being ascribed to cloud-based software businesses at the present time, or due to competition from other potential acquirers that may have greater resources, brand name recognition, industry contacts or flexibility of structure than we do. If we are unable to effectively deploy capital for acquisitions on acceptable terms, we may not be able to execute on our strategy, and our business may be adversely impacted.
Acquisitions and investments could result in operating difficulties and other harmful consequences that may adversely impact our businesses, financial condition and results of operations.
As part of our business growth strategies, our existing businesses have acquired, and may continue to acquire, other companies, businesses and technologies. The process of integrating an acquired company, business or technology involves numerous risks, including difficulties in the integration of the operations, administrative systems, technologies, services and products of the acquired company or business and the diversion of management’s attention from other business concerns. Although we will endeavor to evaluate the risks inherent in any particular acquisition transaction, there can be no assurance that we will properly ascertain all such risks. In addition, acquisitions may result in the incurrence of additional indebtedness and other expenses for our businesses. Accordingly, difficulties encountered with acquisitions may have a material adverse effect on our businesses, financial condition and results of operations.
Entering new vertical markets through acquisitions could adversely affect our operating results.
We intend to acquire businesses in new vertical markets that we believe can be transformed through the adoption of cloud-based technologies. If the vertical markets that ultimately enter are not receptive to cloud-based solutions or potential customers in such markets choose to adopt solutions provided by our competitors, including providers of horizontal-based solutions, our operating results could be adversely affected.
We may make acquisitions that do not meet our financial or strategic expectations, which could adversely affect our operating results.
We face competition for potential acquisition targets and may need to pay purchase prices reflective of high valuations to acquire attractive cloud-based technology companies. Such acquisitions could result in dilutive issuances of our equity securities or the incurrence of debt and could fail to meet our financial or strategic expectations and/or to justify such valuations, which could adversely affect our operating results.
11
Our consummation of acquisitions could have negative accounting consequences.
A significant portion of the purchase price of any companies we acquire may be allocated to acquired goodwill and other intangible assets, which must be assessed for impairment at least annually. If we consummate acquisitions that do not yield expected returns, we may be required to take charges to our operating results based on this impairment assessment process, which could adversely affect our results of operations.
The operations and growth of our businesses could be impaired by the inability to raise capital or borrow money on favorable terms.
The operations and growth (both organic and acquisitions-based) of our businesses may require additional capital. If we or our businesses are unable to raise capital or obtain credit on favorable terms, the ability of our businesses to operate and grow may be impaired. This may require us to take other actions, such as borrowing money on terms that may be unfavorable, or divesting of assets prematurely to raise capital. If we need capital for our businesses and are unable to raise it, our businesses may need to limit or cease operations.
Execution of our acquisitions strategy may result in a depletion of our cash.
Our strategy may, from time to time, call for us to acquire new cloud-based software and services businesses. Acquiring a controlling equity stake in a cloud-based software or services company with the strong financial characteristics and growth potential necessitated by our strategy would likely require a significant amount of capital. Deploying large amounts of capital to acquire one or more companies could lead to a depletion of our available cash and could require us to borrow money, issue stock or otherwise raise additional capital, which we may not be able to do on favorable terms or at all.
Ownership in our consolidated businesses by such businesses’ management teams could negatively impact our ability to execute our strategy if our interests are not aligned with management.
One aim of our business strategy is to maintain significant majority ownership positions in our most promising and mature businesses, ideally owning such businesses solely with such businesses’ management teams. Because we believe that it is important that the key managers of our businesses own stakes in such businesses, when we acquire a new consolidated business we typically encourage its key managers to roll their equity ownership into equity of the surviving business. Additionally, each of our consolidated businesses maintains equity incentive plans for its employees. We seek to align our interests with management of our businesses through equity ownership and believe that, particularly when management holds the same security as us, such alignment is likely. The ownership of equity interests by company managers who have different financial and strategic goals or hold different securities than us, however, could have a negative impact on our ability to execute our business strategy.
Minority stockholders of our consolidated businesses could attempt to limit our ability to control our businesses, which could have a negative impact on our ability to execute our business strategy.
Management of our consolidated businesses, and in the case of Bolt, other minority stockholders of Bolt, could have financial or business interests or objectives that are different from ours and could seek to limit our ability to control our actions with respect that business, particularly in connection with capital-raising activities, which could have a negative impact on our ability to execute our business strategy.
If we cannot, or choose not to, extract cash from our businesses, it could have a negative impact on our liquidity position and operations.
One of our goals is to help our businesses achieve profitability so that we can access their cash flow. All of our businesses may not meet that goal; even if they do, in lieu of issuing dividends, we may choose to reinvest cash in our businesses’ for operations, including for investment in product development and sales and market, tuck-in acquisitions. If we do not access cash from our businesses it could have a negative impact on our future liquidity position and operations.
Our accounting estimates with respect to the ultimate recoverability of our carrying basis in our businesses could change materially in the near term.
Our accounting estimates with respect to the ultimate recoverability of our carrying basis, including goodwill, in our businesses could change in the near term, and the effect of those changes on our consolidated financial statements could be significant. It is possible that a significant write-down or write-off of our carrying basis in our businesses, including goodwill, may be required in the future, or that a significant loss will be recorded in the future upon the sale of one or more businesses. Any write-down or write-off of this type could cause a decline in the price of our stock.
12
Changes in financial accounting standards or practices may cause adverse, unexpected financial reporting fluctuations and affect our reported results of operations.
Financial accounting standards may change or their interpretation may change. A change in accounting standards or practices can have a significant effect on our reported results and may even affect our reporting of transactions completed before the change becomes effective. Changes to existing rules or the re-examining of current practices may adversely affect our reported financial results or the way we conduct our business.
Numerous external forces, including generally weak and/or uncertain economic and political conditions could result in declines in our revenue and operating results.
Numerous external forces beyond our control, including generally weak and/or uncertain economic and political conditions, could result in future declines in our revenue and operating results. Adverse or uncertain financial and political conditions could cause customers and potential customers of our businesses to forgo, delay or reduce the amount of cloud-based software and services that they purchase, extend our business sales cycles, create difficulties in collecting (or the inability to collect) accounts receivable, lead to slower adoption of new technologies, result in increased price competition and/or make it difficult or impossible for our businesses to obtain financing.
Our stock price has been volatile in the past and may continue to be volatile in the future.
Our stock price has historically had a higher than average volatility. This volatility may continue in the future, particularly in light of the uncertainty that has characterized the global economy in recent years.
The following factors, among others, may add to the volatility in the price of our stock:
— | general economic conditions, including economic downturns or uncertainty; |
— | the reluctance of potential customers to use cloud-based solutions or spend on non-core products and services; |
— | actual or anticipated variations in our quarterly results; |
— | changes in the market valuations of our businesses and other cloud-based technology businesses; |
— | conditions or trends related to cloud-based technology businesses; |
— | changes by securities analysts regarding their expectations of our performance; |
— | new products or services offered by our businesses and their competitors; |
— | announcements by our businesses or their competitors of technological innovations; |
— | announcements by us, our businesses or our businesses’ competitors of significant acquisitions, strategic partnerships or joint ventures; |
— | additional sales or repurchases of our securities or the securities of our businesses; and |
— | additions to or departures of our key personnel. |
Many of these factors are beyond our control. Any of these factors may decrease the price of our stock.
We have had a general history of operating losses and may experience operating losses in the future.
Historically we have had significant operating losses, excluding the effect of any non-operating gains, such as from the sale of interests in our businesses. We can give no assurances as to whether we will achieve profitability and, even if we do achieve profits, we may not be able to sustain them in the future.
Our businesses have relatively limited operating histories and may never be profitable.
Our businesses have relatively limited operating histories to aid in assessing future prospects. Further, some of our businesses have significant historical losses and may never be profitable. Our businesses have incurred substantial costs to develop and market their products and expand operations and have incurred net losses; we intend to continue to spend substantial amounts on product development and sales and marketing for our business. The operating expenses of these businesses could increase in the foreseeable future as they continue to develop products, increase sales and marketing efforts and expand operations, and there can be no assurance that such increased expenses will ultimately result in increased revenues.
13
We and our businesses may be subject to litigation proceedings that could disrupt and harm our businesses.
We and our businesses may be subject to legal claims involving stockholder, consumer, competition and other matters. Litigation is subject to inherent uncertainties, and unfavorable rulings could occur. An unfavorable ruling could include monetary damages or, in cases for which injunctive relief is sought, an injunction prohibiting one or more of our businesses from performing a critical activity, such as selling its software and services. If we or one of our businesses were to receive an unfavorable ruling in a litigation matter, our businesses, financial condition and results of operations could be materially harmed. Even if legal claims brought against us or our businesses are without merit, defending lawsuits could be time-consuming and expensive and could divert our or our businesses’ management attention from other business concerns.
We and our businesses may be subject to government regulation that could disrupt and harm our businesses.
The software and services offerings of our businesses are subject to government regulation domestically and internationally in many areas, including regulation of the Internet regarding user privacy, telecommunications, data protection and online content. The application of those laws and regulations to our businesses is often unclear and sometimes may conflict. Compliance with those laws and regulations may involve significant costs or require changes in business practices that result in reduced revenue. Our Bolt business operates in the heavily regulated insurance market and, as such is also subject to state regulation with to its insurance operations. Noncompliance by our businesses with applicable regulations could result in monetary penalties being imposed on our businesses or orders that our businesses cease performing a critical activity, such as selling their software and services or, in the case of Bolt, providing insurance services.
We have implemented certain anti-takeover provisions that could make it more difficult for a third party to acquire us, even if doing so would be beneficial to our stockholders.
Provisions of our amended certificate of incorporation and bylaws, including supermajority voting requirements and the inability of our stockholders to call stockholder meetings or act by written consent, as well as provisions of Delaware law, could make it more difficult for a third party to acquire us, even if doing so would be beneficial to our stockholders. Our amended certificate of incorporation provides that our board of directors may issue preferred stock without stockholder approval and also provides for a staggered board of directors. We are subject to the provisions of Section 203 of the Delaware General Corporation Law, which restricts certain business combinations with interested stockholders. The combination of these provisions may inhibit a non-negotiated merger or other business combination.
ITEM 1B. Unresolved Staff Comments
None.
ITEM 2. Properties
The location and general description of our properties as of March 1, 2013 are as follows: Our corporate headquarters is located at 555 East Lancaster Avenue, Suite 640 in an office facility located in Radnor, Pennsylvania, where we lease approximately 10,674 square feet. Our consolidated businesses lease approximately 97,082 square feet of office, administrative, sales and marketing, operations and data center space in the United States, principally in Connecticut, Florida, Illinois, Minnesota, New York, Texas and Washington, D.C., and administrative office space in Europe and Israel.
ITEM 3. Legal Proceedings
None.
ITEM 4. Mine Safety Disclosures
None.
14
PART II
ITEM 5. Market For Registrant’s Common Equity, Related Stockholder Matters and Issuer Purchases of Equity Securities
Market Information. Our Common Stock is currently traded on The NASDAQ Global Select Market under the symbol “ICGE.” The price range per share reflected in the table below is the highest and lowest sale price for our Common Stock, as reported by The NASDAQ Global Select Market during each quarterly period of the years ended December 31, 2012 and 2013, respectively.
| 2012 | | | 2013 | |
Quarter Ended | Mar. 31 | | | Jun. 30 | | | Sep. 30 | | | Dec. 31 | | | Mar. 31 | | | Jun. 30 | | | Sep. 30 | | | Dec. 31 | |
High | $ | 10.65 | | | $ | 9.84 | | | $ | 10.67 | | | $ | 11.78 | | | $ | 13.50 | | | $ | 12.42 | | | $ | 15.00 | | | $ | 18.81 | |
Low | $ | 7.90 | | | $ | 8.25 | | | $ | 8.16 | | | $ | 9.60 | | | $ | 11.09 | | | $ | 10.33 | | | $ | 10.96 | | | $ | 13.87 | |
Holders. As of March 1, 2014, there were approximately 625 holders of record of our Common Stock; there is a much larger number of beneficial owners of our Common Stock.
Dividends. We have never declared or paid cash dividends on our capital stock, and we do not intend to pay cash dividends in the foreseeable future. We plan to retain any earnings to fund future growth in our businesses and to acquire new ones.
Stock Performance Graph. The following graph presents a comparison of the performance of our Common Stock with that of the NASDAQ Composite Index and the NASDAQ Computer & Data Processing Index from December 31, 2008 to December 31, 2013. The graph shall not be deemed “filed” for purposes of Section 18 of the Exchange Act, or otherwise subject to the liabilities under that section, and shall not be deemed to be incorporated by reference into any filing of the Company under the Securities Act or the Exchange Act.
COMPARISON OF CUMULATIVE TOTAL RETURN* SINCE DECEMBER 31, 2008 AMONG ICG GROUP, INC.
THE NASDAQ COMPOSITE INDEX AND THE NASDAQ COMPUTER & DATA PROCESSING INDEX
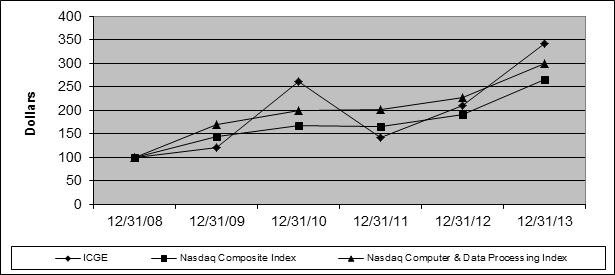
| | 12/31/2008 | | | | 12/31/2009 | | | | 12/31/2010 | | | | 12/31/2011 | | | | 12/31/2012 | | | | 12/31/2013 | |
ICGE | $ | 100.00 | | | $ | 122.02 | | | $ | 261.47 | | | $ | 141.65 | | | $ | 209.72 | | | $ | 341.83 | |
Nasdaq Composite Index | | 100.00 | | | | 143.89 | | | | 168.22 | | | | 165.19 | | | | 191.47 | | | | 264.84 | |
Nasdaq Computer & Data Processing Index | | 100.00 | | | | 170.82 | | | | 200.62 | | | | 201.60 | �� | | | 226.76 | | | | 299.19 | |
*$100 invested at closing prices on December 31, 2008 in our Common Stock or in a stock index, including reinvestment of dividends.
15
Securities Authorized for Issuance Under Equity Compensation Plans. For certain information concerning securities authorized for issuance under our equity compensation plan, see Item 12—“Security Ownership of Certain Beneficial Owners and Management and Related Stockholder Matters.”
Issuer Purchases of Equity Securities. We maintain a share repurchase program under which we may, from time to time, repurchase shares of our Common Stock in the open market, in privately negotiated transactions or pursuant to trading plans meeting the requirements of Rule 10b5-1 under the Exchange Act. The program was expanded in November 2011 from an initial authorization of $25 million to allow for the repurchase of up to $50 million of shares of our Common Stock. In September 2013, the program was further expanded to allow for the repurchase of up to $150 million of shares of our Common Stock. The table below contains information relating to the repurchases of our Common Stock that occurred under the share repurchase program from the program’s inception on July 31, 2008 through the date of the filing of this Report.
Period | Total Number
of Shares
Purchased (1) | | | Average
Price Paid
per Share (2) | | | Total Number of
Shares Purchased as
Part of Publicly
Announced
Program (1) | | | Approximate Dollar
Value That May Yet
Be Purchased Under
the Program | |
Repurchased during the year ended 12/31/2008 | | 1,948,158 | | | $ | 4.75 | | | | 1,948,158 | | | $ | 15.7 million | |
Repurchased during the year ended 12/31/2009 | | 492,242 | | | $ | 5.45 | | | | 492,242 | | | $ | 13.1 million | |
Repurchased during the year ended 12/31/2010 | | 0 | | | $ | — | | | | 0 | | | $ | 13.1 million | |
Repurchased during the year ended 12/31/2011 | | 841,027 | | | $ | 10.17 | | | | 841,027 | | | $ | 29.5 million | |
Repurchased during the year ended 12/31/2012 | | 930,225 | | | $ | 8.94 | | | | 930,225 | | | $ | 21.2 million | |
1/1/2013 to 1/31/2013 | | 0 | | | $ | — | | | | 0 | | | $ | 21.2 million | |
2/1/2013 to 2/28/2013 | | 40,000 | | | $ | 12.96 | | | | 40,000 | | | $ | 20.7 million | |
3/1/2013 to 3/31/2013 | | 121,200 | | | $ | 13.11 | | | | 121,200 | | | $ | 19.1 million | |
4/1/2013 to 4/30/2013 | | 0 | | | $ | — | | | | 0 | | | $ | 19.1 million | |
5/1/2013 to 5/31/2013 | | 467,100 | | | $ | 11.04 | | | | 467,100 | | | $ | 13.9 million | |
6/1/2013 to 6/30/2013 | | 13,000 | | | $ | 11.22 | | | | 13,000 | | | $ | 13.8 million | |
7/1/2013 to 7/31/2013 | | 0 | | | $ | — | | | | 0 | | | $ | 13.8 million | |
8/1/2013 to 8/31/2013 | | 0 | | | $ | — | | | | 0 | | | $ | 13.8 million | |
9/1/2013 to 9/30/2013 | | 0 | | | $ | — | | | | 0 | | | $ | 113.8 million | |
10/1/2013 to 10/31/2013 | | 0 | | | $ | — | | | | 0 | | | $ | 113.8 million | |
11/1/2013 to 11/30/2013 | | 162,020 | | | $ | 16.96 | | | | 162,020 | | | $ | 111.0 million | |
12/1/2013 to 12/31/2013 | | 102,965 | | | $ | 17.78 | | | | 102,965 | | | $ | 109.2 million | |
1/1/2014 to 1/31/2014 | | 0 | | �� | $ | — | | | | 0 | | | $ | 109.2 million | |
2/1/2014 to 2/28/2014 | | 0 | | | $ | — | | | | 0 | | | $ | 109.2 million | |
3/1/2014 to 3/17/2014 | | 0 | | | $ | — | | | | 0 | | | $ | 109.2 million | |
Total | | 5,117,937 | | | $ | 7.97 | | | | 5,117,937 | | | $ | 109.2 million | |
(1) | All shares purchased in open market transactions. |
(2) | Average price paid per share excludes commissions. |
16
ITEM 6. Selected Financial Data
The following table summarizes certain selected historical consolidated financial information that has been derived from our audited Consolidated Financial Statements for the years ended December 31, 2013, 2012, 2011, 2010 and 2009. The financial information may not be indicative of our future performance and should be read in conjunction with “Management’s Discussion and Analysis of Financial Condition and Results of Operations” and our Consolidated Financial Statements and the related Notes thereto included in this Report. During the year ended December 31, 2013, Channel Intelligence, InvestorForce and Procurian were sold. Accordingly, we have recast the selected historical consolidated financial information to conform to the current period presentation; those three businesses are presented as discontinued operations for all periods presented.
| Year Ended December 31, | |
| 2013 | | | 2012 | | | 2011 | | | 2010 | | | 2009 | |
| (in thousands, except per share data) | |
Consolidated Statements of Operations and Comprehensive Income (Loss) Data: | | | | | | | | | | | | | | | | | | | |
Revenue | $ | 59,201 | | | $ | 26,640 | | | $ | 12,885 | | | $ | 8,119 | | | $ | 4,610 | |
Operating expenses | | | | | | | | | | | | | | | | | | | |
Cost of revenue | | 17,757 | | | | 9,459 | | | | 4,589 | | | | 2,284 | | | | 1,306 | |
Sales and marketing | | 28,129 | | | | 12,355 | | | | 5,306 | | | | 3,740 | | | | 1,028 | |
General and administrative | | 30,960 | | | | 28,408 | | | | 20,119 | | | | 20,446 | | | | 17,588 | |
Research and development | | 9,032 | | | | 8,807 | | | | 2,934 | | | | 2,126 | | | | 2,368 | |
Amortization of intangible assets | | 8,470 | | | | 4,837 | | | | 1,373 | | | | 1,357 | | | | 205 | |
Impairment related and other | | 4,292 | | | | 1,130 | | | | 109 | | | | 796 | | | | 4,876 | |
Total operating expenses | | 98,640 | | | | 64,996 | | | | 34,430 | | | | 30,749 | | | | 27,371 | |
Operating income (loss) | | (39,439 | ) | | | (38,356 | ) | | | (21,545 | ) | | | (22,630 | ) | | | (22,761 | ) |
Other income (loss), net | | (4,210 | ) | | | 57,820 | | | | 43,203 | | | | 74,501 | | | | 16,098 | |
Interest income (expense), net | | (1,257 | ) | | | 413 | | | | 330 | | | | 203 | | | | 205 | |
Income (loss) from continuing operations before income taxes and equity loss | | (44,906 | ) | | | 19,877 | | | | 21,988 | | | | 52,074 | | | | (6,458 | ) |
Income tax benefit (expense) | | 17,803 | | | | (108 | ) | | | 464 | | | | 1,111 | | | | 13,442 | |
Equity loss | | (2,963 | ) | | | (8,672 | ) | | | (11,964 | ) | | | (16,022 | ) | | | (13,801 | ) |
Income (loss) from continuing operations | | (30,066 | ) | | | 11,097 | | | | 10,488 | | | | 37,163 | | | | (6,817 | ) |
Income (loss) on discontinued operations | | 232,107 | | | | 12,484 | | | | 19,313 | | | | 10,745 | | | | 33,676 | |
Net income (loss) | | 202,041 | | | | 23,581 | | | | 29,801 | | | | 47,908 | | | | 26,859 | |
Less: Net income (loss) attributable to non-controlling interest | | (7,018 | ) | | | 592 | | | | 2,235 | | | | 1,319 | | | | 11,325 | |
Net income (loss) attributable to ICG Group, Inc. | $ | 209,059 | | | $ | 22,989 | | | $ | 27,566 | | | $ | 46,589 | | | $ | 15,534 | |
Basic Income (loss) Per Share Attributable to ICG Group, Inc.: | | | | | | | | | | | | | | | | | | | |
Income (loss) from continuing operations | $ | (0.70 | ) | | $ | 0.35 | | | $ | 0.29 | | | $ | 1.02 | | | $ | (0.12 | ) |
Income (loss) on discontinued operations | | 6.42 | | | | 0.29 | | | | 0.46 | | | | 0.26 | | | | 0.54 | |
Basic income (loss) per share | $ | 5.72 | | | $ | 0.64 | | | $ | 0.75 | | | $ | 1.28 | | | $ | 0.42 | |
Shares used in computation of basic income (loss) per share | | 36,536 | | | | 35,890 | | | | 36,656 | | | | 36,427 | | | | 36,660 | |
Income (loss) from continuing operations | $ | (0.70 | ) | | $ | 0.35 | | | $ | 0.29 | | | $ | 1.00 | | | $ | (0.12 | ) |
Income (loss) on discontinued operations | | 6.42 | | | | 0.28 | | | | 0.45 | | | | 0.26 | | | | 0.54 | |
Diluted income (loss) per share | $ | 5.72 | | | $ | 0.63 | | | $ | 0.74 | | | $ | 1.26 | | | $ | 0.42 | |
Shares used in computation of diluted income (loss) per share | | 36,536 | | | | 36,543 | | | | 37,460 | | | | 37,064 | | | | 36,660 | |
Consolidated Balance Sheet Data: | | | | | | | | | | | | | | | | | | | |
Cash, cash equivalents and short-term investments | $ | 335,898 | | | $ | 21,280 | | | $ | 92,828 | | | $ | 74,668 | | | $ | 32,250 | |
Working capital | $ | 308,609 | | | $ | 168,075 | | | $ | 104,784 | | | $ | 72,128 | | | $ | 113,332 | |
Total assets | $ | 529,604 | | | $ | 447,059 | | | $ | 306,820 | | | $ | 280,989 | | | $ | 330,087 | |
Other long-term debt, net of current portion | $ | 6,008 | | | $ | 9,645 | | | $ | — | | | $ | 559 | | | $ | 574 | |
Total ICG Group, Inc. stockholders’ equity | $ | 450,161 | | | $ | 265,898 | | | $ | 245,884 | | | $ | 223,807 | | | $ | 280,665 | |
17
ITEM 7. Management’s Discussion and Analysis of Financial Condition and Results of Operations
The following Management’s Discussion and Analysis of Financial Condition and Results of Operations contains forward-looking statements that involve risks and uncertainties. Our actual results could differ materially from those anticipated in these forward-looking statements as a result of certain factors, including those set forth elsewhere in this Report and discussed in our other SEC filings. The following discussion should be read in conjunction with our audited Consolidated Financial Statements and the related Notes thereto included in this Report.
The Consolidated Financial Statements include the consolidated accounts of ICG Group, Inc., a company incorporated in Delaware, and its subsidiaries, both wholly-owned and consolidated (ICG Group, Inc. and all such subsidiaries are collectively hereafter referred to as “ICG,” “the Company,” “we,” “our,” or “us”), and have been prepared in accordance with U.S. generally accepted principles (GAAP).
Overview
ICG is a multi-vertical cloud technology company with offerings that create unique and compelling value for our customers and provide transformative efficiency to vertical markets worldwide. We manage our consolidated vertical cloud-based businesses, which operate in the government, compliance and insurance markets, respectively, with a uniform set of industry-standard recurring revenue metrics and specifically look to drive growth at those businesses by:
— | continuously creating compelling, differentiated cloud-based products and services through investment in research and development; |
— | driving efficient long-term growth in recurring revenue through aggressive reinvestment in lead generation, marketing and sales; |
— | identifying, structuring and executing accretive acquisitions that accelerate strategic plans, increase revenue growth and, over time, improve margins; |
— | investing in and cultivating deep, vertical-expert management teams; and |
— | implementing strategies to obtain operational leverage and increased profitability while maintaining high revenue growth, particularly as a company scales. |
We believe that, through those and other measures, we are developing a set of leading businesses that possess unique assets which are hard to replicate and which provide competitive differentiation in the sizable vertical markets in which they operate. We believe further that our vertical cloud business model focus, which drives the compelling value proposition of our businesses, well-positions us to generate sustained, meaningful long-term returns for our stockholders, through, among other things:
— | high revenue visibility and predictability (and lower revenue volatility than traditional software companies); |
— | low customer acquisition costs and attractive lifetime customer values, which allow for efficient growth through investment in sales and marketing; |
— | economies of scale inherent in multi-tenancy software architecture, which allow a focus on innovation; and |
— | ultimately, long-term profitability and free cash flow. |
The results of operations of our businesses are reported in two segments: the “vertical cloud” reporting segment and the “vertical cloud (venture)” reporting segment. Our vertical cloud reporting segment reflects the aggregate financial results of our businesses (1) that share the economic and other characteristics described above, (2) in which our management takes a very active role in providing strategic direction and operational support and (3) towards which we devote relatively large proportions of our personnel, financial capital and other resources. As of the date of this Report, we own majority controlling equity positions in (and therefore consolidate the financial results of) each of the three businesses in our vertical cloud segment. Our vertical cloud (venture) reporting segment includes businesses with many characteristics similar to those of the businesses in our vertical cloud segment, but in which we take a less active role in terms of strategic direction and operational support, and, accordingly, towards which we devote relatively small amounts of personnel, financial capital and other resources.
We have achieved significant growth over the last three years. A substantial majority of our growth has come from acquisitions. We believe that an active acquisition program will continue to be an important element of our growth strategy as it expands our customer base, grows our revenues and increases our stockholder value. Additionally, we have experienced significant organic growth at our businesses through new customers and expansion at existing customers.
18
We intend to continue investing for long-term growth. We have invested, and expect to continue to invest heavily in sales and marketing. In addition, we expect to continue to invest in technology development efforts to deliver additional compelling applications to address customers’ evolving need. These investments will increase our costs on an absolute basis in the near term. Many of these investments will occur in advance of experiencing any direct benefit from them.
Our Businesses
As of December 31, 2013, the three businesses that are included in our vertical cloud segment are: Bolt, GovDelivery and MSDSonline. As of December 31, 2013, the three businesses that are included in our vertical cloud (venture) segment are: CIML, InstaMed and Parchment.
Channel Intelligence, InvestorForce and Procurian were sold during the year ended December 31, 2013, and are included in “Dispositions” in our segment disclosures. Those companies were presented as discontinued operations in our Consolidated Financial Statements. Freeborders and WhiteFence were also sold during the year ended December 31, 2013; our results of those operations are also included in “Dispositions” in our segment disclosures.
We own 70%, 94% and 96% Bolt, GovDelivery and MSDSonline, respectively, as of December 31, 2013, and, accordingly, consolidate the results of those businesses. We own 38% of, and exert significant influence over, CIML; we account for that business under the equity method of accounting. We own less than 20% of InstaMed and Parchment, and account for those businesses under the cost method of accounting.
Results of Operations
The following table contains selected financial information related to our reportable segments. The segments, as applicable, include the results of our consolidated businesses and record our share of the earnings and losses of businesses accounted for under the equity method of accounting. The businesses included in each segment are consistent between periods, with the exception of certain businesses that ICG acquired or disposed of in a given period, as noted below. The method of accounting for any particular company may change based upon, among other things, a change in our ownership interest.
“Dispositions” includes the results of those businesses that have been sold or ceased operations and are no longer included in our segments for the periods presented. A disposition could be the sale of a division, subsidiary or asset group of one of our consolidated businesses, typically classified as discontinued operations for accounting purposes, or the disposition of our ownership interest in a business accounted for under the equity method of accounting. “Other” expenses represent (1) the corporate general and administrative expenses of ICG’s business operations, which primarily include employee costs and costs associated with operating as a public company, (2) gains or losses on the dispositions of businesses and marketable securities holdings, (3) income taxes, (4) impairment charges associated with our businesses, and (5) the results of operations attributable to the respective noncontrolling interests of these businesses.
Segment Information | |
(in thousands) | |
| | | | | | | | | | | Reconciling Items | | | | |
| | Vertical
Cloud | | | Vertical Cloud
(Venture) | | | Total
Segments | | | Dispositions | | | Other | | | Consolidated | |
For the Year Ended December 31, 2013 | | | | | | | | | | | | | | | | | | | | | | | | |
Revenue | | $ | 58,772 | | | $ | 429 | | | $ | 59,201 | | | $ | — | | | $ | — | | | $ | 59,201 | |
Net income (loss) attributable to ICG Group, Inc. | | $ | (18,026 | ) | | $ | (2,320 | ) | | $ | (20,346 | ) | | $ | 230,773 | | | $ | (1,368 | ) | | $ | 209,059 | |
For the Year Ended December 31, 2012 | | | | | | | | | | | | | | | | | | | | | | | | |
Revenue | | $ | 26,026 | | | $ | 614 | | | $ | 26,640 | | | $ | — | | | $ | — | | | $ | 26,640 | |
Net income (loss) attributable to ICG Group, Inc. | | $ | (18,244 | ) | | $ | (2,835 | ) | | $ | (21,079 | ) | | $ | 10,440 | | | $ | 33,628 | | | $ | 22,989 | |
For the Year Ended December 31, 2011 | | | | | | | | | | | | | | | | | | | | | | | | |
Revenue | | $ | 12,885 | | | $ | — | | | $ | 12,885 | | | $ | — | | | $ | — | | | $ | 12,885 | |
Net income (loss) attributable to ICG Group, Inc. | | $ | (7,490 | ) | | $ | — | | | $ | (7,490 | ) | | $ | 11,031 | | | $ | 24,025 | | | $ | 27,566 | |
19
Results of Operations – Vertical Cloud Businesses
Year Ended December 31, 2013 compared to Year Ended December 31, 2012
The following presentation includes the consolidated results of Bolt, GovDelivery and MSDSonline, as well as the equity loss associated with Bolt for the period prior to that company’s consolidation beginning on December 27, 2012.
| | Year Ended December 31, | | | Annual Change | |
| | 2013 | | | 2012 | | | (in thousands) | | | (percentage) | |
| | (in thousands) | |
Selected data: | | | | | | | | | | | | | | | | |
Revenue | | $ | 58,772 | | | $ | 26,026 | | | $ | 32,746 | | | | 126 | % |
Cost of revenue | | | (17,687 | ) | | | (9,203 | ) | | | (8,484 | ) | | | (92 | )% |
Sales and marketing | | | (28,071 | ) | | | (12,291 | ) | | | (15,780 | ) | | | (128 | )% |
General and administrative | | | (10,804 | ) | | | (4,402 | ) | | | (6,402 | ) | | | (145 | )% |
Research and development | | | (9,032 | ) | | | (7,892 | ) | | | (1,140 | ) | | | (14 | )% |
Amortization of intangible assets | | | (8,398 | ) | | | (4,837 | ) | | | (3,561 | ) | | | (74 | )% |
Impairment related and other | | | (1,212 | ) | | | (265 | ) | | | (947 | ) | | | NM | |
Operating expenses | | | (75,204 | ) | | | (38,890 | ) | | | (36,314 | ) | | | (93 | )% |
Operating loss | | | (16,432 | ) | | | (12,864 | ) | | | (3,568 | ) | | | (28 | )% |
Interest and other | | | (1,535 | ) | | | 2 | | | | (1,537 | ) | | | NM | |
Income tax benefit (expense) | | | (59 | ) | | | (109 | ) | | | 50 | | | | 46 | % |
Equity income (loss) | | | — | | | | (5,273 | ) | | | 5,273 | | | | 100 | % |
Net loss | | $ | (18,026 | ) | | $ | (18,244 | ) | | $ | 218 | | | | 1 | % |
Revenue
Revenue increased $32.7 million from the year ended December 31, 2012 to the year ended December 31, 2013, primarily due to strong organic revenue growth at MSDSonline and GovDelivery. Revenue at GovDelivery and MSDSonline increased $14.4 million in the aggregate in the 2013 period compared to the 2012 period as a result of new customer contracts and services. The residual increase is due to the consolidation of Bolt on December 27, 2012, resulting in revenue being recognized in the 2013 period, compared to no revenue from Bolt being included in our consolidated results in 2012 when Bolt was accounted for under the equity method of accounting.
Operating expenses
Operating expenses increased $36.3 million from the year ended December 31, 2012 to the corresponding 2013 period. The consolidation of Bolt on December 27, 2012 increased 2013 operating expenses $22.8 million compared to 2012. Cost of revenue increased from 2012 to 2013, primarily as a result of the Bolt consolidation but improved as a percentage of revenue. Sales and marketing expenses increased and the percentage of those expenses to revenue also increased in the 2013 period compared to the 2012 period due to the Bolt consolidation and the increase in the number of sales employees for all of our businesses. General and administrative and research and development expenses increased from 2012 to 2013 primarily as a result of the Bolt consolidation. Amortization expense increased due to the intangible amortization associated with acquisition accounting for the consolidation of Bolt. We expect sales and marketing expenses to increase in 2014, as compared to 2013, as we aggressively build out teams at our businesses to drive revenue growth.
Interest and other
The increase in interest and other from the year ended December 31, 2012 to the year ended December 31, 2013 is primarily due to interest expense at Bolt associated with debt obligations at that business. As a result of the consolidation of Bolt on December 27, 2012, Bolt’s interest expense is included in our consolidated results in 2013 but ICG’s share of Bolt’s interest expense related to 2012 is reflected in equity loss. Given our strong balance sheet, we plan to reduce third-party debt and, accordingly, reduce interest expense in future periods. However, we may also incur prepayment penalties by acting on this strategy.
Income tax benefit (expense)
Income tax benefit (expense) in the years ended December 31, 2013 and 2012 primarily relates to state income taxes at MSDSonline.
20
Equity loss
| | Year Ended December 31, | | | Annual Change | |
| | 2013 | | | 2012 | | | (in thousands) | | | (percentage) | |
| | (in thousands) | |
Selected data: | | | | | | | | | | | | | | | | |
Our share of total net loss | | $ | — | | | $ | (4,287 | ) | | $ | 4,287 | | | | 100 | % |
Amortization of intangible assets | | | — | | | | (986 | ) | | | 986 | | | | 100 | % |
Equity loss | | $ | — | | | $ | (5,273 | ) | | $ | 5,273 | | | | 100 | % |
Equity loss related to our vertical cloud segment for the year ended December 31, 2012 reflects our share of the results of Bolt, which was accounted for using the equity method of accounting in that period. On December 27, 2012, we increased our ownership in Bolt and consolidated the results of Bolt from that point forward.
Year Ended December 31, 2012 compared to Year Ended December 31, 2011
| | Year Ended December 31, | | | Annual Change | |
| | 2012 | | | 2011 | | | (in thousands) | | | (percentage) | |
| | (in thousands) | |
Selected data: | | | | | | | | | | | | | | | | |
Revenue | | $ | 26,026 | | | $ | 12,885 | | | $ | 13,141 | | | | 102 | % |
Cost of revenue | | | (9,203 | ) | | | (4,589 | ) | | | (4,614 | ) | | | (101 | )% |
Sales and marketing | | | (12,291 | ) | | | (5,306 | ) | | | (6,985 | ) | | | (132 | )% |
General and administrative | | | (4,402 | ) | | | (3,033 | ) | | | (1,369 | ) | | | (45 | )% |
Research and development | | | (7,892 | ) | | | (2,934 | ) | | | (4,958 | ) | | | (169 | )% |
Amortization of intangible assets | | | (4,837 | ) | | | (1,373 | ) | | | (3,464 | ) | | | NM | |
Impairment related and other | | | (265 | ) | | | (135 | ) | | | (130 | ) | | | (96 | )% |
Operating expenses | | | (38,890 | ) | | | (17,370 | ) | | | (21,520 | ) | | | (124 | )% |
Operating loss | | | (12,864 | ) | | | (4,485 | ) | | | (8,379 | ) | | | (187 | )% |
Interest and other | | | 2 | | | | (22 | ) | | | (24 | ) | | | (109 | )% |
Income tax benefit (expense) | | | (109 | ) | | | - | | | | (109 | ) | | | (100 | )% |
Equity income (loss) | | | (5,273 | ) | | | (2,983 | ) | | | (2,290 | ) | | | (77 | )% |
Net loss | | $ | (18,244 | ) | | $ | (7,490 | ) | | $ | (10,754 | ) | | | (144 | )% |
Revenue
Revenue increased $13.1 million from the year ended December 31, 2011 to the corresponding 2012 period primarily, due to strong organic revenue growth at GovDelivery resulting from new customers at that company. The residual increase in revenue is due to the acquisition of MSDSonline on March 30, 2012, whereby MSDSonline’s revenues are reflected in most of the 2012 period but not in the 2011 period.
Operating expenses
Operating expenses increased $21.5 million from the year ended December 31, 2011 to the corresponding 2012 period. The increase in operating expenses in 2012 is primarily related to the acquisition of MSDSonline on March 30, 2012, since MSDSonline’s operating expenses are reflected in most of the 2012 period but not in the 2011 period. In addition, the increase in sales and marketing expenses relates to our focus on sales and marketing initiatives at our businesses. Amortization expense increased due to the intangible amortization associated with our acquisition accounting for the acquisition of MSDSonline.
Equity loss
| | Year Ended December 31, | | | Annual Change | |
| | 2012 | | | 2011 | | | (in thousands) | | | (percentage) | |
| | (in thousands) | |
Selected data: | | | | | | | | | | | | | | | | |
Our share of total net loss | | $ | (4,287 | ) | | $ | (2,383 | ) | | $ | (1,904 | ) | | | (80 | )% |
Amortization of intangible assets | | | (986 | ) | | | (600 | ) | | | (386 | ) | | | (64 | )% |
Equity loss | | $ | (5,273 | ) | | $ | (2,983 | ) | | $ | (2,290 | ) | | | 77 | % |
21
Equity loss for our vertical cloud segment for the year ended December 31, 2012 and 2011 relates to our share of the results of Bolt. Net loss at Bolt increased in the 2012 period compared to the 2011 period primarily due to the timing of expenses associated with a large multi-year contract signing as well as sales and marketing initiatives at Bolt aimed at generating revenue growth.
Income tax benefit (expense)
Income tax benefit (expense) in the year ended December 31, 2012 primarily relates to state income taxes at MSDSonline.
Results of Operations – Vertical Cloud (Venture) Businesses
The following presentation includes the consolidated results of CIML for the period from July 11, 2012 (the date on which we acquired additional ownership interests in CIML from noncontrolling shareholders) to February 20, 2013 (the date on which options and warrants were exercised, in connection with the sale of Channel Intelligence to Google, and we no longer controlled CIML) when CIML was consolidated in our results, as well as the equity loss associated with CIML for the period prior to July 11, 2012 and after February 20, 2013, when CIML was accounted for as an equity method company.
| | Year Ended December 31, | | | Annual Change | |
| | 2013 | | | 2012 | | | (in thousands) | | | (percentage) | |
| | (in thousands) | |
Selected data: | | | | | | | | | | | | | | | | |
Revenue | | $ | 429 | | | $ | 614 | | | $ | (185 | ) | | | (30 | )% |
Cost of revenue | | | (70 | ) | | | (256 | ) | | | 186 | | | | 73 | % |
Sales and marketing | | | (58 | ) | | | (64 | ) | | | 6 | | | | 9 | % |
General and administrative | | | (1,024 | ) | | | (894 | ) | | | (130 | ) | | | (15 | )% |
Research and development | | | — | | | | (915 | ) | | | 915 | | | | 100 | % |
Amortization of intangible assets | | | (72 | ) | | | — | | | | (72 | ) | | | (100 | )% |
Impairment related and other | | | (127 | ) | | | — | | | | (127 | ) | | | (100 | )% |
Operating expenses | | | (1,351 | ) | | | (2,129 | ) | | | 778 | | | | 37 | % |
Operating loss | | | (922 | ) | | | (1,515 | ) | | | 593 | | | | 39 | % |
Interest and other | | | (1 | ) | | | 34 | | | | (35 | ) | | | (103 | )% |
Income tax benefit (expense) | | | — | | | | — | | | | — | | | | — | |
Equity income (loss) | | | (1,397 | ) | | | (1,354 | ) | | | (43 | ) | | | (3 | )% |
Net loss | | $ | (2,320 | ) | | $ | (2,835 | ) | | $ | 515 | | | | 18 | % |
Equity loss
| | Year Ended December 31, | | | Annual Change | |
| | 2013 | | | 2012 | | | (in thousands) | | | (percentage) | |
| | (in thousands) | |
Selected data: | | | | | | | | | | | | | | | | |
Our share of total net loss | | $ | (1,232 | ) | | $ | (1,254 | ) | | $ | 22 | | | | 2 | % |
Amortization of intangible assets | | | (165 | ) | | | (100 | ) | | | (65 | ) | | | (65 | )% |
Equity loss | | $ | (1,397 | ) | | $ | (1,354 | ) | | $ | (43 | ) | | | (3 | )% |
Equity loss for our vertical cloud venture segment for the year ended December 31, 2013 and 2012 relates to our share of the results of CIML. CIML’s operating results were generally consistent between periods and were primarily due to costs associated with start-up activities at mylist and the build-out of mylist’s technology platform that were incurred during those periods. CIML did not have any operating results for 2011.
Results of Operations – Reconciling Items
Dispositions
Discontinued operations as of December 31, 2013 include the following: (1) Procurian, which was sold to Accenture on December 4, 2013, (2) the Channel Intelligence subsidiary of CIML that was sold to Google on February 20, 2013, and (3) InvestorForce, which was sold to MSCI on January 29, 2013. The following businesses that had been accounted for under the equity method of accounting were disposed during one of the years ended December 31, 2013, 2012 and 2011: (1) WhiteFence, substantially all of the assets of which were acquired by Allconnect, Inc. (“Allconnect”) on October 28, 2013, (2) Freeborders, which was merged with Symbio S.A. (“Symbio”) on October 18, 2013, (3) GoIndustry-DoveBid plc (“GoIndustry”), which was sold to Liquidity Services, Inc. (“Liquidity
22
Services”) on July 5, 2012, (4) StarCite, Inc. (“StarCite”), which was sold to The Active Network, Inc. (“Active”) on December 30, 2011, (5) ClickEquations, Inc. (“ClickEquations”), substantially all of the assets of which were acquired by Channel Intelligence on June 14, 2011, and (6) Metastorm Inc. (“Metastorm”), which was sold to Open Text Corporation (“Open Text”) on February 17, 2011. The results of these businesses (or our share of the results in the case of the equity-method businesses, including any related intangible amortization) were removed from our segments and are included in “Dispositions” in the “Results of Operations” segment information table above for all periods presented. The net impact of those discontinued operations and our share of the results of the disposed equity-method businesses are detailed below.
Equity loss and Discontinued operations
| | Year Ended December 31, | | | Annual Change | |
| | 2013 | | | 2012 | | | (in thousands) | | | (percentage) | |
| | (in thousands) | |
Selected data: | | | | | | | | | | | | | | | | |
Equity loss | | $ | (1,566 | ) | | $ | (2,044 | ) | | $ | 478 | | | | 23 | % |
Discontinued operations, including gain on sale | | | 232,339 | | | | 12,484 | | | | 219,855 | | | | NM | |
Equity income (loss) and discontinued operations | | $ | 230,773 | | | $ | 10,440 | | | $ | 220,333 | | | | NM | |
| | Year Ended December 31, | | | Annual Change | |
| | 2012 | | | 2011 | | | (in thousands) | | | (percentage) | |
| | (in thousands) | |
Selected data: | | | | | | | | | | | | | | | | |
Equity loss | | $ | (2,044 | ) | | $ | (8,282 | ) | | $ | 6,238 | | | | 75 | % |
Discontinued operations, including gain on sale | | | 12,484 | | | | 19,313 | | | | (6,829 | ) | | | (35 | )% |
Equity income (loss) and discontinued operations | | $ | 10,440 | | | $ | 11,031 | | | $ | (591 | ) | | | (5 | )% |
On December 4, 2013, Procurian was acquired by Accenture. Procurian’s revenue for the years ended December 31, 2013, 2012 and 2011 was $127.1 million, $140.0 million and $120.6 million, respectively, and our share of Procurian’s net income was less than $0.1 million, $8.4 million and $12.9 million, respectively, in those periods. Procurian’s results (and the gain on sale of Procurian) are the primary driver of the income reflected in the line item “Discontinued operations, including gain on sale” in the tables above. Procurian’s revenue was higher in 2012 than 2013 mainly due to recognition of revenue under an interim contract associated with a large long-term contract that was awarded to Procurian in 2012. In addition, changes in net income in each of those periods was primarily impacted by increased staffing needs to facilitate the large long-term contract noted, including subcontractor fees, and the re-allocation of income tax benefit/(expense) between discontinued operations and continuing operations for Procurian on a standalone basis. In connection with the Procurian sale, we recorded a gain of $224.9 million during the year ended December 31, 2013.
On February 20, 2013, Channel Intelligence was sold to Google. From June 11, 2012 through February 20, 2013, Channel Intelligence was included in our consolidated results; prior to June 11, 2012, Channel Intelligence was accounted for under the equity method of accounting. Channel Intelligence’s revenue for the period from January 1, 2013 through February 20, 2013 was $3.1 million, and our share of Channel Intelligence’s net loss for that period was $2.5 million. Channel Intelligence’s revenue for the period from June 11, 2012 through December 31, 2012 was $11.1 million, and our share of Channel Intelligence’s net income for that period was $0.7 million. Additionally, we recorded $0.4 million and $2.5 million in 2013 and 2012, respectively, of amortization expense related to intangible assets and charges related to acquisition adjustments that were recorded in connection with the consolidation of Channel Intelligence in July 2012. The results of Channel Intelligence that had been included in our consolidated results are included in the line item “Discontinued operations, including gain on sale” in the table above. Our share of Channel Intelligence’s net income for the period from January 1, 2012 to July 11, 2012 (when Channel Intelligence was accounted for under the equity method of accounting) was $0.2 million, and our share of Channel Intelligence’s net loss for the year ended December 31, 2011 was $1.4 million; those amounts are included in the line item “Equity loss” in the table above for the years ended December 31, 2012 and 2011. In connection with the Channel Intelligence sale to Google, we recorded a gain of $17.8 million during year ended December 31, 2013.
On January 29, 2013, InvestorForce was sold to MSCI. InvestorForce’s revenue for the years ended December 31, 2013, 2012 and 2011 was $0.8 million, $8.6 million and $7.1 million, respectively. Our share of InvestorForce’s net loss was $0.5 million, $1.4 million and $2.4 million for the years ended December 31, 2013, 2012 and 2011, respectively. The results of InvestorForce (and the gain on the sale of InvestorForce) are included in the line item “Discontinued operations, including gain on sale” in the table above. In connection with the sale transaction, we recorded a gain of $15.7 million during the year ended December 31, 2013.
On October 28, 2013, substantially all of the assets of WhiteFence were sold to Allconnect. For the years ended December 31, 2013, 2012 and 2011, our share of WhiteFence’s net loss was $0.7 million, $1.3 million and $1.2 million, respectively. Those amounts are included in the line item “Equity loss” in the table above.
23
On October 18, 2013, Freeborders was sold to Symbio. For the years ended December 31, 2013, 2012 and 2011, our share of Freeborders’ net loss was $0.9 million, $0.2 million and less than $0.1 million, respectively. Those amounts are included in the line item “Equity loss” in the table above.
On July 5, 2012, GoIndustry was sold to Liquidity Services. For the years ended December 31, 2012 and 2011, our share of GoIndustry’s net loss was $0.7 million and $1.5 million, respectively. Those amounts are included in the line item “Equity loss” in the table above.
On December 30, 2011, StarCite was sold to Active. For the year ended December 31, 2011, our share of StarCite’s net loss was $1.9 million. Additionally, we recorded $1.2 million of ICG’s intangible asset amortization related to StarCite for the year ended December 31, 2011. Those amounts are included in the line item “Equity loss” in the table above.
On June 14, 2011, substantially all of the assets of ClickEquations were sold to Channel Intelligence. For the year ended December 31, 2011, our share of ClickEquations’ net loss was $0.7 million. That amount is included in the line item “Equity loss” in the table above.
On February 17, 2011, Metastorm was sold to Open Text. For the year ended December 31, 2011, our share of Metastorm’s net loss was $0.3 million. That amount is included in the line item “Equity loss” in the table above.
Other
Year Ended December 31, 2013 compared to Year Ended December 31, 2012
| | Year Ended December 31, | | | Annual Change | |
| 2013 | | | 2012 | | | (in thousands) | | | (percentage) | |
| | (in thousands) | |
Corporate general and administrative | | $ | (19,132 | ) | | $ | (23,113 | ) | | $ | 3,981 | | | | 17 | % |
Impairment related and other | | | (2,953 | ) | | | (865 | ) | | | (2,088 | ) | | | NM | |
Corporate other income (loss) | | | (4,102 | ) | | | 57,826 | | | | (61,928 | ) | | | (107 | )% |
Interest income | | | 171 | | | | 372 | | | | (201 | ) | | | (54 | )% |
Income tax benefit (expense) | | | 17,630 | | | | 1 | | | | 17,629 | | | | NM | |
Equity loss | | | - | | | | (1 | ) | | | 1 | | | | 100 | % |
Noncontrolling interest (income) loss | | | 7,018 | | | | (592 | ) | | | 7,610 | | | | NM | |
Net income (loss) | | $ | (1,368 | ) | | $ | 33,628 | | | $ | (34,996 | ) | | | (103 | )% |
Corporate general and administrative
Corporate general and administrative expenses decreased from the year ended December 31, 2012 to the year ended December 31, 2013 primarily due to lower aggregate salary and bonus expenses following the termination of certain ICG employees in 2012 and the issuance of performance-based equity awards made in 2013 in lieu of a portion of the annual cash bonus historically paid to ICG management in connection with achievement under ICG’s annual performance plan. Those reductions were partially offset by an increase in equity-based compensation charges, primarily related to the performance-based equity awards issued in March 2013 in connection with our annual performance plan.
Impairment related and other
Impairment related and other for the year ended December 31, 2012 and 2013 primarily relates to severance expense in those periods.
Corporate other income (loss)
Corporate other income (loss) for the year ended December 31, 2013 primarily related to the loss on the WhiteFence asset sale. Corporate other income (loss) for the year ended December 31, 2012 primarily related to the gains on fair value for the respective consolidations of CIML and Bolt and funds received in connection with the final escrow distribution from the sale of a former equity method business, which we recorded as a gain in the period the distribution was received, as well as proceeds from the sale of Active common stock.
24
Interest income
The decrease in interest income from 2012 to 2013 is primarily due to significantly lower yield rates on cash balances in 2013 than 2012, partially offset by a higher average cash balance in 2013.
Income tax benefit (expense)
The income tax benefit recognized in 2013 is offset by a tax provision in discontinued operations since there was a loss in continuing operations and income in discontinued operations in that same year. There was not a similar benefit in 2012 as there was income in both continuing and discontinued operations in that year.
Noncontrolling interest (income) loss
The increase in the loss attributable to the non-controlling interests in the year ended December 31, 2013 compared to the year ended December 31, 2012 relates to changes in the non-controlling interests with respect to all of ICG’s consolidated businesses, which also included the noncontrolling interest’s portion of transaction costs associated with our sales of Channel Intelligence and Procurian.
Year Ended December 31, 2012 compared to Year Ended December 31, 2011
| | Year Ended December 31, | | | Annual Change | |
| 2012 | | | 2011 | | | (in thousands) | | | (percentage) | |
| | (in thousands) | |
Corporate general and administrative | | $ | (23,113 | ) | | $ | (17,086 | ) | | $ | (6,027 | ) | | | (35) | % |
Impairment related and other | | | (865 | ) | | | 26 | | | | (891 | ) | | | NM | |
Corporate other income (loss) | | | 57,826 | | | | 43,207 | | | | 14,619 | | | | 34 | % |
Interest income | | | 372 | | | | 348 | | | | 24 | | | | 7 | % |
Income tax benefit (expense) | | | 1 | | | | 464 | | | | (463 | ) | | | (100 | )% |
Equity loss | | | (1 | ) | | | (699 | ) | | | 698 | | | | 100 | % |
Noncontrolling interest (income) loss | | | (592 | ) | | | (2,235 | ) | | | 1,643 | | | | 74 | % |
Net income (loss) | | $ | 33,628 | | | $ | 24,025 | | | $ | 9,603 | | | | 40 | % |
Corporate general and administrative
General and administrative expenses at corporate increased from the year ended December 31, 2011 to the year ended December 31, 2012, primarily due to higher bonuses in connection with our achievement under our annual performance plan in 2012.
Impairment related and other
Impairment related and other for the year ended December 31, 2012 primarily relates to severance expense in that period.
Corporate other income (loss)
Corporate other income (loss) for the year ended December 31, 2012, primarily related to the gains on fair value upon the respective consolidations of CIML and Bolt and funds received in connection with the final escrow distribution from the sale of a former equity method business, which we recorded as a gain in the period the distribution was received, as well as proceeds from the sale of Active common stock. Corporate other income (loss) for the year ended December 31, 2011 primarily related to gains on the sales of Metastorm and StarCite.
Interest income
The increase in interest income for 2012 from that for 2011 is primarily due to higher cash balances and significantly higher yield rates on cash balances in 2012 than in 2011, partially offset by a higher average cash balance in 2011.
Income tax benefit (expense)
The income tax benefit for the year ended December 31, 2011 primarily relates to losses at corporate.
25
Equity loss
Equity loss for the year ended December 31, 2011 relates to our share of the results of Acquirgy, Inc. (“Acquirgy”). We account for Acquirgy under the equity method of accounting. As of December 31, 2013 and 2012, our basis in Acquirgy was zero.
Noncontrolling interest (income) loss
The decrease in the loss attributable to the non-controlling interests for the year ended December 31, 2012 compared to the year ended December 31, 2011 relates to changes in the non-controlling interests with respect to all of ICG’s consolidated businesses.
Liquidity and Capital Resources
As of December 31, 2013, our principal source of liquidity was cash and cash equivalents totaling $334.7 million. Our cash and cash equivalents are comprised primarily of money market funds and commercial paper investments. We fund our operations with cash on hand, cash flow from operations, borrowings at certain of our businesses and proceeds from sales of our businesses.
As part of our business strategy, we constantly look to acquire new, cloud-based businesses that bring transformative efficiency to specific vertical markets. We could purchase such businesses using cash or debt. Our existing vertical cloud businesses also intend to pursue acquisition opportunities, using either cash on hand, cash from debt borrowings or stock as consideration. In connection with any such acquisitions, and as part of our capital allocation program, we may purchase additional debt or equity securities from our existing businesses. We may also use cash to repurchase shares of our common stock. We also expect to continue our aggressive sales and marketing campaigns and research and development initiatives. We expect that our current sources of liquidity, as described above, will be sufficient to fund our cash requirements, including execution of such initiatives, for the foreseeable future.
We do not expect any of our existing vertical cloud businesses to pay a dividend in the near future. However, because we do not own 100% of any of those businesses, if one of our existing vertical cloud businesses were to pay a dividend or to make any other distribution to its equity holders, the noncontrolling interest holders may receive a portion of that dividend or distribution.
Our consolidated businesses may issue additional securities or repurchase outstanding shares. Equity issuances or repurchases by one of those businesses, including dilution associated with management equity grants, may change the ownership split that ICG and the noncontrolling interest holders have in that subsidiary. Any change in the ownership of a consolidated subsidiary would result in an adjustment to ICG’s additional paid-in capital.
From time to time, we may be required to increase our ownership in one or more of our consolidated businesses as a result of certain members of those businesses’ management teams exercising put rights (See Note 4, “Consolidated Businesses”). From time to time, we may also seek to voluntarily increase our ownership in one or more of our consolidated businesses.
Our cash flows from operating, investing and financing activities of continuing operations, as reflected in the Consolidated Statements of Cash Flows, are summarized in the following table:
| | Year ended December 31, | |
| | 2013 | | | 2012 | | | 2011 | |
Cash provided by (used in): | | | | | | | | | | | | |
Operating activities | | $ | (18,323 | ) | | $ | (10,816 | ) | | $ | (10,167 | ) |
Investing activities | | $ | 374,166 | | | $ | (48,254 | ) | | $ | 41,920 | |
Financing activities | | $ | (36,844 | ) | | $ | (7,546 | ) | | $ | (9,144 | ) |
Operating activities
Income from continuing operations is adjusted for non-cash items that include depreciation and amortization, equity-based compensation charges, other income/loss associated with the disposal of ownership interests in businesses and marketable securities, equity loss and the current income tax benefit related to discontinued operations. In 2013, the increase in cash used in operating activities was primarily driven by operating expenses of our overall businesses, which includes Bolt for 2013 and includes the spending initiatives related to sales and marketing, partially offset by the net impact of working capital components on cash flows used in operating activities of $3.0 million. In 2012, the cash provided by operating activities related in large part to an increase in deferred revenue during the year, primarily due to the acquisitions of MSDSonline and the consolidation of Bolt in that year. In 2011, the cash provided by operating activities was primarily driven by the receipt of a $6.3 million tax refund.
26
Investing activities
In 2013, cash provided by investing activities primarily relates to proceeds received from the sales of Procurian, Channel Intelligence and InvestorForce during the year, partially offset by Bolt’s acquisition of Superior Access Insurance Services, Inc. (“Superior Access”) in August 2013. In 2012, cash used in investing activities primarily reflects cash paid to acquire MSDSonline in March 2012 and cash paid to acquire additional interests in Bolt in December 2012. In 2011, the cash provided by investing activities relates mostly to sales of certain of our ownership interests in our equity method businesses and marketable securities.
Financing activities
For all three years presented, cash flows from financing activities resulted in net cash used. In 2013, acquisitions of noncontrolling interests in subsidiary equity, primarily for Bolt and GovDelivery, ICG’s repurchase of its common stock, and tax withholdings related to SAR exercises increased significantly from 2012 and 2011. In 2012 and 2011, ICG’s repurchases of its common stock were the primarily use of cash in financing activities.
Our working capital increased during the year ended 2013 from the year ended 2012 due primarily to the proceeds we received from the sales of Procurian, and, to a lesser extent, Channel Intelligence and InvestorForce.
From time to time, we and our businesses are involved in various claims and legal actions arising in the ordinary course of business. We do not expect any liability with respect to any legal claims or actions that would materially affect our financial position or cash flows.
Contractual Cash Obligations and Commercial Commitments
The following table summarizes our contractual cash obligations and commercial commitments as of December 31, 2013:
| | Payments due by period | |
| | Total | | | 2014 | | | 2015-2016 | | | 2017-2018 | | | Thereafter | |
Term loans and lines of credit, including projected interest | | $ | 13,398 | | | $ | 6,850 | | | $ | 6,548 | | | $ | — | | | $ | — | |
Operating leases | | | 7,360 | | | | 2,665 | | | | 4,182 | | | | 513 | | | | — | |
| | $ | 20,758 | | | $ | 9,515 | | | $ | 10,730 | | | $ | 513 | | | $ | — | |
Off-Balance Sheet Arrangements
We are not involved in any off-balance sheet arrangements that have or are reasonably likely to have a material future effect on our financial condition, changes in financial condition, revenue or expenses, results of operations, liquidity, capital expenditures or capital resources.
Critical Accounting Policies
Our discussion and analysis of our financial condition and results of operations are based upon our Consolidated Financial Statements, which have been prepared in accordance with GAAP. The preparation of our financial statements requires us to make estimates and judgments that affect the reported amounts of assets, liabilities, revenue and expenses and related disclosure of contingent assets and liabilities. On an ongoing basis, we evaluate our estimates, including those related to our interests in our businesses, marketable securities, revenue, income taxes and commitments and contingencies. We base our estimates on historical experience and on various other assumptions that are believed to be reasonable under the circumstances, the results of which form the basis for making judgments about the carrying values of assets and liabilities. Actual results may differ from those estimates under different assumptions or conditions.
We believe the following critical accounting policies are important to the presentation of our financial statements and often require difficult, subjective and complex judgments.
Valuation of Goodwill, Intangible Assets and Ownership Interests
We test goodwill for impairment annually, or more frequently as conditions warrant, and intangible assets when events or changes in circumstances indicate that the carrying amount of an asset may not be recoverable. Additionally, we perform ongoing business reviews to evaluate our ownership interests in companies accounted for under the equity and cost methods of accounting to determine whether an other-than-temporary decline in the value of a company should be recognized. We use quantitative and qualitative measures to assess the need to record impairment losses on goodwill, intangible assets and ownership interests in our businesses when impairment indicators are present. Where impairment indicators are present, we determine the amount of the impairment charge as the
27
excess of the carrying value over the fair value. We determine fair value using a combination of the discounted cash flow methodology, which is based upon converting expected future cash flows to present value, and the market approach, which includes analysis of market price multiples of companies engaged in lines of business similar to the company being evaluated. The market price multiples are selected and applied to the company based on relative performance, future prospects and risk profile of the company in comparison to the guideline companies. Significant assumptions relating to future operating results must be made when estimating the future cash flows associated with these businesses. Significant assumptions relating to the achievement of business plan objectives and milestones must be made when evaluating whether impairment indicators are present. Should unforeseen events occur or should operating trends change significantly, additional impairment losses could occur.
Revenue Recognition
Bolt generates revenue from (1) software licenses, (2) maintenance and support services, (3) professional service fees, (4) insurance commissions and (5) subscription fees. Bolt’s software license revenue derives from licenses of its software products directly to end users and is recognized when persuasive evidence of an arrangement exists, delivery of the product has occurred, no significant obligations with regard to implementation remain, the fee is fixed or determinable and collectability is probable; Bolt’s software license revenue is recognized ratably over the applicable contract term. Bolt’s maintenance and customer support fees are recognized ratably over the life of maintenance and support contracts, which is typically one year. Bolt’s professional service fees revenue relates to professional services for software licenses that require significant customization, integration and installation; that revenue is recognized ratably over the applicable contract term. Bolt’s commissions on the premiums from sales of insurance policies are recognized when Bolt has sufficient information to determine the amount that is owed, it is probable that the economic benefits associated with the transaction will flow to Bolt, and the costs incurred, or to be incurred, with respect to the transaction can be accurately measured. Finally, Bolt recognizes subscription fee revenue over the subscription period, which is generally one month.
GovDelivery revenue consists of (1) nonrefundable setup fees and (2) monthly maintenance and hosting fees. Those fees generally are deferred and recognized as the services are performed, which is typically over the service term. Costs related to performing setup services are expensed as incurred.
MSDSonline derives revenue from two sources: (1) subscription fees and (2) professional services fees. The vast majority of MSDSonline’s revenue is derived from subscription fees from customers accessing the business’ database and web-based tools; that revenue is recognized ratably over the applicable contract term, beginning on the contract implementation date. MSDSonline also generates professional services fees from (1) training, (2) authoring of material safety data sheets and (3) compiling customers’ online libraries of material safety data sheet documents and indexing those documents. The revenue derived from those fees is recognized on a percentage of completion basis over the applicable project’s timeline.
Equity Income/Loss
We record our share of our businesses’ net income/loss, which is accounted for under the equity method of accounting as equity income/loss. Since we do not control these businesses, this equity income/loss is based on unaudited results of operations of our businesses and may require adjustment in the future when the audits of our businesses are complete. The compilation and review of these results of operations require significant judgment and estimates by management.
Deferred Income Taxes
We record a valuation allowance to reduce our net deferred tax assets to the amount that is more likely than not to be realized. We consider future taxable income and prudent and feasible tax planning strategies in determining the need for a valuation allowance. In the event that we determine that we would not be able to realize all or part of our net deferred tax assets, an adjustment to the deferred tax assets would be charged to earnings in the period such determination is made. Likewise, if we later determine that it is more likely than not that the net deferred tax assets would be realized, the previously provided valuation allowance would be reversed.
Commitments and Contingencies
From time to time, we are a defendant or plaintiff in various legal actions that arise in the normal course of business. From time to time, we are also a guarantor of various third-party obligations and commitments. We are required to assess the likelihood of any adverse judgments or outcomes to these matters, as well as potential ranges of probable losses. A determination of the amount of reserves required for these contingencies, if any, which would be charged to earnings, is made after careful analysis of each individual matter. The required reserves may change in the future due to new developments in each matter or changes in circumstances, such as a change in settlement strategy. Changes in required reserves could increase or decrease our earnings in the period the changes are made.
28
Fair Value Measurements
Fair value is the price that would be received from selling an asset or paid to transfer a liability in an orderly transaction between market participants at the measurement date. There are three levels of inputs that may be used to measure fair value. Any marketable securities we hold are reported at fair value on our consolidated balance sheets based on quoted prices in active markets for identical or comparable assets.
Recent Accounting Pronouncements
In February 2013, the Financial Accounting Standards Board (“FASB”) issued Accounting Standards Update 2013-02, “Other Comprehensive Income (Topic 220)” (“ASU 2013-02”). The objective of ASU 2013-02 is to improve the reporting of reclassifications out of accumulated other comprehensive income. ASU 2013-02 seeks to attain that objective by requiring an entity to report the effect of significant reclassifications out of accumulated other comprehensive income on the respective line items in net income if the amount being reclassified is required under U.S. generally accepted accounting principles (GAAP) to be reclassified in its entirety to net income in the same reporting period. For other amounts that are not required under U.S. GAAP to be reclassified in their entirety to net income in the same reporting period, an entity is required to cross-reference other disclosures required under U.S. GAAP that provide additional detail about those amounts. ASU 2013-02 was effective prospectively for us in its first quarter of 2013. The impact of the adoption of ASU 2013-02 was insignificant to our Consolidated Financial Statements.
We have considered all other recently issued accounting pronouncements and do not believe the adoption of such pronouncements will have a material impact on its audited Financial Statements.
ITEM 7A. Quantitative and Qualitative Disclosures About Market Risk
As of December 31, 2013, our cash and cash equivalents included $325.7 million in money market accounts. We may be exposed to market risk relating to changes in market interest rates and overall market conditions that could affect the value of our cash and cash equivalents; however, we believe any changes in the fair value of our investment portfolio would be insignificant to our results given current market conditions.
29
ITEM 8. Financial Statements and Supplementary Data
The following Consolidated Financial Statements, and the related Notes thereto, of ICG Group, Inc. and the Report of Independent Registered Public Accounting Firm are filed as a part of this Report.
30
REPORT OF INDEPENDENT REGISTERED PUBLIC ACCOUNTING FIRM
ICG GROUP, INC.
The Board of Directors and Stockholders
ICG Group, Inc. and Subsidiaries:
We have audited the accompanying consolidated balance sheets of ICG Group, Inc. and Subsidiaries (the Company) as of December 31, 2013 and 2012, and the related consolidated statements of operations and comprehensive income (loss), changes in equity and cash flows for each of the years in the three-year period ended December 31, 2013. These consolidated financial statements are the responsibility of the Company’s management. Our responsibility is to express an opinion on these consolidated financial statements based on our audits.
We conducted our audits in accordance with the standards of the Public Company Accounting Oversight Board (United States). Those standards require that we plan and perform the audit to obtain reasonable assurance about whether the financial statements are free of material misstatement. An audit includes examining, on a test basis, evidence supporting the amounts and disclosures in the financial statements. An audit also includes assessing the accounting principles used and significant estimates made by management, as well as evaluating the overall financial statement presentation. We believe that our audits provide a reasonable basis for our opinion.
In our opinion, the consolidated financial statements referred to above present fairly, in all material respects, the financial position of ICG Group, Inc. and Subsidiaries as of December 31, 2013 and 2012, and the results of their operations and their cash flows for each of the years in the three-year period ended December 31, 2013, in conformity with U. S. generally accepted accounting principles.
We also have audited, in accordance with the standards of the Public Company Accounting Oversight Board (United States), ICG Group, Inc. and Subsidiaries’ internal control over financial reporting as of December 31, 2013, based on criteria established in Internal Control—Integrated Framework (1992) issued by the Committee of Sponsoring Organizations of the Treadway Commission (COSO), and our report dated March 17, 2014 expressed an unqualified opinion on the effectiveness of the Company’s internal control over financial reporting.
|
/s/ KPMG LLP |
|
Philadelphia, Pennsylvania |
March 17, 2014 |
31
ICG GROUP, INC.
CONSOLIDATED BALANCE SHEETS
(In Thousands, Except Per Share Data)
| December 31,
2013 | | | December 31,
2012 | |
Assets | | | | | | | |
Current Assets | | | | | | | |
Cash and cash equivalents | $ | 334,656 | | | $ | 20,872 | |
Restricted cash | | 1,242 | | | | 408 | |
Accounts receivable, net of allowance ($200-2013;$202-2012) | | 11,300 | | | | 8,111 | |
Prepaid expenses and other current assets | | 5,907 | | | | 2,630 | |
Assets of discontinued operations | | — | | | | 229,605 | |
Total current assets | | 353,105 | | | | 261,626 | |
Fixed assets, net of accumulated depreciation and amortization | | 5,840 | | | | 8,069 | |
Marketable securities | | — | | | | 327 | |
Goodwill | | 90,352 | | | | 87,812 | |
Intangibles, net | | 58,755 | | | | 61,687 | |
Equity and cost method businesses | | 20,373 | | | | 26,340 | |
Other assets, net | | 1,179 | | | | 1,198 | |
Total Assets | $ | 529,604 | | | $ | 447,059 | |
Liabilities | | | | | | | |
Current Liabilities | | | | | | | |
Current maturities of long-term debt | $ | 5,902 | | | $ | 336 | |
Accounts payable | | 2,970 | | | | 4,260 | |
Accrued expenses | | 5,062 | | | | 2,809 | |
Accrued compensation and benefits | | 8,732 | | | | 5,626 | |
Deferred revenue | | 21,830 | | | | 16,603 | |
Liabilities of discontinued operations | | — | | | | 63,917 | |
Total current liabilities | | 44,496 | | | | 93,551 | |
Long-term debt | | 6,008 | | | | 9,645 | |
Deferred revenue | | 254 | | | | 179 | |
Other liabilities | | 1,726 | | | | 1,269 | |
Total Liabilities | | 52,484 | | | | 104,644 | |
Redeemable noncontrolling interest (Note 4, “Consolidated Businesses”) | | 3,442 | | | | 3,383 | |
Equity | | | | | | | |
ICG Group, Inc.’s Stockholders’ Equity | | | | | | | |
Preferred stock, $0.01 par value; 10,000 shares authorized, none issued or outstanding | | — | | | | — | |
Common stock, $0.001 par value; 2,000,000 shares authorized, 43,333 shares (2013) and 42,155 shares (2012) issued | | 43 | | | | 42 | |
Treasury stock, at cost, 5,118 shares (2013) and 4,211 shares (2012) | | (40,998 | ) | | | (28,973 | ) |
Additional paid-in capital | | 3,536,761 | | | | 3,549,533 | |
Accumulated deficit | | (3,045,685 | ) | | | (3,254,744 | ) |
Accumulated other comprehensive income | | 40 | | | | 40 | |
Total ICG Group, Inc.’s Stockholders’ Equity | | 450,161 | | | | 265,898 | |
Noncontrolling Interest | | 23,517 | | | | 73,134 | |
Total Equity | | 473,678 | | | | 339,032 | |
Total Liabilities, Redeemable noncontrolling interest and Equity | $ | 529,604 | | | $ | 447,059 | |
See accompanying Notes to Consolidated Financial Statements.
32
ICG GROUP, INC.
CONSOLIDATED STATEMENTS OF OPERATIONS AND COMPREHENSIVE INCOME (LOSS)
(In Thousands, Except Per Share Data)
| Year Ended December 31, | |
| 2013 | | | 2012 | | | 2011 | |
Revenue | $ | 59,201 | | | $ | 26,640 | | | $ | 12,885 | |
Operating expenses | | | | | | | | | | | |
Cost of revenue | | 17,757 | | | | 9,459 | | | | 4,589 | |
Sales and marketing | | 28,129 | | | | 12,355 | | | | 5,306 | |
General and administrative | | 30,960 | | | | 28,408 | | | | 20,119 | |
Research and development | | 9,032 | | | | 8,807 | | | | 2,934 | |
Amortization of intangible assets | | 8,470 | | | | 4,837 | | | | 1,373 | |
Impairment related and other | | 4,292 | | | | 1,130 | | | | 109 | |
Total operating expenses | | 98,640 | | | | 64,996 | | | | 34,430 | |
Operating income (loss) | | (39,439 | ) | | | (38,356 | ) | | | (21,545 | ) |
Other income (loss), net | | (4,210 | ) | | | 57,820 | | | | 43,203 | |
Interest income | | 227 | | | | 439 | | | | 361 | |
Interest expense | | (1,484 | ) | | | (25 | ) | | | (31 | ) |
Income (loss) before income taxes, equity loss and noncontrolling interest | | (44,906 | ) | | | 19,878 | | | | 21,988 | |
Income tax (expense) benefit | | 17,571 | | | | (108 | ) | | | 464 | |
Equity loss | | (2,963 | ) | | | (8,672 | ) | | | (11,964 | ) |
Income (loss) from continuing operations | | (30,298 | ) | | | 11,098 | | | | 10,488 | |
Income (loss) from discontinued operations, including gain on sale, net of tax | | 232,339 | | | | 12,483 | | | | 19,313 | |
Net income (loss) | | 202,041 | | | | 23,581 | | | | 29,801 | |
Less: Net income (loss) attributable to the noncontrolling interest | | (7,018 | ) | | | 592 | | | | 2,235 | |
Net income (loss) attributable to ICG Group, Inc. | $ | 209,059 | | | $ | 22,989 | | | $ | 27,566 | |
Amounts attributable to ICG Group, Inc.: | | | | | | | | | | | |
Net income (loss) from continuing operations | $ | (25,669 | ) | | $ | 12,703 | | | $ | 10,682 | |
Net income (loss) from discontinued operations | | 234,728 | | | | 10,286 | | | | 16,884 | |
Net income (loss) | $ | 209,059 | | | $ | 22,989 | | | $ | 27,566 | |
Basic income (loss) per share attributable to ICG Group, Inc.: | | | | | | | | | | | |
Income (loss) from continuing operations | $ | (0.70 | ) | | $ | 0.35 | | | $ | 0.29 | |
Income (loss) from discontinued operations | | 6.42 | | | | 0.29 | | | | 0.46 | |
Net income (loss) | $ | 5.72 | | | $ | 0.64 | | | $ | 0.75 | |
Shares used in computation of basic income (loss) per share | | 36,536 | | | | 35,890 | | | | 36,656 | |
Diluted income (loss) per share attributable to ICG Group, Inc.: | | | | | | | | | | | |
Income (loss) from continuing operations | $ | (0.70 | ) | | $ | 0.35 | | | $ | 0.29 | |
Income (loss) from discontinued operations | | 6.42 | | | | 0.28 | | | | 0.45 | |
Net income (loss) | $ | 5.72 | | | $ | 0.63 | | | $ | 0.74 | |
Shares used in computation of diluted income (loss) per share | | 36,536 | | | | 36,543 | | | | 37,460 | |
Net income (loss) | $ | 202,041 | | | $ | 23,581 | | | $ | 29,801 | |
Other comprehensive income (loss) | | | | | | | | | | | |
Unrealized holding gain (loss) in marketable securities | | 24 | | | | 1,552 | | | | — | |
Reclassified adjustments/realized net (gains) loss on marketable securities | | (23 | ) | | | (1,552 | ) | | | — | |
Other accumulated other comprehensive income (loss) | | (1 | ) | | | (34 | ) | | | 20 | |
Comprehensive income (loss) | | 202,041 | | | | 23,547 | | | | 29,821 | |
Less: Comprehensive income (loss) attributable to the noncontrolling interest | | (7,018 | ) | | | 558 | | | | 2,255 | |
Comprehensive income (loss) attributable to ICG Group, Inc. | $ | 209,059 | | | $ | 22,989 | | | $ | 27,566 | |
See accompanying Notes to Consolidated Financial Statements
33
ICG GROUP, INC.
CONSOLIDATED STATEMENTS OF CHANGES IN EQUITY
(In Thousands)
| ICG Group, Inc. Stockholders’ Equity | | | | | | | |
| Common Stock | | | Treasury Stock | | | Additional
Paid-In
Capital | | | Accumulated
Deficit | | | Accumulated
Other
Comprehensive
Income (AOCI) | | | Non-controlling
Interest | | | Total | |
| Shares | | | Amount | | | Shares | | | Amount | | | | | | | | | | | |
Balance as of December 31, 2010 | | 39,439 | | | $ | 39 | | | | (2,440 | ) | | $ | (12,031 | ) | | $ | 3,541,044 | | | $ | (3,305,299 | ) | | $ | 54 | | | $ | 4,622 | | | $ | 228,429 | |
Equity-based compensation expense related to stock appreciation rights (SARs) and stock options | | — | | | | — | | | | — | | | | — | | | | 2,252 | | | | — | | | | — | | | | — | | | | 2,252 | |
Equity-based compensation related to deferred stock units (DSUs) | | — | | | | — | | | | — | | | | — | | | | 703 | | | | — | | | | — | | | | — | | | | 703 | |
Equity-based compensation related to restricted stock (RS) | | — | | | | — | | | | — | | | | — | | | | 851 | | | | — | | | | — | | | | — | | | | 851 | |
Issuance of DSUs | | 73 | | | | — | | | | — | | | | — | | | | 165 | | | | — | | | | — | | | | — | | | | 165 | |
Issuance of RS, net of forfeitures and surrenders | | 1,178 | | | | 1 | | | | — | | | | — | | | | (32 | ) | | | — | | | | — | | | | — | | | | (31 | ) |
Exercise of SARs and stock options, net of surrenders | | 39 | | | | 1 | | | | — | | | | — | | | | 2 | | | | — | | | | — | | | | — | | | | 3 | |
Repurchase of ICGE common stock | | — | | | | — | | | | (841 | ) | | | (8,588 | ) | | | — | | | | — | | | | — | | | | — | | | | (8,588 | ) |
Impact of redeemable noncontrolling interest accretion | | — | | | | — | | | | — | | | | — | | | | (509 | ) | | | — | | | | — | | | | — | | | | (509 | ) |
Impact of subsidiary equity transactions | | — | | | | — | | | | — | | | | — | | | | (355 | ) | | | — | | | | — | | | | 555 | | | | 200 | |
Noncontrolling owners’ share of AOCI of consolidated subsidiary | | — | | | | — | | | | — | | | | — | | | | — | | | | — | | | | 20 | | | | (20 | ) | | | — | |
Net income (loss) | | — | | | | — | | | | — | | | | — | | | | — | | | | 27,566 | | | | — | | | | 2,456 | | | | 30,022 | |
Balance as of December 31, 2011 | | 40,729 | | | $ | 41 | | | | (3,281 | ) | | $ | (20,619 | ) | | $ | 3,544,121 | | | $ | (3,277,733 | ) | | $ | 74 | | | $ | 7,613 | | | $ | 253,497 | |
See accompanying Notes to Consolidated Financial Statements
34
ICG GROUP, INC.
CONSOLIDATED STATEMENTS OF CHANGES IN EQUITY – (CONTINUED)
(In Thousands)
| ICG Group, Inc. Stockholders’ Equity | | | | | | | | | |
| Common Stock | | | Treasury Stock | | | Additional
Paid-In
Capital | | | Accumulated
Deficit | | | Accumulated
Other
Comprehensive
Income
(AOCI) | | | Non-controlling
Interest | | | Total | |
| Shares | | | Amount | | | Shares | | | Amount | | | | | | | | | | | |
Balance as of December 31,
2011 | | 40,729 | | | $ | 41 | | | | (3,281 | ) | | $ | (20,619 | ) | | $ | 3,544,121 | | | $ | (3,277,733 | ) | | $ | 74 | | | $ | 7,613 | | | $ | 253,497 | |
Equity-based compensation expense related to stock appreciation rights (SARs) and stock options | | — | | | | — | | | | — | | | | — | | | | 2,488 | | | | — | | | | — | | | | — | | | | 2,488 | |
Equity-based compensation related to deferred stock units (DSUs) | | — | | | | — | | | | — | | | | — | | | | 419 | | | | — | | | | — | | | | — | | | | 419 | |
Equity-based compensation related to restricted stock (RS) | | — | | | | — | | | | — | | | | — | | | | 3,155 | | | | — | | | | — | | | | — | | | | 3,155 | |
Issuance of DSUs | | 74 | | | | — | | | | — | | | | — | | | | 107 | | | | — | | | | — | | | | — | | | | 107 | |
Issuance of RS, net of forfeitures and surrenders | | 77 | | | | — | | | | — | | | | — | | | | (188 | ) | | | — | | | | — | | | | — | | | | (188 | ) |
Exercise of SARs and stock options, net of surrenders | | 183 | | | | — | | | | — | | | | — | | | | 1,003 | | | | — | | | | — | | | | — | | | | 1,003 | |
Repurchase of ICGE common stock | | — | | | | — | | | | (930 | ) | | | (8,354 | ) | | | — | | | | — | | | | — | | | | — | | | | (8,354 | ) |
Impact of redeemable noncontrolling interest accretion | | — | | | | — | | | | — | | | | — | | | | (839 | ) | | | — | | | | — | | | | — | | | | (839 | ) |
Impact of subsidiary equity transactions | | 1,092 | | | | 1 | | | | — | | | | — | | | | (733 | ) | | | — | | | | 13 | | | | 64,733 | | | | 64,014 | |
Noncontrolling owners’ share of AOCI of consolidated subsidiary | | — | | | | — | | | | — | | | | — | | | | — | | | | — | | | | (47 | ) | | | 47 | | | | — | |
Net income (loss) | | — | | | | — | | | | — | | | | — | | | | — | | | | 22,989 | | | | — | | | | 741 | | | | 23,730 | |
Balance as of December 31,
2012 | | 42,155 | | | $ | 42 | | | | (4,211 | ) | | $ | (28,973 | ) | | $ | 3,549,533 | | | $ | (3,254,744 | ) | | $ | 40 | | | $ | 73,134 | | | $ | 339,032 | |
See accompanying Notes to Consolidated Financial Statements
35
ICG GROUP, INC.
CONSOLIDATED STATEMENTS OF CHANGES IN EQUITY – (CONTINUED)
(In Thousands)
| ICG Group, Inc. Stockholders’ Equity | | | | | | | | | |
| Common Stock | | | Treasury Stock | | | Additional
Paid-In
Capital | | | Accumulated
Deficit | | | Accumulated
Other
Comprehensive
Income
(AOCI) | | | Non-controlling
Interest | | | Total | |
| Shares | | | Amount | | | Shares | | | Amount | | | | | | | | | | | |
Balance as of December 31,
2012 | | 42,155 | | | $ | 42 | | | | (4,211 | ) | | $ | (28,973 | ) | | $ | 3,549,533 | | | $ | (3,254,744 | ) | | $ | 40 | | | $ | 73,134 | | | $ | 339,032 | |
Equity-based compensation expense related to stock appreciation rights (SARs) and stock options | | — | | | | — | | | | — | | | | — | | | | 2,377 | | | | — | | | | — | | | | — | | | | 2,377 | |
Equity-based compensation related to deferred stock units (DSUs) | | — | | | | — | | | | — | | | | — | | | | 377 | | | | — | | | | — | | | | — | | | | 377 | |
Equity-based compensation related to restricted stock (RS) | | — | | | | — | | | | — | | | | — | | | | 2,958 | | | | — | | | | — | | | | — | | | | 2,958 | |
Issuance of DSUs | | 60 | | | | — | | | | — | | | | — | | | | 359 | | | | — | | | | — | | | | — | | | | 359 | |
Issuance of RS, net of forfeitures and surrenders | | 124 | | | | — | | | | — | | | | — | | | | (609) | | | | — | | | | — | | | | — | | | | (609 | ) |
Exercise of SARs and stock options, net of surrenders | | 994 | | | | 1 | | | | — | | | | — | | | | (11,736 | ) | | | — | | | | — | | | | — | | | | (11,735 | ) |
Impact of redeemable noncontrolling interest accretion | | — | | | | — | | | | — | | | | — | | | | (1,088 | ) | | | — | | | | — | | | | — | | | | (1,088 | ) |
Impact of sale of consolidated subsidiaries | | — | | | | — | | | | — | | | | — | | | | — | | | | — | | | | — | | | | (42,315 | ) | | | (42,315 | ) |
Impact of subsidiary equity transactions | | — | | | | — | | | | — | | | | — | | | | (5,410 | ) | | | — | | | | — | | | | (389 | ) | | | (5,799 | ) |
Repurchase of ICGE common stock | | — | | | | — | | | | (907 | ) | | | (12,025 | ) | | | — | | | | — | | | | — | | | | — | | | | (12,025 | ) |
Net income (loss) | | — | | | | — | | | | — | | | | — | | | | — | | | | 209,059 | | | | — | | | | (6,913 | ) | | | 202,146 | |
Balance as of December 31,
2013 | | 43,333 | | | $ | 43 | | | | (5,118 | ) | | $ | (40,998 | ) | | $ | 3,536,761 | | | $ | (3,045,685 | ) | | $ | 40 | | | $ | 23,517 | | | $ | 473,678 | |
See accompanying Notes to Consolidated Financial Statements
36
ICG GROUP, INC.
CONSOLIDATED STATEMENTS OF CASH FLOWS
(In Thousands)
| Year Ended December 31, | |
| 2013 | | | 2012 | | | 2011 | |
Operating Activities – continuing operations | | | | | | | | | | | |
Net income (loss) | $ | 202,041 | | | $ | 23,581 | | | $ | 29,801 | |
(Income) loss from discontinued operations, including gain on sale, net of tax | | (232,339 | ) | | | (12,483 | ) | | | (19,313 | ) |
Adjustments to reconcile net loss to cash provided by (used in) operating activities: | | | | | | | | | | | |
Depreciation and amortization | | 11,701 | | | | 6,625 | | | | 2,326 | |
Equity-based compensation | | 6,411 | | | | 6,236 | | | | 3,861 | |
Other (income) loss | | 4,210 | | | | (57,820 | ) | | | (43,203 | ) |
Equity loss | | 2,963 | | | | 8,672 | | | | 11,964 | |
Current income tax benefit related to income from discontinued operations | | (17,571 | ) | | | 108 | | | | (464 | ) |
Changes in assets and liabilities, net of effect of acquisitions: | | | | | | | | | | | |
Accounts receivable, net | | (3,445 | ) | | | (378 | ) | | | (1,308 | ) |
Tax receivable | | — | | | | — | | | | 6,314 | |
Prepaid expenses and other assets | | (817 | ) | | | (703 | ) | | | 235 | |
Accounts payable | | (1,358 | ) | | | 2,643 | | | | 274 | |
Accrued expenses | | 1,192 | | | | 1,501 | | | | 310 | |
Accrued compensation and benefits | | 3,034 | | | | 1,697 | | | | (1,371 | ) |
Deferred revenue | | 5,325 | | | | 9,928 | | | | 457 | |
Other liabilities | | 330 | | | | (423 | ) | | | (50 | ) |
Cash flows provided by (used in) operating activities | | (18,323 | ) | | | (10,816 | ) | | | (10,167 | ) |
Investing Activities – continuing operations | | | | | | | | | | | |
Capital expenditures, net | | (1,243 | ) | | | (6,990 | ) | | | (912 | ) |
Change in restricted cash | | (834 | ) | | | (460 | ) | | | 1 | |
Proceeds from other distributions | | — | | | | — | | | | 1,855 | |
Proceeds from sales/distributions of ownership interests | | 388,968 | | | | 20,525 | | | | 54,116 | |
Proceeds from marketable securities | | 760 | | | | 7,632 | | | | — | |
Ownership acquisition, net of cash acquired | | (14,638 | ) | | | (68,961 | ) | | | (12,090 | ) |
Increase (decrease) in cash due to consolidation/deconsolidation of subsidiaries | | 1,153 | | | | — | | | | — | |
Acquisitions by subsidiaries, net of cash acquired | | — | | | | — | | | | (1,050 | ) |
Cash flows provided by (used in) investing activities | | 374,166 | | | | (48,254 | ) | | | 41,920 | |
Financing Activities – continuing operations | | | | | | | | | | | |
Acquisition of noncontrolling interest in subsidiary equity | | (15,430 | ) | | | — | | | | — | |
Borrowings of long-term debt | | 4,900 | | | | — | | | | 238 | |
Repayment of long-term debt and capital lease obligations | | (2,480 | ) | | | — | | | | (798 | ) |
Purchase of treasury stock | | (12,025 | ) | | | (8,354 | ) | | | (8,588 | ) |
Tax withholdings related to equity-based awards | | (11,747 | ) | | | (237 | ) | | | (147 | ) |
Cash received for stock option exercises | | 11 | | | | 1,045 | | | | 151 | |
Other financing activities | | (73 | ) | | | — | | | | — | |
Cash flows provided by (used in) financing activities | | (36,844 | ) | | | (7,546 | ) | | | (9,144 | ) |
Discontinued Operations | | | | | | | | | | | |
Cash flows provided by (used in) operating activities | | 5,216 | | | | 8,260 | | | | 988 | |
Cash flows provided by (used in) investing activities | | (2,302 | ) | | | (17,285 | ) | | | (3,675 | ) |
Cash flows provided by (used in) financing activities | | (8,129 | ) | | | 3,685 | | | | (1,762 | ) |
Net increase (decrease) in cash and cash equivalents from discontinued operations | | (5,215 | ) | | | (5,340 | ) | | | (4,449 | ) |
Net increase (decrease) in cash and cash equivalents | | 313,784 | | | | (71,956 | ) | | | 18,160 | |
Cash and cash equivalents at beginning of period | | 20,872 | | | | 92,828 | | | | 74,668 | |
Cash and cash equivalents at end of period | $ | 334,656 | | | $ | 20,872 | | | $ | 92,828 | |
See accompanying Notes to Consolidated Financial Statements
37
ICG GROUP, INC.
NOTES TO CONSOLIDATED FINANCIAL STATEMENTS
1. The Company
Description of the Company
ICG Group, Inc. (together with its subsidiaries, “ICG”) was formed on March 4, 1996 and is a multi-vertical cloud technology company with offerings that create unique and compelling value for our customers and provide transformative efficiency to vertical markets worldwide.
Basis of Presentation
The Consolidated Financial Statements contained herein (the “Consolidated Financial Statements”) include the accounts of ICG Group, Inc. and its wholly-owned subsidiaries, wholly-controlled subsidiaries and majority-owned subsidiaries.
ICG’s Consolidated Balance Sheets as of December 31, 2013 and 2012 included the financial position of the following majority-owned subsidiaries:
December 31, 2013 | | December 31, 2012 |
Bolt | | Bolt (2) |
GovDelivery | | GovDelivery |
MSDSonline | | MSDSonline |
QC Holdings (1) | | mylist (3) |
ICG’s Consolidated Statements of Operations and Comprehensive Income (Loss) (its “Consolidated Statements of Operations”) for the years ended December 31, 2013, 2012 and 2011 included the results of the following majority-owned subsidiaries:
Year Ended December 31, |
2013 | | 2012 | | 2011 |
Bolt (2) | | GovDelivery | | GovDelivery |
GovDelivery | | MSDSonline (4) | | |
MSDSonline | | mylist (3) | | |
mylist (3) | | | | |
QC Holdings (1) | | | | |
(1) | QC Holdings, Inc. (“QC Holdings”) (f/k/a WhiteFence, Inc.) is the entity that holds the remaining assets of WhiteFence following the sale of substantially all of WhiteFence’s assets to Allconnect on October 28, 2013. The $2.8 million of net assets of QC Holdings consist primarily of a receivable related to the deferred payment from Allconnect and the legal rights to a patent. See Note 13, “Other income (loss).” |
(2) | On December 27, 2012, ICG acquired additional equity ownership interests in Bolt, increasing ICG’s ownership in that company to 53%; ICG began consolidating the financial position of Bolt as of that date. The results of operations of Bolt from the date of acquisition through December 31, 2012 were immaterial to ICG; accordingly, the results of operations of Bolt are included on ICG’s Consolidated Statements of Operations beginning on January 1, 2013. See Note 4, “Consolidated Businesses,” for additional information regarding ICG’s consolidation of Bolt. |
(3) | CIML was a consolidated company from July 11, 2012, when ICG increased its ownership in that company to 52%, to February 20, 2013, when ICG’s equity ownership interest in CIML was reduced to 38% as a result of the exercise of existing warrants and options, in conjunction with the sale of Channel Intelligence to Google. As a result of that sale, Channel Intelligence is presented as discontinued operations in the Consolidated Financial Statements for the relevant periods and is not included in the table above; mylist continues to be included in continuing operations in ICG’s Consolidated Financial Statements for the period for which it was consolidated. |
(4) | On March 30, 2012, ICG acquired 96% of MSDSonline and began consolidating the financial position of MSDSonline as of that date. The results of operations of MSDSonline from the date of acquisition through March 31, 2012 were immaterial to ICG; accordingly, the results of operations of MSDSonline are included on ICG’s Consolidated Statements of Operations beginning on April 1, 2012. See Note 4, “Consolidated Businesses,” for additional information regarding ICG’s acquisition of MSDSonline. |
38
ICG GROUP, INC.
NOTES TO CONSOLIDATED FINANCIAL STATEMENTS – (CONTINUED)
2. Significant Accounting Policies
Principles of Accounting for Ownership Interests
The various interests that ICG acquires in its businesses are accounted for under one of three methods: the consolidation method, the equity method and the cost method. The applicable accounting method is generally determined based on ICG’s voting interest in a company.
Consolidation. Businesses in which (1) ICG directly or indirectly owns more than 50% of the outstanding voting securities, and (2) other stockholders do not possess the right to affect significant management decisions are generally accounted for under the consolidation method of accounting. Participation of other stockholders in the net assets and in the earnings or losses of a consolidated subsidiary is reflected in the line items “Noncontrolling Interest” in ICG’s Consolidated Balance Sheets and “Net income attributable to the noncontrolling interest” in ICG’s Consolidated Statements of Operations. Noncontrolling interest adjusts ICG’s consolidated results of operations to reflect only ICG’s share of the earnings or losses of the consolidated subsidiary.
Any changes in ICG’s ownership interest in a consolidated subsidiary, through additional equity issuances by the consolidated subsidiary or through ICG acquiring the shares from existing shareholders, in which ICG maintains control is recognized as an equity transaction, with appropriate adjustments to both ICG’s additional paid-in capital and the corresponding noncontrolling interests. The difference between the carrying amount of ICG’s ownership interest in the company and the underlying net book value of the company after the issuance of stock by the company is reflected as an equity transaction in ICG’s Consolidated Statements of Changes in Equity.
An increase in ICG’s ownership interest in a business accounted for under the equity or cost method of accounting in which ICG obtains a controlling financial interest is accounted for as a step acquisition, with an allocation of the purchase price to the fair value of the net assets acquired. In addition, ICG remeasures its previously held ownership interest in a business that was previously not consolidated at the acquisition date fair value; any gain or loss resulting from this remeasurement is recognized in ICG’s Consolidated Statements of Operations at that time. ICG begins to include the financial position and operating results of the newly-consolidated subsidiary in its Consolidated Financial Statements from the date ICG obtains the controlling financial interest in that subsidiary. If control is lost, any retained interest is measured at fair value, and a gain or loss is recognized in ICG’s Consolidated Statements of Operations at that time. In addition, to the extent ICG maintains a smaller equity ownership, the accounting method used for that business is adjusted to the equity or cost method of accounting, as appropriate, for subsequent periods.
Equity Method. Businesses that are not consolidated, but over which ICG exercises significant influence, are accounted for under the equity method of accounting and are referred to in the Notes to Consolidated Financial Statements as “equity method businesses.” The determination as to whether or not ICG exercises significant influence with respect to a company depends on an evaluation of several factors, including, among others, representation on the company’s board of directors and equity ownership level, which is generally between a 20% and a 50% interest in the voting securities of an equity method business, as well as voting rights associated with ICG’s holdings in common stock, preferred stock and other convertible instruments in that company. ICG’s share of the earnings and/or losses of the company, as well as any adjustments resulting from prior period finalizations of equity income/losses, are reflected in the line item “Equity loss” in ICG’s Consolidated Statements of Operations.
An increase in ICG’s ownership interest in an equity method business over which ICG maintains significant influence is accounted for as a step acquisition, with an allocation of the excess purchase price to the fair value of the net assets acquired. A decrease in ICG’s ownership interest in an equity method business over which ICG maintains significant influence is accounted for as a dilution gain or loss in ICG’s Consolidated Statements of Operations and reflects the difference between ICG’s share of the underlying net assets of that company prior to the relevant change in ownership and ICG’s share of the underlying net assets of that company subsequent to the relevant change in ownership.
Cost Method. Businesses not accounted for under either the consolidation method or equity method of accounting are accounted for under the cost method of accounting and are referred to in these Notes to Consolidated Financial Statements as “cost method businesses.” ICG’s share of the earnings and/or losses of cost method businesses is not included in ICG’s Consolidated Statement of Operations. However, impairment charges related to cost method businesses are recognized in ICG’s Consolidated Statements of Operations. If circumstances suggest that the value of a cost method business with respect to which an impairment charge has been made has subsequently recovered, that recovery is not recorded. The carrying values of ICG’s cost method businesses are reflected in the line item “Equity and cost method investments” in ICG’s Consolidated Balance Sheets.
ICG GROUP, INC.
NOTES TO CONSOLIDATED FINANCIAL STATEMENTS – (CONTINUED)
ICG initially records its carrying value in businesses accounted for under the cost method at cost, unless the equity securities of a cost method business have readily determinable fair values based on quoted market prices, in which case the interests are valued at fair value and are classified as marketable securities or some other classification in accordance with guidance for ownership interests in debt and equity securities.
Use of Estimates
The preparation of financial statements in conformity with U.S. GAAP requires management to make estimates and assumptions that affect the amounts reported in the financial statements and accompanying notes. Actual results could differ materially from those estimates. Those estimates include evaluation of ICG’s convertible debt and equity holdings in businesses, holdings in marketable securities, asset impairment, revenue recognition, income taxes and commitments and contingencies. Those estimates and assumptions are based on management’s best judgments. Management evaluates its estimates and assumptions on an ongoing basis using historical experience and other factors, such as the current economic environment, that management believes to be reasonable under the circumstances. Management adjusts those estimates and assumptions when facts and circumstances dictate that it is necessary or appropriate to do so. It is reasonably possible that ICG’s accounting estimates with respect to the ultimate recoverability of ICG’s ownership interests in convertible debt and equity holdings, goodwill and the useful lives of intangible assets could change in the near term and that the effect of such changes on ICG’s consolidated financial statements could be material. Management believes the recorded amounts of goodwill, intangible assets, equity method businesses and cost method businesses were not impaired as of December 31, 2013.
Cash and Cash Equivalents
ICG considers all highly liquid instruments with an original maturity of approximately three months at the time of purchase to be cash equivalents. Cash and cash equivalents at December 31, 2013 and 2012 were invested principally in money market accounts and commercial paper.
Restricted Cash
ICG considers cash that is legally restricted and cash that is held as a compensative balance for letter of credit arrangements as restricted cash. ICG had no long-term restricted cash as of December 31, 2013 and 2012.
Goodwill, Intangible Assets, Equity Method Businesses and Cost Method Businesses
ICG evaluates its carrying value in equity method businesses and cost method businesses continuously to determine whether an other-than-temporary decline in the fair value of any such business exists and should be recognized. In order to make that determination, ICG considers each such business’ achievement of its business plan objectives and milestones, the fair value of its ownership interest in each such business (which, in the case of any company listed on a public stock exchange, is the quoted stock price of the relevant ownership interest), the financial condition and prospects of each such business, and other relevant factors. The business plan objectives and milestones ICG considers include, among others, those related to financial performance, such as achievement of planned financial results or completion of capital raising activities, and those that are not primarily financial in nature, such as obtaining key business partnerships or the hiring of key employees. Impairment charges are determined by comparing ICG’s carrying value of a business with its estimated fair value. Fair value is determined by using a combination of estimating the cash flows related to the relevant asset, including estimated proceeds on disposition, and an analysis of market price multiples of companies engaged in lines of business similar to the company being evaluated. ICG concluded that the carrying value of its equity method businesses and cost method businesses was not impaired as of December 31, 2013 and 2012.
ICG tests goodwill for impairment annually during the fourth quarter of each year, or more frequently as conditions warrant, and tests intangible assets for impairment when events or changes in circumstances indicate that the carrying amount of an asset may not be recoverable. ICG concluded that its goodwill and intangible assets were not impaired as of December 31, 2013 and 2012.
Marketable Securities
Marketable securities are reported at fair value, based on quoted market prices, with the net unrealized gain or loss reported as a component of “Accumulated Other Comprehensive Income” in ICG Group, Inc. Stockholders’ Equity on ICG’s Consolidated Statements of Changes in Equity.
ICG GROUP, INC.
NOTES TO CONSOLIDATED FINANCIAL STATEMENTS – (CONTINUED)
Financial Instruments
Cash and cash equivalents, accounts receivable and accounts payable are carried at cost, which approximates fair value due to the short-term maturity of these instruments. Marketable securities are carried at fair value.
Deferred Revenue
Deferred revenue consists primarily of payments received in advance of revenue being earned under the relevant customer agreements.
Revenue Recognition
During the year ended December 31, 2013, ICG’s consolidated revenue was primarily attributable to Bolt, GovDelivery and MSDSonline. During the year ended December 31, 2012, ICG’s consolidated revenue was primarily attributable to GovDelivery and MSDSonline. During the year ended December 31, 2011, ICG’s consolidated revenue was attributable to GovDelivery.
Bolt generates revenue from (1) software licenses, (2) maintenance and support services, (3) professional service fees, (4) insurance commissions and (5) subscription fees. Bolt’s software license revenue derives from licenses of its software products directly to end users and is recognized when persuasive evidence of an arrangement exists, delivery of the product has occurred, no significant obligations with regard to implementation remain, the fee is fixed or determinable and collectability is probable; Bolt’s software license revenue is recognized ratably over the applicable contract term. Bolt’s maintenance and customer support fees are recognized ratably over the life of maintenance and support contracts, which is typically one year. Bolt’s professional service fees revenue relates to professional services for software licenses that require significant customization, integration and installation; that revenue is recognized ratably over the applicable contract term. Bolt’s commissions on the premiums from sales of insurance policies are recognized when Bolt has sufficient information to determine the amount that is owed, it is probable that the economic benefits associated with the transaction will flow to Bolt, and the costs incurred, or to be incurred, with respect to the transaction can be accurately measured. Finally, Bolt recognizes subscription fee revenue over the subscription period, which is generally one month.
GovDelivery revenue consists of (1) nonrefundable setup fees and (2) monthly maintenance and hosting fees. Those fees generally are deferred and recognized as the services are performed, which is typically over the service term. Costs related to performing setup services are expensed as incurred.
MSDSonline derives revenue from two sources: (1) subscription fees and (2) professional services fees. The vast majority of MSDSonline’s revenue is derived from subscription fees from customers accessing the business’ database and web-based tools; that revenue is recognized ratably over the applicable contract term, beginning on the contract implementation date. MSDSonline also generates professional services fees from (1) training, (2) authoring of material safety data sheets and (3) compiling customers’ online libraries of material safety data sheet documents and indexing those documents. The revenue derived from those fees is recognized on a percentage of completion basis over the applicable project’s timeline.
Equity-Based Compensation
ICG recognizes equity-based compensation expense in the Consolidated Financial Statements for all share options and other equity-based arrangements that are expected to vest. Equity-based compensation expense is measured at the date of grant, based on the fair value of the aware, and is recognized using the straight-line method over the employee’s requisite service period. Equity-based awards with vesting conditions other than service are recognized based on the probability that those conditions will be achieved.
Research and Development
Research and development costs are charged to expense as incurred.
Income Taxes
Income taxes are accounted for under the asset and liability method, whereby deferred tax assets and liabilities are recognized for the estimated future tax consequences attributable to differences between the financial statement carrying amounts of existing assets and liabilities and their respective tax basis. Deferred tax assets and liabilities are measured using enacted tax rates in effect for the year in which the temporary differences are expected to be recovered or settled. The effect on deferred tax assets and liabilities of a change in tax rates is recognized in income in the period that includes the enactment date.
ICG GROUP, INC.
NOTES TO CONSOLIDATED FINANCIAL STATEMENTS – (CONTINUED)
Discontinued Operations
During the year ended December 31, 2013, Channel Intelligence, InvestorForce and Procurian were sold. Accordingly, ICG has recast all financial information within this Report to conform to the current period presentation; those three businesses are presented as discontinued operations for all periods presented.
Net Income (Loss) Per Share
Basic net income (loss) per share (EPS) is computed using the weighted average number of common shares outstanding during a given period. Diluted EPS includes shares, unless anti-dilutive, that would arise from the exercise of stock options and conversion of other convertible securities and is adjusted, if applicable, for the effect on net income (loss) of such transactions. See Note 15, “Net Income (Loss) per Share.”
Comprehensive Income (Loss)
ICG reports and displays comprehensive income (loss) and its components in the Consolidated Statements of Operations and Comprehensive Income (Loss). Comprehensive income (loss) is the change in equity of a business enterprise during a period from non-owner sources. ICG’s sources of comprehensive income (loss) are net income (loss), and net unrealized appreciation on its marketable securities. Reclassification adjustments result from the recognition of gains or losses in net income that were included in comprehensive income (loss) in prior periods.
Supplemental Cash Flow Disclosures
In 2013, 2012 and 2011, ICG paid interest of $1.2 million, less than $0.1 million and $0.1 million, respectively. ICG made income tax payments of $0.3 million and $0.1 million in 2013 and 2012, respectively. ICG received income tax refunds of $6.5 million in 2011.
Escrow Information
When an interest in one of ICG’s businesses is sold, a portion of the proceeds may be held in escrow primarily to satisfy purchase price adjustments and/or indemnity claims. ICG records gains on escrowed proceeds at the time ICG is entitled to receive such proceeds, the amount is fixed or determinable and realization is assured. As of December 31, 2013, $29.1 million related to ICG’s potential proceeds from sales of former businesses remained in escrow to satisfy potential or unresolved indemnification claims. Those outstanding escrows are scheduled to be released at various dates within the next two years, subject to pending and potential indemnity claims pursuant to the terms of the specific sales agreements. On January 15, 2014, $0.3 million related to the sale of StarCite was released from escrow. ICG will recognize a gain in that amount during the first quarter of 2014.
Concentration of Customer Base and Credit Risk
For the years ended December 31, 2013, 2012 and 2011, none of the customers of ICG’s consolidated businesses represented more than 10% of ICG’s consolidated revenue.
Commitments and Contingencies
From time to time, ICG and its businesses are involved in various claims and legal actions arising in the ordinary course of business. ICG does not expect any liability with respect to any legal claims or actions that would materially affect its consolidated financial position or cash flows.
Reclassifications
Certain amounts in the prior year financial statements have been reclassified to conform to the current-year presentation. The impact of the reclassifications made to prior year amounts is not material and did not affect net income (loss).
ICG GROUP, INC.
NOTES TO CONSOLIDATED FINANCIAL STATEMENTS – (CONTINUED)
Recent Accounting Pronouncements
In February 2013, the Financial Accounting Standards Board (“FASB”) issued Accounting Standards Update 2013-02, “Other Comprehensive Income (Topic 220)” (“ASU 2013-02”). The objective of ASU 2013-02 is to improve the reporting of reclassifications out of accumulated other comprehensive income. ASU 2013-02 seeks to attain that objective by requiring an entity to report the effect of significant reclassifications out of accumulated other comprehensive income on the respective line items in net income if the amount being reclassified is required under U.S. generally accepted accounting principles (GAAP) to be reclassified in its entirety to net income in the same reporting period. For other amounts that are not required under U.S. GAAP to be reclassified in their entirety to net income in the same reporting period, an entity is required to cross-reference other disclosures required under U.S. GAAP that provide additional detail about those amounts. ASU 2013-02 was effective prospectively for ICG in its first quarter of 2013. The impact of the adoption of ASU 2013-02 was insignificant to the Consolidated Financial Statements.
ICG has considered all other recently issued accounting pronouncements and does not believe the adoption of such pronouncements will have a material impact on its audited Financial Statements.
3. Goodwill and Intangible Assets
Goodwill
The following table summarizes the activity related to ICG’s goodwill (in thousands):
| Gross Carrying
Amount | | | Accumulated
Impairment
Losses | | | Net Carrying
Amount | |
Goodwill as of December 31, 2012 | $ | 88,116 | | | | (304 | ) | | $ | 87,812 | |
Increase in goodwill due to Bolt’s acquisition of Superior Access | | 2,540 | | | | — | | | | 2,540 | |
Goodwill as of December 31, 2013 | $ | 90,656 | | | | (304 | ) | | $ | 90,352 | |
During the year ended December 31, 2013, ICG revised its initial estimates of its allocation of value related to the 2012 consolidation of Bolt. Based on those revisions, ICG retrospectively increased the value of goodwill as of December 31, 2012 by $10.2 million, which was primarily offset by a decrease in intangible assets. See Note 4, “Consolidated Business” for additional information regarding the transactions impacting goodwill detailed in the table above.
As of December 31, 2013 and 2012, all of ICG’s goodwill was allocated to its consolidated businesses.
Intangible Assets
The following table summarizes ICG’s intangible assets from continuing operations (in thousands):
| | Useful Life | | As of December 31, 2013 | |
Intangible Assets | | | Gross
Carrying
Amount | | | Accumulated
Amortization | | | Net
Carrying
Amount | |
Customer relationships | | 1-11 years | | $ | 45,601 | | | $ | (9,546 | ) | | $ | 36,055 | |
Trademarks/trade names | | 3-11 years | | | 15,813 | | | | (2,373 | ) | | | 13,440 | |
Technology | | 5-10 years | | | 9,527 | | | | (2,161 | ) | | | 7,366 | |
Non-compete agreements | | 2-5 years | | | 3,666 | | | | (2,172 | ) | | | 1,494 | |
| | | | | 74,607 | | | | (16,252 | ) | | | 58,355 | |
Other intellectual property | | Indefinite | | | 400 | | | | — | | | | 400 | |
| | | | $ | 75,007 | | | $ | (16,252 | ) | | $ | 58,755 | |
ICG GROUP, INC.
NOTES TO CONSOLIDATED FINANCIAL STATEMENTS – (CONTINUED)
| | Useful Life | | As of December 31, 2012 | |
Intangible Assets | | | Gross
Carrying
Amount | | | Accumulated
Amortization | | | Net
Carrying
Amount | |
Customer relationships | | 3-11 years | | $ | 40,622 | | | $ | (5,386 | ) | | $ | 35,236 | |
Trademarks/trade names | | 3-11 years | | | 14,713 | | | | (866 | ) | | | 13,847 | |
Technology | | 10 years | | | 10,068 | | | | (588 | ) | | | 9,480 | |
Non-compete agreements | | 2-5 years | | | 3,666 | | | | (942 | ) | | | 2,724 | |
| | | | | 69,069 | | | | (7,782 | ) | | | 61,287 | |
Other intellectual property | | Indefinite | | | 400 | | | | — | | | | 400 | |
| | | | $ | 69,469 | | | $ | (7,782 | ) | | $ | 61,687 | |
Amortization expense for intangible assets during the years ended December 31, 2013, 2012 and 2011 was $8.5 million, $4.8 million and $1.4 million, respectively. ICG amortizes intangible assets using the straight line method.
During the year ended December 31, 2013, ICG revised its initial estimates related to the allocated value of Bolt in connection with the 2012 consolidation of that company. Accordingly, based on those revisions, ICG retrospectively decreased the value of intangible assets as of December 31, 2012 by $10.9 million. See Note 4, “Consolidated Business” for additional information regarding the transactions impacting intangibles detailed in the table above.
Remaining estimated amortization expense is as follows (in thousands):
2014 | $ | 9,169 | |
2015 | | 8,246 | |
2016 | | 7,844 | |
2017 | | 7,429 | |
2018 | | 6,175 | |
Thereafter | | 19,492 | |
Remaining amortization expense | $ | 58,355 | |
Impairment
ICG completed its annual impairment testing in the fourth quarter of each of 2013, 2012 and 2011. The completion of ICG’s annual impairment testing did not result in an impairment charge related to ICG’s consolidated businesses in any of those years; ICG’s fair value of its reporting units, including goodwill, substantially exceeds its carrying value. ICG estimates the fair value of its reporting units using a “Level 3” input (see Note 8, “Financial Instruments,” for the definition of a “Level 3” input) market approach by determining market multiples from comparable publicly-traded companies and applying those approximate multiples to the revenues of the reporting units, which are then compared to the respective carrying values of the reporting units. See Note 4, “Consolidated Businesses.” ICG also performs ongoing business reviews of its equity method companies and cost method companies. See Note 7, “Equity and Cost Method Businesses.”
During the year ended December 31, 2012, GovDelivery decreased its liability related to contingent consideration payments for an acquisition because it believed that performance targets related to those contingent payments would not be achieved. As a result, GovDelivery performed an impairment analysis with respect to the associated intangible assets and goodwill recorded related to that acquisition, and recorded an impairment charge of $0.4 million related to the intangible assets and an impairment charge of $0.3 million related to goodwill that are reflected in the line item “Impairment related and other” in ICG’s Consolidated Statements of Operations for the year ended December 31, 2012. The $0.4 million impairment to intangibles is included in the $5.4 million accumulated amortization balance for customer relationships as of December 31, 2012 in the table above. In addition to the $0.7 million of impairments recorded by GovDelivery in 2012, GovDelivery also recorded a gain of $0.7 million to reverse a contingent consideration liability, which is also included in “Impairment related and other” on ICG’s Consolidated Statement of Operations during the year ended December 31, 2012.
ICG GROUP, INC.
NOTES TO CONSOLIDATED FINANCIAL STATEMENTS – (CONTINUED)
4. Consolidated Businesses
Acquisitions
During 2012 and 2013, ICG completed the following acquisitions:
(1) On March 30, 2012, ICG acquired 96% of the equity of MSDSonline. The acquisition was accounted for under the acquisition method. ICG allocated the purchase price to the acquired tangible and identifiable intangible assets and liabilities based upon their respective fair values as of the date of acquisition.
(2) On December 27, 2012, ICG acquired additional equity ownership interests in Bolt (then an equity method business) for consideration of $13.2 million, increasing ICG’s ownership interest in that business from 38% to 53%. ICG consolidated the financial position of Bolt as of the date the additional equity interests were acquired and accounted for the transaction as a business combination. ICG allocated the value of Bolt to its tangible and identifiable intangible assets and liabilities based upon their respective estimated fair values as of the date of acquisition. Additionally, ICG recorded a gain on the transaction of $25.5 million, representing the excess of ICG’s portion of the enterprise value of Bolt over its carrying value for its prior equity interest in Bolt as an equity method company. That gain is included in the line item “Other income (loss), net” in ICG’s Consolidated Statements of Operations for the year ended December 31, 2012. The primary valuation technique used to measure the acquisition date fair value of Bolt immediately before the business combination was the backsolve option-pricing method.
(3) On August 9, 2013, Bolt acquired Superior Access for $8.7 million in cash. Bolt has estimated the allocation of purchase price to the acquired tangible and identifiable intangible assets and liabilities based upon their respective estimated fair values at the date of acquisition. ICG expects the acquisition accounting related to Bolt’s acquisition of Superior Access to be complete by June 30, 2014.
No other acquisitions occurred in 2013 or 2012 that were significant to ICG’s consolidated results.
The allocations of the purchase price related to the acquisition of MSDSonline and Superior Access and the allocation of the value upon consolidation of Bolt to identified intangible assets and tangible assets and liabilities are as follows (in thousands):
| MSDSonline | | | Bolt | | | Superior
Access | |
Net assets acquired: | | | | | | | | | | | |
Goodwill | $ | 15,847 | | | $ | 68,253 | | | $ | 2,540 | |
Customer lists (5-11 year life) | | 20,440 | | | | 6,800 | | | | 4,000 | |
Trademarks, trade names and domain names (5-11 year life) | | 6,800 | | | | 6,400 | | | | 1,100 | |
Technology (5 year life) | | 1,900 | | | | 4,300 | | | | 1,300 | |
Non-compete agreements (3 year life) | | 3,580 | | | | — | | | | — | |
Other net assets (liabilities) | | 1,170 | | | | (5,150 | ) | | | (229 | ) |
| | 49,737 | | | | 80,603 | | | | 8,711 | |
Noncontrolling interest (1) | | (1,355 | ) | | | (31,824 | ) | | | — | |
| $ | 48,382 | | | $ | 48,779 | | | $ | 8,711 | |
(1) | ICG estimated the fair value of the noncontrolling interest in Bolt and MSDSonline with consideration of discounts for lack of control and lack of marketability. See “Redeemable Noncontrolling Interest” in this Note 4 with respect to MSDSonline. |
Redeemable Noncontrolling Interest
Certain GovDelivery stockholders have the ability to require GovDelivery to redeem their shares in 2014 based on a fair value determination. Because that redemption is outside the control of GovDelivery, ICG has classified this noncontrolling interest outside of equity and will accrete to its estimated redemption value with an offset to additional paid-in capital. This noncontrolling interest is classified as “Redeemable noncontrolling interest” on ICG’s Consolidated Balance Sheets.
Certain MSDSonline stockholders have the ability to require MSDSonline to redeem their shares beginning in 2015 based on a fair value determination. Because that redemption is outside the control of MSDSonline, ICG has classified this noncontrolling interest outside of equity and will accrete to its estimated redemption value with an offset to additional paid-in capital. This noncontrolling interest is classified as “Redeemable noncontrolling interest” on ICG’s Consolidated Balance Sheets.
ICG GROUP, INC.
NOTES TO CONSOLIDATED FINANCIAL STATEMENTS – (CONTINUED)
The following reconciles the activity related to the redeemable noncontrolling interest during the years ended December 31, 2013, 2012 and 2011 (in thousands):
Balance at December 31, 2010 | $ | 1,182 | |
Redeemable noncontrolling interest portion of subsidiary net (income)/loss | | (221 | ) |
Accretion to estimated redemption value | | 509 | |
Impact of subsidiary equity transactions | | (92 | ) |
Balance at December 31, 2011 | $ | 1,378 | |
Redeemable noncontrolling interest portion of subsidiary net (income)/loss | | (149 | ) |
Accretion to estimated redemption value | | 839 | |
Acquisition of MSDSonline | | 1,309 | |
Impact of subsidiary equity transactions | | 6 | |
Balance at December 31, 2012 | $ | 3,383 | |
Redeemable noncontrolling interest portion of subsidiary net (income)/loss | | (105 | ) |
Accretion to estimated redemption value | | 1,088 | |
Impact of subsidiary equity transactions | | (924 | ) |
Balance at December 31, 2013 | $ | 3,442 | |
Other Consolidated Businesses Transactions
From time to time, ICG acquires additional equity ownership interests in its consolidated businesses. Purchasing equity ownership interests from a consolidated business’s existing shareholders results in an increase in ICG’s controlling interest in that business and a corresponding decrease in the noncontrolling interest ownership. Those transactions are accounted for as a decrease to “Noncontrolling Interest” and a decrease to “Additional paid-in capital” on ICG’s Consolidated Balance Sheets for the relevant period. During the year ended December 31, 2013, ICG paid $11.0 million and $3.0 million to the noncontrolling interest holders of Bolt and GovDelivery, respectively, to purchase equity interests in those companies. ICG may also acquire additional equity ownership interests in its consolidated businesses as a result of share issuances by those companies or may be diluted by such share issuances. An issuance of equity securities by a consolidated business that results in a decrease in ICG’s equity ownership interests is accounted for in accordance with the policy for “Principles of Accounting for Ownership Interests” described in Note 2, “Significant Accounting Policies.” Other changes to ICG’s equity ownership interests in its consolidated businesses, as well as equity-based compensation award activity at those businesses, also result in adjustments to “Additional paid-in capital” and “Noncontrolling Interest” on ICG’s Consolidated Balance Sheets. The impact of any equity-related transactions at ICG’s consolidated businesses is included in the line item “Impact of subsidiary equity transactions” on ICG’s Consolidated Statements of Changes in Equity. The impact of these changes to the noncontrolling interest are also included in the line item “Impact of subsidiary equity transactions” on ICG’s Consolidated Statements of Changes in Equity for the years ended 2013, 2012 and 2011. These amounts primarily relate to ICG’s acquisition of additional equity ownership interests in our consolidated businesses from noncontrolling interests, as well as the impact of ICG’s consolidation of Bolt and CIML in 2012 on the noncontrolling interest.
Pro Forma Information (Unaudited)
The information in the following table represents revenue, net income (loss) attributable to ICG Group, Inc. and net income (loss) per diluted share attributable to ICG Group, Inc. for the relative periods, had ICG consolidated MSDSonline and Bolt (including Bolt’s acquisition of Superior Access) in each of those periods (in thousands, except per share data).
| | Year Ended December 31, | |
| 2013 | | | 2012 | |
| | |
Revenue | $ | 65,995 | | | $ | 47,265 | |
Net income (loss) attributable to ICG Group, Inc. | $ | (25,591 | ) | | $ | 10,134 | |
Net income (loss) per diluted share attributable to ICG Group, Inc. | $ | (0.70) | | | $ | 0.28 | |
Separate Financial Statements of Subsidiary not Consolidated
The following is summarized financial information for Bolt (then Seapass Solutions, Inc.), which was consolidated by ICG as of December 27, 2012, for the years ended December 31, 2012 and 2011. Prior to such consolidation, ICG held a 38% and 26% equity ownership interest in the company for the years ended December 31, 2012 and 2011, respectively, and accounted for this ownership interest under the equity method of accounting. The following summarized information is based upon that company’s financial
ICG GROUP, INC.
NOTES TO CONSOLIDATED FINANCIAL STATEMENTS – (CONTINUED)
statements, which have been prepared in conformity with GAAP and require estimates and assumptions that affect the amounts reported. Actual results could materially differ from those estimates.
| | December 31, 2012 | | | | December 31, 2011 | |
| | (in thousands) | |
Total Assets | $ | 11,705 | | | $ | 3,983 | |
Total Liabilities | $ | 16,759 | | | $ | 8,248 | |
Total Stockholders’ Equity | $ | (5,054 | ) | | $ | (4,265 | ) |
| Years Ended December 31, | |
| | 2012 | | | | 2011 | |
| | (in thousands) | |
Revenue | $ | 6,518 | | | $ | 6,083 | |
Expenses | $ | (18,245 | ) | | $ | (15,091 | ) |
Net loss | $ | (11,727 | ) | | $ | (9,008 | ) |
The following is summarized financial information for StarCite, which was acquired by Active on December 30, 2011, for the period from January 1, 2011 to December 30, 2011. Prior to the sale of StarCite, ICG held a 36% equity ownership interest in the company and accounted for StarCite under the equity method of accounting. The following summarized information of StarCite is based upon that company’s financial statements, which have been prepared in conformity with GAAP and require StarCite’s management to make estimates and assumptions that affect the amounts reported. Actual results could materially differ from those estimates.
| | | December 30, 2011 | |
| | (in thousands) | |
Total Assets | | $ | 51,335 | |
Total Liabilities | | $ | 32,924 | |
Total Stockholders’ Equity | | $ | 18,411 | |
| | | Period Ended December 30, 2011 | |
| | (in thousands) | |
Revenue | | $ | 44,968 | |
Expenses | | $ | (50,324 | ) |
Net loss | | $ | (5,356 | ) |
ICG GROUP, INC.
NOTES TO CONSOLIDATED FINANCIAL STATEMENTS – (CONTINUED)
5. Discontinued Operations
During the year ended December 31, 2013, three of ICG’s consolidated subsidiaries were sold: InvestorForce, Channel Intelligence and Procurian.
On January 29, 2013, InvestorForce was sold to MSCI for $23.6 million in cash. ICG’s proceeds from the sale were $20.8 million, a portion of which is being held in escrow and is subject to potential indemnification claims. ICG recorded a gain of $15.7 million related to the transaction; that gain is included in the line item “Income (loss) from discontinued operations, including gain on sale, net of tax” on ICG’s Consolidated Statements of Operations for the year ended December 31, 2013.
On February 20, 2013, Channel Intelligence was sold to Google for $125.0 million in cash. ICG realized $60.5 million in the transaction, a portion of which is being held in escrow and is subject to potential indemnification claims. ICG recorded a gain of $17.8 million related to the transaction; that gain is included in the line item “Income (loss) from discontinued operations, including gain on sale, net of tax” on ICG’s Consolidated Statements of Operations for the year ended December 31, 2013.
On December 4, 2013, Procurian was sold to an affiliate of Accenture for $375.0 million in cash. ICG realized $327.8 million in the transaction, a portion of which is being held in escrow and is subject to potential indemnification claims. ICG recorded a gain of $224.9 million related to the transaction; that gain is included in the line item “Income (loss) from discontinued operations, including gain on sale, net of tax” on ICG’s Consolidated Statements of Operations for the year ended December 31, 2013.
InvestorForce, Channel Intelligence and Procurian have been accounted for as discontinued operations. The results of operations and cash flows of these businesses have been reclassified from the results of continuing operations and are shown separately on ICG’s Consolidated Statements of Operations and ICG’s Consolidated Statements of Cash Flows for all relevant periods presented. The assets and liabilities of these discontinued operations have been reclassified and are reflected in the line items “Assets of discontinued operations” and “Liabilities of discontinued operations” on ICG’s Consolidated Balance Sheets as of December 31, 2012. Consistent with ICG’s policy election, ICG’s proceeds from these transactions are reflected in cash flows provided by investing activities from continuing operations on ICG’s Consolidated Statement of Cash Flows for the year ended December 31, 2013. The results of ICG’s discontinued operations are summarized below (in millions):
| | InvestorForce | | | Channel
Intelligence | | | Procurian | |
Year ended December 31, 2013 | | | | | | | | | | | | |
Revenue (through date of respective sale) | | $ | 0.8 | | | $ | 3.1 | | | $ | 127.1 | |
ICG’s share of net income (loss) (through date of respective sale) | | $ | (0.5 | ) | | $ | (2.9 | ) | | $ | 0.1 | |
Year ended December 31, 2012 | | | | | | | | | | | | |
Revenue | | $ | 8.6 | | | $ | 11.1 | | | $ | 140.0 | |
ICG’s share of net income (loss) | | $ | (1.4 | ) | | $ | (1.8 | ) | | $ | 8.4 | |
Year ended December 31, 2011 | | | | | | | | | | | | |
Revenue | | $ | 7.1 | | | $ | — | | | $ | 120.6 | |
ICG’s share of net income (loss) | | $ | (2.4 | ) | | $ | — | | | $ | 12.9 | |
Income tax expense of $20.4 million and an income tax benefit of $5.1 million and $6.4 million is included in the line item “Income (loss) from discontinued operations, including gain on sale, net of tax” on ICG’s Consolidated Statements of Operations for the years ended December 31, 2013, 2012 and 2011, respectively.
ICG GROUP, INC.
NOTES TO CONSOLIDATED FINANCIAL STATEMENTS – (CONTINUED)
The assets and liabilities of ICG’s discontinued operations that are included in the line items “Assets of discontinued operations” and “Liabilities of discontinued operations” on ICG’s Consolidated Balance Sheets as of December 31, 2012 are as follows (in millions):
| | InvestorForce | | | Channel
Intelligence | | | Procurian | |
As of December 31, 2012 | | | | | | | | | | | | |
Current assets | | $ | 3.1 | | | $ | 6.2 | | | $ | 72.8 | |
Noncurrent assets | | | 1.0 | | | | 72.2 | | | | 74.3 | |
Assets of discontinued operations | | $ | 4.1 | | | $ | 78.4 | | | $ | 147.1 | |
| | | | | | | | | | | | |
Current liabilities | | $ | 3.6 | | | $ | 6.3 | | | $ | 30.6 | |
Noncurrent liabilities | | | 0.3 | | | | 0.2 | | | | 22.9 | |
Liabilities of discontinued operations | | $ | 3.9 | | | $ | 6.5 | | | $ | 53.5 | |
The assets of ICG’s discontinued operations include $12.2 million of ICG’s consolidated deferred tax asset related to Procurian; that amount is included in the $74.3 million of Procurian’s “Noncurrent assets” in the table above.
Additionally, the following goodwill and intangible asset balances of ICG’s discontinued operations are included in the line item “Noncurrent assets” in the table above for the respective business (in millions):
| | InvestorForce | | | Channel
Intelligence | | | Procurian | |
As of December 31, 2012 | | | | | | | | | | | | |
Goodwill | | $ | 0.7 | | | $ | 48.9 | | | $ | 30.5 | |
Intangible Assets: | | | | | | | | | | | | |
Customer relationships | | $ | — | | | $ | 9.5 | | | $ | 8.8 | |
Trademarks/trade names/domain names | | | — | | | | 6.7 | | | | 0.8 | |
Developed technology | | | — | | | | 2.7 | | | | 1.9 | |
Servicing agreements | | | — | | | | 3.5 | | | | — | |
Non-compete agreements | | | — | | | | 0 | | | | 0.5 | |
Intellectual property | | | — | | | | 0 | | | | 0.1 | |
Total Intangible Assets | | $ | — | | | $ | 22.4 | | | $ | 12.1 | |
6. Fixed Assets
Fixed assets consist of the following (in thousands):
| | | | | As of December 31, | |
| | Useful Life | | | 2013 | | | 2012 | |
Computer equipment and software, office equipment and furniture | | | 3-7 years | | | $ | 12,510 | | | $ | 11,969 | |
Leasehold improvements | | | 3-6 years | | | | 842 | | | | 628 | |
| | | | | | | 13,352 | | | | 12,597 | |
Less: accumulated depreciation | | | | | | | (7,512 | ) | | | (4,528 | ) |
| | | | | | $ | 5,840 | | | $ | 8,069 | |
Depreciation expense for the years ended December 31, 2013, 2012 and 2011 was $3.4 million, $1.7 million and $1.0 million, respectively. ICG uses the straight line method of depreciation.
ICG GROUP, INC.
NOTES TO CONSOLIDATED FINANCIAL STATEMENTS – (CONTINUED)
7. Equity and Cost Method Businesses
Equity Method Businesses
The following unaudited summarized financial information relates to ICG’s businesses accounted for under the equity method of accounting as of December 31, 2013 and 2012. This aggregate information has been compiled from the financial statements of those businesses.
Balance Sheets (Unaudited)
| | December 31,
2013 (1) | | | December 31,
2012 (2) | |
| | (in thousands) | |
Cash and cash equivalents | | $ | 5,909 | | | $ | 5,572 | |
Other current assets | | | 2,002 | | | | 11,268 | |
Non-current assets | | | 399 | | | | 13,218 | |
Total assets | | $ | 8,310 | | | $ | 30,058 | |
Current liabilities | | $ | 11,085 | | | $ | 21,115 | |
Non-current liabilities | | | 65 | | | | 1,397 | |
Long-term debt | | | — | | | | 12,670 | |
Stockholders’ deficit | | | (2,840 | ) | | | (5,124 | ) |
Total liabilities and stockholders’ deficit | | $ | 8,310 | | | $ | 30,058 | |
Total carrying value | | $ | 775 | | | $ | 13,333 | |
(1) | Includes (ICG voting ownership): Acquirgy (25%) and CIML (38%). |
(2) | Includes (ICG voting ownership): Acquirgy (25%), Freeborders (31%) and WhiteFence (36%). |
As of December 31, 2013, ICG’s aggregate carrying value in its equity method businesses exceeded ICG’s share of the net assets of those businesses by $1.3 million. Of this excess, $0.6 million is allocated to goodwill, which is not amortized, and $0.7 million is allocated to intangibles, which are generally being amortized over five years. As of December 31, 2012, this excess was $15.3 million, $12.0 million of which was allocated to goodwill, and $3.3 million of which was allocated to intangibles. Amortization expense associated with those intangibles for the years ended December 31, 2013, 2012 and 2011 was $0.2 million, $1.2 million and $2.0 million, respectively; that amortization expense is included in the table below in the line item “Amortization of intangible assets” and is included in the line item “Equity loss” on ICG’s Consolidated Statements of Operations.
Results of Operations (Unaudited)
| | Year ended December 31, | |
| | 2013 (1) | | | 2012 (2) | | | 2011 (3) | |
Revenue | | $ | 48,316 | | | $ | 89,958 | | | $ | 176,481 | |
Net income (loss) | | $ | (9,238 | ) | | $ | (20,159 | ) | | $ | (31,976 | ) |
Equity income (loss) excluding impairments and amortization of intangible assets | | $ | (2,798 | ) | | $ | (7,518 | ) | | $ | (9,946 | ) |
Amortization of intangible assets | | $ | (165 | ) | | | (1,154 | ) | | | (2,018 | ) |
Total equity income (loss) | | $ | (2,963 | ) | | $ | (8,672 | ) | | $ | (11,964 | ) |
(1) | Includes Acquirgy, CIML, Freeborders (through October 18, 2013, the date of disposition) and WhiteFence (through October 28, 2013, the date of disposition). |
(2) | Includes Acquirgy, Bolt (through December 27, 2012, the date of consolidation), CIML (through July 11, 2012, the date of consolidation), Freeborders, GoIndustry (through July 5, 2012, the date of disposition) and WhiteFence. |
(3) | Includes Acquirgy, Bolt, CIML, ClickEquations (through June 14, 2011, the date of disposition), Freeborders, GoIndustry, Metastorm (through February 17, 2011, the date of disposition), StarCite (through December 30, 2011, the date of disposition) and WhiteFence. |
ICG GROUP, INC.
NOTES TO CONSOLIDATED FINANCIAL STATEMENTS – (CONTINUED)
Other Equity Method Businesses Information
During the year ended December 31, 2012, ICG participated in a follow-on equity financing transaction for Bolt (prior to ICG’s consolidation of the company). ICG acquired $9.0 million of Bolt preferred stock in the transaction, increasing its ownership in Bolt from 26% to 38%. Also during the year ended December 31, 2012, ICG purchased $13.2 million of Bolt preferred stock from existing shareholders, collectively increasing its ownership in Bolt from 38% to 53%. See Note 4, “Consolidated Businesses,” subsection “Acquisitions,” for additional information related to the consolidation of Bolt.
Cost Method Businesses
ICG’s carrying value of its holdings in cost method businesses was $19.6 million and $13.0 million as December 31, 2013 and 2012, respectively. Those amounts are reflected in the line item “Equity and cost method businesses” on ICG’s Consolidated Balance Sheets as of the relevant dates.
ICG owns approximately 9% of Anthem Ventures Fund, L.P. (formerly eColony, Inc.) and Anthem Ventures Annex Fund, L.P. (collectively, “Anthem”), which invest in technology companies. ICG acquired its interest in Anthem in 2000 and currently has no carrying value in Anthem. Accordingly, the receipt of distributions from Anthem by ICG would result in a gain at the time ICG receives those distributions.
Marketable Securities
Marketable securities represent ICG’s holdings of publicly-traded equity securities and are accounted for as available-for-sale securities. During the years ended December 31, 2012 and 2011, ICG received, and subsequently sold, publicly-traded equity securities that it has accounted for as marketable securities. ICG does not hold any marketable securities as of December 31, 2013. The fair value of the shares of Active common stock held by ICG as of December 31, 2012 of $0.7 million is reflected in both the line item “Marketable Securities” ($0.3 million) and the line item “Prepaid expenses and other current assets” ($0.4 million) on ICG’s Consolidated Balance Sheets. See Note 13, “Other Income (Loss)” for additional information related to the receipt and sale of marketable securities.
Impairments
ICG performs ongoing business reviews of its equity and cost method businesses to determine whether ICG’s carrying value in those businesses is impaired. ICG determined its carrying value in its equity and cost method businesses was not impaired during the years ended December 31, 2013, 2012 and 2011.
8. Financial Instruments
Fair Value Measurements
Fair value is the price that would be received from selling an asset or paid to transfer a liability in an orderly transaction between market participants at the measurement date. There are three levels of inputs that may be used to measure fair value, which are as follows:
Level 1 – Observable inputs, such as quoted market prices for identical assets and liabilities in active public markets.
Level 2 – Observable inputs other than Level 1 prices based on quoted prices in markets with insufficient volume or infrequent transactions, or valuations in which all significant inputs are observable for substantially the full term of the asset or liability.
Level 3 – Unobservable inputs to the valuation techniques that are significant to the fair value of the asset or liability.
Assets and liabilities are measured at fair value based on one or more of the following three valuation techniques:
Market Approach – Fair value is determined based on prices and other relevant information generated by market transactions involving identical or comparable assets and liabilities.
Income Approach – Fair value is determined by converting relevant future amounts to a single present amount, based on market expectations (including present value techniques and option pricing models).
ICG GROUP, INC.
NOTES TO CONSOLIDATED FINANCIAL STATEMENTS – (CONTINUED)
Cost Approach – Fair value represents the amount that currently would be required to replace the service capacity of the relevant asset (often referred to as replacement cost).
The fair value hierarchy of ICG’s financial assets measured at fair value on a recurring basis was as follows (in thousands):
| | Asset (liability) at
December 31, 2013 | | | Valuation
Technique
(Approach) | | | Level 1 | | | Level 2 | | | Level 3 | |
Cash equivalents (money market accounts) | | $ | 325,652 | | | | Market | | | $ | 325,652 | | | $ | — | | | $ | — | |
| | $ | 325,652 | | | | | | | $ | 325,652 | | | $ | — | | | $ | — | |
| | Asset (liability) at
December 31, 2012 | | | Valuation
Technique
(Approach) | | | Level 1 | | | Level 2 | | | Level 3 | |
Cash equivalents (money market accounts and commercial paper investments) | | $ | 13,918 | | | | Market | | | $ | 13,918 | | | $ | — | | | $ | — | |
| | $ | 13,918 | | | | | | | $ | 13,918 | | | $ | — | | | $ | — | |
During the year ended December 31, 2012, GovDelivery determined that the estimated fair value of its acquisition contingent consideration obligations had changed with respect to a prior acquisition. The contingent consideration liability had an estimated fair value of $0.7 million, which was determined at the acquisition date, and was written down to the current estimated fair value of zero which resulted in a gain of $0.7 million that is included in “Impairment related and other” on ICG’s Consolidated Statements of Operations. In conjunction with this determination, GovDelivery also performed an impairment analysis of intangible assets and goodwill that were recorded related to the acquisition. See Note 3, “Goodwill and Intangibles, net.”
The carrying value of certain of ICG’s other financial instruments, including accounts receivable and accounts payable approximates fair value due to the short-term nature of those instruments. The fair value of ICG’s long-term debt is based on assumptions concerning the amount and timing of estimated future cash flows and assumed risk-adjusted discount rates. See Note 9, “Debt” for further discussion. ICG’s non-financial assets measured on a non-recurring basis using the market approach were as follows (in thousands):
| | As of December 31, | |
| | 2013 | | | 2012 | |
Significant unobservable inputs (Level 3): | | | | | | | | |
Goodwill (annual impairment assessment) | | $ | 90,352 | | | $ | 87,812 | |
Acquired intangible assets (periodic assessment, as necessary) | | | 58,755 | | | | 61,687 | |
| | $ | 149,107 | | | $ | 149,499 | |
9. Debt
Long-Term Debt
ICG’s long-term debt as of December 31, 2013 and 2012 consisted of the following:
| | Interest | | | As of December 31, | |
| | Rates | | | 2013 | | | 2012 | |
| | | | | (in thousands) | |
Term loans and lines of credit | | | 5.50-11.65 | % | | $ | 11,910 | | | $ | 9,981 | |
Current maturities | | | | | | | (5,902 | ) | | | (336 | ) |
Long-term debt | | | | | | $ | 6,008 | | | $ | 9,645 | |
ICG GROUP, INC.
NOTES TO CONSOLIDATED FINANCIAL STATEMENTS – (CONTINUED)
ICG’s long-term debt matures as follows:
2014 | | $ | 5,902 | |
2015 | | | 4,645 | |
2016 | | | 1,363 | |
2017 | | | — | |
2018 | | | — | |
| | $ | 11,910 | |
Loan and Credit Agreements
On April 13, 2011, Bolt entered into an agreement with Horizon Technology Finance Corporation (“Horizon”) that provided for a loan in the amount of $5.0 million. That loan was subject to an interest rate of 11.75%, and initially matured on November 1, 2014. On October 26, 2012, Bolt entered into an additional agreement with Horizon that provided for the repayment of the original $5.0 million loan and the issuance of two $5.0 million in borrowings, both subject to a stated interest rate of 11.65%. Principal and interest payments related to these loans are payable monthly (interest only payments were payable monthly for the first twelve months). Both debt instruments are secured by Bolt’s assets, and both mature on May 1, 2016. Those debt instruments have a fair value as of December 31, 2013 and 2012 of $9.2 million and $9.3 million, respectively, due to warrants issued by Bolt to Horizon in connection with the debt agreement, and are included in the line item “Term loans and lines of credit” in the table above. As of December 31, 2013 and 2012, $9.7 million and $10.0 million, respectively, was outstanding under those loan agreements. There are prepayment penalties associated with these arrangements.
On August 9, 2013, as part of a debt financing, Bolt entered into certain debt agreements with Neurone II Investments G.P. Ltd. (“Neurone”). Those agreements provide for a term loan of $0.5 million that is subject to an interest rate of 8.0% and matures on August 9, 2014. Those debt instruments have a fair value as of December 31, 2013 of $0.5 million, due to warrants issued by Bolt to Neurone in connection with the debt agreement. As of December 31, 2013, $0.5 million is outstanding under the term loan, which is included in the line item “Term loans and lines of credit” in the table above.
On November 30, 2012, GovDelivery entered into loan agreements with Venture Bank that provided for a $2.0 million revolving credit facility that matured on November 30, 2013, and a $2.5 million term loan that matures on November 30, 2017, in order to fund GovDelivery’s 2013 initiatives of replacing existing equipment and expanding the company’s data centers. Both the revolving credit facility and the term loan are secured by GovDelivery’s assets and mature. Each of the line of credit and the term loan bears interest at a base rate equal to the prime rate plus 2.0% but in no case will be less than 5.5%. There was no amount outstanding under the line of credit as of December 31, 2013 and $2.2 million was outstanding under the term loan as of December 31, 2013. The term loan has a fair value as of December 31, 2013 of $2.2 million. There was no amount outstanding under the line of credit as of December 31, 2012; there was $2.5 million outstanding under the term loan as of December 31, 2012. The fair value of the term loan as of December 31, 2012 was $2.4 million. The amounts outstanding for each period are included in the line item “Term loans and lines of credit” in the table above. In January 2014, GovDelivery repaid the term loan; accordingly, the $2.2 million outstanding balance as of December 31, 2013 was included in the line item “Current maturities of long term debt” on ICG’s Consolidated Balance Sheets as of December 31, 2013.
10. ICG Group, Inc.’s Stockholders’ Equity
Holders of ICG’s Common Stock are entitled to one vote per share and are entitled to dividends as declared. No cash dividends have been declared to date, and ICG does not intend to pay cash dividends in the foreseeable future.
ICG may establish one or more classes or series of preferred stock. The holders of the preferred stock may be entitled to preferences over common stockholders with respect to dividends, liquidation, dissolution, or winding up of ICG, as established by ICG’s Board of Directors. As of December 31, 2013 and 2012, 10,000,000 shares of preferred stock were authorized; none of these shares have been issued, and ICG does not have any plan to issue any of those shares in the foreseeable future.
ICG GROUP, INC.
NOTES TO CONSOLIDATED FINANCIAL STATEMENTS – (CONTINUED)
11. Treasury Stock
In accordance with ICG’s share repurchase program, ICG has been authorized to repurchase, from time to time, shares of Common Stock in the open market, in privately negotiated transactions or pursuant to trading plans meeting the requirements of Rule 10b5-1 under the Exchange Act. The program was adopted in 2008 and was most recently expanded to allow for the repurchase of up to $150.0 million of shares of our Common Stock. During the years ended December 31, 2013 and 2012, ICG repurchased 906,285 shares and 930,225 shares, respectively, of its Common Stock. Those shares were repurchased at an average stock price of $13.23 per share and $8.94 per share during the annual periods ended December 31, 2013 and 2012, respectively. Since commencement of this program, ICG has repurchased a total of 5,117,937 shares of Common Stock at an average purchase price of $7.97 per share. As of the date of this Report, ICG may repurchase an additional $109.2 million of its Common Stock under this program. All repurchases are reflected in the line item “Treasury stock, at cost” as a reduction of Stockholders’ Equity in ICG’s Consolidated Balance Sheets in the relevant periods.
12. Equity-Based Compensation
As of December 31, 2013, equity-based compensation awards may be granted to ICG employees, directors and consultants under ICG’s 2005 Omnibus Equity Compensation Plan, as such has been amended from time to time (the “Plan”). Generally, the grants vest over a period from one to four years and expire eight to ten years after the grant date. Most businesses in which ICG holds equity ownership interests also maintain their own equity incentive/compensation plans.
ICG issues the following types of equity-based compensation to its employees and non-employee directors: (1) stock appreciation rights (SARs), (2) stock options, (3) restricted stock (often subject to performance-based or market-based conditions) and (4) deferred stock units (DSUs). ICG’s grants of equity-based compensation are approved by the Compensation Committee of its Board of Directors. The following table summarizes the equity-based compensation recognized in the respective periods; that equity-based compensation is included in operating expenses, primarily in the line item “General and administrative” on ICG’s Consolidated Statements of Operations.
Equity-Based Compensation (in thousands, except weighted average years):
| | Year Ended December 31, | | | Unrecognized
Equity-Based
Compensation
as of | | | Weighted
Average Years
Remaining of
Equity-Based
Compensation
as of | |
| | 2013 | | | 2012 | | | 2011 | | | Dec. 31, 2013 | | | Dec. 31, 2013 | |
SARs | | $ | 2,377 | | | $ | 2,488 | | | $ | 2,252 | | | $ | 1,338 | | | | 1.8 | |
Restricted Stock | | | 2,958 | | | | 2,871 | | | | 832 | | | | 7,526 | | | | 2.0 | |
Deferred Stock Units | | | 377 | | | | 419 | | | | 703 | | | | 64 | | | | 0.2 | |
| | | 5,712 | | | | 5,778 | | | | 3,787 | | | | 8,928 | | | | | |
Equity-Based Compensation for Consolidated Businesses | | | 699 | | | | 458 | | | | 74 | | | | 1,492 | | | | 2.6 | |
Total Equity-Based Compensation | | $ | 6,411 | | | $ | 6,236 | | | $ | 3,861 | | | $ | 10,420 | | | | | |
ICG GROUP, INC.
NOTES TO CONSOLIDATED FINANCIAL STATEMENTS – (CONTINUED)
SARs
Each SAR represents the right of the holder to receive, upon exercise of that SAR, shares of ICG Common Stock equal to the amount by which the fair market value of a share of that Common Stock on the date of exercise of the SAR exceeds the base price of the SAR. The base price is determined by the NASDAQ closing price of ICG’s Common Stock on the date of grant (or the closing price on the next trading day if there are no trades in ICG’s stock on the date of grant). The fair value of each SAR is estimated on the grant date using the Black-Scholes option-pricing model. SARs generally vest over four years, with 25% vesting on the first anniversary of the grant date, and the remaining 75% vesting ratably each month over the subsequent 36 months.
Activity with respect to SARs during the years ended December 31, 2013, 2012 and 2011 was as follows:
| | Number of SARs | | | Weighted
Average
Base Price | | | Weighted
Average
Fair Value | |
Outstanding as of December 31, 2010 | | | 3,971,885 | | | $ | 7.45 | | | $ | 4.43 | |
Granted | | | 275,625 | | | $ | 12.15 | | | $ | 6.58 | |
Exercised (1) | | | (100,119 | ) | | $ | 9.74 | | | $ | 5.82 | |
Outstanding as of December 31, 2011 | | | 4,147,391 | | | $ | 7.71 | | | $ | 4.54 | |
Granted | | | 260,125 | | | $ | 9.25 | | | $ | 4.90 | |
Exercised (1) | | | (54,873 | ) | | $ | 7.89 | | | $ | 4.65 | |
Forfeited | | | (1,598 | ) | | $ | 10.54 | | | $ | 5.83 | |
Cancelled | | | (12,795 | ) | | $ | 6.70 | | | $ | 3.93 | |
Outstanding as of December 31, 2012 | | | 4,338,250 | | | $ | 7.80 | | | $ | 4.56 | |
Granted | | | 2,500 | | | $ | 16.19 | | | $ | 9.83 | |
Exercised (1) | | | (3,045,700) | | | $ | 14.42 | | | $ | 8.64 | |
Forfeited | | | (62,242) | | | $ | 10.25 | | | $ | 5.51 | |
Outstanding as of December 31, 2013 | | | 1,232,808 | | | $ | 8.86 | | | $ | 4.99 | |
(1) | The exercise of SARs listed in this table resulted in the issuance of 992,390 shares, 9,818 shares and 20,229 shares of ICG’s Common Stock during the years ended December 31, 2013, 2012 and 2011. |
The following table summarizes information about SARs outstanding as of December 31, 2013:
Grant Price | | Number of
SARs
Outstanding | | | Number of
SARs
Exercisable | | | Weighted Average
Remaining
Contractual Life of
SARs Outstanding
(in years) | | | Aggregate Intrinsic
Value of SARs
Outstanding as of
Dec. 31, 2013 (in thousands) | |
$6.70-$7.00 | | | 530,557 | | | | 505,366 | | | | 6.02 | | | $ | 6,322,045 | |
$7.34-$8.76 | | | 139,602 | | | | 130,288 | | | | 4.98 | | | $ | 1,434,848 | |
$9.50-$16.19 | | | 562,649 | | | | 330,391 | | | | 7.41 | | | $ | 4,289,943 | |
| | | 1,232,808 | | | | 966,045 | | | | | | | $ | 12,046,835 | |
As of December 31, 2013, 2012 and 2011, there were 966,045 SARs, 3,468,805 SARs and 2,979,552 SARs exercisable, respectively, at a weighted average base price of $8.50 per share, $7.53 per share and $7.42 per share, respectively, under the Plan. As of December 31, 2013, ICG expects an additional 966,045 SARs to vest in the future.
Stock Options
The fair value of each stock option is estimated on the grant date using the Black-Scholes option-pricing model. Stock options generally vest ratably over four years: 25% vest on the first anniversary of the grant date, and the remaining 75% vest ratably on a monthly basis over the subsequent 36 months.
ICG GROUP, INC.
NOTES TO CONSOLIDATED FINANCIAL STATEMENTS – (CONTINUED)
Activity with respect to stock options during the years ended December 31, 2013, 2012 and 2011 was as follows:
| | Number of Options | | | Weighted
Average
Base Price | | | Weighted
Average
Fair Value | |
Outstanding as of December 31, 2010 | | | 311,169 | | | $ | 16.64 | | | $ | 14.30 | |
Exercised (1) | | | (18,725 | ) | | $ | 8.06 | | | $ | 6.22 | |
Cancelled | | | (109,236 | ) | | $ | 42.07 | | | $ | 36.36 | |
Outstanding as of December 31, 2011 | | | 183,208 | | | $ | 6.25 | | | $ | 4.97 | |
Exercised (1) | | | (173,208 | ) | | $ | 6.03 | | | $ | 4.83 | |
Forfeited | | | (21 | ) | | $ | 8.41 | | | $ | 4.96 | |
Cancelled | | | (8,229 | ) | | $ | 10.62 | | | $ | 8.16 | |
Outstanding as of December 31, 2012 | | | 1,750 | | | $ | 6.91 | | | $ | 4.14 | |
Exercised (1) | | | (1,500 | ) | | $ | 7.34 | | | $ | 4.42 | |
Outstanding as of December 31, 2013 | | | 250 | | | $ | 4.30 | | | $ | 2.47 | |
(1) | ICG received cash of less than $0.1 million, $1.0 million and $0.2 million related to stock options exercised during the years ended December 31, 2013, 2012 and 2011. |
As of December 31, 2013, there were 250, 1,729 and 183,082 stock options exercisable at a weighted average exercise price of $4.30, $6.94 and $6.25 per share, respectively, under the Plan. The weighted average remaining contractual life of the stock options outstanding as of December 31, 2013 was 5.3 years; those stock options had an aggregate intrinsic value as of December 31, 2013 of less than $0.1 million.
SARs and Stock Options Fair Value Assumptions
ICG estimates the grant date fair value of SARs and stock options using the Black-Scholes option-pricing model, which requires the input of highly subjective assumptions. Those assumptions include estimating the expected life of the award and estimating volatility of ICG’s stock price over the expected term. Expected volatility approximates the historical volatility of ICG’s Common Stock over the period commensurate with the expected term of the award. The expected term calculation is based on an average of the award vesting term and the life of the award. The risk-free interest rate is based on the U.S. Treasury yield in effect at the time of grant for an instrument with a maturity that is commensurate with the expected term of the award. Changes in the above assumptions, the estimated forfeitures and/or the requisite service period can materially affect the amount of equity-based compensation recognized on ICG’s Consolidated Statements of Operations.
The following assumptions were used to determine the fair value of SARs granted to employees and a non-management director by ICG during the years ended December 31, 2013, 2012 and 2011:
| | Years Ended December 31, | |
| | 2013 | | | 2012 | | | 2011 | |
Expected volatility | | | 56 | % | | | 56 | % | | | 56 | % |
Average expected life of SAR (in years) | | | 6.25 | | | | 6.25 | | | | 5.25-6.25 | |
Risk-free interest rate | | | 1.86 | % | | | 0.92 | % | | | 1.62-1.97 | % |
Dividend yield | | | 0 | % | | | 0 | % | | | 0 | % |
Restricted Stock
ICG periodically issues shares of restricted stock to its employees and non-management directors. Recipients of restricted stock do not pay cash consideration for the shares and have the right to vote all shares subject to the grant and receive all dividends with respect to the shares, whether or not the shares have vested. As of December 31, 2013, issued and unvested shares of restricted stock granted to ICG’s employees vest as follows: (1) 57,248 shares of restricted stock vest 25% each year over a four-year period, (2) 49,967 shares of restricted stock vest 12.5% on the nine-month anniversary of the grant date, and the remaining 87.5% every six months subsequent to the first vesting date and (3) 130,440 shares of restricted stock vest upon the achievement of certain performance goals, as discussed below. Additionally, as of December 31, 2013, 916,666 shares of restricted stock granted to ICG’s Chief Executive Officer and ICG’s President are subject to vesting in accordance with the lapse of specified service periods, and the achievement of certain performance goals and market conditions, as discussed below.
ICG GROUP, INC.
NOTES TO CONSOLIDATED FINANCIAL STATEMENTS – (CONTINUED)
During the year ended December 31, 2013, in lieu of their right to receive 50% of their respective target bonus amounts under the ICG 2013 Performance Plan (the “Performance Plan”) in cash, senior ICG employees, including each of ICG’s executive officers, were issued a total of 130,440 shares of restricted stock (the “Performance Shares”) (determined based on the value of 50% of their respective individual target bonuses under the Performance Plan and the closing price of ICG’s common stock of $13.09 per share on March 1, 2013, the date of the restricted stock grant). If and to the extent that an individual’s achievement percentage under the Performance Plan (1) is greater than or equal to 50%, all of that employee’s Performance Shares will vest or (2) is greater than 0% but less than 50%, a portion of that employee’s Performance Shares equal to two times the achievement percentage will vest. All of those performance-based restricted stock awards vested during the first quarter of 2014.
As of December 31, 2013, outstanding shares of restricted stock granted to ICG’s Chief Executive Officer and ICG’s President vest as follows: (1) 183,334 shares of restricted stock vest in equal installments each November and May through November 9, 2015, (2) 366,666 shares of restricted stock vest based on the achievement of stipulated performance goals related to ICG’s consolidated revenue and EBITDA performance on or before December 31, 2015, and (3) 366,666 shares of restricted stock vest based on stipulated market thresholds related to ICG’s Common Stock price through December 31, 2015. As of December 31, 2013, ICG determined that, following the closing of the sale of Procurian to an affiliate of Accenture on December 4, 2013, the stipulated performance goals related to the performance-based restricted stock awards are improbable of achievement. Accordingly, ICG has reversed previously-recorded equity compensation cost related to those awards in the amount of $1.5 million. That equity compensation cost had been recognized as follows: $0.4 million, $0.9 million and $0.2 million was recognized during the years ended December 31, 2013, 2012 and 2011, respectively. Subsequent to December 31, 2013, in light of the sale of Procurian and the improbability of the achievement of the performance-based awards, both ICG’s Chief Executive Officer and ICG’s President elected to forfeit those shares of restricted stock. In the event of a change of control (as defined by the Plan) before December 31, 2015, all of the shares contingent upon the achievement of the stock price metrics would automatically vest, and any unrecognized equity-based compensation expense associated with those awards would be immediately recognized. Additionally, in the event of a change of control during which ICG’s Chief Executive Officer and ICG’s President are terminated, any remaining service-based awards would automatically vest, and any unrecognized equity-based compensation expense associated with those awards would be immediately recognized.
During the years ended December 31, 2013 and 2012, ICG granted 30,750 shares and 18,750 shares, respectively, of restricted stock under ICG’s Amended and Restated Non-Management Director Compensation Plan (the “Director Plan”), which are included in the table below. See “Non-Management Director Equity-Based Compensation” in this Note 12 for additional details related to vesting.
Share activity with respect to restricted stock awards during the years ended December 31, 2013, 2012 and 2011 was as follows:
| | Number of
Shares | | | Weighted Average
Grant Date
Fair Value | |
Issued and unvested as of December 31, 2010 | | | 60,500 | | | $ | 8.23 | |
Granted | | | 1,181,910 | | | $ | 9.15 | |
Vested | | | (16,625 | ) | | $ | 8.12 | |
Issued and unvested as of December 31, 2011 | | | 1,225,785 | | | $ | 9.12 | |
Granted | | | 116,973 | | | $ | 9.11 | |
Vested | | | (124,920 | ) | | $ | 10.01 | |
Forfeited | | | (375 | ) | | $ | 12.15 | |
Issued and unvested as of December 31, 2012 | | | 1,217,463 | | | $ | 9.03 | |
Granted | | | 183,190 | | | $ | 13.35 | |
Vested | | | (202,689 | ) | | $ | 10.02 | |
Forfeited | | | (12,893 | ) | | $ | 10.55 | |
Issued and unvested as of December 31, 2013 | | | 1,185,071 | | | $ | 9.52 | |
The total aggregate fair value of restricted stock awards that vested and were converted to ICG’s Common Stock during the years ended December 31, 2013, 2012 and 2011 was $2.6 million, $1.3 million and $0.2 million, respectively. During the years ended December 31, 2013, 2012 and 2011, 46,616 shares, 39,817 shares and 3,351 shares, respectively, were surrendered for satisfying withholding taxes. As of December 31, 2013, ICG expects 818,405 shares of restricted stock to vest in the future.
Subsequent to December 31, 2013, ICG granted 158,942 shares of restricted stock to certain ICG employees that will vest upon the achievement of performance metrics in accordance with ICG’s established 2014 performance plan. These shares were valued at approximately $3.2 million.
ICG GROUP, INC.
NOTES TO CONSOLIDATED FINANCIAL STATEMENTS – (CONTINUED)
Subsequent to December 31, 2013, ICG granted 2,575,000 shares of restricted stock to ICG’s executive officers and management valued at $52.3 million. These shares vest upon the achievement of stipulated market thresholds related to ICG’s Common Stock price through February 28, 2016.
Non-Management Director Equity-Based Compensation
ICG periodically issues DSUs and/or shares of restricted stock to its non-management directors in accordance with the Director Plan. Each DSU represents a share of Common Stock into which that DSU will be converted upon the termination of the recipient’s service at ICG. DSUs issued annually under the Director Plan vest on the one-year anniversary of the grant date.
Share activity with respect to the annual DSU awards for the years ended December 31, 2013, 2012 and 2011 are as follows:
| | Number of
DSUs | | | Weighted Average
Grant Date
Fair Value | |
Issued and unvested as of December 31, 2010 | | | 31,500 | | | $ | 6.80 | |
Granted | | | 60,000 | | | $ | 13.32 | |
Vested | | | (39,000 | ) | | $ | 8.05 | |
Issued and unvested as of December 31, 2011 | | | 52,500 | | | $ | 13.32 | |
Granted | | | 41,250 | | | $ | 8.40 | |
Vested | | | (52,500 | ) | | $ | 13.32 | |
Issued and unvested as of December 31, 2012 | | | 41,250 | | | $ | 8.40 | |
Granted | | | 29,250 | | | $ | 13.09 | |
Vested | | | (41,250 | ) | | $ | 8.40 | |
Issued and unvested as of December 31, 2013 | | | 29,250 | | | $ | 13.09 | |
As of December 31, 2013, ICG expects 29,250 DSUs related to the annual grant program under the Director Plan to vest in the future.
Each non-management director is also entitled to receive quarterly cash payments for his service on the Board of Directors and its committees, as applicable, under the Director Plan. Each director may elect to receive DSUs in lieu of all or a portion of those cash fees. Each participating director receives DSUs representing shares of ICG’s Common Stock with a fair market value equal to the relevant cash fees (with such fair market value determined by reference to the closing Common Stock price reported by NASDAQ on the date these cash fees otherwise would have been paid). DSUs received in lieu of cash fees are fully vested at the time they are granted and are settled in shares of ICG’s Common Stock upon the termination of the recipient’s service at ICG. The expense for those DSUs is recorded when the fees to which the DSUs relate are earned and is included in the line item “general and administrative” on ICG’s Consolidated Statements of Operations (but is not reflected in the summarized Equity-Based Compensation table above).
Share activity with respect to periodically-issued DSUs for the years ended December 31, 2013, 2012 and 2011 was as follows:
| | Number of
DSUs | | | Weighted Average
Grant Date
Fair Value | |
Issued and unvested as of December 31, 2010 | | | — | | | $ | — | |
Granted | | | 13,571 | | | $ | 12.02 | |
Vested | | | (13,571 | ) | | $ | 12.02 | |
Issued and unvested as of December 31, 2011 | | | — | | | $ | — | |
Granted | | | 32,923 | | | $ | 9.42 | |
Vested | | | (32,923 | ) | | $ | 9.42 | |
Issued and unvested as of December 31, 2012 | | | — | | | $ | — | |
Granted | | | 30,540 | | | $ | 12.30 | |
Vested | | | (30,540 | ) | | $ | 12.30 | |
Issued and unvested as of December 31, 2013 | | | — | | | $ | — | |
Expense associated with the DSUs periodically issued in lieu of cash for the years ended December 31, 2013, 2012 and 2011 was $0.4 million, $0.3 million and $0.2 million, respectively.
ICG GROUP, INC.
NOTES TO CONSOLIDATED FINANCIAL STATEMENTS – (CONTINUED)
Consolidated Businesses
All of ICG’s consolidated businesses issue equity-based compensation awards to their employees. Those awards are most often in the form of stock options that vest over four years. The fair value of the stock option awards is estimated on the grant date using the Black-Scholes option pricing model. The majority of the stock options vest 25% on the first anniversary of the grant date, and the remaining 75% vest ratably each month over the subsequent 36 months. The other awards generally vest ratably over four years, with 25% vesting on each anniversary date over that term.
13. Other Income (Loss)
Other Income (Loss), net
Other income (loss), net consists of the effect of transactions and other events relating to ICG’s ownership interests and its operations in general, and, for the years ended December 31, 2013, 2012 and 2011, is comprised of the following (in thousands):
| | Year Ended December 31, | |
| | 2013 | | | 2012 | | | 2011 | |
Gain on fair value of prior equity interests | | $ | — | | | $ | 51,668 | | | $ | — | |
Gain (loss) on sales/distributions of ownership interests | | | (4,032 | ) | | | 5,260 | | | | 40,873 | |
Realized gains on sales of marketable securities | | | 23 | | | | 1,552 | | | | — | |
Gain on other distributions | | | — | | | | — | | | | 1,856 | |
Dilution gain on equity method businesses | | | — | | | | — | | | | 496 | |
Other | | | (93 | ) | | | (656 | ) | | | (18 | ) |
| | | (4,102 | ) | | | 57,824 | | | | 43,207 | |
Total other income (loss) for consolidated businesses | | | (108 | ) | | | (4 | ) | | | (4 | ) |
| | $ | (4,210 | ) | | $ | 57,820 | | | $ | 43,203 | |
On December 27, 2012, ICG acquired additional equity interests in Bolt and began to consolidate the financial position and results of Bolt as of that date. ICG recorded a gain on the transaction of $25.5 million, which represents the excess of the fair value at the date of consolidation over its carrying value from its previous equity interest as an equity method business. That gain is included in the line item “Gain on fair value of prior equity interests” for the year ended December 31, 2012 in the table above. See Note 4, “Consolidated Businesses” for the allocation of the enterprise value.
On July 11, 2012, ICG acquired additional equity interests in CIML and began to consolidate the financial position and results of CIML as of that date. In conjunction with the fair value determination of ICG’s previous equity interest in CIML, ICG recorded a gain of $26.2 million, representing the excess of ICG’s portion of the value of CIML over its carrying value from its previous equity interest as an equity method business at the date of consolidation; that gain is included in the line item “Gain on fair value of prior equity interests” for the year ended December 31, 2012 in the table above. The primary valuation technique used to measure the acquisition date fair value of CIML immediately before the acquisition was the backsolve option-pricing method.
On October 18, 2013, Freeborders was sold to Symbio. ICG received an equity ownership interest in Symbio as consideration for this transaction. ICG recorded a gain on that transaction of $0.3 million that is included in the line item “Gain (loss) on sales/distributions of ownership interests” for the year ended December 31, 2013 in the table above.
On October 28, 2013, substantially all of the assets of WhiteFence were sold to Allconnect. ICG’s portion of the proceeds was $5.4 million of cash, $1.6 million of which was deferred for one year. ICG recorded a loss on that transaction of $4.3 million that is included in the line item “Gain (loss) on sales/distributions of ownership interests” for the year ended December 31, 2013 in the table above.
On July 5, 2012, GoIndustry was sold to Liquidity Services. ICG’s portion of the proceeds was $2.9 million of cash, which was received in July 2012. During the three-month period ended September 30, 2012, ICG recorded its share of the sale transaction costs incurred by GoIndustry, and, accordingly, ICG’s carrying value of GoIndustry was reduced to zero as of the date of the transaction. ICG recorded a gain of $2.9 million for the proceeds received during the year ended December 31, 2012, which is included in the line item “Gain (loss) on sales/distributions of ownership interests” in the table above.
ICG GROUP, INC.
NOTES TO CONSOLIDATED FINANCIAL STATEMENTS – (CONTINUED)
On February 17, 2011, Metastorm was sold to Open Text. ICG’s portion of the sale proceeds was $53.0 million; $51.3 million of those proceeds were received at closing on February 17, 2011, and the remaining proceeds were placed in escrow in connection with a customary indemnification holdback. As a result of that transaction and the related receipt of escrowed proceeds, ICG recorded gains of $26.0 million during the year ended December 31, 2011. During the year ended December 31, 2012, ICG received $0.2 million of escrowed proceeds, representing the final distribution of escrowed proceeds. ICG recorded those amounts as gains, which are included in the line item “Gain (loss) on sales/distributions of ownership interests” in the relative periods in the table above.
On December 30, 2011, StarCite was sold to Active. ICG’s portion of the sale proceeds was $24.9 million, which consisted of $15.8 million of cash and 615,862 shares of Active common stock valued at $8.4 million, based on the $13.60 closing price of the stock on December 30, 2011. Approximately $0.1 million of the cash consideration and 102,199 shares of the stock consideration were placed in escrow to satisfy potential indemnity claims. ICG recorded a gain on that transaction of $14.1 million during the year ended December 31, 2011 that is included in the line item “Gain (loss) on sales/distributions of ownership interests” in the table above. During the year ended December 31, 2012, in conjunction with the release of 83,627 shares of Active common stock and a deminimis amount of cash from escrow, ICG recorded a gain of $0.4 million, which is also included in the line item “Gain (loss) on sales/distributions of ownership interests” for that year in the table above.
As noted above, ICG’s portion of the StarCite sale proceeds included shares of Active common stock, some of which were held in escrow for a period of time to satisfy potential indemnity claims. During the years ended December 31, 2013 and 2012, ICG realized proceeds of $0.8 million and $7.5 million, respectively, from the sale of 150,233 shares of Active common stock at an average price of $5.10 per share in the 2013 period, and 447,057 shares of Active common stock at an average price of $16.88 per share in the 2012 period. ICG recorded a gain on the sale of those securities of less than $0.1 million and $1.4 million during the years ended December 31, 2013 and 2012, respectively. Those gains are included in the line item “Realized gains on sales of marketable securities” in the relative periods in the table above. On various dates during the year ended December 31, 2012, ICG determined that the price per share at which shares of Active common stock were recorded on ICG’s Consolidated Balance Sheets exceeded the fair value price per share of those securities. Accordingly, during the year ended December 31, 2012, ICG recorded impairment charges of $0.6 million related to the mark-to-market adjustment on Active common stock. That impairment charge is included in the line item “Other” for the year ended December 31, 2012 in the table above.
During the year ended December 30, 2012, ICG received 12,989 shares of Intercontinental Exchange, Inc. (“ICE”), representing the final distribution of escrow proceeds related to the disposition of Creditex Group, Inc. ICG recorded a gain during the year ended December 31, 2012 of $1.7 million based on the closing stock price of the ICE common stock on the day it was released from escrow; that gain is included in the line item “Gain (loss) on sales/distributions of ownership interests” in the relative period in the table above. Subsequent to the receipt of those shares of ICE common stock, ICG sold the shares and received total proceeds of $1.8 million. The incremental gain on the sale of those shares of $0.1 million is included in the line item “Realized gains on the sales of marketable securities” for the year ended December 31, 2012 in the table above.
On June 14, 2011, Channel Intelligence acquired substantially all of the assets of ClickEquations, primarily in exchange for Channel Intelligence preferred stock that was distributed to ClickEquations’ stockholders, including ICG. The transaction diluted ICG’s ownership in Channel Intelligence and, accordingly, ICG recorded a dilution gain of $0.5 million during the year ended December 31, 2011, which is included in the line item “Dilution gain on equity method businesses” in the table above. Based on the excess of the specified value of the Channel Intelligence preferred stock received by ICG in the transaction over ICG’s carrying value of ClickEquations on the transaction date, ICG recorded a loss on the sale of ClickEquations in the amount of $0.8 million. The loss on the sale transaction is included in the line item “Gain (loss) on sales/distributions of ownership interests” during the year ended December 31, 2011 in the table above.
During the year ended December 31, 2011, ICG received escrowed proceeds and/or settlement payments related to several former businesses in which ICG had debt or equity ownership interests. ICG recorded aggregate gains of $1.6 million related to the receipt of those funds, which are included in the line item “Gain (loss) on sales/distributions of ownership interests” for the year ended December 31, 2011 in the table above.
Also during the year ended December 31, 2011, ICG received a distribution from Anthem in the amount of $1.9 million, which was recorded as a gain and is included in the line item “Gains on other distributions” in the table above.
ICG GROUP, INC.
NOTES TO CONSOLIDATED FINANCIAL STATEMENTS – (CONTINUED)
14. Income Taxes
Total income tax (benefit) expense was allocated as follows (in thousands):
| | Year Ended December 31, | |
| | 2013 | | | 2012 | | | 2011 | |
Income tax (benefit) expense from continuing operations: | | | | | | | | | | | | |
Current taxes | | | | | | | | | | | | |
Federal taxes | | $ | (17,711 | ) | | $ | 57 | | | $ | (464 | ) |
State taxes | | | 140 | | | | 640 | | | | 329 | |
Foreign taxes | | | — | | | | 506 | | | | 164 | |
Current taxes | | $ | (17,571 | ) | | $ | 1,203 | | | $ | 29 | |
Deferred taxes | | | | | | | | | | | | |
Federal taxes | | $ | — | | | $ | (376 | ) | | $ | 56 | |
State taxes | | | — | | | | 537 | | | | (4,372 | ) |
Foreign taxes | | | — | | | | (28 | ) | | | — | |
Deferred taxes | | $ | — | | | $ | 133 | | | $ | (4,316 | ) |
Income tax (benefit) expense | | $ | (17,571 | ) | | $ | 1,336 | | | $ | (4,287 | ) |
ICG Group, Inc., GovDelivery, InvestorForce (through January 29, 2013, the date of disposition), MSDSonline (beginning March 30, 2012, the date of acquisition) and Procurian (through December 4, 2013, the date of disposition) file a consolidated federal income tax return. ICG recorded consolidated income tax expense of $0.1 million for the year ended December 31, 2013. A significant amount of ICG’s overall tax expense relates to Procurian which is now presented as discontinued operations. The current federal income tax benefit recognized in 2013 of $17.7 million is offset by a $17.7 million income tax expense in discontinued operations since there was a loss in continuing operations and income in discontinued operations in that same year. There was not a similar benefit in 2012 or 2011, as there was income in both continuing operations and discontinued operations in those years. There was current tax expense recognized for state income taxes. For deferred income taxes, after evaluating all the positive and negative evidence, both historical and prospective, and determining it is not more likely than not to be realized, ICG maintains a full valuation allowance against its net deferred tax assets; therefore, no deferred tax expense was recorded in 2013. Amounts for 2012 and 2011 included in the table above are not recast to reflect what is reported in discontinued operations; rather, it is noted that $1.2 million of the $1.3 million income tax expense for 2012 and $3.8 million of the $4.3 million income tax benefit for 2011 are included in the line item “Income (loss) from discontinued operations, including gain on sale, net of tax” on ICG’s Consolidated Statements of Operations for those respective years. ICG recorded a consolidated income tax expense of $1.3 million during the year ended December 31, 2012. That income tax expense includes a benefit of $0.8 million related to the result of reconciliation of tax depreciation expense on fixed assets, which relates to periods prior to Procurian being a consolidating member of our consolidated tax return. ICG has determined that this amount is immaterial to all applicable periods, which encompasses the years of 2009 to 2012. ICG recorded a consolidated income tax benefit of $4.3 million during the year ended December 31, 2011. That benefit is comprised of $4.5 million of net deferred tax benefit related to the release of certain valuation allowances at Procurian, a tax benefit of $0.3 million for a return-to-provision adjustment for alternative minimum taxes from 2010 and a tax benefit of $0.2 million related to interest received on an income tax refund, partially offset by state and foreign tax expense from operations at Procurian.
As a result of a change in ownership under Internal Revenue Code Section 382 that occurred in 2004, ICG’s net operating loss carryforwards and capital loss carryforwards are subject to an annual limitation. The annual limitation on the utilization of these carryforwards is approximately $14.5 million. This annual limitation can be carried forward if it is not used. ICG did not use the limitation in 2009; therefore, the amount available for 2010 was $29.0 million, all of which was used in 2010. ICG did not use the limitation in 2011 or 2012; therefore, the amount available for 2013 was $43.5 million, all of which was used in 2013 to offset the capital gains realized in 2013. The total amount available in future years for these carryforwards at December 31, 2013 was $145.2 million. These losses expire in varying amounts between 2018 and 2023.
Additionally, as of December 31, 2013, ICG consolidated had $82.0 million of net operating loss carryforwards that are not subject to the Section 382 annual limitation. These net operating losses expire between 2018 and 2033. Of this amount, approximately $15.0 million is attributable to excess deductions for equity compensation, the benefit of which will be recorded to additional paid-in capital when realized.
GovDelivery joined in filing a consolidated federal income tax return with ICG beginning in 2010. At the time of acquisition, GovDelivery had approximately $2.8 million of net operating loss carryforwards. ICG’s acquisition of GovDelivery constituted a change in ownership under Internal Revenue Code Section 382. As a result, these net operating losses are limited to approximately
ICG GROUP, INC.
NOTES TO CONSOLIDATED FINANCIAL STATEMENTS – (CONTINUED)
$1.0 million per year, plus any recognized built-in gains. As of December 31, 2013, all of these NOLs are available. GovDelivery’s net deferred tax liability after acquisition accounting of $4.8 million reduced ICG’s valuation allowance.
MSDSonline joined in ICG’s consolidated federal tax return beginning on March 30, 2012 (when it was acquired). MSDSonline had NOLs totaling approximately $50.9 million when it was acquired. These NOLs expire in varying amounts between 2019 and 2031. The acquisition of MSDSonline constituted a change in ownership under Internal Revenue Code Section 382. The annual limitation on the utilization of MSDSonline’s NOLs equals approximately $1.7 million plus recognized built-in gains. Approximately $47.4 million of NOLs are expected to be available as a result of this limitation, of which, $9.4 million is currently available and included in the $82.0 million of NOLs that are not subject to the Section 382 limitations noted above.
ICG’s net deferred tax asset (liability) consists of the following (in thousands):
| | As of December 31, | |
| | 2013 | | | 2012 | |
| | (in thousands) | |
Deferred tax assets: | | | | | | | | |
Net operating loss and capital loss carryforward – 382 limited | | $ | 74,220 | | | $ | 97,760 | |
Net operating loss carryforward – not 382 limited | | | 34,774 | | | | 35,811 | |
State net operating loss carryforward, net | | | — | | | | 4,345 | |
Capital loss carryforward – not 382 limited | | | 23,106 | | | | 44,806 | |
Company basis difference | | | 25,176 | | | | 18,958 | |
Reserves and accruals | | | 291 | | | | 5,563 | |
Equity-based compensation expense | | | 5,369 | | | | 9,196 | |
AMT and other credits | | | — | | | | 582 | |
Other, net | | | 1,302 | | | | 1,348 | |
Total deferred tax assets | | | 164,238 | | | | 218,369 | |
Valuation allowance | | | (150,408 | ) | | | (162,283 | ) |
Deferred tax asset | | | 13,830 | | | | 56,086 | |
Deferred tax liabilities: | | | | | | | | |
Intangible assets | | | (13,830 | ) | | | (25,968 | ) |
Total deferred tax liabilities | | | (13,830 | ) | | | (25,968 | ) |
Total net deferred tax assets | | $ | — | | | $ | 30,118 | |
After evaluating all positive and negative evidence, both historical and prospective, and determining it is not more likely than not to be realized, ICG has recorded a full valuation allowance against its net deferred tax assets as of December 31, 2013. The net deferred tax asset as of December 31, 2012 is included in the line item “Assets of Discontinued Operations” on ICG’s Consolidated Balance Sheets.
ICG’s practice is to recognize interest and/or penalties related to income tax matters in income tax expense. ICG had no material accrual for interest or penalties on ICG’s Consolidated Balance Sheets at December 31, 2013, 2012 or 2011. ICG recognized an income tax benefit related to $0.2 million of interest received in conjunction with the aforementioned refunds, which is included in ICG’s Consolidated Statements of Operations for the year ended December 31, 2011. There were no interest and/or penalties in ICG’s Consolidated Statements of Operations for the year ended December 31, 2012 or 2013.
Tax years 2009 and forward are subject to examination for federal tax purposes. Tax years 1998 through 2008 are subject to examination for federal tax purposes to the extent of net operating losses used in future years.
ICG GROUP, INC.
NOTES TO CONSOLIDATED FINANCIAL STATEMENTS – (CONTINUED)
The effective tax rate differs from the federal statutory rate as follows:
| | Year Ended December 31, | |
| | 2013 | | | 2012 | | | 2011 | |
Tax expense (benefit) at statutory rate | | | (35.0 | )% | | | 35.0 | % | | | 35.0 | % |
IRS audit adjustment and interest | | | — | % | | | — | % | | | (0.9 | )% |
Foreign and state taxes | | | (2.3 | )% | | | 4.6 | % | | | 2.1 | % |
Non-deductible expenses and other | | | 0.6 | % | | | 0.1 | % | | | 3.7 | % |
Valuation allowance | | | — | % | | | (24.4 | )% | | | (57.8 | )% |
Prior period adjustment | | | — | % | | | (3.6 | )% | | | — | % |
Acquisition of MSDSonline | | | — | % | | | (6.3 | )% | | | — | % |
| | | (36.7 | )% | | | 5.4 | % | | | (17.9 | )% |
15. Net Income (Loss) per Share
The calculations of net income (loss) per share were as follows (in thousands, except per share data):
| | Year Ended December 31, | |
| | 2013 | | | 2012 | | | 2011 | |
Basic and Diluted: | | | | | | | | | | | | |
Income (loss) from continuing operations | | $ | (25,669 | ) | | $ | 12,703 | | | $ | 10,682 | |
Income (loss) from discontinued operations | | | 234,728 | | | | 10,286 | | | | 16,884 | |
Net income (loss) attributable to ICG Group, Inc. | | $ | 209,059 | | | $ | 22,989 | | | $ | 27,566 | |
Basic: | | | | | | | | | | | | |
Income (loss) from continuing operations per share | | $ | (0.70 | ) | | $ | 0.35 | | | $ | 0.29 | |
Income (loss) from discontinued operations per share | | | 6.42 | | | | 0.29 | | | | 0.46 | |
Net income (loss) attributable to ICG Group, Inc. per share | | $ | 5.72 | | | $ | 0.64 | | | $ | 0.75 | |
Diluted: | | | | | | | | | | | | |
Income (loss) from continuing operations per share | | $ | (0.70 | ) | | $ | 0.35 | | | $ | 0.29 | |
Income (loss) from discontinued operations per share | | | 6.42 | | | | 0.28 | | | | 0.45 | |
Net income (loss) attributable to ICG Group, Inc. per share | | $ | 5.72 | | | $ | 0.63 | | | $ | 0.74 | |
Shares used in computation of basic income (loss) per share | | | 36,536 | | | | 35,890 | | | | 36,656 | |
Incremental Diluted Shares Impact: | | | | | | | | | | | | |
Stock options | | | — | | | | 41 | | | | 84 | |
SARs | | | — | | | | 546 | | | | 683 | |
Restricted stock | | | — | | | | 40 | | | | 20 | |
DSUs | | | — | | | | 26 | | | | 17 | |
Shares used in the computation of diluted income (loss) per share | | | 36,536 | | | | 36,543 | | | | 37,460 | |
ICG GROUP, INC.
NOTES TO CONSOLIDATED FINANCIAL STATEMENTS – (CONTINUED)
The following potentially dilutive securities were not included in the computation of diluted net loss per share, as their effect would have been anti-dilutive:
| | Units
(in thousands) | | | Weighted Average
Price per Share | |
Year ended December 31, 2013 | | | | | | | | |
SARs | | | 28 | | | $ | 12.47 | |
Restricted stock (1) | | | 748 | | | $ | 8.22 | |
Year ended December 31, 2012 | | | | | | | | |
SARs | | | 655 | | | $ | 10.98 | |
Restricted stock (1) | | | 762 | | | $ | 8.08 | |
Year ended December 31, 2011 | | | | | | | | |
SARs | | | 2,201 | | | $ | 8.03 | |
Stock options | | | 2 | | | $ | 15.80 | |
Restricted stock (1) | | | 1,195 | | | $ | 9.18 | |
(1) | Anti-dilutive securities include contingently issuable shares unvested as of December 31, 2013, the vesting of which is based on performance conditions and market conditions that have not yet been achieved. See Note 12, “Equity-Based Compensation.” |
16. Commitments and Contingencies
ICG and its consolidated subsidiaries are involved in various claims and legal actions arising in the ordinary course of business. In the opinion of management, the amount of the ultimate liability with respect to legal claims/actions will not materially affect the financial position, results of operations or cash flows of ICG or its consolidated businesses.
ICG and its consolidated businesses lease their facilities under operating lease agreements expiring 2013 through 2019. Future minimum lease payments as of December 31, 2013 under the leases are as follows (in thousands):
2014 | | $ | 2,665 | |
2015 | | $ | 2,348 | |
2016 | | $ | 1,834 | |
2017 | | $ | 512 | |
2018 | | $ | 1 | |
Thereafter | | $ | — | |
Rent expense under the non-cancelable operating leases was $2.4 million, $1.4 million and $0.8 million for the years ended December 31, 2013, 2012 and 2011, respectively.
17. Segment Information
The results of operations of our businesses are reported in two segments: the “vertical cloud” reporting segment and the “vertical cloud (venture)” reporting segment. Our vertical cloud reporting segment reflects the aggregate financial results of our businesses (1) that share the economic and other characteristics described above, (2) in which our management takes a very active role in providing strategic direction and operational support and (3) towards which we devote relatively large proportions of our personnel, financial capital and other resources. As of the date of this Report, we own majority controlling equity positions in (and therefore consolidate the financial results of) each of the three businesses in our vertical cloud segment. Our vertical cloud (venture) reporting segment includes businesses with many characteristics similar to those of the businesses in our vertical cloud segment, but in which we take a less active role in terms of strategic direction and operational support, and, accordingly, towards which we devote relatively small amounts of personnel, financial capital and other resources.
Approximately $2.5 million, $1.0 million and $0.6 million of ICG’s consolidated revenue for the years ended December 31, 2013, 2012 and 2011, respectively, relates to sales generated outside of the United States, primarily Europe and Canada. As of December 31, 2013 and 2012, ICG’s assets were located primarily in the United States.
ICG GROUP, INC.
NOTES TO CONSOLIDATED FINANCIAL STATEMENTS – (CONTINUED)
The following summarizes selected information related to ICG’s segments for the years ended December 31, 2013, 2012 and 2011. The amounts presented as “Dispositions” in the following table represent businesses reported as discontinued operations as of December 31, 2013 and ICG’s share of businesses’ results that had been accounted for under the equity method of accounting that were disposed during the years ended December 31, 2013, 2012 and 2011. Businesses reported as discontinued operations as of December 31, 2013 include the following: (1) Procurian, which was sold to Accenture on December 4, 2013, (2) Channel Intelligence, which was sold to Google on February 20, 2013, and (3) InvestorForce, which was sold to MSCI on January 29, 2013. Businesses that were accounted for under the equity method of accounting and were disposed of during the three years ended December 31, 2013 include the following: (1) WhiteFence, substantially all of the assets of which were acquired by Allconnect on October 28, 2013, (2) Freeborders, which was merged with Symbio on October 18, 2013, (3) GoIndustry, which was sold to Liquidity Services on July 5, 2012, (4) StarCite, which was sold to Active on December 30, 2011, (5) ClickEquations, substantially all of the assets of which were acquired by Channel Intelligence on June 14, 2011, and (6) Metastorm, which was sold to Open Text on February 17, 2011. The results of these businesses (or our share of the results in the case of the equity-method businesses, including any related intangible amortization) were removed from our segments and are included in “Dispositions” in the segment information table below for all periods presented.
| | Segment Information | |
| | (in thousands) | |
| | | | | Reconciling Items | | |
| | Vertical Cloud | | | Vertical Cloud - Venture | | | Total Segment | | | Dispositions | | | Other (1) | | | Consolidated
Results | |
Year Ended December 31, 2013 | | | | | | | | | | | | | | | | | | | | | | | | |
Revenue. | | $ | 58,772 | | | $ | 429 | | | $ | 59,201 | | | $ | — | | | $ | — | | | $ | 59,201 | |
Net income (loss) attributable to ICG Group, Inc. | | $ | (18,026 | ) | | $ | (2,320 | ) | | $ | (20,346 | ) | | $ | 230,773 | | | $ | (1,368 | ) | | $ | 209,059 | |
Assets | | $ | 179,687 | | | $ | 15,879 | | | $ | 195,566 | | | $ | — | | | $ | 334,038 | | | $ | 529,604 | |
Capital expenditures | | $ | (1,183 | ) | | $ | (26 | ) | | $ | (1,209 | ) | | $ | — | | | $ | (34 | ) | | $ | (1,243 | ) |
Year Ended December 31, 2012 | | | | | | | | | | | | | | | | | | | | | | | | |
Revenue | | $ | 26,026 | | | $ | 614 | | | $ | 26,640 | | | $ | — | | | $ | — | | | $ | 26,640 | |
Net income (loss) attributable to ICG Group, Inc. | | $ | (18,244 | ) | | $ | (2,835 | ) | | $ | (21,079 | ) | | $ | 10,440 | | | $ | 33,628 | | | $ | 22,989 | |
Assets | | $ | 173,300 | | | $ | 14,820 | | | $ | 188,120 | | | $ | 242,938 | | | $ | 16,001 | | | $ | 447,059 | |
Capital expenditures | | $ | (5,487 | ) | | $ | — | | | $ | (5,487 | ) | | $ | — | | | $ | (1,503 | ) | | $ | (6,990 | ) |
Year Ended December 31, 2011 | | | | | | | | | | | | | | | | | | | | | | | | |
Revenue | | $ | 12,885 | | | $ | — | | | $ | 12,885 | | | $ | — | | | $ | — | | | $ | 12,885 | |
Net income (loss) attributable to ICG Group, Inc. | | $ | (7,490 | ) | | $ | — | | | $ | (7,490 | ) | | $ | 11,031 | | | $ | 24,025 | | | $ | 27,566 | |
Assets | | $ | 30,023 | | | $ | 9,478 | | | $ | 39,501 | | | $ | 138,481 | | | $ | 128,838 | | | $ | 306,820 | |
Capital expenditures | | $ | (826 | ) | | $ | — | | | $ | (826 | ) | | $ | — | | | $ | (85 | ) | | $ | (912 | ) |
The following table reflects the components of Net income (loss) attributable to ICG Group, Inc. included in Other (in thousands):
| | Year Ended December 31, | |
| | 2013 | | | 2012 | | | 2011 | |
General and administrative | | $ | (19,132 | ) | | $ | (23,113 | ) | | $ | (17,086 | ) |
Impairment related and other | | | (2,953 | ) | | | (865 | ) | | | 26 | |
Corporate other income (loss) (Note 13) | | | (4,102 | ) | | | 57,824 | | | | 43,207 | |
Interest income | | | 171 | | | | 374 | | | | 348 | |
Income tax benefit (expense) | | | 17,630 | | | | 1 | | | | 464 | |
Equity loss | | | — | | | | (1 | ) | | | (699 | ) |
Noncontrolling interest (income) loss | | | 7,018 | | | | (592 | ) | | | (2,235 | ) |
Net income (loss) | | $ | (1,368 | ) | | $ | 33,628 | | | $ | 24,025 | |
ICG GROUP, INC.
NOTES TO CONSOLIDATED FINANCIAL STATEMENTS – (CONTINUED)
18. Related Parties
ICG provides strategic and operational support to companies in which it holds convertible debt and equity ownership interests in the normal course of its business. ICG’s employees generally provide these services. The costs related to employees are paid by ICG and are reflected in general and administrative expenses. Non-management members of ICG’s Board of Directors are compensated with cash and equity grants of ICG Common Stock that are accounted for in accordance with guidance for equity-based payment compensation.
19. Selected Quarterly Financial Information (Unaudited)
The following table sets forth selected quarterly consolidated financial information for the years ended December 31, 2013 and 2012. The operating results for any given quarter are not necessarily indicative of results for any future period.
| | 2013 Quarter Ended | | | 2012 Quarter Ended | |
| | Mar.31 | | | Jun.30 | | | Sep.30 | | | Dec.31 | | | Mar.31 | | | Jun.30 | | | Sep.30 | | | Dec.31 | |
| | (in thousands, except per share data) | |
Revenue | | $ | 11,974 | | | $ | 13,476 | | | $ | 16,071 | | | $ | 17,680 | | | $ | 4,211 | | | $ | 5,400 | | | $ | 7,998 | | | $ | 9,031 | |
Operating Expenses | | | | | | | | | | | | | | | | | | | | |
Cost of revenue | | | 4,198 | | | | 4,123 | | | | 4,501 | | | | 4,935 | | | | 1,232 | | | | 2,396 | | | | 2,889 | | | | 2,942 | |
Sales and marketing | | | 5,682 | | | | 6,541 | | | | 7,571 | | | | 8,335 | | | | 1,547 | | | | 3,125 | | | | 3,848 | | | | 3,835 | |
General and administrative | | | 8,803 | | | | 7,220 | | | | 7,852 | | | | 7,085 | | | | 6,350 | | | | 6,405 | | | | 7,396 | | | | 8,257 | |
Research and development | | | 2,246 | | | | 2,331 | | | | 2,149 | | | | 2,306 | | | | 1,157 | | | | 1,904 | | | | 2,825 | | | | 2,921 | |
Amortization of intangible assets | | | 2,491 | | | | 1,544 | | | | 2,176 | | | | 2,259 | | | | 398 | | | | 1,409 | | | | 1,511 | | | | 1,519 | |
Impairment related and other | | | 170 | | | | 127 | | | | 470 | | | | 3,525 | | | | — | | | | 141 | | | | 655 | | | | 334 | |
Total operating expenses | | | 23,590 | | | | 21,886 | | | | 24,719 | | | | 28,445 | | | | 10,684 | | | | 15,380 | | | | 19,124 | | | | 19,808 | |
Operating income (loss) | | | (11,616 | ) | | | (8,410 | ) | | | (8,648 | ) | | | (10,765) | | | | (6,473 | ) | | | (9,980 | ) | | | (11,126 | ) | | | (10,777 | ) |
Other income (loss), net | | | (64 | ) | | | (46 | ) | | | (68 | ) | | | (4,032 | ) | | | 157 | | | | 1,470 | | | | 31,222 | | | | 24,971 | |
Interest income | | | 31 | | | | 56 | | | | 63 | | | | 77 | | | | 124 | | | | 82 | | | | 138 | | | | 95 | |
Interest expense | | | (321 | ) | | | (385 | ) | | | (370 | ) | | | (408 | ) | | | (10 | ) | | | (9 | ) | | | — | | | | (6 | ) |
Income (loss) before income taxes, equity loss, discontinued operations and noncontrolling
interest | | | (11,970 | ) | | | (8,785 | ) | | | (9,023 | ) | | | (15,128 | ) | | | (6,202 | ) | | | (8,437 | ) | | | 20,234 | | | | 14,283 | |
Income tax (expense) benefit | | | (73 | ) | | | (56 | ) | | | 99 | | | | 17,601 | | | | 806 | | | | 2,457 | | | | (3,330 | ) | | | (41 | ) |
Equity loss | | | (701 | ) | | | (923 | ) | | | (295 | ) | | | (1,044 | ) | | | (2,303 | ) | | | (3,236 | ) | | | (1,607 | ) | | | (1,526 | ) |
Income (loss) from continuing operations | | | (12,744 | ) | | | (9,764 | ) | | | (9,219 | ) | | | 1,429 | | | | (7,699 | ) | | | (9,216 | ) | | | 15,297 | | | | 12,716 | |
Income (loss) from discontinued operations | | | 28,226 | | | | 2,448 | | | | 4,980 | | | | 196,685 | | | | 831 | | | | 3,874 | | | | 5,657 | | | | 2,121 | |
Net income (loss) | | | 15,482 | | | | (7,316 | ) | | | (4,239 | ) | | | 198,114 | | | | (6,868 | ) | | | (5,342 | ) | | | 20,954 | | | | 14,837 | |
Less: Net income attributable to the noncontrolling
interest | | | (3,586 | ) | | | (458 | ) | | | (907 | ) | | | (2,067 | ) | | | 152 | | | | 652 | | | | (387 | ) | | | 175 | |
Net income (loss) attributable to ICG Group, Inc. | | $ | 19,068 | | | $ | (6,858 | ) | | $ | (3,332 | ) | | $ | 200,181 | | | $ | (7,020 | ) | | $ | (5,994 | ) | | $ | 21,341 | | | $ | 14,662 | |
Amounts attributable to ICG Group, Inc.: | | | | | | | | | | | | | | | | | | | | | | | | | | | | | | | | |
Net income (loss) from continuing operations | | $ | (11,426 | ) | | $ | (9,025 | ) | | $ | (8,022 | ) | | $ | 2,804 | | | $ | (7,660 | ) | | $ | (9,156 | ) | | $ | 16,063 | | | $ | 13,449 | |
Net income (loss) from discontinued operations | | | 30,494 | | | | 2,167 | | | | 4,690 | | | | 197,377 | | | | 640 | | | | 3,162 | | | | 5,278 | | | | 1,213 | |
Net income (loss) | | $ | 19,068 | | | $ | (6,858 | ) | | $ | (3,332 | ) | | $ | 200,181 | | | $ | (7,020 | ) | | $ | (5,994 | ) | | $ | 21,341 | | | $ | 14,662 | |
Basic income (loss) per share (1) | | | | | | | | | | | | | | | | | | | | | | | | | | | | | | | | |
Income (loss) from continuing operations | | $ | (0.31 | ) | | $ | (0.25 | ) | | $ | (0.22 | ) | | $ | 0.08 | | | $ | (0.21 | ) | | $ | (0.26 | ) | | $ | 0.45 | | | $ | 0.37 | |
Income (loss) from discontinued operations | | | 0.83 | | | | 0.06 | | | | 0.13 | | | | 5.38 | | | | 0.02 | | | | 0.09 | | | | 0.15 | | | | 0.04 | |
Net income (loss) attributable to ICG Group, Inc.
operations | | $ | 0.52 | | | $ | (0.19 | ) | | $ | (0.09 | ) | | $ | 5.46 | | | $ | (0.19 | ) | | $ | (0.17 | ) | | $ | 0.60 | | | $ | 0.41 | |
Shares used in computation of basic income (loss)
per share (1) | | | 36,713 | | | | 36,468 | | | | 36,303 | | | | 36,664 | | | | 36,156 | | | | 35,917 | | | | 35,650 | | | | 35,840 | |
Diluted income (loss) per share (1) | | | | | | | | | | | | | | | | | | | | | | | | | | | | | | | | |
Income (loss) from continuing operations | | $ | (0.31 | ) | | $ | (0.25 | ) | | $ | (0.22 | ) | | $ | 0.08 | | | $ | (0.21 | ) | | $ | (0.26 | ) | | $ | 0.44 | | | $ | 0.36 | |
Income (loss) from discontinued operations | | | 0.83 | | | | 0.06 | | | | 0.13 | | | | 5.10 | | | | 0.02 | | | | 0.09 | | | | 0.15 | | | | 0.04 | |
Net income (loss) attributable to ICG Group, Inc. | | $ | 0.52 | | | $ | (0.19 | ) | | $ | (0.09 | ) | | $ | 5.18 | | | $ | (0.19 | ) | | $ | (0.17 | ) | | $ | 0.59 | | | $ | 0.40 | |
Shares used in computation of diluted income (loss) per share (1) | | | 36,713 | | | | 36,468 | | | | 36,303 | | | | 38,680 | | | | 36,156 | | | | 35,917 | | | | 36,273 | | | | 36,912 | |
(1) | The sum of quarterly income (loss) per share differs from the full year amount due to changes in the number of shares outstanding during the year. |
ITEM 9. Changes in Disagreements with Accountants on Accounting and Financial Disclosures
None.
ITEM 9A. Controls and Procedures
Disclosure Controls and Procedures
We carried out an evaluation, under the supervision and with the participation of management, including the Chief Executive Officer and Chief Financial Officer, of the effectiveness of the design and operation of our disclosure controls and procedures (as defined in Rules 13a-15(e) and 15d-15(e) under the Exchange Act) as of the end of the period covered in this Report. Based upon that evaluation, the Chief Executive Officer and Chief Financial Officer concluded that, as of the end of the period covered in this Report, our disclosure controls and procedures have been designed and are effective to provide reasonable assurance that information required to be included in ICG’s periodic SEC reports is recorded, processed, summarized and reported within the time periods specified in the relevant SEC rules and forms, and is accumulated and communicated to management, including the Chief Executive Officer and Chief Financial Officer, as appropriate, to allow timely discussions regarding required disclosure.
Management’s Report on Internal Control Over Financial Reporting
Management of ICG is responsible for establishing and maintaining adequate internal control over financial reporting (as defined in Rules 13a-15(f) and 15d-15(f) under the Exchange Act). ICG’s internal control over financial reporting is a process designed to provide reasonable assurance regarding the reliability of financial reporting and the preparation of financial statements for external purposes in accordance with generally accepted accounting principles. ICG’s internal control over financial reporting includes those policies and procedures that (1) pertain to the maintenance of records that, in reasonable detail, accurately and fairly reflect the transactions and dispositions of the assets of ICG, (2) provide reasonable assurance that transactions are recorded as necessary to permit preparation of financial statements for external purposes in accordance with generally accepted accounting principles, (3) provide reasonable assurance that receipts and expenditures of ICG are being made only in accordance with authorizations of management and directors of ICG, and (4) provide reasonable assurance regarding prevention or timely detection of unauthorized acquisition, use or disposition of ICG’s assets that could have a material effect on the financial statements.
Management of ICG Group, Inc. evaluated ICG’s internal control over financial reporting as of December 31, 2013. In making this assessment, it used the criteria set forth by the Committee of Sponsoring Organizations of the Treadway Commission (COSO) in Internal Control-Integrated Framework (1992). Management’s assessment included an evaluation of the design of its internal control over financial reporting and testing of the operational effectiveness of its internal control over financial reporting. Management reviewed the results of its assessment with the Audit Committee of the Board of Directors. Based on this assessment, as of December 31, 2013, ICG’s internal control over financial reporting was effective based on those criteria.
ICG’s independent registered public accounting firm, KPMG LLP, has audited the operating effectiveness of ICG’s internal control over financial reporting. KPMG LLP’s report on the operating effectiveness of ICG’s internal control over financial reporting appears below.
Changes in Internal Control Over Financial Reporting
There have been no changes in internal control over financial reporting during the period covered by this Report that have materially affected, or are reasonably likely to materially affect, ICG’s internal control over financial reporting.
Inherent Limitations on Effectiveness of Controls
The design of any system of control is based upon certain assumptions about the likelihood of future events, and there can be no assurance that any design will succeed in achieving its stated objectives under all future events, no matter how remote, that controls may become inadequate because of changes in conditions, or that the degree of compliance with the policies or procedures may not deteriorate. Because of their inherent limitations, systems of control may not prevent or detect all misstatements. Accordingly, even effective systems of control can provide only reasonable assurance of achieving their control objectives.
ITEM 9B. Other Information
None.
Report of Independent Registered Public Accounting Firm
The Board of Directors and Stockholders
ICG Group, Inc. and Subsidiaries:
We have audited ICG Group, Inc. and Subsidiaries’ (the Company) internal control over financial reporting as of December 31, 2013, based on criteria established in Internal Control—Integrated Framework (1992) issued by the Committee of Sponsoring Organizations of the Treadway Commission (COSO). ICG Group, Inc. and subsidiaries’ management is responsible for maintaining effective internal control over financial reporting and for its assessment of the effectiveness of internal control over financial reporting, included in the accompanying Management’s Report on Internal Control Over Financial Reporting. Our responsibility is to express an opinion on the Company’s internal control over financial reporting based on our audit.
We conducted our audit in accordance with the standards of the Public Company Accounting Oversight Board (United States). Those standards require that we plan and perform the audit to obtain reasonable assurance about whether effective internal control over financial reporting was maintained in all material respects. Our audit included obtaining an understanding of internal control over financial reporting, assessing the risk that a material weakness exists, and testing and evaluating the design and operating effectiveness of internal control based on the assessed risk. Our audit also included performing such other procedures as we considered necessary in the circumstances. We believe that our audit provides a reasonable basis for our opinion.
A company’s internal control over financial reporting is a process designed to provide reasonable assurance regarding the reliability of financial reporting and the preparation of financial statements for external purposes in accordance with generally accepted accounting principles. A company’s internal control over financial reporting includes those policies and procedures that (1) pertain to the maintenance of records that, in reasonable detail, accurately and fairly reflect the transactions and dispositions of the assets of the company; (2) provide reasonable assurance that transactions are recorded as necessary to permit preparation of financial statements in accordance with generally accepted accounting principles, and that receipts and expenditures of the company are being made only in accordance with authorizations of management and directors of the company; and (3) provide reasonable assurance regarding prevention or timely detection of unauthorized acquisition, use, or disposition of the company’s assets that could have a material effect on the financial statements.
Because of its inherent limitations, internal control over financial reporting may not prevent or detect misstatements. Also, projections of any evaluation of effectiveness to future periods are subject to the risk that controls may become inadequate because of changes in conditions, or that the degree of compliance with the policies or procedures may deteriorate.
In our opinion, ICG Group, Inc. and Subsidiaries maintained, in all material respects, effective internal control over financial reporting as of December 31, 2013, based on criteria established in Internal Control—Integrated Framework (1992) issued by the Committee of Sponsoring Organizations of the Treadway Commission.
We also have audited, in accordance with the standards of the Public Company Accounting Oversight Board (United States), the consolidated balance sheets of ICG Group, Inc. and Subsidiaries as of December 31, 2013 and 2012, and the related consolidated statements of operations and comprehensive income (loss), changes in equity and cash flows for each of the years in the three-year period ended December 31, 2013, and our report dated March 17, 2014 expressed an unqualified opinion on those consolidated financial statements.
/s/ KPMG LLP
Philadelphia, Pennsylvania
March 17, 2014
ITEM 10. Directors, Executive Officers and Corporate Governance
We incorporate by reference the information contained under the captions “Election of Directors,” “Section 16(a) Beneficial Ownership Reporting Compliance,” “Executive Officers” and “Corporate Governance” in our Definitive Proxy Statement for our 2014 Annual Meeting of Stockholders to be filed within 120 days after the end of the year covered by this Report pursuant to Regulation 14A under the Exchange Act.
We have adopted a written code of business conduct and ethics, known as our Corporate Code of Conduct, which applies to all of our directors, officers and employees, including our principal executive officer and our principal financial and accounting officer. Our Corporate Code of Conduct is available on our internet website, www.icg.com. Any amendments to our Corporate Code of Conduct or waivers from the provisions of the Corporate Code of Conduct for our principal executive officer or our principal financial and accounting officer will be disclosed in accordance with applicable SEC and stock exchange rules.
ITEM 11. Executive Compensation
We incorporate by reference the information contained under the caption “Executive Compensation” in our Definitive Proxy Statement for our 2014 Annual Meeting of Stockholders to be filed within 120 days after the end of the year covered by this Report pursuant to Regulation 14A under the Exchange Act.
ITEM 12. Security Ownership of Certain Beneficial Owners and Management and Related Stockholder Matters
We incorporate by reference the information contained under the caption “Security Ownership of Certain Beneficial Owners and Directors and Officers” in our Definitive Proxy Statement for our 2014 Annual Meeting of Stockholders to be filed within 120 days after the end of the year covered by this Report pursuant to Regulation 14A under the Exchange Act.
ITEM 13. Certain Relationships and Related Transactions, and Director Independence
We incorporate by reference the information contained under the caption “Certain Relationships and Related Transactions” in our Definitive Proxy Statement for our 2014 Annual Meeting of Stockholders to be filed within 120 days after the end of the year covered by this Report pursuant to Regulation 14A under the Exchange Act.
ITEM 14. Principal Accountant Fees and Services
We incorporate by reference the information contained under the caption “Ratification of Appointment of Independent Registered Public Accountant” in our Definitive Proxy Statement for our 2014 Annual Meeting of Stockholders to be filed within 120 days after the end of the year covered by this Report pursuant to Regulation 14A under the Exchange Act.
ITEM 15. Exhibits and Financial Statement Schedules
1. Consolidated Financial Statements
The Consolidated Financial Statements and related Notes thereto as set forth under Item 8 of this Report are incorporated herein by reference.
2. Financial Statement Schedule
Report of Independent Registered Public Accounting Firm
The Board of Directors and Stockholders
ICG Group, Inc. and Subsidiaries:
Under date of March 17, 2014, we reported on the consolidated balance sheets of ICG Group, Inc. and Subsidiaries (the Company) as of December 31, 2013 and 2012, and the related consolidated statements of operations and comprehensive income (loss), changes in equity and cash flows for each of the years in the three-year period ended December 31, 2013. In connection with our audits of the aforementioned consolidated financial statements, we also audited the related consolidated financial statement schedule. The consolidated financial statement schedule is the responsibility of the Company’s management. Our responsibility is to express an opinion on the consolidated financial statement schedule based on our audits.
In our opinion, such consolidated financial statement schedule, when considered in relation to the basic consolidated financial statements taken as a whole, presents fairly, in all material respects, the information set forth therein.
/s/ KPMG LLP
Philadelphia, PA
March 17, 2014
ICG GROUP, INC.
SCHEDULE II – VALUATION AND QUALIFYING ACCOUNTS
Years Ended December 31, 2011, 2012 and 2013
(in thousands)
| | Balance at
Beginning
of Year | | | Charged to
Costs and
Expenses | | | Charged to
Other
Accounts | | | Write-offs | | | Balance at
End of Year | |
Allowance for Doubtful Accounts: | | | | | | | | | | | | | | | | | | | | |
December 31, 2011 | | $ | 96 | | | $ | 33 | | | $ | 0 | | | $ | (93 | ) | | $ | 36 | |
December 31, 2012 | | $ | 36 | | | $ | 237 | | | $ | 0 | | | $ | (71 | ) | | $ | 202 | |
December 31, 2013 | | $ | 202 | | | $ | 56 | | | $ | 0 | | | $ | (58 | ) | | $ | 200 | |
3. List of Exhibits
The following is a list of exhibits required by Item 601 of Regulation S-K filed as part of this Report. Where so indicated, exhibits that were previously filed are incorporated by reference. For exhibits incorporated by reference, the location of the exhibit in the previous filing is indicated in parentheses.
Exhibit Number | | Document |
| | |
3.1.1 | | Restated Certificate of Incorporation of the Company (incorporated by reference to Exhibit 2.1 to the Company’s Registration Statement on Form 8-A, filed August 4, 1999 (File No. 000-26989)). |
| | |
3.1.2 | | Certificate of Amendment of Restated Certificate of Incorporation of the Company (incorporated by reference to Exhibit 3.3 to the Company’s Annual Report on Form 10-K for the year ended December 31, 2002, filed March 31, 2003 (File No. 001-16249)). |
| | |
3.1.3 | | Second Amendment of Restated Certificate of Incorporation of the Company (incorporated by reference to Exhibit 3.1 to the Company’s Quarterly Report on Form 10-Q for the quarter ended June 30, 2004, filed August 9, 2004 (File No. 001-16249)). |
| | |
3.1.4 | | Third Amendment of Restated Certificate of Incorporation of the Company (incorporated by reference to Exhibit 3.1 to the Company’s Current Report on Form 8-K, filed June 22, 2011 (File No. 001-16249)). |
| | |
3.2 | | Second Amended and Restated By-laws of the Company (incorporated by reference to Exhibit 3.1 to the Company’s Current Report on Form 8-K, filed April 13, 2012 (File No. 001-16249)). |
| | |
4.1 | | Form of Certificate for Company Common Stock (incorporated by reference to Exhibit 4.1 to the Company’s Annual Report on Form 10-K/A for the year ended December 31, 2010, filed June 24, 2011 (File No. 001-16249)). |
| | |
10.1 | | Fifth Amended and Restated 2005 Omnibus Equity Compensation Plan of the Company (incorporated by reference to Exhibit 10.5 to the Company’s Current Report on Form 8-K, filed March 4, 2014 (File No. 001-16249)).* |
| | |
10.2 | | ICG Amended and Restated Non-Management Director Compensation Plan (incorporated by reference to Exhibit 10.3 to the Company’s Annual Report on Form 10-K/A for the year ended December 31, 2010, filed June 24, 2011 (File No. 001-16249)).* |
| | |
10.3 | | Amended and Restated Director Deferred Stock Unit Program of the Company (incorporated by reference to Exhibit 10.4 to the Company’s Annual Report on Form 10-K/A for the year ended December 31, 2010, filed June 24, 2011 (File No. 001-16249)).* |
| | |
10.4.1 | | ICG 2013 Performance Plan (incorporated by reference to Exhibit 10.1 to the Company’s Current Report on Form 8-K, filed March 5, 2013 (File No. 001-16249)).* |
| | |
10.4.2 | | Form of Company Performance Plan Restricted Share Agreement (incorporated by reference to Exhibit 3.2 to the Company’s Current Report on Form 8-K, filed March 5, 2013 (File No. 001-16249)). |
| | |
10.5.1 | | ICG 2014 Performance Plan (incorporated by reference to Exhibit 10.1 to the Company’s Current Report on Form 8-K, filed March 4, 2014 (File No. 001-16249)).* |
| | |
10.5.2 | | Form of Company Performance Plan Restricted Share Agreement (incorporated by reference to Exhibit 10.2 to the Company’s Current Report on Form 8-K, filed March 4, 2014 (File No. 001-16249)). |
| | |
10.6 | | Form of Company Restricted Share Agreement Without Performance Acceleration (incorporated by reference to Exhibit 10.8 to the Company’s Annual Report on Form 10-K/A for the year ended December 31, 2010, filed June 24, 2011 (File No. 001-16249)).* |
| | |
10.7 | | Form of Company Non-Management Director Restricted Share Agreement (incorporated by reference to Exhibit 10.9 to the Company’s Annual Report on Form 10-K/A for the year ended December 31, 2010, filed June 24, 2011 (File No. 001-16249)).* |
| | |
10.8 | | Form of Company Stock Unit Award Agreement (incorporated by reference to Exhibit 10.15 to the Company’s Annual Report on Form 10-K/A for the year ended December 31, 2010, filed June 24, 2011 (File No. 001-16249)).* |
| | |
Exhibit Number | | Document |
| | |
10.9 | | Form of Company Stock Appreciation Right Certificate (incorporated by reference to Exhibit 10.16 to the Company’s Annual Report on Form 10-K/A for the year ended December 31, 2010, filed June 24, 2011 (File No. 001-16249)).* |
| | |
10.10 | | Form of Company Non-Employee Director Stock Appreciation Right Certificate (incorporated by reference to Exhibit 10.17 to the Company’s Annual Report on Form 10-K/A for the year ended December 31, 2010, filed June 24, 2011 (File No. 001-16249)).* |
| | |
10.11.1 | | Employment Agreement, dated February 28, 2007, by and among Internet Capital Group Operations, Inc., the Company and Walter W. Buckley, III (incorporated by reference to Exhibit 10.1 to the Company’s Current Report on Form 8-K, filed March 5, 2007 (File No. 001-16249)).* |
| | |
10.11.2 | | Amendment 2008-1 to the Employment Agreement, dated as of December 18, 2008, by and between Internet Capital Group Operations, Inc. and Walter W. Buckley, III (incorporated by reference to Exhibit 10.2 to the Company’s Current Report on Form 8-K, filed December 18, 2008 (File No. 001-16249)).* |
| | |
10.11.3 | | Amendment 2010-1 to the Employment Agreement, dated as of June 18, 2010, by and between Internet Capital Group Operations, Inc. and Walter W. Buckley, III (incorporated by reference to Exhibit 10.2 to the Company’s Current Report on Form 8-K, filed June 24, 2010 (File No. 001-16249)).* |
| | |
10.11.4 | | Amendment 2014-1 to the Employment Agreement, dated as of February 28, 2014, by and between Internet Capital Group Operations, Inc. and Walter W. Buckley, III (incorporated by reference to Exhibit 10.3 to the Company’s Current Report on Form 8-K, filed March 4, 2014 (File No. 001-16249)).* |
| | |
10.12 | | Restricted Share Agreement dated as of October 4, 2011 by and among the Company, Internet Capital Group Operations, Inc. and Walter W. Buckley, III (incorporated by reference to Exhibit 10.1 to the Company’s Quarterly Report on Form 10-Q for the quarter ended September 30, 2011, filed November 8, 2011 (File No. 001-16249)).* |
| | |
10.13 | | Amended and Restated Letter Agreement, dated October 6, 2011, by and between the Company and R. Kirk Morgan (incorporated by reference to Exhibit 10.1 to the Company’s Current Report on Form 8-K, filed October 7, 2011 (File No. 001-16249)).* |
| | |
10.14.1 | | Employment Agreement, dated April 18, 2007, by and between the Company and Douglas A. Alexander (incorporated by reference to Exhibit 10.1 to the Company’s Current Report on Form 8-K, filed April 18, 2007 (File No. 001-16249)).* |
| | |
10.14.2 | | Amendment 2008-1 to the Employment Agreement, dated as of December 18, 2008, by and between Internet Capital Group Operations, Inc. and Douglas A. Alexander (incorporated by reference to Exhibit 10.3 to the Company’s Current Report on Form 8-K, filed December 18, 2008 (File No. 001-16249)).* |
| | |
10.14.3 | | Amendment 2010-1 to the Employment Agreement, dated as of June 18, 2010, by and between Internet Capital Group Operations, Inc. and Douglas A. Alexander (incorporated by reference to Exhibit 10.3 to the Company’s Current Report on Form 8-K, filed June 24, 2010 (File No. 001-16249)).* |
| | |
10.14.4 | | Amendment 2014-1 to the Employment Agreement, dated as of February 28, 2014, by and between Internet Capital Group Operations, Inc. and Douglas A. Alexander (incorporated by reference to Exhibit 10.4 to the Company’s Current Report on Form 8-K, filed March 4, 2014 (File No. 001-16249)).* |
| | |
10.15 | | Restricted Share Agreement dated as of October 4, 2011 by and among the Company, Internet Capital Group Operations, Inc. and Douglas Alexander (incorporated by reference to Exhibit 10.2 to the Company’s Quarterly Report on Form 10-Q for the quarter ended September 30, 2011, filed November 8, 2011 (File No. 001-16249)).* |
| | |
10.16 | | Form of Executive Restricted Share Agreement (incorporated by reference to Exhibit 10.6 to the Company’s Current Report on Form 8-K, filed March 4, 2014 (File No. 001-16249)). |
| | |
10.17 | | Form of Restrictive Covenant Agreement (incorporated by reference to Exhibit 10.4 to the Company’s Current Report on Form 8-K, filed July 28, 2005 (File No. 001-16249)).* |
Exhibit Number | | Document |
| | |
| | |
10.18 | | Form of Agreement of Limited Partnership for the Company’s Carried Interest Long-Term Incentive Plan (incorporated by reference to Exhibit 10.2 to the Company’s Current report on Form 8-K, filed December 13, 2007 (File No. 001-16249)).* |
| | |
10.19 | | Form of Limited Partnership Interest Grant (incorporated by reference to Exhibit 10.3 to the Company’s Current Report on Form 8-K, filed December 13, 2007 (File No. 001-16249)).* |
| | |
10.20 | | Company Compensation Clawback Policy (incorporated by reference to Exhibit 10.26 to the Company’s Annual Report on Form 10-K/A for the year ended December 31, 2010, filed June 24, 2011 (File No. 001-16249)).* |
| | |
10.21 | | Agreement and Plan of Merger, dated as of October 2, 2013, by and among Procurian, ICG, Internet Capital Group Operations, Inc. (as Stakeholder Representative), Accenture Sub Inc. and Peregrine Merger Sub, Inc. (incorporated by reference to Exhibit 10.1 to the Company’s Current Report on Form 8-K, filed October 3, 2013 (File No. 001-16249)). |
| | |
10.22 | | Executive Lease Agreement, dated as of July 26, 2012, by and among Channel Intelligence, Inc., CIML, LLC, Internet Capital Group Operations, Inc., ICG Group, Inc. and Douglas Alexander (incorporated by reference to Exhibit 10.1 to the Company’s Current Report on Form 8-K, filed July 26, 2012 (File No. 001-16249)). |
| | |
10.23 | | Amended and Restated CIML, LLC 2012 Profits Interest Plan, effective as of September 19, 2012 (incorporated by reference to Exhibit 10.2 to the Company’s Quarterly Report on Form 10-Q for the quarter ended September 30, 2012, filed November 9, 2012 (File No. 001-16249)). |
| | |
10.24 | | CIML, LLC 2012 Profits Interest Plan Restricted Unit Award Agreement, dated as of July 26, 2012, between CIML, LLC and Douglas Alexander (incorporated by reference to Exhibit 10.3 to the Company’s Current Report on Form 8-K, filed July 26, 2012 (File No. 001-16249)). |
| | |
11.1 | | Statement Regarding Computation of Per Share Earnings (included herein at Note 2-“Significant Accounting Policies” in the subsection “Net Income (Loss) Per Share” to the Consolidated Financial Statements and Note 15-“Net Income (Loss) Per Share” to the Consolidated Financial Statements). |
| | |
14.1 | | Company Corporate Code of Conduct (incorporated by reference to Exhibit 14.1 to the Company’s Current Report on Form 8-K, filed June 22, 2011 (File No. 001-16249)). |
| | |
21.1 | | Subsidiaries of ICG Group, Inc. (filed herewith). |
| | |
23.1 | | Consent of KPMG LLP (filed herewith). |
| |
31.1 | | Certification of Chief Executive Officer required by Section 302 of the Sarbanes-Oxley Act of 2002 (filed herewith). |
| | |
31.2 | | Certification of Chief Financial Officer required by Section 302 of the Sarbanes-Oxley Act of 2002 (filed herewith). |
| | |
32.1 | | Certification of the Chief Executive Officer required by Section 906 of the Sarbanes-Oxley Act of 2002 (filed herewith). |
| | |
32.2 | | Certification of the Chief Financial Officer required by Section 906 of the Sarbanes-Oxley Act of 2002 (filed herewith). |
| | |
99.1 | | Lease dated February 28, 2012 between Radnor Properties-555 LA, L.P. and Internet Capital Group Operations, Inc. (incorporated by reference to Exhibit 99.4 to the Company’s Annual Report on Form 10-K for the year ended December 31, 2011, filed March 15, 2012 (File No. 001-16249)). |
| | |
99.2 | | Assignment and Consent dated February 28, 2012 among Crawford Advisors, LLC, Internet Capital Group Operations, Inc. and Radnor Properties-555 LA, L.P. (incorporated by reference to Exhibit 99.5 to the Company’s Annual Report on Form 10-K for the year ended December 31, 2011, filed March 15, 2012 (File No. 001-16249)). |
| | |
Exhibit Number | | Document |
| | |
101.0 | | The following financial information formatted in eXtensible Business Reporting Language (XBRL) from the Company’s Annual Report on Form 10-K for the year ended December 31, 2013, filed March 17, 2014: (i) Consolidated Balance Sheets, (ii) Consolidated Statements of Operations and Comprehensive Income (Loss), (iii) Consolidated Statements of Changes in Equity, (iv) Consolidated Statements of Cash Flows and (v) Notes to Consolidated Financial Statements.** |
| | |
| | |
* | Management contract or compensatory plan or arrangement. |
** | Filed herewith. |
SIGNATURES
Pursuant to the requirements of Section 13 or 15(d) of the Securities Exchange Act of 1934, the Company has duly caused this Report to be signed on its behalf by the undersigned, thereunto duly authorized.
Date: March 17, 2014 | | | ICG GROUP, INC. |
| | | | |
| | | By: | | /s/ R. KIRK MORGAN |
| | | Name: | | R. Kirk Morgan |
| | | Title: | | Chief Financial Officer |
Pursuant to the requirements of the Securities Exchange Act of 1934, this Report has been signed below by the following persons on behalf of the Company and in the capacities indicated, and on the date set forth above.
Signature | | Title |
/s/ WALTER W. BUCKLEY, III | | Chief Executive Officer and Chairman of the Board of Directors |
Walter W. Buckley, III | | (Principal Executive Officer) |
/s/ R. KIRK MORGAN | | Chief Financial Officer |
R. Kirk Morgan | | (Principal Financial and Accounting Officer) |
/s/ DAVID J. ADELMAN | | Director |
David J. Adelman | | |
/s/ DAVID J. BERKMAN | | Director |
David J. Berkman | | |
/s/ THOMAS A. DECKER | | Director |
Thomas A. Decker | | |
/s/ DAVID K. DOWNES | | Director |
David K. Downes | | |
/s/ THOMAS P. GERRITY | | Director |
Thomas P. Gerrity | | |
/s/ MICHAEL J. HAGAN | | Director |
Michael J. Hagan | | |
/s/ PETER K. MILLER | | Director |
Peter K. Miller | | |
/s/ PHILIP J. RINGO | | Director |
Philip J. Ringo | | |