
Annual Shareholders’ Meeting May 16, 2013
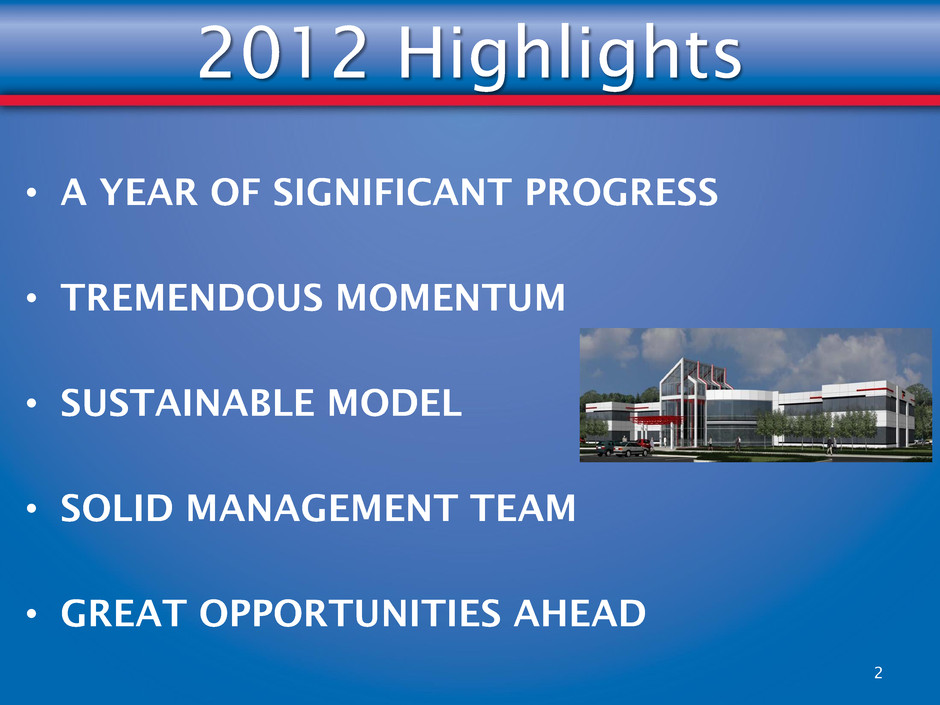
2012 Highlights • A YEAR OF SIGNIFICANT PROGRESS • TREMENDOUS MOMENTUM • SUSTAINABLE MODEL • SOLID MANAGEMENT TEAM • GREAT OPPORTUNITIES AHEAD 2

The Model • Manage for Growth and Profitability • Deliver AMAZING Service • Fund Loan Growth through Strong Deposit Growth • Maintain Low Risk Profile • Continue to Increase Shareholder Value 3
Experienced Management Team Gary L. Nalbandian- Chairman/President/CEO Mark A. Zody, CPA – Chief Financial Officer Percival B. Moser – Chief Operating Officer James R. Ridd – Chief Credit Officer Adam L. Metz – Chief Lending Officer Steven W. Cribbs – Chief Risk Officer 4

#3 in Market Share – Harrisburg Metro Area Bank Deposits ($ in 000’s) % of Market Share # of Stores PNC $ 1,692,684 14.67% 27 M & T 1,496,082 12.97% 26 1,266,981 10.98% 16 Wells Fargo 1,066,204 9.24% 10 Orrstown 817,052 7.08% 14 Susquehanna 697,105 6.04% 18 Fulton 651,492 5.65% 14 Mid Penn 545,071 4.72% 12 Integrity Bank 487,412 4.22% 4 5 Source: 6/30/12 FDIC Deposit Market Share Report – www3.fdic.gov
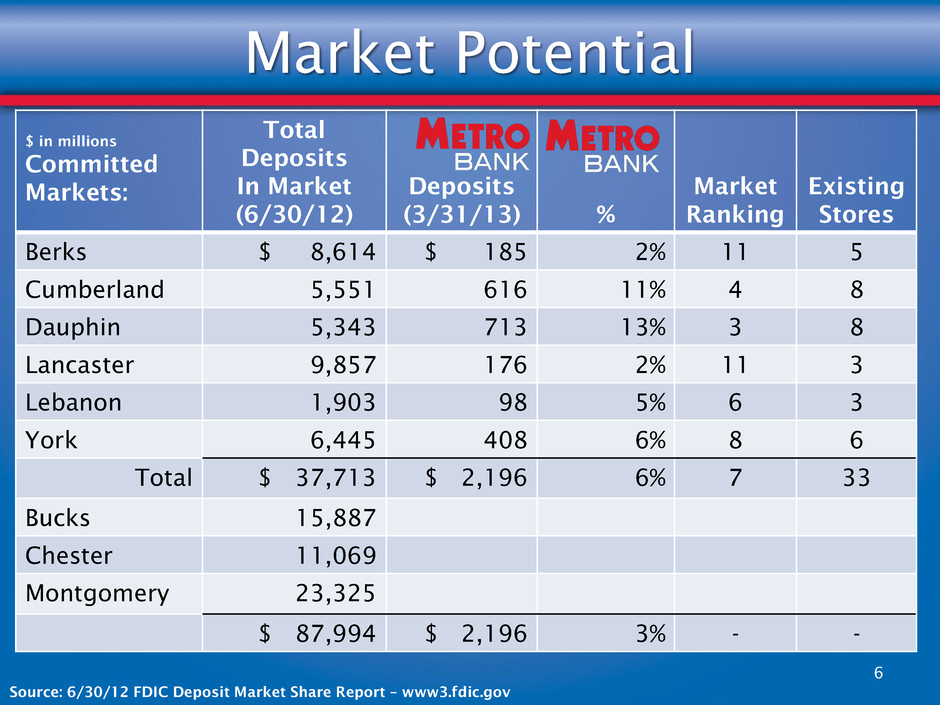
Market Potential 6 $ in millions Committed Markets: Total Deposits In Market (6/30/12) Deposits (3/31/13) % Market Ranking Existing Stores Berks $ 8,614 $ 185 2% 11 5 Cumberland 5,551 616 11% 4 8 Dauphin 5,343 713 13% 3 8 Lancaster 9,857 176 2% 11 3 Lebanon 1,903 98 5% 6 3 York 6,445 408 6% 8 6 Total $ 37,713 $ 2,196 6% 7 33 Bucks 15,887 Chester 11,069 Montgomery 23,325 $ 87,994 $ 2,196 3% - - Source: 6/30/12 FDIC Deposit Market Share Report – www3.fdic.gov
FINANCIAL REVIEW

Forward-Looking Statements This document contains projections and other forward-looking statements regarding future events, strategic corporate objectives or the future financial performance of Metro. We wish to caution you that these forward-looking statements may differ materially from actual results due to a number of risks and uncertainties. For a more detailed description of the factors that may affect Metro’s operating results, we refer you to our filings with the Securities and Exchange Commission, including our annual report on Form 10-K for the year ended December 31, 2012 and our quarterly report on Form 10-Q for the quarter ended March 31, 2013 and our current reports on Form 8-K filed on January 25, 2013, February 11, 2013, February 26, 2013 and April 22, 2013. Metro assumes no obligation to update the forward-looking statements made during this presentation. For more information please visit our Website at: www.mymetrobank.com. 8
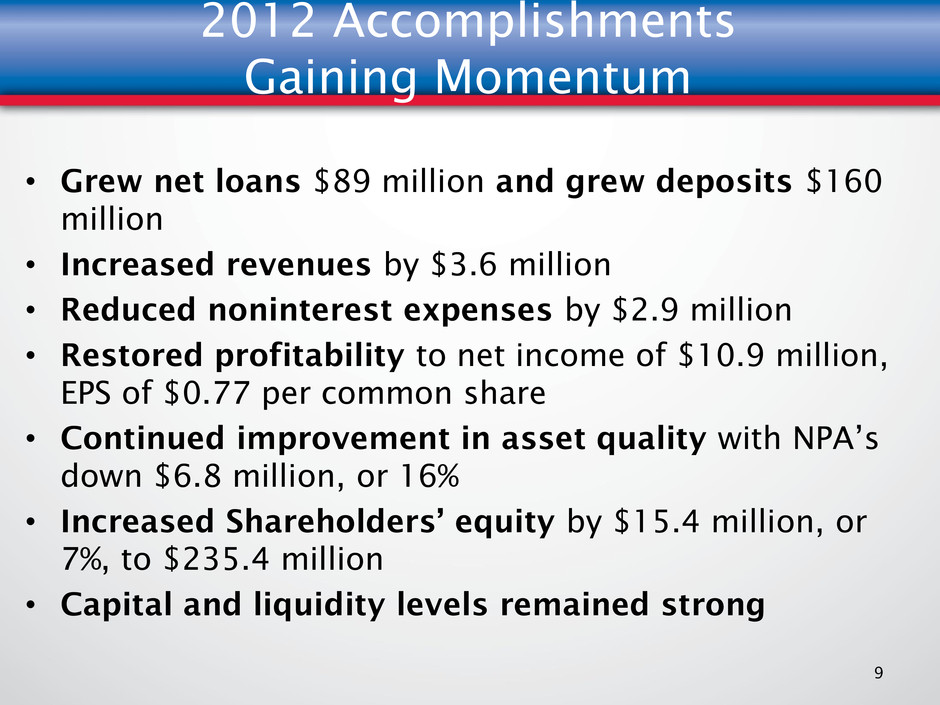
2012 Accomplishments Gaining Momentum • Grew net loans $89 million and grew deposits $160 million • Increased revenues by $3.6 million • Reduced noninterest expenses by $2.9 million • Restored profitability to net income of $10.9 million, EPS of $0.77 per common share • Continued improvement in asset quality with NPA’s down $6.8 million, or 16% • Increased Shareholders’ equity by $15.4 million, or 7%, to $235.4 million • Capital and liquidity levels remained strong 9
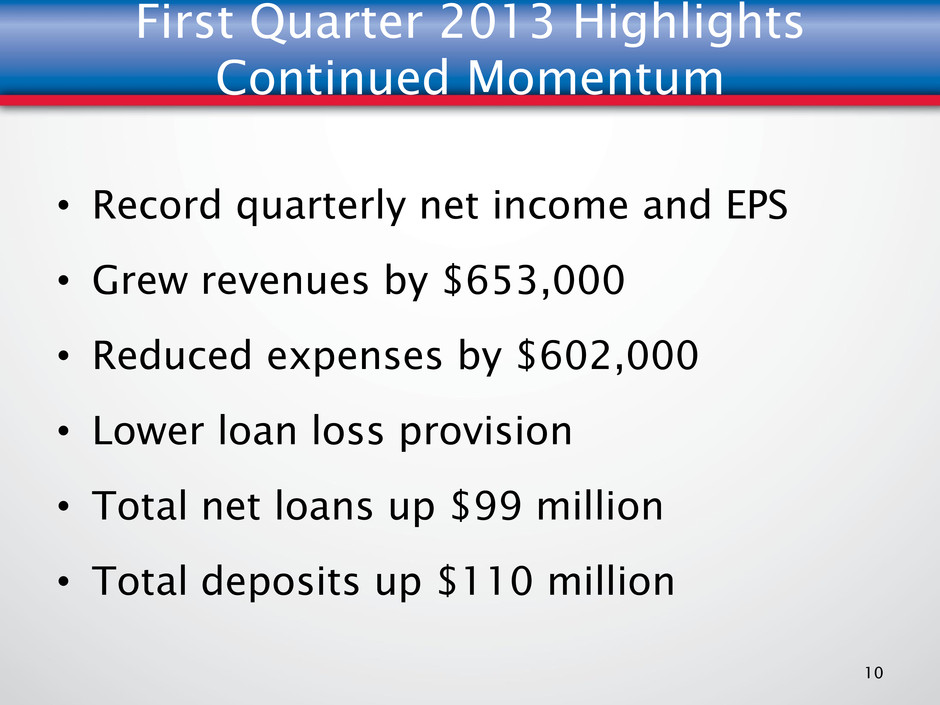
First Quarter 2013 Highlights Continued Momentum 10 • Record quarterly net income and EPS • Grew revenues by $653,000 • Reduced expenses by $602,000 • Lower loan loss provision • Total net loans up $99 million • Total deposits up $110 million
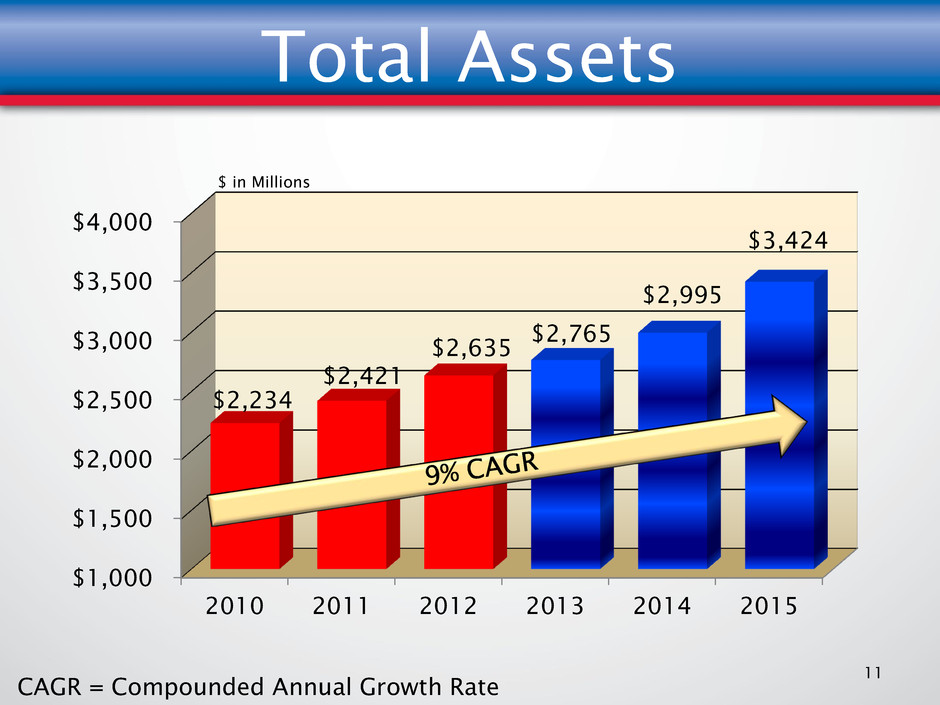
Total Assets $1,000 $1,500 $2,000 $2,500 $3,000 $3,500 $4,000 2010 2011 2012 2013 2014 2015 $2,234 $2,421 $2,635 $2,765 $2,995 $3,424 11 $ in Millions CAGR = Compounded Annual Growth Rate

Total Deposits $1,000 $1,500 $2,000 $2,500 $3,000 2010 2011 2012 2013 2014 2015 $1,832 $2,072 $2,231 $2,347 $2,573 $2,846 12 $ in Millions
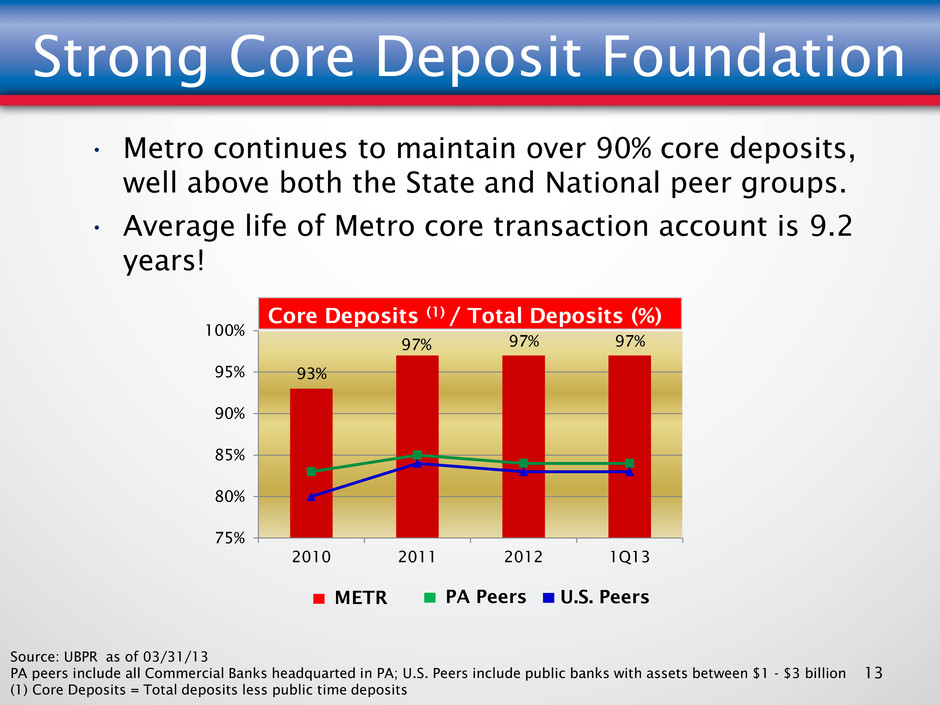
Strong Core Deposit Foundation 13 93% 97% 97% 97% 75% 80% 85% 90% 95% 100% 2010 2011 2012 1Q13 Source: UBPR as of 03/31/13 PA peers include all Commercial Banks headquarted in PA; U.S. Peers include public banks with assets between $1 - $3 billion (1) Core Deposits = Total deposits less public time deposits • Metro continues to maintain over 90% core deposits, well above both the State and National peer groups. • Average life of Metro core transaction account is 9.2 years! Core Deposits (1) / Total Deposits (%) METR PA Peers U.S. Peers

DDA Non-Interest Bearing, $493,640 22% DDA & NOW Interest Bearing, $828,015 38% MMDA & Savings, $698,850 32% Retail Time, $134,359 6% Public Time, $53,407 2% Average Deposits per store = $63.2 million Source: Deposit data per company reports as of 03/31/13; Dollar figures in thousands Core Deposit Mix 14
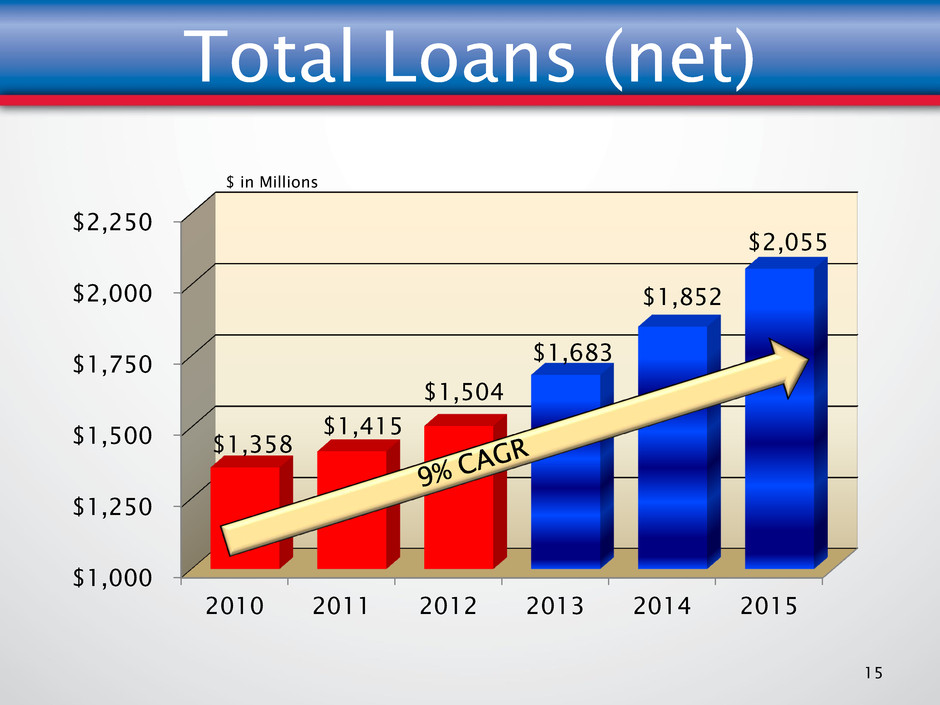
Total Loans (net) $1,000 $1,250 $1,500 $1,750 $2,000 $2,250 2010 2011 2012 2013 2014 2015 $1,358 $1,415 $1,504 $1,683 $1,852 $2,055 15 $ in Millions

Consistent, Quality Loan Growth $1,200 $1,300 $1,400 $1,500 $1,600 Q1 2012 Q2 2012 Q3 2012 Q4 2012 Q1 2013 $1,373 $1,401 $1,417 $1,445 $1,493 $99 $91 $88 $83 $81 All Other Classified Loans 16 $ in Millions • Non classified loans up 9% • Classified loans down 18%
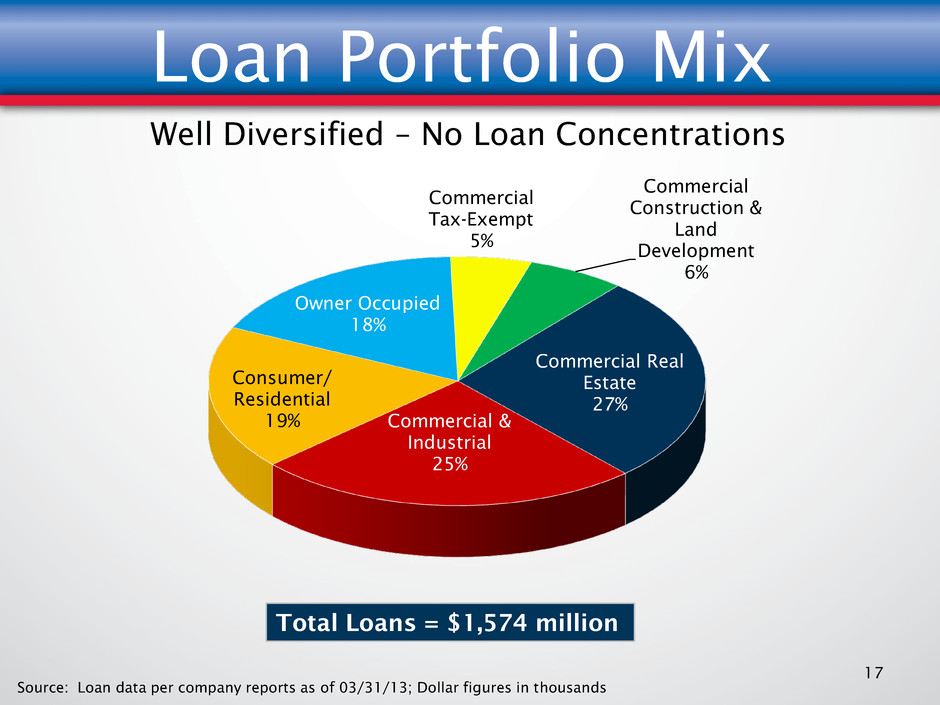
Commercial Real Estate 27% Commercial & Industrial 25% Consumer/ Residential 19% Owner Occupied 18% Commercial Tax-Exempt 5% Commercial Construction & Land Development 6% Total Loans = $1,574 million Source: Loan data per company reports as of 03/31/13; Dollar figures in thousands Loan Portfolio Mix 17 Well Diversified – No Loan Concentrations

1-4 Family Construction, 5% Commercial Construction, 3% Residential Development & Land, 8% Commercial Development & Land, 3% 1-4 Family Rental, 16% Multi-Family, 16% Commercial - Income Producing Properties, 49% Source: Loan data per company reports as of 03/31/13; Dollar figures in thousands unless shown otherwise Real Estate & Construction Loans Office, 29% Warehouse/ Industrial, 7% Flex, 3% Stand Alone Retail, 10% Strip Center, 6% Self Storage, 2% Mobile Home Park, 1% Mixed Use, 6% Parking Facilities, 1% Lodging, 21% Farmland, 3% Other, 11% CRE and Construction & Development Loans Total Loans = $523 MM CRE – Income Producing Properties Total Loans = $256.4 MM 18
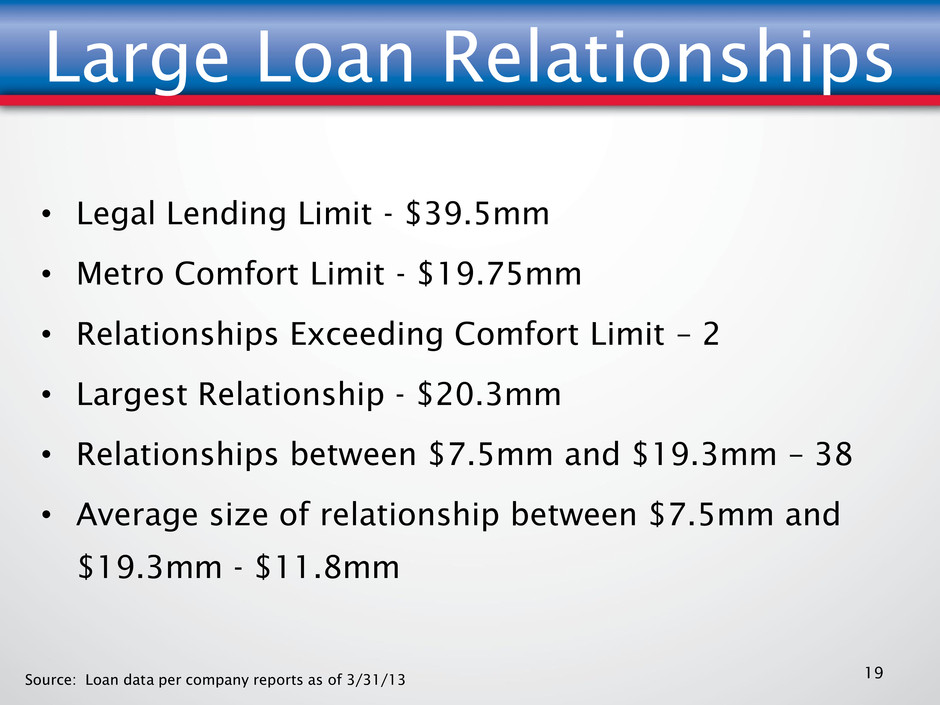
Large Loan Relationships • Legal Lending Limit - $39.5mm • Metro Comfort Limit - $19.75mm • Relationships Exceeding Comfort Limit – 2 • Largest Relationship - $20.3mm • Relationships between $7.5mm and $19.3mm – 38 • Average size of relationship between $7.5mm and $19.3mm - $11.8mm 19 Source: Loan data per company reports as of 3/31/13
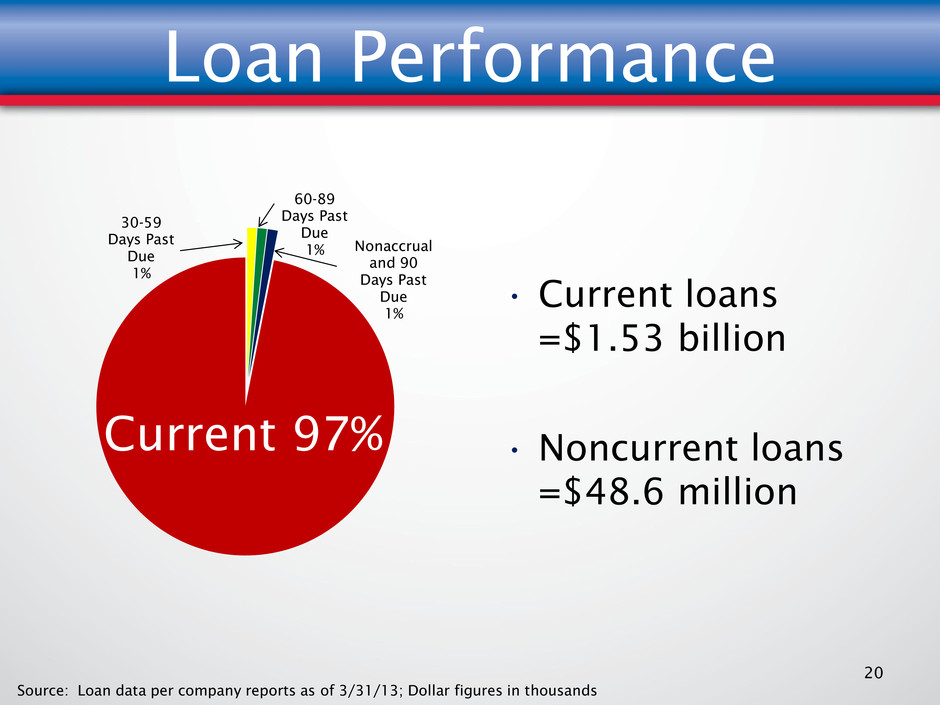
Source: Loan data per company reports as of 3/31/13; Dollar figures in thousands Loan Performance 20 30-59 Days Past Due 1% 60-89 Days Past Due 1% Nonaccrual and 90 Days Past Due 1% Current 97% • Current loans =$1.53 billion • Noncurrent loans =$48.6 million

Asset Quality and Loan Loss Reserve Trends 21 2.61% 3.83% 2.42% 2.13% 38% 41% 62% 77% 10% 20% 30% 40% 50% 60% 70% 80% 90% 1.00% 2.00% 3.00% 4.00% 5.00% 2009 2010 2011 2012 Non Performing Loans / Total Loans
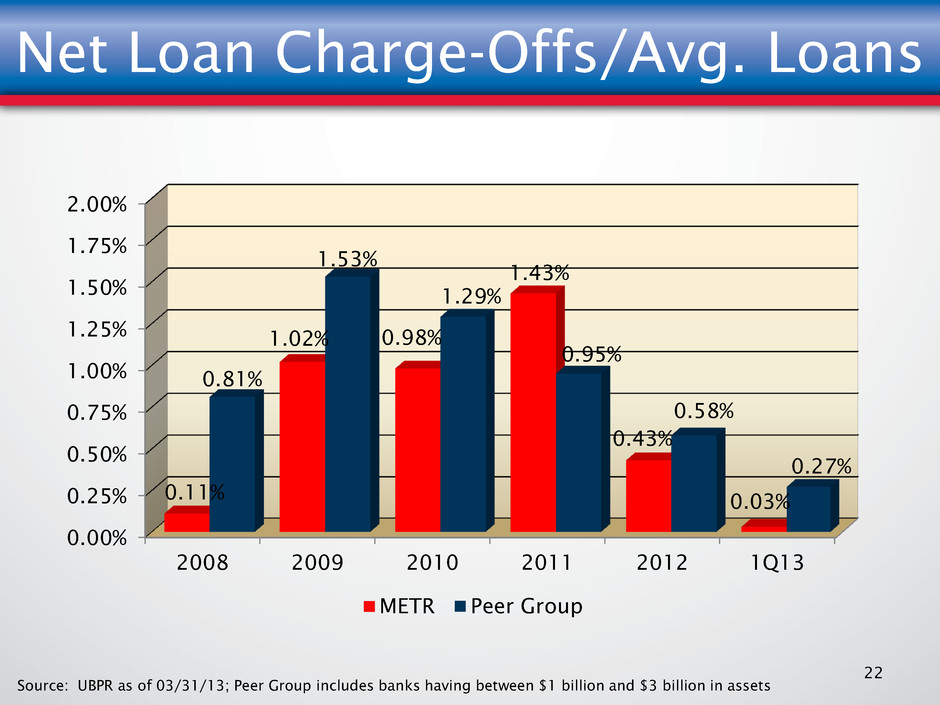
Net Loan Charge-Offs/Avg. Loans 0.00% 0.25% 0.50% 0.75% 1.00% 1.25% 1.50% 1.75% 2.00% 2008 2009 2010 2011 2012 1Q13 0.11% 1.02% 0.98% 1.43% 0.43% 0.03% 0.81% 1.53% 1.29% 0.95% 0.58% 0.27% METR Peer Group 22 Source: UBPR as of 03/31/13; Peer Group includes banks having between $1 billion and $3 billion in assets
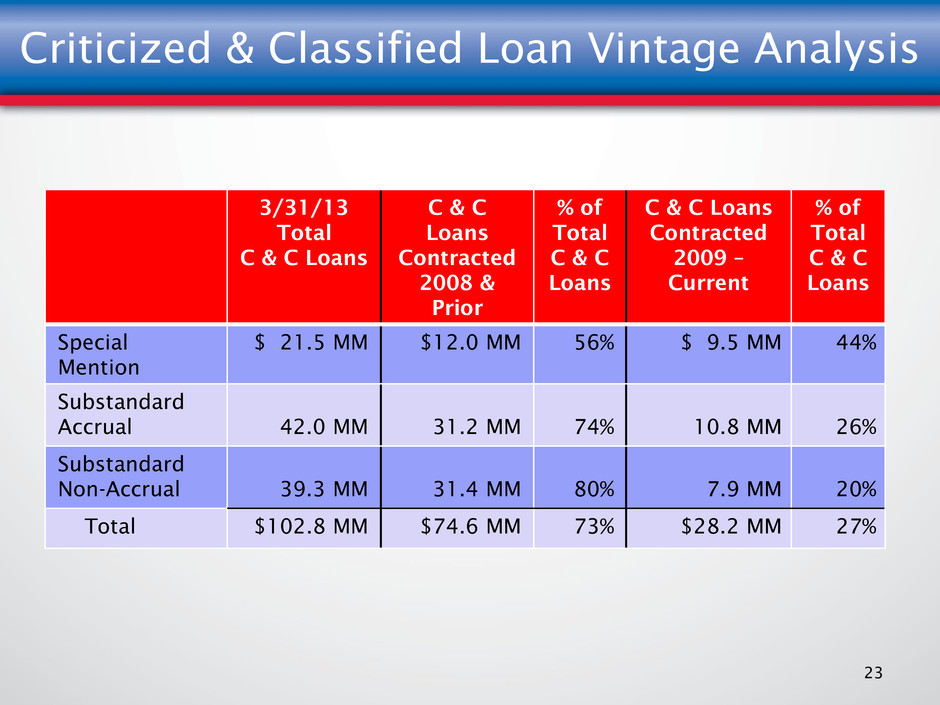
Criticized & Classified Loan Vintage Analysis 3/31/13 Total C & C Loans C & C Loans Contracted 2008 & Prior % of Total C & C Loans C & C Loans Contracted 2009 – Current % of Total C & C Loans Special Mention $ 21.5 MM $12.0 MM 56% $ 9.5 MM 44% Substandard Accrual 42.0 MM 31.2 MM 74% 10.8 MM 26% Substandard Non-Accrual 39.3 MM 31.4 MM 80% 7.9 MM 20% Total $102.8 MM $74.6 MM 73% $28.2 MM 27% 23
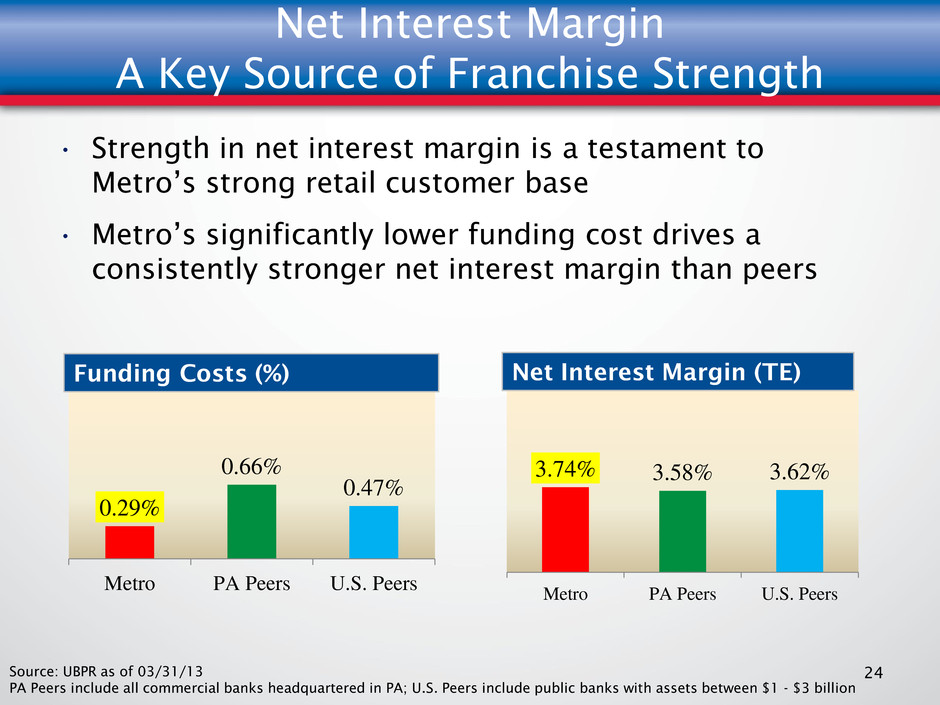
3.74% 3.58% 3.62% Metro PA Peers U.S. Peers Net Interest Margin A Key Source of Franchise Strength 24 • Strength in net interest margin is a testament to Metro’s strong retail customer base • Metro’s significantly lower funding cost drives a consistently stronger net interest margin than peers Source: UBPR as of 03/31/13 PA Peers include all commercial banks headquartered in PA; U.S. Peers include public banks with assets between $1 - $3 billion 0.29% 0.66% 0.47% Metro PA Peers U.S. Peers Net Interest Margin (TE) Funding Costs (%)

Net Interest Income Growth 3.25% 3.45% 3.65% 3.85% 4.05% 4.25% $21.0 $21.5 $22.0 $22.5 $23.0 Q1 2012 Q2 2012 Q3 2012 Q4 2012 Q1 2013 Net Interest Income Net Interest Margin (FTE) 3.25% 3.50% 3.75% 4.00% $80.0 $82.0 $84.0 $86.0 $88.0 2011 2012 Net Interest Income Net Interest Margin (FTE) 25 $ in Millions $ in Millions
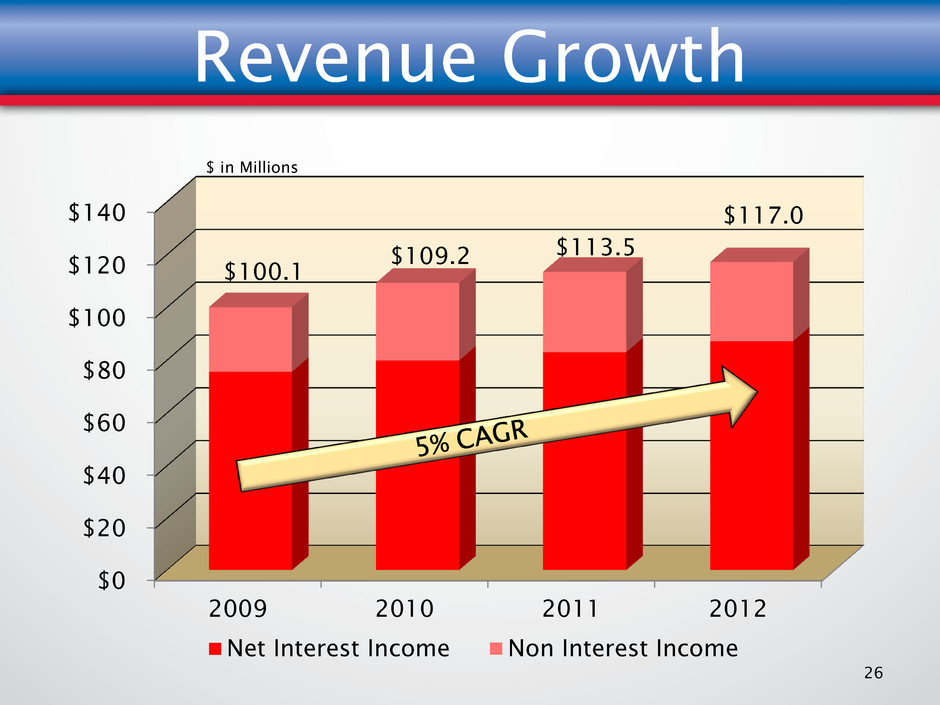
Revenue Growth $0 $20 $40 $60 $80 $100 $120 $140 2009 2010 2011 2012 Net Interest Income Non Interest Income 26 $ in Millions $100.1 $109.2 $113.5 $117.0
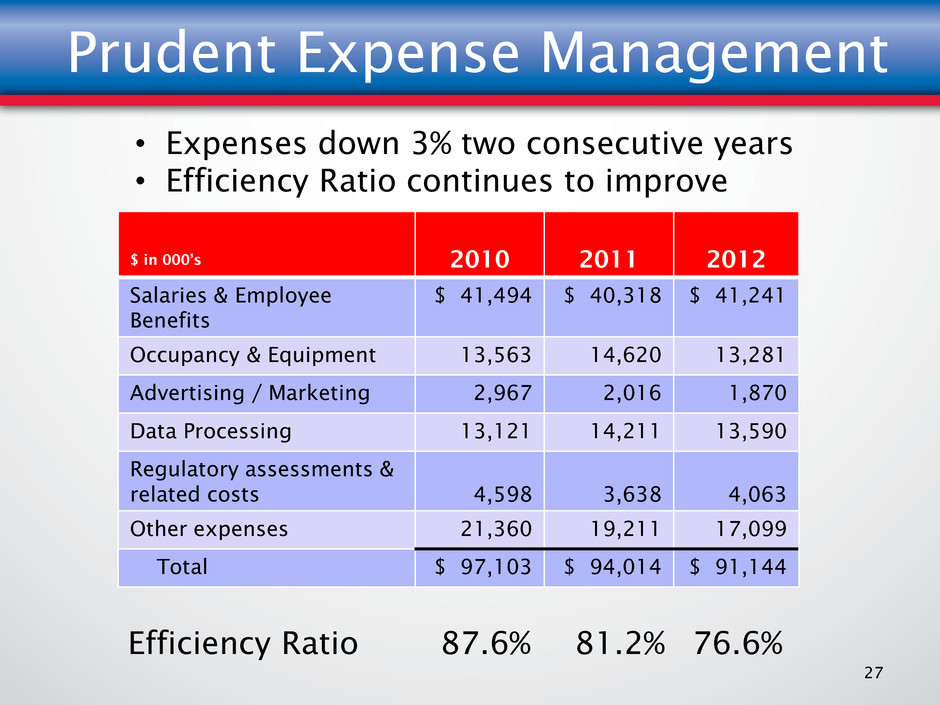
Prudent Expense Management $ in 000’s 2010 2011 2012 Salaries & Employee Benefits $ 41,494 $ 40,318 $ 41,241 Occupancy & Equipment 13,563 14,620 13,281 Advertising / Marketing 2,967 2,016 1,870 Data Processing 13,121 14,211 13,590 Regulatory assessments & related costs 4,598 3,638 4,063 Other expenses 21,360 19,211 17,099 Total $ 97,103 $ 94,014 $ 91,144 27 • Expenses down 3% two consecutive years • Efficiency Ratio continues to improve 87.6% Efficiency Ratio 81.2% 76.6%

Improved Profitability ($5,000) ($2,500) $0 $2,500 $5,000 $7,500 $10,000 $12,500 2010 2011 2012 1Q13 ($4,337) $289 $10,894 $3,645 28 Net Income (Loss) (2.09)% 0.13% 4.76% $ in 000’s 6.28% Return on Stockholders’ Equity
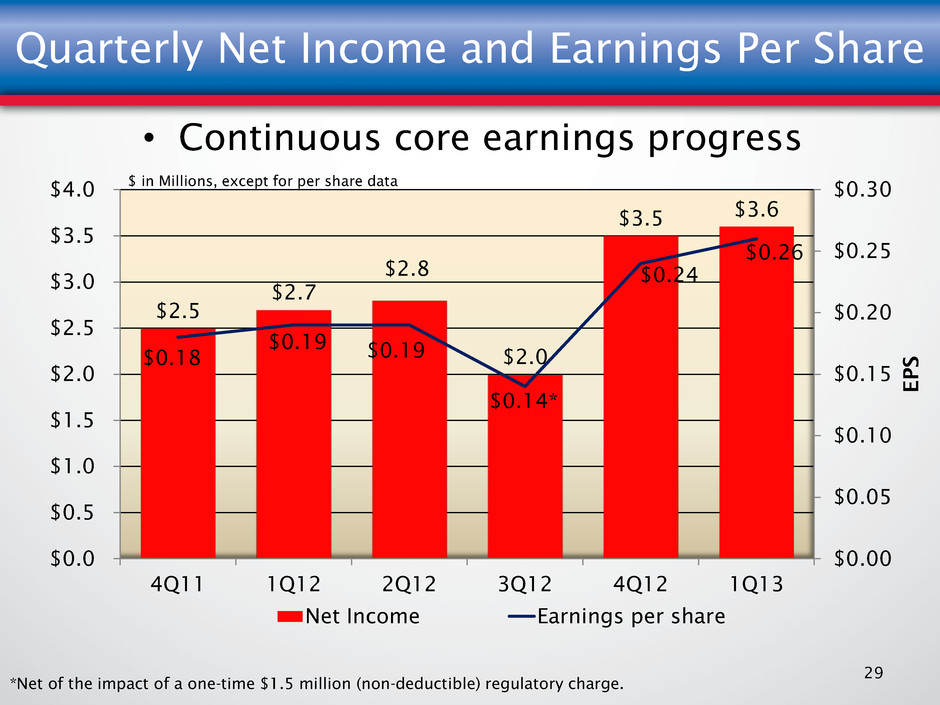
$2.5 $2.7 $2.8 $2.0 $3.5 $3.6 $0.18 $0.19 $0.19 $0.14* $0.24 $0.26 $0.00 $0.05 $0.10 $0.15 $0.20 $0.25 $0.30 $0.0 $0.5 $1.0 $1.5 $2.0 $2.5 $3.0 $3.5 $4.0 4Q11 1Q12 2Q12 3Q12 4Q12 1Q13 E P S Net Income Earnings per share Quarterly Net Income and Earnings Per Share 29 $ in Millions, except for per share data *Net of the impact of a one-time $1.5 million (non-deductible) regulatory charge. • Continuous core earnings progress

Strong Capital Position • Metro’s capital levels are far above the requirements for a well-capitalized bank • We have plenty of capital to leverage our growth 30 As of 3/31/13: Regulatory Minimums for Well Capitalized Metro Bancorp Consolidated Metro Bank Peer Group (1) Leverage Ratio 5.00% 9.40% 9.00% 9.59% Risk Based Tier 1 6.00% 13.94% 13.34% 14.12% Risk Based Total 10.00% 15.19% 14.60% 15.33% (1) Source: UBPR as of 03/31/13; Peer Group includes banks having between $1 billion and $3 billion in assets
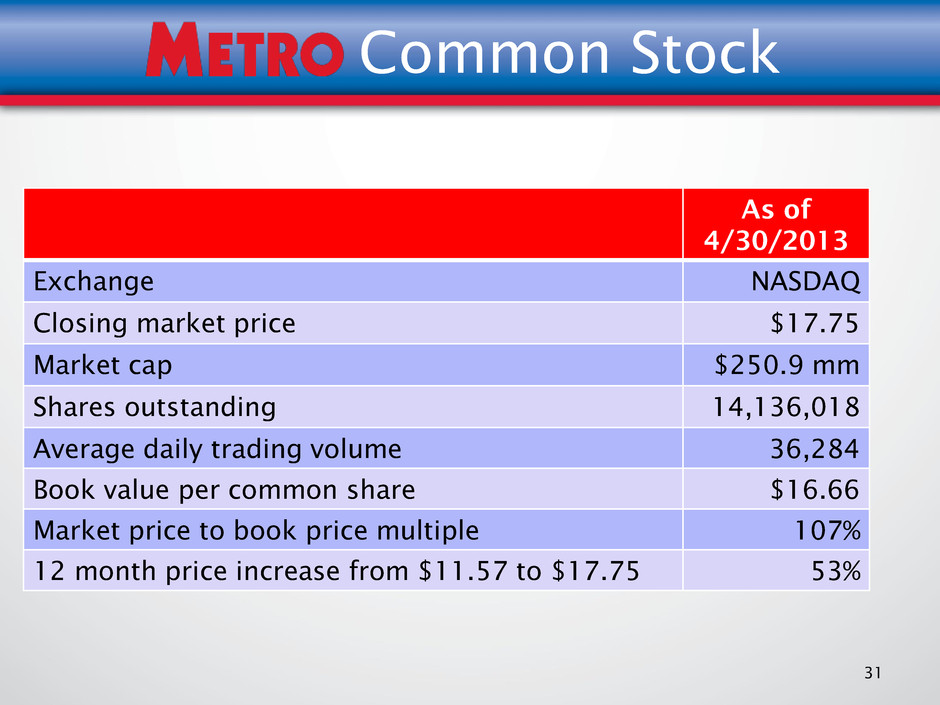
31 Common Stock As of 4/30/2013 Exchange NASDAQ Closing market price $17.75 Market cap $250.9 mm Shares outstanding 14,136,018 Average daily trading volume 36,284 Book value per common share $16.66 Market price to book price multiple 107% 12 month price increase from $11.57 to $17.75 53%
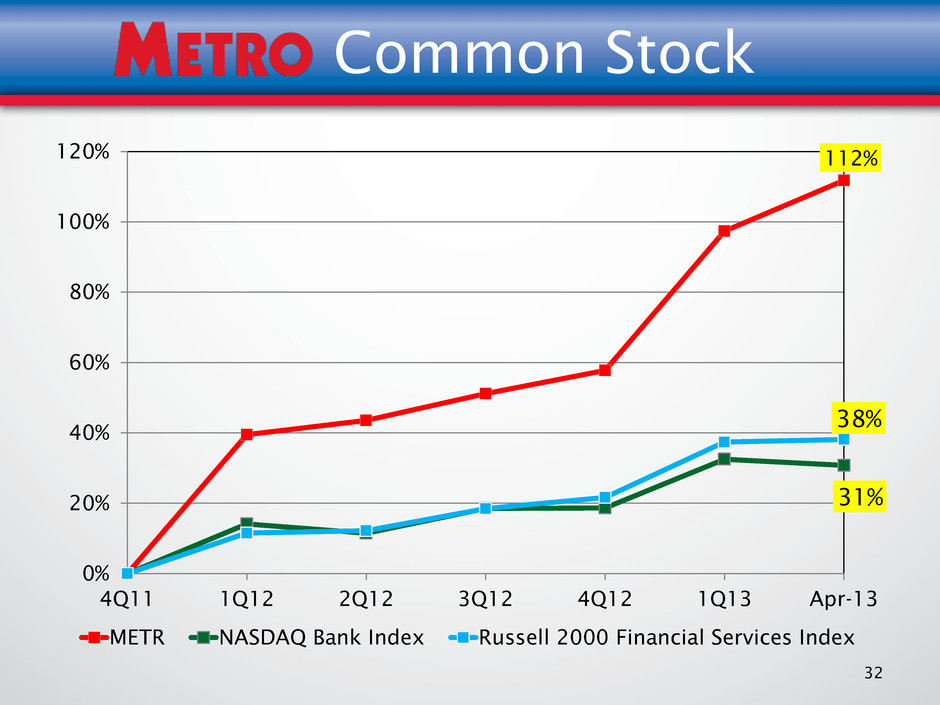
32 Common Stock 112% 31% 38% 0% 20% 40% 60% 80% 100% 120% 4Q11 1Q12 2Q12 3Q12 4Q12 1Q13 Apr-13 METR NASDAQ Bank Index Russell 2000 Financial Services Index
2013 and Beyond Enhance long-term shareholder value by: • Increasing revenue through loan growth, deposit growth and fee income growth • Growing market share – customers, households and share of wallet • Diligently managing asset quality as well as other enterprise risks • Improving EPS and ROE by increasing revenue, controlling expenses and managing capital 33

OUR FUTURE
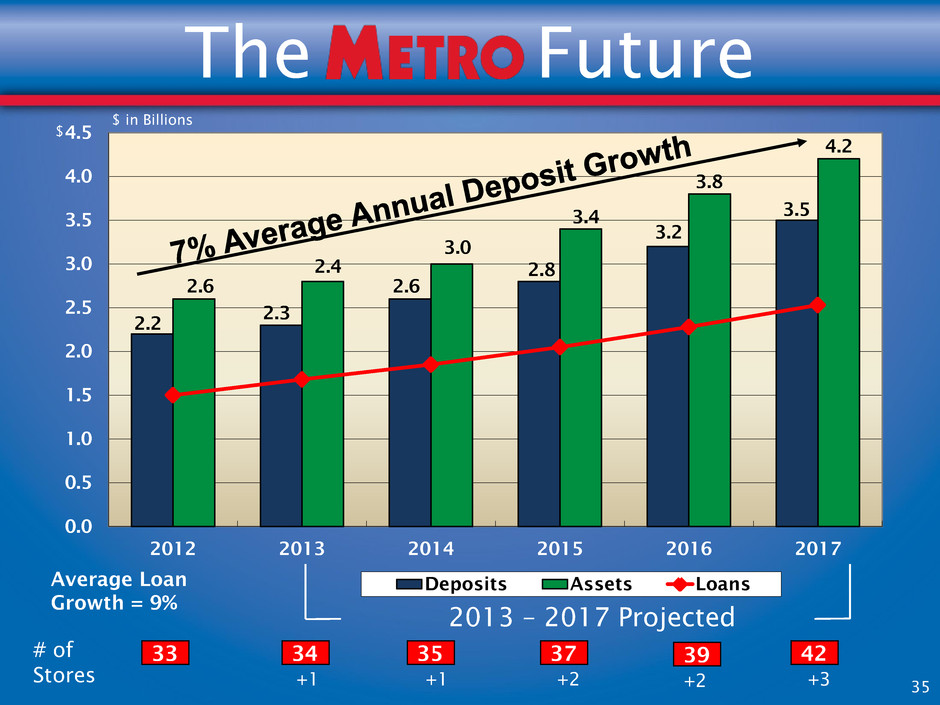
2.2 2.3 2.6 2.8 3.2 3.5 2.6 2.4 3.0 3.4 3.8 4.2 0.0 0.5 1.0 1.5 2.0 2.5 3.0 3.5 4.0 4.5 2012 2013 2014 2015 2016 2017 Deposits Assets Loans # of Stores 33 34 35 37 $ 2013 – 2017 Projected +1 +1 +2 $ in Billions 42 +3 39 +2 The Future 35 Average Loan Growth = 9%
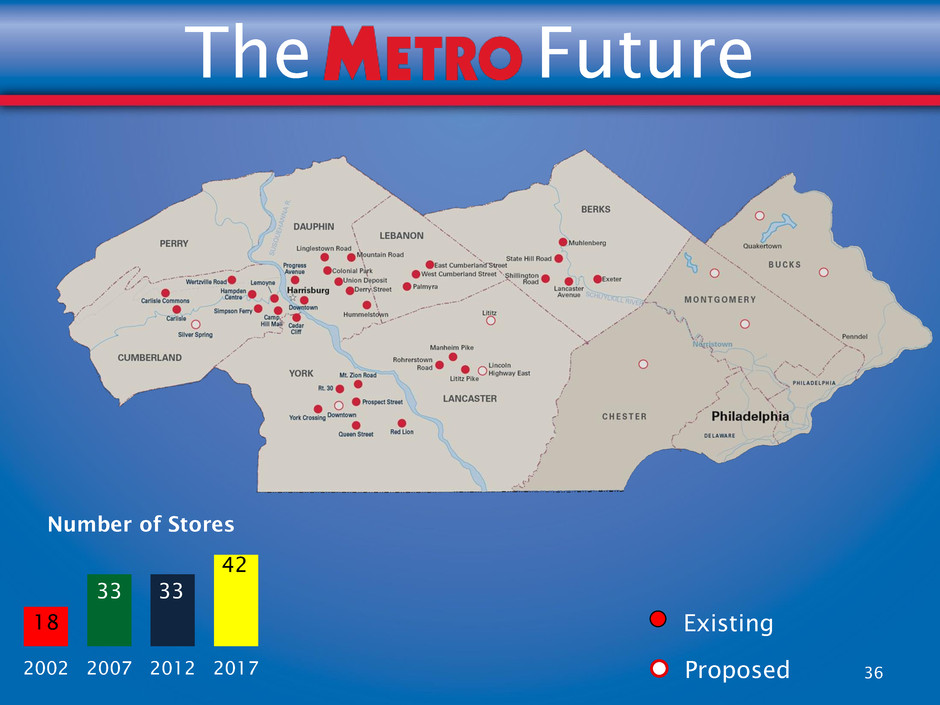
Existing Proposed The Future 36 18 33 33 42 2002 2007 2012 2017 Number of Stores
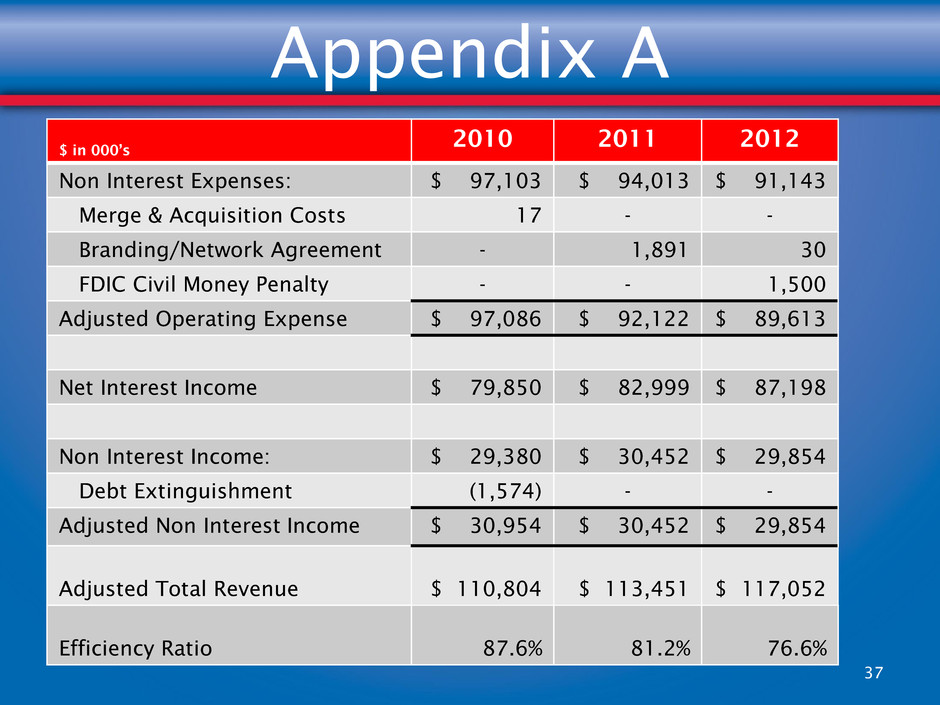
Appendix A $ in 000’s 2010 2011 2012 Non Interest Expenses: $ 97,103 $ 94,013 $ 91,143 Merge & Acquisition Costs 17 - - Branding/Network Agreement - 1,891 30 FDIC Civil Money Penalty - - 1,500 Adjusted Operating Expense $ 97,086 $ 92,122 $ 89,613 Net Interest Income $ 79,850 $ 82,999 $ 87,198 Non Interest Income: $ 29,380 $ 30,452 $ 29,854 Debt Extinguishment (1,574) - - Adjusted Non Interest Income $ 30,954 $ 30,452 $ 29,854 Adjusted Total Revenue $ 110,804 $ 113,451 $ 117,052 Efficiency Ratio 87.6% 81.2% 76.6% 37


