UNITED STATES SECURITIES AND EXCHANGE COMMISSION
Washington, D.C. 20549
FORM 8-K
Current Report
Pursuant to Section 13 or 15(d) of the Securities Exchange Act of 1934
October 26, 2006
Date of Report (Date of earliest event reported)
APEX CAPITAL GROUP, INC.
(Exact name of Registrant as specified in its charter)
Nevada | 000-27001 | 91-1939535 |
| (State or other jurisdiction of incorporation) | (Commission File Number) | (I.R.S. Employer File Number) |
No. 507 Royal Plaza, 21-1 Wenyi Road,
Shenhe District, Shenyang City, Liaoning Province, China, Postal Code 110000
(Address of principal executive offices)
(86) 24-31296178
(Registrant’s telephone number, including area code)
69930 Highway 111, Suite 100, Rancho Mirage, California 92270
(Former Name or Former Address, if Changed Since Last Report)
Check the appropriate box below if the filing of this Current Report on Form 8-K is intended to simultaneously satisfy the filing obligation of the registrant under any of the following provisions:
| o | Written communications pursuant to Rule 425 under the Securities Act (17 CFR 230.425) |
| o | Soliciting material pursuant to Rule 14a-12 under the Exchange Act (17 CFR 240.14a-12) |
| o | Pre-commencement communications pursuant to Rule 14d-2(b) under the Exchange Act (17 CFR 240.14d-2(b)) |
| o | Pre-commencement communications pursuant to Rule 13e-4(c) under the Exchange Act (17 CFR 240.13e-4(c)) |
Item 1.01. Entry into a Material Definitive Agreement.
On October 26, 2006, Apex Capital Group, Inc., a Wyoming Corporation (“Apex Wyoming”), and Apex Capital Group, Inc., a Nevada Corporation (“Apex”), entered into an Assignment and Assumption Agreement and Consent to Assignment (the “Assignment”) pursuant to which Apex Wyoming assigned to Apex all of its right, title, and interest in and to the Securities Exchange Agreement, dated as of September 6, 2006 (the “Securities Exchange Agreement”), by and between Apex Wyoming, Dempsey Mork, Elwin Group Limited, a British Virginia Islands corporation (“Elwin”), and Elwin’s shareholders. The Assignment is incorporated herein by reference and filed herewith as Exhibit 10.1. The Securities Exchange Agreement filed with our Current Report on Form 8-K filed on September 7, 2006 is incorporated herein by reference.
Item 2.01. Completion of an Acquisition or Disposition of Assets.
The information provided in Item 1.01 of this Current Report on Form 8-K is incorporated herein by reference. In addition, pursuant to Item 2.01(f) of Form 8-K, we are providing below the information that would be required if we were filing a general form for registration of securities on Form 10-SB.
For convenience in this report, unless indicated otherwise, "the company," "we," "us" and "our" refer to Apex and its consolidated subsidiaries, including our operating subsidiary, Shenyang Fangyuan Group Kangping Aluminum Factory Company Limited ("Kangping Aluminum").
FORWARD-LOOKING STATEMENTS
This report includes forward-looking statements relating to analyses and other information that are based on forecasts of future results and estimates of amounts not yet determinable. These statements also relate to future prospects, developments and business strategies. These forward looking statements are identified by their use of terms and phrases such as "anticipate," "believe," "could," "estimate," "expect," "intend," "may," "plan," "predict," "project," "should," "will" and similar terms and phrases, including references to assumptions. Such statements are based on current expectations, are inherently uncertain and are subject to changing assumptions.
Such forward-looking statements include, but are not limited to:
| · | estimates of the demand for high purity aluminum and the growth of the high purity aluminum market; |
| · | expectations of our ability to successfully covert our existing operations from the production of primary aluminum to high purity aluminum; |
| · | expectations as to the impact of increasing prices of raw materials and utilities used the production of high purity aluminum; |
| · | expectations about our ability to produce and successfully utilize our intellectual property rights; |
| · | expectations about our ability to retain key personnel; |
| · | expectations about the economic and political stability of China; |
| · | expectations regarding working capital trends and anticipated capital expenditures levels; |
| · | the availability of financial resources to fund our operations in 2006 and beyond; and |
| · | the impact of various market risks, including fluctuations in currency exchange rates, fluctuations in commodity prices and fluctuations in the market price of our common stock. |
Such forward looking statements involve known and unknown risks, uncertainties and other factors that may cause actual results to be materially different. Such factors include, but are not limited to, the following: changes in general economic and business conditions; changes in current pricing and cost levels; changes in political, social and economic conditions and local regulations in China; foreign currency fluctuations; reductions in sales to any significant customers; competition; disruptions of established supply channels; manufacturing capacity constraints; the availability, terms and deployment of capital; and the other factors described under "Risk Factors."
If one or more of these risks or uncertainties materialize, or if underlying assumptions prove incorrect, actual results may vary materially from those expected, estimated or projected. In addition to other factors that affect our operating results and financial position, neither past financial performance nor our expectations should be considered reliable indicators of future performance. Investors should not use historical trends to anticipate results or trends in future periods. Failure of sales or income in any quarter to meet the investment community's expectations, as well as broader market trends, could have an adverse impact on our stock price. We do not undertake an obligation to update such forward looking statements or risk factors to reflect future events or circumstances.
RISK FACTORS
Risks Related to our Business
We are currently transitioning our business entirely from primary aluminum manufacturing to high purity aluminum manufacturing, and we are therefore subject to the risks generally associated with the formation of any new business and the complete transition of an existing business.
In June, 2006, we began to transition our business entirely from primary aluminum manufacturing to high purity aluminum manufacturing. We have converted one of our 172 electrolytic cells for production of high purity aluminum, and we expect to complete the transition by the end of 2007. Upon completion of this transition, we will manufacture only high purity aluminum. We are therefore subject to the risks generally associated with the formation of any new business and the complete transition of an existing business, including the following risks:
| · | the high purity aluminum market is a developing niche market, and we may have over-estimated demand and growth potential; |
| · | we may have underestimated the level of competition in the high purity aluminum manufacturing market; |
| · | we have no established relationships with customers in the high purity aluminum manufacturing marketplace, and we may be unable to successfully establish or maintain such relationships; |
| · | we may encounter significant technical difficulties in the transition to new manufacturing processes; |
| · | our transition may take much longer or cost much more than expected; and |
| · | we may fail to raise sufficient capital to fund our transition. |
The transition to and implementation of our new business plans will require significant resources and will place a significant strain on our personnel and management team. We have no meaningful high purity aluminum manufacturing operating history upon which investors may evaluate our performance and assess our future prospects. We cannot assure you that we will be able to successfully implement the transition or to establish or maintain a successful high purity aluminum manufacturing business. Accordingly, our financial performance to date may not be indicative of our long-term future performance and may not necessarily reflect what our results of operations, financial condition and cash flows would have been had we been engaged significantly or solely in high purity aluminum manufacturing during the periods presented. If we are unable to successfully transition to and establish our new operations, then our business, financial condition, results of operations and growth prospects will be adversely affected.
If we do not effectively manage our expected growth, then our business, ability to maintain consistent quality control and financial results could be adversely affected.
Based on our estimates of the demand for high purity aluminum in the Peoples Republic of China (“China” or the “PRC”) and the world, we expect our business to grow significantly as a result of our transition to high purity aluminum manufacturing. This growth will place significant demands on our current management resources. Our ability to manage our growth effectively will require us to expand our operational, financial and management information systems and to continue to retain, attract, train, motivate and manage key employees. We cannot assure you that we will be successful in attracting qualified individuals to the extent necessary, and management may expend significant time and energy attracting the appropriate personnel to manage facilities we develop in the future. Also, additional facilities will require us to maintain consistent quality control measures that allow our management to effectively identify deviations that result in manufacturing substandard products. If we are unable effectively to manage our growth or successfully to integrate expansions into our existing business or maintain consistent quality control measures, our business, financial condition and results of operations could be adversely affected.
We may need additional capital to fund our operations and finance our growth, and we may not be able to obtain it on terms acceptable to us, or at all, which may limit our ability to grow.
Continued expansion of our business may require additional capital, particularly if we were to accelerate our transition or expansion plans. Financing may not be available to us or may be available to us only on terms that are not favorable. If we are unable to raise additional funds or obtain funds on terms acceptable to us, we may have to delay or abandon some or all of our transition or growth strategies. Further, if additional funds are raised through the issuance of additional equity securities, the percentage ownership of our stockholders would be diluted. Any newly issued equity securities may have rights, preferences or privileges senior to those of our common stock. See “Description of Capital Stock.”
The geographic concentration of our facilities could leave us vulnerable to an economic downturn, regulatory changes or acts of nature in those areas, resulting in a decrease in our revenues or an increase in our costs, or otherwise negatively impacting our results of operations.
All of our facilities are located in northeastern China. As a result of this concentration, the conditions of local economies, acts of nature, changes in governmental rules and regulations, particularly with respect to aluminum manufacturing, and other factors that may result in a decrease in demand for high purity aluminum in northeastern China or China in general could have an adverse effect on our revenues, costs and results of operations.
Departure of our chief technology officer or other key technical personnel could harm our business.
Our successful transition to and establishment of our high purity aluminum manufacturing business depends, to a significant extent, upon the continued service of key technical personnel, and in particular our chief technology officer (“CTO”), Prof. Huimin Lu. Our CTO is a leading metallurgist with significant experience successfully applying his technological developments to allow mass production of high purity aluminum. He has signed a 50-year license agreement with us giving us exclusive rights to use, among other things, his recent patent-pending high purity aluminum manufacturing process. Kangping Aluminum has an option to extend the license agreement for an additional 50-year term. We have also entered into a 10-year employment agreement with our CTO pursuant to which he must assign to us any intellectual property rights relating to high purity aluminum and arising during the term of the employment agreement. We believe this agreement is enforceable, but we cannot assure you that we would be able to enforce it if it is challenged. If we were to lose his services, then our transition to high purity aluminum manufacturing, our business, financial results and growth prospects could be adversely affected. If he joins a competitor or forms a competing company, we could lose exclusive access to high purity aluminum manufacturing processes in which he may have rights, as well as lose customers and incur additional expenses to recruit replacements and train personnel.
Elwin’s failure to make full payment for its acquisition of Kangping Aluminum could result in the annulment of Elwin’s acquisition of Kangping Aluminum.
Elwin entered into an agreement to purchase Kangping Aluminum for approximately $16.8 million (RMB133.21 million) on August 10, 2006. The Chinese government approved the acquisition on August 28, 2006 and issued Kangping Aluminum a license to operate as a wholly foreign-owned enterprise on September 4, 2006. Elwin has not yet paid any of the monies owed pursuant to the acquisition of Kangping Aluminum. Under Chinese law, Elwin must pay the entire price within 90 days of the granting of the business license. Although Chinese regulations provide for extensions at the discretion of the government agencies, there is no assurance that we will be able to obtain such an extension. If we fail to raise sufficient funds within the 90 days and we fail to obtain an extension from the Chinese government, Elwin’s acquisition of Kangping Aluminum will be annulled and, Kangping Aluminum will no longer be our subsidiary. As a result, we would have no operating assets.
We generally do not enter into long-term contracts with our suppliers and customers.
| · | our relationships with our customers or suppliers; |
| · | the financial condition of our customers or suppliers; |
| · | short-term or long-term increases in market prices or decreases in supply of our raw materials; and |
| · | short-term or long-term decreases in market prices or demand for our products. |
If our relationship with one of our key suppliers or customers is adversely affected, we may not be able to quickly or effectively replace such supplier or customer.
We have significant customer concentration, and a significant decline in business with of one or more of our major customers could materially impair our business, operating results, prospects and financial condition.
For the year ended December 31, 2005, our largest four customers accounted for approximately 34%, 19%, 9% and 6%, respectively, of our net sales of primary aluminum. For the six months ended June 30, 2006, our largest four customers accounted for approximately 26%, 15%, 6% and 5%, respectively, of our net sales of primary aluminum. Accordingly, prior to completing our conversion to high purity aluminum manufacturing, the loss of, or significant reduction in purchases by, any of these customers or other significant customers could materially impair our operating results and weaken our financial condition. For more information, see “Business—Our Major Primary Aluminum Customers.” We do not currently have established histories with any customers for high purity aluminum.
After our transition to high purity aluminum manufacturing, our revenues will depend initially on sales of one product, and later on sales of a few related high purity aluminum products, and a decline in sales of any of these products could cause our revenues to decrease.
After our transition to high purity aluminum manufacturing, we expect to derive substantially all of our revenue initially from the sale of unfinished high purity aluminum. After we expand our production capabilities to produce high purity aluminum foils and alloys and later super high purity aluminum, we expect to derive substantially all of our revenue from the sale of a few related high purity aluminum products for the foreseeable future. Any factors adversely affecting the pricing of, demand for or market acceptance of high purity aluminum or these related semi-finished products, including increased competition, could cause our revenues to decline and our business and future operating results to suffer. Our failure to develop products that are compatible with market needs could have an adverse effect on our sales and earnings.
Our operations consume substantial amounts of electricity, and our profitability may decline if our electricity costs rise or if electricity supplies are interrupted.
We consume substantial amounts of electricity in our operations, and it accounts for approximately 30% of the total cost of our primary aluminum products and will account for an estimated 40% of the total cost of our high purity aluminum products. Because local governments in the areas we operate desire to encourage local development, we currently pay discounted preferential rates for the electricity we use for our operations. These rates are approximately 20% lower than the normal rates charged for other businesses and are not locked in for any fixed period. The following could adversely affect our results of operations:
| · | we could lose our preferential electricity rates, which would significantly increase our costs; |
| · | electrical power could be interrupted due to unplanned outages, equipment failure or other causes, which could severely damage our manufacturing facilities; |
| · | there could be a reduction in supply of coal, from which the electricity we use is generated, which could interrupt the electrical power supply or cause an increase in the costs of electrical power; and |
| · | one or more of our manufacturing facilities could shut down due to an inability to continue to obtain electrical power on cost-effective terms. |
Moreover, the law relating to intellectual property is not as developed in China, and our intellectual property rights may not be as protected in China as they are in other countries such as the United States. Any patents issued to us, or in which we otherwise have rights, may not be sufficiently broad to protect our proprietary technologies, and given the costs of obtaining patent protection, we may choose not to seek patent protection for certain of our proprietary technologies. We may not be effective in policing unauthorized use of our intellectual property, and even if we do detect violations, litigation may be necessary to enforce our intellectual property rights. Any enforcement efforts we undertake, including litigation, could be time-consuming and expensive, could divert our management’s attention and may result in a court determining that our intellectual property rights are unenforceable. If we are not successful in cost-effectively protecting our intellectual property rights, our business, operating results and financial condition could be harmed.
Our use of hazardous or toxic substances in our business may subject us to substantial liabilities, which may exceed the value of the underlying assets and which could materially and adversely affect our liquidity and earnings.
Our aluminum production operations are subject to environmental protection laws and regulations in China that impose such penalties as waste discharge fees, fines or closure of non-compliant plants. Each of our aluminum production plants has implemented a system to control its emissions and to oversee compliance with PRC environmental regulations. The PRC government has taken steps, and may take additional steps, towards more rigorous enforcement of applicable laws or adoption of more stringent environmental standards. If the PRC national or local authorities enact additional regulations or enforce existing or new regulations in a more rigorous manner, we may be required to make additional environmental expenditures, which could have an adverse impact on our financial condition.
We may not be able to successfully implement productivity and cost-reduction initiatives.
We have undertaken and may continue to undertake productivity and cost-reduction initiatives to improve performance. There can be no assurance that these initiatives will be completed or beneficial to our business or that any estimated cost savings from such activities will be realized.
We may not be able to successfully develop or implement new technology initiatives.
We are working on new technology and manufacturing developments. These developments may not be feasible or beneficial to our business.
We have limited business insurance coverage and may be subject to losses that might not be covered by existing insurance coverage.
The insurance industry in China is still at an early stage of development. Insurance companies in China offer limited business insurance products. As a result, we do not have business liability or disruption insurance coverage for our operations. Any business disruption, litigation or natural disaster might result in substantial costs and diversion of resources.
Risks Related to our Industry
We are exposed to volatility in the aluminum industry, economic conditions generally and aluminum end-use markets.
The aluminum industry is highly cyclical, with prices subject to worldwide market forces of supply and demand and other influences. Prices have been historically volatile and we expect such volatility to continue. Because most of our costs are fixed and we may not be able to respond quickly to any sudden decrease in prices of high purity aluminum, any significant fluctuation in market prices could materially adversely affect our business, financial condition and operating performance.
A decrease in supply or increase in cost of our raw materials could result in a material decline in our profitability.
Because we purchase large volumes of raw materials, such as alumina, any restrictions on the supply or increase in the cost of our raw materials could significantly reduce our profit margins. Efforts to mitigate restrictions on the supply or price increases of our raw materials by productivity improvements or by passing cost increases to our customers may not be successful, and as is typical in China, we do not generally enter into long-term purchase contracts with fixed-price terms. Our profitability depends largely on the price and continuity of supply of these raw materials, which are supplied by a limited number of sources. Our ability to pass on these costs to our customers is, to a large extent, dependent on the terms of our contracts with our customers and industry conditions, including the extent to which our customers would switch to alternative materials that we do not produce in the event of an increase in the prices of our products.
We participate in a highly competitive market.
We believe that there are two other high purity aluminum manufacturers in China, one with an estimated capacity of 15,000 metric tons per year and the other with a capacity of 5,000 metric tons per year. After we complete our transition to high purity aluminum manufacturing, we expect to have a capacity of 20,000 metric tons per year. Our estimates could be wrong, more competitors could enter the marketplace or our competitors could increase their capacity, any of which could limit our ability to sell our products at expected prices, which could have a material adverse effect on our revenues and earnings.
In connection with its accession to the World Trade Organization in 2001, China has undertaken to open up its markets to foreign companies. China reduced its average import tariff rate overall to 10.4% in 2004 and further reduced it to 9.90% in 2005. As a result, foreign competitors may form alliances with or acquire companies in our industry in China. Intensified competition from these foreign competitors may lead to lower profit margins due to price competition, loss of customers and slower than anticipated growth.
Risks Related to Doing Business in China
A slowdown in the growth of the Chinese economy may slow down our growth and profitability.
Our business is primarily dependent upon the economy and the business environment in China. In particular, our growth strategy is based upon the assumption that demand in China for high purity aluminum will continue to grow with the Chinese economy. However, the growth of the Chinese economy has been uneven across geographic regions and economic sectors. Several years ago, the Chinese economy also experienced deflation, which may reoccur in the foreseeable future. There can be no assurance that growth of the Chinese economy will be steady or uniform or that any slowdown will not have a negative effect on our business.
China’s legal system is characterized by uncertainty that could negatively impact our business and results of operations.
The Chinese legal system is a civil law system based on written statutes. Unlike common law systems, it is a system in which decided legal cases have little value as precedent. Beginning in 1979, the PRC government promulgated a comprehensive system of laws and regulations governing economic matters, which has had the overall effect of significantly enhancing the protections afforded to foreign invested enterprises in China.
However, these laws, regulations and legal requirements are relatively new and are evolving rapidly, and their interpretation and enforcement involve uncertainties. These uncertainties could limit the legal protections available to foreign investors. In addition, enforcement of existing laws, or contracts based on existing law, may be uncertain and sporadic, and it may be difficult to obtain swift and equitable enforcement or to obtain enforcement of a judgment by a court of another jurisdiction. The relative inexperience of China’s judiciary in many cases creates additional uncertainty as to the outcome of any litigation. Furthermore, interpretation of statutes and regulations may be subject to new government policies reflecting domestic political changes.
Our activities in China will be subject to administrative review and approval by various national and local agencies of the PRC government. Because of the changes occurring in China’s legal and regulatory structure, we may not be able to secure the requisite governmental approval for our activities. Failure to obtain the requisite governmental approval for any of our activities could adversely affect our business and results of operations.
Any recurrence of SARS or another widespread public health problem, such as the emergence of an avian influenza, could negatively impact our business and results of operations.
A renewed outbreak of SARS or another widespread public health problem in China, where substantially all of our revenue is derived and where our operations are located, could have a negative effect on our operations. Our operations may be impacted by a number of health-related factors, including the following:
| · | quarantines or closures of some of our offices, which would severely disrupt our operations; |
| · | the sickness or death of our key officers and employees; and |
| · | a general slowdown in the Chinese economy. |
Any of the foregoing events or other unforeseen consequences of public health problems could adversely affect our business and results of operations.
Changes in China’s political and economic policies could negatively impact our business.
Substantially all of our business operations are conducted in China. Accordingly, our results of operations, financial condition and prospects are subject in a significant degree to the economic, political and legal developments in China. China’s economy has historically been a planned economy subject to governmental plans and quotas and has, in certain aspects, been transitioning to a more market-oriented economy. Although we believe that the economic reform and the macroeconomic measures adopted by the PRC government have had a positive effect on the economic development of China, we cannot predict the future direction of these economic reforms or the effects these measures may have on our business, financial position or results of operations. In addition, the Chinese economy differs from the economies of most countries belonging to the Organization for Economic Cooperation and Development (“OECD”). These differences include:
| · | level of government involvement in the economy; |
| · | level of capital reinvestment; |
| · | control of foreign exchange; |
| · | methods of allocating resources; and |
| · | balance of payments position. |
As a result of these differences, our business may not develop in the same way or at the same rate as might be expected if the Chinese economy were similar to those of the OECD member countries.
Restrictions on foreign currency exchange may limit our ability to receive and use our revenues effectively.
Any future restrictions on currency exchanges may limit our ability to use revenues generated in Renminbi to fund any future business activities outside China or to make dividend or other payments in U.S. dollars or other foreign currencies. Although the PRC government introduced regulations in 1996 to allow greater convertibility of the Renminbi for current account transactions, significant restrictions still remain, including primarily the restriction that foreign invested enterprises may only buy, sell and/or remit foreign currencies at those banks authorized to conduct foreign exchange business after providing valid commercial documents. In addition, remittance of foreign currencies abroad and conversion of Renminbi for capital account items, including direct investment and loans, is subject to governmental approval in China, and companies are required to open and maintain separate foreign exchange accounts for capital account items. We cannot be certain that the Chinese regulatory authorities will not impose more stringent restrictions on the convertibility of the Renminbi, especially with respect to foreign exchange transactions.
Our operating subsidiary in China is subject to restrictions on dividend payments.
We are a holding company incorporated in Nevada with no operating assets. We rely on dividends and other distributions from our operating subsidiary in the PRC, Kangping Aluminum, to provide us with our cash flow and allow us to pay dividends on our common stock and meet our other obligations. Current regulations in China permit Kangping Aluminum to pay dividends to us only out of its accumulated distributable profits, if any, determined in accordance with its articles of association and PRC accounting standards and regulations. In particular, Kangping Aluminum, as a wholly foreign owned enterprise in China, is required to set aside at least 10% (up to an aggregate amount equal to half of its registered capital) of its after-tax profits each year. Such cash reserve may not be distributed as cash dividends. Currently, the aggregate amount of the reserve fund of Kangping Aluminum is in excess of half of its registered capital, and therefore, Kangping Aluminum is not required to set aside any addition reserve fund. In addition, if Kangping Aluminum incurs debt on its own behalf in the future, the instruments governing the debt may restrict its ability to pay dividends or make other payments to us.
Fluctuations in the value of the Renminbi could negatively impact our results of operations.
Our reporting currency is the U.S. dollar and our sales, operating expenses and substantially all of our assets and liabilities are denominated in Renminbi. As a result, we are exposed to foreign exchange risk, and our reported profits will decline if the Renminbi depreciates against the U.S. dollar.
The value of the Renminbi is subject to changes in China’s governmental policies and to international economic and political developments. Since January 1, 1994, the PRC government has used a unitary managed floating rate system. Under this system, the People’s Bank of China publishes a daily base exchange rate with reference primarily to the supply and demand of Renminbi against U.S. dollar and other foreign currencies in the market during the previous day. Authorized banks and financial institutions are allowed to quote buy and sell rates for Renminbi within a specified band around the central bank’s daily exchange rate. However, since July 2005 the Renminbi is no longer pegged solely to the U.S. dollar. Instead, it is reported to be pegged against a basket of currencies, determined by the People’s Bank of China, against which it can rise or fall by as much as 0.3% each day. The Renminbi may appreciate or depreciate significantly in value against the U.S. dollar in the long term, depending on the fluctuation of the basket of currencies against which it is currently valued or it may be permitted to enter into a full float, which may also result in a significant appreciation or depreciation of the Renminbi against the U.S. dollar.
As we rely entirely on dividends paid to us by Kangping Aluminum, any significant devaluation of the Renminbi would have a material adverse effect on our revenues and financial condition, and the value of, and any dividends payable on, our shares in foreign currency terms. Conversely, to the extent that we need to convert U.S. dollars we receive from any future primary offering into Renminbi for our operations, appreciation of the Renminbi against the U.S. dollar would have an adverse effect on the Renminbi amount we receive from the conversion. Fluctuations in the exchange rate will also affect the earnings from and the value of any U.S. dollar-denominated investments we make in the future.
Our officers and directors, and substantially all of our assets, are located in China, which may make it difficult to obtain jurisdiction over and enforce liabilities against our officers, directors and assets.
Because our executive officers and directors are Chinese citizens living in China it may be difficult, if not impossible, to obtain jurisdiction over them in the event that a stockholder or group of stockholders initiates a lawsuit in the United States against us or any of our officers or directors. We anticipate that our future officers and directors will also be Chinese citizens. Because the majority of our assets are located in China, it would also be extremely difficult to access those assets to satisfy an award entered against us in U.S. court.
SELECTED HISTORICAL FINANCIAL AND OPERATING DATA FOR KANGPING ALUMINUM
The following table sets forth selected historical financial data as of and for each of the years in the five-year period ended December 31, 2005 and for the six months ended June 30, 2006 and 2005 for our operating subsidiary, Kangping Aluminum. Kangping Aluminum's historical statements of operations data for the years ended December 31, 2005, 2004, 2003 and 2002 and balance sheet data as of December 31, 2005, 2004, and 2003 have been derived from its audited financial statements. Kangping Aluminum's financial statements from certain of these periods are included elsewhere in this report. The statements of operations data for the year ended December 31, 2001 and balance sheet data as of December 31, 2002 and 2001 have been derived from Kangping Aluminum's unaudited financial statements. The statements of operations data for the six months ended June 30, 2006 and the balance sheet data as of June 30, 2006 and 2005 are derived from Kangping Aluminum's unaudited interim financial statements included elsewhere in this report.
You should read this information in conjunction with the information under ‘‘Management’s Discussion and Analysis of Financial Condition and Results of Operations,’’ ‘‘Business’’ and our historical combined financial statements and the related notes thereto included elsewhere in this report.
Statements of Operations (in U.S. dollars) | | | | | | | | | | Six Months | |
| | | Year Ended December 31, | | Ended June 30, | |
| | | 2001 | | 2002 | | 2003 | | 2004 | | 2005 | | 2005 | | 2006 | |
| | | (unaudited) | | | | | | | | | | (unaudited) | | (unaudited) | |
| Sales - Unrelated Parties | | | 13,177,281 | | | 11,540,020 | | | 29,680,549 | | | 33,616,221 | | | 26,370,255 | | | 10,875,793 | | | 17,697,440 | |
| Sales - Related Parties | | | 9,076,487 | | | 10,592,798 | | | 12,270,345 | | | 10,204,957 | | | 13,757,972 | | | 3,909,841 | | | 571,234 | |
| Sales | | | 22,253,768 | | | 22,122,818 | | | 41,950,894 | | | 43,821,178 | | | 40,128,227 | | | 14,785,634 | | | 18,268,674 | |
| | | | | | | | | | | | | | | | | | | | | | | |
| Cost of Sales | | | 17,858,370 | | | 18,743,827 | | | 36,723,472 | | | 39,306,630 | | | 34,430,828 | | | 12,841,255 | | | 15,773,226 | |
| Gross Profit | | | 4,395,397 | | | 3,378,991 | | | 5,227,422 | | | 4,514,548 | | | 5,697,399 | | | 1,944,379 | | | 2,495,448 | |
| Operating Expenses | | | | | | | | | | | | | | | | | | | | | | |
| General & Administrative Expenses | | | 1,090,479 | | | 447,494 | | | 615,904 | | | 771,584 | | | 321,396 | | | 286,505 | | | 319,444 | |
| Income from Operations | | | 3,304,919 | | | 2,931,497 | | | 4,611,518 | | | 3,742,964 | | | 5,376,003 | | | 1,657,874 | | | 2,176,004 | |
| | | | | | | | | | | | | | | | | | | | | | | |
| Other Income (Expenses) | | | | | | | | | | | | | | | | | | | | | | |
| Interest Income - Related Party | | | - | | | - | | | 885,309 | | | 1,007,289 | | | 959,232 | | | 579,768 | | | 266,633 | |
| Other Income | | | 1,481 | | | 159,479 | | | 224,858 | | | 205,842 | | | 103,750 | | | 56,204 | | | 26,895 | |
| Other Expenses | | | (7,029 | ) | | (15,734 | ) | | (16,162 | ) | | (18,348 | ) | | (26,590 | ) | | (7,414 | ) | | (3,203 | ) |
| Interest Expense - Unrelated Party | | | (373,295 | ) | | (648,797 | ) | | (1,358,196 | ) | | (1,769,241 | ) | | (1,712,986 | ) | | (840,014 | ) | | (869,535 | ) |
| Income Before Income Taxes | | | 2,926,075 | | | 2,426,445 | | | 4,347,327 | | | 3,168,506 | | | 4,699,409 | | | 1,446,418 | | | 1,596,795 | |
| Provision for Income Taxes | | | | | | | | | | | | | | | | | | | | | | |
| Current | | | - | | | - | | | 1,127,613 | | | 1,045,609 | | | 1,626,367 | | | 561,232 | | | 573,288 | |
| Net Income | | | 2,926,075 | | | 2,426,445 | | | 3,219,714 | | | 2,122,897 | | | 3,073,042 | | | 885,186 | | | 1,023,507 | |
| | | | | | | | | | | | | | | | | | | | | | | |
| Translation Gain | | | - | | | - | | | - | | | - | | | 627,236 | | | - | | | 119,542 | |
| Comprehensive Income | | | 2,926,075 | | | 2,426,445 | | | 3,219,714 | | | 2,122,897 | | | 3,700,278 | | | 885,186 | | | 1,143,049 | |
Balance Sheet Data (in U.S. dollars) | | As of December 31, | | | As of June 30, | |
| | | 2001 | | 2002 | | 2003 | | 2004 | | 2005 | | | 2006 | |
| | | (unaudited) | | (unaudited) | | | | | | | | | (unaudited) | |
| Cash | | | 841,255 | | | 2,632,623 | | | 1,908,537 | | | 329,398 | | | 118,084 | | | | 4,429,101 | |
| Cash Restricted | | | 1,449,608 | | | 9,217,091 | | | 16,247,600 | | | 2,416,000 | | | 6,510,013 | | | | - | |
| Notes Receivable | | | 639,736 | | | - | | | 338,838 | | | 78,520 | | | 22,940 | | | | 18,760 | |
| Accounts Receivable | | | 31,522 | | | 36,290 | | | 73,230 | | | 300,040 | | | 276,544 | | | | 2,738,703 | |
| Related Party Receivable | | | 14,852,377 | | | - | | | - | | | 6,342,000 | | | 3,676,227 | | | | - | |
| Inventories | | | 2,905,118 | | | 5,361,272 | | | 8,755,329 | | | 13,107,659 | | | 16,018,762 | | | | 12,256,996 | |
| Prepayments & Other Current Assets | | | 1,347,183 | | | 4,910,828 | | | 4,493,236 | | | 666,530 | | | 1,996,769 | | | | 5,875,726 | |
| Total Current Assets | | | 22,066,798 | | | 22,158,103 | | | 31,816,770 | | | 23,240,147 | | | 28,619,339 | | | | 25,319,286 | |
| Total Non-Current Assets | | | 15,637,352 | | | 21,695,081 | | | 20,402,255 | | | 19,341,103 | | | 18,430,512 | | | | 17,838,947 | |
| Total Assets | | | 37,704,150 | | | 43,853,185 | | | 52,219,025 | | | 42,581,250 | | | 47,049,851 | | | | 43,158,233 | |
| | | | | | | | | | | | | | | | | | | | | |
| Total Current Liabilities | | | 15,396,566 | | | 26,683,481 | | | 54,907,369 | | | 14,408,388 | | | 12,774,035 | | | | 10,060,506 | |
| Total Long Term Liabilities | | | 7,248,040 | | | 7,248,040 | | | - | | | 19,086,400 | | | 19,282,038 | | | | 19,448,197 | |
| Total Liabilities | | | 22,644,606 | | | 33,931,521 | | | 54,907,369 | | | 33,494,788 | | | 32,056,073 | | | | 29,508,703 | |
| Total Owners' Equity | | | 15,059,544 | | | 9,921,664 | | | (2,688,344 | ) | | 9,086,462 | | | 14,993,778 | | | | 13,649,530 | |
| Total Liabilities & Owners' Equity | | | 37,704,150 | | | 43,853,185 | | | 52,219,025 | | | 42,581,250 | | | 47,049,851 | | | | 43,158,233 | |
INDUSTRY OVERVIEW
The Aluminum Industry
As a raw material for both industrial and consumer products, aluminum has a broad range of applications. It is widely used in the construction, transportation, electric, electronics and other industries. A nation’s per capita consumption of aluminum is highly correlated with its per capita gross domestic product (“GDP”). In other words, the demand for aluminum tends to increase along with the economic development of a particular country. The following table shows the per capita consumption of various countries with varying degrees of economic development in 2004:
Country | | Per Capita GDP (thousands of U.S. dollars) | | Per Capita Aluminum Consumption (Kg)* |
| Norway | | 53.4 | | 53.3 |
| United States | | 48.9 | | 19.6 |
| Japan | | 36.5 | | 15.8 |
| Germany | | 33.1 | | 21.8 |
| Canada | | 32.1 | | 24.3 |
| Australia | | 30.1 | | 15.4 |
| Italy | | 29.1 | | 16.8 |
| Korea | | 14.8 | | 23.2 |
| Russia | | 4.7 | | 7.1 |
| China | | 1.6 | | 4.8 |
Source: 2005 Industry Yearbook, China Non-Ferrous Metals Industry Association (“CNFMIA”).
* Based on our calculation. The consumption data is from the 2005 Industry Yearbook by CNFMIA, and the population data is from the website of the Population Reference Bureau (www.prb.org).
The aluminum industry is a mature industry characterized by intense competition. Almost all major countries in the world have the capacity to manufacture a significant amount of aluminum. No single country or manufacturer dominates the market. The following table shows the amount of aluminum production for various countries which produced more than one million metric tons in 2004:
Country | | Aluminum Production Volume (in millions of metric tons) | | Ranking |
| China | | 6.68 | | 1 |
| Russia | | 3.59 | | 2 |
| Canada | | 2.59 | | 3 |
| United States | | 2.52 | | 4 |
| Australia | | 1.89 | | 5 |
| Brazil | | 1.46 | | 6 |
| Norway | | 1.32 | | 7 |
Source: 2005 Industry Yearbook, CNFMIA.
The manufacturing process of aluminum comprises two phases: (1) conversion of bauxite into alumina and (2) conversion of alumina into aluminum. Some manufacturers produce both alumina and aluminum, while others focus on either alumina or aluminum. Most aluminum manufacturers market aluminum ingots only, whereas some manufacturers further process aluminum into semi-finished products such as aluminum bars, pipes and plates, which usually command a higher price than ingots.
The cost of aluminum depends largely on the cost of alumina and electricity. Our experience shows that the cost of alumina accounts for as much as 60% of the total cost and the cost of electricity accounts for approximately 30% of the total cost. Both alumina and aluminum are fungible commodities. Their prices are subject to a wide range of fluctuation directly related to the supply and demand in the industry. The cost of electricity varies from country to country and is also subject to price fluctuation if the supply or demand of power in a particular country is not stable. The price of aluminum in a particular country reflects, to a large degree, the price of aluminum in the international commodities market. Aluminum manufacturers normally do not have much freedom to set prices. The following table shows the price fluctuations of aluminum in the international commodities market from 2000 to 2005:
Year | | Average Price (U.S. dollars per metric ton)* | | Percentage Change |
| 2000 | | 1,553 | | N/A |
| 2001 | | 1,450 | | (6.6%) |
| 2002 | | 1,353 | | (6.6%) |
| 2003 | | 1,435 | | 6.1% |
| 2004 | | 1,717 | | 19.7% |
| 2005 | | 1,897 | | 10.5% |
Source: London Metal Exchange.
* Yearly averages calculated on the basis of stated monthly prices.
Aluminum can be classified into several different categories according to its content. Alumina is usually refined through the electrolytic method into primary aluminum. The process yields a product with at least 99% aluminum content. Primary aluminum is a common raw material for many industries. Primary aluminum can be further processed to yield a higher aluminum content of at least 99.9% using various technologies including the three-layered electrolytic method. The technologies involved in secondary processing require more technical expertise. As a result, the price and profit margin for high content aluminum are significantly higher. The following table shows the different aluminum classification systems as used in China and the United States:
Chinese Classifications
Classification | | Aluminum Content |
| Primary Aluminum | | 99.00%-99.85% |
| Refined Aluminum | | 99.95%-99.996% |
| High Purity Aluminum | | >99.996% |
Source: Journal dated September 20, 2006 of CNFMIA.
U.S. Classifications
Classification | | Aluminum Content |
| Industrial Pure Aluminum | | 99.50%-99.79% |
| High Purity Aluminum | | 99.80%-99.945% |
| Sub-Hyper-Purity Aluminum | | 99.950%-99.9959% |
| Hyper-Purity Aluminum | | 99.9960%-99.9990% |
| Ultra-Purity Aluminum | | > 99.9990% |
Source: The Minerals, Metals & Materials Society
We refer to all aluminum with higher than 99.99% content as “high purity aluminum.” High purity aluminum is a value-added product and is used in a variety of high-tech industries such as aerospace, aviation, electronics and precision machinery industries. It is also used as a raw material to produce high purity aluminum alloys for high speed trains and other products with special requirements. However, the market for such high content aluminum is not as large as that for primary aluminum. The amount of high content aluminum produced each year is relatively small. According to a journal of the CNFMIA, the worldwide productions of high purity aluminum were approximately 120,000 metric tons and 150,000 metric tons in 2004 and 2005, respectively.
The Aluminum Industry in China
China began its economic reforms in the late 1970s. Since then, China’s economy has grown on average at a rate of approximately 10% per year. Along with rapid economic growth came an enormous increase in the consumption of aluminum. According to the 2005 Industry Yearbook by the CNFMIA, China’s per capita consumption of aluminum has increased from 3.2kg to 4.8kg between 2002 and 2004. China’s aluminum manufacturers have expanded their capacity to meet the increased demand. According to statistics published by the CNFMIA, total output has increased from 850,000 metric tons in 1990 to 6.69 million metric tons in 2004. With continued expansion of China’s economy, we believe the demand for aluminum will continue to increase. The following table shows China’s output increase from 2002 to 2004:
Year | | Amount (millions of metric tons) | | Growth over Previous Year |
| 2002 | | 4.23 | | N/A |
| 2003 | | 5.55 | | 31% |
| 2004 | | 6.69 | | 20% |
Source: CNFMIA website (www.chinania.org.cn)
Most of China’s aluminum refineries are state-owned companies. China Aluminum Co. Ltd. is the largest of these, with a combined capacity of 1.09 million metric tons per year in 2004. More than a dozen other state-owned companies have a capacity of over 100,000 metric tons per year. The rest of the aluminum refineries have a capacity from 10,000 metric tons per year to 100,000 metric tons per year. There are only a few privately owned aluminum refineries, which tend to have smaller capacities in the range of 5,000 to 50,000 metric tons. Below is a table of the top-ten primary aluminum producers in China in 2004:
Company Name | | Production Volume in 2004 (metric tons) | | Ranking |
| China Aluminum Company Qinghai Branch Company | | 286,058 | | 1 |
| Qingtongxia Aluminum Group Company Limited | | 247,743 | | 2 |
| China Aluminum Company Guizhou Branch Company | | 230,001 | | 3 |
| Baotou Aluminum (Group) Company Limited | | 228,458 | | 4 |
| Zhaozuo city Wanfang Aluminum Shares Company Limited | | 226,289 | | 5 |
| Henan Yugang Longquan Aluminum Company Limited | | 204,090 | | 6 |
| Henan Wanji Aluminum Company Limited | | 185,443 | | 7 |
| Yunan Aluminum Shares Company Limited | | 182,023 | | 8 |
| Shandong Yinfa Aluminum Electric Group | | 176,433 | | 9 |
| Fushun Aluminum Factory | | 162,869 | | 10 |
Source: 2005 China Industry Analysis Report, CNFMIA
China’s aluminum market is characterized by a high degree of government intervention, and the PRC government has historically acted to control prices and supplies. However, the policies of the PRC government are sometimes ignored or circumvented by the local governments, which have an economic interest in building more capacity to generate more revenues and employment opportunities. As a result, China’s current aluminum capacity outstrips demand. According to the 2005 Industry Yearbook by the CNFMIA, China produced approximately 6.68 million metric tons, but its consumption was only 5.97 million metric tons. The Yearbook further projected that the total output for 2005 would be 7.6 million metric tons while the demand for 2005 would be 6.86 million metric tons.
Due to government intervention and restrictions, the price for aluminum in China does not always reflect that of the international market. The following table indicates the price of aluminum in China and in the international commodities market from 2000 to 2005:
Year | | Price of Aluminum in China (U.S. dollars per metric ton) | | Price of Aluminum in the International Market (U.S. dollars per metric ton) |
| 2000 | | 1,962 | | 1,553 |
| 2001 | | 1,732 | | 1,450 |
| 2002 | | 1,637 | | 1,353 |
| 2003 | | 1,763 | | 1,435 |
| 2004 | | 1,962 | | 1,717 |
| 2005 | | 2,081 | | 1,897 |
Sources: Shanghai Futures Exchange (www.shfe.com.cn); London Metal Exchange (www.lme.co.uk)
By September 2006, many new alumina manufacturers in China had gone into production and the price of alumina had decreased significantly. Many aluminum refineries have been increasing their output to take advantage of the alumina price drop. We believe that, as a result, a large inventory of primary aluminum will build up and the price will drop accordingly.
Market Opportunity
The Market for Primary Aluminum
Although there will still be room for growth in the primary aluminum business in China in the long term due to China’s rapid economic development, we see very limited opportunity in the primary aluminum business in China for the short term due to overcapacity and downward price trends.
The Market for High Purity Aluminum
We believe there will be opportunities in the high purity aluminum segment due to China’s increasing role as an international manufacturing center. The aerospace industry uses a significant amount of high purity aluminum to make aircraft and spacecraft components. In addition to consuming a large amount of primary aluminum, the electronics industry also utilizes a significant amount of high purity aluminum. For example, high purity aluminum foils are used to make electrolytic capacitors. According to a report by the CNFMIA dated September 20, 2006 (the "CNFMIA Report"), the demands for high purity aluminum in China and globally in 2005 were 50,000 metric tons and 150,000 metric tons, respectively. The same report predicts that demand for high purity aluminum in China will increase at a rate of 20% per annum starting in 2006. There may also be opportunities for exporting high purity aluminum to East Asia and North America.
Because the high purity aluminum market is relatively new with few manufacturers, little third-party data is available. Based on our industry experience, we believe that high purity aluminum typically generates a higher profit margin than primary aluminum. The following table sets forth our current prices and profit margins for primary aluminum and our internal estimates of market prices and profit margins for high purity aluminum and high purity aluminum foils (all amounts in U.S. dollars based on an exchange rate of 1U.S.$ / 7.92 RMB):
| | | Selling Price | | Cost | | Gross Profit | | Gross Margin |
| Primary Aluminum | | 2,149 | | 1,858 | | 291 | | 14% |
| High Purity Aluminum | | 3,793 | | 3,034 | | 759 | | 20% |
| High Purity Aluminum Foils | | 6,953 | | 3,793 | | 3,161 | | 45%* |
* If we have to outsource production of high purity aluminum foil, the gross profit margin will be 29%.
Due to the high level of technical competence required, few aluminum manufacturers in China are able to produce high purity aluminum. We believe that there are currently two high purity aluminum manufacturers in China: Xinjiang Joinworld Aluminum Co. Ltd. (“Joinworld”) and Guizhou Aluminum Company (“Guizhou”). We estimate that Joinworld has a production capacity of 15,000 metric tons per year and Guizhou has a production capacity of 5,000 metric tons per year. In 2005, Joinworld produced 13,000 metric tons while Guizhou produced 4,000 metric tons (Source: CNFMIA Report). We believe that we can successfully take advantage of the high growth potential of this niche market due to our exclusively licensed technology from our CTO.
BUSINESS
Overview
We manufacture, market and sell a variety of primary aluminum products including ingots, bars and pipes. Our refined manufacturing operations involve the extraction of aluminum from aluminum oxide (alumina) through electrolysis processes commonly known as smelting. We further process the extracted liquid aluminum into primary aluminum ingots, bars and pipes through different casting processes. We market and sell primary aluminum products for the commercial aluminum product market consisting of foundries, fabricators and others, as well as finished aluminum products for the energy, electric power, railway, automotive, construction, mechanics, electronic appliance and consumer goods industries.
We have begun converting our facilities so that by the end of 2007, we expect to manufacture and sell principally only high purity aluminum. High purity aluminum is processed into foil to make electrolytic capacitors for industrial and consumer electronics and is sold as ingots or processed into alloys for aerospace components, high-precision instruments and high-speed trains. We sell our products to our customers through direct sales, and our customers take delivery of the products at our refineries. We serve geographic markets covering several provinces in Northeast China, primarily Liaoning Province.
We estimate that we are one of five privately owned aluminum manufacturers in mainland China and the only privately owned aluminum manufacturer in northeastern China. We currently have the capacity to produce 25,000 metric tons of primary aluminum per year. In fiscal year 2005, we manufactured approximately 22,000 metric tons of primary aluminum products, including aluminum ingots, bars, pipes, and plates. Our revenue in 2005 was approximately $40 million with a net profit of approximately $3 million.
In June 2006, we began to convert our business entirely to the production of high purity aluminum. We expect to complete the conversion by the end of 2007 and to have the capacity to produce 20,000 metric tons of high purity aluminum per year. As of October 2006, we have converted one electrolytic cell for production of high purity aluminum. We have produced samples of high purity aluminum, which have received positive test results from China’s National Center for the Analysis and Testing of Non-Ferrous Metals and Electronic Materials and from Shiva Technologies, Inc., a laboratory in the United States. We have an exclusive, long-term license to use an advanced method to manufacture high purity aluminum. We believe that this licensed technology will allow us to offer cost-effective and high-quality high purity aluminum products. By the end of 2007, we plan to have an internal research and development staff of five to ten employees engaged primarily in advancing our high purity aluminum related technologies.
Our Products
Our aluminum manufacturing business can be divided into the following categories:
Primary Aluminum (99.5%-99.8% aluminum content)
We currently have the capacity to produce 25,000 metric tons of primary aluminum per year. Primary aluminum is used by the building materials, rail road, machinery, power, chemical and steel industries. Approximately 50% of the primary aluminum products we sell are semi-finished products, such as aluminum bars, pipes and plates, and the other 50% consists of ingots. By the end of 2007, we plan to have ceased producing primary aluminum.
High Purity Aluminum (99.990%-99.996%, or 4N-4N6, aluminum content)
We have begun to convert our facility into one that will be able to produce high purity aluminum. We have finished one electrolytic cell and have successfully produced samples of high purity aluminum. We expect to complete the conversion by the end of 2007 and to have the capacity to produce 20,000 metric tons of high purity aluminum per year. Initially, we plan to produce and sell unfinished high purity aluminum ingots, and shortly thereafter we plan to start processing the ingots into high purity aluminum foils and alloys. High purity aluminum ingots and alloys are used to manufacture aerospace components, high-precision instruments, such as high-definition telescopes, and high-speed trains. High purity aluminum foils are used to make electrolytic capacitors for industrial and consumer electronics, such as computers, cell phones, televisions and MP3 players. Foils are also starting to be used in automobile electronics and mirrors.
We take pride in our quality control. We have established quality assurance systems for our products and have passed ISO 9001 in 2001. We are seeking to continuously improve our production systems and processes and to meet the latest requirements of ISO 9001 (Version 2000).
Super High Purity Aluminum (99.999%-99.9999%, or 5N-6N, aluminum content)
Within two years after our conversion to high purity aluminum production, we plan to begin to manufacture super high purity aluminum. Our CTO is developing technology to produce high purity aluminum at 5N to 6N aluminum content. We believe that only one other company in the world (Hydro Aluminum, in Norway) currently has the technology to produce aluminum at this level of purity. We believe that the selling prices and profit margins for 5N and 6N aluminum would be significantly higher than those for 4N aluminum. Aluminum with a purity level of 5N to 6N is used in the defense industry and for large-scale integrated circuits, semiconductor components and super-conductors.
Competitive Strengths
We believe we have the following competitive strengths:
| · | Privately Owned. We believe we are one of only five privately owned aluminum manufacturers in China and that we will be the only privately owned high purity aluminum manufacturer in China. Most aluminum manufacturers in China are state owned and employ an average of approximately 300 employees for every 10,000 metric tons of production capacity. We use only approximately 150 employees for every 10,000 metric tons of production capacity. Therefore, we believe our average production costs are lower than those of the state-owned enterprises. We believe we are also flexible and quick in our decision-making process and in adapting our business to market conditions. We believe we are good at tailoring our production to the needs of our customers and thus have strong relationships with our customers. |
| · | Cutting-Edge Technologies for High-Purity Aluminum. We believe that, after our conversion to high purity aluminum manufacturing, we will be one of only three companies in China that will be able to produce high purity aluminum. We have a long-term exclusive license to use new high purity aluminum production technology developed by our CTO. We believe that this technology is superior to that used by other high purity aluminum manufacturers in China, because we expect it to require less capital investment in manufacturing facilities, use less electricity and produce high purity aluminum of more consistently high quality than the technology used by the other manufacturers. Our CTO is also developing additional technology for us, including methods for producing super high purity aluminum. |
| · | More Semi-finished Products. We believe that most other primary aluminum manufacturers in China produce ingots only, whereas we process half of our primary aluminum into semi-finished products such as bars, plates and pipes. These semi-finished products have a higher profit margin, which amounts to approximately $120 more per metric ton. Most of our competitors do not produce such semi-finished products. As a result, we believe that we are more diversified in the primary aluminum products we manufacture, we can better satisfy our customers’ primary aluminum product needs and we have higher over-all profit margins from primary aluminum products than most primary aluminum manufacturers in China. |
| · | Advanced Environmental and Recycling Technologies. We believe that our facilities are newer than those of most of our competitors and that we have more advanced, effective and efficient environmental technology in place. Our environmental and recycling equipment was installed in 2000 and 2003. We have passed the inspections by the municipal and the provincial environmental agencies every year since our inception and have consistently achieved results that are better than the national standards. Because some of this new technology enables us to recycle certain chemicals we use in manufacturing, it helps reduce our costs related to environmental protection. |
| · | Limited Obligations to Retirees. We believe that most of our current competitors and all of our post-conversion competitors in China are state owned. State-owned aluminum manufacturers in China typically have substantial ongoing obligations to support a large number of retirees through the pension funds they must maintain. In contrast, we do not currently have any financial obligations to retirees beyond our required payroll contributions to state-administered pension programs. These contributions typically amount to between 8% and 20% of salaries. Unlike our state-owned competitors, after employees leave our company, we have no further support obligations to them. |
Growth Strategy
Our growth strategy includes converting our current primary aluminum manufacturing facilities into high purity aluminum manufacturing facilities, increasing our product line to include semi-finished high purity aluminum products, such as foils and alloys, gradually implementing plans for super-high purity aluminum production, conducting research and development to further our high purity aluminum manufacturing technologies, building a strong management team and broadening our customer base. We strive to become a market leader of high purity aluminum products in China and, eventually, in the global market.
Capitalize on Growing High Purity Aluminum Markets
Global market for high purity aluminum. Because the market for high purity aluminum is relatively recent with few manufacturers, very little independent market data is available. In 2004, the total global capacity for high purity aluminum production was approximately 120,000 metric tons. In 2005, the capacity increased to approximately 150,000 metric tons (Source: CNFMIA Report). The current high purity aluminum producing countries include Japan, Norway, Germany, China, Russia, U.S. and France. To the best of our knowledge, only one company, Hydro Aluminum, a Norwegian company, is currently able to produce aluminum with a purity level of 5N (99.999%) or above. Recently, global demand has had an estimated average year-over-year growth rate of approximately 6%. With the advent of electronic automobile technology, it has been estimated that the average growth rate could soon reach 8 to 10% (Source: Guotai Junan Securities Research Report on Joinworld, dated July 6, 2006 (“Guotai Report”)).
Demand for high purity aluminum in China. By 2006, China’s yearly high purity aluminum production has increased to an estimated 20,000 metric tons. (Source: Guotai Report). This increase is almost entirely attributable to the increases in production capacity of Joinworld. It is estimated that, in recent years, China’s demand for high purity aluminum has been increasing at 20% per year, compared to an estimated 8 to 10% per year growth rate for the world’s entire high purity aluminum market. Because of the current large-scale development of modern telecommunications networks in China, we believe high purity aluminum products are, and will continue to be, in great demand. Although manufacturers in China currently have an estimated capacity to produce 20,000 metric tons of high purity aluminum and high purity aluminum alloys per year, current demand in China for these products is estimated to be 50,000 metric tons per year (Source: CNFMIA Report). Therefore, we believe our high purity aluminum products will be in demand.
Growing demand for aluminum electrolytic capacitors. About 75% of high purity aluminum produced each year is processed into high-voltage electrolytic aluminum foil, which is an essential component of aluminum electrolytic capacitors. Together with electrolytes, they account for 30% to 70% of the raw material cost of aluminum electrolytic capacitors. The estimated global sales volume of electrolytic capacitors was $4.62 billion in 2003 and $5.0 billion in 2005. It is projected that the global sales volume could reach $5.25 billion in 2006 and $5.5 billion in 2007 (Source: Guotai Report). The rapidly growing telecommunications and automobile industries, the continued increase of digitizing homes and other forms of automated business processes and the expansion of the aerospace industry are expected to continue to create an increasing demand and lead to further increases in the consumption of aluminum capacitors. We believe that our conversion to high purity aluminum manufacturing will position us well to capitalize on this growing market.
With the recent rapid growth in China’s electronics industries, many consumer electronics products have become affordable to more people in China. These products require aluminum electrolytic capacitors, thus increasing demand in China for high purity aluminum foils. According to the data from the Information Center of China Electronic Component Association, China produced 70 billion aluminum electrolytic capacitors, with a value of approximately $846 million, in 2004, accounting for about 40% of the world total. The demand in China in 2004 was about 85.5 billion aluminum electrolytic capacitors with a value of approximately $1.039 billion. We have concluded that China’s demand for aluminum electrolytic capacitors is significantly greater than its domestic supply.
Convert Our Current Facilities to Manufacture High Purity Aluminum Exclusively
We currently have 172 electrolytic cells, which have the capacity to manufacture 25,000 metric tons of primary aluminum per year. Our plan is to fully convert our current primary aluminum manufacturing facilities into high purity aluminum manufacturing facilities with the capacity to manufacture 20,000 metric tons of high purity aluminum per year by the end of 2007. We have converted one primary aluminum electrolytic cell into a high purity aluminum electrolytic cell. We have produced sample products with the newly converted high purity aluminum electrolytic cell. The sample has been tested by China’s National Center for the Analysis and Testing of Non-Ferrous Metals and Electronic Materials, whose report shows our samples contain on average 99.9953% of aluminum. The sample has also been tested by Shiva Technologies, Inc. in the U.S., whose report shows our samples contain 99.995% of aluminum.
Build Facilities to Manufacture High Purity Aluminum Foils and High Purity Aluminum Alloys
Once we are able to produce high purity aluminum in large quantities, we plan to build facilities for production of high purity aluminum products, such as high purity aluminum foils and high purity aluminum alloys. By the end of 2008, we plan to have the capacity to process 15,000 metric tons of high purity aluminum into high purity aluminum foils. If we do not obtain sufficient funds to build such facilities, we plan to sub-contract the production of high purity aluminum foil to third-party foil factories in China. We intend to leverage our raw material supply advantage to become a more vertically integrated producer, which we expect to further enhance our profit margins.
Develop Cutting Edge Processes and Products Through Expanded Research and Development
We plan to develop new technologies in our manufacturing processes. We expect that our use of high purity aluminum manufacturing processes already developed by our CTO will reduce our production costs significantly. We currently have a five-member research and development staff at our aluminum plant in Liaoning Province. Our total projected 2007 research and development budget is $700,000. We plan to establish a research and development center in Beijing, which will house a research and development staff of five to ten employees with a budget of $250,000 for 2007. The current goal of our research and development efforts is to improve our current technologies and develop new technologies and techniques for high purity aluminum and related products such as super high purity aluminum with 99.999% to 99.9999% content, high purity aluminum alloys to use for high-precision instruments, auto mirrors and pitted foils for high voltage capacitors. Our research and development efforts will be aimed at finding new varieties of products, improving existing products, improving existing product quality and reducing production costs.
Build a Strong Management Team
Our experienced management team has strong capabilities in leadership and execution. Under their leadership, we have a demonstrated record of rapid and orderly growth of our business. Most of the members of our management team have more than ten years of industry experience. To meet the challenges of our growing business, we plan to grow our management team by recruiting more people with international and management experience. We believe a strong management team will ensure our continued success in this industry.
Building a Broad Customer Base
We currently have three sales staff because little marketing is needed in our current market. In connection with our conversion to high purity aluminum manufacturing, we plan to increase sales staff in the near future to market high purity aluminum and high purity aluminum products and to provide related technical support. We plan to set up sales or liaison offices in other parts of China where there is a high concentration of electronics manufacturers including the Beijing metropolis, the Yangtze River Delta and the Pearl River Delta. We also plan to attend industry trade shows and exhibitions to market our new products.
Our Refining Technology
Primary Aluminum
For our current production of primary aluminum, we use the Hall-Héroult process, in which alumina is reduced to aluminum metal by an electrolytic process involving carbon electrodes and cryolite flux (3NaF· AlF3). The electrolytic reduction process is carried out in electrolytic cells (we use prebake or Soderberg cells). Alumina is dissolved in the cell in an electrolyte at a high temperature (930 to 950 degrees Celsius) and a low voltage (4.1 to 4.5 volts). A high current is applied to the melted fraction. The alumina is reduced to aluminum at the cathode, and the metal sinks to the bottom of the electrolytic cell. The aluminum is then removed by siphoning and taken from the cell to holding furnaces from which it is poured into molds and cast into aluminum ingots, ballets and pipes according to orders. Our production process for primary aluminum is depicted below:
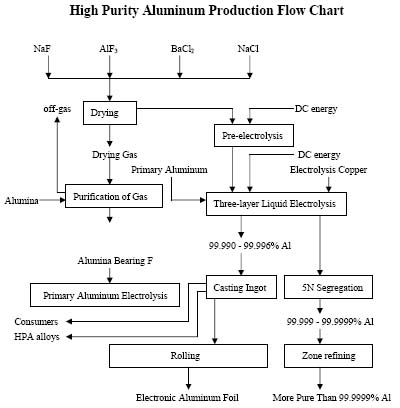
High Purity Aluminum
We are using the three-layer electrolytic process to produce high purity aluminum. Converting industrial-grade primary aluminum manufacturing to high purity aluminum manufacturing requires changes to our technology and our manufacturing facilities. We will not increase the amount of alumina used in the production, but we estimate that the selling prices and profit margins for high purity aluminum will be significantly higher than those for primary aluminum. Our production process for high purity aluminum is depicted below:
Further Improving Our High Purity Aluminum Technology
Our CTO is developing technology for us to produce super high purity aluminum (5N to 6N). Under his license agreement with us, we will have exclusive rights to use this technology. We plan to continue to improve our technology and gradually implement these technologies in our production to produce these much higher value-added aluminum material products. Our objective is to become one of the world’s leading specialized aluminum product suppliers.
Source of High Purity Aluminum Technology
General technological theories and methodologies for making high purity aluminum are well documented and widely shared among metallurgic scholars. However, it is very difficult to apply these theories and methodologies in large-scale commercial production and to produce high purity aluminum in bulk quantity with consistent quality. Among the difficulties are the following:
| · | it is very difficult to develop a set of electrolyte formulas to ensure that the electrolyte remains clean, has high electricity conductivity and a low melting point during production; |
| · | it is very difficult to design a large-scale three-layered liquid electrolytic cell and develop a comprehensive set of equipment to ensure lower consumption of electricity, higher production efficiency and current efficiency; |
| · | it requires specialized technology to produce the cathode of the electrolytic cell to produce consistently high-quality high purity aluminum; |
| · | it is very difficult to optimize the magnetic field, electric field and liquid field in the electrolytic cells to maintain a stable three layers (cathodic layer, electrolyte layer and anodic alloy layer); |
| · | it is very difficult to develop economical production methods to achieve electrical current efficiency over 98%, which allows for a consistently high quality product with lower consumption of electricity; and |
| · | it is very difficult to keep the purity grade of the high purity aluminum between 99.990 and 99.999%. |
Various factors have to be considered, continuously monitored and adjusted precisely to commercially produce aluminum of 99.990-99.996% content. Commercial production of high purity aluminum requires mastery of a combination of specialized know-how, industrial experience and manufacturing expertise. We believe that the only other companies in China that have mastered the manufacturing technologies for high purity aluminum are Joinworld and Guizhou. In addition, we believe that several other better-funded aluminum refineries have attempted to produce high purity aluminum, but that none of them has been successful, further demonstrating the difficulty of commercially producing high purity aluminum. We do not believe that either Joinworld or Guizhou currently has the research and development capability to further improve their existing production process and develop new technologies.
We benefit from our CTO’s many years of research work and commercial application experience. He is widely recognized in China as a foremost expert in advanced light metal production and application technology, especially in high purity aluminum related technologies. In addition, he has hands-on experience in the high purity aluminum industry. In his former work with the Beijing University of Science and Technology, Prof. Lu led several research lab efforts focusing on high purity aluminum production methods and innovation.
Our CTO is a leading metallurgist with significant experience successfully applying his technological developments to allow mass production of high purity aluminum. He was the principal researcher in two high purity aluminum research projects: the “New Electronic Material Grade High Purity Aluminum Production Method and Whole Set Equipment Development” project and the “Large-scale High Purity Aluminum Production Technology” project. These two projects were accepted into the National High Technology Research and Development Program of China (the “863” Program) between 2002 and 2005. The “863” Program was organized and sponsored by the PRC government and administered by the PRC Ministry of Science and Technology to promote research in world-leading technologies in selected areas that will have the greatest impact on technological, economic and social development. The “863” Program projects represent the highest level of technology research efforts in China and, often, in the world. The “863” Program projects are often associated with business enterprises that participate in the commercial implementation of these technologies. Prof. Lu successfully implemented both of his high purity aluminum research projects in cooperation with Joinworld. However, we do not believe that Joinworld has exclusive claims to any of our CTO’s technological developments under the “863” program. He has given us an exclusive license to use his more advanced high purity aluminum technology, has agreed to provide us with his services as our chief technology officer, and has signed an employment agreement with us containing confidentiality provisions.
Our Intellectual Property
We have an exclusive, 50-year license from our CTO to his rights under a pending patent application and related technology for a high purity manufacturing method that he developed. As discussed above under “Source of High Purity Aluminum Technology,” part of the technology that we will use is also used by Joinworld, but the technology covered under the pending patent is exclusively licensed to us. We believe that the technology that is exclusively licensed to us will provide us with a competitive advantage because we expect it to require less capital investment in manufacturing facilities, use less electricity and produce high purity aluminum of more consistently high quality than the technology used by the other manufacturers.
We own one registered trademark issued by the Trademark Office of the State Administration for Industry and Commerce of China, a company logo with the initials of the Chinese words “Fangyuan,” which is the name of our group, and “Kangluu” or “Kanglv,” which are alternate spellings for the shortened name of our aluminum factory.
Raw Materials
In our current primary aluminum manufacturing activities, alumina constitutes 95.4% of the cost of raw materials we use, and raw materials constitute approximately 60% of our total production costs. After we have fully converted to high purity aluminum manufacturing, we expect that alumina will constitute 95.4% of the cost of our raw materials and that raw materials will constitute approximately 42% of our total production costs. As a result, materials purchasing and materials management are important to our profitability. We carefully manage our purchasing efforts and have established company policies involving raw materials procurement.
Supplier Management System
Over the last two years, the prices for raw materials such as alumina have undergone a great deal of fluctuation in China, which has affected our profit margin. According to our purchasing cost, the average prices per metric ton for alumina in 2004 and 2005 were approximately $459 and $505, respectively, and the current price is approximately $618 per metric ton. We have adopted measures to reduce risks in raw material supply, including establishing long term relationships with suppliers, diversifying suppliers and supply sources, and seeking long-term contracts with suppliers.
Purchasing Procedures
Most of our purchasing transactions are conducted in accordance with an established procedure. Potential suppliers are compared objectively according to relevant quality guidelines. After validating the various suppliers’ quality, service and capabilities for stable supply, we acquire the needed materials from the supplier offering at the lowest cost. Our financial department establishes an oversight process by appointing individuals to periodically conduct independent market research of key price points. We have a standard procedure for procurement to insure that all purchasing policies are being adhered to.
Major Suppliers
We do not expect our conversion to high purity aluminum to result in any supplier changes, because our raw- material needs will not change. The table below lists our suppliers from whom we purchased 5% or more (by cost) of our alumina during 2005 and the first six months of 2006
Our Major Suppliers of Alumina
Suppliers | | Amount Purchased in 2005 (millions of U.S. dollars) | | Percentage of Total Purchase in 2005 | | Amount Purchased in Six Months Ending June 30, 2006 (millions of U.S. dollars) | | Percentage of Total Purchase in Six Months Ending June 30, 2006 |
| Shandong Aluminum Company Ltd. | | 14.5 | | 51% | | 2.2 | | 30% |
| Tianjin Youfeng Metals Trading Co. Ltd. | | 9.6 | | 34% | | 0.4 | | 5% |
| Zhibo Zhouchunqu Xinglu Charcoal Material Factory | | 1.5 | | 5% | | 0.6 | | 8% |
| Zhipin Xinfa Alumina Factory Ltd. | | -- | | -- | | 3.9 | | 53% |
Total | | 25.6 | | 90% | | 7.1 | | 96% |
Source: Company Information
Our Major Primary Aluminum Customers
Our current customers for primary aluminum are located in the Liaoning province and other parts of northeastern China. Our primary aluminum customers are large-scale manufacturers for the building materials, automotives, power, transportation and steel industries. Our major customers, based on sales revenue over 5% during 2005 and the first six months of 2006, were as follows:
Major Customers for Our Primary Aluminum Products
Name | | Amount of Sales in 2005 (millions of U.S dollars) | | Percentage of Total Sales in 2005 | | Amount of Sales in Six Months Ending June 30, 2006 (millions of U.S dollars) | | Percentage of Total Sales in Six Months Ending June 30, 2006 |
| Shenyang Fangyuan Group Company Limited* | | 14.0 | | 34% | | Less than 5% | | Less than 5% |
| Ying Kou Liao He Aluminum Fabrication Company Limited | | 7.2 | | 19% | | 4.7 | | 26% |
| Gai Zhou City Jin Hua Zinc & Aluminum Powder Main Factory | | 3.6 | | 9% | | 2.7 | | 15% |
| Shenyang Economic Development Area Enterprise Company | | 2.5 | | 6% | | Less than 5% | | Less than 5% |
| Anshan City Chengchong Special Treatment Company Limited | | Less than 5% | | Less than 5% | | 1.0 | | 6% |
| Yingkou Ruida Aluminum Company Limited | | Less than 5% | | Less than 5% | | 0.9 | | 5% |
Total | | 27.3 | | 67% | | 9.3 | | 52% |
*Shenyang Fangyuan Group Limited (“Fangyuan Group”) is our affiliate of which Mr. Shushun Feng, our Chairman and CEO, owns 80%. By the end of 2006, we plan to have stopped making sales to this customer.
After our conversion to high purity aluminum manufacturing, we expect that we will have an entirely different group of customers in the industrial and personal electronics, aerospace, high-precision instrument and transportation industries.
Our Competition
We are subject to intense competition. In our industry, we compete based upon proprietary technology, product quality, product cost, service and ability to produce a diverse range of products. Most of our competitors, including our expected high purity aluminum competitors, are state-owned. Although the PRC government gives preferential treatment to wholly foreign-owned entities like us, it also favors state-owned enterprises in certain other respects. For example, a state-owned primary aluminum refinery may have priority in obtaining permission to expand its production capacity or may have preferential access to government loans. Some of our competitors have greater financial resources, larger staff, and more established market recognition in both domestic Chinese and international markets than we have.
We generally compete within defined geographic areas because it is not economical to ship aluminum a long distance. Below is a list of the companies we view as our competitors based on the markets in which we sell our products:
Primary Aluminum
Company Name* | | Production Volume in 2004 (in metric tons) |
| Baotou Aluminum (Group) Company Limited | | 228,458 |
| Shandong Xinfa Aluminum Electric Group | | 176,433 |
| Fushun Aluminum Factory | | 162,869 |
Source: 2005 China Industry Analysis Report, CNFMIA
* All of these companies have some state ownership.
Below is a list of the companies we view as our competitors based on the markets in which we plan to sell our new high purity aluminum products:
High Purity Aluminum
| | Production Capacity (in metric tons) |
| Xinjiang Joinworld Aluminum Co, Ltd. | | 15,000 |
| China Aluminum Co. Ltd. Guizhou Branch | | 5,000 |
Source: CNFMIA Report.
* All of these companies have some state ownership.
Regulation
Smoke dust discharges in our manufacturing process are regulated and must meet certain standards under China’s environmental laws and regulations. The local branch of the PRC Administration of Environmental Protection samples and tests our smoke dust discharge regularly. The technology and specifications of these discharges must be consistent with the regulations, relevant laws and standards for industrial waste gas, including the Smoke Dust Discharge Standard for the aluminum industry issued by the PRC Administration of Environmental Protection. We consume industrial water mainly for the cooling of transformers and the casting process of aluminum ingots. Because we used a closed system that recycles cooling-water, our cooling-water discharge in the manufacturing process is not currently regulated. We have passed all of our environmental inspections every year since our inception.
Our business is also regulated by a number of governmental authorities for safe production. The agencies inspect our facilities for safety issues. To date, we have not had any serious industrial accidents.
The local government currently gives us a 20% discount on electricity because we use a large and stable volume of electricity.
Our Employees
As of September 30, 2006, we employed 355 full-time employees with 41 management personnel, five research and development staff, and three sales staff. Ten of the employees have college degrees and two have masters degrees. Our CTO has a Ph.D. in metallurgy from the Northeastern University in China and is a leading metallurgist. We believe that we maintain a satisfactory working relationship with our employees, and we have not experienced any significant labor disputes or any difficulty in recruiting staff for our operations.
As required by applicable PRC law, we have entered into employment contracts with most of our officers, managers and key employees. We are working towards entering into employment contracts with those officers and key employees who do not currently have employment contracts with us. Key employees, including our CTO, will be required to sign a confidentiality agreement prohibiting them from disclosing our trade secrets or using them for purposes other than benefiting us. They will also be required to sign a non-competition agreement prohibiting them from competing with the company for two years after the termination of their employment with the company. Our CTO’s license agreement with us contains a long-term confidentiality provision.
Our employees in China participate in a state pension scheme organized by Chinese municipal and provincial governments. We are required to contribute to the scheme at rates ranging from 8% to 20% of the average monthly salary. In addition, we are required by PRC law to cover employees in China with other types of social insurance. Our total contribution, including pension contributions, may amount to as much than 30% or more of the average employee’s monthly salary. As required by PRC law, we have purchased state-administered social insurance for all of our employees. Social insurance expenses were approximately $26,900 and $33,900 for fiscal years 2005 and 2004, respectively.
Our Facilities
All land in China is owned by the State. Individuals and companies are permitted to acquire rights to use land for specific purposes. In the case of land used for industrial purposes, the land use rights are granted for a period of 50 years. This period may be renewed at the expiration of the initial and any subsequent terms. Granted land-use rights are transferable and may be used as security for borrowing and other obligations. We currently have land-use rights to approximately 28 acres of land consisting of manufacturing facilities, employee quarters, warehouses and office buildings in Kangping County, Liaoning Province, China. In addition, we have rented approximately 3 acres of land in the adjacent area of our owned land for 52 years from 2002. Our headquarters are located in Shenyang City, Liaoning Province, China with a leased space of approximately 1,561 square feet.
The main equipment and machinery of our business includes power substations, transformers, electrolytic cells, environmental equipment, air and water supply equipment, a chemical lab, maintenance equipment, quality-testing instruments and vehicles.
We believe that all our properties and equipment have been adequately maintained, are generally in good condition, and are suitable and adequate for our business.
We insure our facilities and equipment against natural disasters and improper handling. Our vehicles are insured against accidents and damages.
Our History
We were organized as a Nevada corporation on January 25, 1996 under the name of Pinnacle Management Group, Inc. We subsequently changed our name to “Apex Capital Group, Inc.” on February 6, 1996. We conducted no material operations from the date of our organization until the date of the Securities Exchange Agreement.
Kangping Aluminum was established as a PRC domestic limited liability company on May 28, 1998 upon the issuing of a business license by the Administration for Industry and Commerce of Shenyang City in Liaoning Province, China. Prior to August 22, 2006, Kangping Aluminum was 80% owned by Fangyuan Group, which in turn is 90% owned by Mr. Shushun Feng and 10% owned by his wife, Ms. Yuying Liu. Ms. Liu owned the remaining 20% of Kangping Aluminum. On August 22, 2006, Fangyuan Group transferred its 80% equity interest in Kangping Aluminum to Mr. Feng making Mr. Feng and Ms. Liu the sole owners of Kangping Aluminum.
Elwin was incorporated in the British Virgin Islands on November 5, 2004. On May 18, 2005, Elwin incorporated a wholly-owned subsidiary, Elwin Non-Ferrous Metals Co., Limited (“ENFML”), in accordance with the laws of the PRC. ENFML has been operationally dormant since its date of incorporation. As of October 26, 2006, Elwin has paid $100,000 of $1 million total required capitalization of ENFML.
On August 10, 2006, Elwin entered into an agreement with Mr. Feng and Ms. Liu to acquire 100% of the equity of Kangping Aluminum in exchange for cash consideration of RMB 133.21 million (approximately $16.8 million). On August 28, 2006, Elwin received approval from the Economic and Trade Bureau of Liaoning Province, China, for this acquisition and, on September 4, 2006, Kangping Aluminum obtained a license to become a wholly foreign-owned enterprise.
On September 6, 2006, we entered into, and on October 26, 2006, we consummated, the Securities Exchange Agreement with Elwin and Elwin’s shareholders pursuant to which Elwin’s shareholders transferred all of the equity securities of Elwin to us in exchange for shares of our common stock. Upon the closing of the share exchange, we issued to Elwin’s shareholders an aggregate of 29,190,241 shares of our common stock in exchange for their equity securities of Elwin. As a result, Elwin, which is the sole owner of Kangping Aluminum, became our wholly-owned subsidiary. Elwin owns all of the equity securities of Kangping Aluminum.
On October 26, 2006, in connection with the closing of the share exchange, our directors and officers resigned and were replaced by Shushun Feng as director, Chief Executive Officer, and President; Huimin Lu, as director, Vice President and Chief Technology Officer; and Chris Wu, as Vice President and Chief Financial Officer.
Immediately prior to the completion of the share exchange, Dempsey Mork, our then-current director, President, Secretary and Treasurer, beneficially owned 94.8% of our common stock. Upon the completion of the share exchange, Mr. Shushun Feng owned 24.5% of our common stock, Ms. Fei Feng owned 19.9% of our common stock and Aviate Investments Ltd. owned 14.5% of our common stock.
The evolution of our corporate structure is depicted in the following charts:
Before the Restructuring of Kangping Aluminum’s Ownership:
Following the Restructuring of Kangping Aluminum’s Ownership:
Following the Securities Exchange:
There are no pending legal proceedings to which we or our properties are subject.
MANAGEMENT’S DISCUSSION AND ANALYSISOF RESULTS OF OPERATIONS AND FINANCIAL CONDITION
General
The transactions described below under “reorganization” have been accounted for as a reverse acquisition presented as a recapitalization, except no goodwill or other intangible assets have been recorded. The acquisition of a private operating company by a non-operating public shell corporation with nominal net assets typically results in the owners and management of the private company having actual or effective operating control of the combined companies after the transaction, with shareholders of the former public shell continuing only as passive investors. These transactions are considered to be capital transactions in substance, rather than business combinations. That is, the transaction is equivalent to the issuance of stock by the private company for the net monetary assets of the shell corporation, accompanied by a recapitalization. For accounting purposes, Kangping Aluminum is deemed to be the acquirer.
Accordingly, following the acquisition by the shell corporation, the financial statements of Kangping Aluminum became the historical financial statements of Apex and, since Kangping Aluminum and Apex are under common control, the Apex financial statements are presented on a consolidated basis with Kangping Aluminum, Elwin and subsidiary and Apex.
Unless otherwise stated, this management discussion and analysis refers to Kangping Aluminum, the main operating unit of Apex, and all amounts are in U.S. dollars. The following discussion and analysis should be read in conjunction with the audited financial statements of Kangping Aluminum for the years ended December 31, 2003, 2004 and 2005, the unaudited financial statements as of and for the six months ended June 30, 2006 of Kangping Aluminum and their related notes included elsewhere in this filing.
Overview
We manufacture, market and sell a variety of primary aluminum products including ingots, bars and pipes. Our refined manufacturing operations involve the extraction of aluminum from aluminum oxide (alumina) through electrolysis processes commonly known as smelting. We further process the extracted liquid aluminum into primary aluminum ingots, bars and pipes through different casting processes. We market and sell primary aluminum products for the commercial aluminum product market consisting of foundries, fabricators and others, as well as finished aluminum products for the energy, electric power, railway, automotive, construction, mechanics, electronic appliance and consumer goods industries.
Reorganization
We were organized as a Nevada corporation on January 25, 1996 under the name of Pinnacle Management Group, Inc. We subsequently changed our name to Apex Capital Group, Inc. on February 6, 1996. We conducted no material operations from the date of our organization until the date of the Securities Exchange Agreement.
Kangping Aluminum was established as a PRC domestic limited liability company on May 28, 1998 upon the issuing of a business license by the Administration for Industry and Commerce of Shenyang City in Liaoning Province, China. Prior to August 22, 2006, Kangping Aluminum was 80% owned by Fangyuan Group, which in turn is 90% owned by Mr. Shushun Feng and 10% owned by his wife, Ms. Yuying Liu. Ms. Liu owned the remaining 20% of Kangping Aluminum. On August 22, 2006, Fangyuan Group transferred its 80% equity interest in Kangping Aluminum to Mr. Feng making Mr. Feng and Ms. Liu the sole owners of Kangping Aluminum.
Elwin was incorporated in the British Virgin Islands on November 5, 2004. On May 18, 2005, Elwin incorporated a wholly-owned subsidiary, Elwin Non-Ferrous Metals Co., Limited (“ENFML”), in accordance with the laws of the PRC. ENFML has been operationally dormant since its date of incorporation. As of October 26, 2006, Elwin has paid $100,000 of $1 million total required capitalization of ENFML.
On August 10, 2006, Elwin entered into an agreement with Mr. Feng and Ms. Liu to acquire 100% of the equity of Kangping Aluminum in exchange for newly issued Elwin shares and cash consideration of RMB 133.21 million (approximately $16.8 million). On August 28, 2006, Elwin received approval from the Economic and Trade Bureau of Liaoning Province, China, for this acquisition and, on September 4, 2006, Kangping Aluminum obtained a license to become a wholly foreign-owned enterprise.
On September 6, 2006, we entered into, and on October 26, 2006, we consummated, the Securities Exchange Agreement with Elwin and Elwin’s shareholders pursuant to which the Elwin’s shareholders transferred all of the equity securities of Elwin to us in exchange for shares of our common stock. Upon the closing of the share exchange, we issued to Elwin’s shareholders an aggregate of 29,190,241 shares of our common stock in exchange for their equity securities of Elwin. As a result, Elwin, which is the sole owner of Kangping Aluminum, became our wholly-owned subsidiary. Elwin owns all of the equity securities of Kangping Aluminum.
Sales
We currently derive our revenues from the sales of primary aluminum. The most significant factors that directly or indirectly affect our sales are as follows:
| · | Pricing of aluminum in the futures market of the Shanghai Futures Exchange. Typically, we benchmark our sales prices to the futures prices for aluminum on the Shanghai Futures Exchange. Generally speaking, the higher the futures prices are on the Shanghai Futures Exchange, the higher our selling price is. |
| · | Pricing of aluminum in international markets such as the London Metal Exchange. Although most of our customers are located in the PRC, price fluctuations in international markets also affect our sales. Generally speaking, proven trends of price rallies in the international markets may result in more sales, as customers anticipate that prices will continue to increase. |
| · | Manufacturing capacity of primary aluminum. Our manufacturing capacity of primary aluminum is approximately 25,000 metric tons per year, which is approximately the same capacity we have had since 2003. Beginning in June 2006, we have reduced our manufacturing capacity due to the conversion of our production facilities to produce high purity aluminum. We anticipate completion of this conversion by the end of 2007, assuming we are able to obtain sufficient funding on a timely basis. We anticipate that we will no longer sell refined aluminum following the conversion. |
| · | Industry demand. Our downstream industry includes construction, electronics, infrastructure and energy. Due to the rapid growth of the above-mentioned industries in China over the last decade, there has been significant demand for our products. |
Cost of Sales
Cost of sales depends substantially on two factors: the cost of alumina and the cost of electricity. These two factors represent approximately 90% of our cost of sales in 2005.
Cost of alumina. Cost of alumina typically fluctuates in line with the general trend of primary aluminum. We have long-term relationships with our major alumina suppliers and have developed a network of backup suppliers. Our average cost of alumina per metric ton was $459 in 2004, $505 in 2005 and $618 for the first six months of 2006. Historically, the cost of alumina accounts for approximately 60% of our cost of sales.
Electricity Cost. Our production plant is located in a remote village in Shenyang. This geographic location has provided us with a relatively stable supply of electricity from a local branch of the Shenyang Electricity Company. Electricity tariffs vary from one location to another location within China. Our electricity tariff is low in comparison to some locations in southeastern China, but high in comparison to some northwestern regions. We have obtained an electricity concession of 20% off of the standard city electricity rate from the provincial government of Liaoning since July, 2000. We have netted off this discount in our financial statements for the years ended December 31, 2005, 2004 and 2003 in the cost of goods sold wholly in the discount years. Currently, there is no predicted date as to if and when this discount will be adjusted or terminated.
Gross Profit
Our gross profit has been affected by many factors, including the demand for our products, the average selling price of our products, the cost of alumina, and the cost of electricity used in the manufacturing of our products.
Operating Expenses
Operating expenses consist of sales and marketing and general and administrative expenses. Sales and marketing expense consists primarily of (a) salaries (b) commissions, (c) travel, lodging and other out-of-pocket expenses, (d) rebates for customers and (e) other related overhead. We expect our sales and marketing expense to grow for the foreseeable future as we further increase our sales. We expect that we will employ more sales staff and pay more commissions based on growing sales.
General and administrative expense consists primarily of salaries, insurance fees, leases for housing and property and other related overhead. We expect our general and administrative expenses to continue to increase. As a public company, we will incur additional expenses related to costs of compliance with securities laws and regulations, including increased audit and legal fees and investor relations expenses.
Kangping Aluminum’s Critical Accounting Policies and Estimates
Sales Recognition
We recognize sales when the significant risks and rewards of ownership have transferred pursuant to PRC law, including factors such as persuasive evidence that an arrangement exists, passage of title, the sales price being fixed and determinable, sales and value-added tax laws having been complied with and collectibility being reasonably assured. In the event goods are returned from a customer, revenues are reduced, and returned goods are placed back into inventory during the period that we receive the returned goods. Returns are immaterial for all periods presented.
Allowance for Doubtful Accounts
Payment terms of delivered sales to unrelated parties generally are cash or banker’s acceptance. For those sales where credit is extended, we recognize an allowance for doubtful accounts to ensure that accounts receivable are not overstated due to uncollectibility. Bad debt reserves are maintained for customers based on a variety of factors, including the length of time receivables are past due, significant one-time events and historical experience. An additional reserve for individual accounts is recorded when we become aware of a customer’s inability to meet its financial obligation, such as in the case of bankruptcy filings or deterioration in the customer’s operating results or financial position. If circumstances related to customers change, estimates of the recoverability of receivables would be further adjusted. As of December 31, 2005 and 2004, the allowance for doubtful accounts was $0.
Inventories
Inventories are stated at the lower of cost or market. Substantially all inventory costs are determined using the weighted-average method. Inventory costs do not exceed net realizable value.
Related Party Receivable
Related party receivable is an amount due from Fangyuan Group primarily for accounts receivable from sales and advances. We have classified related party receivable in two parts, one under current assets and the other one under owners’ equity. The related party receivable classified under current assets on the 2005 balance sheet was fully repaid by June 30, 2006, and the related party receivable classified under current assets on the 2004 balance sheet was fully repaid by July 19, 2005. The related party receivable classified under owners’ equity represents the unpaid balance as of the dates of those payments.
Cost of Goods Sold
We have obtained an electricity concession of 20% off of the standard city electricity rate from the provincial government of Liaoning since July 2000. We have netted off this discount in our financial statements for the years ended December 31, 2005, 2004 and 2003 in the cost of goods sold wholly in the discount year. Currently, there is no date as to if and when this discount will be adjusted or terminated.
Foreign Currency Translation
Our balance sheet accounts are translated into U.S. dollars at the year-end exchange rates and all sales and expenses are translated into U.S. dollars at the average exchange rates prevailing during the periods in which these items arise. Translation gains and losses are deferred and accumulated as a component of other comprehensive income in owners’ equity. Transaction gains and losses that arise from exchange rate fluctuations from transactions denominated in a currency other than the functional currency are included in the statement of operations as incurred. Translation gains of $627,236 were recorded for the year ended December 31, 2005, and were immaterial for the years ended December 31, 2004 and 2003. Transaction gains and losses were immaterial for the years ended December 31, 2005, 2004 and 2003.
Kangping Aluminum’s Results of Operations (all amounts in U.S. dollars)
Comparison of the six months ended June 30, 2006 to the six months ended June 30, 2005.
Sales
| | Six months ended June 30, | | | | |
| | 2005 (unaudited) | | 2006 (unaudited) | | Period-to-Period Change |
| | Amount ($) | | Percentage of Total Sales | | Amount ($) | | Percentage of Total Sales | | Amount ($) | | Percentage |
| Sales by type | | | | | | | | | | | |
- Unrelated parties | 10,875,793 | | 73.6% | | 17,697,440 | | 96.9% | | 6,821,647 | | 62.7% |
- Related parties | 3,909,841 | | 26.4% | | 571,234 | | 3.1% | | (3,338,607) | | (85.4%) |
| Total sales | 14,785,634 | | 100.0% | | 18,268,674 | | 100.0% | | 3,483,040 | | 23.6% |
Net Sales. Net sales increased approximately $3.5 million, or 23.6%, from $14.8 million for the six months ended June 30, 2005 to $18.3 million for the six months ended June 30, 2006. The increase for the six months ended June 30, 2006 is attributable to an increased average selling price of aluminum. Our average selling price of primary aluminum per metric ton for the first six months increased 25.7% from approximately $1,700 in 2005 to $2,200 in 2006.
Sales to related parties. Sales to related parties refers to sales to Fangyuan Group, a company owned 90% by Mr. Shushun Feng, our President and CEO, and 10% by his wife. Such sales decreased by $3.3 million, or 85%, from $3.9 million to $0.6 million for the six months ended June 30, 2005 and 2006, respectively. This decrease is the result of a Company initiative to minimize reliance on related party sales and to end such practices by the end of 2006.
Cost of Sales and Gross Profit
| | Six months ended June 30, | | | | |
| | 2005 (unaudited) | | 2006 (unaudited) | | Period-to-Period Change |
| | Amount ($) | | Percentage of Total Sales | | Amount ($) | | Percentage of Total Sales | | Amount ($) | | Percentage |
| Cost of sales | 12,841,255 | | 86.9% | | 15,773,226 | | 86.3% | | 2,931,971 | | 22.8% |
| Gross Profit | 1,944,379 | | 13.1% | | 2,495,448 | | 13.7% | | 551,069 | | 28.3% |
Cost of Sales. Cost of sales increased $2.9 million, or 22.8%, from $12.8 million for the six months ended June 30, 2005 to $15.8 million for the six months ended June 30, 2006. The increase in cost of sales is a result of a 23.6% increase in sales volume over the same period.
Gross Profit. Gross profit increased $0.6 million. This increase is mainly the result of an increase in sales. The change in gross profit margin is not material.
Operating Expenses
| | Six months ended June 30, | | | | |
| | 2005 (unaudited) | | 2006 (unaudited) | | Period-to-Period Change |
| | Amount ($) | | Percentage of Total Sales | | Amount ($) | | Percentage of Total Sales | | Amount ($) | | Percentage |
| Operating expenses | | | | | | | | | | | |
| Depreciation | 60,958 | | 0.4% | | 63,734 | | 0.4% | | 2,776 | | 4.6% |
| General and administrative | 225,547 | | 1.5% | | 255,710 | | 1.4% | | 30,163 | | 13.4% |
| Total operating expenses | 286,505 | | 1.9% | | 319,444 | | 1.8% | | 32,939 | | 11.5% |
General and Administrative. General and administrative expense increased $0.03 million, or 13.4%, from $0.23 million for the six months ended June 30, 2005 to $0.25 million for the six months ended June 30, 2006. General and administrative expense has remained stable due primarily to the fact that there was no material change in staff headcount from 2005 to 2006.
Interest Income, Income Tax and Net Income
| | Six months ended June 30, | | | | |
| | 2005 (unaudited) | | 2006 (unaudited) | | Period-to-Period Change |
| | Amount ($) | | Percentage of Total Sales | | Amount ($) | | Percentage of Total Sales | | Amount ($) | | Percentage |
| Interest Income | 579,768 | | 3.9% | | 266,633 | | 1.5% | | (313,135) | | (54.0%) |
| Income before provision for income taxes | 1,446,418 | | 9.8% | | 1,596,795 | | 8.8% | | 150,377 | | 10.4% |
| Income Tax | 561,232 | | 3.8% | | 573,288 | | 3.1% | | 12,056 | | 2.1% |
| Net Income | 885,186 | | 6.0% | | 1,023,507 | | 5.6% | | 138,321 | | 15.6% |
Interest Income. Interest income principally is generated from our related party receivable, currently due solely from Fangyuan Group. Interest income reduced $0.3 million, or 54.0%, from $0.6 million to $0.3 million for the six months ended June 30, 2005 & 2006, respectively. The decrease reflects a reduction of the average outstanding receivable balance from Fangyuan Group to Kangping Aluminum in the first six months in 2006 compared to 2005.
Income Tax. Income tax increased $0.01 million, or 2.1%, from $0.56 million for the six months ended June 30, 2005 to $0.57 million for the six months ended June 30, 2006. There is no material fluctuation noted with respect to this item.
Net Income. Net income increased $0.1 million, an increase of 15.6%, from $0.9 million for the six months ended June 30, 2005 to $1.0 million for the six months ended June 30, 2006. The reason for such an increase was primarily an increase of sales volume.
Comparison of the year ended December 31, 2005 to the year ended December 31, 2004
Sales
| | Year ended December 31, | | | | |
| | 2004 | | 2005 | | Year-to-Year Change |
| | Amount ($) | | Percentage of Total Sales | | Amount ($) | | Percentage of Total Sales | | Amount ($) | | Percentage |
| Sales by type | | | | | | | | | | | |
- Unrelated parties | 33,616,221 | | 76.7% | | 26,370,255 | | 65.7% | | (7,245,966) | | (21.6%) |
- Related parties | 10,204,957 | | 23.3% | | 13,757,972 | | 34.3% | | 3,553,015 | | 34.8% |
| Total sales | 43,821,178 | | 100.0% | | 40,128,227 | | 100.0% | | (3,692,951) | | (8.4%) |
Net Sales. Net sales for the year decreased $3.7 million, or 8.4%, to $40.1 million in 2005 from $43.8 million in 2004. The decrease was caused by a $4.4 million reduction in production volume due to the machinery maintenance, coupled with an intentional accumulation of inventory of $2.9 million, offset by a $3.6 million increase in sales to related party (Fangyuan Group).
Cost of Sales and Gross Profit
| | Year ended December 31, | | | | |
| | 2004 | | 2005 | | Year-to-Year Change |
| | Amount ($) | | Percentage of Total Sales | | Amount ($) | | Percentage of Total Sales | | Amount ($) | | Percentage |
| Cost of Sales | 39,306,630 | | 89.7% | | 34,430,828 | | 85.8% | | (4,875,802) | | (12.4%) |
| Gross Profit | 4,514,548 | | 10.3% | | 5,697,399 | | 14.2% | | 1,182,851 | | 26.2% |
Cost of Sales. Cost of sales decreased by $4.9 million, or 12.4%, from $39.3 million for the year ended December 31, 2004 to $34.4 million for the year ended December 31, 2005. The decrease was due to an approximately 4,500 ton volume reduction in 2005 (a $6.9 million decrease) and an approximately $0.4 million decrease due to decreases in costs of chemical components apart from alumina, and offset by an approximately $2.4 million increase due to alumina price increases. The average price of alumina per metric ton was $459 in 2004 and $505 in 2005.
Gross Profit. Gross profit increased $1.2 million, or 26.2%, from $4.5 million for the year ended December 31, 2004 to $5.7 million for the year ended December 31, 2005. Such increase was attributable to $2.0 million increase due to an improved gross profit margin being offset by a $0.8 million decrease due to the reduction in sales volume.
Operating Expenses
| | Year ended December 31, | | | | |
| | 2004 | | 2005 | | Year-to-Year Change |
| | Amount ($) | | Percentage of Total Sales | | Amount ($) | | Percentage of Total Sales | | Amount ($) | | Percentage |
| Operating expenses | | | | | | | | | | | |
| Depreciation | 125,058 | | 0.3% | | 128,819 | | 0.3% | | 3,761 | | 3.0% |
| General and administrative | 646,526 | | 1.5% | | 192,577 | | 0.5% | | (453,949) | | (70.2%) |
| Total operating expenses | 771,584 | | 1.8% | | 321,396 | | 0.8% | | (450,188) | | (58.4%) |
General and administrative expenses. General and administrative expenses decreased by $0.5 million, or 70%, to $0.19 million for the year ended December 31, 2005, from $0.65 million for the year ended December 31, 2004. The decrease was primarily due to a special stock count gain of $0.25 million in the year 2005 and a decrease of $0.2 million in professional fees.
Interest Income, Income Tax and Net Income
| | Year ended December 31, | | | | |
| | 2004 | | 2005 | | Year-to-Year Change |
| | Amount ($) | | Percentage of Total Sales | | Amount ($) | | Percentage of Total Sales | | Amount ($) | | Percentage |
| Interest Income | 1,007,289 | | 2.3% | | 959,232 | | 2.4% | | (48,057) | | (4.8%) |
| Income before provision for income taxes | 3,168,506 | | 7.2% | | 4,699,409 | | 11.7% | | 1,530,903 | | 48.3% |
| Income Tax | 1,045,609 | | 2.4% | | 1,626,367 | | 4.1% | | 580,758 | | 55.5% |
| Net Income | 2,122,897 | | 4.8% | | 3,073,042 | | 7.7% | | 950,145 | | 44.8% |
Interest Income. Interest income decreased by $0.05 million, or 4.8%, to $0.96 million for the year ended December 31, 2005, from $1.01 million for the year ended December 31, 2004. The decrease in interest income was attributable to the slightly lower average balance of related party receivable in 2005 compared to that in 2004.
Income Tax. Income tax increased by $0.6 million, or 55.5%, to $1.6 million for the year ended December 31, 2005, from $1.0 million for the year ended December 31, 2004. Such increase is primarily due to the increase in profit assessable for income tax in 2005 compared to that in 2004. There was no material change in the statutory tax rate applicable to us between the years ended December 31, 2004 and 2005.
Net Income. Net income increased by $1.0 million, an increase of 44.8%, to $3.1 million for the year ended December 31, 2005 from $2.1 million for the year ended December 31, 2004. The reasons for such increase were primarily an improved gross profit margin and a reduction in general and administrative expenses.
Comparison of the year ended December 31, 2004 to the year ended December 31, 2003
Sales
| | Year ended December, | | | | |
| | 2003 | | 2004 | | Year-to-Year Change |
| | Amount ($) | | Percentage of Total Sales | | Amount ($) | | Percentage of Total Sales | | Amount ($) | | Percentage |
| Sales by type | | | | | | | | | | | |
-Unrelated parties | 29,680,549 | | 70.8% | | 33,616,221 | | 76.7% | | 3,935,672 | | 13.3% |
- Related parties | 12,270,345 | | 29.3% | | 10,204957 | | 23.3% | | (2,065,388) | | (16.8%) |
| Total sales | 41,950,894 | | 100.0% | | 43,821,178 | | 100.0% | | 1,870,284 | | 4.5% |
Net Sales. Net sales increased $1.8 million, or 4.5%, to $43.8 million for the year ended December 31, 2004, from $42.0 million for the year ended December 31, 2003. Such increase was attributable to a $3.9 million increase in sales to 3 major unrelated customers, offset by a $2.1 million reduction of sales to a related party (Fangyuan Group).
Sales to related parties. Sales to related parties decreased by $2.1 million, or 16.8%, to $10.2 million for the year ended December 31, 2004, from $12.3 million for the year ended December 31, 2003. Such decrease was solely due to weaker customer demand from Fangyuan Group in 2004 compared to that in 2003.
Cost of Sales and Gross Profit
| | Year ended December 31, | | | | |
| | 2003 | | 2004 | | Year-to-Year change |
| | Amount ($) | | Percentage of Total Sales | | Amount ($) | | Percentage of Total Sales | | Amount ($) | | Percentage |
| Cost of Sales | 36,723,472 | | 87.5% | | 39,306,630 | | 89.7% | | 2,583,158 | | 7.0% |
| Gross Profit | 5,227,422 | | 12.5% | | 4,514,548 | | 10.3% | | (712,874) | | (13.6%) |
Cost of Sales. Cost of sales increased $2.6 million, or 7.0%, to $39.3 million for the year ended December 31, 2004 from $36.7 million for year ended December 31, 2003. Such increase was mainly attributable to a 5% increase in raw material costs in 2004 compared to that in 2003.
Gross Profit. Gross profit decreased by $0.7 million, or 13.6%, from $5.2 million to $4.5 million for the years ended December 31, 2003 and 2004, respectively. Such decrease was primarily due to an increase in raw material costs.
Operating Expenses
| | Year ended December 31, | | | | |
| | 2003 | | 2004 | | Year-to-Year Change |
| | Amount ($) | | Percentage of Total Sales | | Amount ($) | | Percentage of Total Sales | | Amount ($) | | Percentage |
| Operating expenses | | | | | | | | | | | |
| Depreciation | 120,500 | | 0.3% | | 125,058 | | 0.3% | | 4,558 | | 3.9% |
| General and administrative | 495,404 | | 1.2% | | 646,526 | | 1.5% | | 151,122 | | 30.5% |
| Total operating expenses | 615,904 | | 1.5% | | 771,584 | | 1.8% | | 155,680 | | 25.3% |
General and Administrative. General and administrative expenses increased $0.15 million, or 30%, to $0.65 million for the year ended December 31, 2004 from $0.50 million for the year ended December 31, 2003. Such increase was due to an audit fee of approximately $0.15 million in 2004 compared with no such fee in 2003.
Interest Income, Income Tax and Net Income
| | Year ended December 31, | | | | |
| | 2003 | | 2004 | | Year-to-Year Change |
| | Amount ($) | | Percentage of Total Sales | | Amount ($) | | Percentage of Total Sales | | Amount ($) | | Percentage |
| Interest Income | 885,309 | | 2.1% | | 1,007,289 | | 2.3% | | 121,980 | | 13.8% |
| Income before provision for income taxes | 4,347,327 | | 10.4% | | 3,168,506 | | 7.2% | | (1,178,821) | | (27.1%) |
| Income Tax | 1,127,613 | | 2.7% | | 1,045,609 | | 2.4% | | (82,004) | | (7.3%) |
| Net Income | 3,219,714 | | 7.7% | | 2,122,897 | | 4.8% | | (1,096,817) | | (34.1%) |
Interest Income. Interest income increased $0.12 million, or $13.8%, to $1.01 million for the year ended December 31, 2004, from $0.89 million for the year ended December 31, 2003. The major factor is the higher average balance of the receivable from related party (Fangyuan Group) in 2004 compared to that in 2003.
Income Tax. Income tax decreased by $0.1 million, or 7.3%, to $1.0 million for the year ended December 31, 2004, from $1.1 million for the year ended December 31, 2003. The decrease is mainly attributable to the reduction of tax payable under the current tax rate of $0.41 million offset by a tax exemption during the first quarter in 2003 of $0.31 million. Pursuant to relevant laws and regulations in the PRC, Kangping Aluminum received an exemption from PRC income tax for three years from April 1, 2000 to March 31, 2003. From April 1, 2004, Kangping Aluminum has been subject to income tax at the statutory rate of 33%.
Net Income. Net income decreased by $1.1 million, or 34.1%, to $2.1 million for the year ended December 31, 2004, from $3.2 million for the year ended December 31, 2003. The reasons for such decrease were primarily an increase in raw material costs and an increase in general and administrative expenses.
Liquidity and Capital Resources
Kangping Aluminum’s principal source of liquidity is operating cash flows, which are derived from net income.
| | | Year ended December 31, | | Six months ended June 30, |
| | | 2003 | | 2004 | | 2005 | | 2005 (unaudited) | | 2006 (unaudited) |
| Cash and cash equivalents | | 1,908,537 | | 329,398 | | 118,084 | | 42,894 | | 4,429,101 |
| Accounts receivables, net | | 73,230 | | 300,040 | | 276,544 | | 662,961 | | 2,738,703 |
| Working capital, net | | (23,090,599) | | 8,831,759 | | 15,845,304 | | 22,187,670 | | 15,258,780 |
| | | | | | | | | | | |
| Net Cash Provided in / (Used by) Operating Activities | | (13,578,076) | | 7,183,301 | | 5,355,620 | | 2,407,705 | | 712,792 |
| Net Cash Provided in / (Used by) Investing activities | | (893,959) | | (729,240) | | (348,038) | | (36,596) | | (21,499) |
| Net Cash Provided in / (Used by) Financing activities | | 16,006,000 | | (8,033,200) | | (5,201,131) | | (2,657,613) | | 3,600,204 |
| Effect Of Exchange Rate Changes On Cash | | - | | - | | (17,766) | | - | | 19,520 |
| Net Increase (Decrease) In Cash Equivalents | | 1,533,966 | | (1,579,139) | | (211,314) | | (286,504) | | 4,311,017 |
For the year ended December 31, 2005, Kangping Aluminum’s operations generated $5.4 million of positive cash flow. For the year ended December 31, 2004, Kangping Aluminum’s operations generated $7.2 million of positive cash flow. The year-over-year decrease in cash flow generation from operations was mainly due to an increase in prepayments to suppliers. Cash used in investing activities was $0.35 million and $0.73 million for the years ended December 31, 2005 and 2004, respectively. Investing activities included the purchase of production equipment and payment of construction in progress. Net cash used in financing activities was $5.2 million and $8.0 million for the years ended December 31, 2005 and 2004, respectively. The reduction in cash used in relation to financing activities was due to a lower payment amount of notes payable in 2005 compared to 2004. As of December 31, 2005, Kangping Aluminum had cash and cash equivalents of $0.12 million.
The working capital of Kangping Aluminum was $15.8 million and $8.8 million as of December 31, 2005 and December 31, 2004, respectively. The $7.0 million increase in working capital was primarily due to the $4.1 million increase in restricted cash and a $3.3 million increase in inventory offset by a $0.4 million decrease in other items. The increase of $4.1 million in restricted cash in 2005 was due to restricted cash deposited as collateral to cover bank-issued notes used to pay vendor invoices. The $3.3 million increase in inventory in 2005 was due to management’s decision to increase the inventory of finished goods in anticipation of increased sales prices in 2006.
The outstanding principal amount of Kangping Aluminum’s formerly outstanding short-term loan was reduced to $4.0 million from $4.8 million as of December 31, 2005 and 2004, respectively. As of December 31, 2005, the loan carried an annual interest rate of 6.138% and was repayable in three unequal installments as follows: March 10, 2006, $1,550,003; April 10, 2006, $1,240,002; and May 10, 2006, $1,240,003. The loan was guaranteed by the Fangyuan Group and collateralized by the Company’s land-use rights, buildings and leasehold improvements with a book value of $6,388,148, and accumulated depreciation and amortization of $797,457.
On March 9, 2006, the Company obtained a new short-term loan facility of $3,844,000 from the same financial institution. The new short-term loan facility was drawn down on March 10, 2006 to refinance a portion of the original short-term loan. The original short-term loan was fully repaid on March 10, 2006. The new short-term loan matures on January 1, 2007 and carries an annual interest rate of 6.138%.
Kangping Aluminum’s long-term loan increased to $19.3 million from $19.1 million as of December 31, 2005 and 2004, respectively. On December 25, 2005, the Company agreed with a financial institution to extend the maturity dates of three of its outstanding individual loan facilities totaling approximately $19,300,000. The loans, which were due on December 15, 2006, December 20, 2006, and December 25, 2006, have been extended to each mature on December 25, 2007. The loans are secured by three guarantees issued by the Fangyuan Group in favor of the issuing bank, and bear interest at rates of 5.879%, 6.912% and 6.912% per year, respectively. No principal installment payments are due on the loans prior to the revised maturity date.
Following the Securities exchange, we expect most of the operating cash flow will be used for the conversion to high purity aluminum manufacturing. Thus, Kangping Aluminum’s future liquidity and capital resources may be substantially different from the historic figures discussed above.
Kangping Aluminum’s Contractual Obligations and Contingent Liabilities
As of December 31, 2005, we have the following material contractual obligations (in U.S. dollars):
Nature \ Maturity | | | Total | | | Less than 1 year | | | 1-3 years | | | 3-5 years | | | > 5 years | |
| Short-term Loans | | | 4,030,008 | | | 4,030,008 | | | | | | | | | - | |
| Long-term Loans | | | 19,282,038 | | | - | | | 19,282,038 | | | - | | | - | |
| Other Payables | | | 1,365,600 | | | 1,365,600 | | | | | | - | | | - | |
| Accounts Payables | | | 1,260,479 | | | | | | | | | - | | | - | |
| Tax Payables | | | 1,157,938 | | | | | | | | | - | | | - | |
| TOTAL | | | 27,096,063 | | | | | | | | | | | | - | |
New Accounting Pronouncements
In December 2004, FASB issued SFAS No. 123R, "Share-Based Payment, an Amendment of SFAS No. 123." SFAS No. 123R requires companies to recognize in the statement of operations the grant-date fair value of stock options and other equity-based compensation issued to employees. SFAS No. 123R is effective beginning in the Company's first quarter of fiscal 2006. The Company is in process of evaluating the impact of this pronouncement on its financial position.
In December 2004, FASB issued SFAS No. 153, "Exchanges of Non-monetary Assets." The Statement is an amendment of APB Opinion No. 29. SFAS No. 153 eliminates the exception for nonmonetary exchanges of similar productive assets and replaces it with a general exception for exchanges of nonmonetary assets that do not have commercial substance. The Company believes that the adoption of this standard will have no material impact on its financial statements.
In May 2005, FASB issued SFAS No. 154, "Accounting Changes and Error Corrections - a replacement of APB Opinion No. 20 and FASB Statement No. 3" ("SFAS 154"). SFAS 154 changes the requirements for the accounting for and reporting of a change in accounting principle. These requirements apply to all voluntary changes and changes required by an accounting pronouncement in the unusual instance that the pronouncement does not include specific transition provisions. SFAS 154 is effective for fiscal years beginning after December 15, 2005. As such, the Company is required to adopt these provisions at the beginning of the fiscal year ended December 31, 2006. The Company is currently evaluating the impact of SFAS 154 on its consolidated financial statements. In March 2005, FASB issued Interpretation No. 47, "Accounting for Conditional Asset Retirement Obligations and interpretation of FASB Statement No. 143" (FIN 47). FIN 47 clarifies that conditional asset retirement obligations meet the definition of liabilities and should be recognized when incurred if their fair values can be reasonably estimated. The cumulative effect of initially applying FIN 47 would be recognized as a change in accounting principle. FIN 47 is effective no later than the end of fiscal years ending after December 15, 2005. Adoption of FIN 47 is not expected to have a material impact on our financial condition or results of operations.
In February 2006, FASB issued FASB 155, Accounting for Certain Hybrid Financial Instruments an amendment to FASB 133, Accounting for Derivative Instruments and Hedging Activities, and FASB 140, Accounting for Transfers and Servicing of Financial Assets and Extinguishments of Liabilities. FASB 155 provides the framework for fair value remeasurement of any hybrid financial instrument that contains an embedded derivative that otherwise would require bifurcation, and establishes a requirement to evaluate interests in securitized financial assets to identify interests. FASB 155 further amends FASB 140 to eliminate the prohibition on a qualifying special-purpose entity from holding a derivative. This statement is effective for all financial instruments acquired or issued after the beginning of an entity's first fiscal year that begins after September 15, 2006. FASB 155 is not expected to have a material impact on our consolidated financial statements.
In March 2006, FASB issued FASB 156, Accounting for Servicing of Financial Assets, which amended FASB Statement No. 140. FASB 156 requires the recognition of a servicing asset or servicing liability under certain circumstances when an obligation is incurred to service a financial asset by entering into a servicing contract. FASB 156 also requires all separately recognized servicing assets and servicing liabilities to be initially measured at fair value utilizing the amortization method or fair market value method. FASB 156 is effective the beginning of the first fiscal year that begins after September 15, 2006. FASB 156 is not expected to have a material impact on our consolidated financial statements.
Quantitative and Qualitative Disclosures about Market Risks
The Company operates principally in China and grants credit to its customers in this geographic region. Although China is considered economically stable, it is always possible that unanticipated events in foreign countries could disrupt the Company’s operations.
We perform certain credit evaluation procedures and do not require collateral when extending credit to our customers. We believe that credit risk with respect to our customers is limited because we routinely assess the financial strength of our customers, and based upon factors surrounding the credit risk of our customers, we will establish allowances for uncollectible accounts and, as a consequence, believe that our accounts receivable credit risk exposure beyond such allowances is limited. As of June 30, 2006, we had not established any allowance for doubtful accounts.
At June 30, 2006, the Company has a credit risk exposure of uninsured cash in banks of approximately $4,429,100. The Company does not require collateral or other securities to support financial instruments that are subject to credit risk.
For the six months ended June 30, 2006, two customers accounted for approximately 50% of total sales as follows: Yingkou Liaohe Aluminum Fabrication Company Limited at $4,716,959 (32%) and Gaizhou City Jinhua Zinc & Aluminum Powder Main Factory at $2,676,601 (18%).
Since our gross profit depends primarily on the cost of our main raw material, alumina, any increases in alumina prices would have significant impact on our financial performance. We do not have long term contracts with alumina suppliers that could provide any assurance on future alumina prices. We have not entered and presently have no intention to enter into any commodities future contracts to provide hedging for our material costs. Our selling price of refined aluminum therefore depends on current market prices, and there is no assurance provided from our customers on any future prices.
Market Risk Sensitive Instruments
(U.S. dollars)
Financial Instrument | | Carrying Value | | Fair Value | |
| Instruments entered into for trading purposes | | | None | | | | |
| Instruments entered into for other than trading purposes (as of June 30, 2006) | | | | | | | |
| Cash and Cash equivalents | | | | | | | |
United States | | | — | | | — | |
Foreign | | | 4,429,101 | | | 4,429,101 | |
Total | | | 4,429,101 | | | 4,429,101 | |
| Accounts Payable | | | | | | | |
United States | | | — | | | — | |
Foreign | | | 2,233,820 | | | 2,233,820 | |
Total | | | 2,233,820 | | | 2,233,820 | |
Cash and cash equivalents and accounts payable are short-term financial instruments, and as such are not subject to significant market risk. Substantially all financial instruments are settled in the local currency and therefore, the Company has no substantial exposure to foreign currency exchange risk. Cash is maintained in local currency.
Set forth below are our directors and officers:
Name | | Age | | Position |
| Shushun Feng | | 54 | | President, Chief Executive Officer & Director |
| Prof. Huimin Lu | | 46 | | Vice President, Chief Technology Officer & Director |
| Chris Wu | | 34 | | Vice President & Chief Financial Officer |
Shushun Feng, President, Chief Executive Officer and Director. Mr. Feng has served as our President, Chief Executive Officer and Director since October 26, 2006. He has served as chief executive officer of Kangping Aluminum since 2002. He is the founder of Kangping Aluminum and has served as a director since the company’s formation in 1998. He obtained a Masters Degree in International Finance from Liaoning University in 1992.
Huimin Lu, Chief Technology Officer and Director. Prof. Lu has served as our Vice President, Chief Technology Officer and Director since October 26, 2006. Prof. Lu joined Shenyang Kangping Aluminum as CTO and director on August 1, 2006. Prof. Lu has served both as a Professor and Dean of Light Metals Research Center of the School of Materials at Beijing University of Aeronautics & Astronautics since March 2006. From March 2005 to February 2006, Prof. Lu was a visitor in the Metallurgy Department of the University of Cambridge in England. From January 2000 to February 2005, Prof. Lu worked as a Professor and the Deputy Dean of the School of Metallurgy at Beijing University of Science and Technology. Prof. Lu holds a Ph.D. in Metallurgy from the Northeastern University in China.
Chris Wu, Chief Financial Officer. Mr. Wu has served as our Vice President and Chief Financial Officer since October 26, 2006. He joined Elwin as chief financial officer on July 1, 2006. Mr. Wu was chief financial officer of a British Virgin Islands company that merged with a Hong Kong-listed electronics manufacturer from April 2005 to May 2006. Mr. Wu was Group Financial Controller of Superior Fastening Technology Limited, a Singapore-listed metal parts manufacturer, from March 2004 to February 2005. Mr. Wu was Accounting Manager and Finance Manager for Gold Peak Industrial Limited, a Singapore-listed OEM electronics manufacturer, and Starlight International Limited, a Hong Kong listed OEM electronics manufacturer, from 1999 to 2003. Mr. Wu graduated from the Hong Kong University of Science and Technology with a B.B.A. (Accounting) in 1995 and is an Associate Member of the Hong Kong Institute of Certified Public Accountants and a Fellow Member of the Association of Chartered Certified Accountants.
Executive Compensation
The following table sets forth the compensation paid by us to our chief executive officer and to all other executive officers for services rendered during the fiscal years ended December 31, 2005, 2004 and 2003. In reviewing the table, please note that:
| · | From June 30, 1996 through October 2006, Dempsey K. Mork served as our president, chief executive officer and director and earned no compensation for acting as such. |
| · | From December 15, 2001 through October 2006, Norbert L. LoBoeuf served as our chief financial officer and director and earned no compensation for acting as such. |
| · | Mr. Shushun Feng was appointed as chief executive officer on October 26, 2006. |
| · | The compensation amounts paid to Mr. Shushun Feng reflect compensation paid to him by the operating subsidiaries of Apex during the reported periods. |
| · | No officer of Apex or Kangping Aluminum earned more than $100,000 during any of the reported periods. |
| | | | | Annual Compensation | | Long Term Compensation |
Name and Position | | Year | | Salary | | Bonus | | Other | | Restricted Stock Awards ($) | | Common Shares Underlying Options | | All Other Compensation |
| | | | | | | | | | | | | | | |
Dempsey K. Mork Former President, CEO and Director | | 2005 2004 2003 | | $0 $0 $0 | | $0 $0 $0 | | $0 $0 $0 | | $0 $0 $0 | | $0 $0 $0 | | $0 $0 $0 |
| | | | | | | | | | | | | | | |
Norbert L. LoBoeuf Former CFO and Director | | 2005 2004 2003 | | $0 $0 $0 | | $0 $0 $0 | | $0 $0 $0 | | $0 $0 $0 | | $0 $0 $0 | | $0 $0 $0 |
| | | | | | | | | | | | | | | |
Shushun Feng, President and CEO | | 2005 2004 2003 | | $0 $0 $0 | | $0 $0 $0 | | $0 $0 $0 | | $0 $0 $0 | | $0 $0 $0 | | $0 $0 $0 |
Board Composition and Committees
We currently do not have standing audit, nominating or compensation committees. Our entire board of directors is responsible for the functions that would otherwise be handled by these committees. We intend, however, to establish an audit committee and a compensation committee of the board of directors as soon as practicable. We envision that the audit committee will be primarily responsible for reviewing the services performed by our independent auditors and evaluating our accounting policies and our system of internal controls. The compensation committee will be primarily responsible for reviewing and approving our salary and benefits policies (including stock options) and other compensation of our executive officers.
Our board of directors has not made a determination as to whether any member of our board is an audit committee financial expert. Upon the establishment of an audit committee, the board will determine whether any of the directors qualifies as an audit committee financial expert.
We have not paid our directors fees for attending scheduled or special meetings of our board of directors. In the future, we may adopt a policy of paying independent directors a fee for their attendance at board and committee meetings. We reimburse each director for reasonable travel expenses related to such director's attendance at board of directors and committee meetings.
LIMITATION OF LIABILITY OF DIRECTORS AND
INDEMNIFICATION OF DIRECTORS AND OFFICERS
The Nevada General Corporation Law provides that corporations may include a provision in their certificate of incorporation relieving directors and officers of monetary liability for breach of their fiduciary duty as directors or officers, as applicable, provided that such provision shall not eliminate or limit the liability of a director or officer (i) for any breach of the duty of loyalty to the corporation or its stockholders, (ii) for acts or omissions not in good faith or which involve intentional misconduct or a knowing violation of law, (iii) for unlawful payment of a dividend or unlawful stock purchase or redemption, or (iv) for any transaction from which the director or officer derived an improper personal benefit. Our certificate of incorporation provide that directors and officers are not liable to us or our stockholders for monetary damages for breach of their fiduciary duty as directors to the fullest extent permitted by Nevada law. In addition to the foregoing, our bylaws provide that we may indemnify directors, officers, employees or agents to the fullest extent permitted by law and we have agreed to provide such indemnification to each of our directors and officers.
The above provisions in our certificate of incorporation and bylaws may have the effect of reducing the likelihood of derivative litigation against directors and may discourage or deter stockholders or management from bringing a lawsuit against directors or officers for breach of their fiduciary duty, even though such an action, if successful, might otherwise have benefited us and our stockholders. However, we believe that the foregoing provisions are necessary to attract and retain qualified persons as directors.
Insofar as indemnification for liabilities arising under the Securities Act of 1933, as amended (the “Securities Act”) may be permitted to our directors, officers and controlling persons pursuant to the foregoing provisions, or otherwise, we have been advised that in the opinion of the SEC, such indemnification is against public policy as expressed in the Securities Act and is, therefore, unenforceable.
SECURITY OWNERSHIP OF EXECUTIVE OFFICERS, DIRECTORS
AND PRINCIPAL STOCKHOLDERS
The following table sets forth certain information regarding the beneficial ownership of the shares of our common stock as of October 26, 2006 by (i) each person who is known by us to be the beneficial owner of more than five percent (5%) of the issued and outstanding shares of our common stock, (ii) each of our directors and executive officers, and (iii) all directors and executive officers as a group. The information is determined in accordance with Rule 13d-3 promulgated under the Exchange Act based upon information furnished by persons listed or contained in filings made by them with the SEC by information provided by such persons directly to us. Except as indicated, the stockholders listed below possess sole voting and investment power with respect to their shares.
Name and Address of Beneficial Owner | | Number of Shares of Common Stock Beneficially Owned | | Percentage Owned |
| (i) Beneficial Owners of Greater Than 5% of Outstanding Shares |
| Shushun Feng* | | 7,881,365 | | 24.5% |
| Fei Feng* | | 6,421,853 | | 19.9% |
Aviate Investments Ltd., 18/F., 16 Ice House Street, Central, Hong Kong | | 4,670,439 | | 14.5% |
| Jian Xhang* | | 2,335,219 | | 7.3% |
| Jinping Liu* | | 2,335,219 | | 7.3% |
| Zhiqiang Zhang* | | 2,335,219 | | 7.3% |
| Duoxiang Sun* | | 1,751,414 | | 5.4% |
| (ii) Beneficial Ownership of Each of Our Directors and Officers |
| Shushun Feng* | | 7,881,365 | | 24.5% |
| Huimin Lu* | | 0 | | 0% |
| Chris Wu* | | 0 | | 0% |
| (iii) Beneficial Ownership of All Directors and Officers as a Group | | 7,881,365 | | 24.5% |
*The address for all of these individuals is: No. 507 Royal Plaza, 21-1 Wenyi Road, Shenhe District, Shenyang City, Liaoning Province, China, Postal Code 110000
This table is based upon information derived from our stock records. Unless otherwise indicated in the footnotes to this table and subject to community property laws where applicable, we believe that each of the shareholders named in this table has sole or shared voting and investment power with respect to the shares indicated as beneficially owned. Applicable percentages are based upon 32,194,761 shares of common stock outstanding as of October 26, 2006.
CERTAIN RELATIONSHIPS AND RELATED TRANSACTIONS
On October 26, 2006, we consummated the transactions contemplated by a share exchange agreement among us and the owners of the issued and outstanding capital stock of Elwin, including Shushun Feng, our President and CEO. Pursuant to the share exchange agreement, we acquired all of the outstanding capital stock of Elwin in exchange for 29,190,241 shares of our common stock. As a result of this transaction, Mr. Feng became the owner of approximately 24.5 percent of our outstanding common shares.
On September 4, 2006, Elwin, our direct wholly owned subsidiary, entered into an asset purchase agreement with Kangping Aluminum, our indirect wholly owned PRC subsidiary, whereby Elwin agreed to acquire 100% of the registered capital of Kangping Aluminum for approximately $16.8 million. Mr. Shushun Feng, our President and Chief Executive Officer, was a controlling shareholder of both Elwin and Kangping Aluminum.
Kangping Aluminum has had a continuous trade relationship with Fangyuan Group. For the first six months in 2006, Kangping Aluminum made approximately $571,234 in sales (3% of our total) to Fangyuan Group. In 2005, 2004 and 2003, respectively, Kangping Aluminum made approximately $13,758,000 (34% of our total), $10,205,000 (23% of our total) and $12,270,300 (29% of our total) in sales to Fangyuan Group. Mr. Shushun Feng, our President and CEO, was the controlling shareholder and a director of both Fangyuan Group and Kangping Aluminum.
On December 2003, Kangping Aluminum signed an agreement with Fangyuan Group, effective January 1, 2003, whereby Fangyuan Group agreed to pay 6% of interest per annum on the balance owed to Kangping Aluminum, which includes accounts receivables from sales and advances. Interest income earned was approximately $959,200, $1,007,300 and $885,300 for 2005, 2004 and 2003, respectively. Mr. Shushun Feng, our President and CEO, was the controlling shareholder and a director of both Fangyuan Group and Kangping Aluminum.
In 2005 and 2003, Kangping Aluminum purchased approximately $258,940 and $424,100 in fuel from an entity owned by the brother of one of our beneficial owners.
On June 30, 2006, Fangyuan Group agreed to convert all of its outstanding balances owed to Kangping Aluminum, including accounts receivables from sales and advances, into a six-month loan in a principal amount of $2,188,211, with our President and CEO, Mr. Shushun Feng, as guarantor. Mr. Feng was the controlling shareholder and director of both Fangyuan Group and Kangping Aluminum.
DESCRIPTION OF CAPITAL STOCK
We are authorized to issue 99,990,000 shares of common stock, par value $.001, and 10,000 shares of preferred stock, par value $.001. As of October 26, 2006, 32,194,761 shares of common stock and no shares of preferred stock were issued and outstanding and held by approximately 51 record holders. As of the date of this report, there are no outstanding options, warrants or other securities which upon exercise or conversion entitle their holder to acquire shares of common stock, except as set forth below.
Holders of shares of common stock are entitled to one vote per share on all matters to be voted upon by the stockholders generally. The approval of proposals submitted to stockholders at a meeting other than for the election of directors requires the favorable vote of a majority of the shares voting, except in the case of certain fundamental matters (such as certain amendments to the certificate of incorporation, and certain mergers and reorganizations), in which cases Nevada law and our bylaws require the favorable vote of at least a majority of all outstanding shares. Stockholders are entitled to receive such dividends as may be declared from time to time by the board of directors out of funds legally available therefor, and in the event of liquidation, dissolution or winding up, to share ratably in all assets remaining after payment of liabilities. The holders of shares of common stock have no preemptive, conversion, subscription or cumulative voting rights.
MARKET PRICE OF AND DIVIDENDS ON THE REGISTRANT’S
COMMON EQUITY AND RELATED SHAREHOLDER MATTERS
There is no established public trading market for our common stock, and we have paid no dividends.
Item 3.02. Unregistered Sale of Equity Securities.
The information provided in Item 1.01 of this Current Report on Form 8-K is incorporated herein by reference.
Item 5.01. Changes in Control of Registrant.
The information provided in Item 1.01 and 2.01 of this Current Report on Form 8-K is incorporated herein by reference.
On October 26, 2006, in connection with the closing of the share exchange, our directors and officers resigned and were replaced by Shushun Feng as director, Chief Executive Officer, and President; Huimin Lu, as director, Vice President and Chief Technology Officer; and Chris Wu, as Vice President and Chief Financial Officer.
Immediately prior to the closing of the share exchange, Dempsey Mork, our then-current director, President, Secretary and Treasurer, beneficially owned 94.8% of our common stock. Upon the completion of the share exchange, Mr. Shushun Feng owned 24.5% of our common stock, Ms. Fei Feng owned 19.9% of our common stock and Aviate Investments Ltd. owned 14.5% of our common stock.
Item 5.02. Departure of Directors or Principal Officers; Election of Directors; Appointment of Principal Officers.
On October 26, 2006, in connection with the closing of the share exchange, our directors and officers resigned and were replaced by Shushun Feng as director, Chief Executive Officer, and President; Huimin Lu, as director, Vice President and Chief Technology Officer; and Chris Wu, as Vice President and Chief Financial Officer.
In addition, the information provided in Item 2.01 of this Current Report on Form 8-K under “Our History” and “Certain Relationships and Related Transactions” is incorporated herein by reference.
Item 5.03. Amendments to Articles of Incorporation or Bylaws; Change in Fiscal Year
On October 23, 2006, we adopted the Amended and Restated Bylaws. The Amended and Restated Bylaws, among other things, (i) provide the name and address of the registered agent; (ii) establish our fiscal year as ending on December 31; (iii) delete the provision describing the treatment of fraction shares; (iv) delete the provision governing shareholders’ dividends; (v) delete the provision describing the corporate seal; (vi) delete the provision requiring annual reports be filed with the Nevada Secretary of State; (vii) specify the maximum number of directors as five and grants the Board of Directors the power to modify the number of directors; (viii) describe and specify the responsibilities of the president, vice president, secretary, and treasurer; (ix) delete the description of the duties and powers of the board of directors and the establishment of committees of the board of directors; (x) provide for the indemnification of our officers, directors, employees and agents; and (xi) specify the individuals who are authorized to execute negotiable instruments, deeds and contracts.
The Amended and Restated Bylaws are filed herewith as Exhibit 3.1 and incorporated herein by reference.
Item 5.06. Change in Shell Company Status.
The information provided in Items 1.01 and 5.01 of this Current Report on Form 8-K is incorporated by reference.
Item 7.01. Regulation FD Disclosure
In this report, we are providing guidance on a preliminary basis for our net income, after giving effect to the share exchange, for the fiscal year ending December 31, 2007 and for the fiscal year ending December 31, 2008.
The guidance provided in this Item 7.01, as well as throughout this report, includes forward-looking statements relating to analyses and other information that are based on forecasts of future results and estimates of amounts not yet determinable. These statements also relate to future prospects, developments and business strategies. These forward looking statements are identified by their use of terms and phrases such as "anticipate," "believe," "could," "estimate," "expect," "intend," "may," "plan," "predict," "project," "should," "will" and similar terms and phrases, including references to assumptions. Such statements are based on current expectations, are inherently uncertain and are subject to changing assumptions.
Such forward looking statements involve known and unknown risks, uncertainties and other factors that may cause actual results to be materially different. Such factors include, but are not limited to, the following: changes in general economic and business conditions; changes in current pricing and cost levels; changes in political, social and economic conditions and local regulations in China; foreign currency fluctuations; reductions in sales to any significant customers; competition; disruptions of established supply channels; manufacturing capacity constraints; the availability, terms and deployment of capital; and the other factors described under “Risk Factors” in Item 2.01 of this report and incorporated herein by reference.
If one or more of these risks or uncertainties materialize, or if underlying assumptions prove incorrect, actual results may vary materially from those expected, estimated or projected. In addition to other factors that affect our operating results and financial position, neither past financial performance nor our expectations should be considered reliable indicators of future performance. Investors should not use historical trends to anticipate results or trends in future periods. Failure of sales or income in any quarter to meet the investment community's expectations, as well as broader market trends, could have an adverse impact on our stock price. We do not undertake an obligation to update such forward looking statements or risk factors to reflect future events or circumstances.
We project, on a preliminary basis, that our net income for the fiscal year ending December 31, 2007 will be approximately $4.5 million, which is an estimated increase of up to approximately 47% over fiscal year ended December 31, 2005. We further project, on a preliminary basis, that our net income will reach $15.8 million for the fiscal year ending December 31, 2008.
Item 8.01. Other Events.
On October 26, 2006, in connection with the share exchange, we relocated our corporate headquarters from 69930 Highway 111, Suite 100, Rancho Mirage, California 92270 to No. 507 Royal Plaza, 21-1 Wenyi Road, Shenhe District, Shenyang City, Liaoning Province, China, Postal Code 110000. Our new phone number is (86) 24-31296178.
Item 9.01. Financial Statements and Exhibits.
(a) Financial Statements of Businesses Acquired
Elwin Group Limited and Subsidiary | |
Unaudited Financial Statements | |
| Consolidated Balance Sheet as of June 30, 2006 | |
| Consolidated Statements of Operations and Comprehensive Income for the Six Months Ended June 30, 2006 and 2005 | |
| Consolidated Statements of Stockholders’ Deficit for the Period from November 17, 2004 (inception) to June 30, 2006 | |
| Consolidated Statements of Cash Flows for the Six Months Ended June 30, 2006 and 2005 | |
| Notes to Unaudited Consolidated Financial Statements | |
Audited Financial Statements | |
| Report of Independent Registered Public Accounting Firm | |
| Consolidated Balance Sheet as of December 31, 2005 | |
| Statements of Operations and Comprehensive Income for the Year Ended December 31, 2005 and the Period from November 17, 2004 (inception) to December 31, 2004 |
| Statements of Stockholders’ Deficit for the Period from November 17, 2004 (inception) to December 31, 2005 | |
| Statements of Cash Flows for the Year Ended December 31, 2005 and the Period from November 17, 2004 (inception) to December 31, 2004 |
| Notes to Financial Statements | |
| | |
Shenyang Fangyuan Group Kangping Aluminum Factory Company Limited | |
Unaudited Financial Statements | |
| Balance Sheets as at June 30, 2006 and 2005 | |
| Statements of Operations and Comprehensive Income for the Six Months Ended June 30, 2006 and 2005 | |
| Statements of Cash Flows for the Six Months Ended June 30, 2006 and 2005 | |
| Notes to the Financial Statements | |
Audited Financial Statements | |
| Report of Independent Registered Public Accounting Firm | |
| Balance Sheets as at December 31, 2005 and 2004 | |
| Statements of Operations and Comprehensive Income for the Years Ended December 31, 2005, 2004 and 2003 | |
| Statements of Owner’s Equity for the Years Ended December 31, 2005, 2004 and 2003 | |
| Statements of Cash Flows for the Years Ended December 31, 2005, 2004 and 2003 | |
| Notes to the Financial Statements | |
ELWIN GROUP LIMITED AND SUBSIDIARY (A Development Stage Enterprise) |
| Consolidated Balance Sheet |
| As of June 30, 2006 |
(Expressed in United States dollars) (Unaudited) |
| | | | | | |
| ASSETS | |
| CURRENT ASSETS | | | | | |
| Cash | | | | | $ | 2,089 | |
| Related Party Receivable | | | | | | 45,024 | |
| Total Current Assets | | | | | | 47,113 | |
| Total Assets | | | | | $ | 47,113 | |
| |
| LIABILITIES AND STOCKHOLDERS’ DEFICIT |
| CURRENT LIABILITIES | | | | | | | |
| Short Term Borrowings | | | | | $ | 50,000 | |
| Accounts Payable | | | | | | 3,846 | |
| Related Party Payable | | | | | | 897 | |
| Total Current Liabilities | | | | | | 54,743 | |
| COMMITMENTS AND CONTINGENCIES | | | | | | | |
| STOCKHOLDERS' DEFICIT | | | | | | | |
Common stock, authorized 50,000 shares, par value $1, issued and outstanding 50,000 shares | | | | | | 50,000 | |
| Deficit Accumulated During the Development Stage | | | | | | (57,579 | ) |
| Accumulated Other Comprehensive Loss | | | | | | (51 | ) |
| TOTAL STOCKHOLDERS’ DEFICIT | | | | | | (7,630 | ) |
| TOTAL LIABILITIES AND STOCKHOLDERS’ DEFICIT | | | | | $ | 47,113 | |
The accompanying notes are an integral part of these unaudited consolidated financial statements.
ELWIN GROUP LIMITED AND SUBSIDIARY (A Development Stage Enterprise) |
| Consolidated Statement of Operations and Comprehensive Income |
| For the six months ended June 30, 2006 and 2005 |
(Expressed in United States dollars) (Unaudited) |
| | | Cumulative from Inception (November 17, 2004) to June 30, 2006 | | 2006 | | 2005 | |
| REVENUES | | $ | - | | $ | - | | $ | - | |
| OPERATING EXPENSES | | | | | | | | | | |
| General and administrative expenses | | | 58,545 | | | 262 | | | 109 | |
| (LOSS) FROM OPERATIONS | | | (58,545 | ) | | (262 | ) | | (109 | ) |
| Other Income | | | 993 | | | - | | | - | |
| Other Expenses | | | (27 | ) | | (21 | ) | | - | |
| (LOSS) BEFORE INCOME TAXES | | | (57,579 | ) | | (283 | ) | | (109 | ) |
| PROVISION FOR INCOME TAXES | | | - | | | - | | | - | |
| NET LOSS | | | (57,579 | ) | | (283 | ) | | (109 | ) |
| FOREIGN CURRENCY TRANSLATION | | $ | (51 | ) | $ | 398 | | $ | - | |
| COMPREHENSIVE INCOME / (LOSS) | | | (57,630 | ) | | 115 | | | (109 | ) |
| Net Loss per Share | | | | | | (0.00 | ) | | (0.03 | ) |
| Weighted Average Number of Shares Outstanding | | | | | | 50,000 | | | 4,176 | |
The accompanying notes are an integral part of these unaudited consolidated financial statements.
ELWIN GROUP LIMITED AND SUBSIDIARY (A Development Stage Enterprise) |
| Consolidated Statements of Stockholders’ Deficit |
For the period from November 17, 2004 (inception) to June 30, 2006 (Expressed in United States dollars) (Unaudited) |
| | | | Accumulated | |
| | | | Other | Total |
| | Common | Accumulated | Comprehensive | Stockholders’ |
| | Stock | Loss | Loss | Equity |
| | | | | |
| Balance at November 17, 2004 | - | - | - | - |
| Common share issued dated November 17, 2004 - 10 | 10 | - | - | 10 |
| Net loss | - | (358) | - | (358) |
| Balance at December 31, 2004 | 10 | (358) | - | (348) |
| | | | | |
| Common share issued June 16, 2005 - 49,990 | 49,990 | - | - | 49,990 |
| Net loss | - | (56.938) | | (56,938) |
| Foreign Currency Translation | - | - | (449) | (449) |
| Balance at December 31, 2005 | 50,000 | (57,296) | (449) | (7,745) |
| | | | | |
| Net loss | - | (283) | - | (283) |
| Foreign Currency Translation | - | - | 398 | 398 |
| Balance at June 30, 2006 | 50,000 | (57,579) | (51) | (7,630) |
| | | | | |
The accompanying notes are an integral part of these unaudited consolidated financial statements.
ELWIN GROUP LIMITED AND SUBSIDIARY (A Development Stage Enterprise) |
| Consolidated Statements of Cash Flows |
| For the six months ended June 30, 2006 and 2005 |
(Expressed in United States dollars) (Unaudited) |
| | Cumulative from Inception (November 17, 2004) to June 30, 2006 | 2006 | 2005 |
| CASH FLOWS FROM OPERATING ACTIVITIES | | | |
| (Net Loss) | (57,579) | (283) | (109) |
| Adjusted for: | | | |
| (Increase) in related party receivable | (44,640) | - | - |
| Increase in other payables | 3,846 | - | - |
| Increase in related party payable | 897 | - | 897 |
| Net Cash (Used) by Operating Activities | (97,476) | (283) | 788 |
| CASH FLOWS FROM FINANCING ACTIVITIES | | | |
| Proceed from new issue of shares | 50,000 | - | 49,990 |
| Increase in short term borrowings | 50,000 | - | 50,000 |
| Net Cash Provided by Financing Activities | 100,000 | - | 99,990 |
| Effect of exchange rate changes on cash | (435) | 14 | |
| NET INCREASE IN CASH | 2,089 | (269) | 100,788 |
| CASH, beginning of period | - | 2,358 | 252 |
| CASH, end of period | 2,089 | 2,089 | 101,030 |
| | | | |
| SUPPLEMENTAL DISCLOSURES | | | |
| Interest paid | - | - | - |
| Income taxes paid | - | - | - |
The accompanying notes are an integral part of these unaudited consolidated financial statements.
ELWIN GROUP LIMITED AND SUBSIDIARY
(A Development Stage Enterprise)
NOTES TO UNAUDITED CONSOLIDATED FINANCIAL STATEMENTS
Elwin Group Limited ("the Company" or "Elwin BVI") is an International Business Company incorporated in the British Virgin Islands (“BVI”) on November 17, 2004, and capitalized with $10. On June 16, 2005, the owners of the Company contributed additional US$49,990 as capital.
On May 18, 2005, the Company incorporated a wholly-foreign owned enterprise, namely Shenyang Elwin Non-Ferrous Limited (“the Subsidiary”) in The People’s Republic of China (“PRC”) for a period of twenty years with a registered capital of US$1,000,000. At the date of these financial statements, the Company invested US$100,000 in the Subsidiary. The Company has subscribed for an additional US$900,000, which remains unpaid as of December 31, 2005.
As of June 30, 2006, the Company holds 100% equity interest in the subsidiary.
The Company has been presented as a "development stage enterprise" in accordance with Statement of Financial Accounting Standards ("SFAS") No.7, "Accounting and Reporting by Development Stage Enterprises". Since inception, the Company's activities have been limited to organizational efforts, obtaining initial financing, and preparing to make filings with the Securities and Exchange Commission ("SEC").
| 2. | Summary of Significant Accounting Policies |
(a) Basis of Presentation
The accompanying unaudited financial statements have been prepared in accordance with generally accepted accounting principles for interim financial information. Accordingly, they do not include all of the information and footnotes required by generally accepted accounting principles for complete financial statements. In the opinion of management, all adjustments (consisting of normal recurring accruals) considered necessary in order to make financial statements not misleading. The results of operations for the six months ended June 30, 2006 are not necessarily indicative of the results for the full fiscal year ending December 31, 2006. The unaudited consolidated interim financial statements should be read in conjunction with the Company’s audited consolidated financial statements and notes thereto for the year ended December 31, 2005 as reported elsewhere in this Form 8-K.
(b) Use of Estimates
In preparing financial statements in conformity with US GAAP, management is required to make estimates and assumptions that affect the reported amounts of assets and liabilities and the disclosure of contingent assets and liabilities at the date of the financial statements and revenues and expenses during the reported periods. Actual results could differ from those estimates.
(c) Cash and Cash Equivalents
The Company considers all highly liquid investments with original maturities of three months or less at the time of purchase to be cash equivalents. As of June 30, 2006, the Company has no cash equivalents.
(d) Principle of Consolidation
The consolidated financial statements include Elwin BVI and the Subsidiary. The consolidated statement of operations for the six months ended June 30, 2006 includes the Subsidiary for the full period and for the six months ended June 30, 2005 includes the Subsidiary from May 18, 2005. Intercompany items have been eliminated.
(e) Foreign Currency Translation
The Group has a wholly-owned subsidiary that maintains its books and accounting records in Renminbi ("RMB"), the PRC's currency and the subsidiary's functional currency. Translation of amounts from RMB into United States dollars ("US$") has been made at the following exchange rates for the respective years:
| June 30, 2006 | |
| Balance Sheet | RMB 7.9956 to US$1.00 |
| Statement of Operations | RMB 8.0301 to US$1.00 |
| | |
| December 31, 2005: | |
| Balance Sheet | RMB 8.0645 to US$ 1.00 |
| Statement of Operations | RMB 8.1699 to US$ 1.00 |
The subsidiary’s balance sheet accounts are translated into US dollars at the year-end exchange rates and all revenue and expenses are translated into U.S. dollars at the average exchange rates prevailing during the periods in which these items arise. Translation gains and losses are deferred and accumulated as a component of other comprehensive income in owners’ equity. Transaction gains and losses that arise from exchange rate fluctuations from transactions denominated in a currency other than the functional currency are included in the statement of operations as incurred. Translation gain of $398 was recorded for the six months ended June 30, 2006 and translation loss of $449 was recorded for the year ended December 31, 2005. Transaction gains and losses were immaterial for the six month ended June 30, 2006 and for the year ended December 31, 2005,
The Chinese government imposes significant exchange restrictions on fund transfers out of China that are not related to business operations. These restrictions have not had a material impact on the Company because it has not engaged in any significant transactions that are subject to the restrictions.
RMB is not readily convertible into United States dollars or other foreign currencies. For several years prior to July 21, 2005, the foreign exchange rate between the United States dollar and the RMB had been stable at approximately RMB 8.28 to US$1.00 for the last several years. On July 21, 2005, the Central Bank of China announced that it would allow the Yuan (Renminbi) to move to a flexible exchange rate with a maximum daily variance against the US dollar of 0.3%. No provision has been made in the accompanying financial statements for the change in currency policy, nor has any determination been made as to the potential impact this may have on the Company's future operations. No representation is made that RMB amounts could have been, or could be, converted into United States dollars or any other currency at that rate or any other rate.
The Company’s functional currency is Hong Kong dollars. The Hong Kong government imposes currency peg with the United States dollars at a fixed rate of approximately 7.8. All of the Company’s cash is denominated in Hong Kong Dollars (HKD) and HKD is readily convertible in USD at the above-mentioned rate. Therefore, all foreign currency transactions of the Company are translated into USD at 7.8. There were no transaction & translation gains /losses of the Company for the years ended June 30, 2006 and 2005.
(f) Comprehensive Income or Loss
The Company follows the provisions of SFAS No. 130, "Reporting Comprehensive Income" ("SFAS No. 130"). SFAS No. 130 establishes standards for the reporting and display of comprehensive income, its components and accumulated balances in a full set of general purpose consolidated financial statements. SFAS No. 130 defines comprehensive income or loss to include all changes in equity, except those resulting from investments by owners and distributions to owners, including adjustments to minimum pension liabilities, accumulated foreign currency translation, and unrealized gains or losses on marketable securities.
Accumulated other comprehensive income represents the change in equity of the Company during the periods presented from foreign currency translation adjustments.
(g) Fair Value of Financial Instruments
SFAS No. 107, “Disclosures about Fair Values of Financial Instruments”, requires disclosing fair value to the extent practicable for financial instruments that are recognized or unrecognized in the balance sheet. The fair value of the financial instruments disclosed herein is not necessarily representative of the amount that could be realized or settled, nor does the fair value amount consider the tax consequences of realization or settlement. For certain financial instruments, including cash accounts, related party receivables, other payables and short term debt, it was assumed that the carrying amounts approximate fair value because of the near term maturities of such obligations.
(h) Concentrations of Credit Risk
Financial instruments that potentially subject the Company to significant concentrations of credit risk consist primarily of cash. At June 30, 2006 the Company had uninsured cash in bank, amount of approximately $2,100. The Company does not require collateral or other securities to support financial instruments that are subject to credit risk.
(i) Earnings Per Share
Basic earnings per share is computed by dividing the earnings for the year by the weighted average number of common shares common outstanding for the year. Diluted earnings per share reflects the potential dilution of securities by including other potential stock, including stock options and warrants, in the weighted average number of common shares outstanding for the year, if dilutive. There are no potentially dilutive instruments outstanding for the periods presented in the financial statements.
(j) Short Term Borrowing
Short term borrowing is an advance which is interest free and due on demand. At December 31, 2005, the Company had short term borrowing of US$50,000 from Mr. Yeung So, who is a director of Aviante Investments Limited. Aviate Investments Limited became a shareholder of Elwin Group Limited subsequent to June 30, 2006.
(k) Income Taxes
The Company accounts for income taxes under SFAS No. 109, "Accounting for Income Taxes". Under SFAS No. 109, deferred tax assets and liabilities are recognized for the future tax consequences attributable to differences between the financial statement carrying amounts of existing assets and liabilities and their respective tax bases. Deferred tax assets and liabilities are measured using enacted tax rates expected to apply to taxable income in the years in which those temporary differences are expected to be recovered or settled. Under SFAS No. 109, the effect on deferred tax assets and liabilities of a change in tax rates is recognized in income in the period that includes the enactment date.
The Company is not subject to income tax in the BVI. The Subsidiary is subject to income tax of 33% in the PRC. At December 31, 2005, the Subsidiary has net operating losses of approximately US$54,000, which can be used to offset future taxable income though 2012. The Company has recorded deferred tax asset of approximately US$18,000 for the operating loss carryforward. A valuation allowance of a like amount has been recorded as of December 31, 2005 as management believes that is more likely than not that the loss will not be utilized.
A reconciliation of the expected income tax benefit at the U.S. Federal income tax rate to the income tax benefit actually recognized for the years ended December 31, 2005 is set forth below:
| Expected income tax benefit | | $ | (18,000 | ) |
| Net increase in valuation allowance | | | 18,000 | |
| | | | | |
| Income tax benefit | | $ | - | |
| 3. | Related Party Transactions |
The related party payable amount as of June 30, 2006 represents an $897 advance from the director of the Company, Mr. Shushun Feng. Such advance is interest-free and repayable upon demand.
The related party receivable amount as of June 30, 2006 represents $45,024 advance to Shenyang Fangyuan Group Kangping Aluminum Company Limited, which was a wholly-owned subsidiary subsequent to the acquisition described in Note 4.
On August 31, 2006, the Company signed a sales and purchase agreement with Mr. Shushun Feng and Ms. Yuying Liu (Husband and wife) to acquire from them a 100% equity interest of Shenyang Fangyuan Group Kangping Aluminum Factory Company Limited. The transaction was closed on September 4, 2006.
On September 6, 2006, the Company and its owners signed a share swap agreement with Apex Capital Group, a public but non-trading company in the United States, and Mr. Dempsey Mork, the controlling shareholder of Apex Capital Group. Pursuant to this share swap agreement, once completed, the Company will become a 100% owned subsidiary of Apex Capital Group.
On October 10, 2006, the Subsidiary has received full payment of the related party receivable of $45,024 from Shenyang Fangyuan Group Kangping Aluminum Company Limited.
ELWIN AND SUBSIDIARY AUDITED FINANCIAL STATEMENTS
Report of Independent Registered Public Accounting Firm
To the Board of Directors and Stockholders of
Elwin Group Limited and Subsidiary (A Development Stage Enterprise)
We have audited the accompanying balance sheet of Elwin Group Limited and Subsidiary (A Development Stage Enterprise) as of December 31, 2005 (consolidated), and the related statements of operations and comprehensive income, stockholders’ equity, and cash flows for the year and period ended December 31, 2005 (consolidated) and 2004. These financial statements are the responsibility of the Company’s management. Our responsibility is to express an opinion on these financial statements based on our audits.
We conducted our audits in accordance with the standards of the Public Company Accounting Oversight Board (United States). Those standards require that we plan and perform the audit to obtain reasonable assurance about whether the financial statements are free of material misstatement. The Company is not required to have, nor were we engaged to perform, an audit of its internal control over financial reporting. Our audit included consideration of internal control over financial reporting as a basis for designing audit procedures that are appropriate in the circumstances, but not for the purposes of expressing an opinion on the effectiveness of the Company’s internal control over financial reporting. Accordingly, we express no such opinion. An audit includes examining, on a test basis, evidence supporting the amounts and disclosures in the financial statements. An audit also includes assessing the accounting principles used and significant estimates made by management, as well as evaluating the overall financial statement presentation. We believe that our audits provide a reasonable basis for our opinion.
In our opinion, the financial statements referred to above present fairly, in all material respects, the financial position of Elwin Group Limited and Subsidiary (A Development Stage Enterprise) as of December 31, 2005 (consolidated), and the results of their operations and their cash flows for the year and period ended December 31, 2005 and 2004, in conformity with accounting principles generally accepted in the United States of America.
| | Moore Stephens, P.C. |
| | Certified Public Accountants |
New York, New York
October 14, 2006
ELWIN GROUP LIMITED AND SUBSIDIARY (A Development Stage Enterprise) |
| Consolidated Balance Sheet |
| As of December 31, 2005 |
| (Expressed in United States dollars) |
| ASSETS | |
| CURRENT ASSETS | | | |
| Cash | | $ | 2,358 | |
| Related Party Receivable | | | 44,640 | |
| Total Current Assets | | | 46,998 | |
| Total Assets | | $ | 46,998 | |
| |
| LIABILITIES AND STOCKHOLDERS’ DEFICIT |
| CURRENT LIABILITIES | | | | |
| Short term Borrowing | | $ | 50,000 | |
| Accounts payable | | | 3,846 | |
| Related Party Payable | | | 897 | |
| Total Current Liabilities | | | 54,743 | |
| COMMITMENTS AND CONTINGENCIES | | | | |
| STOCKHOLDERS' DEFICIT | | | | |
Common stock, authorized 50,000 shares, par value $1, issued and outstanding 50,000 shares | | | 50,000 | |
| Deficit accumulated during the development stage | | | (57,296 | ) |
| Accumulated Other Comprehensive Loss | | | (449 | ) |
| TOTAL STOCKHOLDERS’ DEFICIT | | | (7,745 | ) |
| TOTAL LIABILITIES AND STOCKHOLDERS’ DEFICIT | | $ | 46,998 | |
The accompanying notes are an integral part of these financial statements.
ELWIN GROUP LIMITED AND SUBSIDIARY (A Development Stage Enterprise) |
| Statements of Operations and Comprehensive Income |
| For the year ended December 31, 2005 and the period from November 17,2004 (inception) to December 31,2004 |
| (Expressed in United States dollars) |
| | | Cumulative from Inception (November 17, 2004) to December 31, 2005 | | 2005 (Consolidated) | | 2004 | |
| | | | | | | | | | | |
| REVENUES | | $ | - | | $ | - | | $ | - | |
| OPERATING EXPENSES | | | | | | | | | | |
| General and administrative expenses | | | 58,283 | | | 57,925 | | | 358 | |
| (LOSS) FROM OPERATIONS | | | (58,283 | ) | | (57,925 | ) | | (358 | ) |
| Other Income | | | 993 | | | 993 | | | - | |
| Other Expenses | | | (6 | ) | | (6 | ) | | - | |
| (LOSS) BEFORE INCOME TAXES | | | (57,296 | ) | | (56,938 | ) | | (358 | ) |
| PROVISION FOR INCOME TAXES | | | - | | | - | | | - | |
| NET LOSS | | $ | (57,296 | ) | $ | (56,938 | ) | $ | (358 | ) |
| FOREIGN CURRENCY TRANSLATION | | | (449 | ) | | (449 | ) | | - | |
| COMPREHENSIVE LOSS | | | (57,745 | | | (57,387 | ) | | (358 | ) |
| Net Loss per share | | | | | | (2.12 | ) | | (35.8 | ) |
| Weighted Average Number of Shares Outstanding | | | | | | 27,088 | | | 10 | |
The accompanying notes are an integral part of these financial statements.
ELWIN GROUP LIMITED AND SUBSIDIARY (Development Stage Enterprises) |
| Statements of Stockholders’ Deficit |
For the period from November 17, 2004 (inception) to December 31, 2005 (Expressed in United States dollars) |
| | | | Accumulated | |
| | | | Other | Total |
| | Common | Accumulated | Comprehensive | Stockholders’ |
| | Stock | Loss | Loss | Deficit |
| | | | | |
| Balance at November 17, 2004 | - | - | - | - |
| Common share issued November 17, 2004 - 10 | 10 | - | - | 10 |
| Net loss | - | (358) | - | (358) |
| Balance at December 31, 2004 | 10 | (358) | - | (348) |
| | | | | |
| Common share issued June 16, 2005 - 49,990 | 49,990 | - | - | 49,990 |
| Net loss | - | (56.938) | - | (56,938) |
| Foreign currency translation | - | - | (449) | (449) |
Balance at December 31, 2005 (Consolidated) | 50,000 | (57,296) | (449) | (7,745) |
| | | | | |
The accompanying notes are an integral part of these financial statements.
ELWIN GROUP LIMITED AND SUBSIDIARY (Development Stage Enterprises) |
| STATEMENTS OF CASH FLOWS |
| For the year ended December 31, 2005 and for the period from November 17, 2004 to December 31, 2004 |
| (Expressed in United States dollars) |
| |
| | Cumulative from Inception (November 17, 2004) to December 31, 2005 | 2005 (Consolidated) | 2004 |
| CASHFLOW FROM OPERATING ACTIVITIES | | | |
| (Net Loss) | (57,296) | (56,938) | (358) |
| Adjusted for: | | | |
| (Increase) in related party receivable | (44,640) | (44,640) | - |
| Increase in other payables | 3,846 | 3,846 | - |
| Increase in related party payable | 897 | 297 | 600 |
| Net Cash Provided / (Used) by Operating Activities | (97,193) | (97,435) | 242 |
| CASHFLOW FROM FINANCING ACTIVITIES | | | |
| Proceed from new issue of shares | 50,000 | 49,990 | 10 |
| Increase in short term borrowings | 50,000 | 50,000 | - |
| Net Cash Provided by Financing Activities | 100,000 | 99,990 | 10 |
| Effect of exchange rate changes on cash | (449) | (449) | - |
| NET INCREASE IN CASH | 2,358 | 2,106 | 252 |
| CASH, beginning of period | - | 252 | - |
| CASH, end of period | 2,358 | 2,358 | 252 |
| | | | |
| SUPPLEMENTAL DISCLOSURES | | | |
| Interest paid | - | - | - |
| Income taxes paid | - | - | - |
The accompanying notes are an integral part of these financial statements.
ELWIN GROUP LIMITED AND SUBSIDIARY
(Development Stage Enterprises)
NOTES TO FINANCIAL STATEMENTS
Elwin Group Limited ("the Company" or "Elwin BVI") is an International Business Company incorporated in the British Virgin Islands (“BVI”) on November 17, 2004, and capitalized with $10. On June 16, 2005, the owners of the Company contributed additional US$49,990 as capital.
On May 18, 2005, the Company incorporated a wholly-foreign owned enterprise, namely Shenyang Elwin Non-Ferrous Limited (“the Subsidiary”) in The People’s Republic of China (“PRC”) for a period of twenty years with a registered capital of US$1,000,000. At the date of these financial statements, the Company invested US$100,000 in the Subsidiary. The Company has subscribed for an additional US$900,000, which remains unpaid as of December 31, 2005.
As of December 31, 2005, the Company holds 100% equity interest in the subsidiary.
The Company has been presented as a "development stage enterprise" in accordance with Statement of Financial Accounting Standards ("SFAS") No.7, "Accounting and Reporting by Development Stage Enterprises". Since inception, the Company's activities have been limited to organizational efforts, obtaining initial financing, and preparing to make filings with the Securities and Exchange Commission ("SEC").
| 2. | Summary of Significant Accounting Policies |
(a) Basis of Presentation
The accompanying financial statements have been prepared in accordance with generally accepted accounting principles in the United States of America (“US GAAP”).
(b) Use of Estimates
In preparing financial statements in conformity with US GAAP, management is required to make estimates and assumptions that affect the reported amounts of assets and liabilities and the disclosure of contingent assets and liabilities at the date of the financial statements and revenues and expenses during the reported periods. Actual results could differ from those estimates.
(c) Cash and Cash Equivalents
The Company considers all highly liquid investments with original maturities of three months or less at the time of purchase to be cash equivalents. As of December 31, 2005, the Company has no cash equivalents.
(d) Principle of Consolidation
The 2005 consolidated financial statements include Elwin BVI and the Subsidiary. The consolidated statement of operations for the year ended December 31, 2005 includes Elwin BVI for the full year and the Subsidiary from May 2005. The statement of operations for the period ended December 31, 2004 includes Elwin BVI only. Intercompany items have been eliminated.
(e) Foreign Currency Translation
The Subsidiary maintains its books and accounting records in Renminbi ("RMB"), the PRC's currency and the subsidiary's functional currency. Translation of amounts from RMB into United States dollars ("US$") has been made at the following exchange rates for the respective year:
| December 31, 2005: | |
| Balance sheet | RMB 8.0645 to US$ 1.00 |
| Statement of Operations | RMB 8.1699 to US$ 1.00 |
The subsidiary’s balance sheet accounts are translated into US dollars at the year-end exchange rates and all revenue and expenses are translated into U.S. dollars at the average exchange rates prevailing during the periods in which these items arise. Translation gains and losses are deferred and accumulated as a component of other comprehensive income in owners’ equity. Transaction gains and losses that arise from exchange rate fluctuations from transactions denominated in a currency other than the functional currency are included in the statement of operations as incurred. Translation loss of $449 was recorded for the year ended December 31, 2005. Transaction gains and losses were immaterial for the year ending December 31, 2005 and the period ending December 31, 2004.
The Chinese government imposes significant exchange restrictions on fund transfers out of China that are not related to business operations. These restrictions have not had a material impact on the Company because it has not engaged in any significant transactions that are subject to the restrictions.
RMB is not readily convertible into United States dollars or other foreign currencies. For several years prior to July 21, 2005, the foreign exchange rate between the United States dollar and the RMB had been stable at approximately RMB 8.28 to US$1.00 for the last several years. On July 21, 2005, the Central Bank of China announced that it would allow the Yuan (Renminbi) to move to a flexible exchange rate with a maximum daily variance against the US dollar of 0.3%. No provision has been made in the accompanying financial statements for the change in currency policy, nor has any determination been made as to the potential impact this may have on the Company's future operations. No representation is made that RMB amounts could have been, or could be, converted into United States dollars or any other currency at that rate or any other rate.
The Company’s functional currency is Hong Kong dollars. The Hong Kong government imposes currency peg with the United States dollars at a fixed rate of approximately 7.8. All of the Company’s cash is denominated in Hong Kong Dollars (HKD) and HKD is readily convertible in USD at the above-mentioned rate. Therefore, all foreign currency transactions of the Company are translated into USD at 7.8. There were no transaction and translation gains or losses of the Company for the year ended December 31, 2005 and the period ended December 31, 2004.
(f) Comprehensive Income or Loss
The Company follows the provisions of SFAS No. 130, "Reporting Comprehensive Income" ("SFAS No. 130"). SFAS No. 130 establishes standards for the reporting and display of comprehensive income, its components and accumulated balances in a full set of general purpose consolidated financial statements. SFAS No. 130 defines comprehensive income or loss to include all changes in equity, except those resulting from investments by owners and distributions to owners, including adjustments to minimum pension liabilities, accumulated foreign currency translation, and unrealized gains or losses on marketable securities.
Accumulated other comprehensive income represents the change in equity of the Company during the periods presented from foreign currency translation adjustments.
(g) Fair Value of Financial Instruments
SFAS No. 107, “Disclosures about Fair Values of Financial Instruments”, requires disclosing fair value to the extent practicable for financial instruments that are recognized or unrecognized in the balance sheet. The fair value of the financial instruments disclosed herein is not necessarily representative of the amount that could be realized or settled, nor does the fair value amount consider the tax consequences of realization or settlement. For certain financial instruments, including cash accounts, related party receivables, other payables and short term debt, it was assumed that the carrying amounts approximate fair value because of the near term maturities of such obligations.
(h) Concentrations of Credit Risk
Financial instruments that potentially subject the Company to significant concentrations of credit risk consist primarily of cash. As of December 31, 2005, the Company had uninsured cash in bank, amount of approximately $2,400. The Company does not require collateral or other securities to support financial instruments that are subject to credit risk.
(i) Earnings Per Share
Basic earnings per share is computed by dividing the earnings for the year by the weighted average number of common shares common outstanding for the year. Diluted earnings per share reflects the potential dilution of securities by including other potential stock, including stock options and warrants, in the weighted average number of common shares outstanding for the year, if dilutive. There are no potentially dilutive instruments outstanding for all periods presented in the financial statements.
(j) Short Term Borrowing
Short term borrowing is an advance which is interest free and due on demand. At December 31, 2005, the Company had short term borrowing of US$50,000 from Mr. Yeung So, who is a director of Aviante Investments Limited. Aviate Investments Limited became a shareholder of Elwin Group Limited subsequent to June 30, 2006.
(k) Income Taxes
The Company accounts for income taxes under SFAS No. 109, "Accounting for Income Taxes". Under SFAS No. 109, deferred tax assets and liabilities are recognized for the future tax consequences attributable to differences between the financial statement carrying amounts of existing assets and liabilities and their respective tax bases. Deferred tax assets and liabilities are measured using enacted tax rates expected to apply to taxable income in the years in which those temporary differences are expected to be recovered or settled. Under SFAS No. 109, the effect on deferred tax assets and liabilities of a change in tax rates is recognized in income in the period that includes the enactment date.
The Company is not subject to income tax in the BVI. The Subsidiary is subject to income tax of 33% in the PRC. At December 31, 2005, the Subsidiary has net operating losses of approximately US$54,000, which can be used to offset future taxable income through 2012. The Company has recorded deferred tax asset of approximately US$18,000 for the operating loss carryforward. A valuation allowance of a like amount has been recorded as of December 31, 2005 as management believes that is more likely than not that the loss will not be utilized.
A reconciliation of the expected income tax benefit at the U.S. Federal income tax rate to the income tax benefit actually recognized for the years ended December 31, 2005 is set forth below:
| Expected income tax benefit | | $ | (18,000 | ) |
| Net increase in valuation allowance | | | 18,000 | |
| | | | | |
| Income tax benefit | | $ | - | |
| 3. | Related Party Transactions |
The related party payable amount as of December 31, 2005 represents an $897 advance from the director of the Company, Mr. Shushun Feng. Such advance is interest-free and repayable upon demand.
The related party receivable amount as of December 31, 2005 represents $44,640 advance to Shenyang Fangyuan Group Kangping Aluminum Company Limited, which was a wholly-owned subsidiary subsequent to the acquisition described in Note 4.
On August 31, 2006, the Company signed a sales and purchase agreement with Mr. Shushun Feng and Ms. Yuying Liu (Husband and wife) to acquire from them a 100% equity interest of Shenyang Fangyuan Group Kangping Aluminum Factory Company Limited. The transaction was closed on September 4, 2006.
On September 6, 2006, the Company and its owners signed a share swap agreement with Apex Capital Group, a public but non-trading company in the United States, and Mr. Dempsey Mork, the controlling shareholder of Apex Capital Group. Pursuant to this share swap agreement, once completed, the Company will become a 100% owned subsidiary of Apex Capital Group.
On October 10, 2006, the Subsidiary has received full payment of the related party receivable of $45,024 (as converted to US dollar using the exchange rate at June 30, 2006) from Shenyang Fangyuan Group Kangping Aluminum Company Limited.
| Shenyang Fangyuan Group Kangping Aluminum Factory Company Limited |
| Balance Sheets |
| As at June 30, |
| (Expressed in United States dollars) |
| | | 2006 | | 2005 | |
| ASSETS | |
| CURRENT ASSETS | | | | | |
| Cash | | $ | 4,429,101 | | $ | 42,894 | |
| Cash restricted | | | - | | | 4,832,000 | |
| Notes receivable | | | 18,760 | | | - | |
| Accounts receivable | | | 2,738,703 | | | 662,961 | |
| Related party receivable | | | - | | | 18,525,481 | |
| Inventories | | | 12,256,996 | | | 18,222,678 | |
| Prepayments and other current assets | | | 5,875,726 | | | 645,812 | |
Total Current Assets | | | 25,319,286 | | | 42,931,826 | |
| PROPERTY, PLANT AND EQUIPMENT, net | | | 11,415,161 | | | 10,754,932 | |
| BUILDING PLEDGED AS SECURITY TO CREDITOR, net | | | 5,803,345 | | | 5,770,576 | |
| LAND USE RIGHT, net | | | 177,488 | | | 175,662 | |
| CONSTRUCTION IN PROGRESS | | | 442,953 | | | 1,733,987 | |
| Total Non-Current Assets | | | 17,838,947 | | | 18,435,157 | |
| Total Assets | | $ | 43,158,233 | | $ | 61,366,983 | |
| |
| LIABILITIES AND OWNERS’ EQUITY |
| CURRENT LIABILITIES | | | | | | | |
| Short term borrowings | | $ | 6,117,114 | | $ | 4,530,000 | |
| Notes payable | | | - | | | 4,892,400 | |
| Accounts payable | | | 2,233,820 | | | 2,479,563 | |
| Other payables and accruals | | | 1,146,392 | | | 6,637,608 | |
| Taxes payable | | | 563,180 | | | 2,204,585 | |
| Total Current Liabilities | | | 10,060,506 | | | 20,744,156 | |
| | | | | | | | |
| LONG TERM BORROWINGS | | | 19,448,197 | | | 19,086,400 | |
| Total Liabilities | | | 29,508,703 | | | 39,830,556 | |
| OWNERS' EQUITY | | | | | | | |
| Paid-in capital | | | 12,080,000 | | | 12,080,000 | |
| Accumulated other comprehensive income | | | 746,778 | | | - | |
| Reserves | | | 2,074,486 | | | 1,607,505 | |
| Retained earnings | | | 936,477 | | | 9,994,374 | |
Less: related party receivable | | | (2,188,211 | ) | | (2,145,452 | ) |
Total Owner's Equity | | | 13,649,530 | | | 21,536,427 | |
Total Liabilities and Owners' Equity | | $ | 43,158,233 | | $ | 61,366,983 | |
| |
The accompanying notes are an integral part of these financial statements.
| Shenyang Fangyuan Group Kangping Aluminum Factory Company Limited |
| Statements of Operations and Comprehensive Income |
| For the Six Months Ended June 30, |
| (Expressed in United States dollars) |
| |
| | | 2006 | | 2005 | |
| SALES - UNRELATED PARTIES | | $ | 17,697,440 | | | | |
| SALES - RELATED PARTIES | | | 571,234 | | | 3,909,841 | |
| SALES | | | 18,268,674 | | | 14,785,634 | |
| COST OF SALES | | | 15,773,226 | | | 12,841,255 | |
| GROSS PROFIT | | | 2,495,448 | | | 1,944,379 | |
| OPERATING EXPENSES | | | | | | | |
| General and administrative expenses | | | 319,444 | | | 286,505 | |
| INCOME FROM OPERATIONS | | | 2,176,004 | | | 1,657,874 | |
| OTHER INCOME (EXPENSE) | | | | | | | |
| Interest income - related party | | | 266,633 | | | 579,768 | |
| Other income | | | 26,896 | | | 56,204 | |
| Other expense | | | (3,203 | ) | | (7,414 | ) |
| Interest expense | | | (869,535 | ) | | (840,014 | ) |
| | | | | | | | |
| INCOME BEFORE INCOME TAXES | | | 1,596,795 | | | 1,446,418 | |
| PROVISION FOR INCOME TAXES | | | | | | | |
| Current | | | 573,288 | | | 561,232 | |
| NET INCOME | | | 1,023,507 | | | 885,186 | |
| | | | | | | | |
| Net Income | | | 1,023,507 | | | 885,186 | |
| Foreign Currency Translation | | | 119,542 | | | - | |
| Comprehensive Income | | $ | 1,143,049 | | | | |
The accompanying notes are an integral part of these financial statements.
| Shenyang Fangyuan Group Kangping Aluminum Factory Company Limited | |
| Statements of Cash Flows | |
| For the Six Months Ended June 30, | |
| (Expressed in United States dollars) | |
| | | 2006 | | 2005 | |
| CASH FLOWS FROM OPERATING ACTIVITIES | | | | | |
| Net income | | $ | 1,023,507 | | $ | 885,186 | |
| Adjustments to reconcile net income to net cash | | | | | | | |
| used by operating activities: | | | | | | | |
| Depreciation | | | 684,957 | | | 940,511 | |
| Disposal of fixed assets | | | 81,522 | | | - | |
| Land lease amortization | | | 2,182 | | | 2,116 | |
| Changes in operating assets and liabilities | | | | | | | |
| Decrease (Increase) in operating assets: | | | | | | | |
| Notes receivable | | | 4,359 | | | 78,520 | |
| Accounts receivable | | | (2,449,209 | ) | | (362,923 | ) |
| Related party receivable | | | 1,201,354 | | | (586,798 | ) |
| Inventories | | | 3,883,049 | | | (5,115,047 | ) |
| Prepayments and other current assets | | | (3,845,158 | ) | | 20,718 | |
| Increase (Decrease) in operating liabilities | | | | | | | |
| Accounts payable | | | 958,345 | | | 761,825 | |
| Other payables and accruals | | | (229,977 | ) | | 5,385,609 | |
| Income and other taxes payable | | | (602,139 | ) | | 397,988 | |
| Net Cash Provided / (Used) by operating Activities | | | 712,792 | | | 2,407,705 | |
| CASH FLOWS FROM INVESTING ACTIVITIES | | | | | | | |
| Purchase of fixed assets | | | (810 | ) | | - | |
| Construction in progress | | | (20,689 | ) | | (36,596 | ) |
| Net Cash (Used) by Investing activities | | | (21,499 | ) | | (36,596 | ) |
| CASH FLOWS FROM FINANCING ACTIVITIES | | | | | | | |
| Proceeds from (payment of) notes payable | | | (4,981,258 | ) | �� | 60,400 | |
| (Decrease)/increase in short term borrowings | | | 2,043,561 | | | (302,000 | ) |
| (Increase)/Decrease in restricted cash | | | 6,537,901 | | | (2,416,013 | ) |
| Net Cash Provided / (Used) by Financing Activities | | | 3,600,204 | | | (2,657,613 | ) |
| EFFECT OF EXHANGE RATE CHANGES ON CASH | | | 19,520 | | | - | |
| NET INCREASE(DECREASE) IN CASH | | | 4,311,017 | | | (286,504 | ) |
| CASH, beginning of period | | | 118,084 | | | 329,398 | |
| CASH, end of period | | $ | 4,429,101 | | $ | 42,894 | |
| | | | | | | | |
The accompanying notes are an integral part of these financial statements.
SHENYANG FANGYUAN GROUP KANGPING ALUMINUM FACTORY COMPANY LIMITED
NOTES TO FINANCIAL STATEMENTS
(Expressed in United States dollars)
Shenyang Fangyuan Group Kangping Aluminum Factory Company Limited. (“the Company”) is located in Kangping, China. The Company was organized by Shenyang Fangyuan Group Company Limited (“the Group”) (80%) and Mrs. Feng Liu Yu Ying (20%) as a Chinese limited liability company on June 8, 1998 in China. The Company is principally engaged in aluminum refining for sale within China. Mrs. Feng is also a 10% shareholder in the Group.
2. | Summary of Significant Accounting Policies |
The accompanying unaudited financial statements have been prepared in accordance with generally accepted accounting principles for interim financial information. Accordingly, they do not include all of the information and footnotes required by generally accepted accounting principles for complete financial statements. In the opinion of management, all adjustments (consisting of normal recurring accruals) considered necessary in order to fairly present the interim financial information have been included. The results of operations for the six months ended June 30, 2006 are not necessarily indicative of the results for the full fiscal year ending December 31, 2006.
| b. | Foreign Currency Translation |
The Company maintains its books and accounting records in Renminbi ("RMB") or “Yuan”, the currency of the People’s Republic of China (“PRC”) and the Company's functional currency. Translation of amounts from RMB into United States dollars ("US$") has been made at the following exchange rates for the respective years:
| June 30, 2006: | |
| Balance sheet | RMB 7.9956 to US$ 1.00 |
| Statement of Operations | RMB 8.0301 to US$ 1.00 |
| | |
| June 30, 2005: | |
| Balance sheet | RMB 8.2781 to US$ 1.00 |
| Statement of Operations | RMB 8.2781 to US$ 1.00 |
The Company’s balance sheet accounts are translated into US dollars at the year-end exchange rates and all revenue and expenses are translated into U.S. dollars at the average exchange rates prevailing during the periods in which these items arise. Translation gains and losses are deferred and accumulated as a component of other comprehensive income in owners’ equity. Transaction gains and losses that arise from exchange rate fluctuations from transactions denominated in a currency other than the functional currency are included in the statement of operations as incurred. Translation gains of $119,542 were recorded for the six months ended June 30, 2006 and were immaterial for the six months ended June 30, 2005.
The Chinese government imposes significant exchange restrictions on fund transfers out of China that are not related to business operations. These restrictions have not had a material impact on the Company because it has not engaged in any significant transactions that are subject to the restrictions.
RMB is not readily convertible into United States dollars or other foreign currencies. For several years prior to July 21, 2005, the foreign exchange rate between the United States dollar and the RMB had been stable at approximately RMB 8.28 to US$1.00. On July 21, 2005, the Central Bank of China announced that it would allow the Yuan to move to a flexible exchange rate with a maximum daily variance against the US dollar of 0.3%. No provision has been made in the accompanying financial statements for the change in currency policy, nor has any determination been made as to the potential impact this may have on the Company's future operations. No representation is made that RMB amounts could have been, or could be, converted into United States dollars or any other currency at that rate or any other rate.
In preparing financial statements in conformity with accounting principles generally accepted in the United Sates of America, management is required to make estimates and assumptions that affect the reported amounts of assets and liabilities and the disclosure of contingent assets and liabilities at the date of the financial statements and the reported amounts of revenues and expenses during the reported periods. Actual results could differ from those estimates. Significant estimates include allowance for doubtful accounts receivable and depreciable lives of fixed assets. .
| | d. | Cash and Cash Equivalents |
The Company considers all highly liquid investments with original maturities of three months or less at the time of purchase to be cash equivalents. As of June 30, 2006 and 2005 the Company did not have any cash equivalents.
Inventories are stated at the lower of cost or market. Substantially all inventory costs are determined using the weighted-average method. Inventory costs do not exceed net realizable value.
| | f. | Property, Plant and Equipment, Net |
Property, plant and equipment are stated at cost. Depreciation and amortization is provided principally by use of the straight-line method over the useful lives of the related assets, which are twenty to thirty-five years for building and leasehold improvements, and ten years for all other assets. Expenditures for maintenance and repairs which do not improve or extend the expected useful life of the assets are expensed to operations, while major repairs are capitalized
| | g. | Construction in Progress |
Construction in progress represents properties under construction and is stated at cost. This includes cost of construction and other direct costs. Construction in progress is not depreciated until such time as the assets are completed and put into operational use.
The Company accounts for income taxes under Statement of Financial Accounting Standards (“SFAS”) No. 109, "Accounting for Income Taxes" (“SFAS No. 109”). Under SFAS No. 109, deferred tax assets and liabilities are recognized for the future tax consequences attributable to differences between the financial statement carrying amounts of existing assets and liabilities and their respective tax bases. Deferred tax assets and liabilities are measured using enacted tax rates expected to apply to taxable income in the years in which those temporary differences are expected to be recovered or settled. Under SFAS No. 109, the effect on deferred tax assets and liabilities of a change in tax rates is recognized in income in the period that includes the enactment date. There are no deferred tax assets or liabilities as of June 30, 2006 and 2005 as there are immaterial differences between the income tax bases of assets and liabilities and these bases for financial statement purposes.
| i. | Revenue Recognition and Return |
The Company recognizes revenue when the significant risks and rewards of ownership have transferred pursuant to PRC law, including factors such as when persuasive evidence of an arrangement exists, passage of title, the sales price being fixed and determinable, sales and value-added tax laws have been complied with, and collectibility is reasonably assured. In the event goods are returned from a customer, revenue is reduced, and the returned goods are placed back into inventory during the period that the returned goods are received by the Company. Returns are immaterial for all periods presented.
| j. | Employees' Benefits and Pension Obligations |
Mandatory contributions, based on gross salary payments, are made to the PRC government's health, retirement benefit, and unemployment programs at the statutory rates in effect during each reporting period. These payments are charged to expense in the same period as the related salary cost. (see Note 13).
| k. | Comprehensive Income or Loss |
The Company follows the provisions of SFAS No. 130, "Reporting Comprehensive Income" ("SFAS No. 130"). SFAS No. 130 establishes standards for the reporting and display of comprehensive income, its components and accumulated balances in a full set of general purpose consolidated financial statements. SFAS No. 130 defines comprehensive income or loss to include all changes in equity, except those resulting from investments by owners and distributions to owners. Other comprehensive income shall be classified separately into foreign currency items, minimum pension liability adjustments and unrealized gains or losses on certain investments in debt and equity securities.
Accumulated other comprehensive income represents the change in equity of the Company during the periods presented from foreign currency translation adjustments.
| l. | Concentrations of Credit Risk |
Financial instruments that potentially subject the Company to significant concentrations of credit risk consist primarily of cash and trade accounts receivable. The Company performs ongoing credit evaluations with respect to the financial condition of its customers, but does not require collateral. In order to determine the value of the Company's accounts receivable, the Company records a provision for doubtful accounts to cover possible credit losses. Management reviews and adjusts this allowance periodically based on historical experience and its evaluation of the collectibility of outstanding accounts receivable.
In accordance with SFAS No. 144, "Accounting for Impairment or Disposal of Long-Lived Assets" the Company evaluates its long-lived assets to determine whether later events and circumstances warrant revised estimates of useful lives or a reduction in carrying value due to impairment. If indicators of impairment exist and if the value of the assets is impaired, an impairment loss would be recognized.
SFAS No. 107, “Disclosures about Fair Values of Financial Instruments”, requires disclosing fair value to the extent practicable for financial instruments that are recognized or unrecognized in the balance sheet. The fair value of the financial instruments disclosed herein is not necessarily representative of the amount that could be realized or settled, nor does the fair value amount consider the tax consequences of realization or settlement. For certain financial instruments, including cash accounts, related party and other receivables, accounts payable, other payables and accrued expenses and short term debt, it was assumed that the carrying amounts approximate fair value because of the near term maturities of such obligations. For long-term debt, the carrying amount is assumed to approximate fair value based on the current rates at which the Company could borrow funds with similar remaining maturities.
Basic earnings per share are computed by dividing the earnings for the year by the weighted average number of common shares outstanding for the period. Diluted earnings per share reflects the potential dilution of securities by including other potential common stock, including stock options and warrants, in the weighted average number of common shares outstanding for a period, if dilutive. There are no potentially dilutive instruments outstanding for any period presented. For the six months ended June 30, 2006 and 2005, earnings per share are not shown as there are no shares outstanding.
| p. | Allowance for Doubtful Accounts |
Payment terms of delivered sales to unrelated parties generally are cash or banker’s acceptance. For those sales in which credit is extended, the Company recognizes an allowance for doubtful accounts to ensure accounts receivable are not overstated due to uncollectibility. Bad debt reserves are maintained for all customers based on a variety of factors, including the length of time the receivables are past due, significant one -time events and historical experience. An additional reserve for individual accounts is recorded when the Company becomes aware of a customer’s inability to meet its financial obligation, such as in the case of bankruptcy filings or deterioration in the customer’s operating results or financial position. If circumstances related to customers change, estimates of the recoverability of receivables would be further adjusted. As of June 30, 2006 and 2005, the allowance for doubtful accounts was $0.
Shipping and handling costs are included in the cost of sales.
| 3. | Related party receivable |
Related party receivable is the amount due from the Group (see Note 1) primarily for accounts receivable from sales, and advances. The Company charges interest to the Group on the balance owed to it by the Group at the rate of 6% per year. We have classified the related party receivable into two parts, one under current assets and the other one under owners’ equity. The related party receivable classified under current assets was fully repaid subsequent to the balance sheet date through August 15, 2006, while the related party receivable classified under owners’ equity represents the unpaid balance as of the dates of those payments. Interest income earned was approximately $266,633 and $579,768 for the six months ended June 30, 2006 and 2005, respectively.
In accordance with the Group’s instructions, the Company has utilized part of its banking facilities to make advances to the Group for the Groups’ central fund management purpose. The Group provides corporate guarantees to secure the banking facilities granted by the banks to the Company (see Note 11).
On June 15, 2005, the Company and the Group signed a Debt Repayment Agreement (the “Agreement”) whereby the Group would partially settle the outstanding amount of $20,084,144 as at December 31, 2004 by two cash installments of $2,416,000 on or before June 30, 2005 and of $3,926,000 on or before July 31, 2005 and the transfer of the Group’s land use rights to the Company. For accounting purposes, because of the related party nature of the transaction, the Company reduced the receivable from the Group by the amortized cost of the land use right on the Group’s books at the date of transfer, which was $2,310,200; the estimated appraised value at that date was approximately $15,130,000. The Agreement also discontinued the imposition of interest on the receivable as January 1, 2005.
By a Supplemental Agreement signed between the Company and the Group on September 16, 2005, the Company and the Group agreed to terminate the original Debt Repayment Agreement which was signed on June 15, 2005 as the location of the subjected land use rights are included by the local government under its city redevelopment plan. Under this plan, the land was reclassified from an industrial use to commercial and residential land; therefore, the transfer of the land use rights was no longer approved by the local government. Since the Agreement was cancelled, the Company and the Group agreed to reinstate the imposition of interest on the related party receivable as of January 1, 2005.
On June 12, 2006, the Equity Owners of the Company approved the Board’s recommendation to distribute a special dividend of $2,480,005 to the Equity Owners. All Equity Owners agreed with the Company to off-set the distribution with the amount due by the Group to the Company as of that date.
A second supplementary agreement was signed on June 30, 2006 between the Company, the Group and the Group’s Chairman, Mr. Feng Shushun. This agreement converted to a short-term note receivable the account receivable of $2, 188, 211 (as converted to US dollar using the exchange rate at June 30, 2006), which was shown on the December 31, 2005 balance sheet as a deduction from owners’ equity, as this was the remaining balance after payment by the Group of $3,676,227 subsequent to December 31, 2005. The note has the following terms and conditions:
| | I) | the maturity date is December 31, 2006 |
| | II) | the annual interest rate is approximately 7.2%, and all interest accrued is due and payable at December 31, 2006. |
| | III) | Mr. Feng personally guarantees the note. |
The Company is planning to undergo a recapitalization of its capital in the coming years. As part of the plan and pursuant to an Equity Owners’ meeting on December 18, 2005, the Equity Owners’ approved the Board’s recommendation by making a special distribution of the retained earning of the Company of $9,332,809 to the Equity Owners. All Equity Owners agreed with the Company to off-set the distributions with the amount due by the Group to the Company.
Inventories are comprised of the following:
| | | June 30, | | June 30, | |
| | | 2006 | | 2005 | |
| Raw materials | | $ | 2,106,483 | | $ | 1,568,946 | |
| Work in progress | | | 1,663,817 | | | 1,900,105 | |
| Finished goods | | | 8,486,696 | | | 14,753,627 | |
| | | $ | 12,256,996 | | $ | 18,222,678 | |
5. | Property, Plant and Equipment, Net |
Property, plant and equipment are comprised of the following:
| | | June 30, | | June 30, | |
| | | 2006 | | 2005 | |
| Building and leasehold improvements | | $ | 2,908,498 | | $ | 2,195,156 | |
| Machinery and equipment | | | 16,610,715 | | | 14,969,177 | |
| Vehicles | | | 135,978 | | | 148,368 | |
| Office equipment and other | | | 42,564 | | | 41,112 | |
| Total at cost | | | 19,697,755 | | | 17,53,813 | |
| Accumulated depreciation | | | 8,282,594 | | | 6,598,881 | |
| | | $ | 11,415,161 | | $ | 10,754,932 | |
Depreciation and amortization expense for each of the six months ended June 30, 2006 and 2005 was approximately $684,957 and $940,511, respectively, of which approximately over 90% and 93% was included in cost of sales for June 30, 2006 and 2005, respectively.
The Company has received the right from the Chinese government to use two parcels of land. Each right has a term of fifty years. The consideration paid for the rights amounts to approximately $217,200. The Company amortizes the cost using the straight-line method over the life of the leases. Amortization expense is approximately $2,182 and $2,116 for the six months ended June 30, 2006 and 2005 respectively.
Pursuant to the relevant laws and regulations in the PRC, the Company was entitled to an exemption from PRC income tax for three years starting from April 1, 2000 to March 31, 2003. From March 31, 2003 onwards, the Company is subject to income taxes computed at the statutory rate of 33%. As of June 30, 2006 and 2005, the Company’s income tax liability was approximately $342,280 and $2,158,790 respectively. Taxes payable on the balance sheets also include other unpaid taxes such as value added tax (VAT), business tax and surtax.
8. | Concentrations and Credit Risk |
The Company operates principally in China and grants credit to its customers in this geographic region. At June 30, 2006 and 2005 the Company has a credit risk exposure of uninsured cash in banks of approximately $4,429,091 and $4,874,894 respectively. The Company does not require collateral or other securities to support financial instruments that are subject to credit risk.
The Company’s principal business activities are located in China. Although China is considered economically stable, it is always possible that unanticipated events in foreign countries could disrupt the Company’s operations.
For the six months ended June 30, 2006, two customers accounted for approximately 41% of total sales as follows: Customer A at $4,716,959 (26%) and Customer B at $2,676,601(15%). For the six months ended June 30, 2005, two customers accounted for approximately 39% of total sales as follows: the Group at $3,972,393 (27%) and Customer C at $1,722,526 (12%).
The Company has a short-term loan payable from two financial institutions of $6,117,114 at June 30, 2006. The loan from financial institution A is $3,752,064, matures on January 1, 2007 and carries an annual interest rate of 6.138%. The loan from financial institution B is $2,365,050, matures on April 15, 2007 and carries an annual interest rate of 6.138%.
As of June 30, 2006 and 2005, the balances of $0 and $4,892,400, respectively, are payable to various banks and restricted cash of $0 and $4,832,000 represents funds deposited with the banks as collateral against these balances. The notes that are generally drawn to pay vendor invoices are all short-term and non-interest bearing.
On December 25, 2005, the Company agreed with a bank to extend the maturity dates of three individual RMB loan facilities totaling approximately $19,300,000. The loans, which were due on various dates between December 15, 2006 and December 25, 2006, have been extended to December 25, 2007. These loans are secured by three corporate guarantees issued by the Group in favor of the bank and bear interest at the rates various from 5.879% to 6.912% per year. No installment payments of principal were due on the loans prior to the revised due date. Due to the changes in the exchange rate of USD to RMB, the outstanding balance of the long term loan is $19,448,197 as at June 30, 2006.
Pursuant to the accounting systems for business enterprises as promulgated by the PRC, the profits of the Company, which are based on their PRC statutory financial statements, are available for distribution in the form of cash dividends only after they have satisfied all PRC tax liabilities, provided for losses in previous years, and made appropriations to reserve funds (as discussed below). If all these conditions are satisfied, the Company is not limited or otherwise restricted in making distributions or dividends, which are determined at the discretion of the Board of Directors in accordance with PRC accounting standards and regulations.
As stipulated by the relevant laws and regulations for enterprises operating in the PRC, companies are required to make annual appropriations to two reserve funds, consisting of the statutory surplus and public welfare funds. In accordance with relevant PRC regulations and the articles of association of the respective companies, companies are required to allocate a certain percentage of their profits after taxation (approximately 15% for the Company), as determined in accordance with the PRC accounting standards applicable to the companies, to the statutory surplus reserve, until such reserve reaches 50% of the registered capital of the companies. The Company’s registered capital is $12,080,000.
The Company is required by statutory Chinese employment laws to fund certain government sponsored retirement plans. The expense incurred by the Company for the six months ended June 30, 2006 and 2005 is immaterial.
For the six months ended June 30, 2006 and 2005, cost of goods sold includes approximately $874,553 (net of VAT) and $1,402,033 (net of VAT), respectively, of discounts from the Shenyang Electricity Company. These discounts have been granted to the Company by the provincial government of Liaoning since 2000. The government can, at its discretion, increase, decrease or terminate the discount.
| 15. | New Accounting Pronouncements |
In February 2006, the Financial Accounting Standards Board (“FASB”) issued SFAS No. 155, “Accounting for Certain Hybrid Financial Instruments - an amendment to SFAS No. 133 and 140”. SFAS No. 155 provides the framework for fair value remeasurement of any hybrid financial instrument that contains an embedded derivative that otherwise would require bifurcation as well as establishes a requirement to evaluate interests in securitized financial assets to identify interests. SFAS No. 155 further amends SFAS No. 140 to eliminate the prohibition on a qualifying special-purpose entity from holding derivatives. This statement is effective for all financial instruments acquired or issued after the beginning of an entity's first fiscal year that begins after September 15, 2006. SFAS No. 155 is not expected to have a material impact on our consolidated financial statements.
In March 2006, FASB issued SFAS No. 156, “Accounting for Servicing of Financial Assets--an amendment of FASB Statement No. 140”. SFAS No. 156 requires the recognition of a servicing asset or servicing liability under certain circumstances when an obligation to service a financial asset by entering into a servicing contract. SFAS No. 156 also requires all separately recognized servicing assets and servicing liabilities to be initially measured at fair value utilizing the amortization method or fair market value method. SFAS No. 156 is effective the beginning of the first fiscal year that begins after September 15, 2006. SFAS No. 156 is not expected to have a material impact on our consolidated financial statements.
| 16. | Supplemental Cash Flow Disclosures |
The Company had the following income tax payments:
a) $661,572 and $0 for the six months ended June 30, 2006 and 2005, respectively.
The Company had the following non-cash investing and financing transactions:
b) Reclassification of related party receivable to equity - June 30, 2006 ($2,188,211) and June 30, 2005 ($2,145,452).
c) Reducing related party receivable by the amount of a special dividend distribution of $2,480,005 and $0 for the six months ended June 30, 2006 and 2005, respectively.
On September 4, 2006, the Company was acquired by Elwin Group Limited, a company incorporated in the British Virgin Islands, pursuant to a re-organization plan. Elwin Group Limited owns a 100% equity interest in Elwin Non-Ferrous Metals Limited (ENFML), a currently a nonoperating entity. As of June 30, 2006, the Company has an amount due to ENFML of $45,024 and such amount shall be reclassified as related party payable subsequent to the re-organization plan.
KANGPING ALUMINUM AUDITED FINANCIAL STATEMENTS
Report of Independent Registered Public Accounting Firm
To the Board of Directors and Stockholders of
Shenyang Fangyuan Group Kangping Aluminum Factory Company Limited
We have audited the accompanying balance sheets of Shenyang Fangyuan Group Kangping Aluminum Factory Company Limited as of December 31, 2005 and 2004, and the related statements of operations and comprehensive income, owners’ equity, and cash flows for each of the three years in the period ended December 31, 2005. These financial statements are the responsibility of the Company’s management. Our responsibility is to express an opinion on these financial statements based on our audits.
We conducted our audits in accordance with the standards of the Public Company Accounting Oversight Board (United States). Those standards require that we plan and perform the audit to obtain reasonable assurance about whether the financial statements are free of material misstatement. The Company is not required to have, nor were we engaged to perform, an audit of its internal control over financial reporting. Our audit included consideration of internal control over financial reporting as a basis for designing audit procedures that are appropriate in the circumstances, but not for the purposes of expressing an opinion on the effectiveness of the Company’s internal control over financial reporting. Accordingly, we express no such opinion. An audit includes examining, on a test basis, evidence supporting the amounts and disclosures in the financial statements. An audit also includes assessing the accounting principles used and significant estimates made by management, as well as evaluating the overall financial statement presentation. We believe that our audits provide a reasonable basis for our opinion.
In our opinion, the financial statements referred to above present fairly, in all material respects, the financial position of Shenyang Fangyuan Group Kangping Aluminum Factory Company Limited as of December 31, 2005 and 2004, and the results of its operations and its cash flows for each of the three years in the period ended December 31, 2005, in conformity with accounting principles generally accepted in the United States of America.
| | Moore Stephens, P.C. |
| | Certified Public Accountants |
New York, New York
April 21 2006, except for Note 18,
As to which the date is July 27, 2006
| Shenyang Fangyuan Group Kangping Aluminum Factory Company Limited |
| Balance Sheets |
| December 31, |
| (Expressed in United States dollars) |
| | | 2005 | | 2004 | |
| ASSETS | |
| CURRENT ASSETS | | | | | |
| Cash | | $ | 118,084 | | $ | 329,398 | |
| Cash restricted | | | 6,510,013 | | | 2,416,000 | |
| Notes receivable | | | 22,940 | | | 78,520 | |
| Accounts receivable | | | 276,544 | | | 300,040 | |
| Related party receivable | | | 3,676,227 | | | 6,342,000 | |
| Inventories | | | 16,018,762 | | | 13,107,659 | |
| Prepayments and other current assets | | | 1,996,769 | | | 666,530 | |
| Total Current Assets | | | 28,619,339 | | | 23,240,147 | |
| PROPERTY, PLANT AND EQUIPMENT, net | | | 12,243,110 | | | 12,436,477 | |
| BUILDING PLEDGED AS SECURITY TO CREDITOR, net | | | 5,590,691 | | | 4,975,443 | |
| LAND USE RIGHT, net | | | 178,144 | | | 177,779 | |
| CONSTRUCTION IN PROGRESS | | | 418,567 | | | 1,751,404 | |
| Total Non-Current Assets | | | 18,430,512 | | | 19,341,103 | |
| Total Assets | | $ | 47,049,851 | | $ | 42,581,250 | |
| LIABILITIES AND OWNERS’ EQUITY |
| CURRENT LIABILITIES | | | | | | | |
| Short term borrowings | | $ | 4,030,008 | | $ | 4,832,000 | |
| Notes payable | | | 4,960,010 | | | 4,832,000 | |
| Accounts payable | | | 1,260,479 | | | 1,717,742 | |
| Other payables and accruals | | | 1,365,600 | | | 1,220,047 | |
| Taxes payable | | | 1,157,938 | | | 1,806,599 | |
| Total Current Liabilities | | | 12,774,035 | | | 14,408,388 | |
| | | | | | | | |
| LONG TERM BORROWINGS | | | 19,282,038 | | | 19,086,400 | |
| Total Liabilities | | | 32,056,073 | | | 33,494,788 | |
| COMMITMENTS (Note 7) | | | | | | | |
| OWNERS' EQUITY | | | | | | | |
| Paid-in capital | | | 12,080,000 | | | 12,080,000 | |
| Accumulated other comprehensive income | | | 627,236 | | | - | |
| Reserves | | | 2,074,488 | | | 1,607,505 | |
| Retained earnings | | | 2,414,345 | | | 9,141,095 | |
| | | | 17,196,069 | | | 22,828,600 | |
| Less: related party receivable | | | (2,202,291 | ) | | (13,742,138 | ) |
| Total Owner's Equity | | | 14,993,778 | | | 9,086,462 | |
| Total Liabilities and Owners' Equity | | $ | 47,049,851 | | $ | 42,581,250 | |
| |
| The accompanying notes are an integral part of these financial statements. |
| Shenyang Fangyuan Group Kangping Aluminum Factory Company Limited |
| Statements of Operations and Comprehensive Income |
| For the Years Ended December 31, |
| (Expressed in United States dollars) |
| |
| | | 2005 | | 2004 | | 2003 | |
| SALES - UNRELATED PARTIES | | $ | 26,370,255 | | $ | 33,616,221 | | $ | 29,680,549 | |
| SALES - RELATED PARTIES | | | 13,757,972 | | | 10,204,957 | | | 12,270,345 | |
| SALES | | | 40,128,227 | | | 43,821,178 | | | 41,950,894 | |
| COST OF SALES | | | 34,430,828 | | | 39,306,630 | | | 36,723,472 | |
| GROSS PROFIT | | | 5,697,399 | | | 4,514,548 | | | 5,227,422 | |
| OPERATING EXPENSES | | | | | | | | | | |
| Depreciation | | | 128,819 | | | 125,058 | | | 120,500 | |
| General and administrative expenses | | | 192,577 | | | 646,526 | | | 495,404 | |
| INCOME FROM OPERATIONS | | | 5,376,003 | | | 3,742,964 | | | 4,611,518 | |
| OTHER INCOME (EXPENSE) | | | | | | | | | | |
| Interest income - related party | | | 959,232 | | | 1,007,289 | | | 885,309 | |
| Other income | | | 103,750 | | | 205,842 | | | 224,858 | |
| Other expense | | | (26,590 | ) | | (18,348 | ) | | (16,162 | ) |
| Interest expense | | | (1,712,986 | ) | | (1,769,241 | ) | | (1,358,196 | ) |
| | | | (676,594 | ) | | (574,458 | ) | | (264,191 | ) |
| INCOME BEFORE INCOME TAXES | | | 4,699,409 | | | 3,168,506 | | | 4,347,327 | |
| PROVISION FOR INCOME TAXES | | | | | | | | | | |
| Current | | | 1,626,367 | | | 1,045,609 | | | 1,127,613 | |
| NET INCOME | | $ | 3,073,042 | | $ | 2,122,897 | | $ | 3,219,714 | |
| | | | | | | | | | | |
| Net Income | | $ | 3,073,042 | | $ | 2,122,897 | | $ | 3,219,714 | |
| Foreign Currency Translation | | | 627,236 | | | 0 | | | 0 | |
| Comprehensive Income | | $ | 3,700,278 | | $ | 2,122,897 | | $ | 3,219,714 | |
The accompanying notes are an integral part of these financial statements.
| Shenyang Fangyuan Group Kangping Aluminum Factory Company Limited |
| Statements of Owners' Equity |
| For the Years Ended December 31, 2005, 2004 and 2003 |
| (Expressed in United States dollars) |
| | | | | Accumulated | | | | | | | | | |
| | | | | other | | | | | | Related | | | |
| | | Paid-in | | Comprehensive | | Retained | | | | Party | | Owners' | |
| | | Capital | | Income | | Earnings | | Reserves | | Receivable | | Equity | |
| | | | | | | | | | | | | | |
| Balance at January 1, 2003 | | | 12,080,000 | | | 0 | | | 4,595,091 | | | 810,898 | | | (7,564,325 | ) | | 9,921,664 | |
| Net income | | | | | | | | | 3,219,714 | | | | | | | | | 3,219,714 | |
| Transfer to reserve funds | | | | | | | | | (482,957 | ) | | 482,957 | | | | | | - | |
| Increase in related party receivable | | | | | | | | | | | | | | | (15,829,722 | ) | | (15,829,722 | ) |
| Balance at December 31, 2003 | | | 12,080,000 | | | 0 | | | 7,331,848 | | | 1,293,855 | | | (23,394,047 | ) | | (2,688,344 | ) |
| | | | | | | | | | | | | | | | | | | | |
| Net income | | | | | | | | | 2,122,897 | | | | | | | | | 2,122,897 | |
| Transfer to reserve funds | | | | | | | | | (313,650 | ) | | 313,650 | | | | | | - | |
| Decrease in related party receivable | | | | | | | | | | | | | | | 9,651,909 | | | 9,651,909 | |
| Balance at December 31, 2004 | | | 12,080,000 | | | 0 | | | 9,141,095 | | | 1,607,505 | | | (13,742,138 | ) | | 9,086,462 | |
| | | | | | | | | | | | | | | | | | | | |
| Net income | | | | | | | | | 3,073,042 | | | | | | | | | 3,073,042 | |
| Foreign currency translation | | | | | | 627,236 | | | | | | | | | | | | 627,236 | |
| Transfer to reserve funds | | | | | | | | | (466,983 | ) | | 466,983 | | | | | | - | |
| Distribution declared | | | | | | | | | (9,332,809 | ) | | | | | 9,332,809 | | | - | |
| Decrease in related party receivable | | | | | | | | | | | | | | | 2,207,038 | | | 2,207,038 | |
| Balance at December 31,2005 | | | 12,080,000 | | | 627,236 | | | 2,414,345 | | | 2,074,488 | | | (2,202,291 | ) | | 14,993,778 | |
The accompanying notes are an integral part of these financial statements.
| Shenyang Fangyuan Group Kangping Aluminum Factory Company Limited | |
| Statements of Cash Flows | |
| For the Years Ended December 31, | |
| (Expressed in United States dollars) | |
| | |
| | | 2005 | | 2004 | | 2003 | |
| CASH FLOWS FROM OPERATING ACTIVITIES | | | | | | | |
| Net income | | $ | 3,073,042 | | $ | 2,122,897 | | $ | 3,219,714 | |
| Adjustments to reconcile net income to net cash | | | | | | | | | | |
| used by operating activities: | | | | | | | | | | |
| Depreciation | | | 1,753,737 | | | 1,726,240 | | | 1,567,194 | |
| Disposal of fixed assets | | | 17,481 | | | 59,920 | | | - | |
| Land lease amortization | | | 4,289 | | | 4,233 | | | 4,233 | |
| Changes in operating assets and liabilities | | | | | | | | | | |
| Decrease (Increase) in operating assets: | | | | | | | | | | |
| Notes receivable | | | 56,906 | | | 260,318 | | | (338,838 | ) |
| Accounts receivable | | | 31,034 | | | (226,810 | ) | | 2,154,214 | |
| Related party receivable | | | 5,316,765 | | | 3,309,909 | | | (15,829,722 | ) |
| Inventories | | | (2,530,343 | ) | | (4,352,330 | ) | | (3,985,224 | ) |
| Prepayments and other current assets | | | (1,295,426 | ) | | 3,826,706 | | | (1,519,122 | ) |
| Increase (Decrease) in operating liabilities | | | | | | | | | | |
| Accounts payable | | | (496,199 | ) | | 497,032 | | | (720,870 | ) |
| Related party payable | | | - | | | (1,073,215 | ) | | 942,748 | |
| Other payables and accruals | | | 111,751 | | | (278,319 | ) | | 444,798 | |
| Income and other taxes payable | | | (647,418 | ) | | 1,306,720 | | | 482,801 | |
| Net Cash Provided / (Used) by operating Activities | | | 5,355,620 | | | 7,183,301 | | | (13,578,076 | ) |
| CASH FLOWS FROM INVESTING ACTIVITIES | | | | | | | | | | |
| Purchase of fixed assets | | | (7,343 | ) | | (7,236 | ) | | - | |
| Construction in progress | | | (340,695 | ) | | (722,004 | ) | | (893,959 | ) |
| Net Cash (Used) by Investing activities | | | (348,038 | ) | | (729,240 | ) | | (893,959 | ) |
| CASH FLOWS FROM FINANCING ACTIVITIES | | | | | | | | | | |
| Proceeds from (payment of) notes payable | | | - | | | (27,663,200 | ) | | 20,862,160 | |
| (Decrease)/increase in short term borrowings | | | (917,847 | ) | | 5,798,400 | | | 2,174,400 | |
| (Decrease)/increase in long term borrowings | | | 305,949 | | | - | | | - | |
| (Increase)/Decrease in restricted cash | | | (3,977,335 | ) | | 13,831,600 | | | (7,030,560 | ) |
| Net Cash Provided / (Used) by Financing Activities | | | (5,201,131 | ) | | (8,033,200 | ) | | 16,006,000 | |
| EFFECT OF EXHANGE RATE CHANGES ON CASH | | | (17,766 | ) | | - | | | - | |
| NET INCREASE(DECREASE) IN CASH | | | (211,314 | ) | | (1,579,139 | ) | | 1,533,966 | |
| CASH, beginning of year | | | 329,398 | | | 1,908,537 | | | 374,571 | |
| CASH, end of year | | $ | 118,084 | | $ | 329,398 | | $ | 1,908,537 | |
| SUPPLEMENTAL DISCLOSURES | | | | | | | | | | |
| Interest paid | | $ | 1,646,825 | | $ | 1,672,941 | | $ | 1,552,575 | |
| Income taxes paid | | $ | 2,864,172 | | $ | 171,045 | | $ | 470,108 | |
The accompanying notes are an integral part of these financial statements.
SHENYANG FANGYUAN GROUP KANGPING ALUMINUM FACTORY COMPANY LIMITED
NOTES TO FINANCIAL STATEMENTS
(Expressed in United States dollars)
Shenyang Fangyuan Group Kangping Aluminum Factory Company Limited. [“the Company”] is located in Kangping, China.The Company was organized by Shenyang Fangyuan Group Company Limited [“the Group”] (80%) and Mrs. Feng Lew Yu Ying (20%) as a Chinese limited liability company on June 8, 1998 in China. The Company is principally engaged in aluminum refining for sale within China. Mrs. Feng is also a 10% shareholder in the Group.
2. | Summary of Significant Accounting Policies |
| a. | Foreign Currency Translation |
The Company maintains its books and accounting records in Renminbi ("RMB"), the PRC's currency and the Company's functional currency. Translation of amounts from RMB into United States dollars ("US$") has been made at the following exchange rates for the respective years:
| December 31, 2005: | |
| Balance sheet | RMB 8.0645 to US$ 1.00 |
| Statement of Operations | RMB 8.1699 to US$ 1.00 |
| | |
| December 31, 2004 and 2003: | |
| Balance sheet | RMB 8.2781 to US$ 1.00 |
| Statement of Operations | RMB 8.2781 to US$ 1.00 |
| | |
The Company’s balance sheet accounts are translated into US dollars at the year-end exchange rates and all revenue and expenses are translated into U.S. dollars at the average exchange rates prevailing during the periods in which these items arise. Translation gains and losses are deferred and accumulated as a component of other comprehensive income in owners’ equity. Transaction gains and losses that arise from exchange rate fluctuations from transactions denominated in a currency other than the functional currency are included in the statement of operations as incurred. Translation gains of $627,236 were recorded for the year ended December 31, 2005 and were immaterial for the years ended December 31, 2004 and 2003. Transaction gains and losses were immaterial for the years December 31, 2005, 2004 and 2003.
The Chinese government imposes significant exchange restrictions on fund transfers out of China that are not related to business operations. These restrictions have not had a material impact on the Company because it has not engaged in any significant transactions that are subject to the restrictions.
RMB is not readily convertible into United States dollars or other foreign currencies. For several years prior to July 21, 2005, the foreign exchange rate between the United States dollar and the RMB had been stable at approximately RMB 8.28 to US$1.00 for the last several years. On July 21, 2005, the Central Bank of China announced that it would allow the Yuan (Renminbi) to move to a flexible exchange rate with a maximum daily variance against the US dollar of 0.3%. No provision has been made in the accompanying financial statements for the change in currency policy, nor has any determination been made as to the potential impact this may have on the Company's future operations. No representation is made that RMB amounts could have been, or could be, converted into United States dollars or any other currency at that rate or any other rate.
In preparing financial statements in conformity with accounting principles generally accepted in the United Sates of America, management is required to make estimates and assumptions that affect the reported amounts of assets and liabilities and the disclosure of contingent assets and liabilities at the date of the financial statements and the reported amounts of revenues and expenses during the reported periods. Actual results could differ from those estimates. Significant estimates include allowance for doubtful accounts receivable and depreciable lives of fixed assets. .
| c. | Cash and Cash Equivalents |
The Company considers all highly liquid investments with original maturities of three months or less at the time of purchase to be cash equivalents. As of December 31, 2005 and 2004 the Company did not have any cash equivalents.
Inventories are stated at the lower of cost or market. Substantially all inventory costs are determined using the weighted-average method. Inventory costs do not exceed net realizable value.
| e. | Property, Plant and Equipment, Net |
Property, plant and equipment is stated at cost. Depreciation and amortization is provided principally by use of the straight-line method over the useful lives of the related assets, which are twenty to thirty-five years for building and leasehold improvements, and ten years for all other assets. Expenditures for maintenance and repairs which do not improve or extend the expected useful life of the assets are expensed to operations, while major repairs are capitalized
SHENYANG FANGYUAN GROUP KANGPING ALUMINUM FACTORY COMPANY LIMITED
NOTES TO FINANCIAL STATEMENTS - CONTINUED
(Expressed in United States dollars)
2 | Summary of Significant Accounting Policies - continued |
| f. | Construction in Progress |
Construction in progress represents properties under construction and is stated at cost. This includes cost of construction and other direct costs. Construction in progress is not depreciated until such time as the assets are completed and put into operational use.
The Company accounts for income taxes under Statement of Financial Accounting Standards (“SFAS”) No. 109, "Accounting for Income Taxes" (“SFAS No. 109”). Under SFAS No. 109, deferred tax assets and liabilities are recognized for the future tax consequences attributable to differences between the financial statement carrying amounts of existing assets and liabilities and their respective tax bases. Deferred tax assets and liabilities are measured using enacted tax rates expected to apply to taxable income in the years in which those temporary differences are expected to be recovered or settled. Under SFAS No. 109, the effect on deferred tax assets and liabilities of a change in tax rates is recognized in income in the period that includes the enactment date. There are no deferred tax assets or liabilities as of December 31, 2005 and 2004 as there are immaterial differences between the income tax bases of assets and liabilities and these bases for financial statement purposes.
| h. | Revenue Recognition and Return |
The Company recognizes revenue when the significant risks and rewards of ownership have transferred pursuant to People’s Republic of China (“PRC”) law, including factors such as when persuasive evidence of an arrangement exists, passage of title, the sales price being fixed and determinable, sales and value-added tax laws have been complied with, and collectibility is reasonably assured. In the event goods are returned from a customer, revenue is reduced, and the returned goods are placed back into inventory during the period that the returned goods are received by the Company. Returns are immaterial for all periods presented.
| i. | Employees' Benefits and Pension Obligations |
Mandatory contributions, based on gross salary payments, are made to the PRC government's health, retirement benefit, and unemployment programs at the statutory rates in effect during each reporting period. These payments are charged to expense in the same period as the related salary cost. (see Note 14).
SHENYANG FANGYUAN GROUP KANGPING ALUMINUM FACTORY COMPANY LIMITED
NOTES TO FINANCIAL STATEMENTS - CONTINUED
(Expressed in United States dollars)
| 2. | Summary of Significant Accounting Policies - continued |
| j. | Comprehensive Income or Loss |
The Company follows the provisions of SFAS No. 130, "Reporting Comprehensive Income" ("SFAS No. 130"). SFAS No. 130 establishes standards for the reporting and display of comprehensive income, its components and accumulated balances in a full set of general purpose consolidated financial statements. SFAS No. 130 defines comprehensive income or loss to include all changes in equity, except those resulting from investments by owners and distributions to owners, including adjustments to minimum pension liabilities, accumulated foreign currency translation, and unrealized gains or losses on marketable securities.
Accumulated other comprehensive income represents the change in equity of the Company during the periods presented from foreign currency translation adjustments.
| k. | Concentrations of Credit Risk |
Financial instruments that potentially subject the Company to significant concentrations of credit risk consist primarily of trade accounts receivable. The Company performs ongoing credit evaluations with respect to the financial condition of its creditors, but does not require collateral. In order to determine the value of the Company's accounts receivable, the Company records a provision for doubtful accounts to cover probable credit losses. Management reviews and adjusts this allowance periodically based on historical experience and its evaluation of the collectibility of outstanding accounts receivable.
In accordance with SFAS No. 144, "Accounting for Impairment or Disposal of Long-Lived Assets" the Company evaluates its long-lived assets to determine whether later events and circumstances warrant revised estimates of useful lives or a reduction in carrying value due to impairment. If indicators of impairment exist and if the value of the assets is impaired, an impairment loss would be recognized.
SHENYANG FANGYUAN GROUP KANGPING ALUMINUM FACTORYCOMPAN Y LIMITED
NOTES TO FINANCIAL STATEMENTS - CONTINUED
(Expressed in United States dollars)
| 2. | Summary of Significant Accounting Policies - continued |
Parties are considered to be related if one party has the ability, directly or indirectly, to control the other party, or exercise significant influence over the other party, in making financial and operational decisions. Parties are also considered to be related if they are subject to common control or common significant influence. Related parties may be individuals, corporate or other types of legal entities.
| n. | Fair Value of Financial Instruments |
SFAS No. 107, “Disclosures about Fair Values of Financial Instruments”, requires disclosing fair value to the extent practicable for financial instruments that are recognized or unrecognized in the balance sheet. The fair value of the financial instruments disclosed herein is not necessarily representative of the amount that could be realized or settled, nor does the fair value amount consider the tax consequences of realization or settlement. For certain financial instruments, including cash accounts, related party and other receivables, accounts payable, other payables and accrued expenses and short term debt, it was assumed that the carrying amounts approximate fair value because of the near term maturities of such obligations. For long-term debt, the carrying amount is assumed to approximate fair value based on the current rates at which the Company could borrow funds with similar remaining maturities.
SHENYANG FANGYUAN GROUP KANGPING ALUMINUM FACTORY COMPANY LIMITED
NOTES TO FINANCIAL STATEMENTS - CONTINUED
(Expressed in United States dollars)
| 2. | Summary of Significant Accounting Policies - continued |
Basic earnings per share is computed by dividing the earnings for the year by the weighted average number of common shares outstanding for the period. Diluted earnings per share reflects the potential dilution of securities by including other potential common stock, including stock options and warrants, in the weighted average number of common shares outstanding for a period, if dilutive. There are no potentially dilutive instruments outstanding for any period presented.
For the years ended December 31, 2005, 2004 and 2003, earnings per share are not shown as there are no shares outstanding.
| p. | Allowance for Doubtful Accounts |
Payment terms of delivered sales to unrelated parties generally are cash or banker’s acceptance. For those sales in which credit is extended, the Company recognizes an allowance for doubtful accounts to ensure accounts receivable are not overstated due to uncollectibility. Bad debt reserves are maintained for all customers based on a variety of factors, including the length of time the receivables are past due, significant one -time events and historical experience. An additional reserve for individual accounts is recorded when the Company becomes aware of a customer’s inability to meet its financial obligation, such as in the case of bankruptcy filings or deterioration in the customer’s operating results or financial position. If circumstances related to customers change, estimates of the recoverability of receivables would be further adjusted. As of December 31, 2005 and 2004, the allowance for doubtful accounts was $0.
Shipping and handling costs are included in the cost of sales.
There are two outstanding notes at December 31, 2005 which mature on February 3, 2006 and May 25, 2006, respectively. . All are due from unrelated customers and are non-interest bearing for 2005 and 2004.
SHENYANG FANGYUAN GROUP KANGPING ALUMINUM FACTORY COMPANY LIMITED
NOTES TO FINANCIAL STATEMENTS - CONTINUED
(Expressed in United States dollars)
| 3. | Notes Receivable - continued |
| | | 2005 | | 2004 | |
| Balance at January 1 | | $ | 78,520 | | $ | 338,838 | |
| Additions for the year | | | 25,918,178 | | | 25,525,150 | |
| Repayments for the year | | | (25,973,758 | ) | | (25,785,468 | ) |
| Balance at December 31 | | $ | 22,940 | | $ | 78,520 | |
| 4. | Related party receivable |
Related party receivable is the amount due from the Group primarily for accounts receivable from sales, and advances. The Company charges interest to the Group on the balance owed to it by the Group at the rate of 6% per annum. We have classified the related party receivable into two parts, one under the current asset and the other one under owners’ equity. The related party receivable classified under current asset was fully repaid subsequent to the balance sheet date through June 30, 2006 (July 19, 2005 for the 2004 balance sheet), while the related party receivable classified under owners’ equity represent the unpaid balance as of the date of those payments.
In accordance with the Group’s instructions, the Company has utilized part of its banking facilities to make advances to the Group for the Groups’ central fund management purpose. The Group provides corporate guarantees to secure the banking facilities granted by the banks to the Company (see Note 10 ).
On June 15, 2005, the Company and the Group signed a Debt Repayment Agreement (the “Agreement”) whereby the Group would partially settle the outstanding amount of $20,084,144 as at December 31, 2004 by two cash installments of $2,416,000 on or before June 30, 2005 and of $3,926,000 on or before July 31, 2005 and the transfer of the Group’s land use rights to the Company. For accounting purposes, because of the related party nature of the transaction, the Company reduced the receivable from the Group by the amortized cost of the land use right on the Group’s books at the date of transfer, which was $2,310,200; the appraised value at that date was approximately $15,130,000. The Agreement also discontinued the imposition of interest on the receivable as January 1, 2005.
SHENYANG FANGYUAN GROUP KANGPING ALUMINUM FACTORY COMPANY LIMITED
NOTES TO FINANCIAL STATEMENTS - CONTINUED
(Expressed in United States dollars)
| 4. | Related party receivable - continued |
By a Supplemental Agreement signed between the Company and the Group on September 16, 2005, the Company and the Group agreed to terminate the original Debt Repayment Agreement which was signed on June 15, 2005 as the location of the subjected land use rights are included by the local government under its city redevelopment plan. Under this plan, the land was reclassified from an industrial use to commercial and residential land; therefore, the transfer of the land use rights was no longer approved by the local government. Since the Agreement was cancelled, the Company and the Group agreed to reinstate the imposition of interest on the related party receivable as of January 1, 2005.
A second supplementary agreement was signed on June 30, 2006 between the Company, the Group and the Group’s Chairman, Mr. Feng Shushun. This agreement converted to a short-term note receivable the account receivable of $2,202,291, which is shown on the December 31, 2005 balance sheet as a deduction from owners’ equity, as this is the remaining balance after the payment by the Group of $3,676,227 subsequent to December 31, 2005 (see Note 18 ). The note has the following terms and conditions:
| | I) | the maturity date is December 31, 2006 |
| | II) | the annual interest rate is approximately 7.2%, and all interest accrued is due and payable at December 31, 2006. |
| | III) | Mr. Feng personally guarantees the note. |
The Company is planning to undergo a recapitalization of its capital in the coming years. As part of the plan and pursuant to an Equity Owners’ meeting on December 18, 2005, the Equity Owners’ approved the Board’s recommendation by making a special distribution of the retained earning of the Company of $9,332,809 to the Equity Owners.
All Equity Owners agreed with the Company to off-set the distributions with the amount due by the Group to the Company (see Note 15).
SHENYANG FANGYUAN GROUP KANGPING ALUMINUM FACTORY COMPANY LIMITED
NOTES TO FINANCIAL STATEMENTS - CONTINUED
(Expressed in United States dollars)
Inventories are comprised of the following:
| | | December 31, | | December 31, | |
| | | 2005 | | 2004 | |
| Raw materials | | | 1,735,055 | | $ | 1,375,109 | |
| Work in progress | | | 1,402,218 | | | 1,923,000 | |
| Finished goods | | | 12,881,489 | | | 9,809,550 | |
| | | | 16,018,762 | | $ | 13,107,659 | |
| 6. | Property, Plant and Equipment, Net |
Property, plant and equipment is comprised of the following:
| | | December 31 | | December 31 | |
| | | 2005 | | 2004 | |
| Building and leasehold improvements | | $ | 2,059,105 | | $ | 3,284,582 | |
| Machinery and equipment | | | 16,841,654 | | | 13,525,380 | |
| Vehicles | | | 143,893 | | | 157,269 | |
| Office equipment and other | | | 43,366 | | | 42,247 | |
| Total at cost | | | 19,088,018 | | | 17,009,478 | |
| Accumulated depreciation and amortization | | | (6,844,908 | ) | | (4,573,001 | ) |
| | | $ | 12,243,110 | | $ | 12,436,477 | |
Depreciation and amortization expense for each of the years ended December 31, 2005, 2004 and 2003 was approximately $1,746,700, $1,726,200 and $1,567,200, respectively, of which approximately $1,617,900, $1,601,200 and $1,446,700 was included in cost of sales for 2005, 2004 and 2003, respectively.
SHENYANG FANGYUAN GROUP KANGPING ALUMINUM FACTORY COMPANY LIMITED
NOTES TO FINANCIAL STATEMENTS - CONTINUED
(Expressed in United States dollars)
The Company has received the right from the Chinese government to use two parcels of land. Each right has a term of fifty years. The consideration paid for the rights amounts to approximately $217,200. The Company amortizes the cost using the straight-line method over the life of the leases. Amortization expense is approximately $4,300 for the years ended December 31, 2005, 2004 and 2003, respectively. Accumulated amortization at December 31, 2005 and 2004 is approximately $39,100 and $33,900, respectively. The amortization for each of next five years is estimated to be $4,300 each year. The land lease is pledged for the short-term borrowings.
Pursuant to the relevant laws and regulations in the Peoples’ Republic of China (“PRC”), the Company was entitled to an exemption from PRC income tax for three years starting from April 1, 2000 to March 31, 2003.
A reconciliation between taxes computed at the statutory rate of 33% and the Company’s effective tax rate of 33% (2004: 33%, 2003: 27%) is as follows:
| | | December 31, | |
| | | 2005 | | 2004 | | 2003 | |
| Income tax on pretax income at statutory rate | | $ | 1,550,805 | | $ | 1,045,609 | | $ | 1,434,618 | |
| Effect of 2003 income tax exemption | | | - | | | - | | | (307,005 | ) |
| Permanent differences | | | 75,562 | | | - | | | - | |
| Income tax at effective rate | | $ | 1,626,367 | | $ | 1,045,609 | | $ | 1,127,613 | |
As of December 31, 2005 and 2004, the Company’s income tax liability was approximately $380,900 and $1,592,700, respectively.
The Company is also subject to pay value added tax (VAT), business tax and surtax.
SHENYANG FANGYUAN GROUP KANGPING ALUMINUM FACTORY COMPANY LIMITED
NOTES TO FINANCIAL STATEMENTS - CONTINUED
(Expressed in United States dollars)
| 9. | Concentrations and Credit Risk |
The Company operates principally in China and grants credit to its customers in this geographic region. At December 31, 2005 and 2004 the Company has a credit risk exposure of uninsured cash in banks of approximately $6,628,000 and $2,745,400, respectively. The Company does not require collateral or other securities to support financial instruments that are subject to credit risk.
The Company’s principal business activities are located in China. Although China is considered economically stable, it is always possible that unanticipated events in foreign countries could disrupt the Company’s operations.
For the year ended December 31, 2005, two customers accounted for approximately 53% of total sales as follows: the Group at $13,758,000 (34%) and Customer A at $7,074,000 (19%). For the year ended December 31, 2004, two customers accounted for approximately 38% of total sales as follows: the Group at $10,205,000 (23%) and Customer A at $6,353,600 (15%). For the year ended December 31, 2003, four customers accounted for approximately 62% of total sales as follows: the Group at $12,270,300 (29%); Customer A at $4,826,500 (12%); Customer B at $4,701,000 (11%) and Customer C at $4,101,700 (10%) (see Note 15).
The Company has a short-term loan payable from a financial institution of $4,030,008 at December 31, 2005. This loan carries an annual interest rate of 6.138% and is repayable in three unequal installments as follows: March 10, 2006, $1,550,003; April 10, 2006, $1,240,002; and May 10, 2006, $1,240,003 (see Note 18).
The short term loan is guaranteed by the Group and collateralized by the Company’s land use rights, part of the buildings and leasehold improvements with a cost of $6,388,148 and accumulated depreciation and amortization of $797,457. Interest expense was approximately $1,713,000, $1,769,200 and $1,358,200 for the years ended December 31, 2005, 2004 and 2003, respectively.
On March 9, 2006, the Company obtained a new short term loan facility of US$3,844,000 from the same financial institution with which the Company had a short-term facility outstanding at December 31, 2005. The new short term loan facility was drawn down on March 10, 2006 to refinance a portion of the original short term loan. The original short term loan was fully repaid on March 10, 2006. The new short-term loan matures on January 1, 2007 and carries an annual interest rate of 6.138%.
SHENYANG FANGYUAN GROUP KANGPING ALUMINUM FACTORY COMPANY LIMITED
NOTES TO FINANCIAL STATEMENTS - CONTINUED
(Expressed in United States dollars)
As of December 31, 2005 and 2004, the balances of $4,960,010 and $4,832,000, respectively, are payable to various banks and restricted cash of $6,510,013 and $2,416,000 represents funds deposited with the banks as collateral against these balances. The notes, which are generally drawn to pay vendor invoices, are all short-term and noninterest-bearing.
| Balance at December 31, 2003 | | $ | 32,495,200 | |
| Additions for the year | | | 18,761,400 | |
| Repayments for the year | | | 46,424,600 | |
| Balance at December 31, 2004 | | $ | 4,832,000 | |
| Additions for the year | | | 12,400,025 | |
| Repayments for the year | | | (12,272,015 | ) |
| Balance at December 31, 2005 | | $ | 4,960,010 | |
On December 25, 2005, the Company agreed with a bank to extend the maturity dates of three individual loan facilities totaling approximately $19,300,000. The loans, which were due on various dates between December 15, 2006 and December 25, 2006, have been extended to December 25, 2007. These loans are secured by three corporate guarantees issued by the Group in favor of the bank and bear interest at the rates various from 5.879% to 6.912% per annum. No installment payments of principal were due on the loans prior to the revised due date.
Pursuant to the accounting systems for business enterprises as promulgated by the PRC, the profits of the Company, which are based on their PRC statutory financial statements, are available for distribution in the form of cash dividends only after they have satisfied all PRC tax liabilities, provided for losses in previous years, and made appropriations to reserve funds (as discussed below), as determined at the discretion of the Board of Directors and in accordance with the PRC accounting standards and regulations. With the exception of the restriction on distributions and dividends, the Company is not limited or otherwise restricted in making distributions by any other agencies or indentures.
SHENYANG FANGYUAN GROUP KANGPING ALUMINUM FACTORY COMPANY LIMITED
NOTES TO FINANCIAL STATEMENTS - CONTINUED
(Expressed in United States dollars)
As stipulated by the relevant laws and regulations for enterprises operating in the PRC, companies are required to make annual appropriations to two reserve funds, consisting of the statutory surplus and public welfare funds. In accordance with relevant PRC regulations and the articles of association of the respective companies, companies are required to allocate a certain percentage of their profits after taxation (approximately 15% for the Company), as determined in accordance with the PRC accounting standards applicable to the companies, to the statutory surplus reserve, until such reserve reaches 50% of the registered capital of the companies.
Net income reported in the US GAAP financial statements may differ from that reported in the PRC statutory financial statements. For 2005 this difference was approximately$229,000; for both 2004 and 2003 the difference is immaterial. In accordance with relevant laws and regulations in the PRC, profits available for distribution are based on the statutory financial statements.
The Company is required by statutory Chinese employment laws to fund certain government sponsored retirement plans. The expense incurred by the Company for the years ended December 31, 2005, 2004 and 2004 is immaterial.
| 15. | Related Party Transactions |
As of December 31, 2005 and 2004, the related party receivable of $5,878,517 and $20,084,144 respectively, is due from the Group. In December 2003, the Company signed an agreement with the Group, effective January 1, 2003, whereby the Company charges interest to the Group on the balance owed to it by the Group, which includes accounts receivables from sales and advances. The annual interest rate is approximately 6%. Interest income earned was approximately $959,200, $1,007,300 and $885,300 for 2005, 2004 and 2003, respectively. (see Note 4).
The Company has approximately $13,758,000 (34%), $10,205,000 (23%) and $12,270,300 (29%) of sales to the Group in 2005, 2004 and 2003 respectively (see Note 9).
In 2005, 2004 and 2003, the Company purchased fuel from an entity owned by the brother of one of the Company’s beneficial owners. The 2005 purchase is approximately $258,940. The amount of the 2004 purchase was immaterial and the 2003 purchase is approximately $424,100.
SHENYANG FANGYUAN GROUP KANGPING ALUMINUM FACTORY COMPANY LIMITED
NOTES TO FINANCIAL STATEMENTS - CONTINUED
(Expressed in United States dollars)
In 2005 and 2004, cost of goods sold includes approximately $2,570,411 (RMB 21,000,000, net of VAT) and $2,536,800 (RMB 21,000,000, net of VAT), respectively, of discounts from the Shenyang Electricity Company. These discounts have been granted to the Company by the provincial government of Liaoning since 2001, and currently there is no date as to if and when the discounts will be adjusted or terminated.
| 17. | New Accounting Pronouncements |
In November 2004, the Financial Accounting Standards Board ("FASB") issued Statement of Financial Accounting Standard No. 151 "Inventory Costs - an amendment of ARB No. 43, Chapter 4" ("SFAS 151"). This statement amends the guidance in ARB No. 43, Chapter 4, "Inventory Pricing," to clarify the accounting for abnormal amounts of idle facility expense, freight, handling costs, and wasted material (spoilage). SFAS 151 requires that those items be recognized as current-period charges. In addition, this Statement requires that allocation of fixed production overheads to costs of conversion be based upon the normal capacity of the production facilities. The provisions of SFAS 151 are effective for fiscal years beginning after June 15, 2005. As such, the Company is required to adopt these provisions at the beginning of the fiscal year ending December 31, 2006. The Company is currently evaluating the impact of SFAS 151 on its consolidated financial statements.
In December 2004, the FASB issued SFAS No. 123R, "Share-Based Payment, an Amendment of SFAS No. 123" SFAS No. 123R requires companies to recognize in the statement of operations the grant- date fair value of stock options and other equity-based compensation issued to employees. SFAS No. 123R is effective beginning in the Company's first quarter of fiscal 2006. The Company is in process of evaluating the impact of this pronouncement on its financial position.
In December 2004, the FASB issued SFAS No. 153, "Exchanges of Non-monetary Assets." The Statement is an amendment of APB Opinion No. 29. SFAS No. 153 eliminates the exception for nonmonetary exchanges of similar productive assets and replaces it with a general exception for exchanges of nonmonetary assets that do not have commercial substance. The Company believes that the adoption of this standard will have no material impact on its financial statements.
SHENYANG FANGYUAN GROUP KANGPING ALUMINUM FACTORY COMPANY LIMITED
NOTES TO FINANCIAL STATEMENTS - CONTINUED
(Expressed in United States dollars)
| 17. | New Accounting Pronouncements - continued |
In May 2005, the FASB issued SFAS No. 154, "Accounting Changes and Error Corrections - a replacement of APB Opinion No. 20 and FASB Statement No. 3" ("SFAS 154"). SFAS 154 changes the requirements for the accounting for and reporting of a change in accounting principle. These requirements apply to all voluntary changes and changes required by an accounting pronouncement in the unusual instance that the pronouncement does not include specific transition provisions. SFAS 154 is effective for fiscal years beginning after December 15, 2005. As such, the Company is required to adopt these provisions at the beginning of the fiscal year ended December 31, 2006. The Company is currently evaluating the impact of SFAS 154 on its consolidated financial statements.
In March 2005, the FASB Interpretation No. 47, "Accounting for Conditional Asset Retirement Obligations and interpretation of FASB Statement No. 143" (FIN 47). FIN 47 clarifies that conditional asset retirement obligations meet the definition of liabilities and should be recognized when incurred if their fair values can be reasonably estimated. The cumulative effect of initially applying FIN 47 would be recognized as a change in accounting principle. FIN 47 is effective no later than the end of fiscal years ending after December 15, 2005. Adoption of FIN 47 is not expected to have a material impact on our financial condition or results of operations.
In June 2005, the EITF reached consensus on Issue No. 05-6, Determining the Amortization Period for Leasehold Improvements, and (EITF 05-6). EITF 05-6 provides guidance on determining the amortization period for leasehold improvements acquired in a business combination or acquired subsequent to lease inception. The guidance on EITF 05-6 will be applied prospectively and is effective for periods after June 29, 2005. EITF 05-6 is not expected to have a material impact on our consolidated financial statements.
In February 2006, FASB issued FASB 155, Accounting for Certain Hybrid Financial Instruments an amendment to FASB 133, Accounting for Derivative Instruments and Hedging Activities, and FASB 140, Accounting for Transfers and Servicing of Financial Assets and Extinguishments of Liabilities. FASB 155 provides the framework for fair value remeasurement of any hybrid financial instrument that contains an embedded derivative that otherwise would require bifurcation as well as establishes a requirement to evaluate interests in securitized financial assets to identify interests. FASB 155 further amends FASB 140 to eliminate the prohibition on a qualifying special-purpose entity from holding a
SHENYANG FANGYUAN GROUP KANGPING ALUMINUM FACTORY COMPANY LIMITED
NOTES TO FINANCIAL STATEMENTS - CONTINUED
(Expressed in United States dollars)
| 17. | New Accounting Pronouncements - continued |
derivatives. This statement is effective for all financial instruments acquired or issued after the beginning of an entity's first fiscal year that begins after September 15, 2006. FASB 155 is not expected to have a material impact on our consolidated financial statements.
In March 2006, FASB issued FASB 156, Accounting for Servicing of Financial Assets--an amendment of FASB Statement No. 140. FASB 156 requires the recognition of a servicing asset or servicing liability under certain circumstances when an obligation to service a financial asset by entering into a servicing contract. FASB 156 also requires all separately recognized servicing assets and servicing liabilities to be initially measured at fair value utilizing the amortization method or fair market value method. FASB 156 is effective the beginning of the first fiscal year that begins after September 15, 2006. FASB 156 is not expected to have a material impact on our consolidated financial statements.
On June 12, 2006, the Equity Owners of the Company approved the Board’s recommendation to distribute a special dividend of $2,480,005 to the Equity Owners. All Equity Owners agreed with the Company to off-set the distribution with the amount due by the Group to the Company as of that date.
By June 30, 2006, the Group has fully settled the related party receivable, $3,676,227, classified under the current assets in the balance sheet of this financial statement as of December 31, 2005 (see Note 4).
SHENYANG FANGYUAN GROUP KANGPING ALUMINUM FACTORY COMPANY LIMITED
NOTES TO FINANCIAL STATEMENTS - CONTINUED
(Expressed in United States dollars)
| 19. | Supplemental Cash Flow Disclosures |
The Company had the following non-cash investing and financing transactions:
| | a) | Reclassification of related party receivable to equity - 2005 ($2,202,291), 2004 ($13,742,138), and 2003 ($23,394,047); |
| | b) | Reclassification of related party receivable to distributions - 2005 ($9,332,809), 2004 ($0), and 2003 ($0). |
| | c) | Transfer of construction in progress to fixed assets - 2005 ($1,724,443), 2004 ($0), and 2003 ($0). |
Certain comparative figures have been reclassified to conform to current year’s presentation.
(b) Pro Forma Combined Financial Statements
| Unaudited Combined Pro forma Balance Sheet as at June 30, 2006 | |
| Statement of Operations for the Six Months Ended June 30, 2006 | |
| Statement of Operations for the Year Ended December 31, 2005 | |
| Notes to Unaudited Combined Pro Forma Financial Statements | |
UNAUDITED PRO FORMA COMBINED FINANCIAL STATEMENTS
We were organized as a Nevada corporation on January 25, 1996 under the name of Pinnacle Management Group, Inc. We subsequently changed our name to Apex Capital Group, Inc. on February 6, 1996. We conducted no material operations from the date of our organization until the date of the Securities Exchange Agreement.
Kangping Aluminum was established as a PRC domestic limited liability company on May 28, 1998 upon the issuing of a business license by the Administration for Industry and Commerce of Shenyang City in Liaoning Province, China. Prior to August 25, 2006, Kangping Aluminum was 80% owned by Fangyuan Group, which in turn is 90% owned by Mr. Shushun Feng and 10% owned by his wife, Ms. Yuying Liu. Ms. Liu directly owned the remaining 20% of Kangping Aluminum. On August 22, 2006, Fangyuan Group transferred its 80% equity interest in Kangping Aluminum to Mr. Feng and Ms. Liu making them the sole owners of Kangping Aluminum.
Elwin was incorporated in the British Virgin Islands on November 17, 2004. On May 18, 2005, Elwin incorporated a wholly-owned subsidiary, ENFML, in accordance with the laws of the PRC. ENFML has been operationally dormant since its date of incorporation. As of October 26, 2006, Elwin has paid $100,000 of $1 million total required capitalization of ENFML.
On August 10, 2006, Elwin entered into an agreement with Mr. Feng and Ms. Liu to acquire 100% of the equity of Kangping Aluminum in exchange for newly issued Elwin shares and cash consideration of RMB 133.21 million (approximately $16.8 million). On August 28, 2006, Elwin received approval from the Economic and Trade Bureau of Liaoning Province, China, for this acquisition and, on September 4, 2006, Kangping Aluminum obtained a license to become a wholly foreign-owned enterprise.
Elwin has not yet paid Mr. Feng and Ms. Liu the consideration that they are owed for the acquisition of Kangping Aluminum. As of October 26, 2006, the unpaid balance owed to Mr. Feng and Ms. Liu was $16,704,000, reduced to $10,975,000 by the expenses described below. The unpaid balance was recorded as a related party payable in an adjustment to the combined pro forma account. In connection with the acquisition of Kangping Aluminum, Elwin has contracted to pay the necessary PRC taxes for Mr. and Mrs. Feng ($4,429,000) as well as professional fees ($1,300,000). The total of the two fees amounts to $5,729,000. Mr. and Mrs. Feng further contracted to provide a subordinated, interest-free, no-amortization loan with a 99-year life in the amount of $10,975,000 to Kangping Aluminum. Due to its terms, the loan is considered in substance to be a capital contribution and has been recorded as such in these pro forma financial statements. This transaction has been accounted for as a recapitalization of Elwin with no adjustment to the historical basis of the assets and liabilities of Kangping Aluminum.
On September 6, 2006, we entered into, and on October 26, 2006, we consummated, the Securities Exchange Agreement with Elwin and Elwin’s shareholders pursuant to which the Elwin’s shareholders transferred all of the equity securities of Elwin to us in exchange for shares of our common stock. Upon the closing of the share exchange, we issued to Elwin’s shareholders an aggregate of 29,190,244 shares of our common stock in exchange for their equity securities of Elwin. As a result, Elwin, which is the sole owner of Kangping Aluminum, became our wholly-owned subsidiary. Elwin owns all of the equity securities of Kangping Aluminum.
Because of common ownership, under generally accepted accounting principles both acquisitions described above are considered to be capital transactions in substance, rather than business combinations. That is, Apex’s acquisition of Elwin and its subsidiaries, ENFML and Kangping Aluminum, is equivalent to the issuance of stock by Elwin for the net monetary assets of Apex and the acquisition of Kangping Aluminum by Elwin is equivalent to the issuance of stock by Kangping Aluminum for the net monetary assets of Elwin. Each transaction is accompanied by a recapitalization and is accounted for as a change in capital structure. Accordingly, the accounting for the acquisition is identical to that resulting from a reverse acquisition, except that no goodwill is recorded. Under reverse takeover accounting, the comparative historical financial statements of the “legal acquirer,” Apex, are those of the “accounting acquirer,” Elwin.
The unaudited pro forma financial information has been prepared giving pro forma effects on the statements of operations for the year ended December 31, 2005 and for the six months ended June 30, 2006 as if the transaction occurred on January 1, 2005. The pro forma balance sheet assumes the transaction occurred on the balance sheet date.
The unaudited pro forma financial information is based upon the historical financial statements of Apex, Elwin and ENFML and Kangping Aluminum as of and for the year ended December 31, 2005 and for the six months ended June 30, 2006, after giving effect to pro forma adjustments described in Note 1.
The unaudited pro forma financial information does not purport to represent what the results of operations of Apex, Elwin and ENFML and Kangping Aluminum would actually have been if the events described above had in fact occurred at the beginning of 2004, or any other date, or to project the net profit of Apex, Elwin and ENFML and Kangping Aluminum for any future period. The adjustments are based on currently available information and certain estimates and assumptions. However, management believes that the assumptions provide a reasonable basis for presenting the unaudited pro forma financial information and that pro forma adjustments give effect to those assumptions and are properly applied in the unaudited pro forma financial information.
Apex Capital Group, Inc.
Unaudited Combined Pro Forma Balance Sheet
As of June 30, 2006
(Expressed in United States dollars)
| | Apex | | Kangping Aluminum | | Elwin | | Pro Forma Adjustments | | Note | | Pro Forma Combined (Unaudited) | |
| ASSETS | | | | | | | | | | | | |
| CURRENT ASSETS | | | | | | | | | | | | |
| Cash | | - | | | 4,429,101 | | | 2,089 | | | - | | | | | | 4,431,190 | |
| Cash restricted | | - | | | - | | | - | | | - | | | | | | - | |
| Notes receivable | | - | | | 18,760 | | | - | | | - | | | | | | 18,760 | |
| Accounts receivable | | - | | | 2,738,703 | | | 45,024 | | | - | | | | | | 2,783,727 | |
| Related party receivable | | - | | | - | | | - | | | - | | | | | | - | |
| Inventories | | - | | | 12,256,996 | | | - | | | - | | | | | | 12,256,996 | |
| Capital Contribution Receivable | | - | | | - | | | - | | | 10,975,000 | | | 1(f) | | | 10,975,000 | |
| Prepaid expenses and other current assets | | - | | | 5,875,726 | | | - | | | - | | | | | | 5,875,726 | |
| Total Current Assets | | - | | | 25,319,286 | | | 47,113 | | | 10,975,000 | | | | | | 36,341,399 | |
| | | | | | | | | | | | | | | | | | | |
| PROPERTY, PLANT AND EQUIPMENT, net | | - | | | 11,415,161 | | | - | | | - | | | | | | 11,415,161 | |
| BUILDING PLEDGED AS SECURITY TO CREDITOR, net | | - | | | 5,803,345 | | | - | | | - | | | | | | 5,803,345 | |
| LAND USE RIGHT, net | | - | | | 177,488 | | | - | | | - | | | | | | 177,488 | |
| CONSTRUCTION IN PROGRESS | | - | | | 442,953 | | | - | | | - | | | | | | 442,953 | |
| | | | | | | | | | | | | | | | | | | |
| Total Assets | | - | | | 43,158,233 | | | 47,113 | | | 10,975,000 | | | | | | 54,180,346 | |
| | | | | | | | | | | | | | | | | | | |
| LIABILITIES AND OWNERS' EQUITY | | | | | | | | | | | | | | | | | | |
| CURRENT LIABILITIES | | | | | | | | | | | | | | | | | | |
| Short term borrowings | | - | | | 6,117,114 | | | 50,000 | | | - | | | | | | 6,167,114 | |
| Notes payable | | - | | | - | | | - | | | - | | | | | | - | |
| Accounts payable | | 1,400 | | | 2,233,820 | | | 3,846 | | | - | | | | | | 2,239,066 | |
| Related party payable | | 5,900 | | | - | | | 897 | | | (10,975,000 | ) | | 1(e) | | | 10,981,797 | |
| Other payable and accruals | | - | | | 1,146,392 | | | - | | | - | | | | | | 1,146,392 | |
| Taxes payable | | - | | | 563,180 | | | - | | | - | | | | | | 563,180 | |
| Total Current Liabilities | | 7,300 | | | 10,060,506 | | | 54,743 | | | (10,975,000 | ) | | | | | 21,097,549 | |
| | | | | | | | | | | | | | | | | | | |
| LONG TERM BORROWINGS | | 70,000 | | | 19,448,197 | | | - | | | - | | | | | | 19,518,197 | |
| | | | | | | | | | | | | | | | | | | |
| Total Liabilites | | 77,300 | | | 29,508,703 | | | 54,743 | | | (10,975,000 | ) | | | | | 40,615,746 | |
| | | | | | | | | | | | | | | | | | | |
| OWNERS' EQUITY | | | | | | | | | | | | | | | | | | |
| Common Stock | | 1,005 | | | | | | 50,000 | | | 20,810 | | | 1(a) & 1(d) | | | 30,195 | |
| | | | | | | | | | | | | | | | | | | |
| | | | | | | | | | | | | | | | | | | |
| Additional Paid-in capital | | - | | | 12,080,000 | | | - | | | 114,770 | | | 1(a), 1(b), 1(c), 1(d), 1(e) & 1(f) | | | 11,965,230 | |
| Accumulated Comprehensive Income | | - | | | 746,778 | | | - | | | - | | | | | | 746,778 | |
| Reserves | | (304 | ) | | 2,074,486 | | | - | | | - | | | | | | 2,074,182 | |
| Retained earnings | | (78,001 | ) | | 936,477 | | | (57,630 | ) | | (135,580 | ) | | 1(b) & 1(c) | | | 936,426 | |
| Less: Related party receivable | | - | | | (2,188,211 | ) | | - | | | - | | | | | | (2,188,211 | ) |
| Total Owners' Equity | | (77,300 | ) | | 13,649,530 | | | (7,630 | ) | | - | | | | | | 13,564,600 | |
| | | | | | | | | | | | | | | | | | | |
| Total Liabilities and Owners' Equity | | - | | | 43,158,233 | | | 47,113 | | | (10,975,000 | ) | | | | | 54,180,346 | |
| See Notes to unaudited combined pro forma financial information. |
Apex Capital Group, Inc.
Unaudited Combined Pro Forma Statement of Operations
For the Six Months Ended June 30, 2006
(Expressed in United States dollars)
| | | Apex | | Kangping Aluminum | | Elwin | | Pro Forma Adjustments | | Pro Forma Combined (Unaudited) | |
| | | | | | | | | | | | |
| SALES - UNRELATED PARTIES | | | - | | | 17,697,440 | | | - | | | - | | | 17,697,440 | |
| SALES - RELATED PARTIES | | | - | | | 571,234 | | | - | | | - | | | 571,234 | |
| SALES | | | - | | | 18,268,674 | | | - | | | - | | | 18,268,674 | |
| | | | | | | | | | | | | | | | | |
| COST OF SALES | | | - | | | 15,773,226 | | | - | | | - | | | 15,773,226 | |
| GROSS PROFIT | | | - | | | 2,495,448 | | | - | | | - | | | 2,495,448 | |
| | | | | | | | | | | | | | | | | |
| OPERATING EXPENSES | | | | | | | | | | | | | | | | |
| General and administrative expenses | | | 1,400 | | | 319,444 | | | 262 | | | - | | | 321,106 | |
| INCOME / (LOSS) FROM OPERATIONS | | | (1,400 | ) | | 2,176,004 | | | (262 | ) | | - | | | 2,174,342 | |
| | | | | | | | | | | | | | | | | |
| OTHER INCOME & OTHER EXPENSES | | | | | | | | | | | | | | | | |
| Interest income - related party | | | - | | | 266,633 | | | - | | | - | | | 266,633 | |
| Other income | | | - | | | 26,896 | | | - | | | - | | | 26,896 | |
| Other expenses | | | - | | | 3,203 | | | 21 | | | - | | | 3,224 | |
| Interest expense - unrelated party | | | - | | | 869,535 | | | | | | - | | | 869,535 | |
| INCOME / (LOSS) BEFORE INCOME TAXES | | | (1,400 | ) | | 1,596,795 | | | (283 | ) | | - | | | 1,595,112 | |
| INCOME TAXES | | | - | | | 573,288 | | | - | | | - | | | 573,288 | |
| NET INCOME / (LOSS) | | | (1,400 | ) | | 1,023,507 | | | (283 | ) | | - | | | 1,021,824 | |
| | | | | | | | | | | | | | | | | |
| NUMBER OF SHARES | | | 1,004,520 | | | | | | | | | | | | 30,194,761 | |
| | | | | | | | | | | | | | | | | |
| EARNINGS (LOSS) PER SHARE | | | (0.01 | ) | | | | | | | | | | | 0.03 | |
| See Notes to unaudited combined pro forma financial information. |
Apex Capital Group, Inc.
Unaudited Combined Pro Forma Statement of Operations
For the Year Ended December 31, 2005
(Expressed in United States dollars)
| | | Apex | | Kangping Aluminum | | Elwin | | Pro Forma Adjustments | | Pro Forma Combined (Unaudited) | |
| | | | | | | | | | | | |
| SALES - UNRELATED PARTIES | | | - | | | 26,370,255 | | | - | | | - | | | 26,370,255 | |
| SALES - RELATED PARTIES | | | - | | | 13,757,972 | | | - | | | - | | | 13,757,972 | |
| SALES | | | - | | | 40,128,227 | | | - | | | - | | | 40,128,227 | |
| | | | | | | | | | | | | | | | | |
| COST OF SALES | | | - | | | 34,430,828 | | | - | | | - | | | 34,430,828 | |
| GROSS PROFIT | | | - | | | 5,697,399 | | | - | | | - | | | 5,697,399 | |
| | | | | | | | | | | | | | | | | |
| OPERATING EXPENSES | | | | | | | | | | | | | | | | |
| Depreciation | | | - | | | 128,819 | | | - | | | - | | | 128,819 | |
| General and administrative expenses | | | 5,900 | | | 192,577 | | | 57,925 | | | - | | | 256,402 | |
| INCOME / (LOSS) FROM OPERATIONS | | | (5,900 | ) | | 5,376,003 | | | (57,925 | ) | | - | | | 5,312,178 | |
| | | | | | | | | | | | | | | | | |
| OTHER INCOME & OTHER EXPENSES | | | | | | | | | | | | | | | | |
| Interest income - related party | | | - | | | 959,232 | | | - | | | - | | | 959,232 | |
| Other income | | | - | | | 103,750 | | | 993 | | | - | | | 104,743 | |
| Other expenses | | | - | | | 26,590 | | | 6 | | | - | | | 26,596 | |
| Interest expense - unrelated party | | | - | | | 1,712,986 | | | - | | | - | | | 1,712,986 | |
| INCOME / (LOSS) BEFORE INCOME TAXES | | | (5,900 | ) | | 4,699,409 | | | (56,938 | ) | | - | | | 4,636,571 | |
| INCOME TAXES | | | - | | | 1,626,367 | | | - | | | - | | | 1,626,367 | |
| NET INCOME / (LOSS) | | | (5,900 | ) | | 3,073,042 | | | (56,938 | ) | | - | | | 3,010,204 | |
| | | | | | | | | | | | | | | | | |
| NUMBER OF SHARES | | | 1,004,520 | | | | | | | | | | | | 30,194,761 | |
| | | | | | | | | | | | | | | | | |
| EARNINGS (LOSS) PER SHARE | | | (0.01 | ) | | | | | | | | | | | 0.10 | |
| See Notes to unaudited combined pro forma financial information. |
Apex Capital Group, Inc.
Notes to Unaudited Combined Pro Forma Statement of Operations
(Expressed in United States dollars)
1. Pro forma Adjustments
The adjustments in the combined pro forma balance sheet represent the following:
| | (a) | elimination of common stock of Elwin Group Limited and Subsidiary; |
| | (b) | elimination of accumulated deficit of Apex Capital Group, Inc.; |
| | (c) | elimination of accumulated deficit of Elwin Group Limited and Subsidiary; |
| | (d) | issuance of 29,190,241 common stock by Apex Capital Group, Inc.; |
| | (e) | net proceeds to be paid to Mr. and Mrs. Feng for the acquisition of Kangping; and |
| | (f) | net proceeds of the purchase price of Kangping contractually pledged as a capital contribution. |
(d) Exhibits
Exhibit No. | Description |
| 3.1 | Amended and Restated Bylaws |
| 10.1 | Assignment and Assumption Agreement and Consent to Assignment |
SIGNATURES
Pursuant to the requirements of the Securities Exchange Act of 1934, as amended, the Registrant has duly caused this report to be signed on its behalf by the undersigned hereunto duly authorized.
| | | |
| | APEX CAPITAL GROUP, INC. |
|
|
|
| Date: October 26, 2006 | By: | /s/ Shushun Feng |
| |
Shushun Feng President and Chief Executive Officer |