EXHIBIT 99.2
MLP Investor Conference March 1, 2005
FORWARD-LOOKING STATEMENTS
Statements in this presentation which are not statements of historical fact are forward-looking statements within the meaning of the safe harbor provisions of the Private Securities Litigation Reform Act of 1995. These forward-looking statements are based on current factual information and certain assumptions which management believes to be reasonable at this time. The Partnership’s actual current and future results, however, are dependent upon numerous factors outside the control of the Partnership. These factors, and other applicable risks and uncertainties that could cause actual results to differ materially from projected results, are described more fully in the Partnership’s public periodic and other reports filed with the Securities and Exchange Commission. Except as required by applicable securities laws, the Partnership undertakes no obligation to update any forward-looking statements at any time in the future.
Alliance Resource Partners, L.P.
3 2005 MLP Investor Conference
Focused On Primary Objective
Sustainable, capital efficient growth in distributable cash flow that will enable growth in distributions to ARLP unitholders
4 2005 MLP Investor Conference
ARLP Investment Highlights
Diversified asset base, both geographically and in types of coal produced Efficient, low cost operator Strong long-term market outlook for coal Proven track record of growth Attractive growth prospects looking forward Demonstrated market performance
5 2005 MLP Investor Conference
Diversified & Efficient Operator
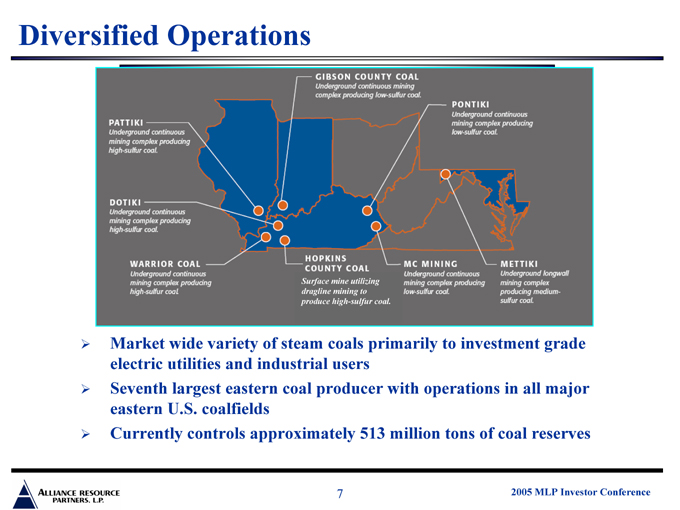
Diversified Operations
Market wide variety of steam coals primarily to investment grade electric utilities and industrial users Seventh largest eastern coal producer with operations in all major eastern U.S. coalfields Currently controls approximately 513 million tons of coal reserves
GIBSON COUNTY COAL
Underground continuous mining complex producing low-slfur coal.
PONTIKI
Underground continuous mining complex producing low-sulfur coal.
PATTIKI
Underground continuous mining complex producing high sulfur coal.
DOTIKI
Underground continuous mining complex producing high-sulfur coal.
WARRIOR COAL
Underground continuous mining complex producing high-sulfur coal.
HOPKINS COUNTY COAL
Surface mine utilizing dragline mining to produce high-sulfur coal.
MC MINING
Underground continuous mining complex producing low-sulfur coal.
METTIKI
Underground longwall mining complex producing medium-sulfur coal.
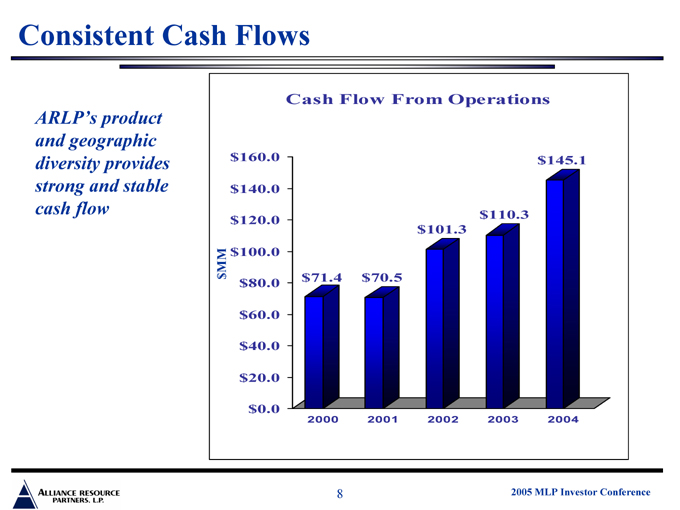
Consistent Cash Flows
ARLP’s product and geographic diversity provides strong and stable cash flow
Cash Flow From Operations $MM $160.0 $140.0 $120.0 $100.0 $80.0 $60.0 $40.0 $20.0 $0.0 $71.4 $70.5 $101.3 $110.3 $145.1
2000 2001 2002 2003 2004
8
2005 MLP Investor Conference

Ability to Leverage Market
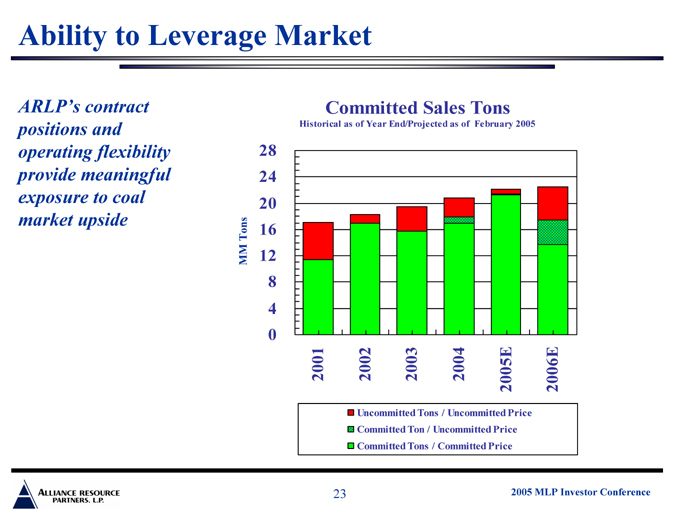
ARLP’s contract positions and operating flexibility provide meaningful exposure to coal market upside
Committed Sales Tons
Historical as of Year End/Projected as of February 2005
MM Tons
28 24 20 16 12 8 4 0
2001 2002 2003 2004
2005E 2006E
Uncommitted Tons / Uncommitted Price Committed Ton / Uncommitted Price Committed Tons / Committed Price
9
2005 MLP Investor Conference
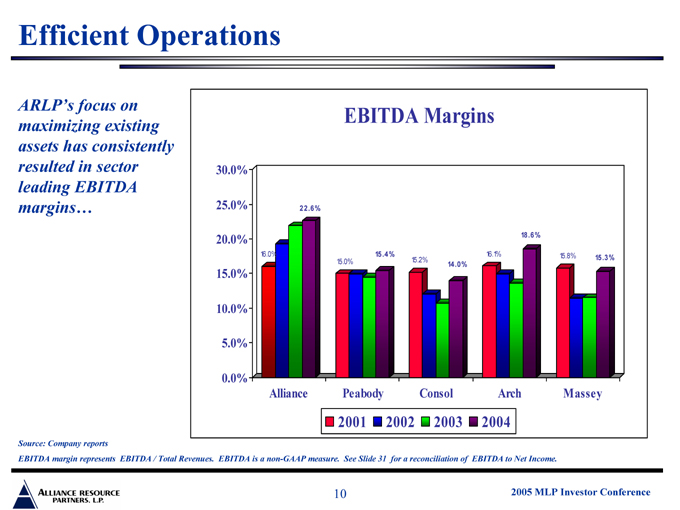
Efficient Operations
ARLP’s focus on maximizing existing assets has consistently resulted in sector leading EBITDA margins…
EBITDA Margins
30.0% 25.0% 20.0% 15.0% 10.0% 5.0% 0.0%
Alliance Peabody Consol Arch Massey
16.0%
22.6%
15.0%
15.4%
15.2%
14.0%
16.1%
18.6%
15.8%
15.3%
Source: Company reports
EBITDA margin represents EBITDA / Total Revenues. EBITDA is a non-GAAP measure. See Slide 31 for a reconciliation of EBITDA to Net Income.
10
2005 MLP Investor Conference
Coal Market Outlook
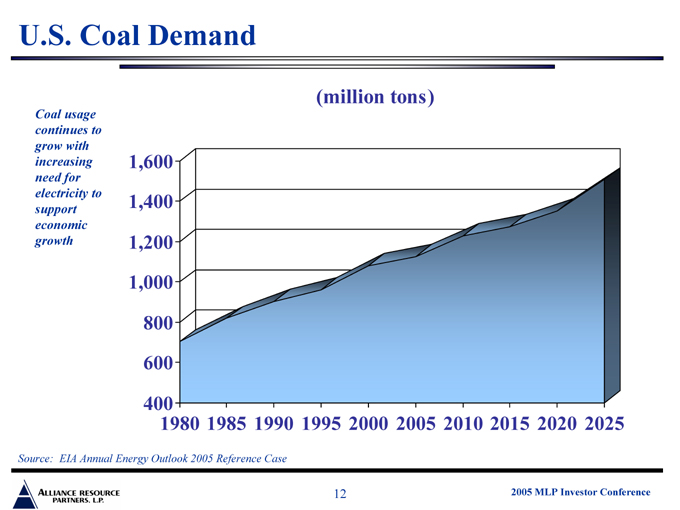
U.S. Coal Demand
Coal usage continues to grow with increasing need for electricity to support economic growth
(million tons)
1,600 1,400
1,200 1,000
800 600
400
1980 1985 1990 1995 2000 2005 2010 2015 2020 2025
Source: EIA Annual Energy Outlook 2005 Reference Case
12
2005 MLP Investor Conference
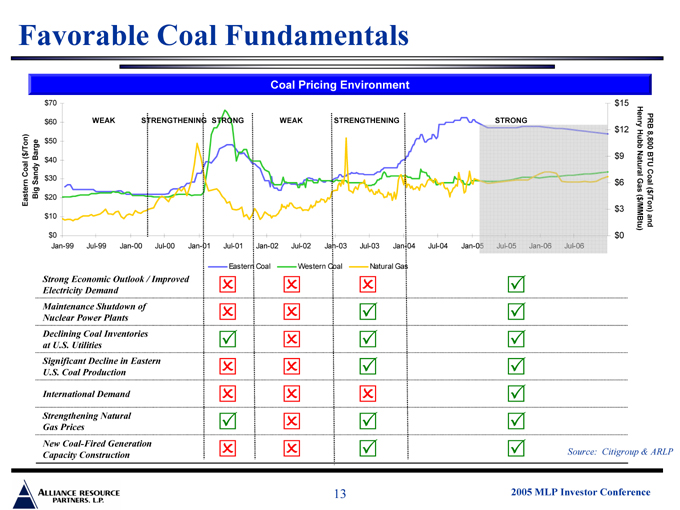
Favorable Coal Fundamentals
Coal Pricing Environment
Eastern Coal ($/Ton) Big Sandy Barge $70 $60 $50 $40 $30 $20 $10 $0
WEAK
STRENGTHENING
STRONG
WEAK
STRENGTHENING
STRONG
Jan-99 Jul-99 Jan-00 Jul-00 Jan-01 Jul-01 Jan-02 Jul-02 Jan-03 Jul-03 Jan-04 Jul-04 Jan-05 Jul-05 Jan-06 Jul-06 $15 $12 $9 $6 $3 $0
PRB 8,800 BTU Coal ($/Ton) and Henry Hubb Natural Gas ($/MMBtu)
Eastern Coal
Western Coal
Natural Gas
Strong Economic Outlook / Improved Electricity Demand
Maintenance Shutdown of Nuclear Power Plants
Declining Coal Inventories at U.S. Utilities
Significant Decline in Eastern U.S. Coal Production
International Demand
Strengthening Natural Gas Prices
New Coal-Fired Generation Capacity Construction
Source: Citigroup & ARLP
13
2005 MLP Investor Conference
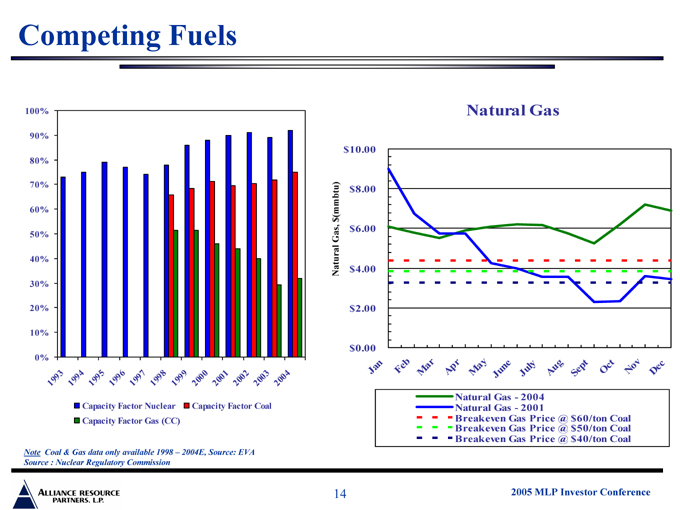
Competing Fuels
100%
90%
80%
70%
60% 50% 40%
30%
20%
10%
0%
1993
1994
1995
1996
1997
1998
1999
2000
2001
2002
2003
2004
Capacity Factor Nuclear
Capacity Factor Coal
Capacity Factor Gas (CC)
Natural Gas, $(mmbtu) $10.00 $8.00 $6.00
$4.00 $2.00 $0.00
Natural Gas
Jan
Feb
Mar
Apr
May June
July
Aug
Sept
Oct
Nov
Dec
Note Coal & Gas data only available 1998 – 2004E, Source: EVA Source : Nuclear Regulatory Commission
Natural Gas—2004 Natural Gas—2001
Breakeven Gas Price @ $60/ton Coal Breakeven Gas Price @ $50/ton Coal Breakeven Gas Price @ $40/ton Coal
14
2005 MLP Investor Conference

Proven Track Record of Growth
Four Consecutive Years of Record Results
Production Revenues EBITDA Net Income
2005 MLP Investor Conference
16
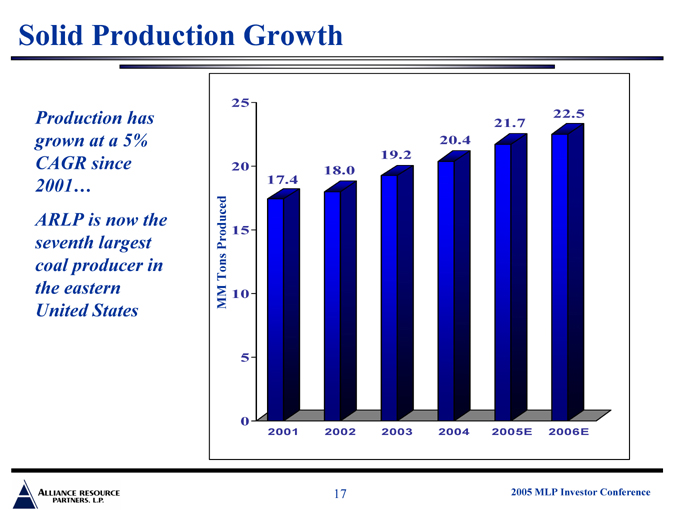
Solid Production Growth
Production has grown at a 5% CAGR since 2001… ARLP is now the seventh largest coal producer in the eastern United States
MM Tons Produced
25
20
15
10
5
0
17.4
18.0
19.2
20.4
21.7
22.5
2001 2002 2003 2004 2005E 2006E
2005 MLP Investor Conference
17
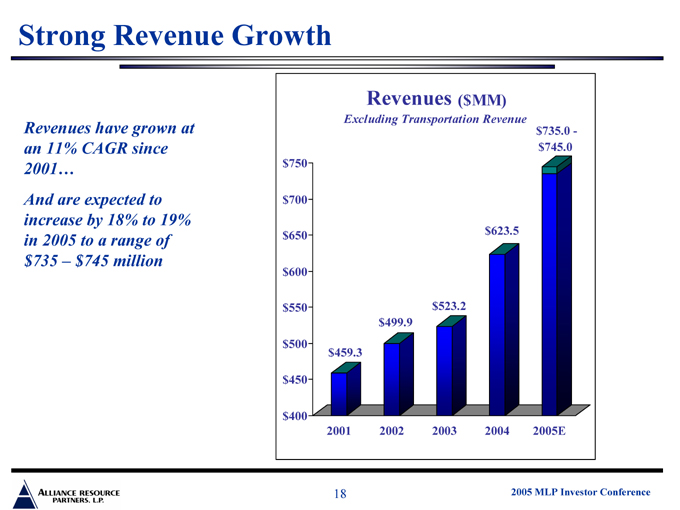
Strong Revenue Growth
Revenues have grown at an 11% CAGR since 2001… And are expected to increase by 18% to 19% in 2005 to a range of $735 – $745 million $750 $700 $650 $600 $550 $500 $450 $400
Revenues ($MM)
Excluding Transportation Revenue $459.3 $499.9 $523.2 $623.5 $735.0 - $745.0
2001 2002 2003 2004 2005E
2005 MLP Investor Conference
18
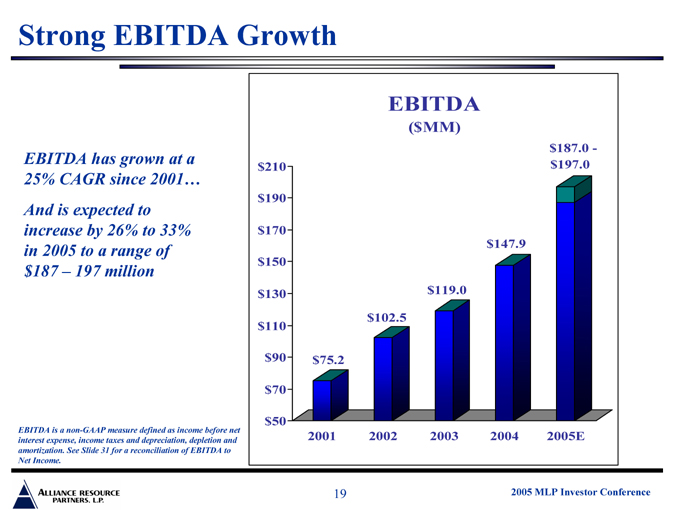
Strong EBITDA Growth
EBITDA has grown at a 25% CAGR since 2001… And is expected to increase by 26% to 33% in 2005 to a range of $187 – 197 million
EBITDA is a non-GAAP measure defined as income before net interest expense, income taxes and depreciation, depletion and amortization. See Slide 31 for a reconciliation of EBITDA to Net Income.
$210 $190 $170 $150 $130 $110 $90 $70 $50
EBITDA
($ MM) $75.2 $102.5 $119.0 $147.9 $187.0 - $197.0
2001 2002 2003 2004 2005E
2005 MLP Investor Conference
19
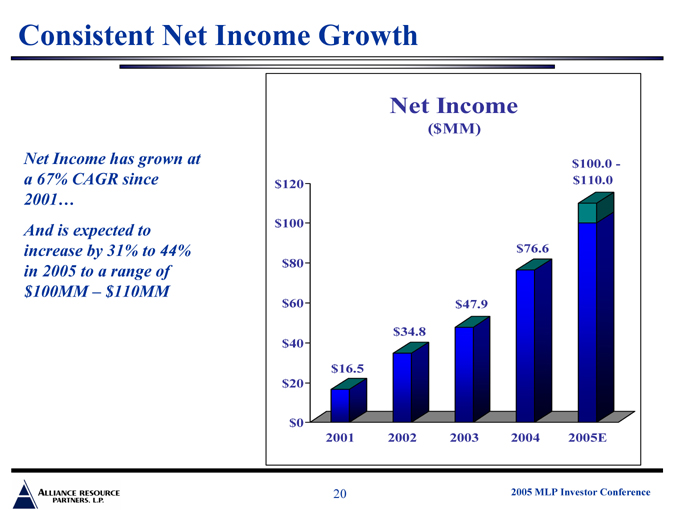
Consistent Net Income Growth
Net Income has grown at a 67% CAGR since 2001… And is expected to increase by 31% to 44% in 2005 to a range of $100MM – $110MM
Net Income
($ MM) $120 $100 $80 $60 $40 $20 $0 $16.5 $34.8 $47.9 $76.6 $100.0 - $110.0
2001 2002 2003 2004 2005E
2005 MLP Investor Conference
20
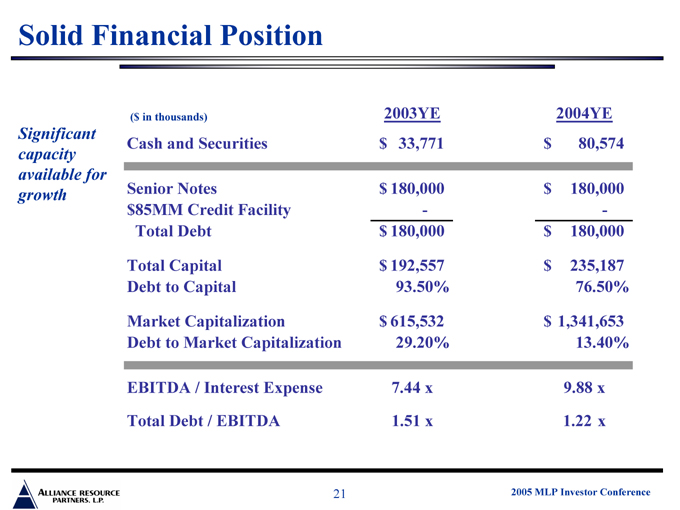
Solid Financial Position
Significant capacity available for growth
($ in thousands) 2003YE 2004YE
Cash and Securities $33,771 $80,574
Senior Notes $180,000 $180,000
$85MM Credit Facility - -
Total Debt $180,000 $180,000
Total Capital $192,557 $235,187
Debt to Capital 93.50% 76.50%
Market Capitalization $615,532 $1,341,653
Debt to Market Capitalization 29.20% 13.40%
EBITDA / Interest Expense 7.44 x 9.88 x
Total Debt / EBITDA 1.51 x 1.22 x
21
2005 MLP Investor Conference
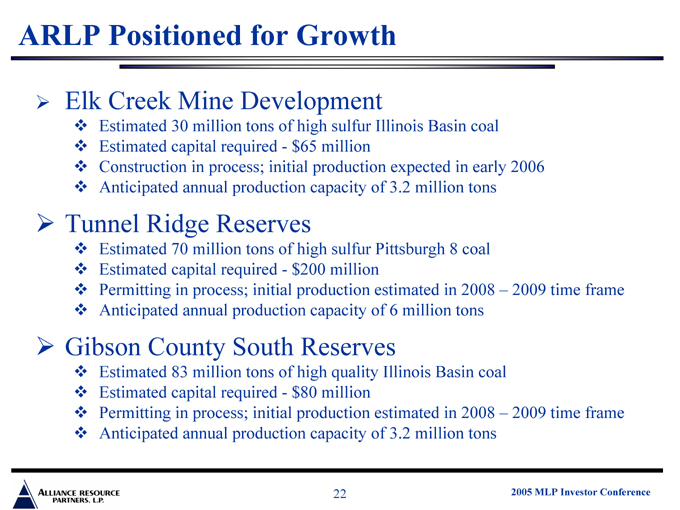
ARLP Positioned for Growth
Elk Creek Mine Development
Estimated 30 million tons of high sulfur Illinois Basin coal Estimated capital required - $65 million Construction in process; initial production expected in early 2006 Anticipated annual production capacity of 3.2 million tons
Tunnel Ridge Reserves
Estimated 70 million tons of high sulfur Pittsburgh 8 coal Estimated capital required - $200 million
Permitting in process; initial production estimated in 2008 – 2009 time frame Anticipated annual production capacity of 6 million tons
Gibson County South Reserves
Estimated 83 million tons of high quality Illinois Basin coal Estimated capital required - $80 million
Permitting in process; initial production estimated in 2008 – 2009 time frame Anticipated annual production capacity of 3.2 million tons
2005 MLP Investor Conference
22
Ability to Leverage Market
ARLP’s contract positions and operating flexibility provide meaningful exposure to coal market upside
Committed Sales Tons
Historical as of Year End/Projected as of February 2005
28 24 20 16
MM Tons 12
8 4 0
2001 2002 2003 2004 2005E 2006E
Uncommitted Tons / Uncommitted Price Committed Ton / Uncommitted Price Committed Tons / Committed Price
2005 MLP Investor Conference
23
Demonstrated Market Performance
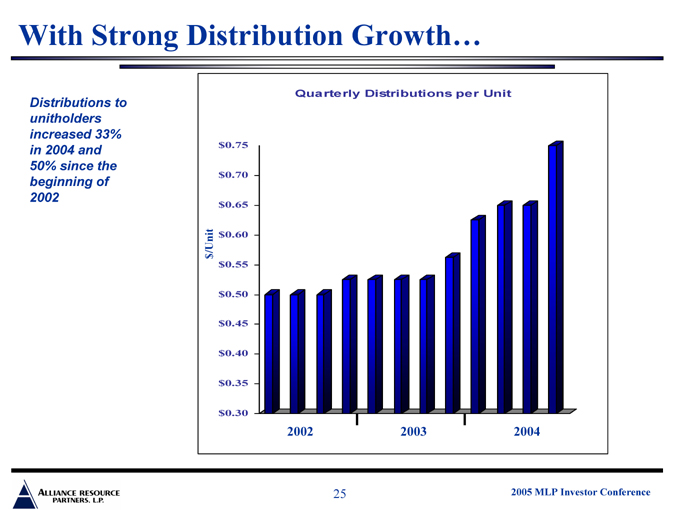
With Strong Distribution Growth…
Distributions to unitholders increased 33% in 2004 and 50% since the beginning of 2002
Quarterly Distributions per Unit $0.75 $0.70 $0.65
/Unit $0.60 $
$0.55 $0.50 $0.45 $0.40 $0.35 $0.30
2002 2003 2004
2005 MLP Investor Conference
25
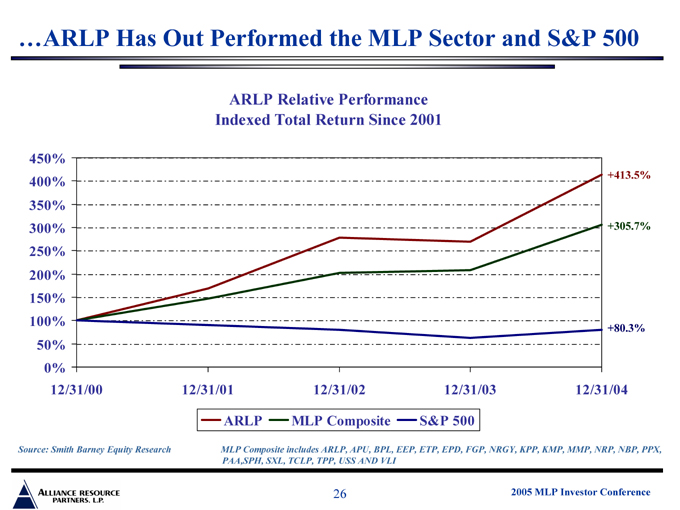
…ARLP Has Out Performed the MLP Sector and S&P 500
ARLP Relative Performance Indexed Total Return Since 2001
450% 400% 350% 300% 250% 200% 150% 100% 50% 0%
12/31/00 12/31/01 12/31/02 12/31/03 12/31/04
+413.5% +305.7% +80.3%
ARLP
MLP Composite
S&P 500
Source: Smith Barney Equity Research
MLP Composite includes ARLP, APU, BPL, EEP, ETP, EPD, FGP, NRGY, KPP, KMP, MMP, NRP, NBP, PPX, PAA,SPH, SXL, TCLP, TPP, USS AND VLI
2005 MLP Investor Conference
26
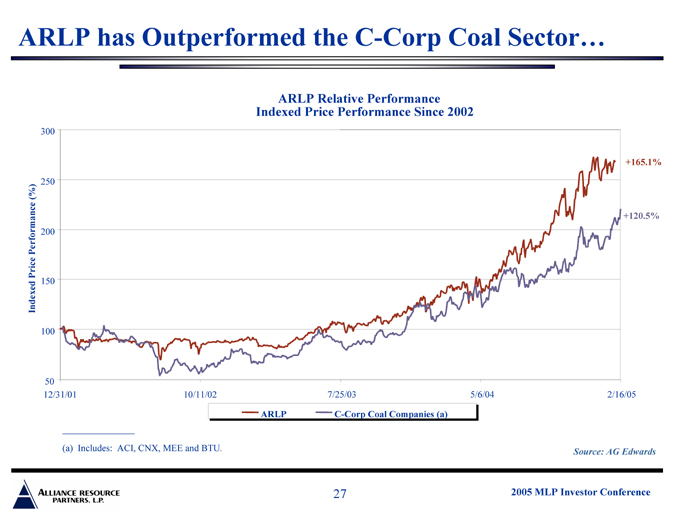
ARLP has Outperformed the C-Corp Coal Sector…
ARLP Relative Performance Indexed Price Performance Since 2002
Indexed Price Performance (%)
50 100 150 200 250 300
+165.1%
+120.5%
12/31/01 10/11/02 7/25/03 5/6/04 2/16/05
ARLP
C-Corp Coal Companies (a)
(a) Includes: ACI, CNX, MEE and BTU.
Source: AG Edwards
2005 MLP Investor Conference
27
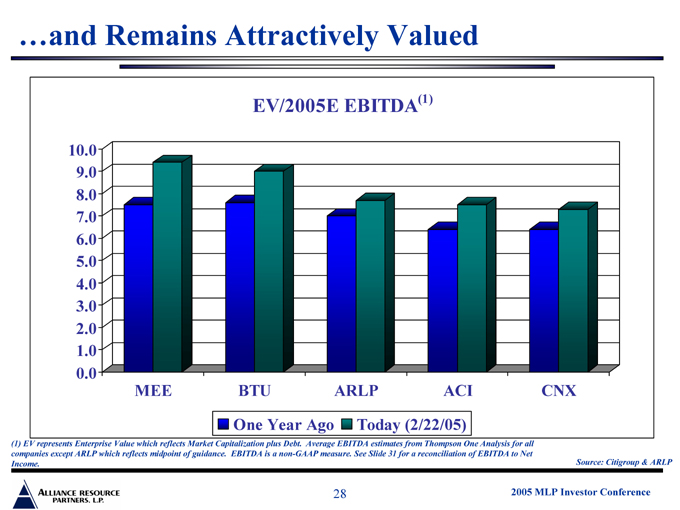
…and Remains Attractively Valued
EV/2005E EBITDA(1)
10.0 9.0 8.0 7.0 6.0 5.0 4.0 3.0 2.0 1.0 0.0
MEE BTU ARLP ACI CNX
One Year Ago
Today (2/22/05)
(1) EV represents Enterprise Value which reflects Market Capitalization plus Debt. Average EBITDA estimates from Thompson One Analysis for all companies except ARLP which reflects midpoint of guidance. EBITDA is a non-GAAP measure. See Slide 31 for a reconciliation of EBITDA to Net Income.
Source: Citigroup & ARLP
2005 MLP Investor Conference
28
Investment Highlights

ARLP Investment Highlights
Diversified asset base, both geographically and in types of coal produced Efficient, low cost operator Strong long-term market outlook for coal Proven track record of growth Attractive growth prospects looking forward Demonstrated market performance
2005 MLP Investor Conference
30
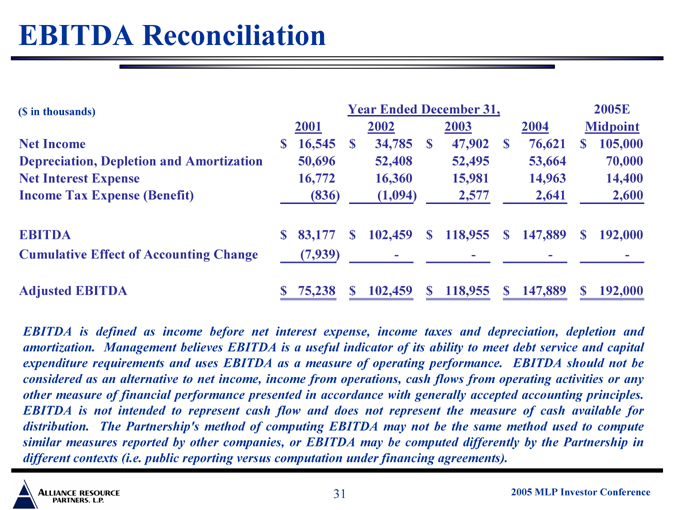
EBITDA Reconciliation
($ in thousands) Year Ended December 31, 2005E
2001 2002 2003 2004 Midpoint
Net Income $16,545 $34,785 $47,902 $76,621 $105,000
Depreciation, Depletion and Amortization 50,696 52,408 52,495 53,664 70,000
Net Interest Expense 16,772 16,360 15,981 14,963 14,400
Income Tax Expense (Benefit) (836) (1,094) 2,577 2,641 2,600
EBITDA $83,177 $102,459 $118,955 $147,889 $192,000
Cumulative Effect of Accounting Change (7,939) - - - -
Adjusted EBITDA $75,238 $102,459 $118,955 $147,889 $192,000
EBITDA is defined as income before net interest expense, income taxes and depreciation, depletion and amortization. Management believes EBITDA is a useful indicator of its ability to meet debt service and capital expenditure requirements and uses EBITDA as a measure of operating performance. EBITDA should not be considered as an alternative to net income, income from operations, cash flows from operating activities or any other measure of financial performance presented in accordance with generally accepted accounting principles. EBITDA is not intended to represent cash flow and does not represent the measure of cash available for distribution. The Partnership’s method of computing EBITDA may not be the same method used to compute similar measures reported by other companies, or EBITDA may be computed differently by the Partnership in different contexts (i.e. public reporting versus computation under financing agreements).
2005 MLP Investor Conference
31