Coal USA June 28, 2006 Exhibit 99.2 |
Statements in this presentation which are not statements of historical fact are forward- looking statements within the meaning of the safe harbor provisions of the Private Securities Litigation Reform Act of 1995. These forward-looking statements are based on current factual information and certain assumptions which management believes to be reasonable at this time. The Partnership’s actual current and future results, however, are dependent upon numerous factors outside the control of the Partnership. These factors, and other applicable risks and uncertainties that could cause actual results to differ materially from projected results, are described more fully in the Partnership’s public periodic and other reports filed with the Securities and Exchange Commission. Except as required by applicable securities laws, the Partnership undertakes no obligation to update any forward-looking statements at any time in the future. For additional information, go to the ARLP website at www.arlp.com FORWARD-LOOKING STATEMENTS |
June 28, 2006 Ownership of Alliance Partnerships (a) Includes general partner interest held directly in ARLP’s Intermediate Partnership. __________________ 56.7% L.P. Interest 42.3% L.P. Interest 1.98% General Partner Interest Alliance Holdings GP , L.P. (NASDAQ: AHGP) 59.9 million units outstanding Alliance Resource Partners, L.P. (NASDAQ: ARLP) 36.4 million units outstanding Public Unitholders Public Unitholders Management / Others 1 (a) IDRs 80.0% L.P. Interest 20.0% L.P. Interest Ownership structure provides two ways to invest in Alliance Partnerships Strong alignment of interests throughout the Alliance Partnerships Management owns significant interests directly in AHGP and indirectly in ARLP All unitholders benefit from increased distributions by ARLP |
June 28, 2006 (a):Includes value of ARLP general partner interest / IDR interest as of June 12, 2006. Net debt as of March 31, 2006. 5.9% 29.4% $2,197 mm (a) $2,067 mm (a) 2.17x $1.84 $35.06 ARLP $22.31 Unit Price (6/12/06): $1,335 mm (b) Equity Market Cap: (b) As of June 12, 2006 0.0% Net Debt / Net Book Cap: $1,335 mm (b) Enterprise Value: $0.74 Distribution: AHGP NASDAQ Symbol: 0.0% Net Debt / Ent. Value: 1.00x Total Unit Coverage: Alliance Partnership Profiles 2 |
June 28, 2006 Benefits of Industry-Leading Distribution Coverage ARLP’s coverage ratio is among the highest of publicly traded limited partnerships in the energy sector (a) Benefits to ARLP and AHGP investors include: Greater potential for future distribution growth Capital efficient financing for ARLP organic growth projects Added stability across operating and pricing environments (a) Source: public filings. Coverage calculated as last twelve months (as of 12/31/05) total cash available for distribution divided by current annualized cash distributions. (b) Coal MLP Index includes NRP and PVR. Coverage calculated as last twelve months (as of 12/31/05) total cash available for distribution divided by current annualized cash distributions. (c) Pipeline MLP Index includes APL, BPL, BWP, XTEX, DPM, EEP, EPD, ETP, HLND, HEP, KMP, MMP, MWE, MMLP, NBP, PPX, PAA, SXL, TCLP, TLP, TPP, WPZ and VLI. Coverage calculated as last twelve months (as of 12/31/05) total cash available for distribution divided by current annualized cash distributions. __________________ 2.17x 1.33x 1.02x ARLP Coal MLP Index Pipeline MLP Index (b) (c) 3 |
June 28, 2006 __________________ ARLP is a diversified producer and marketer of coal to major U.S. utilities and industrial users Fifth largest eastern coal producer and eleventh largest in the U.S. (a) Only publicly-traded master limited partnership involved in the production and marketing of coal At 1/1/06, ARLP had approximately 549.0 million tons of proven and probable coal reserves in the Illinois Basin, Central Appalachia and Northern Appalachia regions On April 12, 2006, ARLP announced the acquisition of River View, adding 99.3 million tons of reserves (a) Source: Platts coal data as of 9/30/05. (b) Includes value of ARLP general partner interest / IDR interest as of June 12, 2006. Net debt as of March 31, 2006. Alliance Resource Partners, L.P. Snapshot Unit Price at 6/12/06: $35.06 Current Annualized Distribution: $1.84 Current Yield: 5.25% Equity Market Value (b) : ~$2,067 mm Enterprise Value (b) : ~$2,197 mm ARLP Trading Information 4 1 2 3 4 Pattiki Complex River View Complex Dotiki Complex Mount Vernon Transfer Terminal 5 6 7 8 Warrior Complex Hopkins Complex Gibson Complex Pontiki Complex 9 10 11 12 MC Mining Complex Tunnel Ridge Complex Penn Ridge Complex Mettiki Complex |
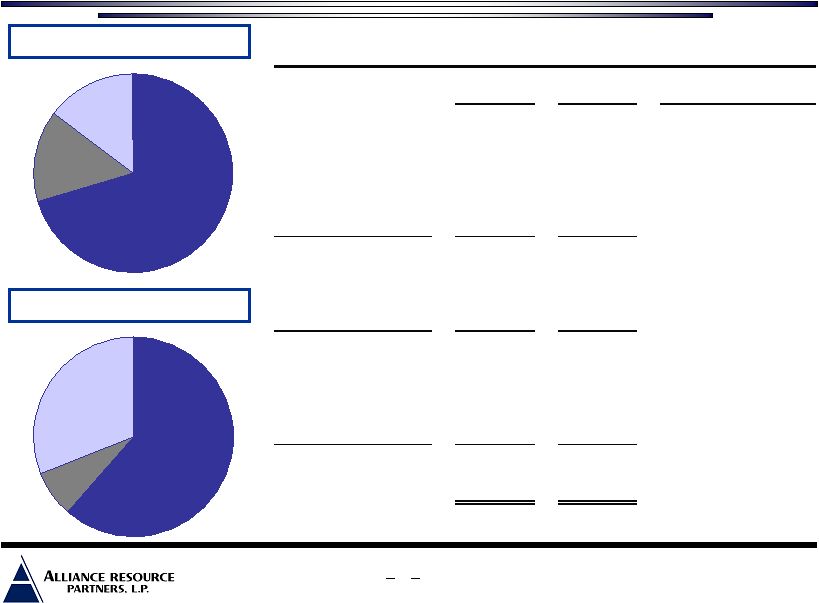
June 28, 2006 Operations Summary Northern Appalachia 15% Illinois Basin 70% Central Appalachia 15% 2005 Production Northern Appalachia 31% Illinois Basin 61% Central Appalachia 8% Reserves - 2005 YE 5 2005 Summary (MM Tons) Production Reserves Primary Customers Illinois Basin Dotiki 4.7 89.5 Seminole; LG&E; TVA Warrior 4.1 17.8 Synfuel Solutions Pattiki 2.6 47.6 TVA; Tampa Electric Hopkins 0.9 64.3 LG&E Gibson (North) 3.4 35.1 PSI Energy Gibson (South) - 82.7 - Region Total 15.7 337.0 Central Appalachia Pontiki 1.7 18.4 ICG MC Mining 1.6 22.8 Various Region Total 3.3 41.2 Northern Appalachia Mettiki / Mettiki WV 3.3 43.6 Virginia Electric Power Tunnel Ridge - 70.5 - Penn Ridge - 56.7 - Region Total 3.3 170.8 Total Company 22.3 549.0 Including River View Reserves (4/12/06) 642.0 |
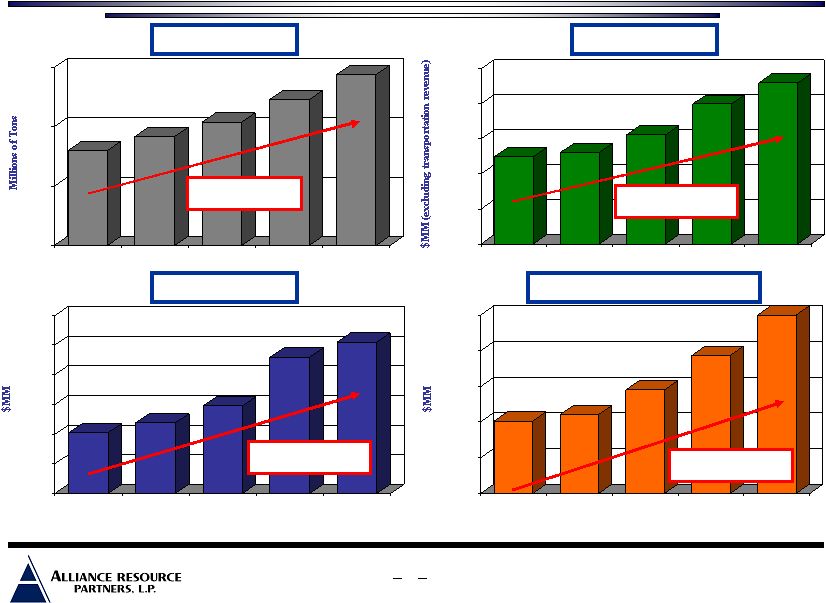
June 28, 2006 __________________ Note: EBITDA is a non-GAAP measure defined as income before net interest expense, income taxes and depreciation, depletion and amortization. See slide 12 for a reconciliation of EBITDA to Net Income. (a) Based on the midpoint of management guidance as of April 24, 2006. Consistent Track Record of Growth at ARLP 18.0 19.2 20.4 22.3 24.4 10.0 15.0 20.0 25.0 2002 2003 2004 2005 2006E Production $499.0 $523.2 $623.5 $799.6 $920.0 $0.0 $200.0 $400.0 $600.0 $800.0 $1,000.0 2002 2003 2004 2005 2006E Revenue $101.3 $110.3 $145.1 $193.6 $250.0 $0.0 $50.0 $100.0 $150.0 $200.0 $250.0 2002 2003 2004 2005 2006E Cash Flow from Operations $102.5 $119.0 $147.9 $230.1 $255.0 $0.0 $50.0 $100.0 $150.0 $200.0 $250.0 $300.0 2002 2003 2004 2005 2006E EBITDA CAGR: 7.9% CAGR: 16.5% CAGR: 25.6% CAGR: 25.3% (a) (a) (a) 6 (a) |
June 28, 2006 Positioned for Continued Growth |
June 28, 2006 ARLP Organic Growth Opportunities Commodity Prices Growing Scrubber Market New Coal Fueled Power Generating Units Coal to Liquids 7 |
June 28, 2006 Major Supply Shifts Influenced by Clean Air Act Source: MSHA / Platts 8 U.S. Coal Supply (Million Tons) Change % Change 1990 1995 2000 2005 90 - '05 90 - '05 Illinois Basin 141 109 87 92 (49) -35% Northern Appalachia 166 137 140 140 (26) -16% Central Appalachia 287 272 263 232 (55) -19% Powder River Basin 199 286 362 430 231 116% Subtotal 793 804 852 894 101 13% Other 225 228 224 233 8 4% TOTAL 1,018 1,032 1,076 1,127 109 11% |
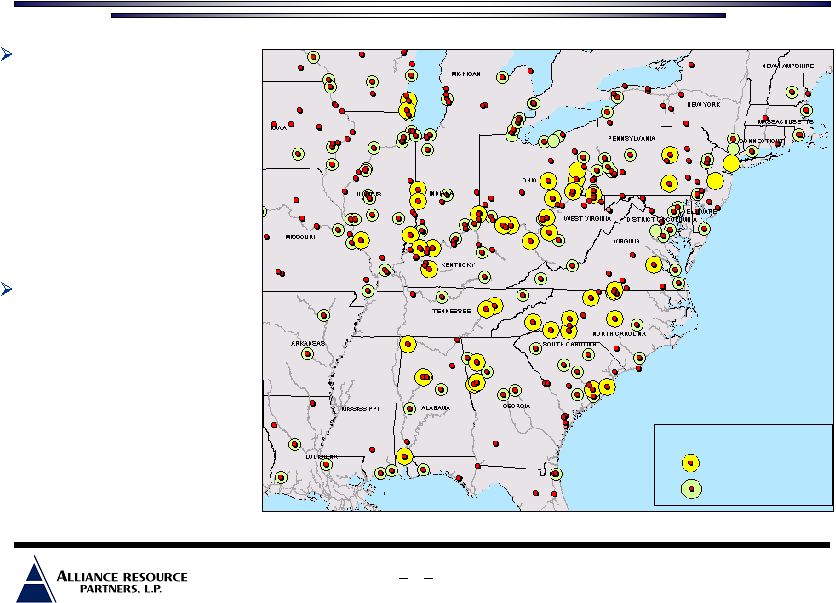
June 28, 2006 Significant Scrubber Market Dynamics Scrubber Additions - Announced Planned Current and pending legislation has caused utilities to add or announce plans to add scrubbers which management expects should lead to additional market opportunities for the Illinois Basin and Northern Appalachian regions As utilities execute their environmental compliance initiatives, a significant amount of coal demand historically supplied from the Central Appalachian region should switch to higher sulfur Illinois Basin and Northern Appalachian coal 9 Source: Company analysis. __________________ |
June 28, 2006 ARLP Well Positioned in Scrubber Markets Current Position Four mining complexes currently producing in the Illinois Basin and one in Northern Appalachia serving the scrubbed utility markets #2 overall producer in the Illinois Basin Growing presence with announced projects in Northern Appalachia In 2005, 70% of the 22.3 million tons produced serviced the high or medium sulfur markets Approximately 540 million tons of “scrubber” quality coal reserves (high and medium sulfur) Recent Contract Agreements Allegheny Coal Sales Agreement • New 10 year, 20 million ton coal supply agreement commencing with initial production from Penn Ridge mine LG&E Coal Sales Agreement • New 6 year, 23.5 million ton coal supply agreement commencing January 1, 2006 with option to extend VEPCO Coal Sales Agreement • New 7 year, 15.8 million ton coal supply agreement commencing January 1, 2007 Current Mine Developments Elk Creek Mountain View Van Lear New Mine Developments Tunnel Ridge (Permitting in Progress) Penn Ridge (Initiating Permitting Process) Gibson South (Permitting in Progress) River View (Initiating Permitting Process) 10 |
June 28, 2006 Large Inventory of Organic Growth Projects ARLP has a number of significant, near-term development opportunities 11 Tunnel Penn Gibson Development Project: Ridge Ridge South Status: Permitting in progress Initiating permitting process Permitting in progress Expected Development Cost: $200 million $165 million $100 million Anticipated Initial Production: 2008 - 2009 2009 - 2010 2008 - 2009 Estimated Reserves (million tons): 70 55 83 Coal Quality: High Sulfur High Sulfur Medium Sulfur Estimated Annual Production Capacity (million tons): 6.0 5.0 3.1 River View $110 - $130 million 99 High Sulfur 3.5 2008 - 2009 Initiating permitting process |
June 28, 2006 Summary |
June 28, 2006 ARLP EBITDA Reconciliation EBITDA is defined as income before net interest expense, income taxes and depreciation, depletion and amortization. Management believes EBITDA is a useful indicator of its ability to meet debt service and capital expenditure requirements and uses EBITDA as a measure of operating performance. EBITDA should not be considered as an alternative to net income, income from operations, cash flows from operating activities or any other measure of financial performance presented in accordance with generally accepted accounting principles. EBITDA is not intended to represent cash flow and does not represent the measure of cash available for distribution. The Partnership's method of computing EBITDA may not be the same method used to compute similar measures reported by other companies, or EBITDA may be computed differently by the Partnership in different contexts (i.e. public reporting versus computation under financing agreements). ($ in thousands) Year Ended December 31, 2006E 2002 2003 2004 2005 Midpoint Cash flows provided by operating activities 101,306 $ 110,312 $ 145,055 $ 193,618 $ 250,000 $ Reclamation and mine closing (1,365) (1,341) (1,622) (1,918) (1,800) Coal inventory adjustment to market (48) (687) (488) (573) - Other 1,014 353 (255) (2,057) (1,000) Net effect of changes in operating assets and liabilities (13,714) (8,240) (12,405) 26,577 (5,700) Interest expense 16,360 15,981 14,963 11,816 10,700 Income taxes (1,094) 2,577 2,641 2,682 2,800 EBITDA 102,459 $ 118,955 $ 147,889 $ 230,145 $ 255,000 $ Depreciation, depletion and amortization (52,408) (52,495) (53,664) (55,637) (71,500) Interest expense (16,360) (15,981) (14,963) (11,816) (10,700) Income taxes 1,094 (2,577) (2,641) (2,682) (2,800) Net income 34,785 $ 47,902 $ 76,621 $ 160,010 $ 170,000 $ 12 |
Coal USA June 28, 2006 |