Wachovia Securities Nantucket Equity Conference June 26, 2007 Alliance Resource Partners, L.P. Alliance Holdings GP, L.P. Exhibit 99.2 |
Forward-Looking Statements This presentation contains forward-looking statements and information that are based on the beliefs of Alliance Resource Partners, L.P. and Alliance Holdings GP, L.P. (the “Partnerships”) and those of their respective general partners (the “General Partners”), as well as assumptions made by and information currently available to them. When used in this presentation, words such as “anticipate,” “project,” “expect,” “plan,” “goal,” “forecast,” “intend,” “could,” “believe,” “may,” and similar expressions and statements regarding the plans and objectives of the Partnerships for future operations, are intended to identify forward-looking statements. Although the Partnerships and their General Partners believe that such expectations reflected in such forward-looking statements are reasonable at the time such statements are made, neither the Partnerships nor the General Partners can give assurances that such expectations will prove to be correct. Such statements are subject to a variety of risks, uncertainties and assumptions. If one or more of these risks or uncertainties materialize, or if underlying assumptions prove incorrect, actual results may vary materially from those the Partnerships anticipated, estimated, projected or expected. The Partnerships have no obligation to publicly update or revise any forward-looking statement, whether as a result of new information, future events or otherwise. |
Alliance Overview |
__________________ Diversified producer and marketer of coal to major U.S. utilities and industrial users Only publicly-traded master limited partnership involved in the production and marketing of coal Began mining operations in 1971 Currently operate eight underground mining complexes in Illinois, Indiana, Kentucky, Maryland and West Virginia Approximately 712 million tons of proven and probable coal reserves in the Illinois Basin, Central Appalachia and Northern Appalachia regions (a) Consistent growth through internal development and disciplined acquisitions Fourth largest eastern coal producer and ninth largest in the U.S. (b) Sixth consecutive year of record performance (a) Estimated reserves at June 20, 2007, including Providence reserve acquisition. (b) Source: Platts coal data as of 9/30/06 Alliance Resource Partners, L.P. 1 |
Two Ways to Invest in Alliance Partnerships (a) Includes control group comprised of present and former members of ARLP management (b) Includes general partner interest held directly in ARLP’s Intermediate Partnership. __________________ 56.9% L.P. Interest 42.1% L.P. Interest 1.98% General Partner Interest Alliance Holdings GP , L.P. (NASDAQ: AHGP) 59.9 million units outstanding Alliance Resource Partners, L.P. (NASDAQ: ARLP) 36.6 million units outstanding Public Unitholders Public Unitholders Management / Others (a) 2 (b) IDRs 80.0% L.P. Interest 20.0% L.P. Interest Distribution growth from ARLP benefits all unitholders Strong alignment of interests throughout the Alliance Partnerships Management owns significant interests directly in AHGP and indirectly in ARLP |
4 th largest eastern coal producer operating 8 underground mining complexes 712 million tons of reserves at June 20, 2007 following Providence reserve acquisition 6.1% 28.0% $1,695 mm $1,592 mm 1.77x $2.16 $43.56 ARLP $30.04 Unit Price (06/20/07): $1,798 mm Equity Market Cap: Ownership Interests in ARLP 1.98% G.P. Interest 100% of Incentive Distribution Rights 15.5 mm ARLP common units Asset Profile: 0.0% Net Debt / Book Cap: $1,798 mm Enterprise Value: $1.00 Distribution: AHGP NASDAQ Symbol: 0.0% Net Debt / Enterprise Value: 1.00x Total Unit Coverage: Alliance Partnership Profiles 3 |
Strong operational and financial attributes of Alliance Resource Partners, L.P. Established history of operating and financial performance Efficient, low-cost operator Proven track record of executing growth strategy Favorable long-term industry fundamentals Experienced management team Conservative balance sheet with significant liquidity Visible inventory of growth prospects Robust distribution coverage at ARLP provides stability and a catalyst for future growth Accelerated cash flow growth potential of Alliance Holdings GP, L.P. through ownership of ARLP incentive distribution rights Strong economic alignment throughout organization Management owns significant interests in both ARLP and AHGP Alliance Investment Highlights 4 |
Increase cash distributions to unitholders by actively assisting ARLP in implementing its business strategy AHGP supports ARLP by assisting with the identification, evaluation and pursuit of growth opportunities AHGP may provide ARLP access to AHGP’s capital resources to facilitate such growth opportunities Complementary Business Objectives Alliance Holdings GP, L.P. 5 Create sustainable, capital efficient growth in distributable cash flow to maximize growth in distributions to ARLP unitholders Maximize existing asset base – expand / extend current operations, continuous focus on productivity improvements Build on strong coal platform – develop new mining complexes, enhance customer / strategic relationships, pursue strategic opportunities Alliance Resource Partners, L.P. |
Alliance Resource Partners, L.P. Overview |
ARLP operates eight underground mining complexes in all major eastern coal producing regions Diversified reserve position in the Illinois Basin, Central Appalachia and Northern Appalachia regions Four significant organic development projects identified in the growing Illinois Basin and Northern Appalachia high sulfur coal markets Alliance Resource Partners, L.P. Snapshot Unit Price at 06/20/07: $43.56 Current Annualized Distribution: $2.16 Current Yield: 4.96% Equity Market Value: ~$1,592 mm Enterprise Value: ~$1,695 mm ARLP Trading Information 6 1 2 3 4 Pattiki Complex River View Complex Dotiki Complex Mount Vernon Transfer Terminal 5 6 7 8 Warrior Complex Hopkins Complex Gibson Complex Pontiki Complex 9 10 11 12 MC Mining Complex Tunnel Ridge Complex Penn Ridge Complex Mettiki Complex |
Operations Summary 2006 Production Northern Appalachia 26% Illinois Basin 68% Central Appalachia 6% Reserves - 2006 7 2006 Summary (MM Tons) Dotiki 4.7 86.7 Seminole; TVA Warrior 4.5 13.9 Synfuel Solutions; LG&E Pattiki 2.5 44.4 Corn Products; LG&E Hopkins 1.6 63.5 Tampa Electric; TVA River View - 110.0 - Gibson (North) 3.6 31.8 Duke Energy; Alabama Electric Gibson (South) 0.0 82.7 - Region Total 16.9 433.0 Central Appalachia Pontiki 1.6 16.7 Progress; Ontario Power MC Mining 1.9 20.7 Progress; NRG; East KY Power Region Total 3.5 37.4 Northern Appalachia Mettiki / Mettiki WV 3.3 36.3 Virginia Electric Power Tunnel Ridge - 70.5 - Penn Ridge - 56.7 Allegheny Energy Region Total 3.3 163.5 Total Company 23.7 633.9 Including Providence Reserves (June 20, 2007) 712.0 Northern Appalachia 14% Illinois Basin 71% Central Appalachia 15% |
Efficient Operator Source: Public filings EBITDA margin represents EBITDA / Total Revenues. EBITDA is a non-GAAP measure. See reconciliation slide of EBITDA to Net Income. ARLP is a low-cost, efficient coal operator, delivering sector-leading EBITDA margins __________________ 8 0.0% 5.0% 10.0% 15.0% 20.0% 25.0% 30.0% Alliance Consol Arch Foundation Peabody Alpha Massey 2003 2004 2005 2006 |
Focused on Safety ARLP’s safety performance has been consistently better than our industry peer group Innovative use of technology to improve safety State-of-the-art Leaky Feeder mine communication systems installed at all operations Fiber optic based mine monitoring systems installed at all operations Currently installing proprietary Miner Tracking systems at all operations 9 Alliance Coal, LLC 5.6 7.6 4.8 6.4 4.7 5.7 3.1 3.4 3.4 3.8 1.8 8.6 9.1 8.5 7.3 7.4 6.7 5.9 5.5 5.1 5.1 8.4 -65% -23% -36% -25% -43% -16% -35% -54% -42% -37% -27% 0 2 4 6 8 10 1997 1998 1999 2000 2001 2002 2003 2004 2005 2006 2007 ARLP NFDL Industry Average % Below Industry Average Safety Comparison 1997-2007 |
__________________ Note: EBITDA is a non-GAAP measure defined as income before net interest expense, income taxes and depreciation, depletion and amortization. See reconciliation slide of EBITDA to Net Income. (a) Based on the midpoint of management guidance. Consistent Track Record of Growth at ARLP 19.2 20.4 22.3 23.7 25.0 10.0 15.0 20.0 25.0 2003 2004 2005 2006 2007E Production $523.2 $623.5 $799.6 $920.0 $1,000.0 $0.0 $200.0 $400.0 $600.0 $800.0 $1,000.0 2003 2004 2005 2006 2007E Revenue $110.3 $145.1 $193.6 $245.0 $253.4 $50.0 $100.0 $150.0 $200.0 $250.0 2003 2004 2005 2006 2007E Cash Flow from Operations $119.0 $147.9 $230.1 $250.0 $270.0 $0.0 $50.0 $100.0 $150.0 $200.0 $250.0 $300.0 2003 2004 2005 2006 2007E EBITDA CAGR: 6.8% CAGR: 17.6% CAGR: 22.7% CAGR: 23.1% (a) (a) (a) 10 (a) |
$1.05 $1.05 $1.05 $1.13 $1.25 $1.30 $1.30 $1.50 $1.50 $1.65 $1.65 $1.84 $1.84 $2.00 $2.00 $2.16 $2.16 $0.75 $1.00 $1.25 $1.50 $1.75 $2.00 $2.25 Continuous Unit Distribution Growth ARLP has increased its quarterly distribution by 100% over the last four years 11 |
Leader in Distribution Growth ARLP compares favorably to the broad MLP universe in terms of distribution growth since the beginning of 2004 (a) 12 142% 92% 62% 57% 52% 50% 49% 49% 44% 38% 28% 24% 23% 22% 22% 22% 18% 3% 0% __________________ (a) Total distribution growth from distribution paid in the first quarter of 2004 to the latest announced distribution as of June 20, 2007. (b) Previously VLI |
Alliance Holdings GP, L.P. Overview |
Note: This graph shows the impact to AHGP as a result of ARLP raising or lowering its quarterly distribution from the current announced quarterly distribution of $0.54 per common unit ($2.16 annualized). This information is presented for illustrative purposes only and is not intended to be a prediction of future performance. __________________ Incentive distribution rights provide AHGP unitholders with significant financial leverage to ARLP distribution growth $0 $20,000 $40,000 $60,000 $80,000 $100,000 $1.84 $1.94 $2.04 $2.14 $2.24 $2.34 $2.44 $2.54 $2.64 Hypothetical ARLP Annual Distribution per L.P. Unit Hypothetical Distributions to AHGP AHGP Leverage to ARLP Growth G.P. Interest IDRs L.P. Interest Current ARLP Distribution ($2.16 per unit) 13 ARLP Distribution at AHGP IPO ($1.84 per unit) |
Note: Potential one year ARLP distribution growth over current annualized distribution level of $2.16 and assuming 36.6 million common units outstanding at ARLP as of 3/31/07. __________________ Impact of ARLP Distribution Growth 14 AHGP Leverage to ARLP Distribution Growth ARLP Distribution Growth 0% 10% 20% 30% 40% 0% 5% 10% 15% 20% 9.0% 27.0% 18.0% 36.0% |
Benefits of Industry-Leading Distribution Coverage ARLP’s coverage ratio is among the highest of publicly traded limited partnerships in the energy sector (a) Benefits to AHGP investors include: Greater potential for future distribution growth Capital efficient financing for ARLP organic growth projects Added stability across operating and pricing environments (a) Source: public filings. Coverage calculated as 2007E distributable cash flow (per Wall Street equity research) divided by current annualized cash distributions. (b) Coal MLP Index includes NRP and PVR. Coverage calculated as 2007E distributable cash flow (per Wall Street equity research) divided by current annualized cash distributions. (c) Pipeline MLP Index includes APL, BPL, BWP, XTEX, DPM, EEP, EPD, ETP, HLND, HEP, KMP, MMP, MWE, MMLP, NS, PAA, RGNC, SXL, TCLP, TLP, TPP, and WPZ. Coverage calculated as 2007E distributable cash flow (per Wall Street equity research) divided by current annualized cash distributions. __________________ (b) (c) 15 1.77x 1.16x 1.22x ARLP Coal MLP Index Pipeline MLP Index |
Value Inherent in Underlying Cash Flows ARLP’s value proposition becomes clear through its current cash available for distribution The impact is even more pronounced at Alliance Holdings GP due to the IDR leverage Implied Yields (a) 7.55% 5.60% 6.62% 4.96% 5.11% 5.64% 3.33% 3.31% 6.54% 4.30% 1.50% 3.00% 4.50% 6.00% 7.50% 9.00% ARLP Coal MLPs Pipeline MLPs AHGP GP Holdcos Distributed Yield Assuming 1.00x Coverage at MLP (a) Yields as of 6/20/2007. (b) Coal MLPs Index includes NRP and PVR. (c) Pipeline MLPs includes APL, BPL, BWP, DPM, EEP, EPD, ETP, HLND, HEP, KMP, MMLP, MMP, MWE, NS, PAA, RGNC, SXL, TCLP, TLP, TPP, WPZ and XTEX. (d) GP Holdcos includes AHD, BGH, EPE, ETE, HPGP, MGG, NRGP, NSH, PVG and XTXI. __________________ (c) (d) (b) 16 |
Positioned for Continued Growth |
Recent Soft Spot Market Prices have been influenced by: Generally mild weather Short term increase in coal production in 2006 Higher than normal utility stockpiles 2007 Outlook EIA projects 60 million ton swing in 2007 coal demand/production as demand is projected to increase 2.1% while production is anticipated to decline 3.1%. (a) For 2007, year to date electricity generation is up 3.6% from 2006 and 6.2% versus the five-year average (b) Total U.S. coal production for 2007 is down 2.8% ytd while eastern coal production is down 3.4% ytd compared to 2006. (b) Current Market Conditions Expected to Improve (a) U.S. Energy Information-Short-Term-Energy-Outlook;--(b)-Stifel-Nicolaus-“Coal-Supply-and-Demand-Indicators”-June19,-2007 17 |
Growing Domestic Coal Demand Coal’s share of U.S. Fuel market expected to increase from 49% to 57% by 2030 (a) New coal-fired power plants expected to result in 120 MTPY of additional coal demand by 2010 (a) Btu conversion technologies could more than double U.S. coal demand by 2030 (b) Constrained Domestic Coal Supply Regulatory environment – safety and permitting Diminishing low cost reserves for Central App Increasing capital requirements and operating costs Increasing Global Coal Demand Global economic expansion continues to drive escalating demand for energy Global coal demand has increased by 23% or 1 billion tons since 2001 (c) Worldwide coal demand expected to nearly double by 2030 (d) Challenges for Competing Fuels Nuclear utilization at full capacity Non-competitive oil and natural gas prices Continued challenges for LNG Robust Long-Term Coal Industry Fundamentals __________________ Sources: (a) Energy Information Administration, (b) National Coal Council, (c) BP Statistical Review of World Energy, (d) Department of Energy, Energy Information Administration, International Energy Outlook 18 |
Coal - The Cornerstone of America’s Energy Future 19 Coal is a vital source of secure, affordable domestic energy Coal is essential to U. S. energy security Coal comprises 95% of U.S. energy reserves Over 200 years of U.S. coal supply Coal is the affordable fuel of choice Over 50% of U.S. electricity generation is coal fired Delivered cost of coal superior to alternatives Coal - $1.54/mmbtu Natural gas - $8.21/mmbtu Petroleum - $6.44/mmbtu Source: Energy Information Administration |
ARLP Is Positioned for Future Sector Growth Future growth potential for scrubber market bodes well for Alliance high sulfur operations Projected Eastern U.S. Installed Scrubber Capacity 20 0 50 100 150 200 250 300 350 400 450 2005 2006 2007 2008 2009 2010 2011 2012 2013 2014 2015 0 20 40 60 80 100 120 140 160 180 Scrubber Capacity Gigawatts Million Tons (a) 12,500 Btu equivalent Gigawatts (b) __________________ (a) Assumption used to convert gigawatts of capacity to million tons of coal: 9,600 Btu/kwhr plant heat rate, 75% plant capacity factor, 12,500 Btu coal (b) Source: The McIlvaine Company. |
ARLP Well Positioned in Scrubber Markets Approximately 676 million tons of “scrubber” quality coal 21 Illinois Basin Second largest producer in the basin Strong reserve base of ~512 million tons of high and medium sulfur coal Currently accounts for ~74% of total ARLP coal production Northern Appalachia Strong reserve base of ~164 million tons of high and medium sulfur coal Currently accounts for ~13% of total ARLP coal production |
River View Commencing slope and shaft construction Estimated capital cost ~ $130 - $160 million Estimated reserves ~ 110 million tons high sulfur coal Production capacity ~ 3.1 - 4.6 million tons/year Initial production in 2009 – 2010 Gibson South Permitting in progress Estimated capital cost ~ $100 - $110 million Estimated reserves ~ 83 million tons medium sulfur coal Production capacity ~ 2.7 - 3.1 million tons/year Initial production in 2009 – 2010 Large Inventory of Organic Growth Projects Estimated capital costs are based on 2006 dollars and exclude capitalized development and interest expenses. Timing of anticipated initial-production-dependent-upon-obtaining-required-permits-and-customer-contracts Penn Ridge Initiating permitting process Estimated capital cost ~ $165 - $175 million Estimated reserves ~ 57 million tons high sulfur coal Production capacity ~ 5 million tons/year Initial production in 2009 – 2011 22 __________________ Tunnel Ridge Permitting in progress Estimated capital cost ~ $195 - $210 million Estimated reserves ~ 70 million tons high sulfur coal Production capacity ~ 6 million tons/year Initial production in 2009 – 2010 |
Summary |
Alliance Resource Partners, L.P. Performance Proven track record of superior operating and financial results Clear strategy and visible inventory of growth prospects to exploit favorable long-term coal fundamentals Results (a) ARLP has outperformed peers over the last four years in both distribution growth and unit price appreciation ARLP has delivered a 289% total return to unitholders since June 2003 Alliance Holding GP, L.P. Opportunity IDRs provide leverage to distribution growth potential of ARLP Results (a) AHGP has increased distributions 35.1% since IPO AHGP unit price has increased 20.1% since IPO, 43.0% in last 12 months and 52.0% YTD Alliance Investment Take Aways 23 (a) As of June 20, 2007 (a) As of June 20, 2007 |
Appendix |
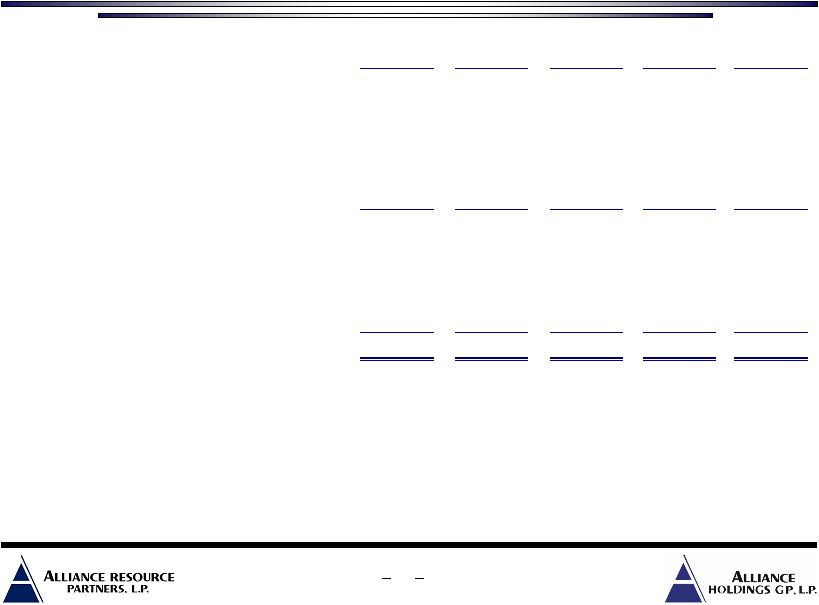
ARLP EBITDA Reconciliation EBITDA is defined as income before net interest expense, income taxes and depreciation, depletion and amortization. Management believes EBITDA is a useful indicator of its ability to meet debt service and capital expenditure requirements and uses EBITDA as a measure of operating performance. EBITDA should not be considered as an alternative to net income, income from operations, cash flows from operating activities or any other measure of financial performance presented in accordance with generally accepted accounting principles. EBITDA is not intended to represent cash flow and does not represent the measure of cash available for distribution. The Partnership's method of computing EBITDA may not be the same method used to compute similar measures reported by other companies, or EBITDA may be computed differently by the Partnership in different contexts (i.e. public reporting versus computation under financing agreements). Estimate midpoint reflects the Partnership’s most recent guidance. 24 2007E 2003 2004 2005 2006 Mid-point Cash flow provided by operating activities 110,312 $ 145,055 $ 193,618 $ 250,923 $ 253,400 $ Reclamation and mine closing (1,341) (1,622) (1,918) (2,101) (2,200) Coal inventory adjustment to market (687) (488) (573) (319) - Other 353 (255) (2,057) 69 (300) Net effect of changes in operating assets and liabilities (8,240) (12,405) 26,577 (9,429) 6,100 Interest expense 15,981 14,963 11,816 9,175 10,200 Income taxes 2,577 2,682 2,443 2,800 EBITDA 118,955 $ 147,889 $ 230,145 $ 250,761 $ 270,000 $ Depreciation, depletion and amortization (52,495) (53,664) (55,637) (66,489) (86,800) Interest expense (15,981) (14,963) (11,816) (9,175) (10,200) Income taxes (2,577) (2,641) (2,682) (2,443) (2,800) Cumulative effect of accounting change - - - 112 - Minority interest income - - - 161 (200) Net income 47,902 $ 76,621 $ 160,010 $ 172,927 $ 170,000 $ 2,641 |
Alliance Resource Partners, L.P. Alliance Holdings GP, L.P. Wachovia Securities Nantucket Equity Conference June 26, 2007 |