UNITED STATES
SECURITIES AND EXCHANGE COMMISSION
Washington, D.C. 20549
FORM N-CSR
CERTIFIED SHAREHOLDER REPORT OF REGISTERED MANAGEMENT
INVESTMENT COMPANIES
Investment Company Act file number 811-09377
The Gabelli Dividend Growth Fund ��
(Exact name of registrant as specified in charter)
One Corporate Center
Rye, New York 10580-1422
(Address of principal executive offices) (Zip code)
Bruce N. Alpert
Gabelli Funds, LLC
One Corporate Center
Rye, New York 10580-1422
(Name and address of agent for service)
Registrant’s telephone number, including area code: 1-800-422-3554
Date of fiscal year end: December 31
Date of reporting period: December 31, 2012
Form N-CSR is to be used by management investment companies to file reports with the Commission not later than 10 days after the transmission to stockholders of any report that is required to be transmitted to stockholders under Rule 30e-1 under the Investment Company Act of 1940 (17 CFR 270.30e-1). The Commission may use the information provided on Form N-CSR in its regulatory, disclosure review, inspection, and policymaking roles.
A registrant is required to disclose the information specified by Form N-CSR, and the Commission will make this information public. A registrant is not required to respond to the collection of information contained in Form N-CSR unless the Form displays a currently valid Office of Management and Budget (“OMB”) control number. Please direct comments concerning the accuracy of the information collection burden estimate and any suggestions for reducing the burden to Secretary, Securities and Exchange Commission, 100 F Street, NE, Washington, DC 20549. The OMB has reviewed this collection of information under the clearance requirements of 44 U.S.C. § 3507.
| Item 1. | Reports to Stockholders. | |
The Report to Shareholders is attached herewith.
| | | | |
The Gabelli Dividend Growth Fund Annual Report — December 31, 2012 
Morningstar® rated The Gabelli Dividend Growth Fund Class AAA Shares 4 stars overall, 3 stars for the three year period, 4 stars for the five year period, and 5 stars for the ten year period ended December 31, 2012 among 1,506, 1,506, 1,324, and 836 Large Blend funds, respectively. Morningstar RatingTM is based on risk-adjusted returns. | | |  | |
| |
| |
| |
| |
| Barbara G. Marcin, CFA
Portfolio Manager |
|
To Our Shareholders,
For the year ended December 31, 2012, the net asset value (“NAV”) per Class AAA Share of The Gabelli Dividend Growth Fund increased 11.5% compared with the increase of 16.0% for the Standard & Poor’s (“S&P”) 500 Index. See page 3 for additional performance information.
Enclosed are the schedule of investments and financial statements as of December 31, 2012.
Performance Discussion (Unaudited)
Over the first three quarters of 2012, the stock market alternately rose, declined, and grew again, as investors considered the rising and falling expectations concerning U.S., European, and Chinese economies. Globally, central banks took measures to stimulate asset prices and their local economies. Within the U.S., concerns about job growth and the fiscal cliff were balanced against a bottoming of the housing market. Quantitative Easing 3 (QE3) was adopted despite indications that the first two rounds were largely ineffectual. The Federal Reserve has now tied monetary policy to the unemployment rate with a target of 6.5% to be reached before it will consider tightening monetary policy.
Throughout the year cash rich companies continued to increase dividends over previous years, finally exceeding the dividend payout ratio prior to the 2008 fiscal crisis. Companies continue to hold large amounts of cash, and during the fourth quarter many companies announced special dividends or accelerated 2013 dividends into 2012 due to potentially automatic increases in tax rates on such payments if the fiscal cliff is breached.
For the year, all ten sectors that comprise the S&P 500 had positive returns, led by the financial and consumer discretionary stocks. The worst performers were the utility and energy sectors, each of which gained less than 5%.
Selected holdings that contributed positively to performance in 2012 were International Paper (3.3% of net assets as of December 31, 2012), which operates as a paper and packaging company in North America, Diageo plc (2.9%), a leading global producer of alcoholic beverages, and BlackRock Inc. (3.1%), a publicly owned investment manager. Some of our weaker performing stocks during the year were: Newmont Mining Corp. (2.3%), based in Denver, CO, one of the largest gold mining companies in the world; Intel Corp. (1.9%), the world’s leading microprocessor company; and Vodafone Group (2.4%), which provides mobile telecommunication services worldwide.
We appreciate your confidence and trust.
|
| Sincerely yours, |
|
 |
|
Bruce N. Alpert President |
February 22, 2013
Morningstar Rating™ is based on risk-adjusted returns. The Overall Morningstar Rating is derived from a weighted average of the performance figures associated with a fund’s three, five, and ten year (if applicable) Morningstar Rating metrics. For funds with at least a three year history, a Morningstar Rating is based on a risk-adjusted return measure (including the effects of sales charges, loads, and redemption fees) placing more emphasis on downward variations and rewarding consistent performance. That accounts for variations in a fund’s monthly performance. The top 10% of funds in each category receive 5 stars, the next 22.5% 4 stars, the next 35% 3 stars, the next 22.5% 2 stars, and the bottom 10% 1 star. (Each share class is counted as a fraction of one fund within this scale and rated separately, which may cause slight variations in the distribution percentages.) Morningstar Rating is for the AAA Share class only; other classes may have different performance characteristics. Ratings reflect relative performance. Results for certain periods were negative. ©2013 Morningstar, Inc. All Rights Reserved. The information contained herein: (1) is proprietary to Morningstar and/or its content providers; (2) may not be copied or distributed; and (3) is not warranted to be accurate, complete, or timely. Neither Morningstar nor its content providers are responsible for any damages or losses arising from any use of this information.
We have separated the portfolio manager’s commentary from the financial statements and investment portfolio due to corporate governance regulations stipulated by the Sarbanes-Oxley Act of 2002. We have done this to ensure that the content of the portfolio manager’s commentary is unrestricted. The financial statements and investment portfolio are mailed separately from the commentary. Both the commentary and the financial statements, including the portfolio of investments, will be available on our website at www.gabelli.com.
2
Comparative Results
| | | | | | | | | | |
| Average Annual Returns through December 31, 2012 (a) (Unaudited) | | Since | | |
| | | | | | | | | Inception | | |
| | | 1 Year | | 5 Year | | 10 Year | | (8/26/99) | | |
Class AAA (GABBX) | | 11.50% | | 1.62% | | 8.21% | | 4.22% | | |
S&P 500 Index | | 16.00 | | 1.66 | | 7.10 | | 2.47(d) | | |
Lipper Large Cap Value Fund Average | | 15.87 | | 0.17 | | 6.41 | | 2.63 | | |
Class A (GBCAX) | | 11.57 | | 1.64 | | 8.24 | | 4.25 | | |
With sales charge (b) | | 5.15 | | 0.45 | | 7.61 | | 3.79 | | |
Class C (GBCCX) | | 10.59 | | 0.86 | | 7.49 | | 3.70 | | |
With contingent deferred sales charge (c) | | 9.59 | | 0.86 | | 7.49 | | 3.70 | | |
Class I (GBCIX) | | 11.75 | | 1.88 | | 8.44 | | 4.39 | | |
In the current prospectus dated April 27, 2012, the expense ratios for Class AAA, A, C, and I Shares are 2.00%, 2.00%, 2.75%, and 1.75%, respectively. See page 10 for the expense ratios for the year ended December 31, 2012. Class AAA and Class I Shares do not have a sales charge. The maximum sales charge for Class A and C Shares is 5.75% and 1.00%, respectively. (a) Returns represent past performance and do not guarantee future results. Total returns and average annual returns reflect changes in share price, reinvestment of distributions and are net of expenses. Investment returns and the principal value of an investment will fluctuate. When shares are redeemed, they may be worth more or less than their original cost. The Fund imposes a 2% redemption fee on shares sold or exchanged within seven days after the date of purchase. Current performance may be lower or higher than the performance data presented. Returns would have been lower had Gabelli Funds, LLC (the “Adviser”) not reimbursed certain expenses of the Fund. Visit www.gabelli.com for performance information as of the most recent month end. Investors should carefully consider the investment objectives, risks, charges, and expenses of the Fund before investing. The prospectus contains information about these and other matters and should be read carefully before investing. The S&P 500 Index is a market capitalization weighted index of 500 large capitalization stocks commonly used to represent the U.S. equity market. The Lipper Large Cap Value Fund Average reflects the average performance of mutual funds classified in this particular category. Dividends are considered reinvested. You cannot invest directly in an index. The Class AAA Share NAVs are used to calculate performance for the periods prior to the issuance of Class A Shares and Class C Shares on December 31, 2003, and the Class I Shares on June 30, 2004.The actual performance of the Class C Shares would have been lower due to the additional expenses associated with this class of shares. The actual performance for the Class I Shares would have been higher due to the lower expenses related to this class of shares. (b)Performance results include the effect of the maximum 5.75% sales charge at the beginning of the period. (c)Assuming payment of the 1% maximum contingent deferred sales charge imposed on redemptions made within one year of purchase. (d)S&P 500 Index since inception performance is as of August 31, 1999. | | |
COMPARISON OF CHANGE IN VALUE OF A $10,000 INVESTMENT IN
THE GABELLI DIVIDEND GROWTH FUND (CLASS AAA SHARES) AND S&P 500 INDEX (Unaudited)
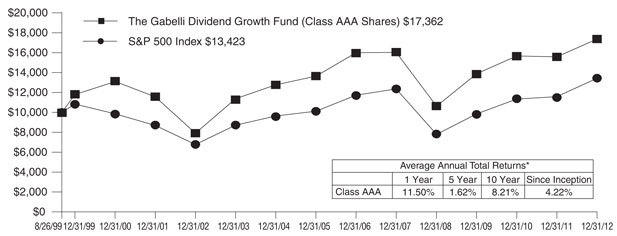
| * | Past performance is not predictive of future results. The performance tables and graph do not reflect the deduction of taxes that a shareholder would pay on Fund distributions or the redemption of Fund shares. |
3
The Gabelli Dividend Growth Fund
Disclosure of Fund Expenses (Unaudited)
| | |
For the Six Month Period from July 1, 2012 through December 31, 2012 | | Expense Table |
We believe it is important for you to understand the impact of fees and expenses regarding your investment. All mutual funds have operating expenses. As a shareholder of a fund, you incur ongoing costs, which include costs for portfolio management, administrative services, and shareholder reports (like this one), among others. Operating expenses, which are deducted from a fund’s gross income, directly reduce the investment return of a fund. When a fund’s expenses are expressed as a percentage of its average net assets, this figure is known as the expense ratio. The following examples are intended to help you understand the ongoing costs (in dollars) of investing in your Fund and to compare these costs with those of other mutual funds. The examples are based on an investment of $1,000 made at the beginning of the period shown and held for the entire period.
The Expense Table below illustrates your Fund’s costs in two ways:
Actual Fund Return: This section provides information about actual account values and actual expenses. You may use this section to help you to estimate the actual expenses that you paid over the period after any fee waivers and expense reimbursements. The “Ending Account Value” shown is derived from the Fund’s actual return during the past six months, and the “Expenses Paid During Period” shows the dollar amount that would have been paid by an investor who started with $1,000 in the Fund. You may use this information, together with the amount you invested, to estimate the expenses that you paid over the period.
To do so, simply divide your account value by $1,000 (for example, an $8,600 account value divided by $1,000 = 8.6), then multiply the result by the number given for your Fund under the heading “Expenses Paid During Period” to estimate the expenses you paid during this period.
Hypothetical 5% Return: This section provides information about hypothetical account values and hypothetical expenses based on the Fund’s actual expense ratio. It assumes a hypothetical annualized return of 5% before expenses during the
period shown. In this case – because the hypothetical return used is not the Fund’s actual return – the results do not apply to your investment and you cannot use the hypothetical account value and expense to estimate the actual ending account balance or expenses you paid for the period. This example is useful in making comparisons of the ongoing costs of investing in the Fund and other funds. To do so, compare this 5% hypothetical example with the 5% hypothetical examples that appear in shareholder reports of other funds.
Please note that the expenses shown in the table are meant to highlight your ongoing costs only and do not reflect any transactional costs such as sales charges (loads), redemption fees, or exchange fees, if any, which are described in the Prospectus. If these costs were applied to your account, your costs would be higher. Therefore, the 5% hypothetical return is useful in comparing ongoing costs only, and will not help you determine the relative total costs of owning different funds. The “Annualized Expense Ratio” represents the actual expenses for the last six months and may be different from the expense ratio in the Financial Highlights which is for the year ended December 31, 2012.
| | | | | | | | |
| | | Beginning Account Value 07/01/12 | | Ending Account Value 12/31/12 | | Annualized Expense Ratio | | Expenses Paid During Period* |
The Gabelli Dividend Growth Fund | | |
Actual Fund Return | | | | |
Class AAA | | $1,000.00 | | $1,052.80 | | 2.00% | | $10.32 |
Class A | | $1,000.00 | | $1,053.40 | | 2.00% | | $10.32 |
Class C | | $1,000.00 | | $1,047.60 | | 2.75% | | $14.15 |
Class I | | $1,000.00 | | $1,054.00 | | 1.75% | | $ 9.04 |
Hypothetical 5% Return | | | | |
Class AAA | | $1,000.00 | | $1,015.08 | | 2.00% | | $10.13 |
Class A | | $1,000.00 | | $1,015.08 | | 2.00% | | $10.13 |
Class C | | $1,000.00 | | $1,011.31 | | 2.75% | | $13.90 |
Class I | | $1,000.00 | | $1,016.34 | | 1.75% | | $ 8.87 |
| * | Expenses are equal to the Fund’s annualized expense ratio for the last six months multiplied by the average account value over the period, multiplied by the number of days in the most recent fiscal half year (184 days), then divided by 366. |
4
Summary of Portfolio Holdings (Unaudited)
The following table presents portfolio holdings as a percent of net assets as of December 31, 2012:
The Gabelli Dividend Growth Fund
| | | | |
Financial Services | | | 19.0% | |
Health Care | | | 13.0% | |
Energy | | | 10.1% | |
Food and Beverage | | | 7.8% | |
Diversified Industrial | | | 7.4% | |
Specialty Chemicals | | | 6.5% | |
Energy Services | | | 4.9% | |
Telecommunications | | | 4.2% | |
Metals and Mining | | | 4.2% | |
Computer Software and Services | | | 3.4% | |
Paper and Forest Products. | | | 3.3% | |
Electronics | | | 3.2% | |
| | | | |
Business Services | | | 3.0% | |
Entertainment | | | 1.9% | |
Machinery | | | 1.7% | |
Environmental Services | | | 1.4% | |
Water | | | 1.4% | |
Computer Hardware | | | 1.2% | |
Consumer Products | | | 0.9% | |
Consumer Services | | | 0.5% | |
Agriculture | | | 0.4% | |
Other Assets and Liabilities (Net) | | | 0.6% | |
| | | | |
| |
| | | 100.0% | |
| | | | |
The Fund files a complete schedule of portfolio holdings with the Securities and Exchange Commission (the “SEC”) for the first and third quarters of each fiscal year on Form N-Q. Shareholders may obtain this information at www.gabelli.com or by calling the Fund at 800-GABELLI (800-422-3554).The Fund’s Form N-Q is available on the SEC’s website at www.sec.gov and may also be reviewed and copied at the SEC’s Public Reference Room in Washington, DC. Information on the operation of the Public Reference Room may be obtained by calling 800-SEC-0330.
Proxy Voting
The Fund files Form N-PX with its complete proxy voting record for the twelve months ended June 30, no later than August 31 of each year. A description of the Fund’s proxy voting policies, procedures, and how the Fund voted proxies relating to portfolio securities is available without charge, upon request, by (i) calling 800-GABELLI (800-422-3554); (ii) writing to The Gabelli Funds at One Corporate Center, Rye, NY 10580-1422; or (iii) visiting the SEC’s website at www.sec.gov.
5
The Gabelli Dividend Growth Fund
Schedule of Investments — December 31, 2012
| | | | | | | | | | | | |
Shares | | | | | Cost | | | Market Value | |
| | | | COMMON STOCKS — 99.4% | | | | | | | | |
| | | | Agriculture — 0.4% | | | | | | | | |
| | 1,000 | | | Monsanto Co. | | $ | 59,350 | | | $ | 94,650 | |
| | | | | | | | | | | | |
| | | | Business Services — 3.0% | | | | | | | | |
| | 13,500 | | | Diebold Inc. | | | 444,996 | | | | 413,235 | |
| | 10,800 | | | Thomson Reuters Corp. | | | 321,037 | | | | 313,848 | |
| | | | | | | | | | | | |
| | | | | | | 766,033 | | | | 727,083 | |
| | | | | | | | | | | | |
| | | | Computer Hardware — 1.2% | | | | | | | | |
| | 15,300 | | | Cisco Systems Inc. | | | 280,188 | | | | 300,645 | |
| | | | | | | | | | | | |
| | | | Computer Software and Services — 3.4% | |
| | 500 | | | Apple Inc. | | | 279,501 | | | | 266,515 | |
| | 21,000 | | | Microsoft Corp. | | | 573,074 | | | | 561,330 | |
| | | | | | | | | | | | |
| | | | | | | 852,575 | | | | 827,845 | |
| | | | | | | | | | | | |
| | | | Consumer Products — 0.9% | | | | | | | | |
| | 3,300 | | | Tupperware Brands Corp. | | | 171,338 | | | | 211,530 | |
| | | | | | | | | | | | |
| | | | Consumer Services — 0.5% | | | | | | | | |
| | 2,500 | | | The ADT Corp. | | | 66,643 | | | | 116,225 | |
| | | | | | | | | | | | |
| | | | Diversified Industrial — 7.4% | | | | | | | | |
| | 28,000 | | | General Electric Co. | | | 488,174 | | | | 587,720 | |
| | 10,000 | | | Honeywell International Inc. | | | 323,863 | | | | 634,700 | |
| | 1,199 | | | Pentair Ltd. | | | 39,023 | | | | 58,931 | |
| | 17,000 | | | Tyco International Ltd. | | | 436,301 | | | | 497,250 | |
| | | | | | | | | | | | |
| | | | | | | 1,287,361 | | | | 1,778,601 | |
| | | | | | | | | | | | |
| | | | Electronics — 3.2% | | | | | | | | |
| | 21,600 | | | Intel Corp. | | | 490,713 | | | | 445,608 | |
| | 10,800 | | | Texas Instruments Inc. | | | 202,032 | | | | 334,152 | |
| | | | | | | | | | | | |
| | | | | | | 692,745 | | | | 779,760 | |
| | | | | | | | | | | | |
| | | | Energy — 10.1% | | | | | | | | |
| | 2,700 | | | Chevron Corp. | | | 187,531 | | | | 291,978 | |
| | 11,050 | | | ConocoPhillips | | | 424,479 | | | | 640,789 | |
| | 6,000 | | | Exxon Mobil Corp. | | | 439,773 | | | | 519,300 | |
| | 8,500 | | | Great Plains Energy Inc. | | | 178,797 | | | | 172,635 | |
| | 6,000 | | | NextEra Energy Inc. | | | 329,136 | | | | 415,140 | |
| | 7,525 | | | Phillips 66 | | | 215,472 | | | | 399,578 | |
| | | | | | | | | | | | |
| | | | | | | 1,775,188 | | | | 2,439,420 | |
| | | | | | | | | | | | |
| | | | Energy Services — 4.9% | | | | | | | | |
| | 11,000 | | | Enterprise Products Partners LP | | | 494,655 | | | | 550,880 | |
| | 10,300 | | | Halliburton Co. | | | 234,130 | | | | 357,307 | |
| | 6,100 | | | Transocean Ltd.† | | | 342,363 | | | | 272,365 | |
| | | | | | | | | | | | |
| | | | | | | 1,071,148 | | | | 1,180,552 | |
| | | | | | | | | | | | |
| | | | Entertainment — 1.9% | | | | | | | | |
| | 9,000 | | | The Walt Disney Co. | | | 307,957 | | | | 448,110 | |
| | | | | | | | | | | | |
| | | | Environmental Services — 1.4% | | | | | | | | |
| | 10,000 | | | Waste Management Inc. | | | 316,772 | | | | 337,400 | |
| | | | | | | | | | | | |
| | | | | | | | | | | | |
Shares | | | | | Cost | | | Market Value | |
| | | | Financial Services — 19.0% | | | | | | | | |
| | 4,500 | | | American Express Co. | | $ | 124,768 | | | $ | 258,660 | |
| | 16,000 | | | American International Group Inc.† | | | 522,029 | | | | 564,800 | |
| | 3,600 | | | BlackRock Inc. | | | 573,009 | | | | 744,156 | |
| | 12,500 | | | Citigroup Inc. | | | 403,498 | | | | 494,500 | |
| | 11,000 | | | CME Group Inc. | | | 583,156 | | | | 557,810 | |
| | 22,500 | | | H&R Block Inc. | | | 355,378 | | | | 417,825 | |
| | 15,000 | | | JPMorgan Chase & Co. | | | 479,905 | | | | 659,550 | |
| | 17,000 | | | Morgan Stanley | | | 286,632 | | | | 325,040 | |
| | 5,000 | | | U.S. Bancorp | | | 166,500 | | | | 159,700 | |
| | 11,000 | | | Waddell & Reed Financial Inc., Cl. A . | | | 299,210 | | | | 383,020 | |
| | | | | | | | | | | | |
| | | | | | | 3,794,085 | | | | 4,565,061 | |
| | | | | | | | | | | | |
| | | | Food and Beverage — 7.8% | | | | | | | | |
| | 6,000 | | | Diageo plc, ADR | | | 508,147 | | | | 699,480 | |
| | 4,000 | | | Kraft Foods Group Inc. | | | 111,307 | | | | 181,880 | |
| | 12,000 | | | Mondelez International Inc., Cl. A. | | | 207,371 | | | | 305,640 | |
| | 5,000 | | | Nestlé SA, ADR | | | 282,788 | | | | 325,850 | |
| | 5,400 | | | PepsiCo Inc. | | | 345,768 | | | | 369,522 | |
| | | | | | | | | | | | |
| | | | | | | 1,455,381 | | | | 1,882,372 | |
| | | | | | | | | | | | |
| | | | Health Care — 13.0% | | | | | | | | |
| | 19,487 | | | Bristol-Myers Squibb Co. | | | 458,554 | | | | 635,081 | |
| | 5,400 | | | Covidien plc | | | 176,245 | | | | 311,796 | |
| | 9,000 | | | Eli Lilly & Co. | | | 368,327 | | | | 443,880 | |
| | 9,000 | | | Johnson & Johnson | | | 562,445 | | | | 630,900 | |
| | 11,950 | | | Merck & Co. Inc. | | | 279,642 | | | | 489,233 | |
| | 24,490 | | | Pfizer Inc. | | | 426,259 | | | | 614,209 | |
| | | | | | | | | | | | |
| | | | | | | 2,271,472 | | | | 3,125,099 | |
| | | | | | | | | | | | |
| | | | Machinery — 1.7% | | | | | | | | |
| | 15,000 | | | Xylem Inc. | | | 398,174 | | | | 406,500 | |
| | | | | | | | | | | | |
| | | | Metals and Mining — 4.2% | | | | | | | | |
| | 12,900 | | | Freeport-McMoRan Copper & Gold Inc. | | | 465,422 | | | | 441,180 | |
| | 12,000 | | | Newmont Mining Corp. | | | 605,617 | | | | 557,280 | |
| | | | | | | | | | | | |
| | | | | | | 1,071,039 | | | | 998,460 | |
| | | | | | | | | | | | |
| | | | Paper and Forest Products — 3.3% | | | | | | | | |
| | 20,000 | | | International Paper Co. | | | 570,727 | | | | 796,800 | |
| | | | | | | | | | | | |
| | | | Specialty Chemicals — 6.5% | | | | | | | | |
| | 6,500 | | | Air Products & Chemicals Inc. | | | 471,154 | | | | 546,130 | |
| | 12,000 | | | E. I. du Pont de Nemours and Co. | | | 456,742 | | | | 539,640 | |
| | 15,000 | | | The Dow Chemical Co. | | | 424,451 | | | | 484,800 | |
| | | | | | | | | | | | |
| | | | | | | 1,352,347 | | | | 1,570,570 | |
| | | | | | | | | | | | |
| | | | Telecommunications — 4.2% | | | | | | | | |
| | 10,000 | | | Verizon Communications Inc. | | | 290,999 | | | | 432,700 | |
| | 22,500 | | | Vodafone Group plc, ADR | | | 561,398 | | | | 566,775 | |
| | | | | | | | | | | | |
| | | | | | | 852,397 | | | | 999,475 | |
| | | | | | | | | | | | |
See accompanying notes to financial statements.
6
The Gabelli Dividend Growth Fund
Schedule of Investments (Continued) — December 31, 2012
| | | | | | | | | | | | |
Shares | | | | | Cost | | | Market Value | |
| | | | COMMON STOCKS (Continued) | | | | | | | | |
| | | | Water — 1.4% | | | | | | | | |
| | 9,000 | | | American Water Works Co. Inc. | | $ | 264,166 | | | $ | 334,170 | |
| | | | | | | | | | | | |
| | | |
| | | | TOTAL COMMON STOCKS | | | 19,677,086 | | | | 23,920,328 | |
| | | | | | | | | | | | |
| | | |
| | | | TOTAL INVESTMENTS — 99.4% | | $ | 19,677,086 | | | | 23,920,328 | |
| | | | | | | | | | | | |
| | |
| | | | Other Assets and Liabilities (Net) — 0.6% | | | | 137,337 | |
| | | | | | | | | | | | |
| | | |
| | | | NET ASSETS — 100.0% | | | | | | $ | 24,057,665 | |
| | | | | | | | | | | | |
| † | Non-income producing security. |
| ADR | American Depositary Receipt |
See accompanying notes to financial statements.
7
The Gabelli Dividend Growth Fund
Statement of Assets and Liabilities
December 31, 2012
| | | | |
| |
Assets: | | | | |
Investments, at value (cost $19,677,086) | | $ | 23,920,328 | |
Receivable for Fund shares sold | | | 146,379 | |
Dividends receivable | | | 38,239 | |
Prepaid expenses | | | 28,983 | |
| | | | |
Total Assets | | | 24,133,929 | |
| | | | |
Liabilities: | | | | |
Payable to custodian | | | 3,559 | |
Payable for Fund shares redeemed | | | 9,544 | |
Payable for investment advisory fees | | | 18,565 | |
Payable for distribution fees | | | 5,185 | |
Payable for shareholder communications expenses | | | 20,478 | |
Payable for legal and audit fees | | | 9,385 | |
Payable for shareholder services fees | | | 5,214 | |
Payable for custodian fees | | | 4,295 | |
Other accrued expenses | | | 39 | |
| | | | |
Total Liabilities | | | 76,264 | |
| | | | |
Net Assets | | | | |
(applicable to 1,596,198 shares outstanding) | | $ | 24,057,665 | |
| | | | |
Net Assets Consist of: | | | | |
Paid-in capital | | $ | 20,025,219 | |
Undistributed net investment income | | | 42,039 | |
Accumulated net realized loss on investments | | | (252,835 | ) |
Net unrealized appreciation on investments | | | 4,243,242 | |
| | | | |
Net Assets | | $ | 24,057,665 | |
| | | | |
| | | | |
| Shares of Beneficial Interest, each at $0.001 par value; unlimited number of shares authorized: | | | | |
Class AAA: | | | | |
Net Asset Value, offering, and redemption price per share ($18,621,184 ÷ 1,233,171 shares outstanding) | | | $15.10 | |
| | | | |
Class A: | | | | |
Net Asset Value and redemption price per share ($1,421,226 ÷ 94,203 shares outstanding) | | | $15.09 | |
| | | | |
Maximum offering price per share (NAV ÷ 0.9425, based on maximum sales charge of 5.75% of the offering price) | | | $16.01 | |
| | | | |
Class C: | | | | |
Net Asset Value and offering price per share ($1,102,649 ÷ 76,628 shares outstanding) | | | $14.39 | (a) |
| | | | |
Class I: | | | | |
Net Asset Value, offering, and redemption price per share ($2,912,606 ÷ 192,196 shares outstanding) | | | $15.15 | |
| | | | |
| (a) | Redemption price varies based on the length of time held. |
Statement of Operations
For the Year Ended December 31, 2012
| | | | |
| |
Investment Income: | | | | |
Dividends (net of foreign withholding taxes of $3,658) | | $ | 782,217 | |
Interest | | | 838 | |
| | | | |
Total Investment Income | | | 783,055 | |
| | | | |
Expenses: | | | | |
Investment advisory fees | | | 243,398 | |
Distribution fees - Class AAA | | | 49,114 | |
Distribution fees - Class A | | | 3,003 | |
Distribution fees - Class C | | | 7,963 | |
Registration expenses | | | 49,782 | |
Shareholder communications expenses | | | 46,420 | |
Shareholder services fees | | | 32,878 | |
Trustees’ fees | | | 30,330 | |
Legal and audit fees | | | 23,687 | |
Custodian fees | | | 10,348 | |
Interest expense | | | 699 | |
Miscellaneous expenses | | | 16,229 | |
| | | | |
Total Expenses | | | 513,851 | |
| | | | |
Less: | | | | |
Expenses reimbursed by Adviser (See Note 3) | | | (27,126 | ) |
| | | | |
Net Expenses | | | 486,725 | |
| | | | |
Net Investment Income | | | 296,330 | |
| | | | |
Net Realized and Unrealized Gain on Investments: | | | | |
Net realized gain on investments | | | 987,727 | |
| | | | |
Net change in unrealized appreciation on investments | | | 1,386,780 | |
| | | | |
Net Realized and Unrealized Gain on Investments | | | 2,374,507 | |
| | | | |
Net Increase in Net Assets Resulting from Operations | | $ | 2,670,837 | |
| | | | |
See accompanying notes to financial statements.
8
The Gabelli Dividend Growth Fund
Statement of Changes in Net Assets
| | | | | | | | |
| |
| | | For the Year Ended
December 31, | |
| | | 2012 | | | 2011 | |
Operations: | | | | | | | | |
Net investment income | | $ | 296,330 | | | $ | 78,154 | |
Net realized gain on investments | | | 987,727 | | | | 1,673,919 | |
Net change in unrealized appreciation/depreciation on investments | | | 1,386,780 | | | | (1,900,698 | ) |
| | | | | | | | |
Net Increase/(Decrease) in Net Assets Resulting from Operations | | | 2,670,837 | | | | (148,625 | ) |
| | | | | | | | |
Distributions to Shareholders: | | | | | | | | |
Net investment income | | | | | | | | |
Class AAA | | | (226,623 | ) | | | (63,166 | ) |
Class A | | | (18,002 | ) | | | (5,315 | ) |
Class C | | | (9,029 | ) | | | — | |
Class I | | | (43,019 | ) | | | (10,120 | ) |
| | | | | | | | |
Total Distributions to Shareholders | | | (296,673 | ) | | | (78,601 | ) |
| | | | | | | | |
| | |
Shares of Beneficial Interest Transactions: | | | | | | | | |
Class AAA | | | (4,909,335 | ) | | | (3,421,822 | ) |
Class A | | | (142,470 | ) | | | 311,720 | |
Class B* | | | (9,140 | ) | | | (65,497 | ) |
Class C | | | 437,857 | | | | 176,998 | |
Class I | | | 895,333 | | | | 253,982 | |
| | | | | | | | |
Net Decrease in Net Assets from Shares of Beneficial Interest Transactions | | | (3,727,755 | ) | | | (2,744,619 | ) |
| | | | | | | | |
Redemption Fees | | | 576 | | | | 307 | |
| | | | | | | | |
Net Decrease in Net Assets | | | (1,353,015 | ) | | | (2,971,538 | ) |
Net Assets: | | | | | | | | |
Beginning of period | | | 25,410,680 | | | | 28,382,218 | |
| | | | | | | | |
End of period (including undistributed net investment income of $42,039 and $0, respectively) | | $ | 24,057,665 | | | $ | 25,410,680 | |
| | | | | | | | |
| * | Class B Shares were fully redeemed and closed on January 4, 2012. |
See accompanying notes to financial statements.
9
The Gabelli Dividend Growth Fund
Financial Highlights
Selected data for a share of beneficial interest outstanding throughout each period:
| | | | | | | | | | | | | | | | | | | | | | | | | | | | | | | | | | | | | | | | | | | | | | | | | | | | | | | | | | | | | | | | | | | | | | | | | | | | | | | | |
| | | | | Income (Loss)
from Investment Operations | | Distributions | | | | | | | | | | Ratios to Average Net Assets/
Supplemental Data |
Period Ended
December 31 | | Net Asset
Value,
Beginning
of Period | | Net
Investment
Income
(Loss)(a) | | Net
Realized
and
Unrealized Gain (Loss) on Investments | | Total from Investment Operations | | Net Investment Income | | Net
Realized
Gain on
Investments | | Return
of
Capital | | Total
Distributions | | Redemption
Fees (a) | | Net
Asset
Value,
End of
Period | | Total
Return† | | Net
Assets,
End of
Period
(in 000’s) | | Net Investment Income
(Loss) | | Operating
Expenses
Before Reimbursement | | Operating
Expenses Net of
Reimbursement
(b) | | Portfolio
Turnover
Rate |
Class AAA | | | | | | | | | | | | | | | | | | | | | | | | | | | | | | | | | | | | | | | | | | | | | | | | | | | | | | | | | | | | | | | | | | | | | | | | | | | | | | | | |
2012 | | | $ | 13.71 | | | | $ | 0.18 | | | | $ | 1.40 | | | | $ | 1.58 | | | | $ | (0.19 | ) | | | | — | | | | | — | | | | $ | (0.19 | ) | | | $ | 0.00 | (c) | | | $ | 15.10 | | | | | 11.5 | % | | | $ | 18,621 | | | | | 1.21 | % | | | | 2.11 | % | | | | 2.00 | % | | | | 20 | % |
2011 | | | | 13.82 | | | | | 0.04 | | | | | (0.11 | ) | | | | (0.07 | ) | | | | (0.04 | ) | | | | — | | | | | — | | | | | (0.04 | ) | | | | 0.00 | (c) | | | | 13.71 | | | | | (0.5 | ) | | | | 21,551 | | | | | 0.28 | | | | | 2.00 | | | | | 2.00 | (d) | | | | 45 | |
2010 | | | | 12.25 | | | | | (0.02 | ) | | | | 1.59 | | | | | 1.57 | | | | | — | | | | | — | | | | | — | | | | | — | | | | | — | | | | | 13.82 | | | | | 12.8 | | | | | 25,152 | | | | | (0.14 | ) | | | | 2.12 | | | | | 2.00 | | | | | 42 | |
2009 | | | | 9.40 | | | | | (0.00 | )(c) | | | | 2.88 | | | | | 2.88 | | | | | (0.03 | ) | | | | — | | | | $ | (0.00 | )(c) | | | | (0.03 | ) | | | | 0.00 | (c) | | | | 12.25 | | | | | 30.6 | | | | | 26,045 | | | | | 0.04 | | | | | 2.13 | | | | | 2.01 | | | | | 76 | |
2008 | | | | 14.21 | | | | | 0.03 | | | | | (4.82 | ) | | | | (4.79 | ) | | | | (0.02 | ) | | | $ | (0.00 | )(c) | | | | — | | | | | (0.02 | ) | | | | 0.00 | (c) | | | | 9.40 | | | | | (33.7 | ) | | | | 18,136 | | | | | 0.23 | | | | | 2.02 | | | | | 2.00 | | | | | 90 | |
Class A | | | | | | | | | | | | | | | | | | | | | | | | | | | | | | | | | | | | | | | | | | | | | | | | | | | | | | | | | | | | | | | | | | | | | | | | | | | | | | | | |
2012 | | | $ | 13.70 | | | | $ | 0.17 | | | | $ | 1.41 | | | | $ | 1.58 | | | | $ | (0.19 | ) | | | | — | | | | | — | | | | $ | (0.19 | ) | | | $ | 0.00 | (c) | | | $ | 15.09 | | | | | 11.6 | % | | | $ | 1,421 | | | | | 1.18 | % | | | | 2.11 | % | | | | 2.00 | % | | | | 20 | % |
2011 | | | | 13.82 | | | | | 0.04 | | | | | (0.11 | ) | | | | (0.07 | ) | | | | (0.05 | ) | | | | — | | | | | — | | | | | (0.05 | ) | | | | 0.00 | (c) | | | | 13.70 | | | | | (0.5 | ) | | | | 1,451 | | | | | 0.32 | | | | | 2.00 | | | | | 2.00 | (d) | | | | 45 | |
2010 | | | | 12.25 | | | | | (0.02 | ) | | | | 1.59 | | | | | 1.57 | | | | | — | | | | | — | | | | | — | | | | | — | | | | | — | | | | | 13.82 | | | | | 12.8 | | | | | 1,153 | | | | | (0.14 | ) | | | | 2.12 | | | | | 2.00 | | | | | 42 | |
2009 | | | | 9.41 | | | | | (0.01 | ) | | | | 2.89 | | | | | 2.88 | | | | | (0.04 | ) | | | | — | | | | $ | (0.00 | )(c) | | | | (0.04 | ) | | | | 0.00 | (c) | | | | 12.25 | | | | | 30.6 | | | | | 1,404 | | | | | (0.07 | ) | | | | 2.13 | | | | | 2.01 | | | | | 76 | |
2008 | | | | 14.23 | | | | | 0.03 | | | | | (4.82 | ) | | | | (4.79 | ) | | | | (0.03 | ) | | | $ | (0.00 | )(c) | | | | — | | | | | (0.03 | ) | | | | 0.00 | (c) | | | | 9.41 | | | | | (33.7 | ) | | | | 111 | | | | | 0.24 | | | | | 2.02 | | | | | 2.00 | | | | | 90 | |
Class C | | | | | | | | | | | | | | | | | | | | | | | | | | | | | | | | | | | | | | | | | | | | | | | | | | | | | | | | | | | | | | | | | | | | | | | | | | | | | | | | |
2012 | | | $ | 13.12 | | | | $ | 0.07 | | | | $ | 1.32 | | | | $ | 1.39 | | | | $ | (0.12 | ) | | | | — | | | | | — | | | | $ | (0.12 | ) | | | $ | 0.00 | (c) | | | $ | 14.39 | | | | | 10.6 | % | | | $ | 1,103 | | | | | 0.51 | % | | | | 2.86 | % | | | | 2.75 | % | | | | 20 | % |
2011 | | | | 13.28 | | | | | (0.05 | ) | | | | (0.11 | ) | | | | (0.16 | ) | | | | — | | | | | — | | | | | — | | | | | — | | | | | 0.00 | (c) | | | | 13.12 | | | | | (1.2 | ) | | | | 600 | | | | | (0.41 | ) | | | | 2.75 | | | | | 2.75 | (d) | | | | 45 | |
2010 | | | | 11.86 | | | | | (0.11 | ) | | | | 1.53 | | | | | 1.42 | | | | | — | | | | | — | | | | | — | | | | | — | | | | | — | | | | | 13.28 | | | | | 12.0 | | | | | 424 | | | | | (0.90 | ) | | | | 2.87 | | | | | 2.75 | | | | | 42 | |
2009 | | | | 9.15 | | | | | (0.09 | ) | | | | 2.80 | | | | | 2.71 | | | | | — | | | | | — | | | | | — | | | | | — | | | | | 0.00 | (c) | | | | 11.86 | | | | | 29.6 | | | | | 300 | | | | | (0.82 | ) | | | | 2.88 | | | | | 2.76 | | | | | 76 | |
2008 | | | | 13.91 | | | | | (0.06 | ) | | | | (4.70 | ) | | | | (4.76 | ) | | | | — | | | | $ | (0.00 | )(c) | | | | — | | | | $ | (0.00 | )(c) | | | | 0.00 | (c) | | | | 9.15 | | | | | (34.2 | ) | | | | 64 | | | | | (0.50 | ) | | | | 2.77 | | | | | 2.75 | | | | | 90 | |
Class I | | | | | | | | | | | | | | | | | | | | | | | | | | | | | | | | | | | | | | | | | | | | | | | | | | | | | | | | | | | | | | | | | | | | | | | | | | | | | | | | |
2012 | | | $ | 13.76 | | | | $ | 0.22 | | | | $ | 1.40 | | | | $ | 1.62 | | | | $ | (0.23 | ) | | | | — | | | | | — | | | | $ | (0.23 | ) | | | $ | 0.00 | (c) | | | $ | 15.15 | | | | | 11.8 | % | | | $ | 2,913 | | | | | 1.50 | % | | | | 1.86 | % | | | | 1.75 | % | | | | 20 | % |
2011 | | | | 13.87 | | | | | 0.08 | | | | | (0.11 | ) | | | | (0.03 | ) | | | | (0.08 | ) | | | | — | | | | | — | | | | | (0.08 | ) | | | | 0.00 | (c) | | | | 13.76 | | | | | (0.2 | ) | | | | 1,800 | | | | | 0.57 | | | | | 1.75 | | | | | 1.75 | (d) | | | | 45 | |
2010 | | | | 12.26 | | | | | 0.01 | | | | | 1.60 | | | | | 1.61 | | | | | — | | | | | — | | | | | — | | | | | — | | | | | 0.00 | (c) | | | | 13.87 | | | | | 13.1 | | | | | 1,575 | | | | | 0.11 | | | | | 1.87 | | | | | 1.75 | | | | | 42 | |
2009 | | | | 9.41 | | | | | 0.03 | | | | | 2.87 | | | | | 2.90 | | | | | (0.05 | ) | | | | — | | | | $ | (0.00 | )(c) | | | | (0.05 | ) | | | | 0.00 | (c) | | | | 12.26 | | | | | 30.9 | | | | | 844 | | | | | 0.28 | | | | | 1.88 | | | | | 1.76 | | | | | 76 | |
2008 | | | | 14.23 | | | | | 0.06 | | | | | (4.83 | ) | | | | (4.77 | ) | | | | (0.05 | ) | | | $ | (0.00 | )(c) | | | | — | | | | | (0.05 | ) | | | | 0.00 | (c) | | | | 9.41 | | | | | (33.5 | ) | | | | 665 | | | | | 0.52 | | | | | 1.77 | | | | | 1.75 | | | | | 90 | |
| † | | Total return represents aggregate total return of a hypothetical $1,000 investment at the beginning of the period and sold at the end of the period including reinvestment of distributions and does not reflect applicable sales charges. |
| (a) | | Per share amounts have been calculated using the average shares outstanding method. |
| (b) | | The Fund also incurred tax expense during the year ended December 31, 2009. If tax expense had not been incurred, the ratios of operating expenses to average net assets would have been 2.00% (Class AAA and Class A), 2.75% (Class C), and 1.75% (Class I), respectively. For the years ended December 31, 2012, 2011, 2010 and 2008, there were no tax expenses incurred by the Fund. |
| (c) | | Amount represents less than $0.005 per share. |
| (d) | | Under an expense deferral agreement with the Adviser, the Adviser recovered from the Fund $13,570 in the year ended December 31, 2011, representing previously reimbursed expenses from the Adviser. Had such payment not been made, the expense ratio would have been 1.95% (Class AAA and Class A) 2.70% (Class C), and 1.70% (Class I). |
See accompanying notes to financial statements.
10
The Gabelli Dividend Growth Fund
Notes to Financial Statements
1. Organization. The Gabelli Dividend Growth Fund was organized on May 13, 1999 as a Delaware statutory trust. The Fund is a diversified open-end management investment company registered under the Investment Company Act of 1940, as amended (the “1940 Act”). The Fund commenced operations on August 26, 1999.
2. Significant Accounting Policies. The Fund’s financial statements are prepared in accordance with U.S. Generally Accepted Accounting Principles (“GAAP”), which may require the use of management estimates and assumptions. Actual results could differ from those estimates. The following is a summary of significant accounting policies followed by the Fund in the preparation of its financial statements.
Security Valuation. Portfolio securities listed or traded on a nationally recognized securities exchange or traded in the U.S. over-the-counter market for which market quotations are readily available are valued at the last quoted sale price or a market’s official closing price as of the close of business on the day the securities are being valued. If there were no sales that day, the security is valued at the average of the closing bid and asked prices or, if there were no asked prices quoted on that day, then the security is valued at the closing bid price on that day. If no bid or asked prices are quoted on such day, the security is valued at the most recently available price or, if the Board of Trustees (the “Board”) so determines, by such other method as the Board shall determine in good faith to reflect its fair market value. Portfolio securities traded on more than one national securities exchange or market are valued according to the broadest and most representative market, as determined by the Adviser.
Portfolio securities primarily traded on a foreign market are generally valued at the preceding closing values of such securities on the relevant market, but may be fair valued pursuant to procedures established by the Board if market conditions change significantly after the close of the foreign market, but prior to the close of business on the day the securities are being valued. Debt instruments with remaining maturities of sixty days or less that are not credit impaired are valued at amortized cost, unless the Board determines such amount does not reflect the securities’ fair value, in which case these securities will be fair valued as determined by the Board. Debt instruments having a maturity greater than sixty days for which market quotations are readily available are valued at the average of the latest bid and asked prices. If there were no asked prices quoted on such day, the security is valued using the closing bid price. U.S. government obligations with maturities greater than sixty days are normally valued using a model that incorporates market observable data such as reported sales of similar securities, broker quotes, yields, bids, offers, and reference data. Certain securities are valued principally using dealer quotations.
Securities and assets for which market quotations are not readily available are fair valued as determined by the Board. Fair valuation methodologies and procedures may include, but are not limited to: analysis and review of available financial and non-financial information about the company; comparisons with the valuation and changes in valuation of similar securities, including a comparison of foreign securities with the equivalent U.S. dollar value ADR securities at the close of the U.S. exchange; and evaluation of any other information that could be indicative of the value of the security.
11
The Gabelli Dividend Growth Fund
Notes to Financial Statements (Continued)
The inputs and valuation techniques used to measure fair value of the Fund’s investments are summarized into three levels as described in the hierarchy below:
| | • | | Level 1 — quoted prices in active markets for identical securities; |
| | • | | Level 2 — other significant observable inputs (including quoted prices for similar securities, interest rates, prepayment speeds, credit risk, etc.); and |
| | • | | Level 3 — significant unobservable inputs (including the Fund’s determinations as to the fair value of investments). |
A financial instrument’s level within the fair value hierarchy is based on the lowest level of any input both individually and in the aggregate that is significant to the fair value measurement. The inputs or methodology used for valuing securities are not necessarily an indication of the risk associated with investing in those securities. The summary of the Fund’s investments in securities by inputs used to value the Fund’s investments as of December 31, 2012 is as follows:
| | |
Valuation Inputs* | | Investments
in Securities
(Market Value)
Assets |
Level 1 - Quoted Prices | | $23,920,328 |
| | |
Total | | $23,920,328 |
| | |
| * | Portfolio holdings designated in Level 1 are disclosed individually in the Schedule of Investments (“SOI”). Please refer to the SOI for the industry classifications of these portfolio holdings. |
The Fund did not have transfers between Level 1 and Level 2 during the year ended December 31, 2012. The Fund’s policy is to recognize transfers among Levels as of the beginning of the reporting period.
There were no Level 3 investments held at December 31, 2012 or December 31, 2011.
Additional Information to Evaluate Qualitative Information.
General. The Fund uses recognized industry pricing services – approved by the Board and unaffiliated with the Adviser – to value most of its securities, and uses broker quotes provided by market makers of securities not valued by these and other recognized pricing sources. Several different pricing feeds are received to value domestic equity securities, international equity securities, preferred equity securities, and fixed income securities. The data within these feeds is ultimately sourced from major stock exchanges and trading systems where these securities trade. The prices supplied by external sources are checked by obtaining quotations or actual transaction prices from market participants. If a price obtained from the pricing source is deemed unreliable, prices will be sought from another pricing service or from a broker/dealer that trades that security or similar securities.
Fair Valuation. Fair valued securities may be common and preferred equities, warrants, options, rights, and fixed income obligations. Where appropriate, Level 3 securities are those for which market quotations are not available, such as securities not traded for several days, or for which current bids are not available, or which are restricted as to transfer. Among the factors to be considered to fair value a security are recent prices of comparable securities that are publicly traded, reliable prices of securities not publicly traded, the use of valuation models, current analyst reports, valuing the income or cash flow of the issuer, or cost if the preceding factors do not apply. The circumstances of Level 3 securities are frequently monitored to determine if fair valuation measures continue to apply.
12
The Gabelli Dividend Growth Fund
Notes to Financial Statements (Continued)
The Adviser reports quarterly to the Board the results of the application of fair valuation policies and procedures. These include back testing the prices realized in subsequent trades of these fair valued securities to fair values previously recognized.
Foreign Securities. The Fund may directly purchase securities of foreign issuers. Investing in securities of foreign issuers involves special risks not typically associated with investing in securities of U.S. issuers. The risks include possible revaluation of currencies, the inability to repatriate funds, less complete financial information about companies, and possible future adverse political and economic developments. Moreover, securities of many foreign issuers and their markets may be less liquid and their prices more volatile than securities of comparable U.S. issuers.
Foreign Taxes. The Fund may be subject to foreign taxes on income, gains on investments, or currency repatriation, a portion of which may be recoverable. The Fund will accrue such taxes and recoveries as applicable, based upon its current interpretation of tax rules and regulations that exist in the markets in which it invests.
Securities Transactions and Investment Income. Securities transactions are accounted for on the trade date with realized gain or loss on investments determined by using the identified cost method. Interest income (including amortization of premium and accretion of discount) is recorded on the accrual basis. Premiums and discounts on debt securities are amortized using the effective yield to maturity method. Dividend income is recorded on the ex-dividend date, except for certain dividends from foreign securities that are recorded as soon after the ex-dividend date as the Fund becomes aware of such dividends.
Determination of Net Asset Value and Calculation of Expenses. Certain administrative expenses are common to, and allocated among, various affiliated funds. Such allocations are made on the basis of each fund’s average net assets or other criteria directly affecting the expenses as determined by the Adviser pursuant to procedures established by the Board.
In calculating the NAV per share of each class, investment income, realized and unrealized gains and losses, redemption fees, and expenses other than class specific expenses are allocated daily to each class of shares based upon the proportion of net assets of each class at the beginning of each day. Distribution expenses are borne solely by the class incurring the expense.
Custodian Fee Credits and Interest Expense. When cash balances are maintained in the custody account, the Fund receives credits which are used to offset custodian fees. The gross expenses paid under the custody arrangement are included in custodian fees in the Statement of Operations with the corresponding expense offset, if any, shown as “Custodian fee credits.” When cash balances are overdrawn, the Fund is charged an overdraft fee equal to 2.00% above the federal funds rate on outstanding balances. This amount, if any, would be included in the Statement of Operations.
Distributions to Shareholders. Distributions to shareholders are recorded on the ex-dividend date. Distributions to shareholders are based on income and capital gains as determined in accordance with federal income tax regulations, which may differ from income and capital gains as determined under GAAP. These differences are primarily due to differing treatments of income and gains on various investment securities held by the Fund, timing differences, and differing characterizations of distributions made by the Fund. These book/ tax differences are either temporary or permanent in nature. To the extent these differences are permanent, adjustments are made to the appropriate capital accounts in the period when the differences arise. Permanent differences are
13
The Gabelli Dividend Growth Fund
Notes to Financial Statements (Continued)
primarily due to recharacterization of distributions. These reclassifications have no impact on the NAV of the Fund. For the year ended December 31, 2012, reclassifications were made to increase undistributed net investment income by $42,382, with an offsetting adjustment to paid-in capital.
The tax character of distributions paid during the years ended December 31, 2012 and December 31, 2011 was $296,673 and $78,601, respectively, of ordinary income.
Provision for Income Taxes. The Fund intends to continue to qualify as a regulated investment company under Subchapter M of the Internal Revenue Code of 1986, as amended (the “Code”). It is the policy of the Fund to comply with the requirements of the Code applicable to regulated investment companies and to distribute substantially all of its net investment company taxable income and net capital gains. Therefore, no provision for federal income taxes is required.
As of December 31, 2012, the components of accumulated earnings/losses on a tax basis were as follows:
| | | | |
Accumulated capital loss carryforwards | | $ | (163,448 | ) |
Net unrealized appreciation on investments | | | 4,195,894 | |
| | | | |
Total | | $ | 4,032,446 | |
| | | | |
At December 31, 2012, the Fund had net capital loss carryforwards for federal income tax purposes which are available to reduce future required distributions of net capital gains to shareholders. Under the Regulated Investment Company Modernization Act of 2010, the Fund will be permitted to carry forward for an unlimited period capital losses incurred in years beginning after December 22, 2010. In addition, these losses must be utilized prior to the losses incurred in pre-enactment taxable years. As a result of the rule, pre-enactment capital loss carryforwards may have an increased likelihood of expiring unused. Additionally, post enactment capital losses that are carried forward will retain their character as either short-term or long-term capital losses rather than being considered all short-term as under previous law.
| | | | |
Capital Loss Carryforward Available through 2017 | | | $163,448 | |
During the year ended December 31, 2012, the Fund utilized capital loss carryforwards of $911,036.
At December 31, 2012, the temporary differences between book basis and tax basis unrealized appreciation/ depreciation on investments were primarily due to deferral of losses from wash sales for tax purposes and adjustment for partnership income.
The following summarizes the tax cost of investments and the related unrealized appreciation at December 31, 2012:
| | | | | | | | |
| | | Cost | | Gross
Unrealized
Appreciation | | Gross
Unrealized
Depreciation | | Net Unrealized
Appreciation |
Investments | | $19,724,434 | | $4,574,957 | | $(379,063) | | $4,195,894 |
The Fund is required to evaluate tax positions taken or expected to be taken in the course of preparing the Fund’s tax returns to determine whether the tax positions are “more-likely-than-not” of being sustained by the applicable tax authority. Income tax and related interest and penalties would be recognized by the Fund as tax expense in the Statement of Operations if the tax positions were deemed not to meet the more-likely-than-not threshold. For the year ended December 31, 2012, the Fund did not incur any income tax, interest, or penalties. As of December 31, 2012, the Adviser has reviewed all open tax years and concluded that there was no impact
14
The Gabelli Dividend Growth Fund
Notes to Financial Statements (Continued)
to the Fund’s net assets or results of operations. Tax years ended December 31, 2009 through December 31, 2012 remain subject to examination by the Internal Revenue Service and state taxing authorities. On an ongoing basis, the Adviser will monitor the Fund’s tax positions to determine if adjustments to this conclusion are necessary.
3. Investment Advisory Agreement and Other Transactions. The Fund has entered into an investment advisory agreement (the “Advisory Agreement”) with the Adviser which provides that the Fund will pay the Adviser a fee, computed daily and paid monthly, at the annual rate of 1.00% of the value of its average daily net assets. In accordance with the Advisory Agreement, the Adviser provides a continuous investment program for the Fund’s portfolio, oversees the administration of all aspects of the Fund’s business and affairs, and pays the compensation of all Officers and Trustees of the Fund who are affiliated persons of the Adviser.
The Adviser has contractually agreed to waive its advisory fee and/or reimburse expenses of the Fund to the extent necessary to maintain the annualized total operating expenses of the Fund (exclusive of brokerage fees, interest, taxes, and extraordinary expenses) until at least May 1, 2013, at no more than 2.00%, 2.00%, 2.75%, and 1.75%, respectively, of Class AAA, Class A, Class C, and Class I Shares’ average daily net assets. In addition, the Fund has agreed, during the two year period following any waiver or reimbursement by the Adviser, to repay such amount to the extent, that after giving the effect to the repayment, such adjusted annualized total operating expenses of the Fund would not exceed 2.00%, 2.00%, 2.75%, and 1.75% of the value of the Fund’s average daily net assets for Class AAA, Class A, Class C, and Class I, respectively. For the year ended December 31, 2012, the Adviser reimbursed the Fund $27,126. The Fund is obliged to repay the Adviser for a period of two years following the year in which the Adviser reimbursed the Fund only to the extent that the operating expenses of the Fund, after giving effect to the recovery by the Adviser, would not exceed the foregoing limitations. At December 31, 2012, the cumulative amount which the Fund may repay the Adviser is $27,126, which is available for recovery by December 31, 2014.
The Fund pays each Trustee who is not considered an affiliated person an annual retainer of $3,000 plus $500 for each Board meeting attended, and they are reimbursed for any out of pocket expenses incurred in attending meetings. All Board committee members receive $500 per meeting attended and the Chairman of the Audit Committee and the Lead Trustee each receive a $1,000 annual fee. A Trustee may receive a single meeting fee, allocated among the participating funds, for participation in certain meetings held on behalf of multiple funds. Trustees who are directors or employees of the Adviser or an affiliated company receive no compensation or expense reimbursement from the Fund.
4. Distribution Plan. The Fund’s Board has adopted a distribution plan (the “Plan”) for each class of shares, except for Class I Shares, pursuant to Rule 12b-1 under the 1940 Act. Under the Class AAA, Class A, and Class C Share Plans, payments are authorized to G.distributors, LLC (the “Distributor”), an affiliate of the Fund at annual rates of 0.25%, 0.25%, and 1.00%, respectively, of the average daily net assets of those classes, the annual limitations under each Plan. Such payments are accrued daily and paid monthly.
5. Portfolio Securities. Purchases and sales of securities during the year ended December 31, 2012, other than short-term securities and U.S. Government obligations, aggregated $4,590,298 and $7,607,536, respectively.
15
The Gabelli Dividend Growth Fund
Notes to Financial Statements (Continued)
6. Transactions with Affiliates. During the year ended December 31, 2012, the Fund paid brokerage commissions on security trades of $5,439 to Gabelli & Company, Inc., an affiliate of the Fund. Additionally the Distributor retained a total of $2,377 from investors representing commissions (sales charges and underwriting fees) on sales and redemptions of Fund shares.
The cost of calculating the Fund’s NAV per share is a Fund expense pursuant to the Advisory Agreement. A reimbursement was not sought by the Adviser during the year ended December 31, 2012.
7. Line of Credit. The Fund participates in an unsecured line of credit of up to $75,000,000 under which it may borrow up to 10% of its net assets from the custodian for temporary borrowing purposes. Borrowings under this arrangement bear interest at the higher of the sum of the overnight LIBOR rate plus 100 basis points or the sum of the federal funds rate plus 100 basis points at the time of borrowing. This amount, if any, would be included in “interest expense” in the Statement of Operations. At December 31, 2012, there were no borrowings outstanding under the line of credit.
The average daily amount of borrowings outstanding under the line of credit during the year ended December 31, 2012 was $31,281 with a weighted average interest rate of 1.25%. The maximum amount borrowed at any time during the year ended December 31, 2012 was $1,389,000.
8. Shares of Beneficial Interest. The Fund offers four classes of shares – Class AAA Shares, Class A Shares, Class C Shares, and Class I Shares. Class AAA Shares are offered without a sales charge only to investors who acquire them directly from the Distributor, through selected broker/dealers, or the transfer agent. Class I Shares are offered without a sales charge, solely to certain institutions, directly through the Distributor or brokers that have entered into selling agreements specifically with respect to Class I Shares. Class A Shares are subject to a maximum front-end sales charge of 5.75%. Class C Shares are subject to a 1.00% contingent deferred sales charge for one year after purchase. Class B Shares were fully redeemed and closed on January 4, 2012.
The Fund imposes a redemption fee of 2.00% on all classes of shares that are redeemed or exchanged on or before the seventh day after the date of a purchase. The redemption fee is deducted from the proceeds otherwise payable to the redeeming shareholders and is retained by the Fund as an increase in paid-in capital. The redemption fees retained by the Fund during the years ended December 31, 2012 and December 31, 2011 amounted to $576 and $307, respectively.
16
The Gabelli Dividend Growth Fund
Notes to Financial Statements (Continued)
Transactions in shares of beneficial interest were as follows:
| | | | | | | | | | | | | | | | |
| | | Year Ended
December 31, 2012 | | | Year Ended
December 31, 2011 | |
| | | Shares | | | Amount | | | Shares | | | Amount | |
Class AAA | | | | | | | | | | | | | | | | |
Shares sold | | | 184,718 | | | $ | 2,728,423 | | | | 160,795 | | | $ | 2,250,475 | |
Shares issued upon reinvestment of distributions | | | 14,066 | | | | 211,264 | | | | 4,324 | | | | 58,801 | |
Shares redeemed | | | (537,129 | ) | | | (7,849,022 | ) | | | (413,953 | ) | | | (5,731,098 | ) |
| | | | | | | | | | | | | | | | |
Net decrease | | | (338,345 | ) | | $ | (4,909,335 | ) | | | (248,834 | ) | | $ | (3,421,822 | ) |
| | | | | | | | | | | | | | | | |
Class A | | | | | | | | | | | | | | | | |
Shares sold | | | 97,607 | | | $ | 1,484,167 | | | | 59,137 | | | $ | 815,899 | |
Shares issued upon reinvestment of distributions | | | 1,192 | | | | 17,885 | | | | 386 | | | | 5,253 | |
Shares redeemed | | | (110,449 | ) | | | (1,644,522 | ) | | | (37,058 | ) | | | (509,432 | ) |
| | | | | | | | | | | | | | | | |
Net increase/(decrease) | | | (11,650 | ) | | $ | (142,470 | ) | | | 22,465 | | | $ | 311,720 | |
| | | | | | | | | | | | | | | | |
Class B* | | | | | | | | | | | | | | | | |
Shares redeemed | | | (687 | ) | | $ | (9,140 | ) | | | (5,215 | ) | | $ | (65,497 | ) |
| | | | | | | | | | | | | | | | |
Net decrease | | | (687 | ) | | $ | (9,140 | ) | | | (5,215 | ) | | $ | (65,497 | ) |
| | | | | | | | | | | | | | | | |
Class C | | | | | | | | | | | | | | | | |
Shares sold | | | 45,507 | | | $ | 647,303 | | | | 21,063 | | | $ | 272,995 | |
Shares issued upon reinvestment of distributions | | | 589 | | | | 8,508 | | | | — | | | | — | |
Shares redeemed | | | (15,181 | ) | | | (217,954 | ) | | | (7,274 | ) | | | (95,997 | ) |
| | | | | | | | | | | | | | | | |
Net increase | | | 30,915 | | | $ | 437,857 | | | | 13,789 | | | $ | 176,998 | |
| | | | | | | | | | | | | | | | |
Class I | | | | | | | | | | | | | | | | |
Shares sold | | | 87,759 | | | $ | 1,286,382 | | | | 51,826 | | | $ | 738,004 | |
Shares issued upon reinvestment of distributions | | | 1,805 | | | | 27,214 | | | | 721 | | | | 9,847 | |
Shares redeemed | | | (28,161 | ) | | | (418,263 | ) | | | (35,277 | ) | | | (493,869 | ) |
| | | | | | | | | | | | | | | | |
Net increase | | | 61,403 | | | $ | 895,333 | | | | 17,270 | | | $ | 253,982 | |
| | | | | | | | | | | | | | | | |
| * | Class B shares were fully redeemed and closed on January 4, 2012. |
9. Indemnifications. The Fund enters into contracts that contain a variety of indemnifications. The Fund’s maximum exposure under these arrangements is unknown. However, the Fund has not had prior claims or losses pursuant to these contracts. Management has reviewed the Fund’s existing contracts and expects the risk of loss to be remote.
10. Other Matters. On April 24, 2008, the Adviser entered into a settlement with the SEC to resolve an inquiry regarding prior frequent trading in shares of the GAMCO Global Growth Fund (the “Global Growth Fund”) by one investor who was banned from the Global Growth Fund in August 2002. Under the terms of the settlement, the Adviser, without admitting or denying the SEC’s findings and allegations, paid $16 million (which included a $5 million civil monetary penalty). On the same day, the SEC filed a civil action in the U.S. District Court for the Southern District of New York against the Executive Vice President and Chief Operating Officer of the Adviser, alleging violations of certain federal securities laws arising from the same matter. The officer, who also is an officer of the Global Growth Fund and other funds in the Gabelli/GAMCO complex, including this Fund, denies the allegations and is continuing in his positions with the Adviser and the funds. The settlement by the Adviser did not have, and the resolution of the action against the officer is not expected to have, a material adverse impact on the Adviser or its ability to fulfill its obligations under the Advisory Agreement.
17
The Gabelli Dividend Growth Fund
Notes to Financial Statements (Continued)
11. Subsequent Events. Management has evaluated the impact on the Fund of all subsequent events occurring through the date the financial statements were issued and has determined that there were no subsequent events requiring recognition or disclosure in the financial statements.
18
The Gabelli Dividend Growth Fund
Report of Independent Registered Public Accounting Firm
To the Shareholders and Board of Trustees of
The Gabelli Dividend Growth Fund
We have audited the accompanying statement of assets and liabilities, including the schedule of investments, of The Gabelli Dividend Growth Fund (the “Fund”), as of December 31, 2012, and the related statement of operations for the year then ended, the statements of changes in net assets for each of the two years in the period then ended, and the financial highlights for each of the five years in the period then ended. These financial statements and financial highlights are the responsibility of the Fund’s management. Our responsibility is to express an opinion on these financial statements and financial highlights based on our audits.
We conducted our audits in accordance with the standards of the Public Company Accounting Oversight Board (United States). Those standards require that we plan and perform the audit to obtain reasonable assurance about whether the financial statements and financial highlights are free of material misstatement. We were not engaged to perform an audit of the Fund’s internal control over financial reporting. Our audits included consideration of internal control over financial reporting as a basis for designing audit procedures that are appropriate in the circumstances, but not for the purpose of expressing an opinion on the effectiveness of the Fund’s internal control over financial reporting. Accordingly, we express no such opinion. An audit also includes examining, on a test basis, evidence supporting the amounts and disclosures in the financial statements and financial highlights, assessing the accounting principles used and significant estimates made by management, and evaluating the overall financial statement presentation. Our procedures included confirmation of securities owned as of December 31, 2012, by correspondence with the Fund’s custodian. We believe that our audits provide a reasonable basis for our opinion.
In our opinion, the financial statements and financial highlights referred to above present fairly, in all material respects, the financial position of the Fund at December 31, 2012, the results of its operations for the year then ended, the changes in its net assets for each of the two years in the period then ended, and its financial highlights for each of the five years in the period then ended, in conformity with U.S. generally accepted accounting principles.

New York, New York
February 28, 2013
19
The Gabelli Dividend Growth Fund
Additional Fund Information (Unaudited)
The business and affairs of the Fund are managed under the direction of the Fund’s Board of Trustees. Information pertaining to the Trustees and officers of the Fund is set forth below. The Fund’s Statement of Additional Information includes additional information about the Fund’s Trustees and is available without charge, upon request, by calling 800-GABELLI (800-422-3554) or by writing to The Gabelli Dividend Growth Fund at One Corporate Center, Rye, NY 10580-1422.
| | | | | | | | |
Name, Position(s) Address1 and Age | | Term of Office and Length of Time Served2 | | Number of Funds in Fund Complex Overseen by Trustee | | Principal Occupation(s) During Past Five Years | | Other Directorships Held by Trustee4 |
| | | | |
| INTERESTED TRUSTEES3: | | | | | | | | |
| | | | |
Mario J. Gabelli, CFA Trustee Age: 70 | | Since 1999 | | 27 | | Chairman, Chief Executive Officer, and Chief Investment Officer–Value Portfolios of GAMCO Investors, Inc. and Chief Investment Officer– Value Portfolios of Gabelli Funds, LLC, and GAMCO Asset Management Inc.; Director/ Trustee or Chief Investment Officer of other registered investment companies in the Gabelli/GAMCO Funds Complex; Chief Executive Officer of GGCP, Inc. | | Director of Morgan Group Holdings, Inc. (holding company); Chairman of the Board and Chief Executive Officer of LICT Corp. (multimedia and communication services company); Director of CIBL, Inc. (broadcasting and wireless communications); Director of RLJ Acquisition Inc. (blank check company) (2011- 2012) |
| | | | |
| INDEPENDENT TRUSTEES5: | | | | | | | | |
| | | | |
Anthony J. Colavita Trustee Age: 77 | | Since 1999 | | 35 | | President of the law firm of Anthony J. Colavita, P.C. | | — |
| | | | |
Vincent D. Enright Trustee Age: 69 | | Since 1999 | | 17 | | Former Senior Vice President and Chief Financial Officer of KeySpan Corporation (public utility) (1994-1998) | | Director of Echo Therapeutics, Inc. (therapeutics and diagnostics). Director of the LGL Group, Inc. (diversified manufacturing) and until September 2006 Director of Aphton Corporation (pharmaceuticals) |
| | | | |
Mary E. Hauck Trustee Age: 70 | | Since 2000 | | 3 | | Retired Senior Manager of the Gabelli O’Connor Fixed Income Mutual Funds Management Company | | — |
| | | | |
Kuni Nakamura Trustee Age: 44 | | Since 2009 | | 13 | | President of Advanced Polymer, Inc. (chemical wholesale company) | | — |
| | | | |
Werner J. Roeder, MD Trustee Age: 72 | | Since 1999 | | 22 | | Medical Director of Lawrence Hospital and practicing private physician | | — |
20
The Gabelli Dividend Growth Fund
Additional Fund Information (Continued) (Unaudited)
| | | | |
Name, Position(s) Address1 and Age | | Term of Office and Length of Time Served2 | | Principal Occupation(s) During Past Five Years |
OFFICERS: | | | | |
Bruce N. Alpert President and Acting Chief Compliance Officer Age: 61 | | Since 2003 Since November 2011 | | Executive Vice President and Chief Operating Officer of Gabelli Funds, LLC since 1988; Officer of all of the registered investment companies in the Gabelli/GAMCO Funds Complex; Director of Teton Advisors, Inc. 1998-2012; Chairman of Teton Advisors, Inc. 2008-2010; President of Teton Advisors, Inc. 1998-2008; Senior Vice President of GAMCO Investors, Inc. since 2008 |
| | |
Agnes Mullady Secretary and Treasurer Age: 54 | | Since 2006 | | President and Chief Operating Officer of the Open-End Fund Division of Gabelli Funds, LLC since September 2010; Senior Vice President of GAMCO Investors, Inc. since 2009; Vice President of Gabelli Funds, LLC since 2007; Officer of all of the registered investment companies in the Gabelli/GAMCO Funds Complex |
| 1 | Address: One Corporate Center, Rye, NY 10580-1422, unless otherwise noted. |
| 2 | Each Trustee will hold office for an indefinite term until the earliest of (i) the next meeting of shareholders, if any, called for the purpose of considering the election or re-election of such Trustee and until the election and qualification of his or her successor, if any, elected at such meeting, or (ii) the date a Trustee resigns or retires, or a Trustee is removed by the Board of Trustees or shareholders, in accordance with the Fund’s By-Laws and Agreement and Declaration of Trust. Each officer will hold office for an indefinite term until the date he or she resigns or retires or until his or her successor is elected and qualified. |
| 3 | “Interested person” of the Fund as defined in the 1940 Act. Mr. Gabelli is considered an “interested person” because of his affiliation with Gabelli Funds, LLC which acts as the Fund’s investment adviser. |
| 4 | This column includes only directorships of companies required to report to the SEC under the Securities Exchange Act of 1934, as amended, i.e., public companies, or other investment companies registered under the 1940 Act. |
| 5 | Trustees who are not interested persons are considered “Independent” Trustees. |
2012 TAX NOTICE TO SHAREHOLDERS (Unaudited)
For the year ended December 31, 2012, the Fund paid to shareholders ordinary income distributions (comprised of net investment income) totaling $0.186, $0.194, $0.120, and $0.226 per share for Class AAA, Class A, Class C, and Class I, respectively. For the year ended December 31, 2012, 100% of the ordinary income distribution qualifies for the dividends received deduction available to corporations. The Fund designates 100% of the ordinary income distribution as qualified dividend income pursuant to the Jobs and Growth Tax Relief Reconciliation Act of 2003. The Fund designates 0.11% of the ordinary income distribution as qualified interest income pursuant to the Tax Relief, Unemployment Reauthorization, and Job Creation Act of 2010.
U.S. Government Income:
The percentage of the ordinary income distribution paid by the Fund during the year ended December 31, 2012 which was derived from U.S. Treasury securities was 0.11%. Such income is exempt from state and local tax in all states. However, many states, including New York and California, allow a tax exemption for a portion of the income earned only if a mutual fund has invested at least 50% of its assets at the end of each quarter of the Fund’s fiscal year in U.S. Government securities. The Gabelli Dividend Growth Fund did not meet this strict requirement in 2012. Due to the diversity in state and local tax law, it is recommended that you consult your personal tax adviser as to the applicability of the information provided to your specific situation.
All designations are based on financial information available as of the date of this annual report and, accordingly, are subject to change. For each item, it is the intention of the Fund to designate the maximum amount permitted under the Internal Revenue Code and the regulations thereunder.
21
Gabelli/GAMCO Funds and Your Personal Privacy
Who are we?
The Gabelli/GAMCO Funds are investment companies registered with the Securities and Exchange Commission under the Investment Company Act of 1940. We are managed by Gabelli Funds, LLC, which is affiliated with GAMCO Investors, Inc. GAMCO Investors, Inc. is a publicly held company that has subsidiaries that provide investment advisory or brokerage services for a variety of clients.
What kind of non-public information do we collect about you if you become a fund shareholder?
If you apply to open an account directly with us, you will be giving us some non-public information about yourself. The non-public information we collect about you is:
| | • | | Information you give us on your application form. This could include your name, address, telephone number, social security number, bank account number, and other information. | |
| | • | | Information about your transactions with us, any transactions with our affiliates, and transactions with the entities we hire to provide services to you. This would include information about the shares that you buy or redeem. If we hire someone else to provide services — like a transfer agent — we will also have information about the transactions that you conduct through them. | |
What information do we disclose and to whom do we disclose it?
We do not disclose any non-public personal information about our customers or former customers to anyone other than our affiliates, our service providers who need to know such information, and as otherwise permitted by law. If you want to find out what the law permits, you can read the privacy rules adopted by the Securities and Exchange Commission. They are in volume 17 of the Code of Federal Regulations, Part 248. The Commission often posts information about its regulations on its website, www.sec.gov.
What do we do to protect your personal information?
We restrict access to non-public personal information about you to the people who need to know that information in order to provide services to you or the fund and to ensure that we are complying with the laws governing the securities business. We maintain physical, electronic, and procedural safeguards to keep your personal information confidential.
|
| GABELLI/GAMCO FAMILY OF FUNDS |
Gabelli Asset Fund
Seeks to invest primarily in a diversified portfolio of common stocks selling at significant discounts to their private market value. The Fund’s primary objective is growth of capital.
| | |
(Multiclass) | | Team Managed |
Gabelli Dividend Growth Fund
Seeks to invest at least 80% of its net assets in dividend paying stocks. (Multiclass)
Portfolio Manager: Barbara G. Marcin, CFA
TETON Westwood Equity Fund
Seeks to invest primarily in the common stock of well seasoned companies that have recently reported positive earnings surprises and are trading below Westwood’s proprietary growth rate estimates. The Fund’s primary objective is capital appreciation.
| | |
(Multiclass) | | Team Managed |
Gabelli Focus Five Fund
Seeks to invest up to 50% of its net assets in the equity securities of five companies with the remaining net assets invested in ten to twenty other companies or in short-term high grade investments or cash and cash equivalents.
| | |
(Multiclass) | | Team Managed |
Gabelli Value Fund
Seeks to invest in securities of companies believed to be undervalued. The Fund’s primary objective is long-term capital appreciation.
| | |
(Multiclass) | | Team Managed |
Gabelli Small Cap Growth Fund
Seeks to invest primarily in common stock of smaller companies (market capitalizations at the time of investment of $2 billion or less) believed to have rapid revenue and earnings growth potential. The Fund’s primary objective is capital appreciation. (Multiclass)
Portfolio Manager: Mario J. Gabelli, CFA
TETON Westwood SmallCap Equity Fund
Seeks to invest primarily in smaller capitalization equity securities – market caps of $2.5 billion or less. The Fund’s primary objective is long-term capital appreciation.
(Multiclass) Portfolio Manager: Nicholas F. Galluccio
GAMCO Growth Fund
Seeks to invest primarily in large cap stocks believed to have favorable, yet undervalued, prospects for earnings growth. The Fund’s primary objective is capital appreciation.
(Multiclass) Portfolio Manager: Howard F. Ward, CFA
GAMCO International Growth Fund
Seeks to invest in the equity securities of foreign issuers with long-term capital appreciation potential. The Fund offers investors global diversification.
(Multiclass) Portfolio Manager: Caesar Bryan
GAMCO Global Growth Fund
Seeks capital appreciation through a disciplined investment program focusing on the globalization and interactivity of the world’s marketplace. The Fund invests in companies at the forefront of accelerated growth. The Fund’s primary objective is capital appreciation. (Multiclass)
Team Managed
TETON Westwood Mighty MitesSM Fund
Seeks to invest in micro-cap companies that have market capitalizations of $500 million or less. The Fund’s primary objective is long-term capital appreciation. (Multiclass)
Team Managed
Gabelli Equity Income Fund
Seeks to invest primarily in equity securities with above average market yields. The Fund pays monthly distributions and seeks a high level of total return with an emphasis on income. (Multiclass)
Portfolio Manager: Mario J. Gabelli, CFA
TETON Westwood Balanced Fund
Seeks to invest in a balanced and diversified portfolio of stocks and bonds. The Fund’s primary objective is both capital appreciation and current income. (Multiclass)
Team Managed
TETON Westwood Income Fund
Seeks to provide a high level of current income as well as long-term capital appreciation by investing in income producing equity and fixed income securities. (Multiclass)
Portfolio Manager: Barbara G. Marcin, CFA
GAMCO Vertumnus Fund
Seeks to invest principally in common stock and convertible securities of domestic and foreign companies. The Fund’s primary objective is total return through a combination of current income and capital appreciation. (Multiclass)
Portfolio Manager: Mario J. Gabelli, CFA
GAMCO Global Opportunity Fund
Seeks to invest in common stock of companies which have rapid growth in revenues and earnings and potential for above average capital appreciation or are undervalued. The Fund’s primary objective is capital appreciation. (Multiclass)
Team Managed
Gabelli SRI Green Fund
Seeks to invest in common and preferred stocks meeting guidelines for social responsibility (avoiding defense contractors and manufacturers of alcohol, abortifacients, gaming, and tobacco products) and sustainability (companies engaged in climate change, energy security and independence, natural resource shortages, organic living, and urbanization). The Fund’s primary objective is capital appreciation. (Multiclass)
Team Managed
GAMCO Global Telecommunications Fund
Seeks to invest in telecommunications companies throughout the world – targeting undervalued companies with strong earnings and cash flow dynamics. The Fund’s primary objective is capital appreciation. (Multiclass) Team Managed
Gabelli Gold Fund
Seeks to invest in a global portfolio of equity securities of gold mining and related companies. The Fund’s objective is long-term capital appreciation. Investment in gold stocks is considered speculative and is affected by a variety of worldwide economic, financial, and political factors.
(Multiclass) Portfolio Manager: Caesar Bryan
Gabelli Utilities Fund
Seeks to provide a high level of total return through a combination of capital appreciation and current income.
(Multiclass) Portfolio Manager: Mario J. Gabelli, CFA
Gabelli ABC Fund
Seeks to invest in securities with attractive opportunities for appreciation or investment income. The Fund’s primary objective is total return in various market conditions without excessive risk of capital loss. (No-load) (Multiclass)
Portfolio Manager: Mario J. Gabelli, CFA
Gabelli Enterprise Mergers and Acquisitions Fund
Seeks to invest in securities believed to be likely acquisition targets within 12–18 months or in arbitrage transactions of publicly announced mergers or other corporate reorganizations. The Fund’s primary objective is capital appreciation. (Multiclass)
Portfolio Manager: Mario J. Gabelli, CFA
GAMCO Mathers Fund
Seeks long-term capital appreciation in various market conditions without excessive risk of capital loss. (No-load)
Portfolio Manager: Henry Van der Eb, CFA
Comstock Capital Value Fund
Seeks capital appreciation and current income. The Fund may use either long or short positions to achieve its objective.
(Multiclass) Portfolio Managers: Charles L. Minter
Martin Weiner, CFA
TETON Westwood Intermediate Bond Fund
Seeks to invest in a diversified portfolio of bonds with various maturities. The Fund’s primary objective is total return.
(Multiclass) Portfolio Manager: Mark R. Freeman, CFA
| | |
| CASH MANAGEMENT-MONEY MARKET | | |
Gabelli U.S. Treasury Money Market Fund
Seeks to invest exclusively in short-term U.S. Treasury securities. The Fund’s primary objective is to provide high current income consistent with the preservation of principal and liquidity. (No-load)
Co-Portfolio Managers: Judith A. Raneri
Ronald S. Eaker
An investment in the above Money Market Fund is neither insured nor guaranteed by the Federal Deposit Insurance Corporation or any government agency. Although the Fund seeks to preserve the value of your investment at $1.00 per share, it is possible to lose money by investing in the Fund.
The Funds may invest in foreign securities which involve risks not ordinarily associated with investments in domestic issues, including currency fluctuation, economic, and political risks.
To receive a prospectus, call 800-GABELLI (800-422-3554). Investors should carefully consider the investment objectives, risks, charges, and expenses of a fund before investing. The prospectus contains more information about these and other matters and should be read carefully before investing. Distributed by G.distributors, LLC, One Corporate Center, Rye, NY 10580.
THE GABELLI DIVIDEND GROWTH FUND
One Corporate Center
Rye, New York 10580-1422
| | |
t f e | | 800-GABELLI (800-422-3554) 914-921-5118 info@gabelli.com |
GABELLI.COM
Net Asset Value per share available daily
by calling 800-GABELLI after 7:00 P.M.
| | |
BOARD OF TRUSTEES Mario J. Gabelli, CFA Chairman and Chief Executive Officer, GAMCO Investors, Inc. Anthony J. Colavita President, Anthony J. Colavita, P.C. Vincent D. Enright Former Senior Vice, President and Chief Financial Officer, KeySpan Corp. Mary E. Hauck Former Senior Portfolio Manager, Gabelli-O’ Connor Fixed Income Mutual Fund Management Co. Kuni Nakamura President, Advanced Polymer, Inc. | | Werner J. Roeder, MD Medical Director, Lawrence Hospital OFFICERS Bruce N. Alpert President and Acting Chief Compliance Officer Agnes Mullady Secretary and Treasurer DISTRIBUTOR G.distributors, LLC CUSTODIAN, TRANSFER AGENT, AND DIVIDEND DISBURSING AGENT State Street Bank and Trust Company LEGAL COUNSEL Skadden, Arps, Slate, Meagher & Flom LLP |
This report is submitted for the general information of the shareholders of The Gabelli Dividend Growth Fund. It is not authorized for distribution to prospective investors unless preceded or accompanied by an effective prospectus.

Overall Morningstar Rating
Morningstar® rated The Gabelli Dividend Growth Fund Class AAA Shares 4 stars overall, 3 stars for the three year period, 4 stars for the five year period, and 5 stars for the ten year peiod ended December 31, 2012 among 1,506, 1,506, 1,324, and 836 Large Blend funds, respectively. Morningstar RatingTM is based on risk-adjusted returns.
GAB402Q412AR
THE GABELLI DIVIDEND GROWTH FUND Annual Report December 31, 2012 Overall Morningstar RatingTM Morningstar RatingTM is based on risk-adjusted returns.
| | (a) | The registrant, as of the end of the period covered by this report, has adopted a code of ethics that applies to the registrant’s principal executive officer, principal financial officer, principal accounting officer or controller, or persons performing similar functions, regardless of whether these individuals are employed by the registrant or a third party. | |
| | (c) | There have been no amendments, during the period covered by this report, to a provision of the code of ethics that applies to the registrant’s principal executive officer, principal financial officer, principal accounting officer or controller, or persons performing similar functions, regardless of whether these individuals are employed by the registrant or a third party, and that relates to any element of the code of ethics description. | |
| | (d) | The registrant has not granted any waivers, including an implicit waiver, from a provision of the code of ethics that applies to the registrant’s principal executive officer, principal financial officer, principal accounting officer or controller, or persons performing similar functions, regardless of whether these individuals are employed by the registrant or a third party, that relates to one or more of the items set forth in paragraph (b) of this item’s instructions. | |
| Item 3. | Audit Committee Financial Expert. | |
As of the end of the period covered by the report, the registrant’s Board of Trustees has determined that Vincent D. Enright is qualified to serve as an audit committee financial expert serving on its audit committee and that he is “independent,” as defined by Item 3 of Form N-CSR.
| Item 4. | Principal Accountant Fees and Services. | |
Audit Fees
| | (a) | The aggregate fees billed for each of the last two fiscal years for professional services rendered by the principal accountant for the audit of the registrant’s annual financial statements or services that are normally provided by the accountant in connection with statutory and regulatory filings or engagements for those fiscal years are $17,000 for 2011 and $17,600 for 2012. | |
Audit-Related Fees
| | (b) | The aggregate fees billed in each of the last two fiscal years for assurance and related services by the principal accountant that are reasonably related to the performance of the audit of the registrant’s financial statements and are not reported under paragraph (a) of this Item are $0 for 2011 and $0 for 2012. | |
Tax Fees
| | (c) | The aggregate fees billed in each of the last two fiscal years for professional services rendered by the principal accountant for tax compliance, tax advice, and tax planning are $3,200 for 2011 and $3,300 for 2012. Tax fees represent tax compliance services provided in connection with the review of the Registrant’s tax returns. | |
All Other Fees
| | (d) | The aggregate fees billed in each of the last two fiscal years for products and services provided by the principal accountant, other than the services reported in paragraphs (a) through (c) of this Item are $0 for 2011 and $0 for 2012. | |
| (e)(1) | Disclose the audit committee’s pre-approval policies and procedures described in paragraph (c)(7) of Rule 2-01 of Regulation S-X. | |
| | Pre-Approval Policies and Procedures. The Audit Committee (“Committee”) of the registrant is responsible for pre-approving (i) all audit and permissible non-audit services to be provided by the independent registered public accounting firm to the registrant and (ii) all permissible non-audit services to be provided by the independent registered public accounting firm to the Adviser, Gabelli Funds, LLC, and any affiliate of Gabelli Funds, LLC (“Gabelli”) that provides services to the registrant (a “Covered Services Provider”) if the independent registered public accounting firm’s engagement related directly to the operations and financial reporting of the registrant. The Committee may delegate its responsibility to pre-approve any such audit and permissible non-audit services to the Chairperson of the Committee, and the Chairperson must report to the Committee, at its next regularly scheduled meeting after the Chairperson’s pre-approval of such services, his or her decision(s). The Committee may also establish detailed pre-approval policies and procedures for pre-approval of such services in accordance with applicable laws, including the delegation of some or all of the Committee’s pre-approval responsibilities to the other persons (other than Gabelli or the registrant’s officers). Pre-approval by the Committee of any permissible non-audit services is not required so long as: (i) the permissible non-audit services were not recognized by the registrant at the time of the engagement to be non-audit services; and (ii) such services are promptly brought to the attention of the Committee and approved by the Committee or Chairperson prior to the completion of the audit. | |
| (e)(2) | The percentage of services described in each of paragraphs (b) through (d) of this Item that were approved by the audit committee pursuant to paragraph (c)(7)(i)(C) of Rule 2-01 of Regulation S-X are as follows: | |
(b) N/A
(c) 100%
(d) N/A
| | (f) | The percentage of hours expended on the principal accountant’s engagement to audit the registrant’s financial statements for the most recent fiscal year that were attributed to work performed by persons other than the principal accountant’s full-time, permanent employees was 0%. | |
| | (g) | The aggregate non-audit fees billed by the registrant’s accountant for services rendered to the registrant, and rendered to the registrant’s investment adviser (not including any sub-adviser whose role is primarily portfolio management and is subcontracted with or overseen by another investment adviser), and any entity controlling, controlled by, or under common control with the adviser that provides ongoing services to the registrant for each of the last two fiscal years of the registrant was $49,500 for 2011 and $29,100 for 2012. | |
| | (h) | The registrant’s audit committee of the board of directors has considered whether the provision of non-audit services that were rendered to the registrant’s investment adviser (not including any sub-adviser whose role is primarily portfolio management and is subcontracted with or overseen by another investment adviser), and any entity controlling, controlled by, or under common control with the investment adviser that provides ongoing services to the registrant that were not pre-approved pursuant to paragraph (c)(7)(ii) of Rule 2-01 of Regulation S-X is compatible with maintaining the principal accountant’s independence. | |
| Item 5. | Audit Committee of Listed registrants. | |
Not applicable.
| (a) | Schedule of Investments in securities of unaffiliated issuers as of the close of the reporting period is included as part of the report to shareholders filed under Item 1 of this form. | |
| Item 7. | Disclosure of Proxy Voting Policies and Procedures for Closed-End Management Investment Companies. | |
Not applicable.
| Item 8. | Portfolio Managers of Closed-End Management Investment Companies. | |
Not applicable.
| Item 9. | Purchases of Equity Securities by Closed-End Management Investment Company and Affiliated Purchasers. | |
Not applicable.
| Item 10. | Submission of Matters to a Vote of Security Holders. | |
There have been no material changes to the procedures by which the shareholders may recommend nominees to the registrant’s Board of Trustees, where those changes were implemented after the registrant last provided disclosure in response to the requirements of Item 407(c)(2)(iv) of Regulation S-K (17 CFR 229.407) (as required by Item 22(b)(15) of Schedule 14A (17 CFR 240.14a-101)), or this Item.
| Item 11. | Controls and Procedures. | |
| | (a) | The registrant’s principal executive and principal financial officers, or persons performing similar functions, have concluded that the registrant’s disclosure controls and procedures (as defined in Rule 30a-3(c) under the Investment Company Act of 1940, as amended (the “1940 Act”) (17 CFR 270.30a-3(c))) are effective, as of a date within 90 days of the filing date of the report that includes the disclosure required by this paragraph, based on their evaluation of these controls and procedures required by Rule 30a-3(b) under the 1940 Act (17 CFR 270.30a-3(b)) and Rules 13a-15(b) or 15d-15(b) under the Securities Exchange Act of 1934, as amended (17 CFR 240.13a-15(b) or 240.15d-15(b)). | |
| | (b) | There were no changes in the registrant’s internal control over financial reporting (as defined in Rule 30a-3(d) under the 1940 Act (17 CFR 270.30a-3(d)) that occurred during the registrant’s second fiscal quarter of the period covered by this report that has materially affected, or is reasonably likely to materially affect, the registrant’s internal control over financial reporting. | |
| | (a)(1) | Code of ethics, or any amendment thereto, that is the subject of disclosure required by Item 2 is attached hereto. | |
| | (a)(2) | Certifications pursuant to Rule 30a-2(a) under the 1940 Act and Section 302 of the Sarbanes-Oxley Act of 2002 are attached hereto. | |
| | (b) | Certifications pursuant to Rule 30a-2(b) under the 1940 Act and Section 906 of the Sarbanes- Oxley Act of 2002 are attached hereto. | |
SIGNATURES
Pursuant to the requirements of the Securities Exchange Act of 1934 and the Investment Company Act of 1940, the registrant has duly caused this report to be signed on its behalf by the undersigned, thereunto duly authorized.
| | |
(Registrant) | | The Gabelli Dividend Growth Fund |
| | |
| |
By (Signature and Title)* | | /s/ Bruce N. Alpert |
| | Bruce N. Alpert, Principal Executive Officer |
Pursuant to the requirements of the Securities Exchange Act of 1934 and the Investment Company Act of 1940, this report has been signed below by the following persons on behalf of the registrant and in the capacities and on the dates indicated.
| | |
By (Signature and Title)* | | /s/ Bruce N. Alpert |
| | Bruce N. Alpert, Principal Executive Officer |
| | |
| |
By (Signature and Title)* | | /s/ Agnes Mullady |
| | Agnes Mullady, Principal Financial Officer and Treasurer |
* Print the name and title of each signing officer under his or her signature.