The Gabelli Dividend Growth Fund
Annual Report — December 31, 2022
 |  |  |
| Sarah Donnelly | Robert D. Leininger, CFA | Justin Bergner, CFA |
| Portfolio Manager | Portfolio Manager | Portfolio Manager |
| BS, Fordham | BA, Amherst College | BA, Yale University |
| University | MBA, Wharton School, | MBA, Wharton School, |
| | University of Pennsylvania | University of Pennsylvania |
To Our Shareholders,
For the year ended December 31, 2022, the net asset value (NAV) total return per Class AAA Share of The Gabelli Dividend Growth Fund was (9.6)% compared with a total return of (18.1)% for the Standard & Poor's (S&P) 500 Index. Other classes of shares are available. See page 3 for additional performance information for all classes.
Enclosed are the financial statements, including the schedule of investments, as of December 31, 2022.
Investment Objective and Strategy (Unaudited)
The Fund's primary investment objective is to seek to provide long term growth of capital. Current income is a secondary objective of the Fund.
Under normal market conditions, the Fund invests at least 80% of its net assets in dividend paying stocks. Dividend paying stocks include, for example, common stocks, preferred stocks, and convertible securities. In addition to seeking out stocks that pay a dividend, the Fund will focus on stocks that the portfolio manager believes are well positioned to increase their dividend over the long term. In selecting investments, the portfolio managers will consider, among other things, the market price of the issuer’s securities, earnings expectations, dividend paying and other earnings and price histories, balance sheet characteristics, and perceived management skills.
| As permitted by regulations adopted by the Securities and Exchange Commission, paper copies of the Fund’s annual and semiannual shareholder reports will no longer be sent by mail, unless you specifically request paper copies of the reports. Instead, the reports will be made available on the Fund’s website (www.gabelli.com), and you will be notified by mail each time a report is posted and provided with a website link to access the report. If you already elected to receive shareholder reports electronically, you will not be affected by this change and you need not take any action. To elect to receive all future reports on paper free of charge, please contact your financial intermediary, or, if you invest directly with the Fund, you may call 800-422-3554 or send an email request to info@gabelli.com. |
Performance Discussion (Unaudited)
By the end of the first fiscal quarter of 2022, inflation numbers had hit 40 year highs, and nobody believed that inflation is “transitory”, including the Federal Reserve. In fact, the Fed, started to take aggressive steps to both raise short term interest rates, and to reduce the size of the Federal Reserve’s balance sheet, in an effort to fight inflation. Energy costs were rising dramatically, as a result of the ongoing war in Ukraine, and food prices, along with most other goods, were following suit.
During the second quarter of 2022, the job market remained strong in the U.S, but inflation was close to a 40 year high. Concerned that the economy could head into a period of stagflation, similar to the 1970’s, the stock market indices pulled back during the quarter. The Federal Reserve showed it was serious about fighting inflationary pressures; the Federal Funds target rate ended the quarter at 1.75%, up from 0.25% at the end of 2021.
The third quarter of 2022 saw the Federal Reserve continue to raise interest rates which coincided with the third straight quarter of broad stock market indices in the United States being down. Although the U.S. economy continued getting back to normal after over two years of global pandemic shutdowns and supply chain disruptions, the main concern for investors remained inflation. The unemployment rate remained low, but anxieties continue to revolve around the Fed’s continued push for higher interest rates.
Top contributors to the portfolio for the year included Merck (5.1% of net assets as of December 31, 2022), a global healthcare company that delivers innovative health solutions through its prescription medicines, vaccines, biologic therapies, and animal health products. Merck has become the leading oncology company in the world based on the strength of its main drug Keytruda, which harnesses the body’s own immune system to fight a wide range of cancers with relatively few side effects. CEO Robert Davis has pledged to diversify the company via more aggressive acquisitions and licensing deals and continues to grow its revenue; and Bristol-Myers Squibb (1.5%), a global biopharmaceutical company committed to discovering, developing and delivering innovative medicines to patients with serious diseases. has revolutionized the treatment of many types of cancer by harnessing the body’s own immune system to fight malignancies. The company has been continuing to increase revenues and market share thanks to a diverse portfolio of immune-oncology drugs.
Detractors to performance included Alphabet (3.1%), a multinational technology conglomerate holding company created through a 2015 restructuring of Google, and became the parent company of Google and several former Google subsidiaries. Alphabet’s performance mirrored the sharp decline in tech stocks, and was further impacted by looming antitrust charges being filed by the U.S. Department of Justice; and International Flavors & Fragrances (1.9%), a leading global supplier of flavor and fragrances and ingredients used in food, beverage, and personal and household care products. Despite upbeat revenue reporting, IFF has been struggling to reduce costs and increase profit margins.
Thank you for your investment in The Gabelli Dividend Growth Fund.
We appreciate your confidence and trust.
| The views expressed reflect the opinions of the Fund's portfolio managers and Gabelli Funds, LLC, the Adviser, as of the date of this report and are subject to change without notice based on changes in market, economic, or other conditions. These views are not intended to be a forecast of future events and are no guarantee of future results. |
Comparative Results
Average Annual Returns through December 31, 2022 (a) (Unaudited)
Average annual returns reflect changes in share price, reinvestment of distributions, and are net of expenses.
| | | 1 Year | | | 5 Year | | | 10 Year | | | 15 Year | | | Since
Inception
(8/26/99) | |
| Class AAA (GABBX) | | | (9.60 | )% | | | 5.14 | % | | | 7.77 | % | | | 5.68 | % | | | 5.72 | % |
| S&P 500 Index (b) | | | (18.11 | ) | | | 9.42 | | | | 12.56 | | | | 8.81 | | | | 6.53 | |
| Lipper Large Cap Value Fund Average (b) | | | (7.81 | ) | | | 7.35 | | | | 10.62 | | | | 7.02 | | | | 5.98 | |
| Class A (GBCAX) | | | (9.64 | ) | | | 5.13 | | | | 7.77 | | | | 5.68 | | | | 5.74 | |
| With sales charge (c) | | | (14.83 | ) | | | 3.89 | | | | 7.13 | | | | 5.27 | | | | 5.47 | |
| Class C (GBCCX) | | | (10.26 | ) | | | 4.36 | | | | 6.97 | | | | 4.89 | | | | 5.09 | |
| With contingent deferred sales charge (d) | | | (11.16 | ) | | | 4.36 | | | | 6.97 | | | | 4.89 | | | | 5.09 | |
| Class I (GBCIX) | | | (8.70 | ) | | | 6.20 | | | | 8.55 | | | | 6.28 | | | | 6.15 | |
| (a) | Returns would have been lower had the Adviser not reimbursed certain expenses of the Fund. The Class AAA Share NAVs are used to calculate performance for the periods prior to the issuance of Class A Shares and Class C Shares on December 31, 2003 and the Class I Shares on June 30, 2004. The actual performance of the Class A and Class C Shares would have been lower due to the additional fees and expenses associated with these classes of shares. The actual performance for the Class I Shares would have been higher due to the lower expenses related to this class of shares. The Fund imposes a 2% redemption fee on shares sold or exchanged within seven days of purchase. |
| (b) | The S&P 500 Index is a market capitalization weighted index of 500 large capitalization stocks commonly used to represent the U.S. equity market. The Lipper Large Cap Value Fund Average reflects the average performance of mutual funds classified in this particular category. Dividends are considered reinvested. You cannot invest directly in an index. |
| (c) | Performance results include the effect of the maximum 5.75% sales charge at the beginning of the period. |
| (d) | Assuming payment of the 1% maximum contingent deferred sales charge imposed on redemptions made within one year of purchase. |
In the current prospectuses dated April 29, 2022, the expense ratios for Class AAA, A, C, and I Shares are 2.17%, 2.17%, 2.92%, and 1.92%, respectively, and the net expense ratios for these share classes after contractual reimbursements by Gabelli Funds, LLC, (the Adviser) are 2.00%, 2.00%, 2.75%, and 1.00%, respectively. See page 11 for the expense ratios for the year ended December 31, 2022. The contractual reimbursement is in effect through April 30, 2022. Class AAA and Class I Shares do not have a sales charge. The maximum sales charge for Class A Shares and Class C Shares is 5.75% and 1.00%, respectively.
Investors should carefully consider the investment objectives, risks, charges, and expenses of the Fund before investing. The prospectuses contain information about these and other matters and should be read carefully before investing. To obtain a prospectus, please visit our website at www.gabelli.com.
Returns represent past performance and do not guarantee future results. Investment returns and the principal value of an investment will fluctuate. When shares are redeemed, they may be worth more or less than their original cost. Current performance may be lower or higher than the performance data presented. Visit www.gabelli.com for performance information as of the most recent month end.
COMPARISON OF CHANGE IN VALUE OF A $10,000 INVESTMENT IN
THE GABELLI DIVIDEND GROWTH FUND (CLASS AAA SHARES) AND S&P 500 INDEX (Unaudited)
Average Annual Total Returns* |
| | 1 Year | 5 Year | 10 Year |
| Class AAA | (9.60)% | 5.14% | 7.77% |
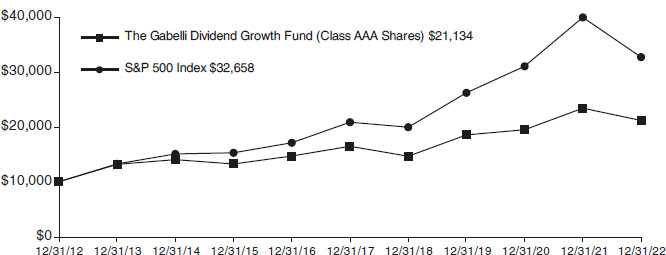
* Past performance is not predictive of future results. The performance tables and graph do not reflect the deduction of taxes that a shareholder would pay on Fund distributions or the redemption of Fund shares.
The Gabelli Dividend Growth Fund
Disclosure of Fund Expenses (Unaudited)
| For the Six Month Period from July 1, 2022 through December 31, 2022 | Expense Table |
We believe it is important for you to understand the impact of fees and expenses regarding your investment. All mutual funds have operating expenses. As a shareholder of a fund, you incur ongoing costs, which include costs for portfolio management, administrative services, and shareholder reports (like this one), among others. Operating expenses, which are deducted from a fund’s gross income, directly reduce the investment return of a fund. When a fund’s expenses are expressed as a percentage of its average net assets, this figure is known as the expense ratio. The following examples are intended to help you understand the ongoing costs (in dollars) of investing in your Fund and to compare these costs with those of other mutual funds. The examples are based on an investment of $1,000 made at the beginning of the period shown and held for the entire period.
The Expense Table below illustrates your Fund’s costs in two ways:
Actual Fund Return: This section provides information about actual account values and actual expenses. You may use this section to help you to estimate the actual expenses that you paid over the period after any fee waivers and expense reimbursements. The “Ending Account Value” shown is derived from the Fund’s actual return during the past six months, and the “Expenses Paid During Period” shows the dollar amount that would have been paid by an investor who started with $1,000 in the Fund. You may use this information, together with the amount you invested, to estimate the expenses that you paid over the period.
To do so, simply divide your account value by $1,000 (for example, an $8,600 account value divided by $1,000 = 8.6), then multiply the result by the number given for your Fund under the heading “Expenses Paid During Period” to estimate the expenses you paid during this period.
Hypothetical 5% Return: This section provides information about hypothetical account values and hypothetical expenses based on the Fund’s actual expense ratio. It assumes a hypothetical annualized return of 5% before expenses during the period shown. In this case – because the hypothetical return used is not the Fund’s actual return – the results do not apply to your investment and you cannot use the hypothetical account value and expense to estimate the actual ending account balance or expenses you
paid for the period. This example is useful in making comparisons of the ongoing costs of investing in the Fund and other funds. To do so, compare this 5% hypothetical example with the 5% hypothetical examples that appear in shareholder reports of other funds.
Please note that the expenses shown in the table are meant to highlight your ongoing costs only and do not reflect any transactional costs such as sales charges (loads), redemption fees, or exchange fees, if any, which are described in the Prospectus. If these costs were applied to your account, your costs would be higher. Therefore, the 5% hypothetical return is useful in comparing ongoing costs only, and will not help you determine the relative total costs of owning different funds.
| | | Beginning
Account Value
07/01/22 | | | Ending
Account Value
12/31/22 | | | Annualized
Expense
Ratio | | | Expenses
Paid During
Period * | |
| The Gabelli Dividend Growth Fund | | | | | | |
| Actual Fund Return | | | | | | | | | |
| Class AAA | | $ | 1,000.00 | | | $ | 1,055.60 | | | | 2.00 | % | | $ | 10.36 | |
| Class A | | $ | 1,000.00 | | | $ | 1,055.80 | | | | 2.00 | % | | $ | 10.36 | |
| Class C | | $ | 1,000.00 | | | $ | 1,052.20 | | | | 2.75 | % | | $ | 14.22 | |
| Class I | | $ | 1,000.00 | | | $ | 1,061.50 | | | | 1.00 | % | | $ | 5.20 | |
| Hypothetical 5% Return | | | | | | | | | | | | | | | | |
| Class AAA | | $ | 1,000.00 | | | $ | 1,015.12 | | | | 2.00 | % | | $ | 10.16 | |
| Class A | | $ | 1,000.00 | | | $ | 1,015.12 | | | | 2.00 | % | | $ | 10.16 | |
| Class C | | $ | 1,000.00 | | | $ | 1,011.34 | | | | 2.75 | % | | $ | 13.94 | |
| Class I | | $ | 1,000.00 | | | $ | 1,020.16 | | | | 1.00 | % | | $ | 5.09 | |
| * | Expenses are equal to the Fund’s annualized expense ratio for the last six months multiplied by the average account value over the period, multiplied by the number of days in the most recent fiscal half year (184 days), then divided by 365. |
Summary of Portfolio Holdings (Unaudited)
The following table presents portfolio holdings as a percent of net assets as of December 31, 2022:
The Gabelli Dividend Growth Fund
| Financial Services | | | 16.7 | % | | Retail | | | 1.4 | % |
| Health Care | | | 16.0 | % | | Electronics | | | 1.3 | % |
| Food and Beverage | | | 12.5 | % | | Machinery | | | 1.2 | % |
| Energy | | | 10.9 | % | | U.S. Government Obligations | | | 1.0 | % |
| Specialty Chemicals | | | 7.8 | % | | Consumer Products | | | 1.0 | % |
| Computer Software and Services | | | 7.6 | % | | Agriculture | | | 1.0 | % |
| Diversified Industrial | | | 7.3 | % | | Automotive | | | 1.0 | % |
| Cable and Satellite | | | 2.4 | % | | Semiconductors | | | 0.8 | % |
| Telecommunications | | | 2.1 | % | | Hotels and Gaming | | | 0.5 | % |
| Business Services | | | 1.7 | % | | Automotive: Parts and Accessories | | | 0.4 | % |
| Environmental Services | | | 1.7 | % | | Other Assets and Liabilities (Net) | | | 0.7 | % |
| Aerospace | | | 1.5 | % | | | | | 100.0 | % |
| Metals and Mining | | | 1.5 | % | | | | | | |
The Fund files a complete schedule of portfolio holdings with the Securities and Exchange Commission (the SEC) for the first and third quarters of each fiscal year on Form N-PORT. Shareholders may obtain this information at www.gabelli.com or by calling the Fund at 800-GABELLI (800-422-3554). The Fund’s Form N-PORT is available on the SEC’s website at www.sec.gov and may also be reviewed and copied at the SEC’s Public Reference Room in Washington, DC. Information on the operation of the Public Reference Room may be obtained by calling 800-SEC-0330.
Proxy Voting
The Fund files Form N-PX with its complete proxy voting record for the twelve months ended June 30, no later than August 31 of each year. A description of the Fund’s proxy voting policies, procedures, and how each Fund voted proxies relating to portfolio securities is available without charge, upon request, by (i) calling 800-GABELLI (800-422-3554); (ii) writing to The Gabelli Funds at One Corporate Center, Rye, NY 10580-1422; or (iii) visiting the SEC’s website at www.sec.gov.
The Gabelli Dividend Growth Fund
Schedule of Investments — December 31, 2022
| Shares | | | | | Cost | | | Market
Value | |
| | | | COMMON STOCKS — 98.3% | | | | | | | | |
| | | | Aerospace — 1.5% | | | | | | | | |
| 1,500 | | | The Boeing Co.† $ | | $ | 179,802 | | | $ | 285,735 | |
| | | | | | | | | | | | |
| | | | Agriculture — 1.0% | | | | | | | | |
| 3,136 | | | Corteva Inc. | | | 84,145 | | | | 184,334 | |
| | | | | | | | | | | | |
| | | | Automotive — 1.0% | | | | | | | | |
| 1,800 | | | PACCAR Inc. | | | 155,333 | | | | 178,146 | |
| | | | | | | | | | | | |
| | | | Automotive: Parts and Accessories — 0.4% | | | | | | | | |
| 5,000 | | | Dana Inc. | | | 97,760 | | | | 75,650 | |
| | | | | | | | | | | | |
| | | | Business Services — 1.7% | | | | | | | | |
| 1,500 | | | Visa Inc., Cl. A | | | 137,987 | | | | 311,640 | |
| | | | | | | | | | | | |
| | | | Cable and Satellite — 2.4% | | | | | | | | |
| | | | | | | | | | | | |
| 800 | | | Netflix Inc.† | | | 159,801 | | | | 235,904 | |
| 12,500 | | | Paramount Global, Cl. B | | | 331,448 | | | | 211,000 | |
| | | | | | | 491,249 | | | | 446,904 | |
| | | | Computer Software and Services — 7.6% | | | | | | | | |
| 6,600 | | | Alphabet Inc., Cl. C† | | | 238,336 | | | | 585,618 | |
| 2,000 | | | Apple Inc. | | | 37,181 | | | | 259,860 | |
| 10,000 | | | Hewlett Packard Enterprise Co. | | | 136,877 | | | | 159,600 | |
| 1,500 | | | Meta Platforms Inc., Cl. A† | | | 171,380 | | | | 180,510 | |
| 1,000 | | | Microsoft Corp. | | | 25,120 | | | | 239,820 | |
| | | | | | | 608,894 | | | | 1,425,408 | |
| | | | Consumer Products — 1.0% | | | | | | | | |
| 5,000 | | | Edgewell Personal Care Co. | | | 141,427 | | | | 192,700 | |
| | | | | | | | | | | | |
| | | | Diversified Industrial — 7.3% | | | | | | | | |
| 6,000 | | | Carrier Global Corp. | | | 268,897 | | | | 247,500 | |
| 2,700 | | | General Electric Co. | | | 235,725 | | | | 226,233 | |
| 2,800 | | | Honeywell International Inc. | | | 90,337 | | | | 600,040 | |
| 4,300 | | | Textron Inc. | | | 142,984 | | | | 304,440 | |
| | | | | | | 737,943 | | | | 1,378,213 | |
| | | | Electronics — 1.3% | | | | | | | | |
| 3,200 | | | Sony Group Corp., ADR | | | 180,009 | | | | 244,096 | |
| | | | | | | | | | | | |
| | | | Energy — 10.9% | | | | | | | | |
| 1,600 | | | Chevron Corp. | | | 161,893 | | | | 287,184 | |
| 8,000 | | | Eversource Energy | | | 675,813 | | | | 670,720 | |
| 8,000 | | | Halliburton Co. | | | 239,101 | | | | 314,800 | |
| 9,000 | | | Schlumberger Ltd. | | | 326,207 | | | | 481,140 | |
| 8,000 | | | UGI Corp. | | | 294,437 | | | | 296,560 | |
| | | | | | | 1,697,451 | | | | 2,050,404 | |
| | | | Environmental Services — 1.7% | | | | | | | | |
| 2,400 | | | Republic Services Inc. | | | 190,500 | | | | 309,576 | |
| | | | | | | | | | | | |
| | | | Financial Services — 16.7% | | | | | | | | |
| 4,000 | | | American Express Co. | | | 313,809 | | | | 591,000 | |
| Shares | | | | | Cost | | | Market
Value | |
| 4,000 | | | American International Group Inc. | | $ | 203,488 | | | $ | 252,960 | |
| 7,000 | | | Bank of America Corp. | | | 178,628 | | | | 231,840 | |
| 11,000 | | | Citigroup Inc. | | | 601,373 | | | | 497,530 | |
| 3,000 | | | JPMorgan Chase & Co. | | | 204,631 | | | | 402,300 | |
| 6,000 | | | Morgan Stanley | | | 245,071 | | | | 510,120 | |
| 1,000 | | | PayPal Holdings Inc.† | | | 31,601 | | | | 71,220 | |
| 1,113 | | | T. Rowe Price Group Inc. | | | 107,847 | | | | 121,384 | |
| 1,100 | | | The PNC Financial Services Group Inc. | | | 168,200 | | | | 173,734 | |
| 1,200 | | | Willis Towers Watson plc | | | 189,646 | | | | 293,496 | |
| | | | | | | 2,244,294 | | | | 3,145,584 | |
| | | | Food and Beverage — 12.5% | | | | | | | | |
| 5,000 | | | Conagra Brands Inc. | | | 173,876 | | | | 193,500 | |
| 1,400 | | | Diageo plc, ADR | | | 161,322 | | | | 249,466 | |
| 11,500 | | | Keurig Dr Pepper Inc. | | | 348,429 | | | | 410,090 | |
| 5,000 | | | Molson Coors Beverage Co., Cl. B | | | 229,481 | | | | 257,600 | |
| 14,500 | | | Mondelz International Inc., Cl. A | | | 607,103 | | | | 966,425 | |
| 8,000 | | | Nomad Foods Ltd.† | | | 202,422 | | | | 137,920 | |
| 9,000 | | | The Hain Celestial Group Inc.† | | | 189,279 | | | | 145,620 | |
| | | | | | | 1,911,912 | | | | 2,360,621 | |
| | | | Health Care — 16.0% | | | | | | | | |
| 4,000 | | | Bristol-Myers Squibb Co. | | | 225,620 | | | | 287,800 | |
| 5,500 | | | CVS Health Corp. | | | 451,554 | | | | 512,545 | |
| 2,000 | | | Henry Schein Inc.† | | | 133,986 | | | | 159,740 | |
| 3,300 | | | Medtronic plc | | | 277,571 | | | | 256,476 | |
| 8,700 | | | Merck & Co. Inc. | | | 512,469 | | | | 965,265 | |
| 4,000 | | | Patterson Cos. Inc. | | | 91,400 | | | | 112,120 | |
| 4,500 | | | Perrigo Co. plc | | | 169,679 | | | | 153,405 | |
| 11,000 | | | Pfizer Inc. | | | 357,993 | | | | 563,640 | |
| | | | | | | 2,220,272 | | | | 3,010,991 | |
| | | | Hotels and Gaming — 0.5% | | | | | | | | |
| 3,000 | | | MGM Resorts International | | | 33,355 | | | | 100,590 | |
| | | | | | | | | | | | |
| | | | Machinery — 1.2% | | | | | | | | |
| 3,300 | | | The Timken Co. | | | 236,515 | | | | 233,211 | |
| | | | | | | | | | | | |
| | | | Metals and Mining — 1.5% | | | | | | | | |
| 6,000 | | | Newmont Corp. | | | 222,632 | | | | 283,200 | |
| | | | | | | | | | | | |
| | | | Retail — 1.4% | | | | | | | | |
| 6,000 | | | The Kroger Co. | | | 209,895 | | | | 267,480 | |
| | | | | | | | | | | | |
| | | | Semiconductors — 0.8% | | | | | | | | |
| 1,000 | | | NXP Semiconductors NV | | | 91,990 | | | | 158,030 | |
| | | | | | | | | | | | |
| | | | Specialty Chemicals — 7.8% | | | | | | | | |
| 10,500 | | | DuPont de Nemours Inc. | | | 630,360 | | | | 720,615 | |
| 3,000 | | | FMC Corp. | | | 310,540 | | | | 374,400 | |
See accompanying notes to financial statements.
The Gabelli Dividend Growth Fund
Schedule of Investments (Continued) — December 31, 2022
| Shares | | | | | Cost | | | Market
Value | |
| | | | COMMON STOCKS (Continued) | | | | | | |
| | | | | Specialty Chemicals (Continued) | | | | | | | | |
| | 3,500 | | | International Flavors & Fragrances Inc. | | $ | 417,580 | | | $ | 366,940 | |
| | | | | | | | 1,358,480 | | | | 1,461,955 | |
| | | | | Telecommunications — 2.1% | | | | | | | | |
| | 2,800 | | | T-Mobile US Inc.† | | | 208,410 | | | | 392,000 | |
| | | | | | | | | | | | | |
| | | | | TOTAL COMMON STOCKS | | | 13,440,255 | | | | 18,496,468 | |
| | | | | | | | | | | | | |
| | | | | | | | | | | | | |
| | Principal
Amount | | | | | | | | | | | |
| | | | | U.S. GOVERNMENT OBLIGATIONS — 1.0% | | | | | | | | |
| $ | 195,000 | | | U.S. Treasury Bill, | | | | | | | | |
| | | | | 4.377%††, 03/30/23 | | | 192,936 | | | | 193,005 | |
| | | | | | | | | | | | | |
| | | | | TOTAL INVESTMENTS — 99.3% | | $ | 13,633,191 | | | | 18,689,473 | |
| | | | | Other Assets and Liabilities (Net) — 0.7% | | | | | | | 128,946 | |
| | | | | NET ASSETS — 100.0% | | | | | | $ | 18,818,419 | |
| † | Non-income producing security. |
| †† | Represents annualized yield at date of purchase. |
| ADR | American Depositary Receipt |
See accompanying notes to financial statements.
The Gabelli Dividend Growth Fund
Statement of Assets and Liabilities
December 31, 2022
| Assets: | | | |
| Investments, at value (cost $13,633,191) | | $ | 18,689,473 | |
| Cash | | | 56,056 | |
| Receivable for investments sold | | | 83,477 | |
| Receivable for Fund shares sold | | | 10,317 | |
| Receivable from Adviser | | | 15,087 | |
| Dividends receivable | | | 38,724 | |
| Prepaid expenses | | | 15,317 | |
| Total Assets | | | 18,908,451 | |
| Liabilities: | | | | |
| Payable for Fund shares redeemed | | | 1,546 | |
| Payable for investment advisory fees | | | 16,302 | |
| Payable for distribution fees | | | 4,036 | |
| Payable for legal and audit fees | | | 27,276 | |
| Payable for shareholder communications | | | 26,631 | |
| Payable for shareholder services fees | | | 9,025 | |
| Other accrued expenses | | | 5,216 | |
| Total Liabilities | | | 90,032 | |
| Net Assets | | | | |
| (applicable to 1,164,303 shares outstanding) | | $ | 18,818,419 | |
| Net Assets Consist of: | | | | |
| Paid-in capital | | $ | 13,901,520 | |
| Total distributable earnings | | | 4,916,899 | |
| Net Assets | | $ | 18,818,419 | |
| | | | | |
| Shares of Beneficial Interest, each at $0.001 par | | | | |
| value; unlimited number of shares authorized: | | | | |
| Class AAA: | | | | |
| Net Asset Value, offering, and redemption price per share ($13,619,169 ÷ 837,096 shares outstanding) | | $ | 16.27 | |
| Class A: | | | | |
| Net Asset Value and redemption price per share ($2,324,205 ÷ 143,367 shares outstanding) | | $ | 16.21 | |
| Maximum offering price per share (NAV ÷ 0.9425, based on maximum sales charge of 5.75% of the offering price) | | $ | 17.20 | |
| Class C: | | | | |
| Net Asset Value and offering price per share ($648,425 ÷ 46,627 shares outstanding) | | $ | 13.91 | (a) |
| Class I: | | | | |
| Net Asset Value, offering, and redemption price per share ($2,226,620 ÷ 137,213 shares outstanding) | | $ | 16.23 | |
Statement of Operations
For the Year Ended December 31, 2022
| Investment Income: | | | | |
| Dividends (net of foreign withholding taxes of $675) | | $ | 372,530 | |
| Interest | | | 10,460 | |
| Total Investment Income | | | 382,990 | |
| Expenses: | | | | |
| Investment advisory fees | | | 211,043 | |
| Distribution fees - Class AAA | | | 34,892 | |
| Distribution fees - Class A | | | 5,706 | |
| Distribution fees - Class C | | | 7,906 | |
| Registration expenses | | | 53,708 | |
| Legal and audit fees | | | 49,091 | |
| Shareholder communications expenses | | | 46,656 | |
| Trustees’ fees | | | 30,000 | |
| Shareholder services fees | | | 28,973 | |
| Custodian fees | | | 5,778 | |
| Interest expense | | | 373 | |
| Miscellaneous expenses | | | 14,262 | |
| Total Expenses | | | 488,388 | |
| Less: | | | | |
| Expense reimbursements (See Note 3) | | | (99,037 | ) |
| Expenses paid indirectly by broker (See Note 6) | | | (1,705 | ) |
| Total Credits and Reimbursements | | | (100,742 | ) |
| Net Expenses | | | 387,646 | |
| Net Investment Loss | | | (4,656 | ) |
| Net Realized and Unrealized Gain/(Loss) on Investments: | | | | |
| Net realized gain on investments | | | 298,122 | |
| | | | | |
| Net change in unrealized appreciation/depreciation: | | | | |
| on investments | | | (2,398,356 | ) |
| Net Realized and Unrealized Loss on Investments | | | (2,100,234 | ) |
| Net Decrease in Net Assets Resulting from Operations | | | (2,104,890 | ) |
| | | $ | (2,104,890 | ) |
| (a) | Redemption price varies based on the length of time held. |
See accompanying notes to financial statements.
The Gabelli Dividend Growth Fund
Statement of Changes in Net Assets
| | | Year Ended
December 31, 2022 | | | Year Ended
December 31, 2021 | |
| Operations: | | | | | | |
| Net investment income/(loss) | | $ | (4,656 | ) | | $ | 59,209 | |
| Net realized gain on investments | | | 298,122 | | | | 2,431,957 | |
| Net change in unrealized appreciation/depreciation on investments | | | (2,398,356 | ) | | | 1,585,505 | |
| Net Increase/(Decrease) in Net Assets Resulting from Operations | | | (2,104,890 | ) | | | 4,076,671 | |
| | | | | | | | | |
| Distributions to Shareholders: | | | | | | | | |
| Accumulated earnings | | | | | | | | |
| Class AAA | | | (194,906 | ) | | | (1,589,180 | ) |
| Class A | | | (31,970 | ) | | | (261,314 | ) |
| Class C | | | (9,284 | ) | | | (111,720 | ) |
| Class I | | | (66,895 | ) | | | (507,401 | ) |
| | | | (303,055 | ) | | | (2,469,615 | ) |
| Return of capital | | | | | | | | |
| Class AAA | | | (35,137 | ) | | | — | |
| Class A | | | (5,764 | ) | | | — | |
| Class C | | | (1,673 | ) | | | — | |
| Class I | | | (5,765 | ) | | | — | |
| | | | (48,339 | ) | | | — | |
| Total Distributions to Shareholders | | | (351,394 | ) | | | (2,469,615 | ) |
| | | | | | | | | |
| Shares of Beneficial Interest Transactions: | | | | | | | | |
| Class AAA | | | (280,758 | ) | | | 974,859 | |
| Class A | | | 19,975 | | | | 353,740 | |
| Class C | | | (210,072 | ) | | | 84,521 | |
| Class I | | | (2,007,074 | ) | | | 547,000 | |
| Net Increase/(Decrease) in Net Assets from Shares of Beneficial Interest | | | | | | | | |
| Transactions | | | (2,477,929 | ) | | | 1,960,120 | |
| | | | | | | | | |
| Redemption Fees | | | 23 | | | | 12 | |
| | | | | | | | | |
| Net Increase/(Decrease) in Net Assets | | | (4,934,190 | ) | | | 3,567,188 | |
| Net Assets: | | | | | | | | |
| Beginning of year | | | 23,752,609 | | | | 20,185,421 | |
| End of period | | $ | 18,818,419 | | | $ | 23,752,609 | |
See accompanying notes to financial statements.
The Gabelli Dividend Growth Fund
Financial Highlights
Selected data for a share of beneficial interest outstanding throughout each year:
| | | | | Income (Loss) from Investment
Operations | | Distributions | | | | | | | | | Ratios to Average Net Assets/Supplemental Data |
| Year | | Net Asset Value,
Beginning of Year | | Net Investment
Income (Loss)(a) | | Net Realized
and Unrealized
Gain (Loss) on
Investments | | Total from
Investment
Operations | | Net Investment
Income | | Net Realized
Gain on
Investments | | Return of Capital | | Total
Distributions | | Redemption
Fees(a)(b) | | Net Asset Value,
End of Year | | Total Return† | | Net Assets, End of
Year (in 000’s) | | Net Investment
Income (Loss) | | Operating
Expenses Before
Reimbursement(c) | | Operating
Expenses Net of
Reimbursement(c) | | Portfolio
Turnover
Rate |
| Class AAA | | | | | | | | | | | | | | | | | | | | | | | | | | | | | | | | | | | | | | | | | | | | | | | | | | | | | | | | | | | |
| 2022 | | $ | 18.31 | | $ | (0.03 | ) | | $ | (1.73 | ) | | $ | (1.76 | ) | | $ | — | | | $ | (0.24 | ) | | $ | (0.04 | ) | | $ | (0.28 | ) | | $ | 0.00 | | | 16.27 | | | (9.60 | )% | | $ | 13,619 | | | (0.18 | )% | | 2.33 | %(d) | | | 2.00 | %(d) | | | 19 | % |
| 2021 | | | 16.95 | | | 0.02 | | | | 3.40 | | | | 3.42 | | | | (0.01 | ) | | | (2.05 | ) | | | — | | | | (2.06 | ) | | | 0.00 | | | 18.31 | | | 20.18 | | | | 15,600 | | | 0.10 | | | 2.17 | (d) | | | 2.00 | (d) | | | 26 | |
| 2020 | | | 16.60 | | | 0.01 | | | | 0.83 | | | | 0.84 | | | | (0.00 | )(b) | | | (0.49 | ) | | | — | | | | (0.49 | ) | | | 0.00 | | | 16.95 | | | 5.09 | | | | 13,527 | | | 0.06 | | | 2.49 | (d) | | | 2.01 | (d) | | | 19 | |
| 2019 | | | 13.71 | | | 0.06 | | | | 3.56 | | | | 3.62 | | | | (0.06 | ) | | | (0.67 | ) | | | — | | | | (0.73 | ) | | | 0.00 | | | 16.60 | | | 26.43 | | | | 15,508 | | | 0.40 | | | 2.18 | (d) | | | 2.00 | (d) | | | 18 | |
| 2018 | | | 17.23 | | | 0.02 | | | | (1.93 | ) | | | (1.91 | ) | | | (0.00 | )(b) | | | (1.61 | ) | | | — | | | | (1.61 | ) | | | 0.00 | | | 13.71 | | | (11.00 | ) | | | 13,533 | | | 0.13 | | | 2.16 | (d) | | | 2.01 | (d) | | | 25 | |
| Class A | | | | | | | | | | | | | | | | | | | | | | | | | | | | | | | | | | | | | | | | | | | | | | | | | | | | | | | | | | | |
| 2022 | | $ | 18.25 | | $ | (0.03 | ) | | $ | (1.73 | ) | | $ | (1.76 | ) | | $ | — | | | $ | (0.24 | ) | | $ | (0.04 | ) | | $ | (0.28 | ) | | $ | 0.00 | | | 16.21 | | | (9.64 | )% | | $ | 2,324 | | | (0.16 | )% | | 2.33 | % | | | 2.00 | %(d) | | | 19 | % |
| 2021 | | | 16.90 | | | 0.02 | | | | 3.39 | | | | 3.41 | | | | (0.01 | ) | | | (2.05 | ) | | | — | | | | (2.06 | ) | | | 0.00 | | | 18.25 | | | 20.18 | | | | 2,575 | | | 0.08 | | | 2.17 | | | | 2.00 | (d) | | | 26 | |
| 2020 | | | 16.55 | | | 0.01 | | | | 0.83 | | | | 0.84 | | | | (0.00 | )(b) | | | (0.49 | ) | | | — | | | | (0.49 | ) | | | 0.00 | | | 16.90 | | | 5.11 | | | | 2,067 | | | 0.05 | | | 2.49 | | | | 2.01 | (d) | | | 19 | |
| 2019 | | | 13.67 | | | 0.06 | | | | 3.56 | | | | 3.62 | | | | (0.07 | ) | | | (0.67 | ) | | | — | | | | (0.74 | ) | | | 0.00 | | | 16.55 | | | 26.46 | | | | 2,860 | | | 0.41 | | | 2.18 | | | | 2.00 | (d) | | | 18 | |
| 2018 | | | 17.19 | | | 0.02 | | | | (1.93 | ) | | | (1.91 | ) | | | (0.00 | )(b) | | | (1.61 | ) | | | — | | | | (1.61 | ) | | | 0.00 | | | 13.67 | | | (11.03 | ) | | | 2,298 | | | 0.13 | | | 2.16 | | | | 2.01 | (d) | | | 25 | |
| Class C | | | | | | | | | | | | | | | | | | | | | | | | | | | | | | | | | | | | | | | | | | | | | | | | | | | | | | | | | | | |
| 2022 | | $ | 15.77 | | $ | (0.14 | ) | | $ | (1.48 | ) | | $ | (1.62 | ) | | $ | — | | | $ | (0.20 | ) | | $ | (0.04 | ) | | $ | (0.24 | ) | | $ | 0.00 | | | 13.91 | | | (10.26 | )% | | $ | 648 | | | (0.94 | )% | | 3.08 | % | | | 2.75 | %(d) | | | 19 | % |
| 2021 | | | 14.94 | | | (0.11 | ) | | | 2.99 | | | | 2.88 | | | | — | | | | (2.05 | ) | | | — | | | | (2.05 | ) | | | 0.00 | | | 15.77 | | | 19.27 | | | | 963 | | | (0.66 | ) | | 2.92 | | | | 2.75 | (d) | | | 26 | |
| 2020 | | | 14.79 | | | (0.09 | ) | | | 0.73 | | | | 0.64 | | | | — | | | | (0.49 | ) | | | — | | | | (0.49 | ) | | | 0.00 | | | 14.94 | | | 4.36 | | | | 833 | | | (0.67 | ) | | 3.24 | | | | 2.76 | (d) | | | 19 | |
| 2019 | | | 12.32 | | | (0.05 | ) | | | 3.19 | | | | 3.14 | | | | — | | | | (0.67 | ) | | | — | | | | (0.67 | ) | | | 0.00 | | | 14.79 | | | 25.49 | | | | 1,288 | | | (0.33 | ) | | 2.93 | | | | 2.75 | (d) | | | 18 | |
| 2018 | | | 15.79 | | | (0.10 | ) | | | (1.76 | ) | | | (1.86 | ) | | | — | | | | (1.61 | ) | | | — | | | | (1.61 | ) | | | 0.00 | | | 12.32 | | | (11.70 | ) | | | 1,514 | | | (0.63 | ) | | 2.91 | | | | 2.76 | (d) | | | 25 | |
| Class I | | | | | | | | | | | | | | | | | | | | | | | | | | | | | | | | | | | | | | | | | | | | | | | | | | | | | | | | | | | |
| 2022 | | $ | 18.38 | | $ | 0.13 | | | $ | (1.74 | ) | | $ | (1.61 | ) | | $ | (0.26 | ) | | $ | (0.24 | ) | | $ | (0.04 | ) | | $ | (0.54 | ) | | $ | 0.00 | | | 16.23 | | | (8.70 | )% | | $ | 2,227 | | | 0.77 | % | | 2.08 | % | | | 1.00 | %(d) | | | 19 | % |
| 2021 | | | 17.00 | | | 0.21 | | | | 3.43 | | | | 3.64 | | | | (0.21 | ) | | | (2.05 | ) | | | — | | | | (2.26 | ) | | | 0.00 | | | 18.38 | | | 21.40 | | | | 4,615 | | | 1.08 | | | 1.92 | | | | 1.00 | (d) | | | 26 | |
| 2020 | | | 16.63 | | | 0.16 | | | | 0.86 | | | | 1.02 | | | | (0.16 | ) | | | (0.49 | ) | | | — | | | | (0.65 | ) | | | 0.00 | | | 17.00 | | | 6.17 | | | | 3,758 | | | 1.06 | | | 2.24 | | | | 1.01 | (d) | | | 19 | |
| 2019 | | | 13.76 | | | 0.22 | | | | 3.60 | | | | 3.82 | | | | (0.28 | ) | | | (0.67 | ) | | | — | | | | (0.95 | ) | | | 0.00 | | | 16.63 | | | 27.77 | | | | 3,937 | | | 1.41 | | | 1.93 | | | | 1.00 | (d) | | | 18 | |
| 2018 | | | 17.33 | | | 0.20 | | | | (1.97 | ) | | | (1.77 | ) | | | (0.19 | ) | | | (1.61 | ) | | | — | | | | (1.80 | ) | | | 0.00 | | | 13.76 | | | (10.16 | ) | | | 4,286 | | | 1.13 | | | 1.91 | | | | 1.01 | (d) | | | 25 | |
| † | Total return represents aggregate total return of a hypothetical investment at the beginning of the year and sold at the end of the year including reinvestment of distributions and does not reflect the applicable sales charges. |
| (a) | Per share amounts have been calculated using the average shares outstanding method. |
| (b) | Amount represents less than $0.005 per share. |
| (c) | The Fund incurred interest expense. For the years ended December 31, 2020 and December 31, 2018, if interest expense had not been incurred, the ratio of operating expenses to average net assets would have been 2.00% (Class AAA and Class A), 2.75% (Class C), and 1.00% (Class I). For all remaining periods, there was no impact on the expense ratios. |
| (d) | The Fund received credits from a designated broker who agreed to pay certain Fund operating expenses. For all years presented, there was no impact on the expense ratios. |
See accompanying notes to financial statements.
The Gabelli Dividend Growth Fund
Notes to Financial Statements
1. Organization. The Gabelli Dividend Growth Fund was organized on May 13, 1999 as a Delaware statutory trust. The Fund is a diversified open-end management investment company registered under the Investment Company Act of 1940, as amended (the 1940 Act). The Fund’s primary objective is long term growth of capital with current income as a secondary objective. The Fund commenced investment operations on August 26, 1999.
2. Significant Accounting Policies. As an investment company, the Fund follows the investment company accounting and reporting guidance, which is part of U.S. generally accepted accounting principles (GAAP) that may require the use of management estimates and assumptions in the preparation of its financial statements. Actual results could differ from those estimates. The following is a summary of significant accounting policies followed by the Fund in the preparation of its financial statements.
The global outbreak of the novel coronavirus disease, known as COVID-19, has caused adverse effects on many companies, sectors, nations, regions, and the markets in general, and may continue for an unpredictable duration. The effects of this pandemic may materially impact the value and performance of the Fund, its ability to buy and sell fund investments at appropriate valuations, and its ability to achieve its investment objectives.
Security Valuation. Portfolio securities listed or traded on a nationally recognized securities exchange or traded in the U.S. over-the-counter market for which market quotations are readily available are valued at the last quoted sale price or a market’s official closing price as of the close of business on the day the securities are being valued. If there were no sales that day, the security is valued at the average of the closing bid and asked prices or, if there were no asked prices quoted on that day, then the security is valued at the closing bid price on that day. If no bid or asked prices are quoted on such day, the security is valued at the most recently available price or, if the Board of Trustees (the Board) so determines, by such other method as the Board shall determine in good faith to reflect its fair market value. Portfolio securities traded on more than one national securities exchange or market are valued according to the broadest and most representative market, as determined by Gabelli Funds, LLC (the Adviser).
Portfolio securities primarily traded on a foreign market are generally valued at the preceding closing values of such securities on the relevant market, but may be fair valued pursuant to procedures established by the Board if market conditions change significantly after the close of the foreign market, but prior to the close of business on the day the securities are being valued. Debt obligations for which market quotations are readily available are valued at the average of the latest bid and asked prices. If there were no asked prices quoted on such day, the security is valued using the closing bid price, unless the Board determines such amount does not reflect the securities’ fair value, in which case these securities will be fair valued as determined by the Board. Certain securities are valued principally using dealer quotations. Futures contracts are valued at the closing settlement price of the exchange or board of trade on which the applicable contract is traded. OTC futures and options on futures for which market quotations are readily available will be valued by quotations received from a pricing service or, if no quotations are available from a pricing service, by quotations obtained from one of more dealers in the instrument in question by the Adviser.
Securities and assets for which market quotations are not readily available are fair valued as determined by the Board. Fair valuation methodologies and procedures may include, but are not limited to: analysis and review of available financial and non-financial information about the company; comparisons with the valuation and changes in valuation of similar securities, including a comparison of foreign securities with the equivalent U.S.
The Gabelli Dividend Growth Fund
Notes to Financial Statements (Continued)
dollar value American Depositary Receipt securities at the close of the U.S. exchange; and evaluation of any other information that could be indicative of the value of the security.
The inputs and valuation techniques used to measure fair value of the Fund’s investments are summarized into three levels as described in the hierarchy below:
| | ● | Level 1 — quoted prices in active markets for identical securities; |
| | ● | Level 2 — other significant observable inputs (including quoted prices for similar securities, interest rates, prepayment speeds, credit risk, etc.); and |
| | ● | Level 3 — significant unobservable inputs (including the Board’s determinations as to the fair value of investments). |
A financial instrument’s level within the fair value hierarchy is based on the lowest level of any input both individually and in the aggregate that is significant to the fair value measurement. The inputs or methodology used for valuing securities are not necessarily an indication of the risk associated with investing in those securities. The summary of the Fund’s investments in securities by inputs used to value the Fund’s investments as of December 31, 2022 is as follows:
| | | Valuation Inputs | | | | |
| | | Level 1
Quoted Prices | | | Level 2 Other
Significant
Observable Inputs | | | Total Market Value
at 12/31/22 | |
| INVESTMENTS IN SECURITIES: | | | | | | | | | | | | |
| ASSETS (Market Value): | | | | | | | | | | | | |
| Common Stocks (a) | | $ | 18,496,468 | | | | — | | | $ | 18,496,468 | |
| U.S. Government Obligations | | | — | | | $ | 193,005 | | | | 193,005 | |
| TOTAL INVESTMENTS IN SECURITIES ASSETS | | $ | 18,496,468 | | | $ | 193,005 | | | $ | 18,689,473 | |
| (a) | Please refer to the Schedule of Investments for the industry classifications of these portfolio holdings. |
The Fund held no Level 3 investments at December 31, 2021 or 2022.
Additional Information to Evaluate Qualitative Information.
General. The Fund uses recognized industry pricing services – approved by the Board and unaffiliated with the Adviser – to value most of its securities, and uses broker quotes provided by market makers of securities not valued by these and other recognized pricing sources. Several different pricing feeds are received to value domestic equity securities, international equity securities, preferred equity securities, and fixed income securities. The data within these feeds are ultimately sourced from major stock exchanges and trading systems where these securities trade. The prices supplied by external sources are checked by obtaining quotations or actual transaction prices from market participants. If a price obtained from the pricing source is deemed unreliable, prices will be sought from another pricing service or from a broker/dealer that trades that security or similar securities.
Fair Valuation. Fair valued securities may be common or preferred equities, warrants, options, rights, or fixed income obligations. Where appropriate, Level 3 securities are those for which market quotations are not available, such as securities not traded for several days, or for which current bids are not available, or which are restricted as to transfer. When fair valuing a security, factors to consider include recent prices of comparable
The Gabelli Dividend Growth Fund
Notes to Financial Statements (Continued)
securities that are publicly traded, reliable prices of securities not publicly traded, the use of valuation models, current analyst reports, valuing the income or cash flow of the issuer, or cost if the preceding factors do not apply. A significant change in the unobservable inputs could result in a lower or higher value in Level 3 securities. The circumstances of Level 3 securities are frequently monitored to determine if fair valuation measures continue to apply.
The Adviser reports quarterly to the Board the results of the application of fair valuation policies and procedures. These may include backtesting the prices realized in subsequent trades of these fair valued securities to fair values previously recognized.
Foreign Securities. The Fund may directly purchase securities of foreign issuers. Investing in securities of foreign issuers involves special risks not typically associated with investing in securities of U.S. issuers. The risks include possible revaluation of currencies, the inability to repatriate funds, less complete financial information about companies, and possible future adverse political and economic developments. Moreover, securities of many foreign issuers and their markets may be less liquid and their prices more volatile than securities of comparable U.S. issuers.
Foreign Taxes. The Fund may be subject to foreign taxes on income, gains on investments, or currency repatriation, a portion of which may be recoverable. The Fund will accrue such taxes and recoveries as applicable, based upon its current interpretation of tax rules and regulations that exist in the markets in which it invests.
Securities Transactions and Investment Income. Securities transactions are accounted for on the trade date with realized gain/(loss) on investments determined by using the identified cost method. Interest income (including amortization of premium and accretion of discount) is recorded on an accrual basis. Premiums and discounts on debt securities are amortized using the effective yield to maturity method or amortized to earliest call date, if applicable. Dividend income is recorded on the ex-dividend date, except for certain dividends from foreign securities that are recorded as soon after the ex-dividend date as the Fund becomes aware of such dividends.
Determination of Net Asset Value and Calculation of Expenses. Certain administrative expenses are common to, and allocated among, various affiliated funds. Such allocations are made on the basis of each fund’s average net assets or other criteria directly affecting the expenses as determined by the Adviser pursuant to procedures established by the Board.
In calculating the NAV per share of each class, investment income, realized and unrealized gains and losses, redemption fees, and expenses other than class specific expenses are allocated daily to each class of shares based upon the proportion of net assets of each class at the beginning of each day. Distribution expenses are borne solely by the class incurring the expense.
Distributions to Shareholders. Distributions to shareholders are recorded on the ex-dividend date. Distributions to shareholders are based on income and capital gains as determined in accordance with federal income tax regulations, which may differ from income and capital gains as determined under GAAP. These differences are primarily due to differing treatments of income and gains on various investment securities held by the Fund, timing differences, and differing characterizations of distributions made by the Fund. These book/ tax differences are either temporary or permanent in nature. To the extent these differences are permanent, adjustments are made to the appropriate capital accounts in the period when the differences arise. Permanent differences
The Gabelli Dividend Growth Fund
Notes to Financial Statements (Continued)
were primarily due to redesignation of dividends paid, Fund level return of capital, or over distribution and the reclassification of prior year return of capital. These reclassifications have no impact on the NAV of the Fund.
The tax character of distributions paid during the year ended December 31, 2022 and 2021 was as follows:
| | | Year Ended
December 31, 2022 | | | Year Ended
December 31, 2021 | |
| Distributions paid from: | | | | | | | | |
| Ordinary income (inclusive of short term capital gains) | | $ | 40,717 | | | $ | 88,993 | |
| Net long term capital gains | | | 262,338 | | | | 2,438,618 | |
| Return of capital | | | 48,339 | | | | — | |
| Total distributions paid | | $ | 351,394 | | | $ | 2,527,611 | |
Provision for Income Taxes. The Fund intends to continue to qualify as a regulated investment company under Subchapter M of the Internal Revenue Code of 1986, as amended (the Code). It is the policy of the Fund to comply with the requirements of the Code applicable to regulated investment companies and to distribute substantially all of its net investment company taxable income and net capital gains. Therefore, no provision for federal income taxes is required.
At December 31, 2022, the components of accumulated earnings/losses on a tax basis were as follows:
| Net unrealized appreciation on investments | | $ | 4,916,899 | |
At December 31, 2022, the temporary differences between book basis and tax basis unrealized appreciation on investments were primarily due to deferral of losses from wash sales for tax purposes.
The following summarizes the tax cost of investments and the related net unrealized appreciation at December 31, 2022:
| | Cost | | Gross
Unrealized
Appreciation | | Gross
Unrealized
Depreciation | | Net Unrealized
Appreciation | |
| Investments | $13,772,574 | | $5,538,138 | | $(621,239) | | $4,916,899 | |
The Fund is required to evaluate tax positions taken or expected to be taken in the course of preparing the Fund’s tax returns to determine whether the tax positions are “more-likely-than-not” of being sustained by the applicable tax authority. Income tax and related interest and penalties would be recognized by the Fund as tax expense in the Statement of Operations if the tax positions were deemed not to meet the more-likely-than-not threshold. During the year ended December 31, 2022, the Fund did not incur any income tax, interest, or penalties. As of December 31, 2022, the Adviser has reviewed all open tax years and concluded that there was no impact to the Fund’s net assets or results of operations. The Fund’s federal and state tax returns for the prior three fiscal years remain open, subject to examination. On an ongoing basis, the Adviser will monitor the Fund’s tax positions to determine if adjustments to this conclusion are necessary.
3. Investment Advisory Agreement and Other Transactions. The Fund has entered into an investment advisory agreement (the Advisory Agreement) with the Adviser which provides that the Fund will pay the Adviser a fee, computed daily and paid monthly, at the annual rate of 1.00% of the value of its average daily net
The Gabelli Dividend Growth Fund
Notes to Financial Statements (Continued)
assets. In accordance with the Advisory Agreement, the Adviser provides a continuous investment program for the Fund’s portfolio, oversees the administration of all aspects of the Fund’s business and affairs, and pays the compensation of all Officers and Trustees of the Fund who are affiliated persons of the Adviser.
Through April 30, 2023, the Adviser has agreed to waive its advisory fee and/or reimburse expenses of the Fund to the extent necessary to maintain the Fund’s annualized total operating expenses (exclusive of brokerage fees, interest, taxes, acquired fund fees and expenses, and extraordinary expenses) at no more than 2.00%, 2.00%, 2.75%, and 1.00%, respectively, of Class AAA, Class A, Class C, and Class I Shares’ average daily net assets. During the year ended December 31, 2022, the Adviser reimbursed expenses in the amount of $99,037. The Fund has agreed, during the two year period following any waiver or reimbursement by the Adviser, to repay such amount to the extent, that after giving effect to the repayment, such adjusted annualized total operating expenses of the Fund would not exceed the foregoing respective percentage limitations, after giving effect to the recovery by the Adviser. At December 31, 2022, the cumulative amount which the Fund may repay the Adviser is $170,569. The amended agreement is renewable annually.
| For the year ended December 31, 2021, expiring December 31, 2023 | | | $ | 71,532 | |
| For the year ended December 31, 2022, expiring December 31, 2024 | | | | 99,037 | |
| | | | $ | 170,569 | |
4. Distribution Plan. The Fund’s Board has adopted a distribution plan (the Plan) for each class of shares, except for Class I Shares, pursuant to Rule 12b-1 under the 1940 Act. Under the Class AAA, Class A, and Class C Share Plans, payments are authorized to G.distributors, LLC (the Distributor), an affiliate of the Adviser, at annual rates of 0.25%, 0.25%, and 1.00%, respectively, of the average daily net assets of those classes, the annual limitations under each Plan. Such payments are accrued daily and paid monthly.
5. Portfolio Securities. Purchases and sales of securities during the year ended December 31, 2022, other than short term securities and U.S. Government obligations, aggregated $3,925,160 and $5,279,925, respectively.
6. Transactions with Affiliates and Other Arrangements. During the year ended December 31, 2022, the Fund paid $628 in brokerage commissions on security trades to G.research, LLC, an affiliate of the Adviser. Additionally, the Distributor retained a total of $1,330 from investors representing commissions (sales charges and underwriting fees) on sales and redemptions of Fund shares.
During the year ended December 31, 2022, the Fund received credits from a designated broker who agreed to pay certain Fund operating expenses. The amount of such expenses paid through this directed brokerage arrangement during this period was $1,705.
The cost of calculating the Fund’s NAV per share is a Fund expense pursuant to the Advisory Agreement. Under the sub-administration agreement with Bank of New York Mellon, the fees paid include the cost of calculating the Fund’s NAV. The Fund reimburses the Adviser for this service. The Adviser did not seek a reimbursement during the year ended December 31, 2022.
The Fund pays retainer and per meeting fees to Trustees not affiliated with the Adviser, plus specified amounts to the Lead Trustee and Audit Committee Chairman. Trustees are also reimbursed for out of pocket expenses incurred in attending meetings. Trustees who are directors or employees of the Adviser or an affiliated company receive no compensation or expense reimbursement from the Fund.
The Gabelli Dividend Growth Fund
Notes to Financial Statements (Continued)
7. Line of Credit. The Fund participates in an unsecured line of credit, which expires on March 1, 2023 and may be renewed annually, of up to $75,000,000 under which it may borrow up to 10% of its net assets from the bank for temporary borrowing purposes. Borrowings under this arrangement bear interest at a floating rate equal to the higher of the Overnight Federal Funds Rate plus 135 basis points or the Overnight Bank Funding Rate plus 135 basis points in effect on that day. This amount, if any, would be included in “Interest expense” in the Statement of Operations. During the year ended December 31, 2022, there were no borrowings under the line of credit.
The average daily amount of borrowings outstanding under the line of credit for the five days of borrowings during the year ended December 31, 2022 was $252,200 with a weighted average interest rate of 5.44%. The maximum amount borrowed at any time during the year ended December 31, 2022 was $313,000.
8. Shares of Beneficial Interest. The Fund offers four classes of shares – Class AAA Shares, Class A Shares, Class C Shares, and Class I Shares. Class AAA and Class I Shares are offered without a sales charge. Class A Shares are subject to a maximum front-end sales charge of 5.75%, and Class C Shares are subject to a 1.00% contingent deferred sales charge for one year after purchase.
The Fund imposes a redemption fee of 2.00% on all classes of shares that are redeemed or exchanged on or before the seventh day after the date of a purchase. The redemption fee is deducted from the proceeds otherwise payable to the redeeming shareholders and is retained by the Fund as an increase in paid-in capital. The redemption fees retained by the Fund during the years ended December 31, 2022 and 2021, if any, can be found in the Statement of Changes in Net Assets under Redemption Fees.
The Gabelli Dividend Growth Fund
Notes to Financial Statements (Continued)
Transactions in shares of beneficial interest were as follows:
| | | Year Ended
December 31, 2022 | | | Year Ended
December 31, 2021 | |
| | | Shares | | | Amount | | | Shares | | | Amount | |
| Class AAA | | | | | | | | | | | | | | | | |
| Shares sold | | | 37,345 | | | $ | 610,046 | | | | 42,275 | | | $ | 825,320 | |
| Shares issued upon reinvestment of distributions | | | 14,051 | | | | 226,133 | | | | 84,855 | | | | 1,553,697 | |
| Shares redeemed | | | (66,074 | ) | | | (1,116,937 | ) | | | (73,307 | ) | | | (1,404,158 | ) |
| Net increase/(decrease) | | | (14,678 | ) | | $ | (280,758 | ) | | | 53,823 | | | $ | 974,859 | |
| Class A | | | | | | | | | | | | | | | | |
| Shares sold | | | 28,255 | | | $ | 463,149 | | | | 22,301 | | | $ | 433,319 | |
| Shares issued upon reinvestment of distributions | | | 2,354 | | | | 37,734 | | | | 14,318 | | | | 261,314 | |
| Shares redeemed | | | (28,353 | ) | | | (480,908 | ) | | | (17,823 | ) | | | (340,893 | ) |
| Net increase | | | 2,256 | | | $ | 19,975 | | | | 18,796 | | | $ | 353,740 | |
| Class C | | | | | | | | | | | | | | | | |
| Shares sold | | | 11,670 | | | $ | 162,551 | | | | 5,925 | | | $ | 101,148 | |
| Shares issued upon reinvestment of distributions | | | 797 | | | | 10,957 | | | | 7,084 | | | | 111,720 | |
| Shares redeemed | | | (26,914 | ) | | | (383,580 | ) | | | (7,710 | ) | | | (128,347 | ) |
| Net increase/(decrease) | | | (14,447 | ) | | $ | (210,072 | ) | | | 5,299 | | | $ | 84,521 | |
| Class I | | | | | | | | | | | | | | | | |
| Shares sold | | | 27,499 | | | $ | 464,491 | | | | 30,721 | | | $ | 587,499 | |
| Shares issued upon reinvestment of distributions | | | 4,389 | | | | 70,392 | | | | 27,110 | | | | 498,013 | |
| Shares redeemed | | | (145,764 | ) | | | (2,541,957 | ) | | | (27,849 | ) | | | (538,512 | ) |
| Net increase/(decrease) | | | (113,876 | ) | | $ | (2,007,074 | ) | | | 29,982 | | | $ | 547,000 | |
9. Indemnifications. The Fund enters into contracts that contain a variety of indemnifications. The Fund’s maximum exposure under these arrangements is unknown. However, the Fund has not had prior claims or losses pursuant to these contracts. Management has reviewed the Fund’s existing contracts and expects the risk of loss to be remote.
10. Subsequent Events. Management has evaluated the impact on the Fund of all subsequent events occurring through the date the financial statements were issued and has determined that there were no subsequent events requiring recognition or disclosure in the financial statements.
The Gabelli Dividend Growth Fund
Report of Independent Registered Public Accounting Firm
To the Shareholders and the Board of Trustees of
The Gabelli Dividend Growth Fund
Opinion on the Financial Statements
We have audited the accompanying statement of assets and liabilities of The Gabelli Dividend Growth Fund (the “Fund”), including the schedule of investments, as of December 31, 2022, and the related statement of operations for the year then ended, the statements of changes in net assets for each of the two years in the period then ended, the financial highlights for each of the five years in the period then ended and the related notes (collectively referred to as the “financial statements”). In our opinion, the financial statements present fairly, in all material respects, the financial position of the Fund at December 31, 2022, the results of its operations for the year then ended, the changes in its net assets for each of the two years in the period then ended and its financial highlights for each of the five years in the period then ended, in conformity with U.S. generally accepted accounting principles.
Basis for Opinion
These financial statements are the responsibility of the Fund’s management. Our responsibility is to express an opinion on the Fund’s financial statements based on our audits. We are a public accounting firm registered with the Public Company Accounting Oversight Board (United States) (“PCAOB”) and are required to be independent with respect to the Fund in accordance with the U.S. federal securities laws and the applicable rules and regulations of the Securities and Exchange Commission and the PCAOB.
We conducted our audits in accordance with the standards of the PCAOB. Those standards require that we plan and perform the audit to obtain reasonable assurance about whether the financial statements are free of material misstatement, whether due to error or fraud. The Fund is not required to have, nor were we engaged to perform, an audit of the Fund’s internal control over financial reporting. As part of our audits, we are required to obtain an understanding of internal control over financial reporting, but not for the purpose of expressing an opinion on the effectiveness of the Fund’s internal control over financial reporting. Accordingly, we express no such opinion.
Our audits included performing procedures to assess the risks of material misstatement of the financial statements, whether due to error or fraud, and performing procedures that respond to those risks. Such procedures included examining, on a test basis, evidence regarding the amounts and disclosures in the financial statements. Our procedures included confirmation of securities owned as of December 31, 2022, by correspondence with the custodian. Our audits also included evaluating the accounting principles used and significant estimates made by management, as well as evaluating the overall presentation of the financial statements. We believe that our audits provide a reasonable basis for our opinion.

We have served as the auditor of one or more Gabelli Funds investment companies since 1992.
New York, New York
March 1, 2023
The Gabelli Dividend Growth Fund
Liquidity Risk Management Program (Unaudited)
In accordance with Rule 22e-4 under the 1940 Act, the Fund has established a liquidity risk management program (the LRM Program) to govern its approach to managing liquidity risk. The LRM Program is administered by the Liquidity Committee (the Committee), which is comprised of members of Gabelli Funds, LLC management. The Board has designated the Committee to administer the LRM Program.
The LRM Program’s principal objectives include supporting the Fund’s compliance with limits on investments in illiquid assets and mitigating the risk that the Fund will be unable to meet its redemption obligations in a timely manner. The LRM Program also includes elements that support the management and assessment of liquidity risk, including an annual assessment of factors that influence the Fund’s liquidity and the monthly classification and re-classification of certain investments that reflect the Committee’s assessment of their relative liquidity under current market conditions.
At a meeting of the Board held on August 17, 2022, the Board received a written report from the Committee regarding the design and operational effectiveness of the LRM Program. The Committee determined, and reported to the Board, that the LRM Program is reasonably designed to assess and manage the Fund’s liquidity risk and has operated adequately and effectively since its implementation. The Committee reported that there were no liquidity events that impacted the Fund or its ability to timely meet redemptions without dilution to existing shareholders. The Committee noted that the Fund is primarily invested in highly liquid securities and, accordingly, continues to be exempt from the requirement to determine a “highly liquid investment minimum” as defined in the Rule 22e-4. Because of that continued qualification for the exemption, the Fund has not adopted a “highly liquid investment minimum” amount. The Committee further noted that while changes to the LRM Program were made during the Review Period and reported to the Board, no material changes were made to the LRM Program as a result of the Committee’s annual review.
There can be no assurance that the LRM Program will achieve its objectives in the future. Please refer to the Fund’s Prospectus for more information regarding its exposure to liquidity risk and other principal risks to which an investment in the Fund may be subject.
The Gabelli Dividend Growth Fund
Additional Fund Information (Unaudited)
The business and affairs of the Fund are managed under the direction of the Fund’s Board of Trustees. Information pertaining to the Trustees and Officers of the Fund is set forth below. The Fund’s Statement of Additional Information includes additional information about the Fund’s Trustees and is available without charge, upon request, by calling 800-GABELLI (800-422-3554) or by writing to The Gabelli Dividend Growth Fund at One Corporate Center, Rye, NY 10580-1422.
Name, Position(s)
Address1
and Year of Birth | | Term of Office
and
Length of
Time Served2 | | Number of
Funds
in Fund
Complex
Overseen
by Trustee3 | | Principal Occupation(s)
During Past Five Years | | Other Directorships
Held by Trustee3 |
| INTERESTED TRUSTEE4: | | | | | | |
Mario J. Gabelli, CFA
Trustee
1942 | | Since 1999 | | 31 | | Chairman, Chief Executive Officer, and Chief Investment Officer– Value Portfolios of GAMCO Investors, Inc. and Chief Investment Officer – Value Portfolios of Gabelli Funds, LLC and GAMCO Asset Management, Inc.; Director/ Trustee or Chief Investment Officer of other registered investment companies within the Gabelli Fund Complex; Chief Executive Officer of GGCP, Inc.; Executive Chairman of Associated Capital Group, Inc. | | Director of Morgan Group Holding, Co. (holding company) (2001-2019); Chairman of the Board and Chief Executive Officer of LICT Corp. (multimedia and communication services company); Director of CIBL, Inc. (broadcasting and wireless communications); Director of ICTC Group Inc. (communications) (2013-2018) |
| INDEPENDENT TRUSTEES5: | | | | | | |
Anthony J. Colavita6
Trustee
1935 | | Since 1999 | | 18 | | President of the law firm of Anthony J. Colavita, P.C. | | — |
| | | | | | | | | |
Vincent D. Enright6
Trustee
1943 | | Since 1999 | | 17 | | Former Senior Vice President and Chief Financial Officer of KeySpan Corp. (public utility) (1994-1998) | | Director of Echo Therapeutics, Inc. (therapeutics and diagnostics) (2008-2014); Director of The LGL Group, Inc. (diversified manufacturing) (2011-2014) |
| | | | | | | | | |
Mary E. Hauck
Trustee
1942 | | Since 2000 | | 9 | | Retired Senior Manager of the Gabelli- O’Connor Fixed Income Mutual Funds Management Company | | — |
| | | | | | | | | |
Kuni Nakamura
Trustee
1968 | | Since 2009 | | 36 | | President of Advanced Polymer, Inc. (chemical manufacturing company); President of KEN Enterprises, Inc. (real estate); Trustee on Long Island University Board of Trustees; Trustee on Fordham Preparatory School Board of Trustees | | — |
The Gabelli Dividend Growth Fund
Additional Fund Information (Unaudited) (Continued)
Name, Position(s)
Address1
and Year of Birth | | Term of Office
and
Length of
Time Served2 | | Number of
Funds
in Fund
Complex
Overseen
by Trustee3 | | Principal Occupation(s)
During Past Five Years | | Other Directorships
Held by Trustee3 |
Werner J. Roeder
Trustee
1940 | | Since 2001 | | 20 | | Retired physician; Former Vice President of Medical Affairs (Medical Director) of New York Presbyterian/Lawrence Hospital (1999-2014) | | — |
The Gabelli Dividend Growth Fund
Additional Fund Information (Unaudited) (Continued)
Name, Position(s)
Address1
and Year of Birth | | Term of Office
and Length of
Time Served2 | | Principal Occupation(s)
During Past Five Years |
| OFFICERS: | | | | |
John C. Ball
President and
Treasurer
1976 | | Since 2017 | | Officer of registered investment companies within the Gabelli Fund Complex since 2017; Vice President and Assistant Treasurer of AMG Funds, 2014-2017; Chief Executive Officer, G.distributors, LLC since December 2020 |
| | | | | |
Peter Goldstein
Secretary and Vice
President
1953 | | Since 2020 | | General Counsel, GAMCO Investors, Inc. and Chief Legal Officer, Associated Capital Group, Inc. since 2021; General Counsel and Chief Compliance Officer, Buckingham Capital Management, Inc. (2012-2020); Chief Legal Officer and Chief Compliance Officer, The Buckingham Research Group, Inc. (2012-2020) |
| | | | | |
Richard J. Walz
Chief Compliance
Officer
1959 | | Since 2013 | | Chief Compliance Officer of registered investment companies within the Fund Complex since 2013 |
| 1 | Address: One Corporate Center, Rye, NY 10580-1422, unless otherwise noted. |
| 2 | Each Trustee will hold office for an indefinite term until the earliest of (i) the next meeting of shareholders, if any, called for the purpose of considering the election or re-election of such Trustee and until the election and qualification of his or her successor, if any, elected at such meeting, or (ii) the date a Trustee resigns or retires, or a Trustee is removed by the Board of Trustees or shareholders, in accordance with the Fund’s By-Laws and Agreement and Declaration of Trust. Each officer will hold office for an indefinite term until the date he or she resigns or retires or until his or her successor is elected and qualified. For Officers, includes time served in other officer positions with the Fund. |
| 3 | This column includes only directorships of companies required to report to the SEC under the Securities Exchange Act of 1934, as amended, i.e., public companies, or other investment companies registered under the 1940 Act. |
| 4 | “Interested person” of the Fund as defined in the 1940 Act. Mr. Gabelli is considered an “interested person” because of his affiliation with Gabelli Funds, LLC which acts as the Fund’s investment adviser. |
| 5 | Trustees who are not interested persons are considered “Independent” Trustees. |
| 6 | Mr. Colavita’s son, Anthony S. Colavita, serves as a director of other funds in the Gabelli Fund Complex. |
The Gabelli Dividend Growth Fund
2022 TAX NOTICE TO SHAREHOLDERS (Unaudited)
For the year ended December 31, 2022, the Fund paid to shareholders ordinary income distributions comprised of net investment income totaling $0.2620 per share for Class I and long term capital gains totaling $262,338, or the maximum allowable. The distribution of long term capital gains has been designated as a capital gain dividend by the Fund’s Board of Trustees. For the year ended December 31, 2022, 100% of the ordinary income distribution qualifies for the dividends received deduction available to corporations. The Fund designates 100% of the ordinary income distribution as qualified dividend income pursuant to the Jobs and Growth Tax Relief Reconciliation Act of 2003. The Fund designates 2.44% of the ordinary income distribution as qualified interest income pursuant to the Tax Relief, Unemployment Reauthorization, and Job Creation Act of 2010.
U.S. Government Income:
The percentage of the ordinary income distribution paid by the Fund during the year ended December 31, 2022 which was derived from U.S. Treasury securities was 0.00%. The Fund did not meet this strict requirement in 2022. The percentage of U.S. Government securities held as of December 31, 2022 was 1.0%. Due to the diversity in state and local tax law, it is recommended that you consult your personal tax adviser as to the applicability of the information provided to your specific situation.
All designations are based on financial information available as of the date of this annual report and, accordingly, are subject to change. For each item, it is the intention of the Fund to designate the maximum amount permitted under the Internal Revenue Code and the regulations thereunder.
Gabelli Funds and Your Personal Privacy
Who are we?
The Gabelli Funds are investment companies registered with the Securities and Exchange Commission under the Investment Company Act of 1940. We are managed by Gabelli Funds, LLC, which is affiliated with GAMCO Investors, Inc. that is a publicly held company with subsidiaries and affiliates that provide investment advisory services for a variety of clients.
What kind of non-public information do we collect about you if you become a fund shareholder?
If you apply to open an account directly with us, you will be giving us some non-public information about yourself. The non-public information we collect about you is:
| ● | Information you give us on your application form. This could include your name, address, telephone number, social security number, bank account number, and other information. |
| ● | Information about your transactions with us, any transactions with our affiliates, and transactions with the entities we hire to provide services to you. This would include information about the shares that you buy or redeem. If we hire someone else to provide services — like a transfer agent — we will also have information about the transactions that you conduct through them. |
What information do we disclose and to whom do we disclose it?
We do not disclose any non-public personal information about our customers or former customers to anyone other than our affiliates, our service providers who need to know such information, and as otherwise permitted by law. If you want to find out what the law permits, you can read the privacy rules adopted by the Securities and Exchange Commission. They are in volume 17 of the Code of Federal Regulations, Part 248. The Commission often posts information about its regulations on its website, www.sec.gov.
What do we do to protect your personal information?
We restrict access to non-public personal information about you to the people who need to know that information in order to provide services to you or the fund and to ensure that we are complying with the laws governing the securities business. We maintain physical, electronic, and procedural safeguards to keep your personal information.
THE GABELLI DIVIDEND GROWTH FUND
One Corporate Center
Rye, NY 10580-1422
Portfolio Management Team Biographies
Sarah Donnelly joined Gabelli in 1999 as a junior research analyst working with the consumer staples and media analysts. Currently she is a portfolio manager of Gabelli Funds, LLC, a Senior Vice President, and the Food, Household, and Personal Care products research analyst for Gabelli & Company. In 2013, she was named the Health & Wellness research platform leader. Ms. Donnelly received a BS in Business Administration with a concentration in Finance and minor in History from Fordham University.
Robert D. Leininger, CFA, joined GAMCO Investors, Inc. in 1993 as an equity analyst. Subsequently, he was a partner and portfolio manager at Rorer Asset Management before rejoining GAMCO in 2010 where he currently serves as a portfolio manager of Gabelli Funds, LLC. Mr. Leininger is a magna cum laude graduate of Amherst College with a degree in Economics and holds an MBA degree from the Wharton School at the University of Pennsylvania.
Justin Bergner, CFA, is a Vice President at Gabelli & Company and a portfolio manager for Gabelli Funds LLC. Justin rejoined Gabelli & Company in 2013 as a research analyst covering Diversified Industrials, Home Improvement, and Transport companies. He began his investment career at Gabelli & Company in 2005 as a metals and mining analyst, and subsequently spent five years at Axiom International Investors as a senior analyst focused on industrial and healthcare stocks. Prior to business school, Mr. Bergner worked in management consulting at both Bain & Company and Dean & Company. Mr. Bergner graduated cum laude from Yale University with a BA in Economics & Mathematics and received an MBA in Finance and Accounting from the Wharton School at the University of Pennsylvania.
| We have separated the portfolio managers’ commentary from the financial statements and investment portfolio due to corporate governance regulations stipulated by the Sarbanes-Oxley Act of 2002. We have done this to ensure that the contents of the portfolio managers’ commentary are unrestricted. Both the commentary and the financial statements, including the portfolios of investments, will be available on our website at www.gabelli.com. |
Item 2. Code of Ethics.
| (a) | The registrant, as of the end of the period covered by this report, has adopted a code of ethics that applies to the registrant’s principal executive officer, principal financial officer, principal accounting officer or controller, or persons performing similar functions, regardless of whether these individuals are employed by the registrant or a third party. |
| (c) | There have been no amendments, during the period covered by this report, to a provision of the code of ethics that applies to the registrant’s principal executive officer, principal financial officer, principal accounting officer or controller, or persons performing similar functions, regardless of whether these individuals are employed by the registrant or a third party, and that relates to any element of the code of ethics description. |
| (d) | The registrant has not granted any waivers, including an implicit waiver, from a provision of the code of ethics that applies to the registrant’s principal executive officer, principal financial officer, principal accounting officer or controller, or persons performing similar functions, regardless of whether these individuals are employed by the registrant or a third party, that relates to one or more of the items set forth in paragraph (b) of this item’s instructions. |
Item 3. Audit Committee Financial Expert.
As of the end of the period covered by the report, the registrant’s Board of Trustees has determined that Vincent D. Enright is qualified to serve as an audit committee financial expert serving on its audit committee and that he is “independent,” as defined by Item 3 of Form N-CSR.
Item 4. Principal Accountant Fees and Services.
Audit Fees
| (a) | The aggregate fees billed for each of the last two fiscal years for professional services rendered by the principal accountant for the audit of the registrant's annual financial statements or services that are normally provided by the accountant in connection with statutory and regulatory filings or engagements for those fiscal years are $20,600 for 2021 and $21,400 for 2022. |
Audit-Related Fees
| (b) | The aggregate fees billed in each of the last two fiscal years for assurance and related services by the principal accountant that are reasonably related to the performance of the audit of the registrant’s financial statements and are not reported under paragraph (a) of this Item are $0 for 2021 and $0 for 2022. |
Tax Fees
| (c) | The aggregate fees billed in each of the last two fiscal years for professional services rendered by the principal accountant for tax compliance, tax advice, and tax planning are $3,800 for 2021 and $3,800 for 2022. Tax fees represent tax compliance services provided in connection with the review of the Registrant's tax returns. |
All Other Fees
| (d) | The aggregate fees billed in each of the last two fiscal years for products and services provided by the principal accountant, other than the services reported in paragraphs (a) through (c) of this Item are $31 for 2021 and $31 for 2022. The fees relate to Passive Foreign Investment Company identification database subscription fees billed on an annual basis. |
| (e)(1) | Disclose the audit committee’s pre-approval policies and procedures described in paragraph (c)(7) of Rule 2-01 of Regulation S-X. |
Pre-Approval Policies and Procedures. The Audit Committee (“Committee”) of the registrant is responsible for pre-approving (i) all audit and permissible non-audit services to be provided by the independent registered public accounting firm to the registrant and (ii) all permissible non-audit services to be provided by the independent registered public accounting firm to the Adviser, Gabelli Funds, LLC, and any affiliate of Gabelli Funds, LLC (“Gabelli”) that provides services to the registrant (a “Covered Services Provider”) if the independent registered public accounting firm’s engagement related directly to the operations and financial reporting of the registrant. The Committee may delegate its responsibility to pre-approve any such audit and permissible non-audit services to the Chairperson of the Committee, and the Chairperson must report to the Committee, at its next regularly scheduled meeting after the Chairperson’s pre-approval of such services, his or her decision(s). The Committee may also establish detailed pre-approval policies and procedures for pre-approval of such services in accordance with applicable laws, including the delegation of some or all of the Committee’s pre-approval responsibilities to the other persons (other than Gabelli or the registrant’s officers). Pre-approval by the Committee of any permissible non-audit services is not required so long as: (i) the permissible non-audit services were not recognized by the registrant at the time of the engagement to be non-audit services; and (ii) such services are promptly brought to the attention of the Committee and approved by the Committee or Chairperson prior to the completion of the audit.
| (e)(2) | The percentage of services described in each of paragraphs (b) through (d) of this Item that were approved by the audit committee pursuant to paragraph (c)(7)(i)(C) of Rule 2-01 of Regulation S-X are as follows: |
(b) N/A
(c) 0%
(d) 0%
| (f) | The percentage of hours expended on the principal accountant’s engagement to audit the registrant’s financial statements for the most recent fiscal year that were attributed to work performed by persons other than the principal accountant’s full-time, permanent employees was less than fifty percent. |
| (g) | The aggregate non-audit fees billed by the registrant's accountant for services rendered to the registrant, and rendered to the registrant's investment adviser (not including any sub-adviser whose role is primarily portfolio management and is subcontracted with or overseen by another investment adviser), and any entity controlling, controlled by, or under common control with the adviser that provides ongoing services to the registrant for each of the last two fiscal years of the registrant was $44,950 for 2021 and $48,350 for 2022. |
| (h) | The registrant’s audit committee of the board of directors has considered whether the provision of non-audit services that were rendered to the registrant’s investment adviser (not including any sub-adviser whose role is primarily portfolio management and is subcontracted with or overseen by another investment adviser), and any entity controlling, controlled by, or under common control with the investment adviser that provides ongoing services to the registrant that were not pre-approved pursuant to paragraph (c)(7)(ii) of Rule 2-01 of Regulation S-X is compatible with maintaining the principal accountant’s independence. |
(i) Not Applicable.
(j) The registrant is not a foreign issuer.
Item 5. Audit Committee of Listed Registrants.
Not applicable.
Item 6. Investments.
| (a) | Schedule of Investments in securities of unaffiliated issuers as of the close of the reporting period is included as part of the report to shareholders filed under Item 1(a) of this form. |
| (b) | Not applicable due to no such divestments during the semi-annual period covered since the previous Form N-CSR filing |
Item 7. Disclosure of Proxy Voting Policies and Procedures for Closed-End Management Investment Companies.
Not applicable.
Item 8. Portfolio Managers of Closed-End Management Investment Companies.
Not applicable.
Item 9. Purchases of Equity Securities by Closed-End Management Investment Company and Affiliated Purchasers.
Not applicable.
Item 10. Submission of Matters to a Vote of Security Holders.
There have been no material changes to the procedures by which the shareholders may recommend nominees to the registrant’s Board of Trustees, where those changes were implemented after the registrant last provided disclosure in response to the requirements of Item 407(c)(2)(iv) of Regulation S-K (17 CFR 229.407) (as required by Item 22(b)(15) of Schedule 14A (17 CFR 240.14a-101)), or this Item.
Item 11. Controls and Procedures.
| (a) | The registrant’s principal executive and principal financial officers, or persons performing similar functions, have concluded that the registrant’s disclosure controls and procedures (as defined in Rule 30a-3(c) under the Investment Company Act of 1940, as amended (the “1940 Act”) (17 CFR 270.30a-3(c))) are effective, as of a date within 90 days of the filing date of the report that includes the disclosure required by this paragraph, based on their evaluation of these controls and procedures required by Rule 30a-3(b) under the 1940 Act (17 CFR 270.30a-3(b)) and Rules 13a-15(b) or 15d-15(b) under the Securities Exchange Act of 1934, as amended (17 CFR 240.13a-15(b) or 240.15d-15(b)). |
| (b) | There were no changes in the registrant’s internal control over financial reporting (as defined in Rule 30a-3(d) under the 1940 Act (17 CFR 270.30a-3(d))) that occurred during the period covered by this report that has materially affected, or is reasonably likely to materially affect, the registrant’s internal control over financial reporting. |
Item 12. Disclosure of Securities Lending Activities for Closed-End Management Investment Companies.
Not applicable.
Item 13. Exhibits.
SIGNATURES
Pursuant to the requirements of the Securities Exchange Act of 1934 and the Investment Company Act of 1940, the registrant has duly caused this report to be signed on its behalf by the undersigned, thereunto duly authorized.
| (Registrant) | | The Gabelli Dividend Growth Fund | |
| By (Signature and Title)* | | /s/ John C. Ball | |
| | | John C. Ball, Principal Executive Officer | |
Pursuant to the requirements of the Securities Exchange Act of 1934 and the Investment Company Act of 1940, this report has been signed below by the following persons on behalf of the registrant and in the capacities and on the dates indicated.
| By (Signature and Title)* | | /s/ John C. Ball | |
| | | John C. Ball, Principal Executive Officer | |
| By (Signature and Title)* | | /s/ John C. Ball | |
| | | John C. Ball, Principal Financial Officer and Treasurer | |
* Print the name and title of each signing officer under his or her signature.