MANAGEMENT’S DISCUSSION AND ANALYSIS
As at and for the years ended December 31
BASIC EARNINGS PER SHARE(1)
(Canadian $)
| • | | Basic earnings per share of $2.90, an increase of 21 per cent from 2001. Excluding non-recurring items in 2001(2), basic earnings per share increased by 15 per cent in the year |
| |
| • | | Medium-term target of 15 per cent growth in earnings per share was achieved |
| |
| • | | Five-year annual compound growth rate for earnings per share of 18 per cent |
SHAREHOLDERS’ NET INCOME(1)
(Canadian $ in millions)
| • | | 19 per cent growth in shareholders’ net income to $1,378 million. Excluding non-recurring items in 2001(2), shareholders’ net income increased by 13 per cent over 2001 |
| |
| • | | Ninth consecutive year of record earnings |
RETURN ON SHAREHOLDERS’ EQUITY(1)
(per cent)
| • | | Return on shareholders’ equity of 16.2 per cent, exceeding the Company’s 16 per cent objective. Excluding non-recurring items in
2001(2), return on shareholders’ equity was 15.9 per cent |
(1) For 1998 and 1999 — Shareholders’ net income refers to earnings from mutual operations (prior to demutualization) and net income
(1) For 1998 and 1999 —attributed to shareholders (after demutualization).
(1) For 1998 and 1999— Basic earnings per share have been calculated assuming common shares issued for demutualization and the initial
(1) For 1998 and 1999 —public offering were outstanding at the beginning of 1998 and 1999.
(2) Please refer to the Financial Performance — Consolidated Net Income section of this Management’s Discussion and Analysis.
Ratings as at March 5, 2003
The following rating agencies each assign The Manufacturers Life Insurance Company ratings within their highest range of categories, thereby recognizing the company as among the strongest in the life insurance industry.
| | | | | | | | | |
| PURPOSE | | RATING AGENCY | | RATING |
| |
| |
|
| Claims paying/Financial strength | | A.M. Best | | A++ (1st of 16 categories) |
| | | Dominion Bond Rating Service | | IC-1 (1st of 5 categories) |
| | | FitchRatings | | AA+ (2nd of 24 categories) |
| | | Moody's | | Aa2 (3rd of 21 categories) |
| | | Standard & Poor's | | AA+ (2nd of 21 categories) |
28
| • | | $4.1 billion increase in total premiums and deposits, up 16 per cent |
| |
| • | | 21 per cent growth in segregated fund deposits |

| • | | $4 billion increase in funds under management |
| |
| • | | Strong growth from premiums and deposits was mostly offset by the decline in equity values |
| • | | Repurchased $726 million of Manulife’s common shares |
| |
| • | | Total equity of $8.7 billion |
| |
| • | | Total capital of $12.0 billion |
| |
| • | | As at December 31, 2002, The Manufacturers Life Insurance Company’s MCCSR was 235 per cent |
The Minimum Continuing Capital and Surplus Requirements (“MCCSR”) is a measure of a company’s capital strength. The Manufacturers Life Insurance Company’s MCCSR was 235 per cent at year-end 2002, well above the minimum prescribed by the Office of the Superintendent of Financial Institutions (Canada).
| | | | | | | | | | | | | |
| MCCSR | | | | | | | | | | | | |
| Year | | Ratio | | Required Capital | | Available Capital |
| |
| |
| |
|
| 2002 | | | 235% | | | $4.5 billion | | $10.6 billion |
| 2001 | | | 236% | | | $4.4 billion | | $10.3 billion |
| 2000 | | | 238% | | | $3.4 billion | | $8.0 billion |
| 1999 | | | 239% | | | $3.3 billion | | $7.9 billion |
| 1998 | | | 255% | | | $3.0 billion | | $7.7 billion |
29
FINANCIAL PERFORMANCE
Canadian generally accepted accounting principles (“GAAP”) require the presentation of financial information in discrete segments. The Company views the contracts comprising the general fund, segregated funds and other funds under management as alternative offerings that are managed interdependently. The reason for this is that there are transfer options between the general fund and the segregated funds as a result of a policyholder’s ability to change investment options or products. Fee income for investment management and administrative services provided to segregated funds is recorded in the general fund.
As a result of similarities between general fund, segregated fund and mutual fund products from a business perspective and the many interdependencies, the Company measures certain key business indicators in aggregate. These key business indicators are:
| (1) | | Growth of total premiums and deposits, and |
| |
| (2) | | Growth in funds under management. |
Taxes, levies and assessments are a significant component of Manulife Financial’s expenses. In addition to income and capital-based taxes, the Company is subject to other taxes reported as part of the Company’s operating expenses, including property and business taxes, premium taxes, employer payroll taxes, commodity and consumption taxes, and Canadian investment income taxes. Total taxes, levies and assessments, excluding income and certain capital-based taxes, which are recorded separately as income taxes in the Consolidated Statements of Operations, amounted to $315 million in 2002.
CONSOLIDATED NET INCOME
Manulife Financial reported record earnings in 2002 as shareholders’ net income increased by 19 per cent to $1,378 million compared to $1,159 million reported in 2001. Earnings per share grew by 21 per cent to $2.90 from $2.40 in 2001. Shareholders’ net income in 2001 included non-recurring items, which in aggregate reduced net income by $64 million.
Excluding these non-recurring items, shareholders’ net income increased by 13 per cent to $1,378 million from $1,223 million in 2001. This increase in earnings was driven by very good claims experience in U.S. Insurance and Canadian Group Benefits, business growth in Hong Kong Insurance and the Property and Casualty and Structured Reinsurance lines, together with tight management of expenses across the Company. However, earnings were dampened by the impact of poor equity markets and surrenders from the block of policies acquired from Daihyaku Mutual Life Insurance Company (“Daihyaku”), which was not fully offset by growth in new sales in Japan.
The 2001 non-recurring items related to provisions of $150 million for anticipated claims arising from the terrorist events in the United States on September 11, 2001, mitigated by a $27 million gain from the disposition of a portion of the Company’s investment in Seamark Asset Management Ltd. (“Seamark”), and two tax related items, which totaled $59 million.
In 2002, the Company achieved its medium-term targets of 16 per cent return on share-holders’equity and 15 per cent growth in earnings per share. The return on shareholders’ equity for the year ended December 31, 2002 was 16.2 per cent compared to 15.1 per cent for 2001. Earnings per share for the year ended December 31, 2002 were $2.90 compared to $2.40 for 2001, an increase of 21 per cent, reflecting the higher earnings together with the favourable impact of common share repurchases during the year. Excluding the nonrecurring items, 2001 return on shareholders’equity and earnings per share were 15.9 per cent and $2.53, respectively.
30
SUMMARY STATEMENT OF OPERATIONS
| | | | | | | | | | | | | |
| For the years ended December 31 | | | | | | | | | | | | |
| (Canadian $ in millions, unless otherwise stated) | | 2002 | | 2001 | | 2000 |
| |
| |
| |
|
| Premium income | | $ | 10,779 | | | $ | 10,247 | | | $ | 8,515 | |
| Investment income | | | 4,235 | | | | 4,479 | | | | 4,350 | |
| Other revenue | | | 1,518 | | | | 1,505 | | | | 1,287 | |
| | | |
| | | |
| | | |
| |
| Total revenue | | $ | 16,532 | | | $ | 16,231 | | | $ | 14,152 | |
| | | |
| | | |
| | | |
| |
| Policy benefits | | $ | 10,670 | | | $ | 10,826 | | | $ | 9,335 | |
| General expenses | | | 2,490 | | | | 2,478 | | | | 2,191 | |
| Commissions | | | 1,207 | | | | 1,133 | | | | 1,086 | |
| Interest expense | | | 243 | | | | 257 | | | | 191 | |
| Premium taxes | | | 111 | | | | 105 | | | | 96 | |
| Non-controlling interest in subsidiaries | | | 72 | | | | 4 | | | | (151 | ) |
| Trust preferred securities issued by subsidiaries | | | 65 | | | | 65 | | | | 63 | |
| | | |
| | | |
| | | |
| |
| Total policy benefits and expenses | | $ | 14,858 | | | $ | 14,868 | | | $ | 12,811 | |
| | | |
| | | |
| | | |
| |
| Income before income taxes | | $ | 1,674 | | | $ | 1,363 | | | $ | 1,341 | |
| Income taxes | | | (304 | ) | | | (196 | ) | | | (273 | ) |
| | | |
| | | |
| | | |
| |
| Net income | | $ | 1,370 | | | $ | 1,167 | | | $ | 1,068 | |
| Less: net income (loss) attributed to participating policyholders | | | (8 | ) | | | 8 | | | | (7 | ) |
| | | |
| | | |
| | | |
| |
| Net income attributed to shareholders | | $ | 1,378 | | | $ | 1,159 | | | $ | 1,075 | |
| | | |
| | | |
| | | |
| |
| Basic earnings per share | | $ | 2.90 | | | $ | 2.40 | | | $ | 2.22 | |
| | | |
| | | |
| | | |
| |
PREMIUMS AND DEPOSITS
Premiums and deposits increased by 16 per cent to $29.9 billion in 2002 compared to $25.8 billion for the year ended December 31, 2001. Segregated fund deposits increased by 21 per cent to $17.0 billion in 2002 from $14.0 billion in 2001, primarily due to record sales of 401(k) pension products and a 25 per cent increase in variable annuity deposits in the United States. General fund premiums increased five per cent to $10.8 billion in 2002 from $10.2 billion in 2001. This increase is due to business growth in Asia, higher Property and Casualty premiums in Reinsurance Division, and higher Individual Insurance and Group Benefits premiums together with strong sales of guaranteed products in Canada. This increase in general fund premiums was partially offset by reduced client utilization of the variable annuity dollar-cost-averaging program in the United States, which allows pre-authorized periodic transfers from the fixed-rate general fund portfolio to a segregated fund.
PREMIUMS AND DEPOSITS
| | | | | | | | | | | | | |
| For the years ended December 31 | | | | | | | | | | | | |
| (Canadian $ in millions) | | 2002 | | 2001 | | 2000 |
| |
| |
| |
|
| General fund premiums | | $ | 10,779 | | | $ | 10,247 | | | $ | 8,515 | |
| Segregated fund deposits | | | 17,013 | | | | 14,044 | | | | 14,777 | |
| Mutual fund deposits | | | 1,251 | | | | 754 | | | | 630 | |
| ASO premium equivalents | | | 860 | | | | 795 | | | | 643 | |
| | | |
| | | |
| | | |
| |
| Total | | $ | 29,903 | | | $ | 25,840 | | | $ | 24,565 | |
| | | |
| | | |
| | | |
| |
31
INVESTMENT INCOME
Investment income decreased to $4.2 billion in 2002 from $4.5 billion in 2001. The favourable impact of a higher average level of fixed-income investments, with lower yields, was more than offset by the effect of weak equity markets and higher provisions. As at December 31, 2002, approximately 34 per cent of stocks supported the Company’s participating policies and the impact of a decrease in investment income from these stocks was substantially offset by a change in actuarial liabilities. The remaining 66 per cent of stocks supported other actuarial liabilities and the Company’s capital. Investment income on these stocks impacts the Company’s net income over time.
Provisions against impaired assets increased to $197 million in 2002 from $99 million in 2001, primarily due to the establishment of $220 million in specific provisions in the second quarter of 2002 against certain investments in the telecommunications sector, partially offset by recoveries related to bonds in other sectors, including investments in Californian utilities. As a result of the aforementioned and lower yields, total investment yield for the Company decreased to 5.93 per cent from 6.90 per cent in 2001.
INVESTMENT INCOME
| | | | | | | | | | | | | |
| For the years ended December 31 | | | | | | | | | | | | |
| (Canadian $ in millions) | | 2002 | | 2001 | | 2000 |
| |
| |
| |
|
| Gross investment income before: | | $ | 4,019 | | | $ | 3,962 | | | $ | 3,807 | |
| Provisions for impaired assets | | | (197 | ) | | | (99 | ) | | | (100 | ) |
| Amortization of net realized and unrealized gains | | | 413 | | | | 616 | | | | 643 | |
| | | |
| | | |
| | | |
| |
| Total | | $ | 4,235 | | | $ | 4,479 | | | $ | 4,350 | |
| | | |
| | | |
| | | |
| |
| Yield | | | 5.93 | % | | | 6.90 | % | | | 8.58 | % |
| | | |
| | | |
| | | |
| |
OTHER REVENUE
Other revenue remained unchanged at $1.5 billion in 2002. Included in other revenue, fee income increased by six per cent to $1.4 billion, primarily due to the management of a higher average level of segregated fund assets in 2002. The impact of higher fees was offset by the 2001 one-time gain from the sale of a portion of the Company’s investment in Seamark and the settlement of a tax case in Canada related to the capital tax treatment of deferred realized gains.
POLICY BENEFITS AND EXPENSES
Policy benefits decreased slightly to $10.7 billion in 2002 from $10.8 billion in 2001.
A decrease in transfers to segregated funds was significantly offset by an increase in actuarial liabilities.Transfers to segregated funds declined $814 million to $656 million in 2002, reflecting equity market volatility and investors’ preference for fixed-income products. Actuarial liabilities increased by $515 million to $307 million in 2002, reflecting higher general fund premiums, and lower surrenders in Japan and in the Canadian wealth management operations.
Policyholder dividends and experience rating refunds increased by four per cent to $932 million in 2002 from $900 million in 2001, primarily due to continued growth in cash values of participating policies.
General expenses remained unchanged at $2.5 billion in 2002. Lower fixed costs were offset by higher variable costs related to increased business activity. Commissions increased by seven per cent to $1.2 billion in 2002,primarily due to higher individual insurance sales
32
in the United States, Canada and Hong Kong and higher U.S. pension sales. This increase was partially offset by lower commissions in Hong Kong Pensions, which were uniquely high in 2001 due to the launch of the Mandatory Provident Fund business.
Interest expense decreased by five per cent to $243 million in 2002 from $257 million in 2001, primarily due to a decline in interest rates. Premium taxes increased by six per cent to $111 million from $105 million in 2001, due to an increase in premiums.
Non-controlling interest in subsidiaries increased to $72 million compared to $4 million in 2001. This increase related to the fixed cash distributions to the holders of Manulife Financial Capital Securities, which were issued in December 2001.
Income taxes increased to $304 million in 2002 from $246 million in 2001, after excluding the non-recurring tax items for 2001. The Company’s 2002 provision for income taxes of $304 million is comprised of $9 million of current taxes recoverable and $313 million of future taxes. The increase in the income tax expense was consistent with the increase in earnings and reflected the mix of earnings derived in tax jurisdictions with differing income tax rates and regulations.
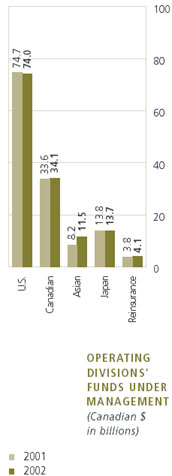
FUNDS UNDER MANAGEMENT
Funds under management increased by $4.0 billion to $146.2 billion in 2002 from $142.2 billion in 2001.General fund assets grew by $2.6 billion to $81.2 billion as at December 31, 2002 from $78.6 billion as at December 31, 2001. This reflects the acquisition of Zurich Canada, and growth in insurance businesses, particularly in Asia, partially offset by the scheduled transfer of the U.S. variable annuity business’ dollar-cost-averaging assets to segregated funds.
Segregated fund assets decreased marginally to $58.8 billion as at December 31, 2002 from $59.2 billion as at December 31, 2001. This decrease was primarily due to strong net deposits of U.S. 401(k) pension and variable annuity products and increased Mandatory Provident Fund deposits in Hong Kong, more than offset by a reduction in the market value of assets as a result of continued weak equity market performance.
Segregated fund assets, mutual fund assets and other managed funds are not available to satisfy the liabilities of the Company’s general fund.
Other managed funds represent pension funds, pooled funds, endowment funds and other institutional funds managed by the Company on behalf of others.
| | | | | | | | | | | | | |
| As at December 31 | | | | | | | | | | | | |
| (Canadian $ in millions) | | 2002 | | 2001 | | 2000 |
| |
| |
| |
|
| General fund | | $ | 81,195 | | | $ | 78,613 | | | $ | 60,067 | |
| Segregated funds | | | 58,831 | | | | 59,206 | | | | 54,908 | |
| Mutual and other managed funds(1) | | | 6,149 | | | | 4,363 | | | | 8,545 | |
| | | |
| | | |
| | | |
| |
| Total | | $ | 146,175 | | | $ | 142,182 | | | $ | 123,520 | |
| | | |
| | | |
| | | |
| |
| (1) | | Other managed funds included Seamark third party managed funds of $4,288 as at December 31, 2000. Disposition of a portion of the Company’s controlling interest in Seamark occurred in July 2001, at which time the Company ceased consolidation of the assets and liabilities and results of operations of Seamark and commenced accounting for this investment on an equity basis. |
33
DIFFERENCES BETWEEN CANADIAN AND U.S. GAAP
The consolidated financial statements of Manulife Financial are presented in accordance with Canadian GAAP. Canadian GAAP differs in certain significant respects from U.S. GAAP.
The differences between Canadian GAAP and U.S. GAAP include accounting for premiums and deposits, invested assets, investment income and segregated funds. There are also differences in the calculation and accounting for actuarial liabilities and differences in reporting policy cash flows. These differences are described in more detail in note 17 to the consolidated financial statements.
DIFFERENCES BETWEEN CANADIAN AND HONG KONG GAAP
The consolidated financial statements of Manulife Financial are presented in accordance with Canadian GAAP. Canadian GAAP differs in certain respects from Hong Kong GAAP.
In Hong Kong, there are no accounting standards specific to life insurance companies; consequently, companies have more discretion in selecting appropriate accounting principles to prepare financial statements. The Canadian GAAP requirements for life insurance enterprises used by the Company in relation to fixed-interest investments, non-invested assets and non-actuarial liabilities are generally considered acceptable within the Hong Kong accounting framework. Stocks held on a long-term basis are carried at market value as compared to Canadian GAAP where stocks are carried on a moving average market basis. The computation of actuarial liabilities in Hong Kong is governed by the requirements of the Hong Kong Insurance Authority. In certain interest rate environments, actuarial liabilities determined in accordance with Hong Kong GAAP may be higher than actuarial liabilities computed in accordance with Canadian GAAP.
The Hong Kong Insurance Authority requires that insurance companies meet minimum solvency requirements. Each year, the Company compares the amount of net assets prepared in accordance with Canadian GAAP, as reported in the Company’s annual regulatory return, with the minimum solvency margin required in Hong Kong. As at December 31, 2002, the Company’s net assets determined in accordance with Canadian GAAP exceeded the minimum solvency margin required in Hong Kong.
34
U.S. DIVISION
U.S. Division provides insurance and wealth management products and services to select markets. The Division’s Insurance operations focus on the sale of life insurance products to high net-worth individuals. Wealth management services include the operations of Group Pensions, concentrating on 401(k) plans for small and medium-sized businesses, and Individual Wealth Management operations that offers variable annuities, College Savings 529 plans and personalized Private Account investment products primarily to middle- and upper-income individuals.
FINANCIAL PERFORMANCE
U.S. Division’s net income was $471 million in 2002 compared to $373 million in 2001, an increase of $98 million or 26 per cent. The increase in earnings was due to very good claims experience, continued tight management of expenses, growth in business and increased profit margins. The increase in earnings was partially offset by the impact of poor equity markets and start-up costs associated with the College Savings 529 plan and Private Account businesses.
In 2002,U.S. Division contributed 34 per cent of the Company’s shareholders’ net income, 59 per cent of total premiums and deposits and as at December 31,2002, accounted for 51 per cent of the Company’s funds under management.
SUMMARY STATEMENT OF OPERATIONS
| | | | | | | | | | | | | |
| For the years ended December 31 | | | | | | | | | | | | |
| (Canadian $ in millions) | | 2002 | | 2001 | | 2000 |
| |
| |
| |
|
| Premium income | | $ | 3,555 | | | $ | 3,836 | | | $ | 3,348 | |
| Investment income | | | 1,773 | | | | 1,942 | | | | 1,925 | |
| Other revenue | | | 998 | | | | 939 | | | | 885 | |
| | | |
| | | |
| | | |
| |
| Total revenue | | $ | 6,326 | | | $ | 6,717 | | | $ | 6,158 | |
| | | |
| | | |
| | | |
| |
| Policy benefits | | $ | 4,155 | | | $ | 4,697 | | | $ | 4,055 | |
| General expenses | | | 856 | | | | 830 | | | | 759 | |
| Commissions | | | 620 | | | | 572 | | | | 600 | |
| Other | | | 62 | | | | 94 | | | | 99 | |
| | | |
| | | |
| | | |
| |
| Total policy benefits and expenses | | $ | 5,693 | | | $ | 6,193 | | | $ | 5,513 | |
| | | |
| | | |
| | | |
| |
| Income before income taxes | | $ | 633 | | | $ | 524 | | | $ | 645 | |
| Income taxes | | | (162 | ) | | | (151 | ) | | | (168 | ) |
| | | |
| | | |
| | | |
| |
| Net income attributed to shareholders | | $ | 471 | | | $ | 373 | | | $ | 477 | |
| | | |
| | | |
| | | |
| |
PREMIUMS AND DEPOSITS
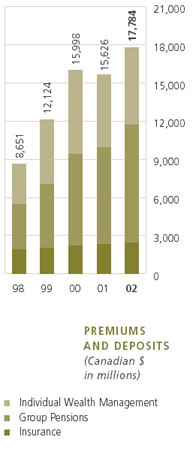
Premiums and deposits increased by 14 per cent to $17.8 billion in 2002 from the $15.6 billion reported in 2001,despite a difficult operating environment. Excellent growth in 401(k) pension deposits, strong growth in universal life premiums and a solid increase in variable annuity sales contributed to the higher volume. The growth in premiums and deposits reflects U.S. Division’s diverse distribution capabilities and continued delivery of innovative products and superior customer service.
General fund premiums declined by seven per cent, with strong universal life premiums more than offset by reduced client utilization of the dollar-cost-averaging program in the variable annuity business, which allows pre-authorized periodic transfers from the fixed-rate general fund portfolio to segregated funds.
35
Segregated fund deposits increased by 21 per cent during 2002, driven by strong sales in wealth management operations. Deposits related to the 401(k) pension business grew by $1.5 billion to a record $8.9 billion, a 20 per cent increase over 2001, reflecting the ongoing successful penetration of the broker-dealer market and continued strong sales from the Third Party Administrator channel. Variable annuity deposits increased by $949 million over 2001 to $4.8 billion with the success of the new Venture III product, a key factor in driving growth despite very difficult equity market conditions.
PREMIUMS AND DEPOSITS
| | | | | | | | | | | | | |
| For the years ended December 31 | | | | | | | | | | | | |
| (Canadian $ in millions) | | 2002 | | 2001 | | 2000 |
| |
| |
| |
|
| Premiums | | $ | 3,555 | | | $ | 3,836 | | | $ | 3,348 | |
| Segregated fund deposits | | | 14,229 | | | | 11,790 | | | | 12,650 | |
| | | |
| | | |
| | | |
| |
| Total premiums and deposits | | $ | 17,784 | | | $ | 15,626 | | | $ | 15,998 | |
| | | |
| | | |
| | | |
| |
FUNDS UNDER MANAGEMENT
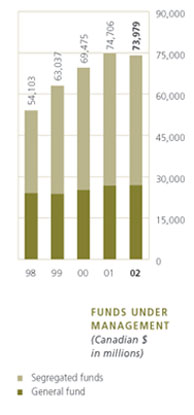
Funds under management of $74.0 billion ended the year $0.7 billion lower than in 2001.
Segregated funds under management of $47.2 billion were slightly lower than 2001 levels, despite strong net deposits of $8.4 billion, driven by record sales of 401(k) pension products and strong sales of variable annuity products. This growth was more than offset by the decline in equity values.
General fund assets were comparable to 2001 levels. The favourable impact of strong universal life insurance sales was fully offset by the scheduled transfer of the variable annuity business’ dollar-cost-averaging assets to segregated funds.
FUNDS UNDER MANAGEMENT
| | | | | | | | | | | | | |
| As at December 31 | | | | | | | | | | | | |
| (Canadian $ in millions) | | 2002 | | 2001 | | 2000 |
| |
| |
| |
|
| General fund | | $ | 26,790 | | | $ | 26,731 | | | $ | 25,105 | |
| Segregated funds | | | 47,189 | | | | 47,975 | | | | 44,370 | |
| | | |
| | | |
| | | |
| |
| Total funds under management | | $ | 73,979 | | | $ | 74,706 | | | $ | 69,475 | |
| | | |
| | | |
| | | |
| |
MOVING FORWARD
Distribution relationships, product innovation and service excellence continue to be the focus of the U.S. Division. In 2003, the Division will expand and build on these strengths.
Product development plans for 2003 include initiatives by Group Pensions to penetrate the upper end of the small case 401(k) market, while Insurance will expand its offerings with the launch of a new universal life product designed to provide lower cost coverage to consumers – this product will supplement Insurance’s current universal life offerings. The new universal life product, in addition to a refreshed survivorship universal life offering, will complement Insurance’s 2002 product initiatives, which have positioned the portfolio of variable universal life products to take full advantage of a recovery in equity markets.
In 2003, Individual Wealth Management will refresh its variable annuity portfolio to provide clients with attractive offerings while carefully managing the risk profile of its product portfolio in the current challenging equity market environment. In addition, Individual Wealth Management will look to further enhance both its College Savings 529 plan and Private Account product lines through the inclusion of new investment managers and additional portfolio offerings.
36
Distribution and service developments in 2003 include initiatives by Group Pensions to maintain its strong relationships with Third Party Administrators while continuing to penetrate the broker-dealer network. Group Pensions is committed to expanding its service to include increased participant communication and educational programs, as well as additional service support for key producers. Insurance will continue to build on its broad-based multi-channel distribution system by investing in a series of programs to augment service and support to policyholders and key firms. These initiatives include enhanced compensation programs, additional account management to support top distribution partners, and improved functionality for sales compensation and Web-based systems.
As a result of its new Scudder Investments relationship,Individual Wealth Management is well positioned in 2003 to enhance its presence within the variable annuity marketplace and to gradually decrease unit costs. While continuing to investigate new opportunities, Individual Wealth Management will also strengthen its existing distribution networks through enhanced service delivery.
Variable annuity services will be augmented to provide clients with increased information access and data management capabilities, while expanded College Savings 529 plan services will include enhanced client and broker system functionality, customized sales tools and continued product education.
In 2003, the new Private Account business will focus on establishing additional distribution arrangements as well as implementing an on-line sales proposal system and a Web-based client application process.
37
CANADIAN DIVISION
Canadian Division is one of the leading life insurance-based financial services organizations in Canada. Its individual wealth management product offerings include variable and fixed annuities, individual investment and banking products and mutual funds. Individual life insurance products are aimed at middle- and upper-income individuals and business owners. Insurance products are also directly marketed to members of professional, alumni, retiree and other associations and to the customers of financial and retail institutions. Group life, health and pension products and services are marketed to Canadian employers.
FINANCIAL PERFORMANCE
Canadian Division’s shareholder net income increased 11 per cent to $378 million in 2002 from $339 million in 2001. This result reflects expense efficiencies in protection and wealth management businesses, very good claims experience in Group Benefits,positive contributions from the acquisition of Zurich Canada completed in March 2002 and the effect of a larger in force block, partially offset by the negative impact of lower equity markets on the Division’s wealth management businesses and unfavourable claims experience in Individual Insurance.
In 2002, the Canadian Division contributed 27 per cent to the Company’s shareholders’net income, 20 per cent of total premiums and deposits and as at December 31, 2002, accounted for 23 per cent of the Company’s funds under management.
SUMMARY STATEMENT OF OPERATIONS
| | | | | | | | | | | | | |
| For the years ended December 31 | | | | | | | | | | | | |
| (Canadian $ in millions) | | 2002 | | 2001 | | 2000 |
| |
| |
| |
|
| Premium income | | $ | 3,191 | | | $ | 2,924 | | | $ | 2,488 | |
| Investment income | | | 1,629 | | | | 1,617 | | | | 1,587 | |
| Other revenue | | | 287 | | | | 287 | | | | 249 | |
| | | |
| | | |
| | | |
| |
| Total revenue | | $ | 5,107 | | | $ | 4,828 | | | $ | 4,324 | |
| | | |
| | | |
| | | |
| |
| Policy benefits | | $ | 3,581 | | | $ | 3,418 | | | $ | 3,051 | |
| General expenses | | | 679 | | | | 654 | | | | 595 | |
| Commissions | | | 260 | | | | 238 | | | | 238 | |
| Other | | | 115 | | | | 101 | | | | 90 | |
| | | |
| | | |
| | | |
| |
| Total policy benefits and expenses | | $ | 4,635 | | | $ | 4,411 | | | $ | 3,974 | |
| | | |
| | | |
| | | |
| |
| Income before income taxes | | $ | 472 | | | $ | 417 | | | $ | 350 | |
| Income taxes | | | (104 | ) | | | (82 | ) | | | (75 | ) |
| | | |
| | | |
| | | |
| |
| Net income | | $ | 368 | | | $ | 335 | | | $ | 275 | |
| Less: net loss attributed to participating policyholders | | | (10 | ) | | | (4 | ) | | | (2 | ) |
| | | |
| | | |
| | | |
| |
| Net income attributed to shareholders | | $ | 378 | | | $ | 339 | | | $ | 277 | |
| | | |
| | | |
| | | |
| |
38
PREMIUMS AND DEPOSITS
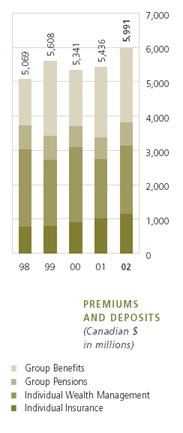
Premiums and deposits of $6.0 billion increased by $0.6 billion or 10 per cent from $5.4 billion in 2001. Individual fixed-rate deposits grew by 19 per cent while individual segregated funds increased by four per cent reflecting investor preference for guaranteed investments. Long-term mutual fund deposits more than doubled to $387 million reflecting the strong performances of a number of specific funds led by the Elliott & Page Monthly High Income Fund. Strong sales along with the impact of recent acquisitions generated an increase of 13 per cent in Individual Insurance premiums, while group premiums and deposits were up six per cent over 2001.
PREMIUMS AND DEPOSITS
| | | | | | | | | | | | | |
| For the years ended December 31 | | | | | | | | | | | | |
| (Canadian $ in millions) | | 2002 | | 2001 | | 2000 |
| |
| |
| |
|
| Premiums | | $ | 3,191 | | | $ | 2,924 | | | $ | 2,488 | |
| Segregated fund deposits | | | 1,283 | | | | 1,190 | | | | 1,681 | |
| Mutual fund deposits | | | 657 | | | | 527 | | | | 529 | |
| ASO premium equivalents | | | 860 | | | | 795 | | | | 643 | |
| | | |
| | | |
| | | |
| |
| Total premiums and deposits | | $ | 5,991 | | | $ | 5,436 | | | $ | 5,341 | |
| | | |
| | | |
| | | |
| |
FUNDS UNDER MANAGEMENT
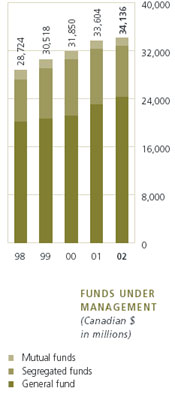
Funds under management increased by two per cent to $34.1 billion as at December 31, 2002 from $33.6 billion as at December 31, 2001, primarily due to the acquisition of Zurich Canada, organic growth of insurance and fixed-income savings businesses, and positive net segregated and mutual fund policyholder cash flows, partially offset by the impact of lower equity markets.
FUNDS UNDER MANAGEMENT
| | | | | | | | | | | | | |
| As at December 31 | | | | | | | | | | | | |
| (Canadian $ in millions) | | 2002 | | 2001 | | 2000 |
| |
| |
| |
|
| General fund | | $ | 24,235 | | | $ | 23,012 | | | $ | 21,097 | |
| Segregated funds | | | 8,577 | | | | 9,279 | | | | 9,394 | |
| Mutual funds | | | 1,324 | | | | 1,313 | | | | 1,359 | |
| | | |
| | | |
| | | |
| |
| Total funds under management | | $ | 34,136 | | | $ | 33,604 | | | $ | 31,850 | |
| | | |
| | | |
| | | |
| |
MOVING FORWARD
Consolidation, primarily in the form of acquisitions and strategic alliances, remains the key word in the Canadian life insurance industry with significant activity in 2002 and more expected in 2003. In its pursuit of growth, Canadian Division plans to be an active participant in the industry consolidation.
Canadian Division is committed to delivering professional advice and efficient service in support of innovative product offerings. In 2003, the Division will unveil enhancements to its individual insurance and wealth management products. In addition to adding new features to its term and universal life products, the individual life business will continue to enhance in force policies by allowing existing Innovision (universal life) clients to choose the new Investment Accelerator option, which provides lower management fees on the investment accounts within the policy.
39
Individual wealth management product development will focus on an integrated flow of new products and features to meet the needs of affluent Canadians.In 2002,this approach resulted in the launch of the Manulife Investments brand for all individual wealth management products. Efforts in 2003 will include the continuation of the rollout of the innovative Manulife Investment eXchange (MIX) and GIC Renaissance products brought to the market late in the fourth quarter.
Group Pensions will deliver enhanced plan member education services and an expanded share ownership product,while Group Benefits will deliver a new flexible benefits plan and introduce innovative products designed for and billed directly to plan members, such as optional life insurance.
Leveraging technology remains a key priority for Canadian Division in the challenge to provide superior customer service. The Division will continue its investment in technology in the front and back offices, with ongoing focus on Internet solutions that make it easier to do business with Manulife. From product illustration to order entry to claim payment, advisors and customers will be able to efficiently track transactions and retrieve data on secure Web sites, making previously hard-to-access information readily available. Group customers can expect to see increased Internet functionality and plan member services including member health and dental claims submission, eligibility of benefit statements and electronic claim payments.
Canadian Division’s achievement in growing sales of individual products through the stockbroker channel in 2002 is indicative of the Division’s goal to expand its distribution network through traditional and non-traditional sources. Success in group product distribution depends on quality relationships with key consultants and distribution organizations. In 2003, the Division will continue to strengthen existing relationships and develop new partnerships by delivering enhanced education services and increased Internet functionality.
40
ASIAN DIVISION
Manulife Financial has operated in Asia since 1897, beginning in Hong Kong and the Philippines, expanding into Singapore, Indonesia, Taiwan, Shanghai and Guangzhou (China), and Vietnam. Asian Division provides a wide range of insurance and wealth management products including individual and group life and health insurance and pension and mutual funds.
FINANCIAL PERFORMANCE
Asian Division’s shareholder net income increased by 39 per cent to $257 million in 2002 from $185 million in 2001. This increase was attributable to business growth, particularly in Hong Kong, as well as higher fee income from the administration of a growing Mandatory Provident Fund business. This growth was driven by continuous expansion of the agency force,which totaled 17,881 agents as at December 31, 2002 compared to 15,671 at the end of 2001. Product initiatives, such as the launch of the savings-focused Wealth series of products in Hong Kong and the introduction of the Value Preservation Option rider in Vietnam during the year also supported the strong growth.
In 2002, Asian Division contributed 19 per cent to the Company’s shareholders’ net income, 10 per cent of total premiums and deposits and as at December 31, 2002, accounted for eight per cent of the Company’s funds under management. Hong Kong continues to be Asian Division’s largest operation, accounting for almost 70 per cent of the Division’s premiums and deposits in 2002.
SUMMARY STATEMENT OF OPERATIONS
| | | | | | | | | | | | | |
| For the years ended December 31 | | | | | | | | | | | | |
| (Canadian $ in millions) | | 2002 | | 2001 | | 2000 |
| |
| |
| |
|
| Premium income | | $ | 1,519 | | | $ | 1,347 | | | $ | 1,064 | |
| Investment income | | | 334 | | | | 333 | | | | 313 | |
| Other revenue | | | 114 | | | | 94 | | | | 74 | |
| | | |
| | | |
| | | |
| |
| Total revenue | | $ | 1,967 | | | $ | 1,774 | | | $ | 1,451 | |
| | | |
| | | |
| | | |
| |
| Policy benefits | | $ | 1,033 | | | $ | 956 | | | $ | 770 | |
| General expenses | | | 418 | | | | 382 | | | | 344 | |
| Commissions | | | 197 | | | | 183 | | | | 137 | |
| Other | | | 54 | | | | 57 | | | | 46 | |
| | | |
| | | |
| | | |
| |
| Total policy benefits and expenses | | $ | 1,702 | | | $ | 1,578 | | | $ | 1,297 | |
| | | |
| | | |
| | | |
| |
| Income before income taxes | | $ | 265 | | | $ | 196 | | | $ | 154 | |
| Income taxes | | | (6 | ) | | | 1 | | | | (6 | ) |
| Net income | | $ | 259 | | | $ | 197 | | | $ | 148 | |
| Less: net income (loss) attributed to participating policyholders | | | 2 | | | | 12 | | | | (5 | ) |
| | | |
| | | |
| | | |
| |
| Net income attributed to shareholders | | $ | 257 | | | $ | 185 | | | $ | 153 | |
| | | |
| | | |
| | | |
| |
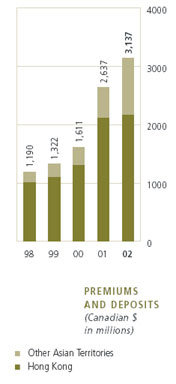
PREMIUMS AND DEPOSITS
Premiums and deposits increased by 19 per cent to $3.1 billion in 2002 from $2.6 billion in 2001. This increase reflected growth in individual insurance premiums across the Division as well as mutual fund deposits in Hong Kong and Indonesia.The expansion of the career agency force drove strong sales in Hong Kong and the other Asian territories and general fund premiums increased by 13 per cent over 2001. Mutual fund deposits more than doubled to $594 million in 2002, primarily as a result of the launch of the Dynamic Funds in Hong Kong and new distribution agreements with business partners in Indonesia. Growth
41
in regular contributions to the Hong Kong pension business was offset by lower deposits from transferred plans, which were uniquely high in 2001 due to the launch of the Mandatory Provident Fund business.
PREMIUMS AND DEPOSITS
| | | | | | | | | | | | | |
| For the years ended December 31 | | | | | | | | | | | | |
| (Canadian $ in millions) | | 2002 | | 2001 | | 2000 |
| |
| |
| |
|
| Premiums | | $ | 1,519 | | | $ | 1,347 | | | $ | 1,064 | |
| Segregated fund deposits | | | 1,024 | | | | 1,063 | | | | 446 | |
| Mutual fund deposits | | | 594 | | | | 227 | | | | 101 | |
| | | |
| | | |
| | | |
| |
| Total premiums and deposits | | $ | 3,137 | | | $ | 2,637 | | | $ | 1,611 | |
| | | |
| | | |
| | | |
| |
FUNDS UNDER MANAGEMENT
Funds under management increased by 41 per cent to $11.5 billion in 2002 from $8.2 billion in 2001, primarily due to increases in Hong Kong and Indonesia. Growth in Hong Kong reflected increased business volumes in the Insurance and Mandatory Provident Fund businesses as well as higher mutual fund sales and an increase in institutional funds managed by Manulife Asset Management (Hong Kong); growth in Indonesia was driven by higher mutual fund deposits. General fund assets increased to $6.5 billion in 2002 from $5.4 billion in 2001 due to business growth. Segregated fund assets increased to $2.5 billion in 2002 from $1.9 billion in 2001, primarily due to Mandatory Provident Fund deposits in Hong Kong.
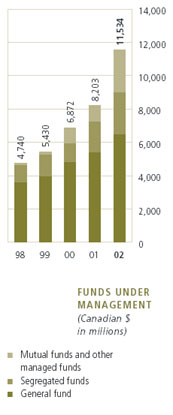
FUNDS UNDER MANAGEMENT
| | | | | | | | | | | | | |
| As at December 31 | | | | | | | | | | | | |
| (Canadian $ in millions) | | 2002 | | 2001 | | 2000 |
| |
| |
| |
|
| General fund | | $ | 6,476 | | | $ | 5,361 | | | $ | 4,776 | |
| Segregated funds | | | 2,497 | | | | 1,865 | | | | 1,144 | |
| Mutual and other managed funds | | | 2,561 | | | | 977 | | | | 952 | |
| | | |
| | | |
| | | |
| |
| Total funds under management | | $ | 11,534 | | | $ | 8,203 | | | $ | 6,872 | |
| | | |
| | | |
| | | |
| |
MOVING FORWARD
Despite a challenging business environment during 2002, particularly in Hong Kong, Asian Division continued to experience strong business growth. In 2003, the Division will continue to provide quality products and services to grow its business. In addition, the flag-ship Hong Kong operations expect to achieve its goal of one million customers.
The career agency force will remain the primary distribution channel in the region and the Division will continue to drive career agency force expansion while maintaining its focus on the professional delivery of services.
In 2002, product initiatives, including Hong Kong’s launch of the Wealth series of products, contributed to solid business growth across the region. In 2003, the Division will launch a new universal variable life and a deferred annuity product in Hong Kong, while the other territories will focus on investment-linked products and product riders in order to meet changing customer needs.
In 2002, Asian Division’s business expansion included acquisitions in Taiwan and the Philippines and, in Singapore, the acquisition of full ownership of its former 50 per cent joint venture. In China, a new branch was established to operate in the main southern city of Guangzhou and an application was submitted to establish a branch in the capital city of Beijing. In 2003, further opportunities to acquire and expand business in the region will continue to be actively pursued.
42
JAPAN DIVISION
Japan Division provides insurance and wealth management products to one of the largest insurance markets in the world, a market currently underserved due to limited product choice. For insurance products, the Division is focused on developing universal life product concepts tailored to meet the needs of two key market segments – middle-and upper-income individuals and their families, and small and medium-sized businesses. Wealth management products contribute to the overall product strategy for these two segments. The Division’s universal life product, ManuFlex, one of the first of its type in Japan, and ManuSolution, a variable annuity product, leverage the Company’s expertise with these types of products in North America.
FINANCIAL PERFORMANCE
Japan Division’s net income decreased by $9 million to $111 million in 2002, down from $120 million in 2001. This decrease primarily reflected the impact of surrenders from the block of policies acquired from Daihyaku, which was not fully offset by growth in new sales given the prevailing economic environment in Japan.
In 2002, Japan Division contributed eight per cent to the Company’s shareholders’ net income, six per cent of premiums and deposits and as at December 31, 2002, accounted for nine per cent of the Company’s funds under management.
SUMMARY STATEMENT OF OPERATIONS
| | | | | | | | | | | | | |
| For the years ended December 31 | | | | | | | | | | | | |
| (Canadian $ in millions) | | 2002 | | 2001 | | 2000 |
| |
| |
| |
|
| Premium income | | $ | 1,451 | | | $ | 1,349 | | | $ | 847 | |
| Investment income | | | 81 | | | | 114 | | | | 40 | |
| Other revenue | | | 34 | | | | 25 | | | | 6 | |
| | | |
| | | |
| | | |
| |
| Total revenue | | $ | 1,566 | | | $ | 1,488 | | | $ | 893 | |
| | | |
| | | |
| | | |
| |
| Policy benefits | | $ | 875 | | | $ | 787 | | | $ | 609 | |
| General expenses | | | 428 | | | | 436 | | | | 323 | |
| Commissions | | | 92 | | | | 96 | | | | 64 | |
| Other | | | 8 | | | | 2 | | | | (155 | ) |
| | | |
| | | |
| | | |
| |
| Total policy benefits and expenses | | $ | 1,403 | | | $ | 1,321 | | | $ | 841 | |
| | | |
| | | |
| | | |
| |
| Income before income taxes | | $ | 163 | | | $ | 167 | | | $ | 52 | |
| Income taxes | | | (52 | ) | | | (47 | ) | | | (7 | ) |
| | | |
| | | |
| | | |
| |
| Net income attributed to shareholders | | $ | 111 | | | $ | 120 | | | $ | 45 | |
| | | |
| | | |
| | | |
| |
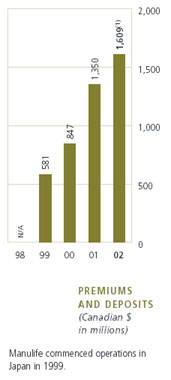
PREMIUMS AND DEPOSITS
Premiums and deposits increased by $259 million to $1.6 billion for the year ended December 31, 2002. This was driven by higher single premium sales from the January launch of the new variable annuity product, ManuSolution, as well as higher regular premiums due to the impact of a full year of premiums from the policies transferred from Daihyaku and sales of ManuFlex, a universal life product launched late in 2001.
PREMIUMS AND DEPOSITS
| | | | | | | | | | | | | |
| For the years ended December 31 | | | | | | | | | | | | |
| (Canadian $ in millions) | | 2002 | | 2001 | | 2000 |
| |
| |
| |
|
| Premiums | | $ | 1,451 | | | $ | 1,349 | | | $ | 847 | |
| Segregated fund deposits(1) | | | 158 | | | | 1 | | | | — | |
| | | |
| | | |
| | | |
| |
| Total premiums and deposits | | $ | 1,609 | | | $ | 1,350 | | | $ | 847 | |
| | | |
| | | |
| | | |
| |
| (1) | | Segregated fund deposits for the year ended December 31, 2002 excluded $319 million of net seed capital. |
43
FUNDS UNDER MANAGEMENT
Funds under management decreased by $409 million to $13.4 billion as at December 31, 2002, from $13.8 billion as at December 31, 2001, as increases from policyholder cash flows were more than offset by benefit payments, which included the impact of discontinued policy obligations assumed from Daihyaku at the time of acquisition.
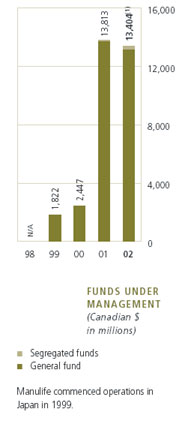
FUNDS UNDER MANAGEMENT
| | | | | | | | | | | | | |
| As at December 31 | | | | | | | | | | | | |
| (Canadian $ in millions) | | 2002 | | 2001 | | 2000 |
| |
| |
| |
|
| General fund | | $ | 13,153 | | | $ | 13,726 | | | $ | 2,447 | |
| Segregated funds(1) | | | 251 | | | | 87 | | | | — | |
| | | |
| | | |
| | | |
| |
| Total funds under management | | $ | 13,404 | | | $ | 13,813 | | | $ | 2,447 | |
| | | |
| | | |
| | | |
| |
| (1) | | Segregated funds under management as at December 31, 2002 excluded $317 million of seed capital. |
MOVING FORWARD
Commencing in the fourth quarter of 2001, the Japanese economy entered its third recession in 10 years. In 2002, an export-led recovery dissipated as the year progressed and equity markets declined to 20-year lows. The outlook for the short- to medium-term is for continued deflation and consequently, a continuation of the extremely low interest rate environment.
Demand for traditional life insurance is expected to continue to decrease over time. Offsetting this, however, are higher growth expectations for new product segments, such as universal life, variable annuities, interest sensitive insurance products and third sector insurance – sickness and medical insurance – products.
The Division aims to be a product leader in Japan. In 2003, the Division will continue the development of its range of universal life products to meet the changing needs of the Japanese population. The variable annuity product will be enhanced to broaden the target market and to support the Division’s goal of growing its bank and stockbroker distribution channels.
The Japan Division will also continue to focus on increasing the size and enhancing the professionalism and efficiency of its distribution channels. The current sales distribution system will be expanded with an increased emphasis on the active recruitment and training of sales agents and the further development of the bank and stockbroker distribution channels.
Maintaining a high level of customer service and improving operational efficiencies are important business objectives. During 2002, significant progress was made in upgrading and rationalizing operational and sales systems. The Division will leverage its investment in technology to better serve both customers and agents and reduce costs.
44
REINSURANCE DIVISION
Established in 1984, Reinsurance Division has grown to be one of North America’s leading providers of risk management solutions, specializing in life retrocession. In the simplest terms, reinsurance refers to insurance purchased by an insurance company to cover all or part of certain risks on insurance policies issued by that company. Retrocession is a form of reinsurance involving the assumption of risk from other reinsurers. Manulife’s innovative products generate customer interest worldwide, with business written in North America, Europe, Asia and Australia. Through offices in Canada, Germany and Barbados, Reinsurance Division provides customer-focused solutions in the following lines of business:
| • | | Life (offering retrocession of traditional life mortality risk); |
| |
| • | | Structured (offering non-traditional life retrocession and reinsurance); |
| |
| • | | Property and Casualty (including specialized non-traditional retrocession for property and casualty reinsurers); and |
| |
| • | | Accident (including personal and specialized coverages). |
FINANCIAL PERFORMANCE
Reinsurance Division’s net income increased to $184 million in 2002 from $48 million in 2001. The 2001 result included $145 million in net provisions for anticipated claims arising from the terrorist events in the United States on September 11, 2001, partially offset by a $30 million one-time reduction in tax expense. Excluding the impact of these non-recurring items, earnings for the year were $21 million higher than in 2001, reflecting business growth in the Property and Casualty and the Structured Reinsurance businesses.
In 2002, Reinsurance Division contributed 13 per cent to the Company’s shareholders’net income, four per cent of premiums and deposits and as at December 31, 2002, accounted for three per cent of the Company’s funds under management.
SUMMARY STATEMENT OF OPERATIONS
| | | | | | | | | | | | | |
| For the years ended December 31 | | | | | | | | | | | | |
| (Canadian $ in millions) | | 2002 | | 2001 | | 2000 |
| |
| |
| |
|
| Premium income | | $ | 1,063 | | | $ | 791 | | | $ | 768 | |
| Investment income | | | 226 | | | | 231 | | | | 194 | |
| Other revenue | | | 43 | | | | 38 | | | | 22 | |
| | | |
| | | |
| | | |
| |
| Total revenue | | $ | 1,332 | | | $ | 1,060 | | | $ | 984 | |
| | | |
| | | |
| | | |
| |
| Policy benefits | | $ | 1,003 | | | $ | 963 | | | $ | 762 | |
| General expenses | | | 45 | | | | 40 | | | | 35 | |
| Commissions | | | 38 | | | | 44 | | | | 47 | |
| Other | | | 8 | | | | 11 | | | | 8 | |
| | | |
| | | |
| | | |
| |
| Total policy benefits and expenses | | $ | 1,094 | | | $ | 1,058 | | | $ | 852 | |
| | | |
| | | |
| | | |
| |
| Income before income taxes | | $ | 238 | | | $ | 2 | | | $ | 132 | |
| Income taxes | | | (54 | ) | | | 46 | | | | (24 | ) |
| | | |
| | | |
| | | |
| |
| Net income attributed to shareholders | | $ | 184 | | | $ | 48 | | | $ | 108 | |
| | | |
| | | |
| | | |
| |
45
PREMIUM INCOME
Premiums increased by 35 per cent to $1.1 billion in 2002 from $791 million in 2001. Life Reinsurance premiums increased by four per cent to $455 million in 2002 from $438 million in 2001, reflecting growth in premiums on in force business. Property and Casualty Reinsurance premiums experienced very strong growth due to higher business volumes and price increases in a hardening rate market. Accident Reinsurance premiums continued to decline in 2002 due to the Company’s exit from the U.S. medical reinsurance market and personal accident pool business, together with reduced new business volumes as contracts have been written very selectively in the aftermath of the events of September 11, 2001.
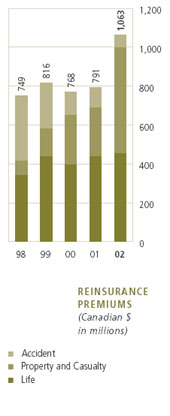
PREMIUMS
| | | | | | | | | | | | | |
| For the years ended December 31 | | | | | | | | | | | | |
| (Canadian $ in millions) | | 2002 | | 2001 | | 2000 |
| |
| |
| |
|
| Life reinsurance | | $ | 455 | | | $ | 438 | | | $ | 394 | |
| Property and Casualty reinsurance | | | 544 | | | | 249 | | | | 256 | |
| Accident reinsurance | | | 64 | | | | 104 | | | | 118 | |
| | | |
| | | |
| | | |
| |
| Total premiums | | $ | 1,063 | | | $ | 791 | | | $ | 768 | |
| | | |
| | | |
| | | |
| |
MOVING FORWARD
Reinsurance Division is committed to a “know your client” philosophy focused on expanding relationships with key business partners. As a leader in the reinsurance marketplace, the Division plays an important role by providing capacity, technical expertise and financial strength. The Division will continue to seek growth by focusing on providing innovative customer-focused solutions that leverage its existing areas of expertise. The Division will also continue to focus on maintaining and improving upon the strong risk management practices that reinforce high quality standards for both new business and the in force block.
Reinsurance Division will seek out new opportunities to grow its business globally and remains focused on maintaining its leadership position within the Life Retrocession market. In addition, increasing focus on maximizing capital efficiency throughout the life insurance industry will provide continued growth opportunities for Structured Reinsurance solutions. The Property and Casualty line is expecting continued growth, taking advantage of opportunities due to improving terms and conditions and continued rate hardening in the Property and Casualty market. In Accident Reinsurance, the Division continues to seek opportunities in today’s hard market conditions and will look to further enhance the strong recent performance within this portfolio while adhering to strict underwriting guidelines in assessing new business.
46
INVESTMENT OPERATIONS
Manulife Financial’s Investment Operations manages assets for the Company’s insurance and wealth management businesses and for external third party clients. Manulife is a significant player in many of the asset classes that it manages, with securities management offices located around the globe.
INVESTMENT MANAGEMENT
The Securities Management group manages investments in a wide range of asset classes and securities markets, using a variety of investment styles. The group includes Elliott & Page Limited in Canada, Manulife International Investment Management Limited in London, England, both operating under the brand name of MFC Global Investment Management, as well as offices in Hong Kong and Japan.
As at December 31, 2002, MFC Global Investment Management (Canada) managed assets totaling $53 billion for the Company as well as for institutional and individual investors.MFC Global Investment Management (UK) managed $6 billion of general, segregated and mutual funds for the Company and third parties, while assets managed by the investment offices in Hong Kong and Japan amounted to $17 billion.
In addition, the Asset Origination group managed $14 billion of assets that included mortgages, real estate assets located throughout North America, private placement debt and equity investments (Manulife Capital), and oil and gas properties (NAL Resources Management Limited).
GENERAL FUND ASSETS
Manulife Financial’s general fund invested assets increased to $77.6 billion as at December 31, 2002 from $74.8 billion as at December 31, 2001. The goal in investing these assets is to maximize total returns while managing within the Company’s investment and risk management policies.
GENERAL FUND INVESTED ASSETS
| | | | | | | | | | | | | | | | | |
| As at December 31 | | 2002 | | 2001 |
| |
| |
|
| | | Carrying | | % of | | Carrying | | % of |
| (Canadian $ in millions) | | value | | total | | value | | total |
| |
| |
| |
| |
|
| Bonds | | $ | 46,677 | | | | 60 | | | $ | 46,070 | | | | 62 | |
| Mortgages | | | 9,294 | | | | 12 | | | | 7,902 | | | | 10 | |
| Stocks | | | 6,898 | | | | 9 | | | | 6,964 | | | | 9 | |
| Real estate | | | 3,570 | | | | 5 | | | | 3,484 | | | | 5 | |
| Policy loans | | | 4,939 | | | | 6 | | | | 4,644 | | | | 6 | |
| Cash and short-term investments | | | 5,143 | | | | 7 | | | | 4,995 | | | | 7 | |
| Other investments | | | 1,041 | | | | 1 | | | | 693 | | | | 1 | |
| | | |
| | | |
| | | |
| | | |
| |
| Total invested assets | | $ | 77,562 | | | | 100 | | | $ | 74,752 | | | | 100 | |
| | | |
| | | |
| | | |
| | | |
| |
BONDS
The Company’s bond portfolio represented 60 per cent of invested assets as at December 31, 2002. The Company diversifies its bond portfolio by sector as well as by industry and issuer. There was no significant change in sector distribution over the year. The portfolio is monitored closely to enhance yields while optimizing the matching of asset cash flows to the estimated liability cash flows.As at December 31, 2002, 96 per cent of the portfolio was invested in securities rated investment grade (BBB and over).
47
BOND PORTFOLIO BY SECTOR AND INDUSTRY
| | | | | | | | | | | | | | | | | | | | | | | | | |
| As at December 31 | | 2002 | | 2001 |
| |
| |
|
| | | | | | | % | | | | | | % |
| | | Carrying | | % of | | investment | | Carrying | | % of | | investment |
| (Canadian $ in millions) | | value | | total | | grade | | value | | total | | grade |
| |
| |
| |
| |
| |
| |
|
| Government and Agency | | $ | 18,632 | | | | 40 | | | | 100 | | | $ | 18,668 | | | | 41 | | | | 99 | |
| Financial | | | 11,569 | | | | 25 | | | | 97 | | | | 11,664 | | | | 25 | | | | 97 | |
| Telecommunications | | | 3,039 | | | | 7 | | | | 85 | | | | 3,525 | | | | 7 | | | | 99 | |
| Utilities | | | 3,821 | | | | 8 | | | | 94 | | | | 2,980 | | | | 6 | | | | 92 | |
| Energy | | | 2,383 | | | | 5 | | | | 93 | | | | 1,851 | | | | 4 | | | | 98 | |
| Industrial | | | 1,948 | | | | 4 | | | | 96 | | | | 1,487 | | | | 3 | | | | 95 | |
| Securitized (ABS/MBS) | | | 1,092 | | | | 2 | | | | 99 | | | | 1,703 | | | | 4 | | | | 99 | |
| Consumer (non-cyclical) | | | 1,522 | | | | 3 | | | | 93 | | | | 1,406 | | | | 3 | | | | 87 | |
| Consumer (cyclical) | | | 1,113 | | | | 2 | | | | 83 | | | | 1,186 | | | | 3 | | | | 81 | |
| Basic materials | | | 384 | | | | 1 | | | | 75 | | | | 378 | | | | 1 | | | | 69 | |
| Technology | | | 335 | | | | 1 | | | | 94 | | | | 301 | | | | 1 | | | | 96 | |
| Media and Internet | | | 708 | | | | 2 | | | | 94 | | | | 612 | | | | 1 | | | | 83 | |
| Other | | | 131 | | | | — | | | | 94 | | | | 309 | | | | 1 | | | | 92 | |
| | | |
| | | |
| | | |
| | | |
| | | |
| | | |
| |
| Total bonds | | $ | 46,677 | | | | 100 | | | | 96 | | | $ | 46,070 | | | | 100 | | | | 97 | |
| | | |
| | | |
| | | |
| | | |
| | | |
| | | |
| |
MORTGAGES AND REAL ESTATE
As at December 31, 2002, mortgages represented 12 per cent of invested assets with 63 per cent of the mortgage portfolio in Canada and 37 per cent in the United States. Commercial mortgages accounted for 96 per cent of total mortgages. Mortgages increased by $1.4 billion in the year, due primarily to favourable business conditions for commercial mortgage origination. The mortgage portfolio consists almost entirely of first mortgages and is diversified by geographic region, property type and mortgagor. Government-insured loans represented four per cent of the total mortgage portfolio. All mortgages are secured by real properties.
As at December 31, 2002, five per cent of the Company’s invested assets were held in real estate. The portfolio is focused on high quality office buildings located in superior downtown and large suburban markets across North America. It is diversified by geographic region and property type, with 62 per cent located in the United States, 37 per cent in Canada and one per cent in Asia. Commercial office properties represented 74 per cent of the portfolio, with the remainder split among residential, retail, industrial and other property classifications.
STOCKS
As at December 31, 2002, stocks represented nine per cent of invested assets. The portfolio of publicly traded common stocks is diversified by industry sector and issuer. As at December 31, 2002, the stock portfolio was invested 36 per cent in U.S. issuers, 31 per cent in Canadian issuers, 23 per cent in Asian issuers and 10 per cent in other issuers.
MOVING FORWARD
Consistently achieving superior asset returns and significantly growing the wealth management business remain the two primary goals of Investment Operations. The strategy combines traditional asset management techniques with capital markets and risk management expertise. Investment Operations will continue to include a portfolio of non-traditional assets to enhance yields, diversify invested assets and provide a competitive advantage.
48
RISK MANAGEMENT
OVERVIEW
Manulife Financial has established an integrated, enterprise-wide framework for managing all risks across the organization. The framework guides all risk-taking activities and ensures that they are aligned with the Company’s overall risk-taking philosophy as well as shareholder and customer expectations. While Manulife Financial seeks to maximize shareholder value by achieving strong growth and earning an appropriate return on capital, the Company limits the aggregate level of risk assumed and ensures it is diversified across risk types and businesses.
The enterprise risk management framework is built around four key elements:
| • | | comprehensive risk governance |
| |
| • | | effective risk management policies and processes |
| |
| • | | rigorous risk exposure measurement |
| |
| • | | risk limit management |
A network of qualified risk management professionals and business managers are accountable for ensuring business operations are consistent with the Company’s risk-taking philosophy, standards and limits.
RISK GOVERNANCE
The governance structure is designed to foster a strong and well-informed risk culture across the organization and to facilitate sound business decisions. The Board of Directors, through its Audit and Risk Management Committee and Conduct Review and Ethics Committee, has overall responsibility for overseeing the Company’s risk-taking activities and risk management programs.
AUDIT AND RISK MANAGEMENT COMMITTEE
| • | | Approves, and reviews compliance with, key financial and operational risk policies and limits |
| |
| • | | Reviews trends in key risk positions and exposures, and major risk-taking activities |
| |
| • | | Reviews risk management practices and internal controls |
Chair: External Director
CONDUCT REVIEW AND ETHICS COMMITTEE
| • | | Approves code of business conduct and ethics policy |
| |
| • | | Reviews procedures to resolve conflicts of interest and restrict use of confidential information |
| |
| • | | Reviews procedures to disclose information to customers under the Insurance Companies Act (Canada) and for dealing with customer complaints |
Chair: External Director
The Chief Executive Officer (“CEO”) is directly accountable to the Board of Directors for all of Manulife Financial’s risk-taking activities and risk management programs. The executive management structures that support the CEO include the Chief Financial Officer, the Corporate Risk Management Committee and subcommittees, and the Chief Risk Officer, who is responsible for administering the Company’s enterprise risk management program.
CORPORATE RISK MANAGEMENT COMMITTEE
| • | | Oversees administration of the enterprise risk management framework, incorporating policy development, risk assessment and measurement, risk review, risk reporting and risk mitigation |
| |
| • | | Establishes global risk management strategic priorities |
| |
| • | | Reviews key risk positions and exposure trends, risk-taking activities and risk management strategies |
Chair: Chief Risk Officer
49
RISK MANAGEMENT POLICIES AND PROCESSES
The Company’s enterprise risk management framework provides the overall infrastructure designed to ensure all risks to which the Company is exposed are managed using a common set of standards and guidelines. The framework is also designed to ensure assessment of potential returns on all new business initiatives, acquisitions and potential investments incorporates an evaluation of potential returns on a consistent risk-adjusted basis, and an assessment of risk in relation to the Company’s targeted risk profile. The framework integrates a series of specific risk management programs administered through the Company’s risk committees and risk managers. These comprehensive programs incorporate the following key components:
| • | | policies and limits |
| |
| • | | risk management accountabilities |
| |
| • | | delegated authorities |
| |
| • | | control and mitigation strategies |
| |
| • | | processes for risk identification, assessment, measurement, monitoring and reporting |
In addition, stress scenario analysis is performed as part of the Dynamic Capital Adequacy Testing process, independently reported to the Audit and Risk Management Committee by the Chief Actuary. Internal audits of risk controls and of global risk management programs are performed and independently reported to the Audit and Risk Management Committee by the Internal Auditor. Prudent actuarial liabilities are established considering all risk exposures, and are independently signed off by the Chief Actuary.
RISK MEASUREMENT
Individual measures are used to assess risk exposures from various risks. In aggregate, the Company uses the risk-based capital required by its regulator, or Minimum Continuing Capital and Surplus Requirements (“MCCSR”), as a measure of overall capital at risk. The Company allocates capital on this basis and evaluates returns on this risk-based capital. This is supplemented in some situations by an economic-based capital at risk measure that reflects the probable maximum loss of capital that could occur over a specific time horizon with a certain degree of confidence. A key priority is to extend the use of the economic-based capital at risk measure across the Company and establish an integrated risk measurement framework. Enterprise-wide, integrated stochastic scenario-based projection models are being developed to implement the integrated risk measurement framework.
RISK LIMIT MANAGEMENT
The Company has established a defined capacity for assuming risk, considering the risk tolerances of the Board of Directors and management and the Company’s financial condition. The overall capacity is defined in terms of the Company’s MCCSR ratio. This is the ratio of the Company’s available capital to its risk-based capital requirements, as defined by its regulator. Manulife Financial targets an MCCSR ratio of at least 180 per cent. To limit exposure to specific risks, the Company has established enterprise-wide limits for various asset liability and market risks, and credit risks, based on the individual risk exposure measures used to assess these risks. The Company’s risk profile is well diversified across risks and products.
50
Manulife Financial uses a standard inventory of risks in all aspects of risk identification, assessment, monitoring and reporting. These risks are summarized into major risk categories, each of which is discussed below.
STRATEGIC RISK
Strategic risk is the risk of loss resulting from the inability to adequately plan or implement an appropriate business strategy, or to adapt to change in the external business, political or regulatory environment.
Manulife Financial faces many strategic and environmental challenges, including product, service and distribution competition, changing political and regulatory environments, and potential loss of reputation. The Company manages risks of a strategic nature by utilizing:
| • | | strategic planning and capital allocation processes incorporating thorough risk analyses, with final approval by the Board of Directors; |
| |
| • | | detailed business plans developed and executed by local divisional executive management; |
| |
| • | | operational reviews of all businesses by the CEO quarterly and by the Board of Directors annually; |
| |
| • | | acquisition and divestiture review processes, incorporating thorough risk analyses and controls, with final approvals by the CEO and Board of Directors; and |
| |
| • | | high standards for business conduct in all its operations, well communicated through the Company’s Code of Business Conduct and Ethics and published P.R.I.D.E. values. |
PRODUCT RISK
Product risk is the risk of loss due to actual experience emerging differently than assumed when the product was designed and priced, as a result of investment returns, expenses, taxes, mortality and morbidity claims, and policyholder behaviour.
The Company’s product design and pricing risk is managed through a program, overseen jointly by the Chief Actuary and Chief Risk Officer, incorporating standards and guidelines designed to ensure the level of risk borne by the Company is within acceptable levels and is consistent with its targeted profile. The standards and guidelines cover:
| • | | product design |
| |
| • | | pricing methods and assumption setting |
| |
| • | | stochastic and stress scenario analysis |
| |
| • | | risk-based capital allocations |
| |
| • | | profit margin objectives |
| |
| • | | pricing models and software |
| |
| • | | documentation |
| |
| • | | approval processes |
| |
| • | | experience monitoring programs |
Annual risk and compliance self-assessments and periodic internal audits are required for all business units. Designated pricing officers in each business unit are accountable for all pricing activities. The general manager and chief financial officer of each business unit approve the design and pricing of each product, ensuring the Company’s standards and guidelines are met. The Chief Actuary and Chief Risk Officer approve any new product or modification that introduces material changes in risk or product design.
The Company’s underwriting and claims risk management program incorporates underwriting policies and procedures, including criteria for approval of risks, and claims adjudication policies and procedures. The global Underwriting Council has the mandate to ensure underwriting practices are consistent across the organization while reflecting local conditions. Periodic reviews ensure compliance with the standards.
51
Enterprise-wide, claims risk is diversified as a result of the Company’s international operations with a wide range of insured individuals and products covering varied risk events. Exposure to individual large claims is mitigated through established retention limits per insured life varying by market and jurisdiction, reviewed periodically and approved by the CEO. Coverage in excess of these limits is reinsured with other companies. The current retention limits in Canada and the U.S. are $10 million in local currency ($15 million for joint life policies). For direct written business, current retention limits are Yen 500 million in Japan and U.S. $100,000 in Hong Kong and, for assumed reinsurance, are U.S. $10 million in both Japan and Hong Kong.
Local concentration risk is mitigated through the use of aggregate retention limits for certain covers and through catastrophe reinsurance for life and disability insurance worldwide. The Company’s catastrophe reinsurance covers losses in excess of U.S. $50 million, up to U.S. $150 million (U.S. $100 million for Japan) and covers losses due to certain terrorist activities in Canada, where the bulk of this concentration risk is located.
ASSET LIABILITY AND MARKET RISK
Asset liability and market risk is the risk of loss resulting from market price volatility, interest rate changes, adverse movements in foreign currency rates, and from not having access to sufficient funds to meet both expected liabilities and unexpected cash demands.
The Company’s asset liability and market risk management program is carried out through a network of asset liability committees. Global investment policies, approved by the Audit and Risk Management Committee, establish enterprise-wide and portfolio level targets and limits and establish delegated approval authorities. The targets and limits are designed to ensure investment portfolios are widely diversified across asset classes and individual investment risks. Actual investment positions are monitored regularly. They are reported to the asset liability committees monthly and to the Corporate Risk Management Committee and Audit and Risk Management Committee quarterly.
GLOBAL ASSET LIABILITY COMMITTEE
| • | | Approves, and monitors compliance with, asset mix, interest rate risk, equity and real estate market risk, liquidity and foreign exchange risk, and derivatives policies |
| |
| • | | Reviews key risk positions and investment strategies to optimize shareholder value within risk tolerances |
| |
| • | | Oversees divisional asset liability committee activities |
Chair: Chief Risk Officer
SEGMENTATION AND ASSET MIX
The foundation of the asset liability and market risk management program is the segmentation of product liabilities with similar characteristics and the establishment of investment policies and goals for each segment. The investment policies and goals incorporate currency mix, asset mix, asset quality, industry mix, interest rate risk exposure and liquidity targets. They are approved by the governing divisional asset liability committee and the Global Asset Liability Committee.
The Company invests in assets with characteristics that closely match the characteristics of the liabilities they support. Products offering interest rate and term guarantees, such as annuities and pension products, are supported predominantly by bonds and mortgages. Products that allow adjustments to credited interest rates or premiums, such as participating whole life and universal life insurance, and policies with very long-dated liabilities, are supported by a broader range of assets, including real estate and equities. For these products,
52
target asset mixes are established to optimize returns considering risk-based capital required, downside risk and management risk tolerances, and to minimize potential risk exposure related to long-term contractual minimum return guarantees.
The Company uses derivatives, including foreign exchange contracts, interest rate and cross currency swaps, forward rate agreements and equity options, to manage interest rate, foreign currency and equity risk. The risks associated with the use of derivatives are limited by established risk management policies and procedures, including specific limits on the size of derivative transactions, authorized types of derivatives, authorization limits for specific personnel, and detailed derivative strategy documentation requirements.
INTEREST RATE RISK
Interest rate changes may result in losses if asset and liability cash flows are not closely matched with respect to timing and amount. The Company has established interest rate risk management programs for each product liability segment designed to keep potential losses within acceptable limits, but still allow asset managers to add value by taking modest risk positions. Policies and procedures, including delegated authorities and accountabilities for managing and monitoring interest rate risk, are clearly defined. Target asset durations are established consistent with liability durations. Interest rate risk positions are held within prescribed limits. Asset and liability positions are updated with a frequency ranging from daily to monthly depending on the scope and size of potential movements in positions. Interest rate risk positions are monitored and reported to the asset liability committees monthly and the Corporate Risk Management Committee and the Audit and Risk Management Committee quarterly.
The Company measures and manages interest rate risk exposure using a variety of sophisticated measures, including cash flow gaps, durations, key rate durations, convexity, and economic value at risk based on both stochastic scenarios and predetermined scenarios.
IMPACT ON ECONOMIC VALUE OF INTEREST RATE MOVEMENTS(1)
| | | | | | | | | | | | | | | | | |
| | | 2002 | | 2001 |
| | |
| |
|
| As at December 31 | | One per cent | | One per cent | | One per cent | | One per cent |
| (Canadian $ in millions) | | increase | | decrease | | increase | | decrease |
| |
| |
| |
| |
|
| Wealth management | | $ | (1 | ) | | $ | 2 | | | $ | 6 | | | $ | (6 | ) |
| Insurance | | | 264 | | | | (263 | ) | | | 250 | | | | (310 | ) |
| Surplus | | | (319 | ) | | | 344 | | | | (222 | ) | | | 229 | |
| | | |
| | | |
| | | |
| | | |
| |
| Total | | $ | (56 | ) | | $ | 83 | | | $ | 34 | | | $ | (87 | ) |
| | | |
| | | |
| | | |
| | | |
| |
| (1) | | Impact on economic value represents the potential economic gain (loss) to shareholders as a result of an immediate and parallel change of one per cent in interest rates across all maturities in all markets, with a zero per cent interest rate floor. |
The interest rate risk exposure arises as a result of actual asset durations differing from targets in liability segments and holding non-cash fixed income assets in surplus. The exposure related to insurance segments arises primarily in Japan segments in which the duration of assets held is shorter than that of liabilities to allow the Company to take advantage of potential interest rate increases.
EQUITY AND REAL ESTATE MARKET RISK
Fluctuations in equity market prices, and to a lesser extent real estate prices, may impact returns on assets held in the general fund, fee income earned on market-based funds, and liabilities associated with investment-related guarantees, primarily on variable annuities and segregated funds. The Company’s investment-related guarantees include maturity and death benefit guarantees on Canadian segregated fund contracts, minimum income and death benefit guarantees on U.S. variable annuity contracts and minimum death benefit guarantees through reinsurance assumed under several treaties with third parties.
53
The Company has established specific policies and procedures designed to limit the exposure to losses from equity market volatility. These incorporate:
| • | | guidelines related to product design and pricing of variable annuities and segregated fund products; |
| |
| • | | established limits for equity risk exposures arising from investment-related segregated fund guarantees and all other sources; |
| |
| • | | use of reinsurance to mitigate risk; and |
| |
| • | | monitoring economic capital at risk for equity risk arising from investment-related segregated fund guarantees based on industry-accepted methodologies and stochastic scenario projection models. |
SEGREGATED FUND GUARANTEE EXPOSURE
| | | | | | | | | |
| As at December 31, 2002 | | | | | | | | |
| (Canadian $ in millions) | | Fund value(1) | | Amount at risk(1) |
| |
| |
|
| Maturity/income benefits | | $ | 7,325 | | | $ | 1,237 | |
| Death benefits(1) | | | 9,767 | | | | 3,906 | |
| | | |
| | | |
| |
| Total | | $ | 17,092 | | | $ | 5,143 | |
| | | |
| | | |
| |
| (1) | | Death benefits include stand-alone guarantees and guarantees in excess of maturity or income guarantees where both are provided on a policy. Amount at risk is the excess of guaranteed values over fund values on all policies where the guaranteed value exceeds the fund value. Fund value and amount at risk are net of amounts reinsured. Amounts reinsured do not include amounts covered under stop loss treaties. |
The amount at risk is not currently payable. Guaranteed death benefits are contingent and only payable upon the eventual death of policyholders if fund values remain below guaranteed values. Maturity and income benefits are also contingent and only payable at scheduled maturities in the future, if policyholders are still living and have not terminated their policies, and fund values remain below guaranteed values. The Company projects future guaranteed benefit payments under a variety of stochastic market return scenarios, also considering future mortality and policy termination rates. The Company is required to hold actuarial liabilities for these contingent benefit payments sufficient to cover the average of the worst 40 per cent market return scenarios. As at December 31, 2002, actuarial liabilities held for these guarantee payments were $579 million. These exceed the minimum requirements.
Exposures related to direct equity and real estate holdings are managed through established targets and limits. The direct equity and real estate holdings in the general fund represent a small proportion of the Company’s total assets and are held in surplus segments or used to support long-term policy liabilities. Equity holdings are diversified and managed against established targets and limits by industry type and corporate connection. Real estate holdings are diversified and managed against established limits by property type and location.
IMPACT ON ECONOMIC VALUE OF A TEN PER CENT DECLINE IN MARKET VALUE OF DIRECT EQUITY HOLDINGS(1)
| | | | | | | | | |
| As at December 31 | | | | | | | | |
| (Canadian $ in millions) | | 2002 | | 2001 |
| |
| |
|
| Liability segments | | $ | 149 | | | $ | 165 | |
| Surplus | | | 264 | | | | 317 | |
| | | |
| | | |
| |
| Total | | $ | 413 | | | $ | 482 | |
| | | |
| | | |
| |
| (1) | | Impact on economic value represents the potential economic loss to shareholders as a result of an immediate decline of ten per cent in the market price of direct equity holdings in all markets. |
54
FOREIGN CURRENCY RISK
The Company may be exposed to losses resulting from adverse movements in foreign exchange rates due to the fact that it manages operations in many currencies and reports financial results in Canadian dollars. The Company’s foreign currency risk management program incorporates a policy of matching the currency of its assets with the currency of the liabilities these assets support. The program also incorporates a policy of generally matching the currency of its equity, up to its target MCCSR ratio, with the currency of its liabilities, to limit the impact of changes in foreign exchange rates on the Company’s MCCSR ratio. The Company holds equity in excess of its target MCCSR ratio predominantly in Canadian dollars to mitigate the impact of changes in foreign exchange rates on shareholders’equity. The foreign currency management policy also establishes the currencies in which the Company is authorized to transact.
The Company manages foreign currency risk against an established foreign currency Value at Risk exposure limit, based on the industry-accepted J.P. Morgan RiskMetrics methodology, and also monitors sensitivities to predetermined scenarios regularly.
IMPACT ON SHAREHOLDERS’ EQUITY OF A ONE PER CENT INCREASE IN THE CANADIAN DOLLAR RELATIVE TO FOREIGN CURRENCIES
| | | | | | | | | |
| As at December 31 | | | | | | | | |
| (Canadian $ in millions) | | 2002 | | 2001 |
| |
| |
|
| U.S. dollar | | $ | (34 | ) | | $ | (23 | ) |
| Japanese yen | | $ | (5 | ) | | $ | (6 | ) |
LIQUIDITY RISK
The Company’s global liquidity risk management program incorporates policies and procedures designed to ensure that adequate liquidity is available. These policies and procedures include managing against established minimum levels of operating and strategic liquidity by focusing on:
| • | | designing products to reduce the possibility of unexpected liquidity demands; |
| |
| • | | centrally forecasting and monitoring actual cash movements on a daily basis; |
| |
| • | | maintaining investment portfolios with adequate levels of marketable investments; and |
| |
| • | | maintaining access to other sources of liquidity such as commercial paper funding and committed standby bank credit facilities. |
The Company has established minimum levels for both operating and strategic liquidity measures. Operating liquidity is maintained at or above the level of one month’s operating cash out-flows. Strategic liquidity is measured using an industry-accepted model under both immediate (within one month) and ongoing (within one year) stress scenarios. Under this model, adjusted liquid assets include cash and short-term investments, and marketable bonds and stocks discounted to reflect their convertibility to cash, net of maturing debt obligations. Under the model, actuarial liabilities are adjusted to reflect their potential for withdrawal. The Company’s policy is to maintain adjusted liquid assets at a level well above adjusted actuarial liabilities.
STRATEGIC LIQUIDITY
| | | | | | | | | | | | | | | | | |
| As at December 31 | | 2002 | | 2001 |
| | |
| |
|
| (Canadian $ in millions | | Immediate | | Ongoing | | Immediate | | Ongoing |
| unless otherwise stated) | | scenario | | scenario | | scenario | | scenario |
| |
| |
| |
| |
|
| Adjusted liquid assets | | $ | 52,463 | | | $ | 53,231 | | | $ | 51,263 | | | $ | 52,101 | |
| Adjusted actuarial liabilities | | $ | 9,176 | | | $ | 12,617 | | | $ | 9,016 | | | $ | 12,451 | |
| Liquidity ratio | | | 572 | % | | | 422 | % | | | 569 | % | | | 418 | % |
55
CREDIT RISK
Credit risk is the risk of loss due to the inability or unwillingness of a borrower or counter-party to fulfill its payment obligations.
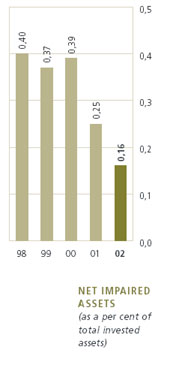
The Company’s credit risk management program, overseen by the Credit Committee, incorporates policies and procedures that emphasize the quality and diversification of the Company’s investment portfolio and establishes criteria for the selection of counterparties and intermediaries. The policies establish exposure limits by borrower or issuer, corporate connection, quality rating, industry, and geographic region, and establish delegated credit approval authorities. Distinct derivative counterparty exposure limits are in place with respect to notional amounts outstanding and daily mark-to-market exposures. Specific reinsurance counterparty exposure measures and limits are in place. All counterparties are required to meet minimum credit-rating criteria.
CREDIT COMMITTEE
| • | | Approves, and monitors compliance with, credit policies |
| |
| • | | Approves credits within tiered authority structure |
| |
| • | | Actively monitors credit exposures and commitments |
| |
| • | | Monitors overall asset portfolio quality |
| |
| • | | Oversees provisioning for impaired assets |
Chair: Chief Financial Officer
An allowance for losses on invested assets is established when an asset or portfolio of assets becomes impaired as a result of deterioration in credit quality, to the extent there is no longer assurance of timely realization of the carrying value of assets and related investment income. The carrying value of an impaired asset is reduced to net realizable value at the time of recognition of impairment. There is no assurance that the allowance for losses will be adequate to cover future losses or that additional provisions or asset write-downs will not be required. However, the Company remains conservatively provisioned for credit losses overall and the level of impaired assets continues to be very low. Actuarial liabilities also include general provisions for credit losses from future asset impairments. These are set conservatively, taking into account normal historical levels and future expectations. The Company monitors a variety of aggregate credit risk exposure measures.
CREDIT RISK MEASURES
| | | | | | | | | |
| As at December 31 | | | | | | | | |
| (Canadian $ in millions unless otherwise stated) | | 2002 | | 2001 |
| |
| |
|
| Net impaired assets | | $ | 123 | | | $ | 186 | |
| Net impaired assets as a per cent of total invested assets | | | 0.16 | % | | | 0.25 | % |
| Allowance for impairment | | $ | 290 | | | $ | 208 | |
| Provision for future credit losses included in actuarial liabilities | | $ | 1,699 | | | $ | 1,525 | |
| Performing assets coverage ratio(1) | | | 4.27 | % | | | 3.84 | % |
| Impaired assets coverage ratio(1) | | | 482 | % | | | 440 | % |
| (1) | | Performing assets coverage ratio is calculated as allowance for impairment and provision for future credit losses included in actuarial liabilities less gross impaired assets, as a per cent of total mortgages and non-government bonds less gross impaired assets. Impaired assets coverage ratio is calculated as allowance for impairment and provision for future credit losses included in actuarial liabilities, as a per cent of gross impaired assets. |
56
OPERATIONAL RISK
Operational risk is the risk of loss resulting from inadequate or failed internal processes, systems failures, human performance failures or from external events.
The Company’s operational risk management programs seek to minimize exposure by ensuring appropriate internal controls and systems, together with trained and competent people, are in place throughout the Company. The Company uses an established program of comprehensive risk self-assessments in conjunction with independent internal audits to monitor and assess inherent operational risks and the effectiveness of internal controls. External auditors review the effectiveness of internal controls to the extent necessary to conduct an audit of the Company’s financial statements. Both the internal and external auditors report independently to the Audit and Risk Management Committee on the findings of their audits.
Established global risk management programs for potential high risks, including business interruption, technology management, information security and privacy, and regulatory compliance, ensure risk controls are effective enterprise-wide.
A global business continuity program is in place to ensure key business functions can continue and normal operations can resume effectively and efficiently in the event of a major disruption. The program incorporates periodic scenario analysis to validate the assessment of both critical and non-critical units and the establishment and testing of appropriate business continuity plans for all key units. Off-site backup facilities are available to minimize recovery time. Systems-related risks are managed through a rigorous systems development protocol, global information security programs, and comprehensive policies and procedures for managing outsourcing arrangements.
The Company’s regulatory compliance management program facilitates compliance with regulatory obligations worldwide, ensuring awareness of the laws and regulations that affect the Company and the risks associated with failing to comply. The program covers a broad range of regulations impacting product design, financial reporting, investment activities, employment practices, underwriting and claims processing, and sales and marketing practices. The program includes processes for assessing risks and monitoring compliance with related obligations.
57