
Manulife Financial Corporation - Second Quarter 2014
1
MESSAGE TO SHAREHOLDERS
In the second quarter of 2014, we continued to earn the trust of our customers by delivering on life insurance, retirement, and other financial needs. We paid out claims, cash surrender values, annuity payments and other benefits worth $5.1 billion. We now manage over $637 billion on behalf of our customers.
As a result of these activities, and others, our Company’s income has grown and stabilized, our capital ratio is strong, and our outlook is positive. We also have increased clarity and comfort with the direction of international capital and regulatory standards.
As a consequence, I am delighted to announce that our Board has approved a dividend increase to shareholders, the first since 2008. This will come as very good news to shareholders, and reflects much hard work by our employees, many of whom are also shareholders. It is a very clear signal of the strength of our Company and the fine work that we are doing around the world.
Hopefully, this will be the first of many in the years to come as we grow our Company.
Customer-centric developments are key to our growth, and we delivered them with abundance in the second quarter:
In Canada, Group Benefits released a mobile app that gives customers access to their benefits plan from their smartphone or tablet. In Hong Kong, we launched Manuflex Protector, our first Renminbi denominated Universal Life (“UL”) product. John Hancock reduced the cost of the John Hancock Freedom 529 College Savings Plan, making the product more appealing for a wider audience. In Indonesia, our Manulife Indonesia Money Market Fund was named “Best Money Market Fund”. Affinity Markets was awarded “Best Insurance Online Newsletter” by the Web Marketing Association of North America.
We also made further progress on our financial goals. Our net income for the quarter was $943 million. Our core earnings were $701 million, and our capital ratio at the end of the quarter was 243%. Our plan is unfolding well and we continue to make progress towards our financial objectives.
Excluding Group Benefits, insurance sales increased 10% year-over-year, and were 13% higher than the first quarter of this year. These increases are the result of recent actions taken to improve the competitiveness of our life insurance products in Japan and the United States. Including Group Benefit sales, which are naturally lumpy, and benefitted from a very large case sold in the second quarter of last year, total insurance sales were down 38%.
Wealth sales of $13.3 billion were down 7% year-over-year and were in line with the first quarter. What this aggregate number does not depict sufficiently is the simply outstanding performance by John Hancock Investments, which is now one of the fastest-growing mutual fund companies in the U.S. With an organic growth rate of 26%, it outpaced the comparable industry organic growth rate of 2% by a wide margin; and according to a recent report by Morningstar, John Hancock Investments is now ranked as the 15th largest manager of long-term mutual funds.
Net wealth flows in our asset management businesses exceeded $6 billion for the quarter and $13 billion year-to-date, driving our 23rd consecutive quarter of record funds under management. Manulife Asset Management now has 82 Four- or Five-Star Morningstar rated funds, and has now been ranked the 30th largest manager in the world, up from 34th in 2012.
We believe our greatest contributions to society comes from our products and services, which help people with their big financial decisions, and the work we do for our shareholders around the world, who have entrusted us with their capital. But our contributions to society come in a variety of other ways. For example, in the second quarter, John Hancock was recognized with the “United Nations Association of Greater Boston Leadership Award” and for the 11th time Manulife received Gold in the Insurance category from Reader’s Digest Trusted Brands Award in Hong Kong.
It is also gratifying to hear customer comments, and I would like to share this one from a gentleman in the United States:
“My father was recently diagnosed with early-onset Alzheimer’s at the age of 53. Because my father practiced what he preached, he is extremely well insured with disability income, long-term care, and of course, life insurance. In each stage of our lives, these different insurance products will drastically improve the situation from what it otherwise could have been. And when his time eventually does come, his life insurance policies will allow my mother to not have to worry about the financial strain that would otherwise present itself. It does take a tremendous weight off of my father’s shoulders. If I wasn’t already before, this example has made me a true believer in the power of these products and the impact they can have on families.”
All of these results would not have occurred without the dedicated efforts of more than 28,000 employees, almost 51,000 agents and our hundreds of thousands of other distribution partners around the world. We would like to thank our shareholders for their continued support, and look forward to reporting back to you on our progress next quarter.
Donald A. Guloien
President and Chief Executive Officer
Manulife Financial Corporation - Second Quarter 2014
2
SALES AND BUSINESS GROWTH
Asia Division
We had a strong second quarter, building on the insurance sales momentum noted in the first quarter. The second quarter growth was 26% compared to the same quarter of the prior year and 18% compared to the prior quarter. Japan continued to be the most significant driver of insurance sales growth, but the overall results were augmented by good growth in several other markets across Asia, reflecting the ongoing success of product enhancement initiatives and our multi-channel distribution strategy. We also delivered significantly improved wealth sales in the second quarter with a 32% increase over the prior quarter, reflecting successful marketing campaigns and improved market sentiment.
Asia Division 2Q14 insurance sales of US$304 million were 26% higher than 2Q13 and 18% higher compared to 1Q14. (Percentages quoted below are for the period 2Q14 compared with 2Q13, unless stated otherwise, and are on a constant currency basis).
| · | Japan insurance sales of US$158 million increased 68% driven by the continued momentum of corporate product sales. Sales increased 25% compared with 1Q14. |
| · | Hong Kong insurance sales of US$60 million were consistent with 2Q13 and increased 10% compared with 1Q14. Several products were recently launched and a series of sales campaigns will be launched shortly. |
| · | Indonesia insurance sales of US$26 million decreased 3%. Agency sales were lower by 24% but were substantially offset by 23% growth in bancassurance sales. We experienced an increase in rider attachment and a favourable product mix. Sales were 1% higher than 1Q14. |
| · | Asia Other (excludes Japan, Hong Kong and Indonesia) insurance sales of US$60 million were in line with 2Q13 results. Double digit growth in most Asian markets, in particular, record sales in the Philippines following a successful agency sales campaign, was offset by competitive pressures in Singapore. Compared to 1Q14, insurance sales increased 15%. |
Asia Division 2Q14 wealth sales of US$2.0 billion decreased 33% compared with 2Q13 and increased 32% compared to 1Q14. (Percentages quoted below are for the period 2Q14 compared with 2Q13, unless stated otherwise, and are on a constant currency basis).
| · | Japan wealth sales of US$275 million were at a similar level to 1Q14 but remained 58% lower than the levels in 2Q13 reflecting a shift in investor product preferences in Japan. |
| · | Hong Kong wealth sales of US$276 million increased 9% mainly driven by the increase in pensions sales, reflecting successful marketing campaigns and new product launches. These drivers also accounted for the 17% increase compared with 1Q14. |
| · | Indonesia wealth sales of US$251 million were 34% lower than 2Q13 but 166% higher than 1Q14 due to improved economic conditions and market sentiment. |
| · | Asia Other wealth sales of US$1,149 million decreased 29% compared with 2Q13 in response to lower market sentiment in the first half of 2014 but increased 36% compared with 1Q14, marking the second highest quarter on record. |
Canadian Division
We continue to report solid sales in our wealth fund and group retirement businesses; new bank loan volumes, while up significantly from first quarter levels, continue to reflect the slowdown in the residential mortgage market; and retail insurance sales remain challenged due to competitive positioning and market demand for participating whole life products which are currently not part of our product portfolio. We recently launched Manulife UL, a simplified universal life product which we expect will enhance sales in future quarters1, and listed our new closed end fund, U.S. Regional Bank Trust, on the TSX. We established the Canadian industry’s first mental health specialist team enhancing support to our group disability insurance clients and their employees. In mid-July we launched our Voluntary Retirement Savings Plan (“VRSP”) in Quebec, helping small business owners provide their employees with a retirement savings plan that is simple, affordable and easy to maintain.
Wealth sales of $2.6 billion in 2Q14 decreased by 15% from 2Q13 primarily due to the timing of closed end fund deposits and the slowdown in the residential mortgage market impacting new bank loan volumes. Sales in 2Q13 included deposits on a closed end fund (there was no closed end fund offering in 2Q14). (Percentages quoted below are for the period 2Q14 compared with 2Q13, unless stated otherwise).
| · | Mutual Funds’ record assets under management exceeded $30 billion at June 30, 2014, increasing 29% year-over-year and outpacing industry growth2. Gross deposits3,4 of $1.5 billion were in line with 2Q13 levels, excluding the 2Q13 closed end fund deposits of almost $300 million, reflecting continued strong fund performance and expanded distribution. |
| · | Retail Segregated Fund Products5 sales were $353 million, an increase of 10% in our repositioned new business portfolio. Fixed Products sales of $69 million were 17% lower, reflecting our deliberate rate positioning in the immediate annuity market. |
| · | Group Retirement Solutions sales of $212 million were 8% lower reflecting normal variability in the large case group market. Year-to-date, sales of almost $900 million were 25% higher than 2013 and based on the latest market data, as of 1Q14 we continued to lead the defined contribution pension market with 37% market share6. |
| · | Manulife Bank net lending assets grew 7% to a record $19.2 billion at June 30, 2014, outpacing year-over-year growth in the residential mortgage market7. New loan volumes of $902 million rose by over 40% from 1Q14 partly due to normal market seasonality; however, volumes were 18% lower than 2Q13 reflecting intense rate competition driven by the slowdown in the residential mortgage market. |
1 | See “Caution regarding forward-looking statements” below. |
| 2 | Based on publicly available information from Investor Economics and the Investment Funds Institute of Canada as at June 30, 2014. |
| 3 | This item is a non-GAAP measure. See “Performance and Non-GAAP Measures” below. |
| 4 | Gross mutual fund deposits in 2Q14 include deposits from segregated fund products of $392 million. |
| 5 | Segregated fund products include guarantees. These products are also referred to as variable annuities. |
| 6 | As per LIMRA SRI Canadian Pension Market sales report as of March 31, 2014. |
| 7 | As per McVay and Associates, The Personal Banking Product Market Share, March 2014. |
Manulife Financial Corporation - Second Quarter 2014
3
Insurance sales in 2Q14 were lower than 2Q13 due to large single premium group benefits sales in 2Q13. Excluding Group Benefits, 2Q14 insurance sales of $129 million were in line with 2Q13. (Percentages quoted below are for the period 2Q14 compared with 2Q13, unless stated otherwise).
| · | Retail Markets insurance sales continue to be challenged due to competitive positioning and market demand for participating whole life products which are currently not part of our product portfolio. While overall Retail sales of $39 million were 7% lower compared with 2Q13, universal life product sales increased by 11% due to re-pricing and product changes made over the past year. Compared with 1Q14, Retail insurance sales increased 3%. |
| · | Institutional Markets insurance sales of $90 million decreased 3%, excluding the large single premium sales noted above. Based on the most recent industry data8, Group Benefits’ sales market share declined in 1Q14 in the face of strong competitive pressures. |
U.S. Division
Once again, record quarterly sales in John Hancock Investments contributed to record funds under management in the Wealth Management businesses. A strong product line-up, including 41 Four- or Five-Star Morningstar rated mutual funds, continues to drive favourable results in this business9. On the insurance front, product enhancements and targeted pricing changes implemented earlier this year improved John Hancock Life sales over the first quarter.
Wealth Management sales in 2Q14 of US$7.9 billion increased 7% compared with 2Q13. Increased sales in John Hancock Investments (“JH Investments”) were partially offset by a decrease in John Hancock Retirement Plan Services (“JH RPS”).
| · | JH Investments 2Q14 sales of US$6.9 billion increased 9% compared with 2Q13. Continued sales momentum was driven by a strong product line-up and broad-based distribution and included a new US$1 billion mandate from a large wirehouse firm. The strong sales contributed to our 11th consecutive quarter of positive net sales10 which propelled funds under management as at June 30, 2014 to a record of US$71 billion, a 37% increase from June 30, 2013. Our organic sales growth rate of 26% over the 12 months ended May 2014 outpaced the Intermediary-Sold industry growth rate of 2% over the same period11. |
| · | JH RPS reported record funds under management of US$85.7 billion as at June 30, 2014, a 14% increase over June 30, 2013, and 2Q14 sales of US$927 million decreased 7% compared with 2Q13. Sales in our core market, the small-case 401(k) market, are showing signs of improvement as we successfully roll-out our Signature 2.0 initiative which is focused on price competitiveness, fee transparency, new investment options and participant service. Sales of Enterprise (our 401(k) mid-market offering) delivered a number of new plans for the quarter as we continue to build out our product and service capacity. |
Overall U.S. Division Insurance sales in 2Q14 of US$115 million were 12% lower compared with 2Q13 and increased 6% compared with 1Q14 due to new product enhancements.
| · | John Hancock Life 2Q14 sales of US$102 million increased by 20% over 1Q14 but were 13% lower than 2Q13. The business recorded strong sales in Indexed universal life (“UL”) and Variable UL products supported by recent product launches. |
| · | John Hancock Long-Term Care (“LTC”) sales of US$13 million in 2Q14 were consistent with 2Q13. As expected, sales decreased from 1Q14 which included bi-annual inflation buy up activity on the Federal LTC program. In addition, in 2Q14 we launched new business price increases consistent with initiatives on our in-force business. |
Manulife Asset Management
Strong General Fund investment-related experience continued in the second quarter of 2014, driven by favourable returns on our private equity and oil and gas investments, the redeployment of government securities into higher yielding assets, and investments in private equity and other alternative long-duration assets. In addition, we continued to benefit from favourable credit experience.
Manulife Asset Management's second quarter direct net sales were very strong, reflecting a breadth of sales success across all channels. Long-term investment performance continues to be a differentiator for Manulife Asset Management; we reported strong results, with the majority of public asset classes once again outperforming their benchmarks on a 1, 3, and 5-year basis.
At June 30, 2014, total assets managed by Manulife Asset Management ("MAM") were $300 billion, including $259 billion managed for external clients. Assets managed for external clients increased $2 billion from March 31, 2014. MAM was ranked as the 30th largest asset manager globally in 2013, up from 34th in 2012, based on the May 2014 institutional investor trade publication Pensions & Investments. At June 30, 2014, MAM had a total of 82 Four- or Five-Star Morningstar rated funds, an increase of two funds since March 31, 2014.
| 9 | For each fund with at least a 3-year history, Morningstar calculates a Morningstar Rating based on a Morningstar Risk-Adjusted Return that accounts for variation in a fund’s monthly performance (including effects of sales charges, loads and redemption fees), placing more emphasis on downward variations and rewarding consistent performance. The top 10% of funds in each category, the next 22.5%, 35%, 22.5% and bottom 10% receive 5, 4, 3, 2 or 1 star, respectively. The Overall Morningstar Rating for a fund is derived from a weighted average of the performance associated with its 3-, 5- and 10 year (if applicable) Morningstar Rating metrics. Past performance is no guarantee of future results. The overall rating includes the effects of sales charges, loads and redemption fees, while the load-waived does not. Load-waived rating for Class A shares should only be considered by investors who are not subject to a front-end sales charge. |
| 10 | Source: Strategic Insight SIMFUND. Net sales (net new flows) is calculated using retail long-term open end mutual funds for managers in the Intermediary-Sold channel. Figures exclude money market and 529 share classes. |
| 11 | Source: Strategic Insight: ICI Confidential. Direct Sold mutual funds, fund-of-funds and ETF’s are excluded. Organic sales growth rate is calculated as: net new flows divided by beginning period assets. |
Manulife Financial Corporation - Second Quarter 2014
4
MANAGEMENT’S DISCUSSION AND ANALYSIS
This Management’s Discussion and Analysis (“MD&A”) is current as of August 7, 2014, unless otherwise noted. This MD&A should be read in conjunction with the MD&A and audited Consolidated Financial Statements contained in our 2013 Annual Report.
For further information relating to our risk management practices and risk factors affecting the Company, see “Risk Factors” in our most recent Annual Information Form, “Risk Management and Risk Factors” and “Critical Accounting and Actuarial Policies” in the MD&A in our 2013 Annual Report, and the “Risk Management” note to the Consolidated Financial Statements in our 2013 Annual Report.
In this MD&A, the terms “Company”, “Manulife Financial”, “Manulife” and “we” mean Manulife Financial Corporation (“MFC”) and its subsidiaries.
Contents | |||
| A | OVERVIEW | D | RISK MANAGEMENT AND RISK FACTORS UPDATE |
| 1. | Q2 highlights | 1. | Variable annuity and segregated fund guarantees |
| 2. | Q3 and Q4 items | 2. | Caution related to sensitivities |
| 3. | Publicly traded equity performance risk | ||
| B | FINANCIAL HIGHLIGHTS | 4. | Interest rate and spread risk |
| 1. | Q2 and year-to-date earnings analysis | ||
| 2. | Premiums and deposits | E | ACCOUNTING MATTERS AND CONTROLS |
| 3. | Funds under management | 1. | Critical accounting and actuarial policies |
| 4. | Capital | 2. | Sensitivity of policy liabilities to updates to assumptions |
| 5. | Impact of fair value accounting | 3. | Accounting and reporting changes |
| 4. | U.S. GAAP Results | ||
| C | PERFORMANCE BY DIVISION | 5. | Quarterly financial information |
| 1. | Asia | 6. | Change in internal control over financial reporting |
| 2. | Canadian | 7. | Audit Committee |
| 3. | U.S. | ||
| 4. | Corporate and Other | F | OTHER |
| 1. | Quarterly dividend | ||
| 2. | Outstanding shares | ||
| 3. | Performance and Non-GAAP measures | ||
| 4. | Key planning assumptions and uncertainties | ||
| 5. | Caution regarding forward-looking statements | ||
Manulife Financial Corporation - Second Quarter 2014
5
A OVERVIEW
| A1 | Q2 highlights |
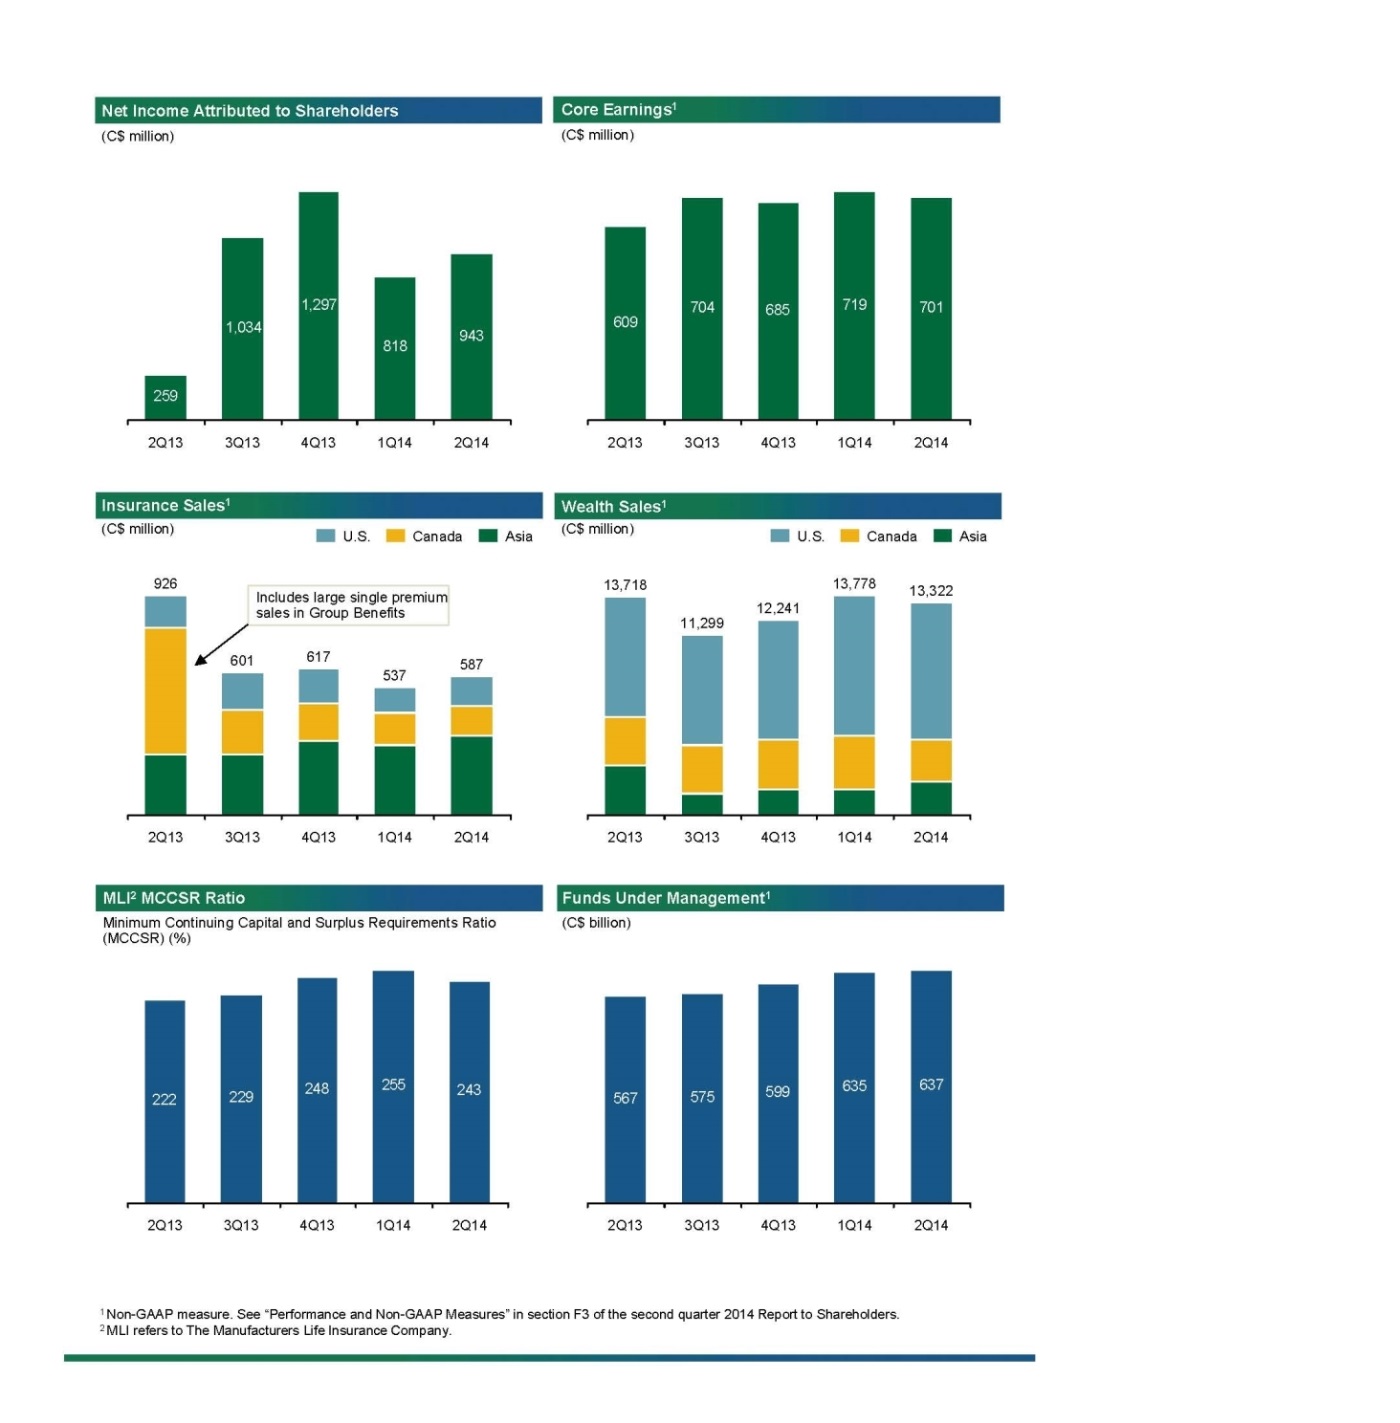
Manulife reported 2Q14 net income attributed to shareholders of $943 million and core earnings12 of $701 million. This compares with 2Q13 net income attributed to shareholders and core earnings of $259 million and $609 million, respectively.
The increase in net income of $684 million included $92 million of higher core earnings along with strong investment-related experience in 2Q14, while in 2Q13 we reported investment-related experience charges. (In 2Q13 we noted that investment-related experience included charges of approximately $180 million that were timing related and were expected to reverse in future quarters).
The $92 million increase in core earnings was driven by higher fee income on higher assets under management, lower hedging costs, the release of a legal provision and the strengthening of the U.S. dollar. These items were partially offset by lower margin release on variable annuity business as a result of lower overall provisions for adverse deviation driven by higher markets and risk management activities.
Items excluded from core earnings in 2Q14 totaled $242 million and included $217 million of investment-related experience gains in excess of the $50 million reported in core earnings. These gains related to favourable returns on our private equity and oil and gas investments, redeployment of government securities into higher yielding assets including private equities and other alternative long-duration assets that resulted in gains driven by the impact of current period investing activities on future expected investment income assumptions in the measurement of our insurance and investment contract liabilities. In addition, we continued to benefit from favourable credit experience.
Net income attributed to shareholders for the 6 months ended June 30, 2014 was $1,761 million as compared to $799 million for the 6 months ended June 30, 2013. Of the $962 million increase, $684 million is described above, and the remaining portion primarily related to $100 million of higher core earnings and $128 million of higher investment-related experience in 1Q14 compared with 1Q13.
The Minimum Continuing Capital and Surplus Requirements (“MCCSR”) ratio for The Manufacturers Life Insurance Company (“MLI”) was 243% as at June 30, 2014. The 12 point decrease from 255% in 1Q14 was due to $1 billion of maturing debt and the $450 million redemption of preferred shares. As a result of these capital actions, the Company’s financial leverage ratio improved from 30.8% at 1Q14 to 28.2%.
Insurance sales12 were $587 million in 2Q14, down 38%13 compared with 2Q13. Excluding Group Benefits sales which included large single premium sales in the prior year, insurance sales increased relative to 1Q14 by 13% and 2Q13 by 10%, as a result of recent actions taken to improve the competitiveness of our life insurance products in Japan and the United States. In Canada, retail insurance sales remained challenged due to competitive positioning and market demand for participating whole life products which are currently not part of our product portfolio. We launched Manulife UL, a simplified universal life product which we expect will enhance sales in future quarters14.
Wealth sales were $13.3 billion in 2Q14, a decrease of 7% compared with 2Q13 and in line with 1Q14. Wealth sales declined over 2Q13 reflecting a shift in investor product preferences in Japan, and the non-recurrence of a closed end fund offering in Canada. Our 2Q14 wealth sales were in line with the prior quarter, driven by the continued success of our North American mutual fund businesses and building momentum in Asia following successful marketing campaigns and improved market sentiment.
A2 Q3 and Q4 items
In the third quarter, we will complete our annual review of actuarial methods and assumptions and implement the Canadian Institute of Actuaries published guidance on the calibration criteria for fixed income funds with respect to the valuation of segregated fund guarantees. While our review is not complete, the impact could be up to an amount in the general range of our 3Q13 charge for changes in actuarial methods and assumptions14.
In the fourth quarter, the Canadian Actuarial Standards Board’s (“ASB”) revisions to the Canadian Actuarial Standards of Practice, issued in May 2014 and related to economic reinvestment assumptions used in the valuation of policy liabilities, will become effective. The impact of these revisions will depend on interest rates and other assumptions at the time of implementation as well as investment-related experience in the second half of 2014. While we noted in our 2013 Annual Report that we did not anticipate that the impact on net income would be significant, as a result of the decline in interest rates between December 31, 2013 and June 30, 2014 and year-to-date investment-related experience, we have updated our estimate to be a charge to net income of up to $200 million14 if current interest rates and assumptions were used.
| 12 | This item is a non-GAAP measure. See “Performance and Non-GAAP Measures” below. |
13 | Growth (declines) in sales, premiums and deposits and funds under management are stated on a constant currency basis. Constant currency basis is a non-GAAP measure. See “Performance and Non-GAAP Measures” below. |
14 | See “Caution regarding forward-looking statements” below. |
Manulife Financial Corporation - Second Quarter 2014
6
| B | FINANCIAL HIGHLIGHTS |
| Quarterly Results | YTD Results | |||||||||||||||||||
| (C$ millions, unless otherwise stated, unaudited) | 2Q 2014 | 1Q 2014 | 2Q 2013 | 1H 2014 | 1H 2013 | |||||||||||||||
Net income attributed to shareholders | $ | 943 | $ | 818 | $ | 259 | $ | 1,761 | $ | 799 | ||||||||||
| Preferred share dividends | (36 | ) | (34 | ) | (32 | ) | (70 | ) | (64 | ) | ||||||||||
| Common shareholders’ net income | 907 | $ | 784 | $ | 227 | 1,691 | $ | 735 | ||||||||||||
| Reconciliation of core earnings to net income attributed to shareholders: | ||||||||||||||||||||
Core earnings(1) | $ | 701 | $ | 719 | $ | 609 | $ | 1,420 | $ | 1,228 | ||||||||||
| Investment-related experience in excess of amounts included in core earnings | 217 | 225 | (97 | ) | 442 | - | ||||||||||||||
Core earnings plus investment-related experience in excess of amounts included in core earnings | $ | 918 | $ | 944 | $ | 512 | $ | 1,862 | $ | 1,228 | ||||||||||
| Other items to reconcile core earnings to net income attributed to shareholders: | ||||||||||||||||||||
| Direct impact of equity markets and interest rates and variable annuity guarantee liabilities | 55 | (90 | ) | (242 | ) | (35 | ) | (349 | ) | |||||||||||
| Changes in actuarial methods and assumptions | (30 | ) | (40 | ) | (35 | ) | (70 | ) | (104 | ) | ||||||||||
Other items (see section B1) | - | 4 | 24 | 4 | 24 | |||||||||||||||
| Net income attributed to shareholders | $ | 943 | $ | 818 | $ | 259 | $ | 1,761 | $ | 799 | ||||||||||
| Basic earnings per common share (C$) | $ | 0.49 | $ | 0.42 | $ | 0.12 | $ | 0.91 | $ | 0.40 | ||||||||||
| Diluted earnings per common share (C$) | $ | 0.49 | $ | 0.42 | $ | 0.12 | $ | 0.91 | $ | 0.40 | ||||||||||
Diluted core earnings per common share (C$)(1) | $ | 0.36 | $ | 0.37 | $ | 0.31 | $ | 0.73 | $ | 0.63 | ||||||||||
| Return on common shareholders’ equity (“ROE”) (%) | 13.1 | % | 11.9 | % | 3.9 | % | 12.5 | % | 6.5 | % | ||||||||||
Core ROE (%)(1) | 9.6 | % | 10.4 | % | 10.0 | % | 10.0 | % | 10.3 | % | ||||||||||
U.S. GAAP net income (loss) attributed to shareholders(1) | $ | 906 | $ | 2,161 | $ | (692 | ) | $ | 3,067 | $ | (1,037 | ) | ||||||||
Sales(1) Insurance products(2) | $ | 587 | $ | 537 | $ | 926 | $ | 1,124 | $ | 1,539 | ||||||||||
Wealth products | $ | 13,322 | $ | 13,778 | $ | 13,718 | $ | 27,100 | $ | 26,141 | ||||||||||
Premiums and deposits(1) Insurance products | $ | 6,007 | $ | 5,904 | $ | 6,321 | $ | 11,911 | $ | 12,323 | ||||||||||
Wealth products | $ | 18,959 | $ | 19,532 | $ | 17,358 | $ | 38,491 | $ | 33,689 | ||||||||||
Funds under management (C$ billions)(1) | $ | 637 | $ | 635 | $ | 567 | $ | 637 | $ | 567 | ||||||||||
Capital (C$ billions)(1) | $ | 35.8 | $ | 36.2 | $ | 30.8 | $ | 35.8 | $ | 30.8 | ||||||||||
| MLI’s MCCSR ratio | 243 | % | 255 | % | 222 | % | 243 | % | 222 | % | ||||||||||
| (1) | This item is a non-GAAP measure. See “Performance and Non-GAAP Measures” below. |
| (2) | Insurance sales have been adjusted to exclude Taiwan for all periods. |
Manulife Financial Corporation - Second Quarter 2014
7
B1 Q2 and year-to-date earnings analysis
The table below reconciles core earnings to reported net income attributed to shareholders.
| Quarterly Results | YTD Results | |||||||||||||||||||
| (C$ millions, unaudited) | 2Q 2014 | 1Q 2014 | 2Q 2013 | 1H 2014 | 1H 2013 | |||||||||||||||
Core earnings(1) | ||||||||||||||||||||
Asia Division(2) | $ | 231 | $ | 244 | $ | 226 | $ | 475 | $ | 452 | ||||||||||
Canadian Division(2) | 232 | 228 | 225 | 460 | 404 | |||||||||||||||
U.S. Division(2) | 329 | 374 | 343 | 703 | 783 | |||||||||||||||
| Corporate and Other (excluding expected cost of macro hedges and core investment gains) | (92 | ) | (135 | ) | (105 | ) | (227 | ) | (233 | ) | ||||||||||
Expected cost of macro hedges(2) | (49 | ) | (42 | ) | (128 | ) | (91 | ) | (276 | ) | ||||||||||
Investment-related experience in core earnings(3) | 50 | 50 | 48 | 100 | 98 | |||||||||||||||
| Core earnings | $ | 701 | $ | 719 | $ | 609 | $ | 1,420 | $ | 1,228 | ||||||||||
Investment-related experience in excess of amounts included in core earnings(3) | 217 | 225 | (97 | ) | 442 | - | ||||||||||||||
| Core earnings plus investment-related experience in excess of amounts included in core earnings | $ | 918 | $ | 944 | $ | 512 | $ | 1,862 | $ | 1,228 | ||||||||||
Direct impact of equity markets and interest rates and variable annuity guarantee liabilities (see table below)(3),(4) | 55 | (90 | ) | (242 | ) | (35 | ) | (349 | ) | |||||||||||
Changes in actuarial methods and assumptions(5) | (30 | ) | (40 | ) | (35 | ) | (70 | ) | (104 | ) | ||||||||||
Other items | - | 4 | 24 | 4 | 24 | |||||||||||||||
| Net income attributed to shareholders | $ | 943 | $ | 818 | $ | 259 | $ | 1,761 | $ | 799 | ||||||||||
| (1) | This item is a non-GAAP measure. See “Performance and Non-GAAP Measures” below. |
| (2) | The expected cost of the macro equity hedges is relative to our long-term valuation assumptions. Of the $79 million decrease in expected macro hedging costs compared with 2Q13, approximately half was offset by an increase in dynamic hedging costs, primarily in Asia and the U.S. The difference between the actual cost and the expected cost is included in the direct impact of equity markets and interest rates. |
| (3) | Net insurance contract liabilities under IFRS for Canadian insurers are determined using the Canadian Asset Liability Method (“CALM”). Under CALM, the measurement of policy liabilities includes estimates regarding future expected investment income on assets supporting the policies. Experience gains and losses are reported when current period activity differs from what was assumed in the policy liabilities at the beginning of the period. These gains and losses can relate to both the investment returns earned in the period, as well as to the change in our policy liabilities driven by the impact of current period investing activities on future expected investment income assumptions. The direct impact of markets is separately reported. |
| (4) | The direct impact of equity markets and interest rates is relative to our policy liability valuation assumptions and includes changes to interest rate assumptions, including a quarterly ultimate reinvestment rate (“URR”) update for North America and for Japan, as well as experience gains and losses on derivatives associated with our macro equity hedges. We also include gains and losses on the sale of available-for-sale (“AFS”) bonds and derivative positions in the surplus segment. See table below for components of this item. |
| (5) | The $30 million charge in 2Q14 primarily relates to the impact of method and modelling refinements in the projection of certain asset and liability related cash flows across several business units. |
The quarterly gain (charge) related to the direct impact of equity markets and interest rates and variable annuity guarantee liabilities in the table above is attributable to:
| (C$ millions, unaudited) | 2Q 2014 | 1Q 2014 | 2Q 2013 | |||||||||
Direct impact of equity markets and variable annuity guarantee liabilities(1) | $ | 66 | $ | (71 | ) | $ | (196 | ) | ||||
Fixed income reinvestment rates assumed in the valuation of policy liabilities(2) | 22 | 9 | 151 | |||||||||
| Sale of AFS bonds and derivative positions in the Corporate and Other segment | (8 | ) | (3 | ) | (127 | ) | ||||||
| Charges due to lower fixed income URR assumptions used in the valuation of policy liabilities | (25 | ) | (25 | ) | (70 | ) | ||||||
| Direct impact of equity markets and interest rates and variable annuity guarantee liabilities | $ | 55 | $ | (90 | ) | $ | (242 | ) | ||||
| Direct impact of equity markets and interest rates | $ | 6 | $ | (92 | ) | $ | (272 | ) |
| (1) | In 2Q14, gross equity exposure losses of $122 million were more than offset by net hedge gains of $188 million. |
| (2) | The gain in 2Q14 for fixed income reinvestment assumptions was driven by a decrease in swap spreads in Japan and the U.S., partially offset by an increase in swap spreads in Canada. |
Premiums and deposits for insurance products were $6 billion in 2Q14, a decrease of 8% on a constant currency basis from 2Q13. In-force growth in Asia, including strong sales in Japan, was more than offset by a decline in Canada which benefited from large Group Benefits single premium sales in 2Q13, and lower U.S. premiums.
Premiums and deposits for wealth products were $19 billion in 2Q14, an increase of $1.6 billion or 4% on a constant currency basis, compared with 2Q13. Growth was driven by U.S. mutual fund sales.
B3 Funds under management15
Funds under management as at June 30, 2014 were a record $637 billion, an increase of $70 billion from June 30, 2013. The increase was due to a combination of growth in our Asset Management businesses, customer cash net inflows in all divisions and equity market growth over the period.
B4 Capital15
MFC’s total capital as at June 30, 2014 was $35.8 billion, a decrease of $0.4 billion from March 31, 2014 and an increase of $5 billion from June 30, 2013.
B5 Impact of fair value accounting
Fair value accounting policies affect the measurement of both our assets and our liabilities. The impact on the measurement of both assets and liabilities of investment activities and market movements are reported as experience gains (losses) on investments, the direct impact of equity markets and interest rates and variable annuity guarantee liabilities, each of which impacts net income (see section A1 above for discussion of second quarter experience).
Net realized and unrealized gains reported in investment income were $4.1 billion for 2Q14. This amount was primarily driven by the mark-to-market impact of the decrease in interest rates on our bond and fixed income derivative holdings and, to a lesser extent, the impact of the increase in equity markets on our equity futures in our macro and dynamic hedging program as well as other items.
As outlined in the “Critical Accounting and Actuarial Policies” in the MD&A in the 2013 Annual Report, net insurance contract liabilities under IFRS are determined using CALM, as required by the Canadian Institute of Actuaries. The measurement of policy liabilities includes the estimated value of future policyholder benefits and settlement obligations to be paid over the term remaining on in-force policies, including the costs of servicing the policies, reduced by the future expected policy revenues and future expected investment income on assets supporting the policies. Investment returns are projected using the current asset portfolios and projected reinvestment strategies. Experience gains and losses are reported when current period activity differs from what was assumed in the policy liabilities at the beginning of the period. We classify gains and losses by assumption type. For example, current period investing activities that increase (decrease) the future expected investment income on assets supporting the policies will result in an investment-related experience gain (loss).
| 15 | This item is a non-GAAP measure. See “Performance and Non-GAAP Measures” below. |
Manulife Financial Corporation - Second Quarter 2014
9
C PERFORMANCE BY DIVISION
C1 Asia Division
| ($ millions, unless otherwise stated) | Quarterly Results | YTD Results | ||||||||||||||||||
| Canadian dollars | 2Q 2014 | 1Q 2014 | 2Q 2013 | 1H 2014 | 1H 2013 | |||||||||||||||
| Net income attributed to shareholders | $ | 337 | $ | 242 | $ | 386 | $ | 579 | $ | 1,314 | ||||||||||
Core earnings(1) | 231 | 244 | 226 | 475 | 452 | |||||||||||||||
| Premiums and deposits | 4,150 | 3,800 | 5,138 | 7,950 | 9,606 | |||||||||||||||
| Funds under management (billions) | 81.4 | 82.3 | 79.3 | 81.4 | 79.3 | |||||||||||||||
| U.S. dollars | ||||||||||||||||||||
| Net income attributed to shareholders | $ | 308 | $ | 219 | $ | 378 | $ | 527 | $ | 1,298 | ||||||||||
| Core earnings | 212 | 221 | 220 | 433 | 444 | |||||||||||||||
| Premiums and deposits | 3,806 | 3,444 | 5,024 | 7,250 | 9,454 | |||||||||||||||
| Funds under management (billions) | 76.2 | 74.5 | 75.4 | 76.2 | 75.4 | |||||||||||||||
| (1) | See “Performance and Non-GAAP Measures” for a reconciliation between IFRS net income attributed to shareholders and core earnings. |
Asia Division’s net income attributed to shareholders was US$308 million in 2Q14 compared with US$378 million in 2Q13, and core earnings in 2Q14 were US$212 million compared with US$220 million in 2Q13. Core earnings increased US$25 million compared to 2Q13, after adjusting for the increased dynamic hedging costs (there is a corresponding decrease in macro hedging costs in the Corporate and Other segment), the impact of changes in currency rates and the sale of our Taiwan insurance business in 4Q13. This growth in core earnings was driven by improved new business margins from a favorable product mix and pricing actions, higher fee income and improved policyholder experience.
Year-to-date net income attributed to shareholders was US$527 million in 2014 compared with US$1,298 million for the same period of 2013. The decline of US$771 million was primarily related to the direct impact of equity markets on variable annuity guarantee liabilities not dynamically hedged. Year-to-date core earnings in 2014 increased US$62 million after adjusting for the same items as in the paragraph above, reflecting business growth, higher new business margins and improved policyholder experience.
Premiums and deposits in 2Q14 were US$3.8 billion, a decrease of 21% on a constant currency basis compared with 2Q13. Premiums and deposits for insurance products were US$1.5 billion, an increase of 10% compared with 2Q13 (adjusted to exclude the Taiwan insurance business), driven by strong corporate product sales in Japan and in-force business growth, notably in Hong Kong, Indonesia and China. Wealth management premiums and deposits of US$2.3 billion decreased by 33% compared to 2Q13, as rising interest rates and market uncertainty since the second half of 2013 continued to impact some of our key markets. Compared to 1Q14, wealth management premiums and deposits increased 19% reflecting improved market sentiment and recent marketing campaigns.
Funds under management as at June 30, 2014 were US$76.2 billion, an increase of 3% on a constant currency basis compared with June 30, 2013. Net policyholder cash inflows of US$2.5 billion and favourable market returns in the past 12 months were largely offset by the US$2 billion impact from the sale of our Taiwan insurance business as well as unfavorable currency movements.
C2 Canadian Division
| ($ millions, unless otherwise stated) | Quarterly Results | YTD Results | ||||||||||||||||||
| Canadian dollars | 2Q 2014 | 1Q 2014 | 2Q 2013 | 1H 2014 | 1H 2013 | |||||||||||||||
| Net income attributed to shareholders | $ | 267 | $ | 377 | $ | 103 | $ | 644 | $ | 41 | ||||||||||
Core earnings(1) | 232 | 228 | 225 | 460 | 404 | |||||||||||||||
| Premiums and deposits | 5,069 | 6,050 | 5,661 | 11,119 | 10,996 | |||||||||||||||
| Funds under management (billions) | 153.4 | 150.3 | 135.8 | 153.4 | 135.8 | |||||||||||||||
| (1) | See “Performance and Non-GAAP Measures” for a reconciliation between IFRS net income attributed to shareholders and core earnings. |
Canadian Division’s net income attributed to shareholders was $267 million in 2Q14 compared with net income of $103 million in 2Q13. Market and investment-related experience increased by $157 million, and core earnings of $232 million in 2Q14 increased $7 million compared with 2Q13. Increases in core earnings driven by in-force business growth, including higher fee income from our growing wealth management businesses were partly offset by lower new business margins due to sales mix and lower interest rates.
Year-to-date net income attributed to shareholders was $644 million compared with $41 million for the same period of 2013. Year-to-date core earnings of $460 million were $56 million higher than the first 6 months of 2013 reflecting business growth and improved claims experience. Excluded from core earnings were market and investment-related gains of $184 million in the first half of 2014 compared with losses of $363 million in the first half of 2013.
Premiums and deposits of $5.1 billion in 2Q14 decreased 10% from 2Q13. After adjusting for the large Group Benefits single premium sales and deposits to a closed end fund in 2Q13, premiums and deposits increased 2% year-over-year.
Funds under management were a record $153.4 billion as at June 30, 2014, an increase of 13% from June 30, 2013 driven by business growth and the favourable impact of equity market appreciation and lower interest rates.
Manulife Financial Corporation - Second Quarter 2014
10
C3 U.S. Division
| ($ millions, unless otherwise stated) | Quarterly Results | YTD Results | ||||||||||||||||||
| Canadian dollars | 2Q 2014 | 1Q 2014 | 2Q 2013 | 1H 2014 | 1H 2013 | |||||||||||||||
| Net income attributed to shareholders | $ | 559 | $ | 403 | $ | 429 | $ | 962 | $ | 1,155 | ||||||||||
Core earnings(1) | 329 | 374 | 343 | 703 | 783 | |||||||||||||||
| Premiums and deposits | 12,947 | 13,399 | 11,713 | 26,346 | 23,438 | |||||||||||||||
| Funds under management (billions) | 360.5 | 360.5 | 315.7 | 360.5 | 315.7 | |||||||||||||||
| U.S. dollars | ||||||||||||||||||||
| Net income attributed to shareholders | $ | 513 | $ | 366 | $ | 419 | $ | 879 | $ | 1,139 | ||||||||||
| Core earnings | 302 | 339 | 336 | 641 | 772 | |||||||||||||||
| Premiums and deposits | 11,873 | 12,146 | 11,450 | 24,019 | 23,079 | |||||||||||||||
| Funds under management (billions) | 337.7 | 326.2 | 300.3 | 337.7 | 300.3 | |||||||||||||||
| (1) | See “Performance and Non-GAAP Measures” for a reconciliation between IFRS net income attributed to shareholders and core earnings. |
U.S. Division’s net income attributed to shareholders was US$513 million for 2Q14 compared with US$419 million for 2Q13. Core earnings for 2Q14 were US$302 million, a decrease of US$34 million compared with 2Q13.
The decrease in core earnings was driven by increased dynamic hedging costs (there is a corresponding decrease in macro hedging costs in the Corporate and Other segment), the impact of higher markets and risk management activities leading to lower releases of provisions for adverse deviation on variable annuity business and lower new business gains in the Insurance business. Partially offsetting these items was higher wealth management fee income due to higher asset levels and lower amortization of deferred acquisition costs due to the on-going run-off of variable annuity business. Items reconciling core earnings to net income attributed to shareholders in both 2Q14 and 2Q13 included favourable investment-related experience and the impact of equity markets and interest rates.
Year-to-date net income attributed to shareholders was US$879 million in 2014 compared with US$1,139 million for the same period in 2013. Year-to-date core earnings of US$641 million in 2014 were US$131 million lower than the first 6 months of 2013. In addition to the items above, we reported unfavourable claims experience in 1Q14 and more favourable tax related items in 2013. Excluded from core earnings was favourable market and investment-related experience of US$238 million in the first 6 months of 2014 compared with US$367 million in the first 6 months of 2013.
Premiums and deposits for 2Q14 were US$11.9 billion, an increase of 4% compared with 2Q13. The increase was driven by record sales in mutual funds partially offset by lower life insurance premiums consistent with dampened sales.
Funds under management as at June 30, 2014 were a record US$337.7 billion, up 12% from June 30, 2013 levels. The increase was due to positive investment returns and strong net mutual fund sales in JH Investments partially offset by surrender and benefit payments in John Hancock Annuities.
C4 Corporate and Other
| Quarterly Results | YTD Results | |||||||||||||||||||
(C$ millions, unless otherwise stated) | 2Q 2014 | 1Q 2014 | 2Q 2013 | 1H 2014 | 1H 2013 | |||||||||||||||
| Net loss attributed to shareholders | $ | (220 | ) | $ | (204 | ) | $ | (659 | ) | $ | (424 | ) | $ | (1,711 | ) | |||||
Core losses (excl. macro hedges and core investment gains)(1) | $ | (92 | ) | $ | (135 | ) | $ | (105 | ) | $ | (227 | ) | $ | (233 | ) | |||||
| Expected cost of macro hedges | (49 | ) | (42 | ) | (128 | ) | (91 | ) | (276 | ) | ||||||||||
| Investment-related experience included in core earnings | 50 | 50 | 48 | 100 | 98 | |||||||||||||||
| Total core losses | $ | (91 | ) | $ | (127 | ) | $ | (185 | ) | $ | (218 | ) | $ | (411 | ) | |||||
| Premiums and deposits | $ | 2,800 | $ | 2,187 | $ | 1,167 | $ | 4,987 | $ | 1,972 | ||||||||||
| Funds under management (billions) | 42.0 | 41.8 | 36.2 | 42.0 | 36.2 | |||||||||||||||
| (1) | See “Performance and Non-GAAP Measures” for a reconciliation between IFRS net income attributed to shareholders and core earnings. |
Corporate and Other is composed of: Investment performance on assets backing capital, net of amounts allocated to operating divisions and financing costs; Investment Division’s external asset management business; Property and Casualty Reinsurance business; as well as run-off reinsurance operations including variable annuities and accident and health.
For segment reporting purposes, the impact of updates to actuarial assumptions, settlement costs for macro equity hedges and other non-operating items are included in this segment’s earnings.
Corporate and Other reported a net loss attributed to shareholders of $220 million for 2Q14 compared to a net loss of $659 million for 2Q13. Core losses were $91 million in 2Q14 compared to core losses of $185 million in 2Q13.
Manulife Financial Corporation - Second Quarter 2014
11
Charges in 2Q14 excluded from core losses totaled $129 million (2Q13 - $474 million):
| · | $62 million of net experience losses on macro hedges (2Q13 - $231 million), |
| · | $30 million charge for changes in actuarial methods and assumptions (2Q13 - $35 million), |
| · | $8 million of realized losses on AFS bonds and interest rate swaps (2Q13 - $127 million), and |
| · | $50 million related to the total company offset included in core investment-related experience (2Q13 - $48 million; 2Q13 also included $81 million related to severance accruals and market- related charges). |
| · | Partially offsetting these items was a $21 million gain related to other mark-to-market gains (2Q13 - $50 million gain reflecting the impact of provincial tax rate changes). |
Core losses declined by $94 million from 2Q13 primarily due to a $79 million decrease in the expected cost of macro hedging and the $26 million release of a legal provision.
On a year-to-date basis the net loss attributed to shareholders of $424 million in 2014 compared to a net loss of $1,711 million for the same period of 2013. Year-to-date charges of $206 million in 2014 not included in core earnings were $1,094 million lower than the same period last year primarily reflecting a decline in macro hedging losses, realized losses on AFS bonds and related swaps and other mark-to-market gains. Year-to-date core losses of $218 million in 2014 were $193 million lower than the same period in 2013 reflecting a decrease in the expected cost of macro hedging and the release of a legal provision.
Premiums and deposits for 2Q14 of $2.8 billion increased from $1.2 billion in 2Q13 as a result of higher deposits from institutional asset management clients.
Funds under management of $42 billion as at June 30, 2014 (June 30, 2013 – $36.2 billion) included record assets managed by Manulife Asset Management on behalf of institutional clients of $37.4 billion (2013 – $30.6 billion) and $8.8 billion (2013 – $8.4 billion) of the Company’s own funds, partially offset by a $4.2 billion (2013 – $2.8 billion) total company adjustment related to the reclassification of derivative positions from invested assets to other assets and liabilities.
Manulife Financial Corporation - Second Quarter 2014
12
| D | RISK MANAGEMENT AND RISK FACTORS UPDATE |
This section provides an update to our risk management practices and risk factors outlined in the MD&A in our 2013 Annual Report. The shaded text and tables in this section of the MD&A represent our disclosure on market and liquidity risk in accordance with IFRS7, “Financial Instruments – Disclosures”. Accordingly, the following shaded text and tables represent an integral part of our unaudited Interim Consolidated Financial Statements.
| D1 | Variable annuity and segregated fund guarantees |
As described in the MD&A in our 2013 Annual Report, guarantees on variable products and segregated funds may include one or more of death, maturity, income and withdrawal guarantees. Variable annuity and segregated fund guarantees are contingent and only payable upon the occurrence of the relevant event, if fund values at that time are below guaranteed values. Depending on future equity market levels, liabilities on current in-force business would be due primarily in the period from 2015 to 2038. We seek to mitigate a portion of the risks embedded in our retained (i.e. net of reinsurance) variable annuity and segregated fund guarantee business through the combination of our dynamic and macro hedging strategies (see section D3 “Publicly traded equity performance risk” below). The table below shows selected information regarding the Company’s variable annuity and segregated fund guarantees gross and net of reinsurance. |
Variable annuity and segregated fund guarantees, net of reinsurance
| As at | June 30, 2014 | December 31, 2013 | ||||||||||||||||||||||
| (C$ millions) | Guarantee value | Fund value | Amount at risk(4),(5) | Guarantee value | Fund value | Amount at risk(4),(5) | ||||||||||||||||||
Guaranteed minimum income benefit(1) | $ | 5,795 | $ | 4,848 | $ | 1,013 | $ | 6,194 | $ | 5,161 | $ | 1,109 | ||||||||||||
| Guaranteed minimum withdrawal benefit | 64,875 | 63,720 | 3,400 | 66,189 | 63,849 | 4,120 | ||||||||||||||||||
| Guaranteed minimum accumulation benefit | 16,368 | 20,275 | 56 | 16,942 | 20,581 | 94 | ||||||||||||||||||
Gross living benefits(2) | $ | 87,038 | $ | 88,843 | $ | 4,469 | $ | 89,325 | $ | 89,591 | $ | 5,323 | ||||||||||||
Gross death benefits(3) | 12,054 | 10,977 | 1,257 | 12,490 | 11,230 | 1,413 | ||||||||||||||||||
| Total gross of reinsurance and hedging | $ | 99,092 | $ | 99,820 | $ | 5,726 | $ | 101,815 | $ | 100,821 | $ | 6,736 | ||||||||||||
| Living benefits reinsured | $ | 5,059 | $ | 4,254 | $ | 854 | $ | 5,422 | $ | 4,544 | $ | 942 | ||||||||||||
| Death benefits reinsured | 3,472 | 3,363 | 527 | 3,601 | 3,465 | 564 | ||||||||||||||||||
| Total reinsured | $ | 8,531 | $ | 7,617 | $ | 1,381 | $ | 9,023 | $ | 8,009 | $ | 1,506 | ||||||||||||
| Total, net of reinsurance | $ | 90,561 | $ | 92,203 | $ | 4,345 | $ | 92,792 | $ | 92,812 | $ | 5,230 | ||||||||||||
| (1) | Contracts with guaranteed long-term care benefits are included in this category. |
| (2) | Where a policy includes both living and death benefits, the guarantee in excess of the living benefit is included in the death benefit category. |
| (3) | Death benefits include stand-alone guarantees and guarantees in excess of living benefit guarantees where both death and living benefits are provided on a policy. |
| (4) | Amount at risk (in-the-money amount) is the excess of guarantee values over fund values on all policies where the guarantee value exceeds the fund value. This amount is not currently payable. For guaranteed minimum death benefit, the amount at risk is defined as the current guaranteed minimum death benefit in excess of the current account balance. For guaranteed minimum income benefit, the amount at risk is defined as the excess of the current annuitization income base over the current account value. For all guarantees, the amount at risk is floored at zero at the single contract level. |
| (5) | The amount at risk net of reinsurance at June 30, 2014 was $4,345 million (December 31, 2013 – $5,230 million) of which: US$2,757 million (December 31, 2013 – US$3,124 million) was on our U.S. business, $812 million (December 31, 2013 – $1,248 million) was on our Canadian business, US$289 million (December 31, 2013 – US$335 million) was on our Japan business and US$263 million (December 31, 2013 – US$285 million) was related to Asia (other than Japan) and our run-off reinsurance business. |
The amount at risk on variable annuity contracts, net of reinsurance was $4.3 billion at June 30, 2014, compared with $5.2 billion at December 31, 2013. The policy liabilities established for variable annuity and segregated fund guarantees were $2,680 million at June 30, 2014 (December 31, 2013 - $1,197 million). For non-dynamically hedged business, policy liabilities increased from $589 million at December 31, 2013 to $644 million at June 30, 2014. For the dynamically hedged business, the policy liabilities increased from $608 million at December 31, 2013 to $2,036 million at June 30, 2014. The increase in the total policy liabilities for variable annuity and segregated fund guarantees since December 31, 2013 is mainly due to the decline in yield curves and in the case of dynamically hedged business, is also due to the decrease in swap rates in North America. |
| D2 | Caution related to sensitivities |
In this document, we provide sensitivities and risk exposure measures for certain risks. These include sensitivities due to specific changes in market prices and interest rate levels projected using internal models as at a specific date, and are measured relative to a starting level reflecting the Company’s assets and liabilities at that date and the actuarial factors, investment activity and investment returns assumed in the determination of policy liabilities. The risk exposures measure the impact of changing one factor at a time and assume that all other factors remain unchanged. Actual results can differ significantly from these estimates for a variety of reasons including the interaction among these factors when more than one changes; changes in actuarial and investment return and future investment activity assumptions; actual experience differing from the assumptions, changes in business mix, effective tax rates and other market factors; and the general limitations of our internal models. For these reasons, the sensitivities should only be viewed as directional estimates of the underlying sensitivities for the respective factors based on the assumptions outlined below. Given the nature of these calculations, we cannot provide assurance that the actual impact on net income attributed to shareholders or on MLI’s MCCSR ratio will be as indicated.
Manulife Financial Corporation - Second Quarter 2014
13
| D3 | Publicly traded equity performance risk |
As outlined in our 2013 Annual Report, our macro hedging strategy is designed to mitigate public equity risk arising from variable annuity guarantees not dynamically hedged and from other products and fees. In addition, our variable annuity guarantee dynamic hedging strategy is not designed to completely offset the sensitivity of policy liabilities to all risks associated with the guarantees embedded in these products (see pages 48 and 49 of our 2013 Annual Report).
The tables below show the potential impact on net income attributed to shareholders resulting from an immediate 10, 20 and 30 % change in market values of publicly traded equities followed by a return to the expected level of growth assumed in the valuation of policy liabilities. The potential impact is shown after taking into account the impact of the change in markets on the hedge assets. While we cannot reliably estimate the amount of the change in dynamically hedged variable annuity guarantee liabilities that will not be offset by the profit or loss on the dynamic hedge assets, we make certain assumptions for the purposes of estimating the impact on shareholders’ net income. This estimate assumes that the performance of the dynamic hedging program would not completely offset the gain/loss from the dynamically hedged variable annuity guarantee liabilities. It assumes that the hedge assets are based on the actual position at the period end, and that equity hedges in the dynamic program are rebalanced at 5% intervals. In addition, we assume that the macro hedge assets are rebalanced in line with market changes. |
It is also important to note that these estimates are illustrative, and that the hedging program may underperform these estimates, particularly during periods of high realized volatility and/or periods where both interest rates and equity market movements are unfavourable. This disclosure has been simplified in 2Q14 to exclude the impact of assuming that the change in the value of dynamic hedge assets completely offsets the change in dynamically hedged variable annuity guarantees, and now shows the impact of macro and dynamic hedge assets in aggregate. |
Potential impact on net income attributed to shareholders arising from changes to public equities(1)
| As at June 30, 2014 | ||||||||||||||||||||||||
| (C$ millions) | -30 | % | -20 | % | -10 | % | 10 | % | 20 | % | 30 | % | ||||||||||||
Underlying sensitivity to net income attributed to shareholders(2) | ||||||||||||||||||||||||
| Variable annuity guarantees | $ | (4,320 | ) | $ | (2,430 | ) | $ | (990 | ) | $ | 630 | $ | 1,040 | $ | 1,330 | |||||||||
| Asset based fees | (330 | ) | (220 | ) | (110 | ) | 110 | 220 | 330 | |||||||||||||||
General fund equity investments (3) | (530 | ) | (350 | ) | (180 | ) | 180 | 360 | 530 | |||||||||||||||
| Total underlying sensitivity before hedging | $ | (5,180 | ) | $ | (3,000 | ) | $ | (1,280 | ) | $ | 920 | $ | 1,620 | $ | 2,190 | |||||||||
Impact of macro and dynamic hedge assets(4) | $ | 3,630 | $ | 1,980 | $ | 850 | $ | (750 | ) | $ | (1,310 | ) | $ | (1,740 | ) | |||||||||
| Net potential impact on net income after impact of hedging | $ | (1,550 | ) | $ | (1,020 | ) | $ | (430 | ) | $ | 170 | $ | 310 | $ | 450 | |||||||||
| As at December 31, 2013 | ||||||||||||||||||||||||
| (C$ millions) | -30 | % | -20 | % | -10 | % | 10 | % | 20 | % | 30 | % | ||||||||||||
Underlying sensitivity to net income attributed to shareholders(2) | ||||||||||||||||||||||||
| Variable annuity guarantees | $ | (4,120 | ) | $ | (2,310 | ) | $ | (960 | ) | $ | 610 | $ | 1,060 | $ | 1,380 | |||||||||
| Asset based fees | (310 | ) | (210 | ) | (110 | ) | 110 | 210 | 310 | |||||||||||||||
General fund equity investments(3) | (420 | ) | (280 | ) | (130 | ) | 140 | 280 | 430 | |||||||||||||||
| Total underlying sensitivity before hedging | $ | (4,850 | ) | $ | (2,800 | ) | $ | (1,200 | ) | $ | 860 | $ | 1,550 | $ | 2,120 | |||||||||
Impact of macro and dynamic hedge assets(4) | $ | 3,510 | $ | 1,880 | $ | 770 | $ | (680 | ) | $ | (1,160 | ) | $ | (1,510 | ) | |||||||||
| Net potential impact on net income after impact of hedging | $ | (1,340 | ) | $ | (920 | ) | $ | (430 | ) | $ | 180 | $ | 390 | $ | 610 | |||||||||
| (1) | See “Caution related to sensitivities” above. |
| (2) | Defined as earnings sensitivity to a change in public equity markets including settlements on reinsurance contracts, but before the offset of hedge assets or other risk mitigants. |
| (3) | This impact for general fund equities is calculated as at a point-in-time and does not include: (i) any potential impact on public equity weightings; (ii) any gains or losses on public equities held in the Corporate and Other segment; or (iii) any gains or losses on public equity investments held in Manulife Bank. The participating policy funds are largely self-supporting and generate no material impact on net income attributed to shareholders as a result of changes in equity markets. |
| (4) | Includes the impact of rebalancing equity hedges in the macro and dynamic hedging program. The impact of dynamic hedge rebalancing represents the impact of rebalancing equity hedges for dynamically hedged variable annuity guarantee best estimate liabilities at 5% intervals, but does not include any impact in respect of other sources of hedge ineffectiveness e.g. fund tracking, realized volatility and equity, interest rate correlations different from expected among other factors. |
Potential impact on MLI’s MCCSR ratio arising from public equity returns different from the expected return for policy liability valuation(1),(2)
| Impact on MLI MCCSR ratio | ||||||||||||||||||||||||
| Percentage points | -30 | % | -20 | % | -10 | % | +10 | % | +20 | % | +30 | % | ||||||||||||
| June 30, 2014 | (19 | ) | (10 | ) | (4 | ) | 5 | 15 | 18 | |||||||||||||||
| December 31, 2013 | (14 | ) | (8 | ) | (4 | ) | 13 | 25 | 25 | |||||||||||||||
| (1) | See “Caution related to sensitivities” above. In addition, estimates exclude changes to the net actuarial gains/losses with respect to the Company’s pension obligations as a result of changes in equity markets, as the impact on the quoted sensitivities is not considered to be material. |
| (2) | The potential impact is shown assuming that the change in value of the hedge assets does not completely offset the change in the dynamically hedged variable annuity guarantee liabilities. The estimated amount that would not be completely offset relates to our practices of not hedging the provisions for adverse deviation and of rebalancing equity hedges for dynamically hedged variable annuity liabilities at 5% intervals. |
Manulife Financial Corporation - Second Quarter 2014
14
The following table shows the notional value of shorted equity futures contracts utilized for our variable annuity guarantee dynamic hedging and our macro equity risk hedging strategies.
| As at | June 30, | December 31, | ||||||
| (C$ millions) | 2014 | 2013 | ||||||
| For variable annuity guarantee dynamic hedging strategy | $ | 8,200 | $ | 7,500 | ||||
| For macro equity risk hedging strategy | 2,900 | 2,000 | ||||||
| Total | $ | 11,100 | $ | 9,500 | ||||
| D4 | Interest rate and spread risk |
At June 30, 2014, we estimated the sensitivity of our net income attributed to shareholders to a 100 basis point parallel decline in interest rates to be a charge of $600 million, and to a 100 basis point increase in interest rates to be a benefit of $100 million. The $200 million increase in sensitivity to a 100 basis point decline in interest rates from December 31, 2013 was primarily attributable to interest rate movements in the first half of 2014. The 100 basis point parallel decline includes a change of one per cent in current government, swap and corporate rates for all maturities across all markets with no change in credit spreads between government, swap and corporate rates, and with a floor of zero on government rates and corporate spreads, relative to the rates assumed in the valuation of policy liabilities, including embedded derivatives. As the sensitivity to a 100 basis point change in interest rates includes any associated change in the applicable prescribed reinvestment scenario, the impact of changes to interest rates for less than, or more than, the amounts indicated are unlikely to be linear. Furthermore, the reinvestment scenario changes tend to amplify the negative effects of a decrease in interest rates, and dampen the positive effects of an increase in interest rates. For variable annuity guarantee liabilities that are dynamically hedged, it is assumed that interest rate hedges are rebalanced at 20 basis point intervals. |
The income impact does not allow for any future potential changes to the URR assumptions or other potential impacts of lower interest rate levels, for example, increased strain on the sale of new business or lower interest earned on our surplus assets. It also does not reflect potential management actions to realize gains or losses on AFS fixed income assets held in the surplus segment in order to partially offset changes in MLI’s MCCSR ratio due to changes in interest rate levels.
Potential impact on net income attributed to shareholders and MLI’s MCCSR ratio of an immediate 1% parallel change in interest rates relative to rates assumed in the valuation of policy liabilities(1),(2),(3),(4)
| June 30, 2014 | December 31,2013 | |||||||||||||||
| As at | -100 | bp | +100 | bp | -100 | bp | +100 | bp | ||||||||
| Net income attributed to shareholders (C$ millions) | ||||||||||||||||
| Excluding change in market value of AFS fixed income assets held in the surplus segment | $ | (600 | ) | $ | 100 | $ | (400 | ) | $ | - | ||||||
| From fair value changes in AFS fixed income assets held in surplus, if realized | 700 | (600 | ) | 600 | (600 | ) | ||||||||||
MLI's MCCSR ratio (Percentage points) | ||||||||||||||||
Before impact of change in market value of AFS fixed income assets held in the surplus segment(5) | (15 | ) | 12 | (13 | ) | 18 | ||||||||||
| From fair value changes in AFS fixed income assets held in surplus, if realized | 5 | (4 | ) | 4 | (5 | ) | ||||||||||
| (1) | See “Caution related to sensitivities” above. In addition, estimates exclude changes to the net actuarial gains/losses with respect to the Company’s pension obligations as a result of changes in interest rates, as the impact on the quoted sensitivities is not considered to be material. |
| (2) | Includes guaranteed insurance and annuity products, including variable annuity contracts as well as adjustable benefit products where benefits are generally adjusted as interest rates and investment returns change, a portion of which have minimum credited rate guarantees. For adjustable benefit products subject to minimum rate guarantees, the sensitivities are based on the assumption that credited rates will be floored at the minimum. |
| (3) | The amount of gain or loss that can be realized on AFS fixed income assets held in the surplus segment will depend on the aggregate amount of unrealized gain or loss. |
| (4) | Sensitivities are based on projected asset and liability cash flows at the beginning of the quarter adjusted for the estimated impact of new business, investment markets and asset trading during the quarter. Any true-up to these estimates, as a result of the final asset and liability cash flows to be used in the next quarter’s projection, are reflected in the next quarter’s sensitivities. Impact of realizing fair value changes in AFS fixed income assets is as of the end of the quarter. |
| (5) | The impact on MLI’s MCCSR ratio includes both the impact of the change in earnings on available capital as well as the change in required capital that results from a change in interest rates. The potential increase in required capital accounted for 10 of the 15 point impact of a 100 bp decline in interest rates on MLI’s MCCSR ratio this quarter. |
The following table shows the potential impact on net income attributed to shareholders resulting from a change in credit spreads and swap spreads over government bond rates for all maturities across all markets with a floor of zero on the total interest rate, relative to the spreads assumed in the valuation of policy liabilities. |
Manulife Financial Corporation - Second Quarter 2014
15
Potential impact on net income attributed to shareholders arising from changes to corporate spreads and swap spreads(1),(2),(3)
As at | ||||||||
(C$ millions) | June 30, 2014 | December 31, 2013 | ||||||
Corporate spreads(4) | ||||||||
Increase 50 basis points | $ | 400 | $ | 400 | ||||
Decrease 50 basis points | (400 | ) | (400 | ) | ||||
Swap spreads | ||||||||
Increase 20 basis points | $ | (500 | ) | $ | (400 | ) | ||
Decrease 20 basis points | 500 | 400 | ||||||
| (1) | See “Caution related to sensitivities” above. |
| (2) | The impact on net income attributed to shareholders assumes no gains or losses are realized on our AFS fixed income assets held in the surplus segment and excludes the impact arising from changes in off-balance sheet bond fund value arising from changes in credit spreads. The participating policy funds are largely self-supporting and generate no material impact on net income attributed to shareholders as a result of changes in corporate and swap spreads. |
| (3) | Sensitivities are based on projected asset and liability cash flows at the beginning of the quarter adjusted for the estimated impact of new business, investment markets and asset trading during the quarter. Any true-up to these estimates, as a result of the final asset and liability cash flows to be used in the next quarter’s projection, are reflected in the next quarter’s sensitivities. |
| (4) | Corporate spreads are assumed to grade to an expected long-term average over five years. |
As the sensitivity to a 50 basis point decline in corporate spreads includes the impact of a change in prescribed reinvestment scenarios where applicable, the impact of changes to corporate spreads for less than, or more than, the amounts indicated are unlikely to be linear. The potential earnings impact of a 50 basis point decline in corporate spreads related to the impact of the scenario change was not significant at June 30, 2014 and was not significant at December 31, 2013. The $100 million increase in sensitivity to swap spreads was primarily attributable to interest rate and swap spread movements during the first half of 2014. |
Alternative Long-Duration Asset (“ALDA”) Performance Risk
The following table shows the potential impact on net income attributed to shareholders resulting from changes in market values of ALDA that differ from the expected levels assumed in the valuation of policy liabilities. |
Potential impact on net income attributed to shareholders arising from changes in ALDA returns(1),(2),(3),(4)
| As at | June 30, 2014 | December 31, 2013 | ||||||||||||||
| (C$ millions) | -10 | % | 10 | % | -10 | % | 10 | % | ||||||||
| Real estate, agriculture and timber assets | $ | (1,100 | ) | $ | 1,100 | $ | (1,000 | ) | $ | 1,000 | ||||||
| Private equities and other alternative long-duration assets | (1,100 | ) | 1,000 | (900 | ) | 800 | ||||||||||
| Alternative long-duration assets | $ | (2,200 | ) | $ | 2,100 | $ | (1,900 | ) | $ | 1,800 | ||||||
| (1) | See “Caution Related to Sensitivities” above. |
| (2) | This impact is calculated as at a point-in-time impact and does not include: (i) any potential impact on ALDA weightings; (ii) any gains or losses on ALDA held in the Corporate and Other segment; or (iii) any gains or losses on ALDA held in Manulife Bank. |
| (3) | The participating policy funds are largely self-supporting and generate no material impact on net income attributed to shareholders as a result of changes in alternative long-duration asset returns. |
| (4) | Net income impact does not consider any impact of the market correction on assumed future return assumptions. |
The increased sensitivity from December 31, 2013 to June 30, 2014 is related to the impact of the decrease in risk free rates in some jurisdictions during the period, decreasing the rate at which funds can be reinvested, as well as the increase in market value of the ALDA, due to investment activities and positive investment returns. |
Manulife Financial Corporation - Second Quarter 2014
16
| E | ACCOUNTING MATTERS AND CONTROLS |
| E1 | Critical accounting and actuarial policies |
Our significant accounting policies under IFRS are described in note 1 to our Consolidated Financial Statements for the year ended December 31, 2013. The critical accounting policies and the estimation processes related to the determination of insurance contract liabilities, fair values of financial instruments, the application of derivative and hedge accounting, the determination of pension and other post-employment benefit obligations and expenses, and accounting for income taxes and uncertain tax positions are described on pages 67 to 75 of our 2013 Annual Report.
| E2 | Sensitivity of policy liabilities to updates to assumptions |
When the assumptions underlying our determination of policy liabilities are updated to reflect recent and emerging experience or change in outlook, the result is a change in the value of policy liabilities which in turn affects income. The sensitivity of after-tax income to updates to asset related assumptions underlying policy liabilities is shown below, assuming that there is a simultaneous update to the assumption across all business units.
For updates to asset related assumptions, the sensitivity is shown net of the corresponding impact on income of the change in the value of the assets supporting policy liabilities. In practice, experience for each assumption will frequently vary by business and geographic market and assumption updates are made on a business/geographic specific basis. Actual results can differ materially from these estimates for a variety of reasons including the interaction among these factors when more than one changes; changes in actuarial and investment return and future investment activity assumptions; actual experience differing from the assumptions; changes in business mix, effective tax rates and other market factors; and the general limitations of our internal models.
Most participating business is excluded from this analysis because of the ability to pass both favourable and adverse experience to the policyholders through the participating dividend adjustment. The estimated potential impact on net income for the next 5 years and the following 5 years from changes in the fixed income URR driven by changes in risk free rates is not shown here. After the implementation of the revised actuarial standards of practice relating to reinvestment assumptions in 4Q14 we do not anticipate that there will be any further impact on net income due to changes in fixed income URR16.
Potential impact on net income attributed to shareholders arising from changes to asset related assumptions supporting actuarial liabilities, excluding the fixed income ultimate reinvestment rate discussed above.
| As at | Increase (decrease) in after-tax income | |||||||||||||||
| (C$ millions) | June 30, 2014 | December 31, 2013 | ||||||||||||||
| Asset related assumptions updated periodically in valuation basis changes | Increase | Decrease | Increase | Decrease | ||||||||||||
100 basis point change in future annual returns for public equities(1) | $ | 300 | $ | (300 | ) | $ | 400 | $ | (400 | ) | ||||||
100 basis point change in future annual returns for alternative long-duration assets(2) | 4,400 | (4,300 | ) | 3,800 | (3,700 | ) | ||||||||||
100 basis point change in equity volatility assumption for stochastic segregated fund modelling(3) | (200 | ) | 200 | (200 | ) | 200 | ||||||||||
| (1) | The sensitivity to public equity returns above includes the impact on both segregated fund guarantee reserves and on other policy liabilities. For a 100 basis point increase in expected growth rates, the impact from segregated fund guarantee reserves is a $200 million increase (December 31, 2013 – $200 million increase). For a 100 basis point decrease in expected growth rates, the impact from segregated fund guarantee reserves is a $200 million decrease (December 31, 2013 – $200 million decrease). Expected long-term annual market growth assumptions for public equities pre-dividends for key markets are based on long-term historical observed experience and compliance with actuarial standards. The growth rates for returns in the major markets used in the stochastic valuation models for valuing segregated fund guarantees are 7.6% per annum in Canada, 7.6% per annum in the U.S. and 5.2% per annum in Japan. Growth assumptions for European equity funds are market-specific and vary between 5.8% and 7.85%. |
| (2) | ALDA include commercial real estate, timber and agricultural real estate, oil and gas, and private equities. The increase of $600 million in sensitivity from December 31, 2013 to June 30, 2014 is related to the impact of the decrease in risk free rates in some jurisdictions during the period, decreasing the rate at which funds can be reinvested, as well as the increase in market value of the ALDA, due to investment activities and positive investment returns. |
| (3) | Volatility assumptions for public equities are based on long-term historic observed experience and compliance with actuarial standards. The resulting volatility assumptions are 17.15% per annum in Canada and 17.15% per annum in the U.S. for large cap public equities, and 19% per annum in Japan. For European equity funds, the volatility assumptions vary between 16.15% and 18.4%. |
| E3 | Accounting and reporting changes |
As outlined in section A2, above, in May 2014 the ASB published revisions to the Canadian Actuarial Standards of Practice related to economic reinvestment assumptions used in the valuation of policy liabilities. The revised standards will be effective in the fourth quarter of 2014.
Other future accounting changes are outlined below:
| Topic | Effective Date | Recognition / Measurement / Presentation | Impact / Expected Impact |
| Future Accounting Changes | |||
| IAS 41 "Agriculture" and IAS 16 "Property, Plant and Equipment" | Jan 1, 2016 | Measurement | Currently assessing |
| IAS 16 "Property, Plant and Equipment" and IAS 38 "Intangible Assets" | Jan 1, 2016 | Measurement | Currently assessing |
| IFRS 11 "Joint Arrangements" | Jan 1, 2016 | Recognition and Measurement | Not significant |
| IFRS 15 "Revenue Recognition" | Jan 1, 2017 | Recognition and Measurement | Currently assessing |
| IFRS 9 "Financial Instruments" | Jan 1, 2018 | Measurement | Currently assessing |
Manulife Financial Corporation - Second Quarter 2014
17
| E4 | U.S. GAAP results |
Net income attributed to shareholders in accordance with U.S. GAAP17 for 2Q14 was $906 million, compared with net income attributed to shareholders of $943 million under IFRS. As we are no longer reconciling our financial results under IFRS and U.S. GAAP within our Consolidated Financial Statements, net income attributed to shareholders in accordance with U.S. GAAP is considered a non-GAAP financial measure. The reconciliation of the major differences between net income attributed to shareholders in accordance with IFRS and the net income attributed to shareholders in accordance with U.S. GAAP for 2Q14 follows, with major differences expanded upon below:
| For the quarters ended June 30, | Quarterly Results | |||||||
| (C$ millions, unaudited) | 2014 | 2013 | ||||||
| Net income attributed to shareholders in accordance with IFRS | $ | 943 | $ | 259 | ||||
| Key earnings differences: | ||||||||
Variable annuity guarantee liabilities and related dynamic hedges (1) | $ | 176 | $ | (440 | ) | |||
Impact of mark-to-market accounting and investing activities on investment income and policy liabilities(2) | (160 | ) | (506 | ) | ||||
New business differences including acquisition costs(3) | (203 | ) | (208 | ) | ||||
Changes in actuarial methods and assumptions(4) | 18 | 52 | ||||||
| Other differences | 132 | 151 | ||||||
| Total earnings difference | $ | (37 | ) | $ | (951 | ) | ||
| Net income (loss) attributed to shareholders in accordance with U.S. GAAP | $ | 906 | $ | (692 | ) | |||
| (1) | IFRS follows a predominantly “mark-to-market” accounting approach to measure variable annuity guarantee liabilities while U.S. GAAP only uses “mark-to-market” accounting for certain benefit guarantees. The U.S. GAAP accounting results in an accounting mismatch between the hedge assets supporting the dynamically hedged guarantees and the guarantees not accounted for on a mark-to-market basis. Another difference is that U.S. GAAP reflects the Company’s own credit standing in the measurement of the liability. In 2Q14, we reported a net gain of $244 million (2Q13 – charge of $335 million) in our total variable annuity businesses under U.S. GAAP compared with a gain of $68 million under IFRS (2Q13 – $105 million). Under both accounting bases we reported charges on our macro hedging program of $111 million in 2Q14 (2Q13 – $359 million). |
| (2) | Under IFRS, accumulated unrealized gains and losses arising from fixed income investments and interest rate derivatives supporting policy liabilities are largely offset in the valuation of the policy liabilities. The 2Q14 IFRS impacts of fixed income reinvestment assumptions, general fund equity investments, fixed income and alternative long-duration asset investing totaled a net gain of $317 million (2Q13 – net charge of $165 million) compared with U.S. GAAP net realized gains and other investment-related gains of $157 million (2Q13 – losses of $671 million). |
| (3) | Acquisition costs that are related to and vary with the production of new business are explicitly deferred and amortized under U.S. GAAP but are recognized as an implicit reduction in insurance liabilities along with other new business gains and losses under IFRS. |
| (4) | The charge recognized under IFRS from changes in actuarial methods and assumptions of $30 million in 2Q14 (2Q13 – $35 million) compared to a charge of $12 million (2Q13 –gain of $17 million) on a U.S. GAAP basis. |
Total equity in accordance with U.S. GAAP17 as at June 30, 2014 was approximately $13 billion higher than under IFRS. Of this difference, approximately $7 billion was attributable to the higher cumulative net income on a U.S. GAAP basis. The remaining difference was primarily attributable to the recording of net unrealized gains on fixed income investments and derivatives in a cash flow hedging relationship in Accumulated Other Comprehensive Income (“AOCI”) under U.S. GAAP partially offset by the impact of currency translation on net foreign operations.
17 This item is a non-GAAP measure. See “Performance and Non-GAAP Measures” below.
Manulife Financial Corporation - Second Quarter 2014
18
| E5 | Quarterly financial information |
| The following table provides summary information related to our eight most recently completed quarters: |
| As at and for the three months ended | restated(1) | |||||||||||||||||||||||||||||||
| (C$ millions, except per share amounts or otherwise stated, unaudited) | Jun 30, 2014 | Mar 31, 2014 | Dec 31, 2013 | Sept 30, 2013 | Jun 30, 2013 | Mar 31, 2013 | Dec 31, 2012 | Sept 30, 2012 | ||||||||||||||||||||||||
| Revenue | ||||||||||||||||||||||||||||||||
| Premium income | ||||||||||||||||||||||||||||||||
| Life and health insurance | $ | 3,786 | $ | 3,696 | $ | 3,956 | $ | 3,879 | $ | 3,681 | $ | 3,837 | $ | 4,335 | $ | 3,399 | ||||||||||||||||
| Annuities and pensions | 446 | 465 | 592 | 490 | 495 | 580 | 488 | 501 | ||||||||||||||||||||||||
Net premium income prior to FDA coinsurance(2) | $ | 4,232 | $ | 4,161 | $ | 4,548 | $ | 4,369 | $ | 4,176 | $ | 4,417 | $ | 4,823 | $ | 3,900 | ||||||||||||||||
Premiums ceded relating to FDA coinsurance (2) | - | - | - | - | - | - | (2 | ) | (1,799 | ) | ||||||||||||||||||||||
| Investment income | 2,825 | 2,684 | 2,637 | 2,483 | 2,345 | 2,405 | 2,520 | 2,432 | ||||||||||||||||||||||||
Realized and unrealized gains (losses) on assets supporting insurance and investment contract liabilities and on the macro hedge program(3) | 4,093 | 5,256 | (2,788 | ) | (2,513 | ) | (9,355 | ) | (2,961 | ) | (2,075 | ) | 1,104 | |||||||||||||||||||
| Other revenue | 2,119 | 2,135 | 2,645 | 1,966 | 2,324 | 1,974 | 1,679 | 1,802 | ||||||||||||||||||||||||
| Total revenue | $ | 13,269 | $ | 14,236 | $ | 7,042 | $ | 6,305 | $ | (510 | ) | $ | 5,835 | $ | 6,945 | $ | 7,439 | |||||||||||||||
| Income (loss) before income taxes | $ | 1,211 | $ | 937 | $ | 1,854 | $ | 1,118 | $ | 205 | $ | 570 | $ | 1,091 | $ | (679 | ) | |||||||||||||||
| Income tax (expense) recovery | (234 | ) | (133 | ) | (497 | ) | (172 | ) | 103 | (15 | ) | 14 | 360 | |||||||||||||||||||
| Net income (loss) | $ | 977 | $ | 804 | $ | 1,357 | $ | 946 | $ | 308 | $ | 555 | $ | 1,105 | $ | (319 | ) | |||||||||||||||
| Net income (loss) attributed to shareholders | $ | 943 | $ | 818 | $ | 1,297 | $ | 1,034 | $ | 259 | $ | 540 | $ | 1,077 | $ | (211 | ) | |||||||||||||||
Reconciliation of core earnings to net income (loss) attributed to shareholders | ||||||||||||||||||||||||||||||||
Total core earnings(4) | $ | 701 | $ | 719 | $ | 685 | $ | 704 | $ | 609 | $ | 619 | $ | 554 | $ | 570 | ||||||||||||||||
Other items to reconcile net income attributed to hareholders core earnings(5): | ||||||||||||||||||||||||||||||||
Investment-related experience in excess of amounts included in core earnings | 217 | 225 | 215 | 491 | (97 | ) | 97 | 321 | 365 | |||||||||||||||||||||||
Direct impact of equity markets, interest rates and variable annuity guarantee liabilities | 55 | (90 | ) | (81 | ) | 94 | (242 | ) | (107 | ) | 82 | 34 | ||||||||||||||||||||
Impact of in-force product changes and recapture of reinsurance treaties | - | - | 261 | - | - | - | - | 26 | ||||||||||||||||||||||||
| Change in actuarial methods and assumptions | (30 | ) | (40 | ) | (133 | ) | (252 | ) | (35 | ) | (69 | ) | (87 | ) | (1,006 | ) | ||||||||||||||||
| Goodwill impairment charge | - | - | - | - | - | - | - | (200 | ) | |||||||||||||||||||||||
| Disposition of Taiwan insurance business | - | - | 350 | - | - | - | - | - | ||||||||||||||||||||||||
Tax items and restructuring charge related to organizational design | - | 4 | - | (3 | ) | 24 | - | 207 | - | |||||||||||||||||||||||
| Net income (loss) attributed to shareholders | $ | 943 | $ | 818 | $ | 1,297 | $ | 1,034 | $ | 259 | $ | 540 | $ | 1,077 | $ | (211 | ) | |||||||||||||||
| Basic earnings (loss) per common share | $ | 0.49 | $ | 0.42 | $ | 0.69 | $ | 0.54 | $ | 0.12 | $ | 0.28 | $ | 0.57 | $ | (0.13 | ) | |||||||||||||||
| Diluted earnings (loss) per common share | $ | 0.49 | $ | 0.42 | $ | 0.68 | $ | 0.54 | $ | 0.12 | $ | 0.28 | $ | 0.57 | $ | (0.13 | ) | |||||||||||||||
| Segregated funds deposits | $ | 5,587 | $ | 6,776 | $ | 5,756 | $ | 5,321 | $ | 5,516 | $ | 6,466 | $ | 5,728 | $ | 5,625 | ||||||||||||||||
| Total assets (in billions) | $ | 536 | $ | 539 | $ | 514 | $ | 498 | $ | 498 | $ | 498 | $ | 485 | $ | 479 | ||||||||||||||||
Weighted average common shares (in millions) | 1,854 | 1,849 | 1,844 | 1,839 | 1,834 | 1,828 | 1,822 | 1,816 | ||||||||||||||||||||||||
Diluted weighted average common shares (in millions) | 1,878 | 1,874 | 1,869 | 1,864 | 1,860 | 1,856 | 1,854 | 1,816 | ||||||||||||||||||||||||
Dividends per common share paid in the quarter | $ | 0.13 | $ | 0.13 | $ | 0.13 | $ | 0.13 | $ | 0.13 | $ | 0.13 | $ | 0.13 | $ | 0.13 | ||||||||||||||||
CDN$ to US$1 - Statement of Financial Position | 1.0676 | 1.1053 | 1.0636 | 1.0285 | 1.0512 | 1.0156 | 0.9949 | 0.9837 | ||||||||||||||||||||||||
| CDN$ to US$1 - Statement of Income | 1.0905 | 1.1031 | 1.0494 | 1.0386 | 1.0230 | 1.0083 | 0.9914 | 0.9953 | ||||||||||||||||||||||||
| (1) | The 2012 results were restated to reflect the retrospective application of new IFRS accounting standards effective January 1, 2013. For a detailed description of the change see note 2 to our 2013 Annual Consolidated Financial Statements. |
| (2) | On June 29, 2012 and September 25, 2012 the Company entered into coinsurance agreements to reinsure 89 per cent of its book value fixed deferred annuity (“FDA”) business. Under the terms of the agreements, the Company will maintain responsibility for servicing of the policies and managing some of the assets and has retained the remaining exposure. |
| (3) | For fixed income assets supporting insurance and investment contract liabilities and for equities supporting pass-through products and derivatives related to variable hedging programs, the impact of realized and unrealized gains (losses) on the assets is largely offset in the change in insurance and investment contract liabilities. |
| (4) | Core earnings is a non-GAAP measure. See “Performance and Non-GAAP Measures” below. |
| (5) | For explanations of other items, see “Q2 and year-to-date earnings analysis” table in section B “Financial Highlights” and for an operating segment split of these items see the 8 quarter trend tables in section F3 “Performance and Non-GAAP Measures” which reconcile net income attributed to shareholders to core earnings. |
| E6 | Changes in internal control over financial reporting |
No changes were made in our internal control over financial reporting during the six months ended June 30, 2014, that have materially affected or are reasonably likely to materially affect our internal control over financial reporting.
| E7 | Audit Committee |
As in prior quarters, MFC’s Audit Committee reviewed this MD&A and the unaudited interim financial report and MFC’s Board of Directors approved this MD&A prior to its release.
Manulife Financial Corporation - Second Quarter 2014
19
| F | Other |
| F1 | Quarterly dividend |
On August 6, 2014, our Board of Directors approved an increase of 19% or 2.5 cents to the quarterly shareholders’ dividend resulting in a dividend of 15.5 cents per share on the common shares of MFC, payable on or after September 19, 2014 to shareholders of record at the close of business on August 19, 2014.
The Board also declared dividends on the following non-cumulative preferred shares, payable on or after September 19, 2014 to shareholders of record at the close of business on August 19, 2014.
| Class A Shares Series 1 – $0.25625 per share | Class 1 Shares Series 5 – $0.275 per share |
| Class A Shares Series 2 – $0.29063 per share | Class 1 Shares Series 7 – $0.2875 per share |
| Class A Shares Series 3 – $0.28125 per share | Class 1 Shares Series 9 – $0.275 per share |
| Class 1 Shares Series 1 – $0.35 per share | Class 1 Shares Series 11 – $0.25 per share |
| Class 1 Shares Series 3 – $0.2625 per share | Class 1 Shares Series 13 – $0.2375 per share |
| Class 1 Shares Series 15 – $0.24375 per share |
| F2 | Outstanding shares – selected information |
Class A Shares Series 1
As at August 1, 2014, MFC had 14 million Class A Shares Series 1 (“Series 1 Preferred Shares”) outstanding at a price of $25 per share, for an aggregate amount of $350 million. The Series 1 Preferred Shares are non-voting and are entitled to non-cumulative preferential cash dividends payable quarterly, if and when declared, at a per annum rate of 4.10%. With regulatory approval, the Series 1 Preferred Shares may be redeemed by MFC, in whole or in part, at declining premiums that range from $1.25 to nil per Series 1 Preferred Share, by either payment of cash or the issuance of MFC common shares. On or after December 19, 2015, the Series 1 Preferred Shares will be convertible at the option of the holder into MFC common shares, the number of which is determined by a prescribed formula, and is subject to the right of MFC prior to the conversion date to redeem for cash or find substitute purchasers for such preferred shares. The prescribed formula is the face amount of the Series 1 Preferred Shares divided by the greater of $2.00 and 95% of the then market price of MFC common shares.
Common Shares
As at July 31, 2014 MFC had 1,858 million common shares outstanding.
| F3 | Performance and Non-GAAP Measures |
We use a number of non-GAAP financial measures to measure overall performance and to assess each of our businesses. A financial measure is considered a non-GAAP measure for Canadian securities law purposes if it is presented other than in accordance with generally accepted accounting principles used for the Company’s audited financial statements. Non-GAAP measures include: Core Earnings; Net Income Attributed to Shareholders in Accordance with U.S. GAAP; Total Equity in Accordance with U.S. GAAP; Core ROE; Diluted Core Earnings Per Common Share; Constant Currency Basis; Premiums and Deposits; Funds under Management; Capital; New Business Embedded Value and Sales. Non-GAAP financial measures are not defined terms under GAAP and, therefore, with the exception of Net Income Attributed to Shareholders in Accordance with U.S. GAAP and Total Equity in Accordance with U.S. GAAP (which are comparable to the equivalent measures of issuers whose financial statements are prepared in accordance with U.S. GAAP), are unlikely to be comparable to similar terms used by other issuers. Therefore, they should not be considered in isolation or as a substitute for any other financial information prepared in accordance with GAAP.
Core earnings (losses) is a non-GAAP measure which we use to better understand the long-term earnings capacity and valuation of the business. Core earnings excludes the direct impact of changes in equity markets and interest rates as well as a number of other items, outlined below, that are considered material and exceptional in nature. While this metric is relevant to how we manage our business and offers a consistent methodology, it is not insulated from macro-economic factors, which can have a significant impact.
Any future changes to the core earnings definition referred to below, will be disclosed.
Items that are included in core earnings are:
| 1. | Expected earnings on in-force, including expected release of provisions for adverse deviation, fee income, margins on group business and spread business such as Manulife Bank and asset fund management. |
| 2. | Macro hedging costs based on expected market returns. |
| 3. | New business strain. |
| 4. | Policyholder experience gains or losses. |
| 5. | Acquisition and operating expenses compared to expense assumptions used in the measurement of insurance and investment contract liabilities. |
| 6. | Up to $200 million of favourable investment-related experience reported in a single year which is referred to as “core investment gains”. |
| 7. | Earnings on surplus other than mark-to-market items. Gains on available-for-sale (“AFS”) equities and seed money investments are included in core earnings. |
| 8. | Routine or non-material legal settlements. |
| 9. | All other items not specifically excluded. |
| 10. | Tax on the above items. |
| 11. | All tax related items except the impact of enacted or substantially enacted income tax rate changes. |
Manulife Financial Corporation - Second Quarter 2014
20
Items excluded from core earnings are:
| 1. | The direct impact of equity markets and interest rates and variable annuity guarantee liabilities, consisting of: |
| § | The earnings impact of the difference between the net increase (decrease) in variable annuity liabilities that are dynamically hedged and the performance of the related hedge assets. Our variable annuity dynamic hedging strategy is not designed to completely offset the sensitivity of insurance and investment contract liabilities to all risks or measurements associated with the guarantees embedded in these products for a number of reasons, including: provisions for adverse deviation, fund performance, the portion of the interest rate risk that is not dynamically hedged, realized equity and interest rate volatilities and changes to policyholder behaviour. |
| § | Gains (charges) on variable annuity guarantee liabilities that are not dynamically hedged. |
| § | Gains (charges) on general fund equity investments supporting insurance and investment contract liabilities and on fee income. |
| § | Gains (charges) on macro equity hedges relative to expected costs. The expected cost of macro hedges is calculated using the equity assumptions used in the valuation of insurance and investment contract liabilities. |
| § | Gains (charges) on higher (lower) fixed income reinvestment rates assumed in the valuation of insurance and investment contract liabilities, including the impact on the fixed income ultimate reinvestment rate (“URR”). |
| § | Gains (charges) on sale of AFS bonds and open derivatives not in hedging relationships in the Corporate and Other segment. |
| 2. | Net favourable investment-related experience in excess of $200 million per annum or net unfavourable investment-related experience on a year-to-date basis. Investment-related experience relates to fixed income trading, alternative long-duration asset returns, credit experience and asset mix changes. This favourable and unfavourable investment-related experience is a combination of reported investment experience as well as the impact of investing activities on the measurement of our insurance and investment contract liabilities. The maximum of $200 million per annum to be reported in core earnings compares with an average of over $80 million per quarter of favourable investment-related experience reported since 1Q07. |
| 3. | Mark-to-market gains or losses on assets held in the Corporate and Other segment other than gains on AFS equities and seed money investments in new segregated or mutual funds. |
| 4. | Changes in actuarial methods and assumptions. |
| 5. | The impact on the measurement of insurance and investment contract liabilities of changes in product features or new reinsurance transactions, if material. |
| 6. | Goodwill impairment charges. |
| 7. | Gains or losses on disposition of a business. |
| 8. | Material one-time only adjustments, including highly unusual/extraordinary and material legal settlements or other items that are material and exceptional in nature. |
| 9. | Tax on the above items. |
| 10. | Impact of enacted or substantially enacted income tax rate changes. |
Manulife Financial Corporation - Second Quarter 2014
21
The following table summarizes for the past eight quarters core earnings and net income (loss) attributed to shareholders.
Total Company
| Quarterly Results | ||||||||||||||||||||||||||||||||
| (C$ millions, unaudited) | 2 | Q | 1 | Q | 4 | Q | 3 | Q | 2 | Q | 1 | Q | 4 | Q | 3 | Q | ||||||||||||||||
| 2014 | 2014 | 2013 | 2013 | 2013 | 2013 | 2012 | (1) | 2012 | (1) | |||||||||||||||||||||||
| Core earnings (losses) | ||||||||||||||||||||||||||||||||
| Asia Division | $ | 231 | $ | 244 | $ | 227 | $ | 242 | $ | 226 | $ | 226 | $ | 180 | $ | 230 | ||||||||||||||||
| Canadian Division | 232 | 228 | 233 | 268 | 225 | 179 | 233 | 229 | ||||||||||||||||||||||||
| U.S. Division | 329 | 374 | 366 | 361 | 343 | 440 | 293 | 288 | ||||||||||||||||||||||||
Corporate and Other (excluding expected cost of macro hedges and core investment gains) | (92 | ) | (135 | ) | (138 | ) | (135 | ) | (105 | ) | (128 | ) | (62 | ) | (103 | ) | ||||||||||||||||
| Expected cost of macro hedges | (49 | ) | (42 | ) | (53 | ) | (84 | ) | (128 | ) | (148 | ) | (140 | ) | (124 | ) | ||||||||||||||||
Investment-related experience included in core earnings | 50 | 50 | 50 | 52 | 48 | 50 | 50 | 50 | ||||||||||||||||||||||||
| Total core earnings | $ | 701 | $ | 719 | $ | 685 | $ | 704 | $ | 609 | $ | 619 | $ | 554 | $ | 570 | ||||||||||||||||
Investment-related experience in excess of amounts included in core earnings | 217 | 225 | 215 | 491 | (97 | ) | 97 | 321 | 365 | |||||||||||||||||||||||
Core earnings plus investment-related experience in excess of amounts included in core earnings | $ | 918 | $ | 944 | $ | 900 | $ | 1,195 | $ | 512 | $ | 716 | $ | 875 | $ | 935 | ||||||||||||||||
Other items to reconcile core earnings to net income loss) attributed to shareholders: | ||||||||||||||||||||||||||||||||
Direct impact of equity markets and interest rates and variable annuity guarantee liabilities (details below) | 55 | (90 | ) | (81 | ) | 94 | (242 | ) | (107 | ) | 82 | 34 | ||||||||||||||||||||
Impact of in-force product changes and recapture of reinsurance treaties | - | - | 261 | - | - | - | - | 26 | ||||||||||||||||||||||||
Change in actuarial methods and assumptions | (30 | ) | (40 | ) | (133 | ) | (252 | ) | (35 | ) | (69 | ) | (87 | ) | (1,006 | ) | ||||||||||||||||
| Goodwill impairment charge | - | - | - | - | - | - | - | (200 | ) | |||||||||||||||||||||||
Disposition of Taiwan insurance business | - | - | 350 | - | - | - | - | - | ||||||||||||||||||||||||
Tax items and restructuring charge related to organizational design | - | 4 | - | (3 | ) | 24 | - | 207 | - | |||||||||||||||||||||||
| Net income (loss) attributed to shareholders | $ | 943 | $ | 818 | $ | 1,297 | $ | 1,034 | $ | 259 | $ | 540 | $ | 1,077 | $ | (211 | ) | |||||||||||||||
| Other market-related factors | ||||||||||||||||||||||||||||||||
| Direct impact of equity markets and variable annuity guarantee liabilities | $ | 66 | $ | (71 | ) | $ | 105 | $ | 306 | $ | (196 | ) | $ | 243 | $ | 412 | $ | 389 | ||||||||||||||
| Gains (charges) on higher (lower) fixed income reinvestment rates assumed in the valuation of policy liabilities | 22 | 9 | (105 | ) | (77 | ) | 151 | (245 | ) | (290 | ) | (330 | ) | |||||||||||||||||||
Gains (charges) on sale of AFS bonds and derivative positions in the Corporate segment | (8 | ) | (3 | ) | (55 | ) | (72 | ) | (127 | ) | (8 | ) | (40 | ) | (25 | ) | ||||||||||||||||
Charges due to lower fixed income URR assumptions used in the valuation of policy liabilities | (25 | ) | (25 | ) | (26 | ) | (63 | ) | (70 | ) | (97 | ) | - | - | ||||||||||||||||||
Direct impact of equity markets and interest rates and variable annuity guarantee liabilities | $ | 55 | $ | (90 | ) | $ | (81 | ) | $ | 94 | $ | (242 | ) | $ | (107 | ) | $ | 82 | $ | 34 | ||||||||||||
| (1) | The 2012 results were restated to reflect the retrospective application of new IFRS accounting standards effective January 1, 2013. For a detailed description of the change see note 2 to our 2013 Annual Consolidated Financial Statements. |
Manulife Financial Corporation - Second Quarter 2014
22
Asia Division
| Quarterly Results | ||||||||||||||||||||||||||||||||
| (C$ millions, unaudited) | 2 | Q | 1 | Q | 4 | Q | 3 | Q | 2 | Q | 1 | Q | 4 | Q | 3 | Q | ||||||||||||||||
| 2014 | 2014 | 2013 | 2013 | 2013 | 2013 | 2012 | 2012 | |||||||||||||||||||||||||
| Asia Division core earnings | $ | 231 | $ | 244 | $ | 227 | $ | 242 | $ | 226 | $ | 226 | $ | 180 | $ | 230 | ||||||||||||||||
| Investment-related experience in excess of amounts included in core earnings | 18 | 19 | (5 | ) | (4 | ) | (18 | ) | 43 | 33 | 12 | |||||||||||||||||||||
| Core earnings plus investment-related experience in excess of amounts included in core earnings | $ | 249 | $ | 263 | $ | 222 | $ | 238 | $ | 208 | $ | 269 | $ | 213 | $ | 242 | ||||||||||||||||
Other items to reconcile core earnings to net income attributable to shareholders | ||||||||||||||||||||||||||||||||
Direct impact of equity markets and interest rates and variable annuity guarantee liabilities | 88 | (25 | ) | 85 | 242 | 178 | 659 | 469 | 249 | |||||||||||||||||||||||
Recapture of reinsurance treaty and tax items | - | - | 68 | - | - | - | - | - | ||||||||||||||||||||||||
Disposition of Taiwan insurance business | - | - | 350 | - | - | - | - | - | ||||||||||||||||||||||||
| Tax gains due to rate changes | - | 4 | - | - | - | - | - | - | ||||||||||||||||||||||||
| Net income attributed to shareholders | $ | 337 | $ | 242 | $ | 725 | $ | 480 | $ | 386 | $ | 928 | $ | 682 | $ | 491 | ||||||||||||||||
Canadian Division
| Quarterly Results | ||||||||||||||||||||||||||||||||
| (C$ millions, unaudited) | 2 | Q | 1 | Q | 4 | Q | 3 | Q | 2 | Q | 1 | Q | 4 | Q | 3 | Q | ||||||||||||||||
| 2014 | 2014 | 2013 | 2013 | 2013 | 2013 | 2012 | 2012 | |||||||||||||||||||||||||
| Canadian Division core earnings | $ | 232 | $ | 228 | $ | 233 | $ | 268 | $ | 225 | $ | 179 | $ | 233 | $ | 229 | ||||||||||||||||
Investment-related experience in excess of amounts include d in core earnings | 46 | 135 | 106 | 135 | (88 | ) | (187 | ) | (31 | ) | 20 | |||||||||||||||||||||
Core earnings plus investment-related experience in excess of amounts included in core earnings | $ | 278 | $ | 363 | $ | 339 | $ | 403 | $ | 137 | $ | (8 | ) | $ | 202 | $ | 249 | |||||||||||||||
Other items to reconcile core earnings to net income (loss) attributable to shareholders | ||||||||||||||||||||||||||||||||
Direct impact of equity markets and interest rates and variable annuity guarantee liabilities | (11 | ) | 14 | 34 | 14 | (34 | ) | (54 | ) | 49 | 129 | |||||||||||||||||||||
Recapture of reinsurance treaty, segregated fund product changes and impact of tax related changes | - | - | - | (3 | ) | - | - | - | - | |||||||||||||||||||||||
| Net income (loss) attributed to shareholders | $ | 267 | $ | 377 | $ | 373 | $ | 414 | $ | 103 | $ | (62 | ) | $ | 251 | $ | 378 | |||||||||||||||
U.S. Division
| Quarterly Results | ||||||||||||||||||||||||||||||||
| (C$ millions, unaudited) | 2 | Q | 1 | Q | 4 | Q | 3 | Q | 2 | Q | 1 | Q | 4 | Q | 3 | Q | ||||||||||||||||
| 2014 | 2014 | 2013 | 2013 | 2013 | 2013 | 2012 | (1) | 2012 | (1) | |||||||||||||||||||||||
| U.S. Division core earnings | $ | 329 | $ | 374 | $ | 366 | $ | 361 | $ | 343 | $ | 440 | $ | 293 | $ | 288 | ||||||||||||||||
Investment-related experience in excess of amounts included in core earnings | 206 | 111 | 161 | 404 | 65 | 263 | 367 | 348 | ||||||||||||||||||||||||
| Core earnings plus investment-related experience in excess of amounts included in core earnings | $ | 535 | $ | 485 | $ | 527 | $ | 765 | $ | 408 | $ | 703 | $ | 660 | $ | 636 | ||||||||||||||||
Other items to reconcile core earnings to net income (loss) attributable to shareholders | ||||||||||||||||||||||||||||||||
Direct impact of equity markets and interest rates and variable annuity guarantee liabilities | 24 | (82 | ) | 105 | 163 | 21 | 23 | (104 | ) | (224 | ) | |||||||||||||||||||||
Impact of in-force product changes and recapture of reinsurance treaties | - | - | 193 | - | - | - | - | 26 | ||||||||||||||||||||||||
| Tax items | - | - | - | - | - | - | 170 | - | ||||||||||||||||||||||||
| Net income attributed to shareholders | $ | 559 | $ | 403 | $ | 825 | $ | 928 | $ | 429 | $ | 726 | $ | 726 | $ | 438 | ||||||||||||||||
| (1) | The 2012 results were restated to reflect the retrospective application of new IFRS accounting standards effective January 1, 2013. For a detailed description of the change see note 2 to our 2013 Annual Consolidated Financial Statements. |
Manulife Financial Corporation - Second Quarter 2014
23
Corporate and Other
| Quarterly Results | ||||||||||||||||||||||||||||||||
| (C$ millions, unaudited) | 2 | Q | 1 | Q | 4 | Q | 3 | Q | 2 | Q | 1 | Q | 4 | Q | 3 | Q | ||||||||||||||||
| 2014 | 2014 | 2013 | 2013 | 2013 | 2013 | 2012 | (1) | 2012 | (1) | |||||||||||||||||||||||
Corporate and Other core losses (excluding expected cost of macro hedges and core investment gains) | $ | (92 | ) | $ | (135 | ) | $ | (138 | ) | $ | (135 | ) | $ | (105 | ) | $ | (128 | ) | $ | (62 | ) | $ | (103 | ) | ||||||||
| Expected cost of macro hedges | (49 | ) | (42 | ) | (53 | ) | (84 | ) | (128 | ) | (148 | ) | (140 | ) | (124 | ) | ||||||||||||||||
Investment-related experience included in core earnings | 50 | 50 | 50 | 52 | 48 | 50 | 50 | 50 | ||||||||||||||||||||||||
| Total core losses | $ | (91 | ) | $ | (127 | ) | $ | (141 | ) | $ | (167 | ) | $ | (185 | ) | $ | (226 | ) | $ | (152 | ) | $ | (177 | ) | ||||||||
Investment-related experience in excess of amounts included in core earnings | (53 | ) | (40 | ) | (47 | ) | (44 | ) | (56 | ) | (22 | ) | (48 | ) | (15 | ) | ||||||||||||||||
Core losses plus investment-related experience in excess of amounts included in core earnings | $ | (144 | ) | $ | (167 | ) | $ | (188 | ) | $ | (211 | ) | $ | (241 | ) | $ | (248 | ) | $ | (200 | ) | $ | (192 | ) | ||||||||
Other items to reconcile core earnings (losses) to net income (loss) attributed to shareholders | ||||||||||||||||||||||||||||||||
| Direct impact of equity markets and interest rates and variable annuity guarantee liabilities | (46 | ) | 3 | (305 | ) | (325 | ) | (407 | ) | (735 | ) | (332 | ) | (120 | ) | |||||||||||||||||
| Changes in actuarial methods and assumptions | (30 | ) | (40 | ) | (133 | ) | (252 | ) | (35 | ) | (69 | ) | (87 | ) | (1,006 | ) | ||||||||||||||||
| Goodwill impairment charge and other | - | - | - | - | 24 | - | 37 | (200 | ) | |||||||||||||||||||||||
| Net loss attributed to shareholders | $ | (220 | ) | $ | (204 | ) | $ | (626 | ) | $ | (788 | ) | $ | (659 | ) | $ | (1,052 | ) | $ | (582 | ) | $ | (1,518 | ) | ||||||||
| (1) | The 2012 results were restated to reflect the retrospective application of new IFRS accounting standards effective January 1, 2013. For a detailed description of the change see note 2 to our 2013 Annual Consolidated Financial Statements. |
Net income (loss) attributed to shareholders in accordance with U.S. GAAP is a non-GAAP profitability measure. It shows what the net income would have been if the Company had applied U.S. GAAP as its primary financial reporting basis. We consider this to be a relevant profitability measure given our large U.S. domiciled investor base and for comparability to our U.S. peers who report under U.S. GAAP.
Total equity in accordance with U.S. GAAP is a non-GAAP measure. It shows what the total equity would have been if the Company had applied U.S. GAAP as its primary financial reporting basis. We consider this to be a relevant measure given our large U.S. domiciled investor base and for comparability to our U.S. peers who report under U.S. GAAP.
Core return on common shareholders’ equity (“Core ROE”) is a non-GAAP profitability measure that presents core earnings available to common shareholders as a percentage of the capital deployed to earn the core earnings. The Company calculates Core ROE using average common shareholders’ equity.
Diluted core earnings per common share is core earnings available to common shareholders expressed per diluted weighted average common share outstanding.
The Company also uses financial performance measures that are prepared on a constant currency basis, which exclude the impact of currency fluctuations and which are non-GAAP measures. Quarterly amounts stated on a constant currency basis in this report are calculated, as appropriate, using the income statement and balance sheet exchange rates effective for the second quarter of 2014.
Premiums and deposits is a non-GAAP measure of top line growth. The Company calculates premiums and deposits as the aggregate of (i) general fund premiums, net of reinsurance, reported as premiums on the Consolidated Statements of Income, (ii) segregated fund deposits, excluding seed money, (“deposits from policyholders”), (iii) investment contract deposits, (iv) mutual fund deposits, (v) deposits into institutional advisory accounts, (vi) premium equivalents for “administration services only” group benefit contracts (“ASO premium equivalents”), (vii) premiums in the Canadian Group Benefits reinsurance ceded agreement, and (viii) other deposits in other managed funds.
| Premiums and deposits | Quarterly Results | |||||||||||
| (C$ millions) | 2Q 2014 | 1Q 2014 | 2Q 2013 | |||||||||
| Net premium income | $ | 4,232 | $ | 4,161 | $ | 4,176 | ||||||
| Deposits from policyholders | 5,587 | 6,776 | 5,516 | |||||||||
| Premiums and deposits per financial statements | $ | 9,819 | $ | 10,937 | $ | 9,692 | ||||||
| Investment contract deposits | 9 | 16 | 16 | |||||||||
| Mutual fund deposits | 10,524 | 10,440 | 10,545 | |||||||||
| Institutional advisory account deposits | 2,743 | 2,167 | 1,146 | |||||||||
| ASO premium equivalents | 775 | 764 | 756 | |||||||||
| Group benefits ceded premiums | 991 | 984 | 1,427 | |||||||||
| Other fund deposits | 105 | 128 | 97 | |||||||||
| Total premiums and deposits | $ | 24,966 | $ | 25,436 | $ | 23,679 | ||||||
| Currency impact | - | (210 | ) | 1,020 | ||||||||
| Constant currency premiums and deposits | $ | 24,966 | $ | 25,226 | $ | 24,699 | ||||||
Manulife Financial Corporation - Second Quarter 2014
24
Funds under management is a non-GAAP measure of the size of the Company. It represents the total of the invested asset base that the Company and its customers invest in.
| Funds under management | ||||||||||||
| As at | Quarterly Results | |||||||||||
| (C$ millions) | June 30, 2014 | March 31, 2014 | June 30, 2013 | |||||||||
| Total invested assets | $ | 244,129 | $ | 244,970 | $ | 230,503 | ||||||
| Segregated funds net assets | 247,186 | 249,724 | 223,405 | |||||||||
| Funds under management per financial statements | $ | 491,315 | $ | 494,694 | $ | 453,908 | ||||||
| Mutual funds | 105,147 | 101,093 | 76,634 | |||||||||
| Institutional advisory accounts (excluding segregated funds) | 35,210 | 33,505 | 28,416 | |||||||||
| Other funds | 5,588 | 5,666 | 8,025 | |||||||||
| Total funds under management | $ | 637,260 | $ | 634,958 | $ | 566,983 | ||||||
| Currency impact | - | (15,015 | ) | 5,370 | ||||||||
| Constant currency funds under management | $ | 637,260 | $ | 619,943 | $ | 572,353 | ||||||
Capital The definition we use for capital, a non-GAAP measure, serves as a foundation of our capital management activities at the MFC level. For regulatory reporting purposes, the numbers are further adjusted for various additions or deductions to capital as mandated by the guidelines used by OSFI. Capital is calculated as the sum of (i) total equity excluding AOCI on cash flow hedges and (ii) liabilities for preferred shares and capital instruments.
| Capital | ||||||||||||
| As at | Quarterly Results | |||||||||||
| (C$ millions) | June 30, 2014 | March 31, 2014 | June 30, 2013 | |||||||||
| Total equity | $ | 30,780 | $ | 31,187 | $ | 26,544 | ||||||
| Add AOCI loss on cash flow hedges | 136 | 139 | 131 | |||||||||
| Add liabilities for preferred shares and capital instruments | 4,884 | 4,902 | 4,130 | |||||||||
| Total capital | $ | 35,800 | $ | 36,228 | $ | 30,805 | ||||||
New business embedded value (“NBEV”) is the change in shareholders’ economic value as a result of sales in the reporting period. NBEV is calculated as the present value of expected future earnings, after the cost of capital, on actual new business sold in the period using future mortality, morbidity, policyholder behaviour, expense and investment assumptions that are consistent with the assumptions used in the valuation of our policy liabilities.
The principal economic assumptions used in the NBEV calculations in the second quarter of 2014 were as follows:
| Canada | U.S. | Hong Kong | Japan | |||||||||||||
| MCCSR ratio | 150 | % | 150 | % | 150 | % | 150 | % | ||||||||
| Discount rate | 8.25 | % | 8.50 | % | 9.00 | % | 6.25 | % | ||||||||
| Jurisdictional income tax rate | 26.5 | % | 35 | % | 16.5 | % | 31 | % | ||||||||
| Foreign exchange rate | n/a | 1.090481 | 0.140656 | 0.01068 | ||||||||||||
| Yield on surplus assets | 4.50 | % | 4.50 | % | 4.50 | % | 2.00 | % | ||||||||
Sales are measured according to product type:
For total individual insurance, sales include 100% of new annualized premiums and 10% of both excess and single premiums. For individual insurance, new annualized premiums reflect the annualized premium expected in the first year of a policy that requires premium payments for more than one year. Sales are reported gross before the impact of reinsurance. Single premium is the lump sum premium from the sale of a single premium product, e.g. travel insurance.
For group insurance, sales include new annualized premiums and administrative services only premium equivalents on new cases, as well as the addition of new coverages and amendments to contracts, excluding rate increases.
For individual wealth management contracts, all new deposits are reported as sales. This includes individual annuities, both fixed and variable; mutual funds; college savings 529 plans; and authorized bank loans and mortgages. As we have discontinued sales of new VA contracts in the U.S., beginning in the first quarter of 2013, subsequent deposits into existing U.S. VA contracts will not be considered sales.
For group pensions/retirement savings, sales of new regular premiums and deposits reflect an estimate of expected deposits in the first year of the plan with the Company. Single premium sales reflect the assets transferred from the previous plan provider. Sales include the impact of the addition of a new division or of a new product to an existing client. Total sales include both new regular and single premiums and deposits.
Manulife Financial Corporation - Second Quarter 2014
25
| F4 | Key Planning assumptions and uncertainties |
Manulife’s 2016 management objectives18 do not constitute guidance and are based on certain key planning assumptions, including: current accounting and regulatory capital standards; no acquisitions; equity market and interest rate assumptions consistent with our long-term assumptions, and favourable investment-related experience included in core earnings.
| F5 | Caution regarding forward-looking statements |
From time to time, MFC makes written and/or oral forward-looking statements, including in this document. In addition, our representatives may make forward-looking statements orally to analysts, investors, the media and others. All such statements are made pursuant to the “safe harbour” provisions of Canadian provincial securities laws and the U.S. Private Securities Litigation Reform Act of 1995. The forward-looking statements in this document include, but are not limited to, statements with respect to our 2016 management objectives for core earnings and core ROE, our 2016 goal for net pre-tax savings related to our Efficiency & Effectiveness initiative, the potential impact on net income of the 3Q14 review of actuarial assumptions and methodology, and the potential impact on net income of the implementation of the revised Canadian Actuarial Standards of Practice related to economic reinvestment assumptions used in the valuation of policy liabilities.
The forward-looking statements in this document also relate to, among other things, our objectives, goals, strategies, intentions, plans, beliefs, expectations and estimates, and can generally be identified by the use of words such as “may”, “will”, “could”, “should”, “would”, “likely”, “suspect”, “outlook”, “expect”, “intend”, “estimate”, “anticipate”, “believe”, “plan”, “forecast”, “objective”, “seek”, “aim”, “continue”, “goal”, “restore”, “embark” and “endeavour” (or the negative thereof) and words and expressions of similar import, and include statements concerning possible or assumed future results. Although we believe that the expectations reflected in such forward-looking statements are reasonable, such statements involve risks and uncertainties, and undue reliance should not be placed on such statements and they should not be interpreted as confirming market or analysts’ expectations in any way.
Certain material factors or assumptions are applied in making forward-looking statements, including in the case of our 2016 management objectives for core earnings and core ROE, the assumptions described under "Key Planning Assumptions and Uncertainties" in our 2013 Annual Report and in this document, and actual results may differ materially from those expressed or implied in such statements. Important factors that could cause actual results to differ materially from expectations include but are not limited to: the factors identified in “Key Planning Assumptions and Uncertainties” in our 2013 Annual Report and in this document; general business and economic conditions (including but not limited to the performance, volatility and correlation of equity markets, interest rates, credit and swap spreads, currency rates, investment losses and defaults, market liquidity and creditworthiness of guarantors, reinsurers and counterparties); changes in laws and regulations; changes in accounting standards; our ability to execute strategic plans and changes to strategic plans; downgrades in our financial strength or credit ratings; our ability to maintain our reputation; impairments of goodwill or intangible assets or the establishment of provisions against future tax assets; the accuracy of estimates relating to morbidity, mortality and policyholder behaviour; the accuracy of other estimates used in applying accounting policies and actuarial methods; our ability to implement effective hedging strategies and unforeseen consequences arising from such strategies; our ability to source appropriate assets to back our long dated liabilities; level of competition and consolidation; our ability to market and distribute products through current and future distribution channels; unforeseen liabilities or asset impairments arising from acquisitions and dispositions of businesses; the realization of losses arising from the sale of investments classified as available-for-sale; our liquidity, including the availability of financing to satisfy existing financial liabilities on expected maturity dates when required; obligations to pledge additional collateral; the availability of letters of credit to provide capital management flexibility; accuracy of information received from counterparties and the ability of counterparties to meet their obligations; the availability, affordability and adequacy of reinsurance; legal and regulatory proceedings, including tax audits, tax litigation or similar proceedings; our ability to adapt products and services to the changing market; our ability to attract and retain key executives, employees and agents; the appropriate use and interpretation of complex models or deficiencies in models used; political, legal, operational and other risks associated with our non-North American operations; acquisitions and our ability to complete acquisitions including the availability of equity and debt financing for this purpose; the disruption of or changes to key elements of the Company’s or public infrastructure systems; environmental concerns; and our ability to protect our intellectual property and exposure to claims of infringement. Additional information about material risk factors that could cause actual results to differ materially from expectations and about material factors or assumptions applied in making forward-looking statements may be found in the body of this document as well as under “Risk Factors” in our most recent Annual Information Form, under “Risk Management”, “Risk Management and Risk Factors” and “Critical Accounting and Actuarial Policies” in the Management’s Discussion and Analysis in our most recent annual report, under “Risk Management and Risk Factors Update” and “Critical Accounting and Actuarial Policies” in the Management’s Discussion and Analysis in our most recent interim report, in the “Risk Management” note to consolidated financial statements in our most recent annual and interim reports and elsewhere in our filings with Canadian and U.S. securities regulators. The forward-looking statements in this document are, unless otherwise indicated, stated as of the date hereof and are presented for the purpose of assisting investors and others in understanding our financial position and results of operations as well as our objectives and strategic priorities, and may not be appropriate for other purposes. We do not undertake to update any forward-looking statements, except as required by law.
Manulife Financial Corporation - Second Quarter 2014
26
| Consolidated Statements of Financial Position | ||||||||
| As at | ||||||||
| (Canadian $ in millions, unaudited) | June 30, 2014 | December 31, 2013 | ||||||
Assets | ||||||||
| Cash and short-term securities | $ | 14,042 | $ | 13,630 | ||||
| Debt securities | 123,748 | 114,957 | ||||||
| Public equities | 13,732 | 13,075 | ||||||
| Mortgages | 37,806 | 37,558 | ||||||
| Private placements | 21,115 | 21,015 | ||||||
| Policy loans | 7,390 | 7,370 | ||||||
| Loans to bank clients | 1,811 | 1,901 | ||||||
| Real estate | 9,551 | 9,708 | ||||||
| Other invested assets | 14,934 | 13,495 | ||||||
Total invested assets (note 3) | $ | 244,129 | $ | 232,709 | ||||
| Other assets | ||||||||
| Accrued investment income | $ | 1,836 | $ | 1,813 | ||||
| Outstanding premiums | 728 | 734 | ||||||
| Derivatives (note 4) | 11,913 | 9,673 | ||||||
| Reinsurance assets | 17,620 | 17,443 | ||||||
| Deferred tax assets | 2,857 | 2,763 | ||||||
| Goodwill and intangible assets | 5,292 | 5,298 | ||||||
| Miscellaneous | 4,869 | 3,324 | ||||||
| Total other assets | $ | 45,115 | $ | 41,048 | ||||
Segregated funds net assets (note 13) | $ | 247,186 | $ | 239,871 | ||||
| Total assets | $ | 536,430 | $ | 513,628 | ||||
Liabilities and Equity | ||||||||
| Liabilities | ||||||||
| Insurance contract liabilities (note 5) | $ | 206,897 | $ | 193,242 | ||||
| Investment contract liabilities (note 5) | 2,464 | 2,524 | ||||||
| Deposits from bank clients | 19,683 | 19,869 | ||||||
| Derivatives (note 4) | 7,735 | 8,929 | ||||||
| Deferred tax liabilities | 1,080 | 617 | ||||||
| Other liabilities | 11,936 | 10,383 | ||||||
| $ | 249,795 | $ | 235,564 | |||||
| Long-term debt (note 7) | 3,785 | 4,775 | ||||||
| Liabilities for preferred shares and capital instruments (note 8) | 4,884 | 4,385 | ||||||
Segregated funds net liabilities (note 13) | 247,186 | 239,871 | ||||||
| Total liabilities | $ | 505,650 | $ | 484,595 | ||||
Equity | ||||||||
| Preferred shares (note 9) | $ | 2,446 | $ | 2,693 | ||||
| Common shares (note 9) | 20,432 | 20,234 | ||||||
| Contributed surplus | 265 | 256 | ||||||
| Shareholders' retained earnings | 6,527 | 5,294 | ||||||
| Shareholders' accumulated other comprehensive income (loss) on: | ||||||||
| Pension and other post-employment plans | (453 | ) | (452 | ) | ||||
| Available-for-sale securities | 612 | 324 | ||||||
| Cash flow hedges | (136 | ) | (84 | ) | ||||
| Translation of foreign operations | 478 | 258 | ||||||
| Total shareholders' equity | $ | 30,171 | $ | 28,523 | ||||
| Participating policyholders' equity | 100 | 134 | ||||||
| Non-controlling interests | 509 | 376 | ||||||
| Total equity | $ | 30,780 | $ | 29,033 | ||||
| Total liabilities and equity | $ | 536,430 | $ | 513,628 | ||||
The accompanying notes are an integral part of these unaudited Interim Consolidated Financial Statements. | ||||||||
|  | |||||||
| Donald A. Guloien | Richard B. DeWolfe | |||||||
| President and Chief Executive Officer | Chairman of the Board of Directors | |||||||
Manulife Financial Corporation - Second Quarter 2014
27
| Consolidated Statements of Income | |||||||||||||||||
| For the | three months ended June 30, | six months ended June 30, | |||||||||||||||
| (Canadian $ in millions except per share amounts, unaudited) | 2014 | 2013 | 2014 | 2013 | |||||||||||||
| Revenue | |||||||||||||||||
| Premium income | |||||||||||||||||
| Gross premiums | $ | 6,029 | $ | 6,314 | $ | 11,978 | $ | 12,414 | |||||||||
| Premiums ceded to reinsurers | (1,797 | ) | (2,138 | ) | (3,585 | ) | (3,821 | ) | |||||||||
| Net premiums | $ | 4,232 | $ | 4,176 | $ | 8,393 | $ | 8,593 | |||||||||
| Investment income (note 3) | |||||||||||||||||
| Investment income | $ | 2,825 | $ | 2,345 | $ | 5,509 | $ | 4,750 | |||||||||
Realized and unrealized gains (losses) on assets supporting insurance and investment contract liabilities and on the macro hedge program | 4,093 | (9,355 | ) | 9,349 | (12,316 | ) | |||||||||||
| Net investment income (loss) | $ | 6,918 | $ | (7,010 | ) | $ | 14,858 | $ | (7,566 | ) | |||||||
| Other revenue | $ | 2,119 | $ | 2,324 | $ | 4,254 | $ | 4,298 | |||||||||
| Total revenue | $ | 13,269 | $ | (510 | ) | $ | 27,505 | $ | 5,325 | ||||||||
| Contract benefits and expenses | |||||||||||||||||
| To contract holders and beneficiaries | |||||||||||||||||
| Death, disability and other claims | $ | 2,633 | $ | 2,553 | $ | 5,341 | $ | 5,099 | |||||||||
| Maturity and surrender benefits | 1,346 | 1,203 | 2,791 | 2,360 | |||||||||||||
| Annuity payments | 841 | 844 | 1,703 | 1,706 | |||||||||||||
| Policyholder dividends and experience rating refunds | 244 | 285 | 458 | 521 | |||||||||||||
| Net transfers from segregated funds | (281 | ) | (176 | ) | (360 | ) | (261 | ) | |||||||||
| Change in insurance contract liabilities | 6,351 | (7,104 | ) | 13,178 | (7,869 | ) | |||||||||||
| Change in investment contract liabilities | 51 | 50 | 40 | 69 | |||||||||||||
| Benefits and expenses ceded to reinsurers | (1,647 | ) | (1,610 | ) | (3,311 | ) | (3,148 | ) | |||||||||
| Change in reinsurance assets | (256 | ) | 493 | (125 | ) | 618 | |||||||||||
| Net benefits and claims | $ | 9,282 | $ | (3,462 | ) | $ | 19,715 | $ | (905 | ) | |||||||
| General expenses | 1,098 | 1,123 | 2,247 | 2,244 | |||||||||||||
| Investment expenses | 358 | 283 | 688 | 552 | |||||||||||||
| Commissions | 1,009 | 941 | 2,030 | 1,892 | |||||||||||||
| Interest expense | 244 | 308 | 538 | 603 | |||||||||||||
| Net premium taxes | 67 | 92 | 139 | 164 | |||||||||||||
| Total contract benefits and expenses | $ | 12,058 | $ | (715 | ) | $ | 25,357 | $ | 4,550 | ||||||||
| Income before income taxes | $ | 1,211 | $ | 205 | $ | 2,148 | $ | 775 | |||||||||
| Income tax (expense) recovery | (234 | ) | 103 | (367 | ) | 88 | |||||||||||
| Net income | $ | 977 | $ | 308 | $ | 1,781 | $ | 863 | |||||||||
| Net income (loss) attributed to: | |||||||||||||||||
| Non-controlling interests | $ | 43 | $ | 9 | $ | 55 | $ | 16 | |||||||||
| Participating policyholders | (9 | ) | 40 | (35 | ) | 48 | |||||||||||
| Shareholders | 943 | 259 | 1,761 | 799 | |||||||||||||
| $ | 977 | $ | 308 | $ | 1,781 | $ | 863 | ||||||||||
| Net income attributed to shareholders | $ | 943 | $ | 259 | $ | 1,761 | $ | 799 | |||||||||
| Preferred share dividends | (36 | ) | (32 | ) | (70 | ) | (64 | ) | |||||||||
| Common shareholders' net income | $ | 907 | $ | 227 | $ | 1,691 | $ | 735 | |||||||||
| Earnings per share: | |||||||||||||||||
| Basic earnings per common share (note 9) | $ | 0.49 | $ | 0.12 | $ | 0.91 | $ | 0.40 | |||||||||
| Diluted earnings per common share (note 9) | 0.49 | 0.12 | 0.91 | 0.40 | |||||||||||||
| Dividends per common share | 0.13 | 0.13 | 0.26 | 0.26 | |||||||||||||
The accompanying notes are an integral part of these unaudited Interim Consolidated Financial Statements. | |||||||||||||||||
Manulife Financial Corporation - Second Quarter 2014
28
| Consolidated Statements of Comprehensive Income | ||||||||||||||||
For the | three months ended June 30, | six months ended June 30, | ||||||||||||||
| (Canadian $ in millions, unaudited) | 2014 | 2013 | 2014 | 2013 | ||||||||||||
| Net income | $ | 977 | $ | 308 | $ | 1,781 | $ | 863 | ||||||||
| Other comprehensive income ("OCI") (loss), net of tax | ||||||||||||||||
| Items that will not be reclassified to net income: | ||||||||||||||||
| Change in pension and other post-employment plans | $ | 6 | $ | (14 | ) | $ | (1 | ) | $ | (23 | ) | |||||
| Real estate revaluation reserve | - | - | 1 | - | ||||||||||||
| Total items that will not be reclassified to net income | $ | 6 | $ | (14 | ) | $ | - | $ | (23 | ) | ||||||
Items that may be subsequently reclassified to net income: | ||||||||||||||||
| Foreign exchange gains (losses) on: | ||||||||||||||||
| Translation of foreign operations | $ | (1,005 | ) | $ | 650 | $ | 152 | $ | 910 | |||||||
| Net investment hedges | 103 | (29 | ) | 68 | (38 | ) | ||||||||||
| Available-for-sale financial securities: | ||||||||||||||||
| Unrealized gains (losses) arising during the period | 170 | (305 | ) | 388 | (233 | ) | ||||||||||
| Reclassification of net realized (gains) losses and impairments to net income | (37 | ) | 91 | (104 | ) | 66 | ||||||||||
| Cash flow hedges: | ||||||||||||||||
| Unrealized gains arising during the period | - | 44 | (57 | ) | 50 | |||||||||||
| Reclassification of realized losses to net income | 3 | 2 | 5 | 4 | ||||||||||||
| Share of other comprehensive income of associates | 1 | - | 4 | - | ||||||||||||
| Total items that may be subsequently reclassified to net income | $ | (765 | ) | $ | 453 | $ | 456 | $ | 759 | |||||||
| Other comprehensive income (loss), net of tax | $ | (759 | ) | $ | 439 | $ | 456 | $ | 736 | |||||||
| Total comprehensive income, net of tax | $ | 218 | $ | 747 | $ | 2,237 | $ | 1,599 | ||||||||
| Total comprehensive income (loss) attributed to: | ||||||||||||||||
| Non-controlling interests | $ | 43 | $ | 9 | $ | 55 | $ | 16 | ||||||||
| Participating policyholders | (9 | ) | 40 | (34 | ) | 48 | ||||||||||
| Shareholders | 184 | 698 | 2,216 | 1,535 | ||||||||||||
| Income Taxes included in Other Comprehensive Income | ||||||||||||||||
For the | three months ended June 30, | six months ended June 30, | ||||||||||||||
| (Canadian $ in millions, unaudited) | 2014 | 2013 | 2014 | 2013 | ||||||||||||
| Income tax (recovery) expense on | ||||||||||||||||
| Items that will not be reclassified to net income: | ||||||||||||||||
| Change in pension and other post-employment plans | $ | 4 | $ | (8 | ) | $ | - | $ | (12 | ) | ||||||
| Real estate revaluation reserve | - | - | 1 | - | ||||||||||||
| Total items that will not be reclassified to net income | $ | 4 | $ | (8 | ) | $ | 1 | $ | (12 | ) | ||||||
| Items that may be subsequently reclassified to net income: | ||||||||||||||||
Unrealized foreign exchange gains/losses on translation of foreign operations | $ | - | $ | 2 | $ | 4 | $ | (4 | ) | |||||||
| Unrealized foreign exchange gains/losses on net investment hedges | 38 | (10 | ) | 25 | (13 | ) | ||||||||||
| Unrealized gains/losses on available-for-sale financial securities | 59 | (67 | ) | 109 | (51 | ) | ||||||||||
Reclassification of realized gains/losses and recoveries/impairments to net income on available-for-sale financial securities | (24 | ) | 50 | (47 | ) | 53 | ||||||||||
| Unrealized gains/losses on cash flow hedges | (2 | ) | 22 | (29 | ) | 26 | ||||||||||
| Reclassification of realized gains/losses to net income on cash flow hedges | 1 | 1 | 2 | 2 | ||||||||||||
| Share of other comprehensive income of associates | - | - | 2 | - | ||||||||||||
| Total items that may be subsequently reclassified to net income | $ | 72 | $ | (2 | ) | $ | 66 | $ | 13 | |||||||
| Total income tax (recovery) expense | $ | 76 | $ | (10 | ) | $ | 67 | $ | 1 | |||||||
The accompanying notes are an integral part of these unaudited Interim Consolidated Financial Statements. | ||||||||||||||||
Manulife Financial Corporation - Second Quarter 2014
29
| Consolidated Statements of Changes in Equity | ||||||||
For the six months ended June 30, | ||||||||
| (Canadian $ in millions, unaudited) | 2014 | 2013 | ||||||
Preferred shares | ||||||||
| Balance, beginning of period | $ | 2,693 | $ | 2,497 | ||||
| Issued during the period (note 9) | 200 | 200 | ||||||
| Redeemed during the period (note 9) | (442 | ) | - | |||||
| Issuance costs, net of tax | (5 | ) | (4 | ) | ||||
| Balance, end of period | $ | 2,446 | $ | 2,693 | ||||
Common shares | ||||||||
| Balance, beginning of period | $ | 20,234 | $ | 19,886 | ||||
| Issued on exercise of stock options | 26 | 2 | ||||||
| Issued under dividend reinvestment and share purchase plans | 172 | 158 | ||||||
| Balance, end of period | $ | 20,432 | $ | 20,046 | ||||
Contributed surplus | ||||||||
| Balance, beginning of period | $ | 256 | $ | 257 | ||||
| Stock option expense | 9 | 10 | ||||||
| Balance, end of period | $ | 265 | $ | 267 | ||||
Shareholders' retained earnings | ||||||||
| Balance, beginning of period | $ | 5,294 | $ | 3,256 | ||||
| Net income attributed to shareholders | 1,761 | 799 | ||||||
| Preferred share dividends | (70 | ) | (64 | ) | ||||
| Premium on redemption of preferred shares (note 9) | (8 | ) | - | |||||
| Common share dividends | (450 | ) | (479 | ) | ||||
| Balance, end of period | $ | 6,527 | $ | 3,512 | ||||
Shareholders' accumulated other comprehensive income (loss) ("AOCI") | ||||||||
| Balance, beginning of period | $ | 46 | $ | (1,184 | ) | |||
| Change in actuarial gains (losses) on pension and other post-employment plans | (1 | ) | (23 | ) | ||||
| Change in unrealized foreign exchange gains (losses) of net foreign operations | 220 | 872 | ||||||
| Change in unrealized gains (losses) on available-for-sale financial securities | 284 | (167 | ) | |||||
| Change in unrealized gains (losses) on derivative instruments designated as cash flow hedges | (52 | ) | 54 | |||||
| Share of other comprehensive income of associates | 4 | - | ||||||
| Balance, end of period | $ | 501 | $ | (448 | ) | |||
| Total shareholders' equity, end of period | $ | 30,171 | $ | 26,070 | ||||
Participating policyholders' equity | ||||||||
| Balance, beginning of period | $ | 134 | $ | 146 | ||||
| Net income (loss) attributed to participating policyholders | (35 | ) | 48 | |||||
| Other comprehensive income attributed to policyholders | 1 | - | ||||||
| Balance, end of period | $ | 100 | $ | 194 | ||||
Non-controlling interests | ||||||||
| Balance, beginning of period | $ | 376 | $ | 301 | ||||
| Net income attributed to non-controlling interests | 55 | 16 | ||||||
| Contributions (distributions), net | 78 | (37 | ) | |||||
| Balance, end of period | $ | 509 | $ | 280 | ||||
| Total equity, end of period | $ | 30,780 | $ | 26,544 | ||||
The accompanying notes are an integral part of these unaudited Interim Consolidated Financial Statements. | ||||||||
Manulife Financial Corporation - Second Quarter 2014
30
| Consolidated Statements of Cash Flows | ||||||||
For the six months ended June 30, | ||||||||
| (Canadian $ in millions, unaudited) | 2014 | 2013 | ||||||
Operating activities | ||||||||
| Net income | $ | 1,781 | $ | 863 | ||||
| Adjustments for non-cash items in net income: | ||||||||
| Increase (decrease) in insurance contract liabilities | 13,178 | (7,869 | ) | |||||
| Increase (decrease) in investment contract liabilities | 40 | 69 | ||||||
| (Increase) decrease in reinsurance assets | (125 | ) | 618 | |||||
| Amortization of (premium) discount on invested assets | 9 | 14 | ||||||
| Other amortization | 222 | 205 | ||||||
| Net realized and unrealized (gains) losses on assets | (9,907 | ) | 12,485 | |||||
| Deferred income tax expense (recovery) | 259 | (322 | ) | |||||
| Stock option expense | 9 | 10 | ||||||
| Net income adjusted for non-cash items | $ | 5,466 | $ | 6,073 | ||||
| Changes in policy related and operating receivables and payables | (1,185 | ) | (390 | ) | ||||
| Cash provided by operating activities | $ | 4,281 | $ | 5,683 | ||||
Investing activities | ||||||||
| Purchases and mortgage advances | $ | (31,225 | ) | $ | (30,940 | ) | ||
| Disposals and repayments | 28,624 | 25,970 | ||||||
| Change in investment broker net receivables and payables | 416 | (116 | ) | |||||
| Net cash decrease from purchase of subsidiaries | (199 | ) | (73 | ) | ||||
| Cash used in investing activities | $ | (2,384 | ) | $ | (5,159 | ) | ||
Financing activities | ||||||||
| Decrease in repurchase agreements and securities sold but not yet purchased | $ | (50 | ) | $ | (142 | ) | ||
| Repayment of long-term debt (note 7) | (1,000 | ) | (350 | ) | ||||
| Issue of capital instruments, net | 497 | 199 | ||||||
| Net redemption of investment contract liabilities | (110 | ) | (80 | ) | ||||
| Funds repaid, net | (2 | ) | (118 | ) | ||||
| Changes in deposits from bank clients, net | (184 | ) | (35 | ) | ||||
| Shareholders dividends paid in cash | (382 | ) | (385 | ) | ||||
| Distributions to non-controlling interests, net | 5 | (37 | ) | |||||
| Common shares issued, net | 26 | 2 | ||||||
| Preferred shares issued, net | 195 | 196 | ||||||
| Preferred shares redeemed, net | (450 | ) | - | |||||
| Cash used in financing activities | $ | (1,455 | ) | $ | (750 | ) | ||
Cash and short-term securities | ||||||||
| Increase (decrease) during the period | $ | 442 | $ | (226 | ) | |||
| Effect of foreign exchange rate changes on cash and short-term securities | 71 | 385 | ||||||
| Balance, beginning of period | 12,886 | 12,753 | ||||||
| Balance, end of period | $ | 13,399 | $ | 12,912 | ||||
Cash and short-term securities | ||||||||
| Beginning of period | ||||||||
| Gross cash and short-term securities | $ | 13,630 | $ | 13,386 | ||||
| Net payments in transit, included in other liabilities | (744 | ) | (633 | ) | ||||
| Net cash and short-term securities, beginning of period | $ | 12,886 | $ | 12,753 | ||||
End of period | ||||||||
| Gross cash and short-term securities | $ | 14,042 | $ | 13,498 | ||||
| Net payments in transit, included in other liabilities | (643 | ) | (586 | ) | ||||
| Net cash and short-term securities, end of period | $ | 13,399 | $ | 12,912 | ||||
Supplemental disclosures on cash flow information | ||||||||
| Interest received | $ | 4,440 | $ | 4,177 | ||||
| Interest paid | 522 | 594 | ||||||
| Income taxes paid | 708 | 281 | ||||||
The accompanying notes are an integral part of these unaudited Interim Consolidated Financial Statements. | ||||||||
Manulife Financial Corporation - Second Quarter 2014
31
NOTES TO INTERIM CONSOLIDATED FINANCIAL STATEMENTS
(Canadian $ in millions except per share amounts or unless otherwise stated, unaudited)
Manulife Financial Corporation (“MFC”) is a publicly traded life insurance company and the holding company of The Manufacturers Life Insurance Company (“MLI”), a Canadian life insurance company, and John Hancock Reassurance Company, Ltd. (“JHRECO”), a Bermuda reinsurance company. MFC and its subsidiaries (collectively, “Manulife Financial” or the “Company”) is a leading Canada-based financial services group with principal operations in Asia, Canada and the United States. Manulife Financial’s international network of employees, agents and distribution partners offers financial protection and wealth management products and services to personal and business clients as well as asset management services to institutional customers. The Company operates as Manulife in Canada and Asia and primarily as John Hancock in the United States.
These Interim Consolidated Financial Statements have been prepared on a condensed basis in accordance with International Accounting Standard (“IAS”) 34 “Interim Financial Reporting” as issued by the International Accounting Standards Board (“IASB”) and the accounting requirements of the Office of the Superintendent of Financial Institutions, Canada (“OSFI”). None of the accounting requirements of OSFI are exceptions to International Financial Reporting Standards (“IFRS”). As outlined in note 1(h) of the 2013 Audited Consolidated Financial Statements, IFRS does not currently prescribe an insurance contract measurement model and, therefore, as permitted by IFRS 4 “Insurance Contracts”, insurance contract liabilities continue to be measured using the Canadian Asset Liability Method (“CALM”).
These Interim Consolidated Financial Statements should be read in conjunction with the audited Consolidated Financial Statements for the year ended December 31, 2013, the accompanying notes included on pages 95 to 168 of the Company’s 2013 Annual Report, the changes in accounting policies which were disclosed in Note 2(a) of the Company’s Interim Consolidated Financial Statements for the three months ended March 31, 2014 and the disclosures on risk in sections D1 to D4 of the second quarter 2014 Management Discussion and Analysis.
These Interim Consolidated Financial Statements of MFC as at and for the three and six month periods ended June 30, 2014 were authorized for issue by the Board of Directors on August 8, 2014.
Note 2 Accounting and Reporting Changes |
Future accounting and reporting changes
Unless otherwise stated, the Company is assessing the impact of these amendments and standards.
| (i) | Revisions to Standards for Economic Reinvestment Assumptions |
In May 2014, the Canadian Actuarial Standards Board published revisions to the Canadian Actuarial Standards of Practice related to economic reinvestment assumptions used in the valuation of policy liabilities. The revised standards will be effective in the fourth quarter of 2014. As of June 2014, the Company expects that the net impact on net income of the implementation of the standards and associated changes in assumptions and methodology will be a charge of less than $200. The actual impact will vary based on the level of prevailing interest rates at the time of implementation. It will also be impacted by investment-related experience gains or losses between now and the time of implementation as well as the third quarter review of assumptions and methodology and any changes to the interpretation of the revised standards.
| (ii) | Amendments to IAS 41 “Agriculture” and IAS 16 “Property, Plant and Equipment” |
Amendments to IAS 41 “Agriculture” and IAS 16 “Property, Plant and Equipment” were issued in June 2014 and are effective for years beginning on or after January 1, 2016, to be applied retrospectively. These amendments require that bearer plants should be considered as property, plant and equipment in the scope of IAS 16 and should be measured either at cost or revalued amount with changes recognized in OCI. Currently these plants are in the scope of IAS 41 and are measured at fair value less cost to sell. A bearer plant is used in the production of agricultural produce and is not intended to be sold as a living plant except for incidental scrap sales. These amendments only apply to the accounting requirements of a bearer plant and not agricultural land properties.
| (iii) | Amendments to IAS 16 “Property, Plant and Equipment” and IAS 38 “Intangible Assets” |
Amendments to IAS 16 “Property, Plant and Equipment” and IAS 38 “Intangible Assets” were issued in May 2014 and are effective for years beginning on or after January 1, 2016, to be applied prospectively. The amendments clarify that the depreciation or amortization of assets accounted for under these two standards should reflect a pattern of consumption of the assets rather than reflect economic benefits expected to be generated from the assets.
| (iv) | Amendments to IFRS 11 “Joint Arrangements” |
Amendments to IFRS 11 “Joint Arrangements” were issued in May 2014 and are effective for years beginning on or after January 1, 2016, to be applied prospectively. The amendments clarify that an acquisition of a joint interest in a joint operation that is a business should be accounted for and disclosed as a business combination in accordance with IFRS 3 “Business Combinations”. Adoption of these amendments is not expected to have a significant impact on the Company’s Consolidated Financial Statements.
| (v) | IFRS 15 “Revenue Recognition” |
IFRS 15 “Revenue Recognition” was issued in May 2014 and is effective for years beginning on or after January 1, 2017, to be applied retrospectively. IFRS 15 provides principles within a single standard for recognizing revenue from all contracts with customers, except leases, financial instruments, and insurance contracts. The standard requires revenue to be recognized on the transfer of promised goods or services to customers at an amount that reflects the consideration expected to be received in exchange for those goods or services.
| (vi) | IFRS 9 “Financial Instruments” |
IFRS 9 “Financial Instruments” was issued in July, 2014 and is effective for years beginning on or after January 1, 2018, to be applied retrospectively. IFRS 9 “Financial Instruments” replaces the existing incurred loss model used for measuring the allowance for credit losses with an expected loss model. IFRS 9 “Financial Instruments” also makes changes to the existing classification and measurement model designed primarily to address specific application issues raised by early adopters of the standard. It also addresses the income statement accounting mismatches and short-term volatility issues which have been identified as a result of the insurance contracts project.
Manulife Financial Corporation - Second Quarter 2014
32
Note 3 Invested Assets and Investment Income |
| (a) | Carrying values and fair values of invested assets |
| As at June 30, 2014 | FVTPL(1) | AFS(2) | Other | Total carrying value | Total fair value | |||||||||||||||
Cash and short-term securities(3) | $ | 396 | $ | 9,769 | $ | 3,877 | $ | 14,042 | $ | 14,042 | ||||||||||
Debt securities(4) | ||||||||||||||||||||
| Canadian government and agency | 13,427 | 3,188 | - | 16,615 | 16,615 | |||||||||||||||
| U.S. government and agency | 13,832 | 8,950 | - | 22,782 | 22,782 | |||||||||||||||
| Other government and agency | 12,313 | 2,155 | - | 14,468 | 14,468 | |||||||||||||||
| Corporate | 62,416 | 4,217 | - | 66,633 | 66,633 | |||||||||||||||
| Mortgage/asset-backed securities | 2,722 | 528 | - | 3,250 | 3,250 | |||||||||||||||
| Public equities | 11,570 | 2,162 | - | 13,732 | 13,732 | |||||||||||||||
| Mortgages | - | - | 37,806 | 37,806 | 39,980 | |||||||||||||||
| Private placements | - | - | 21,115 | 21,115 | 23,036 | |||||||||||||||
| Policy loans | - | - | 7,390 | 7,390 | 7,390 | |||||||||||||||
| Loans to bank clients | - | - | 1,811 | 1,811 | 1,815 | |||||||||||||||
| Real estate | ||||||||||||||||||||
| Own use property | - | - | 794 | 794 | 1,462 | |||||||||||||||
| Investment property | - | - | 8,757 | 8,757 | 8,757 | |||||||||||||||
| Other invested assets | ||||||||||||||||||||
Other alternative long-duration assets(5) | 6,303 | 81 | 5,218 | 11,602 | 11,835 | |||||||||||||||
| Other | 112 | 24 | 3,196 | 3,332 | 3,331 | |||||||||||||||
| Total invested assets | $ | 123,091 | $ | 31,074 | $ | 89,964 | $ | 244,129 | $ | 249,128 | ||||||||||
| As at December 31, 2013 | ||||||||||||||||||||
Cash and short-term securities(3) | $ | 421 | $ | 10,617 | $ | 2,592 | $ | 13,630 | $ | 13,630 | ||||||||||
Debt securities(4) | ||||||||||||||||||||
| Canadian government and agency | 13,106 | 2,844 | - | 15,950 | 15,950 | |||||||||||||||
| U.S. government and agency | 13,189 | 8,383 | - | 21,572 | 21,572 | |||||||||||||||
| Other government and agency | 10,862 | 1,962 | - | 12,824 | 12,824 | |||||||||||||||
| Corporate | 57,192 | 4,017 | - | 61,209 | 61,209 | |||||||||||||||
| Mortgage/asset-backed securities | 2,774 | 628 | - | 3,402 | 3,402 | |||||||||||||||
| Public equities | 11,011 | 2,064 | - | 13,075 | 13,075 | |||||||||||||||
| Mortgages | - | - | 37,558 | 37,558 | 39,176 | |||||||||||||||
| Private placements | - | - | 21,015 | 21,015 | 22,008 | |||||||||||||||
| Policy loans | - | - | 7,370 | 7,370 | 7,370 | |||||||||||||||
| Loans to bank clients | - | - | 1,901 | 1,901 | 1,907 | |||||||||||||||
| Real estate | ||||||||||||||||||||
| Own use property | - | - | 804 | 804 | 1,476 | |||||||||||||||
| Investment property | - | - | 8,904 | 8,904 | 8,904 | |||||||||||||||
| Other invested assets | ||||||||||||||||||||
Other alternative long-duration assets(5) | 5,921 | 68 | 4,217 | 10,206 | 10,402 | |||||||||||||||
| Other | 108 | 26 | 3,155 | 3,289 | 3,289 | |||||||||||||||
| Total invested assets | $ | 114,584 | $ | 30,609 | $ | 87,516 | $ | 232,709 | $ | 236,194 | ||||||||||
| (1) | The FVTPL classification was elected for the securities backing insurance and investment contract liabilities in order to substantially reduce an accounting mismatch arising from changes in the value of these assets and changes in the value of the related insurance and investment contract liabilities. There would otherwise be a mismatch if the available-for-sale (“AFS”) classification was selected because changes in insurance and investment contract liabilities are recognized in net income rather than in OCI. |
| (2) | Securities that are designated as AFS are not actively traded by the Company but sales do occur as circumstances warrant. Such sales result in a reclassification of any accumulated unrealized gain (loss) in AOCI to net income as a realized gain (loss). |
| (3) | Includes short-term securities with maturities of less than one year at acquisition amounting to $3,925 (December 31, 2013 – $4,473) cash equivalents with maturities of less than 90 days at acquisition amounting to $6,239 (December 31, 2013 – $6,565) and cash of $3,877 (December 31, 2013 - $2,592). |
| (4) | Debt securities includes securities which were acquired with maturities of less than one year and less than 90 days of $539 and $4, respectively (December 31, 2013 – $502 and $60, respectively). |
| (5) | Other alternative long-duration assets include investments in private equity of $2,372 , power and infrastructure of $3,732 , oil and gas of $1,705 , timber and agriculture sectors of $3,652 and various others of $141 (December 31, 2013 – $2,181, - $3,486, $1,643, $2,770 and $126 , respectively). On March 26, 2014, the Company acquired a controlling financial interest in Hancock Victoria Plantations Holdings PTY Limited (“HVPH”) which was an associate before this transaction. Upon initial consolidation of HVPH, timber properties of $763, carried at fair value, were recognized and $80 of investments in associate was derecognized. |
Manulife Financial Corporation - Second Quarter 2014
33
| (b) | Investment income (loss) |
| three months ended | six months ended | |||||||||||||||
| June 30, | June 30, | |||||||||||||||
| For the | 2014 | 2013 | 2014 | 2013 | ||||||||||||
| Interest income | $ | 2,247 | $ | 2,156 | $ | 4,479 | $ | 4,268 | ||||||||
| Dividend, rental and other income | 469 | 334 | 849 | 628 | ||||||||||||
| Net recoveries (impairments and provisions) for loan losses | (8 | ) | 21 | (2 | ) | (2 | ) | |||||||||
| Other | 117 | (166 | ) | 183 | (144 | ) | ||||||||||
| $ | 2,825 | $ | 2,345 | $ | 5,509 | $ | 4,750 | |||||||||
Realized and unrealized gains (losses) on assets supporting insurance and investment contract liabilities and on the macro equity hedging program | ||||||||||||||||
| Debt securities | $ | 2,222 | $ | (5,104 | ) | $ | 5,251 | $ | (5,647 | ) | ||||||
| Public equities | 437 | (117 | ) | 584 | 381 | |||||||||||
| Mortgages | 27 | 24 | 31 | 30 | ||||||||||||
| Private placements | 10 | (9 | ) | 2 | (17 | ) | ||||||||||
| Real estate | 72 | 38 | 131 | 53 | ||||||||||||
| Other investments | 159 | 119 | 270 | 196 | ||||||||||||
| Derivatives, including macro equity hedging program | 1,166 | (4,306 | ) | 3,080 | (7,312 | ) | ||||||||||
| $ | 4,093 | $ | (9,355 | ) | $ | 9,349 | $ | (12,316 | ) | |||||||
| Total investment income (loss) | $ | 6,918 | $ | (7,010 | ) | $ | 14,858 | $ | (7,566 | ) | ||||||
| (c) | Mortgage securitization |
The Company securitizes certain insured fixed and variable rate commercial and residential mortgages and Home Equity Lines of Credit (“HELOC”) through creation of mortgage-backed securities under the Canadian Mortgage Bond Program (“CMB”), and through a HELOC securitization program. Benefits received from the transfers include interest spread between the asset and associated liability. These transactions remain “on-balance sheet” and are accounted for as secured borrowings.
The carrying amount of securitized assets reflecting the Company’s continuing involvement with the mortgages and the associated liabilities is as follows.
| As at June 30, 2014 | Securitized assets | |||||||||||||||
| Securitization program | Securitized mortgages | Restricted cash and short-term securities | Total | Secured borrowing liabilities | ||||||||||||
HELOC securitization(1),(2) | $ | 2,000 | $ | 10 | $ | 2,010 | $ | 1,999 | ||||||||
| CMB securitization | 96 | 19 | 115 | 115 | ||||||||||||
| Total | $ | 2,096 | $ | 29 | $ | 2,125 | $ | 2,114 | ||||||||
| As at December 31, 2013 | ||||||||||||||||
HELOC securitization(1),(2) | $ | 2,000 | $ | 10 | $ | 2,010 | $ | 1,998 | ||||||||
| CMB securitization | 104 | 11 | 115 | 115 | ||||||||||||
| Total | $ | 2,104 | $ | 21 | $ | 2,125 | $ | 2,113 | ||||||||
| (1) | The restricted cash balance for the HELOC securitization is a cash reserve fund established in relation to the transactions. The reserve will be drawn upon only in the event of insufficient cash flows from the underlying HELOCs to satisfy the secured borrowing liability. |
| (2) | The secured borrowing liabilities primarily comprise of Series 2010-1 and Series 2011-1 floating rate notes and are expected to mature on December 15, 2015 and December 15, 2017, respectively. |
The fair value of the securitized assets as at June 30, 2014 was $2,126 (December 31, 2013 – $2,127) and the fair value of associated liabilities was $2,122 (December 31, 2013 – $2,124).
| (d) | Fair value measurement |
The following table presents fair value of the Company’s invested assets, measured at fair value in the Consolidated Statements of Financial Position categorized by hierarchy.
Manulife Financial Corporation - Second Quarter 2014
34
| As at June 30, 2014 | Total fair value | Level 1 | Level 2 | Level 3 | ||||||||||||
| Cash and short-term securities | ||||||||||||||||
| FVTPL | $ | 396 | $ | - | $ | 396 | $ | - | ||||||||
| AFS | 9,769 | - | 9,769 | - | ||||||||||||
| Other | 3,877 | 3,877 | - | - | ||||||||||||
Debt securities(1) | ||||||||||||||||
| FVTPL | ||||||||||||||||
| Canadian government and agency | 13,427 | - | 12,607 | 820 | ||||||||||||
| U.S. government and agency | 13,832 | - | 13,502 | 330 | ||||||||||||
| Other government and agency | 12,313 | - | 11,912 | 401 | ||||||||||||
| Corporate | 62,416 | - | 60,315 | 2,101 | ||||||||||||
| Residential mortgage/asset-backed securities | 150 | - | 12 | 138 | ||||||||||||
| Commercial mortgage/asset-backed securities | 812 | - | 399 | 413 | ||||||||||||
| Other securitized assets | 1,760 | - | 1,697 | 63 | ||||||||||||
| AFS | ||||||||||||||||
| Canadian government and agency | 3,188 | - | 2,344 | 844 | ||||||||||||
| U.S. government and agency | 8,950 | - | 8,945 | 5 | ||||||||||||
| Other government and agency | 2,155 | - | 2,091 | 64 | ||||||||||||
| Corporate | 4,217 | - | 4,103 | 114 | ||||||||||||
| Residential mortgage/asset-backed securities | 284 | - | 255 | 29 | ||||||||||||
| Commercial mortgage/asset-backed securities | 100 | - | 23 | 77 | ||||||||||||
| Other securitized assets | 144 | - | 125 | 19 | ||||||||||||
| Equities | ||||||||||||||||
| FVTPL | 11,570 | 11,564 | 6 | - | ||||||||||||
| AFS | 2,162 | 2,162 | - | - | ||||||||||||
Real estate - investment property(2) | 8,757 | - | - | 8,757 | ||||||||||||
Other invested assets(3) | 9,853 | - | - | 9,853 | ||||||||||||
| Total invested assets carried at fair value | $ | 170,132 | $ | 17,603 | $ | 128,501 | $ | 24,028 | ||||||||
| As at December 31, 2013 | ||||||||||||||||
| Cash and short-term securities | ||||||||||||||||
| FVTPL | $ | 421 | $ | - | $ | 421 | $ | - | ||||||||
| AFS | 10,617 | - | 10,617 | - | ||||||||||||
| Other | 2,592 | 2,592 | - | - | ||||||||||||
Debt securities(1) | ||||||||||||||||
| FVTPL | ||||||||||||||||
| Canadian government and agency | 13,106 | - | 12,377 | 729 | ||||||||||||
| U.S. government and agency | 13,189 | - | 13,029 | 160 | ||||||||||||
| Other government and agency | 10,862 | - | 10,542 | 320 | ||||||||||||
| Corporate | 57,192 | - | 55,196 | 1,996 | ||||||||||||
| Residential mortgage/asset-backed securities | 159 | - | 12 | 147 | ||||||||||||
| Commercial mortgage/asset-backed securities | 827 | - | 564 | 263 | ||||||||||||
| Other securitized assets | 1,788 | - | 1,711 | 77 | ||||||||||||
| AFS | ||||||||||||||||
| Canadian government and agency | 2,844 | - | 2,306 | 538 | ||||||||||||
| U.S. government and agency | 8,383 | - | 8,380 | 3 | ||||||||||||
| Other government and agency | 1,962 | - | 1,904 | 58 | ||||||||||||
| Corporate | 4,017 | - | 3,889 | 128 | ||||||||||||
| Residential mortgage/asset-backed securities | 368 | - | 337 | 31 | ||||||||||||
| Commercial mortgage/asset-backed securities | 90 | - | 36 | 54 | ||||||||||||
| Other securitized assets | 170 | - | 139 | 31 | ||||||||||||
| Equities | ||||||||||||||||
| FVTPL | 11,011 | 11,005 | 6 | - | ||||||||||||
| AFS | 2,064 | 2,064 | - | - | ||||||||||||
Real estate - investment property(2) | 8,904 | - | - | 8,904 | ||||||||||||
Other invested assets(3) | 8,508 | - | - | 8,508 | ||||||||||||
| Total invested assets carried at fair value | $ | 159,074 | $ | 15,661 | $ | 121,466 | $ | 21,947 | ||||||||
| (1) | The assets included in Level 3 consist primarily of debt securities with maturities greater than 30 years for which the yield curve is not observable, as well as debt securities where prices are only single quoted broker prices that are not provided publicly and therefore are not observable. Spread inputs are not applicable since public bonds are priced by third party sources. These bonds are considered Level 3 as an extrapolated Treasury rate is used to determine price. |
| (2) | For investment property, the significant unobservable inputs are capitalization rate (ranging from 4.0% to 10.25% during the period and ranging from 4.5% to 8.50% for the year ended December 31, 2013) and terminal capitalization rate (ranging from 4.9% to 9.25% during the period and ranging from 5.1% to 9% during the year ended |
Manulife Financial Corporation - Second Quarter 2014
35
| December 31, 2013). Holding other factors constant, a lower capitalization or terminal capitalization rate will tend to increase the fair value of investment property. Changes in fair value based on variations in unobservable input generally cannot be extrapolated because the relationship between the directional changes of each input is not usually linear. |
| (3) | Other invested assets measured at fair value are held primarily in power and infrastructure and timber sectors. The significant inputs used in the valuation of the Company’s power and infrastructure investments are primarily future distributable cash flows, terminal values and discount rates. Holding other factors constant, an increase to future distributable cash flows or terminal values would tend to increase the fair value of a power and infrastructure investment, while an increase in the discount rate would have the opposite effect. Discount rates during the period ranged from 10% to 18% (December 31, 2013 – ranged from 10% to 18%). Disclosure of distributable cash flow and terminal value ranges are not meaningful given the disparity in estimates by project. The significant inputs used in the valuation of the Company’s investments in timberland are timber prices and discount rates. Holding other factors constant, an increase to timber prices would tend to increase the fair value of a timberland investment, while an increase in the discount rates would have the opposite effect. Discount rates during the period ranged from 5.25% to 8% (December 31, 2013 – ranged from 5.25% to 6%). A range of prices for timber is not meaningful given the disparity in estimates by property. |
For invested assets not measured at fair value in the Consolidated Statements of Financial Position, the following table discloses the summarized fair value information categorized by hierarchy, together with the related carrying values.
| As at June 30, 2014 | Carrying value | Total fair value | Level 1 | Level 2 | Level 3 | |||||||||||||||
| Mortgages | $ | 37,806 | $ | 39,980 | $ | - | $ | - | $ | 39,980 | ||||||||||
| Private placements | 21,115 | 23,036 | - | 19,255 | 3,781 | |||||||||||||||
| Policy loans | 7,390 | 7,390 | - | 7,390 | - | |||||||||||||||
| Loans to bank clients | 1,811 | 1,815 | - | 1,815 | - | |||||||||||||||
| Real estate - own use property | 794 | 1,462 | - | - | 1,462 | |||||||||||||||
Other invested assets(1) | 5,081 | 5,313 | - | - | 5,313 | |||||||||||||||
| Total invested assets disclosed at fair value | $ | 73,997 | $ | 78,996 | $ | - | $ | 28,460 | $ | 50,536 | ||||||||||
| As at December 31, 2013 | ||||||||||||||||||||
| Mortgages | $ | 37,558 | $ | 39,176 | $ | - | $ | - | $ | 39,176 | ||||||||||
| Private placements | 21,015 | 22,008 | - | 18,619 | 3,389 | |||||||||||||||
| Policy loans | 7,370 | 7,370 | - | 7,370 | - | |||||||||||||||
| Loans to bank clients | 1,901 | 1,907 | - | 1,907 | - | |||||||||||||||
| Real estate - own use property | 804 | 1,476 | - | - | 1,476 | |||||||||||||||
Other invested assets(1) | 4,987 | 5,183 | - | - | 5,183 | |||||||||||||||
| Total invested assets disclosed at fair value | $ | 73,635 | $ | 77,120 | $ | - | $ | 27,896 | $ | 49,224 | ||||||||||
| (1) | Other invested assets disclosed at fair value include $2,664 (December 31, 2013 - $2,629) of leveraged leases which are shown at their carrying values as fair value is not routinely calculated on these investments. |
Transfers of Level 1 and Level 2 invested assets
The Company’s policy is to record transfers of invested assets between Level 1 and Level 2 at their fair values as at the end of each reporting period, consistent with the date of the determination of fair value. Assets are transferred out of Level 1 when they are no longer transacted with sufficient frequency and volume in an active market. Conversely, assets are transferred from Level 2 to Level 1 when transaction volume and frequency are indicative of an active market. The Company had no transfers from Level 1 to Level 2 and from Level 2 to Level 1 for the three months and six months ended June 30, 2014 and June 30, 2013.
Invested assets measured at fair value on the Consolidated Statements of Financial Position using significant unobservable inputs (Level 3)
The Company classifies the fair values of invested assets as Level 3 if there are no observable markets for the instruments or, in the absence of active markets, the majority of the inputs used to determine fair value are based on the Company’s own assumptions about market participant assumptions. The Company prioritizes the use of market-based inputs over entity-based assumptions in determining Level 3 fair values and, therefore, the gains and losses in the tables below include changes in fair value due to both observable and unobservable factors.
Manulife Financial Corporation - Second Quarter 2014
36
The following tables present a roll forward for all invested assets measured at fair value using significant unobservable inputs (Level 3) for the three months ended June 30, 2014 and 2013:
| Net realized / unrealized gains (losses) included in: | Transfers | |||||||||||||||||||||||||||||||||||||||||||
Balance as at April 1, 2014 | Net income(1) | OCI(2) | Purchases | Sales | Settlements | Into Level 3(3) | Out of Level 3(3) | Currency movement | Balance as at June 30, 2014 | Change in unrealized gains (losses) on instruments still held | ||||||||||||||||||||||||||||||||||
| Debt securities | ||||||||||||||||||||||||||||||||||||||||||||
| FVTPL | ||||||||||||||||||||||||||||||||||||||||||||
| Canadian government & agency | $ | 765 | $ | 19 | $ | - | $ | 349 | $ | (116 | ) | $ | - | $ | - | $ | (197 | ) | $ | - | $ | 820 | $ | 22 | ||||||||||||||||||||
| U.S. government & agency | 319 | 21 | - | - | - | - | - | - | (10 | ) | 330 | 21 | ||||||||||||||||||||||||||||||||
| Other government & agency | 354 | 19 | - | 40 | (5 | ) | (1 | ) | - | - | (6 | ) | 401 | 19 | ||||||||||||||||||||||||||||||
| Corporate | 2,237 | 20 | - | 81 | (21 | ) | (23 | ) | - | (142 | ) | (51 | ) | 2,101 | 22 | |||||||||||||||||||||||||||||
Residential mortgage/ asset-backed securities | 147 | 2 | - | - | - | (6 | ) | - | - | (5 | ) | 138 | 2 | |||||||||||||||||||||||||||||||
Commercial mortgage/ asset-backed securities | 363 | 3 | - | 64 | - | (5 | ) | - | - | (12 | ) | 413 | 5 | |||||||||||||||||||||||||||||||
| Other securitized assets | 75 | 1 | - | - | - | (11 | ) | - | - | (2 | ) | 63 | 1 | |||||||||||||||||||||||||||||||
| $ | 4,260 | $ | 85 | $ | - | $ | 534 | $ | (142 | ) | $ | (46 | ) | $ | - | $ | (339 | ) | $ | (86 | ) | $ | 4,266 | $ | 92 | |||||||||||||||||||
| AFS | ||||||||||||||||||||||||||||||||||||||||||||
| Canadian government & agency | $ | 656 | $ | 16 | $ | 9 | $ | 488 | $ | (324 | ) | $ | - | $ | - | $ | - | $ | (1 | ) | $ | 844 | $ | - | ||||||||||||||||||||
| U.S. government & agency | 5 | - | 1 | - | - | - | - | - | (1 | ) | 5 | - | ||||||||||||||||||||||||||||||||
| Other government & agency | 59 | - | 1 | 15 | (8 | ) | (1 | ) | - | - | (2 | ) | 64 | - | ||||||||||||||||||||||||||||||
| Corporate | 119 | - | 2 | 9 | (2 | ) | (11 | ) | - | (1 | ) | (2 | ) | 114 | - | |||||||||||||||||||||||||||||
Residential mortgage/ asset-backed securities | 31 | - | - | - | - | (1 | ) | - | - | (1 | ) | 29 | - | |||||||||||||||||||||||||||||||
Commercial mortgage/ asset-backed securities | 58 | - | - | 21 | - | - | - | - | (2 | ) | 77 | - | ||||||||||||||||||||||||||||||||
| Other securitized assets | 25 | - | - | - | - | (5 | ) | - | - | (1 | ) | 19 | - | |||||||||||||||||||||||||||||||
| $ | 953 | $ | 16 | $ | 13 | $ | 533 | $ | (334 | ) | $ | (18 | ) | $ | - | $ | (1 | ) | $ | (10 | ) | $ | 1,152 | $ | - | |||||||||||||||||||
| Real estate - investment property | $ | 8,826 | $ | 69 | $ | - | $ | 44 | $ | 20 | $ | - | $ | - | $ | - | $ | (202 | ) | $ | 8,757 | $ | 69 | |||||||||||||||||||||
| Other invested assets | 9,634 | 270 | (1 | ) | 334 | (39 | ) | (90 | ) | - | - | (255 | ) | 9,853 | 263 | |||||||||||||||||||||||||||||
| $ | 18,460 | $ | 339 | $ | (1 | ) | $ | 378 | $ | (19 | ) | $ | (90 | ) | $ | - | $ | - | $ | (457 | ) | $ | 18,610 | $ | 332 | |||||||||||||||||||
| $ | 23,673 | $ | 440 | $ | 12 | $ | 1,445 | $ | (495 | ) | $ | (154 | ) | $ | - | $ | (340 | ) | $ | (553 | ) | $ | 24,028 | $ | 424 | |||||||||||||||||||
| Net realized / unrealized gains (losses) included in: | Transfers | |||||||||||||||||||||||||||||||||||||||||||
Balance as at April 1, 2013 | Net income(1) | OCI(2) | Purchases | Sales | Settlements | Into Level 3(3) | Out of Level 3(3) | Currency movement | Balance as at June 30, 2013 | Change in unrealized gains (losses) on instruments still held | ||||||||||||||||||||||||||||||||||
| Debt securities | ||||||||||||||||||||||||||||||||||||||||||||
| FVTPL | ||||||||||||||||||||||||||||||||||||||||||||
| Canadian government & agency | $ | 397 | $ | (35 | ) | $ | - | $ | 111 | $ | - | $ | - | $ | - | $ | - | $ | - | $ | 473 | $ | (35 | ) | ||||||||||||||||||||
| U.S. government & agency | 180 | (19 | ) | - | - | - | - | - | - | 5 | 166 | (19 | ) | |||||||||||||||||||||||||||||||
| Other government & agency | 827 | (8 | ) | - | 33 | (26 | ) | - | - | - | 24 | 850 | (9 | ) | ||||||||||||||||||||||||||||||
| Corporate | 2,154 | (72 | ) | - | 159 | (26 | ) | (49 | ) | 1 | (173 | ) | 27 | 2,021 | (64 | ) | ||||||||||||||||||||||||||||
Residential mortgage/ asset-backed securities | 186 | 9 | - | - | (29 | ) | (16 | ) | - | - | 7 | 157 | 8 | |||||||||||||||||||||||||||||||
Commercial mortgage/ asset-backed securities | 211 | 4 | - | - | (11 | ) | (17 | ) | - | - | 8 | 195 | 5 | |||||||||||||||||||||||||||||||
| Other securitized assets | 127 | 23 | - | - | (28 | ) | (20 | ) | - | - | 6 | 108 | (2 | ) | ||||||||||||||||||||||||||||||
| $ | 4,082 | $ | (98 | ) | $ | - | $ | 303 | $ | (120 | ) | $ | (102 | ) | $ | 1 | $ | (173 | ) | $ | 77 | $ | 3,970 | $ | (116 | ) | ||||||||||||||||||
| AFS | ||||||||||||||||||||||||||||||||||||||||||||
| Canadian government & agency | $ | 414 | $ | (2 | ) | $ | (16 | ) | $ | 65 | $ | (198 | ) | $ | - | $ | - | $ | - | $ | - | $ | 263 | $ | - | |||||||||||||||||||
| U.S. government & agency | 3 | - | - | - | - | - | - | - | - | 3 | - | |||||||||||||||||||||||||||||||||
| Other government & agency | 68 | 1 | (1 | ) | 30 | (18 | ) | - | - | - | 1 | 81 | - | |||||||||||||||||||||||||||||||
| Corporate | 196 | 1 | (7 | ) | 24 | (19 | ) | (7 | ) | - | - | 1 | 189 | - | ||||||||||||||||||||||||||||||
Residential mortgage/ asset-backed securities | 43 | 3 | 3 | - | (10 | ) | (7 | ) | - | - | 2 | 34 | - | |||||||||||||||||||||||||||||||
Commercial mortgage/ asset-backed securities | 38 | - | 1 | - | (2 | ) | - | - | - | 1 | 38 | - | ||||||||||||||||||||||||||||||||
| Other securitized assets | 41 | 2 | - | - | (8 | ) | (2 | ) | - | - | 1 | 34 | - | |||||||||||||||||||||||||||||||
| $ | 803 | $ | 5 | $ | (20 | ) | $ | 119 | $ | (255 | ) | $ | (16 | ) | $ | - | $ | - | $ | 6 | $ | 642 | $ | - | ||||||||||||||||||||
| Equities | ||||||||||||||||||||||||||||||||||||||||||||
| FVTPL | $ | 1 | $ | (1 | ) | $ | - | $ | - | $ | - | $ | - | $ | - | $ | - | $ | - | $ | - | $ | - | |||||||||||||||||||||
| AFS | 2 | - | - | - | - | - | - | (2 | ) | - | - | - | ||||||||||||||||||||||||||||||||
| $ | 3 | $ | (1 | ) | $ | - | $ | - | $ | - | $ | - | $ | - | $ | (2 | ) | $ | - | $ | - | $ | - | |||||||||||||||||||||
Real estate - investment property | $ | 7,866 | $ | 38 | $ | - | $ | 33 | $ | (207 | ) | $ | - | $ | - | $ | - | $ | 148 | $ | 7,878 | $ | 37 | |||||||||||||||||||||
| Other invested assets | 7,183 | 89 | (8 | ) | 198 | (4 | ) | (66 | ) | - | (1 | ) | 212 | 7,603 | 98 | |||||||||||||||||||||||||||||
| $ | 15,049 | $ | 127 | $ | (8 | ) | $ | 231 | $ | (211 | ) | $ | (66 | ) | $ | - | $ | (1 | ) | $ | 360 | $ | 15,481 | $ | 135 | |||||||||||||||||||
| $ | 19,937 | $ | 33 | $ | (28 | ) | $ | 653 | $ | (586 | ) | $ | (184 | ) | $ | 1 | $ | (176 | ) | $ | 443 | $ | 20,093 | $ | 19 | |||||||||||||||||||
| (1) | These amounts are included in investment income on the Consolidated Statements of Income. |
| (2) | These amounts are included in AOCI on the Consolidated Statements of Financial Position. |
| (3) | For assets that are transferred into and/or out of Level 3, the Company uses the fair value of the assets at the beginning of the period. |
Manulife Financial Corporation - Second Quarter 2014
37
The following tables present a roll forward for all invested assets measured at fair value using significant unobservable inputs (Level 3) for the six months ended June 30, 2014 and 2013:
| Net realized / unrealized gains (losses) included in: | Transfers | |||||||||||||||||||||||||||||||||||||||||||
| Balance as at January 1, 2014 | Net income(1) | OCI(2) | Purchases(3) | Sales | Settlements | Into Level 3(4) | Out of Level 3(4) | Currency movement | Balance as at June 30, 2014 | Change in unrealized gains (losses) on instruments still held | ||||||||||||||||||||||||||||||||||
| Debt securities | ||||||||||||||||||||||||||||||||||||||||||||
| FVTPL | ||||||||||||||||||||||||||||||||||||||||||||
| Canadian government & agency | $ | 729 | $ | 58 | $ | - | $ | 413 | $ | (183 | ) | $ | - | $ | - | $ | (197 | ) | $ | - | $ | 820 | $ | 59 | ||||||||||||||||||||
| U.S. government & agency | 160 | 47 | - | - | - | - | 122 | - | 1 | 330 | 47 | |||||||||||||||||||||||||||||||||
| Other government & agency | 320 | 57 | - | 51 | (12 | ) | (1 | ) | - | (22 | ) | 8 | 401 | 57 | ||||||||||||||||||||||||||||||
| Corporate | 1,996 | 66 | - | 218 | (60 | ) | (48 | ) | 93 | (190 | ) | 26 | 2,101 | 51 | ||||||||||||||||||||||||||||||
Residential mortgage/ asset-backed securities | 147 | 3 | - | - | - | (13 | ) | - | - | 1 | 138 | 2 | ||||||||||||||||||||||||||||||||
Commercial mortgage/ asset-backed securities | 263 | 10 | - | 149 | - | (7 | ) | - | - | (2 | ) | 413 | 12 | |||||||||||||||||||||||||||||||
| Other securitized assets | 77 | 3 | - | - | - | (17 | ) | - | (1 | ) | 1 | 63 | 3 | |||||||||||||||||||||||||||||||
| $ | 3,692 | $ | 244 | $ | - | $ | 831 | $ | (255 | ) | $ | (86 | ) | $ | 215 | $ | (410 | ) | $ | 35 | $ | 4,266 | $ | 231 | ||||||||||||||||||||
| AFS | ||||||||||||||||||||||||||||||||||||||||||||
| Canadian government & agency | $ | 538 | $ | 17 | $ | 37 | $ | 638 | $ | (374 | ) | $ | - | $ | - | $ | (11 | ) | $ | (1 | ) | $ | 844 | $ | - | |||||||||||||||||||
| U.S. government & agency | 3 | - | 1 | - | - | - | 1 | - | - | 5 | - | |||||||||||||||||||||||||||||||||
| Other government & agency | 58 | - | 2 | 16 | (11 | ) | (1 | ) | - | �� | (1 | ) | 1 | 64 | - | |||||||||||||||||||||||||||||
| Corporate | 128 | - | 3 | 12 | (2 | ) | (16 | ) | 3 | (16 | ) | 2 | 114 | - | ||||||||||||||||||||||||||||||
Residential mortgage/ asset-backed securities | 31 | 1 | - | - | - | (3 | ) | - | - | - | 29 | - | ||||||||||||||||||||||||||||||||
Commercial mortgage/ asset-backed securities | 54 | (1 | ) | 3 | 21 | - | - | - | - | - | 77 | - | ||||||||||||||||||||||||||||||||
| Other securitized assets | 31 | - | 1 | - | - | (13 | ) | - | (1 | ) | 1 | 19 | - | |||||||||||||||||||||||||||||||
| $ | 843 | $ | 17 | $ | 47 | $ | 687 | $ | (387 | ) | $ | (33 | ) | $ | 4 | $ | (29 | ) | $ | 3 | $ | 1,152 | $ | - | ||||||||||||||||||||
| Equities | ||||||||||||||||||||||||||||||||||||||||||||
| FVTPL | $ | - | $ | (1 | ) | $ | - | $ | - | $ | - | $ | - | $ | 1 | $ | - | $ | - | $ | - | $ | (1 | ) | ||||||||||||||||||||
| AFS | - | - | - | - | - | - | - | - | - | - | - | |||||||||||||||||||||||||||||||||
| $ | - | $ | (1 | ) | $ | - | $ | - | $ | - | $ | - | $ | 1 | $ | - | $ | - | $ | - | $ | (1 | ) | |||||||||||||||||||||
| Real estate - investment property | $ | 8,904 | $ | 128 | $ | - | $ | 225 | $ | (531 | ) | $ | - | $ | - | $ | - | $ | 31 | $ | 8,757 | $ | 117 | |||||||||||||||||||||
| Other invested assets | 8,508 | 343 | 1 | 1,330 | (107 | ) | (255 | ) | - | - | 33 | 9,853 | 318 | |||||||||||||||||||||||||||||||
| $ | 17,412 | $ | 471 | $ | 1 | $ | 1,555 | $ | (638 | ) | $ | (255 | ) | $ | - | $ | - | $ | 64 | $ | 18,610 | $ | 435 | |||||||||||||||||||||
| $ | 21,947 | $ | 731 | $ | 48 | $ | 3,073 | $ | (1,280 | ) | $ | (374 | ) | $ | 220 | $ | (439 | ) | $ | 102 | $ | 24,028 | $ | 665 | ||||||||||||||||||||
| (1) | These amounts are included in investment income on the Consolidated Statements of Income. |
| (2) | These amounts are included in AOCI on the Consolidated Statements of Financial Position. |
| (3) | Purchases for other invested assets include timber properties recognized upon initial consolidation of HVPH. Refer to footnote 5 to note 3(a) above. |
| (4) | For assets that are transferred into and/or out of Level 3, the Company uses the fair value of the assets at the beginning of the period. |
| Net realized / unrealized gains (losses) included in: | Transfers | |||||||||||||||||||||||||||||||||||||||||||
| Balance as at January 1, 2013 | Net income(1) | OCI(2) | Purchases | Sales | Settlements | Into Level 3(3) | Out of Level 3(3) | Currency movement | Balance as at June 30, 2013 | Change in unrealized gains (losses) on instruments still held | ||||||||||||||||||||||||||||||||||
| Debt securities | ||||||||||||||||||||||||||||||||||||||||||||
| FVTPL | ||||||||||||||||||||||||||||||||||||||||||||
| Canadian government & agency | $ | 396 | $ | (46 | ) | $ | - | $ | 123 | $ | - | $ | - | $ | - | $ | - | $ | - | $ | 473 | $ | (46 | ) | ||||||||||||||||||||
| U.S. government & agency | 180 | (23 | ) | - | - | - | - | - | - | 9 | 166 | (23 | ) | |||||||||||||||||||||||||||||||
| Other government & agency | 800 | (26 | ) | - | 89 | (43 | ) | (5 | ) | - | - | 35 | 850 | (27 | ) | |||||||||||||||||||||||||||||
| Corporate | 2,094 | (80 | ) | - | 293 | (44 | ) | (59 | ) | 30 | (237 | ) | 24 | 2,021 | (72 | ) | ||||||||||||||||||||||||||||
Residential mortgage/ asset-backed securities | 194 | 24 | - | - | (41 | ) | (31 | ) | - | - | 11 | 157 | 17 | |||||||||||||||||||||||||||||||
Commercial mortgage/ asset-backed securities | 203 | 11 | - | - | (11 | ) | (20 | ) | - | - | 12 | 195 | 18 | |||||||||||||||||||||||||||||||
| Other securitized assets | 135 | 28 | - | - | (28 | ) | (36 | ) | - | - | 9 | 108 | (1 | ) | ||||||||||||||||||||||||||||||
| $ | 4,002 | $ | (112 | ) | $ | - | $ | 505 | $ | (167 | ) | $ | (151 | ) | $ | 30 | $ | (237 | ) | $ | 100 | $ | 3,970 | $ | (134 | ) | ||||||||||||||||||
| AFS | ||||||||||||||||||||||||||||||||||||||||||||
| Canadian government & agency | $ | 210 | $ | (2 | ) | $ | (21 | ) | $ | 275 | $ | (198 | ) | $ | - | $ | - | $ | - | $ | (1 | ) | $ | 263 | $ | - | ||||||||||||||||||
| U.S. government & agency | 3 | - | - | - | - | - | - | - | - | 3 | - | |||||||||||||||||||||||||||||||||
| Other government & agency | 69 | 1 | (1 | ) | 31 | (20 | ) | - | - | - | 1 | 81 | - | |||||||||||||||||||||||||||||||
| Corporate | 151 | 1 | (9 | ) | 25 | (19 | ) | (7 | ) | 49 | - | (2 | ) | 189 | - | |||||||||||||||||||||||||||||
Residential mortgage/ asset-backed securities | 49 | 7 | 5 | - | (16 | ) | (14 | ) | - | - | 3 | 34 | - | |||||||||||||||||||||||||||||||
Commercial mortgage/ asset-backed securities | 40 | (3 | ) | 4 | - | (2 | ) | (3 | ) | - | - | 2 | 38 | - | ||||||||||||||||||||||||||||||
| Other securitized assets | 41 | 2 | 1 | - | (8 | ) | (4 | ) | - | - | 2 | 34 | - | |||||||||||||||||||||||||||||||
| $ | 563 | $ | 6 | $ | (21 | ) | $ | 331 | $ | (263 | ) | $ | (28 | ) | $ | 49 | $ | - | $ | 5 | $ | 642 | $ | - | ||||||||||||||||||||
| Equities | ||||||||||||||||||||||||||||||||||||||||||||
| AFS | $ | - | $ | - | $ | - | $ | 2 | $ | - | $ | - | $ | - | $ | (2 | ) | $ | - | $ | - | $ | - | |||||||||||||||||||||
| $ | - | $ | - | $ | - | $ | 2 | $ | - | $ | - | $ | - | $ | (2 | ) | $ | - | $ | - | $ | - | ||||||||||||||||||||||
| Real estate - investment property | $ | 7,724 | $ | 53 | $ | - | $ | 111 | $ | (231 | ) | $ | - | $ | - | $ | - | $ | 221 | $ | 7,878 | $ | 50 | |||||||||||||||||||||
| Other invested assets | 6,836 | 148 | (8 | ) | 443 | (19 | ) | (130 | ) | 5 | (1 | ) | 329 | 7,603 | 153 | |||||||||||||||||||||||||||||
| $ | 14,560 | $ | 201 | $ | (8 | ) | $ | 554 | $ | (250 | ) | $ | (130 | ) | $ | 5 | $ | (1 | ) | $ | 550 | $ | 15,481 | $ | 203 | |||||||||||||||||||
| $ | 19,125 | $ | 95 | $ | (29 | ) | $ | 1,392 | $ | (680 | ) | $ | (309 | ) | $ | 84 | $ | (240 | ) | $ | 655 | $ | 20,093 | $ | 69 | |||||||||||||||||||
| (1) | These amounts are included in investment income on the Consolidated Statements of Income. |
| (2) | These amounts are included in AOCI on the Consolidated Statements of Financial Position. |
| (3) | For assets that are transferred into and/or out of Level 3, the Company uses the fair value of the assets at the beginning of the period. |
Manulife Financial Corporation - Second Quarter 2014
38
Note 4 Derivative and Hedging Instruments |
| (a) | Fair value of derivatives |
The gross notional amount and the fair value of derivative contracts by the underlying risk exposure for all derivatives in qualifying and non-qualifying hedge accounting relationships are summarized in the following table.
| June 30, 2014 | December 31, 2013 | ||||||||||||||||||||||||
| As at | Fair value | Fair value | |||||||||||||||||||||||
| Type of hedge | Instrument type | Notional amount | Assets | Liabilities | Notional amount | Assets | Liabilities | ||||||||||||||||||
Qualifying hedge accounting relationships | |||||||||||||||||||||||||
| Fair value hedges | Interest rate swaps | $ | 6,214 | $ | 140 | $ | 684 | $ | 5,768 | $ | 185 | $ | 395 | ||||||||||||
| Foreign currency swaps | 74 | - | 19 | 73 | - | 16 | |||||||||||||||||||
| Cash flow hedges | Interest rate swaps | 37 | - | - | 64 | - | - | ||||||||||||||||||
| Foreign currency swaps | 786 | - | 136 | 785 | - | 59 | |||||||||||||||||||
| Forward contracts | 124 | 1 | 1 | 132 | - | 1 | |||||||||||||||||||
| Equity contracts | 140 | 15 | - | 101 | 21 | - | |||||||||||||||||||
| Total derivatives in qualifying hedge accounting relationships | $ | 7,375 | $ | 156 | $ | 840 | $ | 6,923 | $ | 206 | $ | 471 | |||||||||||||
| Non-qualifying hedge accounting relationships | |||||||||||||||||||||||||
| Interest rate swaps | $ | 205,738 | $ | 10,874 | $ | 6,352 | $ | 192,236 | $ | 8,989 | $ | 7,535 | |||||||||||||
| Interest rate futures | 4,992 | - | - | 4,836 | - | - | |||||||||||||||||||
| Interest rate options | 3,242 | 48 | - | 2,854 | 23 | - | |||||||||||||||||||
| Foreign currency swaps | 6,627 | 147 | 516 | 6,663 | 130 | 506 | |||||||||||||||||||
| Currency rate futures | 3,906 | - | - | 3,760 | - | - | |||||||||||||||||||
| Forward contracts | 7,402 | 325 | 24 | 6,921 | 14 | 417 | |||||||||||||||||||
| Equity contracts | 6,050 | 355 | 3 | 4,761 | 302 | - | |||||||||||||||||||
| Credit default swaps | 342 | 8 | - | 335 | 9 | - | |||||||||||||||||||
| Equity futures | 11,266 | - | - | 9,894 | - | - | |||||||||||||||||||
| Total derivatives in non-qualifying hedge accounting relationships | $ | 249,565 | $ | 11,757 | $ | 6,895 | $ | 232,260 | $ | 9,467 | $ | 8,458 | |||||||||||||
| Total derivatives | $ | 256,940 | $ | 11,913 | $ | 7,735 | $ | 239,183 | $ | 9,673 | $ | 8,929 | |||||||||||||
The fair value of derivative instruments is summarized by term to maturity in the following table. Fair values shown do not incorporate the impact of master netting agreements (refer to note 6).
| Term to maturity | ||||||||||||||||||||
| As at June 30, 2014 | Less than 1 year | 1 to 3 years | 3 to 5 years | Over 5 years | Total | |||||||||||||||
| Derivative assets | $ | 390 | $ | 464 | $ | 316 | $ | 10,743 | $ | 11,913 | ||||||||||
| Derivative liabilities | 77 | 287 | 334 | 7,037 | 7,735 | |||||||||||||||
| As at December 31, 2013 | ||||||||||||||||||||
| Derivative assets | $ | 103 | $ | 442 | $ | 316 | $ | 8,812 | $ | 9,673 | ||||||||||
| Derivative liabilities | 484 | 357 | 328 | 7,760 | 8,929 | |||||||||||||||
Manulife Financial Corporation - Second Quarter 2014
39
| As at June 30, 2014 | Total fair value | Level 1 | Level 2 | Level 3 | ||||||||||||
| Derivative assets | ||||||||||||||||
| Interest rate contracts | $ | 11,386 | $ | - | $ | 10,982 | $ | 404 | ||||||||
| Foreign exchange contracts | 149 | - | 147 | 2 | ||||||||||||
| Equity contracts | 370 | - | 46 | 324 | ||||||||||||
| Credit default swaps | 8 | - | 8 | - | ||||||||||||
| Total derivative assets | $ | 11,913 | $ | - | $ | 11,183 | $ | 730 | ||||||||
| Derivative liabilities | ||||||||||||||||
| Interest rate contracts | $ | 7,058 | $ | - | $ | 6,949 | $ | 109 | ||||||||
| Foreign exchange contracts | 674 | - | 658 | 16 | ||||||||||||
| Equity contracts | 3 | - | - | 3 | ||||||||||||
| Total derivative liabilities | $ | 7,735 | $ | - | $ | 7,607 | $ | 128 | ||||||||
| As at December 31, 2013 | ||||||||||||||||
| Derivative assets | ||||||||||||||||
| Interest rate contracts | $ | 9,208 | $ | - | $ | 9,177 | $ | 31 | ||||||||
| Foreign exchange contracts | 133 | - | 132 | 1 | ||||||||||||
| Equity contracts | 323 | - | 30 | 293 | ||||||||||||
| Credit default swaps | 9 | - | 9 | - | ||||||||||||
| Total derivative assets | $ | 9,673 | $ | - | $ | 9,348 | $ | 325 | ||||||||
| Derivative liabilities | �� | |||||||||||||||
| Interest rate contracts | $ | 8,340 | $ | - | $ | 7,888 | $ | 452 | ||||||||
| Foreign exchange contracts | 589 | - | 569 | 20 | ||||||||||||
| Total derivative liabilities | $ | 8,929 | $ | - | $ | 8,457 | $ | 472 | ||||||||
The following table presents a roll forward for net derivative contracts measured at fair value using significant unobservable inputs (Level 3).
| three months ended | six months ended | |||||||||||||||
| June 30, | June 30, | |||||||||||||||
| For the | 2014 | 2013 | 2014 | 2013 | ||||||||||||
| Balance at the beginning of the period | $ | 399 | $ | 5 | $ | (147 | ) | $ | (6 | ) | ||||||
| Net realized / unrealized gains (losses) included in: | ||||||||||||||||
Net income(1) | 143 | (7 | ) | 668 | 6 | |||||||||||
OCI(2) | 9 | 17 | (12 | ) | 16 | |||||||||||
Purchases(3) | 86 | 77 | 98 | 91 | ||||||||||||
| Sales | (1 | ) | (20 | ) | (9 | ) | (42 | ) | ||||||||
| Transfers | ||||||||||||||||
Into Level 3(4) | - | - | (14 | ) | - | |||||||||||
Out of Level 3(4) | (12 | ) | 14 | 35 | 15 | |||||||||||
| Currency movement | (22 | ) | 10 | (17 | ) | 16 | ||||||||||
| Balance at the end of the period | $ | 602 | $ | 96 | $ | 602 | $ | 96 | ||||||||
| Change in unrealized gains (losses) on instruments still held | $ | 241 | $ | 57 | $ | 429 | $ | 60 | ||||||||
| (1) | These amounts are included in investment income on the Consolidated Statements of Income. |
| (2) | These amounts are included in AOCI on the Consolidated Statements of Financial Position. |
| (3) | Purchases include derivatives recognized upon initial consolidation of HVPH. Refer to note 3. |
| (4) | For items that are transferred into and out of Level 3, the Company uses the fair value of the items at the end and beginning of the period, respectively. Transfers into Level 3 occur when the inputs used to price the assets and liabilities lack observable market data (versus the previous period). Transfers out of Level 3 occur when the inputs used to price the assets and liabilities become available from observable market data. |
| (b) | Fair value hedges |
The Company uses interest rate swaps to manage its exposure to changes in the fair value of fixed rate financial instruments caused by changes in interest rates. The Company also uses cross currency swaps to manage its exposure to foreign exchange rate fluctuations, interest rate fluctuations, or both.
The Company recognizes gains and losses on derivatives and the related hedged items in qualifying fair value hedges in investment income. These investment gains (losses) are shown in the following table.
Manulife Financial Corporation - Second Quarter 2014
40
| For the three months ended June 30, 2014 | Hedged items in qualifying fair value hedging relationships | Gains (losses) recognized on derivatives | Gains (losses) recognized for hedged items | Ineffectiveness recognized in investment income | |||||||||
| Interest rate swaps | Fixed rate assets | $ | (216 | ) | $ | 188 | $ | (28 | ) | ||||
| Fixed rate liabilities | (3 | ) | 3 | - | |||||||||
| Foreign currency swaps | Fixed rate assets | (4 | ) | 1 | (3 | ) | |||||||
| Total | $ | (223 | ) | $ | 192 | $ | (31 | ) | |||||
| For the three months ended June 30, 2013 | |||||||||||||
| Interest rate swaps | Fixed rate assets | $ | 423 | $ | (436 | ) | $ | (13 | ) | ||||
| Fixed rate liabilities | (17 | ) | 16 | (1 | ) | ||||||||
| Foreign currency swaps | Fixed rate assets | 7 | (4 | ) | 3 | ||||||||
| Total | $ | 413 | $ | (424 | ) | $ | (11 | ) | |||||
| For the six months ended June 30, 2014 | |||||||||||||
| Interest rate swaps | Fixed rate assets | $ | (519 | ) | $ | 462 | $ | (57 | ) | ||||
| Fixed rate liabilities | (5 | ) | 5 | - | |||||||||
| Foreign currency swaps | Fixed rate assets | (3 | ) | 3 | - | ||||||||
| Total | $ | (527 | ) | $ | 470 | $ | (57 | ) | |||||
| For the six months ended June 30, 2013 | |||||||||||||
| Interest rate swaps | Fixed rate assets | $ | 608 | $ | (640 | ) | $ | (32 | ) | ||||
| Fixed rate liabilities | (16 | ) | 16 | - | |||||||||
| Foreign currency swaps | Fixed rate assets | 10 | (5 | ) | 5 | ||||||||
| Total | $ | 602 | $ | (629 | ) | $ | (27 | ) | |||||
| (c) | Cash flow hedges |
The Company uses interest rate swaps to hedge the variability in cash flows from variable rate financial instruments and forecasted transactions. The Company also uses cross currency swaps and foreign currency forward contracts to hedge the variability from foreign currency financial instruments and foreign currency expenses. Total return swaps are used to hedge the variability in cash flows associated with certain stock-based compensation awards. Inflation swaps are used to reduce inflation risk generated from inflation indexed liabilities.
The effects of derivatives in qualifying cash flow hedging relationships on the Consolidated Statements of Income, the Consolidated Statements of Comprehensive Income and the Consolidated Statements of Changes in Equity are shown in the following table.
Manulife Financial Corporation - Second Quarter 2014
41
Derivatives in qualifying cash flow hedging relationships
| For the three months ended June 30, 2014 | Hedged items in qualifying cash flow hedging relationships | Gains (losses) deferred in AOCI on derivatives | Gains (losses) reclassified from AOCI into investment income | Ineffectiveness recognized in investment income | |||||||||
| Interest rate swaps | Forecasted liabilities | $ | 3 | $ | (4 | ) | $ | - | |||||
| Foreign currency swaps | Fixed rate assets | 1 | - | - | |||||||||
| Floating rate liabilities | (21 | ) | - | - | |||||||||
| Foreign currency forwards | Forecasted expenses | 5 | (2 | ) | - | ||||||||
| Total return swaps | Stock-based compensation | 8 | - | - | |||||||||
| Total | $ | (4 | ) | $ | (6 | ) | $ | - | |||||
| For the three months ended June 30, 2013 | |||||||||||||
| Interest rate swaps | Forecasted liabilities | $ | (5 | ) | $ | (3 | ) | $ | - | ||||
| Foreign currency swaps | Floating rate liabilities | 63 | - | - | |||||||||
| Foreign currency forwards | Forecasted expenses | (5 | ) | - | - | ||||||||
| Total return swaps | Stock-based compensation | 16 | - | - | |||||||||
| Total | $ | 69 | $ | (3 | ) | $ | - | ||||||
| For the six months ended June 30, 2014 | |||||||||||||
| Interest rate swaps | Forecasted liabilities | $ | (1 | ) | $ | (8 | ) | $ | - | ||||
| Foreign currency swaps | Fixed rate assets | (1 | ) | - | - | ||||||||
| Floating rate liabilities | (73 | ) | - | - | |||||||||
| Foreign currency forwards | Forecasted expenses | - | (2 | ) | - | ||||||||
| Total return swaps | Stock-based compensation | (13 | ) | - | - | ||||||||
| Total | $ | (88 | ) | $ | (10 | ) | $ | - | |||||
| For the six months ended June 30, 2013 | |||||||||||||
| Interest rate swaps | Forecasted liabilities | $ | (9 | ) | $ | (6 | ) | $ | - | ||||
| Foreign currency swaps | Fixed rate assets | (1 | ) | - | - | ||||||||
| Floating rate liabilities | 85 | - | - | ||||||||||
| Foreign currency forwards | Forecasted expenses | (10 | ) | - | - | ||||||||
| Total return swaps | Stock-based compensation | 15 | - | - | |||||||||
| Total | $ | 80 | $ | (6 | ) | $ | - | ||||||
The Company anticipates that net losses of approximately $29 will be reclassified from AOCI to net income within the next twelve months. The maximum time frame for which variable cash flows are hedged is 29 years.
| (d) | Hedges of net investments in net foreign operations |
The Company primarily uses forward currency contracts, cross currency swaps and non-functional currency denominated debt to manage its foreign currency exposures to net investments in foreign operations.
The effects of derivatives in net investment hedging relationships on the Consolidated Statements of Income, the Consolidated Statements of Comprehensive Income and the Consolidated Statements of Changes in Equity are shown in the following table.
Manulife Financial Corporation - Second Quarter 2014
42
Hedging instruments in net investment hedging relationships
| For the three months ended June 30, 2014 | Gains (losses) deferred in AOCI on derivatives | Gains (losses) reclassified from AOCI into investment income | Ineffectiveness recognized in investment income | |||||||||
| Non-functional currency denominated debt | $ | 42 | $ | - | $ | - | ||||||
| Total | $ | 42 | $ | - | $ | - | ||||||
| For the three months ended June 30, 2013 | ||||||||||||
| Non-functional currency denominated debt | $ | (39 | ) | $ | - | $ | - | |||||
| Total | $ | (39 | ) | $ | - | $ | - | |||||
| For the six months ended June 30, 2014 | ||||||||||||
| Non-functional currency denominated debt | $ | (4 | ) | $ | - | $ | - | |||||
| Total | $ | (4 | ) | $ | - | $ | - | |||||
| For the six months ended June 30, 2013 | ||||||||||||
| Currency swaps and interest rate swaps | $ | 23 | $ | - | $ | - | ||||||
| Non-functional currency denominated debt | (62 | ) | - | - | ||||||||
| Total | $ | (39 | ) | $ | - | $ | - | |||||
| (e) | Derivatives not designated in qualifying hedge accounting relationships |
The Company generally does not enter into derivative contracts for speculative purposes. Derivatives used in portfolios supporting insurance contract liabilities are generally not designated in qualifying hedge accounting relationships because the change in the value of the insurance contract liabilities economically hedged by these derivatives also is recorded through net income. Given the changes in fair value of these derivatives and hedged related risks are recognized in investment income as they occur, they generally offset the change in hedged risk to the extent the hedges are economically effective.
The effects of derivatives in non-qualifying hedge accounting relationships on the Consolidated Statements of Income are shown in the following table.
Non-qualifying hedge accounting relationships
| three months ended | six months ended | |||||||||||||||
| June 30, | June 30, | |||||||||||||||
| For the | 2014 | 2013 | 2014 | 2013 | ||||||||||||
| Investment income (loss) | ||||||||||||||||
| Interest rate swaps | $ | 1,369 | $ | (3,651 | ) | $ | 3,294 | $ | (4,952 | ) | ||||||
| Equity futures | (562 | ) | (497 | ) | (798 | ) | (2,107 | ) | ||||||||
| Currency futures | 38 | (50 | ) | 15 | (62 | ) | ||||||||||
| Interest rate futures | (73 | ) | 130 | (142 | ) | 129 | ||||||||||
| Interest rate options | 11 | (21 | ) | 23 | 1 | |||||||||||
| Equity contracts | (41 | ) | 91 | (65 | ) | 76 | ||||||||||
| Foreign currency swaps | 128 | (110 | ) | (6 | ) | (186 | ) | |||||||||
| Foreign currency forwards | 10 | (21 | ) | 5 | (42 | ) | ||||||||||
| Forward contracts | 274 | (166 | ) | 710 | (174 | ) | ||||||||||
| Total investment income (loss) from derivatives in non-qualifying hedge accounting relationships | $ | 1,154 | $ | (4,295 | ) | $ | 3,036 | $ | (7,317 | ) | ||||||
Note 5 Insurance and Investment Contract Liabilities |
| (a) | Insurance and investment contracts |
The Company monitors experience and reviews the assumptions used in the calculation of insurance and investment contract liabilities on an ongoing basis to ensure they appropriately reflect future expected experience and any changes in the risk profile of the business. Any changes to the methods and assumptions used in projecting future asset and liability cash flows will result in a change in insurance and investment contract liabilities.
For the three months ended June 30, 2014, the impact of changes in assumptions and model enhancements resulted in an increase in reserves and decrease in shareholders’ pre-tax income of $40 (2013 – increase in reserves and decrease in shareholders’ pre-tax income of $56). For the six months ended June 30, 2014, the impact of changes in assumptions and model enhancements resulted in an increase in reserves and decrease in shareholder’s pre-tax income of $97 (2013 – increase in reserves and decrease in shareholders’ pre-tax income of $153).
Manulife Financial Corporation - Second Quarter 2014
43
The Company will be completing its annual review of actuarial methods and assumptions in the third quarter of 2014 as well as implement the Canadian Institute of Actuaries published guidance on the calibration criteria for fixed income funds with respect to the valuation of segregated fund guarantees. While the Company’s review is not complete, the impact could be up to an amount in the general range of the third quarter of 2013 charge for changes in actuarial methods and assumptions.
| (b) | Investment contracts – Fair value measurement |
Investment contract liabilities measured at fair value – As at June 30, 2014, the fair value of these liabilities was $646 (December 31, 2013 – $671).
Investment contract liabilities measured at amortized cost – The carrying value and the fair value of these liabilities were $1,818 and $1,943, respectively (December 31, 2013 – $1,853 and $1,896, respectively).
All investment contracts were categorized in Level 2 of the fair value hierarchy (December 31, 2013 – Level 2).
Note 6 Risk Management |
The Company’s risk management policies and procedures for managing risk related to financial instruments and insurance contracts can be found in note 10 of the Company’s 2013 Annual Consolidated Financial Statements as well as the shaded tables and text under the “Risk Management and Risk Factors” section of the Management Discussion and Analysis (“MD&A”) in the 2013 Annual Report.
| (a) | Risk disclosures included in the Second Quarter’s MD&A |
Market risk sensitivities related to variable annuity and segregated fund guarantees, publically traded equity performance risk and interest rate and spread risk are disclosed in sections D1 to D4 of the Second Quarter 2014 MD&A. The shaded tables and text of these disclosures are in accordance with IFRS 7 “Financial Instruments: Disclosures” and IAS 34 “Interim Financial Reporting”, and form an integral part of these Interim Consolidated Financial Statements.
| (b) | Credit risk |
| (i) | Credit quality |
The credit quality of commercial mortgages and private placements is assessed at least annually by using an internal rating based on regular monitoring of credit related exposures, considering both qualitative and quantitative factors.
The following table summarizes the credit quality and carrying value of commercial mortgages and private placements.
| As at June 30, 2014 | AAA | AA | A | BBB | BB | B and lower | Total | |||||||||||||||||||||||
| Commercial mortgages | ||||||||||||||||||||||||||||||
| Multi-family residential | $ | 1,147 | $ | 629 | $ | 925 | $ | 908 | $ | - | $ | - | $ | 3,609 | ||||||||||||||||
| Retail | 120 | 699 | 2,880 | 2,163 | 15 | 21 | 5,898 | |||||||||||||||||||||||
| Office | 68 | 679 | 2,188 | 2,300 | 201 | 108 | 5,544 | |||||||||||||||||||||||
| Industrial | 45 | 254 | 657 | 1,038 | 46 | 22 | 2,062 | |||||||||||||||||||||||
| Other | 535 | 198 | 466 | 849 | 42 | 2 | 2,092 | |||||||||||||||||||||||
| Total commercial mortgages | $ | 1,915 | $ | 2,459 | $ | 7,116 | $ | 7,258 | $ | 304 | $ | 153 | $ | 19,205 | ||||||||||||||||
| Agricultural mortgages | $ | - | $ | 178 | $ | 221 | $ | 483 | $ | 200 | $ | - | $ | 1,082 | ||||||||||||||||
| Private placements | 800 | 3,090 | 6,158 | 9,096 | 1,085 | 886 | 21,115 | |||||||||||||||||||||||
| Total | $ | 2,715 | $ | 5,727 | $ | 13,495 | $ | 16,837 | $ | 1,589 | $ | 1,039 | $ | 41,402 | ||||||||||||||||
| As at December 31, 2013 | ||||||||||||||||||||||||||||||
| Commercial mortgages | ||||||||||||||||||||||||||||||
| Multi-family residential | $ | 1,159 | $ | 594 | $ | 747 | $ | 1,033 | $ | - | $ | - | $ | 3,533 | ||||||||||||||||
| Retail | 136 | 704 | 2,744 | 2,277 | 29 | 11 | 5,901 | |||||||||||||||||||||||
| Office | 90 | 628 | 2,204 | 2,376 | 221 | 128 | 5,647 | |||||||||||||||||||||||
| Industrial | 52 | 269 | 645 | 1,059 | 55 | 23 | 2,103 | |||||||||||||||||||||||
| Other | 582 | 198 | 425 | 894 | 42 | 2 | 2,143 | |||||||||||||||||||||||
| Total commercial mortgages | $ | 2,019 | $ | 2,393 | $ | 6,765 | $ | 7,639 | $ | 347 | $ | 164 | $ | 19,327 | ||||||||||||||||
| Agricultural mortgages | $ | - | $ | 170 | $ | 253 | $ | 657 | $ | 153 | $ | - | $ | 1,233 | ||||||||||||||||
| Private placements | 791 | 3,200 | 5,845 | 8,949 | 1,112 | 1,118 | 21,015 | |||||||||||||||||||||||
| Total | $ | 2,810 | $ | 5,763 | $ | 12,863 | $ | 17,245 | $ | 1,612 | $ | 1,282 | $ | 41,575 |
The credit quality of residential mortgages and loans to bank clients is assessed at least annually using the key credit quality indicator of whether the loan is performing or non-performing.
Manulife Financial Corporation - Second Quarter 2014
44
The following table summarizes the carrying value of residential mortgages and loans to bank clients.
| As at | June 30, 2014 | December 31, 2013 | ||||||||||||||||||||||
| Insured | Uninsured | Total | Insured | Uninsured | Total | |||||||||||||||||||
| Residential mortgages | ||||||||||||||||||||||||
| Performing | $ | 8,989 | $ | 8,509 | $ | 17,498 | $ | 9,139 | $ | 7,828 | $ | 16,967 | ||||||||||||
Non-performing(1) | 14 | 7 | 21 | 17 | 14 | 31 | ||||||||||||||||||
Loans to bank clients (1) | ||||||||||||||||||||||||
| Performing | n/a | 1,811 | 1,811 | n/a | 1,901 | 1,901 | ||||||||||||||||||
| Total | $ | 9,003 | $ | 10,327 | $ | 19,330 | $ | 9,156 | $ | 9,743 | $ | 18,899 | ||||||||||||
| (1) | Non-performing refers to assets that are 90 days or more past due if uninsured and 365 days or more if insured. |
| (ii) | Past due or credit impaired financial assets |
The following table summarizes the carrying value or impaired value, in the case of impaired debt securities, of the Company’s financial assets that are considered past due or impaired.
| Past due but not impaired | ||||||||||||||||||||
| As at June 30, 2014 | Less than 90 days | 90 days and greater | Total | Total impaired | Allowance for loan losses | |||||||||||||||
| Debt securities | ||||||||||||||||||||
| FVTPL | $ | 39 | $ | - | $ | 39 | $ | 56 | $ | - | ||||||||||
| AFS | 8 | - | 8 | 24 | - | |||||||||||||||
| Private placements | 215 | 8 | 223 | 121 | 71 | |||||||||||||||
| Mortgages and loans to bank clients | 66 | 20 | 86 | 54 | 36 | |||||||||||||||
| Other financial assets | 25 | 21 | 46 | 1 | - | |||||||||||||||
| Total | $ | 353 | $ | 49 | $ | 402 | $ | 256 | $ | 107 | ||||||||||
| As at December 31, 2013 | ||||||||||||||||||||
| Debt securities | ||||||||||||||||||||
| FVTPL | $ | - | $ | - | $ | - | $ | 127 | $ | - | ||||||||||
| AFS | - | - | - | 12 | - | |||||||||||||||
| Private placements | 53 | - | 53 | 115 | 81 | |||||||||||||||
| Mortgages and loans to bank clients | 55 | 31 | 86 | 53 | 25 | |||||||||||||||
| Other financial assets | 7 | 31 | 38 | - | - | |||||||||||||||
| Total | $ | 115 | $ | 62 | $ | 177 | $ | 307 | $ | 106 | ||||||||||
| (c) | Securities lending, repurchase and reverse repurchase transactions |
As at June 30, 2014, the Company had loaned securities (which are included in invested assets) with a market value of $1,413 (December 31, 2013 – $1,422). The Company holds collateral with a current market value that exceeds the value of securities lent in all cases.
As at June 30, 2014, the Company had engaged in reverse repurchase transactions of $135 (December 31, 2013 – $6) which are recorded as short-term receivables. There were outstanding repurchase agreements of $156 as at June 30, 2014 (December 31, 2013 – $200) which are recorded as payables.
| (d) | Credit default swaps |
The Company replicates exposure to specific issuers by selling credit protection via credit default swaps (“CDSs”) in order to complement its cash debt securities investing. The Company will not write CDS protection in excess of its government bond holdings.
The following table provides details of the credit default swap protection sold by type of contract and external agency rating for the underlying reference security.
Manulife Financial Corporation - Second Quarter 2014
45
| As at June 30, 2014 | Notional Amount(2) | Fair Value | Weighted average maturity (in years)(3) | |||||||||
Single name CDSs(1) | ||||||||||||
| Corporate debt | ||||||||||||
| AAA | $ | 37 | $ | 1 | 3 | |||||||
| AA | 101 | 2 | 3 | |||||||||
| A | 198 | 5 | 3 | |||||||||
| BBB | 5 | - | 5 | |||||||||
| Total single name CDSs | $ | 341 | $ | 8 | 3 | |||||||
| Total CDS protection sold | $ | 341 | $ | 8 | 3 | |||||||
| As at December 31, 2013 | ||||||||||||
Single name CDSs(1) | ||||||||||||
| Corporate debt | ||||||||||||
| AAA | $ | 37 | $ | 1 | 3 | |||||||
| AA | 101 | 3 | 3 | |||||||||
| A | 197 | 5 | 3 | |||||||||
| Total single name CDSs | $ | 335 | $ | 9 | 3 | |||||||
| Total CDS protection sold | $ | 335 | $ | 9 | 3 | |||||||
| (1) | The ratings are based on S&P where available followed by Moody’s, DBRS and Fitch. If no rating is available from a rating agency, an internally developed rating is used. |
| (2) | Notional amounts represent the maximum future payments the Company would have to pay its counterparties assuming a default of the underlying credit and zero recovery on the underlying issuer obligation. |
| (3) | The weighted average maturity of the CDS is weighted based on notional amounts. |
The Company holds no purchased credit protection as at June 30, 2014 (December 31, 2013 – nil).
| (e) | Derivatives |
The Company’s point-in-time exposure to losses related to the credit risk of the counterparty of derivatives transactions is limited to the amount of any net gains that may have accrued with a particular counterparty. Gross derivative counterparty exposure is measured as the total fair value (including accrued interest) of all outstanding contracts in a gain position excluding any offsetting contracts in negative positions and the impact of collateral on hand. The Company seeks to limit the risk of credit losses from derivative counterparties by: establishing a minimum acceptable counterparty credit rating of A- from external rating agencies; entering into master netting arrangements which permit the offsetting of contracts in a loss position in the case of a counterparty default; and entering into Credit Support Annex agreements, whereby collateral must be provided when the exposure exceeds a certain threshold.
All contracts are held with counterparties rated A- or higher. As at June 30, 2014, the percentage of the Company’s derivative exposure which was with counterparties rated AA- or higher amounted to 13 per cent (December 31, 2013 – 12 per cent). As at June 30, 2014, the largest single counterparty exposure, without taking into account the impact of master netting agreements or the benefit of collateral held, was $2,149 (December 31, 2013 – $2,138). The net exposure to this counterparty, after taking into account master netting agreements and the fair value of collateral held, was $1 (December 31, 2013 – nil).
| (f) | Offsetting financial assets and financial liabilities |
Certain derivatives, securities lending and repurchase agreements have conditional offset rights. The Company does not offset these financial instruments in the Consolidated Statements of Financial Position, as the rights of offset are conditional. In the case of derivatives, collateral is collected from and pledged to counterparties and clearinghouses to manage credit risk exposure in accordance with Credit Support Annexes to swap agreements and clearing agreements. Under master netting agreements, the Company has a right of offset in the event of default, insolvency, bankruptcy or other early termination.
In the case of reverse repurchase and repurchase transactions, additional collateral may be collected from or pledged to counterparties to manage credit exposure according to bilateral reverse repurchase or repurchase agreements. In the event of default by a counterparty, the Company is entitled to liquidate the assets the Company holds as collateral to offset against obligations to the same counterparty.
The following table presents the effect of conditional master netting and similar arrangements. Similar arrangements may include global master repurchase agreements, global master securities lending agreements, and any related rights to financial collateral.
Manulife Financial Corporation - Second Quarter 2014
46
| Related amounts not set off in the Consolidated Statements of Financial Position | ||||||||||||||||||||
| As at June 30, 2014 | Gross amounts of financial instruments presented in the Consolidated Statements of Financial Position(1) | Amounts subject to an enforceable master netting arrangement or similar agreements | Financial and cash collateral pledged (received)(2) | Net amount including financing trusts(3) | Net amounts excluding financing trusts | |||||||||||||||
| Financial assets | ||||||||||||||||||||
| Derivative assets | $ | 12,506 | $ | (6,311 | ) | $ | (6,148 | ) | $ | 47 | $ | 47 | ||||||||
| Securities lending | 1,413 | - | (1,413 | ) | - | - | ||||||||||||||
| Reverse repurchase agreements | 135 | (68 | ) | (67 | ) | - | - | |||||||||||||
| Total financial assets | $ | 14,054 | $ | (6,379 | ) | $ | (7,628 | ) | $ | 47 | $ | 47 | ||||||||
| Financial liabilities | ||||||||||||||||||||
| Derivative liabilities | $ | (8,206 | ) | $ | 6,311 | $ | 1,690 | $ | (205 | ) | $ | (22 | ) | |||||||
| Repurchase agreements | (156 | ) | 68 | 88 | - | - | ||||||||||||||
| Total financial liabilities | $ | (8,362 | ) | $ | 6,379 | $ | 1,778 | $ | (205 | ) | $ | (22 | ) | |||||||
| As at December 31, 2013 | ||||||||||||||||||||
| Financial assets | ||||||||||||||||||||
| Derivative assets | $ | 10,021 | $ | (6,734 | ) | $ | (3,267 | ) | $ | 20 | $ | 20 | ||||||||
| Securities lending | 1,422 | - | (1,422 | ) | - | - | ||||||||||||||
| Reverse repurchase agreements | 6 | - | (6 | ) | - | - | ||||||||||||||
| Total financial assets | $ | 11,449 | $ | (6,734 | ) | $ | (4,695 | ) | $ | 20 | $ | 20 | ||||||||
| Financial liabilities | ||||||||||||||||||||
| Derivative liabilities | $ | (9,162 | ) | $ | 6,734 | $ | 2,250 | $ | (178 | ) | $ | (39 | ) | |||||||
| Repurchase agreements | (200 | ) | - | 200 | - | - | ||||||||||||||
| Total financial liabilities | $ | (9,362 | ) | $ | 6,734 | $ | 2,450 | $ | (178 | ) | $ | (39 | ) | |||||||
| (1) | The Company does not offset financial instruments. Financial assets and liabilities in the table above include accrued interest of $597 and $471, respectively (December 31, 2013 – $352 and $233, respectively). |
| (2) | Financial and cash collateral excludes over-collateralization. As at June 30, 2014 the Company was over-collateralized on OTC derivative assets, OTC derivative liabilities, securities lending and reverse repurchase agreements and repurchase agreements in the amounts of $221, $283, $74 and nil, respectively (December 31, 2013 – $390, $297, $75 and nil, respectively). As at June 30, 2014, collateral pledged (received) does not include collateral in transit on OTC instruments or include initial margin on exchange traded contracts. |
| (3) | The net amount includes derivative contracts entered into between the Company and its financing trusts which it does not consolidate. The Company does not exchange collateral on derivatives contracts entered into with these trusts. |
Note 7 Long-Term Debt |
| (a) | The following obligations are included in long-term debt |
| June 30, | December 31, | ||||||||||||
| As at | Maturity date | Par value | 2014 | 2013 | |||||||||
| 4.90% Senior notes | September 17, 2020 | US$500 | $ | 531 | $ | 529 | |||||||
| 7.768% Medium term notes | April 8, 2019 | $ | 600 | 598 | 598 | ||||||||
| 5.505% Medium term notes | June 26, 2018 | $ | 400 | 399 | 399 | ||||||||
| Promissory note to Manulife Finance (Delaware), L.P. ("MFLP") | December 15, 2016 | $ | 150 | 150 | 150 | ||||||||
| 3.40% Senior notes | September 17, 2015 | US$600 | 640 | 637 | |||||||||
| 4.079% Medium term notes | August 20, 2015 | $ | 900 | 899 | 899 | ||||||||
| 5.161% Medium term notes | June 26, 2015 | $ | 550 | 550 | 549 | ||||||||
4.896% Medium term notes(1) | June 2, 2014 | $ | 1,000 | - | 999 | ||||||||
| Other notes payable | n/a | n/a | 18 | 15 | |||||||||
| Total | $ | 3,785 | $ | 4,775 | |||||||||
| (1) | On June 2, 2014, MFC redeemed $1,000 of medium term notes which were issued on June 2, 2009. |
| (b) | Fair value measurement |
Long-term debt is measured at amortized cost in the Consolidated Statements of Financial Position. As at June 30, 2014, the fair value of long-term debt was $4,109 (December 31, 2013 - $5,105). Long- term debt was categorized in Level 2 of the fair value hierarchy (December 31, 2013 – Level 2).
Manulife Financial Corporation - Second Quarter 2014
47
Note 8 Liabilities for Preferred Shares and Capital Instruments |
| (a) | Carrying value of liabilities for preferred shares and capital instruments |
| June 30, | December 31, | |||||||||||||
| As at | Issuance date | Maturity date | Par value | 2014 | 2013 | |||||||||
| Senior debenture notes - 7.535% fixed/floating | July 10, 2009 | December 31, 2108 | $ | 1,000 | $ | 1,000 | $ | 1,000 | ||||||
| Subordinated note - floating | December 14, 2006 | December 15, 2036 | $ | 650 | 647 | 647 | ||||||||
Subordinated debentures - 2.811% fixed/floating(1) | February 21, 2014 | February 21, 2024 | $ | 500 | 498 | - | ||||||||
| Surplus notes - 7.375% U.S. dollar | February 25, 1994 | February 15, 2024 | US$450 | 502 | 501 | |||||||||
| Subordinated debentures - 2.926% fixed/floating | November 29, 2013 | November 29, 2023 | $ | 250 | 249 | 249 | ||||||||
| Subordinated debentures - 2.819% fixed/floating | February 25, 2013 | February 26, 2023 | $ | 200 | 199 | 199 | ||||||||
| Subordinated debentures - 4.165% fixed/floating | February 17, 2012 | June 1, 2022 | $ | 500 | 498 | 498 | ||||||||
Subordinated note - floating(2) | December 14, 2006 | December 15, 2021 | $ | 400 | 399 | 399 | ||||||||
| Subordinated debentures - 4.21% fixed/floating | November 18, 2011 | November 18, 2021 | $ | 550 | 548 | 548 | ||||||||
| Preferred shares - Class A Shares, Series 1 | June 19, 2003 | n/a | $ | 350 | 344 | 344 | ||||||||
| Total | $ | 4,884 | $ | 4,385 | ||||||||||
| (1) | On February 21, 2014, MLI issued $500 in subordinated fixed/floating debentures, which mature February 21, 2024. The debentures are guaranteed by MFC on a subordinated basis. The debentures bear interest at a fixed rate of 2.811% per annum, payable semi-annually for five years and thereafter at the 3-month Bankers’ Acceptance rate plus 0.80% payable quarterly. With regulatory approval, MLI may redeem the debentures, in whole or in part, on or after February 21, 2019, at par, together with accrued and unpaid interest. The subordinated debentures form part of the Company’s Tier 2B regulatory capital. |
| (2) | On March 28, 2014, the parties agreed to extend the maturity of the $400 subordinated note from January 15, 2019 to December 15, 2021. The extension resulted in an increase in the floating rate to 3-month Banker’s Acceptance rate plus 0.74% from 3-month Banker’s Acceptance rate plus 0.552%. |
| (b) | Fair value measurement |
The following table discloses fair value information categorized by the fair value hierarchy. These liabilities are measured at amortized cost in the Consolidated Statements of Financial Position.
| June 30, | December 31, | |||||||
| As at | 2014 | 2013 | ||||||
| Valuation hierarchy: | ||||||||
| Level 1 | $ | 359 | $ | 358 | ||||
| Level 2 | 4,950 | 4,367 | ||||||
| Total fair value | $ | 5,309 | $ | 4,725 | ||||
| (a) | Preferred shares |
The changes in issued and outstanding preferred shares are as follows.
| 2014 | 2013 | |||||||||||||||
| For the six months ended June 30, | Number of shares (in millions) | Amount | Number of shares (in millions) | Amount | ||||||||||||
| Balance, January 1 | 110 | $ | 2,693 | 102 | $ | 2,497 | ||||||||||
| Issued, Class 1 Shares, Series 13 | - | - | 8 | 200 | ||||||||||||
| Issued, Class 1 shares, Series 15 | 8 | 200 | - | - | ||||||||||||
Redeemed, Class A, Series 4(1) | (18 | ) | (450 | ) | - | - | ||||||||||
| Premium on redemption of preferred shares | - | 8 | - | - | ||||||||||||
| Issuance costs, net of tax | - | (5 | ) | - | (4 | ) | ||||||||||
| Balance, June 30 | 100 | $ | 2,446 | 110 | $ | 2,693 | ||||||||||
| (1) | On June 19, 2014, MFC redeemed in full the $450 of Class A Shares Series 4 at par. |
Manulife Financial Corporation - Second Quarter 2014
48
Further information on the preferred shares outstanding is as follows.
| As at June 30, 2014 | Issue date | Annual dividend rate | Earliest redemption date(1) | Number of shares (in millions) | Face amount | Net amount(2) | ||||||||||||
| Class A preferred shares | ||||||||||||||||||
| Series 2 | February 18, 2005 | 4.65 | % | March 19, 2010 | 14 | $ | 350 | $ | 344 | |||||||||
| Series 3 | January 3, 2006 | 4.50 | % | March 19, 2011 | 12 | 300 | 294 | |||||||||||
| Class 1 preferred shares | ||||||||||||||||||
| Series 1 | June 3, 2009 | 5.60 | % | September 19, 2014 | 14 | 350 | 342 | |||||||||||
| Series 3 | March 11, 2011 | 4.20 | % | June 19, 2016 | 8 | 200 | 196 | |||||||||||
| Series 5 | December 6, 2011 | 4.40 | % | December 19, 2016 | 8 | 200 | 195 | |||||||||||
| Series 7 | February 22, 2012 | 4.60 | % | March 19, 2017 | 10 | 250 | 244 | |||||||||||
| Series 9 | May 24, 2012 | 4.40 | % | September 19, 2017 | 10 | 250 | 244 | |||||||||||
| Series 11 | December 4, 2012 | 4.00 | % | March 19, 2018 | 8 | 200 | 196 | |||||||||||
| Series 13 | June 21, 2013 | 3.80 | % | September 19, 2018 | 8 | 200 | 196 | |||||||||||
Series 15(3) | February 25, 2014 | 3.90 | % | June 19, 2019 | 8 | 200 | 195 | |||||||||||
| Total | 100 | $ | 2,446 | |||||||||||||||
| (1) | Redemption of all preferred shares is subject to regulatory approval. With the exception of Class A Series 2 and Series 3 preferred shares, MFC may redeem each series in whole or in part at par, on the earliest redemption date or every five years thereafter. Class A Series 2 and Series 3 may be redeemed on or after the earliest redemption date in whole or in part for cash at declining premiums that range from $1.00 to nil per share. |
| (2) | Net of after-tax issuance costs. |
| (3) | On February 25, 2014, MFC issued eight million of Class 1 Shares Series 15 (“Class 1 Series 15 Preferred Shares”) at a price of $25 per share for an aggregate amount of $200. |
| (b) | Common shares |
As at June 30, 2014, there were 34 million outstanding stock options and deferred share units that entitle the holder to receive common shares or payment in cash or common shares, at the option of the holder (December 31, 2013 – 35 million).
| For the | six months ended | year ended | ||||||
| Number of common shares (in millions) | June 30, 2014 | December 31, 2013 | ||||||
| Balance, beginning of period | 1,848 | 1,828 | ||||||
| Issued on exercise of stock options and deferred share units | 2 | 1 | ||||||
| Issued under dividend reinvestment and share purchase plans | 8 | 19 | ||||||
| Balance, end of period | 1,858 | 1,848 | ||||||
The following is a reconciliation of the denominator (number of shares) in the calculation of basic and diluted earnings per share.
| three months ended | six months ended | |||||||||||||||
| For the | June 30, | June 30, | ||||||||||||||
| (in millions) | 2014 | 2013 | 2014 | 2013 | ||||||||||||
| Weighted average number of common shares | 1,854 | 1,834 | 1,852 | 1,831 | ||||||||||||
Dilutive stock-based awards(1) | 6 | 3 | 6 | 3 | ||||||||||||
Dilutive convertible instruments(2) | 18 | 23 | 18 | 24 | ||||||||||||
Weighted average number of diluted common shares(3) | 1,878 | 1,860 | 1,876 | 1,858 | ||||||||||||
| (1) | The dilutive effect of stock-based awards was calculated using the treasury stock method. This method calculates the number of incremental shares by assuming the outstanding stock-based awards are (i) exercised and (ii) then reduced by the number of shares assumed to be repurchased from the issuance proceeds, using the average market price of MFC common shares for the period. |
| (2) | The holders of the convertible preferred shares have the right to redeem these instruments for MFC shares prior to the conversion date. |
| (c) | Earnings per share |
| three months ended | six months ended | |||||||||||||||
| For the | June 30, | June 30, | ||||||||||||||
| 2014 | 2013 | 2014 | 2013 | |||||||||||||
| Basic earnings per common share | $ | 0.49 | $ | 0.12 | $ | 0.91 | $ | 0.40 | ||||||||
| Diluted earnings per common share | 0.49 | 0.12 | 0.91 | 0.40 | ||||||||||||
Manulife Financial Corporation - Second Quarter 2014
49
Note 10 Employee Future Benefits |
The Company maintains a number of pension plans, both defined benefit and defined contribution, and retiree welfare plans for eligible employees and agents. Information about the cost of the Company’s material pension and retiree welfare plans in the U.S. and Canada is as follows.
| Pension plans | Retiree welfare plans | |||||||||||||||
| For the three months ended June 30, | 2014 | 2013 | 2014 | 2013 | ||||||||||||
| Defined benefit current service cost | $ | 8 | $ | 8 | $ | - | $ | 1 | ||||||||
| Defined benefit administrative expenses | 1 | - | - | - | ||||||||||||
| Past service cost - plan amendments | - | - | - | 3 | ||||||||||||
| Past service cost - curtailments | - | 8 | - | - | ||||||||||||
| Service cost | $ | 9 | $ | 16 | $ | - | $ | 4 | ||||||||
| Interest on net defined benefit (asset) liability | 6 | 7 | 2 | 2 | ||||||||||||
| Defined benefit cost | $ | 15 | $ | 23 | $ | 2 | $ | 6 | ||||||||
| Defined contribution cost | 12 | 13 | - | - | ||||||||||||
| Net benefit cost | $ | 27 | $ | 36 | $ | 2 | $ | 6 | ||||||||
| For the six months ended June 30, | ||||||||||||||||
| Defined benefit current service cost | $ | 17 | $ | 17 | $ | 1 | $ | 2 | ||||||||
| Defined benefit administrative expenses | 2 | 2 | - | - | ||||||||||||
| Past service cost - plan amendments | - | - | - | 3 | ||||||||||||
| Past service cost - curtailments | - | 8 | - | - | ||||||||||||
| Service cost | $ | 19 | $ | 27 | $ | 1 | $ | 5 | ||||||||
| Interest on net defined benefit (asset) liability | 12 | 15 | 3 | 4 | ||||||||||||
| Defined benefit cost | $ | 31 | $ | 42 | $ | 4 | $ | 9 | ||||||||
| Defined contribution cost | 30 | 29 | - | - | ||||||||||||
| Net benefit cost | $ | 61 | $ | 71 | $ | 4 | $ | 9 | ||||||||
Note 11 Commitments and Contingencies |
| (a) | Legal proceedings |
The Company is regularly involved in legal actions, both as a defendant and as a plaintiff. The legal actions naming the Company as a defendant ordinarily involve its activities as a provider of insurance protection and wealth management products, as well as an investment adviser, employer and taxpayer. In addition, government and regulatory bodies in Canada, the United States, Asia and other jurisdictions where the Company conducts business regularly make inquiries and, from time to time, require the production of information or conduct examinations concerning the Company's compliance with, among other things, insurance laws, securities laws, and laws governing the activities of broker-dealers.
Two class actions against the Company have been certified and are pending in Quebec (on behalf of Quebec residents only) and Ontario (on behalf of investors in Canada, other than Quebec). The decisions to grant leave and certification have been of a procedural nature only and there has been no determination on the merits of either claim to date.
The actions in Ontario and Quebec are based on allegations that the Company failed to meet its disclosure obligations related to its exposure to market price risk in its segregated funds and variable annuity guaranteed products. The Company believes that its disclosure satisfied applicable disclosure requirements and intends to vigorously defend itself against any claims based on these allegations. Due to the nature and status of these proceedings, it is not practicable to provide an estimate of the financial effect of these proceedings, an indication of the uncertainties relating to the amount or timing of any outflow, nor the possibility of any reimbursement.
| (b) | Guarantees |
| (i) | Guarantees regarding Manulife Finance (Delaware), L.P. (“MFLP”) |
MFC has guaranteed the payment of amounts on the $550 senior debentures due on December 15, 2026 and the $650 subordinated debentures due on December 15, 2041 issued by MFLP, a wholly owned unconsolidated partnership.
| (ii) | Guarantees regarding The Manufacturers Life Insurance Company |
On January 29, 2007, MFC provided a subordinated guarantee of Class A and Class B Shares of MLI and any other class of preferred shares that rank on a parity with Class A Shares or Class B Shares of MLI. For the following subordinated debentures issued by MLI, MFC has provided a subordinated guarantee on the day of issuance: $550 issued on November 18, 2011, $500 issued on February 17, 2012, $200 issued on February 25, 2013, $250 issued on November 29, 2013 and $500 issued on February 21, 2014.
Manulife Financial Corporation - Second Quarter 2014
50
The following table sets forth certain condensed consolidating financial information for MFC and MFLP.The following table sets forth certain condensed consolidating financial information for MFC and MFLP.
| Condensed Consolidated Statement of Income Information | |||||||||||||||||||||||||
| For the three months ended June 30, 2014 | MFC (Guarantor) | MFLP | MLI consolidated | Other subsidiaries of MFC on a combined basis | Consolidating adjustments | Total consolidated amounts(1) | |||||||||||||||||||
| Total revenue | $ | 101 | $ | 11 | $ | 13,012 | $ | 1,103 | $ | (958 | ) | $ | 13,269 | ||||||||||||
| Net income (loss) attributed to shareholders | 943 | (2 | ) | 963 | (64 | ) | (897 | ) | 943 | ||||||||||||||||
| For the three months ended June 30, 2013 | |||||||||||||||||||||||||
| Total revenue | $ | 67 | $ | 26 | $ | (370 | ) | $ | (771 | ) | $ | 538 | $ | (510 | ) | ||||||||||
| Net income (loss) attributed to shareholders | 259 | 8 | 348 | (103 | ) | (253 | ) | 259 | |||||||||||||||||
| For the six months ended June 30, 2014 | |||||||||||||||||||||||||
| Total revenue | $ | 166 | $ | 32 | $ | 26,938 | $ | 2,385 | $ | (2,016 | ) | $ | 27,505 | ||||||||||||
| Net income (loss) attributed to shareholders | 1,761 | 2 | 1,734 | (31 | ) | (1,705 | ) | 1,761 | |||||||||||||||||
| For the six months ended June 30, 2013 | |||||||||||||||||||||||||
| Total revenue | $ | 120 | $ | 47 | $ | 5,377 | $ | (777 | ) | $ | 558 | $ | 5,325 | ||||||||||||
| Net income (loss) attributed to shareholders | 799 | 12 | 1,135 | (339 | ) | (808 | ) | 799 | |||||||||||||||||
| Condensed Consolidated Statement of Financial Position Information | |||||||||||||||||||||||||
| As at June 30, 2014 | MFC (Guarantor) | MFLP | MLI consolidated | Other subsidiaries of MFC on a combined basis | Consolidating adjustments | Total consolidated amounts(1) | |||||||||||||||||||
| Invested assets | $ | 49 | $ | 6 | $ | 240,120 | $ | 3,960 | $ | (6 | ) | $ | 244,129 | ||||||||||||
| Total other assets | 46,684 | 1,528 | 59,166 | 31,372 | (93,635 | ) | 45,115 | ||||||||||||||||||
| Segregated funds net assets | - | - | 247,186 | - | - | 247,186 | |||||||||||||||||||
| Insurance contract liabilities | - | - | 206,596 | 13,067 | (12,766 | ) | 206,897 | ||||||||||||||||||
| Investment contract liabilities | - | - | 2,464 | - | - | 2,464 | |||||||||||||||||||
| Segregated funds net liabilities | - | - | 247,186 | - | - | 247,186 | |||||||||||||||||||
| Total other liabilities | 16,562 | 1,362 | 54,589 | 21,319 | (44,729 | ) | 49,103 | ||||||||||||||||||
| As at December 31, 2013 | |||||||||||||||||||||||||
| Invested assets | $ | 28 | $ | 2 | $ | 228,933 | $ | 3,748 | $ | (2 | ) | $ | 232,709 | ||||||||||||
| Total other assets | 34,023 | 1,480 | 51,853 | 9,603 | (55,911 | ) | 41,048 | ||||||||||||||||||
| Segregated funds net assets | - | - | 239,871 | - | - | 239,871 | |||||||||||||||||||
| Insurance contract liabilities | - | - | 192,824 | 11,923 | (11,505 | ) | 193,242 | ||||||||||||||||||
| Investment contract liabilities | - | - | 2,524 | - | - | 2,524 | |||||||||||||||||||
| Segregated funds net liabilities | - | - | 239,871 | - | - | 239,871 | |||||||||||||||||||
| Total other liabilities | 5,528 | 1,313 | 52,078 | 461 | (10,422 | ) | 48,958 | ||||||||||||||||||
| (1) | Since MFLP is not consolidated into the results of MFC consolidated, the results of MFLP have been eliminated in the consolidating adjustments column. |
| (iii) | Guarantees regarding John Hancock Life Insurance Company (U.S.A.) |
Details of guarantees regarding certain securities issued or to be issued by John Hancock Life Insurance Company (U.S.A.) are outlined in note 14.
Note 12 Segmented Information |
The Company’s reporting segments are the Asia, Canadian and U.S. Divisions and the Corporate and Other segment. Each division has profit and loss responsibility and develops products, services and distribution strategies based on the profile of its business and the needs of its market. Revenue from the Company’s divisions is derived principally from life and health insurance, investment management and annuities and mutual funds. The Corporate and Other segment is comprised of the Investment Division’s external asset management business; earnings on assets backing capital, net of amounts allocated to operating divisions; changes in actuarial methods and assumptions; the property and casualty and run-off reinsurance operations; and other non-operating items.
Manulife Financial Corporation - Second Quarter 2014
51
By segment | ||||||||||||||||||||
| For the three months ended | Asia | Canadian | U.S. | Corporate | ||||||||||||||||
| June 30, 2014 | Division | Division | Division | and Other | Total | |||||||||||||||
| Revenue | ||||||||||||||||||||
| Premium income | ||||||||||||||||||||
| Life and health insurance | $ | 1,537 | $ | 827 | $ | 1,402 | $ | 20 | $ | 3,786 | ||||||||||
| Annuities and pensions | 117 | 109 | 220 | - | 446 | |||||||||||||||
| Net premium income | $ | 1,654 | $ | 936 | $ | 1,622 | $ | 20 | $ | 4,232 | ||||||||||
| Net investment income (loss) | 981 | 1,755 | 4,257 | (75 | ) | 6,918 | ||||||||||||||
| Other revenue | 290 | 644 | 1,140 | 45 | 2,119 | |||||||||||||||
| Total revenue | $ | 2,925 | $ | 3,335 | $ | 7,019 | $ | (10 | ) | $ | 13,269 | |||||||||
| Contract benefits and expenses | ||||||||||||||||||||
| Life and health insurance | $ | 1,849 | $ | 1,219 | $ | 3,633 | $ | 46 | $ | 6,747 | ||||||||||
| Annuities and pensions | 105 | 912 | 1,518 | - | 2,535 | |||||||||||||||
| Net benefits and claims (recovery) | $ | 1,954 | $ | 2,131 | $ | 5,151 | $ | 46 | $ | 9,282 | ||||||||||
| Interest expense | 22 | 87 | 12 | 123 | 244 | |||||||||||||||
| Other expenses | 549 | 821 | 1,069 | 93 | 2,532 | |||||||||||||||
| Total contract benefits and expenses | $ | 2,525 | $ | 3,039 | $ | 6,232 | $ | 262 | $ | 12,058 | ||||||||||
| Income (loss) before income taxes | $ | 400 | $ | 296 | $ | 787 | $ | (272 | ) | $ | 1,211 | |||||||||
| Income tax recovery (expense) | (32 | ) | (47 | ) | (228 | ) | 73 | (234 | ) | |||||||||||
| Net income (loss) | $ | 368 | $ | 249 | $ | 559 | $ | (199 | ) | $ | 977 | |||||||||
| Less net income (loss) attributed to: | ||||||||||||||||||||
| Non-controlling interests | 22 | - | - | 21 | 43 | |||||||||||||||
| Participating policyholders | 9 | (18 | ) | - | - | (9 | ) | |||||||||||||
| Net income (loss) attributed to shareholders | $ | 337 | $ | 267 | $ | 559 | $ | (220 | ) | $ | 943 | |||||||||
| For the three months ended | ||||||||||||||||||||
| June 30, 2013 | ||||||||||||||||||||
| Revenue | ||||||||||||||||||||
| Premium income | ||||||||||||||||||||
| Life and health insurance | $ | 1,382 | $ | 808 | $ | 1,470 | $ | 21 | $ | 3,681 | ||||||||||
| Annuities and pensions | 148 | 126 | 221 | - | 495 | |||||||||||||||
| Net premium income | $ | 1,530 | $ | 934 | $ | 1,691 | $ | 21 | $ | 4,176 | ||||||||||
| Net investment income (loss) | (966 | ) | (1,380 | ) | (4,068 | ) | (596 | ) | (7,010 | ) | ||||||||||
| Other revenue | 345 | 914 | 1,002 | 63 | 2,324 | |||||||||||||||
| Total revenue | $ | 909 | $ | 468 | $ | (1,375 | ) | $ | (512 | ) | $ | (510 | ) | |||||||
| Contract benefits and expenses | ||||||||||||||||||||
| Life and health insurance | $ | 24 | $ | (62 | ) | $ | (1,822 | ) | $ | 96 | $ | (1,764 | ) | |||||||
| Annuities and pensions | (51 | ) | (519 | ) | (1,128 | ) | - | (1,698 | ) | |||||||||||
| Net benefits and claims | $ | (27 | ) | $ | (581 | ) | $ | (2,950 | ) | $ | 96 | $ | (3,462 | ) | ||||||
| Interest expense | 19 | 130 | 11 | 148 | 308 | |||||||||||||||
| Other expenses | 513 | 774 | 983 | 169 | 2,439 | |||||||||||||||
| Total contract benefits and expenses | $ | 505 | $ | 323 | $ | (1,956 | ) | $ | 413 | $ | (715 | ) | ||||||||
| Income (loss) before income taxes | $ | 404 | $ | 145 | $ | 581 | $ | (925 | ) | $ | 205 | |||||||||
| Income tax recovery (expense) | (11 | ) | 1 | (152 | ) | 265 | 103 | |||||||||||||
| Net income (loss) | $ | 393 | $ | 146 | $ | 429 | $ | (660 | ) | $ | 308 | |||||||||
| Less net income (loss) attributed to: | ||||||||||||||||||||
| Non-controlling interests | 10 | - | - | (1 | ) | 9 | ||||||||||||||
| Participating policyholders | (3 | ) | 43 | - | - | 40 | ||||||||||||||
| Net income (loss) attributed to shareholders | $ | 386 | $ | 103 | $ | 429 | $ | (659 | ) | $ | 259 | |||||||||
Manulife Financial Corporation - Second Quarter 2014
52
By segment | ||||||||||||||||||||
| As at and for the six months ended | Asia | Canadian | U.S. | Corporate | ||||||||||||||||
| June 30, 2014 | Division | Division | Division | and Other | Total | |||||||||||||||
| Revenue | ||||||||||||||||||||
| Premium income | ||||||||||||||||||||
| Life and health insurance | $ | 3,104 | $ | 1,625 | $ | 2,713 | $ | 40 | $ | 7,482 | ||||||||||
| Annuities and pensions | 256 | 252 | 403 | - | 911 | |||||||||||||||
| Net premium income | $ | 3,360 | $ | 1,877 | $ | 3,116 | $ | 40 | $ | 8,393 | ||||||||||
| Net investment income (loss) | 1,575 | 4,031 | 9,392 | (140 | ) | 14,858 | ||||||||||||||
| Other revenue | 645 | 1,217 | 2,271 | 121 | 4,254 | |||||||||||||||
| Total revenue | $ | 5,580 | $ | 7,125 | $ | 14,779 | $ | 21 | $ | 27,505 | ||||||||||
| Contract benefits and expenses | ||||||||||||||||||||
| Life and health insurance | $ | 3,341 | $ | 2,850 | $ | 8,150 | $ | 122 | $ | 14,463 | ||||||||||
| Annuities and pensions | 433 | 1,669 | 3,150 | - | 5,252 | |||||||||||||||
| Net benefits and claims | $ | 3,774 | $ | 4,519 | $ | 11,300 | $ | 122 | $ | 19,715 | ||||||||||
| Interest expense | 44 | 221 | 26 | 247 | 538 | |||||||||||||||
| Other expenses | 1,082 | 1,642 | 2,149 | 231 | 5,104 | |||||||||||||||
| Total contract benefits and expenses | $ | 4,900 | $ | 6,382 | $ | 13,475 | $ | 600 | $ | 25,357 | ||||||||||
| Income (loss) before income taxes | $ | 680 | $ | 743 | $ | 1,304 | $ | (579 | ) | $ | 2,148 | |||||||||
| Income tax recovery (expense) | (57 | ) | (144 | ) | (342 | ) | 176 | (367 | ) | |||||||||||
| Net income (loss) | $ | 623 | $ | 599 | $ | 962 | $ | (403 | ) | $ | 1,781 | |||||||||
| Less net income (loss) attributed to: | ||||||||||||||||||||
| Non-controlling interests | 34 | - | - | 21 | 55 | |||||||||||||||
| Participating policyholders | 10 | (45 | ) | - | - | (35 | ) | |||||||||||||
| Net income (loss) attributed to shareholders | $ | 579 | $ | 644 | $ | 962 | $ | (424 | ) | $ | 1,761 | |||||||||
| Total assets | $ | 64,285 | $ | 143,587 | $ | 304,986 | $ | 23,572 | $ | 536,430 | ||||||||||
| As at and for the six months ended | ||||||||||||||||||||
| June 30, 2013 | ||||||||||||||||||||
| Revenue | ||||||||||||||||||||
| Premium income | ||||||||||||||||||||
| Life and health insurance | $ | 2,825 | $ | 1,582 | $ | 3,067 | $ | 44 | $ | 7,518 | ||||||||||
| Annuities and pensions | 297 | 278 | 500 | - | 1,075 | |||||||||||||||
| Net premium income | $ | 3,122 | $ | 1,860 | $ | 3,567 | $ | 44 | $ | 8,593 | ||||||||||
| Net investment income (loss) | 3 | (1,021 | ) | (5,017 | ) | (1,531 | ) | (7,566 | ) | |||||||||||
| Other revenue | 712 | 1,521 | 1,948 | 117 | 4,298 | |||||||||||||||
| Total revenue | $ | 3,837 | $ | 2,360 | $ | 498 | $ | (1,370 | ) | $ | 5,325 | |||||||||
| Contract benefits and expenses | ||||||||||||||||||||
| Life and health insurance | $ | 1,818 | $ | 1,184 | $ | (1,269 | ) | $ | 198 | $ | 1,931 | |||||||||
| Annuities and pensions | (427 | ) | (624 | ) | (1,785 | ) | - | (2,836 | ) | |||||||||||
| Net benefits and claims | $ | 1,391 | $ | 560 | $ | (3,054 | ) | $ | 198 | $ | (905 | ) | ||||||||
| Interest expense | 37 | 241 | 26 | 299 | 603 | |||||||||||||||
| Other expenses | 1,014 | 1,551 | 1,965 | 322 | 4,852 | |||||||||||||||
| Total contract benefits and expenses | $ | 2,442 | $ | 2,352 | $ | (1,063 | ) | $ | 819 | $ | 4,550 | |||||||||
| Income (loss) before income taxes | $ | 1,395 | $ | 8 | $ | 1,561 | $ | (2,189 | ) | $ | 775 | |||||||||
| Income tax recovery (expense) | (59 | ) | 78 | (406 | ) | 475 | 88 | |||||||||||||
| Net income (loss) | $ | 1,336 | $ | 86 | $ | 1,155 | $ | (1,714 | ) | $ | 863 | |||||||||
| Less net income (loss) attributed to: | ||||||||||||||||||||
| Non-controlling interests | 19 | - | - | (3 | ) | 16 | ||||||||||||||
| Participating policyholders | 3 | 45 | - | - | 48 | |||||||||||||||
| Net income (loss) attributed to shareholders | $ | 1,314 | $ | 41 | $ | 1,155 | $ | (1,711 | ) | $ | 799 | |||||||||
| Total assets | $ | 62,056 | $ | 130,589 | $ | 282,666 | $ | 22,932 | $ | 498,243 | ||||||||||
The results of the Company’s business segments differ from geographic segmentation primarily as a consequence of segmenting the results of the Company’s Corporate and Other segment into the different geographic segments to which its businesses pertain.
Manulife Financial Corporation - Second Quarter 2014
53
By geographic location | ||||||||||||||||||||
| For the three months ended | ||||||||||||||||||||
| June 30, 2014 | Asia | Canada | U.S. | Other | Total | |||||||||||||||
| Revenue | ||||||||||||||||||||
| Premium income | ||||||||||||||||||||
| Life and health insurance | $ | 1,553 | $ | 711 | $ | 1,402 | $ | 120 | $ | 3,786 | ||||||||||
| Annuities and pensions | 117 | 109 | 220 | - | 446 | |||||||||||||||
| Net premium income | $ | 1,670 | $ | 820 | $ | 1,622 | $ | 120 | $ | 4,232 | ||||||||||
| Net investment income (loss) | 964 | 1,770 | 4,062 | 122 | 6,918 | |||||||||||||||
| Other revenue | 298 | 636 | 1,185 | - | 2,119 | |||||||||||||||
| Total revenue | $ | 2,932 | $ | 3,226 | $ | 6,869 | $ | 242 | $ | 13,269 | ||||||||||
For the three months ended | ||||||||||||||||||||
| June 30, 2013 | ||||||||||||||||||||
| Revenue | ||||||||||||||||||||
| Premium income | ||||||||||||||||||||
| Life and health insurance | $ | 1,396 | $ | 686 | $ | 1,470 | $ | 129 | $ | 3,681 | ||||||||||
| Annuities and pensions | 148 | 126 | 221 | - | 495 | |||||||||||||||
| Net premium income | $ | 1,544 | $ | 812 | $ | 1,691 | $ | 129 | $ | 4,176 | ||||||||||
| Net investment income (loss) | (1,316 | ) | (1,323 | ) | (4,367 | ) | (4 | ) | (7,010 | ) | ||||||||||
| Other revenue | 345 | 893 | 1,059 | 27 | 2,324 | |||||||||||||||
| Total revenue | $ | 573 | $ | 382 | $ | (1,617 | ) | $ | 152 | $ | (510 | ) | ||||||||
| For the six months ended | ||||||||||||||||||||
| June 30, 2014 | ||||||||||||||||||||
| Revenue | ||||||||||||||||||||
| Premium income | ||||||||||||||||||||
| Life and health insurance | $ | 3,136 | $ | 1,387 | $ | 2,714 | $ | 245 | $ | 7,482 | ||||||||||
| Annuities and pensions | 256 | 252 | 403 | - | 911 | |||||||||||||||
| Net premium income | $ | 3,392 | $ | 1,639 | $ | 3,117 | $ | 245 | $ | 8,393 | ||||||||||
| Net investment income (loss) | 1,597 | 4,089 | 9,037 | 135 | 14,858 | |||||||||||||||
| Other revenue | 666 | 1,191 | 2,394 | 3 | 4,254 | |||||||||||||||
| Total revenue | $ | 5,655 | $ | 6,919 | $ | 14,548 | $ | 383 | $ | 27,505 | ||||||||||
For the six months ended | ||||||||||||||||||||
| June 30, 2013 | ||||||||||||||||||||
| Revenue | ||||||||||||||||||||
| Premium income | ||||||||||||||||||||
| Life and health insurance | $ | 2,854 | $ | 1,338 | $ | 3,068 | $ | 258 | $ | 7,518 | ||||||||||
| Annuities and pensions | 297 | 278 | 500 | - | 1,075 | |||||||||||||||
| Net premium income | $ | 3,151 | $ | 1,616 | $ | 3,568 | $ | 258 | $ | 8,593 | ||||||||||
| Net investment income (loss) | (996 | ) | (934 | ) | (5,642 | ) | 6 | (7,566 | ) | |||||||||||
| Other revenue | 708 | 1,490 | 2,071 | 29 | 4,298 | |||||||||||||||
| Total revenue | $ | 2,863 | $ | 2,172 | $ | (3 | ) | $ | 293 | $ | 5,325 | |||||||||
Note 13 Segregated Funds |
The Company manages a number of segregated funds on behalf of policyholders. Policyholders are provided the opportunity to invest in different categories of segregated funds that respectively hold a range of underlying investments.
The underlying investments of the segregated funds consist of both individual securities and mutual funds (collectively “net assets”). The carrying value and change in segregated funds net assets are as follows.
Manulife Financial Corporation - Second Quarter 2014
54
| (a) | Carrying value and change in segregated funds net assets are as follows: |
Segregated funds net assets
| As at | June 30, 2014 | December 31, 2013 | ||||||
| Investments at market value | ||||||||
| Cash and short-term securities | $ | 1,811 | $ | 2,540 | ||||
| Debt securities | 7,972 | 7,473 | ||||||
| Equities | 6,929 | 6,615 | ||||||
| Mutual funds | 228,211 | 220,936 | ||||||
| Other investments | 2,691 | 2,595 | ||||||
| Accrued investment income | 74 | 89 | ||||||
| Other liabilities, net | (319 | ) | (202 | ) | ||||
| Total segregated funds net assets | $ | 247,369 | $ | 240,046 | ||||
| Composition of segregated funds net assets | ||||||||
| Held by policyholders | $ | 247,186 | $ | 239,871 | ||||
| Held by Company (seed money reported in other invested assets) | 183 | 175 | ||||||
| Total segregated funds net assets | $ | 247,369 | $ | 240,046 | ||||
Changes in segregated funds net assets
| three months ended | six months ended | |||||||||||||||
| June 30, | June 30, | |||||||||||||||
| For the | 2014 | 2013 | 2014 | 2013 | ||||||||||||
| Net policyholder cash flow | ||||||||||||||||
| Deposits from policyholders | $ | 5,587 | $ | 5,516 | $ | 12,363 | $ | 11,983 | ||||||||
| Net transfers to general fund | (281 | ) | (176 | ) | (360 | ) | (261 | ) | ||||||||
| Payments to policyholders | (8,522 | ) | (7,136 | ) | (17,438 | ) | (13,970 | ) | ||||||||
| $ | (3,216 | ) | $ | (1,796 | ) | $ | (5,435 | ) | $ | (2,248 | ) | |||||
| Investment related | ||||||||||||||||
| Interest and dividends | $ | 505 | $ | 392 | $ | 1,002 | $ | 833 | ||||||||
| Net realized and unrealized investment gains (losses) | 7,678 | (285 | ) | 12,317 | 10,186 | |||||||||||
| $ | 8,183 | $ | 107 | $ | 13,319 | $ | 11,019 | |||||||||
| Other | ||||||||||||||||
| Management and administration fees | $ | (931 | ) | $ | (889 | ) | $ | (2,026 | ) | $ | (1,877 | ) | ||||
| Impact of changes in foreign exchange rates | (6,579 | ) | 5,130 | 1,465 | 20,620 | |||||||||||
| $ | (7,510 | ) | $ | 4,241 | $ | (561 | ) | $ | 18,743 | |||||||
| Net additions (deductions) | $ | (2,543 | ) | $ | 2,552 | $ | 7,323 | $ | 27,514 | |||||||
| Segregated funds net assets, beginning of period | 249,912 | 221,020 | 240,046 | 196,058 | ||||||||||||
| Segregated funds net assets, end of period | $ | 247,369 | $ | 223,572 | $ | 247,369 | $ | 223,572 | ||||||||
The net assets may be exposed to a variety of financial and other risks. These risks are primarily mitigated by investment guidelines that are actively monitored by professional and experienced portfolio advisors. Investment returns on these products belong to the policyholders; accordingly, the Company does not bear the risk associated with these assets outside of guarantees offered on certain variable life and annuity products.
The liabilities related to the guarantees associated with these products are recorded within the Company’s insurance contract liabilities. Assets supporting these guarantees are recognized in invested assets according to their investment type. For information regarding the risks associated with variable annuity and segregated fund guarantees see the “Risk Management and Risk Factors” section of the Company’s Second Quarter 2014 Management Discussion and Analysis.
| (b) | Fair value measurement |
The following table discloses the fair value of the segregated funds’ net assets categorized by hierarchy. The fair value and valuation hierarchy of the segregated funds’ net liabilities were the same as the segregated funds’ net assets.
| June 30, | December 31, | |||||||
| As at | 2014 | 2013 | ||||||
| Valuation hierarchy | ||||||||
| Level 1 | $ | 226,116 | $ | 219,538 | ||||
| Level 2 | 18,641 | 17,972 | ||||||
| Level 3 | 2,429 | 2,361 | ||||||
| Total fair value | $ | 247,186 | $ | 239,871 | ||||
Manulife Financial Corporation - Second Quarter 2014
55
Transfers of Level 1 and Level 2 segregated funds’ assets
The Company’s policy is to record transfers of segregated funds’ assets between Level 1 and Level 2 at their fair values as at the end of each reporting period, consistent with the date of the determination of fair value. Assets are transferred out of Level 1 when they are no longer transacted with sufficient frequency and volume in an active market. Conversely, assets are transferred from Level 2 to Level 1 when transaction volume and frequency are indicative of an active market. The Company had no transfers from Level 1 to Level 2 and from Level 2 to Level 1 for the three months and six months ended June 30, 2014 and June 30, 2013.
The following table presents a roll forward for the segregated funds net assets measured at fair value using significant unobservable inputs (Level 3).
| three months ended | six months ended | |||||||||||||||
| June 30, | June 30, | |||||||||||||||
| For the | 2014 | 2013 | 2014 | 2013 | ||||||||||||
| Balance at the beginning of the period | $ | 2,484 | $ | 2,244 | $ | 2,360 | $ | 2,212 | ||||||||
| Net realized / unrealized gains (losses) included in: | ||||||||||||||||
Net income(1) | 48 | (83 | ) | 25 | (85 | ) | ||||||||||
| OCI | - | - | - | - | ||||||||||||
| Purchases | 37 | 14 | 64 | 29 | ||||||||||||
| Sales | (55 | ) | (19 | ) | (84 | ) | (44 | ) | ||||||||
| Settlements | - | - | - | - | ||||||||||||
| Transfers | ||||||||||||||||
Into Level 3(2) | (1 | ) | - | 55 | (1 | ) | ||||||||||
Out of Level 3(2) | (1 | ) | 1 | (1 | ) | 1 | ||||||||||
| Currency movement | (83 | ) | 75 | 10 | 120 | |||||||||||
| Balance at the end of the period | $ | 2,429 | $ | 2,232 | $ | 2,429 | $ | 2,232 | ||||||||
| Change in unrealized gains (losses) on instruments still held | $ | 15 | $ | 61 | $ | 31 | $ | 66 | ||||||||
| (1) | This amount is included in the investment related section of the changes in net assets for segregated funds. |
| (2) | For assets that are transferred into and/or out of Level 3, the Company uses the fair value of the assets at the beginning of the period. Transfers into Level 3 occur when the inputs used to price the assets and liabilities lack observable market data (versus the previous period). Transfers out of Level 3 occur when the inputs used to price the assets and liabilities become available from observable market data. |
Manulife Financial Corporation - Second Quarter 2014
56
Note 14 Information Provided in Connection with Investments in Deferred Annuity Contracts and SignatureNotes Issued or Assumed by John Hancock Life Insurance Company (U.S.A.) |
The following condensed consolidating financial information, presented in accordance with IFRS, has been included in these Interim Consolidated Financial Statements with respect to John Hancock Life Insurance Company (U.S.A.) (“JHUSA”) in compliance with Regulation S-X and Rule 12h-5 of the United States Securities and Exchange Commission (the “Commission”). These financial statements are (i) incorporated by reference in the registration statements of MFC and JHUSA that relate to MFC’s guarantee of certain securities to be issued by JHUSA and (ii) are provided in reliance on an exemption from continuous disclosure obligations of JHUSA. For information about JHUSA, the MFC guarantees and restrictions on the ability of MFC to obtain funds from its subsidiaries by dividend or loan, refer to note 24 to the Company’s 2013 Annual Consolidated Financial Statements.
| Condensed Consolidating Statement of Financial Position | ||||||||||||||||||||
| As at June 30, 2014 | MFC (Guarantor) | JHUSA (Issuer) | Other Subsidiaries | Consolidation Adjustments | Consolidated MFC | |||||||||||||||
| Assets | ||||||||||||||||||||
| Invested assets | $ | 49 | $ | 93,082 | $ | 151,375 | $ | (377 | ) | $ | 244,129 | |||||||||
| Investments in unconsolidated subsidiaries | 36,032 | 4,818 | 23,878 | (64,728 | ) | - | ||||||||||||||
| Reinsurance assets | - | 28,422 | 6,611 | (17,413 | ) | 17,620 | ||||||||||||||
| Other assets | 10,652 | 21,770 | 39,274 | (44,201 | ) | 27,495 | ||||||||||||||
| Segregated funds net assets | - | 153,739 | 94,773 | (1,326 | ) | 247,186 | ||||||||||||||
| Total assets | $ | 46,733 | $ | 301,831 | $ | 315,911 | $ | (128,045 | ) | $ | 536,430 | |||||||||
| Liabilities and equity | ||||||||||||||||||||
| Insurance contract liabilities | $ | - | $ | 111,189 | $ | 113,794 | $ | (18,086 | ) | $ | 206,897 | |||||||||
| Investment contract liabilities and deposits | - | 1,394 | 1,075 | (5 | ) | 2,464 | ||||||||||||||
| Other liabilities | 12,601 | 20,586 | 50,547 | (43,300 | ) | 40,434 | ||||||||||||||
| Long-term debt | 3,617 | - | 18 | 150 | 3,785 | |||||||||||||||
| Liabilities for preferred shares and capital instruments | 344 | 1,080 | 14,145 | (10,685 | ) | 4,884 | ||||||||||||||
| Segregated funds net liabilities | - | 153,739 | 94,773 | (1,326 | ) | 247,186 | ||||||||||||||
| Shareholders' equity | 30,171 | 13,843 | 40,951 | (54,794 | ) | 30,171 | ||||||||||||||
| Participating policyholders' equity | - | - | 100 | - | 100 | |||||||||||||||
| Non-controlling interests | - | - | 508 | 1 | 509 | |||||||||||||||
| Total liabilities and equity | $ | 46,733 | $ | 301,831 | $ | 315,911 | $ | (128,045 | ) | $ | 536,430 | |||||||||
| Condensed Consolidating Statement of Financial Position | ||||||||||||||||||||
| As at December 31, 2013 | MFC (Guarantor) | JHUSA (Issuer) | Other Subsidiaries | Consolidation Adjustments | Consolidated MFC | |||||||||||||||
| Assets | ||||||||||||||||||||
| Invested assets | $ | 28 | $ | 89,552 | $ | 143,184 | $ | (55 | ) | $ | 232,709 | |||||||||
| Investments in unconsolidated subsidiaries | 33,831 | 4,561 | 13,269 | (51,661 | ) | - | ||||||||||||||
| Reinsurance assets | - | 25,891 | 6,454 | (14,902 | ) | 17,443 | ||||||||||||||
| Other assets | 192 | 19,258 | 23,547 | (19,392 | ) | 23,605 | ||||||||||||||
| Segregated funds net assets | - | 150,448 | 90,812 | (1,389 | ) | 239,871 | ||||||||||||||
| Total assets | $ | 34,051 | $ | 289,710 | $ | 277,266 | $ | (87,399 | ) | $ | 513,628 | |||||||||
| Liabilities and equity | ||||||||||||||||||||
| Insurance contract liabilities | $ | - | $ | 103,945 | $ | 104,847 | $ | (15,550 | ) | $ | 193,242 | |||||||||
| Investment contract liabilities and deposits | - | 1,444 | 1,085 | (5 | ) | 2,524 | ||||||||||||||
| Other liabilities | 574 | 19,561 | 37,974 | (18,311 | ) | 39,798 | ||||||||||||||
| Long-term debt | 4,610 | - | 15 | 150 | 4,775 | |||||||||||||||
| Liabilities for preferred shares and capital instruments | 344 | 1,077 | 3,645 | (681 | ) | 4,385 | ||||||||||||||
| Segregated funds net liabilities | - | 150,448 | 90,812 | (1,389 | ) | 239,871 | ||||||||||||||
| Shareholders' equity | 28,523 | 13,235 | 38,379 | (51,614 | ) | 28,523 | ||||||||||||||
| Participating policyholders' equity | - | - | 134 | - | 134 | |||||||||||||||
| Non-controlling interests | - | - | 375 | 1 | 376 | |||||||||||||||
| Total liabilities and equity | $ | 34,051 | $ | 289,710 | $ | 277,266 | $ | (87,399 | ) | $ | 513,628 | |||||||||
Manulife Financial Corporation - Second Quarter 2014
57
| Condensed Consolidating Statement of Income | ||||||||||||||||||||
| For the three months ended | MFC (Guarantor) | JHUSA (Issuer) | Other Subsidiaries | Consolidation Adjustments | Consolidated MFC | |||||||||||||||
| June 30, 2014 | ||||||||||||||||||||
| Revenue | ||||||||||||||||||||
| Net premium income | $ | - | $ | 1,232 | $ | 3,000 | $ | - | $ | 4,232 | ||||||||||
| Net investment income (loss) | 97 | 3,372 | 3,765 | (316 | ) | 6,918 | ||||||||||||||
| Net other revenue | 4 | 599 | 3,014 | (1,498 | ) | 2,119 | ||||||||||||||
| Total revenue | $ | 101 | $ | 5,203 | $ | 9,779 | $ | (1,814 | ) | $ | 13,269 | |||||||||
| Policy benefits and expenses | ||||||||||||||||||||
| Net benefits and claims | $ | - | $ | 4,333 | $ | 5,982 | $ | (1,033 | ) | $ | 9,282 | |||||||||
| Commissions, investment and general expenses | 4 | 669 | 2,273 | (481 | ) | 2,465 | ||||||||||||||
| Other expenses | 67 | 61 | 483 | (300 | ) | 311 | ||||||||||||||
| Total policy benefits and expenses | $ | 71 | $ | 5,063 | $ | 8,738 | $ | (1,814 | ) | $ | 12,058 | |||||||||
| Income (loss) before income taxes | $ | 30 | $ | 140 | $ | 1,041 | $ | - | $ | 1,211 | ||||||||||
| Income tax (expense) recovery | (9 | ) | 32 | (257 | ) | - | (234 | ) | ||||||||||||
| Income (loss) after income taxes | $ | 21 | $ | 172 | $ | 784 | $ | - | $ | 977 | ||||||||||
| Equity in net income (loss) of unconsolidated subsidiaries | 922 | 173 | 345 | (1,440 | ) | - | ||||||||||||||
| Net income (loss) | $ | 943 | $ | 345 | $ | 1,129 | $ | (1,440 | ) | $ | 977 | |||||||||
| Net income (loss) attributed to: | ||||||||||||||||||||
| Non-controlling interests | $ | - | $ | - | $ | 43 | $ | - | $ | 43 | ||||||||||
| Participating policyholders | - | (15 | ) | (9 | ) | 15 | (9 | ) | ||||||||||||
| Shareholders | 943 | 360 | 1,095 | (1,455 | ) | 943 | ||||||||||||||
| $ | 943 | $ | 345 | $ | 1,129 | $ | (1,440 | ) | $ | 977 | ||||||||||
Condensed Consolidating Statement of Income | ||||||||||||||||||||
| For the three months ended | MFC (Guarantor) | JHUSA (Issuer) | Other Subsidiaries | Consolidation Adjustments | Consolidated MFC | |||||||||||||||
| June 30, 2013 | ||||||||||||||||||||
| Revenue | ||||||||||||||||||||
| Net premium income | $ | - | $ | 1,196 | $ | 2,847 | $ | 133 | $ | 4,176 | ||||||||||
| Net investment income (loss) | 70 | (3,400 | ) | (3,353 | ) | (327 | ) | (7,010 | ) | |||||||||||
| Net other revenue | (3 | ) | 274 | 804 | 1,249 | 2,324 | ||||||||||||||
| Total revenue | $ | 67 | $ | (1,930 | ) | $ | 298 | $ | 1,055 | $ | (510 | ) | ||||||||
| Policy benefits and expenses | ||||||||||||||||||||
| Net benefits and claims | $ | - | $ | (2,781 | ) | $ | (2,390 | ) | $ | 1,709 | $ | (3,462 | ) | |||||||
| Commissions, investment and general expenses | 3 | 688 | 1,971 | (315 | ) | 2,347 | ||||||||||||||
| Other expenses | 68 | 90 | 581 | (339 | ) | 400 | ||||||||||||||
| Total policy benefits and expenses | $ | 71 | $ | (2,003 | ) | $ | 162 | $ | 1,055 | $ | (715 | ) | ||||||||
| Income (loss) before income taxes | $ | (4 | ) | $ | 73 | $ | 136 | $ | - | $ | 205 | |||||||||
| Income tax (expense) recovery | - | 15 | 88 | - | 103 | |||||||||||||||
| Income (loss) after income taxes | $ | (4 | ) | $ | 88 | $ | 224 | $ | - | $ | 308 | |||||||||
| Equity in net income (loss) of unconsolidated subsidiaries | 263 | 57 | 145 | (465 | ) | - | ||||||||||||||
| Net income (loss) | $ | 259 | $ | 145 | $ | 369 | $ | (465 | ) | $ | 308 | |||||||||
| Net income (loss) attributed to: | ||||||||||||||||||||
| Non-controlling interests | $ | - | $ | - | $ | 9 | $ | - | $ | 9 | ||||||||||
| Participating policyholders | - | 8 | 40 | (8 | ) | 40 | ||||||||||||||
| Shareholders | 259 | 137 | 320 | (457 | ) | 259 | ||||||||||||||
| $ | 259 | $ | 145 | $ | 369 | $ | (465 | ) | $ | 308 | ||||||||||
Manulife Financial Corporation - Second Quarter 2014
58
Condensed Consolidating Statement of Income | ||||||||||||||||||||
| For the six months ended | MFC (Guarantor) | JHUSA (Issuer) | Other Subsidiaries | Consolidation Adjustments | Consolidated MFC | |||||||||||||||
| June 30, 2014 | ||||||||||||||||||||
| Revenue | ||||||||||||||||||||
| Net premium income | $ | - | $ | 2,378 | $ | 6,015 | $ | - | $ | 8,393 | ||||||||||
| Net investment income (loss) | 165 | 7,513 | 7,729 | (549 | ) | 14,858 | ||||||||||||||
| Net other revenue | 1 | 1,169 | 6,406 | (3,322 | ) | 4,254 | ||||||||||||||
| Total revenue | $ | 166 | $ | 11,060 | $ | 20,150 | $ | (3,871 | ) | $ | 27,505 | |||||||||
| Policy benefits and expenses | ||||||||||||||||||||
| Net benefits and claims | $ | - | $ | 9,372 | $ | 12,793 | $ | (2,450 | ) | $ | 19,715 | |||||||||
| Commissions, investment and general expenses | 8 | 1,355 | 4,489 | (887 | ) | 4,965 | ||||||||||||||
| Other expenses | 138 | 125 | 948 | (534 | ) | 677 | ||||||||||||||
| Total policy benefits and expenses | $ | 146 | $ | 10,852 | $ | 18,230 | $ | (3,871 | ) | $ | 25,357 | |||||||||
| Income (loss) before income taxes | $ | 20 | $ | 208 | $ | 1,920 | $ | - | $ | 2,148 | ||||||||||
| Income tax (expense) recovery | (7 | ) | 83 | (443 | ) | - | (367 | ) | ||||||||||||
| Income (loss) after income taxes | $ | 13 | $ | 291 | $ | 1,477 | $ | - | $ | 1,781 | ||||||||||
| Equity in net income (loss) of unconsolidated subsidiaries | 1,748 | 264 | 555 | (2,567 | ) | - | ||||||||||||||
| Net income (loss) | $ | 1,761 | $ | 555 | $ | 2,032 | $ | (2,567 | ) | $ | 1,781 | |||||||||
| Net income (loss) attributed to: | ||||||||||||||||||||
| Non-controlling interests | $ | - | $ | - | $ | 55 | $ | - | $ | 55 | ||||||||||
| Participating policyholders | - | (32 | ) | (35 | ) | 32 | (35 | ) | ||||||||||||
| Shareholders | 1,761 | 587 | 2,012 | (2,599 | ) | 1,761 | ||||||||||||||
| $ | 1,761 | $ | 555 | $ | 2,032 | $ | (2,567 | ) | $ | 1,781 | ||||||||||
| Condensed Consolidating Statement of Income | ||||||||||||||||||||
| For the six months ended | MFC (Guarantor) | JHUSA (Issuer) | Other Subsidiaries | Consolidation Adjustments | Consolidated MFC | |||||||||||||||
| June 30, 2013 | ||||||||||||||||||||
| Revenue | ||||||||||||||||||||
| Net premium income | $ | - | $ | 2,495 | $ | 5,965 | $ | 133 | $ | 8,593 | ||||||||||
| Net investment income (loss) | 125 | (4,506 | ) | (2,569 | ) | (616 | ) | (7,566 | ) | |||||||||||
| Net other revenue | (5 | ) | 683 | 1,725 | 1,895 | 4,298 | ||||||||||||||
| Total revenue | $ | 120 | $ | (1,328 | ) | $ | 5,121 | $ | 1,412 | $ | 5,325 | |||||||||
| Policy benefits and expenses | ||||||||||||||||||||
| Net benefits and claims | $ | - | $ | (3,448 | ) | $ | (114 | ) | $ | 2,657 | $ | (905 | ) | |||||||
| Commissions, investment and general expenses | 16 | 1,368 | 3,924 | (620 | ) | 4,688 | ||||||||||||||
| Other expenses | 141 | 179 | 1,072 | (625 | ) | 767 | ||||||||||||||
| Total policy benefits and expenses | $ | 157 | $ | (1,901 | ) | $ | 4,882 | $ | 1,412 | $ | 4,550 | |||||||||
| Income (loss) before income taxes | $ | (37 | ) | $ | 573 | $ | 239 | $ | - | $ | 775 | |||||||||
| Income tax (expense) recovery | 9 | (68 | ) | 147 | - | 88 | ||||||||||||||
| Income (loss) after income taxes | $ | (28 | ) | $ | 505 | $ | 386 | $ | - | $ | 863 | |||||||||
| Equity in net income (loss) of unconsolidated subsidiaries | 827 | 163 | 668 | (1,658 | ) | - | ||||||||||||||
| Net income (loss) | $ | 799 | $ | 668 | $ | 1,054 | $ | (1,658 | ) | $ | 863 | |||||||||
| Net income (loss) attributed to: | ||||||||||||||||||||
| Non-controlling interests | $ | - | $ | - | $ | 17 | $ | (1 | ) | $ | 16 | |||||||||
| Participating policyholders | - | 4 | 46 | (2 | ) | 48 | ||||||||||||||
| Shareholders | 799 | 664 | 991 | (1,655 | ) | 799 | ||||||||||||||
| $ | 799 | $ | 668 | $ | 1,054 | $ | (1,658 | ) | $ | 863 | ||||||||||
Manulife Financial Corporation - Second Quarter 2014
59
Consolidating Statement of Cash Flows | ||||||||||||||||||||
| For the six months ended June 30, 2014 | MFC (Guarantor) | JHUSA (Issuer) | Other Subsidiaries | Consolidation Adjustments | Consolidated MFC | |||||||||||||||
| Operating activities | ||||||||||||||||||||
| Net income (loss) | $ | 1,761 | $ | 555 | $ | 2,032 | $ | (2,567 | ) | $ | 1,781 | |||||||||
| Adjustments for non-cash items in net income (loss) | ||||||||||||||||||||
| Equity in net income of unconsolidated subsidiaries | (1,748 | ) | (264 | ) | (555 | ) | 2,567 | - | ||||||||||||
| Increase (decrease) in insurance contract liabilities | - | 6,731 | 6,447 | - | 13,178 | |||||||||||||||
| Increase (decrease) in investment contract liabilities | - | 26 | 14 | - | 40 | |||||||||||||||
| (Increase) decrease in reinsurance assets | - | (2,541 | ) | 2,416 | - | (125 | ) | |||||||||||||
| Amortization of (premium) discount on invested assets | - | 15 | (6 | ) | - | 9 | ||||||||||||||
| Other amortization | 2 | 50 | 170 | - | 222 | |||||||||||||||
| Net realized and unrealized (gains) losses on assets | 2 | (5,146 | ) | (4,763 | ) | - | (9,907 | ) | ||||||||||||
| Deferred income tax expense (recovery) | 2 | 75 | 182 | - | 259 | |||||||||||||||
| Stock option expense | - | (2 | ) | 11 | - | 9 | ||||||||||||||
| Net income (loss) adjusted for non-cash items | $ | 19 | $ | (501 | ) | $ | 5,948 | $ | - | $ | 5,466 | |||||||||
| Changes in policy related and operating receivables and payables | (166 | ) | 751 | (1,770 | ) | - | (1,185 | ) | ||||||||||||
| Cash provided by (used in) operating activities | $ | (147 | ) | $ | 250 | $ | 4,178 | $ | - | $ | 4,281 | |||||||||
| Investing activities | ||||||||||||||||||||
| Purchases and mortgage advances | $ | - | $ | (12,942 | ) | $ | (18,283 | ) | $ | - | $ | (31,225 | ) | |||||||
| Disposals and repayments | - | 12,608 | 16,016 | - | 28,624 | |||||||||||||||
| Changes in investment broker net receivables and payables | - | 44 | 372 | - | 416 | |||||||||||||||
| Net cash decrease from purchase of subsidiary | - | - | (199 | ) | - | (199 | ) | |||||||||||||
| Capital contribution to unconsolidated subsidiaries | - | (22 | ) | - | 22 | - | ||||||||||||||
| Return of capital from unconsolidated subsidiaries | - | 56 | - | (56 | ) | - | ||||||||||||||
| Notes receivable from parent | - | - | (12,242 | ) | 12,242 | - | ||||||||||||||
| Notes receivable from subsidiaries | (10,460 | ) | (2 | ) | - | 10,462 | - | |||||||||||||
| Cash provided by (used in) by investing activities | $ | (10,460 | ) | $ | (258 | ) | $ | (14,336 | ) | $ | 22,670 | $ | (2,384 | ) | ||||||
| Financing activities | ||||||||||||||||||||
Increase (decrease) in repurchase agreements and securities sold but not yet purchased | $ | - | $ | 40 | $ | (90 | ) | $ | - | $ | (50 | ) | ||||||||
| Reinsurance treaty settlement | - | (39 | ) | 39 | - | - | ||||||||||||||
| Repayment of long-term debt | (1,000 | ) | - | - | - | (1,000 | ) | |||||||||||||
| Issue of capital instruments, net | - | - | 497 | - | 497 | |||||||||||||||
| Net redemption of investment contract liabilities | - | (81 | ) | (29 | ) | - | (110 | ) | ||||||||||||
| Funds repaid, net | - | (1 | ) | (1 | ) | - | (2 | ) | ||||||||||||
| Changes in deposits from bank clients, net | - | - | (184 | ) | - | (184 | ) | |||||||||||||
| Shareholder dividends paid in cash | (382 | ) | - | - | - | (382 | ) | |||||||||||||
| Contributions from (distributions to) non-controlling interests, net | - | - | 5 | - | 5 | |||||||||||||||
| Common shares issued, net | 24 | - | 2 | - | 26 | |||||||||||||||
| Preferred shares issues, net | (255 | ) | - | 450 | - | 195 | ||||||||||||||
| Gain (loss) on intercompany transaction | - | (7 | ) | 7 | - | - | ||||||||||||||
| Capital contributions by parent | - | - | 22 | (22 | ) | - | ||||||||||||||
| Return of capital to parent | - | - | (56 | ) | 56 | - | ||||||||||||||
| Notes payable to parent | - | - | 10,462 | (10,462 | ) | - | ||||||||||||||
| Notes payable to subsidiaries | 12,242 | - | - | (12,242 | ) | - | ||||||||||||||
| Preferred shares redeemed, net | - | - | (450 | ) | - | (450 | ) | |||||||||||||
| Cash provided by (used in) financing activities | $ | 10,629 | $ | (88 | ) | $ | 10,674 | $ | (22,670 | ) | $ | (1,455 | ) | |||||||
| Cash and short-term securities | ||||||||||||||||||||
| Increase (decrease) during the period | $ | 22 | $ | (96 | ) | $ | 516 | $ | - | $ | 442 | |||||||||
| Effect of foreign exchange rate changes on cash and short-term securities | - | 14 | 57 | - | 71 | |||||||||||||||
| Balance, beginning of period | 27 | 3,643 | 9,216 | - | 12,886 | |||||||||||||||
| Balance, end of period | $ | 49 | $ | 3,561 | $ | 9,789 | $ | - | $ | 13,399 | ||||||||||
| Cash and short-term securities | ||||||||||||||||||||
| Beginning of period | ||||||||||||||||||||
| Gross cash and short-term securities | $ | 28 | $ | 4,091 | $ | 9,511 | $ | - | $ | 13,630 | ||||||||||
| Net payments in transit, included in other liabilities | (1 | ) | (448 | ) | (295 | ) | - | (744 | ) | |||||||||||
| Net cash and short-term securities, beginning of period | $ | 27 | $ | 3,643 | $ | 9,216 | $ | - | $ | 12,886 | ||||||||||
| End of period | ||||||||||||||||||||
| Gross cash and short-term securities | $ | 49 | $ | 3,932 | $ | 10,061 | $ | - | $ | 14,042 | ||||||||||
| Net payments in transit, included in other liabilities | - | (371 | ) | (272 | ) | - | (643 | ) | ||||||||||||
| Net cash and short-term securities, end of period | $ | 49 | $ | 3,561 | $ | 9,789 | $ | - | $ | 13,399 | ||||||||||
| Supplemental disclosures on cash flow information: | ||||||||||||||||||||
| Interest received | $ | - | $ | 2,059 | $ | 2,389 | $ | (8 | ) | $ | 4,440 | |||||||||
| Interest paid | 146 | 74 | 664 | (362 | ) | 522 | ||||||||||||||
| Income taxes paid | - | 327 | 381 | - | 708 | |||||||||||||||
Manulife Financial Corporation - Second Quarter 2014
60
Consolidating Statement of Cash Flows | ||||||||||||||||||||
| For the six months ended June 30, 2013 | MFC (Guarantor) | JHUSA (Issuer) | Other Subsidiaries | Consolidation Adjustments | Consolidated MFC | |||||||||||||||
| Operating activities | ||||||||||||||||||||
| Net income (loss) | $ | 799 | $ | 668 | $ | 1,054 | $ | (1,658 | ) | $ | 863 | |||||||||
| Adjustments for non-cash items in net income (loss) | ||||||||||||||||||||
| Equity in net income of unconsolidated subsidiaries | (827 | ) | (163 | ) | (668 | ) | 1,658 | - | ||||||||||||
| Increase (decrease) in insurance contract liabilities | - | (6,544 | ) | (1,325 | ) | - | (7,869 | ) | ||||||||||||
| Increase (decrease) in investment contract liabilities | - | 27 | 42 | - | 69 | |||||||||||||||
| (Increase) decrease in reinsurance assets | - | 2,286 | (1,668 | ) | - | 618 | ||||||||||||||
| Amortization of (premium) discount on invested assets | - | 1 | 13 | - | 14 | |||||||||||||||
| Other amortization | - | 45 | 160 | - | 205 | |||||||||||||||
| Net realized and unrealized (gains) losses on assets | 4 | 6,607 | 5,874 | - | 12,485 | |||||||||||||||
| Deferred income tax expense (recovery) | (9 | ) | 189 | (502 | ) | - | (322 | ) | ||||||||||||
| Stock option expense | - | 2 | 8 | - | 10 | |||||||||||||||
| Net income (loss) adjusted for non-cash items | $ | (33 | ) | $ | 3,118 | $ | 2,988 | $ | - | $ | 6,073 | |||||||||
| Changes in policy related and operating receivables and payables | (115 | ) | (2,223 | ) | 1,948 | - | (390 | ) | ||||||||||||
| Cash provided by (used in) operating activities | $ | (148 | ) | $ | 895 | $ | 4,936 | $ | - | $ | 5,683 | |||||||||
| Investing activities | ||||||||||||||||||||
| Purchases and mortgage advances | $ | - | $ | (7,948 | ) | $ | (22,992 | ) | $ | - | $ | (30,940 | ) | |||||||
| Disposals and repayments | - | 7,548 | 18,422 | - | 25,970 | |||||||||||||||
| Changes in investment broker net receivables and payables | - | 8 | (124 | ) | - | (116 | ) | |||||||||||||
| Net cash decrease from purchase of subsidiary | - | - | (73 | ) | - | (73 | ) | |||||||||||||
| Redemption of preferred shares of subsidiaries | 80 | - | - | (80 | ) | - | ||||||||||||||
| Capital contribution to unconsolidated subsidiaries | - | (92 | ) | - | 92 | - | ||||||||||||||
| Return of capital from unconsolidated subsidiaries | - | 199 | - | (199 | ) | - | ||||||||||||||
| Notes receivable from parent | - | - | (10,800 | ) | 10,800 | - | ||||||||||||||
| Notes receivable from subsidiaries | (10,163 | ) | 3 | - | 10,160 | - | ||||||||||||||
| Cash provided by (used in) investing activities | $ | (10,083 | ) | $ | (282 | ) | $ | (15,567 | ) | $ | 20,773 | $ | (5,159 | ) | ||||||
| Financing activities | ||||||||||||||||||||
Increase (decrease) in repurchase agreements and securities sold but not yet purchased | $ | - | $ | (459 | ) | $ | 317 | $ | - | $ | (142 | ) | ||||||||
| Repayment of long-term debt | (350 | ) | - | - | - | (350 | ) | |||||||||||||
| Issue of capital instruments, net | - | - | 199 | - | 199 | |||||||||||||||
| Net redemption of investment contract liabilities | - | (25 | ) | (55 | ) | - | (80 | ) | ||||||||||||
| Funds repaid, net | - | (1 | ) | (117 | ) | - | (118 | ) | ||||||||||||
| Changes in deposits from bank clients, net | - | - | (35 | ) | - | (35 | ) | |||||||||||||
| Shareholder dividends paid in cash | (385 | ) | - | - | - | (385 | ) | |||||||||||||
| Contributions from (distributions to) non-controlling interests, net | - | - | (37 | ) | - | (37 | ) | |||||||||||||
| Common shares issued, net | 2 | - | - | - | 2 | |||||||||||||||
| Preferred shares issues, net | 196 | - | (80 | ) | 80 | 196 | ||||||||||||||
| Capital contributions by parent | - | - | 92 | (92 | ) | - | ||||||||||||||
| Return of capital to parent | - | - | (199 | ) | 199 | - | ||||||||||||||
| Notes payable to parent | - | - | 10,160 | (10,160 | ) | - | ||||||||||||||
| Notes payable to subsidiaries | 10,800 | - | - | (10,800 | ) | - | ||||||||||||||
| Cash provided by (used in) financing activities | $ | 10,263 | $ | (485 | ) | $ | 10,245 | $ | (20,773 | ) | $ | (750 | ) | |||||||
| Cash and short-term securities | ||||||||||||||||||||
| Increase (decrease) during the period | $ | 32 | $ | 128 | $ | (386 | ) | $ | - | $ | (226 | ) | ||||||||
| Effect of foreign exchange rate changes on cash and short-term securities | 1 | 211 | 173 | - | 385 | |||||||||||||||
| Balance, beginning of period | 22 | 3,747 | 8,984 | - | 12,753 | |||||||||||||||
| Balance, end of period | $ | 55 | $ | 4,086 | $ | 8,771 | $ | - | $ | 12,912 | ||||||||||
| Cash and short-term securities | ||||||||||||||||||||
| Beginning of period | ||||||||||||||||||||
| Gross cash and short-term securities | $ | 22 | $ | 4,122 | $ | 9,242 | $ | - | $ | 13,386 | ||||||||||
| Net payments in transit, included in other liabilities | - | (375 | ) | (258 | ) | - | (633 | ) | ||||||||||||
| Net cash and short-term securities, beginning of period | $ | 22 | $ | 3,747 | $ | 8,984 | $ | - | $ | 12,753 | ||||||||||
| End of period | ||||||||||||||||||||
| Gross cash and short-term securities | $ | 55 | $ | 4,397 | $ | 9,046 | $ | - | $ | 13,498 | ||||||||||
| Net payments in transit, included in other liabilities | - | (311 | ) | (275 | ) | - | (586 | ) | ||||||||||||
| Net cash and short-term securities, end of period | $ | 55 | $ | 4,086 | $ | 8,771 | $ | - | $ | 12,912 | ||||||||||
| Supplemental disclosures on cash flow information: | ||||||||||||||||||||
| Interest received | $ | - | $ | 1,924 | $ | 2,262 | $ | (9 | ) | $ | 4,177 | |||||||||
| Interest paid | 150 | 120 | 572 | (248 | ) | 594 | ||||||||||||||
| Income taxes paid | - | 31 | 250 | - | 281 | |||||||||||||||
Note 15 Comparatives |
Certain comparative amounts have been reclassified to conform with the current period’s presentation.
Manulife Financial Corporation - Second Quarter 2014
61
| SHAREHOLDER INFORMATION |
MANULIFE FINANCIAL CORPORATION HEAD OFFICE 200 Bloor Street East Toronto, ON Canada M4W 1E5 Telephone 416 926-3000 Fax: 416 926-5454 Web site: www.manulife.com INVESTOR RELATIONS Financial analysts, portfolio managers and other investors requiring financial information may contact our Investor Relations Department or access our Web site at www.manulife.com Fax: 416 926-3503 E-mail: investor_relations@manulife.com SHAREHOLDER SERVICES For information or assistance regarding your share account, including dividends, changes of address or ownership, lost certificates, to eliminate duplicate mailings or to receive shareholder material electronically, please contact our Transfer Agents in Canada, the United States, Hong Kong or the Philippines. If you live outside one of these countries please contact our Canadian Transfer Agent. | TRANSFER AGENTS Canada CST Trust Company P.O. Box 700, Station B Montreal, QC Canada H3B 3K3 Toll Free: 1 800 783-9495 Collect: 416 682-3864 E-mail: inquiries@canstockta.com Online: www.canstockta.com CST Trust Company offices are also located in Toronto, Halifax, Vancouver and Calgary. United States Computershare Inc. P.O. Box 30170 College Station, TX 77842-3170 Toll Free: 1 800 249-7702 Collect: 201 680-6578 E-mail: web.queries@computershare.com Online: www.computershare.com/investor Hong Kong Registered Holders: Computershare Hong Kong Investor Services Limited 17M Floor, Hopewell Centre 183 Queen’s Road East, Wan Chai, Hong Kong Telephone: 852 2862–8555 Ownership Statement Holders: The Hongkong and Shanghai Banking Corporation Limited Sub-Custody and Clearing, Hong Kong Office GPO Box 64 Hong Kong Telephone: 852 2288-8355 | Philippines The Hongkong and Shanghai Banking Corporation Limited HSBC Stock Transfer Unit 7th Floor, HSBC Centre 3058 Fifth Avenue West Bonifacio Global City Taguig City, 1634 Philippines Telephone: PLDT 632 581-7595 GLOBE 632 976-7595 AUDITORS Ernst & Young LLP Chartered Accountants Licensed Public Accountants Toronto, Canada | |
The following Manulife Financial documents are available online at www.manulife.com · Annual Report and Proxy Circular · Notice of Annual Meeting · Shareholders Reports · Public Accountability Statement · Corporate Governance material | |||
RATING Financial strength is a key factor in generating new business, maintaining and expanding distribution relations and providing a base for expansion, acquisitions and growth. As at June 30, 2014, Manulife Financial had total capital of C$35.8 billion, including C$30.2 billion of total shareholders’ equity. The Manufacturers Life Insurance Company’s financial strength and claims paying ratings are among the strongest in the insurance industry. | |||||||
| Standard & Poor’s | AA- | (4th of 21 ratings) | |||||
| Moody’s | A1 | (5th of 21 ratings) | |||||
| Fitch Ratings | AA- | (4th of 19 ratings) | |||||
| DBRS | IC-1 | (1st of 6 ratings) | |||||
| A.M. Best | A+ | (2nd of 15 ratings) | |||||
COMMON STOCK TRADING DATA The following values are the high, low and close prices plus the average daily trading volume for Manulife Financial Corporation’s common stock on the Toronto Stock Exchange, the U.S. exchanges, The Stock Exchange of Hong Kong and the Philippine Stock Exchange for the second quarter. The common stock symbol is MFC on all exchanges except Hong Kong where it is 945. | As at June 30, 2014, there were 1,858 million common shares outstanding. | ||||||
April 1 – June 30, 2014 | Toronto Canadian $ | U.S. Composite United States $ | Hong Kong Hong Kong $ | Philippines Philippine Pesos | |||
| High | $21.68 | $ 19.94 | $ 155.00 | P 795 | |||
| Low | $19.67 | $ 18.03 | $ 141.00 | P 711 | |||
| Close | $21.21 | $ 19.87 | $ 153.20 | P 734 | |||
| Average Daily Volume (000) | 2,797 | 1,315 | 70 | 0.5 | |||
Manulife Financial Corporation - Second Quarter 2014
62
| Consent to receive documents electronically |
Electronic documents available from Manulife Financial Manulife Financial is pleased to offer Electronic Documents. Access the information when you want, no more waiting for the mail. The Manulife Financial documents available electronically are: ·Annual Report and Proxy Circular ·Notice of Annual Meeting ·Shareholder Reports ·Public Accountability Statement ·Corporate Governance material | These documents will be available to you on our Web site at www.manulife.com at the same time as they are mailed to other shareholders. Documents relating to the annual meeting, including annual reports will be available on the Web site at least until the next version is available. We will notify you when documents will be available on the Web site and confirm the instructions for accessing the documents at the same time. In the event that the documents are not available on our Web site, paper copies will be mailed to you. This information is also available for viewing or download under quarterly reports from the Investor Relations section of our website at www.manulife.com |
.
……………………………………………………………………………………….… Detach here ……………………………………………………………………………………….
To receive documents electronically when they are available through Manulife Financial’s electronic delivery service, complete this form and return it as indicated. I have read and understand the statement on the reverse and consent to receive electronically the Manulife Financial documents listed in the manner described. I acknowledge that I have the computer requirements to access the documents that are made available on Manulife Financial’s Web site. I understand that I am not required to consent to electronic delivery and that I may revoke my consent at any time. Please note: We will contact you by phone only if there is a problem with your email address. The information provided is confidential and will not be used for any purpose other than that described. | Please Print: __________________________________________________________ Shareholder Name __________________________________________________________ Contact Phone Number __________________________________________________________ Shareholder email Address __________________________________________________________ Shareholder Signature __________________________________________________________ Date |
Manulife Financial Corporation - Second Quarter 2014
63