Exhibit 99.2

Manulife Financial Corporation
Management’s Discussion and Analysis
For the year ended December 31, 2010

Caution regarding forward-looking statements
This document contains forward-looking statements within the meaning of the “safe harbour” provisions of Canadian provincial securities laws and the U.S. Private Securities Litigation Reform Act of 1995. The forward-looking statements in this document include, but are not limited to, statements with respect to our management objectives with respect to hedging equity markets and interest rate risks. The forward-looking statements in this document also relate to, among other things, our objectives, goals, strategies, intentions, plans, beliefs, expectations and estimates, and can generally be identified by the use of words such as “may”, “will”, “could”, “should”, “would”, “likely”, “suspect”, “outlook”, “expect”, “intend”, “estimate”, “anticipate”, “believe”, “plan”, “forecast”, “objective”, “seek”, “aim”, “continue”, “embark” and “endeavour” (or the negative thereof) and words and expressions of similar import, and include statements concerning possible or assumed future results. Although we believe that the expectations reflected in such forward-looking statements are reasonable, such statements involve risks and uncertainties, and undue reliance should not be placed on such statements and they should not be interpreted as confirming market or analysts’ expectations in any way. Certain material factors or assumptions are applied in making forward-looking statements and actual results may differ materially from those expressed or implied in such statements. Important factors that could cause actual results to differ materially from expectations include but are not limited to: general business and economic conditions (including but not limited to performance and volatility of equity markets, interest rate fluctuations and movements in credit and swap spreads, currency rates, investment losses and defaults, market liquidity and creditworthiness of guarantors, reinsurers and counterparties); changes in laws and regulations; changes in accounting standards; our ability to execute strategic plans and changes to strategic plans; downgrades in our financial strength or credit ratings; our ability to maintain our reputation; impairments of goodwill or intangible assets or the establishment of valuation allowances against future tax assets; the accuracy of estimates relating to long-term morbidity, mortality and policyholder behaviour; the accuracy of other estimates used in applying accounting policies and actuarial methods; level of competition and consolidation; our ability to market and distribute products through current and future distribution channels; unforeseen liabilities or asset impairments arising from acquisitions and dispositions of businesses; our ability to implement effective hedging strategies and unforeseen consequences arising from such strategies; our ability to source appropriate non-fixed income assets to back our long dated liabilities; the realization of losses arising from the sale of investments classified as available for sale; our liquidity, including the availability of financing to satisfy existing financial liabilities on their expected maturity dates when required; obligations to pledge additional collateral; the availability of letters of credit to provide capital management flexibility; accuracy of information received from counterparties and the ability of counterparties to meet their obligations; the availability, affordability and adequacy of reinsurance; legal and regulatory proceedings, including tax audits, tax litigation or similar proceedings; our ability to adapt products and services to the changing market; our ability to attract and retain key executives, employees and agents; the appropriate use and interpretation of complex models or deficiencies in models used; political, legal, operational and other risks associated with our non-North American operations; acquisitions and our ability to complete acquisitions including the availability of equity and debt financing for this purpose; the disruption of or changes to key elements of the Company’s or public infrastructure systems; environmental concerns; and our ability to protect our intellectual property and exposure to claims of infringement. Additional information about material factors that could cause actual results to differ materially from expectations and about material factors or assumptions applied in making forward-looking statements may be found in the body of this document as well as under “Risk Factors” in our most recent Annual Information Form, under “Risk Management” and “Critical Accounting and Actuarial Policies” in the Management’s Discussion and Analysis in our most recent annual and interim reports, in the “Risk Management” note to consolidated financial statements in our most recent annual and interim reports and elsewhere in our filings with Canadian and U.S. securities regulators. We do not undertake to update any forward-looking statements except as required by law.
Management’s Discussion and Analysis
About Manulife Financial
Manulife Financial is a leading Canadian-based financial services group serving millions of customers in 22 countries and territories worldwide. We provide financial protection and wealth management products and services, to individual and group customers in Canada, the United States and Asia. These products and services include individual life insurance, group life and health insurance, long-term care services, pension products, annuities, mutual funds and banking products. We offer reinsurance services, specializing in life retrocession and property and casualty reinsurance and provide investment management services with respect to the Company’s general fund and segregated fund assets and to mutual funds and institutional customers.
The Company operates in Canada and Asia through the brand name “Manulife Financial” and in the United States primarily through the brand name “John Hancock”.
In this document, the terms “Company”, “Manulife Financial” and “we” mean Manulife Financial Corporation (“MFC”) and its subsidiaries.
2010 Highlights
Over the last few years, the Company has focused on strategic actions to reduce earnings sensitivity to equity markets and interest rates, rebalance business mix in order to improve both future earnings growth and return on equity, and to strengthen capital. In 2009, we took important steps by strengthening regulatory capital, expanding certain risk reduction initiatives and reallocating resources to products targeted for growth. At the same time, we began overhauling products with less attractive earnings and risk profiles.
In 2010, we made significant progress in positioning the Company for growth. We continued to diversify our businesses, achieved growth in targeted areas, reduced sensitivities to equity markets and interest rates, and strengthened our capital position.
A net loss attributed to shareholders of $391 million was recorded for 2010 as a result of over $3 billion of charges for goodwill impairment and changes in actuarial methods and assumptions from actions such as re-balancing our product mix, raising prices and recognizing long-term trends in morbidity. While these actions came at a cost, they also strengthened our balance sheet and reserves.
Full year adjusted earnings from operations1 was $2,871 million and while changes in equity markets and interest rates created significant volatility in the 2010 quarterly results, on a full year basis, the gains and losses from equity markets, interest rates and other investment experience netted to a loss of $137 million. In our 2009 Annual Report, we estimated the quarterly adjusted earnings from operations would be between $700 million to $800 million in 2010 based on currency rates in effect at June 30, 2009. Under Canadian securities rules, the Company is no longer required to report on adjusted earnings from operations in 2011. We will continue to report on net income excluding the direct impact of equity markets and interest rates, as well as highlight other material items. The following table reconciles adjusted earnings from operations to our 2010 reported net income and also reconciles net income excluding the direct impact of equity markets and interest rates2 to our 2010 reported net income.
| 1 | Adjusted earnings from operations is a non-GAAP measure. See “Performance and non-GAAP Measures” below. |
| 2 | Net income excluding the direct impact of equity markets and interest rates is a non-GAAP measure. See “Performance and non-GAAP Measures” below. |
| | | | | | | | |
For the year ended December 31, 2010 (C$ millions) | | Gain (loss) | | | | |
Reported net loss attributed to shareholders | | $ | (391) | | | | | |
Less the direct impact of higher equity markets and lower interest rates on: | | | | | | | | |
Variable annuity guarantee liabilities that are not dynamically hedged(1),(2) | | $ | (34 | ) | | | | |
General fund equity investments supporting policy liabilities and on fee income(1),(2) | | | 133 | | | | | |
Macro equity hedges, excluding expected cost(3) | | | (48 | ) | | | | |
Fixed income re-investment assumptions used in the determination of policy liabilities(2) | | | (1,293 | ) | | | | |
Net gains realized on the sale of bonds classified as available-for-sale (“AFS”) | | | 570 | | | | | |
Total direct impact of equity markets and interest rates(4) | | $ | (672 | ) | | | | |
Net income excluding the direct impact of equity markets and interest rates | | $ | 281 | | | | | |
Less other notable items | | | | | | | | |
Refinements in actuarial methods and assumptions | | | (2,072 | ) | | | | |
Impairment of goodwill related to repositioning of U.S. Insurance | | | (1,039 | ) | | | | |
Losses on variable annuity business that is dynamically hedged(1),(2),(4) | | | (176 | ) | | | | |
Other favourable investment experience(2),(4) | | | 711 | | | | | |
Tax related gains on closed tax years, net of provisions for lease transactions of $99 | | | 166 | | | | | |
Net policyholder experience gains | | | 44 | | | | | |
Change in accounting policy for deferred acquisition costs in the Hong Kong pension business | | | (39 | ) | | | | |
Changes in currency rates(5) | | | (185 | ) | | | | |
Total other notable items | | $ | (2,590 | ) | | | | |
Adjusted earnings from operations | | $ | 2,871 | | | | | |
| (1) | Adjusted earnings from operations exclude the earnings impact from equity market changes that differ from our best estimate assumptions of growth of 7.25% per annum in Canada, 8.0% per annum in the U.S., 5.0% per annum in Japan and 9.5% per annum in Hong Kong. |
| (2) | As outlined in our accounting policies, policy liabilities represent our estimate of the amount which, together with estimated future premiums and net investment income, will be sufficient to pay estimated future benefits, policyholder dividends and refunds, taxes (other than income taxes) and expenses on policies in-force. Under Canadian GAAP, the determination of policy liabilities is based on an explicit projection of cash flows using current best estimate assumptions for each material cash flow item and contingency. Investment returns are projected using the current asset portfolios and projected re-investment strategies. Each assumption is adjusted by a margin for adverse deviation. As a result of this methodology, experience gains (losses) arise when equity, interest rate, credit and other non-fixed income returns differ from our best estimate policy liability assumptions. |
| (3) | The total cost of macro equity hedges entered into late in the fourth quarter was $82 million and includes a $34 million charge related to the estimated expected cost of the macro equity hedges relative to our long-term valuation assumptions. The estimated expected cost of these hedges was included in net income excluding the direct impact of equity markets and interest rates as well as in adjusted earnings from operations. The $48 million difference was reported as a direct impact of equity markets and was excluded from adjusted earnings from operations. |
| (4) | Included in the gains and losses from equity markets, interest rates and other investment experience which netted to a loss of $137 million for the year ended December 31, 2010. |
| (5) | Adjusted earnings from operations exclude the impact of changes in currency exchange rates from those in effect at June 30, 2009 when we originally provided our estimate of this amount. Since that time, the Canadian dollar has strengthened and the Canadian dollar equivalent of one U.S. dollar has declined from $1.1625 as at June 30, 2009 to $0.9946 as at December 31, 2010. |
Both reported net income (loss) attributed to shareholders and adjusted earnings from operations for the full year 2010 were balanced across our three major operating divisions.
| | | | | | | | | | | | |
For the year ended December 31, 2010 (C$ millions) | | Reported net income
(loss) attributed to
shareholders | | | Adjusted earnings
from operations(1) | | | | |
Asia Division | | $ | 623 | | | $ | 719 | | | | | |
Canadian Division | | | 950 | | | | 718 | | | | | |
U.S. Division | | | 759 | | | | 781 | | | | | |
Reinsurance, Corporate and Other Divisions excluding items below | | | 388 | | | | 468 | | | | | |
| | $ | 2,720 | | | $ | 2,686 | | | | | |
Currency adjustment(2) | | | | | | | 185 | | | | | |
Changes in actuarial methods and assumptions and third quarter goodwill impairment | | | (3,111 | ) | | | Not applicable | | | | | |
Total | | $ | (391 | ) | | $ | 2,871 | | | | | |
| (1) | The divisional results reported under adjusted earnings from operations are before the allocation of earnings on surplus. |
| (2) | Impact of changes in currency rates from June 30, 2009 when adjusted earnings from operations was defined. |
In comparison, in 2009 net income attributed to shareholders was $1,402 million. Notable items included the unfavourable impact of lower interest rates, credit and downgrade charges, the decline in value of real estate, timber and agriculture holdings, and charges for changes in actuarial methods and assumptions partially offset by the favourable impact of the increase in equity markets and tax items. After adjusting for the notable items, adjusted earnings from operations in 2009 was the same as in 2010 at $2,871 million. Adjusted earnings from operations in 2010 included higher earnings from a larger in-force business but this was offset by the impact of lower interest rates on new business and increased hedging costs.
Sales3 as well as premiums and deposits4 (“P&D”) were in line with our strategy of accelerating the growth of products that have favourable return on capital and with lower risk profiles while at the same time pulling back or eliminating products that give rise to earnings sensitivity or produce low returns on capital employed. To measure progress on these goals, we separately report on the sales and P&D of product lines we are targeting to grow from those that are not targeted for growth.
Sales5
Total Company insurance sales for products we are targeting to grow (all insurance products in Asia and Canada, and insurance products in the U.S. other than universal life products with lifetime no-lapse guarantees, guaranteed non-par whole life and long-term care products) exceeded $2 billion, a 20 per cent increase over 2009.
| n | | In Asia, sales were US$1.0 billion, an increase of 43 per cent over 2009, with seven of our businesses achieving record full year sales results. |
| n | | Canadian Division Individual Insurance also had a record year with annual sales increasing 12 per cent from 2009 levels. Group Benefits’ sales in Canada were slightly below 2009 levels with momentum in the small case market building throughout the year. |
| n | | In the U.S. Insurance segment, we are continuing to reposition the business to adapt to the low interest rate environment and focus on the business mix favouring higher return and more capital efficient products. Insurance sales of products we are targeting to grow were US$0.3 billion, an increase of one per cent over 2009. |
Total Company insurance sales of products not targeted for growth (the U.S. products outlined above) totaled $482 million for the year, a year over year decline of nine per cent.
| 3 | Sales is a non-GAAP measure. See “Performance and Non-GAAP Measures” below. |
| 4 | Premiums and deposits is a non-GAAP measure. See “Performance and Non-GAAP Measures” below. |
| 5 | Growth in sales is stated on a constant currency basis. Constant currency basis is a non-GAAP measure. See “Performance and Non-GAAP Measures” below. |
Total Company wealth sales for products we are targeting to grow (all wealth products except variable annuity (“VA”) and book value fixed deferred annuity products) were $27.4 billion, a 23 per cent increase over 2009.
| n | | In the U.S., sales were US$16.2 billion and represented an increase of 30 per cent over 2009 driven by a 48 per cent growth in mutual fund sales. |
| n | | In Canada, retail (individual) sales of $6.7 billion represented an increase of 11 per cent over 2009 as strong mutual fund sales and increased bank volumes were partially offset by lower sales of fixed products. Group Retirement Solutions increased its new business market share in its target market defined contribution segment, however sales of $0.9 billion were 29 per cent lower than sales in 2009, reflecting reduced activity across the industry. |
| n | | In Asia, wealth sales for products we are targeting to grow were $3.1 billion, an increase of 32 per cent over 2009. The increase was driven by the acquisition of a fund management company in China and new product launches in Indonesia and Japan, partially offset by lower money market sales in Taiwan (a product we repositioned early in 2009). |
Full year 2010 sales of wealth products not targeted for growth totaled $6.7 billion, a year over year decline of 46 per cent on a constant currency basis.
Sales(1)
For the years ended December 31,
| | | | | | | | | | | | | | | | |
| (C$ millions) | | 2010 | | | 2009 | | | 2008 | | | | |
Insurance products targeted for growth | | $ | 2,048 | | | $ | 1,766 | | | $ | 1,844 | | | | | |
Insurance products not targeted for growth(2) | | | 482 | | | | 591 | | | | 496 | | | | | |
Wealth products targeted for growth | | | 27,376 | | | | 23,785 | | | | 23,640 | | | | | |
Wealth products not targeted for growth (variable annuities and book value deferred fixed annuities) | | | 6,735 | | | | 13,221 | | | | 19,900 | | | | | |
| (1) | Sales amounts are stated in Canadian dollars, whereas sales growth rates quoted above are on a constant currency basis. |
| (2) | JH Life universal life with lifetime no-lapse guarantees and guaranteed non-par whole life products as well as products in JH Long-Term Care. |
P&D6:
Total Company P&D for insurance products we are targeting to grow increased to $17.8 billion in 2010, an increase of four per cent over 2009. The increase was 16 per cent in Asia, two per cent in Canada and one per cent in the U.S.
P&D for insurance products we are not targeting to grow declined 17 per cent to $3.9 billion.
P&D for wealth products we are targeting to grow increased to $36.7 billion in 2010, an increase of 13 per cent over 2009. For reasons similar to sales, the increase was 22 per cent in the U.S., 25 per cent in Asia and six per cent in Canada.
P&D for wealth products we are not targeting to grow (variable annuities and book value deferred fixed annuities) declined 46 per cent from 2009 to $6.7 billion in 2010.
Premiums and deposits
For the years ended December 31,
| | | | | | | | | | | | | | | | |
| (C$ millions) | | 2010 | | | 2009 | | | 2008 | | | | |
Insurance products targeted for growth | | $ | 17,811 | | | $ | 17,747 | | | $ | 16,783 | | | | | |
Insurance products not targeted for growth(1) | | | 3,880 | | | | 5,205 | | | | 3,340 | | | | | |
Wealth products targeted for growth | | | 36,676 | | | | 35,143 | | | | 35,888 | | | | | |
Wealth products not targeted for growth (variable annuities and book value deferred fixed annuities) | | | 6,694 | | | | 13,175 | | | | 19,739 | | | | | |
Total premiums and deposits | | $ | 65,061 | | | $ | 71,270 | | | $ | 75,750 | | | | | |
| (1) | JH Life universal life with lifetime no-lapse guarantees and guaranteed non-par whole life products as well as products in JH Long-Term Care. |
Total funds under management7 as at December 31, 2010 were $475.2 billion, an increase of $35.6 billion over December 31, 2009. Contributing to the increase were $40.9 billion related to investment returns, $9.8 billion of net positive policyholder cash flows and $2.0 billion of senior and medium term notes issued. These items were partially offset by $13.9 billion due to the strengthening of the Canadian dollar and $3.2 billion of expenses, commissions, taxes and other movements.
Funds under management
As at December 31,
| | | | | | | | | | | | | | | | |
| (C$ millions) | | 2010 | | | 2009 | | | 2008 | | | | |
General fund | | $ | 199,448 | | | $ | 187,470 | | | $ | 187,501 | | | | | |
Segregated funds held by policyholders(1),(2) | | | 198,972 | | | | 190,665 | | | | 164,807 | | | | | |
Mutual and other funds(1),(2),(3) | | | 76,763 | | | | 61,482 | | | | 52,199 | | | | | |
Total funds under management | | $ | 475,183 | | | $ | 439,617 | | | $ | 404,507 | | | | | |
| (1) | Segregated fund assets, mutual fund assets and other funds are not available to satisfy the liabilities of the Company’s general fund. |
| (2) | As at December 31, 2010, we transferred $6,614 million from segregated funds to mutual funds resulting from a restructuring of our Hong Kong pension business. |
| (3) | Other funds represent pension funds, pooled funds, endowment funds and other institutional funds managed by the Company on behalf of others. |
| 6 | Growth in P&D is stated on a constant currency basis. Constant currency basis is a non-GAAP measure. See “Performance and Non-GAAP Measures” below. |
| 7 | Funds under management is a non-GAAP measure. See “Performance and Non-GAAP Measures” below. |
In 2010, we refined our risk reduction plans in order to further reduce our exposure to public equity risk and interest rate riskthrough a combination of time-scheduled and market-trigger based actions. The refined plans established a goal of executing additional hedges so that approximately 60 per cent of our underlying earnings sensitivity8 to equity market movements is offset by hedges by the end of 2012 and approximately 75 per cent of our underlying earnings sensitivity to equity markets is offset by hedges by the end of 2014. In addition, we expect to take actions that would further reduce our interest rate exposures, as measured by the sensitivity of net income attributed to shareholders to a 100 basis point parallel decline in interest rates, to $1.65 billion by the end of 2012 and $1.1 billion by the end of 2014.
As at December 31, 2010, approximately 50 per cent of our underlying earnings sensitivity to equity market movements was offset by hedges compared to nine per cent at the end of 2009. In the fourth quarter of 2010, we implemented a new macro equity risk hedging strategy designed to mitigate public equity risk arising from variable annuities (“VAs”) not dynamically hedged and from other products and fees and during 2010 added $19 billion of in-force guarantee value to our variable annuity guarantee dynamic hedging strategy. By December 31, 2010, approximately 55 per cent of the guarantee value was either dynamically hedged or reinsured, compared to 35 per cent at December 31, 2009.
To reduce interest rate risk, we lengthened the duration of our fixed income investments in both our liability and surplus segments by investing cash and trading shorter term bonds for longer term bonds. These actions, partially offset by the declines in interest rates and updates to policyholder liability assumptions during the year, contributed to a net reduction in the sensitivity of our net income attributed to shareholders to declines in interest rates, as measured by a 100 basis point parallel decline, to $1.8 billion compared to $2.2 billion at December 31, 2009.
Other risk reduction actions taken in 2010 include the re-pricing and de-risking of guaranteed benefit insurance products in Canada and the U.S., and launching new insurance products with lower or limited guarantees. We also launched a lower risk variable annuity product in Japan, an initiative that followed the redesign and re-pricing of our North American variable annuities in 2009. The changes made to our product portfolio have facilitated a desired and ongoing shift in our new business to lower risk product lines with higher profit margins.
For further details on the risk management activities, please refer to the Risk Management section below.
The Manufacturers Life Insurance Company’s (“MLI’s”) Minimum Continuing Capital and Surplus Requirements (“MCCSR”) ratio was 249 per cent as at December 31, 2010, an increase of nine points from December 31, 2009 and well in excess of the supervisory target of 150 per cent required by the Office of the Superintendent of Financial Institutions (“OSFI”). For further information on capital, please refer to the Capital Management Framework Section below.
Summary Statements of Operations
| | | | | | | | | | | | | | | | |
For the years ended December 31, (C$ millions, except per share amounts) | | 2010 | | | 2009 | | | 2008 | | | | |
Revenue | | | | | | | | | | | | | | | | |
Premium income | | $ | 18,351 | | | $ | 22,946 | | | $ | 23,252 | | | | | |
Investment income | | | | | | | | | | | | | | | | |
Investment income | | | 9,476 | | | | 8,041 | | | | 8,094 | | | | | |
Realized and unrealized gains (losses) on assets supporting policy liabilities and consumer notes | | | 3,546 | | | | 3,262 | | | | (3,796 | ) | | | | |
Other revenue | | | 6,260 | | | | 5,858 | | | | 5,453 | | | | | |
Total revenue | | $ | 37,633 | | | $ | 40,107 | | | $ | 33,003 | | | | | |
Policy benefits | | $ | 27,928 | | | $ | 30,081 | | | $ | 22,201 | | | | | |
General expenses | | | 3,732 | | | | 3,682 | | | | 3,546 | | | | | |
Investment expenses | | | 971 | | | | 947 | | | | 943 | | | | | |
Commissions | | | 3,756 | | | | 3,980 | | | | 4,235 | | | | | |
Interest expense | | | 1,077 | | | | 1,301 | | | | 1,187 | | | | | |
Premium taxes | | | 262 | | | | 284 | | | | 280 | | | | | |
Goodwill impairment | | | 1,039 | | | | – | | | | – | | | | | |
Non-controlling interest in subsidiaries | | | 40 | | | | (16 | ) | | | 34 | | | | | |
Total policy benefits and expenses | | $ | 38,805 | | | $ | 40,259 | | | $ | 32,426 | | | | | |
Income (loss) before income taxes | | $ | (1,172 | ) | | $ | (152 | ) | | $ | 577 | | | | | |
Income tax recovery (expense) | | | 860 | | | | 1,572 | | | | (80 | ) | | | | |
Net income (loss) | | $ | (312 | ) | | $ | 1,420 | | | $ | 497 | | | | | |
Net income (loss) attributed to participating policyholders | | | 79 | | | | 18 | | | | (20 | ) | | | | |
Net income (loss) attributed to shareholders | | $ | (391 | ) | | $ | 1,402 | | | $ | 517 | | | | | |
Preferred share dividends | | | (79 | ) | | | (64 | ) | | | (30 | ) | | | | |
Net income (loss) available to common shareholders | | $ | (470 | ) | | $ | 1,338 | | | $ | 487 | | | | | |
Diluted earnings (loss) per share | | $ | (0.27 | ) | | $ | 0.82 | | | $ | 0.32 | | | | | |
Dividends per common share | | $ | 0.52 | | | $ | 0.78 | | | $ | 1.00 | | | | | |
| 8 | Defined as earnings sensitivity to a 10 per cent decline in public equity markets including settlements on reinsurance contracts existing at September 30, 2010, but excluding the dynamic hedging strategy and other hedging activities. |
The $391 million net loss attributed to shareholders included a $1,039 million goodwill impairment charge related to the repositioning of the U.S. Insurance operations and charges of $2,072 million to strengthen policy liabilities. The goodwill impairment charge is shown separately in the above Summary Statements of Operations, and the pre-tax amount of the changes in actuarial methods and assumptions is included in the policy benefits line. The net amount of gains and losses from equity markets, interest rates and other investment experience and notable items was not material in aggregate. The gross gains and losses from these items appear on the following lines of the Summary Statements of Operations: investment income, realized and unrealized gains (losses) on assets supporting policy liabilities and consumer notes, policy benefits, interest expense and income tax recovery (expense).
Premium Income
Of the $65.1 billion of total premiums and deposits outlined above, $18.4 billion (2009 – $22.9 billion) appears on the Summary Statements of Operations and the remainder relates to off-balance sheet products such as segregated funds and mutual funds, Group Benefit premiums in Canada before the ceded reinsurance transaction and Administrative Services Only business. Premium income reported on the Statements of Operations is net of reinsurance. Of the $4.5 billion decrease in premiums reported on the Statement of Operations in 2010 compared to 2009, $3.6 billion relates to insurance and wealth products we are not targeting to grow (JH Life universal life with lifetime no-lapse guarantees and guaranteed non-par whole life products, JH Long-Term Care products, variable annuities and book value deferred fixed annuities) and the remaining $0.9 billion is due to the impact of the strengthened Canadian dollar. On a constant currency basis, premium income for insurance and wealth products we are targeting to grow in Asia was offset by a combination of the lower fixed wealth product sales in Canada and a full year of reinsurance in the Canadian Group Benefits business in 2010 compared to nine months in 2009.
Investment Income
Total investment income of $13.0 billion for 2010 consisted of investment income of $9.5 billion and realized and unrealized market gains on assets supporting policy liabilities and consumer notes of $3.5 billion.
Interest income of $7,983 million was $57 million lower than in 2009 as higher income from an increased asset base was more than offset by the impact of the strengthening Canadian dollar on U.S. dollar revenues. Dividend, rental and other income of $835 million was $60 million lower than in 2009, primarily as a result of lower stock dividend distributions and a decline in real estate mark to market amortization due to lower appraisal values.
Total credit related impairments in 2010 were $140 million, down from $433 million in 2009 and close to the expected level assumed in the valuation of our policy liabilities. Credit impairments of $126 million (2009 – $394 million) were charged to the shareholders’ account and the remaining $14 million (2009 – $39 million) was charged to the participating policyholders’ account. After reducing the credit charges in the shareholders’ account for the pre-tax amount expected in the valuation of the policy liabilities of $170 million and adjusting for a downgrade charge of $50 million, the overall net credit experience in net income attributed to shareholders for 2010 was a pre-tax cost of $15 million.
Other than temporary impairments (“OTTI”) on AFS equities in the Corporate and Other segment and impairments on private equity investments were $83 million, down significantly from the $480 million recorded in 2009.
Realized gains on bonds and other assets classified as AFS were $876 million and largely realized in the third quarter to mitigate the impact of lower interest rates on the valuation of policy liabilities (see Policy Liabilities section below). The Company recognized $124 million of gains on equities classified as AFS in 2010 compared to $54 million in 2009.
In the fourth quarter of 2010, the Company initiated a macro equity risk hedging strategy designed to hedge a portion of our earnings sensitivity to equity markets movements (see Risk Management section). The change in fair value of the hedges was a loss of $119 million.
Realized and unrealized market gains on assets supporting policy liabilities and consumer notes were $3,546 million in 2010 (2009 – $3,262 million). The 2010 amount included $102 million (2009 – $1,301 million) of gains related to the increase in equity markets net of hedging activities and market gains of $3,444 million (2009 – $1,961 million) on bonds, net of hedging activities, primarily related to the decline in interest rates. For fixed income assets supporting policy liabilities and for equities supporting pass through products, the impact of these unrealized and realized gains and losses is largely offset by changes in actuarial liabilities. However, gains and losses on equity investments that support our non pass through insurance products are reported in net income attributed to shareholders to the extent they differ from the policy liability assumptions. This was a pre-tax gain of $102 million in 2010 (2009 – $242 million).
Investment Income
| | | | | | | | | | | | | | | | |
| (C$ millions) | | 2010 | | | 2009 | | | 2008 | | | | |
Interest income | | $ | 7,983 | | | $ | 8,040 | | | $ | 7,816 | | | | | |
Dividend, rental and other income | | | 835 | | | | 895 | | | | 1,212 | | | | | |
| | $ | 8,818 | | | $ | 8,935 | | | $ | 9,028 | | | | | |
Credit impairments | | | (140 | ) | | | (433 | ) | | | (697 | ) | | | | |
OTTI on public and private equities | | | (83 | ) | | | (480 | ) | | | (354 | ) | | | | |
Realized gains (losses) on bonds and other assets classified as AFS | | | 876 | | | | (35 | ) | | | (27 | ) | | | | |
Realized gains on equities classified as AFS | | | 124 | | | | 54 | | | | 144 | | | | | |
Macro equity hedge losses | | | (119 | ) | | | – | | | | – | | | | | |
Investment income | | $ | 9,476 | | | $ | 8,041 | | | $ | 8,094 | | | | | |
Realized and unrealized gains (losses) on assets supporting policy liabilities and consumer notes | | | 3,546 | | | | 3,262 | | | | (3,796 | ) | | | | |
Total investment income | | $ | 13,022 | | | $ | 11,303 | | | $ | 4,298 | | | | | |
Other Revenue
Other revenue was $6.3 billion for 2010, an increase of seven per cent from $5.9 billion in 2009. The higher fee income in the wealth management businesses from higher average assets under management was partially offset by the impact of the strengthened Canadian dollar.
Policy Benefits
Policy benefits are reported net of reinsurance and were $27.9 billion in 2010, down $2.2 billion from $30.1 billion in 2009. Death, disability and other claims, maturity and surrender benefits, annuity payments and policyholder dividends and experience rated refunds decreased by $2.8 billion and net policyholder transfers to segregated funds by $1.7 billion partially offset by an increase in the change in actuarial liabilities of $2.4 billion. Similar to most financial statement lines, the strengthening of the Canadian dollar explained part of the decrease.
Death, disability and other claims declined from 2009, explained by the fact that the first three months of claims in 2009 for Canadian Group Benefits were not reinsured.
Maturity and surrender benefits decreased from 2009 primarily due to $1.5 billion of lower scheduled maturities in John Hancock Fixed Products.
Policyholder dividends and experience rating refunds declined by $291 million year over year, but would have increased by $112 million were it not for the above reinsurance agreement.
Net transfers to segregated funds are offset in the change in actuarial liabilities line, and decreased as a result of the discontinuance of the dollar cost averaging program in the U.S. VA business.
The change in actuarial liabilities increased to $13.8 billion in 2010 from $11.4 billion in 2009. Included in the change in actuarial liabilities are pre-tax strengthening for changes in actuarial methods and assumptions of $2.9 billion in 2010 and $1.6 billion in 2009, as well as the impact of changes in equity markets, interest rates and other investment related and policyholder experience that differed from those assumed in the valuation of policy liabilities. The post-tax equivalent of these items can be found as notable items listed in the adjusted earnings from operations table in the 2010 Highlights section. Most of the investment related notable items in the adjusted earnings from operations table, on a pre-tax basis, flow through the change in actuarial liabilities line on the Statement of Operations with the significant exceptions being the macro equity hedges, general fund equity investments supporting policy liabilities, and gains realized on bonds classified as AFS.
As noted in the Investment Income section above, for fixed income assets supporting policy liabilities and for equities supporting pass-through products, the impact of unrealized and realized gains and losses are largely offset by changes in actuarial liabilities.
Policy Benefits
| | | | | | | | | | | | | | | | |
For the years ended December 31, (C$ millions) | | 2010 | | | 2009 | | | 2008 | | | | |
Death, disability and other claims | | $ | 4,314 | | | $ | 5,029 | | | $ | 6,539 | | | | | |
Maturity and surrender benefits | | | 5,608 | | | | 7,247 | | | | 8,767 | | | | | |
Annuity payments | | | 3,026 | | | | 3,207 | | | | 3,034 | | | | | |
Policyholder dividends and experience rating refunds | | | 1,127 | | | | 1,418 | | | | 1,518 | | | | | |
Payments to policyholders | | $ | 14,075 | | | $ | 16,901 | | | $ | 19,858 | | | | | |
Net transfers to segregated funds | | | 76 | | | | 1,789 | | | | 1,563 | | | | | |
Change in actuarial liabilities | | | 13,777 | | | | 11,391 | | | | 780 | | | | | |
Total policy benefits | | $ | 27,928 | | | $ | 30,081 | | | $ | 22,201 | | | | | |
General Expenses
General expenses were $3.7 billion in 2010, up one per cent from 2009, mainly due to business growth initiatives, offset by the strengthening of the Canadian dollar in 2010.
Investment Expenses
Investment expenses were $971 million, an increase from $947 million in 2009. Cost containment measures and the favourable impact of the strengthened Canadian dollar were offset by higher sub-advisory fees on a higher average level of segregated and mutual funds under management.
Investment Expenses
| | | | | | | | | | | | | | | | |
For the years ended December 31, (C$ millions) | | 2010 | | | 2009 | | | 2008 | | | | |
Related to invested assets | | $ | 381 | | | $ | 397 | | | $ | 388 | | | | | |
Related to segregated, mutual and other funds(1) | | | 590 | | | | 550 | | | | 555 | | | | | |
Total investment expenses | | $ | 971 | | | $ | 947 | | | $ | 943 | | | | | |
| (1) | Incurred by providing portfolio management services where the Company holds or has invested assets on behalf of individuals and financial institutions. |
Commissions
Commissions were $3,756 million in 2010, down from $3,980 million in 2009. The decrease was driven by lower sales in our VA business in the United States, Canada and Japan as well as lower insurance sales in the United States.
Interest Expense
Interest expense was $1,077 million in 2010, down $224 million from $1,301 million in 2009. Consumer notes, which are fair valued, accounted for $128 million of the decline. The other significant decreases related to lower provisions for leveraged leases and the reversal of interest on uncertain tax positions that were closed in Canada.
Income Taxes
Income taxes were a recovery of $860 million in 2010 on a reported loss before income taxes of $1,172 million. Excluding the impairment of goodwill, which is not tax effected, the pre-tax loss was $133 million. The effective tax rate and income tax amount were affected by the tax rates and laws of the jurisdictions where the income was earned. A significant portion of the pre-tax income was earned in low tax rate jurisdictions whereas the pre-tax losses were largely incurred in jurisdictions with higher tax rates.
In 2009, an income tax recovery of $1,572 million was recorded on pre-tax loss of $152 million. Taxes in 2009 benefitted from a significant amount of pre-tax income emerging in lower tax jurisdictions whereas pre-tax losses were largely incurred in jurisdictions with higher tax rates.
Earnings (Loss) per Common Share and Return on Common Shareholders’ Equity9
Loss per common share for 2010 was $0.27, compared to earnings of $0.82 in 2009. Return on common shareholders’ equity for 2010 was minus 1.8 per cent, compared to 5.2 per cent for 2009. Return on common shareholders’ equity is calculated excluding Accumulated Other Comprehensive Income (Loss) (“AOCI”) on AFS securities and cash flow hedges.
Fourth Quarter Results
Financial Highlights
For the quarter ended December 31,
| | | | | | | | | | | | | | | | |
| (C$ millions, except per share amounts) | | 2010 | | | 2009 | | | 2008 | | | | |
Net income (loss) attributed to shareholders | | $ | 1,794 | | | $ | 868 | | | $ | (1,870 | ) | | | | |
Diluted earnings (loss) per share | | $ | 1.00 | | | $ | 0.51 | | | $ | (1.24 | ) | | | | |
Return on common shareholders’ equity (annualized) | | | 28.6% | | | | 13.1% | | | | (28.9)% | | | | | |
Net Income
Net income attributed to shareholders was $1,794 million for the fourth quarter ended December 31, 2010, equating to fully diluted earnings per share of $1.00. Higher equity markets and the increase in interest rates were significant contributors to the record level of earnings in the quarter. Gains related to higher equity markets were $441 million and to increased interest rates were $604 million.
For the fourth quarter of 2009, MFC reported net income attributed to shareholders of $868 million or $0.51 per share. Net income attributed to shareholders in the fourth quarter of 2009 of $868 million reflected increases in equity markets and interest rates, partially offset by a decline in the market value of real estate holdings, model refinements to previously implemented changes in actuarial methods and one-time charges for changes in Ontario tax laws.
Adjusted Earnings from Operations
Fourth Quarter 2010 Adjusted Earnings from Operations and Reconciliation with GAAP Measure
Adjusted earnings from operations for the fourth quarter of 2010 was $692 million. Increased hedging costs, including $34 million related to the macro equity hedges entered into in the latter half of the fourth quarter, resulted in adjusted earnings from operations being slightly below the estimated range of $700 million to $800 million for each quarter in 2010 as outlined in our 2009 Annual Report.
| 9 | Return on common shareholders’ equity is a non-GAAP measure. See “Performance and Non-GAAP Measures”. |
Reconciliation with GAAP Measure
The following table reconciles adjusted earnings from operations to our reported net income and also reconciles net income excluding the direct impact of equity markets and interest rates to our reported net income for the fourth quarter:
For the quarter ended December 31, 2010
| | | | | | | | |
| (C$ millions) | | Gain (loss) | | | | |
Reported net income attributed to shareholders | | $ | 1,794 | | | | | |
Less net impact of higher equity markets and higher interest rates on: | | | | | | | | |
Variable annuity guarantee liabilities that are not dynamically hedged(1),(2) | | $ | 274 | | | | | |
General fund equity investments supporting policy liabilities and on fee income(1),(2) | | | 117 | | | | | |
Macro equity hedges(3) | | | (48 | ) | | | | |
Fixed income re-investment assumptions used in the determination of policy liabilities(2) | | | 516 | | | | | |
Net gains on sale of AFS bonds in the surplus segment | | | 2 | | | | | |
Total direct impact of equity markets and interest rates | | $ | 861 | | | | | |
Net income excluding the direct impact of equity markets and interest rates | | $ | 933 | | | | | |
Less other notable items: | | | | | | | | |
Gains on variable annuity business that is dynamically hedged(1),(2) | | $ | 184 | | | | | |
Other favourable investment experience(2) | | | 61 | | | | | |
Tax related gains on closed tax years | | | 103 | | | | | |
Net policyholder experience gains | | | 36 | | | | | |
Change in accounting policy for deferred acquisition costs in the Hong Kong pension business | | | (39 | ) | | | | |
Refinements in actuarial methods and assumptions | | | (54 | ) | | | | |
Changes in currency rates(4) | | | (50 | ) | | | | |
Total other notable items | | $ | 241 | | | | | |
Adjusted earnings from operations | | $ | 692 | | | | | |
| (1) | Adjusted earnings from operations excludes the earnings impact from equity market changes that differ from our best estimate assumptions of growth of 7.25% per annum in Canada, 8.0% per annum in the U.S., 5.0% per annum in Japan and 9.5% per annum in Hong Kong. |
| (2) | As outlined in our accounting policies, policy liabilities represent our estimate of the amount which, together with estimated future premiums and net investment income, will be sufficient to pay estimated future benefits, policyholder dividends and refunds, taxes (other than income taxes) and expenses on policies in-force. Under Canadian GAAP, the determination of policy liabilities is based on an explicit projection of cash flows using current best estimate assumptions for each material cash flow item and contingency. Investment returns are projected using the current asset portfolios and projected re-investment strategies. Each assumption is adjusted by a margin for adverse deviation. As a result of this methodology, experience gains (losses) arise when equity, interest rate, credit and other non-fixed income returns differ from our best estimate policy liability assumptions. |
| (3) | The total cost of macro equity hedges entered into late in the fourth quarter was $82 million and includes a $34 million charge related to the estimated expected cost of the macro equity hedges relative to our long-term valuation assumptions. The estimated expected cost of these hedges was included in net income excluding the direct impact of equity markets and interest rates as well as in adjusted earnings from operations. The $48 million difference was reported as direct impact of equity markets and was excluded from adjusted earnings from operations. |
| (4) | Adjusted earnings from operations excludes the impact of changes in currency exchange rates from those in effect at June 30, 2009 when we originally provided our estimate of this amount. Since that time, the Canadian dollar has strengthened and the Canadian dollar equivalent of one U.S. dollar has declined from $1.1625 as at June 30, 2009 to $0.9946 as at December 31, 2010. The average daily exchange rate for the quarter was $1.01276. This decline has decreased the reported net income by $50 million during the quarter. |
Impact of higher equity markets and interest rates
The direct impact of higher equity markets and higher interest rates in the fourth quarter resulted in net gains of $861 million.
The increase in equity markets in excess of the returns we assumed in the valuation of our policy liabilities resulted in gains of $274 million on our variable annuity liabilities that were not dynamically hedged and $117 million of gains on general fund equity investments supporting policy liabilities and on fee income.
Partially offsetting this was the portion of the loss on macro equity hedges classified as an experience loss. As outlined above, the full loss on the macro hedges was $82 million, of which $34 million represents the estimated expected cost relative to our long-term valuation assumptions. We estimate the expected after-tax cost of these macro equity hedges in the first quarter of 2011 will be approximately $100 million, relative to our long-term valuation assumptions.
Higher interest rates in the fourth quarter resulted in a $516 million increase in earnings and we realized $2 million of net gains on the sale of bonds classified as AFS.
Gains related to variable annuity business dynamically hedged
As outlined in the Risk Management section below, the profit (loss) of the hedge assets may not completely offset the losses (gains) related to the guarantee liabilities hedged, in any particular quarter, for a number of reasons. In the fourth quarter, the gain of $184 million was primarily due to the un-hedged interest rate sensitivity and the positive fund performance compared to our hedge instruments.
Other favourable investment experience
The other net favourable investment experience is primarily attributed to the impact on policy liabilities of the fixed income investment activities to lengthen the duration of fixed income assets supporting policy liabilities.
The Company’s fixed income portfolio continued to perform very well relative to overall market conditions. Net credit impairments of $11 million and charges related to credit downgrades of $7 million were less than the expected credit losses assumed in the valuation of policy liabilities.
On our alternative non-fixed income class of investments, gains related to real estate, timber and agriculture holdings were more than offset by a reduction in the fair value of our oil and gas holdings.
Tax related gains on closed tax years and net policyholder experience gains
Gains of $103 million were booked in the fourth quarter relating to the closure of prior year tax issues. Policyholder experience was a net gain of $36 million for the quarter with favourable claims experience in our Reinsurance, Asia and Canadian Divisions.
Earnings per Share and Return on Common Shareholders’ Equity
Earnings per common share for the fourth quarter of 2010 was $1.00 compared to $0.51 for the fourth quarter of 2009. Return on common shareholders’ equity was 28.6 per cent for the fourth quarter of 2010 (fourth quarter of 2009 – 13.1 per cent).
Premiums and Deposits
Total Company fourth quarter premiums and deposits of $4.7 billion for insurance products that we are targeting to grow was up eight per cent, on a constant currency basis, over the fourth quarter of 2009 with Asia driving the growth. Premiums and deposits reflects both premiums and deposits received on new sales as well as the recurring premiums and deposits on the growing in-force business.
Total Company fourth quarter premiums and deposits for the insurance lines we are not targeting to grow was $1.0 billion, a decrease of 52 per cent on a constant currency basis from the fourth quarter of 2009. The decline reflects both a one-time deposit received in the fourth quarter of 2009 from a former joint venture partner when JH LTC became the sole carrier of the U.S. Federal Long Term Care Insurance Program and also the impact of lower sales.
Total Company premiums and deposits for the wealth businesses we are targeting to grow was $9.5 billion for the fourth quarter of 2010, an increase of 23 per cent on a constant currency basis compared to the same quarter of 2009. Growth was driven by strong mutual fund sales, partially offset by lower fixed product sales in both the U.S. and Canada.
Total Company premiums and deposits for the wealth products we are not targeting to grow (VA and book value fixed deferred annuity products) amounted to $1.5 billion for the fourth quarter of 2010. These results represent a year over year decrease of 25 per cent on a constant currency basis.
Premiums and Deposits
| | | | | | | | | | | | | | | | |
For the quarter ended December 31, (C$ millions) | | 2010 | | | 2009 | | | 2008 | | | | |
Insurance products targeted for growth | | $ | 4,745 | | | $ | 4,437 | | | $ | 4,635 | | | | | |
Insurance products not targeted for growth(1) | | | 972 | | | | 2,124 | | | | 963 | | | | | |
Wealth products targeted for growth | | | 9,511 | | | | 7,976 | | | | 8,386 | | | | | |
Wealth products not targeted for growth (VAs and book value deferred fixed annuities) | | | 1,479 | | | | 1,998 | | | | 5,509 | | | | | |
Total premiums and deposits | | $ | 16,707 | | | $ | 16,535 | | | $ | 19,493 | | | | | |
| (1) | JH Life universal life with lifetime no-lapse guarantees and guaranteed non-par whole life products as well as products in JH Long-Term Care. |
Performance by Division
Asia Division
Manulife Financial has operated in Asia since 1897, beginning in Hong Kong and the Philippines and expanding into Singapore, Indonesia, Taiwan, China, Japan, Vietnam, Malaysia and Thailand. We provide protection and wealth management products in select markets throughout the region. Protection products include life insurance, group life and health, and hospital coverage. Wealth management products include mutual funds, pensions, variable annuities and segregated funds. We distribute our products through a multi-channel network, including exclusive agents, independent agents, banks, financial advisors and other alternative channels.
In 2010, Asia Division contributed 15 per cent of the Company’s total premiums and deposits and, as at December 31, 2010, accounted for 14 per cent of the Company’s funds under management.
Financial Performance
Asia Division’s net income attributed to shareholders for 2010 was US$600 million compared to US$1.5 billion in 2009. Included in 2010 are net experience losses of US$252 million (2009 – gains of US$559 million) as a result of equity, interest rate, credit and other non-fixed income returns differing from our best estimate policy liability assumptions. Excluding these items and one-time tax benefits in 2009 and 2010, net income attributed to shareholders increased by US$47 million driven by higher fee income and in-force earnings on variable annuities in Japan as well as business growth across the territories. On a Canadian dollar basis, net income attributed to shareholders for 2010 was $623 million compared to $1,739 million reported a year earlier.
Summary Statements of Operations
| | | | | | | | | | | | | | | | | | | | | | | | | | | | | | | | |
For the years ended December 31, ($ millions) | | Canadian $ | | | | | | US $ | | | | |
| | 2010 | | | 2009 | | | 2008 | | | | | | 2010 | | | 2009 | | | 2008 | | | | |
Revenue | | | | | | | | | | | | | | | | | | | | | | | | | | | | | | | | |
Premium income | | $ | 4,855 | | | $ | 4,025 | | | $ | 3,381 | | | | | | | $ | 4,719 | | | $ | 3,541 | | | $ | 3,159 | | | | | |
Investment income | | | | | | | | | | | | | | | | | | | | | | | | | | | | | | | | |
Investment income | | | 914 | | | | 860 | | | | 838 | | | | | | | | 889 | | | | 755 | | | | 789 | | | | | |
Realized and unrealized gains (losses) on
assets supporting policy liabilities | | | 844 | | | | 1,118 | | | | (1,458 | ) | | | | | | | 809 | | | | 1,033 | | | | (1,412 | ) | | | | |
Other revenue | | | 842 | | | | 830 | | | | 853 | | | | | | | | 818 | | | | 731 | | | | 805 | | | | | |
Total revenue | | $ | 7,455 | | | $ | 6,833 | | | $ | 3,614 | | | | | | | $ | 7,235 | | | $ | 6,060 | | | $ | 3,341 | | | | | |
Policyholder benefits | | $ | 4,926 | | | $ | 4,001 | | | $ | 1,857 | | | | | | | $ | 4,783 | | | $ | 3,539 | | | $ | 1,592 | | | | | |
General expenses | | | 815 | | | | 768 | | | | 671 | | | | | | | | 792 | | | | 674 | | | | 629 | | | | | |
Investment expenses | | | 69 | | | | 52 | | | | 48 | | | | | | | | 68 | | | | 46 | | | | 46 | | | | | |
Commissions | | | 763 | | | | 671 | | | | 708 | | | | | | | | 742 | | | | 590 | | | | 668 | | | | | |
Other | | | 104 | | | | 76 | | | | 107 | | | | | | | | 99 | | | | 66 | | | | 100 | | | | | |
Total policy benefits and expenses | | $ | 6,677 | | | $ | 5,568 | | | $ | 3,391 | | | | | | | $ | 6,484 | | | $ | 4,915 | | | $ | 3,035 | | | | | |
Income before income taxes | | $ | 778 | | | $ | 1,265 | | | $ | 223 | | | | | | | $ | 751 | | | $ | 1,145 | | | $ | 306 | | | | | |
Income tax recovery (expense) | | | (91 | ) | | | 464 | | | | (61 | ) | | | | | | | (88 | ) | | | 375 | | | | (78 | ) | | | | |
Net income | | $ | 687 | | | $ | 1,729 | | | $ | 162 | | | | | | | $ | 663 | | | $ | 1,520 | | | $ | 228 | | | | | |
Less net income (loss) attributed to participating policyholders | | | 64 | | | | (10 | ) | | | (15 | ) | | | | | | | 63 | | | | (10 | ) | | | (15 | ) | | | | |
Net income attributed to shareholders | | $ | 623 | | | $ | 1,739 | | | $ | 177 | | | | | | | $ | 600 | | | $ | 1,530 | | | $ | 243 | | | | | |
Premiums and Deposits
Premiums and deposits, excluding variable annuities, were US$8.3 billion, up 26 per cent from US$6.6 billion reported in 2009. Higher premiums and deposits were driven by the inclusion of Manulife TEDA, the recently acquired asset management joint venture in China, strong sales of unit-linked products and mutual funds in combination with higher insurance premium growth due to in-force business growth and record sales. Premiums and deposits for variable annuity products were US$1.3 billion, down US$0.2 billion from US$1.5 billion reported in 2009.
Premium income grew 33 per cent over 2009 driven by robust business growth across the territories and strong sales due to new products launched in Japan, Hong Kong and Taiwan as well as continued expansion in China.
Segregated fund deposits, excluding variable annuities, were up three per cent over 2009 due to higher unit-linked product sales in Indonesia, Hong Kong and Singapore. This was partly offset by lower pension deposits in Hong Kong as 2009 was buoyed by a one-time government contribution.
Mutual fund deposits were US$1.8 billion, up US$0.5 billion over 2009 driven by the inclusion of mutual fund deposits from Manulife TEDA, our recently acquired asset management joint venture in China, as well as strong contributions from Indonesia and Hong Kong.
Premiums and Deposits
| | | | | | | | | | | | | | | | | | | | | | | | | | | | | | | | |
For the years ended December 31, ($ millions) | | | | | | | | Canadian $ | | | | | | | | | | | | US $ | | | | |
| | 2010 | | | 2009 | | | 2008 | | | | | | 2010 | | | 2009 | | | 2008 | | | | |
Premium income | | $ | 4,855 | | | $ | 4,025 | | | $ | 3,381 | | | | | | | $ | 4,719 | | | $ | 3,541 | | | $ | 3,159 | | | | | |
Segregated fund deposits excluding variable annuities | | | 1,918 | | | | 2,067 | | | | 2,079 | | | | | | | | 1,864 | | | | 1,810 | | | | 1,974 | | | | | |
Mutual fund deposits | | | 1,792 | | | | 1,470 | | | | 531 | | | | | | | | 1,750 | | | | 1,262 | | | | 498 | | | | | |
Premiums and deposits excluding variable annuities | | $ | 8,565 | | | $ | 7,562 | | | $ | 5,991 | | | | | | | $ | 8,333 | | | $ | 6,613 | | | $ | 5,631 | | | | | |
Variable annuities premiums and deposits | | | 1,314 | | | | 1,746 | | | | 3,758 | | | | | | | | 1,269 | | | | 1,496 | | | | 3,589 | | | | | |
Total premiums and deposits | | $ | 9,879 | | | $ | 9,308 | | | $ | 9,749 | | | | | | | $ | 9,602 | | | $ | 8,109 | | | $ | 9,220 | | | | | |
Funds under Management
Funds under management as at December 31, 2010 were US$68.1 billion, up 25 per cent from December 31, 2009. Growth was driven by net policyholder cash inflows across the territories of US$3.8 billion, an increase in the market value of funds under management, the impact of currency and assets under management of US$2.0 billion related to the acquired 49 per cent interest in our asset management joint venture in China, Manulife TEDA.
Funds under Management
| | | | | | | | | | | | | | | | | | | | | | | | | | | | | | | | |
As at December 31, ($ millions) | | | | | | | | Canadian $ | | | | | | | | | | | | US $ | | | | |
| | 2010 | | | 2009 | | | 2008 | | | | | | 2010 | | | 2009 | | | 2008 | | | | |
General fund | | $ | 29,130 | | | $ | 24,469 | | | $ | 21,406 | | | | | | | $ | 29,293 | | | $ | 23,377 | | | $ | 17,476 | | | | | |
Segregated funds | | | 24,026 | | | | 27,218 | | | | 24,541 | | | | | | | | 24,159 | | | | 26,007 | | | | 20,039 | | | | | |
Mutual and other funds | | | 14,557 | | | | 5,547 | | | | 4,024 | | | | | | | | 14,638 | | | | 5,299 | | | | 3,286 | | | | | |
Total funds under management | | $ | 67,713 | | | $ | 57,234 | | | $ | 49,971 | | | | | | | $ | 68,090 | | | $ | 54,683 | | | $ | 40,801 | | | | | |
Moving Forward
Asia Division continues to pursue a growth strategy leveraging our core strength in professional agency distribution; we intend to continue to grow our agency force, focus on alternative channel distribution, grow our mutual fund businesses and build on the strength of our brand across Asia. We intend to continue to expand product offerings to capitalize on existing markets and reach new market segments.
In Hong Kong, our brand recognition is supported by our 1.5 million customers, strong financial ratings and a professionally trained sales force of over 4,500 agents. Our strategy is to continue to increase our agency force through industry and organic recruitment as well as focus on diversifying our distribution in the bancassurance channel through new partnerships. In addition, we intend to expand our relationship in the independent financial advisory and broker market by strengthening our wholesaling and account management capabilities and by building a service and compliance support platform that differentiates us from our competitors. As the retail investment funds market is a major growth opportunity in Hong Kong, we intend to modernize the retail asset management platform to attract new and existing customers to increase their fund investments.
In Japan, we continue to execute a strategy of diversifying product offerings and broadening our distribution capabilities. In 2010, the record-high insurance business sales were driven by new product offerings and a successful development of all our distribution channels. We had significant sales growth in the captive agency channel and strong gains in the corporate market through our Managing General Agent (“MGA”) channel. In addition, our first insurance product launched through Mitsubishi UFJ Financial Group (“MUFG”) has been extremely successful.
Going forward, we will be pursuing a balanced growth strategy where the Company will continue to be a distributor of multiple product lines through multiple channels. We will pursue this objective by seeking to expand our number of independent agencies while deepening our relationships with our original top agencies by expanding our product offerings, particularly in the retail area. We also look to replicate the MUFG insurance sales success through other banks in part by capitalizing on our current sales agreements for annuity products.
Other Asia Territories’ operations continue to be increasingly important contributors to our overall results. In 2010, we observed strong results with many of our businesses reaching record levels. We expect to continue this success through distribution initiatives including growing our professional agency franchise through various recruitment initiatives, deepening our existing relationships with key distribution partners and exploring other new distribution channels.
In China, our focus continues to be on geographic expansion to solidify our position as a leading Sino-foreign insurance joint venture. We ended 2010 with operations in 42 cities as well as three additional preparation licenses and will continue to focus on growing our operations geographically.
In 2010, Manulife closed its acquisition of a fund management company in China with the name rebranded as Manulife TEDA. We will explore cross-selling opportunities with Manulife TEDA and leverage the strong relationship with TEDA to facilitate cooperation with China Bohai Bank (“CBHB”) to further expand in the bank channel.
Canadian Division
Our Canadian Division is one of the leading insurance based financial services organizations in Canada. We offer a diverse portfolio of products, services and distribution channels to meet the needs of a broad marketplace. Our individual life and living benefits insurance products are aimed at middle and upper-income individuals and business owners. Group life, health, disability and retirement products and services are marketed to Canadian employers. We also market life, health and specialty products, such as travel insurance, to consumers through a number of alternative distribution channels. Our individual wealth management product offerings include mutual funds, fixed and variable annuities, guaranteed investment certificates and high interest savings accounts. In addition, through Manulife Bank, we offer a variety of lending products including fixed and variable rate mortgages, most notably our innovative Manulife One product, and investment loans.
In 2010, Canadian Division contributed 25 per cent of the Company’s total premiums and deposits and, as at December 31, 2010, accounted for 24 per cent of the Company’s funds under management.
Financial Performance
Canadian Division’s net income attributed to shareholders for 2010 was $950 million compared to $745 million in 2009. Net income in 2010 included experience net losses of $95 million (2009 – $326 million) as a result of equity, interest rate, credit and other non-fixed income returns differing from our best estimate policy liability assumptions.
Excluding these items, net income attributed to shareholders decreased by $26 million. The positive impact from growth in asset levels in our wealth management operations and Manulife Bank was offset by the impact of hedging variable annuity guarantees and less favourable lapse experience than a year ago. Strong sales growth in Individual Insurance and mutual funds, in combination with lower sales of variable annuities and declining market yields, drove significantly higher strain on new business which reduced earnings in 2010. Both years included tax related gains and in 2010, gains related to the closure of prior year tax issues increased income by $186 million.
Net income attributed to participating policyholders was $15 million, as compared to $28 million in 2009.
Summary Statement of Operations
For the years ended December 31,
| | | | | | | | | | | | | | | | |
| (C$ millions) | | 2010 | | | 2009 | | | 2008 | | | | |
Revenue | | | | | | | | | | | | | | | | |
Premium income(1) | | $ | 3,855 | | | $ | 5,292 | | | $ | 6,765 | | | | | |
Investment income | | | | | | | | | | | | | | | | |
Investment income | | | 2,746 | | | | 2,627 | | | | 2,908 | | | | | |
Realized and unrealized gains (losses) on assets supporting policy liabilities | | | 1,246 | | | | 1,617 | | | | (2,364 | ) | | | | |
Other revenue(1) | | | 1,762 | | | | 1,448 | | | | 1,116 | | | | | |
Total revenue | | $ | 9,609 | | | $ | 10,984 | | | $ | 8,425 | | | | | |
Policyholder benefits(1) | | $ | 5,915 | | | $ | 8,131 | | | $ | 4,344 | | | | | |
General expenses | | | 1,095 | | | | 1,001 | | | | 1,030 | | | | | |
Investment expenses | | | 308 | | | | 272 | | | | 269 | | | | | |
Commissions | | | 1,141 | | | | 1,069 | | | | 1,127 | | | | | |
Other | | | 384 | | | | 408 | | | | 537 | | | | | |
Total policy benefits and expenses | | $ | 8,843 | | | $ | 10,881 | | | $ | 7,307 | | | | | |
Income before income taxes | | $ | 766 | | | $ | 103 | | | $ | 1,118 | | | | | |
Income tax recovery (expense) | | | 199 | | | | 670 | | | | (467 | ) | | | | |
Net income | | $ | 965 | | | $ | 773 | | | $ | 651 | | | | | |
Less net income (loss) attributed to participating policyholders | | | 15 | | | | 28 | | | | (5 | ) | | | | |
Net income attributed to shareholders | | $ | 950 | | | $ | 745 | | | $ | 656 | | | | | |
| (1) | At the end of the first quarter of 2009, Group Benefits entered into an external reinsurance agreement the impact of which has been reflected in premiums, other revenue and policyholder benefits. |
Premiums and Deposits
Premiums and deposits, excluding variable annuities, for the year ended December 31, 2010 were $14.0 billion, up three per cent from $13.6 billion reported in 2009. Improved consumer confidence in investment markets, in combination with the Company’s targeted strategy, drove record mutual fund deposits to almost triple 2009 volumes with strong growth in funds targeting yield and safety, industry categories currently favoured by consumers. This growth was dampened by reduced sales of fixed products which were significantly below the record levels of 2009 when investors sought safety in fixed returns. Growth in the insurance businesses also contributed to the year-over-year increase.
Consistent with the Company’s continued focus on risk diversification, premiums and deposits for variable annuity products were $2.5 billion, down $0.8 billion from $3.3 billion reported in 2009.
Premiums and Deposits
For the years ended December 31,
| | | | | | | | | | | | | | | | |
| (C$ millions) | | 2010 | | | 2009 | | | 2008 | | | | |
Premiums | | $ | 3,855 | | | $ | 5,292 | | | $ | 6,765 | | | | | |
Segregated fund deposits excluding variable annuities | | | 2,491 | | | | 2,421 | | | | 1,973 | | | | | |
Mutual fund deposits | | | 1,379 | | | | 508 | | | | 515 | | | | | |
ASO premium equivalents | | | 2,647 | | | | 2,629 | | | | 2,488 | | | | | |
Group Benefits ceded(1) | | | 3,675 | | | | 2,760 | | | | – | | | | | |
Premiums and deposits excluding variable annuities | | $ | 14,047 | | | $ | 13,610 | | | $ | 11,741 | | | | | |
Variable annuities premiums and deposits | | | 2,539 | | | | 3,307 | | | | 4,638 | | | | | |
Total premiums and deposits | | $ | 16,586 | | | $ | 16,917 | | | $ | 16,379 | | | | | |
| (1) | At the end of the first quarter of 2009, Group Benefits entered into an external reinsurance agreement which resulted in a substantial reduction in net premium revenue reported in the income statement. The Company continues to retain certain benefits and certain risks on this business and the associated direct premiums continue to be included in the overall premiums and deposits metric as “Group Benefits ceded”. |
Funds under Management
Funds under management grew by 11 per cent or $11.0 billion to $113.6 billion as at December 31, 2010 compared to December 31, 2009. The increase reflects the impact of equity market appreciation and the decline in interest rates on asset values, as well as growth across the division driven by positive net sales in wealth products and Manulife Bank during 2010.
Funds under Management
As at December 31,
| | | | | | | | | | | | | | | | |
| (C$ millions) | | 2010 | | | 2009 | | | 2008 | | | | |
General fund | | $ | 65,628 | | | $ | 59,898 | | | $ | 52,314 | | | | | |
Segregated funds | | | 40,773 | | | | 36,258 | | | | 27,628 | | | | | |
Mutual and other funds | | | 7,214 | | | | 6,508 | | | | 2,320 | | | | | |
Total funds under management | | $ | 113,615 | | | $ | 102,664 | | | $ | 82,262 | | | | | |
Moving Forward
Our vision is to be the premier insurance based financial services organization in Canada with a reputation for innovative products, excellent service, and professional value-added advice. Our focus on distribution excellence, product leadership, cross-business unit collaboration and providing service value to our customers, in combination with the strength of the Manulife brand, has made us a market leader in many of our businesses.
The Canadian market is mature and market share in traditional products is concentrated in a small number of companies. In order to maintain and grow our leading industry position, we operate in a wide range of product and consumer markets, rather than through a more selective niche-based approach. Growth is projected across all business lines in Canadian Division. However, given the current demographic and economic environment, we project accelerated growth opportunities in Manulife Bank, Mutual Funds, Group Retirement Solutions and Affinity Markets relative to our other more mature businesses. These business lines are well aligned with the Company goals of risk diversification, efficient use of capital and optimizing risk-adjusted returns.
In 2010, the Company launched a comprehensive brand campaign targeting investors, government, opinion leaders and consumers. The complementary Canadian Division campaign is focused on enhancing Canadians’ perception of Manulife as strong, reliable, trustworthy and forward-thinking – the Company Canadians turn to for help with their most significant financial decisions. This long-term brand investment will continue in 2011 and beyond, with the goal to create stronger loyalty among key stakeholders – consumers, advisors, employees – and open new opportunities for growth in Canada.
Our focus on building strong distribution capabilities and capacity has been a key contributor to our success to date. We believe there is significant opportunity to grow organically through ongoing expansion of our multi-channel, independent distribution platforms. In 2011, we intend to continue to enhance our distribution relationships, including expanding relationships across business and product lines, and to attract more advisors in all of our businesses. We will also continue to invest in the industry-leading professional value-added services provided by our tax and estate planning teams, as well as channel and product wholesalers who market our product and sales solutions to advisors.
Contributing to our distribution success is our commitment to provide advisors with competitive products and services to meet customers’ diverse needs. The breadth of our wealth management and insurance product offerings are well suited to the growing affluent baby boomer population. The aging baby boomer population, in conjunction with the focus of governments and employers on reducing the cost of benefits and pensions, creates opportunities for products and services targeting growth and safety of investments; inter-generational wealth transfer; and managing health care costs. We will continue to focus on this target market, enhancing our life, living benefits, banking and savings products to meet the evolving needs of the Canadian population.
We are keenly focused on improving our mutual fund performance and diversifying our fund offerings, laying the foundation in 2010 with the introduction of new funds in key industry categories. Going forward, we will continue to focus on growth through the recently launched Manulife Trust Company which expands opportunities for our advisors to cross-sell innovative banking and trust products to existing customers as well as providing another avenue to introduce new customers to Manulife’s diverse portfolio of
wealth management products. Our group retirement and benefits businesses are focused on developing new products and services in response to the changing demographic and legislative landscape, including continued expansion in providing solutions to the fast-growing small business market.
Our product offerings and business and risk management practices continue to evolve with the changing business and regulatory environment. Throughout 2010, we reduced our equity exposure by hedging our variable annuity block of business and reducing our investment in public equities. We intend to continue to hedge the variable annuity new business and opportunistically hedge the remaining in-force block as appropriate. As a result of the prolonged low interest rate environment, we increased universal life product prices effective for new applications as of December 2010, and will reduce minimum rate guarantees early in 2011. Major Canadian life insurance-based competitors have also announced similar actions to take effect in 2011. Our goal is to provide consumers with a broad portfolio of choices to meet their financial needs while maintaining an appropriate risk-return profile for the Company.
Service quality is key in all our businesses, supporting both sales growth and customer retention, and we closely monitor customer and advisor feedback in order to proactively improve their service experience. We continue to invest in updating infrastructure and expanding capacity in our high growth businesses, Manulife Bank, Manulife Mutual Funds, Group Retirement Solutions and Affinity Markets, as well as making efficiency improvements across the division through system changes, eliminating legacy systems and pursuing outsourcing and offshoring opportunities.
U.S. Insurance
Our U.S. Insurance operation provides life and long-term care insurance products and services to select markets. John Hancock Life (“Life”) focuses on high net worth and emerging affluent markets by providing estate and business planning and other solutions, with an array of protection and accumulation-oriented life insurance products. John Hancock Long-Term Care (“LTC”) currently offers a portfolio of individual products designed for the middle income to affluent markets. Our long-term care products cover the cost of long-term care services received at home, in the community or in long-term care facilities, in addition to providing care advisory services and provider discounts. We distribute our life and long-term care insurance products through a multi-channel network, including John Hancock Financial Network (“JHFN”), a national network of independent career agencies comprised of nearly 1,800 financial representatives across the U.S., offering insurance and wealth management solutions to individuals, families and businesses.
In 2010, U.S. Insurance contributed 11 per cent of the Company’s total premiums and deposits and, as at December 31, 2010, accounted for 16 per cent of the Company’s funds under management.
Financial Performance
U.S. Insurance reported a net loss attributed to shareholders of US$14 million for 2010, compared to a net loss of US$1,273 million for 2009. Included in the 2010 amount are net experience losses of US$390 million (2009 – US$1,483 million) as a result of equity, interest rate, credit and other non-fixed income returns differing from our best estimate policy liability assumptions. The increase in income, excluding these items, was US$166 million primarily due to favourable Life claims experience, improved LTC claims experience following the update in the annual review of policy liability assumptions for the results of a comprehensive long-term care claims experience study, as well as improved policyholder lapse experience. On a Canadian dollar basis, the net loss attributed to shareholders for 2010 was $16 million compared to a net loss of $1,441 million in 2009.
Summary Statements of Operations
| | | | | | | | | | | | | | | | | | | | | | | | | | | | | | | | |
For the years ended December 31, ($ millions) | | Canadian $ | | | | | | US $ | | | | |
| | 2010 | | | 2009 | | | 2008 | | | | | | 2010 | | | 2009 | | | 2008 | | | | |
Revenue | | | | | | | | | | | | | | | | | | | | | | | | | | | | | | | | |
Premium income | | $ | 5,979 | | | $ | 6,640 | | | $ | 5,751 | | | | | | | $ | 5,809 | | | $ | 5,854 | | | $ | 5,383 | | | | | |
Investment income | | | | | | | | | | | | | | | | | | | | | | | | | | | | | | | | |
Investment income | | | 3,042 | | | | 3,066 | | | | 2,886 | | | | | | | | 2,954 | | | | 2,686 | | | | 2,707 | | | | | |
Realized and unrealized gains (losses) on assets supporting policy liabilities | | | 913 | | | | (245 | ) | | | 933 | | | | | | | | 826 | | | | (117 | ) | | | 594 | | | | | |
Other revenue | | | 612 | | | | 649 | | | | 621 | | | | | | | | 595 | | | | 570 | | | | 583 | | | | | |
Total revenue | | $ | 10,546 | | | $ | 10,110 | | | $ | 10,191 | | | | | | | $ | 10,184 | | | $ | 8,993 | | | $ | 9,267 | | | | | |
Policyholder benefits | | $ | 8,639 | | | $ | 10,137 | | | $ | 6,829 | | | | | | | $ | 8,328 | | | $ | 9,021 | | | $ | 6,066 | | | | | |
General expenses | | | 629 | | | | 657 | | | | 592 | | | | | | | | 611 | | | | 578 | | | | 558 | | | | | |
Investment expenses | | | 137 | | | | 150 | | | | 136 | | | | | | | | 133 | | | | 133 | | | | 126 | | | | | |
Commissions | | | 1,022 | | | | 1,245 | | | | 1,288 | | | | | | | | 994 | | | | 1,099 | | | | 1,212 | | | | | |
Other | | | 160 | | | | 166 | | | | 160 | | | | | | | | 155 | | | | 145 | | | | 150 | | | | | |
Total policy benefits and expenses | | $ | 10,587 | | | $ | 12,355 | | | $ | 9,005 | | | | | | | $ | 10,221 | | | $ | 10,976 | | | $ | 8,112 | | | | | |
Income (loss) before income taxes | | $ | (41 | ) | | $ | (2,245 | ) | | $ | 1,186 | | | | | | | $ | (37 | ) | | $ | (1,983 | ) | | $ | 1,155 | | | | | |
Income tax recovery (expense) | | | 25 | | | | 804 | | | | (407 | ) | | | | | | | 23 | | | | 710 | | | | (398 | ) | | | | |
Net income (loss) attributed to shareholders | | $ | (16 | ) | | $ | (1,441 | ) | | $ | 779 | | | | | | | $ | (14 | ) | | $ | (1,273 | ) | | $ | 757 | | | | | |
Premiums and Deposits
Premiums and deposits for the year were US$7.1 billion, US$0.9 billion or 11 per cent lower than 2009 primarily due to the receipt in 2009 of a US$910 million segregated fund deposit as a result of John Hancock becoming the sole carrier of the Federal Long Term Care Insurance Program.
Premiums and Deposits
| | | | | | | | | | | | | | | | | | | | | | | | | | | | | | | | |
For the years ended December 31, ($ millions) | | Canadian $ | | | | | | US $ | | | | |
| | 2010 | | | 2009 | | | 2008 | | | | | | 2010 | | | 2009 | | | 2008 | | | | |
Premium income | | $ | 5,979 | | | $ | 6,640 | | | $ | 5,751 | | | | | | | $ | 5,809 | | | $ | 5,854 | | | $ | 5,383 | | | | | |
Segregated fund deposits | | | 1,287 | | | | 2,269 | | | | 1,398 | | | | | | | | 1,251 | | | | 2,060 | | | | 1,303 | | | | | |
Total premiums and deposits | | $ | 7,266 | | | $ | 8,909 | | | $ | 7,149 | | | | | | | $ | 7,060 | | | $ | 7,914 | | | $ | 6,686 | | | | | |
Funds under Management
Funds under management as at December 31, 2010 were US$74.2 billion, up 17 per cent from December 31, 2009 due to business growth and an increase in the market value of funds under management.
Funds under Management
| | | | | | | | | | | | | | | | | | | | | | | | | | | | | | | | |
| | | Canadian $ | | | | | | US $ | | | | |
| ($ millions) | | 2010 | | | 2009 | | | 2008 | | | | | | 2010 | | | 2009 | | | 2008 | | | | |
General fund | | $ | 61,651 | | | $ | 55,119 | | | $ | 59,967 | | | | | | | $ | 61,986 | | | $ | 52,665 | | | $ | 48,969 | | | | | |
Segregated funds | | | 12,196 | | | | 11,431 | | | | 10,342 | | | | | | | | 12,263 | | | | 10,922 | | | | 8,445 | | | | | |
Total funds under management | | $ | 73,847 | | | $ | 66,550 | | | $ | 70,309 | | | | | | | $ | 74,249 | | | $ | 63,587 | | | $ | 57,414 | | | | | |
Moving Forward
In 2011, U.S. Insurance will continue to focus on repositioning its business, in response to continued low levels of interest rates and current economic conditions, by de-emphasizing products that give rise to significant earnings volatility or produce low returns on capital employed.
Life will focus on adapting and innovating its product portfolio in response to the low interest rate environment. The business is introducing new Universal Life products that perform well for customers in the current markets and have an improved risk profile for the Company. The products are positioned to highlight the value of flexibility and liquidity through policy cash values as well as the potential for improved performance if investment returns increase over time. In addition, sales of Universal Life products with lifetime low cost guarantees have been de-emphasized through pricing action and are expected to represent a lower amount of total life insurance sales going forward. Life will support its key distribution partners with enhancements that will provide expanded electronic servicing capabilities. These expanded capabilities, which span all phases of support from streamlining of the new business process to significant enhancements in the electronic exchange of in-force customer service information, are expected to offer meaningful improvements in efficiency and customer satisfaction.
LTC’s focus in the near term will be the repricing of the in-force business in response to the comprehensive morbidity experience study that was conducted in 2010. The long-term care industry continues to be challenged with in-force rate increases and the departure of carriers from the industry, signaling a need to reassess product offerings. A key focus for us will be to reshape our products to better meet the needs of the consumer, while balancing the Company’s appetite for risk. With the emerging retiring population and the challenges with government funded long-term care programs, like Medicaid, the demographics and potential for this business are favourable. Finding the balance, however, between risk and consumer needs is where most of our focus will be in the short term. During this transition period, we will concentrate our efforts on maintaining and strengthening current distribution relationships that are critical to the success of our future product direction and growth.
JHFN remains a valuable asset and this was never more evident than during the market and economic challenges of the last two years. We continue to develop and invest in this enterprise that provides meaningful and diversified distribution opportunities.
U.S. Wealth Management
U.S. Wealth Management offers a broad range of personal and family oriented wealth management products and services focused on individuals and business markets, as well as institutional oriented products for employee benefit plan funding solutions. U.S. Wealth Management has three core business lines:
| n | | John Hancock Wealth Asset Management (“Wealth Asset Management”) which consists of John Hancock Retirement Plan Services (“Retirement Plan Services”) and John Hancock Mutual Funds (“Mutual Funds”) operations. Retirement Plan Services provides 401(k) plans to small and medium-sized businesses. Mutual Funds offers a variety of mutual funds, privately managed accounts and 529 College Savings plans. |
| n | | John Hancock Variable Annuities (“Variable Annuities”) offers variable annuity products sold mainly to middle and upper-income individuals. |
| n | | John Hancock Fixed Products (“Fixed Products”) provides fixed deferred annuities and fixed guaranteed income payout annuities to individuals, as well as a variety of spread based products and fee based products to institutional clients. |
In 2010, U.S. Wealth Management contributed 43 per cent of the Company’s total premiums and deposits and, as at December 31, 2010, accounted for 39 per cent of the Company’s funds under management.
Financial Performance
U.S. Wealth Management reported net income attributed to shareholders of US$755 million for 2010 compared to US$2,000 million for 2009. Included in the 2010 amount are net experience gains of US$115 million (2009 – US$1,339 million) as a result of equity, interest rate, credit and other non-fixed income returns differing from our best estimate policy liability assumptions. Excluding these items, net income attributed to shareholders decreased by US$21 million. Higher fee income in Wealth Asset Management from higher average assets under management was offset by the costs associated with the hedging of additional in-force variable annuity guaranteed value and the non-recurrence of tax benefits received in 2009 as a result of the successful outcome of certain tax appeals. On a Canadian dollar basis, net income attributed to shareholders for 2010 was $775 million compared to $2,186 million reported a year earlier.
Summary Statements of Operations
| | | | | | | | | | | | | | | | | | | | | | | | | | | | | | | | |
For the years ended December 31, ($ millions) | | Canadian $ | | | | | | US $ | | | | |
| | 2010 | | | 2009 | | | 2008 | | | | | | 2010 | | | 2009 | | | 2008 | | | | |
Revenue | | | | | | | | | | | | | | | | | | | | | | | | | | | | | | | | |
Premium income | | $ | 2,690 | | | $ | 5,866 | | | $ | 6,264 | | | | | | | $ | 2,613 | | | $ | 5,059 | | | $ | 5,791 | | | | | |
Investment income | | | | | | | | | | | | | | | | | | | | | | | | | | | | | | | | |
Investment income | | | 1,849 | | | | 2,044 | | | | 2,089 | | | | | | | | 1,802 | | | | 1,793 | | | | 1,963 | | | | | |
Realized and unrealized gains (losses) on assets supporting policy liabilities and consumer notes | | | 508 | | | | 687 | | | | (851 | ) | | | | | | | 457 | | | | 606 | | | | (835 | ) | | | | |
Other revenue | | | 2,789 | | | | 2,580 | | | | 2,545 | | | | | | | | 2,709 | | | | 2,277 | | | | 2,405 | | | | | |
Total revenue | | $ | 7,836 | | | $ | 11,177 | | | $ | 10,047 | | | | | | | $ | 7,581 | | | $ | 9,735 | | | $ | 9,324 | | | | | |
Policyholder benefits | | $ | 4,791 | | | $ | 5,626 | | | $ | 9,256 | | | | | | | $ | 4,620 | | | $ | 4,738 | | | $ | 8,314 | | | | | |
General expenses | | | 649 | | | | 755 | | | | 781 | | | | | | | | 630 | | | | 661 | | | | 734 | | | | | |
Investment expenses | | | 464 | | | | 451 | | | | 453 | | | | | | | | 450 | | | | 396 | | | | 427 | | | | | |
Commissions | | | 829 | | | | 994 | | | | 1,110 | | | | | | | | 805 | | | | 868 | | | | 1,043 | | | | | |
Other | | | 52 | | | | 175 | | | | 99 | | | | | | | | 51 | | | | 154 | | | | 94 | | | | | |
Total policy benefits and expenses | | $ | 6,785 | | | $ | 8,001 | | | $ | 11,699 | | | | | | | $ | 6,556 | | | $ | 6,817 | | | $ | 10,612 | | | | | |
Income (loss) before income taxes | | $ | 1,051 | | | $ | 3,176 | | | $ | (1,652 | ) | | | | | | $ | 1,025 | | | $ | 2,918 | | | $ | (1,288 | ) | | | | |
Income tax recovery (expense) | | | (276 | ) | | | (990 | ) | | | 731 | | | | | | | | (270 | ) | | | (918 | ) | | | 594 | | | | | |
Net income (loss) attributed to shareholders | | $ | 775 | | | $ | 2,186 | | | $ | (921 | ) | | | | | | $ | 755 | | | $ | 2,000 | | | $ | (694 | ) | | | | |
Premiums and Deposits
Premiums and deposits, excluding variable annuities and book value deferred annuities, were US$24.1 billion, up US$4.4 billion from US$19.7 billion in 2009 driven by higher sales in Wealth Asset Management. Premiums for book value fixed deferred annuities declined US$1.5 billion as a result of the suspension of new sales. Premiums and deposits of variable annuities were US$2.6 billion, down from US$5.3 billion in 2009 as a result of ongoing risk management initiatives.
General fund premiums, excluding variable annuities and book value deferred annuities, primarily from annuity sales in Fixed Products and from fixed rate investment product options in Wealth Asset Management, represented eight per cent of total premiums and deposits in 2010 and were six per cent higher than in 2009. The increase was primarily due to higher sales in Fixed Products.
Segregated fund deposits, excluding variable annuities, represented 46 per cent of total premiums and deposits in 2010. Segregated fund deposits of US$12.3 billion increased by ten per cent over 2009 driven by higher sales.
Mutual fund deposits represented 34 per cent of total premiums and deposits in 2010. Mutual fund deposits of US$9.2 billion were 53 per cent higher than in 2009 as a result of improved sales.
Premiums and Deposits
| | | | | | | | | | | | | | | | | | | | | | | | | | | | | | | | |
| For the years ended December 31, | | Canadian $ | | | | | | US $ | | | | |
| ($ millions) | | 2010 | | | 2009 | | | 2008 | | | | | | 2010 | | | 2009 | | | 2008 | | | | |
Premium income excluding variable annuities and book value fixed deferred annuities | | $ | 2,196 | | | $ | 2,298 | | | $ | 2,081 | | | | | | | $ | 2,134 | | | $ | 2,017 | | | $ | 1,937 | | | | | |
Segregated fund deposits excluding variable annuities | | | 12,646 | | | | 12,703 | | | | 13,020 | | | | | | | | 12,278 | | | | 11,156 | | | | 12,250 | | | | | |
Mutual fund deposits | | | 9,441 | | | | 6,755 | | | | 8,426 | | | | | | | | 9,169 | | | | 5,983 | | | | 8,040 | | | | | |
Other fund deposits | | | 532 | | | | 626 | | | | 534 | | | | | | | | 517 | | | | 553 | | | | 502 | | | | | |
Premiums and deposits excluding variable annuities and book value fixed deferred annuities | | $ | 24,815 | | | $ | 22,382 | | | $ | 24,061 | | | | | | | $ | 24,098 | | | $ | 19,709 | | | $ | 22,729 | | | | | |
Variable annuities premiums and deposits | | | 2,707 | | | | 6,211 | | | | 10,078 | | | | | | | | 2,627 | | | | 5,298 | | | | 9,465 | | | | | |
Book value fixed deferred annuities premiums | | | 136 | | | | 1,919 | | | | 1,273 | | | | | | | | 132 | | | | 1,663 | | | | 1,152 | | | | | |
Total premiums and deposits | | $ | 27,658 | | | $ | 30,512 | | | $ | 35,412 | | | | | | | $ | 26,857 | | | $ | 26,670 | | | $ | 33,346 | | | | | |
Funds under Management
Funds under management were US$188.0 billion, up 11 per cent from US$169.5 billion as at December 31, 2009. The increase was driven by a combination of investment returns and net policyholder cash flows.
Funds under Management
| | | | | | | | | | | | | | | | | | | | | | | | | | | | | | | | |
| As at December 31, | | Canadian $ | | | | | | US $ | | | | |
| ($ millions) | | 2010 | | | 2009 | | | 2008 | | | | | | 2010 | | | 2009 | | | 2008 | | | | |
General fund | | $ | 33,026 | | | $ | 35,482 | | | $ | 39,581 | | | | | | | $ | 33,205 | | | $ | 33,903 | | | $ | 32,322 | | | | | |
Segregated funds | | | 120,021 | | | | 113,440 | | | | 99,133 | | | | | | | | 120,673 | | | | 108,389 | | | | 80,952 | | | | | |
Mutual funds | | | 30,184 | | | | 25,044 | | | | 21,943 | | | | | | | | 30,347 | | | | 23,929 | | | | 17,919 | | | | | |
Other funds | | | 3,742 | | | | 3,477 | | | | 3,279 | | | | | | | | 3,762 | | | | 3,322 | | | | 2,677 | | | | | |
Total funds under management | | $ | 186,973 | | | $ | 177,443 | | | $ | 163,936 | | | | | | | $ | 187,987 | | | $ | 169,543 | | | $ | 133,870 | | | | | |
Moving Forward
U.S. Wealth Management will seek to continue the strong growth of its higher return fee based businesses, while continuing to offer consumer valued products in our annuity line. We will seek to accomplish this by capitalizing on our strong brand name, innovative and broad product offerings, expanding distribution opportunities and providing superior customer service, while maintaining strong financial discipline and risk management in the products we offer.
Retirement Plan Services will seek to continue its strong market presence in the small plan market segment and expand its presence into the mid-market through its extensive distribution footprint, leveraging product innovations such as a new online enrollment experience, new lifecycle investment options which allow participants to choose an investment glide path that suits their individual needs and extension of our current service excellence, removing additional administrative burdens from plan sponsors. We will also seek to grow assets of our in-force block of 1.7 million participants in more than 44,000 plans by launching a service to assist participants in consolidating their retirement assets into the John Hancock 401(k) plan and by increasing plan retention through a dedicated in-force relationship management team.
Mutual Funds will leverage the momentum from a record breaking 2010 by focusing on new distribution, product and marketing opportunities. Distribution resources have been expanded to support critical new sales channels such as Edward Jones and banks, as well as opportunities within the institutional, RIA and Defined Contribution Investment Only channels. Mutual Funds will continue to build innovative products, offering further depth and breadth through new fund adoptions, acquisitions or expansion of existing relationships enabling growth in market share. Mutual Funds will launch a new national advertising campaign with the goal to establish brand recognition of our asset management depth and capability.
Our annuity businesses will continue to provide secured retirement income solutions across a broad array of variable and fixed product offerings with growth expected to be modest as we focus on fee based product lines. We will continue to offer innovative retirement income solutions that address the real need of protecting our clients’ risk of outliving their retirement savings. We will expand our fixed products line with introductions of new fixed savings products that complement our existing market value adjusted product suite. We will continue to opportunistically seek growth in our institutional pension close out and structured settlement product segments.
Reinsurance Division
Established in 1984, our Reinsurance Division has become one of North America’s leading providers of risk management solutions, specializing in retrocession. In simple terms, reinsurance is the transfer of all or part of certain risks related to policies issued by an insurance company to a reinsurer. Retrocession is reinsurance whereby a reinsurer assumes risk from other reinsurers.
Through offices in Canada, the United States, Belgium, Barbados, Germany, Singapore and Japan, the Reinsurance Division provides customer-focused solutions and innovative products in the following lines of business:
| n | | Life – offering retrocession of traditional life mortality or longevity risks; the Life reinsurance business line markets directly to leading life reinsurance companies, primarily in North America and Europe, leveraging long standing relationships with many of these companies; |
| n | | Property and Casualty (“P&C”) – offering retrocession of traditional property catastrophe and aviation catastrophe risks; and |
| n | | International Group Program (“IGP”) – offering international employee benefits management to multinational corporations and their affiliates through a global network of life insurance companies, called “Network Partners”. |
While we no longer write new Accident & Health (“A&H”) or segregated fund guarantee business, Reinsurance Division actively manages a portfolio of A&H business and a block of segregated fund guarantees that have been in run-off for several years.
The Division contributes to the capital and financial management of the Company through designing and negotiating affiliate and external reinsurance solutions for other Divisions.
In 2010, Reinsurance Division contributed two per cent of the Company’s premiums and deposits.
Financial Performance
Reinsurance Division’s net income attributed to shareholders for the year 2010 was US$178 million, down 23 per cent from US$232 million reported in 2009. Included in the 2010 amount are net investment experience losses of US$20 million (2009 – US$51 million), as a result of equity, interest rate, credit and other non-fixed income returns differing from our best estimate policy liability assumptions. Excluding these items, net income attributed to shareholders declined US$85 million, primarily due to less favourable claims and lapse experience in Life Reinsurance compared to 2009.
Summary Statements of Operations
| | | | | | | | | | | | | | | | | | | | | | | | | | | | | | | | |
For the years ended December 31, ($ millions) | | Canadian $ | | | | | | US $ | | | | |
| | 2010 | | | 2009 | | | 2008 | | | | | | 2010 | | | 2009 | | | 2008 | | | | |
Revenue | | | | | | | | | | | | | | | | | | | | | | | | | | | | | | | | |
Premium income | | $ | 972 | | | $ | 1,123 | | | $ | 1,091 | | | | | | | $ | 944 | | | $ | 987 | | | $ | 1,028 | | | | | |
Investment income | | | | | | | | | | | | | | | | | | | | | | | | | | | | | | | | |
Investment income | | | 102 | | | | 130 | | | | 175 | | | | | | | | 100 | | | | 113 | | | | 164 | | | | | |
Realized and unrealized gains (losses) on assets supporting policy liabilities | | | 43 | | | | 74 | | | | (43 | ) | | | | | | | 40 | | | | 68 | | | | (45 | ) | | | | |
Other revenue | | | 26 | | | | 24 | | | | 24 | | | | | | | | 25 | | | | 20 | | | | 23 | | | | | |
Total revenue | | $ | 1,143 | | | $ | 1,351 | | | $ | 1,247 | | | | | | | $ | 1,109 | | | $ | 1,188 | | | $ | 1,170 | | | | | |
Policyholder benefits | | $ | 870 | | | $ | 959 | | | $ | 1,002 | | | | | | | $ | 844 | | | $ | 841 | | | $ | 926 | | | | | |
General expenses | | | 44 | | | | 49 | | | | 51 | | | | | | | | 43 | | | | 42 | | | | 48 | | | | | |
Investment expenses | | | 3 | | | | 5 | | | | 4 | | | | | | | | 3 | | | | 4 | | | | 4 | | | | | |
Commissions | | | 1 | | | | – | | | | 2 | | | | | | | | 1 | | | | – | | | | 2 | | | | | |
Other | | | 7 | | | | 8 | | | | 10 | | | | | | | | 6 | | | | 7 | | | | 9 | | | | | |
Total policy benefits and expenses | | $ | 925 | | | $ | 1,021 | | | $ | 1,069 | | | | | | | $ | 897 | | | $ | 894 | | | $ | 989 | | | | | |
Income before income taxes | | $ | 218 | | | $ | 330 | | | $ | 178 | | | | | | | $ | 212 | | | $ | 294 | | | $ | 181 | | | | | |
Income tax expense | | | (35 | ) | | | (69 | ) | | | (24 | ) | | | | | | | (34 | ) | | | (62 | ) | | | (27 | ) | | | | |
Net income attributed to shareholders | | $ | 183 | | | $ | 261 | | | $ | 154 | | | | | | | $ | 178 | | | $ | 232 | | | $ | 154 | | | | | |
Premiums
Premiums were US$944 million, down four per cent from US$987 million reported in 2009. Life Reinsurance premiums declined by nine per cent due to fluctuations in client reporting as well as an increase in the cost for experience refunds resulting from positive experience on contracts in surplus position. Higher sales volumes contributed to the increase in International Group Program premium income.
Premiums
| | | | | | | | | | | | | | | | | | | | | | | | | | | | | | | | |
For the years ended December 31, ($ millions) | | Canadian $ | | | | | | US$ | | | | |
| | 2010 | | | 2009 | | | 2008 | | | | | | 2010 | | | 2009 | | | 2008 | | | | |
Life Reinsurance | | $ | 472 | | | $ | 574 | | | $ | 584 | | | | | | | $ | 459 | | | $ | 504 | | | $ | 548 | | | | | |
Property and Casualty Reinsurance | | | 75 | | | | 84 | | | | 68 | | | | | | | | 72 | | | | 74 | | | | 63 | | | | | |
International Group Program | | | 425 | | | | 465 | | | | 439 | | | | | | | | 413 | | | | 409 | | | | 417 | | | | | |
Total premiums | | $ | 972 | | | $ | 1,123 | | | $ | 1,091 | | | | | | | $ | 944 | | | $ | 987 | | | $ | 1,028 | | | | | |
Moving Forward
Reinsurance Division continues to pursue opportunities to expand relationships both with key business partners and promising sources of new business. Risk management is a key element of all Reinsurance Division processes, with emphasis on sound pricing of new business and effective performance monitoring and management of in-force business. Reinsurance Division continues to leverage its technical expertise in providing innovative solutions to meet customer needs.
Life
The continued contraction of the traditional excess of loss life retrocession market due to increases in insurer and reinsurer retention has reduced new business volumes to the point where lapses now exceed new business and, therefore, our in-force is starting to shrink. This trend may flatten for 2011 and onwards if there is an increase in M&A activity in the insurance industry driving demand for reinsurance in order to spread risk and attract capital to support these transactions. The Company’s life retrocession market leadership position along with its capital strength mean we are well positioned to respond to client needs and provide mutually attractive solutions on in-force and excess-of-retention opportunities.
P&C
Manulife’s Property and Casualty catastrophe business did not incur an insured catastrophe loss in 2010 in spite of large market losses such as the Chile quake, the Deep Water Horizon explosion and the Australian floods. There was some market softening of property and casualty reinsurance rates for 2011 renewals due to the level of capital available in the market. The Company reviews the single maximum natural catastrophe event risk aggregate on a regular basis in conjunction with the evaluation of our overall balance sheet risk and volatility. Subsequent to the end of 2010, a devastating mega earthquake and tsunami hit Japan in March 2011. Although no claims have been reported to date, we expect to incur a loss on the contracts exposed to Japanese risks. Given the strict risk limits on this block of business, we expect that the first quarter 2011 loss will not be more than $150 million as a result of this event and the impact will not be material to Manulife Financial’s 2011 annual results.
IGP
IGP’s strategic objectives are to maintain its leading position in the North American market while continuing to grow market share in Europe and Asia. There will be a continued focus on sound underwriting of the contracts and maintaining solid, long-term relationships with our Network Partners, clients and intermediaries.
Corporate and Other
Corporate and Other is comprised of the earnings on assets backing capital, net of amounts allocated to operating divisions, changes in actuarial methods and assumptions and model enhancements, Investment Division’s external asset management business, the John Hancock Accident and Health operation, settlement costs for macro equity hedges and other non operating items.
As at December 31, 2010 Corporate and Other accounted for six per cent of the Company’s funds under management.
Financial Performance
Corporate and Other reported a net loss attributed to shareholders of $2,906 million in 2010 compared to a net loss of $2,088 million in 2009.
Contributing to the loss in 2010 were charges related to changes in actuarial methods and assumptions of $2,072 million, the goodwill impairment of $1,039 million, provisions for tax settlements on leveraged lease investments of $98 million and macro equity hedges of $82 million. Partially offsetting these items were realized gain on AFS bonds of $570 million.
The loss of $2,088 million in 2009 included a charge for changes in actuarial methods and assumptions of $1,286 million and credit, OTTI and private equity impairments of $345 million. In addition, tax related provisions on leveraged lease investments amounted to $139 million; and changes in the Ontario tax rate resulted in a charge of $131 million.
Summary Statements of Operations
| | | | | | | | | | | | | | | | |
For the years ended December 31, (C$ millions) | | 2010 | | | 2009 | | | 2008 | | | | |
Revenue | | | | | | | | | | | | | | | | |
Gross investment income | | $ | 1,603 | | | $ | 290 | | | $ | 455 | | | | | |
Interest on surplus funds allocated to divisions | | | (788 | ) | | | (965 | ) | | | (1,270 | ) | | | | |
Other revenue | | | 229 | | | | 327 | | | | 294 | | | | | |
Total revenue | | $ | 1,044 | | | $ | (348 | ) | | $ | (521 | ) | | | | |
General expenses | | $ | 500 | | | $ | 452 | | | $ | 421 | | | | | |
Investment expenses, net | | | (10 | ) | | | 17 | | | | 33 | | | | | |
Commissions | | | – | | | | 2 | | | | 1 | | | | | |
Changes in actuarial methods and assumptions | | | 2,948 | | | | 1,626 | | | | (454 | ) | | | | |
Goodwill impairment | | | 1,039 | | | | – | | | | – | | | | | |
Other | | | 511 | | | | 336 | | | | (46 | ) | | | | |
Total policy benefits and expenses | | $ | 4,988 | | | $ | 2,433 | | | $ | (45 | ) | | | | |
Loss before income taxes | | $ | (3,944 | ) | | $ | (2,781 | ) | | $ | (476 | ) | | | | |
Income tax recovery | | | 1,038 | | | | 693 | | | | 148 | | | | | |
Net loss attributed to shareholders | | $ | (2,906 | ) | | $ | (2,088 | ) | | $ | (328 | ) | | | | |
Funds under Management
Funds under management of $30.6 billion at December 31, 2010 include assets managed by Manulife Asset Management on behalf of institutional clients of $23.2 billion (2009 – $23.3 billion) and $7.6 billion (2009 – $9.8 billion) of the Company’s own funds. The decrease in the Company’s own funds is due to an increase in the assets allocated to the operating divisions and the impact of the strengthened Canadian dollar partially offset by proceeds from debt issuances during the year.
Funds under Management
| | | | | | | | | | | | | | | | |
As at December 31, (C$ millions) | | 2010 | | | 2009 | | | 2008 | | | | |
General fund | | $ | 7,570 | | | $ | 9,815 | | | $ | 11,298 | | | | | |
Segregated funds – elimination of amounts held by the Company | | | (148 | ) | | | (118 | ) | | | (220 | ) | | | | |
Third party funds managed by Investment Division | | | 23,170 | | | | 23,342 | | | | 24,016 | | | | | |
Total funds under management | | $ | 30,592 | | | $ | 33,039 | | | $ | 35,094 | | | | | |
Investment Division
Manulife Financial’s Investment Division manages the invested assets of the Company’s general fund, or the on-balance sheet assets, and through Manulife Asset Management, manages assets for third party retail and institutional clients. We manage a broad range of investments including public and private bonds, public and private equities, mortgages, real estate, oil and gas, infrastructure, timber and agriculture properties. The Division has a physical presence in key financial centres around the world, including in the United States, Canada, Hong Kong, Japan, the United Kingdom, Australia, and throughout South-East Asia.
General Fund
General Fund Investment Philosophy
Our investment philosophy is rooted in a bottom-up approach to developing an asset mix that matches the needs of our policyholder liabilities. We do not limit our portfolio to fixed income investments, but hold a blend of assets that are expected to drive superior returns and risk reduction for our stakeholders (our risk management strategy with respect to investments is outlined in the Risk Management section of this report). We use this disciplined approach across all of our segments, and we do not chase yield in the riskier end of the fixed income market. This philosophy has resulted in a well diversified, high quality investment portfolio.
General Fund Assets
As at December 31, 2010, our general fund invested assets totaled $199.4 billion, up from $187.5 billion at the end of 2009 largely due to net business cash flows, market movement and other items, partially offset by a stronger Canadian dollar. The assets include a variety of asset classes that are highly diversified by geography and sector. This diversification has historically produced superior returns while reducing overall risk. As part of the Company’s initiative to reduce interest rate risk, holdings in long-term Treasury bonds, and thereby government bonds, have increased from December 31, 2009 to December 31, 2010. The following charts show the composition, as at December 31, 2010 and December 31, 2009, by asset class.
General Fund Assets
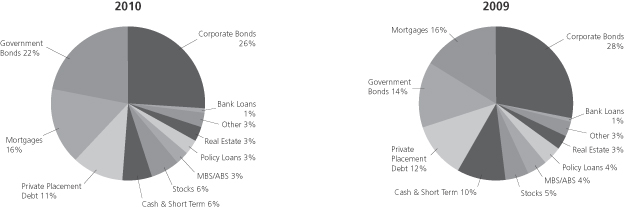
Public Bonds and Private Placement Debt
Of the Company’s public bond and private placement debt portfolio of $123.9 billion (2009 – $108.0 billion), 95 per cent are investment grade and 75 per cent are rated A or higher (2009 – 95 and 70 per cent, respectively). Overall, the percentage of AAA-rated public bonds has increased to 27 per cent (2009 – 20 per cent), largely attributable to the previously mentioned interest rate de-risking actions. The $22.3 billion (2009 – $22.9 billion) of private placement debt holdings provide diversification benefits (issuer, industry, and geography), and because they often provide stronger covenants and collateral than public bonds, they also provide better credit protection and potentially higher recoveries in the event of default.
The following charts provide information on the credit quality of these assets, as at December 31, 2010 and December 31, 2009.
Public Bonds and Private Placement Debt
The high quality portfolio is also diversified by sector, industry, duration, issuer, and geography. The following table shows the distribution of the carrying value of the $101.6 billion of public bonds and $22.3 billion of private placement debt holdings (2009 – $85.1 billion and $22.9 billion, respectively) by sector and industry.
Public Bonds and Private Placement Debt
| | | | | | | | | | | | | | | | | | | | | | | | | | | | | | | | |
As at December 31, Per cent of carrying value | | 2010 | | | | | | 2009 | | | | |
| | Public | | | Private
placement
debt | | | Total | | | | | | Public | | | Private
placement
debt | | | Total | | | | |
Government and agency | | | 42 | | | | 17 | | | | 38 | | | | | | | | 31 | | | | 15 | | | | 28 | | | | | |
Financial | | | 18 | | | | 10 | | | | 17 | | | | | | | | 23 | | | | 11 | | | | 20 | | | | | |
Telecommunications | | | 2 | | | | - | | | | 2 | | | | | | | | 3 | | | | - | | | | 2 | | | | | |
Utilities | | | 11 | | | | 28 | | | | 14 | | | | | | | | 13 | | | | 25 | | | | 16 | | | | | |
Energy | | | 7 | | | | 8 | | | | 7 | | | | | | | | 8 | | | | 6 | | | | 8 | | | | | |
Industrial | | | 4 | | | | 11 | | | | 6 | | | | | | | | 4 | | | | 12 | | | | 6 | | | | | |
Securitized (ABS/MBS) | | | 7 | | | | 1 | | | | 5 | | | | | | | | 9 | | | | 1 | | | | 7 | | | | | |
Consumer (non-cyclical) | | | 3 | | | | 10 | | | | 4 | | | | | | | | 3 | | | | 12 | | | | 5 | | | | | |
Consumer (cyclical) | | | 2 | | | | 6 | | | | 2 | | | | | | | | 2 | | | | 7 | | | | 3 | | | | | |
Basic materials | | | 2 | | | | 8 | | | | 3 | | | | | | | | 2 | | | | 8 | | | | 3 | | | | | |
Technology | | | 1 | | | | - | | | | 1 | | | | | | | | 1 | | | | 1 | | | | 1 | | | | | |
Media and internet | | | 1 | | | | 1 | | | | 1 | | | | | | | | 1 | | | | 2 | | | | 1 | | | | | |
Total per cent | | | 100 | | | | 100 | | | | 100 | | | | | | | | 100 | | | | 100 | | | | 100 | | | | | |
Gross Unrealized Losses
As at December 31, 2010, gross unrealized losses on our public bond and private placement debt holdings were $1.8 billion or two per cent of the amortized cost of these holdings (2009 – $2.4 billion or two per cent) of which $0.4 billion (2009 – $1.1 billion) relates to bonds trading below 80 per cent of cost for more than six months. Securitized assets represented $403 million of the gross unrealized losses and $345 million of the amounts trading below 80 per cent of cost for more than six months (2009 – $882 million and $761 million, respectively). The following chart shows the decline in gross unrealized losses from December 31, 2009 to December 31, 2010.
Gross Unrealized Losses
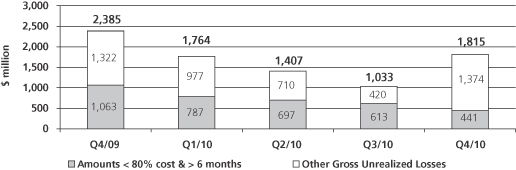
When adjusting for bonds held in the participating policyholder and other pass-through segments, as well as the provisions for credit included in the policy liabilities, the potential impact to shareholders’ pre-tax earnings for bonds trading at less than 80 per cent for greater than six months was approximately $287 million as at December 31, 2010.
Securitized Assets
As at December 31, 2010, the Company had $6.6 billion of public securitized assets in public bonds representing three per cent of total invested assets (2009 – $7.4 billion and four per cent). The following table outlines the public securitized holdings by type and asset quality.
Securitized Assets
| | | | | | | | | | | | | | | | | | | | | | | | | | | | |
As at December 31, (C$ millions), Carrying value | | 2010 | | | | | | 2009 | | | | |
| | RMBS | | | CMBS | | | ABS | | | Total | | | | | | Total | | | | |
AAA | | $ | 114 | | | $ | 3,981 | | | $ | 1,081 | | | $ | 5,176 | | | | | | | $ | 6,182 | | | | | |
AA | | | 106 | | | | 64 | | | | 107 | | | | 277 | | | | | | | | 243 | | | | | |
A | | | 15 | | | | 161 | | | | 57 | | | | 233 | | | | | | | | 157 | | | | | |
BBB | | | 35 | | | | 135 | | | | 181 | | | | 351 | | | | | | | | 320 | | | | | |
BB & below | | | 212 | | | | 224 | | | | 147 | | | | 583 | | | | | | | | 545 | | | | | |
Total public securitized assets | | $ | 482 | | | $ | 4,565 | | | $ | 1,573 | | | $ | 6,620 | | | | | | | $ | 7,447 | | | | | |
Residential Mortgage Backed Securities (“RMBS”) as at December 31, 2010 were $482 million (2009 – $525 million) of which $226 million were sub-prime and $105 million were Alt-A holdings and originations were concentrated in the years 2005 and prior.
Commercial Mortgage Backed Securities (“CMBS”) holdings at December 31, 2010 were $4.6 billion (2009 – $5.1 billion), with approximately 87 per cent of holdings rated AAA, of which approximately 94 per cent are in the most senior class. By vintage or year of origination, 88 per cent of the CMBS holdings were from years 2005 and prior.
Asset Backed Securities (“ABS”) holdings as at December 31, 2010 were $1.6 billion (2009 – $1.8 billion) and were both highly rated and well diversified by sector.
Mortgages
As at December 31, 2010, mortgages represented 16 per cent (2009 – 16 per cent) of invested assets with 58 per cent of the mortgage portfolio invested in Canada (2009 – 57 per cent) and 42 per cent in the United States (2009 – 43 per cent). The overall portfolio is also diversified by geographic region, property type and borrower. 32 per cent (2009 – 29 per cent) of the total mortgage portfolio is insured by CMHC, Canada’s AAA rated government backed national housing agency, with 83 per cent (2009 – 78 per cent) of residential mortgages insured and 13 per cent (2009 – 29 per cent) of commercial mortgages insured. The following table shows the distribution of the carrying value of the mortgage portfolio by property type.
Mortgages
| | | | | | | | | | | | | | | | | | | | | | | | |
| | | 2010 | | | | | | 2009 | | | | |
As at December 31, (C$ millions) | | Carrying
value | | | % of total | | | | | | Carrying
value | | | % of total | | | | |
Commercial | | | | | | | | | | | | | | | | | | | | | | | | |
Multi family residential | | $ | 3,681 | | | | 12 | | | | | | | $ | 3,850 | | | | 13 | | | | | |
Retail | | | 5,883 | | | | 19 | | | | | | | | 5,993 | | | | 19 | | | | | |
Office | | | 5,482 | | | | 17 | | | | | | | | 4,819 | | | | 16 | | | | | |
Industrial | | | 3,183 | | | | 10 | | | | | | | | 3,442 | | | | 11 | | | | | |
Other commercial | | | 2,950 | | | | 9 | | | | | | | | 2,774 | | | | 9 | | | | | |
| | $ | 21,179 | | | | 67 | | | | | | | $ | 20,878 | | | | 68 | | | | | |
Manulife Bank single residential | | | 9,003 | | | | 28 | | | | | | | | 7,901 | | | | 26 | | | | | |
Agriculture | | | 1,634 | | | | 5 | | | | | | | | 1,920 | | | | 6 | | | | | |
Total mortgages | | $ | 31,816 | | | | 100 | | | | | | | $ | 30,699 | | | | 100 | | | | | |
Commercial mortgages have been conservatively underwritten and accounted for 67 per cent (2009 – 68 per cent) of total mortgages. Geographically, 45 per cent are in Canada and 55 per cent in the United States. We are well diversified by property type and largely avoid risky segments of the market such as hotels, construction loans and second liens. As noted in the table below, the mortgages have low loan-to-value ratios, high debt-service coverage ratios and only a few loans in arrears.
Non-CMHC(1) Insured Commercial Mortgages
| | | | | | | | | | | | | | | | | | | | | | | | |
As at December 31, (C$ millions) | | 2010 | | | | | | 2009 | | | | |
| | | Canada | | | | U.S. | | | | | | | | Canada | | | | U.S. | | | | | |
Loan-to-Value ratio(2) | | | 64% | | | | 64% | | | | | | | | 64% | | | | 64% | | | | | |
Debt-Service Coverage ratio(2) | | | 1.47x | | | | 1.57x | | | | | | | | 1.53x | | | | 1.57x | | | | | |
Average duration | | | 3.2 years | | | | 4.9 years | | | | | | | | 3.3 years | | | | 4.9 years | | | | | |
Average loan size | | | $4.5 | | | | $9.4 | | | | | | | | $4.0 | | | $ | 9.3 | | | | | |
Loans in arrears(3) | | | 0.00% | | | | 0.11% | | | | | | | | 0.00% | | | | 0.08% | | | | | |
| (1) | CMHC is Canada Mortgage and Housing Corporation, Canada’s national housing agency. Also excludes Manulife Bank Commercial mortgage loans. |
| (2) | LTV and DSC are based on re-underwritten cash flows. |
| (3) | Arrears defined as over 90 days past due in Canada and over 60 days past due in the U.S. |
Real Estate
As at December 31, 2010, three per cent of the Company’s invested assets were held in real estate, with a carrying value of $6.4 billion (2009 – three per cent and $5.9 billion). The portfolio is diversified by geographic region, with 56 per cent located in the United States, 37 per cent in Canada and seven per cent in Asia (2009 – 56 per cent, 36 per cent, and eight per cent, respectively). The fair value of the portfolio was $6.7 billion as at December 31, 2010 (2009 – $6.3 billion). The high quality portfolio has virtually no leverage and is mostly premium urban office towers, concentrated in cities with stable growth and highly diverse economies in North America and Asia. The portfolio is well positioned with an average occupancy rate of 93.3 per cent (2009 – 92.8 per cent) and an average lease term of 5.7 years (2009 – 5.6 years). The following table shows the distribution of the carrying value and fair value of the real estate portfolio by property type.
Real Estate
| | | | | | | | | | | | | | | | | | | | | | | | | | | | | | | | |
As at December 31, (C$ millions) | | 2010 | | | | | | 2009 | | | | |
| | Fair
value | | | Carrying
value | | | % of total
carrying
value | | | | | | Fair value | | | Carrying
value | | | % of total
carrying
value | | | | |
Office | | $ | 4,690 | | | $ | 4,425 | | | | 70 | | | | | | | $ | 3,925 | | | $ | 3,614 | | | | 61 | | | | | |
Industrial | | | 575 | | | | 656 | | | | 10 | | | | | | | | 589 | | | | 669 | | | | 12 | | | | | |
Company use | | | 833 | | | | 772 | | | | 12 | | | | | | | | 1,192 | | | | 1,122 | | | | 19 | | | | | |
Other | | | 640 | | | | 505 | | | | 8 | | | | | | | | 637 | | | | 492 | | | | 8 | | | | | |
Total real estate | | $ | 6,738 | | | $ | 6,358 | | | | 100 | | | | | | | $ | 6,343 | | | $ | 5,897 | | | | 100 | | | | | |
Public Stocks
As at December 31, 2010, public stock holdings of $10.5 billion represented six per cent (2009 – five per cent) of invested assets. The portfolio is diversified by industry sector and issuer. As at December 31, 2010, $6.7 billion or 64 per cent of the stock portfolio was backing participating and pass-through segments (2009 – $6.0 billion and 62 per cent) and $3.8 billion or 36 per cent was supporting non-participating, non pass-through liability segments and surplus (2009 – $3.7 billion and 38 per cent). Geographically, 35 per cent (2009 – 40 per cent) is held in Canada, 28 per cent (2009 – 25 per cent) is held in the U.S. and the remaining 37 per cent (2009 – 35 per cent) is held in Asia, Europe and Other. Of the total portfolio, 64 per cent is actively managed with the remaining 36 per cent indexed (2009 – 65 and 35 per cent, respectively). The following charts show the distribution of the carrying value of stocks by segment.
Public Stocks
(C$ millions, unless otherwise noted)
| (1) | Equities denoted as pass-through are held by the Company to support the yield credited on equity-linked investment funds for Canadian universal life products. |
Other Investments
As at December 31, 2010, other investments represented three per cent (2009 – three per cent) of invested assets. The investments include private equity and mezzanine, power and infrastructure, oil and gas, timber, agriculture, affordable housing and other. Our alternative assets provide enhanced yields and provide a good match against our long duration liabilities, offering a diversification to traditional equity and bond markets. The following table shows the distribution of the carrying value of the other investments portfolio by sector and/or asset type.
Other Investments
| | | | | | | | | | | | | | | | | | | | | | | | |
As at December 31, (C$ millions) | | | | | 2010 | | | | | | | | | 2009 | | | | |
| | Carrying value | | | % of total | | | | | | Carrying value | | | % of total | | | | |
Private equity and mezzanine debt | | $ | 1,655 | | | | 27 | | | | | | | $ | 1,217 | | | | 23 | | | | | |
Power & infrastructure | | | 1,680 | | | | 27 | | | | | | | | 1,540 | | | | 29 | | | | | |
Oil & gas | | | 858 | | | | 14 | | | | | | | | 734 | | | | 14 | | | | | |
Timber | | | 768 | | | | 12 | | | | | | | | 794 | | | | 15 | | | | | |
Agriculture | | | 574 | | | | 9 | | | | | | | | 428 | | | | 8 | | | | | |
Affordable housing | | | 519 | | | | 8 | | | | | | | | 545 | | | | 10 | | | | | |
Other | | | 210 | | | | 3 | | | | | | | | 63 | | | | 1 | | | | | |
Total other investments | | $ | 6,264 | | | | 100 | | | | | | | $ | 5,321 | | | | 100 | | | | | |
Other Notable Items
The Company has no material exposure to synthetic credit or credit default swap protection. Additionally, the Company does not take on any material credit or liquidity risk with its securities lending programs. The Company has also avoided highly structured and complex instruments, such as Structured Investment Vehicles (SIVs), Constant Proportion Debt Obligations (CPDOs), U.S. Home Equity Lines of Credit (HELOCs) and Synthetic Securities that have resulted in significant losses to other institutions.
Manulife Asset Management
In December 2010, MFC Global Investment Management changed its brand name to Manulife Asset Management globally. In order to leverage the well known John Hancock brand in the United States, Manulife Asset Management is using John Hancock Asset Management as a sub-brand when providing investment management services related to John Hancock wealth management products sold in the United States.
Manulife Asset Management is a leading global institutional asset manager providing a comprehensive range of investment management capabilities and investment solutions for institutional clients, such as pension plans, foundations, endowments and financial institutions. Manulife Asset Management also partners with Manulife’s and John Hancock’s Wealth Management groups to provide their retail clients with superior investment products, using Manulife Asset Management investment capabilities.
Operating through the organization’s global network in 17 countries and territories, with over 275 investment professionals, our business model combines the asset manager empowerment of a boutique environment with the resources and risk management rigor of a global asset manager backed by a financial services leader.
Assets Under Management
Assets managed for external clients by Manulife Asset Management and its affiliates grew by 71 per cent, or $75.2 billion as at December 31, 2010 compared to December 31, 2009. This was largely driven by the inclusion of $61 billion of asset allocation funds from our U.S. Wealth Management business, as we consolidated management of all asset allocation assets under Manulife Asset Management. This reorganization leverages all the expertise of our asset allocation professionals in a closely aligned organization. This, combined with strong retail sales and market performance gains somewhat offset by the negative impact of a stronger Canadian dollar, drove the increase year over year.
Assets Under Management
| | | | | | | | | | | | |
As at December 31 (C$ millions) | | 2010 | | | 2009(2) | | | 2008(2) | |
Managed on behalf of Operating Divisions(1) | | $ | 158,163 | | | $ | 83,074 | | | $ | 69,309 | |
Managed on behalf of Institutional clients | | | 23,412 | | | | 23,305 | | | | 23,838 | |
Total assets under management(3) | | $ | 181,575 | | | $ | 106,379 | | | $ | 93,147 | |
| (1) | Includes 49 per cent share of Manulife TEDA Fund Management Company Ltd., based on the joint venture ownership structure. |
| (2) | Amounts have been restated to be consistent with 2010 figures. |
| (3) | Represents total assets managed for external clients by Manulife Asset Management and its affiliates. In total, Manulife Asset Management manages $209 billion for external and internal clients. |
Moving Forward
Manulife Asset Management expects to remain focused on providing strong and consistent risk-adjusted performance to our clients. Growth is expected to be achieved by leveraging our capabilities around the world, including cross-selling across regions and across asset classes, as well as by expanding our distribution reach and brand awareness.
Our focus on providing repeatable, long-term performance to our clients is evidenced by the increase in five and four-Morningstar rated funds as well as our leading position as the largest provider of timber investment management to institutional clients. As at December 31, 2010, Morningstar awarded us 41 five and four-star rated funds, up from 27 at the end of 2009.
Risk Management
Overview
Manulife Financial is a financial institution offering insurance, wealth and asset management products and services, which subjects the Company to a broad range of risks. We manage these risks within an enterprise-wide risk management framework. Our goal in managing risk is to strategically optimize risk taking and risk management to support long-term revenue, earnings and capital growth. We seek to achieve this by capitalizing on business opportunities that are aligned with the Company’s risk taking philosophy, risk appetite and return expectations; by identifying, measuring and monitoring key risks taken; and by executing risk control and mitigation programs.
We employ an enterprise-wide approach to all risk taking and risk management activities globally. The enterprise risk management (“ERM”) framework sets out policies and standards of practice related to risk governance, risk identification, risk measurement, risk monitoring, and risk control and mitigation. With an overall goal of effectively executing risk management activities, we continuously invest to attract and retain qualified risk professionals, and to build, acquire and maintain the necessary processes, tools and systems.
We manage risk taking activities against an overall risk appetite, which defines the amount and type of risks we are willing to assume. Our risk appetite reflects the Company’s financial condition, risk tolerance and business strategies. The quantitative component of our risk appetite establishes total Company targets defined in relation to economic capital, regulatory capital required, and earnings sensitivity. We have further established targets for each of our principal risks to assist us in maintaining appropriate levels of exposures and a risk profile that is well diversified across risk categories. In 2010, we cascaded the targets for the majority of our principal risks down to the business level, to facilitate the alignment of business strategies and plans with the Company’s overall risk management objectives.
Individual risk management programs are in place for each of our broad risk categories: strategic, market, liquidity, credit, insurance and operational. To ensure consistency, these programs incorporate policies and standards of practice that are aligned with those within the enterprise risk management framework, covering:
| n | | Assignment of risk management accountabilities across the organization; |
| n | | Delegation of authorities related to risk taking activities; |
| n | | Philosophy and appetite related to assuming risks; |
| n | | Establishment of specific risk targets or limits; |
| n | | Identification, measurement, assessment, monitoring, and reporting of risks; and |
| n | | Activities related to risk control and mitigation. |
Risk Governance
The Board of Directors oversees the implementation by management of appropriate systems to identify and manage the principal risks of the Company’s business and periodically reviews and approves our enterprise risk policy, which includes our risk taking philosophy and overall risk appetite.
The Chief Executive Officer (“CEO”) is directly accountable to the Board of Directors for all risk taking activities and risk management practices, and is supported by the Company’s Chief Risk Officer (“CRO”) as well as by the Executive Risk Committee (“ERC”). Together, they shape and promote our risk culture and guide risk taking throughout our global operations and strategically manage our overall risk profile. The ERC, along with other executive-level risk oversight committees, establishes risk policies, guides risk taking activity, monitors significant risk exposures, and sponsors strategic risk management priorities throughout the organization. The Board and executive-level risk oversight committees and key elements of their mandates are presented below.
Board and Committees
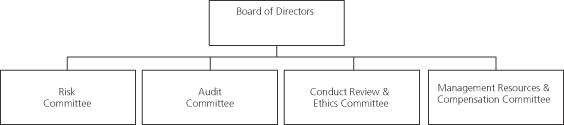
Executive Committees
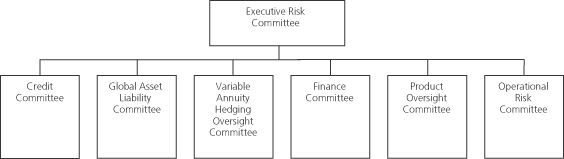
Risk Committee– The Risk Committee is responsible for assisting the Board in its oversight of the Company’s management of its principal risks. The committee also assesses, reviews and approves policies, procedures and controls in place to manage risks and reviews the Company’s compliance with risk policies.
Audit Committee – Responsibilities of the Audit Committee include assisting the Board in its oversight role with respect to the quality and integrity of financial information, the effectiveness of the Company’s internal controls over financial reporting, and the effectiveness of the Company’s compliance with legal and regulatory requirements.
Conduct Review and Ethics Committee – Oversees activities and risks related to conflicts of interest, confidentiality of information, customer complaints and related party transactions.
Management Resources and Compensation Committee – Oversees the Company’s global human resources strategy, policies, programs with a special focus on management succession, development and compensation, and related risks.
Executive Risk Committee– The ERC approves risk policies and oversees the execution of our enterprise risk management program. The committee monitors our overall risk profile, including key and emerging risks and guides risk-taking activities. As part of these activities, the ERC monitors material risk exposures, and sponsors strategic risk management priorities including overseeing risk reduction plans. The ERC also reviews and assesses the impact of business strategies, opportunities and initiatives on overall risk position.
Credit Committee – The Credit Committee establishes credit risk policies and oversees credit risk management. The Credit Committee monitors our overall credit risk profile, key and emerging risk exposures and risk management activities and ensures compliance with credit risk policies. The committee also approves large individual credits and investments.
Global Asset Liability Committee (“GALCO”) – The GALCO establishes market risk policies and oversees related market risk and asset liability management programs and practices. The committee monitors our overall market risk profile, key and emerging risk exposures and risk management activities as well as compliance with related policies. GALCO also approves target investment strategies.
Variable Annuity Hedging Oversight Committee (“VAHOC”) – The VAHOC oversees global variable annuity dynamic hedging operations. The committee reviews and approves hedging strategies and operational policies and procedures as well as hedge program performance and effectiveness. The committee monitors compliance with related policies.
Finance Committee – The Finance Committee oversees our capital management policy framework and provides direction on strategic issues affecting Manulife’s capital, solvency and balance sheet management. The committee monitors the adequacy and efficiency of the Company’s solvency position for consolidated and local entities on an actual and projected basis, recommending appropriate actions. It reviews capital stress testing and sensitivity analyses and approves principles of capital allocation to the businesses.
Product Oversight Committee(“POC”) – The POC establishes product design and pricing policies, insurance risk policies and risk management standards of practice. The POC oversees the insurance risk management and Underwriting Risk Committee activities including retention management and monitors product design, and pricing, and insurance risk exposures and trends. A sub-group of the committee oversees approval of new product initiatives, new business reinsurance arrangements and material insurance underwriting initiatives.
Operational Risk Committee (“ORC”) – The ORC was recently formed and it establishes, reviews and approves policies related to operational risk. The committee oversees operational risk management and monitors operational risk exposures and trends.
Management across the organization are accountable for the risks within their business. Business unit general managers are responsible for ensuring their business strategies align with the Company’s risk taking philosophy, risk appetite and culture, for thoroughly evaluating and managing all risk exposures consistent with our enterprise risk policies and standards of practice, and for delivering returns commensurate with the level of risk assumed.
Corporate Risk Management (“CRM”), under the direction of the CRO, establishes and maintains our enterprise risk management framework and oversees the execution of individual risk management programs across the enterprise. CRM proactively partners with business units and seeks to ensure a consistent enterprise-wide assessment of risk, risk-based capital, and risk-adjusted returns.
Risk Identification, Measurement and Assessment
We have a common approach and process to identify, measure and assess the risks we assume. We evaluate all potential new business initiatives, acquisitions, product offerings, reinsurance arrangements, and investment and financing transactions on a comparable risk-adjusted basis. Business units and functional groups are responsible for identifying and assessing risks arising from business activities on an ongoing basis, as an integral component of business management processes. A standard inventory of risks is used in all aspects of risk identification, measurement and assessment, and monitoring and reporting.
Risk exposures are evaluated using a variety of risk measures, with certain measures used across all risk categories, while others apply only to some risks or a single risk type. Risk measurement includes simple key risk indicators; stress tests, including sensitivity tests and scenario impact analyses; and stochastic scenario modeling. Qualitative risk assessments are performed for those risk types that cannot be reliably quantified.
We perform a variety of sensitivity tests on earnings, regulatory capital ratios, liquidity, economic capital and earnings at risk that consider significant, but plausible events. As required by regulations, through our Dynamic Capital Adequacy Testing (“DCAT”), we stress test our regulatory capital adequacy over a five year projected timeframe, incorporating both existing and projected new business activities, under a number of plausible adverse scenarios.
Economic capital measures the amount of capital needed to meet obligations with a high and pre-defined confidence level, determined using internal models. Our earnings at risk metric measures the potential variance from quarterly expected earnings at a particular confidence level, determined using internal models. Both economic capital and earnings at risk are measured enterprise-wide and are allocated by risk type and business. Economic capital and earnings at risk provide measures of enterprise-wide risk that can be aggregated, and compared, across business activities and risk types.
Risk Monitoring and Reporting
CRM oversees a formal process for monitoring and reporting on enterprise-wide risk exposures, discusses risk exposures with our various risk oversight committees, and submits requests for approval of any policy exceptions or remedial action plans, as required.
On a quarterly basis, the ERC, Board Risk Committee and Board of Directors review risk reports that present an overview of our overall risk profile and exposures across our principal risks. The reports incorporate both quantitative risk exposure measures and sensitivities and qualitative risk assessments. The reports also highlight key risk management activities and facilitate monitoring compliance with key risk policy targets and limits. The reports present information gathered through a formal risk identification and assessment process involving business unit general managers and their executive teams, as well as corporate executives overseeing global risk management of key risks. The ERC reviews key financial risk exposures and sensitivities monthly.
Our Chief Actuary presents the results of the DCAT to the Board of Directors annually. Our Internal Auditor reports the results of internal audits of risk controls and risk management programs to the Audit Committee semi-annually. Management reviews the implementation of key risk management strategies, and their effectiveness, with the Risk Committee annually.
Risk Control and Mitigation
Risk control activities are in place throughout the Company to mitigate risks to within approved risk targets or limits. We believe our controls, which include policies, procedures, systems and processes, are appropriate and commensurate with the key risks faced at all levels across the Company and such controls are an integral part of day to day activity, business management and decision making.
CRM establishes and oversees formal review and approval processes, involving independent individuals, groups or risk oversight committees, for product offerings, insurance underwriting, reinsurance, investment activities and other material business activities, based on the nature, size and complexity of the risk taking activity involved. Authority for assuming risk at the transaction level is delegated to specific individuals based on their skill, knowledge and experience.
Risk mitigation activities, such as product and investment portfolio management, hedging, reinsurance and insurance protection are used to assist in managing our aggregate risk to within our risk appetite, targets and limits. Internal controls within the business units and corporate functions mitigate our exposure to operational risks.
The following sections describe the key risks and associated risk management strategies for each of our broad risk categories (strategic, market, liquidity, credit, insurance and operational).
Strategic Risk
Strategic risk is the risk of loss resulting from the inability to adequately plan or implement an appropriate business strategy, or to adapt to change in the external business, political or regulatory environment.
Key Risk Factor Overview
Manulife Financial operates in highly competitive markets and competes for customers with both insurance and non-insurance financial services companies. Customer loyalty and retention, and access to distributors, are important to the Company’s success and are influenced by many factors, including our product features, service levels, prices, and our financial strength ratings and reputation. External business, economic, political, tax, legal and regulatory environments can significantly impact the products and services we can offer, and their price and attractiveness. Erosion of our corporate image by adverse publicity, as a result of our business practices or those of our employees, representatives and business partners, may cause damage to our franchise value.
Risk Management Strategy
The CEO and Executive Committee establish and oversee execution of business strategies, and have accountability to identify and manage the risks embedded in these strategies. They are supported by a number of processes:
| n | | Strategic business, risk and capital planning that is reviewed with the Board of Directors; |
| n | | Detailed business planning that is executed by divisional management and is reviewed by the CEO, the Chief Financial Officer and the CRO; |
| n | | Quarterly operational performance and risk reviews of all key businesses with the CEO and annual reviews with the Board of Directors; |
| n | | Risk-based capital attribution and allocation designed to encourage a consistent decision-making framework across the organization; and |
| n | | Review and approval of acquisitions and divestitures by the CEO and, where appropriate, the Board of Directors. |
The CEO and Executive Committee are ultimately responsible for our reputation; however, our employees and representatives are responsible for conducting their business activities in a manner that upholds our reputation. This responsibility is reinforced by:
| n | | An enterprise-wide reputation risk policy that specifies the oversight responsibilities of the Board and the responsibilities of executive management; |
| n | | Communication to and education of all directors, officers, employees and representatives, including our Code of Business Conduct and Ethics; |
| n | | Application of a set of guiding principles in conducting all our business activities, designed to protect and enhance our reputation; and |
| n | | Reputation risk assessments considered as part of business strategy development and execution. |
The following is a further description of key strategic risk factors.
Business Strategy
We regularly review and adapt our business strategies and plans in consideration of changes in the external business, economic, political and regulatory environments in which we operate. Key elements of our business strategy include diversifying our business mix, accelerating growth of those products that have a favourable return on capital and better potential outcomes under a range of economic and policyholder behaviour scenarios, and reducing or withdrawing from products with unattractive risk profiles. Our strategy also incorporates a plan to systematically hedge our in-force public equity and interest rate risks over time. We have designed our business plans and strategies to align with our risk appetite, capital and financial performance objectives. However, the economic environment may remain volatile and our regulatory environment will continue to evolve, potentially with higher capital requirements. Further, the attractiveness of our product offerings relative to our competitors will be influenced by competitor actions as well as our own, and the requirements of the regulatory regimes they operate under. For these and other reasons, there is no certainty that we will be successful in implementing our business strategies or that these strategies will achieve the objectives we target.
Regulatory and Capital Requirements
MFC is a holding company with no significant operations and its principal assets are the shares of its regulated insurance subsidiaries. These subsidiaries are subject to a wide variety of insurance and other laws and regulations that vary by jurisdiction and are intended to protect policyholders and beneficiaries rather than investors. These laws and regulations include regulatory restrictions which may limit the ability of subsidiary companies to pay dividends or make distributions to MFC. As a result of the global financial crisis, financial authorities and regulators in many countries are reviewing their capital requirements and considering potential changes.
While the impact of these changes is uncertain, we anticipate that regulators, rating agencies and investors will expect higher levels of capital going forward. These changes could further limit the ability of the insurance subsidiaries to pay dividends or make distributions and could have a significantly adverse effect on MFC’s capital mobility, including its ability to pay dividends to shareholders, buy back its shares and service its debt.
The Office of the Superintendent of Financial Institutions (“OSFI”) has been considering a number of changes, including establishing methodologies for evaluating standalone capital adequacy for Canadian operating life insurance companies, such as MLI and updates to its regulatory guidance for non-operating insurance companies acting as holding companies, such as MFC. In addition, OSFI is working on revisions to the capital requirements for in-force segregated fund guarantees, market, credit and insurance risk. Changes in regulatory capital guidelines for banks under the Basel Accord or for European insurance companies under Solvency II may also have implications for Canadian insurance companies. The timing and outcome of these initiatives is uncertain and could have a significantly adverse impact on the Company or on our position relative to that of other Canadian and international financial institutions with which we compete for business and capital.
OSFI issued an advisory on December 14, 2010 containing new minimum calibration criteria for determining capital requirements for guarantees of segregated fund business written on or after January 1, 2011. The new calibration criteria will increase capital requirements on these products and our 2011 product offerings will be developed and priced taking into account these new rules. The new minimum calibration criteria are not expected to materially impact capital requirements on in-force business written prior to 2011.
The Dodd-Frank Wall Street Reform and Consumer Protection Act (“Dodd-Frank”)
Dodd-Frank creates a new framework for regulation of over-the-counter (“OTC”) derivatives which could affect those activities of the Company which use derivatives for various purposes, including hedging equity market, interest rate and foreign currency exposures. Dodd-Frank will require certain types of OTC derivative transactions to be executed through a centralized exchange or regulated facility and be cleared through a regulated clearinghouse. The legislation could also potentially impose additional costs, including new capital and margin requirements, and additional regulation on the Company. Conversely, increased capital or margin requirements imposed on our counterparties to derivative transactions could reduce our exposure to the counterparties’ default. We cannot predict the effect of the legislation on our hedging costs, our hedging strategy or its implementation, or whether Dodd-Frank will lead to an increase or decrease in or change in composition of the risks we hedge.
In addition, pursuant to Dodd-Frank, in January 2011, the Financial Stability Oversight Council (“FSOC”) released a proposed rule outlining the criteria that will inform the FSOC’s designation of non-bank financial institutions as “systemically important” and the procedures the FSOC will use in the designation process. If designated, the largest, most interconnected and highly-leveraged companies would face stricter prudential regulation, including higher capital requirements and more robust consolidated supervision. At this stage, OSFI has not announced similar rules, and for financial institutions (such as MFC) whose home regulator is outside of the United States, the FSOC’s proposed rule recognizes the need for outreach and coordination with the home regulator, as well as the need to avoid overlapping and conflicting regulations. Although there are good arguments why neither MFC nor any of its subsidiaries should be designated as systemically important by the FSOC, OSFI or any other regulator, at this stage we cannot predict the outcome of this regulatory initiative.
International Financial Reporting Standards (“IFRS”)
On July 30, 2010, the International Accounting Standards Board (“IASB”) issued its Insurance Contracts (Phase II) Exposure Draft, with a comment period that ended November 30, 2010. The Exposure Draft outlined a proposed framework for a single accounting standard for the measurement of insurance contract liabilities to be applied across all jurisdictions adopting IFRS as published by the IASB.10 The insurance contracts accounting policy proposals being considered by the IASB, in particular the discount rate for the measurement of insurance liabilities, are not consistent with our business model because they do not align the measurement of insurance liabilities with the assets that support the payment of those liabilities. Therefore, the standard as proposed and if implemented may lead to a large initial increase in reported insurance liabilities and potentially our required regulatory capital upon adoption, and may create significant ongoing volatility in our reported results and potentially our regulatory capital particularly for long duration guaranteed products. This mismatch between the underlying economics of our business and reported results and potentially our capital requirements could have significant unintended negative consequences on our business model which would potentially affect our customers, shareholders and the capital markets. We believe the accounting rules under discussion could put Canadian insurers at a significant disadvantage relative to their U.S. and global peers, and also to the banking sector in Canada. We, along with the Canadian insurance industry and other interested parties, provided comments and input to the IASB on their proposals. As a result of the preliminary comments received and other outreach activities conducted, the IASB has indicated that they will reconsider their proposals for the determination of the appropriate discount rate for the measurement of insurance contract liabilities contained in the Exposure Draft. The insurance industry in Canada is also currently working with OSFI and the federal government with respect to the potential impact of these proposals on Canadian insurance companies, and the industry is urging policymakers to ensure that any future accounting and capital proposals appropriately consider the underlying business model of a life insurance company and in particular, the implications for long duration guaranteed products which are much more prevalent in North America than elsewhere.
Ratings
The Company has received security ratings from approved rating organizations on its outstanding medium-term notes, outstanding Tier 1 hybrid capital and its outstanding series of preferred shares. In addition, the Company and its primary insurance operating subsidiaries have received financial strength/claims paying ratings. Our ratings could be adversely affected if, in the view of the rating organizations, there is deterioration in our financial flexibility, operating performance, or risk profile. Adverse ratings changes could have a negative impact on future financial results.
| 10 | The current standard, IFRS 4 Insurance Contracts, allows each jurisdiction to determine its own liability measurement practices. |
Reputation
The Company’s reputation is one of our most valuable assets. Our corporate image may be eroded by adverse publicity, as a result of our business practices or those of our employees, representatives and business partners, potentially causing damage to our franchise value. A loss of reputation is often a consequence of some other risk control failure whether associated with complex financial transactions or relatively routine operational activities. As such, reputation risk cannot be managed in isolation from other risks.
Market Risk
Market risk is the risk of loss resulting from market price volatility, interest rate and credit spread changes, and from adverse foreign currency rate movements. Market price volatility primarily relates to changes in prices of publicly traded equities and alternative non-fixed income investments.
Market Risk Management Strategy Overview
Our overall strategy to manage our market risks incorporates several component strategies, each targeted to manage one or more of the market risks arising from our businesses. At an enterprise level, these strategies are designed to manage our aggregate exposures to market risks against economic capital, regulatory required capital and earnings at risk targets.
The following table outlines our key market risks and identifies the risk management strategies which contribute to managing these risks.
| | | | | | | | | | | | | | | | |
| | | Publicly
Traded Equity
Performance
Risk | | | Interest
Rate Risk | | | Alternative
Non-Fixed
Income Asset
Performance Risk | | | Foreign
Exchange Risk | |
Product Design and Pricing | | | X | | | | X | | | | X | | | | X | |
Variable Annuity Guarantee Dynamic Hedging | | | X | | | | X | | | | | | | | X | |
Macro Equity Risk Hedging | | | X | | | | | | | | | | | | X | |
Asset Liability Management | | | X | | | | X | | | | X | | | | X | |
Foreign Exchange Management | | | | | | | | | | | | | | | X | |
These strategies are described more fully under the section “Market Risk Management Strategies” in the pages that follow.
In 2010, we refined our risk reduction plans in order to further reduce our exposure to public equity risk and interest rate risk through a combination of time-scheduled and market-trigger based actions. The refined plans established a goal of executing additional hedges so that approximately 60 per cent of our underlying earnings sensitivity11 to public equity market movements is offset by hedges by the end of 2012 and approximately 75 per cent of our underlying earnings sensitivity to public equity market movements is offset by hedges by the end of 2014. In addition, we expect to take actions that would further reduce our interest rate exposures as measured by the sensitivity of shareholders’ net income to a 100 basis point decline in interest rates, by approximately one-quarter by the end of 2012 and by approximately one-half by the end of 2014. Those targets translate to a sensitivity of net income attributed to shareholders of $1.65 billion and $1.1 billion, as at year end 2012 and 2014, respectively.
As part of our risk reduction plans, we implemented a new macro equity risk hedging strategy designed to mitigate public equity risk arising from variable annuity guarantees not dynamically hedged and from other products and fees. We shorted approximately $5 billion of equity futures contracts in the fourth quarter of 2010. Throughout 2010, we also initiated dynamic hedging on $19 billion of in-force guarantee value and continued to dynamically hedge virtually all new variable annuity business written. By December 31, 2010, approximately 55 per cent of the guarantee value was either dynamically hedged or reinsured, compared to 35 per cent at December 31, 2009. The business dynamically hedged at December 31, 2010 comprised 50 per cent of the variable annuity guarantee values, net of amounts reinsured, and generated 35 per cent of the underlying reserve sensitivity to equity market movements from variable annuities, net of amounts reinsured. As a result of these hedges, as at December 31, 2010 approximately 50 per cent of our underlying earnings sensitivity to equity market movements was estimated to be offset by hedges.11
To reduce interest rate risk, we lengthened the duration of our fixed income investments in both our liability and surplus segments by investing cash and trading shorter term bonds for longer term bonds, and by executing lengthening interest rate swaps. These actions, offset by the changes in interest rates and the impact of updates to policyholder liability assumptions during the year, contributed to a net reduction in the sensitivity of net income attributed to shareholders to declines in interest rates.
Other risk reduction actions taken during 2010 include re-pricing and de-risking guaranteed benefit insurance products in Canada and the U.S., and launching new insurance products with lower or limited guarantees. We also launched a lower risk variable annuity product in Japan, an initiative that followed the redesign and re-pricing of our North American variable annuities in 2009. The changes made to our product portfolio have facilitated a desired and ongoing shift in our new business to lower risk product lines with higher profit margins.
| 11 | Underlying earnings sensitivity is defined as earnings sensitivity to a 10 per cent decline in public equity markets including settlements on reinsurance contracts existing at September 30, 2010, but before the offset of hedge assets or other risk mitigants. For a 10 per cent equity market decrease the gain on the dynamic hedge assets is assumed to be 80 per cent of the loss from the dynamically hedged variable annuity policy liabilities. |
Key Risk Factors
Publicly Traded Equity Performance Risk
Publicly traded equity performance risk arises from a variety of sources, including guarantees associated with off-balance sheet products, asset based fees, investments in publicly traded equities supporting general fund products and surplus investments in publicly traded equities.
For off-balance sheet segregated funds or variable annuities, a sustained decline in public equity markets would likely increase the cost of guarantees and reduce asset based fee revenues. A sustained increase in equity market volatility would likely increase the costs of hedging the guarantees provided.
Where publicly traded equity investments are used to support policy liabilities, the policy valuation incorporates projected investment returns on these assets. If actual returns are lower than the expected returns, the Company’s policy liabilities will increase, reducing net income attributed to shareholders and regulatory capital ratios. Further, for products where the investment strategy applied to future cash flows in the policy valuation includes investing a specified portion of future cash flows in publicly traded equities, a decline in the value of publicly traded equities relative to other assets could require us to change the investment mix assumed for future cash flows, increasing policy liabilities and reducing net income attributed to shareholders. In addition, to the extent publicly traded equities are held as AFS, other than temporary impairments that arise will reduce income.
Interest Rate Risk
Interest rate and spread risk arises from general fund guaranteed benefit products, general fund adjustable benefit products with minimum rate guarantees, general fund products with guaranteed surrender values, off-balance sheet products with minimum benefit guarantees and from surplus fixed income investments.
Interest rate and spread risk arises within the general fund primarily due to the uncertainty of future returns on investments to be made as assets mature and as recurring premiums are received and must be re-invested to support longer dated liabilities. Interest rate risk also arises due to minimum rate guarantees and guaranteed surrender values on products where investment returns are generally passed through to policyholders.
A general decline in interest rates, without a change in corporate bond spreads and swap spreads, will reduce the assumed yield on future investments used in the valuation of policy liabilities, resulting in an increase in policy liabilities and a reduction in net income. A general increase in interest rates, without a change in corporate bond spreads and swap spreads, will result in a decrease in policy liabilities and an increase in net income. In addition, decreases in corporate bond spreads and increases in swap spreads will result in an increase in policy liabilities and a reduction in net income. An increase in corporate bond spreads and a decrease in swap spreads will have the opposite impact. The impact of changes in interest rates and in spreads may be partially offset by changes to credited rates on adjustable products that pass through investment returns to policyholders.
For off-balance sheet segregated funds or variable annuities, a sustained increase in interest rate volatility or a decline in interest rates would also likely increase the costs of hedging the benefit guarantees provided.
Alternative Non-Fixed Income Asset Performance Risk
Alternative non-fixed income asset performance risk arises from general fund investments in commercial real estate, timber properties, agricultural properties, oil and gas properties, and private equities.
Where these assets are used to support policy liabilities, the policy valuation incorporates projected investment returns on these assets. If actual returns are lower than the expected returns, the Company’s policy liabilities will increase, reducing net income attributed to shareholders and regulatory capital ratios. Further, for products where the investment strategy applied to future cash flows in the policy valuation includes investing a specified portion of future policy cash flows in alternative non-fixed income assets, a decline in the value of these assets relative to other assets could require us to change the investment mix assumed for future cash flows, increasing policy liabilities.
Foreign Exchange Risk
Our financial results are reported in Canadian dollars. A substantial portion of our business is transacted in currencies other than Canadian dollars, mainly U.S. dollars, Hong Kong dollars and Japanese yen. If the Canadian dollar strengthens, reported earnings would decline and our reported shareholders’ equity would decline. Further, to the extent that the resultant change in available capital is not offset by a change in required capital, our regulatory capital ratios would be reduced. A weakening of the Canadian dollar against the foreign currencies in which we do business would have the opposite effect, and would increase reported Canadian dollar earnings and shareholders’ equity, and would potentially increase our regulatory capital ratios.
Market Risk Management Strategies
Product Design and Pricing
Our product design and pricing standards and guidelines are designed to help ensure our product offerings align with our risk taking philosophy and tolerances, and in particular, that incremental risk generated from new sales aligns with our strategic risk objectives and risk targets. The specific design features of our product offerings, including level of benefit guarantees, policyholder options, fund offerings and availability restrictions as well as our associated investment strategies help to mitigate the level of underlying risk. We regularly review and modify all key features within our product offerings, including premiums and fee charges with a goal of meeting both profit and risk targets.
During 2010, we continued to make changes to our variable annuity and certain long duration guaranteed benefit product offerings. The changes are intended to reduce risks related to movements in public equity markets and interest rates and improve product margins. Although we continue to support long-term guaranteed liabilities with alternative non-fixed income assets, pricing of new product offerings assume a lower portion of assets invested in this category.
Alternative long duration insurance products with lower or more limited investment related guarantees are being developed across the Company for launch throughout 2011. In addition, price increases on new business have recently been implemented on our U.S. universal life no-lapse guarantee product, U.S. long-term care insurance and Canadian level cost of insurance universal life product lines. Variable annuity offerings continued to be de-risked in 2010, particularly in Japan, and virtually all new business sold continues to be dynamically hedged.
Variable Annuity Guarantee Dynamic Hedging Strategy
The variable annuity dynamic hedging strategy is designed to hedge the sensitivity of variable annuity guarantee policy liabilities and available capital, to both public equity and bond fund performance and interest rate movements. The objective of the dynamic hedging strategy is to offset as closely as possible, the change in our internally defined economic value of guarantees, with the profit and loss from our hedge asset portfolio. The internal economic value of guarantees moves in close tandem with, but not exactly as, our variable annuity guarantee policy liabilities, as it reflects best estimate liabilities and does not include any liability provisions for adverse deviations.
Our current hedging approach is to short exchange-traded equity index and government bond futures and execute currency futures and execute lengthening interest rate swaps to hedge sensitivity of policy liabilities to fund performance (delta) and interest rate movements (rho) arising from variable annuity guarantees. We dynamically rebalance these hedge instruments as market conditions change, and the liability delta and rho change, in order to maintain the hedged position within established limits. We may consider the use of additional hedge instruments opportunistically in the future.
We employ dynamic hedging for virtually all new variable annuity guarantee business when written, or as soon as practical thereafter, and just over half of our in-force variable annuity guarantee values were dynamically hedged as at December 31, 2010. We intend to initiate dynamic hedging for incremental amounts of in-force business not dynamically hedged as market conditions meet our criteria. Public equity risk arising from business not dynamically hedged is managed through our macro equity risk hedging strategy and interest rate risk arising from variable annuity business not dynamically hedged is managed within our asset liability management strategy. During 2010, we initiated dynamic hedging on an additional $19 billion of in-force variable annuity guarantee value.
Our variable annuity guarantee dynamic hedging strategy is not designed to completely offset the sensitivity of policy liabilities to all risks associated with the guarantees embedded in these products. The profit (loss) on the hedge instruments will not completely offset the underlying losses (gains) related to the guarantee liabilities hedged because:
| n | | Policyholder behaviour and mortality experience is not hedged; |
| n | | Provisions for adverse deviation in the policy liabilities are not hedged; |
| n | | A portion of interest rate risk is not hedged; |
| n | | Fund performance on a small portion of the underlying funds is not hedged due to lack of availability of effective exchange traded hedge instruments; |
| n | | Performance of the underlying funds hedged may differ from the performance of the corresponding hedge instruments; |
| n | | Unfavourable realized equity and interest rate volatilities and their correlations may result in higher than expected rebalancing costs; and |
| n | | Not all other risks are hedged. |
The risks related to the variable annuity dynamic hedging strategy are expanded on below.
Policy liabilities and MCCSR required capital for variable annuity guarantees are determined using long-term forward-looking estimates of volatilities and have no sensitivity to quarterly changes in implied market volatilities. These long-term forward-looking volatilities assumed for policy liabilities and required capital meet the Canadian Institute of Actuaries and OSFI calibration standards. To the extent that realized equity or interest rate volatilities in any quarter exceed the assumed long-term volatilities, or correlations between interest rate changes and equity returns are higher, there is a risk that rebalancing will be greater and more frequent, resulting in higher hedging costs.
The level of guarantee claims ultimately paid will be impacted by policyholder longevity and policyholder activity including the timing and amount of withdrawals, lapses and fund transfers. The sensitivity of liability values to equity market and interest rate movements that we hedge are based on long-term expectations for longevity and policyholder activity, since the impact of actual longevity and policyholder experience variances cannot be hedged using capital markets instruments.
The variable annuity guarantee dynamic hedging strategy exposes the Company to additional risks. The strategy relies on the execution of derivative transactions in a timely manner and, therefore, hedging costs and the effectiveness of the strategy may be negatively impacted if markets for these instruments become illiquid. The Company is also subject to counterparty risks arising from the derivative instruments and to the risk of increased funding and collateral demands which may become significant as markets and interest
rates increase. The dynamic hedging strategy is highly dependent on complex systems and mathematical models that are subject to error, which rely on forward looking long-term assumptions that may prove inaccurate, and which rely on sophisticated infrastructure and personnel which may fail or be unavailable at critical times. Due to the complexity of the dynamic hedging strategy there may be additional, unidentified risks that may negatively impact our business and future financial results.
There can be no assurance that the Company’s exposure to public equity performance and movements in interest rates will be reduced to within established targets. We may be unable to hedge our existing unhedged business as outlined in our risk reduction plans, or if we do so, we may be required to record a charge to income when we initiate hedging. Under certain market conditions, which include a sustained increase in realized equity and interest rate volatilities, a decline in interest rates, or an increase in the correlation between equity returns and interest rate declines, the costs of hedging the benefit guarantees provided in variable annuities may increase or become uneconomic, in which case we may reduce or discontinue sales of certain of these products. In addition, there can be no assurance that our dynamic hedging strategy will fully offset the risks arising from the variable annuities being hedged.
Macro Equity Risk Hedging
The macro equity risk hedging strategy was initiated in the second half of 2010 and is designed to hedge a portion of our earnings sensitivity to public equity markets movements arising from the following sources in order to maintain our overall earnings sensitivity to public equity market movements below targeted levels:
| n | | Variable annuity guarantees not dynamically hedged; |
| n | | Unhedged provisions for adverse deviation related to variable annuity guarantees dynamically hedged; |
| n | | General fund equity holdings backing non-participating liabilities; |
| n | | Variable life insurance; |
| n | | Variable annuity fees not associated with guarantees; and |
| n | | Fees on segregated funds without guarantees, mutual funds and institutional assets managed. |
We currently execute our macro equity risk hedging strategy by shorting equity futures and executing currency futures, and rolling them over at maturity. We may consider the use of alternative long maturity instruments opportunistically in the future. The notional value of equity futures contracts that were shorted as part of our macro equity risk hedging strategy as at December 31, 2010 was approximately $5 billion. Management intends to increase the amount of macro equity hedges on a time-scheduled and market-trigger basis. Management also intends to increase the amount of hedges in order to maintain our overall earnings sensitivity to equity market movements below targeted levels should markets decline.
The macro equity risk hedging strategy exposes the Company to risks. The strategy relies on the execution of derivative transactions and the ability to execute may be negatively impacted if markets for these instruments become illiquid. The Company is also subject to the risk of increased funding and collateral demands which may become significant as markets increase.
Asset Liability Management Strategy
Our asset liability management strategy is designed to help ensure that the market risks embedded in our assets and liabilities held in the Company’s general fund are effectively managed and that risk exposures arising from these assets and liabilities are maintained below targeted levels. The embedded market risks include risks related to the level and movement of interest rates and credit spreads, public equity market performance, alternative non-fixed income asset performance and foreign exchange rate movements.
General fund product liabilities are segmented into groups with similar characteristics that are supported by specific asset segments. Each segment is managed to a target investment strategy appropriate for the premium and benefit pattern, policyholder options and guarantees, and crediting rate strategies of the products they support. Similar strategies are established for assets in the Company’s surplus account. The strategies are set using portfolio analysis techniques intended to optimize returns, subject to considerations related to regulatory and economic capital requirements, and risk tolerances. They are designed to achieve broad diversification across asset classes and individual investment risks while being suitably aligned with the liabilities they support. The strategies encompass asset mix, quality rating, term profile, liquidity, currency and industry concentration targets.
We employ matching mandates, target return mandates or a combination of both in managing the assets in each segment. Matching mandates invest in fixed income assets such as publicly traded bonds, private debt and mortgages and seek to match the term profile of the liabilities, subject to the assets available in investment markets. Target return mandates invest a portion in a diversified basket of alternative non-fixed income assets with the remainder invested in fixed income assets and seek to generate returns sufficient to support either guaranteed obligations or to maximize policyholder dividends or credited rates subject to risk and capital constraints for products that generally pass-through investment returns to policyholders. We manage overall allocations to alternative non-fixed income assets to reflect our risk tolerances.
We group our liabilities into four broad categories:
| n | | Guaranteed products with premiums and benefits that are not adjusted with changes in investment returns and interest rates. We use a combination of matching and target return mandates with the matching mandates supporting obligations within the term period for which fixed income assets are generally available in investment markets. |
| n | | Adjustable products which have benefits that are generally adjusted as interest rates and investment returns change, but which have minimum credited rate guarantees. These tend to be supported by target return mandates although segments supporting shorter term liabilities may use matching mandates. |
| n | | Variable annuity guarantee liabilities with benefits and liability amounts that fluctuate significantly with performance of the underlying segregated funds. These tend to be supported by matching mandates. |
| n | | Non-insurance liabilities which are commingled with the assets held in our surplus account. These tend to be supported by a combination of mandates. |
In our general fund, we limit concentration risk associated with non-fixed income asset performance by investing in a diversified basket of assets including public and private equities, commercial real estate, timber and agricultural properties, and oil and gas assets. We further diversify risk by managing publicly traded equities and alternative non-fixed income asset investments against established targets and limits, including for industry type and corporate connection, commercial real estate type and geography, and timber and agricultural property geography and crop type.
Authorities to manage our investment portfolios are delegated to investment professionals who manage to benchmarks derived from the target investment strategies established for each segment, including interest rate risk tolerances. Interest rate risk exposure measures are monitored and communicated to portfolio managers with frequencies ranging from daily to annually, depending on the type of liability. Asset portfolio rebalancing, accomplished using cash investments or derivatives, may occur at frequencies ranging from daily to monthly, depending on our established risk tolerances and the potential for changes in the profile of the assets and liabilities.
Our asset liability management strategy incorporates a wide variety of risk measurement, risk mitigation and risk management and hedging processes. The liabilities and risks to which the Company is exposed, however, cannot be completely matched or hedged due to both limitations on instruments available in investment markets and uncertainty of policyholder experience and consequent liability cash flows.
Foreign Exchange Risk Management Strategy
Our foreign exchange risk management strategy is designed to hedge the sensitivity of our regulatory capital ratios to movements in foreign exchange rates. In particular, the objective of the strategy is to offset within acceptable tolerance levels, changes in required capital with changes in available capital that result from movements in foreign exchange rates. These changes occur when assets and liabilities related to business conducted in currencies other than Canadian dollars is translated to Canadian dollars at period ending exchange rates.
Our policy is to generally match the currency of our assets with the currency of the liabilities they support, and similarly, we have a policy of generally matching the currency of the assets in our shareholders’ equity account to the currency of our required capital. Where assets and liabilities are not matched, forward contracts and currency swaps are used to stabilize our capital ratios and our capital adequacy relative to economic capital, when foreign exchange rates change.
We have established target levels of risk exposure, measured in terms of potential changes in capital ratios due to foreign exchange rate movements, determined to represent a specified likelihood of occurrence based on internal models. We utilize a Value-at-Risk (“VaR”) methodology quarterly to estimate the potential impact of currency mismatches on our capital ratios.
While our risk management strategy is designed to stabilize capital adequacy ratios, the sensitivity of reported shareholders’ equity and income to foreign exchange rate changes is not hedged.
Sensitivities and Risk Exposure Measures
Caution Related to Sensitivities
In the sections that follow, we have provided sensitivities and risk exposure measures for certain risks. These include the sensitivity due to specific changes in market prices and interest rate levels projected using internal models as at a specific date, and are measured relative to a starting level reflecting the Company’s assets and liabilities at that date and the actuarial factors, investment returns and investment activity we assume in the future. The risk exposures measure the impact of changing one factor at a time and assume that all other factors remain unchanged. Actual results can differ significantly from these estimates for a variety of reasons including the interaction among these factors when more than one changes, changes in actuarial and investment return and future investment activity assumptions, actual experience differing from the assumptions, changes in business mix, effective tax rates and other market factors, and the general limitations of our internal models. For these reasons, these sensitivities should only be viewed as directional estimates of the underlying sensitivities for the respective factors based on the assumptions outlined below. Given the nature of these calculations, we cannot provide assurance that the actual impact on net income attributed to shareholders or shareholders’ economic value will be as indicated.
Variable Annuity and Segregated Fund Guarantees
Guarantees on variable products and segregated funds may include one or more of death, maturity, income and withdrawal guarantees. Variable annuity and segregated fund guarantees are contingent and only payable upon the occurrence of the relevant event, if fund values at that time are below guaranteed values. Depending on future equity market levels, liabilities on current in-force business would be due primarily in the period from 2015 to 2038.
The table below shows selected information regarding the Company’s variable annuity and segregated fund investment related guarantees gross and net of reinsurance, and net of the business dynamically hedged.
Variable Annuity and Segregated Fund Guarantees
| | | | | | | | | | | | | | | | | | | | | | | | | | | | | | | | |
As at December 31, (C$ million) | | 2010 | | | | | | 2009 | | | | |
| | Guarantee
value | | | Fund value | | | Amount
at risk(4) | | | | | | Guarantee
value | | | Fund value | | | Amount
at risk(4) | | | | |
Guaranteed minimum income benefit(1) | | $ | 8,202 | | | $ | 6,359 | | | $ | 1,856 | | | | | | | $ | 9,357 | | | $ | 6,834 | | | $ | 2,535 | | | | | |
Guaranteed minimum withdrawal benefit | | | 62,382 | | | | 57,331 | | | | 6,391 | | | | | | | | 58,077 | | | | 51,669 | | | | 7,962 | | | | | |
Guaranteed minimum accumulation benefit | | | 23,902 | | | | 25,152 | | | | 1,980 | | | | | | | | 24,749 | | | | 25,190 | | | | 2,213 | | | | | |
Gross living benefits(2) | | $ | 94,486 | | | $ | 88,842 | | | $ | 10,227 | | | | | | | $ | 92,183 | | | $ | 83,693 | | | $ | 12,710 | | | | | |
Gross death benefits(3) | | | 16,279 | | | | 12,736 | | | | 2,813 | | | | | | | | 18,455 | | | | 13,282 | | | | 4,414 | | | | | |
Total gross of reinsurance & hedging | | $ | 110,765 | | | $ | 101,578 | | | $ | 13,040 | | | | | | | $ | 110,638 | | | $ | 96,975 | | | $ | 17,124 | | | | | |
Living benefits reinsured | | $ | 7,108 | | | $ | 5,506 | | | $ | 1,611 | | | | | | | $ | 8,012 | | | $ | 5,818 | | | $ | 2,200 | | | | | |
Death benefits reinsured | | | 4,924 | | | | 4,070 | | | | 1,052 | | | | | | | | 5,985 | | | | 4,639 | | | | 1,577 | | | | | |
Total reinsured | | $ | 12,032 | | | $ | 9,576 | | | $ | 2,663 | | | | | | | $ | 13,997 | | | $ | 10,457 | | | $ | 3,777 | | | | | |
Total, net of reinsurance | | $ | 98,733 | | | $ | 92,002 | | | $ | 10,377 | | | | | | | $ | 96,641 | | | $ | 86,518 | | | $ | 13,347 | | | | | |
Living benefits dynamically hedged | | $ | 44,606 | | | $ | 44,827 | | | $ | 2,685 | | | | | | | $ | 24,399 | | | $ | 24,137 | | | $ | 1,782 | | | | | |
Death benefits dynamically hedged | | | 4,685 | | | | 3,032 | | | | 424 | | | | | | | | 481 | | | | 317 | | | | 10 | | | | | |
Total dynamically hedged | | $ | 49,291 | | | $ | 47,859 | | | $ | 3,109 | | | | | | | $ | 24,880 | | | $ | 24,454 | | | $ | 1,792 | | | | | |
Living benefits retained | | $ | 42,772 | | | $ | 38,509 | | | $ | 5,931 | | | | | | | $ | 59,772 | | | $ | 53,738 | | | $ | 8,728 | | | | | |
Death benefits retained | | | 6,670 | | | | 5,634 | | | | 1,337 | | | | | | | | 11,989 | | | | 8,326 | | | | 2,827 | | | | | |
Total, net of reinsurance & dynamic hedging | | $ | 49,442 | | | $ | 44,143 | | | $ | 7,268 | | | | | | | $ | 71,761 | | | $ | 62,064 | | | $ | 11,555 | | | | | |
| (1) | Contracts with guaranteed long-term care benefits are included in this category. |
| (2) | Where a policy includes both living and death benefits, the guarantee in excess of the living benefit is included in the death benefit category as outlined in footnote (3). |
| (3) | Death benefits include standalone guarantees and guarantees in excess of living benefit guarantees where both death and living benefits are provided on a policy. |
| (4) | Amount at risk (in-the-money amount) is the excess of guarantee values over fund values on all policies where the guarantee value exceeds the fund value. This amount is not currently payable. For guaranteed minimum death benefit, the net amount at risk is defined as the current guaranteed minimum death benefit in excess of the current account balance. For guaranteed minimum income benefit, the net amount at risk is defined as the excess of the current annuitization income base over the current account value. For all guarantees, the net amount at risk is floored at zero at the single contract level. |
The policy liability established for these benefits was $3,101 million at December 31, 2010 (2009 – $1,671 million). These policy liabilities include the policy liabilities for both the hedged and the unhedged business. For unhedged business, policy liabilities were $2,083 million at December 31, 2010 (2009 – $1,738 million). The policy liabilities for the hedged business were $1,018 million at December 31, 2010 (2009 – $(67) million). The increase in the policy liabilities for the hedged business was primarily due to the change in the value of the dedicated hedge asset portfolio and the adverse impact from basis changes. The year over year increase in policy liabilities related to the unhedged business was due primarily to the adverse impacts from basis changes and interest rate movements, offset by the favourable impact of improved public equity markets.
Variable Contracts with Guarantees
Variable contracts with guarantees are invested, at the policyholder’s discretion subject to contract limitations, in various fund types within the segregated fund accounts and other investments. The account balances by investment category are set out below:
Investment categories for variable contracts with guarantees
Investment category
| | | | | | | | | | | | |
As at December 31, (C$ millions) | | 2010 | | | 2009 | | | | |
Equity funds | | $ | 37,258 | | | $ | 35,883 | | | | | |
Balanced funds | | | 57,376 | | | | 53,588 | | | | | |
Bond funds | | | 10,407 | | | | 9,810 | | | | | |
Money market funds | | | 2,796 | | | | 3,497 | | | | | |
Other fixed interest rate investments | | | 1,565 | | | | 1,717 | | | | | |
| Total | | $ | 109,402 | | | $ | 104,495 | | | | | |
Publicly Traded Equity Performance Risk
The tables below show the potential impact on net income attributed to shareholders resulting from an immediate 10, 20 and 30 per cent change in market values of publicly traded equities followed by a return to the expected level of growth assumed in the valuation of policy liabilities. The potential impact is shown before and after taking into account the impact of the change in markets on the hedge assets.
While we cannot reliably estimate the amount of the change in dynamically hedged variable annuity policy liabilities that will not be offset by the profit or loss on the dynamic hedge assets, we make certain assumptions for the purposes of estimating the impact on
shareholders’ net income. We assume that for a 10, 20 and 30 per cent decrease in the market value of public equities, the profit from the hedge assets offsets 80, 75 and 70 per cent, respectively, of the loss arising from the change in the policy liabilities of the guarantees dynamically hedged. For a 10, 20 and 30 per cent market increase in the market value of public equities the loss on the dynamic hedges is assumed to be 120, 125 and 130 per cent of the gain from the dynamically hedged variable annuity policy liabilities, respectively.
Exposures at December 31, 2010 declined as compared to December 31, 2009 primarily due to improvements in global equity markets, the additional in-force variable annuity business we initiated dynamic hedging for, and the implementation of our macro equity risk hedging strategy. The increases in the policy liabilities as a result of our annual review of policy valuation assumptions and impact of currency movements partially offset these changes.
As at December 31, 2010 the change in the value of the hedge assets was estimated to offset 50 per cent of the underlying impact on net income attributed to shareholders12 from a 10 per cent decline in publicly traded equity value (2009 – nine per cent), assuming that the change in value of the dynamic hedge assets does not completely offset the change in the related variable annuity guarantee liabilities. The Company targets to have hedge assets mitigate 60 per cent of the underlying impact by the end of 2012 and 75 per cent of the underlying impact by the end of 2014.
Potential impact on net income attributed to shareholders arising from changes to public equity returns(1)
| | | | | | | | | | | | | | | | | | | | | | | | | | | | |
| As at December 31, 2010 | | | |
| (C$ millions) | | -30% | | | -20% | | | -10% | | | +10% | | | +20% | | | +30% | | | | |
Underlying sensitivity of net income attributed to shareholders(2) | | | | | | | | | | | | | | | | | | | | | | | | | | | | |
Variable annuity guarantees | | $ | (4,840 | ) | | $ | (2,940 | ) | | $ | (1,300 | ) | | $ | 1,010 | | | $ | 1,830 | | | $ | 2,300 | | | | | |
Asset based fees | | | (270 | ) | | | (180 | ) | | | (90 | ) | | | 90 | | | | 180 | | | | 270 | | | | | |
General fund equity investments(3) | | | (270 | ) | | | (180 | ) | | | (90 | ) | | | 100 | | | | 200 | | | | 300 | | | | | |
Total underlying sensitivity | | $ | (5,380 | ) | | $ | (3,300 | ) | | $ | (1,480 | ) | | $ | 1,200 | | | $ | 2,210 | | | $ | 2,870 | | | | | |
Impact of hedge assets | | | | | | | | | | | | | | | | | | | | | | | | | | | | |
Impact of macro hedge assets | | $ | 1,270 | | | $ | 850 | | | $ | 420 | | | $ | (420 | ) | | $ | (850 | ) | | $ | (1,270 | ) | | | | |
Impact of dynamic hedge assets assuming the change in the value of the hedge assets completely offsets the change in the dynamically hedged variable annuity guarantee liabilities | | | 1,680 | | | | 980 | | | | 400 | | | | (260 | ) | | | (440 | ) | | | (560 | ) | | | | |
Total impact of hedge assets assuming the change in value of the dynamic hedge assets completely offsets the change in the dynamically hedged variable annuity guarantee liabilities | | $ | 2,950 | | | $ | 1,830 | | | $ | 820 | | | $ | (680 | ) | | $ | (1,290 | ) | | $ | (1,830 | ) | | | | |
Net impact assuming the change in the value of the hedge assets completely offsets the change in the dynamically hedged variable annuity guarantee liabilities | | $ | (2,430 | ) | | $ | (1,470 | ) | | $ | (660 | ) | | $ | 520 | | | $ | 920 | | | $ | 1,040 | | | | | |
Impact of assuming the change in value of the dynamic hedge assets does not completely offset the change in the dynamically hedged variable annuity guarantee liabilities(4) | | | (500 | ) | | | (240 | ) | | | (80 | ) | | | (60 | ) | | | (110 | ) | | | (170 | ) | | | | |
Net impact assuming the change in value of the dynamic hedge assets does not completely offset the change in the dynamically hedged variable annuity guarantee liabilities(4) | | $ | (2,930 | ) | | $ | (1,710 | ) | | $ | (740 | ) | | $ | 460 | | | $ | 810 | | | $ | 870 | | | | | |
Percentage of underlying earnings sensitivity to movements in equity markets that is offset by hedges if dynamic hedge assets completely offset the change in the dynamically hedged variable annuity guarantee liability | | | 55% | | | | 55% | | | | 55% | | | | 57% | | | | 58% | | | | 64% | | | | | |
Percentage of underlying earnings sensitivity to movements in equity markets that is offset by hedge assets if dynamic hedges do not completely offset the change in the dynamically hedged variable annuity guarantee liability(4) | | | 46% | | | | 48% | | | | 50% | | | | 62% | | | | 63% | | | | 70% | | | | | |
| (1) | See “Caution Related to Sensitivities” above. |
| (2) | Defined as earnings sensitivity to a change in public equity markets including settlements on reinsurance contracts existing at September 30, 2010, but before the offset of hedge assets or other risk mitigants. |
| (3) | This impact for general fund equities is calculated as at a point-in-time and does not include: (i) any potential impact on public equity weightings; (ii) any gains or losses on public equities held in the Corporate and Other segment; or (iii) any gains or losses on public equity investments held in Manulife Bank. The sensitivities assume that the participating policy funds are self supporting and generate no material impact on net income attributed to shareholders as a result of changes in equity markets. |
| (4) | For a 10, 20 and 30 per cent market decrease the gain on the dynamic hedge assets is assumed to be 80, 75 and 70 per cent of the loss from the dynamically hedged variable annuity policy liabilities, respectively. For a 10, 20 and 30 per cent market increase the loss on the dynamic hedges is assumed to be 120, 125 and 130 per cent of the gain from the dynamically hedged variable annuity policy liabilities, respectively. For presentation purposes, numbers are rounded. |
| 12 | Defined as earnings sensitivity to a 10 per cent decline in public equity markets including settlements on reinsurance contracts existing at September 30, 2010, but before the offset of hedge assets or other risk mitigants. |
| | | | | | | | | | | | | | | | | | | | | | | | | | | | |
| As at December 31, 2009 | | | |
| (C$ millions) | | -30% | | | -20% | | | -10% | | | +10% | | | +20% | | | +30% | | | | |
Underlying sensitivity of net income attributed to shareholders(2) | | | | | | | | | | | | | | | | | | | | | | | | | | | | |
Variable annuity guarantees | | $ | (4,510 | ) | | $ | (2,720 | ) | | $ | (1,220 | ) | | $ | 940 | | | $ | 1,450 | | | $ | 1,650 | | | | | |
Asset based fees | | | (240 | ) | | | (160 | ) | | | (80 | ) | | | 80 | | | | 160 | | | | 240 | | | | | |
General fund equity investments(4) | | | (280 | ) | | | (160 | ) | | | (60 | ) | | | 90 | | | | 180 | | | | 270 | | | | | |
Total underlying sensitivity | | $ | (5,030 | ) | | $ | (3,040 | ) | | $ | (1,360 | ) | | $ | 1,110 | | | $ | 1,790 | | | $ | 2,160 | | | | | |
Impact of hedge assets | | | | | | | | | | | | | | | | | | | | | | | | | | | | |
Variable annuity dynamic hedge assets assuming the change in the value of the hedge assets completely offsets the change in the hedged guarantee policy liabilities | | | 660 | | | | 370 | | | | 160 | | | | (140 | ) | | | (260 | ) | | | (350 | ) | | | | |
Net impact assuming the change in value of the hedge assets completely offsets the change in the dynamically hedged variable annuity guarantee liabilities | | $ | (4,370 | ) | | $ | (2,670 | ) | | $ | (1,200 | ) | | $ | 970 | | | $ | 1,530 | | | $ | 1,810 | | | | | |
Impact of assuming the change in value of the hedge assets does not completely offset the change in the dynamically hedged variable annuity guarantee liabilities(3) | | | (200 | ) | | | (90 | ) | | | (40 | ) | | | (20 | ) | | | (60 | ) | | | (110 | ) | | | | |
Net impact assuming the change in value of the hedge assets does not completely offset the change in the dynamically hedged variable annuity guarantee liabilities(3) | | $ | (4,570 | ) | | $ | (2,760 | ) | | $ | (1,240 | ) | | $ | 950 | | | $ | 1,470 | | | $ | 1,700 | | | | | |
Percentage of underlying earnings sensitivity to movements in equity markets that is offset by hedges if dynamic hedges completely offset related liability changes | | | 13% | | | | 12% | | | | 12% | | | | 13% | | | | 15% | | | | 16% | | | | | |
Percentage of underlying earnings sensitivity to movements in equity markets that is offset by hedges if dynamic hedges do not completely offset related liability changes(4) | | | 9% | | | | 9% | | | | 9% | | | | 14% | | | | 18% | | | | 21% | | | | | |
| (1) | See “Caution Related to Sensitivities” above. |
| (2) | Defined as earnings sensitivity to a change in public equity markets including settlements on reinsurance contracts existing at December 31, 2009, but before the offset of hedge assets or other risk mitigants (which were the same as those as at September 30, 2010). |
| (3) | For a 10, 20 and 30 per cent market decrease the gain on the dynamic hedges is assumed to be 80, 75 and 70 per cent of the loss from the dynamically hedged variable annuity policy liabilities, respectively. For a 10, 20 and 30 per cent market increase the loss on the dynamic hedges is assumed to be 120, 125 and 130 per cent of the gain from the dynamically hedged variable annuity policy liabilities, respectively. For presentation purposes, numbers are rounded. |
| (4) | This impact for general fund equities is calculated as at a point-in-time and does not include: (i) any potential impact on public equity weightings; (ii) any gains or losses on public equities held in the Corporate and Other segment; or (iii) any gains or losses on public equity investments held in Manulife Bank. The sensitivities assume that the participating policy funds are self supporting and generate no material impact on net income attributed to shareholders as a result of changes in equity markets. |
The following table shows the notional value of shorted equity futures contracts utilized for our variable annuity guarantee dynamic hedging and our macro equity risk hedging.
| | | | | | | | | | | | |
As at December 31, (C$ millions) | | 2010 | | | 2009 | | | | |
For variable annuity guarantee dynamic hedging strategy(1) | | $ | 4,200 | | | $ | 1,900 | | | | | |
For macro equity risk hedging strategy | | | 5,100 | | | | – | | | | | |
Total | | $ | 9,300 | | | $ | 1,900 | | | | | |
| (1) | Reflects net short and long positions for exposures to similar exchanges. |
Potential impact on shareholders’ economic value13 arising from changes to public equity returns
The impact on shareholders’ economic value resulting from an immediate 10, 20 and 30 per cent decline in market values of publicly traded equities was estimated as a decrease of $750 million, $1,700 million and $2,810 million, respectively, as at December 31, 2010 ($1,180 million, $2,570 million and $4,200 million as at December 31, 2009). The impact on shareholders’ economic value resulting from an immediate 10, 20 and 30 per cent increase in market values of publicly traded equities was estimated as a gain of $620 million, $1,170 million and $1,690 million, respectively, as at December 31, 2010 ($1,040 million, $2,020 million and $2,910 million as at December 31, 2009).
The impact on shareholders’ economic value arising from off-balance sheet products is calculated as the change in the after-tax net present value of projected future best estimate guaranteed benefit payments, reinsurance settlements and fee income and expenses, discounted at market yields. As it relates to variable product guarantees, this net present value is calculated as the average across many investment return scenarios. The impact on shareholders’ economic value arising from each of general fund equity holdings and macro hedge assets is calculated as the after-tax change in the market value of the equity holdings and macro hedge assets, respectively. We use the same assumptions with respect to the amount of the change in policy liabilities related to dynamically hedged variable annuities that is offset by hedge assets as outlined above. Actual experience may vary from these assumptions.
| 13 | Shareholders economic value is a non-GAAP measure. See “Performance and Non-GAAP Measures” below. |
Changes in equity markets impact our available and required components of the MCCSR ratio. The following table shows the potential impact to MLI’s MCCSR ratio resulting from changes in public equity market values, assuming that the change in the value of the hedge assets does not completely offset the change of the related variable annuity guarantee liabilities.
Potential impact on MLI’s MCCSR ratio arising from public equity returns different than the expected return for policy liability valuation(1),(2)
| | | | | | | | | | | | | | | | | | | | | | | | | | | | | | | | | | | | | | | | | | | | | | | | | | | | | | | | |
| As at December 31, | | 2010 | | | | | | 2009 | | | | |
(percentage points) | | | -30% | | | | -20% | | | | -10% | | | | 10% | | | | 20% | | | | 30% | | | | | | | | -30% | | | | -20% | | | | -10% | | | | 10% | | | | 20% | | | | 30% | | | | | |
Impact on MLI MCCSR | | | (27 | ) | | | (16 | ) | | | (7 | ) | | | 7 | | | | 15 | | | | 24 | | | | | | | | (42 | ) | | | (25 | ) | | | (11 | ) | | | 13 | | | | 25 | | | | 32 | | | | | |
| (1) | See “Caution Related to Sensitivities” above. |
| (2) | For a 10, 20 and 30 per cent market decrease the gain on the dynamic hedge assets is assumed to be 80, 75 and 70 per cent of the loss from the dynamically hedged variable annuity policy liabilities, respectively. For a 10, 20 and 30 per cent market increase the loss on the dynamic hedge assets is assumed to be 120, 125 and 130 per cent of the gain from the dynamically hedged variable annuity policy liabilities, respectively. |
Interest Rate Risk
The following table shows the potential impact on net income attributed to shareholders of a change of one per cent, in current government, swap and corporate rates for all maturities across all markets with no change in credit spreads between government, swap and corporate rates, and with a floor of zero on government rates, relative to the rates assumed in the valuation of policy liabilities. We also assume no change to the ultimate reinvestment rate (“URR”).
Potential impact on annual net income attributed to shareholders of an immediate one per cent parallel change in interest rates relative to rates assumed in the valuation of policy liabilities(1)
| | | | | | | | | | | | | | | | | | | | | | | | |
As at December 31, (C$ millions) | | 2010 | | | | | | 2009 | | | | |
| | | -100bp | | | | +100bp | | | | | | | | -100bp | | | | +100bp | | | | | |
General fund products(2) | | $ | (1,400 | ) | | $ | 1,200 | | | | | | | $ | (1,900 | ) | | $ | 1,500 | | | | | |
Variable annuity guarantees(3) | | | (400 | ) | | | 300 | | | | | | | | (300 | ) | | | 100 | | | | | |
Total | | $ | (1,800 | ) | | $ | 1,500 | | | | | | | $ | (2,200 | ) | | $ | 1,600 | | | | | |
| (1) | See “Caution Related to Sensitivities” above. |
| (2) | The sensitivities assume that the participating policy funds are self supporting and generate no material impact on net income attributed to shareholders as a result of changes in interest rates. |
| (3) | For variable annuity liabilities that are dynamically hedged, it is assumed that interest rate hedges are rebalanced at 20 basis point intervals. |
The decline in exposures was primarily driven by the actions to extend the duration of our fixed income investments supporting policyholder liabilities. These impacts were partially offset by generally lower interest rates in the markets where we operate and the impact of increases to policy liabilities as a result of our annual review of policy valuation assumptions.
The potential impact on annual net income attributed to shareholders provided in the table above does not include any impact arising from the sale of fixed income assets held in our surplus segment. Changes in the market value of these assets may provide a natural economic offset to the interest rate risk arising from our product liabilities. In order for there to also be an accounting offset, the Company would need to realize a portion of the AFS fixed income unrealized gains or losses. It is not certain we would crystallize any of the unrealized gains or losses available. As at December 31, 2010 the AFS fixed income assets held in the surplus segment were in a net after-tax unrealized gain position of $186 million (gross after-tax unrealized gains were $390 million and gross after-tax unrealized losses were $204 million).
The following table shows the potential impact on net income attributed to shareholders including the change in the market value of fixed income assets held in our surplus segment, which could be realized through the sale of these assets.
Potential impact on annual net income attributed to shareholders of an immediate one per cent parallel change in interest rates including on the change in market value of AFS fixed income assets in the surplus segment(1),(2)
| | | | | | | | | | | | | | | | | | | | | | | | |
As at December 31, (C$ millions) | | 2010 | | | | | | 2009 | | | | |
| | | -100bp | | | | +100bp | | | | | | | | -100bp | | | | +100bp | | | | | |
Impact excluding the change in the market value of AFS fixed income assets held in the surplus segment | | $ | (1,800 | ) | | $ | 1,500 | | | | | | | $ | (2,200 | ) | | $ | 1,600 | | | | | |
Impact of the change in the market value of AFS fixed income assets held in the surplus segment (after-tax)(2) | | $ | 1,200 | | | $ | (900 | ) | | | | | | $ | 600 | | | $ | (500 | ) | | | | |
Including 100% of the change in the market value of fixed income assets held in the surplus segment(2) | | $ | (600 | ) | | $ | 600 | | | | | | | $ | (1,600 | ) | | $ | 1,100 | | | | | |
| (1) | See “Caution Related to Sensitivities” above. |
| (2) | The amount of gain or loss that can be realized on AFS fixed income assets held in the surplus segment will depend on the amount of unrealized gain or loss. The table above only shows the change in the unrealized position, as the total unrealized position will depend upon the unrealized position at the beginning of the period. |
Potential impact on shareholders’ economic value of an immediate one per cent parallel change in interest rates14
The impact on shareholders’ economic value of a one per cent decrease and a one per cent increase in government, swap and corporate rates for all maturities across all markets with no change in credit spreads between government, swap and corporate rates, and with a floor of zero on interest rates, was a decrease of $840 million and increase of $130 million, respectively, as at December 31, 2010 ($(1,870) million and $1,100 million, respectively, as at December 31, 2009).
The impact on shareholders’ economic value as a result of interest rate changes is calculated as the change in the after-tax net present value of future cash flows related to assets including derivatives, policy premiums, benefits and expenses, all discounted at market yields for bonds of a specified quality rating. For variable annuity guarantees dynamically hedged, it is assumed that interest rate hedges are rebalanced at 20 basis point intervals.
The following table shows the potential impact on MLI’s MCCSR ratio from an immediate change in interest rates.
Potential impact on MLI’s MCCSR ratio arising from an immediate one per cent parallel change in interest rates(1)
| | | | | | | | | | | | | | | | | | | | | | | | |
As at December 31, (percentage points) | | 2010 | | | | | | 2009 | | | | |
| | -100bp | | | +100bp | | | | | | -100bp | | | +100bp | | | | |
Impact excluding the change in the market value of AFS fixed income assets held in the surplus segment | | | (23 | ) | | | 19 | | | | | | | | (24 | ) | | | 20 | | | | | |
Impact including 100% of the change in the market value of the AFS fixed income assets held in the surplus segment (after-tax)(2) | | | (14 | ) | | | 12 | | | | | | | | (19 | ) | | | 16 | | | | | |
| (1) | See “Caution Related to Sensitivities” above. |
| (2) | The amount of gain or loss that can be realized on AFS fixed income assets held in the surplus segment will depend on the amount of unrealized gain or loss. The table above only shows the change in the unrealized position, as the total unrealized position will depend upon the unrealized position at the beginning of the period. |
The following tables show the potential impact on net income attributed to shareholders resulting from a change in corporate spreads and swap spreads over government bond rates for all maturities across all markets with a floor of zero on the total interest rate, relative to the spreads assumed in the valuation of policy liabilities.
Potential impact on net income attributed to shareholders arising from changes to corporate spreads(1),(2)
| | | | | | | | | | | | |
As at December 31, 2010 (C$ millions) | | -50bp | | | +50bp | | | | |
Corporate spreads(3),(4) | | $ | (500 | ) | | $ | 400 | | | | | |
| (1) | See “Caution Related to Sensitivities” above. |
| (2) | The sensitivity was estimated as 50% of the sensitivity to a 100 basis point change. Actual results may differ materially from these estimates. |
| (3) | The impact on net income attributed to shareholders assumes no gains or losses are realized on our AFS fixed income assets held in the surplus segment and excludes the impact arising from changes in off-balance sheet bond fund value arising from changes in credit spreads. The sensitivities assume that the participating policy funds are self supporting and generate no material impact on net income attributed to shareholders as a result of changes in corporate spreads. |
| (4) | Corporate spreads are assumed to grade to the long term average over five years. |
Potential impact on net income attributed to shareholders arising from changes to swap spreads(1)
| | | | | | | | | | | | |
As at December 31, 2010 (C$ millions) | | -20bp | | | +20bp | | | | |
Swap spreads(2) | | $ | 200 | | | $ | (200 | ) | | | | |
| (1) | See “Caution Related to Sensitivities” above. |
| (2) | The impact on net income attributed to shareholders assumes no gains or losses are realized on our AFS fixed income assets held in the surplus segment and excludes the impact arising from changes in off-balance sheet bond fund value arising from changes in credit spreads. The sensitivities assume that the participating policy funds are self supporting and generate no material impact on net income attributed to shareholders as a result of changes in swap spreads. |
| 14 | See “Caution Related to Sensitivities” above. |
Alternative Non-Fixed Income Asset Performance Risk
The following table shows the potential impact on net income attributed to shareholders resulting from changes in market values of alternative non-fixed income assets different than the expected levels assumed in the valuation of policy liabilities.
Potential impact on net income attributed to shareholders arising from changes in alternative non-fixed income asset returns(1),(2)
| | | | | | | | | | | | | | | | | | | | |
As at December 31, (C$ millions) | | 2010 | | | 2009 | | | | |
| | -10% | | | +10% | | | -10% | | | +10% | | | | |
Real estate, agriculture and timber assets | | $ | (500 | ) | | $ | 600 | | | $ | (400 | ) | | $ | 400 | | | | | |
Private equities and other alternative non-fixed income assets | | | (400 | ) | | | 400 | | | | (200 | ) | | | 200 | | | | | |
Alternative non-fixed income assets | | $ | (900 | ) | | $ | 1,000 | | | $ | (600 | ) | | $ | 600 | | | | | |
| (1) | See “Caution Related to Sensitivities” above. |
| (2) | This impact is calculated as at a point-in-time impact and does not include: (i) any potential impact on non-fixed income asset weightings; (ii) any gains or losses on non-fixed income investments held in the Corporate and Other segment; or (iii) any gains or losses on non-fixed income investments held in Manulife Bank. The sensitivities assume that the participating policy funds are self supporting and generate no material impact on net income attributed to shareholders as a result of changes in alternative non-fixed income asset returns. |
The increased sensitivity from December 31, 2009 to December 31, 2010 is primarily related to the second order impact of the net decline in interest rates as well as the higher future non-fixed income demand in the Long-Term Care business in the U.S. Insurance segment anticipated from future increases in policyholder premiums.
Potential impact on shareholders’ economic value arising from alternative non-fixed income asset returns
The impact on shareholders’ economic value resulting from a 10 per cent decline in alternative non-fixed income assets was estimated at a loss of $763 million at December 31, 2010 (2009 – $657 million). The impact on shareholders’ economic value resulting from a 10 per cent increase in alternative non-fixed income assets was estimated at a gain of $763 million at December 31, 2010 (2009 – $657 million).15
Foreign Exchange Risk
The following table shows the impact on net income attributed to shareholders of a one per cent change in the Canadian dollar relative to our key operating currencies.
Potential impact on net income attributed to shareholders(1)
| | | | | | | | | | | | | | | | | | | | |
| | | 2010 | | | 2009 | | | | |
As at December 31, (C$ millions) | | +1% strengthening | | | -1% weakening | | | +1% strengthening | | | -1% weakening | | | | |
1% change relative to the U.S. Dollar | | $ | 13 | | | $ | (13 | ) | | $ | (10 | ) | | $ | 10 | | | | | |
1% change relative to the Japanese Yen | | $ | 1 | | | $ | (1 | ) | | $ | (3 | ) | | $ | 3 | | | | | |
| (1) | See “Caution Related to Sensitivities” above. Normally, a strengthening Canadian dollar would reduce the Canadian dollar equivalent of our foreign denominated earnings. Applying a one per cent strengthening of the Canadian dollar to the foreign denominated losses experienced in 2010 reduces these losses and therefore would have a positive impact to shareholders’ earnings. |
The following table shows the impact on shareholders’ equity of a one per cent change in the Canadian dollar relative to our key operating currencies.
Potential impact on shareholders’ equity(1)
| | | | | | | | | | | | | | | | | | | | |
As at December 31, (C$ millions) | | 2010 | | | 2009 | | | | |
| | +1% strengthening | | | -1% weakening | | | +1% strengthening | | | -1% weakening | | | | |
1% change relative to the U.S. Dollar | | $ | (181 | ) | | $ | 181 | | | $ | (166 | ) | | $ | 166 | | | | | |
1% change relative to the Japanese Yen | | $ | (29 | ) | | $ | 29 | | | $ | (27 | ) | | $ | 27 | | | | | |
| (1) | See “Caution Related to Sensitivities” above. |
Liquidity Risk
Liquidity risk is the risk of not having access to sufficient funds or liquid assets to meet both expected and unexpected cash and collateral demands.
Key Risk Factors
Manulife Financial is exposed to liquidity risk in each of our operating companies and in our holding company. In the operating companies, expected cash and collateral demands arise day-to-day to fund anticipated policyholder benefits, withdrawals of customer
| 15 | The impact on shareholders’ economic value arising from alternative non-fixed income assets is calculated as the after-tax change in the market value of the alternative non-fixed income assets. |
deposit balances, reinsurance settlements, derivative instrument settlements/collateral pledging, expenses, investment and hedging activities. Under stressed conditions, unexpected cash and collateral demands could arise primarily from an increase in the level of policyholders either terminating policies with large cash surrender values or not renewing them when they mature, withdrawals of customer deposit balances, borrowers renewing or extending their loans when they mature, derivative settlements or collateral demands, and reinsurance settlements or collateral demands. The implementation of the Dodd-Frank bill in the United States in 2011 will require certain derivatives to migrate from bilateral arrangements to clearing houses, and this is expected to increase liquidity requirements to support these contracts.
The ability of our holding company to fund its cash requirements depends upon it receiving dividends, distributions and other payments from our operating subsidiaries. These subsidiaries are generally required to maintain solvency and capital standards imposed by their local regulators and, as a result, may have restrictions on payments which they may make to MFC.
In the normal course of business, third party banks issue letters of credit on our behalf. In lieu of posting collateral, our businesses utilize letters of credit for which third parties are the beneficiaries, as well as for affiliate reinsurance transactions between subsidiaries of MFC. Letters of credit and letters of credit facilities must be renewed periodically. At time of renewal, the Company is exposed to repricing risk and under adverse conditions increases in costs will be realized. In the most extreme scenarios, letters of credit capacity could become constrained due to non-renewals which would restrict our flexibility to manage capital at the operating company level. This could negatively impact our ability to meet local capital requirements or our sales of products in jurisdictions in which our operating companies have been affected. Although the Company did not experience any material change in aggregate capacity during the financial crisis of the past three years, changes in prices and conditions were adverse during the market turbulence. There were no assets pledged against these outstanding letters of credit as at December 31, 2010.
Risk Management Strategy
Global liquidity management policies and procedures are designed to provide adequate liquidity to cover cash and collateral obligations as they come due, and to sustain and grow operations in both normal and stressed conditions. They take into account any legal, regulatory, tax, operational or economic impediments to inter-entity funding.
We seek to reduce liquidity risk by diversifying our business across different products, markets, geographical regions and policyholders. We design insurance products to encourage policyholders to maintain their policies in-force, to help generate a diversified and stable flow of recurring premium income. We design the policyholder termination features of our wealth management products and related investment strategies with the goal of mitigating the financial exposure and liquidity risk related to unexpected policyholder terminations. We establish and implement investment strategies intended to match the term profile of the assets to the liabilities they support, taking into account the potential for unexpected policyholder terminations and resulting liquidity needs. Liquid assets represent a large portion of our total assets. We aim to reduce liquidity risk in our deposit funded businesses by diversifying our funding sources and appropriately managing the term structure of our funding. We forecast and monitor daily operating liquidity and cash movements in various individual entities and operations as well as centrally, aiming to ensure liquidity is available and cash is employed optimally.
We also maintain centralized cash pools and access to other sources of liquidity such as repurchase funding agreements. Our centralized cash pool consists of cash or near-cash, high quality short-term investments that are continually monitored for their credit quality and market liquidity.
Through the normal course of business, pledging of assets is required to comply with jurisdictional regulatory and other requirements including collateral pledged to mitigate derivative counterparty credit risk, assets pledged to exchanges as initial margin and assets held as collateral for repurchase funding agreements. Total unencumbered assets were $214.6 billion as at December 31, 2010 (2009 – $203.9 billion).
The market values of our derivative portfolio are periodically stress tested based on shocks to interest rates, underlying indices, and foreign exchange rates to assess the potential collateral and cash settlement requirements under stressed conditions. Increased use of derivatives for hedging purposes has necessitated greater emphasis on measurement and management of contingent liquidity risk. In 2010, comprehensive new liquidity stress testing was implemented which measures, on an integrated basis, the impact of equity market and rate shocks on derivative collateral requirements, reserve requirements, reinsurance settlements, policyholder behaviour and the market value of eligible liquid assets. We manage the asset mix of our balance sheet taking into account the need to hold adequate unencumbered and appropriate liquid assets to satisfy the potential additional requirements arising under stressed scenarios, and to allow our liquidity ratios to remain strong.
Consolidated group operating and strategic liquidity levels are managed against established minimums. We set minimum operating liquidity as the level of one month’s operating cash outflows. We measure strategic liquidity under both immediate (within one month) and ongoing (within one year) stress scenarios. Our policy is to maintain the ratio of adjusted liquid assets to adjusted policy liabilities at or above a pre-established target. Adjusted liquid assets include unencumbered cash and short-term investments, and marketable bonds and stocks that are discounted to reflect convertibility to cash, net of maturing debt obligations. Policy liabilities are adjusted to reflect their potential for withdrawal. In addition to managing the consolidated liquidity levels, each entity maintains sufficient liquidity to meet its standalone demands.
Manulife Bank has a liquidity risk management policy framework, managed on a standalone basis. The framework includes stress testing, cashflow modeling, a funding plan and a contingency plan. In 2010, the bank established a securitization infrastructure which enables the bank to access a range of funding and liquidity sources.
Risk Exposure Measures
Our strategic liquidity ratios are provided in the following table.
| | | | | | | | | | | | | | | | | | | | |
As at December 31, (C$ millions) | | 2010 | | | 2009 | | | | |
| | Immediate
scenario | | | Ongoing
scenario | | | Immediate
scenario | | | Ongoing
scenario | | | | |
Adjusted liquid assets | | $ | 103,787 | | | $ | 106,341 | | | $ | 99,107 | | | $ | 100,057 | | | | | |
Adjusted policy liabilities | | $ | 24,467 | | | $ | 32,058 | | | $ | 24,926 | | | $ | 34,535 | | | | | |
Liquidity ratio | | | 424% | | | | 332% | | | | 398% | | | | 290% | | | | | |
Credit Risk
Credit risk is the risk of loss due to the inability or unwillingness of a borrower or counterparty to fulfill its payment obligations.
Key Risk Factors
Worsening or continued poor economic conditions could result in borrower or counterparty defaults or downgrades, and could lead to increased provisions or impairments related to our general fund invested assets and off-balance sheet derivative financial instruments, and an increase in provisions for future credit impairments to be included in our policy liabilities. Any of our reinsurance providers being unable or unwilling to fulfill their contractual obligations related to the liabilities we cede to them could lead to an increase in policy liabilities.
Risk Management Strategy
The Company has established objectives for overall quality and diversification of our general fund investment portfolio and criteria for the selection of counterparties, including derivative counterparties, reinsurers and insurance providers. Our policies establish exposure limits by borrower, corporate connection, quality rating, industry, and geographic region, and govern the usage of credit derivatives. Corporate connection limits vary according to risk rating. Our general fund fixed income investments are primarily investment grade bonds and commercial mortgages. We do not actively participate in the credit derivative market, and currently have a minimal exposure to credit default swaps.
Our credit-granting units follow a defined evaluation process that provides an objective assessment of credit proposals. We assign each investment a risk rating based on a detailed examination of the borrower that includes a review of business strategy, market competitiveness, industry trends, financial strength, access to funds, and other risks facing the organization. We assess and update risk ratings regularly, based on a standardized 22-point scale consistent with those of external rating agencies. For additional input to the process, we also assess credit risks using a variety of industry standard, market-based tools and metrics. We map our risk ratings to pre-established probabilities of default and loss given defaults, based on historical industry and Company experience, and to resulting default costs.
We establish delegated credit approval authorities and make credit decisions on a case-by-case basis at a management level appropriate to the size and risk level of the transaction, based on the delegated authorities that vary according to risk rating. We refer all major credit decisions to the Credit Committee and the largest credit decisions to the CEO for approval and, in certain cases, to the Board of Directors.
We limit the types of authorized derivatives and applications and require pre-approval of all derivative application strategies and regular monitoring of the effectiveness of derivative strategies. Derivative counterparty exposure limits are established based on a minimum acceptable counterparty credit rating of A- from internationally recognized rating agencies. We measure derivative counterparty exposure as net potential credit exposure, which takes into consideration mark-to-market values of all transactions with each counterparty, net of any collateral held, and an allowance to reflect future potential exposure. We measure reinsurance counterparty exposure, taking into account current exposures and potential future exposures reflecting the level of ceded policy liabilities. We require all reinsurance counterparties and insurance providers to meet minimum risk rating criteria.
Regular reviews of the credits within the various portfolios are undertaken with the goal of identifying changes to credit quality, and where appropriate, taking corrective action. Prompt identification of problem credits is a key objective. CRM provides independent credit risk oversight by reviewing assigned risk ratings, and monitoring problem and potential problem credits.
We establish an allowance for losses on a loan when it becomes impaired as a result of deterioration in credit quality, to the extent there is no longer assurance of timely realization of the carrying value of the loan and related investment income. We reduce the carrying value of an impaired loan to its estimated net realizable value when we establish the allowance. We establish an allowance for losses on reinsurance contracts when a reinsurance counterparty becomes unable or unwilling to fulfill its contractual obligations. We base the allowance for loss on current recoverables and ceded policy liabilities. There is no assurance that the allowance for losses will be adequate to cover future potential losses or that additional allowances or asset write-downs will not be required.
Policy liabilities include general provisions for credit losses from future asset impairments. We set these conservatively, taking into account average historical levels and future expectations, with a provision for adverse deviations. Fluctuations in credit default rates and deterioration in credit ratings of borrowers may result in losses if actual rates exceed expected rates.
Throughout the recent challenging credit environment, our credit policies and procedures and investment strategies have remained fundamentally unchanged. Credit exposure in our investment portfolio is actively managed to reduce risk and mitigate losses and derivative counterparty exposure is managed proactively. While defaults and downgrades were generally above the historical average in 2009, these measures improved throughout 2010. However, we still expect volatility on a quarterly basis and losses could potentially rise above long-term expected levels.
Risk Exposure Measures
As at December 31, 2010 and December 31, 2009, for every 50 per cent that credit defaults over the next year exceeded the rates provided for in policy liabilities, net income attributed to shareholders would be reduced by $65 million and $73 million, respectively. Downgrades could also be higher than assumed in policy liabilities resulting in policy liability increases and a reduction in net income.
The table below shows net impaired assets and allowances for loan losses.
Net Impaired Assets and Loan Losses
| | | | | | | | | | | | |
As at December 31, (C$ millions unless otherwise stated) | | 2010 | | | 2009 | | | | |
Net impaired fixed income assets | | $ | 536 | | | $ | 625 | | | | | |
Net impaired fixed income assets as a per cent of total invested assets | | | 0.27% | | | | 0.33% | | | | | |
Allowance for loan losses | | $ | 118 | | | $ | 183 | | | | | |
Insurance Risk
Insurance risk is the risk of loss due to actual experience emerging differently than assumed when a product was designed and priced with respect to mortality and morbidity claims, policyholder behaviour and expenses.
Key Risk Factors
We make a variety of assumptions related to the future level of claims, policyholder behaviour, expenses and sales levels when we design and price products, and when we establish policy liabilities. Assumptions for future claims are based on both Company and industry experience and predictive models, and assumptions for future policyholder behavior are based on Company experience and predictive models. Should actual results be materially worse than those assumed in the design, pricing and sale of products, profits will be unfavourably impacted. Such losses could have a significant adverse effect on our results of operations and financial condition. In addition, we periodically review the assumptions we make in determining our policy liabilities and the review may result in an increase in policy liabilities and a decrease in net income attributable to shareholders. Such assumptions require significant professional judgment, so actual experience may be materially different than the assumptions we make.
Life and health insurance claims may be impacted by the unusual onset of disease or illness, natural disasters, large-scale manmade disasters and acts of terrorism. The ultimate level of lifetime benefits paid to policyholders may be impacted by unexpected changes in life expectancy. Policyholder premium payment patterns, policy renewals, and withdrawal and surrender activity are influenced by many factors including market and general economic conditions, and the availability and relative attractiveness of other products in the marketplace. As well, adverse claims experience could result from systematic anti-selection, which could arise from the development of investor owned and secondary markets for life insurance policies, underwriting process failures, or other factors.
We purchase reinsurance protection on certain risks underwritten by our various business segments. External market conditions determine the availability, terms and cost of the reinsurance protection for new business and, in certain circumstances, the cost of reinsurance for business already reinsured. Accordingly, we may be forced to incur additional costs for reinsurance or may not be able to obtain sufficient reinsurance on acceptable terms, which could adversely affect our ability to write future business or result in the assumption of more risk with respect to those policies we issue.
Risk Management Strategy
We have established a broad framework for managing insurance risk, together with all other elements of product design, product pricing and reinsurance purchase practices, set out by our Product Design and Pricing Policy and Underwriting and Claims Policy, and we have established global product design and pricing standards and guidelines, and reinsurance guidelines, aimed to help ensure our product offerings align with our risk taking philosophy and risk targets, and achieve acceptable profit margins. These cover:
| | |
n product design features | | n pricing methods and assumption setting |
n use of reinsurance | | n stochastic and stress scenario testing |
n pricing models and software | | n required documentation |
n internal risk-based capital allocations | | n review and approval processes |
n target profit objectives | | n experience monitoring programs |
We designate individual pricing officers in each business unit who are accountable for all pricing activities. The general manager and chief financial officer of each business unit, and CRM, approve the design and pricing of each product, including key claims, policyholder behaviour, investment return and expense assumptions, as well as reinsurance treaties with third parties, with the goal of meeting corporate standards. Corporate Actuarial approves all policy liability valuation methods and assumptions and approves reinsurance
treaties related to business in-force, as well as all related party reinsurance treaties. We perform annual risk and compliance self-assessments of the product development and pricing activities of all businesses. We also facilitate knowledge transfer between staff working with similar businesses in different geographies in order to leverage best practices.
We utilize a global underwriting manual intended to ensure insurance underwriting practices for direct written life business are consistent across the organization while reflecting local conditions. Each business unit establishes underwriting policies and procedures, including criteria for approval of risks and claims adjudication policies and procedures.
We apply retention limits per insured life that are intended to reduce our exposure to individual large claims which are monitored in each business unit. These retention limits vary by market and jurisdiction. We reinsure exposure in excess of these limits with other companies. Our current global retention limit is US$30 million for a single life (US$35 million for survivorship life policies) and is shared across business units. We apply lower limits in some markets and jurisdictions. We aim to further reduce exposure to claims concentrations by applying geographical aggregate retention limits for certain covers. Enterprise-wide, we aim to reduce the likelihood of high aggregate claims by operating internationally and insuring a wide range of unrelated risk events.
The Company’s aggregate exposure to each of policyholder behaviour risk and claims risk are managed against enterprise-wide economic capital, regulatory capital and earnings at risk targets. The policyholder behaviour risk targets cover the combined risk arising from policyholder renewal activity, policy lapses and surrenders, withdrawals, premium payment patterns, fund selections, and other policyholder driven activity. The claims risk targets cover the combined risk arising from mortality, longevity and morbidity.
In recent years, policyholder lapses and morbidity related to certain policies have been unfavourable compared to expected levels, resulting in experience losses. We have conducted a thorough review and modified our assumptions for the future to reflect the current experience; however, should experience deteriorate further, additional policy liability increases may be required.
We are currently seeking state regulatory approvals for price increases on existing long-term care business in the United States. We cannot be certain whether or when each approval will be granted. Our policy liabilities reflect our estimates of the impact of these price increases, but should we be less successful than anticipated in obtaining them, then policy liabilities would increase accordingly.
Risk Exposure Measures
Fluctuations in claims experience may result in losses. The table below shows the potential change in earnings attributable to shareholders, for every five per cent that actual mortality and morbidity rates over the next year differ from the rates provided for in policy liabilities.
Potential Impact on Net Income Attributed to Shareholders(1),(2)
| | | | | | | | | | | | | | | | | | | | |
As at December 31, (C$ millions) | | 2010 | | | 2009 | | | | |
| | -5% | | | +5% | | | -5% | | | +5% | | | | |
Impact of change in mortality rates | | $ | 58 | | | $ | (58 | ) | | $ | 58 | | | $ | (58 | ) | | | | |
Impact of change in morbidity rates | | | 86 | | | | (86 | ) | | | 113 | | | | (113 | ) | | | | |
Total | | $ | 144 | | | $ | (144 | ) | | $ | 171 | | | $ | (171 | ) | | | | |
| (1) | See “Caution Related to Sensitivities” above. |
| (2) | These exposure measures were determined under the assumption that claims experience would subsequently return to normal levels and as such no change would be required to policy liabilities for future years. The sensitivities assume that the participating policy funds are self supporting and generate no material impact on net income attributed to shareholders as a result of changes in mortality or morbidity rates. |
Operational Risk
Operational risk is the risk of loss resulting from inadequate or failed internal processes, risk management policies and procedures, systems failures, human performance failures or from external events.
Key Risk Factors
Operational risk is naturally present in all of our business activities and encompasses a broad range of risks, including regulatory compliance failures, legal disputes, technology failures, business interruption, information security and privacy, human resource management and employment practices, processing errors, complex modeling, business integration, theft and fraud, and damage to physical assets. Exposures can take the form of financial losses, regulatory sanctions, loss of competitive positioning, or damage to reputation. Operational risk is also embedded in all the practices we use to manage other risks therefore, if not managed effectively, can impact our ability to manage other key risks such as credit risk, market risk, liquidity risk and insurance risk.
Risk Management Strategy
Our corporate governance practices, corporate values, and integrated, enterprise-wide approach to managing risk set the foundation for mitigating operational risks. We strengthen this base by establishing appropriate internal controls and systems, compensation programs, and by seeking to retain trained and competent people throughout the organization. We align compensation programs with business strategy, long-term shareholder value and good governance practices, and we benchmark them against peer companies. We establish enterprise-wide risk management programs for specific operational risks that could materially impact our ability to do business or impact our reputation. Within established corporate standards, business unit general managers are accountable for the day-to-day management of the operational risks inherent in their operations. Business units and functional areas perform risk control self-assessments to identify, document and assess inherent operational risks and effectiveness of internal controls. They monitor key risk indicators that provide early warnings of emerging control issues and proactively modify procedures.
Through our corporate insurance program, we transfer a portion of our operational risk exposure by purchasing global and local insurance coverage that provides some protection against unexpected material losses resulting from events such as criminal activity, property loss or damage and liability exposures, or that satisfies legal requirements and contractual obligations. We determine the nature and amount of insurance coverage we purchase centrally, considering our enterprise-wide exposures and risk tolerances.
The following is a further description of key operational risk factors with associated management strategies.
Legal and Regulatory Risk
In addition to the regulatory and capital requirements described under Strategic Risk, the Company is subject to extensive regulatory oversight by insurance and financial services regulators in the jurisdictions in which we conduct business. While many of these laws and regulations are intended to protect policyholders, beneficiaries, depositors and investors in our products and services, others also set standards and requirements for the governance of our operations. Failure to comply with applicable laws or regulations could result in financial penalties or sanctions, and damage our reputation. We are also regularly involved in litigation, both as a plaintiff or defendant, which could result in an unfavourable resolution.
Global Compliance oversees our regulatory compliance program and function, supported by designated Chief Compliance Officers in every Division. The program is designed to promote compliance with regulatory obligations worldwide and to assist in making the Company aware of the laws and regulations that affect us, and the risks associated with failing to comply. Divisional compliance groups monitor emerging legal and regulatory issues and changes and prepare us to address new requirements. Global Compliance also independently assesses and monitors the effectiveness of a broad range of regulatory compliance processes and business practices against potential legal, regulatory, fraud and reputation risks, and helps to ensure significant issues are escalated and proactively mitigated. Among these processes and business practices are: product design, sales and marketing practices, sales compensation practices, asset management practices, fiduciary responsibilities, employment practices, underwriting and claims processing, privacy (i.e., handling of personal information) and regulatory filings. In addition, we have policies, processes and controls in place to help protect the Company, our customers and other related third parties from acts of fraud and from risks associated with money laundering and terrorist financing. Audit Services and Global Compliance periodically assess the effectiveness of the control environment. For further discussion of government regulation and legal proceedings, refer to “Government Regulation” and “Legal Proceedings” in our most recent Annual Information Form.
Technology, Information Security and Business Interruption Risks
Technology is used in virtually all aspects of our business and operations including the creation and support of new products and services. Our technology systems infrastructure environment is governed and managed according to operational integrity, data integrity and information security standards and controls. Disruption to operations due to system failure or information security breaches can have negative consequences for our businesses. We have business continuity, information security and other policies, plans and procedures in place designed to minimize the impact of a business disruption and protect confidential information; however these may not be effective. Disruptions or breaches caused by natural disasters, man-made disasters, criminal activity, pandemics, or other events beyond our control, could prevent us from effectively operating our business, or adversely impact us from a financial, operational and reputational perspective.
Technology related risks are managed through a systems development protocol and global information security programs. Global Information Systems oversees risks associated with information security, information systems privacy and compliance, business continuity and disaster recovery planning. We have in place a global business continuity policy along with standards of practice designed to ensure to the extent practical, key business functions can continue normal operations effectively and efficiently, in the event of a major disruption. Each business unit is accountable for its own business continuity plans and processes and the global program incorporates periodic scenario analysis designed to validate the assessment of both critical and non-critical units, as well as the establishment and testing of appropriate business continuity plans for all critical units. We establish and regularly test crisis management and communications protocols. We have off-site backup facilities and failover capability designed to minimize downtime and accelerate recovery time. We subject our outsourcing arrangements, whereby a service provider performs a service activity on behalf of the Company, to review procedures, prior to their approval. We have policies and procedures in place to monitor the ongoing results and contractual compliance of such arrangements.
Human Resource Risks
We compete with other insurance companies and financial institutions for qualified executives, employees and agents. Competition for the best people is intense and an inability to recruit qualified individuals may negatively impact our ability to execute on business strategies or to conduct our operations. We have established and implemented a number of human resource policies, practices and programs in order to manage these risks, including recruiting programs at every level of the organization, training and development programs, and competitive compensation programs that are designed to attract, motivate and retain high-performing employees.
Model Risk
Our reliance on highly complex models for pricing, valuation and risk measurement, and for input to decision making, is increasing. Consequently, the risk of inappropriate use or interpretation of our models or their output, or the use of deficient models, data or assumptions is growing. Our model risk oversight program includes processes intended to ensure that our critical business models are conceptually sound, used as intended, and to assess the appropriateness of the inputs, assumptions, calculations and outputs.
Environmental Risk
An environmental issue on a property owned by us or any property with which we are affiliated could result in financial or reputational loss. Our environmental policy reflects the Company’s commitment to conducting all business activities in a manner that recognizes the need to preserve the quality of the environment, and is designed to achieve compliance with all applicable environmental laws and regulations. In natural resource management operations, we have specific policies and procedures in place designed to mitigate environmental risks and operate in an environmentally responsible manner. We also have programs in place across our real estate holdings to conserve energy and reduce waste. In providing credit to borrowers, or making equity investments in private firms, we take reasonable steps to assess that counterparties are environmentally responsible.
Additional Risk Factors That May Affect Future Results
The Accounting Standards Board of the CICA makes changes to the financial accounting and reporting standards that govern the preparation of our financial statements. These changes may be difficult to anticipate and may materially impact how we record and present our financial condition and results of operations. As discussed under “Critical Accounting and Actuarial Policies”, the preparation of financial statements requires management to make estimates and assumptions that affect the reported amounts and disclosures made in the financial statements and accompanying notes. These estimates and assumptions may require revision and actual results may differ materially from these estimates. As well, as noted under “Cautionary Statement Concerning Forward-Looking Statements”, forward-looking statements involve risks and uncertainties and actual results may differ materially from those expressed or implied in such statements. Key risk factors and their management have been described above, summarized by major risk category.
Other factors that may affect future results include changes in government trade policy; monetary policy; fiscal policy; political conditions and developments in or affecting the countries in which we operate; technological changes; public infrastructure disruptions; climate change; changes in consumer spending and saving habits; the possible impact on local, national or global economies from public health emergencies, such as an influenza pandemic, and international conflicts and other developments including those relating to terrorist activities. Although we take steps to anticipate and minimize risks in general, unforeseen future events may have a negative impact on our business, financial condition and results of operations.
We caution that the preceding discussion of risks that may affect future results is not exhaustive. When relying on our forward-looking statements to make decisions with respect to our Company, investors and others should carefully consider the foregoing risks, as well as other uncertainties and potential events, and other external and Company specific risks that may adversely affect the future business, financial condition or results of operations of our Company.
Capital Management Framework
Manulife seeks to manage its capital with the objectives of:
| n | | Operating with sufficient capital to be able to honour all policyholder and other obligations with a high degree of confidence; |
| n | | Securing stability and flexibility through maintaining best access to capital markets, achievement of target credit ratings and by maintaining the confidence of regulators, policyholders, rating agencies, investors and other creditors; and |
| n | | Seeking to optimize return on capital to meet shareholders’ expectations, subject to capital adequacy considerations established to meet the first two objectives. |
Capital is managed in accordance with the Capital Management Policy, which is reviewed and approved by the Board of Directors. The policy establishes guidelines regarding the quantity and quality of capital, capital mobility, integration with risk and financial frameworks and proactive assessment of capital challenges to facilitate timely action to address them.
In establishing target levels of capitalization, the Company typically adopts regulatory capital definitions and measures applicable to any given entity and jurisdiction in which an entity operates. The primary measures are ratios comparing available capital to required capital determined using risk based factors and methods. The targets are established based on internal sensitivity testing as well as expectations of key external stakeholders such as regulators and rating agencies. In addition, these are supplemented by an internal capital measurement framework that reflects our own risk view. We establish internal targets for capital adequacy that typically exceed regulatory requirements. This is designed to ensure ongoing compliance with regulatory constraints and to enable us to take into account risk profiles, rating agency expectations and peer comparisons, among other considerations. Management monitors capital against those internal targets and initiates action appropriate given our business objectives.
Capital is generally allocated to business lines for planning and performance management purposes based on the higher of the internal risk-based capital and the regulatory capital levels.
The currency mix of assets supporting capital is consistent with the currency mix of the Company’s required capital. The impact of currency movements on the capital ratios is thus mitigated as both available and required capital rise (fall) when the Canadian dollar weakens (strengthens).
As part of our annual DCAT, we assess the strength of our capital position under severe shock scenarios. The scenarios are determined each year to ensure their ongoing relevance to our business and risk profile. The 2010 results of this testing indicated that, given the actions taken in 2010, the Company’s capital levels provided for sufficient assets to discharge liabilities and guarantee obligations in the various adverse scenarios tested. These scenarios included tests of risks related to equity markets, credit, interest rates and inflation, amongst others.
Capital quality is maintained by limiting the amount of leverage capital or non-permanent equity capital in the capital structure. The composition of capital between equity and other instruments remains well within regulatory constraints. In addition, the Company’s financial strength rating is an important consideration in determining the appropriate amount of leverage. The Company monitors and rebalances its capital mix through capital issuances and redemptions.
The following measure of available capital serves as the foundation of our capital management activities at the MFC level. For regulatory reporting purposes, the numbers are further adjusted for various additions or deductions to capital as mandated by the guidelines issued by OSFI.
MFC Consolidated Capital
| | | | | | | | | | | | | | | | |
As at December 31, (C$ millions) | | 2010 | | | 2009 | | | 2008 | | | | |
Total equity(1) | | $ | 26,873 | | | $ | 28,907 | | | $ | 27,197 | | | | | |
Less AOCI (loss) on cash flow hedges | | | (99 | ) | | | (48 | ) | | | (325 | ) | | | | |
Total equity less AOCI (loss) on cash flow hedges | | $ | 26,972 | | | $ | 28,955 | | | $ | 27,522 | | | | | |
Liabilities for preferred shares and qualifying capital instruments | | | 4,011 | | | | 4,037 | | | | 3,121 | | | | | |
Non-controlling interest in subsidiaries | | | 254 | | | | 202 | | | | 217 | | | | | |
Total capital | | $ | 31,237 | | | $ | 33,194 | | | $ | 30,860 | | | | | |
| (1) | Total equity includes unrealized gains and losses on AFS bonds and AFS equities, net of taxes. Starting 2009, the current period net unrealized gain or loss on AFS bonds is not part of OSFI regulatory capital. As at December 31, 2010, the unrealized gain on AFS bonds, net of taxes, was $200 million. |
In 2010, the Company’s capital decreased by $2.0 billion compared to prior year. The decrease was primarily due to $0.4 billion losses attributed to shareholders, $0.7 billion shareholder dividends paid in cash, $0.4 billion decrease in unrealized gains on AFS securities, and $0.6 billion due to the negative impact of the strengthened Canadian dollar.
Senior debt raised by MFC, amounting to $5.8 billion at December 31, 2010, is not viewed as capital at the MFC level, consistent with its treatment by OSFI. However, all or some of the funds raised through senior indebtedness can be downstreamed into operating entities in a form that qualifies as regulatory capital at the subsidiary level, which creates financial leverage. Rating agencies expect companies to limit such financial leverage to levels appropriate for their ratings.
The Board of Directors reviews and approves our capital management policies. Each quarter the Audit Committee of the Board reviews the Company’s capital position. In addition, the Appointed Actuary discusses with the Board key sensitivities of the Company’s capital ratios as assessed in the context of annual capital planning and DCAT analysis. Operational oversight of capital management is provided by the Finance Committee, consisting of senior finance, risk management and investment executives and chaired by the Chief Actuary. The committee oversees capital policies and reviews issues and initiatives that affect the capital position of MFC’s subsidiaries and the Company as a whole.
Common Shareholder Dividends and Target Dividend Payout Ratio
The dividends per common share paid in cash or shares and the common share dividend payout ratio in the last three years were:
| | | | | | | | | | | | | | | | |
| For the years ended December 31, | | 2010 | | | 2009 | | | 2008 | | | | |
Dividends per common share paid in cash or shares | | $ | 0.52 | | | $ | 0.78 | | | $ | 1.00 | | | | | |
Common share dividend payout ratio | | | n/a | | | | 94% | | | | 307% | | | | | |
In 2009, the Company introduced a Dividend Reinvestment Plan (“DRIP”) which allowed for issuance of common shares from treasury with a discount, at the discretion of the Board. For the first three quarterly dividends in 2010, the Company elected to issue DRIP shares from treasury with a discount of three per cent. The discount was changed to two per cent for the fourth quarter dividend. Participation in the DRIP is strong, with enrolment in excess of one third of shares outstanding.
Capital and Funding Activities
In analyzing capital at the MFC consolidated level, we primarily consider equity as well as subordinated long-term instruments, in alignment with OSFI’s regulatory capital definitions. We also raise senior debt from MFC which may be deployed in our downstream entities as capital.
In 2010, we raised $2,021 million in total debt funding.
On August 20, 2010, MFC issued $900 million of 4.079% medium term notes constituting senior indebtedness maturing in 2015.
In MFC’s inaugural U.S. debt issuance, on September 17, 2010, the Company raised US$1,100 million of senior notes consisting of US$600 million aggregate principal amount of 3.40% senior notes due 2015 and US$500 million aggregate principal amount of 4.90% senior notes due 2020.
Funding from both the $900 million medium notes and the U.S. $1,100 million senior notes issuance was down-streamed into MLI as capital.
Throughout 2010, MFC issued approximately 19 million common shares for a total consideration of $314 million under the DRIP.
Regulatory Capital Position
The Company monitors and manages consolidated capital for MFC in compliance with the OSFI Guideline A2 – Capital Regime for Regulated Insurance Holding Companies and Non-Operating Life Companies, issued July 5, 2005. Under this regime our consolidated available capital is measured against a required amount of risk capital determined in accordance with the guideline. The capital position of the consolidated MFC holding company remains in excess of our internal targets.
With the completion of the reorganization of our U.S. life insurance subsidiaries at December 31, 2009, all U.S. operating entities are now held under MLI. MFC’s primary operating activities are now all conducted within MLI or its subsidiaries, other than some reinsurance business undertaken outside the MLI consolidated framework.
MLI is regulated by OSFI and is subject to consolidated risk based capital requirements using the OSFI MCCSR framework. MLI’s MCCSR ratio as at December 31, 2010 was 249 per cent (2009 – 240 per cent as reported), well in excess of OSFI’s supervisory target of 150 per cent.
During the year, the Company took action to strengthen the regulatory capital position of MLI through MFC’s increased capital investment using externally raised funds. The nine point increase in the MLI ratio over the year is primarily the result of $2 billion of capital injected by the parent. This more than offsets MLI’s funding of shareholder dividends and other MFC funding needs as well as growth in required capital. The write-off of goodwill in the third quarter of 2010 had no impact on the overall capital position as goodwill is deducted from available capital calculations; the write-off, while reducing retained earnings, also reduces the amount of the deduction. Required capital on liabilities increased over the year, reflecting higher liability exposures resulting from both lower interest rates and the effects of basis changes. Required capital on assets modestly increased, while capital requirements related to segregated fund guarantee capital decreased as the beneficial impacts of equity markets more than offset the impact of basis changes.
In addition to strengthening MLI’s capital position the Company also took action over the year to reduce the capital ratio sensitivities to equity markets and interest rates through equity hedging activities and extending the duration of bond portfolios, respectively.
OSFI has been considering a number of changes, including establishing methodologies for evaluating standalone capital adequacy for Canadian operating life insurance companies, such as MLI and updates to its regulatory guidance for non operating insurance companies acting as holding companies, such as MFC. In addition, OSFI is working on revisions to the capital requirements for in-force segregated fund guarantees, market, credit and insurance risk. Changes in regulatory capital guidelines for banks under the Basel accord or for European insurance companies under Solvency II may also have implications for Canadian insurance companies. The timing and outcome of these initiatives is uncertain and could have a significantly adverse impact on the Company or on our position relative to that of other Canadian and international financial institutions with which we compete for business and capital.
MLI’s non-consolidated operations and subsidiaries all maintained capital levels in excess of local requirements as at December 31, 2010, with their capital ratios exceeding or within their internal target ranges.In particular Manulife Canada Ltd., an OSFI regulated Canadian operating insurance company, had an MCCSR ratio of 242 per cent, above the regulator’s supervisory target of 150 per cent.
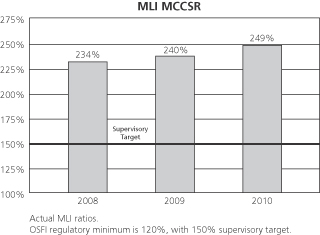
Credit Ratings
Manulife Financial’s insurance operating companies have strong ratings from the credit rating agencies for financial strength and claims paying ability. Maintaining strong ratings on the debt and preferred shares issued by MFC and its subsidiaries allows us to access the capital markets at competitive pricing levels. Should these credit ratings decrease materially, our cost of funds may increase and our access to funding and capital through the capital markets could be reduced.
Manulife Financial, like many of its industry peers, has experienced rating downgrades during the global economic turmoil. In the past year, Standard and Poor’s (“S&P”) lowered the financial strength ratings of our insurance operating companies from AA+ to AA-, lowered our counterparty credit rating from AA- to A-, and assigned a stable outlook; Moody’s lowered the insurance financial strength ratings of our insurance operating companies from Aa3 to A1 and assigned a stable outlook; Fitch lowered the insurer financial strength ratings of our insurance operating companies from AA to AA- and assigned a stable outlook; A.M. Best affirmed the financial strength ratings of our insurance operating companies at A+, lowered our issuer credit rating from “a” to “a-” and assigned a negative outlook; and DBRS confirmed our Claims Paying Ability rating at IC-1 with a stable trend and downgraded MFC’s Non-Cumulative Preferred Shares and Medium Term Notes ratings by one notch to Pfd-2 (high) and A (high) respectively, with a stable trend.
The following table summarizes the financial strength and claims paying ability ratings of MLI and certain of its subsidiaries as at March 15, 2011.
Financial Strength/Claims Paying Ability Ratings
| | | | | | | | | | | | |
| | | S&P | | Moody’s | | DBRS | | Fitch | | A.M. Best | | |
The Manufacturers Life Insurance Company | | AA- | | A1 | | IC-1 | | AA- | | A+ | | |
John Hancock Life Insurance Company (U.S.A.) | | AA- | | A1 | | Not Rated | | AA- | | A+ | | |
Manulife (International) Limited | | AA- | | Not Rated | | Not Rated | | Not Rated | | Not Rated | | |
Manulife Life Insurance Company (Japan) | | AA- | | Not Rated | | Not Rated | | Not Rated | | Not Rated | | |
Critical Accounting and Actuarial Policies
The preparation of financial statements in accordance with Canadian GAAP requires management to make estimates and assumptions that affect the reported amounts and disclosures made in the consolidated financial statements and accompanying notes. These estimates and assumptions are based on historical experience, management’s assessment of current events and conditions and activities that the Company may undertake in the future as well as possible future economic events. Actual results could differ from these estimates. The estimates and assumptions described in this section depend upon subjective or complex judgments about matters that may be uncertain and changes in these estimates and assumptions could materially impact the consolidated financial statements.
Our significant accounting policies are described in note 1 to the consolidated financial statements. Significant estimation processes relate to the determination of policy liabilities, evaluation of invested asset impairment, assessment of variable interest entities, determination of pension and other post-employment benefit obligations and expenses, income taxes and valuation of goodwill and intangible assets as described below. In addition, in the determination of the fair values of financial instruments, where observable market data is not available, management applies judgment in the selection of valuation models.
Policy Liabilities
Policy liabilities for Canadian GAAP are valued under standards established by the Canadian Institute of Actuaries. These standards are designed to ensure we establish an appropriate liability on the balance sheet to cover future obligations to all our policyholders. Under Canadian GAAP, the assumptions underlying the valuation of policy liabilities are required to be reviewed and updated on an ongoing basis to reflect recent and emerging trends in experience and changes in risk profile of the business. In conjunction with prudent business practices to manage both product and asset related risks, the selection and monitoring of appropriate valuation assumptions are designed to minimize our exposure to measurement uncertainty related to policy liabilities.
Determination of Policy Liabilities
Policy liabilities have two major components: a best estimate amount and a provision for adverse deviation. The best estimate amount represents the estimated value of future policyholder benefits and settlement obligations to be paid over the term remaining on in-force policies, including the costs of servicing the policies. The best estimate amount is reduced by the future expected policy revenues and future expected investment income on assets supporting the policies, adjusted for the impact of any reinsurance ceded associated with the policies. Reinsurance is used to transfer part or all of a policy liability to another insurance company at terms negotiated with that insurance company. To determine the best estimate amount, assumptions must be made for a number of key factors, including future mortality and morbidity rates, investment returns, rates of policy termination, operating expenses, certain taxes (other than income taxes) and foreign currency.
To recognize the uncertainty involved in determining the best estimate actuarial liability assumptions, a provision for adverse deviation (“PfAD”) is established. The PfAD is determined by including a margin of conservatism for each assumption to allow for possible deterioration in experience and to provide greater comfort that the policy liabilities will be adequate to pay future benefits. The Canadian Institute of Actuaries establishes suggested ranges for the level of margins for adverse deviation based on the risk profile of the business. We use assumptions at the prudent end of the suggested ranges, taking into account the risk profile of our business. The effect of these margins is to increase policy liabilities over the best estimate assumptions. The margins for adverse deviation decrease the income that is recognized when a new policy is sold and increase the income recognized in later periods, with the margins releasing as the policy risks reduce.
Best Estimate Assumptions
We follow established processes to determine the assumptions used in the valuation of our policy liabilities. The nature of each risk factor and the process for setting the assumptions used in the valuation are discussed below.
Mortality
Mortality relates to the occurrence of death. Mortality assumptions are based on our internal as well as industry past and emerging experience and are differentiated by sex, underwriting class, policy type and geographic market. To offset some of this risk, we reinsure mortality risk on in-force life insurance policies to other insurers and the impact of the reinsurance is directly reflected in our policy valuation. Actual mortality experience is monitored against these assumptions separately for each business. Where mortality rates are lower than assumed for life insurance the result is favourable, and where mortality rates are higher than assumed for payout annuities, mortality results are favourable. Overall 2010 experience was favourable when compared with our assumptions. Consistent with this experience, changes to future expected mortality assumptions in the policy liabilities in 2010 resulted in a reduction in policy liabilities.
Morbidity
Morbidity relates to the occurrence of accidents and sickness for the insured risks. Morbidity assumptions are based on our internal as well as industry past and emerging experience and are established for each type of morbidity risk and geographic market. Actual morbidity experience is monitored against these assumptions separately for each business. Our most significant morbidity risk relates to future expected claims costs for long-term care insurance. Overall 2010 experience was unfavourable when compared with our assumptions. Consistent with this experience, changes in future expected long-term care claims cost assumptions in the policy liabilities in 2010 resulted in an increase in policy liabilities. A comprehensive morbidity experience review was completed in 2010, including assumptions related to in-force price increases.
Policy Termination and Premium Persistency
Policy termination includes lapses and surrenders, where lapses represent the termination of policies due to non-payment of premiums and surrenders represent the voluntary termination of policies by policyholders. Premium persistency represents the level of ongoing deposits on contracts where there is policyholder discretion as to the amount and timing of deposits. Policy termination and premium persistency assumptions are primarily based on our recent experience adjusted for expected future conditions. Assumptions reflect differences by type of contract within each geographic market and actual experience is monitored against these assumptions separately for each business. Overall 2010 experience was unfavourable when compared to our assumptions. A number of revisions were made to future expected policyholder behaviour assumptions in 2010 to reflect the emerging experience resulting in significant increases in policy liabilities in 2010.
Expenses and Taxes
Operating expense assumptions reflect the projected costs of maintaining and servicing in-force policies, including associated overhead expenses. The expenses are derived from internal cost studies and are projected into the future with an allowance for inflation. For some developing businesses, there is an expectation that unit costs will decline as these businesses mature. Actual expenses are monitored against assumptions separately for each business. Overall maintenance expenses for 2010 were favourable when compared with our assumptions. Taxes reflect assumptions for future premium taxes and other non-income related taxes. For income taxes, policy liabilities are adjusted only for temporary tax timing and permanent tax rate differences on the cash flows available to satisfy policy obligations.
Investment Returns
We segment assets to support liabilities by business segment and geographic market and establish investment strategies for each liability segment. The projected cash flows from these assets are combined with projected cash flows from future asset purchases/sales to determine expected rates of return for future years. The investment strategies for future asset purchases and sales are based on our target investment policies for each segment and the re-investment returns are derived from current and projected market rates for fixed interest investments and our projected outlook for non-fixed interest assets. Credit losses are projected based on our own and industry experience, as well as specific reviews of the current investment portfolio. Investment return assumptions for each asset class also incorporate expected investment management expenses that are derived from internal cost studies. In 2010, actual investment returns were unfavourable when compared to our assumptions. For assets backing liabilities, unfavourable results from interest rate movements and some non-fixed income asset classes including oil and gas offset the favourable impact of credit related items on bonds and mortgages and most other non-fixed income asset classes including real estate and public and private equities. Actual investment experience for segregated fund business from changes in market value of funds under management was unfavourable.
Foreign Currency
Foreign currency risk results from a mismatch of the currency of the policy liabilities and the currency of the assets designated to support these obligations. We generally match the currency of our assets with the currency of the liabilities they support, with the objective of mitigating the risk of loss arising from movements in currency exchange rates. Where a currency mismatch exists, the assumed rate of return on the assets supporting the liabilities is reduced to reflect the potential for adverse movements in exchange rates.
Experience Adjusted Products
Where policies have features that allow the impact of changes in experience to be passed on to policyholders through policy dividends, experience rating refunds, credited rates or other adjustable features, the projected policyholder benefits are adjusted to reflect the projected experience. Minimum contractual guarantees and other market considerations are taken into account in determining the policy adjustments.
Provision for Adverse Deviation
The aggregate provision for adverse deviation is the sum of the provisions for adverse deviation for each risk factor. Margins for adverse deviation are established by product type and geographic market for each assumption or factor used in the determination of the best estimate actuarial liability. The margins are established based on the risk characteristics of the business being valued.
In addition to the explicit margin for adverse deviation, the valuation basis for segregated fund liabilities explicitly limits the future revenue recognition in the valuation basis to the amount necessary to offset acquisition expenses, after allowing for the cost of any guarantee features. The fees that are in excess of this limitation are reported as an additional margin and are shown in segregated fund non-capitalized margins.
The provision for adverse deviation and the future revenue deferred in the valuation due to the limitations on recognition of future revenue in the valuation of segregated fund liabilities are shown in the table below.
| | | | | | | | | | | | |
| As at December 31, | | | | | | |
| (C$ millions) | | 2010 | | | 2009 | | | | |
Best estimate actuarial liability(1) | | $ | 109,907 | | | $ | 103,844 | | | | | |
Provision for adverse deviation | | | | | | | | | | | | |
Insurance risks (mortality/morbidity) | | $ | 8,444 | | | $ | 7,663 | | | | | |
Policyholder behavior (lapse/surrender/premium persistency) | | | 3,089 | | | | 2,975 | | | | | |
Expenses | | | 1,589 | | | | 1,243 | | | | | |
Investment risks (non-credit) | | | 16,576 | | | | 15,601 | | | | | |
Investment risks (credit) | | | 1,264 | | | | 1,534 | | | | | |
Segregated fund guarantees | | | 3,012 | | | | 1,405 | | | | | |
Other | | | 29 | | | | 40 | | | | | |
Total provision for adverse deviation (PfAD)(1) | | $ | 34,003 | | | $ | 30,461 | | | | | |
Segregated funds – additional margins | | | 11,032 | | | | 11,627 | | | | | |
Total of PfAD and additional segregated fund margins | | $ | 45,035 | | | $ | 42,088 | | | | | |
| (1) | Reported actuarial liabilities as at December 31, 2010 of $143,910 (2009 – $134,305) are composed of $109,907 (2009 – $103,844) of best estimate actuarial liability and $34,003 (2009 – $30,461) of PfAD. |
The change in PfAD from period to period is impacted by changes in liability and asset composition, by movements in currency and movements in interest rates and by material changes in valuation assumptions. The increase in PfAD for insurance risks was driven by higher claims costs for LTC business as a result of valuation basis changes. The net increase in the investment risk PfAD was as a result of the Q3 2010 valuation basis changes and the lower interest rate environment, offset partially by the lengthening of the duration of the fixed income portfolios beginning in Q3 2010 and continuing in Q4.
Sensitivity of Earnings to Changes in Assumptions
When the assumptions underlying our determination of policy liabilities are updated to reflect recent and emerging experience or change in outlook, the result is a change in the value of policy liabilities which in turn affects income. The sensitivity of after-tax income to changes in non-economic and certain asset related assumptions underlying policy liabilities is shown below, and assumes that there is a simultaneous change in the assumption across all business units.
For changes in asset related assumptions, the sensitivity is shown net of the corresponding impact on income of the change in the value of the assets supporting liabilities. In practice, experience for each assumption will frequently vary by geographic market and business and assumption updates are made on a business/geographic specific basis. Actual results can differ materially from these estimates for a variety of reasons including the interaction among these factors when more than one assumption changes, changes in actuarial and investment return and future investment activity assumptions, actual experience differing from the assumptions, changes in business mix, effective tax rates and other market factors, and the general limitations of our internal models.
Most participating business is excluded from this analysis because of the ability to pass both favourable and adverse experience to the policyholders through the participating dividend adjustment.
Sensitivity of Earnings to Changes in Non-economic Assumptions
| | | | | | | | | | | | |
For the years ended December 31, (C$ millions) | | Decrease in After-Tax Income | | | | |
| | 2010 | | | 2009 | | | | |
Policy Related Assumptions | | | | | | | | | | | | |
2% adverse change in future mortality rates(1) | | | | | | | | | | | | |
Products where an increase in rates increases policy liabilities | | $ | (300 | ) | | $ | (200 | ) | | | | |
Products where a decrease in rates increases policy liabilities | | | (300 | ) | | | (300 | ) | | | | |
5% increase in future morbidity rates(2),(3) | | | (1,100 | ) | | | (1,100 | ) | | | | |
10% adverse change in future termination rates | | | (1,000 | ) | | | (1,000 | ) | | | | |
5% increase in future expense levels | | | (300 | ) | | | (300 | ) | | | | |
| (1) | An increase in mortality rates will generally increase policy liabilities for life insurance contracts whereas a decrease in mortality rates will generally increase policy liabilities for policies with longevity risk such as payout annuities. |
| (2) | No amounts related to morbidity risk are included for policies where the policy liability provides only for claims costs expected over a short period, generally less than one year, such as Group Life and Health. |
| (3) | The impacts of the sensitivities on LTC for morbidity, mortality and lapse are assumed to be moderated by partial offsets from the Company’s ability to contractually raise premium rates in such events, subject to state regulatory approval. |
Sensitivity of Earnings to Changes in Asset Related Assumptions
| | | | | | | | | | | | | | | | | | | | |
As at December 31,
(C$ millions) | | Increase (Decrease) in After-Tax Income | | | | |
| | 2010 | | | 2009 | | | | |
| | Increase | | | Decrease | | | Increase | | | Decrease | | | | |
Asset Related Assumptions Updated Periodically in Valuation Basis Changes | | | | | | | | | | | | | | | | | | | | |
100 basis point change in ultimate fixed income re-investment rates(1) | | $ | 1,500 | | | $ | (1,900 | ) | | $ | 1,200 | | | $ | (1,700 | ) | | | | |
100 basis point change in future annual returns for public equities(2) | | | 900 | | | | (900 | ) | | | 1,000 | | | | (1,000 | ) | | | | |
100 basis point change in future annual returns for other non-fixed income assets(3) | | | 3,100 | | | | (2,900 | ) | | | 2,200 | | | | (2,300 | ) | | | | |
100 basis point change in equity volatility assumption for stochastic segregated fund modeling(4) | | | (300 | ) | | | 300 | | | | (300 | ) | | | 400 | | | | | |
| (1) | Current URRs in Canada are 1.9% per annum and 3.8% per annum for short and long-term bonds, respectively, and in the U.S. are 1.6% per annum and 4.0% per annum for short and long-term bonds, respectively. Since the URRs are based upon a five and ten year rolling average of government bond rates continuation of current rates or a further decline could have a material impact on income. However, for this sensitivity, we assume the URRs decline with full and immediate effect. |
| (2) | Expected long-term annual market growth assumptions for public equities pre-dividends for key markets are based on long-term historical observed experience and are 7.25% per annum in Canada, 8.0% per annum in the U.S., 5.0% per annum in Japan and 9.5% per annum in Hong Kong. These returns are then reduced by margins for adverse deviation to determine net yields used in the valuation. The amount includes the impact on both segregated fund guarantee reserves and on other policy liabilities. For a 100 basis point increase in expected growth rates, the impact from segregated fund guarantee reserves is $700 (December 31, 2009 – $800). For a 100 basis point decrease in expected growth rates, the impact from segregated fund guarantee reserves is $(800) (December 31, 2009 – $(900)). |
| (3) | Other non-fixed income assets include commercial real estate, timber and agricultural real estate, oil and gas, and private equities. The assumed returns on other non-fixed income assets net of provisions for adverse deviation and after taking into account the impact of differential taxation, have a similar impact on policyholder liabilities as the assumptions for public equities. The increased sensitivity from December 31, 2009 to December 31, 2010 is primarily related to the second order impact of the net decline in interest rates as well as the higher future non-fixed income demand in the Long-Term Care business anticipated from future increases in policyholder premiums. |
| (4) | Volatility assumptions for public equities are based on long-term historic observed experience and are 18.05% per annum in Canada and 16.55% per annum in the U.S. for large cap public equities, and 18.35% per annum in Japan and 34.1% per annum in Hong Kong. |
The increase in the sensitivity to changes in market interest rates is primarily due to the impact of the current lower market interest rates on liabilities with minimum interest guarantees and the impact of changes in lapse assumptions. Under Canadian GAAP, we must test a number of prescribed interest scenarios. The interest scenario we have adopted uses the structure of the prescribed scenario that currently produces the highest policy liability, which is a gradual grading of market interest rates from current market levels to assumed ultimate re-investment rates over 20 years, with additional prudence introduced through use of lower ultimate re-investment rates than the maximum prescribed levels. The decrease in sensitivity to public equity market returns is mostly due to the reduction in public equities supporting general fund policy liabilities. Sensitivity to other non-fixed income assets has increased from 2009 due to the projected additional acquisitions of non-fixed income assets modeled in the valuation resulting from the net decline in interest rates and valuation basis changes in 2010, most notably higher anticipated demand in the Long-Term Care segment from the anticipated policy premium increases.
Review of Actuarial Methods and Assumptions
The 2010 full year review of the actuarial methods and assumptions underlying policy liabilities produced a net increase in the policy liabilities of $2,871 million. Net of the impacts on participating surplus and minority interests, this resulted in a decrease in net income attributable to shareholders of $2,072 million post-tax.
The comprehensive 2010 review of valuation methods and assumptions was completed in the third quarter of 2010. In conjunction with prudent business practices to manage both product and asset related risks, the selection and monitoring of appropriate valuation assumptions are designed to minimize our exposure to measurement uncertainty related to policy liabilities. While the assumptions selected represent the Company’s current best estimates and assessment of risk, the ongoing monitoring of emerging actuarial and investment experience and the economic environment as well as a potential change to the actuarial standards in 2011 to include future mortality improvements in the valuation of policy liabilities, are likely to result in future changes to the valuation assumptions, which could be material.
The following table summarizes the full year pre-tax policy liability impact of the basis changes by key category, as well as the corresponding impact on shareholders’ net income (post-tax).
| | | | | | | | | | | | |
(C$ millions) Assumption | | Policy
Liabilities | | | Net Income
Attributable to
Shareholders | | | | |
Mortality and morbidity | | | | | | | | | | | | |
Long-term care | | $ | 1,161 | | | $ | (755 | ) | | | | |
Other | | | (258 | ) | | | 182 | | | | | |
Lapses and policyholder behaviour | | | 650 | | | | (487 | ) | | | | |
Expenses | | | (153 | ) | | | 127 | | | | | |
Investment returns | | | | | | | | | | | | |
Variable annuity parameter update | | | 872 | | | | (665 | ) | | | | |
Ultimate reinvestment rates/grading for corporate spreads | | | 441 | | | | (309 | ) | | | | |
Other | | | 141 | | | | (219 | ) | | | | |
Other valuation model methodology and model refinements | | | 17 | | | | 54 | | | | | |
Net Impact | | $ | 2,871 | | | $ | (2,072 | ) | | | | |
NOTE: For all non-participating policies, excluding certain minor Asian lines of business, the policy liabilities are updated quarterly to reflect the impact of market interest rates and non-fixed income market values. The impact of the update is reflected directly in reported segmented earnings.
Long-term care mortality and morbidity changes
JH LTC completed a comprehensive long-term care claims experience study, including estimated favourable impacts of in-force rate increases. As a result:
| n | | Expected claims costs increase primarily due to increased ultimate incidence at higher attained ages, anti-selection at older issue ages and improved mortality, partially offset by better experience on business sold in the last seven years due to evolving underwriting tools. These collectively resulted in an increase in Active Life Reserves of $3.2 billion. |
| n | | Disabled Life Reserves were also strengthened by $0.3 billion to reflect emerging continuance and salvage experience for Retail and Fortis blocks. |
| n | | Claims margins were harmonized for the pre and post rate stabilization blocks. The reduction in margins resulted in a reserve release of $0.2 billion. |
| n | | Expected future premium increases reduced reserves by $2.2 billion resulting in a total of $3.0 billion of future premium increases assumed in the reserves. Premium increases averaging approximately 40 per cent have been sought on 80 per cent of the in-force business. We have factored into our assumptions our best estimate of the timing and amount of state approved premium increases. Our actual experience obtaining price increases could be materially different than we have assumed, resulting in further policy liability increases or reserve releases which could be material. |
Other mortality and morbidity changes
Policy liabilities were reduced primarily due to improved mortality in Canadian individual insurance.
Lapse and policyholder behavior assumptions
Policy liabilities were increased by:
| n | | $338 million to better reflect emerging recent lower lapse experience on U.S. and Canadian variable annuity business contracts that are in-the-money, |
| n | | $265 million for emerging experience on renewal term business in Canadian individual insurance, and |
| n | | $47 million attributed to emerging termination experience for protection businesses in Asia. |
Expenses
Policy liabilities were reduced by $153 million to reflect lower investment related expenses across most business units, partially offset by a net increase in projected business maintenance expenses across several U.S. business lines.
Variable annuity parameter updates
The annual update to stochastic parameters used to calculate variable annuity policy liabilities resulted in a $461 million reserve strengthening in the U.S., $247 million in Japan and $164 million in Canada. Of this total strengthening, $416 million was related to updates to equity volatility parameters and $456 million was related to updates to mean bond returns.
Stochastic parameters are reviewed annually as part of our method and assumption review. Equity volatility parameters were updated to reflect experience observed in 2009. The resulting volatility parameters were increased from 15.55% to 16.55% in the U.S. and from 16.55% to 18.05% in Canada.
Bond mean returns were also adjusted to reflect the recent market yield environment. Assumed bond mean returns were decreased by 50 basis points in the U.S. and 80 basis points in Canada, while in Japan the bond mean returns increased by 25 basis points.
Other investment returns
Changes to the URRs and assumptions for expected future fixed income spreads contributed to an increase in policy liabilities of $441 million. Policy liabilities were increased by $141 million due to enhancements of asset modeling across several business units.
Other valuation model methodology and model refinements
A number of business specific modeling refinements were made to improve the projection of the future cash flows on in-force business, netting to a reserve increase of approximately $17 million. The two main items consisted of the modeling of tax cash flows, which netted to a reserve release of approximately $195 million, offset by several refinements to modeling of liability cash flows.
The 2009 review of the actuarial methods and assumptions underlying policy liabilities produced a net increase in the policy liabilities of $1,878 million. Net of the impacts on participating surplus, minority interests, and restatement of prior period retained earnings, this resulted in a decrease in 2009 shareholders’ pre-tax income of $1,624 million.
Change in Policy Liabilities
The change in policy liabilities can be attributed to several sources: new business, acquisitions, in-force movement and currency impact. Changes in policy liabilities are substantially offset in the financial statements by premiums, investment income, policy benefits and other policy related cash flows. The changes in policy liabilities by business segment are shown below:
2010 Policy Liability Movement Analysis
| | | | | | | | | | | | | | | | | | | | | | | | | | | | | | | | |
| (C$ millions) | | Asia Division | | | Canadian
Division | | | U.S.
Insurance | | | U.S. Wealth
Management | | | Reinsurance
Division | | | Corporate
and Other | | | Total | | | | |
Balance, January 1, 2010 | | $ | 17,877 | | | $ | 38,876 | | | $ | 54,004 | | | $ | 29,384 | | | $ | 1,693 | | | $ | (147 | ) | | $ | 141,687 | | | | | |
New business | | | (91 | ) | | | 707 | | | | 1,327 | | | | 1,550 | | | | (4 | ) | | | – | | | | 3,489 | | | | | |
In-force movement | | | 3,772 | | | | 2,405 | | | | 3,822 | | | | (1,505 | ) | | | (106 | ) | | | (108 | ) | | | 8,280 | | | | | |
Changes in methods and assumptions | | | 214 | | | | 360 | | | | 1,727 | | | | 504 | | | | 67 | | | | (1 | ) | | | 2,871 | | | | | |
Currency impact | | | 228 | | | | (2 | ) | | | (2,984 | ) | | | (1,522 | ) | | | (112 | ) | | | 9 | | | | (4,383 | ) | | | | |
Total net changes | | $ | 4,123 | | | $ | 3,470 | | | $ | 3,892 | | | $ | (973 | ) | | $ | (155 | ) | | $ | (100 | ) | | $ | 10,257 | | | | | |
Balance, December 31, 2010 | | $ | 22,000 | | | $ | 42,346 | | | $ | 57,896 | | | $ | 28,411 | | | $ | 1,538 | | | $ | (247 | ) | | $ | 151,944 | | | | | |
For new business, the segments with large positive general account premium revenue at contract inception show increases in policy liabilities. For segments where new business deposits are primarily into segregated funds, the increase in policy liabilities related to new business is small since the increase measures only general account liabilities. New business policy liability impact is negative when estimated future premiums together with future investment income, is expected to be more than sufficient to pay estimated future benefits, policyholder dividends and refunds, taxes (excluding income taxes) and expenses on new policies issued.
The reduction in policy liabilities from currency reflects the appreciation of the Canadian dollar relative to the U.S. dollar. To the extent assets are currency matched to liabilities, the reduction in policy liabilities due to currency is offset by a corresponding reduction from currency in the value of assets supporting those liabilities.
The in-force movement over the year is an increase of $8,280 million. A significant part of the in-force movement increase was related to the decline in interest rates and the resulting impact on the fair value of assets which back those liabilities. The large reduction of $1,505 million for in-force movements on the U.S. Wealth Management block includes a reduction from net maturity benefits on institutional contracts, a product line that is intentionally being de-emphasized. The decrease in the Corporate and Other segment is related to the John Hancock Accident and Health operation that is closed to new business and running off.
The increase of $2,871 million from changes in methods and assumptions includes a comprehensive review of all valuation methods and assumptions and results in a decrease in pre-tax earnings.
Of the $11,769 million net increase in policy liabilities related to new business and in-force movement, $10,882 million is an increase in actuarial liabilities. The remaining is an increase of $887 million in other policy liabilities.
2009 Policy Liability Movement Analysis
| | | | | | | | | | | | | | | | | | | | | | | | | | | | | | | | |
| (C$ millions) | | Asia Division | | | Canadian
Division | | | U.S.
Insurance | | | U.S. Wealth
Management | | | Reinsurance
Division | | | Corporate
and Other | | | Total | | | | |
Balance, January 1, 2009 | | $ | 18,692 | | | $ | 35,171 | | | $ | 53,920 | | | $ | 36,655 | | | $ | 1,854 | | | $ | 52 | | | $ | 146,344 | | | | | |
New business | | | (232 | ) | | | 1,372 | | | | 801 | | | | 4,665 | | | | (19 | ) | | | – | | | | 6,587 | | | | | |
In-force movement | | | 1,509 | | | | 2,235 | | | | 7,476 | | | | (7,161 | ) | | | (58 | ) | | | (239 | ) | | | 3,762 | | | | | |
Changes in methods and assumptions | | | 737 | | | | 102 | | | | 165 | | | | 456 | | | | 132 | | | | 15 | | | | 1,607 | | | | | |
Currency impact | | | (2,829 | ) | | | (4 | ) | | | (8,358 | ) | | | (5,231 | ) | | | (216 | ) | | | 25 | | | | (16,613 | ) | | | | |
Total net changes | | $ | (815 | ) | | $ | 3,705 | | | $ | 84 | | | $ | (7,271 | ) | | $ | (161 | ) | | $ | (199 | ) | | $ | (4,657 | ) | | | | |
Balance, December 31, 2009 | | $ | 17,877 | | | $ | 38,876 | | | $ | 54,004 | | | $ | 29,384 | | | $ | 1,693 | | | $ | (147 | ) | | $ | 141,687 | | | | | |
For new business, the segments with large positive general account premium revenue at contract inception show increases in policy liabilities. For segments where new business deposits are primarily into segregated funds, the increase in policy liabilities related to new business is small since the increase measures only general account liabilities.
The reduction in policy liabilities from currency reflects the appreciation of the Canadian dollar relative to the U.S. dollar and Japanese Yen. As assets are currency matched to liabilities, the reduction in policy liabilities due to currency is offset by a corresponding reduction from currency in the value of assets supporting those liabilities.
The large reduction of $7,161 million for in-force movements on the U.S. Wealth Management block includes $2,438 million of net maturity benefits on institutional contracts, a product line that is intentionally being de-emphasized, as well as a material reduction in reserves for segregated fund guarantee products from improved equity markets. A significant part of the in-force movement increase was related to the decline in interest rates and the resulting impact on the fair value of assets which back those liabilities. The decrease in the Corporate and Other segment is related to the transfer of certain reserves held in this segment at prior year end back to the operating units.
The increase of $1,607 million from changes in methods and assumptions is net of $271 million which was reflected as an adjustment to the 2008 opening policy liabilities at then current foreign exchange rates. This change in methods and assumptions results in a decrease in pre-tax earnings.
Of the $10,349 million net increase in policy liabilities related to new business and in-force movement, $9,944 million is an increase in actuarial liabilities. The remaining is an increase of $405 million in other policy liabilities.
Fair Value of Invested Assets
A large portion of the Company’s invested assets are recorded at fair value. Refer to note 1 of the 2010 consolidated financial statements for a description of the methods used in determining fair value for applicable invested assets. When quoted prices in active markets are not available for a particular investment, significant judgment is required to determine an estimated fair value based on market standard valuation methodologies. The market standard valuation methodologies utilized by the Company include discounted cash flow methodologies, matrix pricing or other similar techniques. The inputs to these market standard valuation methodologies include, but are not limited to: current interest rates or yields for similar instruments, credit rating of the issuer or counterparty, industry sector of the issuer, coupon rate, call provisions, sinking fund requirements, tenor (or expected tenor) of the instrument, management’s assumptions regarding liquidity and estimated future cash flows. Accordingly, the estimated fair values are based on available market information and management’s judgments about the key market factors impacting these financial instruments. Financial markets are susceptible to severe events evidenced by rapid depreciation in asset values accompanied by a reduction in asset liquidity. The Company’s ability to sell securities, or the price ultimately realized for these securities, depends upon the demand and liquidity in the market and increases the use of judgment in determining the estimated fair value of certain securities.
Evaluation of Invested Asset Impairment
AFS equity and fixed income securities are carried at fair market value, with changes in fair value recorded in Other Comprehensive Income (“OCI”). AFS securities are considered impaired when fair value falls below their original cost. Impaired securities are reviewed on a regular basis and any fair value decrement is transferred out of AOCI and recorded in income at such time as the impairment is determined to be other than temporary.
Provisions for impairments of mortgage loans and private placement loans are recorded with losses reported in earnings when there is no longer reasonable assurance as to the timely collection of the full amount of the principal and interest.
Significant judgment is required in assessing whether an impairment is other than temporary and in assessing fair values and recoverable values. Key matters considered include economic factors, company and industry specific developments and specific issues with respect to single issuers and borrowers. For fixed income securities, the Company’s ability and intent to hold a security may also be considered in the impairment assessment.
Changes in circumstances may cause future assessments of asset impairment to be materially different from current assessments, which could require additional provisions for impairment. Additional information on the process and methodology for determining the allowance for credit losses is included in the discussion of credit risk in note 7 to the consolidated financial statements.
Derivative Financial Instruments
The Company uses derivative financial instruments (“derivatives”) to manage exposures to foreign currency, interest rate, equity and other market risks arising from on-balance sheet financial instruments, selected anticipated transactions and certain guarantee related actuarial liabilities. Refer to note 5 of the 2010 consolidated financial statements for a description of the methods used to determine the fair value of derivatives.
The accounting for derivatives is complex and interpretations of the primary accounting guidance continue to evolve in practice. Judgment is applied in determining the availability and application of hedge accounting designations and the appropriate accounting treatment under such accounting guidance. If it was determined that hedge accounting designations were not appropriately applied, reported net income could be materially affected. Differences in judgment as to the availability and application of hedge accounting designations and the appropriate accounting treatment may result in a differing impact on the consolidated financial statements of the Company from that previously reported. Assessments of hedge effectiveness and measurements of ineffectiveness of hedging relationships are also subject to interpretations and estimations and different interpretations or estimates may have a material effect on the amount reported in net income.
Variable Interest Entities (“VIEs”)
When an entity is considered a VIE, the primary beneficiary is required to consolidate the assets, liabilities and results of operations of the VIE. The primary beneficiary is the entity that is exposed, through variable interests, to a majority of the VIE’s expected losses and/or is entitled to a majority of the VIE’s expected residual returns, as defined under GAAP. When the Company is the primary beneficiary of a VIE, it consolidates the VIE either into the general fund or the segregated funds based on which has the preponderance of the exposure to the VIE. As outlined in note 17 to the consolidated financial statements, certain VIEs have been consolidated into the general fund and certain VIEs have been consolidated on the segregated funds statements of net assets. The Company uses a variety of complex estimation processes involving both qualitative and quantitative factors to determine whether an entity is a VIE, and to analyze whether it is the primary beneficiary of any entities that are determined to be VIEs. These processes involve estimating the future cash flows and performance of the VIE, analyzing the variability in those cash flows, and allocating the losses and returns among the identified parties holding variable interests. For further details on the Company’s involvement with VIEs, see note 17 to the consolidated financial statements.
Employee Future Benefits
The Company has a number of plans providing pension (defined benefit and defined contribution) and other benefits to eligible employees and agents after employment. The traditional defined benefit pension plans provide benefits based on years of service and average earnings at retirement. Due to the long-term nature of these plans and of the post-employment benefit plans, the calculation of the benefit expense and accrued benefit obligations depends on various economic assumptions such as discount rates, expected rates of return on plan assets, health care cost trend rates and compensation increase rates. These assumptions are determined by management and are reviewed annually. Differences between actual and assumed experience may affect the amount of the accrued benefit obligation and benefit expense. The key weighted average assumptions used, as well as the sensitivity of estimated liabilities to these assumptions, are presented in note 16 to the consolidated financial statements.
Contributions to the defined benefit pension and funded post-employment plans is also subject to various projections and assumptions based on the demographic profile of the membership, expected rates of return on plan assets and compensation increase rates, as presented in note 16 to the consolidated financial statements.
The Company’s broad-based pension plans are funded in accordance with actuarially determined amounts required to satisfy any applicable pension regulations. During 2010, the Company contributed $48 million (2009 – $48 million) to the broad-based pension plans and as at December 31, 2010, the shortfall of fair value of plan assets over plan obligations amounted to $119 million (2009 – $170 million), as presented in note 16 to the consolidated financial statements. For 2011, the required funding for the Company’s largest Canadian and U.S. pension plans is expected to be in the range of $10 to $50 million.
The Company’s supplemental pension plans for executives are for the most part unfunded. As at December 31, 2010, the shortfall of fair value of plan assets over plan obligations amounted to $755 million (2009 – $712 million), as presented in note 16 to the consolidated financial statements.
The Company’s other post-employment benefit plans are also for the most part unfunded. As at December 31, 2010, the shortfall of fair value of plan assets over plan obligations amounted to $440 million (2009 – $480 million), as presented in note 16 to the consolidated financial statements.
The Company reviews the appropriateness of the plans’ investment policy and strategy on a regular basis. The current asset mix and level of investment risk of the Company’s pension plans reflects their long-term nature.
Income Taxes
The Company is subject to income tax laws in various jurisdictions. Tax laws are complex and potentially subject to different interpretations by the taxpayer and the relevant tax authority. The provision for income taxes represents management’s interpretation of the
relevant tax laws and its estimate of current and future income tax implications of the transactions and events during the period. A future income tax asset or liability is recognized whenever an amount is recorded for accounting purposes but not for tax purposes or vice versa. Future tax assets and liabilities are recorded based on expected future tax rates and management’s assumptions regarding the expected timing of the reversal of such temporary differences. The realization of deferred tax assets depends upon the existence of sufficient taxable income within the carryback or carryforward periods under the tax law in the applicable tax jurisdiction. Valuation allowances are established when management determines, based on available information, that it is more likely than not that deferred income tax assets will not be realized. Factors in management’s determination consider the performance of the business including the ability to generate capital gains. Significant judgment is required in determining whether valuation allowances should be established, as well as the amount of such allowances. When making such determinations, consideration is given to, among other things, the following:
(i) future taxable income exclusive of reversing temporary differences and carryforwards;
(ii) future reversals of existing taxable temporary differences;
(iii) taxable income in prior carryback years; and
(iv) tax planning strategies.
The Company may be required to change its provision for income taxes if the ultimate deductibility of certain items is successfully challenged by taxing authorities or if estimates used in determining valuation allowances on deferred tax assets significantly change, or when receipt of new information indicates the need for adjustment in valuation allowances. Additionally, future events, such as changes in tax laws, tax regulations, or interpretations of such laws or regulations, could have an impact on the provision for income tax, deferred tax balances and the effective tax rate. Any such changes could significantly affect the amounts reported in the consolidated financial statements in the year these changes occur.
The Company is an investor in a number of leasing transactions and has established provisions for possible disallowance of the tax treatment and for interest on past due taxes. During the year ended December 31, 2010, the Company recorded additional charges of $99 million after tax related to these provisions. The Company continues to believe that deductions originally claimed in relation to these arrangements are appropriate. Should the tax attributes of all our lease transactions be fully denied, the maximum after-tax exposure including interest is estimated to be an additional US$220 million as at December 31, 2010.
Goodwill and Intangible Assets
Goodwill and intangible assets with indefinite lives are tested at least annually for impairment. Under Canadian GAAP, goodwill is tested at the reporting unit level. As a result of the continuing impact of the deterioration in the overall U.S. economic environment, including persistent low interest rates, and management decisions in the third quarter to further reposition our U.S. business and the resultant reduction or elimination of products that give rise to significant earnings sensitivity or produce low returns on capital employed, our goodwill impairment testing in 2010 resulted in an impairment of the goodwill in our U.S. Insurance reporting unit in the amount of US$1,000 million of the total goodwill of US$2,318 million for the reporting unit. The impairment charge, which has been recorded in our Corporate and Other segment, is a non-cash item and does not affect our ongoing operations or our regulatory capital ratios. The tests performed in 2010 demonstrated that there was no impairment of intangible assets with indefinite lives.
Under IFRS, goodwill is tested at the cash generating unit level, a more granular level than a reporting unit. When IFRS is adopted, we expect to record an impairment charge of approximately $2.1 billion in excess of the impairment charge recorded under Canadian GAAP, and attributable to our U.S. Life, U.S. Wealth and Canadian Individual Insurance operations. This charge will be split between our IFRS Opening Balance Sheet (through retained earnings) at January 1, 2010 of $734 million and the third quarter 2010 comparative IFRS results of $2,330 million based on the facts and circumstances that existed at the respective times. Going forward, the impact of economic conditions and changes in product mix suggests a lower margin of recoverable value relative to carrying value attributable to our U.S Life, U.S. Long-Term Care and Canadian Individual Insurance cash generating units. As a result of these factors and the more granular level of goodwill testing under IFRS, more frequent impairment charges could occur in the future. The goodwill testing for 2011 will be updated based on the conditions that exist in 2011 and may result in further impairment charges, which could be material.
Changes in Accounting Policies
Future Accounting and Reporting Changes
Transition to International Financial Reporting Standards (“IFRS”)
Most publicly accountable enterprises in Canada are required to adopt IFRS for periods beginning on or after January 1, 2011. The Company will adopt IFRS as a replacement of current Canadian GAAP for fiscal periods beginning the first quarter of 2011, with corresponding comparative financial information provided for 2010.
Refer to note 2 of the consolidated financial statements for a summary of our significant IFRS accounting policy choices selected, our first time adoption elections under IFRS 1 – “First Time Adoption of IFRS”, and a description of the adjustments to our opening IFRS Balance Sheet as at January 1, 2010, the date of transition to IFRS, which forms the starting point for financial reporting in accordance with IFRS.
Based on our analysis of the identified differences between Canadian accounting requirements and existing IFRS, with the exception of the items discussed in note 2 of the consolidated financial statements, we do not expect a significant impact on our financial statements upon adoption. Further, we do not expect that the initial adoption of IFRS will have a significant impact on our disclosure controls and procedures, information technology systems or our business activities.
A new international financial reporting standard that addresses the measurement of insurance contracts is currently being developed and is not expected to be effective until at least 2013. Until this standard is completed and becomes effective, the current Canadian GAAP requirements for the valuation of insurance liabilities (“CALM”) will be maintained. Under CALM, the measurement of insurance liabilities is based on projected liability cash flows, together with estimated future premiums and net investment income generated from assets held to support those liabilities. Consistent with the results of the adoption of CICA Handbook Section 3855, when IFRS is initially adopted, any change in the carrying value of the invested assets that support insurance liabilities will be offset by a corresponding change in insurance liabilities and therefore is not expected to have a material impact on net income.
The measurement under IFRS of products no longer considered insurance contracts, certain embedded derivative features contained in insurance products, additional ineffectiveness arising from hedge accounting relationships, more accelerated recognition of pension expense, potentially more frequent impairments of available-for-sale equity securities, and increased income from leverage lease investments are expected to result in additional earnings differences under IFRS, which in aggregate is not expected to be significant. Additionally, as a result of the more granular level of goodwill testing under IFRS, we expect that more frequent goodwill impairment charges could occur in the future.
Expected regulatory capital implications as a result of the adoption of IFRS
As part of the IFRS transition process, the Company is evaluating its effect on regulatory capital requirements. Under the IFRS transition guidance outlined by OSFI, the impact of IFRS adoption on available capital is phased-in over an eight quarter period beginning the first quarter of 2011. The impact on required capital is not subject to the phase-in rules. Our preliminary estimates indicate the adoption of IFRS may initially decrease MLI’s MCCSR by approximately four points beginning the first quarter of 2011 and approximately eight points over the two year phase-in period ending with the fourth quarter of 2012.
Update on IFRS transition progress
Our IFRS transition plan includes the education, review, approval and implementation of the accounting policy changes identified above. Additionally, the transition plan includes ensuring that project resourcing remains appropriate, modifying internal controls over financial reporting for the key identified changes above, frequent communication with our external auditors as well as the Audit Committee of the Board of Directors which includes a review of transition progress, discussion of potential transition and ongoing reporting changes, and an overview of developments in accounting and regulatory guidance related to IFRS. We do not expect the initial adoption of IFRS to have a significant impact on our disclosure controls and procedures, information technology systems or our business activities.
As we prepare for the transition to IFRS, we continue to monitor ongoing changes to IFRS and adjust our transition and implementation plans accordingly.
We have completed the preliminary opening IFRS balance sheet and are in the process of determining our quarterly IFRS comparative results for 2010 and note disclosures under IFRS. The most significant remaining milestones in our plan include finalization of the 2010 quarterly comparative IFRS results. Project status is reviewed by the oversight committee on a monthly basis. Our transition status is currently on track in accordance with our overall transition plan to have any remaining milestones completed by the first quarter of 2011. We are not aware, at the present time, of any matters that would prevent the Company from meeting its filing requirements for the first interim financial report under IFRS for the first quarter of 2011.
Differences between Canadian and U.S. GAAP
The consolidated financial statements of Manulife Financial are presented in accordance with Canadian GAAP. Canadian GAAP differs in certain significant respects from U.S. GAAP.
The primary differences between Canadian GAAP and U.S. GAAP include accounting for premiums and deposits, invested assets, investment income and segregated funds. There are also differences in the calculation and accounting for policy liabilities and differences in reporting policyholder cash flows. These differences are described in more detail in note 22 to the consolidated financial statements.
Differences between Canadian and Hong Kong Financial Reporting Standards
The consolidated financial statements of Manulife Financial are presented in accordance with Canadian GAAP. Canadian GAAP differs in certain respects from Hong Kong Financial Reporting Standards (“HKFRS”).
The primary difference between Canadian GAAP and HKFRS is the determination of policy liabilities. In certain interest rate environments, policy liabilities determined in accordance with HKFRS may be higher than those computed in accordance with current Canadian GAAP.
Canadian GAAP and Hong Kong Regulatory Requirements
Insurers in Hong Kong are required by the Office of the Commissioner of Insurance to meet minimum solvency requirements. As at December 31, 2010, the Company has sufficient assets to meet the minimum solvency requirements under both Hong Kong regulatory requirements and Canadian GAAP.
Controls and Procedures
Disclosure Controls and Procedures
Our disclosure controls and procedures are designed to provide reasonable assurance that information required to be disclosed by us is recorded, processed, summarized and reported accurately and completely and within the time periods specified under Canadian and U.S. securities laws. Our process includes controls and procedures that are designed to ensure that information is accumulated and communicated to management, including the CEO and CFO, to allow timely decisions regarding required disclosure.
As of December 31, 2010, management evaluated the effectiveness of its disclosure controls and procedures as defined under the rules adopted by the U.S. Securities and Exchange Commission and the Canadian securities regulatory authorities. This evaluation was performed under the supervision of the Audit Committee, the CEO and CFO.
Based on that evaluation, the CEO and CFO concluded that our disclosure controls and procedures were effective as at December 31, 2010.
Management’s Report on Internal Control over Financial Reporting
Management is responsible for establishing and maintaining adequate internal control over financial reporting. The Company’s internal control system was designed to provide reasonable assurance to management and the Board of Directors regarding the preparation and fair presentation of published financial statements in accordance with generally accepted accounting principles. All internal control systems, no matter how well designed, have inherent limitations due to manual controls. Therefore, even those systems determined to be effective can provide only reasonable assurance with respect to financial statement preparation and presentation.
Management maintains a comprehensive system of controls intended to ensure that transactions are executed in accordance with management’s authorization, assets are safeguarded, and financial records are reliable. Management also takes steps to ensure that information and communication flows are effective and to monitor performance, including performance of internal control procedures.
Management assessed the effectiveness of the Company’s internal control over financial reporting as of December 31, 2010 based on the criteria set forth by the Committee of Sponsoring Organizations of the Treadway Commission (COSO) in Internal Control – Integrated Framework. Based on this assessment, management believes that, as of December 31, 2010, the Company’s internal control over financial reporting is effective.
The effectiveness of the Company’s internal control over financial reporting as of December 31, 2010 has been audited by Ernst & Young LLP, the Company’s independent registered public accounting firm that also audited the consolidated financial statements of the Company for the year ended December 31, 2010. Their report expressed an unqualified opinion on the effectiveness of the Company’s internal control over financial reporting as of December 31, 2010.
Changes in Internal Control over Financial Reporting
No changes were made in our internal control over financial reporting during the year ended December 31, 2010 that have materially affected, or are reasonably likely to materially affect, our internal control over financial reporting.
Additional Disclosures
Contractual Obligations
In the normal course of business, the Company enters into contracts that give rise to obligations fixed by agreement as to the timing and dollar amount of payment.
As at December 31, 2010, the Company’s contractual obligations and commitments are as follows:
| | | | | | | | | | | | | | | | | | | | | | | | |
Payments due by period (C$ millions) | | Total | | | Less than
1 year | | | 1 – 3
years | | | 3 – 5
years | | | After 5
years | | | | |
Long-term debt(1) | | $ | 6,947 | | | $ | 672 | | | $ | 843 | | | $ | 3,439 | | | $ | 1,993 | | | | | |
Liabilities for capital instruments(1),(2),(3) | | | 15,035 | | | | 763 | | | | 393 | | | | 392 | | | | 13,487 | | | | | |
Purchase obligations | | | 328 | | | | 150 | | | | 131 | | | | 34 | | | | 13 | | | | | |
Operating leases | | | 815 | | | | 110 | | | | 174 | | | | 93 | | | | 438 | | | | | |
General fund policyholder liabilities(4) | | | 485,575 | | | | 11,550 | | | | 11,258 | | | | 12,973 | | | | 449,794 | | | | | |
Bank deposits and consumer notes(1) | | | 17,445 | | | | 13,756 | | | | 1,695 | | | | 1,561 | | | | 433 | | | | | |
Other | | | 689 | | | | 516 | | | | 43 | | | | 47 | | | | 83 | | | | | |
Total contractual obligations | | $ | 526,834 | | | $ | 27,517 | | | $ | 14,537 | | | $ | 18,539 | | | $ | 466,241 | | | | | |
| (1) | The contractual payments include principal, interest and distributions. The contractual payments reflect the amounts payable from January 1, 2011 up to and including the final contractual maturity date. In the case of floating rate obligations, the floating rate index is based on the interest rates as at December 31, 2010 and is assumed to remain constant to the final contractual maturity date. The Company may have the contractual right to redeem or repay obligations prior to maturity and if such right is exercised, total contractual obligations paid and the timing of payment could vary materially from the amounts and timing included in the table. |
| (2) | Liabilities for preferred shares – Class A, Series 1 are not included in the contractual obligation table. These preferred shares are redeemable by the Company by payment of cash or issuance of MFC common shares and are convertible at the option of the holder into MFC common shares on or after December 15, 2015. |
| (3) | $550 subordinated debentures that were redeemed on February 16, 2011 are included in “Less than 1 year”. |
| (4) | General fund policyholder liability cash flows include estimates related to the timing and payment of death and disability claims, policy surrenders, policy maturities, annuity payments, minimum guarantees on segregated fund products, policyholder dividends, commissions and premium taxes offset by contractual future premiums on in-force contracts. These estimated cash flows are based on the best estimate assumptions used in the determination of policy liabilities. These amounts are undiscounted and do not reflect recoveries from reinsurance agreements. Due to the use of assumptions, actual cash flows may differ from these estimates (see “Policy Liabilities”). |
In the normal course of business, the Company enters into investment commitments, which are not reflected in the consolidated financial statements. As at December 31, 2010, there were $3,154 million of investment commitments (2009 – $2,833 million), of which $2,310 million matures within one year (2009 – $1,550 million), $452 million within one to three years (2009 – $1,144 million), $278 million matures within three to five years (2009 – $121 million) and $114 million matures after five years (2009 – $18 million).
Transactions with Related Parties
In its capacities as an investor and as an investment manager, the Company has relationships with various types of entities, some of which are VIEs. Notes 17 and 20 of the annual consolidated financial statements describe the entities with which the Company has significant relationships.
Legal and Regulatory Proceedings
The Company is regularly involved in legal actions, both as a defendant and as a plaintiff. The legal actions naming the Company as a defendant ordinarily involve its activities as a provider of insurance protection and wealth management products, as well as an investment adviser, employer and taxpayer. In addition, government and regulatory bodies in Canada, the United States and Asia regularly make inquiries and, from time to time, require the production of information or conduct examinations concerning the Company’s compliance with, among other things, insurance laws, securities laws, and laws governing the activities of broker-dealers.
The Company announced on June 19, 2009 that it had received an enforcement notice from staff of the Ontario Securities Commission (“OSC”) relating to its disclosure before March 2009 of risks related to its variable annuity guarantee and segregated funds business. The notice indicated that it was the preliminary conclusion of OSC staff that the Company failed to meet its continuous disclosure obligations related to its exposure to market price risk in its segregated funds and variable annuity guaranteed products. The Company has the opportunity to respond to the notice before OSC staff makes a decision whether to commence proceedings. The Company has responded to the notice and is cooperating with OSC staff in responding to further inquiries. The process is ongoing.
The Company may become subject to regulatory or other action by regulatory authorities in other jurisdictions based on similar allegations. The Company is not currently aware that any other regulatory body is considering commencing proceedings based on the Company’s disclosure obligations. However, there can be no assurance that additional regulatory proceedings will not be commenced in the future.
Proposed class action lawsuits against the Company have been filed in Canada and the United States, on behalf of investors in those jurisdictions, based on similar allegations. The Company may become subject to other similar lawsuits by investors.
The Company believes that its disclosure satisfied applicable disclosure requirements and intends to vigorously defend itself against any claims based on these allegations.
Plaintiffs in class action and other lawsuits against the Company may seek very large or indeterminate amounts, including punitive and treble damages, and the damages claimed and the amount of any probable and estimable liability, if any, may remain unknown for substantial periods of time. A substantial legal liability or a significant regulatory action could have a material adverse effect on the Company’s business, results of operations, financial condition and capital position and adversely affect its reputation. Even if the Company ultimately prevails in the litigation, regulatory action or investigation, it could suffer reputational harm, which could have an adverse effect on its business, results of operations, financial condition and capital position, including its ability to attract new customers, retain current customers and recruit and retain employees.
Key Planning Assumptions and Uncertainties
Manulife’s management objectives do not constitute guidance and are based on certain key planning assumptions, including current accounting and capital standards; no acquisitions or divestitures; equity market returns and interest rates consistent with current best estimate of long-term assumptions; no net impact from any future basis changes, additional expected cost of hedging16, benefits of potential variable annuity required capital releases (based upon current required capital standards and long-term assumptions for equity market performance); additional favourable investment experience expected with improved economic conditions; and no net issuance of debt or capital. In addition, uncertainties regarding market and investment risks; potential accounting standard changes; potential regulatory and capital regime changes; timing and approach to expanded hedging and other risks17 could cause actual results to differ materially from management objectives.
| 16 | In its financial model supporting the 2015 management objectives, the Company has modeled for an additional $400 million per annum, after-tax, to cover the expected cost of hedging, though actual results are expected to vary. |
| 17 | See “Caution regarding forward-looking statements”. |
Performance and Non-GAAP Measures
We use a number of non-GAAP financial measures to measure overall performance and to assess each of our businesses. Non-GAAP measures include: Adjusted Earnings from Operations; Net Income Excluding the Direct Impact of Equity Markets and Interest Rates; Return on Common Shareholders’ Equity; Constant Currency Basis; Sales; Premiums and Deposits; Premiums and Premium Equivalents; Funds under Management; Capital; and Shareholders’ Economic Value. Non-GAAP financial measures are not defined terms under GAAP and, therefore, are unlikely to be comparable to similar terms used by other issuers. Therefore, they should not be considered in isolation or as a substitute for any other financial information prepared in accordance with GAAP.
Net income excluding the direct impact of equity markets and interest rates shows what the net income attributed to shareholders would have been assuming that existing hedges remained unchanged and that interest and equity markets performed as assumed in our policy valuation. We consider the gains or losses on the variable annuity business that is dynamically hedged to be an indirect impact, not a direct impact, of changes in equity markets and interest rates.
Adjusted earnings from operation by division uses the same definition of “adjusted earnings from operations” as outlined above under “2010 Highlights” and “Fourth Quarter 2010 Adjusted Earnings from Operations and Reconciliation with GAAP Measure”, and applies it to the divisional level. The total column is the sum of the actual adjusted earnings from operations for each quarter in 2010. The adjusted earnings from operations for the operating divisions (Asia, Canadian, U.S.) excludes the earnings on surplus allocation from the Corporate and Other segment.
| | | | | | | | | | | | | | | | | | | | | | | | | | | | |
| (C$ millions) | | Asia | | | Canadian | | | U.S. | | | Reinsurance,
Corporate
and Other(1) | | | Other | | | Total | | | | |
Reported net income (loss) attributed to shareholders | | $ | 623 | | | $ | 950 | | | $ | 759 | | | $ | 388 | | | $ | (3,111 | ) | | $ | (391 | ) | | | | |
Less notable items: | | | | | | | | | | | | | | | | | | | | | | | | | | | | |
Equity market, interest rate and other investment experience including credit, OTTI and gains on AFS bonds | | $ | (256 | ) | | $ | (95 | ) | | $ | (287 | ) | | $ | 501 | | | $ | – | | | $ | (137 | ) | | | | |
Tax related gains | | | – | | | | 186 | | | | 8 | | | | (28 | ) | | | – | | | | 166 | | | | | |
Net policyholder experience gains (losses) | | | 41 | | | | 2 | | | | (12 | ) | | | 13 | | | | – | | | | 44 | | | | | |
Change in accounting policy for deferred acquisition costs in the Hong Kong pension business | | | (39 | ) | | | – | | | | – | | | | – | | | | – | | | | (39 | ) | | | | |
Remove allocation of earnings on surplus (post-tax) | | | 158 | | | | 139 | | | | 269 | | | | (566 | ) | | | – | | | | – | | | | | |
Refinements in actuarial methods and assumptions | | | – | | | | – | | | | – | | | | – | | | | (2,072 | ) | | | (2,072 | ) | | | | |
Goodwill impairment | | | – | | | | – | | | | – | | | | – | | | | (1,039 | ) | | | (1,039 | ) | | | | |
Changes in currency rates(2) | | | – | | | | – | | | | – | | | | – | | | | (185 | ) | | | (185 | ) | | | | |
Total notable items | | $ | (96 | ) | | $ | 232 | | | $ | (22 | ) | | $ | (80 | ) | | $ | (3,296 | ) | | $ | (3,262 | ) | | | | |
Adjusted earnings from operations | | $ | 719 | | | $ | 718 | | | $ | 781 | | | $ | 468 | | | $ | 185 | | | $ | 2,871 | | | | | |
| (1) | Excludes goodwill impairment and changes to actuarial methods and assumptions. |
| (2) | Adjustment to move adjusted earnings from the actual exchange rates to the June 30, 2009 exchange rates used to calculate adjusted earnings. |
Return on common shareholders’ equity (“ROE”) is a profitability measure that presents the net income available to common shareholders as a percentage of the capital deployed to earn the income. The Company calculates return on common shareholders’ equity using average common shareholders’ equity excluding AOCI on AFS securities and cash flow hedges.
Return on common shareholders’ equity
| | | | | | | | | | | | | | | | | | | | |
| (C$ millions) | | Quarterly results | | | Year ended | | | | |
| | | 4Q10 | | | 4Q09 | | | 2010 | | | 2009 | | | | |
Net income (loss) available to common shareholders | | $ | 1,774 | | | $ | 848 | | | $ | (470 | ) | | $ | 1,338 | | | | | |
Opening total equity available to common shareholders | | $ | 24,501 | | | $ | 24,812 | | | $ | 27,405 | | | $ | 26,496 | | | | | |
Closing total equity available to common shareholders | | $ | 25,292 | | | $ | 27,405 | | | $ | 25,292 | | | $ | 27,405 | | | | | |
Weighted average total equity available to common shareholders | | $ | 24,896 | | | $ | 26,108 | | | $ | 26,239 | | | $ | 25,845 | | | | | |
Opening AOCI on AFS securities and cash flow hedges | | $ | 404 | | | $ | 442 | | | $ | 564 | | | $ | (846 | ) | | | | |
Closing AOCI on AFS securities and cash flow hedges | | $ | 152 | | | $ | 564 | | | $ | 152 | | | $ | 564 | | | | | |
Adjustment for average AOCI | | $ | (278 | ) | | $ | (503 | ) | | $ | (506 | ) | | $ | 126 | | | | | |
Weighted average total equity available to common shareholders excluding average AOCI adjustment | | $ | 24,618 | | | $ | 25,605 | | | $ | 25,733 | | | $ | 25,971 | | | | | |
ROE based on weighted average total equity available to common shareholders (annualized) | | | 28.3% | | | | 12.9% | | | | (1.8)% | | | | 5.2% | | | | | |
ROE based on weighted average total equity available to common shareholders excluding average AOCI adjustment (annualized) | | | 28.6% | | | | 13.1% | | | | (1.8)% | | | | 5.2% | | | | | |
The Company also uses financial performance measures that are prepared on aconstant currency basis, which exclude the impact of currency fluctuations. Quarterly amounts stated on a constant currency basis in this report are calculated, as appropriate, using the income statement and balance sheet exchange rates effective for the fourth quarter of 2009.
Sales are measured according to product type:
| n | | For total individual insurance, sales include 100 per cent of new annualized premiums and 10 per cent of both excess and single premiums. For individual insurance, new annualized premiums reflect the annualized premium expected in the first year of a policy that requires premium payments for more than one year. Sales are reported gross before the impact of reinsurance. Single premium is the lump sum premium from the sale of a single premium product, e.g. travel insurance. |
| n | | For group insurance, sales include new annualized premiums and administrative services only premium equivalents on new cases, as well as the addition of new coverages and amendments to contracts, excluding rate increases. |
| n | | For individual wealth management contracts, all new deposits are reported as sales. This includes individual annuities, both fixed and variable; variable annuity products; mutual funds; college savings 529 plans; and authorized bank loans and mortgages. |
| n | | For group pensions/retirement savings, sales of new regular premiums and deposits reflect an estimate of expected deposits in the first year of the plan with the Company. Single premium sales reflect the assets transferred from the previous plan provider. Sales include the impact of the addition of a new division or of a new product to an existing client. Total sales include both new regular and single premiums and deposits. |
Premiums and deposits is a measure of top line growth. The Company calculates premiums and deposits as the aggregate of (i) premiums and premium equivalents (see below), (ii) segregated fund deposits, excluding seed money, (iii) mutual fund deposits, (iv) deposits into institutional advisory accounts and (v) other deposits in other managed funds.
Premiums and premium equivalents are part of premiums and deposits. The Company calculates premiums and premium equivalents as the aggregate of (i) general fund premiums net of reinsurance, reported as premiums on the Statement of Operations, (ii) premium equivalents for administration only group benefit contracts and (iii) premiums in the Canadian Group Benefit’s reinsurance ceded agreement.
Premiums and deposits
| | | | | | | | | | | | | | | | | | | | | | | | |
| (C$ millions) | | Quarterly results | | | | | | Year ended | | | | |
| | | 4Q10 | | | 4Q09 | | | | | | 2010 | | | 2009 | | | | |
Premium income | | $ | 4,837 | | | $ | 4,731 | | | | | | | $ | 18,351 | | | $ | 22,946 | | | | | |
Deposits from policyholders per Consolidated Statement of Segregated Fund Changes in Net Assets | | | 6,025 | | | | 7,343 | | | | | | | | 24,544 | | | | 29,084 | | | | | |
Premiums and deposits per financial statements | | $ | 10,862 | | | $ | 12,074 | | | | | | | $ | 42,895 | | | $ | 52,030 | | | | | |
Mutual fund deposits | | | 3,662 | | | | 2,378 | | | | | | | | 12,612 | | | | 8,733 | | | | | |
Institutional advisory account deposits | | | 443 | | | | 363 | | | | | | | | 2,700 | | | | 4,492 | | | | | |
ASO premium equivalents | | | 662 | | | | 663 | | | | | | | | 2,647 | | | | 2,629 | | | | | |
Group Benefits ceded premiums | | | 933 | | | | 919 | | | | | | | | 3,675 | | | | 2,760 | | | | | |
Other fund deposits | | | 145 | | | | 138 | | | | | | | | 532 | | | | 626 | | | | | |
Total premiums and deposits | | $ | 16,707 | | | $ | 16,535 | | | | | | | $ | 65,061 | | | $ | 71,270 | | | | | |
Currency impact | | | 432 | | | | – | | | | | | | | 4,787 | | | | – | | | | | |
Constant currency premiums and deposits | | $ | 17,139 | | | $ | 16,535 | | | | | | | $ | 69,848 | | | $ | 71,270 | | | | | |
Funds under management is a measure of the size of the Company. It represents the total of the invested asset base that the Company and its customers invest in.
Funds under management
| | | | | | | | | | | | |
| As at December 31, | | | | | | | | | |
| (C$ millions) | | 2010 | | | 2009 | | | | |
Total invested assets | | $ | 199,448 | | | $ | 187,470 | | | | | |
Total segregated funds net assets | | | 200,057 | | | | 191,741 | | | | | |
Less: segregated funds held by the Company | | | (148 | ) | | | (118 | ) | | | | |
Funds under management per financial statements | | $ | 399,357 | | | $ | 379,093 | | | | | |
Mutual funds | | | 47,726 | | | | 33,370 | | | | | |
Institutional advisory accounts (excluding segregated funds) | | | 21,066 | | | | 20,906 | | | | | |
Other funds (excluding segregated funds) | | | 7,034 | | | | 6,248 | | | | | |
Total funds under management | | $ | 475,183 | | | $ | 439,617 | | | | | |
Currency impact | | | 13,898 | | | | – | | | | | |
Constant currency funds under management | | $ | 489,081 | | | $ | 439,617 | | | | | |
The definition we use forCapital serves as a foundation of our capital management activities at the MFC level. For regulatory reporting purposes, the numbers are further adjusted for various additions or deductions to capital as mandated by the guidelines used by OSFI. Capital is calculated as the sum of: (i) total equity excluding AOCI on cash flow hedges; (ii) non-controlling interest in subsidiaries; and (iii) liabilities for preferred shares and qualifying capital instruments.
Total capital
| | | | | | | | | | | | |
| As at December 31, | | | | | | | | |
| (C$ millions) | | 2010 | | | 2009 | | | | |
Total equity | | $ | 26,873 | | | $ | 28,907 | | | | | |
Add back: AOCI loss on cash flow hedges | | | 99 | | | | 48 | | | | | |
Add liabilities for preferred shares and qualifying capital instruments | | | 4,011 | | | | 4,037 | | | | | |
Add non-controlling interest in subsidiaries | | | 254 | | | | 202 | | | | | |
Total capital | | $ | 31,237 | | | $ | 33,194 | | | | | |
Impact on shareholders’ economic value is one of the measures we use to describe the potential impact of changes in equity markets and interest rates. Our method of calculating the impact on shareholders’ economic value is set out in the relevant sections above where the impact is disclosed.
Quarterly Financial Information
The following table provides summary information related to our eight most recently completed quarters:
| | | | | | | | | | | | | | | | | | | | | | | | | | | | | | | | | | | | |
As at and for the three months ended, (C$ millions, except per share amounts) | | Dec. 31,
2010 | | | Sept. 30,
2010 | | | June 30,
2010 | | | Mar. 31, 2010 | | | Dec. 31,
2009 | | | Sept. 30,
2009 | | | June 30,
2009 | | | Mar. 31, 2009 | | | | |
Revenue | | | | | | | | | | | | | | | | | | | | | | | | | | | | | | | | | | | | |
Premium income | | | | | | | | | | | | | | | | | | | | | | | | | | | | | | | | | | | | |
Life and health insurance(1) | | $ | 3,651 | | | $ | 3,558 | | | $ | 3,356 | | | $ | 3,215 | | | $ | 3,575 | | | $ | 3,576 | | | $ | 3,573 | | | $ | 4,275 | | | | | |
Annuities and pensions | | | 1,186 | | | | 1,091 | | | | 1,114 | | | | 1,180 | | | | 1,156 | | | | 1,947 | | | | 2,147 | | | | 2,697 | | | | | |
Total premium income | | $ | 4,837 | | | $ | 4,649 | | | $ | 4,470 | | | $ | 4,395 | | | $ | 4,731 | | | $ | 5,523 | | | $ | 5,720 | | | $ | 6,972 | | | | | |
Investment income | | | 2,259 | | | | 3,081 | | | | 2,094 | | | | 2,042 | | | | 2,061 | | | | 2,082 | | | | 2,061 | | | | 1,837 | | | | | |
Realized and unrealized (losses) gains on assets supporting policy liabilities and consumer notes(2) | | | (5,289 | ) | | | 3,869 | | | | 3,817 | | | | 1,149 | | | | (1,441 | ) | | | 4,661 | | | | 2,145 | | | | (2,103 | ) | | | | |
Other revenue | | | 1,613 | | | | 1,539 | | | | 1,529 | | | | 1,579 | | | | 1,620 | | | | 1,486 | | | | 1,459 | | | | 1,293 | | | | | |
Total revenue | | $ | 3,420 | | | $ | 13,138 | | | $ | 11,910 | | | $ | 9,165 | | | $ | 6,971 | | | $ | 13,752 | | | $ | 11,385 | | | $ | 7,999 | | | | | |
Income (loss) before income taxes | | $ | 2,155 | | | $ | (1,336 | ) | | $ | (3,346 | ) | | $ | 1,355 | | | $ | 981 | | | $ | (701 | ) | | $ | 1,695 | | | $ | (2,127 | ) | | | | |
Income tax (expense) recovery | | | (341 | ) | | | 437 | | | | 971 | | | | (207 | ) | | | (136 | ) | | | 563 | | | | 89 | | | | 1,056 | | | | | |
Net income (loss) | | $ | 1,814 | | | $ | (899 | ) | | $ | (2,375 | ) | | $ | 1,148 | | | $ | 845 | | | $ | (138 | ) | | $ | 1,784 | | | $ | (1,071 | ) | | | | |
Net income (loss) attributed to shareholders | | $ | 1,794 | | | $ | (947 | ) | | $ | (2,378 | ) | | $ | 1,140 | | | $ | 868 | | | $ | (172 | ) | | $ | 1,774 | | | $ | (1,068 | ) | | | | |
Basic earnings (loss) per common share | | $ | 1.00 | | | $ | (0.55 | ) | | $ | (1.36 | ) | | $ | 0.64 | | | $ | 0.51 | | | $ | (0.12 | ) | | $ | 1.09 | | | $ | (0.67 | ) | | | | |
Diluted earnings (loss) per common share | | $ | 1.00 | | | $ | (0.55 | ) | | $ | (1.36 | ) | | $ | 0.64 | | | $ | 0.51 | | | $ | (0.12 | ) | | $ | 1.09 | | | $ | (0.67 | ) | | | | |
Segregated funds deposits | | $ | 6,025 | | | $ | 5,347 | | | $ | 5,968 | | | $ | 7,204 | | | $ | 7,343 | | | $ | 6,091 | | | $ | 7,391 | | | $ | 8,259 | | | | | |
Total assets–general fund | | $ | 217,672 | | | $ | 228,130 | | | $ | 220,219 | | | $ | 206,521 | | | $ | 205,845 | | | $ | 208,650 | | | $ | 208,238 | | | $ | 214,227 | | | | | |
Segregated funds net assets | | $ | 200,057 | | | $ | 201,752 | | | $ | 190,243 | | | $ | 194,149 | | | $ | 191,741 | | | $ | 188,148 | | | $ | 178,161 | | | $ | 164,464 | | | | | |
Weighted average common shares(in millions) | | | 1,773 | | | | 1,767 | | | | 1,762 | | | | 1,758 | | | | 1,669 | | | | 1,615 | | | | 1,611 | | | | 1,610 | | | | | |
Diluted weighted average common shares(in millions) | | | 1,776 | | | | 1,767 | | | | 1,762 | | | | 1,763 | | | | 1,673 | | | | 1,615 | | | | 1,616 | | | | 1,610 | | | | | |
Dividends per common share | | $ | 0.13 | | | $ | 0.13 | | | $ | 0.13 | | | $ | 0.13 | | | $ | 0.13 | | | $ | 0.13 | | | $ | 0.26 | | | $ | 0.26 | | | | | |
CDN$ to $1US – Balance Sheet | | | 0.9946 | | | | 1.0298 | | | | 1.0606 | | | | 1.0156 | | | | 1.0466 | | | | 1.0722 | | | | 1.1625 | | | | 1.2602 | | | | | |
CDN$ to $1US – Statement of Operations | | | 1.0128 | | | | 1.0391 | | | | 1.0276 | | | | 1.0401 | | | | 1.0562 | | | | 1.0979 | | | | 1.1668 | | | | 1.2456 | | | | | |
| (1) | At the end of the first quarter of 2009, Canadian Group Benefits entered into an external reinsurance agreement which resulted in a substantial reduction in net premium revenue reported on the income statement. |
| (2) | For fixed income assets supporting policy liabilities and for equities supporting pass-through products, the impact of realized and unrealized (losses) gains on the assets is largely offset in the change in actuarial liabilities. |
Selected Annual Financial Information
| | | | | | | | | | | | |
As at and for the years ended December 31, (C$ millions, except per share amounts) | | 2010 | | | 2009 | | | 2008 | |
Total assets | | $ | 217,672 | | | $ | 205,845 | | | $ | 211,025 | |
Long-term financial liabilities: | | | | | | | | | | | | |
Long-term debt | | $ | 5,443 | | | $ | 3,308 | | | $ | 3,689 | |
Non-controlling interest in subsidiaries | | | 254 | | | | 202 | | | | 217 | |
Liabilities for preferred shares and capital instruments | | | 4,412 | | | | 4,581 | | | | 3,674 | |
| | | $ | 10,109 | | | $ | 8,091 | | | $ | 7,580 | |
Dividend per common share | | $ | 0.52 | | | $ | 0.78 | | | $ | 1.00 | |
Cash dividend per Class A Share, Series 1 | | $ | 1.025 | | | $ | 1.025 | | | $ | 1.025 | |
Cash dividend per Class A Share, Series 2 | | $ | 1.16252 | | | $ | 1.16252 | | | $ | 1.16252 | |
Cash dividend per Class A Share, Series 3 | | $ | 1.125 | | | $ | 1.125 | | | $ | 1.125 | |
Cash dividend per Class A Share, Series 4 | | $ | 1.65 | | | $ | 1.3087 | | | | | |
Cash dividend per Class 1 Share, Series 1 | | $ | 1.40 | | | $ | 0.76425 | | | | | |
Additional Information Available
Additional information relating to Manulife Financial, including MFC’s Annual Information Form, is available on the Company’s web site at www.manulife.com and on SEDAR at www.sedar.com.
Outstanding Shares – Selected Information
Class A Shares Series 1
As at March 15, 2011, MFC had 14 million Class A Shares Series 1 (“Series 1 Preferred Shares”) outstanding at a price of $25.00 per share, for an aggregate amount of $350 million. The Series 1 Preferred Shares are non-voting and are entitled to non-cumulative preferential cash dividends payable quarterly, if and when declared, at a per annum rate of 4.10%. With regulatory approval, the Series 1 Preferred Shares may be redeemed by MFC, in whole or in part, at declining premiums that range from $1.25 to nil per Series 1 Preferred Share, by either payment of cash or the issuance of MFC common shares. On or after December 19, 2015, the Series 1 Preferred Shares will be convertible at the option of the holder into MFC common shares, the number of which is determined by a prescribed formula, and is subject to the right of MFC prior to the conversion date to redeem for cash or find substitute purchasers for such preferred shares. The prescribed formula is the face amount of the Series 1 Preferred Shares divided by the greater of $2.00 and 95% of the then market price of MFC common shares.
Subsequent Events
On February 16, 2011, MLI redeemed the outstanding $550 million principal amount of the 6.24% subordinated debentures at par plus accrued and unpaid interest.
On March 11, 2011, MFC issued eight million Class 1 Shares Series 3 (“Series 3 Preferred Shares”) at a price of $25.00 per share, for an aggregate amount of $200 million. The Series 3 Preferred Shares are entitled to non-cumulative preferential cash dividends, payable quarterly, if and when declared, at a per annum rate of 4.20% until June 19, 2016, after which the dividend rate will be reset every five years at a rate equal to the five year Government of Canada bond yield plus 1.41%. On June 19, 2016 and on June 19 every five years thereafter, the Series 3 Preferred Shares will be convertible at the option of the holder into Class 1 Shares Series 4 (“Series 4 Preferred Shares”). The Series 4 Preferred Shares are entitled to non-cumulative floating preferential cash dividends, payable quarterly, if and when declared, at a rate equal to the three month Government of Canada Treasury bill yield plus 1.41%.
Common Shares
As at March 15, 2011, MFC had 1,777,960,688 common shares outstanding.