Exhibit 99.2

Manulife Financial Corporation
Management’s Discussion and Analysis
For the year ended December 31, 2012

2012 Manulife Financial Corporation
Management’s Discussion And Analysis
TABLE OF CONTENTS
| | | | |
| | 11 | | Financial Performance |
| | 18 | | Performance by Division |
| | 36 | | Risk Management and Risk Factors |
| | 60 | | Capital Management Framework |
| | 63 | | Critical Accounting and Actuarial Policies |
| | 73 | | U.S. GAAP Disclosures |
| | 75 | | Controls and Procedures |
| | 75 | | Performance and Non-GAAP Measures |
| | 78 | | Additional Disclosures |
Caution regarding forward-looking statements
This document contains forward-looking statements within the meaning of the “safe harbour” provisions of Canadian provincial securities laws and the U.S. Private Securities Litigation Reform Act of 1995. The forward-looking statements in this document include, but are not limited to, statements with respect to our 2016 management objectives for core earnings and core ROE, potential future charges related to URR assumptions if current low interest rates persist, changes in MLI’s MCCSR ratio and additional risks regarding entities within the MFC group that are interconnected which may make separation difficult. The forward-looking statements in this document also relate to, among other things, our objectives, goals, strategies, intentions, plans, beliefs, expectations and estimates, and can generally be identified by the use of words such as “may”, “will”, “could”, “should”, “would”, “likely”, “suspect”, “outlook”, “expect”, “intend”, “estimate”, “anticipate”, “believe”, “plan”, “forecast”, “objective”, “seek”, “aim”, “continue”, “goal”, “restore”, “embark” and “endeavour” (or the negative thereof) and words and expressions of similar import, and include statements concerning possible or assumed future results. Although we believe that the expectations reflected in such forward-looking statements are reasonable, such statements involve risks and uncertainties, and undue reliance should not be placed on such statements and they should not be interpreted as confirming market or analysts’ expectations in any way. Certain material factors or assumptions are applied in making forward-looking statements, including in the case of our 2016 management objectives for core earnings and core ROE, the assumptions described under “Key Planning Assumptions and Uncertainties” in this document and actual results may differ materially from those expressed or implied in such statements. Important factors that could cause actual results to differ materially from expectations include but are not limited to: the factors identified in “Key Planning Assumptions and Uncertainties” in this document; general business and economic conditions (including but not limited to the performance, volatility and correlation of equity markets, interest rates, credit and swap spreads, currency rates, investment losses and defaults, market liquidity and creditworthiness of guarantors, reinsurers and counterparties); changes in laws and regulations; changes in accounting standards; our ability to execute strategic plans and changes to strategic plans; downgrades in our financial strength or credit ratings; our ability to maintain our reputation; impairments of goodwill or intangible assets or the establishment of provisions against future tax assets; the accuracy of estimates relating to morbidity, mortality and policyholder behaviour; the accuracy of other estimates used in applying accounting policies and actuarial methods; our ability to implement effective hedging strategies and unforeseen consequences arising from such strategies; our ability to source appropriate assets to back our long dated liabilities; level of competition and consolidation; our ability to market and distribute products through current and future distribution channels; unforeseen liabilities or asset impairments arising from acquisitions and dispositions of businesses; the realization of losses arising from the sale of investments classified as available-for-sale; our liquidity, including the availability of financing to satisfy existing financial liabilities on expected maturity dates when required; obligations to pledge additional collateral; the availability of letters of credit to provide capital management flexibility; accuracy of information received from counterparties and the ability of counterparties to meet their obligations; the availability, affordability and adequacy of reinsurance; legal and regulatory proceedings, including tax audits, tax litigation or similar proceedings; our ability to adapt products and services to the changing market; our ability to attract and retain key executives, employees and agents; the appropriate use and interpretation of complex models or deficiencies in models used; political, legal, operational and other risks associated with our non-North American operations; acquisitions and our ability to complete acquisitions including the availability of equity and debt financing for this purpose; the disruption of or changes to key elements of the Company’s or public infrastructure systems; environmental concerns; and our ability to protect our intellectual property and exposure to claims of infringement. Additional information about material factors that could cause actual results to differ materially from expectations and about material factors or assumptions applied in making forward-looking statements may be found in the body of this document under “Risk Management and Risk Factors” and “Critical Accounting and Actuarial Policies” in the Management’s Discussion and Analysis and in the “Risk Management” note to the consolidated financial statements as well as under “Risk Factors” in our most recent Annual Information Form and elsewhere in our filings with Canadian and U.S. securities regulators. We do not undertake to update any forward-looking statements, except as required by law.
| | | | |
| 8 Manulife Financial Corporation 2012 Annual Report | | Table of Contents | | |
MANAGEMENT’S DISCUSSION AND ANALYSIS
This Management’s Discussion and Analysis (“MD&A”) is current as of March 15, 2013.
Overview
Manulife Financial is a leading Canada-based financial services group with principal operations in Asia, Canada and the United States. Manulife Financial’s vision is to provide its clients with strong, reliable, trustworthy and forward-thinking solutions for their most significant financial decisions. Our international network of employees, agents and distribution partners offers financial protection and wealth management products and services to millions of customers. These products and services include individual life insurance, group life and health insurance, long-term care services, pension products, annuities, mutual funds and banking products. We provide asset management services to institutional customers worldwide and offer reinsurance solutions, specializing in property and casualty retrocession. Funds under management1 by Manulife Financial and its subsidiaries were $532 billion as at December 31, 2012. The Company operates as Manulife Financial in Canada and Asia and primarily as John Hancock in the United States.
Manulife Financial Corporation trades as ‘MFC’ on the TSX, NYSE and PSE, and under ‘945’ on the SEHK. Manulife Financial can be found on the internet at manulife.com.
In this document, the terms “Company”, “Manulife Financial” and “we” mean Manulife Financial Corporation (“MFC”) and its subsidiaries.
In 2012 we made significant progress towards our strategic priorities:
| n | | Developing our Asian opportunity to the fullest, |
| n | | Growing our wealth and asset management businesses in Asia, Canada, and the U.S., |
| n | | Continuing to build our balanced Canadian franchise, and |
| n | | Continuing to grow higher return on equity (“ROE”), lower risk U.S. businesses. |
We ended 2012 with record annual sales1 in both our Insurance and Wealth businesses excluding variable annuities. Our Asian operations delivered strong growth by expanding our distribution networks, including growing our bancassurance partnerships. We generated another all-time record for funds under management as a result of record sales in our mutual fund and asset management businesses.
Since 2010, we have enjoyed a positive progression in earnings and in 2012 improved our annual net income attributed to shareholders by $1.6 billion over 2011. We reported net income attributed to shareholders for 2012 of $1,736 million compared with $129 million in 2011. While 2012 earnings included strong investment related gains of $1,137 million, they also included a $1,081 million charge for changes in actuarial methods and assumptions and a $758 million charge for the direct impact of equity markets and interest rates.
In 2012 we introduced “core earnings”1 – a non-GAAP measure which management believes better reflects our underlying earnings capacity. Core earnings excludes investment related gains in excess of $200 million per annum (the $200 million per annum to be reported in core earnings compares with an average of over $320 million per annum reported from 2007 to 2011). It also excludes the mark-to-market accounting impact of equity markets and interest rates as well as a number of other items, outlined in the Financial Performance section below.
Core earnings in 2012 were $2,187 million compared with $2,169 million in 2011. The $18 million increase included a number of offsetting items. Improved new business margins, increased fee income driven by higher funds under management, a higher scheduled release of provisions for adverse deviation for variable annuity guarantees driven by higher equity markets, and the non-recurrence of material Property and Casualty Reinsurance claims were mostly offset by additional macro equity hedging costs, higher pension costs related to amortization of prior years’ unrealized investment losses on the Company’s own pension plans, and higher business development and project related expenses.
Asia Division continues to build a pan-Asian life insurance franchise that is well positioned to satisfy the protection and retirement needs of the fast growing customer base in the region. Our core strategy focuses on expanding our professional agency force and alternative channel distribution, growing our wealth and asset management businesses and investing in our brand across Asia. In 2012, we achieved record sales for both insurance and wealth (excluding variable annuities) products, secured and deepened strategically important distribution agreements with key bank partners in Japan and Indonesia, achieved strong growth in our professional agency force in several key markets, and successfully expanded our presence in the Managing General Agent channel into the retail market in Japan. We launched innovative brand building campaigns to enhance our strong global brand, became the first foreign owned life insurer to commence operations in Cambodia, and we expanded our broad geographic footprint in China with our 50th city license.
The Canadian Division continued to build our diversified Canadian franchise. We achieved record full year sales in several business lines, namely: Group Benefits, Manulife Mutual Funds and Affinity Markets, and Group Retirement Solutions once again led the defined contribution market in sales2. We continued to drive our desired shift in product mix, reducing the proportion of insurance
| 1 | This item is a non-GAAP measure. See “Performance and Non-GAAP Measures” below. |
| 2 | Based on quarterly sales survey by LIMRA, an insurance industry organization, for the year ended December 31, 2012. |
| | | | |
| | Management’s Discussion and Analysis | | Manulife Financial Corporation 2012 Annual Report 9 |
and variable annuity sales with guarantee features. We expanded our distribution reach by welcoming new advisors, extending existing relationships and enhancing support to our distribution partners. On January 4th, 2013 we completed our acquisition of Benesure Canada Inc., strategically positioning us as the leading provider of mortgage creditor insurance through mortgage brokers in Canada.
The U.S. Division continues to make substantive progress towards our strategic priority of growing higher ROE and lower risk businesses. Our focus is on building a leading company in the U.S. that helps Americans with their retirement, long-term care and estate planning needs. We are leveraging our trusted brand, diverse and broad distribution, and core business strength of product innovation to profitably grow our de-risked insurance and wealth management franchises. In 2012 we achieved record sales in our mutual fund and 401(k) businesses and continued to achieve success in our product repositioning strategy in a low interest rate environment. Through product re-design, re-pricing and business re-positioning, we have reduced the equity and interest rate risk and earnings sensitivity of our product portfolio, while we continue to invest in the growth of fee-based products with lower capital requirements and higher return potential, including our 401(k), mutual fund and lower risk insurance products. We are seeing the desired impact of these actions on our product sales mix with a continued shift away from guaranteed, long-duration products in 2012.
The Investment Division continued to deliver strong investment gains with fixed income and alternative long-duration asset investing along with excellent credit experience accounting for the vast majority of our investment gains. The favourable credit experience reflects the strength of our underwriting and the alternative long-duration assets originated during 2012 further diversified our portfolio and continue to enhance our risk-adjusted returns. The acquisitions were across various asset classes including real estate, timberland, private equities, and infrastructure. We continue to focus our acquisitions on high quality, good relative value assets.
Manulife Asset Management experienced significant growth in 2012 across its global franchise, with assets under management increasing by 12 per cent to $238 billion. Our strong investment performance is yielding tangible results across many asset classes. We successfully launched several new products which have enabled us to meet our retail clients’ needs, and we have been awarded new institutional mandates in North America and Asia which have contributed to significant growth in institutional assets under management.
We also achieved our 2014 equity and interest rate hedging goals two years ahead of schedule and closed 2012 with a strong Minimum Continuing Capital and Surplus Requirements (“MCCSR”) capital ratio for The Manufacturers Life Insurance Company (“MLI”) of 211 per cent.
| | | | |
| 10 Manulife Financial Corporation 2012 Annual Report | | Management’s Discussion and Analysis | | |
Financial Performance
In 2012 the Company introduced “core earnings” – a non-GAAP measure, which management believes better reflects our underlying earnings capacity. Core earnings excludes the direct impact of equity markets and interest rates as well as a number of other items, outlined below, that are considered material and exceptional in nature. This metric is not insulated from macro-economic factors which can have a significant impact. Any future changes to the core earnings definition referred to below will be disclosed.
Items that are included in core earnings are:
| 1. | Expected earnings on in-force policies, including expected release of provisions for adverse deviation, fee income, margins on group business and spread business such as Manulife Bank and asset fund management. |
| 2. | Macro hedging costs based on expected market returns. |
| 4. | Policyholder experience gains or losses. |
| 5. | Acquisition and operating expenses compared to expense assumptions used in the measurement of policy liabilities. |
| 6. | Up to $200 million of investment gains reported in a single year, which are referred to as “core” investment gains. |
| 7. | Earnings on surplus other than mark-to-market items. Gains on available-for-sale (“AFS”) equities and seed money investments are included in core earnings. |
| 8. | Routine or non-material legal settlements. |
| 9. | All other items not specifically excluded. |
| 10. | Tax on the above items. |
| 11. | All tax related items except the impact of enacted or substantially enacted income tax rate changes. |
Items excluded from core earnings are:
| 1. | The direct impact of equity markets and interest rates, consisting of: |
| | n | | Income (loss) on variable annuity guarantee liabilities not dynamically hedged. |
| | n | | Gains (charges) on general fund equity investments supporting policy liabilities and on fee income. |
| | n | | Gains (losses) on macro equity hedges relative to expected costs. The expected cost of macro hedges is calculated using the equity assumptions used in the valuation of policy liabilities. |
| | n | | Gains (charges) on higher (lower) fixed income reinvestment rates assumed in the valuation of policy liabilities, including the impact on the fixed income ultimate reinvestment rate (“URR”). |
| | n | | Gains (charges) on sale of AFS bonds and open derivatives not in hedging relationships in the Corporate and Other segment. |
| 2. | The earnings impact of the difference between the net increase (decrease) in variable annuity liabilities that are dynamically hedged and the performance of the related hedge assets. Our variable annuity dynamic hedging strategy is not designed to completely offset the sensitivity of policy liabilities to all risks or measurements associated with the guarantees embedded in these products for a number of reasons, including: provisions for adverse deviation, fund performance, the portion of the interest rate risk that is not dynamically hedged, realized equity and interest rate volatilities and changes to policyholder behaviour. |
| 3. | Net investment related gains in excess of $200 million per annum or net losses on a year-to-date basis. Investment gains (losses) relate to fixed income trading, non-fixed income returns, credit experience and asset mix changes. These gain and losses are a combination of reported investment experience as well as the impact of investing activities on the measurement of our policy liabilities. The maximum of $200 million per annum to be reported in core earnings compares with an average of over $80 million per quarter of investment gains reported from 2007 to 2011. |
| 4. | Mark-to-market gains or losses on assets held in the Corporate and Other segment other than gains on AFS equities and seed money investments in new segregated or mutual funds. |
| 5. | Changes in actuarial methods and assumptions, excluding URR. |
| 6. | The impact on the measurement of policy liabilities of changes in product features or new reinsurance transactions, if material. |
| 7. | Goodwill impairment charges. |
| 8. | Gains or losses on disposition of a business. |
| 9. | Material one-time only adjustments, including highly unusual/extraordinary and material legal settlements or other items that are material and exceptional in nature. |
| 10. | Tax on the above items. |
| 11. | Impact of enacted or substantially enacted income tax rate changes. |
| | | | |
| | Management’s Discussion and Analysis | | Manulife Financial Corporation 2012 Annual Report 11 |
Financial Highlights
| | | | | | | | | | | | | | |
As at and for the years ended December 31, (C$ millions, unless otherwise stated) | | 2012 | | | 2011 | | | 2010 | | | |
Net income (loss) attributed to shareholders | | $ | 1,736 | | | $ | 129 | | | $ | (1,663 | ) | | |
Preferred share dividends | | | (112 | ) | | | (85 | ) | | | (79 | ) | | |
Common shareholders’ net income (loss) | | $ | 1,624 | | | $ | 44 | | | $ | (1,742 | ) | | |
Reconciliation of core earnings to net income (loss) attributed to shareholders: | | | | | | | | | | | | | | |
Core earnings(1) | | $ | 2,187 | | | $ | 2,169 | | | $ | 3,132 | | | |
Investment related gains in excess of core investment gains | | | 937 | | | | 1,290 | | | | 484 | | | |
Core earnings plus investment related gains in excess of core investment gains | | $ | 3,124 | | | $ | 3,459 | | | $ | 3,616 | | | |
Other items to reconcile core earnings to net income (loss) attributed to shareholders: | | | | | | | | | | | | | | |
Direct impact of equity markets and interest rates | | | (758 | ) | | | (1,064 | ) | | | (1,003 | ) | | |
Changes in actuarial methods and assumptions (other than URR) and goodwill impairment | | | (1,281 | ) | | | (1,416 | ) | | | (4,096 | ) | | |
Other items | | | 651 | | | | (850 | ) | | | (180 | ) | | |
Net income (loss) attributed to shareholders | | $ | 1,736 | | | $ | 129 | | | $ | (1,663 | ) | | |
Basic earnings (loss) per common share (C$) | | $ | 0.90 | | | $ | 0.02 | | | $ | (0.99 | ) | | |
Diluted earnings (loss) per common share (C$) | | $ | 0.88 | | | $ | 0.02 | | | $ | (0.99 | ) | | |
Diluted core earnings per common share (C$)(1) | | $ | 1.12 | | | $ | 1.14 | | | $ | 1.68 | | | |
Return on common shareholders’ equity | | | 7.1% | | | | 0.2% | | | | (7.2)% | | | |
U.S. GAAP net income attributed to shareholders(1) | | $ | 2,557 | | | $ | 3,674 | | | $ | 1,652 | | | |
Sales(1) | | | | | | | | | | | | | | |
Insurance products | | $ | 3,349 | | | $ | 2,507 | | | $ | 2,530 | | | |
Wealth products | | $ | 35,940 | | | $ | 34,299 | | | $ | 33,904 | | | |
Premiums and deposits(1) | | | | | | | | | | | | | | |
Insurance products | | $ | 24,221 | | | $ | 22,278 | | | $ | 21,736 | | | |
Wealth products | | $ | 51,280 | | | $ | 43,783 | | | $ | 43,370 | | | |
Funds under management (C$ billions)(1) | | $ | 532 | | | $ | 500 | | | $ | 477 | | | |
Capital (C$ billions) (1) | | $ | 29.6 | | | $ | 29.0 | | | $ | 28.7 | | | |
MLI’s MCCSR ratio(2) | | | 211% | | | | 216% | | | | 249% | | | |
Sensitivities to equity markets and interest rates: | | | | | | | | | | | | | | |
% of underlying earnings sensitivity to equity market movements offset by hedges(3) | | | 72 to 83% | | | | 59 to 70% | | | | 50 to 55% | | | |
Earnings impact of a 1% parallel decline in interest rates(4) | | $ | (400 | ) | | $ | (1,000 | ) | | $ | (1,800 | ) | | |
| (1) | This item is a non-GAAP measure. For a discussion of our use of non-GAAP measures, see “Performance and Non-GAAP Measures” below. |
| (2) | The ratio for 2010 has been calculated in accordance with Canadian generally accepted accounting principles prior to the adoption of International Financial Reporting Standards (“IFRS”). |
| (3) | The lower end of the range represents the impact of re-balancing equity hedges for dynamically hedged variable annuity guarantee liabilities at 5% market decline intervals. Includes the hedge ineffectiveness impact associated with the unhedged provisions for adverse deviation, but does not include any impact in respect of other sources of hedge ineffectiveness, e.g. basis risk, realized volatility and equity, interest rate correlations different from expected among other factors. For presentation purposes, numbers are rounded. See “Risk Management and Risk Factors” section. |
| (4) | The impact above excludes the impact of market value changes in available-for-sale (“AFS”) bonds. The AFS bonds provide a natural economic offset to the interest rate risk arising from our product liabilities, and if included would have reduced the impact by $(800), $(800) and $(1,200) for the years ended December 31, 2012, 2011 and 2010. |
Analysis of Net Income (Loss)
We reported net income attributed to shareholders for the full year 2012 of $1,736 million compared with $129 million in 2011. Core earnings in 2012 were $2,187 million compared with $2,169 million in 2011.
The $18 million increase in core earnings compared with full year 2011 included a number of offsetting items. Improved new business margins, increased fee income driven by higher funds under management, a higher scheduled release of variable annuity guarantee margins driven by higher equity markets, and the non-recurrence of material Property and Casualty Reinsurance claim provisions were mostly offset by $81 million of costs associated with additional equity futures in our macro equity hedging program and higher pension costs related to amortization of prior years’ unrealized investment losses on the Company’s own pension plans, and higher business development and project related expenses.
The difference between full year 2012 core earnings and full year net income attributed to shareholders was a $451 million net charge. Charges included $1,081 million for changes in actuarial methods and assumptions, $758 million for the direct impact of equity markets and interest rates, $200 million for the impairment of goodwill and $57 million related to restructuring. These charges were partially offset by $937 million of investment related gains in excess of the $200 million reported in core earnings and $708 million for the tax items, major reinsurance and in-force product activities, as well as income on variable annuity guarantee liabilities that are dynamically hedged. These items are further outlined in the table below.
The $937 million of investment related gains in excess of the $200 million reported in core earnings was primarily a result of fixed income and alternative long-duration asset investing along with excellent credit experience.
| | | | |
| 12 Manulife Financial Corporation 2012 Annual Report | | Management’s Discussion and Analysis | | |
The net $1,081 million charge related to the update to the actuarial methods and assumptions excluding the fixed income ultimate reinvestment rate are broadly grouped into three categories: (i) updates to actuarial standards of practice, (ii) updates largely related to the current macro-economic climate, and (iii) all other results of the annual review of assumptions.
| n | | A charge of $244 million related to updates to Actuarial Standards of Practice for the calibration of equity returns used in stochastic models to value segregated fund guarantee liabilities. |
| n | | Charges related largely to the impact of the current macro-economic climate were $1,120 million. The current macro-economic climate, including current low interest rates and the current level of equity markets, has made minimum interest rate guarantees and equity fund performance guarantees more valuable and has therefore increased the propensity of policyholders to retain their policies and alter guaranteed withdrawal benefits utilization. Charges resulted from strengthening withdrawal and lapse assumptions for U.S. Variable Annuity Guaranteed Minimum Withdrawal Benefit policies, and updates to lapse assumptions for certain life insurance products in the U.S. Charges also resulted from updates to bond parameters for segregated fund guarantees and from updates to interest rates for certain participating insurance businesses. |
| n | | Other changes to actuarial methods and assumptions netted to a gain of $283 million. Favourable impacts to earnings resulted from updates to mortality and morbidity assumptions, net updates to expense assumptions, refinements to modeling of corporate spreads, refinements to the margins on our dynamically hedged variable annuity business and from a number of refinements in the modeling of policy cash flows. Partially offsetting these favourable impacts were updates to the modeling of liability cash flows, including the estimated impact of systems conversion in U.S. Life, updated lapse assumptions in Japan and Canada, and the net impact of refinements to the modeling of cash flows and updated assumed return assumptions for alternative long-duration assets. |
The $200 million charge related to goodwill was associated with the Individual Insurance business in Canada and was driven by the low interest rate environment.
The $758 million charge for the direct impact of equity markets and interest rates included a $677 million charge as a result of lower fixed income ultimate reinvestment rates assumed in the valuation of our policy liabilities. We reported a net gain of $675 million related to the combined impact of markets on variable annuity guaranteed liabilities that are not hedged, the impact of equity markets on general fund liabilities and macro equity hedges. As a result of the decline in interest rates during 2012 we reported a loss of $756 million related to fixed income reinvestment rates assumed in the valuation of policy liabilities and realized losses on AFS bonds and derivative positions.
The combination of our macro public equity and dynamic hedging programs substantially reduces our sensitivities to our variable annuity and other public market equity declines, and mitigates against significant market moves. Gross equity exposure produced gains of $2,025 million in 2012, 58 per cent of which were offset by the macro hedge experience and the dynamic hedges.
The $57 million ($78 million pre-tax) restructuring charge for severance related to the Company’s Organizational Design initiative. The initiative, started in 2012 and expected to be completed in 2013, is designed to broaden the spans of control and reduce the number of management layers in the organization.
The gain of $708 million included a $176 million gain on variable annuity guarantee liabilities that are dynamically hedged, a net gain of $210 million related to major reinsurance transactions, in-force product changes and dispositions and a gain of $322 million for material and exceptional tax items. With respect to the tax items, we released $182 million of provisions related to prior years’ uncertain tax positions on one item, we reported a net gain of $82 million related to interest on our tax contingency for leasing transactions and a $58 million gain related to the enactment of new tax rates in Japan.
| | | | |
| | Management’s Discussion and Analysis | | Manulife Financial Corporation 2012 Annual Report 13 |
The table below reconciles 2012 core earnings of $2,187 million to the reported net income attributed to shareholders of $1,736 million.
| | | | | | | | | | | | | | |
For the years ended December 31, | | | | | |
(C$ millions, unaudited) | | 2012 | | | 2011 | | | 2010 | | | |
Core earnings (losses)(1) | | | | | | | | | | | | | | |
Asia Division | | $ | 963 | | | $ | 938 | | | $ | 915 | | | |
Canadian Division | | | 835 | | | | 849 | | | | 1,059 | | | |
U.S. Division | | | 1,085 | | | | 1,005 | | | | 1,051 | | | |
Corporate & Other (excluding expected cost of macro hedges) | | | (407 | ) | | | (415 | ) | | | (59) | | | |
Expected cost of macro hedges(2) | | | (489 | ) | | | (408 | ) | | | (34) | | | |
Core investment related gains | | | 200 | | | | 200 | | | | 200 | | | |
Total core earnings | | $ | 2,187 | | | $ | 2,169 | | | $ | 3,132 | | | |
Investment related gains in excess of core investment gains | | | 937 | | | | 1,290 | | | | 484 | | | |
Core earnings plus investment related gains above | | $ | 3,124 | | | $ | 3,459 | | | $ | 3,616 | | | |
Change in actuarial methods and assumptions, excluding URR(3) | | | (1,081 | ) | | | (751 | ) | | | (1,766) | | | |
Direct impact of equity markets and interest rates (see table below)(4) | | | (758 | ) | | | (1,064 | ) | | | (1,003) | | | |
Goodwill impairment charge | | | (200 | ) | | | (665 | ) | | | (2,330) | | | |
Income (charges) on variable annuity guarantee liabilities that are dynamically hedged(5) | | | 176 | | | | (1,153 | ) | | | (180) | | | |
Impact of major reinsurance transactions, in-force product changes and dispositions | | | 210 | | | | 303 | | | | – | | | |
Material and exceptional tax related items(6) | | | 322 | | | | – | | | | – | | | |
Restructuring charge related to organizational design(7) | | | (57 | ) | | | – | | | | – | | | |
Net income (loss) attributed to shareholders | | $ | 1,736 | | | $ | 129 | | | $ | (1,663) | | | |
| (1) | This is a non-GAAP measure. See “Performance and Non-GAAP Measures” below. |
| (2) | The 2012 net loss from macro equity hedges was $1,000 million and consisted of a $489 million charge related to the estimated expected cost of the macro equity hedges relative to our long-term valuation assumptions and a charge of $511 million because actual markets outperformed our valuation assumptions. The latter amount is included in the direct impact of equity markets and interest rates (see table below). |
| (3) | Of the full year 2012 $1,081 million charge for change in actuarial methods and assumptions, $1,006 million was reported in the third quarter as part of the comprehensive annual review of valuation assumptions. The full year charges were broadly grouped into three categories: (i) a charge of $244 million related to updates to actuarial standards of practice, (ii) a charge of $1,120 million for updates largely related to the current macro-economic climate, and (iii) all other results of the annual review of assumptions netted to a gain of $283 million. See section “Review of Actuarial Methods and Assumptions”. |
| (4) | The direct impact of equity markets and interest rates is relative to our policy liability valuation assumptions and includes changes to interest rate assumptions as well as experience gains and losses on derivatives associated with our macro equity hedges. We also include gains and losses on the sale of AFS bonds as management may have the ability to partially offset the direct impacts of changes in interest rates reported in the liability segments. |
| (5) | Our variable annuity guarantee dynamic hedging strategy is not designed to completely offset the sensitivity of policy liabilities to all risks associated with the guarantees embedded in these products. See the “Risk Management” section. |
| (6) | Included in the tax items are $264 million of material and exceptional U.S. tax items and $58 million for changes to tax rates in Japan. |
| (7) | The restructuring charge relates to severance under the Company’s Organizational Design Project. The project is designed to broaden the spans of control and reduce the number of layers in the organization. |
The loss related to the direct impact of equity markets and interest rates in the table above is attributable to:
| | | | | | | | | | | | | | |
For the years ended December 31, (C$ millions, unaudited) | | 2012 | | | 2011 | | | 2010 | | | |
Variable annuity liabilities that are not dynamically hedged | | $ | 1,078 | | | $ | (1,092 | ) | | $ | (30 | ) | | |
General fund equity investments supporting policy liabilities(1) | | | 108 | | | | (214 | ) | | | 133 | | | |
Macro equity hedges relative to expected costs(2) | | | (511 | ) | | | 636 | | | | (48 | ) | | |
Lower fixed income reinvestment rates assumed in the valuation of policy liabilities(3) | | | (740 | ) | | | (281 | ) | | | (1,293 | ) | | |
Sale of AFS bonds and derivative positions in the Corporate & Other segment | | | (16 | ) | | | 324 | | | | 544 | | | |
Charges due to lower fixed income URR assumptions used in the valuation of policy liabilities | | | (677 | ) | | | (437 | ) | | | (309 | ) | | |
Direct impact of equity markets and interest rates | | $ | (758 | ) | | $ | (1,064 | ) | | $ | (1,003 | ) | | |
| (1) | The impact on general fund equity investment supporting policy liabilities includes the capitalized impact on fees for variable universal life policies. |
| (2) | Gross equity exposure produced gains of $2,026 million in 2012, which were partially offset by charges from macro hedge experience and dynamic hedges of $1,174 million. |
| (3) | The $740 million charge in 2012 for lower assumed fixed income returns was driven mainly by lower corporate spreads and increases in swap spreads. |
| | | | |
| 14 Manulife Financial Corporation 2012 Annual Report | | Management’s Discussion and Analysis | | |
Earnings per Common Share and Return on Common Shareholders’ Equity
Net income per common share for 2012 was $0.90, compared to $0.02 in 2011. Return on common shareholders’ equity for 2012 was 7.1 per cent, compared to 0.2 per cent for 2011.
Sales
We reported record annual sales3 in both our Insurance and Wealth businesses excluding variable annuities.
Insurance sales exceeded $3.3 billion for the full year 2012, an increase4 of 33 per cent compared with 2011. Full year insurance sales in Asia increased 16 per cent versus 2011 with record sales levels achieved in eight territories. Insurance sales in Canada almost doubled year over year driven by record Group Benefits sales. Canadian recurring premium insurance sales were eight per cent lower than the prior year due to the implementation of de-risking strategies. In the U.S., JH Life 2012 full year sales increased 12 per cent versus full year 2011 although overall U.S. insurance sales were four per cent lower as a result of the Company’s decision to raise prices and focus on new products with favourable risk characteristics.
Wealth sales were almost $36 billion for full year 2012 and increased four per cent compared with full year 2011 despite restrictions placed on annuity sales by the Company. Asia reported strong growth throughout most of the region with total wealth sales increasing 36 per cent over 2011. Wealth sales in Japan more than doubled in 2012 while Indonesia exceeded the US$1 billion mark in total wealth sales. In Canada, mutual fund sales achieved record levels, while Group Retirement Solutions sales increased 17 per cent compared with 2011. These increases in Canada were partially offset by the anticipated reduction in annuity sales and lower new loan volumes. As a result, overall Canadian wealth sales in 2012 were seven per cent lower than in full year 2011. U.S. wealth sales increased three per cent for the full year compared to 2011. JH Funds and JH RPS reported record full year sales with year over year increases of eight per cent and 28 per cent, respectively.
Premiums and Deposits
Total Company premiums and deposits5 for insurance products increased to $24.2 billion in 2012, an increase6 of eight per cent over 2011. The increase was 24 per cent in Asia, seven per cent in Canada and one per cent in the U.S.
Total Company premiums and deposits for wealth products increased to $51.3 billion in 2012, an increase of 16 per cent over 2011. The increase was 35 per cent in Asia and four per cent in the U.S. In Canada, premiums and deposits were in line with 2011 due to the decline in sales of variable annuity and fixed wealth products. The strong total Company result also included $7.9 billion of Manulife Asset Management institutional deposits, one and half times more than in 2011.
Funds under Management
Funds under management as at December 31, 2012 were a record $532 billion, an increase of $32 billion, or nine per cent on a constant currency basis, over December 31, 2011. The increase was attributed to $44 billion of favourable investment returns and $14 billion of net positive policyholder cash flows, partially offset by the transfer of $7 billion of assets related to the reinsurance of our U.S. fixed deferred annuity business, $11 billion due to currency movements and $8 billion of non-policyholder cash outflows (expenses, commissions, taxes and other items).
Funds under management
| | | | | | | | | | | | | | |
As at December 31, (C$ millions) | | 2012 | | | 2011 | | | 2010 | | | |
General fund | | $ | 229,928 | | | $ | 226,520 | | | $ | 201,222 | | | |
Segregated funds net assets(1) | | | 207,985 | | | | 195,933 | | | | 198,972 | | | |
Mutual funds, institutional advisory accounts and other(1),(2) | | | 94,029 | | | | 77,199 | | | | 76,763 | | | |
Total funds under management | | $ | 531,942 | | | $ | 499,652 | | | $ | 476,957 | | | |
| (1) | Segregated fund assets, mutual fund assets and other funds are not available to satisfy the liabilities of the Company’s general fund. |
| (2) | Other funds represent pension funds, pooled funds, endowment funds and other institutional funds managed by the Company on behalf of others. |
Capital
Total capital7 was $29.6 billion as at December 31, 2012 compared to $29.0 billion as at December 31, 2011, an increase of $0.6 billion. The increase included net earnings of $1.7 billion and net capital raised of $0.2 billion, partially offset by the $0.8 billion impact of the stronger Canadian dollar and cash dividends of $0.7 billion over the period.
| 3 | This is a non-GAAP measure. See “Performance and Non-GAAP Measures” below. |
| 4 | Growth in sales is stated on a constant currency basis. Constant currency basis is a non-GAAP measure. See “Performance and Non-GAAP Measures” below. |
| 5 | This is a non-GAAP measure. See “Performance and Non-GAAP Measures” below. |
| 6 | Growth in premiums and deposits is stated on a constant currency basis. Constant currency basis is a non-GAAP measure. See “Performance and Non-GAAP Measures” below. |
| 7 | This is a non-GAAP measure. See “Performance and Non-GAAP Measures” below. |
| | | | |
| | Management’s Discussion and Analysis | | Manulife Financial Corporation 2012 Annual Report 15 |
Public Equity Risk and Interest Rate Risk Reduction Plans
We achieved both our equity and interest rate hedging targets two years ahead of our 2014 goals thereby further reducing volatility of earnings.
Our established risk reduction plans were designed to reduce our exposure to public equity risk and interest rate risk through a combination of time-scheduled and market-trigger based actions. Our goal was to have approximately 75 per cent of our underlying earnings sensitivity to public equity market movements offset by hedges by the end of 2014 and to reduce our interest rate exposures, as measured by the sensitivity of shareholders’ net income to a 100 basis point decline in interest rates, to $1.1 billion as at year end 2014. At December 31, 2012 between 72 and 83 per cent of our underlying earnings sensitivity to a ten per cent decline in equity markets was offset by hedges and the impact of a 100 basis point decline in interest rates on our earnings was $400 million.
Fourth Quarter Financial Highlights
| | | | | | | | | | | | | | |
| For the quarters ended December 31, | | | | | |
| (C$ millions, except per share amounts) | | 2012 | | | 2011 | | | 2010 | | | |
Net income (loss) attributed to shareholders | | $ | 1,057 | | | $ | (69 | ) | | $ | 1,796 | | | |
Core earnings(1)(see next page for reconciliation) | | $ | 537 | | | $ | 373 | | | $ | 862 | | | |
Diluted earnings (loss) per common share (C$) | | $ | 0.56 | | | $ | (0.05 | ) | | $ | 0.96 | | | |
Diluted core earnings per common share (C$)(1) | | $ | 0.28 | | | $ | 0.19 | | | $ | 0.46 | | | |
Return on common shareholders’ equity (annualized) | | | 18.2% | | | | (1.6)% | | | | 31.6% | | | |
Sales(1) | | | | | | | | | | | | | | |
Insurance products | | $ | 929 | | | $ | 640 | | | $ | 702 | | | |
Wealth products | | $ | 10,439 | | | $ | 8,141 | | | $ | 9,166 | | | |
Premiums and deposits(1) Insurance products | | $ | 6,629 | | | $ | 5,749 | | | $ | 5,729 | | | |
Wealth products | | $ | 17,499 | | | $ | 10,168 | | | $ | 10,990 | | | |
| (1) | This item is a non-GAAP measure. See “Performance and Non-GAAP Measures” below. |
Net Income (Loss) Attributed to Shareholders
In the fourth quarter of 2012, we reported net income attributed to shareholders of $1,057 million and core earnings of $537 million.
Core earnings increased $164 million compared with the fourth quarter of 2011. The increase was driven by a combination of increased fee income on funds under management and the significant improvement in new business margins as a result of pricing actions and improvement in business mix. In addition there were a number of offsetting items in the fourth quarter 2012. The favourable impact of the net release of excess Property and Casualty Reinsurance provisions ($38 million) and certain tax items ($48 million) was offset by sales and other incentive expenses ($32 million), systems and legal fees ($18 million) and higher macro hedge costs ($43 million).
The difference between fourth quarter 2012 core earnings and net income attributed to shareholders was a $520 million net gain, and consisted of:
| n | | $318 million of investment related gains in excess of the $50 million included in core earnings; |
| n | | $264 million of favourable tax related changes that were considered material and exceptional in nature; and |
| n | | $100 million gain related to our hedged variable annuity guarantees; |
partially offset by charges of:
| n | | $87 million primarily attributed to the estimated impact of modeling refinements relating to a valuation systems conversion; |
| n | | $57 million ($78 million pre-tax) restructuring charge for severance related to the Company’s Organizational Design Project; and |
| n | | $18 million for the direct impact of equity markets and interest rates. |
| | | | |
| 16 Manulife Financial Corporation 2012 Annual Report | | Management’s Discussion and Analysis | | |
Analysis of Net Income (Loss)
The table below reconciles the fourth quarter 2012 core earnings of $537 million to the reported net income attributed to shareholders of $1,057 million.
| | | | | | | | | | |
| (C$ millions, unaudited) | | 4Q 2012 | | | 4Q 2011 | | | |
Core earnings (loss)(1) | | | | | | | | | | |
Asia Division | | $ | 180 | | | $ | 213 | | | |
Canadian Division | | | 233 | | | | 142 | | | |
U.S. Division | | | 293 | | | | 189 | | | |
Corporate & Other (excluding expected cost of macro hedges) | | | (79 | ) | | | (124 | ) | | |
Expected cost of macro hedges(2) | | | (140 | ) | | | (97 | ) | | |
Core investment related gains | | | 50 | | | | 50 | | | |
Core earnings | | $ | 537 | | | $ | 373 | | | |
Investment related gains in excess of core investment gains | | | 318 | | | | 261 | | | |
Core earnings plus investment related gains in excess of core investment gains | | $ | 855 | | | $ | 634 | | | |
Other items to reconcile core earnings to net income (loss) attributed to shareholders: | | | | | | | | | | |
Material and exceptional tax related items(3) | | | 264 | | | | – | | | |
Income (charges) on variable annuity guarantee liabilities that are dynamically hedged(4) | | | 100 | | | | (193 | ) | | |
Change in actuarial methods and assumptions excluding URR(5) | | | (87 | ) | | | 2 | | | |
Restructuring charge related to organizational design(6) | | | (57 | ) | | | – | | | |
Direct impact of equity markets and interest rates(7) | | | (18 | ) | | | 153 | | | |
Goodwill impairment charge(8) | | | – | | | | (665 | ) | | |
Net income (loss) attributed to shareholders | | $ | 1,057 | | | $ | (69 | ) | | |
| (1) | Core earnings is a non-GAAP measure. See “Performance and Non-GAAP Measures” below. |
| (2) | The fourth quarter 2012 net loss from macro equity hedges was $432 million and consisted of a $140 million charge related to the estimated expected cost of the macro equity hedges relative to our long-term valuation assumptions and a charge of $292 million because actual markets outperformed our valuation assumptions. This latter amount is included in the direct impact of equity markets and interest rates. |
| (3) | In accordance with our definition of core earnings above, certain fourth quarter tax related items were considered material and exceptional in nature and therefore not included in core earnings. Please note that core earnings does include routine type tax transactions and provisions. |
| (4) | Our variable annuity guarantee dynamic hedging strategy is not designed to completely offset the sensitivity of policy liabilities to all risks associated with the guarantees embedded in these products. The gain in the fourth quarter 2012 was mostly because our equity fund results outperformed indices and the tightening of corporate spreads had a favourable impact on our bond funds. See the Risk Management section. |
| (5) | The charge for the fourth quarter of 2012 is primarily related to the estimated impact of modeling refinements relating to a valuation system conversion in the U.S. |
| (6) | The restructuring charge relates to severance under the Company’s Organizational Design Project. The project is designed to broaden the spans of control and reduce the number of layers in the organization. |
| (7) | The direct impact of equity markets and interest rates is relative to our policy liability valuation assumptions and includes changes to interest rate assumptions as well as gains and losses on derivatives associated with our macro equity hedges. We also include gains and losses on the sale of AFS bonds as management may have the ability to partially offset the direct impacts of changes in interest rates reported in the liability segments. |
| (8) | The goodwill impairment charge in 2011 related to the JH Life cash generating unit. |
Sales8
Insurance sales were $929 million in the fourth quarter of 2012, an increase of 49 per cent compared with fourth quarter of 2011 and included a large Group Benefits sale. In Asia, fourth quarter insurance sales of US$362 million were up 20 per cent from the same quarter of 2011. In Canada, Group Benefits’ sales for the quarter were three and a half times the same quarter of the prior year and we reported lower but more profitable sales in Individual Insurance. In the U.S., insurance sales increased 13 per cent, mainly driven by successful new product offerings with favourable risk characteristics.
Wealth sales of $10.4 billion in the fourth quarter 2012 increased 31 per cent compared with the fourth quarter of 2011. Wealth sales in Asia were more than double those in the fourth quarter 2011 with all countries and territories contributing to the increase. Growth in Japan was fueled by the successful launch of the Strategic Income Fund and continued strong sales of the Australian dollar denominated fixed annuity product. In Canada, record mutual fund sales and a 45 per cent increase in sales in Group Retirement Solutions were more than offset by the decline in annuity sales and lower new loan volumes, resulting in an overall reduction of four per cent compared with the fourth quarter 2011. In the U.S., wealth sales increased 31 per cent over fourth quarter 2011. Both JH Funds and JH RPS reported record quarterly sales, with JH RPS capitalizing on the high turnover in the market including the exit of a key competitor.
| 8 | This is a non-GAAP measure. See “Performance and non-GAAP Measures” below. |
| | | | |
| | Management’s Discussion and Analysis | | Manulife Financial Corporation 2012 Annual Report 17 |
Performance by Division
Asia Division
Manulife Financial has operated in Asia since 1897, beginning in Hong Kong. Today, as a pan-Asian insurer, we have insurance and asset management operations in 12 markets. In addition to Hong Kong we operate in the Philippines, Singapore, Indonesia, Macau, Taiwan, China, Japan, Vietnam, Malaysia, Thailand and Cambodia.
We offer a diverse portfolio of protection, savings and wealth management products and services to meet the needs of individuals and corporate customers. To reach our customers we distribute our products through a multi-channel network, including more than fifty thousand tied agents, bank partners, independent agents, and financial advisors.
In 2012, Asia Division contributed 18 per cent of total premiums and deposits and, as at December 31, 2012, accounted for 15 per cent of the Company’s funds under management.
Financial Performance
Asia Division’s net income attributed to shareholders for 2012 was US$1,979 million in 2012 compared with a net loss of US$62 million for 2011. The significant increase was primarily related to the change in direct impact of equity markets and interest rates on variable annuity guarantee liabilities that are not dynamically hedged.
Core earnings of US$963 million increased by US$13 million. The increase was attributable to growth in in-force business across the region partially offset by an increase in expenses related to expansion activities and the non-recurrence of policyholder experience gains reported in 2011.
On a Canadian dollar basis, the net income attributed to shareholders for 2012 was $1,969 million compared to a net loss of $48 million reported a year earlier.
The table below reconciles core earnings to net income (loss) attributed to shareholders for Asia Division for 2012, 2011 and 2010.
| | | | | | | | | | | | | | | | | | | | | | | | | | |
| For the years ended December 31, | | Canadian $ | | | | | US $ | |
($ millions) | | 2012 | | | 2011 | | | 2010 | | | | | 2012 | | | 2011 | | | 2010 | |
Core earnings(1) | | $ | 963 | | | $ | 938 | | | $ | 915 | | | | | $ | 963 | | | $ | 950 | | | $ | 893 | |
Items to reconcile core earnings to net income attributed to shareholders: | | | | | | | | | | | | | | | | | | | | | | | | | | |
Direct impact of equity markets and interest rates(2) | | | 906 | | | | (1,159 | ) | | | (242 | ) | | | | | 915 | | | | (1,186 | ) | | | (242 | ) |
Investment gains related to fixed income trading, market value increases in excess of expected alternative assets investment returns, asset mix changes and credit experience | | | 55 | | | | 204 | | | | 57 | | | | | | 56 | | | | 205 | | | | 56 | |
Unrealized gain (loss) on variable annuity guarantee liabilities that are dynamically hedged(3) | | | 5 | | | | (31 | ) | | | (18 | ) | | | | | 5 | | | | (31 | ) | | | (18 | ) |
Favourable impact of enacted tax rate changes | | | 40 | | | | – | | | | – | | | | | | 40 | | | | – | | | | – | |
Net income (loss) attributed to shareholders | | $ | 1,969 | | | $ | (48 | ) | | $ | 712 | | | | | $ | 1,979 | | | $ | (62 | ) | | $ | 689 | |
| (1) | Core earnings is a non-GAAP measure. See “Performance and Non-GAAP Measure” below. |
| (2) | The direct impact of equity markets and interest rates is relative to our policy liability valuation assumptions and includes changes to interest rate assumptions. The gains of C$906 million in 2012 (2011 – loss of C$1,159 million) consisted of a C$946 million gain (2011 – loss of C$877 million) related to variable annuities that are not dynamically hedged, C$70 million gain (2011 – loss of C$120 million) on general fund equity investments supporting policy liabilities and on fee income and C$110 million loss (2011 – loss of C$162 million) related to fixed income reinvestment rates assumed in the valuation of policy liabilities. |
| (3) | Our variable annuity guarantee dynamic hedging strategy is not designed to completely offset the sensitivity of policy liabilities to all risks associated with the guarantees embedded in these products. The amount of variable annuity guaranteed value that was dynamically hedged at the end of 2012 was 14 per cent. |
Sales
In 2012, Asia Division achieved record sales for both insurance and wealth (excluding variable annuities) products.
Asia Division’s insurance salesin 2012 were US$1.4 billion, an increase of 16 per cent compared with 2011. Indonesia reported sales of US$114 million, up 46 per cent from 2011, driven by an expanded Bancassurance channel which grew 140 per cent compared to 2011. Sales in Japan reached a record level of US$767 million, 11 per cent higher than the prior year’s record sales, a result of strong cancer product sales in the first half of the year and increasing term sales in the second half of 2012. Sales in Hong Kong reached a record high of US$257 million, up 23 per cent over the prior year. The growth was primarily driven by expanded agency distribution, as well as continued strong sales throughout the year of our participating life product, including a run up of sales prior to price increases in the second quarter. Asia Other insurance sales (excludes sales in Hong Kong, Japan and Indonesia) of US$302 million were 15 per cent higher than 2011 driven primarily by expanded agency distribution.
Asia Division’s wealth salesin 2012 were US$5.7 billion, an increase of 36 per cent compared with 2011. Japan sales of US$1.7 billion more than doubled the prior year and were fueled by the successful launch of the Strategic Income Fund and the continued strong sales of our foreign denominated fixed annuity product. Indonesia sales surpassed the US$1 billion milestone, driven
| | | | |
| 18 Manulife Financial Corporation 2012 Annual Report | | Management’s Discussion and Analysis | | |
by strong performance in all product lines and included mutual fund sales that were seven times higher than 2011. Hong Kong sales of US$792 million were down 15 per cent from 2011, primarily as a result of a change in client preferences for bond funds over equity funds in 2012. This was partially offset by the successful start in capturing transfer cases following the November launch of the Mandatory Provident Fund’s new Employee Choice Arrangement. Asia Other wealth sales (excludes sales in Hong Kong, Japan and Indonesia) of US$2.2 billion were up 13 per cent from 2011. Strong mutual fund sales in Taiwan, as well as unit linked sales in the Philippines, were the key contributors to the growth.
Sales
| | | | | | | | | | | | | | | | | | | | | | | | | | | | |
For the years ended December 31, ($ millions) | | Canadian $ | | | | | US $ | | | |
| | | 2012 | | | | 2011 | | | | 2010 | | | | | | 2012 | | | | 2011 | | | | 2010 | | | |
Insurance products | | $ | 1,440 | | | $ | 1,230 | | | $ | 1,066 | | | | | $ | 1,440 | | | $ | 1,244 | | | $ | 1,036 | | | |
Wealth products | | | 5,690 | | | | 4,131 | | | | 4,530 | | | | | | 5,698 | | | | 4,186 | | | | 4,406 | | | |
Premiums and Deposits
Premiums and deposits in 2012 were US$13 billion, up 28 per cent over 2011 on a constant currency basis.
Insurance premiums and deposits increased by 24 percent to US$6.7 billion in 2012 driven by higher new business sales and in-force business growth across the region, most notably in Japan.
Wealth premiums and deposits increased by 35 percent to US$6.8 billion, for the same reasons as noted in the sales section above.
Premiums and Deposits
| | | | | | | | | | | | | | | | | | | | | | | | | | | | |
For the years ended December 31, ($ millions) | | Canadian $ | | | | | US $ | | | |
| | 2012 | | | 2011 | | | 2010 | | | | | 2012 | | | 2011 | | | 2010 | | | |
Insurance products | | $ | 6,650 | | | $ | 5,311 | | | $ | 4,512 | | | | | $ | 6,655 | | | $ | 5,365 | | | $ | 4,384 | | | |
Wealth products | | | 6,811 | | | | 4,992 | | | | 5,367 | | | | | | 6,822 | | | | 5,057 | | | | 5,218 | | | |
Total premiums and deposits | | $ | 13,461 | | | $ | 10,303 | | | $ | 9,879 | | | | | $ | 13,477 | | | $ | 10,422 | | | $ | 9,602 | | | |
Funds under Management
Asia Division funds under management as at December 31, 2012 were US$78 billion, an increase of 16 per cent, on a constant currency basis, compared with December 31, 2011. Growth was driven by an increase in net policyholder cash flows of US$7 billion and favourable investment returns.
Funds under Management
| | | | | | | | | | | | | | | | | | | | | | | | | | | | |
As at December 31, ($ millions) | | Canadian $ | | | | | US $ | | | |
| | 2012 | | | 2011 | | | 2010 | | | | | 2012 | | | 2011 | | | 2010 | | | |
General funds | | $ | 37,798 | | | $ | 34,757 | | | $ | 29,077 | | | | | $ | 38,002 | | | $ | 34,172 | | | $ | 29,240 | | | |
Segregated funds | | | 23,435 | | | | 23,524 | | | | 24,026 | | | | | | 23,558 | | | | 23,130 | | | | 24,159 | | | |
Mutual and other funds | | | 16,480 | | | | 13,109 | | | | 14,557 | | | | | | 16,563 | | | | 12,889 | | | | 14,638 | | | |
Total funds under management | | $ | 77,713 | | | $ | 71,390 | | | $ | 67,660 | | | | | $ | 78,123 | | | $ | 70,191 | | | $ | 68,037 | | | |
Strategic Direction
Asia Division continues to build a pan-Asian life insurance franchise that is well positioned to satisfy the protection and retirement needs of the fast growing customer base in the region. Our core strategy focuses on expanding our professional agency force and alternative channel distribution, growing our wealth and asset management businesses and investing in our brand across Asia. We remain committed to expanding product offerings and growing our businesses by executing on new opportunities, particularly in the wealth management space where we can leverage our asset management capabilities.
In 2012, we secured and deepened strategically important distribution agreements with key bank partners in Japan and Indonesia, achieved strong growth in our professional agency force in several key markets, and successfully expanded our presence in the Managing General Agent channel in Japan into the retail market. We also launched innovative brand building campaigns to enhance our strong global brand.
In Hong Kong, our professional agency force is now more than 5,500, and our deepened relationships with DBS Bank and CITIC Bank International enable more customers to access our professional and personalized services. To further leverage our core strength in long-term protection and savings products, we plan on further expanding our distribution in Direct Marketing/Telemarketing and independent financial advisory and broker markets, as well as enhancing our wholesaling capability. The 2012 regulatory change in the Mandatory Provident Fund, allowing employees to choose their pension asset manager for their own contributions, provides us an opportunity to grow our market share in the Pension business. Technology is a key part of our strategy and in 2012 we introduced an e-platform for our advisors to perform financial planning analysis and complete insurance applications electronically, thereby providing a more personalized experience for our customers.
| | | | |
| | Management’s Discussion and Analysis | | Manulife Financial Corporation 2012 Annual Report 19 |
In Japan, we continue to execute a growth strategy based on diversified product offerings and broadened distribution capabilities. In 2012, we achieved our fifth consecutive year of record insurance sales. The Managing General Agent channel continued to achieve strong sales in the corporate market and successfully expanded into the retail market with the launch of two new products. In the agency channel, we launched new products to further diversify our product mix. We continue to expand our wealth product line up and distribution relationships, shifting product mix away from variable annuities.
Indonesia is an increasingly important contributor to Asia Division’s overall results. In 2012, our professional agency force grew by 29 per cent, and we launched several new products to further diversify our product mix away from products with long-term guarantees. With the implementation of the partnership between PT Bank Danamon Indonesia Tbk (Danamon) and Manulife in July 2012, we have significantly expanded our bank distribution capabilities. Danamon now offers a range of Manulife product solutions to a broad base of customers throughout its branch network of over 2,400 branches and service outlets countrywide. We have launched a series of protection products to address a range of insurance needs, as well as a diverse range of investment options, through unit-linked funds, that cater to the wealth accumulation needs of customers.
In the Other Asia territories, we continue to invest in our core strength of professional agency distribution, deepen our existing bank relationships, and seek new partnership distribution opportunities that offer growth and diversification opportunities. We successfully launched our Cambodian operations in June, and we had over 300 agents at the end of 2012. In China, Manulife Sinochem was licensed in 50 cities within 13 provinces and municipalities as at December 31, 2012 and has one of the broadest geographic footprints among foreign joint venture insurance companies. We will continue to grow scale in our existing locations by enhancing the productivity and professionalism of our agency force. We are also expanding into alternative distribution channels and exploring ways to capitalize on potential pension and mutual fund opportunities.
| | | | |
| 20 Manulife Financial Corporation 2012 Annual Report | | Management’s Discussion and Analysis | | |
Canadian Division
Serving one in five Canadians, Canadian Division is one of the leading financial services organizations in Canada. We offer a diverse range of protection, estate planning, investment and banking solutions through a diversified multi-channel distribution network, meeting the needs of a broad marketplace.
Our retail businesses provide broad-based solutions targeting middle and upper-income individuals and business owners, sold mainly through independent advisors. We offer life and living benefits insurance; mutual funds; fixed and variable annuities; investment loans and mortgages, including our innovative Manulife One product; guaranteed interest contracts and high interest savings accounts. Manulife Private Wealth offers personalized wealth management and banking solutions to high net worth customers.
Group life, health, disability and retirement solutions are marketed to Canadian employers through consultants and brokers, as well as independent advisors. We also provide international employee benefits management to multinational companies. Life, health and specialty products, such as travel insurance, are offered through alternative distribution channels, including sponsor groups and associations, as well as direct-to-customer marketing.
In 2012, Canadian Division contributed 24 per cent of the Company’s total premiums and deposits and, as at December 31, 2012, accounted for 25 per cent of the Company’s funds under management.
Financial Performance
Canadian Division’s net income attributed to shareholders was $1,169 million in 2012 compared with $927 million for 2011. Core earnings were $835 million in 2012 compared with $849 million in 2011. Excluded from core earnings in 2012 were gains of $334 million (2011 – $78 million). These gains were comprised of $35 million related to the direct impact of equity markets and interest rates (2011 – $12 million); other investment gains of $40 million (2011 – $66 million); a $137 million gain related to the recapture of a reinsurance treaty (2011 – nil); and a $122 million reserve release related to in-force variable annuity product changes (2011 – nil). Core earnings decreased by $14 million compared with full year 2011. Year-over-year, core earnings increased due to lower new business strain as a result of pricing and product changes; changes in investment strategies; and business growth. These gains were more than offset by unfavourable claims and lapse experience and an unfavourable expense position as the business continued to reposition its new business profile.
In addition, core earnings were favourably impacted by the release of tax provisions relating to the closure of the review of prior years’ tax filings in the amount of $58 million, $65 million and $186 million in 2012, 2011 and 2010, respectively.
The table below reconciles core earnings to the net income attributed to shareholders for Canadian Division for 2012, 2011 and 2010.
| | | | | | | | | | | | | | | | | | |
For the years ended December 31, (C$ millions) | | 2012 | | | | | 2011 | | | | | 2010 | | | |
Core earnings(1),(2) | | $ | 835 | | | | | $ | 849 | | | | | $ | 1,059 | | | |
Items to reconcile core earnings to net income attributed to shareholders: | | | | | | | | | | | | | | | | | | |
Impact of major reinsurance transactions and in-force product changes(3) | | | 259 | | | | | | – | | | | | | – | | | |
Income (charges) on variable annuity guarantee liabilities that are dynamically hedged(4) | | | 50 | | | | | | (278 | ) | | | | | 13 | | | |
Direct impact of equity markets and interest rates(5) | | | 35 | | | | | | 12 | | | | | | (159 | ) | | |
Investment gains related to fixed income trading, market value increases in excess of expected alternative assets investment returns, asset mix changes and credit experience | | | (10 | ) | | | | | 344 | | | | | | 189 | | | |
Net income attributed to shareholders | | $ | 1,169 | | | | | $ | 927 | | | | | $ | 1,102 | | | |
| (1) | The Company moved the reporting of its International Group Program business unit from the U.S. Division to the Canadian Division in 2012. Prior period results have been restated to reflect this change. |
| (2) | Core earnings is a non-GAAP measure. See “Performance and Non-GAAP Measures” below. |
| (3) | The $259 million gain includes $137 million related to the recapture of a reinsurance treaty and $122 million reserve release related to in-force variable annuity product changes. |
| (4) | Our variable annuity guarantee dynamic hedging strategy is not designed to completely offset the sensitivity of policy liabilities to all risks associated with the guarantees embedded in these products. The amount of variable annuity guaranteed value that was dynamically hedged at the end of 2012 was 86 per cent. |
| (5) | The direct impact of equity markets and interest rates is relative to our policy liability valuation assumptions and includes changes to interest rate assumptions. The gains of $35 million in 2012 (2011 – $12 million) consisted of a $4 million gain (2011 – loss of $39 million) related to variable annuities that are not dynamically hedged, nil (2011 – loss of $80 million) on general fund equity investments supporting policy liabilities and a $31 million gain (2011 – $131 million) related to fixed income reinvestment rates assumed in the valuation of policy liabilities. |
Sales
In 2012, Canadian Division achieved record sales in several business lines and continued to make significant progress in our product repositioning strategy in an unstable macro-economic environment. Through product re-design and re-pricing, combined with hedging, we have reduced the equity market and interest rate risk of our new business, while continuing to invest in the development and growth of businesses with lower capital and higher return potential. These actions are having the desired impact with increased sales diversification and a lower proportion of our overall sales from guaranteed, long-duration products.
| | | | |
| | Management’s Discussion and Analysis | | Manulife Financial Corporation 2012 Annual Report 21 |
Record insurance sales of over $1.3 billion in 2012 were twice the levels reported in 2011, driven by record sales in Group Benefits. Group Benefits’ sales exceeded $1 billion, an industry record, reflecting strong one-time single premium sales and good growth across diverse market segments in Canada. Individual Insurance sales in 2012 continued to align with our strategy to reduce new business risk, with a significantly lower proportion of sales with guaranteed long-duration features compared to 2011. Manulife has led the industry with changes to guaranteed long-duration products, the anticipated impact of which was reflected in the year-over-year sales result. Sales of recurring premium individual insurance products of $254 million in 2012 were eight per cent below 2011 levels.
Canadian Division sales of wealth products exceeded $10 billion in 2012, seven per cent below 2011 levels, reflecting our actions to moderate variable annuity sales in the current macro-economic environment. GRS continued to lead the market for defined contribution sales in the Canadian group retirement industry in 20129 and total sales of $1.1 billion were 17 per cent higher than 2011 levels. Record mutual fund deposits exceeded $2 billion, three per cent higher than 2011, reflecting expanded distribution reach, continued strong performance in balanced and fixed income fund categories and success of a number of funds launched this year. For 2012, Manulife Mutual Funds was the fastest growing mutual fund organization in Canada based on assets under management of the top 10 fund companies reporting to The Investment Funds Institute of Canada (IFIC)10. Manulife Bank achieved record assets of over $21 billion at December 31, 2012, driven by strong client retention and stable new lending volumes of $4.6 billion for the year. Sales of variable annuity and fixed wealth products of $2.3 billion in 2012 were down significantly from a year ago reflecting the impact of segregated fund product changes and the continued low interest rate environment.
Sales
For the years ended December 31,
| | | | | | | | | | | | |
| (C$ millions) | | 2012 | | | 2011 | | | 2010 | |
Insurance products | | $ | 1,310 | | | $ | 658 | | | $ | 657 | |
Wealth products | | | 10,057 | | | | 10,784 | | | | 10,145 | |
Premiums and Deposits
Canadian Division premiums and deposits of $18.1 billion in 2012 grew two per cent from $17.8 billion in 2011. The primary contributors of the year-over-year increase were record single premium Group Benefits sales and strong growth in our group retirement business, driven by sales and deposits from a growing block of in-force participants. These increases were dampened by a decline in sales of variable annuity and fixed wealth products.
Premiums and Deposits
For the years ended December 31,
| | | | | | | | | | | | |
| (C$ millions) | | 2012 | | | 2011 | | | 2010 | |
Insurance products | | $ | 10,310 | | | $ | 9,603 | | | $ | 9,395 | |
Wealth products | | | 7,809 | | | | 8,213 | | | | 7,642 | |
Total premiums and deposits | | $ | 18,119 | | | $ | 17,816 | | | $ | 17,037 | |
Funds under Management
Canadian Division funds under management grew to a record $133.2 billion as at December 31, 2012, a nine per cent increase from $122.1 billion at December 31, 2011. The increase reflects business growth across the division driven by the wealth management businesses and Manulife Bank. Net increases in asset market values as a result of lower interest rates and equity market appreciation during the last 12 months also contributed to the year-over-year increase.
Funds under Management
As at December 31,
| | | | | | | | | | | | |
| (C$ millions) | | 2012 | | | 2011 | | | 2010 | |
General fund | | $ | 79,961 | | | $ | 73,926 | | | $ | 66,464 | |
Segregated funds | | | 44,701 | | | | 40,826 | | | | 40,773 | |
Mutual and other funds | | | 20,675 | | | | 17,708 | | | | 16,760 | |
Less mutual funds held by segregated funds | | | (12,138 | ) | | | (10,333 | ) | | | (9,546 | ) |
Total funds under management | | $ | 133,199 | | | $ | 122,127 | | | $ | 114,451 | |
| 9 | Based on quarterly sales survey by LIMRA, an insurance industry organization, for the year ended December 31, 2012. |
| 10 | Based on IFIC report of mutual fund assets for top 30 fund companies in Canada, dated December 31, 2012. |
| | | | |
| 22 Manulife Financial Corporation 2012 Annual Report | | Management’s Discussion and Analysis | | |
Strategic Direction
Our vision is to be the premier broad-based, diversified financial services company in Canada, empowering our customers to prepare for their future with confidence by providing them with a comprehensive suite of financial solutions to support their most significant financial decisions. During 2012, we realigned our organization to facilitate a more holistic approach by strengthening our focus on providing comprehensive financial solutions and to provide a more consistent experience for our customers. Canadian Division businesses are now aligned into three pillars: Retail; Institutional; and Banking.
Through our broad product line, strong distribution network and high level of customer service, we have built a large customer base and leading market positions in our core businesses. We will continue to leverage these strengths and in 2012 began to realign our businesses to further enhance our customer focus. We will focus on maintaining market leading positions in our core businesses, while leveraging our strong track record to launch and grow new businesses and investing to grow lower risk, less capital intensive businesses such as Manulife Bank, Manulife Mutual Funds, Group Retirement Solutions, Affinity Markets, and our Group Benefits small business segment.
Over the past four years, we have made substantial progress in moderating our risk profile by hedging equity and interest rate exposures, as well as through product design and repricing. As a result, we have reduced the proportion of insurance and variable annuity sales coming from guaranteed, long-duration products. We have also used reinsurance opportunistically to manage risks and reduce capital requirements.
The number of affluent Canadians is increasing as the baby boomer generation ages which, together with the continuing focus of employers and governments on reducing the cost of benefits, creates opportunities for solutions focused on income growth and safety of investments, inter-generational wealth transfer and managing health care costs. These are all areas in which we excel. We will continue to focus on this target market, enhancing our suite of financial solutions to meet the evolving needs of Canadians.
We will continue to build on our reputation for product leadership with a focus on integrated solutions to meet Canadians’ diverse needs. We continue to increase our focus on risk protection products with lower long-duration risk, including expanding into the mid-market consumer segment with term products and Synergy, our innovative three-in-one product that combines life, disability and critical illness insurance coverage. In 2012 we enhanced our fund platform, launching Manulife Private Investment Pools, a suite of funds aimed at affluent retail investors. In addition, we introduced Manulife Private Wealth, bringing together our expertise in banking, investments, advisory services, and estate planning to provide comprehensive personalized services to high net worth customers. Our product shelf now spans the investor spectrum, ranging from those who are just starting out, to established individuals and families with significant wealth.
In the group benefits and retirement market, we will continue to support employers in providing cost effective options to their employees, leveraging our strong market positioning. We will continue to work closely with governments and industry representatives in the development of the new Pooled Registered Pension Plan (PRPP), aimed at Canadians who do not have access to a workplace pension plan.
With over 74,000 licensed advisors and 650 Manulife sales professionals supporting them, we serve one in five Canadians. We will continue to nurture and expand relationships with our advisors. Key to success is our commitment to provide broad-based, competitive solutions, as well as efficient support to advisors to help their businesses thrive. We will continue to invest in the industry-leading professional value-added services provided by our tax and estate planning teams, as well as the wholesaler teams who market our product and sales solutions to advisors. We will also continue to develop our cross-selling and direct-to-consumer marketing capabilities.
Service quality is important in all our businesses, supporting both sales growth and customer retention. We closely monitor customer and advisor feedback to proactively improve their service experience. We continue to invest in developing e-services such as mobile and web applications, as well as improving our infrastructure and expanding capacity in our high growth businesses. We also continue to make service improvements across the Division through increased automation of customer touch-points, elimination of legacy systems, process improvement initiatives and pursuit of outsourcing and off-shoring opportunities.
| | | | |
| | Management’s Discussion and Analysis | | Manulife Financial Corporation 2012 Annual Report 23 |
U.S. Division
U.S. Division offers a diverse range of protection and savings products.
U.S. Insurance provides life and long-term care insurance products and services to select markets. John Hancock Life (“JH Life”) offers a broad portfolio of insurance products, including universal, variable, whole and term life insurance designed to provide estate, business and retirement solutions for high net worth and emerging affluent markets. John Hancock Long-Term Care (“JH LTC”) provides products offering care advisory services and support and financial resources that help cover the cost of long-term care in the event of an illness, accident, or through the normal effects of aging. Our long-term care products are designed for the middle income to affluent markets.
U.S. Wealth Management offers a broad range of personal and family oriented wealth management products and services focused on individuals and business markets, as well as institutional oriented products for employee benefit plan funding solutions. Within our John Hancock Wealth Asset Management, John Hancock Retirement Plan Services (“Retirement Plan Services”) provides 401(k) plans to small and medium-sized businesses and John Hancock Mutual Funds (“Mutual Funds”) offers a variety of mutual funds and 529 College Savings plans. The Annuity business manages an in-force block of fixed deferred annuities, variable deferred annuities and payout annuity products including single premium immediate annuities, participating pensions, pension close-outs and structured settlement contracts.
U.S. Division distributes its products through a multi-channel network, including brokerage general agents, producer groups, banks, wirehouses and broker-dealers as well as John Hancock Financial Network (“JHFN”), a national network of independent career agencies comprised of 1,600 financial representatives across the U.S., offering insurance and wealth management solutions to individuals, families and businesses.
In 2012, U.S. Division contributed 48 per cent of the Company’s total premiums and deposits and, as at December 31, 2012, accounted for 55 per cent of the Company’s funds under management.
Financial Performance
U.S. Division reported net income attributed to shareholders of US$1,918 million for 2012 compared to US$614 million for 2011. Core earnings were US$1,088 million in 2012 compared with US$1,018 million in 2011. Excluded from core earnings in 2012 were net gains of US$830 million (2011 – losses of US$404 million). These net gains comprised other investment related gains of US$1,021 million (2011 – US$871 million), tax items related to uncertain tax positions (discussed in the Financial Performance section of this report) of US$173 million, gains related to experience on hedged variable annuity guarantee liabilities of US$123 million (2011 – losses of US$857 million) and losses of US$487 million related to the direct impact of equity markets and interest rates (2011 – losses of US$418 million).
Core earnings of US$1,088 million for 2012 increased US$70 million compared with 2011. Contributing to the increase were improved new business margins and business mix, a lower effective tax rate as we released provisions for uncertain tax positions mentioned above and higher fees from higher assets on the Wealth Management business, partially offset by unfavourable policyholder experience.
In line with the 2010 in-force repricing efforts in our JH LTC business, the Company filed for premium rate increases with 50 state regulators. The rate increases requested average approximately 40 per cent on the majority of our in-force retail and group business. As at December 31, 2012, approvals have been received from 43 states.
On a Canadian dollar basis, the net income attributed to shareholders for 2012 was $1,911 million compared to $621 million in 2011.
| | | | |
| 24 Manulife Financial Corporation 2012 Annual Report | | Management’s Discussion and Analysis | | |
The table below reconciles core earnings to net income attributed to shareholders for U.S. Division for 2012, 2011 and 2010.
| | | | | | | | | | | | | | | | | | | | | | | | | | | | |
For the years ended December 31, ($ millions) | | Canadian $ | | | | | US $ |
| | 2012 | | | 2011 | | | 2010 | | | | | 2012 | | | 2011 | | | 2010 | | | |
Core earnings(1) | | $ | 1,085 | | | $ | 1,005 | | | $ | 1,051 | | | | | $ | 1,088 | | | $ | 1,018 | | | $ | 1,019 | | | |
Items to reconcile core earnings to net income attributed to shareholders: | | | | | | | | | | | | | | | | | | | | | | | | | | | | |
Investment gains related to fixed income trading, market value increases in excess of expected alternative assets investment returns, asset mix changes and credit experience | | | 1,018 | | | | 857 | | | | 485 | | | | | | 1,021 | | | | 871 | | | | 467 | | | |
Impact of release of tax reserves and major reinsurance transactions(2) | | | 171 | | | | – | | | | – | | | | | | 173 | | | | – | | | | – | | | |
Income (charges) on variable annuity guarantee liabilities that are dynamically hedged(3) | | | 121 | | | | (844 | ) | | | (175 | ) | | | | | 123 | | | | (857 | ) | | | (167 | ) | | |
Direct impact of equity markets and interest rates(4) | | | (484 | ) | | | (397 | ) | | | (777 | ) | | | | | (487 | ) | | | (418 | ) | | | (749 | ) | | |
Net income attributed to shareholders | | $ | 1,911 | | | $ | 621 | | | $ | 584 | | | | | $ | 1,918 | | | $ | 614 | | | $ | 570 | | | |
| (1) | Core earnings is a non-GAAP measure. See “Performance and Non-GAAP Measure” below. |
| (2) | The US$173 million net gain for impact of release of tax reserves and major reinsurance transactions in 2012 includes US$172 million due to an updated assessment of prior years’ uncertain tax positions and net gains of US$10 million on the Life recapture transaction offset by net losses of US$9 million on the fixed deferred annuity reinsurance transactions. |
| (3) | Our variable annuity guarantee dynamic hedging strategy is not designed to completely offset the sensitivity of policy liabilities to all risks associated with the guarantees embedded in these products. The amount of variable annuity guaranteed value that was dynamically hedged at the end of 2012 was 60 per cent. |
| (4) | The direct impact of equity markets and interest rates is relative to our policy liability valuation assumptions and includes changes to interest rate assumptions. |
Sales
In 2012, U.S. Division achieved record sales in our mutual fund and 401(k) businesses and continued to achieve success in our product repositioning strategy in a low interest rate environment. Through product redesign, repricing and business repositioning, we have reduced the equity and interest rate risk and earnings sensitivity of our product portfolio, while we continue to invest in the growth of fee-based products with lower capital requirements and higher return potential, including our 401(k), mutual fund and lower risk Insurance products. We are seeing the desired impact of these actions on our product sales mix with a continued shift away from guaranteed long-duration products in 2012.
U.S. Division sales for 2012 for insurance products were US$599 million, US$26 million or four per cent lower than 2011. Sales in JH Life increased 12 per cent. JH LTC sales declined by 61 per cent as a result of actions to increase prices and exit certain product segments as well as the non-recurrence of the 2011 open enrollment period in the Federal Long Term Care plan.
U.S. Division sales of wealth management products were US$20.2 billion, US$604 million or three per cent higher than 2011. Wealth Asset Management sales increased by 13 per cent, driven by record sales in our mutual fund and 401(k) businesses and were partially offset by the decision to stop sales of fixed and variable deferred annuities.
Sales
| | | | | | | | | | | | | | | | | | | | | | | | | | | | |
For the years ended December 31, ($ millions) | | Canadian $ | | | | | US $ |
| | 2012 | | | 2011 | | | 2010 | | | | | 2012 | | | 2011 | | | 2010 | | | |
Insurance products | | $ | 599 | | | $ | 619 | | | $ | 807 | | | | | $ | 599 | | | $ | 625 | | | $ | 784 | | | |
Wealth management products | | | 20,193 | | | | 19,384 | | | | 19,229 | | | | | | 20,213 | | | | 19,609 | | | | 18,676 | | | |
Premiums and Deposits
U.S. Division total premiums and deposits for 2012 were US$36.0 billion, US$1.2 billion or three per cent higher than 2011.
Premiums and deposits for 2012 for insurance products were US$7.2 billion, US$0.1 billion higher than 2011. Growth in variable life deposits and the impact of the in-force repricing of long-term care products were mostly offset by the impact of the termination of a reinsurance assumed contract in JH Life.
Premiums and deposits for 2012 for wealth management products were US$28.8 billion, US$1.1 billion or four per cent higher than 2011. The increase is consistent with the sales results discussed above.
Premiums and Deposits
| | | | | | | | | | | | | | | | | | | | | | | | | | | | |
For the years ended December 31, ($ millions) | | Canadian $ | | | | | US $ |
| | 2012 | | | 2011 | | | 2010 | | | | | 2012 | | | 2011 | | | 2010 | | | |
Insurance products | | $ | 7,165 | | | $ | 6,999 | | | $ | 7,266 | | | | | $ | 7,168 | | | $ | 7,070 | | | $ | 7,060 | | | |
Wealth management products | | | 28,779 | | | | 27,413 | | | | 27,451 | | | | | | 28,799 | | | | 27,737 | | | | 26,656 | | | |
Total premiums and deposits | | $ | 35,944 | | | $ | 34,412 | | | $ | 34,717 | | | | | $ | 35,967 | | | $ | 34,807 | | | $ | 33,716 | | | |
| | | | |
| | Management’s Discussion and Analysis | | Manulife Financial Corporation 2012 Annual Report 25 |
Funds under Management
U.S. Division funds under management as at December 31, 2012 were US$294.1 billion, up seven per cent from December 31, 2011. The increase was due to positive investment returns, the impact of lower interest rates on market value of funds under management and net sales in Wealth Asset Management, partially offset by surrender and benefit payments in JH Annuities and the transfer of US$7.2 billion of assets related to the fixed deferred annuity reinsurance transactions.
Funds under Management
| | | | | | | | | | | | | | | | | | | | | | | | | | | | |
As at December 31, ($ millions) | | Canadian $ | | | | | US $ |
| | 2012 | | | 2011 | | | 2010 | | | | | 2012 | | | 2011 | | | 2010 | | | |
General fund | | $ | 112,389 | | | $ | 114,939 | | | $ | 94,756 | | | | | $ | 112,963 | | | $ | 113,018 | | | $ | 95,271 | | | |
Segregated funds | | | 137,931 | | | | 129,581 | | | | 132,218 | | | | | | 138,635 | | | | 127,415 | | | | 132,935 | | | |
Mutual funds and other | | | 42,321 | | | | 35,063 | | | | 32,812 | | | | | | 42,536 | | | | 34,475 | | | | 32,990 | | | |
Total funds under management | | $ | 292,641 | | | $ | 279,583 | | | $ | 259,786 | | | | | $ | 294,134 | | | $ | 274,908 | | | $ | 261,196 | | | |
Strategic Direction
U.S. Division continues to make substantive progress towards our strategic priority of continuing to grow our higher ROE, lower risk businesses. Our focus is on building a leading company in the U.S. that helps Americans with their retirement, long-term care and estate planning needs. We are leveraging our trusted brand, diverse and broad distribution, and core business strength of product innovation to profitably grow our de-risked insurance and wealth management franchises.
JH Life maintains its industry leading distribution franchise while transitioning away from guaranteed products. Our new product portfolio continues to be successful in the marketplace and in 2012 we entered the rapidly growing indexed universal life insurance market with a product that provides clients the potential to participate in equity market returns. JH Life intends to build on this success with new products and to leverage and expand our strong distribution relationships, innovative underwriting and new business processes and service to support profitable growth.
JH LTC products are designed to meet the needs of consumers arising from major gaps in U.S. social programs. We continue to work on new product design ideas that make sense in light of the low interest rate environment, while also addressing affordability of coverage and filling a gap in customers’ retirement planning. Benefit Builder, our newest product, offers an innovative alternative to traditional inflation options.
U.S. Wealth Asset Management’s strategy focuses on a diverse product line-up, strong investment performance, our strong and trusted brand name, industry leading distribution excellence, innovative financial solutions and superior customer service.
Mutual Funds’ plans to enhance investment options through new product offerings managed by both John Hancock Asset Management and non-affiliated investment managers, and to further broaden and diversify our investment management platform. In addition, we plan to expand our penetration of institutional distributors by leveraging a strong product line and recent success in adding our funds to strategic partner recommended lists. We will continue to drive growth through expanded distribution relationships such as Edward Jones where we recently attained Preferred Fund Family status. Our retail distribution support includes national wirehouse firms, financial planners and regional/financial institutions. Our institutional distribution capacity includes Defined Contribution Investment Only, Registered Investment Advisors and managed money platforms.
Retirement Plan Services plans to maintain its strong market position in the core 401(k) small plan market segment and expand into the mid-market segment. In 2012, we launched a new mutual fund-based product and a full service group annuity product in the mid-market segment. This included new technology to support our service focus and innovative product features and benefits. Going forward, we will continue to leverage core strengths including service excellence, participant enrollment and education, distribution and field infrastructure to drive success in this market segment. In addition, the business will continue to drive growth in the 401(k) roll-over service center, expanding capabilities in educating our customers on their options during employment transitions with the goal of increasing customer retention.
Our Wealth Management businesses continue to leverage the John Hancock Lifestyle and Target Date portfolios. As of December 31, 2012, John Hancock was the fourth largest manager of assets in the U.S. for Lifestyle and Target Date funds offered through retail mutual funds and variable insurance products.11
In 2012, we closed our annuity business to new fixed and variable deferred annuity sales and, in March 2013, we closed new sales of our remaining annuity products including single premium and structured settlements. Providing excellent service, particularly as more of our annuity clients are entering the income phase of their life, continues to be our focus.
JHFN has consistently been a top distributor with 15 per cent share of sales in both of our insurance businesses. JHFN continues to build out its platforms to support growth in wealth management sales including the development of a fee-based managed account platform that leverages John Hancock Asset Management expertise and introducing several competitive advantages for representatives who are active in the 401(k) or Retirement Plan Services market. We continue to invest in this enterprise that provides meaningful and diversified distribution opportunities to support our growth in the Retirement Planning and Insurance markets.
We continue to leverage our strong John Hancock brand and pursue opportunities to drive the efficiency and effectiveness of our operations.
| 11 | Source: Strategic Insight. Includes Lifestyle and Lifecycle (Target Date) mutual fund assets and fund-of-funds variable insurance product assets (variable annuity and variable life). |
| | | | |
| 26 Manulife Financial Corporation 2012 Annual Report | | Management’s Discussion and Analysis | | |
Corporate and Other
Corporate and Other is comprised of investment performance on assets backing capital, net of amounts allocated to operating divisions and financing costs, Investment Division’s external asset management business (Manulife Asset Management), our Property and Casualty (“P&C”) Reinsurance business as well as our run-off reinsurance business lines including variable annuities and accident and health. Also included are the results of the Life Retrocession business prior to its sale in 2011.
For segment reporting purposes the impact of updates to actuarial assumptions, settlement costs for macro equity hedges and other non-operating items are included in this segment’s earnings.
As at December 31, 2012, Corporate and Other contributed 11 per cent of the Company’s premiums and deposits and as at December 31, 2012, accounted for five per cent of the Company’s funds under management.
Financial Performance
Corporate and Other reported a full year net loss attributed to shareholders of $3,313 million in 2012 compared to a net loss of $1,371 million in 2011. Core losses were $696 million in 2012 and $623 million in 2011 and both years included $200 million of total company core investment gains reported in core earnings.
Excluded from 2012 core losses were net charges of $2,617 million. Of this amount, $1,215 million related to the direct impact of equity markets and interest rates, largely comprising net experience losses from the macro equity hedges and charges due to lower URR assumptions used in the valuation of policy liabilities, $1,081 million related to changes in actuarial methods and assumptions, other than URR, $200 million related to a goodwill impairment charge and $200 million was the offset to investment gains classified as core earnings. The charges were partially offset by gains of $79 million largely related to mark-to-market investment gains and tax related items, partially offset by restructuring charges.
The $73 million increase in full year core losses was due to: increased amortization of investment losses on the Company’s pension plans, lower investment income due to a combination of declining interest rates and lower average assets, higher business development expenses and higher expected macro hedging. Partially offsetting these items were the non-recurrence of $151 million P&C reinsurance charges in 2011 related to the Japan earthquake and tsunami, the subsequent release in 2012 of $44 million in excess provisions related to these events and lower accrued interest on tax provisions.
The charges related to changes in actuarial methods and assumptions are outlined in the Critical Accounting and Actuarial Policies section below.
The table below reconciles core earnings to net loss attributed to shareholders for Corporate and Other for 2012, 2011 and 2010.
| | | | | | | | | | | | | | |
For the years ended December 31, (C$ millions) | | 2012 | | | 2011 | | | 2010 | | | |
Core losses excluding expected cost of macro hedges and core investment gains(1) | | $ | (407 | ) | | $ | (415 | ) | | $ | (59 | ) | | |
Expected cost of macro hedges | | | (489 | ) | | | (408 | ) | | | (34 | ) | | |
Core investment gains | | | 200 | | | | 200 | | | | 200 | | | |
Total core earnings (losses)(1) | | $ | (696 | ) | | $ | (623 | ) | | $ | 107 | | | |
Items to reconcile core earnings to net loss attributed to shareholders: | | | | | | | | | | | | | | |
Direct impact of equity markets and interest rates(2) | | $ | (1,215 | ) | | $ | 480 | | | $ | 175 | | | |
Change in actuarial methods and assumptions, excluding ultimate reinvestment rate (“URR”) | | | (1,081 | ) | | | (751 | ) | | | (1,766 | ) | | |
Goodwill impairment charge | | | (200 | ) | | | (665 | ) | | | (2,330 | ) | | |
Investment gains/losses related to fixed income trading, market value increases in excess of expected alternative assets investment returns, asset mix changes, credit experience and the offset to “core investment gains” | | | (126 | ) | | | (115 | ) | | | (247 | ) | | |
Restructuring charges | | | (57 | ) | | | – | | | | – | | | |
Impact of tax changes and business dispositions | | | 62 | | | | 303 | | | | – | | | |
Net loss attributed to shareholders | | $ | (3,313 | ) | | $ | (1,371 | ) | | $ | (4,061 | ) | | |
| (1) | Core earnings (losses) is a non-GAAP measure. See “Performance and Non-GAAP Measures” below. |
| (2) | The direct impact of equity markets and interest rates is relative to our policy liability valuation assumptions and includes changes to interest rate assumptions. Also included are gains and losses on derivatives associated with our macro equity hedges. We also include gains and losses on the sale of AFS bonds as management may have the ability to partially offset the direct impacts of changes in interest rates reported in the liability segments. |
Premiums and Deposits
Premiums and deposits were $8.0 billion for 2012, up 126 per cent from $3.5 billion reported in 2011. This increase primarily reflects the impact of new institutional asset management mandates won by Manulife Asset Management. Premiums declined in the Life Retrocession business due to the sale of that business in 2011.
| | | | |
| | Management’s Discussion and Analysis | | Manulife Financial Corporation 2012 Annual Report 27 |
Premiums and Deposits
| | | | | | | | | | | | | | |
For the years ended December 31, (C$ millions) | | 2012 | | | 2011 | | | 2010 | | | |
Life Retrocession | | $ | 2 | | | $ | 253 | | | $ | 491 | | | |
Property and Casualty Reinsurance | | | 95 | | | | 113 | | | | 75 | | | |
Institutional and other deposits | | | 7,880 | | | | 3,164 | | | | 2,907 | | | |
Total premiums and deposits | | $ | 7,977 | | | $ | 3,530 | | | $ | 3,473 | | | |
Funds under Management
Funds under management of $28.4 billion as at December 31, 2012 (December 31, 2011 – $26.6 billion) included assets managed by Manulife Asset Management on behalf of institutional clients of $28.8 billion (2011 – $23.8 billion) and $7.1 billion (2011 – $10.6 billion) of the Company’s own funds, partially offset by a $7.5 billion (2011 – $7.8 billion) total company adjustment related to the reclassification of derivative positions from invested assets to other assets and liabilities. The decline in the Company’s own funds primarily reflects an increase in assets allocated to the operating divisions and the impact of the stronger Canadian dollar.
Funds under Management
| | | | | | | | | | | | | | |
As at December 31, (C$ millions) | | 2012 | | | 2011 | | | 2010 | | | |
General fund | | $ | (221 | ) | | $ | 2,898 | | | $ | 10,924 | | | |
Segregated funds – elimination of amounts held by the Company | | | (166 | ) | | | (124 | ) | | | (148 | ) | | |
Institutional advisory accounts | | | 28,776 | | | | 23,778 | | | | 24,284 | | | |
Total funds under management | | $ | 28,389 | | | $ | 26,552 | | | $ | 35,060 | | | |
Strategic Direction
Our Property and Casualty Reinsurance business provides substantial retrocessional capacity for a very select clientele in the property and aviation reinsurance markets. The Company continues to monitor its exposure to natural catastrophes and manages such exposures in relation to the overall balance sheet risk and volatility.
The strategic direction for our Manulife Asset Management business is included in the Investment Division section that follows.
| | | | |
| 28 Manulife Financial Corporation 2012 Annual Report | | Management’s Discussion and Analysis | | |
Investment Division
The Investment Division has two major businesses – management of the Company’s General Fund investments and Manulife Asset Management, a leading global asset management business.
The General Fund is comprised of a broad range of investments including public and private bonds, public and private equities, mortgages, real estate, power and infrastructure, oil and gas, timberland and farmland properties. Our investment philosophy for the General Fund is to develop an asset mix that optimizes our risk adjusted returns and matches the characteristics of our underlying liabilities.
Manulife Asset Management’s mission is to provide strong, reliable, trustworthy and forward-thinking investment management solutions to our clients globally. We serve our retail clients through Manulife’s and John Hancock’s Wealth Management groups, and directly serve institutional clients such as pension plans, foundations, endowments and financial institutions. Operating in 17 countries and territories around the world, our investment solutions encompass Public Markets, including Fixed Income and Equities as well as Real Assets (including real estate, power and infrastructure, timberland, private equity, oil and gas and farmland). We empower our investment professionals to deliver superior long-term performance based on proprietary fundamental research in a deeply resourced, team-based, highly disciplined and service-oriented operation.
General Fund Investment Philosophy
Our investment philosophy employs a bottom-up approach which combines our strong asset management skills with an in-depth understanding of the characteristics of each investment. As outlined below, we are not limited to fixed income investments but rather have a diversified blend of assets, including a variety of alternative long-duration asset classes, which provides a distinctive positioning. This diversification strategy has historically produced superior risk adjusted returns while reducing overall risk. We use a disciplined approach across all asset classes, and we do not chase yield in the riskier end of the fixed income market. Our risk management strategy is outlined in the Risk Management section below. This strategy has resulted in a well-diversified, high quality investment portfolio which continues to deliver strong and steady investment experience gains.
General Fund Assets
As at December 31, 2012, our General Fund invested assets totaled $229.9 billion compared to $226.5 billion at the end of 2011. The asset strategies are diversified by class, geography and sector.
The following charts show the asset class composition as at December 31, 2012 and December 31, 2011.
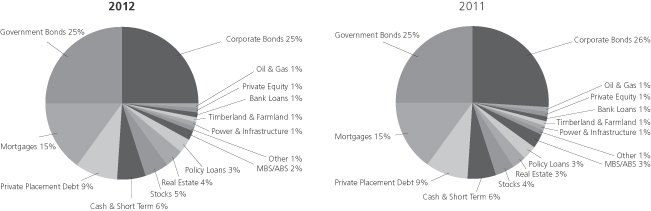
Public Bonds and Private Placement Debt
We manage our high quality fixed income portfolio to optimize yield and quality while ensuring that the asset portfolio remains diversified by sector, industry, duration, issuer and geography.
As at December 31, 2012, the public bond and private placement debt portfolio of $139.6 billion (2011 – $140.8 billion) was 95 per cent investment grade and 76 per cent was A or higher rated (2011 – 95 and 77 per cent, respectively). The percentage of AAA-rated public bonds and private placement debt was 29 per cent (2011 – 30 per cent). The private placement debt holdings provide diversification benefits (issuer, industry and geography) and, because they often provide stronger protective covenants and collateral than public bonds, they typically provide better credit protection and potentially higher recoveries in the event of default.
| | | | |
| | Management’s Discussion and Analysis | | Manulife Financial Corporation 2012 Annual Report 29 |
The following charts provide information on the credit quality of these assets as at December 31, 2012 and December 31, 2011.
Public Bonds and Private Placement Debt – Credit Quality
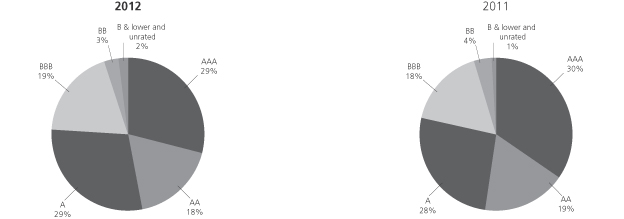
Public Bonds and Private Placement Debt – Diversification
| | | | | | | | | | | | | | | | | | | | | | | | | | | | | | |
As at December 31, Per cent of carrying value | | 2012 | | | | 2011 |
| | Public | | | Private
placement
debt | | | Total | | | | | | | Public | | | Private
placement
debt | | | Total | | | |
Government and agency | | | 48 | | | | 10 | | | | 42 | | | | | | | | 47 | | | | 11 | | | | 42 | | | |
Financial | | | 15 | | | | 11 | | | | 15 | | | | | | | | 16 | | | | 10 | | | | 15 | | | |
Telecommunications | | | 2 | | | | 1 | | | | 2 | | | | | | | | 2 | | | | – | | | | 2 | | | |
Utilities | | | 11 | | | | 38 | | | | 15 | | | | | | | | 11 | | | | 33 | | | | 14 | | | |
Energy | | | 7 | | | | 8 | | | | 7 | | | | | | | | 6 | | | | 9 | | | | 6 | | | |
Industrial | | | 5 | | | | 8 | | | | 5 | | | | | | | | 4 | | | | 10 | | | | 5 | | | |
Securitized (MBS/ABS) | | | 3 | | | | – | | | | 3 | | | | | | | | 5 | | | | – | | | | 4 | | | |
Consumer (non-cyclical) | | | 4 | | | | 12 | | | | 5 | | | | | | | | 4 | | | | 12 | | | | 5 | | | |
Consumer (cyclical) | | | 1 | | | | 6 | | | | 2 | | | | | | | | 1 | | | | 6 | | | | 2 | | | |
Basic materials | | | 2 | | | | 5 | | | | 2 | | | | | | | | 2 | | | | 8 | | | | 3 | | | |
Technology | | | 1 | | | | – | | | | 1 | | | | | | | | 1 | | | | – | | | | 1 | | | |
Media and internet | | | 1 | | | | 1 | | | | 1 | | | | | | | | 1 | | | | 1 | | | | 1 | | | |
Total per cent | | | 100 | | | | 100 | | | | 100 | | | | | | | | 100 | | | | 100 | | | | 100 | | | |
Total carrying value (C$ billions) | | $ | 119.3 | | | $ | 20.3 | | | $ | 139.6 | | | | | | | $ | 120.5 | | | $ | 20.3 | | | $ | 140.8 | | | |
As at December 31, 2012, gross unrealized losses on our public bond and private placement debt holdings were $0.7 billion or one per cent of the amortized cost of these holdings (2011 – $1.3 billion or one per cent). Of this amount, $160 million (2011 – $360 million) relates to bonds trading below 80 per cent of cost for more than six months. Securitized assets represented $116 million of the gross unrealized losses and $80 million of the amounts trading below 80 per cent of amortized cost for more than six months (2011 – $355 million and $253 million, respectively). The following chart shows the decline in gross unrealized losses from December 31, 2011 to December 31, 2012.
Public Bonds and Private Placement Debt – Gross Unrealized Losses
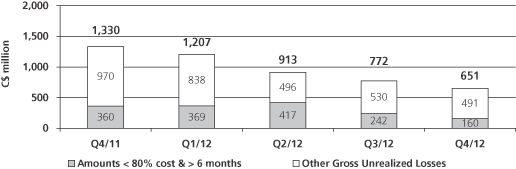
After adjusting for bonds held in the participating policyholder and other pass-through segments, as well as the provisions for credit included in the policy liabilities, the potential impact to shareholders’ pre-tax earnings for bonds trading at less than 80 per cent of amortized cost for greater than six months was approximately $93 million as at December 31, 2012 (2011 – $218 million).
| | | | |
| 30 Manulife Financial Corporation 2012 Annual Report | | Management’s Discussion and Analysis | | |
Securitized Assets
As at December 31, 2012, the Company had $3.8 billion of both public and private securitized assets representing two per cent of total invested assets (2011 – $5.7 billion and three per cent).
Commercial Mortgage Backed Securities (“CMBS”) holdings at December 31, 2012 were $1.6 billion (2011 – $3.4 billion), with approximately 80 per cent of holdings rated AAA, of which approximately 99 per cent are in the most senior class. By vintage or year of origination, 81 per cent of the CMBS holdings were from years 2005 and prior.
Residential Mortgage Backed Securities (“RMBS”) as at December 31, 2012 were $390 million (2011 – $407 million) of which $135 million were sub-prime and $32 million were Alt-A holdings.
Asset Backed Securities (“ABS”) holdings as at December 31, 2012 were $1.8 billion (2011 – $1.9 billion) and were both highly rated and well diversified by sector.
The following table outlines the securitized holdings by type and asset quality.
| | | | | | | | | | | | | | | | | | | | | | | | |
As at December 31, (C$ millions), Carrying value | | 2012 | | | | | 2011 | | | |
| | CMBS | | | RMBS | | | ABS | | | Total | | | | | Total | | | |
AAA | | $ | 1,275 | | | $ | 128 | | | $ | 1,325 | | | $ | 2,728 | | | | | $ | 4,462 | | | |
AA | | | 7 | | | | 66 | | | | 24 | | | | 97 | | | | �� | | 139 | | | |
A | | | 76 | | | | 22 | | | | 156 | | | | 254 | | | | | | 300 | | | |
BBB | | | 43 | | | | 48 | | | | 160 | | | | 251 | | | | | | 311 | | | |
BB & below | | | 198 | | | | 126 | | | | 147 | | | | 471 | | | | | | 522 | | | |
Total public and private securitized assets | | $ | 1,599 | | | $ | 390 | | | $ | 1,812 | | | $ | 3,801 | | | | | $ | 5,734 | | | |
Mortgages
As at December 31, 2012, mortgages represented 15 per cent (2011 – 15 per cent) of invested assets with 63 per cent of the mortgage portfolio invested in Canada (2011 – 60 per cent) and 37 per cent in the United States (2011 – 40 per cent). The overall portfolio is also diversified by geographic region, property type and borrower. 31 per cent (2011 – 32 per cent) of the total mortgage portfolio is insured, primarily by Canada Mortgage and Housing Corporation (“CMHC”), Canada’s AAA rated government backed national housing agency, with 61 per cent (2011 – 71 per cent) of residential mortgages insured and eight per cent (2011 – nine per cent) of commercial mortgages insured.
The following table shows the distribution of the carrying value of the mortgage portfolio by property type.
Mortgages
| | | | | | | | | | | | | | | | | | | | |
As at December 31, (C$ millions) | | 2012 | | | | | 2011 | | | |
| | Carrying value | | | % of total | | | | | Carrying value | | | % of total | | | |
Commercial | | | | | | | | | | | | | | | | | | | | |
Multi-family residential | | $ | 3,320 | | | | 9 | | | | | $ | 3,459 | | | | 10 | | | |
Retail | | | 5,689 | | | | 16 | | | | | | 5,816 | | | | 17 | | | |
Office | | | 5,169 | | | | 15 | | | | | | 5,688 | | | | 16 | | | |
Industrial | | | 2,394 | | | | 7 | | | | | | 2,888 | | | | 8 | | | |
Other commercial | | | 1,957 | | | | 6 | | | | | | 2,197 | | | | 6 | | | |
| | $ | 18,529 | | | | 53 | | | | | $ | 20,048 | | | | 57 | | | |
Manulife Bank single residential | | | 15,220 | | | | 43 | | | | | | 13,434 | | | | 38 | | | |
Agriculture | | | 1,333 | | | | 4 | | | | | | 1,541 | | | | 5 | | | |
Total mortgages | | $ | 35,082 | | | | 100 | | | | | $ | 35,023 | | | | 100 | | | |
Commercial mortgages have been conservatively underwritten and accounted for 53 per cent (2011 – 57 per cent) of total mortgages. Geographically, 37 per cent are in Canada and 63 per cent in the United States. We are well diversified by property type and largely avoid risky segments of the market such as hotels, construction loans and second liens. As noted in the table below, the mortgages have low loan-to-value ratios, high debt-service coverage ratios and very few loans are in arrears.
Non-CMHC Insured Commercial Mortgages(1),(2)
| | | | | | | | | | | | | | | | | | | | |
| As at December 31, | | 2012 | | | | | 2011 |
| | Canada | | | U.S. | | | | | Canada | | | U.S. | | | |
Loan-to-Value ratio(3) | | | 59% | | | | 63% | | | | | | 61% | | | | 65% | | | |
Debt-Service Coverage ratio(3) | | | 1.48x | | | | 1.75x | | | | | | 1.48x | | | | 1.58x | | | |
Average duration | | | 2.8 years | | | | 5.5 years | | | | | | 2.9 years | | | | 5.1 years | | | |
Average loan size (C$ millions) | | | $ 4.9 | | | | $ 10.4 | | | | | | $ 4.8 | | | | $ 10.3 | | | |
Loans in arrears(4) | | | 0.01% | | | | 0.00% | | | | | | 0.08% | | | | 0.70% | | | |
| (1) | CMHC is Canada Mortgage and Housing Corporation, Canada’s AAA rated national housing agency. |
| (2) | Excludes Manulife Bank commercial mortgage loans of $23 million (2011 – $12 million). |
| (3) | Loan-to-Value and Debt-Service Coverage are based on re-underwritten cash flows. |
| (4) | Arrears defined as over 90 days past due in Canada and over 60 days past due in the U.S. |
| | | | |
| | Management’s Discussion and Analysis | | Manulife Financial Corporation 2012 Annual Report 31 |
Public Stocks
As at December 31, 2012, public stock holdings of $12.0 billion represented five per cent (2011 – $10.2 billion and four per cent) of invested assets. The composition of holdings by segment is outlined below. The portfolio is diversified by industry sector and issuer. Geographically, 33 per cent (2011 – 34 per cent) is held in Canada, 27 per cent (2011 – 29 per cent) is held in the U.S. and the remaining 40 per cent (2011 – 37 per cent) is held in Asia, Europe and other geographic areas.
Public Stocks – by segment
(C$ millions, unless otherwise stated)
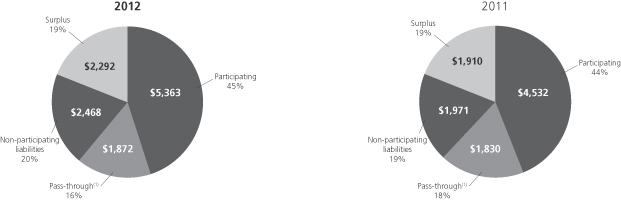
| (1) | Equities denoted as pass-through are held by the Company to support the yield credited on equity-linked investment funds for Canadian universal life products. |
Alternative Long-Duration Assets
This diverse range of asset classes has varying but largely uncorrelated characteristics. These are typically Real Assets representing investments in varied sectors of the economy which act as a hedge against future inflation and serve as an alternative source of asset supply to long-term Corporate bonds. As at December 31, 2012, alternative long-duration assets of $17.4 billion represented eight per cent (2011 – $15.0 billion and seven per cent) of invested assets. These investments are comprised of real estate, power and infrastructure, timberland, private equity, oil and gas and farmland. In addition to being a suitable match against our long-duration liabilities, these assets provide enhanced yields and diversification relative to traditional fixed income markets. The majority of our alternative long-duration assets are managed in-house.
The following table shows the distribution of the carrying value of the alternative long-duration assets portfolio by sector and/or asset type.
Alternative Long-Duration Assets
| | | | | | | | | | | | | | | | | | | | |
As at December 31, (C$ millions) | | 2012 | | | | | 2011 | | | |
| | Carrying value | | | % of total
carrying value | | | | | Carrying value | | | % of total
carrying value | | | |
Real estate | | | | | | | | | | | | | | | | | | | | |
Office | | $ | 6,168 | | | | 35 | | | | | $ | 5,296 | | | | 35 | | | |
Industrial | | | 614 | | | | 4 | | | | | | 585 | | | | 4 | | | |
Company use | | | 789 | | | | 5 | | | | | | 831 | | | | 6 | | | |
Other | | | 942 | | | | 5 | | | | | | 754 | | | | 5 | | | |
Total real estate | | $ | 8,513 | | | | 49 | | | | | $ | 7,466 | | | | 50 | | | |
Power and infrastructure | | | 2,913 | | | | 17 | | | | | | 2,507 | | | | 17 | | | |
Timberland | | | 2,136 | | | | 12 | | | | | | 1,527 | | | | 10 | | | |
Private equity | | | 1,761 | | | | 10 | | | | | | 1,474 | | | | 10 | | | |
Oil and gas | | | 1,355 | | | | 8 | | | | | | 1,292 | | | | 8 | | | |
Farmland | | | 754 | | | | 4 | | | | | | 762 | | | | 5 | | | |
Total alternative long-duration assets | | $ | 17,432 | | | | 100 | | | | | $ | 15,028 | | | | 100 | | | |
As at December 31, 2012, the fair value of total alternative long-duration assets was $18.2 billion (2011 – $15.8 billion).
Real Estate
The real estate portfolio is diversified by geographic region, with 56 per cent located in the U.S., 40 per cent in Canada and four per cent in Asia as at December 31, 2012 (December 31, 2011 – 56 per cent, 38 per cent and six per cent, respectively). The high quality
| | | | |
| 32 Manulife Financial Corporation 2012 Annual Report | | Management’s Discussion and Analysis | | |
portfolio has virtually no leverage and is primarily invested in premium urban office towers, concentrated in cities with stable growth and highly diverse economies in North America and Asia. The portfolio is well positioned with an average occupancy rate of 94.6 per cent (2011 – 94.2 per cent) and an average lease term of 6.1 years (2011 – 5.7 years).
Power & Infrastructure
Investments include electrical power generation, electricity transmission, water distribution, toll roads, ports, social infrastructure investments (including schools and hospitals), and midstream gas infrastructure assets (including gas gathering, transportation, distribution and storage). The portfolio is well diversified geographically with holdings predominantly in the U.S. and Canada, but also in the U.K., Western Europe, and Australia.
Timberland & Farmland
The Company’s timberland and farmland assets are managed by our proprietary Hancock Natural Resources Group (HNRG). In addition to being the largest institutional manager of timberland in the world with properties in the U.S., New Zealand and Australia, HNRG also manages farmland properties in the U.S., Australia and Canada. The General Fund’s timberland portfolio comprises 18 per cent of HNRG’s total timberland AUM. The farmland portfolio includes annual (row) crops, fruit crops, wine grapes, and nut crops. The Company’s holdings comprise 41 per cent of HNRG’s total farmland AUM.
Private Equities
Our portfolio includes both directly held private equity and private equity funds. Both are diversified across vintage years and industry sectors.
Oil & Gas
This category is comprised of our conventional Canadian oil and gas properties which are managed by NAL Resources, which is owned by the Company. Production mix in 2012 was approximately 53 per cent crude oil, 37 per cent natural gas, and 10 per cent natural gas liquids.
Other Invested Assets
As at December 31, 2012, other invested assets of $3.4 billion represented one per cent (2011 – $3.5 billion and one per cent) of invested assets. Other invested assets are comprised primarily of leases, affordable housing, and other miscellaneous invested assets.
Other Notable Items
As at December 31, 2012, our European public and private bond net exposure represented three per cent of fixed income assets or two per cent of total invested assets (2011 – three per cent and two per cent, respectively). Excluding par and pass-through segments and reflecting the cumulative impact of downgrades reflected in our policy liability valuation, our net sovereign, banks and other financials exposure to Ireland, Italy and Spain was limited to $31 million (2011 – $47 million). We do not have any public or private bond investments in Greece or Portugal. As at December 31, 2012, we had $118 million invested in Ireland ($18 million in financials and $100 million in other corporate investments), $13 million in Italian sovereigns and $58 million in Spanish corporate bonds. Other European exposures totaled $13 million of sovereigns, $1,016 million in the financial sector and $2,545 million in other sectors. The split by country was France – $583 million, U.K. – $921 million, Germany – $327 million and other parts of Europe – $1,741 million.
The Company began writing credit default swaps (“CDS”) in 2011. As outlined in the Risk Management and Risk Factors section, the Company does not employ leverage in its CDS program and, therefore, does not write CDS protection in excess of its government bond holdings. As at December 31, 2012, we had $264 million (2011 – $219 million) notional outstanding of CDS protection sold. All CDS decisions follow the same diligent underwriting standards as our cash bond portfolio and we believe the addition of this asset class allows us to better diversify our overall credit risk. Additionally, the Company does not take on any material credit or liquidity risk with its securities lending programs. The Company has avoided investing in any Structured Investment Vehicles, Constant Proportion Debt Obligations and U.S. Home Equity Lines of Credit that have resulted in significant losses to other institutions.
Manulife Asset Management
Assets Under Management
Total assets managed by Manulife Asset Management grew by $26.2 billion to $237.6 billion as at December 31, 2012 from $211.4 billion as at December 31, 2011. Assets managed for external clients grew by $23.3 billion to $201.4 billion during the same period. Our wealth management businesses’ strong distribution capabilities continued to deliver gross sales globally in a challenging marketplace.
Institutional sales for our Public Markets investment teams were driven by a series of sizable mandates in 2012 that were balanced across regions and asset classes. Our Asset Allocations Solutions have also contributed to year-over-year sales growth led by our market leading target-risk Lifestyle portfolios. We raised significant capital for our Real Asset investments in 2012 and deployed it across attractive new opportunities including timberland and agriculture.
| | | | |
| | Management’s Discussion and Analysis | | Manulife Financial Corporation 2012 Annual Report 33 |
Assets Under Management
| | | | | | | | | | | | | | |
As at December 31, (C$ millions) | | 2012 | | | 2011(2) | | | 2010 | | | |
Managed on behalf of Operating Divisions(1) | | $ | 173,998 | | | $ | 157,350 | | | $ | 157,314 | | | |
Managed on behalf of Institutional clients | | | 27,380 | | | | 20,773 | | | | 19,113 | | | |
Total Manulife Asset Management assets managed for external clients(3) | | $ | 201,378 | | | $ | 178,123 | | | $ | 176,427 | | | |
Managed on behalf of General Fund | | | 36,185 | | | | 33,323 | | | | 32,689 | | | |
Total Manulife Asset Management assets under management(3) | | $ | 237,563 | | | $ | 211,446 | | | $ | 209,116 | | | |
| (1) | Includes 49 per cent share of Manulife TEDA Fund Management Company Ltd., based on the joint venture ownership structure. |
| (2) | Assets for 2011 have been restated for the transfer of Private Client Group assets from Managed on behalf of Operating Divisions to Managed on behalf of Institutional clients. |
| (3) | An additional $2,833, $4,356, and $5,148 in 2012, 2011 and 2010, respectively, in assets were managed for external clients by Investment Division Affiliates in addition to Manulife Asset Management assets. |
Assets Under Management – Manulife Asset Management
(C$ millions, unless otherwise stated)
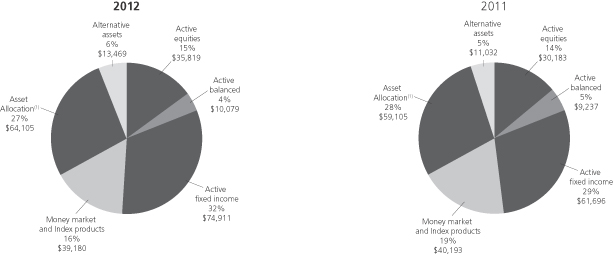
| (1) | Asset Allocation excludes $35,620 and $31,149 internally managed underlying funds in 2012 and 2011, respectively, already included in the other asset categories to avoid double-counting. |
Strategic Direction
Manulife Asset Management has made significant progress in delivering on its strategic initiatives in 2012. We now deliver more investment products, leveraging more strategies, from more teams, delivered to more client segments globally than ever before. The core of our continuing success is our strong investment performance. As at December 31, 2012, 74 per cent of our assets under management exceeded their benchmarks on a one-year basis. Over the longer term, our investment performance remained strong as 79 per cent and 71 per cent of our assets under management exceeded their benchmarks on a three-year and five-year basis, respectively.
For our Wealth Management Affiliates we delivered 65 funds rated Four- and Five-stars by Morningstar12 at year end, an increase of seven funds since December 31, 2011. In addition, we supported our Affiliates by tailoring and launching new products to meet retail investor demand in every region in which we operate. In Canada, we supported the launch of two new large initiatives in 2012, Manulife Private Wealth and Manulife Private Investment Pools. In the U.S., we leveraged our trust operations to support John Hancock Retirement Plan Services’ 401(k) initiative. In Asia and Japan, we supported our Affiliates via product and platform launches and deployment of key staff to the region to increase our responsiveness to retail client needs. In Japan, our joint efforts launched two differentiated products including a near record breaking initial public offering of a retail fund in November. In Malaysia, we supported the launch of a pension platform and similarly in Singapore, we helped launch an investment-linked plan platform.
Manulife Asset Management continued to earn awards for our strong investment capabilities in Asia. We were named the 2011 “Best Asian Bond House” by Asia Asset Management in January, and were subsequently honoured with a series of awards including two 2012 performance awards by Lipper Hong Kong, 2012 “Long-Only Fixed Income Fund Manager of the Year – Gold award” by The
| 12 | For each fund with at least a three year history, Morningstar calculates a Morningstar Rating based on a Morningstar Risk-Adjusted Return that accounts for variation in a fund’s monthly performance (including effects of sales charges, loads and redemption fees), placing more emphasis on downward variations and rewarding consistent performance. The top 10% of funds in each category, the next 22.5%, 35%, 22.5% and bottom 10% receive 5, 4, 3, 2 or 1 star, respectively. The Overall Morningstar Rating for a fund is derived from a weighted average of the performance associated with its three, five and 10 year (if applicable) Morningstar Rating metrics. Past performance is no guarantee of future results. The overall rating includes the effects of sales charges, loads and redemption fees, while the load-waived does not. Load-waived rating for Class A shares should only be considered by investors who are not subject to a front-end sales charge. |
| | | | |
| 34 Manulife Financial Corporation 2012 Annual Report | | Management’s Discussion and Analysis | | |
Asset Asian Awards, a 2012 Investment Performance Award by AsianInvestor, 2012 “Most Innovative Product” Award by Asia Asset Management, and “Best Shariah Equity Fund” by Majalah Investor. In addition to this industry recognition, our Aging Asia Research Series harnessed the insights of our investment professionals and economists to assist investors preparing for the financial implications of the region’s rapidly aging populations.
Going forward, we will continue to assert our strong Fixed Income, Equity, Asset Allocation, and Real Assets investment capabilities to address the needs of our clients worldwide. Our Public Market investment teams continue to focus on global and pan-regional public market offerings in search of attractive returns and diversification. In addition, we will further leverage our leading Asset Allocation franchise to deliver multi-asset class solutions to new markets. Within Real Asset investments, we will continue to pursue acquisitions globally while providing both retail and institutional clients with enhanced opportunities for access to these investments. Across all asset classes we will continue to attract investment management talent to broaden and deepen our capabilities while maintaining our focus on providing investment solutions driven by leading investment performance and rigorous risk containment.
| | | | |
| | Management’s Discussion and Analysis | | Manulife Financial Corporation 2012 Annual Report 35 |
Risk Management and Risk Factors
Overview
Manulife Financial is a financial institution offering insurance, wealth and asset management products and other financial services, which subjects the Company to a broad range of risks. We manage these risks within an enterprise-wide risk management framework. Our goal is to strategically optimize risk taking and risk management to support long-term revenue, earnings and capital growth. We seek to achieve this by capitalizing on business opportunities and strategies with appropriate risk/return profiles; establishing sufficient management expertise to effectively execute strategies, and to identify, understand and manage underlying inherent risks; pursuing strategies and activities aligned with the Company’s corporate and ethical standards and operational capabilities; pursuing opportunities and risks that enhance diversification; and, making risk taking decisions with analyses of inherent risks, risk controls and mitigations, and risk/return trade-off.
The enterprise risk management (“ERM”) framework sets out policies and standards of practice related to risk governance, risk identification, risk measurement, risk monitoring, and risk control and mitigation. With an overall goal of effectively executing risk management activities, we continuously invest to attract and retain qualified risk professionals, and to build, acquire and maintain the necessary processes, tools and systems.
Risk taking activities are managed against an overall risk appetite, which defines the amount and type of risks we are willing to assume. Our risk appetite reflects the Company’s financial condition, risk tolerance and business strategies. The quantitative component of our risk appetite establishes total Company targets defined in relation to economic capital, earnings at risk and regulatory capital required. We have further established targets for each of our principal risks to assist us in managing levels of exposures and risk profiles that are well diversified across risk categories. To facilitate the alignment of business strategies and plans with the Company’s overall risk management objectives, targets for certain principal risks are cascaded down to our operating divisions. Our qualitative risk appetite establishes Company-wide risk management objectives and sets out the conditions under which we will, and will not, assume risk.
Risk management programs are in place for each of our broad risk categories: strategic, market, liquidity, credit, insurance and operational. These programs incorporate policies and standards of practice that are aligned with those within the enterprise risk management framework, covering:
| n | | Assignment of risk management accountabilities across the organization; |
| n | | Philosophy and appetite related to assuming risks; |
| n | | Establishment of specific risk targets or limits; |
| n | | Delegation of authorities related to risk taking activities; |
| n | | Identification, measurement, assessment, monitoring and reporting of risks; and |
| n | | Activities related to risk control and mitigation. |
Risk Governance
The Board of Directors oversees the implementation by management of appropriate frameworks, processes and systems to identify and manage the principal risks of the Company’s business and periodically reviews and approves our enterprise risk policy, our risk taking philosophy and overall risk appetite.
The Chief Executive Officer (“CEO”) is directly accountable to the Board of Directors for all risk taking activities and risk management practices, and is supported by the Company’s Chief Risk Officer (“CRO”) as well as by the Executive Risk Committee (“ERC”). Together, they shape and promote our risk culture and guide risk taking throughout our global operations and strategically manage our overall risk profile. The ERC, along with other executive-level risk oversight committees, establishes risk policies, guides risk taking activity, monitors significant risk exposures and sponsors strategic risk management priorities throughout the organization. The Board and executive-level risk oversight committees and key elements of their mandates are presented below.
Corporate Risk Management (“CRM”), under the direction of the CRO, establishes and maintains our enterprise risk management framework and oversees the execution of individual risk management programs across the enterprise. CRM seeks to ensure a consistent enterprise-wide assessment of risk, risk-based capital and risk-adjusted returns across all operations.
Board of Directors & Board Committees
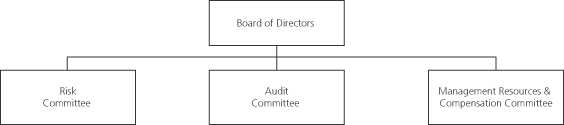
Risk Committee – This committee is responsible for assisting the Board in its oversight of the Company’s management of its principal risks. The committee also assesses, reviews and approves policies, procedures and controls in place to manage risks and reviews the Company’s compliance with risk policies.
| | | | |
| 36 Manulife Financial Corporation 2012 Annual Report | | Management’s Discussion and Analysis | | |
Audit Committee – This committee is responsible for assisting the Board in its oversight role with respect to the quality and integrity of financial information, the effectiveness of the Company’s internal controls over financial reporting and the effectiveness of the Company’s compliance with legal and regulatory requirements. It also oversees activities and risks related to conflicts of interest, confidentiality of information, customer complaints and related party transactions.
Management Resources and Compensation Committee– This committee oversees the Company’s global human resources strategy, policies, programs with a special focus on management succession, development and compensation and risk management relating to these programs.
Executive Committees
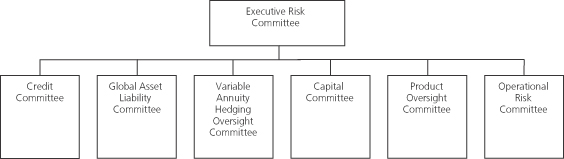
Executive Risk Committee– The ERC approves risk policies and oversees the execution of our enterprise risk management program. The committee monitors our overall risk profile, including key and emerging risks and guides risk-taking activities. As part of these activities, the ERC monitors material risk exposures, and sponsors strategic risk management priorities including overseeing risk reduction plans. The ERC also reviews and assesses the impact of business strategies, opportunities and initiatives on our overall risk position.
Credit Committee – The Credit Committee establishes credit risk policies and oversees credit risk management. The Credit Committee monitors our overall credit risk profile, key and emerging risk exposures and risk management activities and ensures compliance with credit risk policies. The committee also approves large individual credits and investments.
Global Asset Liability Committee (“GALCO”) – The GALCO establishes market and liquidity risk policies and oversees related market and liquidity risk and asset liability management programs and practices. The committee monitors our overall market risk profile, key and emerging risk exposures and risk management activities as well as compliance with related policies. GALCO also approves target investment strategies.
Variable Annuity Hedging Oversight Committee (“VAHOC”) – The VAHOC oversees global variable annuity dynamic hedging operations. The committee reviews and approves hedging strategies and operational policies and procedures. VAHOC also oversees hedge program performance and effectiveness and monitors compliance with related policies.
Capital Committee – The Capital Committee oversees our capital management policy framework and provides direction on strategic issues affecting our regulatory capital for all our operating companies. The committee considers and approves internal target regulatory capital ratios and capital structure for the Company.
Product Oversight Committee (“POC”) – The POC establishes product design and pricing policies and insurance risk policies, as well as risk management standards of practice with regards to risks covered by these policies. It oversees the insurance risk management program and the process for approval of new product initiatives and third party reinsurance arrangements for new business. The POC monitors product design and pricing, and insurance risk across the Company, as well as, oversees underwriting and claims risk committee activities, including retention management and underwriting and claims risk oversight.
Operational Risk Committee (“ORC”) – The ORC oversees operational risk exposures and associated governance and risk processes. It oversees the maintenance and enhancement of our overall Operational Risk Management Framework, including implementation of our Operational Risk Management Program and overseeing specific operational risk management programs and practices. The ORC reviews and approves operational risk policies and monitors compliance with such policies.
Risk Management Culture
A strong risk culture and a common approach to risk management are integral to our risk management practices. Our governance framework is centered on the “three lines of defense” model.
As the first line of defense, businesses are accountable for the risks within their unit including the day to day management of the risks and related controls. They are responsible for ensuring their business strategies align with the Company’s risk taking philosophy, risk appetite and culture, for thoroughly evaluating and managing risk exposures consistent with our enterprise risk policies and standards of practice, and for delivering returns commensurate with the level of risk assumed. Our businesses are supported by global risk managers and risk management professionals across the enterprise that are responsible for the design and execution of risk mitigation practices that are consistent with the Company’s policies and specific risk management strategies.
| | | | |
| | Management’s Discussion and Analysis | | Manulife Financial Corporation 2012 Annual Report 37 |
The second line of defense is comprised of the CRO, the Corporate Risk Management function, global oversight functions and divisional CRO’s functions. Together this group provides independent oversight of risk taking and risk mitigation activities across the enterprise. Enterprise-level risk oversight committees, including the ERC, also provide oversight of risk taking and risk mitigation activities.
As the third line of defense, Internal Audit provides independent analysis of whether controls are effective and appropriate relative to the risk inherent in the business, and whether risk mitigation programs and risk oversight functions are effective in managing risks.
Risk Identification, Measurement and Assessment
We have a common approach and process to identify, measure and assess the risks we assume. We evaluate all potential new business initiatives, acquisitions, product offerings, reinsurance arrangements, and investment and financing transactions on a comparable risk-adjusted basis. Business units and functional groups are responsible for identifying and assessing risks arising from business activities on an ongoing basis, as an integral component of business management processes. A standard inventory of risks is used in all aspects of risk identification, measurement and assessment, and monitoring and reporting.
Risk exposures are evaluated using a variety of risk measures, with certain measures used across all risk categories, while others apply only to some risks or a single risk type. Risk measurement includes: key risk indicators; stress tests, including sensitivity tests and scenario impact analyses; and stochastic scenario modeling. Qualitative risk assessments are performed for those risk types that cannot be reliably quantified.
We perform a variety of stress tests on earnings, regulatory capital ratios, economic capital, earnings at risk and liquidity that consider significant, but plausible events. Through our Dynamic Capital Adequacy Testing (“DCAT”), we stress test our regulatory capital adequacy over a five year projected timeframe, incorporating both existing and projected new business activities, under a number of plausible adverse scenarios. We also perform other integrated, complex scenario tests to assess key risks and the interaction of these risks.
Economic capital measures the amount of capital needed to meet obligations with a high and pre-defined confidence level. Our earnings at risk metric measures the potential variance from quarterly expected earnings at a particular confidence level. Economic capital and earnings at risk are both determined using internal models and measure enterprise-wide risks and are allocated by risk type and business. Economic capital and earnings at risk provide measures of enterprise-wide risk that can be aggregated, and compared, across business activities and risk types.
Risk Monitoring and Reporting
CRM oversees a formal process for monitoring and reporting on enterprise-wide risk exposures, discusses risk exposures with our various risk oversight committees, and submits requests for approval of any policy exceptions or remedial action plans, as required.
On a quarterly basis, the ERC, Board Risk Committee and Board of Directors review risk reports that present an overview of our overall risk profile and exposures across our principal risks. The reports incorporate both quantitative risk exposure measures and sensitivities and qualitative risk assessments. The reports also highlight key risk management activities and facilitate monitoring compliance with key risk policy targets and limits. The reports present information gathered through a formal risk identification and assessment process involving business unit general managers and their executive teams, as well as corporate executives overseeing global risk management of key risks. The ERC reviews key financial risk exposures and sensitivities at least monthly.
Our Group Chief Actuary presents the results of the DCAT to the Board of Directors annually. Our Internal Auditor reports the results of internal audits of risk controls and risk management programs to the Audit Committee semi-annually. Management reviews the implementation of key risk management strategies, and their effectiveness, with the Risk Committee annually.
Risk Control and Mitigation
Risk control activities are in place throughout the Company to mitigate risks to within approved risk targets or limits. We believe our controls, which include policies, procedures, systems and processes, are appropriate and commensurate with the key risks faced at all levels across the Company and such controls are an integral part of day to day activity, business management and decision making.
CRM establishes and oversees formal review and approval processes, involving independent individuals, groups or risk oversight committees, for product offerings, insurance underwriting, reinsurance, investment activities and other material business activities, based on the nature, size and complexity of the risk taking activity involved. Authorities for assuming risk at the transaction level are delegated to specific individuals based on their skill, knowledge and experience.
Risk mitigation activities, such as product and investment portfolio management, hedging, reinsurance and insurance protection are used to assist in managing our aggregate risk to within our risk appetite, targets and limits. Internal controls within the business units and corporate functions mitigate our exposure to operational risks.
The following sections describe the key risks and associated risk management strategies for each of our broad risk categories (strategic, market, liquidity, credit, insurance and operational).
Strategic Risk
Strategic risk is the risk of loss resulting from the inability to adequately plan or implement an appropriate business strategy, or to adapt to change in the external business, political or regulatory environment.
| | | | |
| 38 Manulife Financial Corporation 2012 Annual Report | | Management’s Discussion and Analysis | | |
Key Risk Factor Overview
We operate in highly competitive markets and compete for customers with both insurance and non-insurance financial services companies. Customer loyalty and retention, and access to distributors, are important to the Company’s success and are influenced by many factors, including our product features, service levels, prices, and our financial strength ratings and reputation. Erosion of our corporate image by adverse publicity, as a result of our business practices or those of our employees, representatives and business partners, may cause damage to our franchise value.
External business, economic, political, tax, legal, regulatory environments and changes to accounting or actuarial reserving standards can significantly impact the types, pricing and attractiveness of the products and services we offer. The economic environment may remain volatile and our regulatory environment, particularly in Canada, will continue to evolve, potentially with higher capital requirements which would materially impact our competitiveness. Further, the attractiveness of our product offerings relative to our competitors will be influenced by competitor actions as well as our own, and the requirements of the regulatory regimes we and they operate under. For these and other reasons, there is no certainty that we will be successful in implementing our business strategies or that these strategies will achieve the objectives we target.
Risk Management Strategy
The CEO and Executive Committee establish and oversee execution of business strategies, and have accountability to identify and manage the risks embedded in these strategies. They are supported by a number of processes:
| n | | Strategic business, risk and capital planning that is reviewed with the Board of Directors; |
| n | | Detailed strategic and business planning that is executed by divisional management and is reviewed by the CEO, the Chief Operating Officer, the Group Chief Financial Officer, the CRO and other members of the Executive Committee; |
| n | | Quarterly operational performance and risk reviews of all key businesses with the CEO and annual reviews with the Board of Directors; |
| n | | Risk-based capital attribution and allocation designed to encourage a consistent decision-making framework across the organization; and |
| n | | Review and approval of acquisitions and divestitures by the CEO and, where appropriate, the Board of Directors. |
The CEO and Executive Committee are ultimately responsible for our reputation; however, our employees and representatives are responsible for conducting their business activities in a manner that upholds our reputation. This responsibility is reinforced by:
| n | | An enterprise-wide reputation risk policy that specifies the oversight responsibilities of the Board and the responsibilities of executive management; |
| n | | Communication to and education of all directors, officers, employees and representatives, including our Code of Business Conduct and Ethics; |
| n | | Application of a set of guiding principles in conducting all our business activities, designed to protect and enhance our reputation; and |
| n | | Reputation risk assessments considered as part of business strategy development and execution. |
We regularly review and adapt our business strategies and plans in consideration of changes in the external business, economic, political, and regulatory environments in which we operate. Changes in actuarial reserving standards and changes in the cost of hedging may also cause us to review our business strategies and plans. Key elements of our business strategy include diversifying our business mix, accelerating growth of those products that have a favourable risk/return profile and better potential outcomes under a range of economic and policyholder behaviour scenarios, and reducing or withdrawing from products with unattractive risk profiles. Our strategy also incorporates a plan to continue to mitigate our in-force public equity and interest rate risks. Depending upon market conditions, these actions could result in costs which might depress income. We have designed our business plans and strategies to align with our risk appetite, capital and financial performance objectives.
The following is a further description of key strategic risk factors.
General Macro-Economic Risk Factors
Ongoing uncertainty surrounding the macro environment continues to impact financial market performance. In 2012, equity markets improved overall but remain volatile. Interest rates remained at historically low levels due to continuing monetary policy action and slow economic growth. Under the Canadian insurance accounting and regulatory capital regimes, the impact of the current market conditions are largely reflected in our current period results.
Weak or worsening economic conditions could result in further material charges to income and reductions in our capital position, notwithstanding our improved risk profile and strong underlying regulatory capital position.
In 2012, we revised our objective of $4 billion in net income by 2015 by roughly a year, and we are now targeting $4 billion in core earnings and core ROE of 13 per cent in 201613 based on our macro-economic and other assumptions. Our revised objective uses a core earnings target metric, which is consistent with measuring the underlying earnings capacity of our business.
Risk factors that may result in an inability to achieve our objectives include the following:
| n | | Actions taken by management to bolster capital and further reduce the Company’s risk profile and strengthen capital could reduce future earnings. In 2012, the Company reinsured 90 per cent of its U.S. fixed deferred annuity business and reinsured a portion of |
| 13 | See “Caution regarding forward-looking statements”. |
| | | | |
| | Management’s Discussion and Analysis | | Manulife Financial Corporation 2012 Annual Report 39 |
| | | our Japan insurance risk business. Additional actions that the Company may take to bolster near-term regulatory capital ratios or accelerate its plans to reduce equity market and interest rate exposures or to increase the amounts hedged could reduce earnings. |
| n | | A period of flat equity markets would represent underperformance relative to our long-term valuation assumption and would negatively impact earnings. In addition, as outlined below, there can be no assurance that our dynamic hedging strategy will fully offset the risks arising from the variable annuities being hedged. The publicly traded equity performance risk measures outlined below show the potential impact on net income attributed to shareholders resulting from an immediate 10, 20 and 30 per cent change in market values of publicly traded equities followed by a return to the expected level of growth assumed in the valuation of policy liabilities. Expected long-term annual market growth assumptions for public equities pre-dividends for key markets are based on long-term historical observed experience. In the stochastic valuations of our segregated fund guarantee business, those rates inclusive of dividends are 9.6% per annum in Canada, 9.6% per annum in the U.S., 6.3% per annum in Japan and vary between 7.8% and 9.85% per annum for European equity funds. The calibration of the economic scenario generators that are used to value segregated fund guarantee business complies with current actuarial Standards of Practice for the valuation of these products. Implicit margins are determined through stochastic valuation processes which results in lower net yields used to determine policy liabilities. Assumptions used for alternative assets backing liabilities are constrained by different Standards of Practice and are marginally lower than those used in stochastic valuations. Alternative asset return assumptions vary based on asset class but are largely consistent, after application of valuation margins and differences in taxation, with returns assumed for public equities. |
| n | | A prolonged low interest environment would result in charges related to lower fixed income ultimate reinvestment rate assumptions and an increase in new business strain. |
| | - | The fixed income ultimate reinvestment rate is based on five and ten year rolling averages of government bond rates. The potential impact on net income attributed to shareholders assuming government bond rates remain at December 31, 2012 levels or change by 50 basis points is outlined in the Critical Accounting and Actuarial Policies section of this report. |
| | - | In addition, the difference between the current investable returns and the returns used in pricing new business are generally capitalized when new business is written. Lower interest rates result in higher new business strain until products are re-priced or rates increase. |
| | - | Fixed income reinvestment rates other than the ultimate reinvestment rate are based on current market rates. The net income sensitivity to changes in current rates is outlined in the section “Interest Rate and Spread Risk” below. |
| n | | Other potential consequences of weak economic conditions include: |
| | - | Low interest rates could negatively impact sales. |
| | - | Lower sales volumes could put increased pressure on our ability to maintain operating expense levels within the levels provided for in the policy liability valuation and could result in lower future profit. |
| | - | Lower risk free rates tend to increase the cost of hedging, and as a result the offering of segregated fund guarantees could become uneconomic. |
| | - | The reinvestment of cash flows into low yielding AFS bonds could result in lower future earnings on surplus. |
| | - | A lower interest rate environment could be correlated with other macro-economic factors including unfavourable economic growth and lower returns on other asset classes. |
| | - | Lower interest rates could contribute to potential impairments of goodwill. |
| | - | A weak or declining economic environment could increase the value of guarantees associated with variable annuities, or embedded guarantees in other annuity or insurance products, and could result in future adverse policyholder behaviour experience. |
| | - | Lower interest rates could lead to lower mean bond parameters used for the stochastic valuation of segregated fund guarantees, resulting in higher policy liabilities. Reduced bond parameters could also be precipitated by updated Standards of Practice affecting returns in the tail segments as well as potential updates to bond calibration requirements in general. |
Regulatory and Capital Risk Factors
MFC is a holding company with no significant operations and its principal assets are the shares of its regulated insurance subsidiaries. These subsidiaries are subject to a wide variety of insurance and other laws and regulations that vary by jurisdiction and are intended to protect policyholders and beneficiaries first and foremost, rather than investors. These laws and regulations include regulatory restrictions which may limit the ability of subsidiary companies to pay dividends or make distributions to MFC.
Financial authorities and regulators in many countries are reviewing their capital requirements and implementing or considering various changes aimed at strengthening risk management and the capitalization of financial institutions. Future regulatory capital, actuarial and accounting changes could have a material adverse effect on the Company’s consolidated financial statements and regulatory capital both on transition and going forward. The impact of these changes remains uncertain but could lead to higher levels of capital going forward. These changes could also limit the ability of the insurance subsidiaries to pay dividends or make distributions and could have a significantly adverse effect on MFC’s capital mobility, including its ability to pay dividends to shareholders, buy back its shares and service its debt. We may be required to raise additional capital, which could be dilutive to existing shareholders, or to limit the new business we write, or to pursue actions that would support capital needs but adversely impact our subsequent earnings potential.
The Office of the Superintendent of Financial Institutions (“OSFI”) has been considering a number of changes, including establishing methodologies for evaluating standalone capital adequacy for Canadian operating life insurance companies, such as MLI, and updates to its regulatory guidance and disclosures for non-operating insurance companies acting as holding companies, such as MFC. OSFI has indicated that MCCSR and internal target capital ratio guidelines are expected to become applicable to MFC effective January 1, 2016. In addition, OSFI is evaluating possible changes to the capital requirements for segregated fund guarantees and for market, credit,
| | | | |
| 40 Manulife Financial Corporation 2012 Annual Report | | Management’s Discussion and Analysis | | |
insurance and operational risk. Changes in regulatory capital guidelines for banks under the Basel Accord or for European insurance companies under Solvency II may also have implications for Canadian insurance companies. The timing and outcome of these initiatives as well as various initiatives related to International Financial Reporting Standards (“IFRS”) are uncertain, and could have a significantly adverse impact on the Company or on our competitive position relative to that of other Canadian and international financial institutions with which we compete for business and capital.
Some recent examples of regulatory and professional standard developments which could impact our capital position are provided below.
| n | | Changes to U.S. statutory accounting practices concerning actuarial reserving standards for certain universal life products pursuant to Actuarial Guideline 38 have now been promulgated by the National Association of Insurance Commissioners (“NAIC”). The new requirements for in-force business will affect policies issued since July 1, 2005 and in-force on December 31, 2012. The implementation of this standard requires actuarial judgment and interpretation. To the extent that regulatory guidance emerges that is different than our interpretations it could have a material impact on our statutory policy liabilities and local capital position. |
| n | | On December 24, 2012, the Canadian Actuarial Standards Board (“ASB”) issued a Notice of Intent proposing to revise the Standards of Practice of the Canadian Institute of Actuaries with respect to the economic reinvestment assumptions and investment strategies utilized for long-tail liability cash flows under the Canadian asset liability method (“CALM”). The proposed changes are to incorporate calibration criteria for stochastic interest rate models used for CALM, to revise the deterministic scenarios to provide results comparable to those provided by the stochastic methodology, to establish maximum assumed net risk premiums which may include a possible revision to the 20 year horizon for reinvesting in corporate bonds and to establish limits on the extent to which investment in alternative assets can be assumed. Given the early stage of the ASB review, the net impact of any changes in actuarial standards on earnings and thus capital is unknown. |
| n | | Consistent with the high levels of regulatory activity internationally, the NAIC has been reviewing reserving and capital methodologies as well as the overall risk management framework. These reviews will affect U.S. life insurers, including John Hancock, and could lead to increased reserving and/or capital requirements for our business in the United States. |
| n | | In 2010 the International Accounting Standards Board (“IASB”) issued its Insurance Contracts (Phase II) Exposure Draft and the U.S. Financial Accounting Standards Board (“FASB”) issued its Insurance Contract Discussion paper. The IASB recently announced that it expects to issue a limited re-exposure draft in 2013 and the FASB announced it expects to issue an Exposure Draft in 2013. The final standards are not expected to be effective until 2018. |
The Dodd-Frank Wall Street Reform and Consumer Protection Act (“Dodd-Frank”)
Dodd-Frank Title VII in the United States establishes a new framework for regulation of over-the-counter (“OTC”) derivatives which could affect those activities of the Company which use derivatives for various purposes, including hedging equity market, interest rate and foreign currency exposures. Regulations promulgated by the U.S. Commodities Futures Trading Commission and the U.S. Securities and Exchange Commission under Dodd-Frank which take effect in 2013 require certain types of OTC derivative transactions to be executed through a centralized exchange or regulated facility and be cleared through a regulated clearinghouse. These new rules are expected to impose additional costs, including new capital and funding requirements, and additional regulation on the Company.
Derivative transactions executed through exchanges or regulated facilities will attract new incremental collateral requirements in the form of initial margin, and will require variation margin to be cash settled on a daily basis which increases liquidity risk for the Company. The increase in margin requirements combined with a more restricted list of securities that qualify as eligible collateral is expected to require us to hold larger positions in cash and treasuries, which would reduce income. Conversely, transactions executed through exchanges largely eliminate OTC counterparty credit risk but increase our exposure to the risk of an exchange or clearinghouse defaulting, and increased capital or margin requirements imposed on our OTC derivative counterparties could reduce our exposure to the counterparties’ default. In force derivative transactions will be grandfathered and could migrate to exchanges over time, or the Company may elect to accelerate the migration. Similar regulations in other jurisdictions we operate in are expected to become effective in 2013 and 2014. We cannot predict the effect of the legislation on our hedging costs, our hedging strategy or its implementation, or whether Dodd-Frank and similar regulations in other jurisdictions will lead to an increase or decrease in or change in composition of the risks we hedge.
In addition, pursuant to Dodd-Frank, on April 11, 2012, the Financial Stability Oversight Council (“FSOC”) issued its final rule that describes the manner in which FSOC will designate non-bank financial institutions as “systemically important” and the procedures FSOC will use in the designation process. If designated, the largest, most interconnected and highly-leveraged companies would face stricter prudential regulation, including higher capital requirements and more robust consolidated supervision. While the final rule specifies various quantitative thresholds for use in determining which non-bank financial institutions may be designated, FSOC has left open the possibility that a non-bank financial institution could be below the thresholds and still become subject to a designation as systemically important. Since the issuance of the final rule, FSOC has been reviewing non-bank financial institutions, but has made no designations to date. At this stage, OSFI has not announced similar rules.
International Financial Reporting Standards (“IFRS”)
The International Accounting Standards Board (“IASB”) and the U.S. Financial Accounting Standards Board (“FASB”) insurance contract project continue to work on a new insurance contract standard. While the IASB and FASB discuss common research papers, it is unlikely their final standards will be the same. In 2013 the IASB expects to issue a revised Exposure Draft which will include the full
| | | | |
| | Management’s Discussion and Analysis | | Manulife Financial Corporation 2012 Annual Report 41 |
text of the proposed standard but will limit questions to avoid re-opening issues which they believe have been sufficiently deliberated. The FASB is at a different stage in their standard setting process and is expected to issue a full Exposure Draft in 2013. The final standards are not expected to be effective until at least 2018.
We, along with other companies in the insurance industry from around the world, are providing feedback on the significant issues we see with the current draft proposals. To ensure the overall usefulness of the financial statements prepared under the new insurance contract standard and the new financial Instrument standards, we, along with other companies in the industry, are urging the IASB and FASB to ensure that appropriate testing is completed and would like full field testing by life insurance companies of these draft standards.
We believe the accounting rules under discussion could put Canadian insurers at a significant disadvantage relative to their U.S. and global peers, and also to the banking sector in Canada. These rules could also have adverse capital implications. The insurance industry in Canada is working with OSFI and the federal government with respect to the potential impact of these proposals on Canadian insurance companies, and the industry is urging policymakers to ensure that any future accounting and capital proposals appropriately consider the underlying business model of a life insurance company and, in particular, the implications for long-duration guaranteed products which are much more prevalent in North America than elsewhere.
Entities within the MFC Group are interconnected which may make separation difficult
There have been inquiries relating to the sale or spin-off of all or a part of our U.S. Division. We remain committed to our U.S. Division. In addition, linkages between MFC and its subsidiaries including our U.S. operations, may make it difficult to dispose of or separate a subsidiary within the group by way of spin-off or similar transaction. See the Company’s Annual Information Form – “Risk Factors – Additional risks – Entities within the MFC Group are interconnected which may make separation difficult”. In addition to the possible negative consequences outlined in such disclosure, other negative consequences could include a requirement for significant capital injections, and increased net income and capital sensitivities of MFC and its remaining subsidiaries to market declines.
Ratings Risk Factors
The Company has received security ratings from approved rating organizations on certain of its long-term debt, liabilities for preferred shares and capital instruments and preferred shares qualifying as equity. In addition, the Company and its primary insurance operating subsidiaries have received financial strength/claims paying ratings. Our ratings could be adversely affected if, in the view of the rating organizations, there is deterioration in our financial flexibility, operating performance, or risk profile. Adverse ratings changes could have a negative impact on future financial results.
Reputation Risk Factors
The Company’s reputation is one of our most valuable assets. Our corporate image may be eroded by adverse publicity, as a result of our business practices or those of our employees, representatives and business partners, potentially causing damage to our franchise value. A loss of reputation is often a consequence of some other risk control failure whether associated with complex financial transactions or relatively routine operational activities. As such, reputation risk cannot be managed in isolation from other risks.
Market Risk
Market risk is the risk of loss resulting from market price volatility, interest rate change, credit and swap changes, and from adverse foreign currency rate movements. Market price volatility primarily relates to changes in prices of publicly traded equities and alternative long-duration assets.
Market Risk Management Strategy Overview
Our overall strategy to manage our market risks incorporates several component strategies, each targeted to manage one or more of the market risks arising from our businesses. At an enterprise level, these strategies are designed to manage our aggregate exposures to market risks against economic capital, regulatory required capital and earnings at risk targets.
The following table outlines our key market risks and identifies the risk management strategies which contribute to managing these risks.
| | | | | | | | |
| | | Publicly Traded Equity
Performance
Risk | | Interest Rate and Spread
Risk | | Alternative Long-Duration
Asset Performance
Risk | | Foreign Exchange Risk |
Product Design and Pricing | | X | | X | | X | | X |
Variable Annuity Guarantee Dynamic Hedging | | X | | X | | | | X |
Macro Equity Risk Hedging | | X | | | | | | X |
Asset Liability Management | | X | | X | | X | | X |
Foreign Exchange Management | | | | | | | | X |
During 2012, we achieved our risk reduction targets two years earlier than originally set for public equity and interest rate risk management. These targets were to have 75 per cent of our underlying earnings sensitivity to public equity market movements offset by hedges by the end of 2014 and to reduce interest rate exposures, as measured by the sensitivity of shareholders’ net income to a 100 basis point decline in interest rates to $1.1 billion as at year end 2014.
| | | | |
| 42 Manulife Financial Corporation 2012 Annual Report | | Management’s Discussion and Analysis | | |
To reduce public equity risk, we use a combination of variable annuity guarantee dynamic hedging and general macro equity risk hedging strategies. As a result of our dynamic and macro hedging program, as at December 31, 2012, we estimate that approximately 72 to 83 per cent of our underlying earnings sensitivity to a 10 per cent decline in equity markets would be offset by hedges. The lower end of the range is based on the dynamically hedged assets that exist at December 31, 2012 and assumes re-balancing of equity hedges for dynamically hedged variable annuity liabilities at five per cent intervals and the upper end of the range assumes the performance of the dynamic hedging program would completely offset the loss from the dynamically hedged variable annuity guarantee liabilities. Our strategies employed for variable annuity guarantee dynamic hedging and macro equity risk hedging expose the Company to additional risks. These risks are outlined in the Publicly Traded Equity Performance Risk section below.
To reduce interest rate risk, we lengthened the duration of our fixed income investments in both our liability and surplus segments by investing cash and trading shorter term bonds for longer term bonds, and by executing lengthening interest rate swaps. These actions, partially offset by the changes in interest rates and the impact of updates to policyholder liability assumptions during the year, contributed to a net reduction in the sensitivity of net income attributed to shareholders to declines in interest rates.
Changes in the market value of fixed income assets held in our surplus segment may provide a natural economic offset to the interest rate risk arising from our product liabilities. In order for there to also be an accounting offset, the Company would need to realize a portion of the available for sale fixed income unrealized gains or losses. While we have a history of being able to realize a portion of these gains or losses, it is not certain that we would crystallize any of the unrealized gains or losses available.
During 2012 management was successful with its ongoing efforts to change our risk profile going forward demonstrating strong growth in fee based and non-guarantee business, re-pricing insurance products and closing the U.S. variable annuity business to new sales.
Key Risk Factors
Publicly Traded Equity Performance Risk
Publicly traded equity performance risk arises from a variety of sources, including guarantees associated with certain variable annuity and segregated fund products, asset based fees, and investments in publicly traded equities supporting both our general fund products and our surplus segment.
Our most significant source of equity risk arises from variable annuity and segregated funds with guarantees, where the guarantees are linked to the performance of the underlying funds. Guaranteed benefits are contingent and only payable upon death, maturity, permitted withdrawal or annuitization. If equity markets decline or even if they increase by an amount lower than that assumed in our actuarial valuation, additional liabilities may need to be established to cover the contingent liabilities, resulting in a reduction in shareholders’ net income and regulatory capital ratios. Further, if equity markets do not recover to the amount of the guarantees, by the dates the liabilities are due, the accrued liabilities will need to be paid out in cash. In addition, a sustained flat or a decline in public equity markets would likely reduce asset based fee revenues related to variable annuities and segregated funds with guarantees and related to other wealth and insurance products.
Where publicly traded equity investments are used to support policy liabilities, the policy valuation incorporates projected investment returns on these assets. If actual returns are lower than the expected returns, the Company’s policy liabilities will increase, reducing net income attributed to shareholders.
Further, for products where the investment strategy applied to future cash flows in the policy valuation includes investing a specified portion of future cash flows in publicly traded equities, a decline in the value of publicly traded equities relative to other assets could require us to change the investment mix assumed for future cash flows, which may increase policy liabilities and reduce net income attributed to shareholders. In addition, a reduction in the outlook for expected future returns for publicly traded equities, which could result from a fundamental change in future expected economic growth, would increase policy liabilities and reduce net income attributed to shareholders. In addition, to the extent publicly traded equities are held as AFS, other than temporary impairments that arise will reduce income.
Expected long-term annual market growth assumptions for public equities pre-dividends for key markets are based on long-term historical observed experience. In the stochastic valuations of our segregated fund guarantee business, those rates inclusive of dividends are 9.6% per annum in Canada, 9.6% per annum in the U.S., 6.3% per annum in Japan and vary between 7.8% and 9.85% per annum for European equity funds. The calibration of the economic scenario generators that are used to value segregated fund guarantee business complies with current actuarial Standards of Practice for the valuation of these products. Implicit margins are determined through stochastic valuation processes which results in lower net yields used to determine policy liabilities. Assumptions used for alternative long-duration assets backing liabilities are constrained by different Standards of Practice and result in marginally lower returns for public equities than those used in stochastic valuations. Alternative asset return assumptions vary based on asset class but are largely consistent, after application of valuation margins and differences in taxation, with returns assumed for public equities.
Interest Rate and Spread Risk
Interest rate and spread risk arises from general fund guaranteed benefit products, general fund adjustable benefit products with minimum rate guarantees, general fund products with guaranteed surrender values, segregated fund products with minimum benefit guarantees and from surplus fixed income investments.
| | | | |
| | Management’s Discussion and Analysis | | Manulife Financial Corporation 2012 Annual Report 43 |
Interest rate and spread risk arises within the general fund primarily due to the uncertainty of future returns on investments to be made as assets mature and as recurring premiums are received and invested or reinvested to support longer dated liabilities. Interest rate risk also arises due to minimum rate guarantees and guaranteed surrender values on products where investment returns are generally passed through to policyholders.
A general decline in interest rates, without a change in corporate bond spreads and swap spreads, will reduce the assumed yield on future investments used in the valuation of policy liabilities, resulting in an increase in policy liabilities and a reduction in net income. A general increase in interest rates, without a change in corporate bond spreads and swap spreads, will result in a decrease in policy liabilities and an increase in net income. In addition, decreases in corporate bond spreads or increases in swap spreads will result in an increase in policy liabilities and a reduction in net income, while an increase in corporate bond spreads or a decrease in swap spreads will have the opposite impact. The impact of changes in interest rates and in spreads may be partially offset by changes to credited rates on adjustable products that pass through investment returns to policyholders.
For segregated fund and variable annuity products, a sustained increase in interest rate volatility or a decline in interest rates would also likely increase the costs of hedging the benefit guarantees provided.
Alternative Long-Duration Asset Performance Risk
Alternative long-duration asset performance risk arises from general fund investments in commercial real estate, timber properties, agricultural properties, oil and gas properties, and private equities.
Where these assets are used to support policy liabilities, the policy valuation incorporates projected investment returns on these assets. Alternative long-duration asset assumptions vary by asset class and generally have a similar impact on policy liabilities as publicly traded equities would. If actual returns are lower than the expected returns, the Company’s policy liabilities will increase, reducing net income attributed to shareholders. Further, for products where the investment strategy applied to future cash flows in the policy valuation includes investing a specified portion of future policy cash flows in alternative long-duration assets, a decline in the value of these assets relative to other assets could require us to change the investment mix assumed for future cash flows, increasing policy liabilities and reducing net income. In addition, a reduction in the outlook for expected future returns for alternative long-duration assets, which could result from a fundamental change in future expected economic growth, would increase policy liabilities and reduce net income attributed to shareholders.
Foreign Exchange Risk
Our financial results are reported in Canadian dollars. A substantial portion of our business is transacted in currencies other than Canadian dollars, mainly U.S. dollars, Hong Kong dollars and Japanese yen. If the Canadian dollar strengthens relative to these currencies, reported earnings would decline and our reported shareholders’ equity would decline. Further, to the extent that the resultant change in available capital is not offset by a change in required capital, our regulatory capital ratios would be reduced. A weakening of the Canadian dollar against the foreign currencies in which we do business would have the opposite effect, and would increase reported Canadian dollar earnings and shareholders’ equity, and would potentially increase our regulatory capital ratios.
Market Risk Management Strategies
Product Design and Pricing Strategy
Our policies, standards and standards of practice with respect to product design and pricing are designed with the objective of aligning our product offerings with our risk taking philosophy and risk appetite, and in particular, that incremental risk generated from new sales aligns with our strategic risk objectives and risk targets. The specific design features of our product offerings, including level of benefit guarantees, policyholder options, fund offerings and availability restrictions as well as our associated investment strategies help to mitigate the level of underlying risk. We regularly review and modify all key features within our product offerings, including premiums and fee charges with a goal of meeting both profit and risk targets. Certain of our general fund adjustable benefit products have minimum rate guarantees. The rate guarantees for any particular policy are set at the time the policy is issued and governed by insurance regulation in each jurisdiction where the products are sold. The contractual provisions allow crediting rates to be re-set at pre-established intervals subject to the established minimum crediting rate guarantees. The Company may partially mitigate the interest rate exposure by setting new rates on new business and by adjusting rates on in-force business where permitted. In addition, the Company partially mitigates this interest rate risk through its asset liability management process, product design elements, and crediting rate strategies. New product initiatives, new business reinsurance arrangements and material insurance underwriting initiatives must be reviewed and approved by the CRO or key individuals within Divisional and Corporate Risk Management.
Variable Annuity Guarantee Dynamic Hedging Strategy
The variable annuity dynamic hedging strategy is designed to hedge the sensitivity of variable annuity guarantee policy liabilities and available capital to both public equity and bond fund performance and interest rate movements. The objective of the dynamic hedging strategy is to offset, as closely as possible, the change in the economic value of guarantees with the profit and loss from our hedge asset portfolio. The economic value of guarantees moves in close tandem with, but not exactly as, our variable annuity guarantee policy liabilities, as it reflects best estimate liabilities and does not include any liability provisions for adverse deviations.
Our current hedging approach is to short exchange-traded equity index and government bond futures and execute currency futures and lengthening interest rate swaps to hedge sensitivity of policy liabilities to fund performance and interest rate movements arising
| | | | |
| 44 Manulife Financial Corporation 2012 Annual Report | | Management’s Discussion and Analysis | | |
from variable annuity guarantees. We dynamically rebalance these hedge instruments as market conditions change, in order to maintain the hedged position within established limits. We may consider the use of additional hedge instruments opportunistically in the future.
We employ dynamic hedging for new variable annuity guarantee business when written, or as soon as practical thereafter, and approximately 63 per cent of our in-force variable annuity guarantee values, net of amounts reinsured, were dynamically hedged as at December 31, 2012. We intend to initiate dynamic hedging for incremental amounts of in-force business not dynamically hedged as market conditions meet our criteria. Public equity risk arising from business not dynamically hedged is managed through our macro equity risk hedging strategy and interest rate risk arising from variable annuity business not dynamically hedged is managed within our asset liability management strategy. During 2012, we initiated dynamic hedging on an additional $1.5 billion of in-force variable annuity guarantee value.
Our variable annuity guarantee dynamic hedging strategy is not designed to completely offset the sensitivity of policy liabilities to all risks associated with the guarantees embedded in these products. The profit (loss) on the hedge instruments will not completely offset the underlying losses (gains) related to the guarantee liabilities hedged because:
| n | | Policyholder behaviour and mortality experience are not hedged; |
| n | | Provisions for adverse deviation in the policy liabilities are not hedged; |
| n | | A portion of interest rate risk is not hedged; |
| n | | Fund performance on a small portion of the underlying funds is not hedged due to lack of availability of effective exchange-traded hedge instruments; |
| n | | Performance of the underlying funds hedged may differ from the performance of the corresponding hedge instruments; |
| n | | Correlations between interest rates and equity markets could lead to unfavourable material second order impacts; |
| n | | Unfavourable hedge rebalancing costs can be incurred during periods of high volatility from equity markets, bond markets and/or interest rates. The impact is magnified when these impacts occur concurrently; and |
| n | | Not all other risks are hedged. |
The risks related to the variable annuity dynamic hedging strategy are described below within ‘Risks Related to Hedging Strategies’.
Macro Equity Risk Hedging Strategy
The macro equity risk hedging strategy is designed to hedge a portion of the shareholders’ earnings sensitivity to public equity markets movements arising from the following sources in order to maintain our overall earnings sensitivity to public equity market movements below targeted levels:
| n | | General fund equity holdings backing non-participating liabilities; |
| n | | Variable life insurance; |
| n | | Variable annuity guarantees not dynamically hedged; |
| n | | Unhedged provisions for adverse deviation related to variable annuity guarantees dynamically hedged; |
| n | | Variable annuity fees not associated with guarantees; and |
| n | | Fees on segregated funds without guarantees, mutual funds and institutional assets managed. |
We currently execute our macro equity risk hedging strategy by shorting equity futures and executing currency futures, and rolling them over at maturity. We may consider the use of alternative long maturity instruments opportunistically in the future. The notional value of equity futures contracts that were shorted as part of our macro equity risk hedging strategy as at December 31, 2012 was approximately $7.8 billion.
Risks Related to Hedging Strategies
Our variable annuity guarantee dynamic hedging strategy relies on the execution of derivative transactions in a timely manner. Therefore, hedging costs and the effectiveness of the strategy may be negatively impacted if markets for these instruments become illiquid. The Company is also subject to counterparty risks arising from the derivative instruments and to the risk of increased funding and collateral demands which may become significant as equity markets and interest rates increase. The dynamic hedging strategy is highly dependent on complex systems and mathematical models that are subject to error and rely on forward-looking long-term assumptions that may prove inaccurate, and which rely on sophisticated infrastructure and personnel which may fail or be unavailable at critical times. Due to the complexity of the dynamic hedging strategy there may be additional, unidentified risks that may negatively impact our business and future financial results.
The macro equity risk hedging strategy exposes the Company to risks. The strategy relies on the execution of derivative transactions and the ability to execute may be negatively impacted if markets for these instruments become illiquid. The Company is also subject to the risk of increased funding and collateral demands which may become significant as equity markets increase.
Under certain market conditions, which include a sustained increase in realized equity and interest rate volatilities, a decline in interest rates, or an increase in the correlation between equity returns and interest rate declines, the costs of hedging the benefit guarantees provided in variable annuities may increase or become uneconomic. In addition, there can be no assurance that our dynamic hedging strategy will fully offset the risks arising from the variable annuities being hedged.
Policy liabilities and MCCSR required capital for variable annuity guarantees are determined using long-term forward-looking estimates of volatilities. These long-term forward-looking volatilities assumed for policy liabilities and required capital meet the
| | | | |
| | Management’s Discussion and Analysis | | Manulife Financial Corporation 2012 Annual Report 45 |
Canadian Institute of Actuaries and OSFI calibration standards. To the extent that realized equity or interest rate volatilities in any quarter exceed the assumed long-term volatilities, or correlations between interest rate changes and equity returns are higher, there is a risk that rebalancing will be greater and more frequent, resulting in higher hedging costs.
The level of guarantee claims ultimately paid will be impacted by policyholder longevity and policyholder activity including the timing and amount of withdrawals, lapses and fund transfers. The sensitivity of liability values to equity market and interest rate movements that we hedge are based on long-term expectations for longevity and policyholder activity, since the impact of actual longevity and policyholder experience variances cannot be hedged using capital markets instruments.
Asset Liability Management Strategy
Our asset liability management strategy is designed to help ensure that the market risks embedded in our assets and liabilities held in the Company’s general fund are effectively managed and that risk exposures arising from these assets and liabilities are maintained below targeted levels. The embedded market risks include risks related to the level and movement of interest rates and credit spreads, public equity market performance, alternative long-duration asset performance and foreign exchange rate movements.
General fund product liabilities are segmented into groups with similar characteristics that are supported by specific asset segments. Each segment is managed to a target investment strategy appropriate for the premium and benefit pattern, policyholder options and guarantees, and crediting rate strategies of the products they support. Similar strategies are established for assets in the Company’s surplus account. The strategies are set using portfolio analysis techniques intended to optimize returns, subject to considerations related to regulatory and economic capital requirements, and risk tolerances. They are designed to achieve broad diversification across asset classes and individual investment risks while being suitably aligned with the liabilities they support. The strategies encompass asset mix, quality rating, term profile, liquidity, currency and industry concentration targets.
We employ matching mandates, target return mandates or a combination of both in managing the assets in each segment. Matching mandates invest in fixed income assets such as publicly traded bonds, private debt and mortgages and seek to match the term profile of the liabilities, subject to the assets available in investment markets. Target return mandates invest a portion in a diversified basket of alternative long-duration assets with the remainder invested in fixed income assets and seek to generate returns sufficient to support either guaranteed obligations or to maximize policyholder dividends or credited rates subject to risk and capital constraints for products that generally pass-through investment returns to policyholders. We manage overall allocations to alternative long-duration assets to reflect our risk tolerances.
We group our liabilities into four broad categories:
| n | | Guaranteed products with premiums and benefits that are not adjusted with changes in investment returns and interest rates. We use a combination of matching and target return mandates with the matching mandates supporting obligations within the term period for which fixed income assets are generally available in investment markets. |
| n | | Adjustable products which have benefits that are generally adjusted as interest rates and investment returns change, but which have minimum credited rate guarantees. These tend to be supported by target return mandates although segments supporting shorter term liabilities may use matching mandates. |
| n | | Variable annuity guarantee liabilities with benefits and liability amounts that fluctuate significantly with performance of the underlying segregated funds. These tend to be supported by matching mandates. |
| n | | Non-insurance liabilities which are commingled with the assets held in our surplus account. These tend to be supported by a combination of mandates. |
In our general fund, we limit concentration risk associated with alternative long-duration asset performance by investing in a diversified basket of assets including public and private equities, commercial real estate, infrastructure, timber, agricultural real estate, and oil and gas assets. We further diversify risk by managing publicly traded equities and alternative long-duration asset investments against established targets and limits, including for industry type and corporate connection, commercial real estate type and geography, and timber and agricultural property geography and crop type.
Authorities to manage our investment portfolios are delegated to investment professionals who manage to benchmarks derived from the target investment strategies established for each segment, including interest rate risk tolerances. Interest rate risk exposure measures are monitored and communicated to portfolio managers with frequencies ranging from daily to annually, depending on the type of liability. Asset portfolio rebalancing, accomplished using cash investments or derivatives, may occur at frequencies ranging from daily to monthly, depending on our established risk tolerances and the potential for changes in the profile of the assets and liabilities.
Our asset liability management strategy incorporates a wide variety of risk measurement, risk mitigation and risk management and hedging processes. The liabilities and risks to which the Company is exposed, however, cannot be completely matched or hedged due to both limitations on instruments available in investment markets and uncertainty of policyholder experience and consequent liability cash flows.
Foreign Exchange Risk Management Strategy
Our foreign exchange risk management strategy is designed to hedge the sensitivity of our regulatory capital ratios to movements in foreign exchange rates. In particular, the objective of the strategy is to offset within acceptable tolerance levels, changes in required capital with changes in available capital that result from movements in foreign exchange rates. These changes occur when assets and liabilities related to business conducted in currencies other than Canadian dollars are translated to Canadian dollars at period ending exchange rates.
| | | | |
| 46 Manulife Financial Corporation 2012 Annual Report | | Management’s Discussion and Analysis | | |
Our policy is to generally match the currency of our assets with the currency of the liabilities they support, and similarly, we have a policy of generally matching the currency of the assets in our shareholders’ equity account to the currency of our required capital. Where assets and liabilities are not matched, forward contracts and currency swaps are used to stabilize our capital ratios and our capital adequacy relative to economic capital, when foreign exchange rates change.
We have established target levels of risk exposure, measured in terms of potential changes in capital ratios due to foreign exchange rate movements, determined to represent a specified likelihood of occurrence based on internal models. We utilize a Value-at-Risk (“VaR”) methodology quarterly to estimate the potential impact of currency mismatches on our capital ratios.
While our risk management strategy is designed to stabilize capital adequacy ratios, the sensitivity of reported shareholders’ equity and income to foreign exchange rate changes is not hedged.
Sensitivities and Risk Exposure Measures
Caution Related to Sensitivities
In the sections that follow, we have provided sensitivities and risk exposure measures for certain risks. These include sensitivities due to specific changes in market prices and interest rate levels projected using internal models as at a specific date, and are measured relative to a starting level reflecting the Company’s assets and liabilities at that date and the actuarial factors, investment returns and investment activity the Company assumes in the future. The risk exposures measure the impact of changing one factor at a time and assume that all other factors remain unchanged. Actual results can differ significantly from these estimates for a variety of reasons including the interaction among these factors when more than one changes, changes in actuarial and investment return and future investment activity assumptions, actual experience differing from the assumptions, changes in business mix, effective tax rates and other market factors, and the general limitations of our internal models. For these reasons, these sensitivities should only be viewed as directional estimates of the underlying sensitivities for the respective factors based on the assumptions outlined below. Given the nature of these calculations, the Company cannot provide assurance that the actual impact on net income attributed to shareholders or on MLI’s MCCSR ratio will be as indicated.
Variable Annuity and Segregated Fund Guarantees
Guarantees on variable products and segregated funds may include one or more of death, maturity, income and withdrawal guarantees. Variable annuity and segregated fund guarantees are contingent and only payable upon the occurrence of the relevant event, if fund values at that time are below guaranteed values. Depending on future equity market levels, liabilities on current in-force business would be due primarily in the period from 2015 to 2038.
The table below shows selected information regarding the Company’s variable annuity and segregated fund investment related guarantees gross and net of reinsurance, and net of the business dynamically hedged.
Variable Annuity and Segregated Fund Guarantees
| | | | | | | | | | | | | | | | | | | | | | | | | | | | |
As at December 31, (C$ millions) | | 2012 | | | | | 2011 | | | |
| | Guarantee
value | | | Fund value | | | Amount at risk(4) | | | | | Guarantee
value | | | Fund value | | | Amount at risk(4) | | | |
Guaranteed minimum income benefit(1) | | $ | 6,581 | | | $ | 4,958 | | | $ | 1,630 | | | | | $ | 7,518 | | | $ | 5,358 | | | $ | 2,163 | | | |
Guaranteed minimum withdrawal benefit | | | 65,481 | | | | 58,659 | | | | 7,183 | | | | | | 66,655 | | | | 56,954 | | | | 9,907 | | | |
Guaranteed minimum accumulation benefit | | | 20,380 | | | | 21,468 | | | | 1,383 | | | | | | 23,509 | | | | 23,030 | | | | 2,813 | | | |
Gross living benefits(2) | | $ | 92,442 | | | $ | 85,085 | | | $ | 10,196 | | | | | $ | 97,682 | | | $ | 85,342 | | | $ | 14,883 | | | |
Gross death benefits(3) | | | 13,316 | | | | 10,622 | | | | 2,206 | | | | | | 15,202 | | | | 11,614 | | | | 3,232 | | | |
Total gross of reinsurance and hedging | | $ | 105,758 | | | $ | 95,707 | | | $ | 12,402 | | | | | $ | 112,884 | | | $ | 96,956 | | | $ | 18,115 | | | |
Living benefits reinsured | | $ | 5,780 | | | $ | 4,358 | | | $ | 1,427 | | | | | $ | 6,491 | | | $ | 4,622 | | | $ | 1,871 | | | |
Death benefits reinsured | | | 3,673 | | | | 3,140 | | | | 709 | | | | | | 4,360 | | | | 3,430 | | | | 1,104 | | | |
Total reinsured | | $ | 9,453 | | | $ | 7,498 | | | $ | 2,136 | | | | | $ | 10,851 | | | $ | 8,052 | | | $ | 2,975 | | | |
Total, net of reinsurance | | $ | 96,305 | | | $ | 88,209 | | | $ | 10,266 | | | | | $ | 102,033 | | | $ | 88,904 | | | $ | 15,140 | | | |
Living benefits dynamically hedged | | $ | 55,464 | | | $ | 52,585 | | | $ | 4,528 | | | | | $ | 55,522 | | | $ | 50,550 | | | $ | 6,346 | | | |
Death benefits dynamically hedged | | | 5,453 | | | | 3,945 | | | | 558 | | | | | | 5,133 | | | | 3,461 | | | | 739 | | | |
Total dynamically hedged | | $ | 60,917 | | | $ | 56,530 | | | $ | 5,086 | | | | | $ | 60,655 | | | $ | 54,011 | | | $ | 7,085 | | | |
Living benefits retained | | $ | 31,198 | | | $ | 28,142 | | | $ | 4,241 | | | | | $ | 35,669 | | | $ | 30,170 | | | $ | 6,666 | | | |
Death benefits retained | | | 4,190 | | | | 3,537 | | | | 939 | | | | | | 5,709 | | | | 4,723 | | | | 1,389 | | | |
Total, net of reinsurance and dynamic hedging | | $ | 35,388 | | | $ | 31,679 | | | $ | 5,180 | | | | | $ | 41,378 | | | $ | 34,893 | | | $ | 8,055 | | | |
| (1) | Contracts with guaranteed long-term care benefits are included in this category. |
| (2) | Where a policy includes both living and death benefits, the guarantee in excess of the living benefit is included in the death benefit category as outlined in footnote (3). |
| (3) | Death benefits include standalone guarantees and guarantees in excess of living benefit guarantees where both death and living benefits are provided on a policy. |
| (4) | Amount at risk (in-the-money amount) is the excess of guarantee values over fund values on all policies where the guarantee value exceeds the fund value. This amount is not currently payable. For guaranteed minimum death benefit, the net amount at risk is defined as the current guaranteed minimum death benefit in excess of the current account balance. For guaranteed minimum income benefit, the net amount at risk is defined as the excess of the current annuitization income base over the current account value. For all guarantees, the net amount at risk is floored at zero at the single contract level. |
| | | | |
| | Management’s Discussion and Analysis | | Manulife Financial Corporation 2012 Annual Report 47 |
As at December 31, 2012, approximately 67 per cent of the variable annuity and segregated fund guarantee value was either dynamically hedged or reinsured, compared to 63 per cent at December 31, 2011. The business dynamically hedged at December 31, 2012 comprises 63 per cent of the variable annuity guarantee values, net of amounts reinsured.
The policy liabilities established for these benefits were $7,948 million at December 31, 2012 (2011 – $10,021 million). These policy liabilities include the policy liabilities for both the hedged and the unhedged business. For unhedged business, policy liabilities were $2,695 million at December 31, 2012 (2011 – $3,586 million). The policy liabilities for the hedged block were $5,253 million at December 31, 2012 (2011 – $6,435 million). The decrease in the policy liabilities for the hedged block was primarily due to the favourable impact of equity market movements and the increase in swap rates reducing the expected cost of hedging, partly offset by the adverse impact from changes in actuarial methods and assumptions. The year-over-year decrease in policy liabilities related to the unhedged business was due primarily to the favourable impact of improved public equity markets, partly offset by the adverse impacts from changes in actuarial methods and assumptions and interest rate movements.
The following table shows the notional value of shorted equity futures contracts utilized for our variable annuity guarantee dynamic hedging and our macro equity risk hedging strategies.
Notional value of shorted equity futures contracts
| | | | | | | | | | |
As at December 31, (C$ millions) | | 2012 | | | 2011 | | | |
For variable annuity guarantee dynamic hedging strategy(1) | | $ | 9,500 | | | $ | 10,600 | | | |
For macro equity risk hedging strategy | | | 7,800 | | | | 5,600 | | | |
Total | | $ | 17,300 | | | $ | 16,200 | | | |
| (1) | Reflects net short and long positions for exposures to similar exchanges. |
Publicly Traded Equity Performance Risk
As a result of our dynamic and macro hedging program, as at December 31, 2012, we estimate that approximately 72 to 83 per cent of our underlying earnings sensitivity to a 10 per cent decline in equity markets would be offset by hedges. The lower end of the range is based on the dynamically hedged assets that exist at December 31, 2012 and assumes re-balancing of equity hedges for dynamically hedged variable annuity liabilities at 5 per cent intervals and the upper end of the range assumes the performance of the dynamic hedging program would completely offset the loss from the dynamically hedged variable annuity guarantee liabilities. The range at December 31, 2011 was 59 to 70 per cent. We have achieved our stated goal to have approximately 75 per cent of the underlying earnings sensitivity to equity markets offset by hedges by the end of 2014. However, there can be no assurance that our exposure to public equity markets will remain below year end 2014 targets.
As outlined above, the macro hedging strategy is designed to mitigate public equity risk arising from variable annuity guarantees not dynamically hedged and from other products and fees. In addition, our variable annuity guarantee dynamic hedging strategy is not designed to completely offset the sensitivity of policy liabilities to all risks associated with the guarantees embedded in these products.
The tables below show the potential impact on net income attributed to shareholders resulting from an immediate 10, 20 and 30 per cent change in market values of publicly traded equities followed by a return to the expected level of growth assumed in the valuation of policy liabilities, including embedded derivatives. The potential impact is shown before and after taking into account the impact of the change in markets on the hedge assets. The potential impact is shown assuming that (a) the change in value of the hedge assets completely offsets the change in the dynamically hedged variable annuity guarantee liabilities, including the provisions for adverse deviation and (b) that the change in value is not completely offset. In the fourth quarter 2012 we refined our methodology related to the estimated amount that would not be completely offset. The refinement in methodology assumes that provision for adverse deviation is not offset and that the hedge assets are based on the actual position at the period end. (Previously the methodology assumed that for a 10, 20 and 30 per cent decrease in the market value of equities, the profit from the hedge assets offsets 80, 75 and 70 per cent, respectively, of the loss arising from the change in the policy liabilities associated with the guarantees dynamically hedged. For a 10, 20 and 30 per cent market increase in the market value of equities, the loss on the dynamic hedges was assumed to be 120, 125 and 130 per cent of the gain from the dynamically hedged variable annuity guarantee liabilities, respectively.)
While we cannot reliably estimate the amount of the change in dynamically hedged variable annuity guarantee liabilities that will not be offset by the profit or loss on the dynamic hedge assets, we make certain assumptions for the purposes of estimating the impact on shareholders’ net income. It is also important to note that these estimates are illustrative, and that the hedge program may underperform these estimates, particularly during periods of high realized volatility and/or periods where both interest rates and equity market movements are unfavourable.
| | | | |
| 48 Manulife Financial Corporation 2012 Annual Report | | Management’s Discussion and Analysis | | |
Potential impact on net income attributed to shareholders arising from changes to public equity returns(1)
| | | | | | | | | | | | | | | | | | | | | | | | | | |
As at December 31, 2012 (C$ millions) | | | | | | | | | | | | | | | | | | | | |
| | -30% | | | -20% | | | -10% | | | 10% | | | 20% | | | 30% | | | |
Underlying sensitivity to net income attributed to shareholders(2) | | | | | | | | | | | | | | | | | | | | | | | | | | |
Variable annuity guarantees | | $ | (5,640 | ) | | $ | (3,510 | ) | | $ | (1,580 | ) | | $ | 1,260 | | | $ | 2,220 | | | $ | 2,930 | | | |
Asset based fees | | | (270 | ) | | | (180 | ) | | | (90 | ) | | | 90 | | | | 180 | | | | 270 | | | |
General fund equity investments(3) | | | (380 | ) | | | (260 | ) | | | (130 | ) | | | 120 | | | | 230 | | | | 350 | | | |
Total underlying sensitivity | | $ | (6,290 | ) | | $ | (3,950 | ) | | $ | (1,800 | ) | | $ | 1,470 | | | $ | 2,630 | | | $ | 3,550 | | | |
Impact of hedge assets | | | | | | | | | | | | | | | | | | | | | | | | | | |
Impact of macro hedged assets | | $ | 2,010 | | | $ | 1,340 | | | $ | 670 | | | $ | (670 | ) | | $ | (1,340 | ) | | $ | (2,010 | ) | | |
Impact of dynamic hedge assets assuming the change in the value of the hedge assets completely offsets the change in the dynamically hedged variable annuity guarantee liabilities(4) | | | 3,070 | | | | 1,890 | | | | 820 | | | | (600 | ) | | | (1,000 | ) | | | (1,300 | ) | | |
Total impact of hedge assets assuming the change in value of the dynamic hedge assets completely offsets the change in the dynamically hedged variable annuity guarantee liabilities(4) | | $ | 5,080 | | | $ | 3,230 | | | $ | 1,490 | | | $ | (1,270 | ) | | $ | (2,340 | ) | | $ | (3,310 | ) | | |
Net impact assuming the change in the value of the hedged assets completely offsets the change in the dynamically hedged variable annuity guarantee liabilities(4) | | $ | (1,210 | ) | | $ | (720 | ) | | $ | (310 | ) | | $ | 200 | | | $ | 290 | | | $ | 240 | | | |
Impact of assuming that the provisions for adverse deviation for dynamically hedged liabilities are not offset and that the hedging program rebalances at 5% market intervals(5) | | | (710 | ) | | | (470 | ) | | | (190 | ) | | | (10 | ) | | | (50 | ) | | | (70 | ) | | |
Net impact assuming the change in value of the dynamic hedge assets does not completely offset the change in the dynamically hedged variable annuity guarantee liabilities(5) | | $ | (1,920 | ) | | $ | (1,190 | ) | | $ | (500 | ) | | $ | 190 | | | $ | 240 | | | $ | 170 | | | |
Percentage of underlying earnings sensitivitiy to movements in equity markets that is offset by hedges if dynamic hedge assets completely offset the change in the dynamically hedged variable annuity guarantee liability | | | 81% | | | | 82% | | | | 83% | | | | 86% | | | | 89% | | | | 93% | | | |
Percentage of underlying earnings sensitivity to movements in equity markets that is offset by hedge assets if dynamic hedge assets do not completely offset the change in the dynamically hedged variable annuity guarantee liability(5) | | | 69% | | | | 70% | | | | 72% | | | | 87% | | | | 91% | | | | 95% | | | |
| (1) | See “Caution Related to Sensitivities” above. |
| (2) | Defined as earnings sensitivity to a change in public equity markets including settlements on reinsurance contracts, but before the offset of hedge assets or other risk mitigants. |
| (3) | This impact for general fund equities is calculated as at a point-in-time and does not include: (i) any potential impact on public equity weightings; (ii) any gains or losses on public equities held in the Corporate and Other segment; or (iii) any gains or losses on public equity investments held in Manulife Bank. The sensitivities assume that the participating policy funds are self-supporting and generate no material impact on net income attributed to shareholders as a result of changes in equity markets. |
| (4) | Best estimate liabilities and associated provisions for adverse deviation. |
| (5) | Represents the impact of rebalancing equity hedges for dynamically hedged variable annuity guarantee liabilities at 5% market intervals. Also, represents the impact of changes in markets on provisions for adverse deviation that are not hedged, but does not include any impact in respect of other sources of hedge ineffectiveness, e.g. basis risk, realized volatility and equity, interest rate correlations different from expected among other factors. For presentation purposes, numbers are rounded. |
| | | | |
| | Management’s Discussion and Analysis | | Manulife Financial Corporation 2012 Annual Report 49 |
Potential impact on net income attributed to shareholders arising from changes to public equity returns(1)
| | | | | | | | | | | | | | | | | | | | | | | | | | |
As at December 31, 2011 (C$ millions) | | -30% | | | -20% | | | -10% | | | 10% | | | 20% | | | 30% | | | |
Underlying sensitivity to net income attributed to shareholders(2) | | | | | | | | | | | | | | | | | | | | | | | | | | |
Variable annuity guarantees | | $ | (6,080 | ) | | $ | (3,830 | ) | | $ | (1,780 | ) | | $ | 1,490 | | | $ | 2,720 | | | $ | 3,690 | | | |
Asset based fees | | | (260 | ) | | | (180 | ) | | | (80 | ) | | | 90 | | | | 180 | | | | 260 | | | |
General fund equity investments(3) | | | (300 | ) | | | (200 | ) | | | (110 | ) | | | 100 | | | | 200 | | | | 300 | | | |
Total underlying sensitivity | | $ | (6,640 | ) | | $ | (4,210 | ) | | $ | (1,970 | ) | | $ | 1,680 | | | $ | 3,100 | | | $ | 4,250 | | | |
Impact of hedge assets | | | | | | | | | | | | | | | | | | | | | | | | | | |
Impact of macro hedged assets | | $ | 1,420 | | | $ | 950 | | | $ | 470 | | | $ | (470 | ) | | $ | (950 | ) | | $ | (1,420 | ) | | |
Impact of dynamic hedge assets assuming the change in the value of the hedge assets completely offsets the change in the dynamically hedged variable annuity guarantee liabilities(4) | | | 3,170 | | | | 1,980 | | | | 900 | | | | (710 | ) | | | (1,240 | ) | | | (1,610 | ) | | |
Total impact of hedge assets assuming the change in value of the dynamic hedge assets completely offsets the change in the dynamically hedged variable annuity guarantee liabilities(4) | | $ | 4,590 | | | $ | 2,930 | | | $ | 1,370 | | | $ | (1,180 | ) | | $ | (2,190 | ) | | $ | (3,030 | ) | | |
Net impact assuming the change in the value of the hedged assets completely offsets the change in the dynamically hedged variable annuity guarantee liabilities(4) | | $ | (2,050 | ) | | $ | (1,280 | ) | | $ | (600 | ) | | $ | 500 | | | $ | 910 | | | $ | 1,220 | | | |
Impact of assuming that the provisions for adverse deviation for dynamically hedged liabilities are not offset and that the hedging program rebalances at 5% market intervals(5) | | | (700 | ) | | | (460 | ) | | | (200 | ) | | | (10 | ) | | | (20 | ) | | | (30 | ) | | |
Net impact assuming the change in value of the dynamic hedge assets does not completely offset the change in the dynamically hedged variable annuity guarantee liabilities(5) | | $ | (2,750 | ) | | $ | (1,740 | ) | | $ | (800 | ) | | $ | 490 | | | $ | 890 | | | $ | 1,190 | | | |
Percentage of underlying earnings sensitivitiy to movements in equity markets that is offset by hedges if dynamic hedge assets completely offset the change in the dynamically hedged variable annuity guarantee liability | | | 69% | | | | 70% | | | | 70% | | | | 70% | | | | 71% | | | | 71% | | | |
Percentage of underlying earnings sensitivity to movements in equity markets that is offset by hedge assets if dynamic hedge assets do not completely offset the change in the dynamically hedged variable annuity guarantee liability(5) | | | 59% | | | | 59% | | | | 59% | | | | 71% | | | | 71% | | | | 72% | | | |
| (1) | See “Caution Related to Sensitivities” above. |
| (2) | Defined as earnings sensitivity to a change in public equity markets including settlements on reinsurance contracts, but before the offset of hedge assets or other risk mitigants. |
| (3) | This impact for general fund equities is calculated as at a point-in-time and does not include: (i) any potential impact on public equity weightings; (ii) any gains or losses on public equities held in the Corporate and Other segment; or (iii) any gains or losses on public equity investments held in Manulife Bank. The sensitivities assume that the participating policy funds are self-supporting and generate no material impact on net income attributed to shareholders as a result of changes in equity markets. |
| (4) | Best estimate liabilities and associated provisions for adverse deviation. |
| (5) | Represents the impact of rebalancing equity hedges for dynamically hedged variable annuity guarantee liabilities at 5% market intervals. Also, represents the impact of changes in markets on provisions for adverse deviation that are not hedged, but does not include any impact in respect of other sources of hedge ineffectiveness, e.g. basis risk, realized volatility and equity, interest rate correlations different from expected among other factors. For presentation purposes, numbers are rounded. |
Changes in equity markets impact our available and required components of the MCCSR ratio. The following table shows the potential impact to MLI’s MCCSR ratio resulting from changes in public equity market values, assuming that the change in the value of the hedge assets does not completely offset the change of the related variable annuity guarantee liabilities.
Potential impact on MLI’s MCCSR ratio arising from public equity returns different than the expected return for policy liability valuation(1),(2),(3)
| | | | | | | | | | | | | | | | | | | | | | | | | | | | | | | | | | | | | | | | | | | | | | | | | | | | |
| As at December 31, | | 2012 | | | | | 2011 | | | |
| | | | -30% | | | | -20% | | | | -10% | | | | 10% | | | | 20% | | | | 30% | | | | | | -30% | | | | -20% | | | | -10% | | | | 10% | | | | 20% | | | | 30% | | | |
Impact on MLI MCCSR (percentage points) | | | (17 | ) | | | (11 | ) | | | (5 | ) | | | 1 | | | | 2 | | | | 6 | | | | | | (27 | ) | | | (15 | ) | | | (7 | ) | | | 2 | | | | 3 | | | | 4 | | | |
| (1) | See “Caution Related to Sensitivities” above. |
| (2) | The potential impact is shown assuming that the change in value of the hedge assets does not completely offset the change in the dynamically hedged variable annuity guarantee liabilities, including the provisions for adverse deviation. The estimated amount that would not be completely offset assumes that provision for adverse deviation is not offset and that the hedge assets are based on the actual position at the period end. |
| (3) | Sensitivities above do not include the impact of equity markets on the Company’s own pension plans as a result of 2013 MCCSR Guideline changes (see section “Capital Management Framework – Regulatory Capital Position” for further details). |
| | | | |
| 50 Manulife Financial Corporation 2012 Annual Report | | Management’s Discussion and Analysis | | |
Interest Rate and Spread Risk
The following table shows the potential impact on net income attributed to shareholders of a change of one per cent, in current government, swap and corporate rates for all maturities across all markets with no change in credit spreads between government, swap and corporate rates, and with a floor of zero on government rates, relative to the rates assumed in the valuation of policy liabilities, including embedded derivatives. We also assume no change to the ultimate reinvestment rate (“URR”).
Potential impact on annual net income attributed to shareholders of an immediate one per cent parallel change in interest rates relative to rates assumed in the valuation of policy liabilities(1),(2),(3),(4),(5)
| | | | | | | | | | | | | | | | | | |
As at December 31, (C$ millions) | | 2012 | | | | | 2011 | |
| | -100bp | | | +100bp | | | | | -100bp | | | +100bp | |
General fund products(2) | | $ | (200 | ) | | $ | – | | | | | $ | (500 | ) | | $ | 350 | |
Variable annuity guarantees(3) | | | (200 | ) | | | 200 | | | | | | (500 | ) | | | 350 | |
Total | | $ | (400 | ) | | $ | 200 | | | | | $ | (1,000 | ) | | $ | 700 | |
| (1) | See “Caution Related to Sensitivities” above. |
| (2) | The sensitivities assume that the participating policy funds are self-supporting and generate no material impact on net income attributed to shareholders as a result of changes in interest rates. |
| (3) | For variable annuity liabilities that are dynamically hedged, it is assumed that interest rate hedges are rebalanced at 20 basis point intervals. |
| (4) | Sensitivities are based on projected asset and liability cash flows at the beginning of the quarter adjusted for the estimated impact of new business and investment market and activities during the quarter. Any true-up to these estimates, as a result of the final asset and liability cash flows to be used in the next quarter’s projection, are reflected in the next quarter’s sensitivities. |
| (5) | For general fund adjustable benefit products subject to minimum rate guarantee, the sensitivities are based on the assumption that credited rates floored at the minimum. |
The decline in sensitivity was primarily driven by the actions to extend the duration of our fixed income investments supporting policyholder liabilities. These impacts were partially offset by generally lower interest rates in the markets where we operate and the impact of increases to policy liabilities as a result of our annual review of policy valuation assumptions.
The 100 basis point parallel decline includes a change of one per cent in current government, swap and corporate rates for all maturities across all markets with no change in credit spreads between government, swap and corporate rates, and with a floor of zero on government rates and corporate spreads, relative to the rates assumed in the valuation of policy liabilities, including embedded derivatives. Based on interest rates at the end of 2011 and 2012, a 100 basis point decline in interest rates would result in a movement to a different prescribed reinvestment scenario for policy liability valuation in some jurisdictions, which would produce a higher reserve. The potential earnings impact of a 100 basis point decline in interest rates in 2011 and 2012 includes approximately $500 and $200 million, respectively, related to the impact of the scenario change. This amount would be expected to reduce over time, should risk free rates remain unchanged, as the ultimate reinvestment rate moves toward current risk free rates. Further, as the sensitivity to a 100 basis point decline in interest rates includes the impact of the change in prescribed reinvestment scenarios, the impact of changes to interest rates for less than, or more than, the amounts indicated are unlikely to be linear. For variable annuity guarantee liabilities that are dynamically hedged, it is assumed that interest rate hedges are rebalanced at 20 basis point intervals.
The potential impact on annual net income attributed to shareholders provided in the table above does not allow for any future potential changes to the URR assumptions or other potential impacts of lower interest rate levels, for example, increased strain on the sale of new business, lower interest earned on our surplus assets, or updates to actuarial assumptions related to variable annuity bond fund calibration. It also does not reflect any impact arising from the sale of fixed income assets held in our surplus segment. Changes in the market value of these assets may provide a natural economic offset to the interest rate risk arising from our product liabilities. In order for there to also be an accounting offset, the Company would need to realize a portion of the AFS fixed income asset unrealized gains or losses. It is not certain we would crystallize any of the unrealized gains or losses available. As at December 31, 2012, the AFS fixed income assets held in the surplus segment were in a net after-tax unrealized gain position of $218 million (gross after-tax unrealized gains were $364 million and gross after-tax unrealized losses were $146 million).
The following table shows the potential impact on net income attributed to shareholders including the change in the market value of fixed income assets held in our surplus segment, which could be realized through the sale of these assets.
| | | | |
| | Management’s Discussion and Analysis | | Manulife Financial Corporation 2012 Annual Report 51 |
Potential impact on net income attributed to shareholders and MLI’s MCCSR ratio of an immediate one per cent parallel change in interest rates relative to rates assumed in the valuation of policy liabilities(1),(2),(3),(4)
| | | | | | | | | | | | | | | | | | |
| As at December 31, | | 2012 | | | | | 2011 | |
| | -100bp | | | +100bp | | | | | -100bp | | | +100bp | |
Net income attributed to shareholders (C$ millions): | | | | | | | | | | | | | | | | | | |
Excluding change in market value of AFS fixed income assets held in the surplus segment | | $ | (400 | ) | | $ | 200 | | | | | $ | (1,000 | ) | | $ | 700 | |
From fair value changes in AFS assets held in surplus, if realized | | | 800 | | | | (700 | ) | | | | | 800 | | | | (700 | ) |
MLI’s MCCSR ratio (Percentage points): | | | | | | | | | | | | | | | | | | |
Before impact of change in market value of AFS fixed income assets held in the surplus segment(5) | | | (16 | ) | | | 10 | | | | | | (18 | ) | | | 13 | |
From fair value changes in AFS assets held in surplus, if realized | | | 5 | | | | (5 | ) | | | | | 5 | | | | (5 | ) |
| (1) | See “Caution Related to Sensitivities” above. |
| (2) | Includes guaranteed insurance and annuity products, including variable annuity contracts as well as adjustable benefit products where benefits are generally adjusted as interest rates and investment returns change, a portion of which have minimum credited rate guarantees. For adjustable benefit products subject to minimum rate guarantees, the sensitivities are based on the assumption that credited rates will be floored at the minimum. |
| (3) | The amount of gain or loss that can be realized on AFS fixed income assets held in the surplus segment will depend on the aggregate amount of unrealized gain or loss. The table above only reflects the impact of the change in the unrealized position, as the total unrealized position will depend upon the unrealized position at the beginning of the period. |
| (4) | Sensitivities are based on projected asset and liability cash flows at the beginning of the quarter adjusted for the estimated impact of new business, investment markets and asset trading during the quarter. Any true-up to these estimates, as a result of the final asset and liability cash flows to be used in the next quarter’s projection, are reflected in the next quarter’s sensitivities. Impact of realizing 100% of market value of AFS fixed income is as of the end of the quarter. |
| (5) | The impact on MLI’s MCCSR ratio includes both the impact of lower earnings on available capital as well as the increase in required capital that results from a decline in interest rates. The potential increase in required capital accounted for 11 of the 16 points impact of a 100 bp decline in interest rates on MLI’s MCCSR ratio. |
The following tables show the potential impact on net income attributed to shareholders resulting from a change in corporate spreads and swap spreads over government bond rates for all maturities across all markets with a floor of zero on the total interest rate, relative to the spreads assumed in the valuation of policy liabilities.
Potential impact on annual net income attributed to shareholders arising from changes to corporate spreads(1),(2),(3),(4)
| | | | | | | | | | | | | | | | | | | | |
As at December 31, (C$ millions) | | 2012 | | | | | 2011 | | | |
| | -50bp | | | +50bp | | | | | -50bp | | | +50bp | | | |
Corporate spreads | | $ | (1,000 | ) | | $ | 500 | | | | | $ | (900 | ) | | $ | 500 | | | |
| (1) | See “Caution Related to Sensitivities” above. |
| (2) | The impact on net income attributed to shareholders assumes no gains or losses are realized on our AFS fixed income assets held in the surplus segment and excludes the impact arising from changes in segregated fund bond fund value arising from changes in credit spreads. The sensitivities assume that the participating policy funds are self-supporting and generate no material impact on net income attributed to shareholders as a result of changes in corporate spreads. |
| (3) | Corporate spreads are assumed to grade to the long-term average over five years. Sensitivities to 50 basis point change in corporate spreads were estimated at December 31, 2011. |
| (4) | Sensitivities are based on projected asset and liability cash flows at the beginning of the fourth quarter adjusted for the estimated impact of new business and investment market and activities during the quarter. Any true-up to these estimates, as a result of the final asset and liability cash flows to be used in the next quarter’s projection, are reflected in the next quarter’s sensitivities. |
Based on spreads at the end of 2011 and 2012, a 50 basis point decline in corporate spreads would result in a movement to a different prescribed reinvestment scenario for policy liability valuation in some jurisdictions, which would produce a higher reserve. The potential earnings impact of a 50 basis point decline in 2011 and 2012 includes approximately $300 and $400 million, respectively, related to the impact of the scenario change. This amount would be expected to reduce over time, should risk free rates remain unchanged, as the ultimate reinvestment rate moves toward current risk free rates. Further, as the sensitivity to a 50 basis point decline in corporate spreads includes the impact of the change in prescribed reinvestment scenarios, the impact of changes to corporate spreads for less than, or more than, the amounts indicated are unlikely to be linear.
The sensitivity of shareholders’ net earnings to changes in corporate spreads increased over 2011, primarily due to the change to a different prescribed reinvestment scenario as described above and the decline in interest rates over the year.
Potential impact on annual net income attributed to shareholders arising from changes to swap spreads(1),(2),(3)
| | | | | | | | | | | | | | | | | | | | |
As at December 31, (C$ millions) | | 2012 | | | | | 2011 | | | |
| | -20bp | | | +20bp | | | | | -20bp | | | +20bp | | | |
Swap spreads(2) | | $ | 600 | | | $ | (600 | ) | | | | $ | 600 | | | $ | (600 | ) | | |
| (1) | See “Caution Related to Sensitivities” above. |
| (2) | The impact on net income attributed to shareholders assumes no gains or losses are realized on our AFS fixed income assets held in the surplus segment and excludes the impact arising from changes in segregated fund bond fund value arising from changes in credit spreads. The sensitivities assume that the participating policy funds are self-supporting and generate no material impact on net income attributed to shareholders as a result of changes in swap spreads. |
| (3) | Sensitivities are based on projected asset and liability cash flows at the beginning of the fourth quarter adjusted for the estimated impact of new business and investment market and activities during the quarter. Any true-up to these estimates, as a result of the final asset and liability cash flows to be used in the next quarter’s projection, are reflected in the next quarter’s sensitivities. |
The sensitivity of net income attributed to shareholders to changes in swap spreads is largely unchanged year-over-year.
| | | | |
| 52 Manulife Financial Corporation 2012 Annual Report | | Management’s Discussion and Analysis | | |
Alternative Long-Duration Asset Performance Risk
The following table shows the potential impact on net income attributed to shareholders resulting from changes in market values of alternative long-duration assets different than the expected levels assumed in the valuation of policy liabilities.
Potential impact on net income attributed to shareholders arising from changes in alternative long-duration asset returns(1),(2)
| | | | | | | | | | | | | | | | | | | | |
As at December 31, (C$ millions) | | 2012 | | | | | 2011 |
| | -10% | | | +10% | | | | | -10% | | | +10% | | | |
Real estate, agriculture and timber assets | | $ | (900 | ) | | $ | 900 | | | | | $ | (750 | ) | | $ | 750 | | | |
Private equities and other alternative long-duration assets | | | (800 | ) | | | 700 | | | | | | (550 | ) | | | 550 | | | |
Alternative long-duration assets | | $ | (1,700 | ) | | $ | 1,600 | | | | | $ | (1,300 | ) | | $ | 1,300 | | | |
| (1) | See “Caution Related to Sensitivities” above. |
| (2) | This impact is calculated as at a point-in-time impact and does not include: (i) any potential impact on alternative long-duration asset weightings; (ii) any gains or losses on alternative long-duration assets held in the Corporate and Other segment; or (iii) any gains or losses on alternative long-duration assets held in Manulife Bank. The sensitivities assume that the participating policy funds are self-supporting and generate no material impact on net income attributed to shareholders as a result of changes in alternative long-duration asset returns. Net income impact does not consider any impact of the market correction on assumed future return assumptions. |
The increased sensitivity from December 31, 2011 to December 31, 2012 is primarily related to the decline in fixed income rates (reducing the rate at which funds can reinvest), as well as the increase in market value of the alternative long-duration assets over the year.
Foreign Exchange Risk
The following table shows the impact on net income attributed to shareholders of a 10 per cent change in the Canadian dollar relative to our key operating currencies.
Potential impact on net income attributed to shareholders(1)
| | | | | | | | | | | | | | | | | | |
As at December 31, (C$ millions) | | 2012 | | | | | 2011 | |
| | +10% strengthening | | | -10% weakening | | | | | +10% strengthening | | | -10% weakening | |
10% change relative to the U.S. Dollar | | $ | (150 | ) | | $ | 150 | | | | | $ | 100 | | | $ | (100 | ) |
10% change relative to the Japanese Yen | | | (100 | ) | | | 100 | | | | | | (10 | ) | | | 10 | |
| (1) | See “Caution Related to Sensitivities” above. Due to U.S. dollar denominated losses experienced in 2011, a strengthening of the Canadian dollar relative to the U.S. dollar would have reduced these losses and, therefore, would have had a positive impact on shareholders’ earnings. |
The following table shows the impact on shareholders’ equity of a 10 per cent change in the Canadian dollar relative to our key operating currencies.
Potential impact on shareholders’ equity(1)
| | | | | | | | | | | | | | | | | | |
As at December 31, (C$ millions) | | 2012 | | | | | 2011 | |
| | +10% strengthening | | | -10% weakening | | | | | +10% strengthening | | | -10% weakening | |
10% change relative to the U.S. Dollar | | $ | (1,700 | ) | | $ | 1,700 | | | | | $ | (1,600 | ) | | $ | 1,600 | |
10% change relative to the Japanese Yen | | | (300 | ) | | | 300 | | | | | | (300 | ) | | | 300 | |
| (1) | See “Caution Related to Sensitivities” above. |
Liquidity Risk
Liquidity risk is the risk of not having access to sufficient funds or liquid assets to meet both expected and unexpected cash and collateral demands.
Key Risk Factors
Manulife Financial is exposed to liquidity risk in each of our operating companies and in our holding company. In the operating companies, expected cash and collateral demands arise day-to-day to fund anticipated policyholder benefits, withdrawals of customer deposit balances, reinsurance settlements, derivative instrument settlements/collateral pledging, expenses, investment and hedging activities. Under stressed conditions, unexpected cash and collateral demands could arise primarily from a change in the level of policyholders either terminating policies with large cash surrender values or not renewing them when they mature, withdrawals of customer deposit balances, borrowers renewing or extending their loans when they mature, derivative settlements or collateral demands, and reinsurance settlements or collateral demands. The implementation of Dodd-Frank in the United States in 2013 will require certain derivatives to migrate from bilateral arrangements to clearinghouses, and this is expected to increase liquidity requirements to support these contracts. The transition to clearinghouses will occur over time and the risks do not become a significant issue for Manulife until a large portion of our derivatives have transitioned to central clearinghouses and market conditions adverse to liquidity (material changes in interest rates and/or equity markets) have been experienced.
| | | | |
| | Management’s Discussion and Analysis | | Manulife Financial Corporation 2012 Annual Report 53 |
The ability of our holding company to fund its cash requirements depends upon it receiving dividends, distributions and other payments from our operating subsidiaries. These subsidiaries are generally required to maintain solvency and capital standards imposed by their local regulators and, as a result, may have restrictions on payments which they may make to MFC.
In the normal course of business, third party banks issue letters of credit on our behalf. In lieu of posting collateral, our businesses utilize letters of credit for which third parties are the beneficiaries, as well as for affiliate reinsurance transactions between subsidiaries of MFC. Letters of credit and letters of credit facilities must be renewed periodically. At time of renewal, the Company is exposed to repricing risk and under adverse conditions increases in costs will be realized. In the most extreme scenarios, letters of credit capacity could become constrained due to non-renewals which would restrict our flexibility to manage capital at the operating company level. This could negatively impact our ability to meet local capital requirements or our sales of products in jurisdictions in which our operating companies have been affected. Although the Company did not experience any material change in aggregate capacity during the recent global financial crisis, changes in prices and conditions were adverse during the market turbulence. There were no assets pledged against these outstanding letters of credit as at December 31, 2012.
Risk Management Strategy
Global liquidity management policies and procedures are designed to provide adequate liquidity to cover cash and collateral obligations as they come due, and to sustain and grow operations in both normal and stressed conditions. They take into account any legal, regulatory, tax, operational or economic impediments to inter-entity funding.
We seek to reduce liquidity risk by diversifying our business across different products, markets, geographical regions and policyholders. We design insurance products to encourage policyholders to maintain their policies in-force, to help generate a diversified and stable flow of recurring premium income. We design the policyholder termination features of our wealth management products and related investment strategies with the goal of mitigating the financial exposure and liquidity risk related to unexpected policyholder terminations. We establish and implement investment strategies intended to match the term profile of the assets to the liabilities they support, taking into account the potential for unexpected policyholder terminations and resulting liquidity needs. Liquid assets represent a large portion of our total assets. We aim to reduce liquidity risk in our deposit funded businesses by diversifying our funding sources and appropriately managing the term structure of our funding. We forecast and monitor daily operating liquidity and cash movements in various individual entities and operations as well as centrally, aiming to ensure liquidity is available and cash is employed optimally.
We also maintain centralized cash pools and access to other sources of liquidity such as repurchase funding agreements. Our centralized cash pool consists of cash or near-cash, high quality short-term investments that are continually monitored for their credit quality and market liquidity.
Through the normal course of business, pledging of assets is required to comply with jurisdictional regulatory and other requirements including collateral pledged to mitigate derivative counterparty credit risk, assets pledged to exchanges as initial margin and assets held as collateral for repurchase funding agreements. Total unencumbered assets were $274.4 billion as at December 31, 2012 (2011 – $261.8 billion).
We manage the asset mix of our balance sheet taking into account the need to hold adequate unencumbered and appropriate liquid assets to satisfy the potential additional requirements arising under stressed scenarios and to allow our liquidity ratios to remain strong.
Risk Exposure Measures
Consolidated group operating and strategic liquidity levels are managed against established minimums. We set minimum operating liquidity above the level of the highest one month’s operating cash outflows projected over the next 12 months. We measure strategic liquidity under both immediate (within one month) and ongoing (within one year) stress scenarios. Our policy is to maintain the ratio of adjusted liquid assets to adjusted policy liabilities at or above a pre-established target. Adjusted liquid assets include unencumbered cash and short-term investments, and marketable bonds and stocks that are discounted to reflect convertibility to cash, net of maturing debt obligations. Policy liabilities are adjusted to reflect their potential for withdrawal.
In addition to managing the consolidated liquidity levels, each entity maintains sufficient liquidity to meet its standalone demands.
Our strategic liquidity ratios are provided in the following table.
| | | | | | | | | | | | | | | | | | |
As at December 31, (C$ millions, unless otherwise stated) | | 2012 | | | | | 2011 | |
| | Immediate
Scenario | | | Ongoing
Scenario | | | | | Immediate
Scenario | | | Ongoing
Scenario | |
Adjusted liquid assets | | $ | 123,776 | | | $ | 122,863 | | | | | $ | 123,429 | | | $ | 124,685 | |
Adjusted policy liabilities | | $ | 25,778 | | | $ | 33,540 | | | | | $ | 27,452 | | | $ | 35,656 | |
Liquidity ratio | | | 480% | | | | 366% | | | | | | 450% | | | | 350% | |
Additionally, the market value of our derivative portfolio is periodically stress tested based on market shocks to assess the potential collateral and cash settlement requirements under stressed conditions. Increased use of derivatives for hedging purposes has necessitated greater emphasis on measurement and management of contingent liquidity risk. Comprehensive liquidity stress testing measures, on an integrated basis, the impact of market shocks on derivative collateral and margin requirements, reserve requirements,
| | | | |
| 54 Manulife Financial Corporation 2012 Annual Report | | Management’s Discussion and Analysis | | |
reinsurance settlements, policyholder behaviour and the market value of eligible liquid assets. Stressed liquidity ratios are measured against established targets.
Manulife Bank has a liquidity risk management policy framework, managed on a standalone basis. The framework includes stress testing, cash flow modeling, a funding plan and a contingency plan. The bank has an established securitization infrastructure which enables the bank to access a range of funding and liquidity sources.
Credit Risk
Credit risk is the risk of loss due to the inability or unwillingness of a borrower or counterparty to fulfill its payment obligations.
Key Risk Factors
Worsening or continued poor economic conditions could result in borrower or counterparty defaults or downgrades, and could lead to increased provisions or impairments related to our general fund invested assets and off-balance sheet derivative financial instruments, and an increase in provisions for future credit impairments to be included in our policy liabilities. Any of our reinsurance providers being unable or unwilling to fulfill their contractual obligations related to the liabilities we cede to them could lead to an increase in policy liabilities.
Risk Management Strategy
The Company has established objectives for overall quality and diversification of our general fund investment portfolio and criteria for the selection of counterparties, including derivative counterparties, reinsurers and insurance providers. Our policies establish exposure limits by borrower, corporate connection, quality rating, industry, and geographic region, and govern the usage of credit derivatives. Corporate connection limits vary according to risk rating. Our general fund fixed income investments are primarily investment grade bonds and commercial mortgages. While we have minimal exposure to credit default swaps, we have a program for selling CDS that employs a highly selective, diversified and conservative approach. All CDS decisions will follow the same rigorous underwriting standards as our cash bond portfolio and we believe the addition of this asset class will allow us to better diversify our overall credit portfolio.
Our credit granting units follow a defined evaluation process that provides an objective assessment of credit proposals. We assign each investment a risk rating based on a detailed examination of the borrower that includes a review of business strategy, market competitiveness, industry trends, financial strength, access to funds, and other risks facing the organization. We assess and update risk ratings regularly, based on a standardized 22-point scale consistent with those of external rating agencies. For additional input to the process, we also assess credit risks using a variety of industry standard market-based tools and metrics. We map our risk ratings to pre-established probabilities of default and loss given defaults, based on historical industry and Company experience, and to resulting default costs.
We establish delegated credit approval authorities and make credit decisions on a case-by-case basis at a management level appropriate to the size and risk level of the transaction, based on the delegated authorities that vary according to risk rating. We refer all major credit decisions to the Credit Committee and the largest credit decisions to the CEO for approval and, in certain cases, to the Board of Directors.
We limit the types of authorized derivatives and applications and require pre-approval of all derivative application strategies and regular monitoring of the effectiveness of derivative strategies. Derivative counterparty exposure limits are established based on a minimum acceptable counterparty credit rating (generally A- from internationally recognized rating agencies). We measure derivative counterparty exposure as net potential credit exposure, which takes into consideration mark-to-market values of all transactions with each counterparty, net of any collateral held, and an allowance to reflect future potential exposure. Reinsurance counterparty exposure is measured reflecting the level of ceded liabilities. We require all reinsurance counterparties and insurance providers to meet minimum risk rating criteria.
Regular reviews of the credits within the various portfolios are undertaken with the goal of identifying changes to credit quality, and where appropriate, taking corrective action. Prompt identification of problem credits is a key objective. CRM provides independent credit risk oversight by reviewing assigned risk ratings, and monitoring problem and potential problem credits.
We establish an allowance for losses on a loan when it becomes impaired as a result of deterioration in credit quality, to the extent there is no longer assurance of timely realization of the carrying value of the loan and related investment income. We reduce the carrying value of an impaired loan to its estimated net realizable value when we establish the allowance. We establish an allowance for losses on reinsurance contracts when a reinsurance counterparty becomes unable or unwilling to fulfill its contractual obligations. We base the allowance for loss on current recoverables and ceded policy liabilities. There is no assurance that the allowance for losses will be adequate to cover future potential losses or that additional allowances or asset write-downs will not be required.
| | | | |
| | Management’s Discussion and Analysis | | Manulife Financial Corporation 2012 Annual Report 55 |
Policy liabilities include general provisions for credit losses from future asset impairments. We set these conservatively, taking into account average historical levels and future expectations, with a provision for adverse deviations. Fluctuations in credit default rates and deterioration in credit ratings of borrowers may result in losses if actual rates exceed expected rates.
Throughout the recent challenging credit environment, our credit policies and procedures and investment strategies have remained fundamentally unchanged. Credit exposure in our investment portfolio is actively managed to reduce risk and mitigate losses and derivative counterparty exposure is managed proactively. Defaults and downgrade charges were generally below the historical average in 2012, however, we still expect volatility on a quarterly basis and losses could potentially rise above long-term expected levels.
Risk Exposure Measures
As at December 31, 2012 and December 31, 2011, for every 50 per cent that credit defaults over the next year exceed the rates provided for in policy liabilities, net income attributed to shareholders would be reduced by $56 million and $63 million, respectively. Downgrades could also be higher than assumed in policy liabilities resulting in policy liability increases and a reduction in net income.
The table below shows net impaired assets and allowances for loan losses.
Net Impaired Assets and Loan Losses
| | | | | | | | | | | | |
As at December 31, (C$ millions, unless otherwise stated) | | 2012 | | | | | 2011 | | | |
Net impaired fixed income assets | | | $ 337 | | | | | | $ 486 | | | |
Net impaired fixed income assets as a per cent of total invested assets | | | 0.15% | | | | | | 0.21% | | | |
Allowance for loan losses | | | $ 89 | | | | | | $ 94 | | | |
Insurance Risk
Insurance risk is the risk of loss due to actual experience emerging differently than assumed when a product was designed and priced with respect to mortality and morbidity claims, policyholder behaviour and expenses.
Key Risk Factors
We make a variety of assumptions related to the future level of claims, policyholder behaviour, expenses and sales levels when we design and price products, and when we establish policy liabilities. Assumptions for future claims are based on both Company and industry experience and predictive models, and assumptions for future policyholder behavior are based on Company experience and predictive models. Assumptions for future policyholder behaviour include assumptions related to the retention rates for insurance and wealth products. Losses may result should actual experience be materially different than that assumed in the design, pricing and sale of products. Such losses could have a significant adverse effect on our results of operations and financial condition. In addition, we periodically review the assumptions we make in determining our policy liabilities and the review may result in an increase in policy liabilities and a decrease in net income attributed to shareholders. Such assumptions require significant professional judgment, and actual experience may be materially different than the assumptions we make.
Life and health insurance claims may be impacted by the unusual onset of disease or illness, natural disasters, large-scale man-made disasters and acts of terrorism. The ultimate level of lifetime benefits paid to policyholders may be impacted by unexpected changes in life expectancy. Policyholder behaviour including premium payment patterns, policy renewals, lapse rates and withdrawal and surrender activity are influenced by many factors including market and general economic conditions, and the availability and relative attractiveness of other products in the marketplace. For example, a weak or declining economic environment could increase the value of guarantees associated with variable annuities or other embedded guarantees and contribute to adverse policyholder behaviour experience. As well, adverse claims experience could result from systematic anti-selection, which could arise from the development of investor owned and secondary markets for life insurance policies, underwriting process failures, or other factors.
We purchase reinsurance protection on certain risks underwritten by our various business segments. External market conditions determine the availability, terms and cost of the reinsurance protection for new business and, in certain circumstances, the cost of reinsurance for business already reinsured. Accordingly, we may be forced to incur additional costs for reinsurance or may not be able to obtain sufficient reinsurance on acceptable terms, which could adversely affect our ability to write future business or result in the assumption of more risk with respect to those policies we issue.
Risk Management Strategy
We have established a broad framework for managing insurance risk under our Product Design and Pricing Policy, Underwriting and Claims Management Policy and Reinsurance Risk Management Policy, as well as supporting global product design and pricing standards and guidelines, and reinsurance guidelines, aimed to help ensure our product offerings align with our risk taking philosophy and risk targets, and achieve acceptable profit margins. These cover:
| | | | |
n product design features n use of reinsurance n pricing models and software n internal risk-based capital allocations n target profit objectives | | n pricing methods and assumption setting n stochastic and stress scenario testing n required documentation n review and approval processes n experience monitoring programs | | |
| | | | |
| 56 Manulife Financial Corporation 2012 Annual Report | | Management’s Discussion and Analysis | | |
In each business unit, we designate individual pricing officers who are accountable for all pricing activities and chief underwriters who are accountable for the underwriting activities. Along with the pricing officer, the general manager and chief financial officer of each business unit approves the design and pricing of each product, including key claims, policyholder behaviour, investment return and expense assumptions, in accordance with corporate policies and standards. Through oversight and review, divisional risk officers and CRM provide approval of all product and pricing initiatives, as well as reinsurance treaties related to new business. In addition, Corporate Actuarial approves all policy liability valuation methods, assumptions and in-force reinsurance treaties. We perform annual risk and compliance self-assessments of the product development, pricing, underwriting and claims activities of all businesses. We also facilitate knowledge transfer between staff working with similar businesses in different geographies in order to leverage best practices.
We utilize a global underwriting manual intended to ensure insurance underwriting practices for direct written life business are consistent across the organization while reflecting local conditions. Each business unit establishes underwriting policies and procedures, including criteria for approval of risks and claims adjudication policies and procedures.
We apply retention limits per insured life that are intended to reduce our exposure to individual large claims which are monitored in each business unit. These retention limits vary by market and jurisdiction. We reinsure exposure in excess of these limits with other companies. Our current global retention limit is US$30 million for a single life (US$35 million for survivorship life policies) and is shared across businesses. We apply lower limits in some markets and jurisdictions. We aim to further reduce exposure to claims concentrations by applying geographical aggregate retention limits for certain covers. Enterprise-wide, we aim to reduce the likelihood of high aggregate claims by operating internationally and insuring a wide range of unrelated risk events.
The Company’s aggregate exposure to each of policyholder behaviour risk and claims risk are managed against enterprise-wide economic capital and earnings at risk targets. The policyholder behaviour risk targets cover the combined risk arising from policyholder policy lapses and surrenders, withdrawals and other policyholder driven activity. The claims risk targets cover the combined risk arising from mortality, longevity and morbidity.
Internal experience studies, as well as trends in our experience and that of the industry, are monitored to update current and projected claims and policyholder behaviour assumptions, resulting in updates to policy liabilities as appropriate.
We continue to seek state regulatory approvals for price increases on existing long-term care business in the United States. We cannot be certain whether or when each approval will be granted. Our policy liabilities reflect our estimates of the impact of these price increases, but should we be less successful than anticipated in obtaining them, then policy liabilities would increase accordingly.
Operational Risk
Operational risk is the risk of loss resulting from inadequate or failed internal processes, risk management policies and procedures, systems failures, human performance failures or from external events.
Key Risk Factors
Operational risk is naturally present in all of our business activities and encompasses a broad range of risks, including regulatory compliance failures, legal disputes, technology failures, business interruption, information security and privacy breaches, human resource management, processing errors, modeling errors, business integration, theft and fraud, and damage to physical assets. Exposures can take the form of financial losses, regulatory sanctions, loss of competitive positioning, or damage to reputation. Operational risk is also embedded in all the practices we use to manage other risks; therefore, if not managed effectively, operational risk can impact our ability to manage other key risks such as credit risk, market risk, liquidity risk and insurance risk.
Risk Management Strategy
Our corporate governance practices, corporate values, and integrated, enterprise-wide approach to managing risk set the foundation for mitigating operational risks. We strengthen this base by establishing appropriate internal controls and systems, compensation programs, and by seeking to retain trained and competent people throughout the organization. We align compensation programs with business strategy, long-term shareholder value and good governance practices, and we benchmark these compensation practices against peer companies. We establish enterprise-wide risk management programs for specific operational risks that could materially impact our ability to do business or impact our reputation. Within established corporate standards, business unit general managers are accountable for the day-to-day management of the operational risks inherent in their operations.
Through our corporate insurance program, we transfer a portion of our operational risk exposure by purchasing global and local insurance coverage that provides some protection against unexpected material losses resulting from events such as criminal activity, property loss or damage and liability exposures. We also purchase certain insurance to satisfy legal requirements and/or contractual obligations. We determine the nature and amount of insurance coverage we purchase centrally, considering our enterprise-wide exposures and risk tolerances.
| | | | |
| | Management’s Discussion and Analysis | | Manulife Financial Corporation 2012 Annual Report 57 |
The following is a further description of key operational risk factors with associated management strategies.
Legal and Regulatory Risk
In addition to the regulatory and capital requirements described under Strategic Risk, the Company is subject to extensive regulatory oversight by insurance and financial services regulators in the jurisdictions in which we conduct business. While many of these laws and regulations are intended to protect policyholders, beneficiaries, depositors and investors in our products and services, others also set standards and requirements for the governance of our operations. Failure to comply with applicable laws or regulations could result in financial penalties or sanctions, and damage our reputation. We are also regularly involved in litigation, both as a plaintiff or defendant, which could result in an unfavourable resolution.
Global Compliance oversees our regulatory compliance program and function, supported by designated Chief Compliance Officers in every Division. The program is designed to promote compliance with regulatory obligations worldwide and to assist in making the Company aware of the laws and regulations that affect us, and the risks associated with failing to comply. Divisional compliance groups monitor emerging legal and regulatory issues and changes and prepare us to address new requirements. Global Compliance also independently assesses and monitors the effectiveness of a broad range of regulatory compliance processes and business practices against potential legal, regulatory, fraud and reputation risks, and helps to ensure significant issues are escalated and proactively mitigated. Among these processes and business practices are: privacy (i.e. handling of personal and other confidential information), sales and marketing practices, sales compensation practices, asset management practices, fiduciary responsibilities, employment practices, underwriting and claims processing, product design, and regulatory filings. In addition, we have policies, processes and controls in place to help protect the Company, our customers and other related third parties from acts of fraud and from risks associated with money laundering and terrorist financing. Audit Services, Global Compliance and divisional compliance personnel periodically assess the effectiveness of the control environment. For further discussion of government regulation and legal proceedings, refer to “Government Regulation” and “Legal Proceedings” in our most recent Annual Information Form.
Technology, Information Security and Business Continuity Risks
Technology is used in virtually all aspects of our business and operations including the creation and support of new products and services. Our technology infrastructure, information services and applications are governed and managed according to operational integrity, resiliency, data integrity, confidentiality and information security policies, standards and controls. Disruption to Information Services operations due to system failure, security breach or global crisis can have negative consequences for our businesses. We have business continuity and disaster recovery, information security, technology risk and other policies, plans and procedures in place designed to minimize the impact of business disruptions, help ensure compliance with laws and regulations and protect confidential/personal information. However, disruptions, breaches or violations caused by errors, natural disasters, man-made disasters, criminal activity, fraud, pandemics or other events beyond our control, could prevent us from effectively operating our business, or could adversely impact us from a financial, operational and reputational perspective. In particular, our computer networks are subject to the risk of Advanced Persistent Threats (APT), also referred to as cyber attacks. APT is a type of sophisticated malware breach that has become more pervasive and frequent with the financial services sector. An APT is a network attack in which an unauthorized person attempts to gain undetected access to a network. The intention of an APT attack is to steal data rather than to cause other damage to the network or organization. APT attacks target organizations in sectors with high-value information, such as national defense, manufacturing and the financial industry.
Technology risk management, information security and business continuity risks are managed through a governance and oversight process as part of our Global Information Risk Management program, which includes information and cyber security defenses, to protect our networks from APT and other cyber attacks. The Global Information Risk Management team maintains and updates policies along with standards of practice designed to ensure to the extent practical, key business functions can continue normal operations effectively and efficiently, in the event of a major disruption. Each business unit is accountable for preparing and maintaining its own detailed business continuity plans and processes and the global program incorporates periodic scenario analysis designed to validate the assessment of both critical and non-critical units, as well as the establishment and testing of appropriate business continuity plans for all critical functions. The business continuity team establishes and regularly tests crisis management plans and global crisis communications protocols. The divisions maintain off-site backup facilities and failover capability designed to minimize downtime and accelerate system recovery. As part of our standard vendor management process we subject our outsourcing arrangements, whereby a service provider performs a service activity on behalf of the Company, to standard review procedures, prior to their approval. We have policies and procedures in place to monitor the ongoing results and contractual compliance of such third party arrangements.
Human Resource Risks
We compete with other insurance companies and financial institutions for qualified executives, employees and agents. Competition for the best people is intense and an inability to recruit qualified individuals may negatively impact our ability to execute on business strategies or to conduct our operations. We have established and implemented a number of human resource policies, practices and programs in order to manage these risks, including recruiting programs at every level of the organization, training and development programs, and competitive compensation programs that are designed to attract, motivate and retain high-performing employees.
| | | | |
| 58 Manulife Financial Corporation 2012 Annual Report | | Management’s Discussion and Analysis | | |
Model Risk
Our reliance on highly complex models for pricing, valuation and risk measurement, and for input to decision making, is increasing. Consequently, the risk of inappropriate use or interpretation of our models or their output, or the use of deficient models, data or assumptions is growing. Our model risk oversight program includes processes intended to ensure that our critical business models are conceptually sound, used as intended, and to assess the appropriateness of the calculations and outputs.
Environmental Risk
Our Environmental Policy reflects the Company’s commitment to conducting all business activities in a manner that recognizes the need to preserve the quality of the natural environment. Environmental Procedures have been designed to manage environmental risk and to achieve compliance with all applicable environmental laws and regulations for business units, affiliates and subsidiaries. Environmental risk may originate from investment properties that are subject to natural or man-made environmental risk. The environmental risk may result from on-site or off-site (adjacent) due to migration of regulated pollutants or contaminates with financial or reputational environmental risk and liability consequences by virtue of strict liability. Real estate assets may be owned, leased and/or managed, as well as mortgaged by Manulife who might enter into the chain of liability due to foreclosure ownership when in default. Environmental risk could also arise from natural disasters (e.g., weather, fire, earthquake, floods, pests) or human activities (use of chemicals, pesticides) conducted within the site or when impacted from adjacent sites. To mitigate environmental risk, business units have established protocols and due diligence standards to identify environmental issues in advance of acquisition. Historical and background investigation and subsequent soil and ground water subsurface testing may be conducted as required to assess manageable environmental risk. Regular property inspections and limitations on permitted activities further manage environmental liability or financial risk. Other potentially significant financial risks for individual assets, such as fire and earthquake, have generally been insured where practicable.
Additional Risk Factors That May Affect Future Results
The Accounting Standards Board of the CICA makes changes to the financial accounting and reporting standards that govern the preparation of our financial statements. These changes may be difficult to anticipate and may materially impact how we record and present our financial condition and results of operations. As discussed under “Critical Accounting and Actuarial Policies”, the preparation of financial statements requires management to make estimates and assumptions that affect the reported amounts and disclosures made in the financial statements and accompanying notes. These estimates and assumptions may require revision and actual results may differ materially from these estimates. As well, as noted under “Cautionary Statement Concerning Forward-Looking Statements”, forward-looking statements involve risks and uncertainties and actual results may differ materially from those expressed or implied in such statements. Key risk factors and their management have been described above, summarized by major risk category.
Other factors that may affect future results include changes in government trade policy; monetary policy; fiscal policy; political conditions and developments in or affecting the countries in which we operate; technological changes; public infrastructure disruptions; climate change; changes in consumer spending and saving habits; the possible impact on local, national or global economies from public health emergencies, such as an influenza pandemic, and international conflicts and other developments including those relating to terrorist activities. Although we take steps to anticipate and minimize risks in general, unforeseen future events may have a negative impact on our business, financial condition and results of operations.
We caution that the preceding discussion of risks that may affect future results is not exhaustive. When relying on our forward-looking statements to make decisions with respect to our Company, investors and others should carefully consider the foregoing risks, as well as other uncertainties and potential events, and other external and Company specific risks that may adversely affect the future business, financial condition or results of operations of our Company.
| | | | |
| | Management’s Discussion and Analysis | | Manulife Financial Corporation 2012 Annual Report 59 |
Capital Management Framework
Manulife seeks to manage its capital with the objectives of:
| n | | Safeguarding commitments made to policyholders and customers; |
| n | | Prudently and effectively deploying the capital invested in the Company; |
| n | | Protecting or enhancing the Company’s reputation and brand; and |
| n | | Maintaining target financial strength ratings. |
Capital is managed and monitored in accordance with the Capital Management Policy, which is reviewed and approved by the Board of Directors annually. The policy is integrated with the Company’s risk and financial frameworks. It establishes guidelines regarding the quantity and quality of capital, internal capital mobility, and proactive management of ongoing and future capital requirements. The Board or its designated committees regularly review the Company’s capital position and capital plans. Operational oversight of capital management across the enterprise is provided by the Capital Committee, consisting of senior finance and risk management executives and chaired by the Chief Actuary.
Our capital management framework takes into account the requirements of the Company as a whole as well as the needs of each of our subsidiaries. Our capital adequacy assessment considers expectations of key external stakeholders such as regulators and rating agencies, results of sensitivity testing as well as a comparison to our peers. We set our internal capital targets above regulatory requirements, monitor against these internal targets and initiate actions appropriate to achieving our business objectives.
We also periodically assess the strength of our capital position under various stress scenarios. The annual Dynamic Capital Adequacy Testing (DCAT) typically quantifies the financial impact of economic events arising from shocks in public equity and other markets, interest rates and credit, amongst others. Our 2012 DCAT results demonstrate that we have sufficient assets to discharge policy liabilities in the various adverse scenarios tested.
We integrate capital management into our product planning and performance management. Capital is generally allocated to business lines based on the higher of the internal risk-based capital and the regulatory capital levels applicable to each jurisdiction.
In order to mitigate the impact of currency movements on the consolidated capital ratios, the currency mix of assets supporting capital is managed in relation to the Company’s global capital requirements. As a result, both available and required capital rise (fall) when the Canadian dollar weakens (strengthens).
The composition of capital between equity and other capital instruments impacts the Company’s financial strength ratings and therefore is an important consideration in determining the appropriate amount of leverage. The Company monitors and rebalances its capital mix through capital issuances and redemptions.
MFC Consolidated Capital
The following measure of capital serves as the foundation of our capital management activities at the MFC level.
| | | | | | | | | | | | | | |
As at December 31, (C$ millions) | | 2012 | | | 2011 | | | 2010 | | | |
Non-controlling interest in subsidiaries | | $ | 501 | | | $ | 415 | | | $ | 410 | | | |
Participating policyholders’ equity | | | 146 | | | | 249 | | | | 160 | | | |
Preferred shares | | | 2,497 | | | | 1,813 | | | | 1,422 | | | |
Common shareholders’ equity | | | 22,952 | | | | 22,402 | | | | 22,683 | | | |
Total equity(1) | | $ | 26,096 | | | $ | 24,879 | | | $ | 24,675 | | | |
Less accumulated other comprehensive loss on cash flow hedges | | | (50 | ) | | | (91 | ) | | | (55 | ) | | |
Total equity less accumulated other comprehensive loss on cash flow hedges | | $ | 26,146 | | | $ | 24,970 | | | $ | 24,730 | | | |
Liabilities for preferred shares and qualifying capital instruments | | | 3,501 | | | | 4,012 | | | | 4,004 | | | |
Total capital | | $ | 29,647 | | | $ | 28,982 | | | $ | 28,734 | | | |
| (1) | Total equity includes unrealized gains and losses on AFS bonds and AFS equities, net of taxes. The unrealized gain or loss on AFS bonds are excluded from the OSFI definition of regulatory capital. As at December 31, 2012, the gain on AFS bonds, net of taxes, was $312 (2011 – $193). |
At December 31, 2012, the Company’s capital increased by $0.6 billion compared to December 31, 2011. The increases included net earnings of $1.7 billion and net capital raised of $0.2 billion, partially offset by $0.7 billion impact of the stronger Canadian dollar and cash dividends in 2012 of $0.7 billion.
The “Total capital” above does not include $5.5 billion (2011 – $5.5 billion, 2010 – $5.8 billion) of senior indebtedness issued by MFC because this form of financing does not meet OSFI’s definition of regulatory capital at the MFC level. The Company has down-streamed the proceeds from this financing into operating entities in the form that qualifies as regulatory capital at the subsidiary level. Rating agencies expect companies to limit this and other sources of financial leverage to levels appropriate for their ratings.
Capital and Funding Activities
During 2012 we raised $1,200 million of capital and redeemed $1,000 million through the following transactions:
| n | | We issued $500 million of MLI (4.165%) subordinated debentures on February 17, 2012. |
| | | | |
| 60 Manulife Financial Corporation 2012 Annual Report | | Management’s Discussion and Analysis | | |
| n | | We issued a total of $700 million of preferred shares during the year: $250 million (4.60%) on February 22, 2012, $250 million (4.40%) on May 24, 2012 and $200 million (4.00%) on December 4, 2012. |
| n | | We redeemed a total of $1,000 million of capital notes issued by Manulife Financial Capital Trust, qualifying as regulatory Innovative Tier 1 capital, on June 30, 2012, comprising $60 million of Series A Units (7.00%) and $940 million of Series B Units (6.70%). |
In 2013, $350 million of MFC’s senior indebtedness (4.67%) matures on March 28, 2013.
Common Shareholder Dividends and Dividend Payout Ratio
The declaration and payment of shareholder dividends and the amount thereof are at the discretion of the Board and depend upon the results of operations, financial conditions, cash requirements and future prospects of the Company, taking into account regulatory restrictions on the payment of shareholder dividends as well as other factors deemed relevant by the Board.
The Company offers a Dividend Reinvestment Program (“DRIP”) whereby shareholders may elect to automatically reinvest dividends in the form of MFC common shares instead of receiving cash. The offering of the program and its terms of execution are subject to the Board’s discretion. Participation in the DRIP is strong, with enrolment of approximately one-third of shares outstanding. In 2012 we issued 26 million common shares (2011 – 23 million) for a total consideration of $318 million (2011 ��� $298 million) under this program.
Regulatory Capital Position14
The Company monitors and manages consolidated capital for MFC in compliance with the OSFI Guideline A2 – Capital Regime for Regulated Insurance Holding Companies and Non-Operating Life Companies. Under this regime our consolidated available capital is measured against a required amount of risk capital determined in accordance with the guideline. The capital position of consolidated MFC operations remains in excess of our internal targets.
MFC’s operating activities are mostly conducted within MLI or its subsidiaries. MLI is regulated by OSFI and is subject to consolidated risk based capital requirements using the OSFI MCCSR framework. Some affiliate reinsurance business is undertaken outside the MLI consolidated framework.
Our MCCSR ratio for MLI ended the year at 211 per cent. In addition to earnings and capital funding activities, regulatory capital requirements were supported by reinsurance transactions executed in 2012. These external reinsurance transactions related to the U.S. fixed deferred annuity businesses as well as Japan Universal Life business and jointly improved the year end MCCSR position by approximately six points.
We consider MLI’s MCCSR ratio strong in view of our materially reduced risk sensitivities, the fact that we have capitalized most of the unfavourable impact of the current low interest rate environment and the lack of explicit capital credit for the hedging of our variable annuity liabilities. We have achieved our equity market and interest rate risk targets two years ahead of schedule.
The 2013 MCCSR Guideline contains two changes that will each significantly impact MLI’s regulatory capital ratio. Using recent data and analysis, OSFI reduced requirements for lapse risk capital. As a result, MLI’s MCCSR ratio would increase by approximately four points on a pro forma basis as of January 1, 2013. OSFI also aligned the capital rules with the new accounting standard for defined benefits pension plans (IAS 19R). The initial reduction in available capital resulting from unrealized losses on the Company’s own pension plans will be amortized for regulatory capital purposes on a straight line basis to December 31, 2014, for a total of approximately five points reduction in the ratio by the end of 2014. Future unrealized gains and losses recorded under this standard will be amortized into regulatory capital over twelve quarters, thus mitigating potential volatility of the new rules.
MLI’s non-consolidated operations and subsidiaries all maintained capital levels in excess of local requirements as at December 31, 2012.In particular, Manulife Canada Ltd., an OSFI regulated Canadian operating insurance company, had an MCCSR ratio of 232 per cent, above the regulator’s supervisory target of 150 per cent.
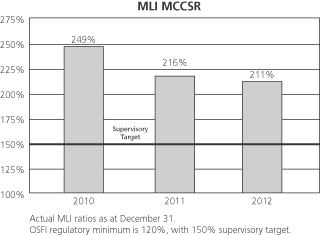
| 14 | The risk management section of the MD&A outlines a number of regulatory capital risks. |
| | | | |
| | Management’s Discussion and Analysis | | Manulife Financial Corporation 2012 Annual Report 61 |
Credit Ratings
Manulife Financial’s insurance operating companies have strong ratings from the credit rating agencies for financial strength and claims paying ability. Maintaining strong ratings on debt and capital instruments issued by MFC and its subsidiaries allows us to access the capital markets at competitive pricing levels. Should these credit ratings decrease materially, our cost of financing may increase and our access to funding and capital through the capital markets could be reduced.
During 2012, S&P, Moody’s, Fitch, DBRS and A.M. Best maintained their assigned ratings. At December 31, 2012, S&P, Moody’s, DBRS and A.M. Best had a stable outlook on the ratings of our insurance operating companies and Fitch had a negative outlook. In February 2013, Fitch affirmed the financial strength ratings of our insurance operating companies and credit ratings and maintained the negative outlook.
The following table summarizes the financial strength and claims paying ability ratings of MLI and certain of its subsidiaries as at March 12, 2013.
Financial Strength/Claims Paying Ability Ratings
| | | | | | | | | | |
| | | S&P | | Moody’s | | DBRS | | Fitch | | A.M. Best |
The Manufacturers Life Insurance Company | | AA- | | A1 | | IC-1 | | AA- | | A+ |
John Hancock Life Insurance Company (U.S.A.) | | AA- | | A1 | | Not Rated | | AA- | | A+ |
Manulife (International) Limited | | AA- | | Not Rated | | Not Rated | | Not Rated | | Not Rated |
Manulife Life Insurance Company (Japan) | | AA- | | Not Rated | | Not Rated | | Not Rated | | Not Rated |
| | | | |
| 62 Manulife Financial Corporation 2012 Annual Report | | Management’s Discussion and Analysis | | |
Critical Accounting and Actuarial Policies
The preparation of financial statements in accordance with IFRS requires management to make estimates and assumptions that affect the reported amounts and disclosures made in the consolidated financial statements and accompanying notes. These estimates and assumptions are based on historical experience, management’s assessment of current events and conditions and activities that the Company may undertake in the future as well as possible future economic events. Actual results could differ from these estimates. The estimates and assumptions described in this section depend upon subjective or complex judgments about matters that may be uncertain and changes in these estimates and assumptions could materially impact the consolidated financial statements.
Our significant accounting policies are described in note 1 to the Consolidated Financial Statements. Significant estimation processes relate to the determination of insurance and investment contract liabilities, fair value of certain financial instruments, derivatives and hedge accounting, provisioning for asset impairment, determination of pension and other post-employment benefit obligations and expenses, income taxes and uncertain tax positions and valuation of goodwill and intangible assets as described below. In addition, in the determination of the fair values of invested assets, where observable market data is not available, management applies judgment in the selection of valuation models.
Policy Liabilities
Policy liabilities for IFRS are valued under standards established by the Canadian Institute of Actuaries. These standards are designed to ensure we establish an appropriate liability on the balance sheet to cover future obligations to all our policyholders. Under IFRS, the assumptions underlying the valuation of policy liabilities are required to be reviewed and updated on an ongoing basis to reflect recent and emerging trends in experience and changes in risk profile of the business. In conjunction with prudent business practices to manage both product and asset related risks, the selection and monitoring of appropriate valuation assumptions is designed to minimize our exposure to measurement uncertainty related to policy liabilities.
Determination of Policy Liabilities
Policy liabilities have two major components: a best estimate amount and a provision for adverse deviation. The best estimate amount represents the estimated value of future policyholder benefits and settlement obligations to be paid over the term remaining on in-force policies, including the costs of servicing the policies. The best estimate amount is reduced by the future expected policy revenues and future expected investment income on assets supporting the policies, before any consideration for reinsurance ceded. To determine the best estimate amount, assumptions must be made for a number of key factors, including future mortality and morbidity rates, investment returns, rates of policy termination, operating expenses, certain taxes (other than income taxes) and foreign currency. Reinsurance is used to transfer part or all of a policy liability to another insurance company at terms negotiated with that insurance company. A separate asset for reinsurance ceded is calculated based on the terms of the reinsurance treaties that are in force, with deductions taken for the credit standing of the reinsurance counterparties where appropriate.
To recognize the uncertainty involved in determining the best estimate actuarial liability assumptions, a provision for adverse deviation (“PfAD”) is established. The PfAD is determined by including a margin of conservatism for each assumption to allow for possible mis-estimation of, or deterioration in, future experience in order to provide greater comfort that the policy liabilities will be sufficient to pay future benefits. The Canadian Institute of Actuaries establishes suggested ranges for the level of margins for adverse deviation based on the risk profile of the business. Our margins are set taking into account the risk profile of our business. The effect of these margins is to increase policy liabilities over the best estimate assumptions. The margins for adverse deviation decrease the income that is recognized at the time a new policy is sold and increase the income recognized in later periods as the margins release as the remaining policy risks reduce.
Best Estimate Assumptions
We follow established processes to determine the assumptions used in the valuation of our policy liabilities. The nature of each risk factor and the process for setting the assumptions used in the valuation are discussed below.
Mortality
Mortality relates to the occurrence of death. Mortality assumptions are based on our internal as well as industry past and emerging experience and are differentiated by sex, underwriting class, policy type and geographic market. We make assumptions about future mortality improvements using historic experience derived from population data. Reinsurance is used to offset some of our direct mortality exposure on in-force life insurance policies with the impact of the reinsurance directly reflected in our policy valuation. Actual mortality experience is monitored against these assumptions separately for each business. Where mortality rates are lower than assumed for life insurance the result is favourable, and where mortality rates are higher than assumed for payout annuities, mortality results are favourable. Overall 2012 experience was favourable when compared with our assumptions. Changes to future expected mortality assumptions in the policy liabilities in 2012 resulted in a reduction in policy liabilities.
Morbidity
Morbidity relates to the occurrence of accidents and sickness for the insured risks. Morbidity assumptions are based on our internal as well as industry past and emerging experience and are established for each type of morbidity risk and geographic market. For our Long-Term Care business we make assumptions about future morbidity improvements. Actual morbidity experience is monitored
| | | | |
| | Management’s Discussion and Analysis | | Manulife Financial Corporation 2012 Annual Report 63 |
against these assumptions separately for each business. Our morbidity risk exposure relates to future expected claims costs for long-term care insurance, as well as for group benefits and certain individual health insurance products we offer. Overall 2012 experience was unfavourable when compared with our assumptions.
Property and Casualty
Our Property and Casualty Reinsurance business insures against losses from natural and human disasters and accidental events. Policy liabilities are held for incurred claims not yet reported, for claims reported but not yet paid and for expected future claims related to premiums paid to date. In 2011, we had significant adverse experience on business assumed on our retrocession business related to the earthquakes in Japan and New Zealand. Our 2012 claims loss experience was favourable with respect to the provisions that were established.
Policy Termination and Premium Persistency
Policy termination includes lapses and surrenders, where lapses represent the termination of policies due to non-payment of premiums and surrenders represent the voluntary termination of policies by policyholders. Premium persistency represents the level of ongoing deposits on contracts where there is policyholder discretion as to the amount and timing of deposits. Policy termination and premium persistency assumptions are primarily based on our recent experience adjusted for expected future conditions. Assumptions reflect differences by type of contract within each geographic market and actual experience is monitored against these assumptions separately for each business. Overall 2012 experience was unfavourable when compared to our assumptions. Revisions were made to future expected policyholder behaviour assumptions for Guaranteed Minimum Withdrawal products associated with segregated funds and for certain insurance businesses in the U.S. and Japan in 2012 to reflect the emerging experience, resulting in significant increases in policy liabilities.
Expenses and Taxes
Operating expense assumptions reflect the projected costs of maintaining and servicing in-force policies, including associated overhead expenses. The expenses are derived from internal cost studies and are projected into the future with an allowance for inflation. For some developing businesses, there is an expectation that unit costs will decline as these businesses mature. Actual expenses are monitored against assumptions separately for each business. Overall maintenance expenses for 2012 were unfavourable when compared with our assumptions. Taxes reflect assumptions for future premium taxes and other non-income related taxes. For income taxes, policy liabilities are adjusted only for temporary tax timing and permanent tax rate differences on the cash flows available to satisfy policy obligations.
Investment Returns
We segment assets to support liabilities by business segment and geographic market and establish investment strategies for each liability segment. The projected cash flows from these assets are combined with projected cash flows from future asset purchases/sales to determine expected rates of return for future years. The investment strategies for future asset purchases and sales are based on our target investment policies for each segment and the re-investment returns are derived from current and projected market rates for fixed interest investments and our projected outlook for non-fixed interest assets. Credit losses are projected based on our own and industry experience, as well as specific reviews of the current investment portfolio. Investment return assumptions for each asset class also incorporate expected investment management expenses that are derived from internal cost studies. In 2012, actual investment returns were unfavourable when compared to our assumptions. Overall investment results, excluding returns on variable annuities, were favourable. While the decline in interest rates was adverse in the year, this unfavourable experience was more than offset by gains from asset trading and origination activity.
Segregated Funds
We offer segregated funds to policyholders that offer certain guarantees, including guaranteed returns of principal on maturity or death, as well as guarantees of minimum withdrawal amounts or income benefits. The on-balance sheet liability for these benefits is the expected cost of these guarantees including appropriate valuation margins for the various contingencies including mortality and lapse. The most dominant assumption is the return on the underlying funds in which the policyholders invest. This risk is mitigated through a dynamic hedging strategy. In 2012, experience on assets underlying segregated fund business which has guarantees due to changes in market value of funds under management was favourable for both the business that is hedged and the business that is not hedged. Note that an unchanged market or an increase of less than our expected returns will still result in an earnings loss, since actual returns would not meet the expected returns in the valuation models.
Foreign Currency
Foreign currency risk results from a mismatch of the currency of the policy liabilities and the currency of the assets designated to support these obligations. We generally match the currency of our assets with the currency of the liabilities they support, with the objective of mitigating the risk of loss arising from movements in currency exchange rates. Where a currency mismatch exists, the assumed rate of return on the assets supporting the liabilities is reduced to reflect the potential for adverse movements in exchange rates.
Experience Adjusted Products
Where policies have features that allow the impact of changes in experience to be passed on to policyholders through policy dividends, experience rating refunds, credited rates or other adjustable features, the projected policyholder benefits are adjusted to reflect the projected experience. Minimum contractual guarantees and other market considerations are taken into account in determining the policy adjustments.
| | | | |
| 64 Manulife Financial Corporation 2012 Annual Report | | Management’s Discussion and Analysis | | |
Provision for Adverse Deviation
The aggregate provision for adverse deviation is the sum of the provisions for adverse deviation for each risk factor. Margins for adverse deviation are established by product type and geographic market for each assumption or factor used in the determination of the best estimate actuarial liability. The margins are established based on the risk characteristics of the business being valued.
In addition to the explicit margin for adverse deviation, the valuation basis for segregated fund liabilities explicitly limits the future revenue recognition in the valuation basis to the amount necessary to offset acquisition expenses, after allowing for the cost of any guarantee features. The fees that are in excess of this limitation are reported as an additional margin and are shown in segregated fund non-capitalized margins.
The provision for adverse deviation and the future revenue deferred in the valuation due to the limitations on recognition of future revenue in the valuation of segregated fund liabilities are shown in the table below.
| | | | | | | | | | |
As at December 31, (C$ millions) | | 2012 | | | 2011 | | | |
Best estimate actuarial liability(1) | | $ | 135,822 | | | $ | 134,514 | | | |
Provision for adverse deviation | | | | | | | | | | |
Insurance risks (mortality/morbidity) | | $ | 10,181 | | | $ | 9,008 | | | |
Policyholder behavior (lapse/surrender/premium persistency) | | | 3,216 | | | | 3,074 | | | |
Expenses | | | 1,940 | | | | 1,747 | | | |
Investment risks (non-credit) | | | 18,343 | | | | 18,634 | | | |
Investment risks (credit) | | | 1,294 | | | | 1,394 | | | |
Segregated fund guarantees | | | 4,442 | | | | 5,240 | | | |
Other | | | 10 | | | | 18 | | | |
Total provision for adverse deviation (PfAD)(1) | | $ | 39,426 | | | $ | 39,115 | | | |
Segregated funds – additional margins | | | 8,571 | | | | 8,686 | | | |
Total of PfAD and additional segregated fund margins | | $ | 47,997 | | | $ | 47,801 | | | |
| (1) | Reported actuarial liabilities as at December 31, 2012 of $175,248 (2011 – $173,629) are composed of $135,822 (2011 – $134,514) of best estimate actuarial liability and $39,426 (2011 – $39,115) of PfAD. |
The change in PfAD from period to period is impacted by changes in liability and asset composition, by movements in currency and movements in interest rates and by material changes in valuation assumptions. The overall increase in PfADs for insurance risks and policyholder behavior was driven by the decline in interest rates during the year resulting in a reduction in the discount rates used to value the PfADs. The decline in segregated fund guarantee PfADs was due to improved equity markets over the year.
Sensitivity of Earnings to Changes in Assumptions
When the assumptions underlying our determination of policy liabilities are updated to reflect recent and emerging experience or change in outlook, the result is a change in the value of policy liabilities which in turn affects income. The sensitivity of after-tax income to changes in non-economic and certain asset related assumptions underlying policy liabilities is shown below, and assumes that there is a simultaneous change in the assumptions across all business units.
For changes in asset related assumptions, the sensitivity is shown net of the corresponding impact on income of the change in the value of the assets supporting liabilities. In practice, experience for each assumption will frequently vary by geographic market and business and assumption updates are made on a business/geographic specific basis. Actual results can differ materially from these estimates for a variety of reasons including the interaction among these factors when more than one changes, changes in actuarial and investment return and future investment activity assumptions, actual experience differing from the assumptions, changes in business mix, effective tax rates and other market factors, and the general limitations of our internal models.
Most participating business is excluded from this analysis because of the ability to pass both favourable and adverse experience to the policyholders through the participating dividend adjustment.
Sensitivity of Insurance Contract Liabilities to Changes in Non-economic Assumptions
| | | | | | | | | | |
For the years ended December 31, (C$ millions) | | Decrease in after-tax income | | | |
| | 2012 | | | 2011 | | | |
Policy Related Assumptions | | | | | | | | | | |
2% adverse change in future mortality rates(1),(3) | | | | | | | | | | |
Products where an increase in rates increases policy liabilities | | $ | (200 | ) | | $ | (200 | ) | | |
Products where a decrease in rates increases policy liabilities | | | (300 | ) | | | (300 | ) | | |
5% increase in future morbidity rates(2),(3) | | | (1,400 | ) | | | (1,200 | ) | | |
10% adverse change in future termination rates(3) | | | (1,400 | ) | | | (1,200 | ) | | |
5% increase in future expense levels | | | (400 | ) | | | (300 | ) | | |
| (1) | An increase in mortality rates will generally increase policy liabilities for life insurance contracts whereas a decrease in mortality rates will generally increase policy liabilities for policies with longevity risk such as payout annuities. |
| (2) | No amounts related to morbidity risk are included for policies where the policy liability provides only for claims costs expected over a short period, generally less than one year, such as Group Life and Health. |
| (3) | The impacts of the sensitivities on LTC for morbidity, mortality and lapse are assumed to be moderated by partial offsets from the Company’s ability to contractually raise premium rates in such events, subject to state regulatory approval. |
| | | | |
| | Management’s Discussion and Analysis | | Manulife Financial Corporation 2012 Annual Report 65 |
We have updated our disclosure to show the estimated impact on net income attributed to shareholders for the next five years and the following five years from changes in fixed income ultimate reinvestment rates (URR) driven by changes in risk free rates.
The table below shows the potential impact on annual net income attributed to shareholders where the URR is determined assuming that risk free rates remain at their starting December 31, 2012 levels. It also shows the potential impact if the URR were determined using risk free rates that are assumed to immediately rise or immediately fall by 50 basis points and then stay at these new levels. We also provide pro-forma estimates as at December 31, 2011 developed using our previously disclosed URR sensitivities. For these pro-forma estimates we assume that assets, liabilities and the interest rate environment are those which were used to value policy liabilities at that time.
Canadian actuarial standards of practice require that policy liabilities be at least as great as the largest value produced by a set of prescribed reinvestment scenarios. The impacts below assume that the URR changes implied by these shocks do not change which reinvestment scenario produces the largest reserve.
Potential impact on aggregate next five years and the following five years net income attributed to shareholders arising from potential changes to the fixed income ultimate reinvestment rates (URR)(1)
| | | | | | | | | | | | | | | | | | | | |
As at December 31, (C$ millions) | | 2012 | | | | | 2011 |
| For the periods | | 2013 – 2017 | | | 2018 – 2022 | | | | | 2012 – 2016 | | | 2017 – 2021 | | | |
Risk free rates remain at December 31, 2012 and December 31, 2011 levels, respectively. | | $ | (1,600 | ) | | $ | (300 | ) | | | | $ | (2,100 | ) | | $ | (500 | ) | | |
Risk free rates rise 50 bp immediately from their December 31, 2012 or December 31, 2011, levels respectively, and then remain at those new levels thereafter. | | $ | (900 | ) | | $ | – | | | | | $ | (1,300 | ) | | $ | (200 | ) | | |
Risk free rates fall 50 bp immediately from their December 31, 2012 or December 31, 2011 levels, respectively, and then remain at those new levels thereafter. | | $ | (2,200 | ) | | $ | (500 | ) | | | | $ | (2,700 | ) | | $ | (700 | ) | | |
| (1) | Current URRs in Canada are 1.00% per annum and 3.00% per annum for short and long-term bonds, respectively, and in the U.S. are 0.80% per annum and 3.60% per annum for short and long-term bonds, respectively. The URRs are based upon a five and ten year rolling average of government bond rates and the URR valuation assumptions are currently higher than the December 31, 2012 government bond rates. |
Potential impact on net income attributed to shareholders arising from changes to asset related assumptions supporting actuarial liabilities, excluding the fixed income ultimate reinvestment rate discussed above
| | | | | | | | | | | | | | | | | | | | |
As at December 31, (C$ millions) | | Increase (decrease) in after-tax income | | | |
| | 2012 | | | | | 2011 | | | |
| | Increase | | | Decrease | | | | | Increase | | | Decrease | | | |
Asset related assumptions updated periodically in valuation basis changes | | | | | | | | | | | | | | | | | | | | |
100 basis point change in future annual returns for publicly traded equities(1) | | $ | 800 | | | $ | (900 | ) | | | | $ | 900 | | | $ | (900 | ) | | |
100 basis point change in future annual returns for alternative long-duration assets(2) | | | 3,900 | | | | (4,000 | ) | | | | | 4,200 | | | | (3,800 | ) | | |
100 basis point change in equity volatility assumption for stochastic segregated fund modeling(3) | | | (300 | ) | | | 300 | | | | | | (300 | ) | | | 300 | | | |
| (1) | Expected long-term annual market growth assumptions for public equities pre-dividends for key markets are based on long-term historical observed experience and are 7.6% per annum in Canada, 7.6% per annum in the U.S. and 5.3% per annum in Japan. Growth assumptions for European equity funds are market-specific and vary between 5.8% and 7.85%. These returns are then reduced by margins for adverse deviation to determine net yields used in the valuation. The amount includes the impact on both segregated fund guarantee reserves and on other policy liabilities. For a 100 basis point increase in expected growth rates, the impact from segregated fund guarantee reserves is $500 million (2011 – $700 million). For a 100 basis point decrease in expected growth rates, the impact from segregated fund guarantee reserves is $(600) million (2011 – $(700) million). |
| (2) | Alternative long-duration assets include commercial real estate, timber and agricultural real estate, oil and gas, and private equities. The assumed returns on alternative long-duration assets net of provisions for adverse deviation and after taking into account the impact of differential taxation, have a similar impact on policyholder liabilities as the assumptions for public equities. The increased sensitivity from December 31, 2011 to December 31, 2012 is primarily related to the decline in fixed income rates over the year (reducing the rate at which funds can reinvest in) as well as the change in foreign exchange rates in the year. |
| (3) | Volatility assumptions for public equities are based on long-term historic observed experience and compliance with actuarial standards. The resulting volatility assumptions are 17.15% per annum in Canada and 17.15% per annum in the U.S. for large cap public equities, and 19% per annum in Japan. For European equity funds, the volatility varies between 16.15% and 18.35%. |
The sensitivity to changes in public equity returns remains unchanged from 2011. Market returns in 2012 were below the expected returns assumed in the valuation which increased sensitivity, but this was offset by the increased amounts of dynamic hedges that were put in place in 2012. The increase in sensitivity to a 100 basis point change in returns for other alternative long-duration assets is primarily related to the decline in fixed income rates over the year, which reduces the rate at which we can reinvest, as well as the change in foreign exchange rates over the year.
Review of Actuarial Methods and Assumptions
The 2012 full year review of the actuarial methods and assumptions underlying policy liabilities produced an increase in the policy liabilities of $2,686 million net of reinsurance ceded, and includes $214 million attributed to participating policyholders. Net of the
| | | | |
| 66 Manulife Financial Corporation 2012 Annual Report | | Management’s Discussion and Analysis | | |
impacts on participating policyholder surplus and minority interests, this resulted in a decrease in net income attributed to shareholders of $1,757 million post-tax including $677 million related to updates to the URR.
In conjunction with prudent best practices to manage both product and asset related risks, the selection and monitoring of assumptions appropriate to the business is designed to minimize our exposure to measurement uncertainty related to policy liabilities. While the assumptions selected represent the Company’s current best estimates and assessment of risk, the ongoing monitoring of experience and the economic environment is likely to result in future changes to the valuation assumptions, which could be material.
The following table summarizes the full year 2012 impact of changes in actuarial methods and assumptions, other than changes to the fixed income URR, on policy liabilities and net income attributed to shareholders by the three main drivers.
For the year ended December 31, 2012
| | | | | | | | | | |
(C$ millions) Assumption | | To Policy Liabilities | | | To Net Income Attributed to
Shareholders | | | |
Related to the URR | | $ | 983 | | | $ | (677 | ) | | |
Related to updates to actuarial standards | | | | | | | | | | |
Segregated fund equity calibration | | $ | 317 | | | $ | (244 | ) | | |
Largely related to current macro-economic environment | | | | | | | | | | |
USVA GMWB update for withdrawal and lapse assumptions | | $ | 722 | | | $ | (469 | ) | | |
Stochastic bond parameter update | | | 595 | | | | (427 | ) | | |
Life insurance lapse updates | | | 296 | | | | (194 | ) | | |
Other interest rate related impacts | | | 258 | | | | (30 | ) | | |
| | | $ | 1,871 | | | $ | (1,120 | ) | | |
Other annual updates | | | | | | | | | | |
Mortality and morbidity updates | | $ | (196 | ) | | $ | 166 | | | |
Expense updates | | | (206 | ) | | | 142 | | | |
Other lapse updates | | | 144 | | | | (134 | ) | | |
Alternative asset modeling refinements and assumption updates | | | 215 | | | | (178 | ) | | |
Refinement to corporate spread modeling | | | (249 | ) | | | 167 | | | |
Update to VA hedge business margin | | | (179 | ) | | | 126 | | | |
Other | | | (14 | ) | | | (6 | ) | | |
| | | $ | (485 | ) | | $ | 283 | | | |
| Net impact excluding changes in URR | | $ | 1,703 | | | $ | (1,081 | ) | | |
Related to updates to actuarial standards
Actuarial standards related to equity calibration for stochastic models used to value segregated fund liabilities were updated in 2012. The implementation of those changes resulted in a $244 million charge to earnings.
Related to changes in the macro-economic environment
Withdrawal and utilization assumptions were strengthened for U.S. Variable Annuity Guaranteed Minimum Withdrawal Benefit business to reflect emerging experience where previously there was limited to no experience. This resulted in a charge to earnings of $469 million.
The low interest rate environment has resulted in an update to the bond parameters used in the stochastic valuation of our segregated fund business. Mean returns generally declined, while volatility parameters were largely unchanged. This resulted in a $427 million charge to earnings.
Lapse rates for certain U.S. Universal Life products with interest guarantees and for certain Japan term insurance businesses were updated to reflect reduced policyholder lapse experience, resulting in a $194 million charge to earnings.
Interest rates were updated for certain participating business in Canada, resulting in a charge to shareholder earnings of $30 million based on our estimate of the amount of future benefits that may have to be covered by the shareholder account.
Other annual updates
Updates to other liability related assumptions were the result of the annual review or monitoring of assumptions and resulted in a $283 million favourable impact to income. Mortality gains of $166 million included gains for updates to morbidity assumptions in Japan and refinement of mortality assumptions in certain U.S. life insurance segments, offset by charges for strengthening of mortality assumptions for Canadian annuity and segregated fund businesses. A charge of $134 million was the result of updates to lapse assumptions for Japan and Canadian insurance products.
Updates to expenses resulted in a $142 million favourable income impact, and were the result of favourable investment expenses partly offset by an update to letter of credit costs in the U.S.
Various refinements to the modeling of alternate asset cash flows and offset by updates to return assumptions resulted in a charge to shareholder income of $178 million.
| | | | |
| | Management’s Discussion and Analysis | | Manulife Financial Corporation 2012 Annual Report 67 |
A $167 million favourable income impact resulted from refinements to the modeling of corporate spreads.
A reduction in valuation margins for segregated fund business that is dynamically hedged resulted in a $126 million benefit to shareholders’ earnings.
A $6 million net reduction in shareholders’ earnings related to refinements in policyholder cash flows included a charge for the provisioning of the anticipated future earnings impact from valuation systems conversions, largely offset by the realized benefits from modeling of future tax timing differences.
Change in Insurance Contract Liabilities
The change in insurance contract liabilities can be attributed to several sources: new business, acquisitions, in-force movement and currency impact. Changes in insurance contract liabilities are substantially offset in the financial statements by premiums, investment income, policy benefits and other policy related cash flows. The changes in insurance contract liabilities by business segment are shown below:
2012 Insurance Contract Liability Movement Analysis
| | | | | | | | | | | | | | | | | | | | | | |
| (C$ millions) | | Asia Division | | | Canadian
Division | | | U.S. Division | | | Corporate
and Other | | | Total | | | |
Balance, January 1, 2012 | | $ | 26,733 | | | $ | 47,144 | | | $ | 105,431 | | | $ | 330 | | | $ | 179,638 | | | |
New business | | $ | 751 | | | $ | 67 | | | $ | 1,732 | | | $ | – | | | $ | 2,550 | | | |
In-force movement | | | 3,035 | | | | 2,244 | | | | (4,902 | ) | | | (510 | ) | | | (133 | ) | | |
Changes in methods & assumptions | | | 147 | | | | 1,155 | | | | 1,367 | | | | 17 | | | | 2,686 | | | |
Currency impact | | | (1,502 | ) | | | (1 | ) | | | (2,328 | ) | | | (3 | ) | | | (3,834 | ) | | |
Total net changes | | $ | 2,431 | | | $ | 3,465 | | | $ | (4,131 | ) | | $ | (496 | ) | | $ | 1,269 | | | |
Balance, December 31, 2012 | | $ | 29,164 | | | $ | 50,609 | | | $ | 101,300 | | | $ | (166 | ) | | $ | 180,907 | | | |
For new business, the segments with large positive general account premium revenue at contract inception show increases in policy liabilities. For segments where new business deposits are primarily into segregated funds, the increase in policy liabilities related to new business is small since the increase measures only general account liabilities. New business policy liability impact is negative when estimated future premiums, together with future investment income, are expected to be more than sufficient to pay estimated future benefits, policyholder dividends and refunds, taxes (excluding income taxes) and expenses on new policies issued.
The net in-force movement over the year was a decrease of $133 million. A material part of the in-force movement increase was related to the decline in interest rates and the resulting impact on the fair value of assets which back those policy liabilities. The $4.9 billion in-force reserve decrease in the U.S. Division during 2012 included a $6.9 billion decrease from reinsurance ceded arrangements entered into during the year. The decrease in the Corporate and Other segment was related to the settlement of claims in the Accident and Health Reinsurance operation that is closed to new business, and the Property and Casualty Reinsurance business.
The increase of $2,686 million from changes in methods and assumptions resulted in a decrease in pre-tax earnings.
Of the $2,417 million net increase in insurance contract liabilities related to new business and in-force movement, $2,647 million was an increase in actuarial liabilities. The remaining was a decrease of $230 million in other insurance contract liabilities.
The decrease in policy liabilities from currency reflects the appreciation of the Canadian dollar relative to the U.S. dollar as well as Japanese yen. To the extent assets are currency matched to liabilities, the decrease in insurance contract liabilities due to currency is offset by a corresponding decrease from currency in the value of assets supporting those liabilities.
2011 Insurance Contract Liability Movement Analysis
| | | | | | | | | | | | | | | | | | | | | | |
| (C$ millions) | | Asia Division | | | Canadian
Division | | | U.S. Division | | | Corporate
and Other | | | Total | | | |
Balance, January 1, 2011 | | $ | 21,379 | | | $ | 42,317 | | | $ | 85,569 | | | $ | 1,215 | | | $ | 150,480 | | | |
New business | | $ | 273 | | | $ | 444 | | | $ | 1,635 | | | $ | (2 | ) | | $ | 2,350 | | | |
In-force movement | | | 4,135 | | | | 4,029 | | | | 14,570 | | | | (917 | ) | | | 21,817 | | | |
Changes in methods & assumptions | | | 77 | | | | 352 | | | | 1,107 | | | | 12 | | | | 1,548 | | | |
Currency impact | | | 869 | | | | 2 | | | | 2,550 | | | | 22 | | | | 3,443 | | | |
Total net changes | | $ | 5,354 | | | $ | 4,827 | | | $ | 19,862 | | | $ | (885 | ) | | $ | 29,158 | | | |
Balance, December 31, 2011 | | $ | 26,733 | | | $ | 47,144 | | | $ | 105,431 | | | $ | 330 | | | $ | 179,638 | | | |
For new business, the segments with large positive general account premium revenue at contract inception show large increases in policy liabilities. For segments where new business deposits are primarily into segregated funds, the increase in policy liabilities related to new business is small since the increase measures only general account liabilities. New business policy liability impact is negative when estimated future premiums, together with future investment income, are expected to be more than sufficient to pay estimated future benefits, policyholder dividends and refunds, taxes (excluding income taxes) and expenses on new policies issued.
| | | | |
| 68 Manulife Financial Corporation 2012 Annual Report | | Management’s Discussion and Analysis | | |
The in-force movement over the year was an increase of $21,817 million. A material part of the in-force movement increase was related to the decline in interest rates and the resulting impact on the fair value of assets which back those liabilities. The decrease in the Corporate and Other segment was related to the sale of the Reinsurance Life Retrocession business and John Hancock Accident and Health operation that is closed to new business and running off.
Of the $24,167 million net increase in insurance contract liabilities related to new business and in-force movement, $23,634 million was an increase in actuarial liabilities. The remaining was an increase of $533 million in other insurance contract liabilities.
The increase in policy liabilities from currency reflects the depreciation of the Canadian dollar relative to the U.S. dollar as well as Japanese yen. To the extent assets are currency matched to liabilities, the increase in insurance contract liabilities due to currency is offset by a corresponding increase from currency in the value of assets supporting those liabilities.
Consolidation
Consolidation is required for those entities in which the Company, directly or indirectly, has power to exercise control over financial and operating policies in order to gain economic benefits. The existence and effect of potential voting rights that are currently exercisable or convertible are considered in assessing whether the Company controls another entity. Special Purpose Entities (“SPEs”) are consolidated when the substance of the relationship between the Company and that entity indicates control.
Potential indicators of control include an assessment of the Company’s exposure to the risks and benefits of the SPE. This assessment of risks and benefits is based on arrangements in place and the assessed risk exposures at inception. The initial assessment is reconsidered at a later date if:
| | a) | the Company acquires additional interests in the entity; |
| | b) | the contractual arrangements of the entity are amended such that the relative exposure to risks and benefits change; or |
| | c) | the Company acquires control over the main operating and financial decisions of the entity. |
Subsidiaries are consolidated from the date on which control is transferred to the Company and cease to be consolidated from the date that control ceases.
Fair Value of Invested Assets
A large portion of the Company’s invested assets are recorded at fair value. Refer to note 1 to the 2012 Consolidated Financial Statements for a description of the methods used in determining fair value for applicable invested assets. When quoted prices in active markets are not available for a particular investment, significant judgment is required to determine an estimated fair value based on market standard valuation methodologies including discounted cash flow methodologies, matrix pricing or other similar techniques. The inputs to these market standard valuation methodologies include, but are not limited to: current interest rates or yields for similar instruments, credit rating of the issuer or counterparty, industry sector of the issuer, coupon rate, call provisions, sinking fund requirements, tenor (or expected tenor) of the instrument, management’s assumptions regarding liquidity and estimated future cash flows. Accordingly, the estimated fair values are based on available market information and management’s judgments about the key market factors impacting these financial instruments. Financial markets are susceptible to severe events evidenced by rapid depreciation in asset values accompanied by a reduction in asset liquidity. The Company’s ability to sell securities, or the price ultimately realized for these securities, depends upon the demand and liquidity in the market and increases the use of judgment in determining the estimated fair value of certain securities.
Evaluation of Invested Asset Impairment
AFS fixed income and equity securities are carried at fair market value, with changes in fair value recorded in Other Comprehensive Income (“OCI”) with the exception of unrealized gains and losses on foreign currency translation of AFS fixed income securities which are included in income. Impaired securities are reviewed on a regular basis and any fair value decrement is transferred out of Accumulated Other Comprehensive Income (“AOCI”) and recorded in income when it is deemed probable that the Company will not be able to collect all amounts due according to the contractual terms of a fixed income security or when fair value of an equity security has declined significantly below cost or for a prolonged period of time.
Provisions for impairments of mortgage loans and private placement loans are recorded with losses reported in earnings when there is no longer reasonable assurance as to the timely collection of the full amount of the principal and interest.
Significant judgment is required in assessing whether an impairment has occurred and in assessing fair values and recoverable values. Key matters considered include economic factors, company and industry specific developments and specific issues with respect to single issuers and borrowers.
Changes in circumstances may cause future assessments of asset impairment to be materially different from current assessments, which could require additional provisions for impairment. Additional information on the process and methodology for determining the allowance for credit losses is included in the discussion of credit risk in note 10 to the Consolidated Financial Statements.
Derivative Financial Instruments
The Company uses derivative financial instruments (“derivatives”) to manage exposures to foreign currency, interest rate, equity and other market risks arising from on-balance sheet financial instruments, selected anticipated transactions and certain guarantee related actuarial liabilities. Refer to note 5 to the 2012 Consolidated Financial Statements for a description of the methods used to determine the fair value of derivatives.
| | | | |
| | Management’s Discussion and Analysis | | Manulife Financial Corporation 2012 Annual Report 69 |
The accounting for derivatives is complex and interpretations of the primary accounting guidance continue to evolve in practice. Judgment is applied in determining the availability and application of hedge accounting designations and the appropriate accounting treatment under such accounting guidance. If it was determined that hedge accounting designations were not appropriately applied, reported net income could be materially affected. Differences in judgment as to the availability and application of hedge accounting designations and the appropriate accounting treatment may result in a differing impact on the consolidated financial statements of the Company from that previously reported. Assessments of hedge effectiveness and measurements of ineffectiveness of hedging relationships are also subject to interpretations and estimations and different interpretations or estimates may have a material effect on the amount reported in net income.
Employee Future Benefits
The Company maintains a number of plans providing pension (defined benefit and defined contribution) and other post-employment benefits to eligible employees and agents after employment. The largest of these are the defined benefit pension and retiree welfare plans in the U.S. and Canada that are the material plans discussed herein and that are the subject of the disclosures in note 17 to the 2012 Consolidated Financial Statements.
Due to the long-term nature of defined benefit pension and retiree welfare plans, the calculation of the defined benefit obligations and net benefit cost depends on various economic assumptions such as discount rates, expected rates of return on plan assets, health care cost trend rates and compensation increase rates. These assumptions are determined by management and are reviewed annually. Differences between actual and expected experience give rise to actuarial gains and losses that affect the amount of the defined benefit obligations and net benefit cost. The weighted average assumptions used, as well as the sensitivity of the obligations and net benefit cost to these assumptions, are presented in note 17 to the 2012 Consolidated Financial Statements.
During 2012, the actual experience for the material plans resulted in an actuarial loss of $2 million (2011 – $209 million) for the defined benefit pension plans and an actuarial gain of $72 million (2011 – loss of $34 million) for the retiree welfare plans. As at December 31, 2012, the actuarial gains and losses that had not yet been recognized in income amounted to a net unrecognized actuarial loss of $825 million (2011 – $990 million) for the defined benefit pension plans and a net unrecognized actuarial gain of $23 million (2011 – loss of $49 million) for the retiree welfare plans.
Contributions to the material broad based defined benefit pension plans are made in accordance with the regulations in the countries in which the plans are offered. During 2012, the Company contributed $37 million (2011 – $23 million) to these plans. As at December 31, 2012, the shortfall between plan assets and plan obligations was $95 million (2011 – $193 million). For 2013, the funding required for these broad-based defined benefit pension plans is expected to be approximately $21 million. The Company’s material supplemental pension plans for executives are unfunded; benefits under these plans are funded as they become due. During 2012, the Company made benefit payments of $62 million (2011 – $57 million) under these plans. As at December 31, 2012, the defined benefit obligations amounted to $727 million (2011 – $720 million).
The Company’s retiree welfare plans are partially funded, although there are no regulations or laws governing or requiring the funding of these plans. As at December 31, 2012, the shortfall between plan assets and plan obligations was $221 million (2011 – $322 million).
For further details on the obligations and net benefit cost for the Company’s material defined benefit pension and retiree welfare plans, refer to note 17 to the 2012 Consolidated Financial Statements.
Income Taxes
The Company is subject to income tax laws in various jurisdictions. Tax laws are complex and potentially subject to different interpretations by the taxpayer and the relevant tax authority. The provision for income taxes represents management’s interpretation of the relevant tax laws and its estimate of current and future income tax implications of the transactions and events during the period. A deferred income tax asset or liability is recognized whenever an amount is recorded for accounting purposes but not for tax purposes or vice versa. Deferred tax assets and liabilities are recorded based on expected future tax rates and management’s assumptions regarding the expected timing of the reversal of such temporary differences. The realization of deferred tax assets depends upon the existence of sufficient taxable income within the carryback or carry forward periods under the tax law in the applicable tax jurisdiction. Valuation allowances are established when management determines, based on available information, that it is more likely than not that deferred income tax assets will not be realized. Factors in management’s determination consider the performance of the business including the ability to generate capital gains. Significant judgment is required in determining whether valuation allowances should be established, as well as the amount of such allowances. When making such determinations, consideration is given to, among other things, the following:
| | a) | future taxable income exclusive of reversing temporary differences and carry forwards; |
| | b) | future reversals of existing taxable temporary differences; |
| | c) | taxable income in prior carryback years; and |
| | d) | tax planning strategies. |
The Company may be required to change its provision for income taxes if the ultimate deductibility of certain items is successfully challenged by taxing authorities or if estimates used in determining valuation allowances on deferred tax assets significantly change, or when receipt of new information indicates the need for adjustment in valuation allowances. Additionally, future events, such as
| | | | |
| 70 Manulife Financial Corporation 2012 Annual Report | | Management’s Discussion and Analysis | | |
changes in tax laws, tax regulations, or interpretations of such laws or regulations, could have an impact on the provision for income tax, deferred tax balances and the effective tax rate. Any such changes could significantly affect the amounts reported in the consolidated financial statements in the year these changes occur.
The Company is an investor in a number of leasing transactions and has established provisions for possible disallowance of the tax treatment and for interest on past due taxes. The Company continues to believe that deductions originally claimed in relation to these arrangements are appropriate. Should the tax attributes of all our lease transactions be fully denied, no material impact to the Company’s results is expected.
Goodwill and Intangible Assets
Under IFRS, goodwill is tested at the cash generating unit level (“CGU”) or group of CGUs level. A CGU comprises the smallest group of assets that are capable of generating largely independent cash flows and is either a business segment or a level below. As a result of the current economic environment including the persistent low interest rates in 2012, the Company recorded a goodwill impairment charge of $200 million attributable to our Canadian Individual Life CGU. This non-cash charge recorded in our Corporate and Other segment does not affect our ongoing operations or our regulatory capital ratios. The Company completed its 2012 goodwill and intangible assets tests in the fourth quarter of 2012, and as a result, management concluded that there was no further impairment of goodwill or intangible assets with indefinite lives.
Impairment charges could occur in the future as a result of changes in economic conditions. The goodwill testing for 2013 will be updated based on the conditions that exist in 2013 and may result in further impairment charges, which could be material.
Future Accounting and Reporting Changes
There are a number of new accounting and reporting changes issued under IFRS including those still under development by the International Accounting Standards Board (“IASB”) that will impact the Company beginning in 2013 and subsequently. Summaries of each of the most recently issued key accounting standards are presented below:
(a) IFRS 10 “Consolidated Financial Statements”
| | IFRS 11 “Joint Arrangements” |
| | IFRS 12 “Disclosure of Interests in Other Entities” |
| | IAS 27 “Separate Financial Statements” (as amended) |
| | IAS 28 “Investments in Associates and Joint Ventures” (as amended) |
“Investment Entities” (Amendments to IFRS 10, IFRS 12 and IAS 27)
IFRS 10 “Consolidated Financial Statements”, IFRS 11 “Joint Arrangements”, IFRS 12 “Disclosure of Interests in Other Entities”, IAS 27 “Separate Financial Statements” and IAS 28 “Investments in Associates and Joint Ventures” were all issued in May 2011. Each of the standards issued in May 2011 are effective for fiscal years beginning on or after January 1, 2013. In October 2012 “Investment Entities” (Amendments to IFRS 10, IFRS 12 and IAS 27) was issued. The October 2012 amendments are effective for fiscal years beginning on or after January 1, 2014.
IFRS 10 replaces the consolidation guidance in IAS 27 “Separate Financial Statements” and Standards Interpretation Committee (“SIC”)-12 “Consolidation – Special Purpose Entities” and introduces a single consolidation model for all entities based on control, irrespective of the nature of the investee. Under IFRS 10, control results from an investor having: 1) power over the investee; 2) exposure or rights to variable returns from its involvement with the investee; and 3) the ability to use its power over the investee to affect the amount of the returns. The adoption of IFRS 10 is expected to result in deconsolidation of certain investments in private equity funds, a timber fund and certain of the Company’s financing trusts from the consolidated financial statements. The Company is evaluating the impact of adopting IFRS 10 on its segregated funds. The adoption of IFRS 10 is not expected to have a significant impact on the Company’s consolidated financial statements.
IFRS 11 introduces new accounting requirements for joint arrangements, replacing IAS 31 “Interests in Joint Ventures”. The option to apply the proportional consolidation method when accounting for jointly controlled entities is removed. The adoption of IFRS 11 will not have a significant impact on the consolidated financial statements as the Company does not have significant joint venture arrangements.
IFRS 12 requires enhanced disclosures about both consolidated entities and unconsolidated entities in which an entity has involvement. The objective of IFRS 12 is to present information so that financial statement users may evaluate the basis of control, any restrictions on consolidated assets and liabilities, risk exposures arising from involvements with unconsolidated structured entities and non-controlling interest holders’ involvement in the activities of consolidated entities, and of associates and joint ventures. The adoption of IFRS 12 will not have a significant impact on the Company’s consolidated financial statements.
Investment Entities (Amendments to IFRS 10, IFRS 12 and IAS 27) establishes the definition of an investment entity using principles commonly found in the mutual fund industry. The amendments require investment entities to use fair value accounting for all of their investments, including those which they control or have significant influence over. The amendments include a scope change for IFRS 10 so Investment Entities, as defined, will be exempt from applying consolidation accounting to their investments. The adoption of these amendments will not have a significant impact on the Company’s consolidated financial statements.
| | | | |
| | Management’s Discussion and Analysis | | Manulife Financial Corporation 2012 Annual Report 71 |
(b) Amendments to IAS 19 “Employee Benefits”
The amendments to IAS 19 “Employee Benefits” were issued in June 2011. The amendments require the full funded status of the plan to be reflected as the net defined benefit liability or asset in the Consolidated Statements of Financial Position and eliminate the corridor approach for amortization of actuarial gains and losses. This will result in actuarial gains and losses being recognized in full in OCI when they occur rather than being recognized in net income. Past service costs or credits will be immediately recognized in income when a plan is amended. Interest costs and expected return on plan assets under current IAS 19 will be replaced with a net interest amount calculated by applying the discount rate to the net defined benefit liability or asset. Further, these amendments include enhanced disclosures about the characteristics of the pension and other post-employment benefit plans and the risks to which the entity is exposed through participation in these plans. Some of these enhanced disclosures have been incorporated into note 17 to the 2012 Consolidated Financial Statements.
The amendments to IAS 19 are effective for fiscal years beginning on or after January 1, 2013. The following is a summary of the expected impacts of the adoption of the amendments to IAS 19 in respect of all Company pension and other post-employment plans as at and for the year ended December 31, 2012. These adjustments will be recognized in 2013 by restating 2012 to reflect the impact of the amendments.
| | | | | | | | | | | | |
| (C$ millions) | | Pension
plans | | | Other post-
employment
benefits | | | Total | |
Increase (decrease) in defined benefit liability | | $ | 872 | | | $ | (33 | ) | | $ | 839 | |
Increase (decrease) in deferred tax liability | | | (277 | ) | | | 11 | | | | (266 | ) |
Increase (decrease) in AOCI | | | (669 | ) | | | 15 | | | | (654 | ) |
Increase (decrease) in 2012 net income | | | 74 | | | | (7 | ) | | | 67 | |
(c) IFRS 13 “Fair Value Measurement”
IFRS 13 “Fair Value Measurement” was issued in May 2011 and replaces existing IFRS guidance on fair value measurement with a single standard. IFRS 13 defines fair value, provides guidance on how to determine fair value and requires disclosures about fair value measurements. IFRS 13 does not change the requirements regarding which items should be measured or disclosed at fair value. The standard is effective for fiscal years beginning on or after January 1, 2013. The adoption of IFRS 13 will result in additional financial statement disclosure but will not have a significant impact on the Company’s consolidated financial statements.
(d) Amendments to IAS 1 “Presentation of Financial Statements”
An amendment to IAS 1 was issued in June 2011 requiring changes to the presentation of items of other comprehensive income. Under the amendments, presentation of items within other comprehensive income will be separately presented based on whether or not the item will be subsequently reclassified into net income. The amendments are effective for the Company for fiscal years beginning on or after January 1, 2013. The adoption of these amendments will not have a significant impact on the Company’s consolidated financial statements.
(e) Amendments to IFRS 7 “Financial Instruments: Disclosure”
| | Amendments to IAS 32 “Financial Instruments: Presentation” |
The amendments to IFRS 7 – “Offsetting Financial Assets and Financial Liabilities” issued in December 2011 introduce new disclosure requirements for financial instruments relating to their rights of offset and related arrangements under an enforceable master netting agreement or similar arrangements. The amendments to IFRS 7 are effective for fiscal years beginning on or after January 1, 2013. The adoption of this amendment will not have a significant impact on the Company’s consolidated financial statements.
The amendments to IAS 32 – “Offsetting Financial Assets and Financial Liabilities” also issued in December 2011 clarify the basis for offsetting financial instruments presented in the statement of financial position. The amendments to IAS 32 are effective for fiscal years beginning on or after January 1, 2014. The adoption of this amendment will not have a significant impact on the Company’s consolidated financial statements.
(f) IFRS 9 “Financial Instruments”
IFRS 9 “Financial Instruments” issued in November 2009 and amended in October 2010 is the first phase of a three phase project to replace IAS 39 “Financial Instruments: Recognition and Measurement”. IFRS 9 currently provides that financial assets are measured at either amortized cost or fair value on the basis of the entity’s business model for managing the financial assets and the contractual cash flow characteristics of the financial assets. The classification and measurement for financial liabilities remains generally unchanged; however, revisions have been made in the accounting for changes in fair value of a financial liability attributable to changes in the credit risk of that liability. The other phases of this project which are currently under development include impairment of financial assets and hedge accounting.
IFRS 9 is effective for fiscal years beginning on or after January 1, 2015. The Company is assessing the impact of IFRS 9 on its consolidated financial statements in conjunction with the completion of the other phases of this project and other IASB projects.
Differences between IFRS and Hong Kong Financial Reporting Standards
The consolidated financial statements of Manulife Financial are presented in accordance with IFRS. IFRS differs in certain respects from Hong Kong Financial Reporting Standards (“HKFRS”).
The primary difference between IFRS and HKFRS is the determination of policy liabilities. In certain interest rate environments, policy liabilities determined in accordance with HKFRS may be higher than those computed in accordance with current IFRS.
| | | | |
| 72 Manulife Financial Corporation 2012 Annual Report | | Management’s Discussion and Analysis | | |
IFRS and Hong Kong Regulatory Requirements
Insurers in Hong Kong are required by the Office of the Commissioner of Insurance to meet minimum solvency requirements. As at December 31, 2012, the Company has sufficient assets to meet the minimum solvency requirements under both Hong Kong regulatory requirements and IFRS.
U.S. GAAP Disclosures
With the adoption of IFRS in 2011, the Company is no longer required to reconcile its annual financial results to U.S. GAAP in the consolidated financial statements. Instead, we have elected to disclose certain consolidated U.S. GAAP information in our MD&A.
For the full year 2012, net income in accordance with U.S. GAAP15 was $2,557 million, $821 million higher than our results under IFRS. As we are no longer reconciling our annual financial results under U.S. GAAP in our consolidated financial statements, net income in accordance with U.S. GAAP is considered a non-GAAP financial measure. A reconciliation of the major differences in net income attributed to shareholders is as follows:
U.S. GAAP Results
| | | | | | | | | | | | | | |
For the years ended December 31, (C$ millions) | | 2012 | | | 2011(1) | | | 2010 | | | |
Net income (loss) attributed to shareholders in accordance with IFRS | | $ | 1,736 | | | $ | 129 | | | $ | (1,663 | ) | | |
Key earnings differences: | | | | | | | | | | | | | | |
For variable annuity guarantee liabilities | | $ | (1,225 | ) | | $ | 2,927 | | | $ | 214 | | | |
Related to the impact of mark-to-market accounting and investing activities on investment income and policy liabilities | | | 432 | | | | (120 | ) | | | 1,147 | | | |
New business differences including acquisition costs | | | (650 | ) | | | (322 | ) | | | (202 | ) | | |
Charges due to lower fixed income ultimate reinvestment rate assumptions used in the valuation of policy liabilities under IFRS | | | 677 | | | | 437 | | | | 309 | | | |
Changes in actuarial methods and assumptions, excluding URR | | | 492 | | | | 349 | | | | 1,614 | | | |
Goodwill impairment charge | | | 200 | | | | 153 | | | | 91 | | | |
Changes related to major reinsurance transactions | | | 60 | | | | (303 | ) | | | – | | | |
Other differences | | | 835 | | | | 424 | | | | 142 | | | |
Total earnings difference | | $ | 821 | | | $ | 3,545 | | | $ | 3,315 | | | |
Net income attributed to shareholders in accordance with U.S. GAAP | | $ | 2,557 | | | $ | 3,674 | | | $ | 1,652 | | | |
| (1) | Restated as a result of adopting Accounting Standards Update No. 2010-26, ‘Accounting for Costs Associated with Acquiring or Renewing Insurance Contracts’ (‘ASU 2010-26’) effective January 1, 2012 but requiring application to 2011. The impact to full year 2011 was a net decrease in earnings of $48 million, all of which is included in ‘New business differences including acquisition costs’. |
Accounting for variable annuity guarantee liabilities – IFRS follows a predominantly “mark-to-market” accounting approach to measure variable annuity guarantee liabilities while U.S. GAAP only uses “mark-to-market” accounting for certain benefit guarantees. The U.S. GAAP accounting results in an accounting mismatch between the hedged assets supporting the dynamically hedged guarantees and the guarantees not accounted for on a mark-to-market basis. Another difference is that U.S. GAAP reflects the Company’s own credit standing in the measurement of the liability. In 2012, we reported a net gain of $29 million (2011 – $682 million; 2010 – $4 million) in our total variable annuity businesses under U.S. GAAP compared to a net gain of $1,254 million under IFRS (2011 – net loss of $2,245 million; 2010 – net loss of $210 million).
Investment income and policy liabilities –Under IFRS, accumulated unrealized gains and losses arising from fixed income investments and interest rate derivatives supporting policy liabilities are largely offset in the valuation of the policy liabilities. The 2012 IFRS impacts on insurance liabilities of fixed income reinvestment assumptions, general fund equity investments, fixed income and alternative long-duration asset investing total a net gain of $475 million (2011 – gain of $941 million; 2010 – loss of $473 million) compared to U.S. GAAP net realized gains and other investment income of $907 million (2011 – gain of $821 million; 2010 – gain of $674 million).
Differences in the treatment of acquisition costs and other new business items –Acquisition costs that are related to and vary with the production of new business are explicitly deferred and amortized under U.S. GAAP but are recognized as an implicit reduction in insurance liabilities along with other new business gains and losses under IFRS. In 2012, IFRS results benefited from lower new business strain compared to U.S. GAAP.
Changes due to lower IFRS fixed income ultimate reinvestment rates –The $677 million charge (2011 – $437 million; 2010 – $309 million) in IFRS related to the update of the fixed income ultimate reinvestment rate actuarial assumptions had no direct impact on U.S. GAAP results.
Changes in actuarial methods and assumptions –The charges recognized under IFRS from the annual review of actuarial methods and assumptions of $1,081 million (2011 – $751 million; 2010 – $1,766 million) excluding URR charges, compared to charges of $589 million (2011 – $402 million; 2010 – $152 million) on a U.S. GAAP basis. The charges on a U.S. GAAP basis related primarily to changes in assumptions driven by the macro-economic environment.
| 15 | Net income in accordance with U.S. GAAP is a non-GAAP measure. See “Performance and Non-GAAP Measures” below. |
| | | | |
| | Management’s Discussion and Analysis | | Manulife Financial Corporation 2012 Annual Report 73 |
Goodwill impairment –In 2012 we recorded a $200 million IFRS goodwill impairment charge related to our Canadian Individual Insurance business. There was no impact on a U.S. GAAP basis. In 2011, under IFRS we recorded a $665 million IFRS goodwill impairment charge representing the remaining goodwill attributable to our U.S. Life insurance business compared to $512 million goodwill impairment charge under U.S. GAAP attributable to our U.S. Wealth management businesses. The difference in amounts and business units affected is primarily attributable to the more granular approach applied under IFRS.
Impact of major reinsurance transactions –In 2012 we completed a coinsurance transaction related to the John Hancock block of fixed deferred annuities as well as the recapture of our Par Life block of business in Canadian Individual Life Insurance. In 2011 we sold our Life Retrocession business to Pacific Life. The accounting for these transactions is different under IFRS versus U.S. GAAP.
Total equity in accordance with U.S. GAAP16 as at December 31, 2012 was approximately $16 billion higher than under IFRS. Of this difference, approximately $10 billion was attributable to the higher cumulative net income on a U.S. GAAP basis. The remaining difference was primarily attributable to the treatment of unrealized gains on fixed income investments and derivatives in a cash flow hedging relationship which are reported in equity under U.S. GAAP, but where the investments and derivatives are supporting policy liabilities, these accumulated unrealized gains are largely offset in the valuation of the policy liabilities under IFRS. The fixed income investments and derivatives have significant unrealized gains as a result of the current low levels of interest rates. The majority of the difference in equity between the two accounting bases as at December 31, 2012 arises from our U.S. businesses.
A reconciliation of the major differences in total equity is as follows:
| | | | | | | | | | | | | | |
As at December 31, (C$ millions) | | 2012 | | | 2011(1) | | | 2010 | | | |
Total equity in accordance with IFRS | | $ | 26,096 | | | $ | 24,879 | | | $ | 24,675 | | | |
Differences in shareholders’ retained earnings and participating policyholders’ equity | | | 9,793 | | | | 8,869 | | | | 6,600 | | | |
Difference in Accumulated Other Comprehensive Income attributable to: | | | | | | | | | | | | | | |
(i) AFS securities and others; | | | 4,967 | | | | 4,473 | | | | 1,723 | | | |
(ii) Cash flow hedges; and | | | 2,440 | | | | 2,570 | | | | 458 | | | |
(iii) Translation of net foreign operations(2) | | | (1,481 | ) | | | (1,309 | ) | | | (1,418 | ) | | |
Differences in share capital, contributed surplus and non-controlling interest in subsidiaries | | | 40 | | | | 148 | | | | 162 | | | |
| Total equity in accordance with U.S. GAAP | | $ | 41,855 | | | $ | 39,630 | | | $ | 32,200 | | | |
| (1) | 2011 equity has been restated to reflect the adoption of ASU No. 2010-26. |
| (2) | Reflects the net difference in the currency translation account after the reset to zero through retained earnings upon adoption of IFRS at January 1, 2010. |
| 16 | Total equity in accordance with U.S. GAAP is a non-GAAP measure. See “Performance and Non-GAAP Measures” below. |
| | | | |
| 74 Manulife Financial Corporation 2012 Annual Report | | Management’s Discussion and Analysis | | |
Controls and Procedures
Disclosure Controls and Procedures
Our disclosure controls and procedures are designed to provide reasonable assurance that information required to be disclosed by us is recorded, processed, summarized and reported accurately and completely and within the time periods specified under Canadian and U.S. securities laws. Our process includes controls and procedures that are designed to ensure that information is accumulated and communicated to management, including the CEO and Group CFO, to allow timely decisions regarding required disclosure.
As of December 31, 2012, management evaluated the effectiveness of its disclosure controls and procedures as defined under the rules adopted by the U.S. Securities and Exchange Commission and the Canadian securities regulatory authorities. This evaluation was performed under the supervision of the Audit Committee, the CEO and Group CFO. Based on that evaluation, the CEO and Group CFO concluded that our disclosure controls and procedures were effective as at December 31, 2012.
MFC’s Audit Committee has reviewed this MD&A and the financial statements and MFC’s Board of Directors approved these reports prior to their release.
Management’s Report on Internal Control over Financial Reporting
Management is responsible for establishing and maintaining adequate internal control over financial reporting. The Company’s internal control system was designed to provide reasonable assurance to management and the Board of Directors regarding the preparation and fair presentation of published financial statements in accordance with generally accepted accounting principles. All internal control systems, no matter how well designed, have inherent limitations due to manual controls. Therefore, even those systems determined to be effective can provide only reasonable assurance with respect to financial statement preparation and presentation.
Management maintains a comprehensive system of controls intended to ensure that transactions are executed in accordance with management’s authorization, assets are safeguarded, and financial records are reliable. Management also takes steps to ensure that information and communication flows are effective and to monitor performance, including performance of internal control procedures.
Management assessed the effectiveness of the Company’s internal control over financial reporting as of December 31, 2012 based on the criteria set forth by the Committee of Sponsoring Organizations of the Treadway Commission (COSO) in Internal Control – Integrated Framework. Based on this assessment, management believes that, as of December 31, 2012, the Company’s internal control over financial reporting is effective.
The effectiveness of the Company’s internal control over financial reporting as of December 31, 2012 has been audited by Ernst & Young LLP, the Company’s independent registered public accounting firm that also audited the consolidated financial statements of the Company for the year ended December 31, 2012. Their report expressed an unqualified opinion on the effectiveness of the Company’s internal control over financial reporting as of December 31, 2012.
Changes in Internal Control over Financial Reporting
No changes were made in our internal control over financial reporting during the year ended December 31, 2012 that have significantly affected, or are reasonably likely to significantly affect, our internal control over financial reporting.
Performance and Non-GAAP Measures
We use a number of non-GAAP financial measures to measure overall performance and to assess each of our businesses. Non-GAAP measures include: Core earnings; Core ROE; Core earnings per share; Net income in accordance with U.S. GAAP; Total equity in accordance with U.S. GAAP; Constant currency basis; Premiums and deposits; Funds under management; Capital; Embedded value; New business embedded value; and Sales. Non-GAAP financial measures are not defined terms under GAAP and, therefore, with the exception of Net income in accordance with U.S. GAAP and Total equity in accordance with U.S. GAAP (which are comparable to the equivalent measures of issuers whose financial statements are prepared in accordance with U.S. GAAP), are unlikely to be comparable to similar terms used by other issuers. Therefore, they should not be considered in isolation or as a substitute for any other financial information prepared in accordance with GAAP.
Core earnings (losses) is a non-GAAP measure which we use to better understand the long-term earnings capacity and valuation of the business. Core earnings excludes the direct impact of equity markets and interest rates as well as a number of other items, outlined below, that are considered material and exceptional in nature. While this metric is relevant to how we manage our business and offers a consistent methodology, it is not insulated from macro-economic factors which can have a significant impact.
See Financial Performance section for detailed definition of core earnings and a reconciliation of core earnings to net income attributed to shareholders.
Core return on common shareholders’ equity (“Core ROE”) is a non-GAAP profitability measure that presents core earnings available to common shareholders as a percentage of the capital deployed to earn the core earnings. The Company calculates core return on common shareholders’ equity using average common shareholders’ equity.
| | | | |
| | Management’s Discussion and Analysis | | Manulife Financial Corporation 2012 Annual Report 75 |
Core earnings per shareis core earnings available to common shareholders expressed per weighted average common share outstanding.
Net income in accordance with U.S. GAAPis a non-GAAP profitability measure. It shows what the net income would have been if the Company had applied U.S. GAAP as its primary financial reporting basis. We consider this to be a relevant profitability measure given our large U.S. domiciled investor base and for comparability to our U.S. peers who report under U.S. GAAP.
Total equity in accordance with U.S. GAAPis a non-GAAP measure. It shows what the total equity would have been if the Company had applied U.S. GAAP as its primary financial reporting basis. We consider this to be a relevant measure given our large U.S. domiciled investor base and for comparability to our U.S. peers who report under U.S. GAAP.
The Company also uses financial performance measures that are prepared on aconstant currency basis, which exclude the impact of currency fluctuations and which are non-GAAP measures. Quarterly amounts stated on a constant currency basis in this report are calculated, as appropriate, using the income statement and balance sheet exchange rates effective for the fourth quarter of 2012.
Premiums and deposits is a non-GAAP measure of top line growth. The Company calculates premiums and deposits as the aggregate of (i) general fund premiums, net of reinsurance, reported as premiums on the Consolidated Statement of Income, (ii) plus adding back the premiums ceded related to FDA coinsurance, (iii) premium equivalents for administration only group benefit contracts, (iv) premiums in the Canadian Group Benefits reinsurance ceded agreement, (v) segregated fund deposits, excluding seed money, (vi) mutual fund deposits, (vii) deposits into institutional advisory accounts, and (viii) other deposits in other managed funds.
| | | | | | | | | | | | | | | | | | | | |
Premiums and deposits For the periods ended December 31, (C$ millions) | | Quarterly Results | | | | | Full Year Results | | | |
| | 4Q 2012 | | | 4Q 2011 | | | | | 2012 | | | 2011 | | | |
Premium income | | $ | 5,012 | | | $ | 4,540 | | | | | $ | 10,734 | | | $ | 17,504 | | | |
Deposits from policyholders | | | 5,537 | | | | 5,575 | | | | | | 22,993 | | | | 21,689 | | | |
Premiums and deposits per financial statements | | $ | 10,549 | | | $ | 10,115 | | | | | $ | 33,727 | | | $ | 39,193 | | | |
Add back premiums ceded relating to FDA coinsurance | | | 2 | | | | – | | | | | | 7,229 | | | | – | | | |
Investment contract deposits | | | 59 | | | | 126 | | | | | | 212 | | | | 289 | | | |
Mutual fund deposits | | | 6,117 | | | | 3,309 | | | | | | 18,843 | | | | 16,640 | | | |
Institutional advisory account deposits | | | 5,376 | | | | 627 | | | | | | 7,744 | | | | 2,807 | | | |
ASO premium equivalents | | | 706 | | | | 666 | | | | | | 2,819 | | | | 2,679 | | | |
Group benefits ceded premiums | | | 1,180 | | | | 941 | | | | | | 4,430 | | | | 3,754 | | | |
Other fund deposits | | | 139 | | | | 133 | | | | | | 497 | | | | 699 | | | |
Total premiums and deposits | | $ | 24,128 | | | $ | 15,917 | | | | | $ | 75,501 | | | $ | 66,061 | | | |
Currency impact | | | – | | | | (372 | ) | | | | | (454 | ) | | | 53 | | | |
Constant currency premiums and deposits | | $ | 24,128 | | | $ | 15,545 | | | | | $ | 75,047 | | | $ | 66,114 | | | |
Funds under management is a non-GAAP measure of the size of the Company. It represents the total of the invested asset base in which the Company and its customers invest.
| | | | | | | | | | |
Funds under management As at December 31, (C$ millions) | | 2012 | | | 2011 | | | |
Total invested assets | | $ | 229,928 | | | $ | 226,520 | | | |
Total segregated fund net assets | | | 207,985 | | | | 195,933 | | | |
Funds under management per financial statements | | $ | 437,913 | | | $ | 422,453 | | | |
Mutual funds | | | 59,979 | | | | 49,399 | | | |
Institutional advisory accounts (excluding segregated funds) | | | 26,692 | | | | 21,652 | | | |
Other funds | | | 7,358 | | | | 6,148 | | | |
Total funds under management | | $ | 531,942 | | | $ | 499,652 | | | |
Currency impact | | | – | | | | (10,991 | ) | | |
Constant currency funds under management | | $ | 531,942 | | | $ | 488,661 | | | |
| | | | |
| 76 Manulife Financial Corporation 2012 Annual Report | | Management’s Discussion and Analysis | | |
CapitalThe definition we use for capital, a non-GAAP measure, serves as a foundation of our capital management activities at the MFC level. For regulatory reporting purposes, the numbers are further adjusted for various additions or deductions to capital as mandated by the guidelines used by OSFI. Capital is calculated as the sum of: (i) total equity excluding AOCI on cash flow hedges and (ii) liabilities for preferred shares and capital instruments.
| | | | | | | | | | |
Capital As at December 31, (C$ millions) | | 2012 | | | 2011 | | | |
Total equity | | $ | 26,096 | | | $ | 24,879 | | | |
Add AOCI loss on cash flow hedges | | | 50 | | | | 91 | | | |
Add liabilities for preferred shares and capital instruments | | | 3,501 | | | | 4,012 | | | |
Total capital | | $ | 29,647 | | | $ | 28,982 | | | |
Embedded valueis a measure of shareholders’ value embedded in the current balance sheet of the Company, excluding any value associated with future new business.
New business embedded value (“NBEV”) is the change in shareholders’ economic value as a result of sales in the reporting period. NBEV is calculated as the present value of expected future earnings, after the cost of capital, on actual new business sold in the period using future mortality, morbidity, policyholder behaviour, expense and investment assumptions that are consistent with the assumptions used in the valuation of our policy liabilities.
Sales are measured according to product type:
| n | | For total individual insurance, sales include 100 per cent of new annualized premiums and 10 per cent of both excess and single premiums. For individual insurance, new annualized premiums reflect the annualized premium expected in the first year of a policy that requires premium payments for more than one year. Sales are reported gross before the impact of reinsurance. Single premium is the lump sum premium from the sale of a single premium product, e.g., travel insurance. |
| n | | For group insurance, sales include new annualized premiums and administrative services only premium equivalents on new cases, as well as the addition of new coverages and amendments to contracts, excluding rate increases. |
| n | | For individual wealth management contracts, all new deposits are reported as sales. This includes individual annuities, both fixed and variable; mutual funds; college savings 529 plans; and authorized bank loans and mortgages. |
| n | | For group pensions/retirement savings, sales of new regular premiums and deposits reflect an estimate of expected deposits in the first year of the plan with the Company. Single premium sales reflect the assets transferred from the previous plan provider. Sales include the impact of the addition of a new division or of a new product to an existing client. Total sales include both new regular and single premiums and deposits. |
| | | | |
| | Management’s Discussion and Analysis | | Manulife Financial Corporation 2012 Annual Report 77 |
Additional Disclosures
Contractual Obligations
In the normal course of business, the Company enters into contracts that give rise to obligations fixed by agreement as to the timing and dollar amount of payment.
As at December 31, 2012, the Company’s contractual obligations and commitments are as follows:
| | | | | | | | | | | | | | | | | | | | | | |
Payments due by period (C$ millions) | | Total | | | Less than 1 year | | | 1 – 3 years | | | 3 – 5 years | | | After 5 years | | | |
Long-term debt(1) | | $ | 6,657 | | | $ | 611 | | | $ | 3,465 | | | $ | 241 | | | $ | 2,340 | | | |
Liabilities for capital instruments(1),(2) | | | 10,450 | | | | 140 | | | | 280 | | | | 280 | | | | 9,750 | | | |
Purchase obligations | | | 175 | | | | 48 | | | | 41 | | | | 45 | | | | 41 | | | |
Operating leases | | | 756 | | | | 135 | | | | 186 | | | | 63 | | | | 372 | | | |
Insurance contract liabilities(3) | | | 479,030 | | | | 6,415 | | | | 7,859 | | | | 10,017 | | | | 454,739 | | | |
Investment contract liabilities(1) | | | 4,467 | | | | 280 | | | | 749 | | | | 358 | | | | 3,080 | | | |
Bank deposits | | | 18,878 | | | | 15,018 | | | | 2,192 | | | | 1,619 | | | | 49 | | | |
Other | | | 1,764 | | | | 934 | | | | 361 | | | | 287 | | | | 182 | | | |
Total contractual obligations | | $ | 522,177 | | | $ | 23,581 | | | $ | 15,133 | | | $ | 12,910 | | | $ | 470,553 | | | |
| (1) | The contractual payments include principal, interest and distributions. The contractual payments reflect the amounts payable from January 1, 2013 up to and including the final contractual maturity date. In the case of floating rate obligations, the floating rate index is based on the interest rates as at December 31, 2012 and is assumed to remain constant to the final contractual maturity date. The Company may have the contractual right to redeem or repay obligations prior to maturity and if such right is exercised, total contractual obligations paid and the timing of payment could vary significantly from the amounts and timing included in the table. |
| (2) | Liabilities for preferred shares – Class A, Series 1 are not included in the contractual obligation table. These preferred shares are redeemable by the Company by payment of cash or issuance of MFC common shares and are convertible at the option of the holder into MFC common shares on or after December 15, 2015. |
| (3) | Insurance contract liabilities cash flows include estimates related to the timing and payment of death and disability claims, policy surrenders, policy maturities, annuity payments, minimum guarantees on segregated fund products, policyholder dividends, commissions and premium taxes offset by contractual future premiums on in-force contracts. These estimated cash flows are based on the best estimate assumptions used in the determination of insurance contract liabilities. These amounts are undiscounted and reflect recoveries from reinsurance agreements. Due to the use of assumptions, actual cash flows may differ from these estimates (see “Policy Liabilities”). Cash flows include embedded derivatives measured separately at fair value. |
In the normal course of business, the Company enters into investment commitments, which are not reflected in the consolidated financial statements. As at December 31, 2012, there were $2,965 million of investment commitments (2011 – $3,431 million), of which $1,420 million matures within one year (2011 – $1,886 million), $879 million matures within one to three years (2011 – $1,068 million), $316 million matures within three to five years (2011 – $391 million) and $350 million matures after five years (2011 – $86 million).
Legal and Regulatory Proceedings
The Company is regularly involved in legal actions, both as a defendant and as a plaintiff. The legal actions naming the Company as a defendant ordinarily involve its activities as a provider of insurance protection and wealth management products, as well as an investment advisor, employer and taxpayer. In addition, government and regulatory bodies in Canada, the United States, Asia and other jurisdictions where the Company conducts business regularly make inquiries and, from time to time, require the production of information or conduct examinations concerning the Company’s compliance with, among other things, insurance laws, securities laws, and laws governing the activities of broker-dealers.
A class action covering Quebec residents only is pending in Quebec against the Company and proposed class action lawsuits against the Company have been filed in Ontario, on behalf of investors in Canada (except for Quebec residents). The actions in Ontario and Quebec are based on allegations that the Company failed to meet its disclosure obligations related to its exposure to market price risk in its segregated funds and variable annuity guaranteed products.
The Company believes that its disclosure satisfied applicable disclosure requirements and intends to vigorously defend itself against any claims based on these allegations.
Plaintiffs in class action and other lawsuits against the Company may seek very large or indeterminate amounts, including punitive and treble damages, and the damages claimed and the amount of any probable and estimable liability, if any, may remain unknown for substantial periods of time. A substantial legal liability or a significant regulatory action could have a significant adverse effect on the Company’s business, results of operations, financial condition and capital position and adversely affect its reputation. Even if the Company ultimately prevails in the litigation, regulatory action or investigation, it could suffer reputational harm, which could have an adverse effect on its business, results of operations, financial condition and capital position, including its ability to attract new customers, retain current customers and recruit and retain employees.
Key Planning Assumptions and Uncertainties
Manulife’s 2016 management objectives do not constitute guidance and are based on certain key planning assumptions, including: current accounting and regulatory capital standards; no acquisitions; equity market and interest rate assumptions consistent with our long-term assumptions, and favourable investment experience included in core earnings.17
| 17 | Interest rate assumptions based on forward curve as of June 30, 2012. Core earnings includes up to $200 million per annum of investment gains. |
| | | | |
| 78 Manulife Financial Corporation 2012 Annual Report | | Management’s Discussion and Analysis | | |
Quarterly Financial Information
The following table provides summary information related to our eight most recently completed quarters:
| | | | | | | | | | | | | | | | | | | | | | | | | | | | | | | | | | | | |
As at and for the three months ended (C$ millions, except per share amounts)
(unaudited) | | Dec 31,
2012 | | | Sep 30,
2012 | | | Jun 30,
2012 | | | Mar 31,
2012 | | | | | Dec 31,
2011 | | | Sep 30,
2011 | | | Jun 30,
2011 | | | Mar 31,
2011 | | | |
Revenue | | | | | | | | | | | | | | | | | | | | | | | | | | | | | | | | | | | | |
Premium income | | | | | | | | | | | | | | | | | | | | | | | | | | | | | | | | | | | | |
Life and health insurance | | $ | 4,356 | | | $ | 3,413 | | | $ | 3,719 | | | $ | 3,473 | | | | | $ | 3,651 | | | $ | 3,490 | | | $ | 3,452 | | | $ | 3,593 | | | |
Annuities and pensions | | | 658 | | | | 573 | | | | 740 | | | | 1,031 | | | | | | 889 | | | | 772 | | | | 730 | | | | 927 | | | |
Net premium income prior to FDA coinsurance | | $ | 5,014 | | | $ | 3,986 | | | $ | 4,459 | | | $ | 4,504 | | | | | $ | 4,540 | | | $ | 4,262 | | | $ | 4,182 | | | $ | 4,520 | | | |
Premiums ceded relating to FDA coinsurance(1) | | | (2 | ) | | | (1,799 | ) | | | (5,428 | ) | | | – | | | | | | – | | | | – | | | | – | | | | – | | | |
Investment income | | | 2,095 | | | | 2,185 | | | | 2,923 | | | | 1,589 | | | | | | 2,034 | | | | 3,697 | | | | 2,609 | | | | 2,027 | | | |
Realized and unrealized gains (losses) on assets supporting insurance and investment contract liabilities(2) | | | (1,600 | ) | | | 1,419 | | | | 7,297 | | | | (4,066 | ) | | | | | 1,360 | | | | 13,491 | | | | 2,266 | | | | (1,247 | ) | | |
Other revenue | | | 1,690 | | | | 1,831 | | | | 2,045 | | | | 1,790 | | | | | | 1,765 | | | | 2,005 | | | | 1,708 | | | | 1,764 | | | |
Total revenue | | $ | 7,197 | | | $ | 7,622 | | | $ | 11,296 | | | $ | 3,817 | | | | | $ | 9,699 | | | $ | 23,455 | | | $ | 10,765 | | | $ | 7,064 | | | |
Income (loss) before income taxes | | $ | 1,057 | | | $ | (697 | ) | | $ | (481 | ) | | $ | 1,290 | | | | | $ | 119 | | | $ | (1,799 | ) | | $ | 532 | | | $ | 1,296 | | | |
Income tax (expense) recovery | | | 22 | | | | 367 | | | | 194 | | | | (60 | ) | | | | | (174 | ) | | | 615 | | | | (37 | ) | | | (307 | ) | | |
Net income (loss) | | $ | 1,079 | | | $ | (330 | ) | | $ | (287 | ) | | $ | 1,230 | | | | | $ | (55 | ) | | $ | (1,184 | ) | | $ | 495 | | | $ | 989 | | | |
Net income (loss) attributed to shareholders | | $ | 1,057 | | | $ | (227 | ) | | $ | (300 | ) | | $ | 1,206 | | | | | $ | (69 | ) | | $ | (1,277 | ) | | $ | 490 | | | $ | 985 | | | |
Basic earnings (loss) per common share | | $ | 0.56 | | | $ | (0.14 | ) | | $ | (0.18 | ) | | $ | 0.66 | | | | | $ | (0.05 | ) | | $ | (0.73 | ) | | $ | 0.26 | | | $ | 0.54 | | | |
Diluted earnings (loss) per common share | | $ | 0.56 | | | $ | (0.14 | ) | | $ | (0.18 | ) | | $ | 0.62 | | | | | $ | (0.05 | ) | | $ | (0.73 | ) | | $ | 0.26 | | | $ | 0.53 | | | |
Segregated funds deposits | | $ | 5,537 | | | $ | 5,539 | | | $ | 5,623 | | | $ | 6,294 | | | | | $ | 5,575 | | | $ | 5,109 | | | $ | 5,086 | | | $ | 5,919 | | | |
Total assets | | $ | 486,056 | | | $ | 480,683 | | | $ | 479,494 | | | $ | 465,164 | | | | | $ | 461,977 | | | $ | 454,969 | | | $ | 427,462 | | | $ | 423,279 | | | |
Weighted average common shares(in millions) | | | 1,822 | | | | 1,816 | | | | 1,808 | | | | 1,802 | | | | | | 1,795 | | | | 1,789 | | | | 1,783 | | | | 1,778 | | | |
Diluted weighted average common shares(in millions) | | | 1,854 | | | | 1,816 | | | | 1,808 | | | | 1,919 | | | | | | 1,795 | | | | 1,789 | | | | 1,871 | | | | 1,861 | | | |
Dividends per common share | | $ | 0.13 | | | $ | 0.13 | | | $ | 0.13 | | | $ | 0.13 | | | | | $ | 0.13 | | | $ | 0.13 | | | $ | 0.13 | | | $ | 0.13 | | | |
CDN$ to US$1 – Statement of Financial Position | | | 0.9949 | | | | 0.9837 | | | | 1.0191 | | | | 0.9991 | | | | | | 1.0170 | | | | 1.0389 | | | | 0.9643 | | | | 0.9718 | | | |
CDN$ to US$1 – Statement of Income | | | 0.9914 | | | | 0.9953 | | | | 1.0105 | | | | 1.0011 | | | | | | 1.0232 | | | | 0.9807 | | | | 0.9679 | | | | 0.9855 | | | |
| (1) | On June 29, 2012 and September 25, 2012, the Company entered into coinsurance agreements to reinsure 89 per cent of its book value fixed deferred annuity business. Under the terms of the agreements, the Company will maintain responsibility for servicing of the policies and some of the assets and has retained the remaining exposure. |
| (2) | For fixed income assets supporting insurance and investment contract liabilities and for equities supporting pass-through products and derivatives related to variable hedging programs, the impact of realized and unrealized gains (losses) on the assets is largely offset in the change in insurance and investment contract liabilities. |
| | | | |
| | Management’s Discussion and Analysis | | Manulife Financial Corporation 2012 Annual Report 79 |
Selected Annual Financial Information
| | | | | | | | | | | | | | |
As at and for the years ended December 31, (C$ millions, except per share amounts) | | 2012 | | | 2011 | | | 2010 | | | |
Revenue | | | | | | | | | | | | | | |
Asia Division | | $ | 10,629 | | | $ | 8,428 | | | $ | 7,403 | | | |
Canadian Division | | | 10,229 | | | | 11,942 | | | | 10,023 | | | |
U.S. Division | | | 16,934 | | | | 28,415 | | | | 18,131 | | | |
Corporate and Other | | | (631 | ) | | | 2,198 | | | | 2,061 | | | |
Total revenue | | $ | 37,161 | | | $ | 50,983 | | | $ | 37,618 | | | |
Total assets | | $ | 486,056 | | | $ | 461,977 | | | $ | 424,619 | | | |
Long-term financial liabilities | | | | | | | | | | | | | | |
Long-term debt | | $ | 5,452 | | | $ | 5,503 | | | $ | 5,841 | | | |
Liabilities for preferred shares and capital instruments | | | 3,501 | | | | 4,012 | | | | 4,004 | | | |
Total | | $ | 8,953 | | | $ | 9,515 | | | $ | 9,845 | | | |
Dividend per common share | | $ | 0.52 | | | $ | 0.52 | | | $ | 0.52 | | | |
Cash dividend per Class A Share, Series 1 | | $ | 1.025 | | | $ | 1.025 | | | $ | 1.025 | | | |
Cash dividend per Class A Share, Series 2 | | $ | 1.16252 | | | $ | 1.16252 | | | $ | 1.16252 | | | |
Cash dividend per Class A Share, Series 3 | | $ | 1.125 | | | $ | 1.125 | | | $ | 1.125 | | | |
Cash dividend per Class A Share, Series 4 | | $ | 1.65 | | | $ | 1.65 | | | $ | 1.65 | | | |
Cash dividend per Class 1 Share, Series 1 | | $ | 1.40 | | | $ | 1.40 | | | $ | 1.40 | | | |
Cash dividend per Class 1 Share, Series 3 | | $ | 1.05 | | | $ | 0.81267 | | | $ | – | | | |
Cash dividend per Class 1 Share, Series 5 | | $ | 1.10 | | | $ | – | | | $ | – | | | |
Cash dividend per Class 1 Share, Series 7 | | $ | 0.94678 | | | $ | – | | | $ | – | | | |
Cash dividend per Class 1 Share, Series 9 | | $ | 0.63062 | | | $ | – | | | $ | – | | | |
Additional Information Available
Additional information relating to Manulife Financial, including MFC’s Annual Information Form, is available on the Company’s website atwww.manulife.com and on SEDAR atwww.sedar.com.
Outstanding Shares – Selected Information
Class A Shares Series 1
As at March 12, 2013, MFC had 14 million Class A Shares Series 1 (“Series 1 Preferred Shares”) outstanding at a price of $25.00 per share, for an aggregate amount of $350 million. The Series 1 Preferred Shares are non-voting and are entitled to non-cumulative preferential cash dividends payable quarterly, if and when declared, at a per annum rate of 4.10%. With regulatory approval, the Series 1 Preferred Shares may be redeemed by MFC, in whole or in part, at declining premiums that range from $1.25 to nil per Series 1 Preferred Share, by either payment of cash or the issuance of MFC common shares. On or after December 19, 2015, the Series 1 Preferred Shares will be convertible at the option of the holder into MFC common shares, the number of which is determined by a prescribed formula, and is subject to the right of MFC prior to the conversion date to redeem for cash or find substitute purchasers for such preferred shares. The prescribed formula is the face amount of the Series 1 Preferred Shares divided by the greater of $2.00 and 95% of the then market price of MFC common shares.
Common Shares
As at March 12, 2013, MFC had 1,827,725,539 common shares outstanding.
| | | | |
| 80 Manulife Financial Corporation 2012 Annual Report | | Management’s Discussion and Analysis | | |