Table of Contents
Exhibit 99.3

PROXY CIRCULAR
Annual and Special Meeting – May 1, 2014
Invitation to Shareholders
Dear Shareholder:
On behalf of the Board of Directors, management and employees, we invite you to attend the Annual and Special Meeting of shareholders of Manulife Financial Corporation on May 1, 2014 at 11:00 a.m. Eastern Time. This meeting will be combined with the Annual and Special Meeting of policyholders and the shareholder of The Manufacturers Life Insurance Company.
This is your opportunity to vote on a number of important matters which are described in the Notice of Annual and Special Meeting and the Proxy Circular. At the meeting, you will also have the opportunity to hear about the Company’s financial performance in 2013 and highlights of the Company’s results for the first quarter of 2014.
We hope you will be able to attend the meeting in person. It will be an opportunity for us to speak with you about your Company and for you to meet the directors and executives. If you are unable to attend in person, we encourage you to vote by following the instructions on the proxy form or voting instruction form. A live webcast of the meeting will be available through our website at www.manulife.com starting at 11:00 a.m. Eastern Time.
We look forward to seeing you at the meeting.
|
|
| |||||
Richard B. DeWolfe | Donald A. Guloien | |||||
Chairman of the Board of Directors | President and Chief Executive Officer | |||||
March 11, 2014
| ||||||


IMPORTANT INFORMATION FOR SHAREHOLDERS.YOUR PARTICIPATION IS IMPORTANT. PLEASE TAKE A MOMENT TO VOTE.
MANULIFE FINANCIAL CORPORATION
This Document Contains:
| • | Notice of Annual and Special Meeting |
| • | Proxy Circular |
| Manulife Financial Corporation Proxy Circular |
Table of Contents
Notice of Annual and Special Meeting of Common Shareholders of Manulife Financial Corporation | 3 | |||
| 4 | ||||
| 4 | ||||
| 7 | ||||
| 9 | ||||
| 11 | ||||
| 11 | ||||
| 18 | ||||
| 18 | ||||
| 18 | ||||
| 19 | ||||
| 20 | ||||
• Report of the Corporate Governance and Nominating Committee | 23 | |||
| 25 | ||||
| 27 | ||||
• Report of the Management Resources and Compensation Committee | 28 | |||
| 30 | ||||
| 31 | ||||
| 33 | ||||
Ø Compensation Program Objectives, Philosophy and Principles | 33 | |||
| 35 | ||||
| 39 | ||||
| 42 | ||||
| 50 | ||||
| 51 | ||||
| 53 | ||||
| 55 | ||||
| 56 | ||||
• Incentive Plan Awards – Value Vested or Earned During the Year | 57 | |||
| 57 | ||||
| 58 | ||||
| 62 | ||||
| 67 | ||||
• Securities Authorized for Issuance Under Equity Compensation Plans | 69 | |||
| 70 | ||||
| 70 | ||||
| 70 | ||||
| 70 | ||||
| 70 | ||||
| 70 | ||||
| 71 | ||||
| 79 | ||||
NOTE: Information contained in, or otherwise accessible through, websites mentioned in the Notice of Annual and Special Meeting and Proxy Circular does not form a part of this document.
| Manulife Financial Corporation Proxy Circular | 2 |
Table of Contents
Notice of Annual and Special Meeting of Common Shareholders of Manulife Financial Corporation (the “Company”) |
Date:
Time:
Place: | Thursday, May 1, 2014
11:00 a.m. Eastern Time
Manulife Financial Corporation Head Office 200 Bloor Street East International Room Toronto, ON Canada | Business of the Annual and Special Meeting of Common Shareholders (the “Meeting”)
At the Meeting, Shareholders will be asked to:
1. Receive the consolidated financial statements of the Company for the year ended December 31, 2013, together with reports of the auditor and the actuary on those statements;
2. Elect directors of the Company;
3. Appoint auditors of the Company for 2014;
4. Consider a special resolution to confirm an amendment to By-Law No. 1 of the Company establishing the maximum annual aggregate remuneration payable to the Board of Directors in United States dollars;
5. Approve the advisory resolution to accept the Company’s approach to executive compensation disclosed in the Proxy Circular; and
6. Consider such other business as may properly be brought before the Meeting or any continuation of the Meeting after an adjournment.
By order of the Board of Directors.
Stephen P. Sigurdson Corporate Secretary
March 11, 2014 |

Important
On March 11, 2014, the record date for the Meeting, 1,849,145,489 common shares were outstanding and eligible to be voted at the Meeting.
The full text of the special resolution to confirm the amendment to By-Law No.1 of the Company establishing the maximum annual aggregate remuneration payable to the Board of Directors in United States dollars is set out on page 7 of the Proxy Circular which is attached to this Notice of Annual and Special Meeting.
Shareholders who cannot attend the Meeting in person may vote by proxy. Instructions on how to complete and return the proxy form or voting instruction form are provided with those forms and described in the Proxy Circular. To ensure your vote is counted, proxies must be received by either of the Company’s transfer agents, CST Trust Company or Computershare Inc., no later than 5:00 p.m. Eastern Time on April 29, 2014, or if the Meeting is adjourned, no later than 5:00 p.m. Eastern Time on the second business day preceding the day to which the Meeting is adjourned.
| Manulife Financial Corporation Proxy Circular | 3 |
Table of Contents
| Management Proxy Circular |
| Voting Information |
Who May Vote
You are entitled to vote at the Annual and Special Meeting (the “Meeting”) if you were a holder of common shares (“Common Shares”) of Manulife Financial Corporation (the “Company” or “Manulife”) at the close of business on March 11, 2014. Each Common Share is entitled to one vote, subject to the Voting Restrictions noted below.
Voting Restrictions
Common Shares cannot be voted either in person or by proxy if they are beneficially owned by:
| • | Any person who has acquired more than 10% of any class of shares of the Company without the approval of the Minister of Finance (Canada); |
| • | The Government of Canada or a provincial government or any of their agencies; |
| • | The government of a foreign country or any political subdivision or any of their agencies; however: |
| 1. | shares held by an eligible agent with the approval of the Minister of Finance (Canada) can be voted; and |
| 2. | shares beneficially owned by a foreign institution or by an entity controlled by the foreign institution that is controlled by the government of a foreign country or any political subdivision or any of their agencies can be voted. |
In addition, no person and no entity controlled by any person may cast votes in respect of any Common Shares beneficially owned by the person or the entity that represent, in the aggregate, more than 20% of the eligible votes that may be cast.
About Voting
How you vote depends on whether you are a registered or non-registered shareholder. Please follow the instructions below based on whether you are a registered or non-registered shareholder.
Registered Shareholder- You are aregistered shareholder if your Common Shares are registered in your name and:
| 1. | You have a share certificate; or |
| 2. | You hold your Common Shares through direct registration in the United States. |
Non-Registered Shareholder - You are anon-registered shareholder if:
| 1. | You received (and continue to hold) a Share Ownership Statement issued when The Manufacturers Life Insurance Company (“Manufacturers Life”) demutualized and you have not requested a share certificate; or |
| 2. | Your Common Shares are registered in the name of an intermediary (for example, a bank, a trustee or a securities broker) or in the name of a depository of which the intermediary is a participant. |
If you are a non-registered shareholder who has requested meeting materials, you will receive a package from the intermediary who holds your Common Shares that will contain either:
| • | A proxy form for the number of Common Shares beneficially owned by you, but which is otherwise incomplete (the proxy form may be signed by the intermediary, but will be unsigned if you hold a Share Ownership Statement); or |
| • | A voting instruction form. |
Carefully follow the instructions that accompany the proxy form or voting instruction form.
If you are a non-registered shareholder in Hong Kong or the Philippines and your Common Shares are held by a broker, you may not receive a proxy form or a voting instruction form. You should contact your broker if you wish to vote.
How to Vote - Registered Shareholders
As a registered shareholder, you may vote in person at the Meeting or by proxy.
| 1. | Attend the Meeting – You may attend the Meeting and vote in person. To vote Common Shares registered in the name of a corporation, the corporation must have submitted a properly executed proxy to our transfer agent, CST Trust Company (“CST Trust”) or Computershare Inc. (“Computershare”), authorizing you to do so. |
| 2. | By Proxy – If you do not plan to attend the Meeting in person, you may vote by proxy in one of two ways: |
| (a) | By authorizing the management representatives of the Company named in the proxy form to vote your Common Shares. You may convey your voting instructions by: |
| • | Internet – Go to the website indicated on the proxy form and follow the instructions; |
| • | Telephone (North America) – Call the toll free number indicated on the proxy form and follow the voice instructions; or |
| • | Mail – Complete the proxy form in full, sign and return it in the envelope provided. |
| Manulife Financial Corporation Proxy Circular | 4 |
Table of Contents
| (b) | You have the right to appoint some other person or company to attend the Meeting and vote your Common Shares on your behalf. You may do this either by: |
| • | Internet – Go to the website indicated on the proxy form and follow the instructions; or |
| • | Mail – Print your appointee’s name in the blank space on the proxy form and indicate how you would like your Common Shares voted. Complete the proxy form in full, sign and return it in the envelope provided. |
If you appoint someone other than the management representatives to vote your Common Shares, your votes can only be counted if your appointee attends the Meeting and votes on your behalf. If you choose this option, complete the proxy form in full, sign (if unsigned by the intermediary) and return it as instructed on the proxy form.
How to Vote - Non-Registered Shareholders
As a non-registered shareholder, you may vote in person at the Meeting or by proxy.
| 1. | Attend the Meeting |
| (a) | If you hold a Share Ownership Statement, simply attend the Meeting and vote; |
| (b) | If you received a proxy form from your intermediary, insert your name in the blank space provided on the form, sign the proxy form if it has not been signed by the intermediary and return the completed proxy form in the enclosed envelope. When you arrive at the Meeting, you should advise the staff that you are a proxy appointee; or |
| (c) | If you received a voting instruction form, follow the instructions on it. |
| 2. | By Proxy |
| (a) | If you hold a Share Ownership Statement or if you received a proxy form from your intermediary and do not plan to attend the Meeting in person, you may vote by proxy. If you choose this option, refer to paragraph 2(a) or paragraph 2(b) under the heading “How to Vote - Registered Shareholders - By Proxy”; or |
| (b) | If you received a voting instruction form, follow the instructions on it. |
To ensure that your vote is recorded, your proxy must be received by CST Trust or Computershare no later than 5:00 p.m. Eastern Time on Tuesday, April 29, 2014 or, if the Meeting is adjourned, no later than 5:00 p.m. Eastern Time on the second business day before the day to which the Meeting is adjourned.
Appointing a Proxyholder
By properly completing and returning a proxy form or voting instruction form appointing a person as your proxy, you are authorizing the person named in the form to attend the Meeting and to vote your Common Shares.
In connection with any ballot that may be conducted, the Common Shares represented by your proxy form or voting instruction form will be voted or withheld from voting as you instruct in the form and, if you specify a choice with respect to any matter to be acted upon, your Common Shares will be voted accordingly. If you have not specified how to vote on a particular matter, if any amendments are proposed to any matter, or if other matters are properly brought before the Meeting, then your proxyholder can vote your Common Shares as your proxyholder sees fit on these matters.
If you properly complete and return your proxy form or voting instruction form appointing management as your proxy, but do not specify how you wish the votes cast, your Common Shares will be voted as follows:
| • | FOR the election of the director nominees set out in this Proxy Circular; |
| • | FOR the appointment of auditors; |
| • | FOR the special resolution confirming an amendment to By-Law No. 1 of the Company expressing the maximum annual aggregate remuneration payable to the Board of Directors in United States dollars; |
| • | FOR the advisory resolution accepting the Company’s approach to executive compensation disclosed in this Proxy Circular; and |
| • | FOR management’s proposals generally. |
Revoking a Proxy
If you wish to revoke your vote on or before April 29, 2014, you may do so by re-voting. Thereafter, you may revoke your vote by delivering a written statement, signed by you or your authorized attorney to:
| (a) | The Corporate Secretary of the Company at 200 Bloor Street East, North Tower 10, Toronto, ON, Canada, M4W 1E5 at any time up to and including April 30, 2014, or the business day preceding the day to which the Meeting is adjourned; or |
| (b) | The Chair of the Meeting prior to the commencement of the Meeting on the day of the Meeting or the day to which the Meeting is adjourned. |
Solicitation of Proxies
Your proxy is being solicited on behalf of the management of the Company. The solicitation will be primarily by mail, but may also be made by telephone and in writing. The Company may use the services of an outside proxy solicitation agency to solicit proxies. The cost of such services, estimated at $75,000, would be paid by the Company.
| Manulife Financial Corporation Proxy Circular | 5 |
Table of Contents
Confidentiality
Your vote is confidential. The Company’s transfer agents maintain the confidentiality of the votes and do not disclose individual shareholder votes or proxies to the Company unless a shareholder has made comments clearly intended for management or as may be required to comply with the law. The Company’s transfer agents provide the Company with a status report on the total number of proxies received and the votes cast in respect of each item of business to be considered at the Meeting.
Voting Results
Following the Meeting, a report on the voting results will be available on the Company’s website at www.manulife.com (About Manulife: Corporate Governance) and will be filed with Canadian Securities Administrators at www.sedar.com.
Number of Common Shares Outstanding
As of the record date, March 11, 2014, there were 1,849,145,489 Common Shares outstanding.
Subject to the Voting Restrictions previously referred to, the number of Common Shares outstanding equals the number of eligible votes.
No person or company is known to beneficially own, directly or indirectly, or exercise control or direction over voting securities carrying more than five per cent of the voting rights attached to any class of shares of the Company.
Procedure for Submitting a Shareholder Proposal for the Company’s Next Annual Meeting to be Held in 2015
The final date for submitting shareholder proposals to the Company is December 11, 2014.
The Company’s governing legislation, theInsurance Companies Act(Canada) (the “Act”), addresses the rights of shareholders to submit a proposal and the obligations of the Company in respect of proposals submitted.
The right of a shareholder to submit a proposal is subject to certain conditions set forth in the Act. The Company must attach any shareholder proposal complying with the requirements of the Act to the Notice of Meeting, together with a statement in support of the proposal from the shareholder, if requested. Under the Act, a shareholder proposal must be received at least 90 days before the anniversary date of the Notice of Meeting sent to shareholders in respect of the Company’s previous annual meeting.
Send all proposals in writing to:
Corporate Secretary
Manulife Financial Corporation
200 Bloor Street East, North Tower 10
Toronto, ON
M4W 1E5
Fax: 416-926-3041
Questions
If you have any questions regarding the Meeting, please contact CST Trust, Computershare or the authorized agent nearest you:
Canada: | CST Trust Company | |||
| 1-800-783-9495 | ||||
United States: | Computershare Inc. | |||
| 1-800-249-7702 | ||||
Hong Kong: | Registered Shareholders | |||
| Computershare Hong Kong Investor | ||||
| Services Limited | ||||
| 852-2862-8555 | ||||
| Share Ownership Statement Holders | ||||
| The Hongkong and Shanghai Banking | ||||
| Corporation | ||||
| 852-2288-8355 | ||||
Philippines: | The Hongkong and Shanghai Banking Corporation Limited
| |||
| PLDT: | 632-581-7595 | |||
GLOBE: | 632-976-7595 | |||
| Manulife Financial Corporation Proxy Circular | 6 |
Table of Contents
| Business of the Meeting |
| 1. | Receipt of the Consolidated Financial Statements |
To receive the consolidated financial statements of Manulife Financial Corporation (the “Company” or “Manulife”) for the year ended December 31, 2013, together with the reports of the auditor and the actuary on those statements.
| 2. | Election of Directors |
The 14 nominees for election to the Company’s Board of Directors (the “Board”) and their biographies are listed in the section “Nominees for the Board of Directors”. All of the nominees are currently directors of the Company.
Each successful nominee will be elected to the Board for a term of one year, which expires at the Company’s annual meeting in 2015.
Directors’ attendance at Board and committee meetings held in 2013 is shown in the chart for each director nominee in the “Nominees for the Board of Directors” section.
| 3. | Appointment of Auditors |
The Board proposes that the firm of Ernst & Young LLP (“Ernst & Young”) be appointed as auditor for the 2014 fiscal year. Ernst & Young has served as the Company’s auditor for more than five years. For 2013, fees charged by Ernst & Young to the Company and its subsidiaries were$28.6 million, compared with $29.8 million in 2012.
Year ended December 31, 2013 ($ in millions) | Year ended December 31, 2012 ($ in millions) | |||
Audit fees1 | $25.5 | $25.9 | ||
Audit-related fees2 | $1.7 | $1.9 | ||
Tax fees3 | $0.3 | $0.4 | ||
All other fees4 | $1.1 | $1.6 | ||
Total | $28.6 | $29.8 |
| 1 | Includes the audit of the financial statements of the Company as well as the financial statements of its subsidiaries and segregated and separate funds, audits of statutory filings, prospectus services,Sarbanes-Oxley Act of 2002 attestations, reviews of quarterly reports and regulatory filings. |
| 2 | Includes reviews of product filing registration statements, consultation concerning financial accounting and reporting standards, and due diligence in connection with proposed or consummated transactions. |
| 3 | Includes tax compliance, tax planning and tax advice services. |
| 4 | Includes information security and other advisory services. |
The Company has complied with applicable rules regulating the provision of non-audit services to the Company by its independent auditor. All audit andnon-audit services provided to the Company by Ernst & Young have been pre-approved by the Audit Committee. The Audit Committee has reviewed the magnitude and nature of these services to ensure that they are compatible with maintaining the independence of the independent auditor.
| 4. | Confirmation of an Amendment to By-Law No.1 |
On February 13, 2014, in order to facilitate the recruitment of directors globally, the Board approved an amendment to By-Law No. 1 of the Company (referred to in By-Law No.1 as the “Corporation”) establishing the
maximum annual aggregate remuneration payable to the Board in United States dollars. This would enable the Company to establish the directors’ remuneration in United States dollars without exceeding the maximum annual aggregate remuneration payable in the event of currency fluctuations.
As a company with a significant global presence, it is desirable that the Board also reflect that geographic diversity. Payment of directors’ remuneration in United States dollars, a global currency, will facilitate the Company’s ability to attract and retain directors globally and be competitive with other large global financial institutions with comparable scope and complexity.
As disclosed on page 22 under “Director Compensation”, amounts are paid in respect of services to both the Company and The Manufacturers Life Insurance Company, the cost of which is shared equally between the two companies. All Board and committee meetings of the two companies are held concurrently.
The amendment approved by the Board is as follows:
| “1. | Section 2.4 of By-Law No. 1 of the Company is amended by deleting the reference to “$2,000,000” and replacing it with a reference to “US$2,000,000” as follows: |
“The aggregate remuneration payable to directors each year for their services as directors shall not exceed US$2,000,000. This amount may be apportioned among the directors on such basis as the directors may determine, together with such further amount as may be necessary to reimburse the directors for their reasonable expenses properly incurred in respect of the services to the Corporation in that capacity.” |
| 2. | The submission of the foregoing amendment toBy-Law No. 1 to the shareholders of the Company entitled to vote thereon for approval at the next meeting of shareholders of the Company is hereby authorized and approved; and |
| 3. | The proper officers of the Company are hereby authorized to sign and deliver for and on behalf of the Company all such documents and instruments and to do all such other acts and things as may be necessary or desirable to give effect to the foregoing resolution.” |
To be effective, this amendment must be confirmed by special resolution of the shareholders. This special resolution requires the affirmative vote of not less than two-thirds of the votes cast by holders of Common Shares present in person or represented by proxy.
The Board recommends that shareholders vote FOR the following special resolution:
RESOLVED THAT:The amendment to By-Law No. 1 of the Company establishing the maximum annual aggregate remuneration payable to the Board in United States dollars is hereby confirmed.
| Manulife Financial Corporation Proxy Circular | 7 |
Table of Contents
| 5. | Shareholder Advisory Vote on the Approach to Executive Compensation |
The Board believes that shareholders should have the opportunity to fully understand the objectives, philosophy and principles the Board has used to make executive compensation decisions and to have an advisory vote on the Board’s approach to executive compensation. As a result, shareholders will have a non-binding, advisory vote on the Company’s executive compensation policy at the Annual and Special Meeting in 2014, as it has done at each of the past four annual meetings.
To assist you in making your voting decision, we refer you to the Compensation Discussion and Analysis (“CD&A”) starting at page 31. The CD&A describes the Board’s approach to executive compensation, the details of the compensation program and the Board’s compensation decisions in 2013. This disclosure has been approved by the Board on the recommendation of the Management Resources and Compensation Committee. If there are specific concerns you wish to discuss, you may contact the Board by writing to the Chairman of the Board in care of the Corporate Secretary of the Company at the address below or by email as indicated on our website at: corporate_governance@manulife.com:
Chairman of the Board
c/o The Corporate Secretary
Manulife Financial Corporation
200 Bloor Street East
North Tower 10
Toronto, ON
M4W 1E5
The Board recommends that shareholders vote FOR the following advisory resolution:
“Resolved, on an advisory basis and not to diminish the role and responsibilities of the Board, that the shareholders accept the approach to executive compensation disclosed in the Proxy Circular delivered in advance of the 2014 Annual and Special Meeting of Common Shareholders.”
As this vote will be an advisory vote, the results will not be binding. However, the Board will take the results of the vote into account, as appropriate, together with feedback received from shareholders in its other engagement activities, when considering future compensation policies, procedures and decisions.
The results of the shareholder advisory vote will be disclosed as part of the report on vote results for the Meeting.
In the event that a significant number of shareholders oppose the resolution, the Board will communicate with certain of its shareholders (particularly those who are known to have voted against it) to understand their concerns and will review the Company’s approach to compensation in the context of those concerns. Shareholders who have voted against the resolution will be encouraged to contact the Board to discuss their specific concerns.
Note:
All figures reported in this Proxy Circular are in Canadian currency, unless otherwise indicated.
| Manulife Financial Corporation Proxy Circular | 8 |
Table of Contents
| Board Succession and Director Nominee Expertise |
Board Succession Process
The Corporate Governance and Nominating Committee engages in the following process to identify the diversity of director experience that, in the Board’s view, will assist the Company in meeting its global strategic objectives, and to select director candidates with this expertise:
| • | Recommends competencies and experience, taking into consideration the Company’s strategic focus and emerging issues, and continuously reviews these requirements to meet the Company’s changing needs. Identifying the selection criteria and any identified gaps in advance allows the Board flexibility to move quickly when excellent qualified individuals become available, and to deliberately recruit against these specifications. |
| • | Maintains an evergreen list of potential candidates who meet the experience criteria. |
(See the “Statement of Corporate Governance Practices – Nomination of Directors” section on page 73 for a detailed description of the process.)
Board Renewal
For the last several years the Board has been engaged in a Board renewal process under the leadership of the Chairman of the Board and the Corporate Governance and Nominating Committee to replace several retiring directors. As part of this process, the Board, together with the Corporate Governance and Nominating Committee, regularly considers the size of the Board (see “Statement of Corporate Governance Practices – Board Size and Quorum” section on page 73 for the factors considered in this determination) and 14 candidates have been nominated for election to the Board at the Meeting.
Board Term Limits
To balance the benefits of experience and the need for renewal and new perspectives, the Board has established term limits for independent directors to replace the mandatory retirement age previously in effect.
Independent directors will not be nominated for re-election at an annual meeting after reaching 12 years of service on the Board. To enable the transition from a mandatory retirement age to term limits, independent directors who, as of the date of the Meeting, have reached at least 12 years of service but have not reached the age of 72 may be recommended for re-election for additional one-year terms for up to five years. For other independent directors, in exceptional circumstances, the Board also has the discretion to recommend them for re-election for additional one-year terms for up to three years following the expiry of the initial 12-year term. The Chairman of the
Board may serve a full five-year term as Chairman regardless of number of years of service on the Board.
(See also “Statement of Corporate Governance Practices – Board Term Limits” section on page 74 for a detailed description of the term limits.)
Board Diversity
Diversity of Board members is the result of the extensive search for potential directors whose backgrounds fit the Company’s strategic objectives and business challenges. The Corporate Governance and Nominating Committee considers gender, ethnic background, geographic representation and other personal characteristics that contribute to diversity amongst board members recognizing that it is the skills, experience and integrity that are most important in assessing candidates and their potential contributions.
The Corporate Governance and Nominating Committee, in actively managing the Board succession, has retained an executive search firm to provide guidance and assistance in considering expanded sources for director talent. The committee analyzed the experience and competencies of the retiring directors and the changing needs of the Company and recommended that in addition to having integrity, good judgment, financial knowledge and sufficient time available, candidates’ experience include the critical and diverse competencies referred to in the “New Directors’ Experience” chart below.
The result of this renewal process was the appointment of ten new directors over the past five years, nine of whom remain on the Board. These nine directors, of which one is a resident of Singapore and four are women, have the diversity of skills and expertise noted below.
New Directors’ Experience
| Areas of Director Experience | Joseph Caron | Susan Dabarno | Sheila Fraser | Tsun-yan Hsieh | Donald Lindsay | John Palmer | James Prieur | Andrea Rosen | Lesley Webster | |||||||||
Senior Executive | ü | ü | ü | ü | ü | ü | ü | ü | ü | |||||||||
Human Resources | ü | ü | ü | ü | ü | ü | ü | |||||||||||
Financial | ü | ü | ü | ü | ü | ü | ü | ü | ü | |||||||||
Global Financial, Investments | ü | ü | ü | ü | ü | |||||||||||||
Risk Management | ü | ü | ü | ü | ü | ü | ||||||||||||
Asia | ü | ü | ü | ü | ü | |||||||||||||
Public Sector | ü | ü | ü | |||||||||||||||
| Manulife Financial Corporation Proxy Circular | 9 |
Table of Contents
Experience Matrix
The following table identifies the diverse experience of the Board and individual nominees in those areas identified by the Board as being important for the Company.
Areas of Director Experience Identified by the Board as Necessary For | Joseph Caron | John Cassaday | Susan Dabarno | Richard DeWolfe | Sheila Fraser | Donald Guloien | Scott Hand | Luther Helms | Tsun-yan Hsieh | Donald Lindsay | John Palmer | James Prieur | Andrea Rosen | Lesley Webster | ||||||||||||||||||||||||||||||||||||||||||
Senior Executive (All)
Broad business experience as a senior officer or chair of the board of a major organization (public, private, non-profit) | ü | ü | ü | ü | ü | ü | ü | ü | ü | ü | ü | ü | ü | ü | ||||||||||||||||||||||||||||||||||||||||||
Other Directorships(Majority)
Director of a major organization | ü | ü | ü | ü | ü | ü | ü | ü | ü | ü | ü | ü | ü | ü | ||||||||||||||||||||||||||||||||||||||||||
Public Sector (Minimum 2)
Including a Crown Corporation, educational institution, or any other non-commercial organization | ü | ü | ü | ü | ü | |||||||||||||||||||||||||||||||||||||||||||||||||||
Financial Experience(Majority)
Based on the definitions of financial literacy or expert for members of the Audit Committee under securities laws | ü | ü | ü | ü | ü | ü | ü | ü | ü | ü | ü | ü | ü | ü | ||||||||||||||||||||||||||||||||||||||||||
Risk Management Experience (Minimum 4)
Experience in identifying principal risks of an organization and the oversight or management of risk management system - may have been gained as a CEO, risk management executive or member of a board risk committee of a public company | ü | ü | ü | ü | ü | ü | ü | ü | ü | ü | ü | |||||||||||||||||||||||||||||||||||||||||||||
Global Financial Services Executive, Knowledge of Investment Management (Minimum 4)
Experience in the financial services industry or experience overseeing complex financial transactions and investment management | ü | ü | ü | ü | ü | ü | ü | |||||||||||||||||||||||||||||||||||||||||||||||||
Operations/Governance
Experience gained through direct involvement with business or regulatory operations:
• Asia (Minimum 3) | ü | ü | ü | ü | ü | ü | ü | ü | ||||||||||||||||||||||||||||||||||||||||||||||||
• Canada (Minimum 4) | ü | ü | ü | ü | ü | �� | ü | ü | ü | ü | ||||||||||||||||||||||||||||||||||||||||||||||
• U.S. (Minimum 4) | ü | ü | ü | ü | ü | ü | ü | ü | ||||||||||||||||||||||||||||||||||||||||||||||||
Human Resources Management & Executive Compensation (Minimum 3)
Experience overseeing compensation design either as a CEO, CFO, senior human resources executive or consultant, or member of a board compensation committee of a public company | ü | ü | ü | ü | ü | ü | ü | ü | ü | ü | ü | ü | ||||||||||||||||||||||||||||||||||||||||||||
| Manulife Financial Corporation Proxy Circular | 10 |
Table of Contents
| Nominees for the Board of Directors |
The following individuals are the nominees for election to the Board. Information regarding the nominees relating to their independence, year first elected or appointed as a director1, term limit2, previous year’s voting results, age, municipality and country of residence, principal occupation, education, areas of expertise, committee memberships, meeting attendance and public board memberships3 is provided in the biographical charts below. Also indicated for each nominee are the number of Company Common Shares (“Common Shares”)4 held by the nominee, the number of Deferred Share Units (“DSUs”)5 held by the nominee under the Stock Plan for Non-Employee Directors (see description of Stock Plan forNon-Employee Directors under Director Compensation on page 21), the total value of the nominees’ equity in the Company6 and whether the nominee meets the minimum equity ownership requirements7 (see Directors’ Equity Ownership Guidelines under Director Compensation on page21). All successful nominees for the Board are elected for a term of one year, expiring at the next annual meeting.
| Director Nominee Information |
| Richard B. DeWolfe | ||||||||||||||
Status: Independent Director Since: 2004 Term Limit: 20188 2013 Votes For: 92.76% Age: 69
Residence: Westwood, MA United States
Areas of Expertise: • Senior Executive • Financial • Risk Management • U.S. Operations/Governance |
Richard DeWolfe is Chairman of the Board, a position he has held since May 2, 2013. Mr. DeWolfe is also Managing Partner of DeWolfe & Company, LLC, a real estate management and investment consulting firm. He was formerly Chairman and CEO of The DeWolfe Companies, Inc., the largest homeownership organization in New England, which was previously listed on the American Stock Exchange and acquired by Cendant Corporation in 2002.
Mr. DeWolfe is a director of Massachusetts General Hospital, President’s Council, a Trustee Emeritus of Boston University, and an honorary director of The Boston Center for Community and Justice. He is also a member of the Wilson Center’s Canada Institute Advisory Board.
He was formerly a director of Avantair, Inc., Chairman and Founder of Reliance Relocation Services, Inc. and Chairman of the Board of Trustees, Boston University.
Mr. DeWolfe holds a BAS, Marketing and Finance from Boston University and an Executive Masters Professional Director Certification from the American College of Corporate Directors, a public company director education and credentialing organization.
| |||||||||||||
| Board/Committee Membership:9 | Overall Attendance: 100% | Public Board Membership During Last Five Years: | ||||||||||||
Board of Directors (Chairman) Audit Corporate Governance & Nominating Risk | 9 of 9 2 of 2 3 of 3 2 of 2 | 100% 100% 100% 100% | Avantair, Inc. | 2009 - August 201310 | ||||||||||
| Securities Held: | ||||||||||||||
| Year | Common Shares | DSUs | Total Common Shares and DSUs | Total Value of Common Shares and DSUs | Minimum Equity Ownership Requirement Met (ü) or Amount ($) | |||||||||
| 2014 | 14,000 | 88,025 | 102,025 | $2,188,436 | ü | |||||||||
| 2013 | 14,000 | 76,214 | 90,214 | $1,398,317 | ||||||||||

| 1 | “Director Since” refers to the year the director was first elected to either the Board of the Company or Manufacturers Life. When Manufacturers Life demutualized in 1999, it became a wholly-owned subsidiary of the Company. |
| 2 | “Term Limit” refers to the year in which independent directors would not be eligible for re-election at the annual meeting unless, in exceptional circumstances, approved by the Board. |
| 3 | The Board does not allow its directors to serve on the same board of another company, unless such interlock is approved by the Corporate Governance and Nominating Committee. Currently, there are no interlocking board memberships held by the Company’s directors. |
| 4 | “Common Shares” refers to the number of Common Shares beneficially owned, or over which control or direction is exercised by, the director as of March 11, 2014 and March 12, 2013, respectively. |
| 5 | “Deferred Share Units” (“DSUs”) refers to the number of DSUs held by the director as of March 11, 2014 and March 12, 2013, as applicable. |
| 6 | “Total Value of Common Shares and DSUs” is determined by multiplying the closing price of the Common Shares on the Toronto Stock Exchange (“TSX”) on each of March 11, 2014 ($21.45) and March 12, 2013 ($15.50), respectively, times the number of Common Shares and DSUs outstanding as of those dates. |
| 7 | Directors’ equity ownership is valued at the greater of market value and the acquisition cost or grant value for the purposes of meeting the directors’ equity ownership guidelines. |
| 8 | Pursuant to the term limits established by the Board, the Chairman may serve a full five-year term as Chairman regardless of the number of years of service on the Board (see section “Board Term Limits” on page 9). |
| 9 | Upon being elected Chairman of the Board on May 2, 2013, Richard DeWolfe resigned from the Audit Committee and Risk Committee and was appointed to the Corporate Governance and Nominating Committee. As Chairman of the Board, Richard DeWolfe is invited to attend all committee meetings at the invitation of the Chair of each Committee. |
| 10 | Mr. DeWolfe was a director of Avantair, Inc. between 2009 and August 2013. On July 25, 2013, an involuntary petition under chapter 7 of title 11 of the United States Code (the “Bankruptcy Code”) in the United States Bankruptcy Court of the Middle District of Florida, Tampa Division (the ‘Bankruptcy Court”), was filed against Avantair, Inc. On August 16, 2013, the Bankruptcy Court entered the order for relief under chapter 7 of the Bankruptcy Code. The chapter 7 case is ongoing. |
| Manulife Financial Corporation Proxy Circular | 11 |
Table of Contents
| Donald A. Guloien | ||||||||||||||
Status: Management Director Since: 2009 Term Limit: N/A11 2013 Votes For: 93.55% Age: 56
Residence: Toronto, ON Canada
Areas of Expertise: • Senior Executive • Financial • Risk Management • Global Financial Services Executive/Knowledge of Investment Management • Asia, Canada and U.S. Operations/Governance |
Donald Guloien is the President and Chief Executive Officer (“CEO”) of Manulife. During his32-year career at Manulife, Mr. Guloien has held a variety of leadership roles in insurance and investments operations, global acquisitions and business development. Before assuming his current role, he was Senior Executive Vice President and Chief Investment Officer, where he was recognized as a leading global investment executive.
Mr. Guloien has been named International Business Executive of the Year by the Canadian Chamber of Commerce and awarded The Queen Elizabeth II Diamond Jubilee medal. Mr. Guloien is Chair-elect of the Canadian Life and Health Insurance Association. He is a recipient of the Arbor Award for his contributions to the University of Toronto. He is a member of the Mayor of Shanghai’s International Business Leaders’ Advisory Council, the Canadian Council of Chief Executives, The Ticker Club and the World Presidents’ Organization. He is a director of The Geneva Association and a former director of LIMRA International.
Mr. Guloien holds a B. Comm. from the University of Toronto and is a Fellow, Life Management Institute.
| |||||||||||||
| Board/Committee Membership:12 | Overall Attendance: 100% | Public Board Membership During Last Five Years: | ||||||||||||
| Board of Directors | 8 of 812 | 100% | None | |||||||||||
| Securities Held: | ||||||||||||||
| Year | Common Shares | DSUs | Total Common Shares and DSUs | Total Value of Common Shares and DSUs | Minimum Equity Ownership Requirement Met (ü) or Amount ($) Required | |||||||||
| 2014 | 123,720 | 192,861 | 316,581 | $6,790,662 | As CEO, Mr. Guloien is subject to different ownership guidelines than the other Directors.13 | |||||||||
| 2013 | 123,720 | 187,138 | 310,858 | $4,818,299 | ||||||||||
| Joseph P. Caron | ||||||||||||||
Status: Independent Director Since: 2010 Term Limit: 2023 2013 Votes For: 95.96% Age: 66
Residence: West Vancouver, BC Canada
Areas of Expertise: • Senior Executive • Public Sector • Financial • Asia Operations/Governance |
Joseph Caron is Principal and Founder of Joseph Caron Incorporated, a consulting business (established in 2010) providing strategic counsel to Asian businesses seeking to grow in Canada and Canadian businesses and organizations focused on development in Asia. From 2010 to 2013, Mr. Caron was a member of HB Global Advisors Corporation, the international consulting firm of Heenan Blaikie.
Mr. Caron’s experience includes almost four decades with the Government of Canada where he served in a number of key diplomatic posts including, Ambassador to the Peoples’ Republic of China (2001 to 2005), Ambassador to Japan (2005 to 2008) and High Commissioner to the Republic of India (2008 to 2010).
He is currently on the advisory board of Westport Innovations Inc. and a director of the Vancouver International Airport. He has also been named a Distinguished Fellow of the Asia Pacific Foundation and an Honorary Research Associate of the University of British Columbia’s Institute of Asian Research.
Mr. Caron holds a BA in Political Science from the University of Ottawa.
| |||||||||||||
| Board/Committee Membership: | Overall Attendance: 100% | Public Board Membership During Last Five Years: | ||||||||||||
Board of Directors Corporate Governance & Nominating Management Resources & Compensation | 9 of 9 3 of 314 7 of 7 | 100% 100% 100% | Westport Innovations Inc. | 2013 - Present | ||||||||||
| Securities Held: | ||||||||||||||
| Year | Common Shares | DSUs | Total Common Shares and DSUs | Total Value of Common Shares and DSUs | Minimum Equity Ownership Requirement Met (ü) or Amount ($) Required | |||||||||
| 2014 | 4,785 | 19,880 | 24,665 | $529,064 | ü | |||||||||
| 2013 | 0 | 14,534 | 14,534 | $225,277 | ||||||||||


| 11 | The term limits established by the Board apply only to independent directors. |
| 12 | Donald Guloien is not a member of any Board committee. He attends committee meetings at the invitation of the Chairman. One Board meeting in 2013 was for independent directors only. |
| 13 | Mr. Guloien also holds RSUs and PSUs issued under the Company’s medium-term incentive programs (see “Medium-Term and Long-Term Incentives Program Descriptions” at page 58”). For disclosure relating to the value of Mr. Guloien’s holdings and the applicable share ownership guidelines see “Share Ownership Guidelines” at page 49. |
| 14 | Joseph Caron was appointed to the Corporate Governance and Nominating Committee on May 2, 2013. |
| Manulife Financial Corporation Proxy Circular | 12 |
Table of Contents
| John M. Cassaday | ||||||||||||||
Status: Independent Director Since: 1993 Term Limit: 201915 2013 Votes For: 86.95% Age: 60
Residence: Toronto, ON Canada
Areas of Expertise: • Senior Executive • Financial • Risk Management • Canada and U.S. Operations/ Governance
|
John Cassaday is President and Chief Executive Officer of Corus Entertainment Inc., a position he has held since its inception in 1999. Corus is a Canadian leader in pay and specialty television, Canadian radio and a global leader in children’s programming and licencing. Prior to Corus, Mr. Cassaday was Executive Vice President of Shaw Communications, President and Chief Executive Officer of CTV Television Network and President of Campbell Soup Company in Canada and the UK.
Mr. Cassaday is currently a member of the board of directors of Corus Entertainment Inc. and Sysco Corporation. He is also active in community affairs, principally with St. Michael’s Hospital.
Mr. Cassaday has an MBA (Dean’s List) from the Rotman School of Management at the University of Toronto.
| |||||||||||||
| Board/Committee Membership: | Overall Attendance: 100% | Public Board Membership During Last Five Years: | ||||||||||||
| Board of Directors | 9 of 9 | 100% | Corus Entertainment Inc. | 1999 - Present | ||||||||||
| Corporate Governance & Nominating | 4 of 4 | 100% | Sysco Corporation | 2004 - Present | ||||||||||
| Management Resources & Compensation (Chair) | 7 of 7 | 100% | ||||||||||||
| Securities Held: | ||||||||||||||
| Year | Common Shares | DSUs | Total Common Shares and DSUs | Total Value of Common Shares and DSUs | Minimum Equity Ownership Requirement Met (ü) or Amount ($) Required | |||||||||
| 2014 | 20,000 | 106,503 | 126,503 | $2,713,489 | ü | |||||||||
| 2013 | 20,000 | 92,622 | 112,622 | $1,745,641 | ||||||||||
| Susan F. Dabarno | ||||||||||||||
Status: Independent Director Since: 2013 Term Limit: 2025 2013 Votes For: 99.39% Age: 61
Residence: Bracebridge, ON Canada
Areas of Expertise: • Senior Executive • Financial • Global Financial Services Executive/Knowledge of Investment Management • Canada Operations/ Governance |
Susan Dabarno has been a Corporate Director since 2011. She has extensive wealth management and distribution expertise and served from 2009 to 2010 as Executive Chair, and from 2003 to 2009 as President and Chief Executive Officer, of Richardson Partners Financial Limited, an independent wealth management services firm. Before joining Richardson Partners Financial Limited, Ms. Dabarno was President and Chief Operating Officer at Merrill Lynch Canada Inc.
Ms. Dabarno is currently a member of the board of Bridgepoint Health Foundation and Toronto Waterfront Revitalization Corporation.
Ms. Dabarno is a Fellow of Certified General Accountants and holds a Class II Diploma from McGill University.
| |||||||||||||
| Board/Committee Membership: | Overall Attendance: 100% | Public Board Membership During Last Five Years: | ||||||||||||
| Board of Directors | 6 of 616 | 100% | People Corporation | 2011 - March 1, 2013 | ||||||||||
| Audit | 4 of 416 | 100% | ||||||||||||
| Securities Held: | ||||||||||||||
| Year | Common Shares | DSUs | Total Common Shares and DSUs | Total Value of Common Shares and DSUs | Minimum Equity Ownership Requirement Met (ü) or Amount ($) Required | |||||||||
| 2014 | 30,000 | 0 | 30,000 | $643,500 | ü | |||||||||
| 2013 | 30,000 | 0 | 30,000 | $465,000 | ||||||||||


| 15 | Pursuant to the transitional provisions of the term limits established by the Board, as Mr. Cassaday has not reached the age of 72 as of the date of the Meeting, he may be recommended for re-election for additional one-year terms for up to five years (see section “Board Term Limits” on page 9). |
| 16 | Susan Dabarno was appointed to the Board of Directors on March 1, 2013. |
| Manulife Financial Corporation Proxy Circular | 13 |
Table of Contents
Sheila S. Fraser | ||||||||||||||
Status: Independent Director Since: 2011 Term Limit: 2024 2013 Votes For: 99.33% Age: 63
Residence: Ottawa, ON Canada
Areas of Expertise: • Senior Executive • Public Sector • Financial • Risk Management |
Sheila Fraser is currently a Corporate Director. From 2001 to 2011, Ms. Fraser served as Auditor General of Canada and, prior to joining the Office of the Auditor General in 1999 as Deputy Auditor General, she was a partner at Ernst & Young for 18 years.
Her contributions to the accounting and auditing profession include her current role as a Trustee of the International Financial Reporting Standards Foundation. She has also chaired two committees of the International Organization of Supreme Audit Institutions (INTOSAI) as well as the Public Sector Accounting Board of the Canadian Institute of Chartered Accountants and, until December 31, 2013, was a member of the International Federation of Accountants-International Public Sector Accounting Standards Board (IFAC-IPSASB).
Ms. Fraser holds a Bachelor of Commerce from McGill University and is a Fellow of the Institute of Chartered Accountants and the Ordre des comptables professionnels agréés du Québec.
| |||||||||||||
| Board/Committee Membership: | Overall Attendance: 100% | Public Board Membership During Last Five Years: | ||||||||||||
Board of Directors Audit (Chair) Risk | 9 of 9 5 of 5 7 of 717 | 100% 100% 100% | Bombardier Inc. | 2012 - Present | ||||||||||
| Securities Held: | ||||||||||||||
| Year | Common Shares | DSUs | Total Common Shares and DSUs | Total Value of Common Shares and DSUs | Minimum Equity Ownership Requirement Met (ü) or Amount ($) Required18 | |||||||||
| 2014 | 580 | 19,296 | 19,876 | $426,340 | $23,660 | |||||||||
| 2013 | 580 | 8,303 | 8,883 | $137,687 | ||||||||||
Scott M. Hand | ||||||||||||||
Status: Independent Director Since: 2007 Term Limit: 2019 2013 Votes For: 83.25% Age: 71
Residence: Toronto, ON Canada
Areas of Expertise: • Senior Executive • Financial • Risk Management • Asia, Canada and U.S. Operations/Governance |
Scott Hand is Executive Chairman of the Board of Royal Nickel Corporation and was the Chairman and Chief Executive Officer of Inco Limited (“Inco”) from April 2002 until he retired in January 2007. Prior to that time, Mr. Hand served as the President of Inco and held positions in Strategic Planning, Business Development and Law. Inco has been a major global Canadian-based resources enterprise and a leading producer and marketer of nickel and other metals.
Mr. Hand is currently a member of the board of directors of Legend Gold Corp., Chinalco Mining Corporation International and Royal Nickel Corporation. Mr. Hand also serves on the boards of Boyd Technologies LLC (non-woven materials), the World Wildlife Fund Canada, the Massachusetts Museum of Contemporary Art and a number of private companies in the mineral resource sector.
Mr. Hand received a BA from Hamilton College and a JD from Cornell University.
| |||||||||||||
| Board/Committee Membership: | Overall Attendance: 96% | Public Board Membership During Last Five Years: | ||||||||||||
Board of Directors Management Resources & Compensation Risk | 9 of 9 7 of 7 8 of 9 | 100% 100% 89% | Chinalco Mining Corporation International Legend Gold Corp. Royal Nickel Corporation Fronteer Gold Inc. Royal Coal Corp. | 2012 - Present 2011 - Present 2008 - Present 2007 - 2011 2010 - May 201219 | ||||||||||
| Securities Held: | ||||||||||||||
| Year | Common Shares | DSUs | Total Common Shares and DSUs | Total Value of Common Shares and DSUs | Minimum Equity Ownership Requirement Met (ü) or Amount ($) Required | |||||||||
| 2014 | 30,000 | 34,453 | 64,453 | $1,382,517 | ü | |||||||||
| 2013 | 30,000 | 28,677 | 58,677 | $909,494 | ||||||||||


| 17 | Sheila Fraser was appointed to the Risk Committee on May 2, 2013. |
| 18 | In accordance with the directors’ equity ownership guidelines (see page 21), Sheila Fraser has elected to receive 100% of her annual Board retainer in equity until the minimum requirement has been met. For information on the annual Board retainer and fees, please see the “Schedule of Board Fees” on page 20. |
| 19 | Scott Hand was a director of Royal Coal Corp. during the period from August 2010 until May 2012. On May 3, 2012, a Cease Trade Order was issued on Royal Coal Corp. by the Ontario Securities Commission for failure to file financial statements. On May 17, 2012, Royal Coal Corp. announced that it received notice from the TSX Venture Exchange that the TSX Venture Exchange had suspended trading in Royal Coal Corp.‘s securities as a result of the Cease Trade Order. |
| Manulife Financial Corporation Proxy Circular | 14 |
Table of Contents
| Luther S. Helms | ||||||||||||||
Status: Independent Director Since: 2007 Term Limit: 2019 2013 Votes For: 93.58% Age: 70
Residence: Paradise Valley, AZ United States
Areas of Expertise: • Senior Executive • Financial • Risk Management • Global Financial Services Executive/Knowledge of Investment Management • Asia, U.S. Operations/Governance |
Luther Helms has been the Managing Director of Sonata Capital Group (“Sonata”) since 2000. Sonata is a privately-owned registered investment advisory firm. Mr. Helms has extensive banking and financial services experience, holding various positions at Bank of America Corporation, including Vice Chairman from 1993-1998, and was the Vice Chairman of KeyBank from 1998-2000.
Mr. Helms is currently a member of the board of directors of ABM Industries Incorporated.
Mr. Helms has an MBA from the University of Santa Clara and a BA, History and Economics from the University of Arizona.
| |||||||||||||
| Board/Committee Membership: | Overall Attendance: 94% | Public Board Membership During Last Five Years: | ||||||||||||
Board of Directors | 9 of 9 | 100% | ABM Industries Incorporated | 1995 – Present | ||||||||||
| Audit | 4 of 5 | 80% | ||||||||||||
| Corporate Governance & Nominating | 4 of 4 | 100% | ||||||||||||
| Securities Held: | ||||||||||||||
| Year | Common Shares | DSUs | Total Common Shares and DSUs | Total Value of Common Shares and DSUs | Minimum Equity Ownership Requirement Met (ü) or Amount ($) Required | |||||||||
| 2014 | 2,100 | 55,718 | 57,818 | $1,240,196 | ü | |||||||||
| 2013 | 2,100 | 49,342 | 51,442 | $797,351 | ||||||||||
| Tsun-yan Hsieh | ||||||||||||||
Status: Independent Director Since: 2011 Term Limit: 2024 2013 Votes For: 95.51% Age: 61
Residence: Singapore, Singapore
Areas of Expertise: • Senior Executive • Financial • Asia, Canada and U.S. Operations/Governance • Human Resources Management |
Tsun-yan Hsieh is Chairman of LinHart Group Pte Ltd., a firm he founded in 2010 to provide leadership counseling. Mr. Hsieh, a resident of Singapore, has extensive experience in international business, leadership development and corporate transformation. Mr. Hsieh joined McKinsey & Company in 1980 and was elected as a director from 1990 to 2008 when he retired and, from 2008 to 2010, Mr. Hsieh was retained by McKinsey as a Special Advisor to clients. During his 30-year career with McKinsey & Company, he founded the McKinsey Center for Asian Leadership and worked with clients in more than 30 countries and industries.
Mr. Hsieh is currently a member of the board of directors of Singapore Airlines and Bharti Airtel Limited. He is a member of the Management Advisory Board at the School of Business and a Provost Chair Professor (Practice) at the School of Business (where he is also a member of the Management Advisory Board) and the Lee Kuan Yew School of Public Policy, both at the National University in Singapore.
He has a BSc in Mechanical Engineering from the University of Alberta and an MBA from Harvard Business School.
| |||||||||||||
| Board/Committee Membership: | Overall Attendance: 94% | Public Board Membership During Last Five Years: | ||||||||||||
Board of Directors | 9 of 9 | 100% | Bharti Airtel Limited | 2010 - Present | ||||||||||
| Management Resources & Compensation | 6 of 7 | 86% | Singapore Airlines | 2012 - Present | ||||||||||
Sony Corporation | 2008 - June 2013 | |||||||||||||
| Securities Held: | ||||||||||||||
| Year | Common Shares | DSUs | Total Common Shares and DSUs | Total Value of Common Shares and DSUs | Minimum Equity Ownership Requirement Met (ü) or Amount ($) Required | |||||||||
| 2014 | 0 | 22,206 | 22,206 | $476,319 | ü | |||||||||
| 2013 | 0 | 11,638 | 11,638 | $180,389 | ||||||||||


| Manulife Financial Corporation Proxy Circular | 15 |
Table of Contents
| Donald R. Lindsay | ||||||||||||||
Status: Independent Director Since: 2010 Term Limit: 2023 2013 Votes For: 99.21% Age: 55
Residence: Vancouver, BC Canada
Areas of Expertise: • Senior Executive • Financial • Risk Management • Global Financial Services Executive/Knowledge of Investment Management • Asia, Canada and U.S. Operations/Governance |
Donald Lindsay is President and CEO of Teck Resources Limited, Canada’s largest diversified mining, mineral processing and metallurgical company, a position he has held since 2005. Mr. Lindsay’s experience includes almost two decades with CIBC World Markets Inc., where he ultimately served as President after periods as Head of Investment and Corporate Banking and Head of the Asia Pacific Region.
Mr. Lindsay is currently a member of the board of directors of Teck Resources Limited.
He earned a BSc in Mining Engineering from Queen’s University and holds an MBA from Harvard Business School.
| |||||||||||||
| Board/Committee Membership: | Overall Attendance: 89% |
Public Board Membership During Last Five Years: | ||||||||||||
Board of Directors Risk | 9 of 9 7 of 9 | 100% 78% | Teck Resources Limited | 2005 - Present | ||||||||||
| Securities Held: | ||||||||||||||
| Year | Common Shares | DSUs | Total Common Shares and DSUs | Total Value of Common Shares and DSUs | Minimum Equity Ownership Requirement Met (ü) or Amount ($) Required | |||||||||
| 2014 | 20,000 | 25,789 | 45,789 | $982,174 | ü | |||||||||
| 2013 | 20,000 | 15,861 | 35,861 | $555,846 | ||||||||||
| John R.V. Palmer | ||||||||||||||
Status: Independent Director Since: 2009 Term Limit: 2022 2013 Votes For: 99.04% Age: 70
Residence: Toronto, ON Canada
Areas of Expertise: • Senior Executive • Public Sector • Financial • Risk Management • Asia and Canada Operations/ Governance |
John Palmer is Chairman and a founding director of the Toronto Leadership Centre, an organization focused on leadership in financial supervision. Mr. Palmer was the Superintendent of Financial Institutions, Canada from 1994 - 2001 following his career at KPMG LLP (Canada) where he held senior positions, including Managing Partner and Deputy Chairman. He was also the Deputy Managing Director of the Monetary Authority of Singapore and has advised other regulators including the Australian Prudential Regulation Authority.
Mr. Palmer is currently a member of the board of directors of Fairfax Financial Holdings Limited and of several non-public organizations.
He is a Fellow of the Institutes of Chartered Accountants of Ontario and British Columbia and holds a BA from the University of British Columbia.
| |||||||||||||
| Board/Committee Membership: | Overall Attendance: 100% |
Public Board Membership During Last Five Years: | ||||||||||||
Board of Directors Audit Risk (Chair) | 9 of 9 5 of 5 9 of 9 | 100% 100% 100% | Fairfax Financial Holdings Limited | 2012 - Present | ||||||||||
| Securities Held: | ||||||||||||||
| Year | Common Shares | DSUs | Total Common Shares and DSUs | Total Value of Common Shares and DSUs | Minimum Equity Ownership Requirement Met (ü) or Amount ($) Required | |||||||||
| 2014 | 0 | 47,064 | 47,064 | $1,009,523 | ü | |||||||||
| 2013 | 0 | 40,119 | 40,119 | $621,845 | ||||||||||


| Manulife Financial Corporation Proxy Circular | 16 |
Table of Contents
| C. James Prieur | ||||||||||||||
Status: Independent Director Since: 2013 Term Limit: 2025 2013 Votes For: 99.28% Age: 62
Residence: Chicago, IL United States
Areas of Expertise: • Senior Executive • Financial • Risk Management • Global Financial Services Executive/Knowledge of Investment Management • Asia, Canada and U.S. Operations/Governance |
James Prieur has been a Corporate Director since 2011 and, prior to that time, Mr. Prieur served as Chief Executive Officer and director of CNO Financial Group, Inc. from 2006 until his retirement in 2011. CNO Financial Group is a life insurance holding company focused on the senior middle income market in the U.S. Prior to joining CNO Financial Group, Mr. Prieur was President and Chief Operating Officer of Sun Life Financial, Inc. from 1999 to 2006 where he had previously led operations in Asia, Canada, United States, and the United Kingdom.
He is a member of the President’s Circle of the Chicago Council on Global Affairs, and a member of The Pacific Council on International Policy and its China Committee.
Mr. Prieur is a Chartered Financial Analyst and holds an MBA from the Richard Ivey School at Western University and a BA from the Royal Military College.
| |||||||||||||
| Board/Committee Membership: | Overall Attendance: 100% | Public Board Membership During Last Five Years: | ||||||||||||
Board of Directors Risk | 9 of 9 9 of 9 | 100% 100% | CNO Financial Group, Inc. | 2006 - 2011 | ||||||||||
| Securities Held: | ||||||||||||||
| Year | Common Shares | DSUs | Total Common Shares and DSUs | Total Value of Common Shares and DSUs | Minimum Equity Ownership Requirement Met (ü) or Amount ($) Required | |||||||||
| 2014 | 20,000 | 9,514 | 29,514 | $633,075 | ü | |||||||||
| 2013 | 20,000 | 0 | 20,000 | $310,000 | ||||||||||
| Andrea S. Rosen | ||||||||||||||
Status: Independent Director Since: 2011 Term Limit: 2024 2013 Votes For: 99.35% Age: 59
Residence: Toronto, ON Canada
Areas of Expertise: • Senior Executive • Financial • Risk Management • Global Financial Services Executive/Knowledge of Investment Management • Canada Operations/Governance |
Andrea Rosen has been a Corporate Director since 2006. Ms. Rosen’s extensive knowledge of the financial services industry includes investment banking and wholesale and retail banking. Prior to January 2005, her experience includes more than a decade with the TD Bank Financial Group, where she ultimately served as Vice Chair, TD Bank Financial Group and President of TD Canada Trust. Earlier in her career, she held progressively senior positions at Wood Gundy Inc. and was Vice President at Varity Corporation.
Ms. Rosen is currently a member of the board of directors of the Alberta Investment Management Corporation, Emera Inc. and Hiscox Limited.
She has an LLB from Osgoode Hall Law School, an MBA from the Schulich School of Business at York University and a BA from Yale University.
| |||||||||||||
| Board/Committee Membership: | Overall Attendance: 100% | Public Board Membership During Last Five Years: | ||||||||||||
Board of Directors Audit | 9 of 9 5 of 5 | 100% 100% | Emera Inc. Hiscox Limited | 2007 - Present 2006 - Present | ||||||||||
| Securities Held: | ||||||||||||||
| Year | Common Shares | DSUs | Total Common Shares and DSUs | Total Value of Common Shares and DSUs | Minimum Equity Ownership Requirement Met (ü) or Amount ($) Required | |||||||||
| 2014 | 11,500 | 27,849 | 39,349 | $844,036 | ü | |||||||||
| 2013 | 11,500 | 18,812 | 30,312 | $469,836 | ||||||||||


| Manulife Financial Corporation Proxy Circular | 17 |
Table of Contents
Lesley D. Webster | ||||||||||||||
Status: Independent Director Since: 2012 Term Limit: 2025 2013 Votes For: 99.32% Age: 61
Residence: Naples, FL United States
Areas of Expertise: • Senior Executive • Financial • Risk Management • U.S. Operations/Governance • Global Financial Services Executive/Knowledge of Investment Management |
Lesley Webster is President and founder of Daniels Webster Capital Advisors, an enterprise risk management consulting firm established in 2006. Ms. Webster has extensive financial industry experience and was Executive Vice President of JP Morgan Chase’s firm-wide Market and Fiduciary Risk Management from 1994 until 2005. Prior to that, she was global head of US Dollar Fixed Income Derivatives at UBS Securities, Inc. and head of Fixed Income Arbitrage trading at Chase Manhattan Bank.
Ms. Webster is currently a member of the board of directors of MarketAxess Holdings Inc.
Ms. Webster earned a PhD in Economics from Stanford University and a BA in Economics from the University of Illinois at Urbana. | |||||||||||||
| Board/Committee Membership: | Overall Attendance: 100% | Public Board Membership During Last Five Years: | ||||||||||||
Board of Directors Management Resources & Compensation Risk | 9 of 9 4 of 420 9 of 9 | 100% 100% 100% | MarketAxess Holdings Inc. | April 2013 - Present | ||||||||||
| Securities Held: | ||||||||||||||
| Year | Common Shares | DSUs | Total Common Shares and DSUs | Total Value of Common Shares and DSUs | Minimum Equity Ownership Requirement Met (ü) or Amount ($) Required21 | |||||||||
| 2014 | 0 | 8,578 | 8,578 | $183,998 | $266,002 | |||||||||
| 2013 | 0 | 2,053 | 2,053 | $31,822 | ||||||||||

| 20 | Lesley Webster was appointed to the Management Resources and Compensation Committee on May 2, 2013. |
| 21 | In accordance with the directors’ equity ownership guidelines (see page 21), Lesley Webster has elected to receive 100% of her annual Board retainer in equity until the minimum requirement has been met. For information on the annual Board retainer and fees, please see the “Schedule of Board Fees” on page 20. |
| Director Attendance |
Directors are expected to attend the annual meeting, the Board meetings and the meetings of committees on which they serve, unless circumstances make it impossible to do so. The attendance of directors nominated for re-election is set out above in the biographical charts. For the year ended December 31, 2013, average attendance of all director nominees at Board and committee meetings was 100 per cent and 98 per cent, respectively.
| Summary of Board and Committee Meetings Held in 2013 |
| Board/Committee | Regular Meetings | |
• Board of Directors | 9 (1 independent) | |
• Audit Committee | 5 | |
• Corporate Governance & Nominating Committee | 4 | |
• Management Resources & Compensation Committee | 7 | |
• Risk Committee | 9 |
| Manulife Financial Corporation Proxy Circular | 18 |
Table of Contents
| Attendance of Retiring Directors |
| Director | Board/Committee Membership | Attendance | ||||||||||
| Robert J. Harding (Retiring May 1, 2014) | Board Audit Corporate Governance & Nominating (Chair as of May 2, 2013) Risk(resigned May 2, 2013) |
| 9 of 9 5 of 5 3 of 3 2 of 2 |
|
| 100 100 100 100 | % % % % | ||||

| Director | Board/Committee Membership | Attendance | ||||||||||
| Lorna R. Marsden (Retiring May 1, 2014) | Board Management Resources & Compensation Corporate Governance & Nominating(appointed May 2, 2013) |
| 8 of 9 7 of 7 3 of 3 |
|
| 89 100 100 | % % % | ||||

| Director Independence and Committee Membership |
The Board Policies require that a majority of directors be independent and the Board has adopted an independence policy. Directors must satisfy the requirements of the independence policy, which includes applicable independence requirements of the laws governing the Company, the stock exchanges on which the Company’s securities are listed and applicable securities regulatory authorities. See “Independence of the Board” on page 72 for details on determining director independence.
| Director | Director Since1 | Term Limit2 | Committees | |||||||||||||
| Audit | Corporate Governance and Nominating | Management Resources and Compensation | Risk | |||||||||||||
Independent | ||||||||||||||||
Joseph Caron | 2010 | 2023 | ü3 | ü | ||||||||||||
John Cassaday | 1993 | 2019 | ü | Chair | ||||||||||||
Susan Dabarno | 2013 | 2025 | ü | |||||||||||||
Richard DeWolfe (Chairman) | 2004 | 2018 | ü | |||||||||||||
Sheila Fraser | 2011 | 2024 | Chair | ü | ||||||||||||
Scott Hand | 2007 | 2019 | ü | ü | ||||||||||||
Luther Helms | 2007 | 2019 | ü | ü | ||||||||||||
Tsun-yan Hsieh | 2011 | 2024 | ü | |||||||||||||
Donald Lindsay | 2010 | 2023 | ü | |||||||||||||
John Palmer | 2009 | 2022 | ü | Chair | ||||||||||||
James Prieur | 2013 | 2025 | ü | |||||||||||||
Andrea Rosen | 2011 | 2024 | ü | |||||||||||||
Lesley Webster | 2012 | 2025 | ü | ü | ||||||||||||
Not Independent - Management | ||||||||||||||||
Donald Guloien4 | 2009 | N/A | ||||||||||||||
| 1 | “Director Since” refers to the year the director was first elected to either the Board of the Company or Manufacturers Life. When Manufacturers Life demutualized in 1999, it became a wholly-owned subsidiary of the Company. |
| 2 | “Term Limit” refers to the year in which independent directors would not be eligible for re-election at the annual meeting unless, in exceptional circumstances, approved by the Board. |
| 3 | Subject to his successful re-election at the Meeting, Mr. Caron will be appointed Chair of the Corporate Governance and Nominating Committee. |
| 4 | Donald Guloien is not independent as he is the President and CEO of the Company. Mr. Guloien is not a member of any committee. |
| Manulife Financial Corporation Proxy Circular | 19 |
Table of Contents
Compensation Determination
Compensation is paid to all non-employee directors. Director compensation is designed to:
| • | Promote alignment with shareholder interests by requiring directors to meet the directors’ equity ownership guidelines (described below); |
| • | Be competitive with Canadian financial institutions and other large global financial institutions with comparable scope and complexity; and |
| • | Reflect the directors’ expertise and expected contribution. |
The Board reviews director compensation every two years with the assistance of the Corporate Governance and Nominating Committee and the advice of its independent consultants, Pearl Meyer & Partners and Hugessen Consulting Inc. (“Hugessen Consulting”) with the objective of paying directors appropriately for their oversight role. In reviewing director compensation, the committee considers the time commitment and the responsibilities of directors. The committee, with the assistance of Pearl Meyer & Partners and Hugessen Consulting, reviewed and recommended to the Board for approval an increase in the directors’ compensation effective January 1, 2014 to be competitive with Canadian financial institutions and other large global financial institutions with comparable scope and complexity.
Set out in the table below is the schedule of fees paid to the independent directors in fiscal 2013 and the Board approved changes to the schedule of fees effective January 1, 2014. Subject to confirmation of the amendment to By-Law No. 1 by the shareholders of the Company and the voting policyholders of The Manufacturers Life Insurance Company, the Board has approved a further change to the fee schedule to establish the fees in United States dollars, effective as of July 1, 2014.
| Schedule of Board Fees1 | January 1 to Fees (CDN$) | Effective Fees (CDN$) | Effective Fees (US$)* | |||||||||
Annual Retainers | ||||||||||||
Board member | $ | 110,000 | $ | 150,000 | $ | 150,000 | ||||||
Chair of the Board2 | $ | 350,000 | $ | 400,000 | $ | 400,000 | ||||||
Vice Chair of the Board, if applicable3 | $ | 50,000 | $ | 50,000 | $ | 50,000 | ||||||
Observer to subsidiary board, if applicable4 | N/A | Variable | Variable | |||||||||
Annual Committee Chair Retainers5 | ||||||||||||
Audit Committee | $ | 30,000 | $ | 40,000 | $ | 40,000 | ||||||
Management Resources and Compensation Committee | $ | 30,000 | $ | 40,000 | $ | 40,000 | ||||||
Risk Committee | $ | 30,000 | $ | 40,000 | $ | 40,000 | ||||||
Corporate Governance and Nominating Committee | $ | 20,000 | $ | 25,000 | $ | 25,000 | ||||||
Annual Committee Membership Retainers6 | ||||||||||||
Audit Committee | $ | 8,000 | $ | 8,000 | $ | 8,000 | ||||||
Management Resources and Compensation Committee | $ | 8,000 | $ | 8,000 | $ | 8,000 | ||||||
Risk Committee | $ | 8,000 | $ | 8,000 | $ | 8,000 | ||||||
Corporate Governance and Nominating Committee | $ | 5,000 | $ | 5,000 | $ | 5,000 | ||||||
Attendance Fees7 | ||||||||||||
Board Meeting | $ | 2,000 | $ | 2,000 | $ | 2,000 | ||||||
Committee Meeting | $ | 1,500 | $ | 1,500 | $ | 1,500 | ||||||
Education session not held on dates on which a Board or Committee meeting is held | $ | 1,500 | $ | 1,500 | $ | 1,500 | ||||||
Travel Allowance (per round trip of at least 150km)8 | ||||||||||||
Travel within North America, Europe or Asia |
| Travel Fees (per 8 hour day of travel to and from the Board Meeting): $1,000 |
| $ | 1,000 | $ | 1,000 | |||||
Travel between North America or Asia and Europe | $ | 1,500 | $ | 1,500 | ||||||||
Travel between North America and Asia | $ | 3,000 | $ | 3,000 | ||||||||
* Subject to confirmation of the amendment to By-Law No. 1 as described above.
| 1 | Amounts paid are for services provided to both Manulife Financial Corporation and The Manufacturers Life Insurance Company and the fees are divided equally between the two companies. |
| 2 | The Chair of the Board does not receive any other retainers or attendance fees but is entitled to receive a travel allowance paid in accordance with this fee schedule. |
| 3 | The annual retainer is paid to the Vice Chair of the Board, if any, in addition to the annual Board member retainer and any other applicable fees. |
| 4 | In connection with the Board’s oversight role on subsidiaries, directors may be requested to serve as observers to subsidiary boards from time to time and may be paid an additional retainer and/or meeting fee, determined at the discretion of the Board. |
| 5 | The annual Committee chair retainer is paid to the director (other than the Chair of the Board) holding the specified position. |
| 6 | The annual Committee membership retainer is paid to directors (other than the Chair of the Board) who are members of the specified Committee. |
| 7 | The attendance fee is paid to directors (other than the Chair of the Board) who attend the specified meeting and, in respect of attendance at Committee meetings, are members of the specified Committee. |
| 8 | Directors are entitled to be paid the specified fee for each round trip of at least 150km between the location of their primary or secondary residence and the Board or Committee meeting, education session or other location to which they are required to travel in connection with their Board or Committee duties. Directors are also reimbursed for travel and other expenses incurred for attendance at such sessions. |
| Manulife Financial Corporation Proxy Circular | 20 |
Table of Contents
Directors’ Equity Ownership Guidelines
To align directors’ compensation with the long-term interests of the Company, each director, including the Chairman, is required to hold equity in the Company having a minimum value representing three times the directors’ annual retainer (currently, $450,000). Common Shares, preferred shares of the Company and DSUs are considered equity for this purpose.
Starting in 2014, the Board instituted a new policy that, until such time as a director has reached an equity position having a value representing three times the directors’ annual retainer (currently, $450,000), the director must take one hundred percent (100%) of the Board retainer in DSUs. Directors, while not required to do so, are also encouraged to accumulate an equity position in the Company, either (i) through direct purchases of shares, or (ii) once the minimum equity ownership has been met, by electing to receive a portion of the fees paid to the director in DSUs.
Directors’ equity ownership is valued at the greater of market value and the acquisition cost or grant value for the purposes of meeting the directors’ equity ownership guidelines.
Directors May Elect to Receive Compensation in Equity
Non-employee directors may elect to receive a percentage of their compensation in Common Shares or DSUs instead of cash under the Stock Plan for Non-Employee Directors (the “Stock Plan”). DSUs granted to directors are fully vested on the date of grant but are not payable until the director is no longer a member of the Board. The number of DSUs granted is determined by dividing the dollar value to be received by the closing price of the Common Shares on the TSX on the last trading day prior to the date of grant. DSUs are credited with additional units when dividends are paid on Common Shares. Upon termination of Board service, the DSUs are paid in cash or Common Shares, at the director’s election, within one year. DSUs are only transferable upon death.
The maximum number of Common Shares and DSUs that may be issued under the Stock Plan is 1,000,000 or less than 0.1% of the outstanding Common Shares as of March 11, 2014. As of March 11, 2014, 734,627 DSUs were outstanding and 260,609 Common Shares had been issued under the Stock Plan, each representing less than 0.1% of the outstanding Common Shares as of that date. The maximum number of Common Shares that may be issued in one year or issuable at any time under the Stock Plan together with all other share-based compensation arrangements to any one participant or to insiders in the aggregate cannot exceed 5%
and 10%, respectively, of all of the outstanding Common Shares. The Stock Plan may be amended provided prior regulatory and shareholder approval are received.
Stock Options
In 2004, the Board permanently discontinued further stock option grants to non-employee directors under the Director Equity Incentive Plan. As of February 13, 2014 there were no option-based awards outstanding under the Director Equity Incentive Plan and the Board terminated the plan.
Compensation from Subsidiaries and Affiliates
From time to time, independent directors of the Company may serve as directors or board observers for subsidiaries and affiliates of the Company. They are paid for their services and reimbursed for travel and other expenses incurred in attending board and committee meetings. No directors received any such fees in 2013.
Outstanding Share Based Awards
The following table shows the market value of share-based awards issued to non-employee directors that have vested but not been paid out. These awards consist entirely of the DSUs that some directors have elected to receive as a portion of their fees.
Independent Directors |
Share-Based Awards | |||
| Market or Payout Value of Vested Share-Based Awards Not Paid Out or Distributed ($)1 | ||||
Current Directors | ||||
Joseph P. Caron | 416,685 | |||
John M. Cassaday | 2,232,303 | |||
Susan F. Dabarno | 0 | |||
Richard B. DeWolfe | 1,845,004 | |||
Sheila S. Fraser | 404,444 | |||
Scott M. Hand | 722,135 | |||
Robert J. Harding | 1,324,756 | |||
Luther S. Helms | 1,167,849 | |||
Tsun-yan Hsieh | 465,438 | |||
Donald R. Lindsay | 540,537 | |||
Lorna R. Marsden | 544,122 | |||
John R.V. Palmer | 986,461 | |||
James Prieur | 199,413 | |||
Andrea S. Rosen | 583,715 | |||
Lesley D. Webster | 179,795 | |||
Retired Directors | ||||
Gail C.A. Cook-Bennett | 994,636 | |||
Thomas P. d’Aquino | 657,767 | |||
Robert E. Dineen, Jr. | 843,074 | |||
Hugh W. Sloan, Jr. | 1,289,375 | |||
| 1 | Value of vested DSUs is calculated based on the closing price of the Common Shares on the TSX on December 31, 2013 ($20.96). |
| Manulife Financial Corporation Proxy Circular | 21 |
Table of Contents
2013 Directors’ Compensation
The following table shows the compensation paid to independent directors from January 1 to December 31, 2013:
| Director | Annual Fee Breakdown | Allocation of Annual Fees | All Other | Total | ||||||||||||||||||||||||||||||||||||
Annual ($) | Committee ($) | Committee ($) | Board ($) | Committee ($) | Travel ($) | Fees Earned ($)1 | Share-Based ($)1 | |||||||||||||||||||||||||||||||||
Current Directors | ||||||||||||||||||||||||||||||||||||||||
| Joseph P. Caron | 110,000 | 0 | 11,334 | 18,000 | 15,000 | 14,000 | 84,167 | 84,167 | 1,000 | 169,334 | ||||||||||||||||||||||||||||||
| John M. Cassaday | 110,000 | 30,000 | 13,000 | 18,000 | 16,500 | 1,000 | 0 | 188,500 | 1,000 | 189,500 | ||||||||||||||||||||||||||||||
| Susan F. Dabarno3 | 91,667 | 0 | 6,667 | 12,000 | 6,000 | 1,000 | 117,334 | 0 | 1,000 | 118,334 | ||||||||||||||||||||||||||||||
| Richard B. DeWolfe4 | 286,668 | 10,000 | 5,334 | 8,000 | 6,000 | 12,000 | 164,001 | 164,001 | 1,000 | 329,002 | ||||||||||||||||||||||||||||||
| Sheila S. Fraser5 | 110,000 | 20,000 | 13,334 | 18,000 | 18,000 | 7,000 | 0 | 186,334 | 1,000 | 187,334 | ||||||||||||||||||||||||||||||
| Scott M. Hand | 110,000 | 0 | 16,000 | 18,000 | 22,500 | 1,000 | 83,750 | 83,750 | 1,000 | 168,500 | ||||||||||||||||||||||||||||||
| Robert J. Harding6 | 110,000 | 13,334 | 14,000 | 18,000 | 15,000 | 1,000 | 0 | 171,334 | 1,000 | 172,334 | ||||||||||||||||||||||||||||||
| Luther S. Helms | 110,000 | 0 | 13,000 | 18,000 | 12,000 | 14,000 | 83,500 | 83,500 | 1,000 | 168,000 | ||||||||||||||||||||||||||||||
| Tsun-Yan Hsieh | 110,000 | 0 | 8,000 | 18,000 | 9,000 | 30,000 | 0 | 175,000 | 1,000 | 176,000 | ||||||||||||||||||||||||||||||
| Donald R. Lindsay | 110,000 | 0 | 8,000 | 18,000 | 12,000 | 14,000 | 0 | 162,000 | 1,000 | 163,000 | ||||||||||||||||||||||||||||||
| Lorna R. Marsden7 | 110,000 | 0 | 11,334 | 16,000 | 15,000 | 1,000 | 153,334 | 0 | 1,000 | 154,334 | ||||||||||||||||||||||||||||||
| John R.V. Palmer | 110,000 | 30,000 | 16,000 | 18,000 | 21,000 | 1,000 | 98,000 | 98,000 | 1,000 | 197,000 | ||||||||||||||||||||||||||||||
| C. James Prieur | 110,000 | 0 | 8,000 | 18,000 | 13,500 | 14,000 | 0 | 163,500 | 1,000 | 164,500 | ||||||||||||||||||||||||||||||
| Andrea S. Rosen | 110,000 | 0 | 8,000 | 18,000 | 7,500 | 1,000 | 0 | 144,500 | 1,000 | 145,500 | ||||||||||||||||||||||||||||||
| Lesley D. Webster8 | 110,000 | 0 | 13,334 | 18,000 | 19,500 | 14,000 | 64,834 | 110,000 | 1,000 | 175,834 | ||||||||||||||||||||||||||||||
Retired Directors | ||||||||||||||||||||||||||||||||||||||||
| Gail C.A. Cook-Bennett9 | 118,585 | 0 | 0 | 0 | 0 | 0 | 0 | 118,585 | 3,000 | 121,585 | ||||||||||||||||||||||||||||||
| Thomas P. d’Aquino9 | 37,269 | 0 | 4,406 | 8,000 | 6,000 | 2,000 | 57,675 | 0 | 3,000 | 60,675 | ||||||||||||||||||||||||||||||
| Robert E. Dineen, Jr.9 | 37,269 | 0 | 2,711 | 8,000 | 3,000 | 4,000 | 54,980 | 0 | 3,000 | 57,980 | ||||||||||||||||||||||||||||||
| Hugh W. Sloan, Jr. 9 | 37,269 | 6,777 | 4,406 | 8,000 | 6,000 | 4,000 | 33,226 | 33,226 | 3,000 | 69,452 | ||||||||||||||||||||||||||||||
| TOTAL:10 | $ | 2,988,198 | ||||||||||||||||||||||||||||||||||||||
| 1 | Directors may elect to receive a percentage of their compensation in Common Shares or DSUs instead of cash under the Stock Plan. The amounts referenced in the “Fees Earned” column are the fees the directors elected to receive in cash. The amounts referenced in the “Share-Based Awards” column are the fees the directors elected to receive in DSUs instead of cash. |
| 2 | In December 2013, the Company made a $1,000 donation in the name of each current director to a charity chosen by that director. |
| 3 | Susan Dabarno was appointed to the Board of Directors on March 1, 2013. |
| 4 | Richard DeWolfe was elected Chairman of the Board on May 2, 2013. Upon being elected Chairman, Mr.Richard DeWolfe resigned from the Audit Committee and Risk Committee and was appointed to the Corporate Governance and Nominating Committee. |
| 5 | Sheila Fraser was elected as Chair of the Audit Committee and was appointed to the Risk Committee on May 2, 2013. |
| 6 | Robert Harding was elected as Chair of the Corporate Governance and Nominating Committee and resigned from the Risk Committee on May 2, 2013. |
| 7 | Lorna Marsden was appointed to the Corporate Governance and Nominating Committee on May 2, 2013. |
| 8 | Lesley Webster was appointed to the Management Resources and Compensation Committee on May 2, 2013. |
| 9 | Gail Cook-Bennett, Thomas d’Aquino, Robert Dineen and Hugh Sloan retired from the Board of Directors on May 2, 2013. On their retirement, each retiring director was presented with a retirement gift valued at $3,000. |
| 10 | The maximum aggregate annual remuneration payable to directors for each of the Company and Manufacturers Life is $4,000,000 ($2,000,000 per company). |
| Manulife Financial Corporation Proxy Circular | 22 |
Table of Contents
| Committee Reports |
| Report of the Corporate Governance and Nominating Committee |
 |  |  |  |  |
| |||||||||
| Robert J. Harding (Chair) | Richard B. DeWolfe | Joseph P. Caron | John M. Cassaday | Luther S. Helms | Lorna R. Marsden |
RESPONSIBILITIES
The mandate of the Corporate Governance and Nominating Committee requires it to do the following:
| • | Review the structure and composition of the Board and its committees. |
| • | Review, and where necessary recommend changes to the Board for approval, the mandates of the Board, individual directors, the Chairman of the Board and the Chair of each of its committees. |
| • | Recommend areas of expertise for selection of new director nominees and identify qualified director nominees for Board approval. |
| • | Assess the effectiveness of the Board, its committees, the Chairs of those committees and the contributions of individual directors. |
| • | Make Chairman of the Board succession recommendations. |
| • | Oversee and recommend the adoption of best practices in corporate governance. |
| • | Oversee director orientation and education. |
| • | Review and recommend director compensation. |
INDEPENDENCE
All committee members are independent. See “Independence of the Board” on page 72 for details on determining director independence.
2013 HIGHLIGHTS
The committee, at its four meetings in 2013, reviewed, analyzed, discussed, made recommendations and approved a variety of matters, which include the following highlights, all in accordance with its charter:
Meetings
| • | The CEO attended the meetings at the invitation of the Chair of the committee. |
| • | Metin camera without management at the end of each meeting. |
Board Evaluations and 2014 Objectives
| • | Reviewed and assessed the Board’s performance against its mandate and its 2013 annual objectives. |
| • | Carried out the annual evaluation of the Board, the committees, the Board and committee Chairs and the contributions of individual directors (see “Board, Committees, Directors and Chairman Evaluation” for a description of the evaluation process on page 75). The evaluation focuses on areas for improvement and focus in the coming year. |
| • | Developed 2014 Board objectives from the results of the evaluations which include: |
| 1. | Enhance engagement with shareholders, policyholders and other stakeholders, including encouraging, supporting and participating in investor relations and shareholder outreach and engagement programs. |
| 2. | Continue to exercise oversight and provide strategic direction in a manner which enhances management effectiveness and supports prudent risk management, including (i) focusing on key issues facing the Company; (ii) understanding the global opportunities for the Company; and (iii) deepening the Board’s understanding of the range of products and services offered by the Company and the competitive landscape. |
| 3. | Support management in developing external benchmarks for regularly measuring and reporting on accomplishments. |
| 4. | Continue to support management in optimizing the quality, continuity and flow of information to the Board. |
| 5. | Maintain a clear role for the Board, with defined boundaries in relation to its oversight function. |
| 6. | Encourage and support director education and credentials beyond the Company’s Board education program. |
Board and Committee Composition and Succession
| • | Continued the Board renewal process to actively manage director retirements, including recommending type of expertise required and identifying director candidates. Recommended the elimination of the mandatory retirement age for directors in favour of term limits for independent directors, with appropriate transition provisions (see “Board Term Limits” on page 74 for details on the term limits). |
Director Compensation
| • | The committee, with the assistance of Pearl Meyer & Partners and of Hugessen Consulting, reviewed and recommended to the Board for approval an increase in the directors’ compensation effective January 1, 2014 to be competitive with Canadian financial institutions and other large global financial institutions with comparable scope and complexity. |
| Manulife Financial Corporation Proxy Circular | 23 |
Table of Contents
| • | The committee also recommended to the Board that it approve an amendment to By-Law No. 1 of the Company establishing the maximum annual aggregate remuneration payable to the Board in United States dollars. This enables Company to pay directors in United States dollars without exceeding the maximum annual aggregate remuneration payable in the event of currency fluctuations. As a company with a significant global presence, it is desirable that the Board also reflect that geographic diversity. Payment of directors’ remuneration in United States dollars, a global currency, will facilitate the Company’s ability to attract and retain directors globally and be competitive with other large global financial institutions with comparable scope and complexity. |
Director Independence
| • | Established a director independence policy which complies with the requirements for independence to which the Company is subject and reviewed the independence qualifications of each director in accordance with these requirements (see “Independence of the Board” on page 72 for details on determining director independence). This annual review considered the employment status of the director (and his or her spouse and children, if applicable), other board memberships, Company shareholdings and business relationships and, for members of the (i) Audit Committee, any consulting, advisory or other compensatory fee received from the Company and its affiliates; and (ii) Management Resources and Compensation Committee, the sources of the director’s remuneration. |
| • | The committee confirmed that only one of the directors has a direct or indirect material relationship with the Company which could, in the view of the Board, be reasonably expected to interfere with the exercise of his independent judgment. As an executive officer of the Company, Mr. Guloien is considered to have a material relationship with the Company and does not meet the independence standards. |
Corporate Governance
| • | The committee continually reviews and benchmarks the Company’s governance practices against domestic and international standards. |
| • | Corporate governance developments were monitored, existing practices were reviewed and recommendations were made to the Board to enhance the Company’s corporate governance program. |
| • | Provided oversight on the Company’s implementation of OSFI’s Corporate Governance Guidelines, including the adoption of an independence policy and amendments to the Board Policies and charters of the Board and its committees. |
External Consultant
| • | During 2013, the Committee retained the services of Pearl Meyer & Partners and of Hugessen Consulting as noted above. |
| • | Fees paid to Hugessen Consulting for their services to the committee were $5,000. Hugessen Consulting was also retained by the Management Resources and Compensation Committee as described in its report on page 28. |
| • | Fees paid to Pearl Meyer & Partners for their services to the committee were $31,1671. |
Charter Review and Compliance
| • | The committee carried out all of the responsibilities required by its charter. |
| • | The committee reviewed its charter, made recommendations for its amendment to the Board and assessed its performance against its charter. |
| • | The charter can be found at www.manulife.com. |
This report has been approved by the members of the Corporate Governance and Nominating Committee.
Robert J. Harding (Chair) (Effective May 2, 2013)2
Richard B. DeWolfe (Chairman of the Board)
Joseph P. Caron
John M. Cassaday
Luther S. Helms
Lorna R. Marsden
| 1 | Fees were paid in U.S. dollars and were converted to Canadian dollars at an average exchange rate of $1.038 per U.S.$1.00. |
| 2 | Hugh Sloan was chair of the Governance Committee until his retirement on May 2, 2013. |
| Manulife Financial Corporation Proxy Circular | 24 |
Table of Contents
| Report of the Audit Committee |
 |  | | |  |  | |||||||||||
| Sheila S. Fraser (Chair) | Susan F. Dabarno | Robert J. Harding | Luther S. Helms | John R.V. Palmer | Andrea S. Rosen |
RESPONSIBILITIES
The Audit Committee assists the Board in its oversight role respecting:
| • | The quality and integrity of financial information. |
| • | The effectiveness of the Company’s internal control over financial reporting. |
| • | The effectiveness of the Company’s risk management and compliance practices. |
| • | The performance, qualifications and independence of the independent auditor. |
| • | Compliance with legal and regulatory requirements. |
| • | The review of policies governing the process by which risk assessment and management is undertaken. |
| • | The performance of the Company’s Finance, Actuarial, Internal Audit and Global Compliance functions. |
| • | The Company’s ethical standards. |
| • | Conflicts of interest, protection of confidential information and customer complaints. |
| • | Arrangements with individuals or entities related to the Company, and transactions that could have a material impact on the stability or solvency of the Company. |
INDEPENDENCE
All committee members are independent. See “Independence of the Board” on page 72 for details on determining director independence.
FINANCIAL LITERACY AND AUDIT COMMITTEE FINANCIAL EXPERTS
The committee and the Board have reviewed the committee membership and determined that all members are financially literate as required by the New York Stock Exchange Listed Company Manual and the applicable instruments of the Canadian Securities Administrators. The Board has also determined that all current members have the necessary qualifications to be designated as audit committee financial experts under the Sarbanes-Oxley Act of 2002 (“SOX”).
2013 HIGHLIGHTS
The committee, at its five meetings in 2013 reviewed, analyzed, discussed, made recommendations and approved a variety of matters, which include the following highlights, all in accordance with its charter:
Meetings
| • | The Chairman of the Board and the CEO attended the meetings at the invitation of the committee Chair, where committee meeting scheduling permitted. |
| • | Metin camera without management at the end of each meeting. |
| • | The committee had direct communication andin camera meetings with each of the Chief Auditor; the independent auditor; the Appointed Actuary; the General Counsel to review the management of legal and |
compliance risks; and the Chief Financial Officer to review management’s financial stewardship and risk management. |
Annual Statement
| • | Reviewed and discussed with management and the independent auditor, Ernst & Young, and recommended for approval by the Board, the 2012 annual audited financial statements and 2013 quarterly unaudited financial reports of the Company. |
| • | Discussed with Ernst & Young all matters required to be discussed by professional auditing guidelines and standards in Canada and the United States. |
| • | Received the written disclosures from Ernst & Young in accordance with the standards of the Canadian Institute of Chartered Accountants and the Public Company Accounting Oversight Board in the United States. |
Independent Auditor
| • | Reviewed the independence and qualifications of Ernst & Young based on its disclosure of its relationship with the Company. |
| • | Recommended the reappointment of Ernst & Young as the Company’s independent auditor for approval by the shareholders. |
| • | In accordance with the Protocol for Approval of Audit and Permitted Non-Audit Services established by the committee, pre-approved recurring audit and non-audit services that were identifiable for the coming year including terms and fees and approved audit and non-audit services proposed during the year. |
| • | Reviewed the scope and plan of the annual audit with Ernst & Young and management and recommended Ernst & Young’s 2013 compensation to the Board for approval. |
| • | Reviewed management’s report on its assessment of internal controls over financial reporting and the independent auditor’s attestation on management’s assessment and discussed with management and the independent auditor. |
| • | Metin camera with Ernst & Young. |
Oversight Functions
| • | Reviewed and approved the mandates of the Chief Financial Officer, the Chief Actuary, the Chief Auditor and the Global Compliance Chief and of the Finance, Actuarial, Internal Audit and Global Compliance functions. |
| • | Reviewed and approved the budget, structure, skills and resources of each of these oversight functions. |
| • | Reviewed the performance evaluation of the heads of each of these oversight functions and assessed the effectiveness of these individuals and their respective functions. |
| • | Reviewed the compensation of the Chief Auditor. |
| Manulife Financial Corporation Proxy Circular | 25 |
Table of Contents
Internal Audit
| • | Reviewed and approved the independence and qualifications of the internal audit function. |
| • | Reviewed and approved the audit plan of the internal audit function. |
| • | Reviewed internal audit’s periodic reports on its activities and the results of the audits. |
| • | Metin camera with the Chief Auditor. |
Appointed Actuary
| • | Reviewed reports, opinions and recommendations prepared by the Appointed Actuary of the Company including the report on Dynamic Capital Adequacy Testing which is also reviewed by the Risk Committee. |
| • | Reviewed the results of the external peer review of work performed by the Appointed Actuary. The review was conducted by an independent peer reviewer in accordance with the requirements of OSFI GuidelineE-15. |
| • | Metin camera with the Appointed Actuary and the independent peer reviewer. |
Financial Reporting
| • | Received updates from management on significant future changes to the accounting principles and practices. |
| • | Reviewed significant financial reporting issues and judgments made in connection with the preparation of financial statements. |
| • | Reviewed the certification process for annual and interim filings with applicable securities regulatory authorities with the CEO and the CFO. |
| • | Monitored the Company’s SOX certification requirements and SOX compliance. |
| • | Financial statements and Management’s Discussion and Analysis were presented for review by the Audit Committee at meetings scheduled prior to Board meetings. The Audit Committee provided a report and recommendation to the Board with respect to financial disclosure of the Company. |
| • | Received reports from the Chair of the Disclosure Committee, as appropriate and approved the Company’s earnings press releases, quarterly and annual financial statements and quarterly and annual Management’s Discussion and Analysis. |
| • | Reviewed procedures for receiving confidential submissions by employees of concerns regarding questionable accounting or auditing matters. |
| • | Metin camera with the Chief Financial Officer. |
Risk Management
| • | Reviewed and discussed guidelines and policies governing the process by which risk assessment and management is undertaken. |
| • | Received a report from the Chief Risk Officer setting out an overview of the Risk Committee’s and management’s process for risk assessment and management, including the Company’s Enterprise Risk Management framework, risk philosophy and appetite, Company and business unit risk targets; risk considerations embedded in business management and incentive compensation plans; the Company’s risk oversight structure; and the Operational Risk Management framework and program. |
| • | Received the Chief Risk Officer’s Report on the Company’s Information Risk Management Program. |
| • | Reviewed the General Counsel’s report on legal matters that may have a material impact on the Company. |
Regulatory Compliance and Anti-Money Laundering/Anti-Terrorist Financing Program
| • | Reviewed the Global Chief Compliance Officer’s report on the Company’s compliance with applicable laws and regulations. |
| • | Reviewed and discussed the Chief Anti-Money Laundering Officer’s report on the Company’sAnti-Money Laundering/Anti-Terrorist Financing program (the “AML/ATF Program”). |
| • | Received the Chief Auditor’s report on the testing of the effectiveness of the AML/ATF Program. |
| • | Metin camera with the Global Compliance Chief. |
Highlights of the Conduct Review and Ethics Responsibilities in 2013
In 2013, the Audit Committee accomplished the following in accordance with the committee’s charter:
Ethical Standards
| • | Carried out its annual review of the Code of Business Conduct and Ethics (the “Code”), received management’s report on the Ethics Hotline (the third party reporting system that permits employees to submit their ethics concerns anonymously), the Code training and certification process and the conflict of interest disclosure statements. |
| • | Confirmed that no executives or directors requested a waiver of the Code and that no waivers were granted. |
| • | Reviewed and assessed the procedures relating to conflicts of interest and the procedures to restrict the use of confidential information. |
Self-Dealing and Disclosure Requirements
| • | Reviewed the effectiveness of the related party transaction procedures and practices to ensure the identification of any material related party transactions. |
| • | Received a report from management that there were no material related party transactions. |
| • | Reviewed procedures for dealing with complaints made by customers having requested or received products or services in Canada from the Company. |
Charter Review and Compliance
| • | The committee carried out all of the responsibilities required by its charter. |
| • | The committee reviewed its charter, made recommendations for its amendment to the Board and assessed its performance against its charter. |
| • | The charter can be found at www.manulife.com. |
This report has been approved by the members of the Audit Committee.
Sheila S. Fraser (Chair) (Effective May 2, 2013)1
Susan F. Dabarno
Robert J. Harding
Luther S. Helms
John R.V. Palmer
Andrea S. Rosen
| 1 | Richard DeWolfe was chair of the Audit Committee prior to May 2, 2013. |
| Manulife Financial Corporation Proxy Circular | 26 |
Table of Contents
| Report of the Risk Committee |
| |  |  |  |
| |||||||||
| John R.V. Palmer (Chair) | Sheila S. Fraser | Scott M. Hand | Donald R. Lindsay | C. James Prieur | Lesley D. Webster |
RESPONSIBILITIES
The Risk Committee assists the Board in its oversight of the Company’s management of its principal risks including:
| • | Reviewing the principal risks of the Company identified by management and assessing whether the key risks of the Company have been identified. The principal risks include market, credit, insurance and operational risks. |
| • | Reviewing and evaluating a range of stress tests, implications of potential stress scenarios and emerging risks developed by management to identify new or evolving risks to the Company. |
| • | Reviewing and approving management’s recommended policies, procedures and controls used to identify, assess and manage the Company’s principal risks. |
| • | Assessing the Company’s programs, procedures and controls in place to manage its principal risks. |
| • | Reviewing the Company’s compliance with its risk management policies. |
INDEPENDENCE
All committee members are independent. See “Independence of the Board” on page 72 for details on determining director independence.
2013 HIGHLIGHTS
The committee, at its nine meetings in 2013 reviewed, analyzed, discussed, made recommendations and approved a variety of matters, which include the following highlights, all in accordance with its charter:
Meetings
| • | The Chairman of the Board and the CEO attended the meetings at the invitation of the committee Chair. |
| • | Metin camera without management at the end of each meeting. |
Oversight of Risk Management
| • | Reviewed management’s recommendations for the Company’s risk appetite and Enterprise Risk Policy and recommended them to the Board for approval. |
| • | Reviewed (a) risk management policies, to seek to ensure they remain appropriate to effectively identify, assess and manage the Company’s principal risks; and (b) the risk targets for principal risks and any exposures exceeding those designated targets. |
| • | Reviewed reports, presentations and other information presented by the Chief Risk Officer, the Risk Disclosure Committee and the Disclosure Committee, as appropriate and members of management, related to the Company’s risk exposures, stress tests and emerging risks and associated programs, procedures and controls in place to manage its principal risks for each Business Division and for the Company as a whole. |
| • | Reviewed reports from the Chief Auditor, relating to the adequacy and effectiveness of the Company’s procedures and controls to manage its principal risks. |
| • | Reviewed the Dynamic Capital Adequacy Testing report and the internal capital target recommendation prepared by the Chief Actuary. |
| • | Reviewed the insurance limits for the Company’s Financial Institutions Bond to be established in compliance with the Protection of Assets (Insurance Companies) Regulation of theInsurance Companies Act (Canada). |
| • | Reviewed information related to the Company’s principal risk exposures and trends. |
| • | Reviewed the alignment of the incentive compensation programs and risk management objectives. |
| • | Reviewed the risk impact of the business plan and new business initiatives, including consistency with the approved risk appetite and related risk management and controls. |
| • | Received reports on the Company’s hedging programs. |
| • | Received updates on significant regulatory issues. |
| • | Received the Audit Services Report, the semi-annual Regulatory Compliance Report and the Litigation Report, all of which were presented to the Audit Committee. |
| • | Metin camera with the Chief Risk Officer. |
Group Risk Management
| • | Reviewed and approved the mandates of the Chief Risk Officer and of the Group Risk Management function. |
| • | Reviewed and approved the budget, structure, skills, resources and independence of the Group Risk Management function. |
| • | Reviewed the performance evaluation of the Chief Risk Officer and assessed the effectiveness of the Group Risk Management function. |
Charter Review
| • | The committee carried out all of the responsibilities required by its charter. |
| • | The committee reviewed its charter, made recommendations for its amendment to the Board and assessed its performance against its charter. |
| • | The charter can be found at www.manulife.com. |
This report has been approved by the members of the Risk Committee.
John R.V. Palmer(Chair)
Sheila S. Fraser
Scott M. Hand
Donald R. Lindsay
C. James Prieur
Lesley D. Webster
| Manulife Financial Corporation Proxy Circular | 27 |
Table of Contents
| Report of the Management Resources and Compensation Committee |
| | | |  |  |  | |||||||||
| John M. Cassaday (Chair) | Joseph P. Caron | Scott M. Hand | Tsun-yan Hsieh | Lorna R. Marsden | Lesley D. Webster |
RESPONSIBILITIES
The Management Resources and Compensation Committee assists the Board (or any committee of the Board) in its oversight role respecting:
| • | The Company’s global human resources strategy, policies and programs. |
| • | Matters relating to the appropriate utilization of human resources within the Company with special focus on management succession, development, compensation and the evaluation of performance and recommendations for compensation for the CEO, all members of the Executive Committee and the heads of the oversight functions. |
| • | Disclosure of relevant information on executive compensation to the Company’s shareholders. |
INDEPENDENCE
| • | All committee members are independent. See “Independence of the Board” on page 72 for details on determining director independence. |
| • | In accordance with the Board Policies, no more than one third of the committee’s members are currently a chief executive officer of another public company and at least one committee member is experienced in executive compensation. |
| • | The CEO is not involved in the committee member selection process. |
2013 HIGHLIGHTS
The committee, at its seven meetings in 2013 reviewed, analyzed, discussed, made recommendations and approved a variety of matters, which include the following highlights, all in accordance with its charter:
Meetings
| • | The Chairman of the Board, the CEO, other members of management and the Board’s independent advisor Hugessen Consulting attended meetings at the invitation of the committee Chair. |
| • | Metin camera without management at the end of each meeting. |
Compensation Program
| • | Completed the annual review of the Company’s compensation programs, including base pay, incentives, pension and benefit plans and made recommendations to the Board. |
| • | Modified and approved the peer groups used for assessing compensation for the CEO and the Senior Executive Vice Presidents. |
| • | Reviewed management’s report on Sales and Investment Incentive Compensation Plan Governance. |
| • | Reviewed Internal Audit’s report on the compensation programs alignment with the Financial Stability Board’s Principles for Sound Compensation Practices. |
| • | Reviewed, on a quarterly basis, the Company’s performance against targets established under the annual and mid-term incentive plans. |
Executive Performance Assessment and Compensation
| • | Reviewed and approved the CEO’s annual objectives. Assessed the CEO’s performance against these objectives and recommended compensation awards for the CEO for approval by the Board. |
| • | Reviewed the performance assessments and approved the objectives of the members of the Executive Committee and the heads of the oversight functions following a review with the CEO. This included a review of the executives’ contribution to a culture of integrity and their management of risk. |
| • | Reviewed and approved the 2013 executive compensation for members of the Executive Committee and the heads of the oversight functions. |
| • | Reviewed and recommended to the Board for approval, the Company’s 2013 compensation policies, programs and payouts. This included the metrics for the balanced scorecard for the annual incentive plan, the design of the annual and medium-term incentive plans, and the equity mix for Executive Committee members and the heads of the oversight functions. |
| • | Confirmed the alignment of the compensation program and payouts with the Company’s risk management objectives. |
Executive and CEO Succession
| • | Reviewed the succession process for the CEO and oversight of the succession process for the members of the Company’s Executive Committee. |
| • | Assessed the readiness to fill potential vacancies and gaps in the readiness. The results of the succession planning exercise were reported to the Board. (See “Talent and Succession Planning” and the “Statement of Corporate Governance Practices” on pages 62 and 72 for a description of Manulife’s succession planning process and philosophy.) |
| • | Metin camera with the CEO to review the CEO’s direct reports and the potential successors with a focus on qualifications required for the position, the competencies and development considerations for each |
| Manulife Financial Corporation Proxy Circular | 28 |
Table of Contents
potential successor candidate, and the performance of individual executives in their current roles. |
| • | Considered the performance of the CEO and recommended his re-appointment as CEO upon his successful election to the Board at the Annual and Special Meeting. |
| • | Reviewed and recommended to the Board for approval several executive appointments arising from the organizational re-design process. |
External Consultant
The committee has retained Hugessen Consulting to act as its independent advisor and to provide it with advice and guidance on compensation issues since 2006. All work undertaken by Hugessen Consulting was pre-approved by the committee Chair.
Hugessen Consulting’s fees for executive compensation consulting services provided to the Management Resources and Compensation Committee in 2013 were $346,832, compared with $258,905 in 2012. Services included participation at committee meetings, reviewing and providing advice on compensation related decisions and reporting on compensation trends. Hugessen Consulting also provided services to the Corporate Governance and Nominating Committee as described in its report on page 23. Hugessen Consulting does not provide any other services to the Company.
The committee also assessed Hugessen Consulting’s independence.
The committee also adopted amendments to its charter that provide that any proposed retainer by management of any independent advisor previously retained by the committee must be submitted to the committee for pre-approval.
Charter Review and Compliance
| • | The committee carried out all of the responsibilities required by its charter. |
| • | The committee reviewed its charter and made recommendations for its amendment to the Board and assessed its performance against its charter. |
| • | The charter can be found at www.manulife.com. |
The members of the Management Resources and Compensation Committee approved this report and reviewed and recommended to the Board for approval, the “Compensation Discussion and Analysis” section of this Proxy Circular.
John M. Cassaday (Chair)
Joseph P. Caron
Scott M. Hand
Tsun-yan Hsieh
Lorna R. Marsden
Lesley D. Webster
| Manulife Financial Corporation Proxy Circular | 29 |
Table of Contents
Manulife’s executive compensation program is designed to encourage and reward our leaders for delivering results and creating sustainable long-term value for shareholders. Pay for performance and alignment with shareholder interests are the philosophies guiding our approach to executive compensation. In addition, good governance principles and practices, and the alignment of our compensation programs with the Financial Stability Board’s Principles for Sound Compensation Practices, drive our executive compensation program plan design.
Manulife’s Board of Directors’ executive compensation decisions are made after considering the recommendations of the Management Resources and Compensation Committee (“MRCC”). The MRCC uses the services of an independent advisor to provide advice on compensation-related decisions and to report on external compensation trends. We continually benchmark our compensation program against our peers to ensure we provide competitive compensation opportunities in order to attract, retain and motivate our executives. And finally, the Board of Directors engages with our shareholders and shareholder advocacy groups to ensure their views are considered when reviewing our compensation program.
Overall, Manulife had strong performance in 2013, however there were a limited number of areas where we did not fully achieve our objectives. We saw our strategy deliver strong operating results and tangible progress was made toward ourlong-term objectives. Our efforts over the past five years to strengthen our capital, reduce risk and redesign our products helped generate positive 2013 results and positioned the Company for continued strong performance in the future. Our efforts have also been reflected in our stock price and resulted in a 60% Total Shareholder Return in Canadian dollars for 2013.
As a result of constructive feedback from our shareholders, we have made changes to this year’s Compensation Discussion & Analysis (“CD&A”). There was a desire for more clarity and insight into our executive compensation program, 2013 incentive payouts and key governance structures. Additionally, in consideration of the positive progression in the Company’s performance over the past three years, the Board of Directors has made several changes to the executive compensation program for 2014 to ensure our programs continually evolve, align with our strategic direction and create value for our shareholders.
At the 2014 Annual and Special Meeting, we will once again hold a non-binding shareholder advisory vote on our approach to executive compensation, and we look forward to your feedback. The Board of Directors will continue to review Manulife’s executive compensation program to ensure it is aligned with the interests of shareholders and our pay for performance philosophy.
|
| |
John Cassaday | Richard B. DeWolfe | |
| Chairman of the Management Resources | Chairman of the Board | |
| and Compensation Committee |

| Manulife Financial Corporation Proxy Circular | 30 |
Table of Contents
Introduction
At Manulife, our compensation philosophy and strategy is to pay for performance against our short, medium and long-term goals. We believe that our multi-faceted executive compensation plans provide an effective framework that aligns with our business and by which progress against our strategic goals may be appropriately measured and rewarded.
The positive results of 2013 are reflected in the payouts under the 2013 Annual Incentive Plan and the Restricted Share Units that vested in 2013. On the other hand, the Performance Share Units that vested in 2013 reflect the business performance challenges we faced in 2011 and 2012, and paid out below the award date value.
2013 Notable Business Results
| • | Delivered a Total Shareholder Return1 of 60% |
| • | Achieved core earnings2 of $2.62 billion, a 16% increase over 2012 |
| • | Achieved net income attributed to shareholders of $3.13 billion versus a 2012 result of $1.81 billion |
| • | Achieved record funds under management2 of $599 billion |
| • | Achieved new business embedded value2 of $1.2 billion, up 16% from 2012 |
| • | Increased MLI’s Minimum Continuing Capital and Surplus Requirements (“MCCSR”) ratio by 37 points over year end 2012 to 248% |
| • | Achieved record wealth sales2 of $49.7 billion, up 37% from 2012 |
| • | Reported insurance sales of $2.8 billion, down 13% from 2012, but with higher margins |
| • | Achieved substantive progress against our long term strategic priorities which include developing our Asian opportunity to the fullest; growing our wealth and asset management business; continuing to build our balanced Canadian franchise and continuing to grow higher ROE, lower risk U.S. businesses |
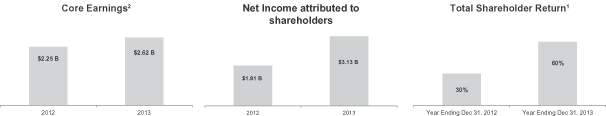
Annual Incentive Plan Payouts
Under the Annual Incentive Plan, Company performance is measured by the results of our balanced scorecard, which aligns with our business strategy, and has three components: (i) Financial Goals; (ii) Operating Targets; and (iii) Strategic Initiatives. Specific objectives, often quantitative, are set for each category, as indicated below.
| 2013 Annual Incentive Plan – Balanced Scorecard for NEOs | ||||||||
Financial Goals [34%] | Operating Targets [33%] | Strategic Initiatives [33%] | ||||||
Annual profit measure – tied to current year results | Measures such as sales, new business embedded value, expense management, customer retention and risk goals | Complex, multi-year initiatives undertaken in the current year | ||||||
q | q | q | ||||||
| Results of current year profitability | Indicators of both current and future performance | Actions implemented to position the Company for future success | ||||||
2013 Result: 152% of Target | 2013 Result: 113% of Target | 2013 Result: 122% of Target |
| 2013 Company Performance Score: 129% of Target (for details see pages 39-41) | ||||||||
In 2013, each NEO’s annual incentive award was calculated by applying the Company performance score of 129% and an individual performance multiplier (IPM), which is an assessment of each NEO’s individual contribution to the success of the organization.
| 1 | Source: Bloomberg |
| 2 | This item is a non-GAAP measure. See “Performance and Non-GAAP Measures” on page 70. |
| Manulife Financial Corporation Proxy Circular | 31 |
Table of Contents
Medium-Term and Long-Term Incentive Plan Payouts
Our medium-term incentive plan is comprised of Restricted Share Units and Performance Share Units. Our long-term incentive plan is comprised of Stock Options. The Restricted Share Units and Performance Share Units cliff vest within three years from the award date. The Performance Share Units that vested in 2013 paid out based on the Company’s performance against three key measures over the 2011-2013 vesting period: net income, return on equity and MCCSR ratio. Stock options vest ratably over four years and have a ten year term.
The Restricted Share Units that vested in 2013 paid out at 117% of the award date value due to the appreciation in Manulife’s stock price over the vesting period, illustrating the alignment with shareholder value. Our Performance Share Units that vested in 2013, however, paid out at 95% of the award date value because the Company’s financial performance was below expectations in 2011 and 2012. Please see page 42 for further details on the 2013 PSU payouts.
Pay for Performance and Shareholder Alignment
Manulife annually reviews its executive compensation program to ensure that it is competitive, drives the right behaviors, aligns executive interests with those of shareholders and that incentive awards are appropriate in light of the Company’s results.
To illustrate the effectiveness of our executive compensation program and alignment with our pay for performance philosophy, we have compared Manulife’s Total Shareholder Return performance and CEO cumulative “Take Home Pay” (as a percentage of target total direct compensation) against our Compensation Peer Group. Over the four-year period from 2009 to 2012, Mr. Guloien’s Take Home Pay has been 53% of his target compensation, reflecting lower shareholder return against the peer group median of 133% of target compensation. The regression line below highlights this link between pay and performance relative to Manulife’s peers. CEOs of companies above the line have realized more compensation for a given level of return while CEOs of companies below the line have realized less compensation for that level of return.
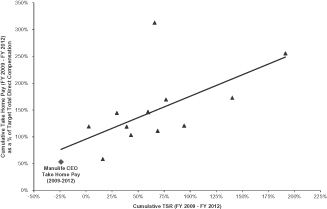
Key Executive Compensation Changes for 2014
In 2013, we spent considerable time listening to our shareholders. In response to the feedback received, we made changes to our 2014 executive compensation program. The following changes are in alignment with our evolving strategy and results, and our goal of ensuring continued alignment of our program with shareholders’ interests:
| • | Amended the entitlement under the CEO’s change in control agreement from three times base salary and bonus to two times base salary and bonus in consideration of market practice and feedback received; |
| • | Redistributed the CEO’s target total direct compensation mix by reducing the proportion of annual incentive and increasing the proportion of medium and long-term incentives to put greater emphasis on the longer-term success of Manulife; |
| • | Added Relative TSR as a new performance condition to our PSUs. We believe including Relative TSR as a measure will result in executive payouts that better reflect the market’s view of our achievements and further align executive pay with shareholder objectives. We continue to believe return on equity, net income and MCCSR ratio are key indicators of multi-year performance; |
| • | Introduced a simplified balanced scorecard for the 2014 Annual Incentive Plan with an increased weighting on profitability measures to ensure our program aligns with business strategy; and |
| • | Terminated the stock option plan applicable to non-employee Directors. |
These changes are further described in the “Executive Compensation Program” section on page 35 and the section titled “Director Compensation – Stock Options” on page 21.
| Manulife Financial Corporation Proxy Circular | 32 |
Table of Contents
Table of Contents:
• Compensation Discussion and Analysis | Page 33 | |||
Ø Compensation Program Objectives, Philosophy and Principles | Page 33 | |||
Ø Executive Compensation Program | Page 35 | |||
Ø 2013 Performance and Incentive Plan Results | Page 39 | |||
Ø Named Executive Officers’ Compensation | Page 42 | |||
Ø Compensation Governance | Page 50 | |||
Ø Compensation Decision Process | Page 51 | |||
Ø Managing Risk Associated with Compensation | Page 53 | |||
• Summary Compensation Table | Page 55 | |||
• Outstanding Share-Based Awards and Option-Based Awards | Page 56 | |||
• Incentive Plan Awards – Value Vested or Earned During the Year | Page 57 | |||
• Performance Graph | Page 57 | |||
• Additional Disclosure | Page 58 | |||
• Pension Plans | Page 62 | |||
• Termination and Change In Control Benefits | Page 67 | |||
• Securities Authorized for Issuance Under Equity Compensation Plans | Page 69 | |||
• Directors’ and Executive Officers’ Indebtedness | Page 70 |
The Compensation Discussion and Analysis describes Manulife’s executive compensation objectives, philosophy and principles. It also describes the 2013 compensation program and discusses the outcomes it produced with supporting details, including highlights of the Company’s performance in 2013. The Total Compensation paid to the Named Executive Officers (“NEOs”) (Messrs. Guloien, Roder, Thomson, Rooney and Bisnaire) for 2013 is set out in the Summary Compensation Table on page 55.
Compensation Program Objectives
The objective of Manulife’s compensation program is to contribute to the Company’s long-term sustainable growth by retaining talented executives and staff, and rewarding superior performance in executing the business strategy for the long-term benefit of shareholders.
Compensation Philosophy – Pay for Performance
Manulife’s compensation philosophy is “pay for performance”. Compensation is tied to the achievement of the Company’s short-term, medium-term and long-term goals. In practice, this has meant that when the Company’s performance is strong, incentive compensation has paid out above target and when the Company’s performance is not strong, incentives were significantly reduced, in some cases to zero.
| Manulife Financial Corporation Proxy Circular | 33 |
Table of Contents
Compensation Principles
Compensation decisions at Manulife are guided by five core principles. Examples of each principle are provided below and further described throughout the “Compensation Discussion and Analysis” section.
Compensation is aligned
The Company’s executive compensation program is designed to tie executive compensation to the achievement of key metrics and objectives. The Annual Incentive Plan uses a balanced scorecard that places a balanced emphasis on financial goals, operating targets and successful execution of strategic initiatives. Rewards under the Annual Incentive Plan are based on a combination of Company, division and/or business unit and individual performance objectives. Performance share units vest based on achievement against defined performance measures. For further information, please see the “Executive Compensation Program” section on page 35. | Compensation is aligned with
Manulife’s executive compensation program is aligned with the Company’s risk management objectives and discourages inappropriate risk taking. Manulife has established a Compensation Risk Framework to provide a structure for the review of risk associated with the compensation program and the design features that mitigate these risks. Within the framework, risk is identified under Business Risk, Talent Risk, Performance Risk and Compliance & Ethical Risk against which the compensation program is assessed annually. This Compensation Risk Framework is further described under “Managing Risk Associated with Compensation” on page 53. Incentive compensation for executives with divisional control function responsibility is independent of the businesses that they supervise.
| |||||
Compensation is aligned with
Manulife’s executive compensation program is designed to incent executives to take a long-term view to increasing shareholder value. Senior executives have a substantial proportion of their compensation delivered in medium and long-term incentives that are directly impacted by share price. Please see the “Compensation Mix” described on page 39. Senior executives are also required to maintain a minimum level of share ownership to ensure alignment with shareholder return. Manulife has a number of policies, including a Clawback Policy, in place to discourage executives from making decisions which could have a negative impact on long-term shareholder value.
| Compensation and performance are
Manulife’s executive compensation program is regularly benchmarked against peer companies to ensure our ability to attract and retain talented executives and staff. The Management Resources and Compensation Committee annually reviews and approves the group of peer companies to be used as a comparator for senior executive compensation. The criteria used in selecting peer companies in 2013 included market capitalization and assets, competitor for talent, similar lines of business and international footprint. Please see page 52 for further information on the peer group. | |||||
Compensation is aligned with good governance practices
Manulife continually monitors the business environment to stay at the forefront of good governance practices. The Company’s executive compensation program is aligned with the Financial Stability Board (“FSB”) Principles and is generally consistent with the Canadian Coalition of Good Governance’s Executive Compensation Principles and Proxy Circular Disclosure Best Practices. The Company’s Internal Audit department conducts an annual independent review of the executive compensation program which, in 2013, confirmed alignment with the FSB Principles. Please see page 50 for further information on Manulife’s compensation governance practices. | ||||||
| Manulife Financial Corporation Proxy Circular | 34 |
Table of Contents
Manulife’s executive compensation program has five key components as outlined below. The program governs compensation for all executives globally, including the CEO and the other NEOs. For details on the specific compensation arrangements of our NEOs, please see page 42.
| Base Salary | Short-Term Incentive | Medium-Term and Long- Term Incentives | Pension and Benefits | Perquisites | ||||
| Provides a stable compensation base over the course of the year for competency and proficiency in the role | Provides incentive based on company and individual achievement over a single year period | Provides incentive based on company and individual achievement over a multi- year period | Assists employees in providing for their health and retirement planning | Provides additional benefits to employees consistent with competitive local market practice |
Base Salary
Base salary compensates executives for competency and proficiency in performing job responsibilities. It recognizes promotions and career progression and provides a stable compensation base over the course of the year. Base salaries and salary ranges are benchmarked at least annually externally against comparable roles in peer companies and internally against the performance, qualifications and experience of other executives. Manulife’s philosophy is to target the median of the competitive market.
Short-Term Incentive (Annual Incentive Plan)
The short-term incentive is intended to reward officers for the Company’s achievement of business results against pre-established financial, operating and strategic objectives as well as individual performance over a calendar year. The Annual Incentive Plan (“AIP”) encourages senior staff to optimize overall division and Company performance while creating a focus for near-term organizational priorities that will result in sustainable performance over time. Under the AIP, awards are paid in cash in February following the performance year and calculated based on the formula set out below.
| Base Salary | X | AIP Target
(Percentage of Base Salary) | X | Company Performance Score (Balanced Scorecard) | X | Individual Performance Multiplier | = | Annual Incentive Award | ||||||||||
| Varies by individual qualifications, experience and performance | Targets are determined individually based on competitive market data and the executive’s level. | • 34% Financial Goals • 33% Operating Targets • 33% Strategic Initiatives
Range = 0 - 200% | Varies by individual and is measured against personal objectives set for the year taking into consideration business results and how they were achieved
Range = 0 - 200% | Payout ranges from zero to a maximum of 2.5x target for senior executives and 1.75x target for the CEO |
2013 Annual Incentive Plan Balanced Scorecard
The Company’s performance is measured against a balanced scorecard comprised of financial goals, operating targets and strategic initiatives as follows:
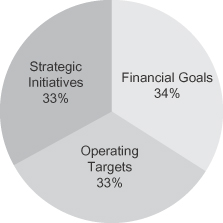 | Financial Goals | Based on Company net income excluding the direct impact of equity markets and interest rates, adjusted up or down for items clearly outside of management’s control and actions taken with negative impact on earnings but in the long-term interests of shareholders. | ||
| Operating Targets | Based on new business measures (such as sales, new business embedded value and risk), customer retention, expense management and investment performance targets, set annually for each business unit or division. For NEOs, the score for this component is based on the weighted average scores for the divisions. | |||
| Strategic Initiatives | Set annually at Company, division or business unit level to align with the Company’s strategic objectives. For NEOs, the strategic initiatives continue to build on three components: Building for the Future (Growth), Managing Risk and Capital, and increasing efficiency and effectiveness. | |||
Company performance metrics and goals have been stress-tested to ensure potential payouts continue to be aligned with business performance. The Board has the discretion to adjust the Company performance score up or down for significant events outside management’s control which would otherwise produce compensation results that are unreasonable, unrepresentative or otherwise inappropriate.
| Manulife Financial Corporation Proxy Circular | 35 |
Table of Contents
Company Performance Score Cap for Senior Executives
Under the 2013 AIP design, the Company performance score for senior executives would have been capped if the net income attributed to shareholders was below target in order to more closely align the compensation of senior executives to shareholder experience. If net income attributed to shareholders had been between the threshold of $500 million and the target of $2.42 billion, the Company performance score would have been capped between 50% and 100% for SEVPs and the CEO. The Company performance score would have been capped at 50% if net income attributed to shareholders was $500 million or less.
Individual Performance Multiplier
Individual performance is assessed against goals focused on major initiatives for the year and an individual’s contribution to the Company. Performance results can be overridden for compliance breaches, breach of authority levels, ethics and gross negligence and can be adjusted for doing the right thing in the interests of the Company and our shareholders. Individual Performance Multipliers can range from 0% to 200%.
NEW ð | New 2014 Company Performance Scorecard |
For 2014, the Management Resources and Compensation Committee approved a new Company performance scorecard for senior executives that is based on performance measures in the following categories: (i) Financial Success; (ii) Building for the Future; and (iii) Other Quantitative Measures of Success. The new scorecard is designed to:
| • | Address feedback received from our shareholders to simplify the AIP |
| • | Align with our Strategic Plan |
| • | Provide clear focus on the key measures that will drive continued successful performance of the business |
| • | Increase the proportion of quantitative measures |
| • | Utilize measures which are readily understood by shareholders and reported externally |
| • | Reflect a top-down approach to goal setting at the Company level, whereas in previous years the goals were set at the business unit level and were combined to establish a composite score for senior executives. |
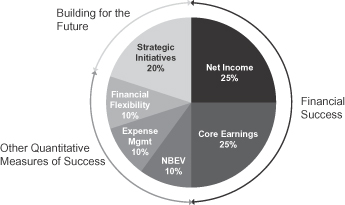
The table below discusses the rationale for the inclusion of each performance measure in the new 2014 Company performance scorecard. By maintaining a balanced scorecard approach (rather than a single measure), the new scorecard continues to provide motivation to deliver current business results, via the Financial Success and Other Quantitative Measures of Success categories, while simultaneously positioning the Company for future success via the Building for the Future category.
| Performance Measure | Rationale | 2014 Weighting | ||
Financial Success: | The use of profit measures is most common for executive annual incentive plans and the significant weighting of profitability metrics is aligned with market practice. | |||
Net Income | Net income aligns our compensation with the experience of shareholders. | 25% | ||
Core Earnings | We believe core earnings (a non-GAAP financial measure introduced by the Company in 2012) better reflects our underlying earnings capacity. | 25% | ||
| Other Quantitative Measures of Success: | Other Quantitative Measures of Success include key non-profitability measures that will drive continued successful performance of the business. | |||
Sales - New Business | New Business Embedded Value is a measure of profitable sales and is a critical measure of our top-line performance. | 10% | ||
Expense Management | The expense management target in 2014 will focus on Efficiency & Effectiveness, the major initiative introduced in 2012 to build meaningful competitive advantage by leveraging our global scale, our global capabilities and our local market focus to achieve operational excellence. | 10% | ||
Financial Flexibility | This component of the scorecard includes measures related to effective capital deployment that would enable the Company to reduce leverage, pay dividends, make acquisitions and sustain strong capital ratios. | 10% | ||
Building for the Future: Strategic Initiatives | Strategic Initiatives are based on enterprise priorities that will drive growth with a balanced approach to risk. | 20% | ||
| Manulife Financial Corporation Proxy Circular | 36 |
Table of Contents
By including a larger weighting (50%) on our key profit measures, core earnings and net income, the Management Resources and Compensation Committee has concluded that the AIP will be more closely aligned with shareholder interests. Consequently, the AIP will be further simplified by eliminating the Company Performance Score Cap for senior executives in 2014.
Medium-Term (RSUs and PSUs) and Long-Term (Stock Options) Incentives
Medium-term and long-term incentives together are intended to drive consistent achievement and provide multi-year ties between executive compensation and Company performance. Medium-term and long-term incentives also strengthen retention and reinforce alignment with shareholder value, especially for senior executives. Restricted Share Units (“RSUs”), Performance Share Units (“PSUs”) and stock options are granted annually to executives based on level, individual performance, potential and market competitiveness. As medium-term and long-term incentives comprise the majority of a senior executive’s total compensation, target award levels are benchmarked annually to ensure competitiveness with the external market. No consideration is given to the outstanding value of an individual’s RSUs, PSUs or stock options in determining the number to be granted in any given year.
Medium-Term Incentives
| • | RSUs are phantom-shares that fluctuate in value with the Common Share price. |
| ¡ | RSUs vest within three years and pay out at the end of the award term based on the Common Share price. RSUs are time-vested and serve as both an incentive and retention tool. |
| • | PSUs are similar to RSUs, but their value depends on both the Common Share price and the achievement of specific performance conditions approved by the Board of Directors. |
| ¡ | PSUs vest within three years and pay out at the end of the award term. The minimum performance factor is zero and the maximum performance factor is 150%. In addition, the Board has the discretion to adjust PSU payouts up or down depending on the Company’s progress towards achieving its risk reduction targets. PSUs are designed to focus executives on key measures of business success: net income, return on equity and minimum continuing capital and surplus requirements. |
2013 PSU Design
The PSUs granted in 2013 are subject to three internal performance conditions measured over three distinct performance periods to reduce the impact of a single year’s performance on the overall results. Performance targets are established consistent with the Company’s strategic plan and achieving management’s core earnings objective of $4 billion in 2016 (see “Caution regarding forward-looking statements” contained in the Company’s 2013 Annual Report). In 2013, we increased the weighting on the net income and return on equity performance conditions to place additional emphasis on consistent achievement of our earnings objectives. Conversely, the MCCSR ratio weighting was reduced because management had largely completed the major risk and capital actions required to stabilize our capital position.
| Manulife Financial Corporation Proxy Circular | 37 |
Table of Contents
The 2012 and 2013 PSUs are subject to the following performance conditions over the applicable performance period:
Performance Condition | Description | 2012 PSUs Weighting | 2013 PSUs | |||
| Net income attributed to shareholders | Net income attributed to shareholders is tied to Manulife’s Strategic Plan and therefore maintains clear alignment between senior management and shareholder interests. | 25% | 34% | |||
Return on equity | Return on equity represents the net income available to common shareholders as a percentage of the capital deployed to earn the income. Return on equity is a key performance metric not only of profitability, but also of how effectively the Company manages shareholders’ capital. | 25% | 33% | |||
MCCSR ratio | The MCCSR ratio is a regulatory ratio used by OSFI to evaluate the financial strength of an insurer and, in particular, its ability to meet its obligations to policyholders. Initiatives to increase the level of this ratio tend to have an offsetting impact on corresponding financial measures such as the return on equity. | 50% | 33% | |||
| NEW ð | New 2014 PSU Design |
For 2014, the Management Resources and Compensation Committee approved a change in the PSU performance conditions to more closely align PSU payouts with shareholder experience. In addition to the internal performance conditions used in 2013, the 2014 PSUs have a new external performance condition, Relative Total Shareholder Return (“Relative TSR”) set up as follows:
| Internal Performance Condition | Weight | Performance Score Range | X | External Performance Condition | Performance Score Range | |||||||||
Net income attributed to shareholders |
|
34 |
% |
0% to 150% |
|
Relative TSR |
|
80% to 120% | ||||||
Return on equity | 33 | % | 0% to 150% | |||||||||||
MCCSR ratio | 33 | % | 0% to 150% | |||||||||||
Cumulative TSR is measured over a single period from January 1, 2014 to September 30, 2016 and compared to the Performance Peer Group median TSR (see below). Cumulative TSR will be calculated using a 20-day average stock price at both the start and the end of the period. Net income, return on equity and MCCSR targets will be established consistent with the Company’s stated objective to achieve core earnings of $4 billion and core ROE of 13% in 2016 (see “Caution regarding forward-looking statements” contained in the Company’s 2013 Annual Report).
Performance Peer Group for the New 2014 PSU Design
Manulife’s TSR will be compared to the companies in the table below. The Performance Peer Group includes the seven global insurers of the twelve companies included in our Compensation Peer Group (see page 52) and six additional relevant global insurers. Although the additional companies meet most of the criteria used to establish our Compensation Peer Group (i.e., market cap, assets, competitor for talent and capital, lines of business and international footprint), they were excluded from the Compensation Peer Group due to limited availability of compensation data. While the Canadian banks are important competitors for capital and for Canadian talent, they are not true competitors for many of our business lines and may not have the same exposure to macro market influences. As such, they have not been included in the Performance Peer Group for PSUs. The TSRs for Manulife and its North American peers will be based on NYSE stock prices while the TSRs for peers outside North America will be based on the stock prices on their respective principal exchange, with no currency conversion applied.
| Performance Peer Group | ||
AFLAC
AIA Group Limited
Allianz SE
Ameriprise Financial
Assicurazioni Generali
Aviva plc
AXA SA |
MetLife
Principal Financial
Prudential Financial
Prudential plc
Sun Life Financial
Zurich Insurance | |
Long-Term Incentives
Stock options granted in 2013 have a maximum exercise period of 10 years and vest 25% per year over four years, serving as a retention tool. We believe stock options continue to provide appropriate motivation for our executives to deliver sustained performance and increase shareholder value, and enhance retention through time vesting requirements.
For additional details on our medium-term and long-term incentive plans, see “Additional Disclosure” on page 58.
| Manulife Financial Corporation Proxy Circular | 38 |
Table of Contents
Medium and Long-Term Incentive Mix
In 2013, similar to many of our peers, Manulife increased the proportion of PSUs in the compensation mix for its CEO, Senior Executive Vice Presidents and Executive Vice Presidents and decreased the proportion of stock options. The mix for 2014 remains unchanged from 2013 since we feel it is the appropriate balance of vehicles to drive performance, align executive interests with shareholders, provide for competitive pay opportunities, and enhance retention.
Medium and Long-Term Incentive Mix
| Executive Level | 2012 | 2013 / 2014 | ||||||||||
| RSUs | PSUs | Stock Options | RSUs | PSUs | Stock Options | |||||||
Chief Executive Officer/Senior Executive Vice President | 25% | 25% | 50% | 25% | 35% | 40% | ||||||
Executive Vice President | 25% | 25% | 50% | 35% | 35% | 30% | ||||||
Chief Risk Officer/Chief Actuary | 50% | 0% | 50% | 70% | 0% | 30% | ||||||
Pension and Benefits
The Company sponsors pension plans which assist employees in providing for their retirement. Plans vary by domicile and are administered in a manner consistent with the Company’s overall compensation philosophy. For additional details on our pension plans, see “Pension Plans” on page 62. Benefit plans reflect local market practice and include group life, disability, health and dental insurance programs. Plans vary by domicile based on cost and competitive benchmarking.
Perquisites
Perquisites vary by domicile and are intended to reflect local market practice. The Company does not provide tax gross-ups related to perquisites.
Target Compensation Mix
The compensation mix offered to executives varies by level such that:
| • | the amount of pay at risk and deferred compensation increases by level, reflecting the greater ability of senior executives to affect the Company’s results |
| • | higher level positions have more variability in compensation than lower level positions |
| • | higher level positions have greater emphasis on total Company results whereas further down in the organization, there is greater emphasis on divisional, business unit or functional goals, with some emphasis on global results to foster collaboration and a business owner mentality |
The proportion of executives’ Total Target Direct Compensation in 2013 that was at risk and/or tied to the Common Share price is illustrated below:
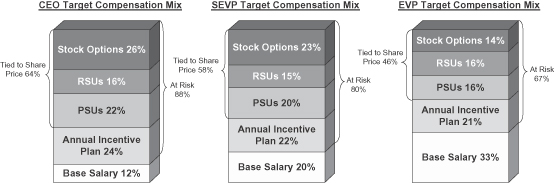
Incentive Plan Results
The following section describes the Company performance results for the short-term, medium-term and long-term performance-based incentive plan results for 2013.
2013 Annual Incentive Plan Results
The Company performance score is measured based on a balanced scorecard consisting of the Financial Goals, Operating Targets and Strategic Initiatives as described in the previous section. These objectives were developed at the beginning of 2013 by the CEO and Executive Committee and approved by the Management Resources and Compensation Committee and the Board. For 2013, the Board has applied discretion with a net negative impact on the Company Performance Score. This application of discretion is in accordance with the AIP design and ensures that the outcome of the AIP is in line with the Company’s compensation philosophy that incentive plans are intended to motivate and reward employees to make decisions and deliver results that are in the best interests of our shareholders. Discretion was applied both for items clearly outside of
| Manulife Financial Corporation Proxy Circular | 39 |
Table of Contents
management’s control and for actions taken that negatively impact earnings but are in the long-term best interests of shareholders. In 2013, application of discretion reduced the score of the Financial Goals component of the scorecard from 182% to 152%. The score for the Operating Targets and Strategic Initiatives components of the balanced scorecard were 113% and 122%, respectively, and are described in more detail in the table below.
Performance in 2013 was strong and resulted in a Company performance score of 129%, which applied to all Executive Committee members and Group Functions officers. As Manulife’s net income, excluding the gain from sale of Taiwan Life operations, of $2.78 billion exceeded plan, the Company Performance Score Cap for senior executives, discussed above, did not apply for 2013.
| 2013 Annual Incentive Plan Results | ||||||||||||||
| Performance Objective | Weighting | 2013 Achievements | ||||||||||||
Financial Goals • The financial goal is based on net income excluding the direct impact of equity markets and interest rates. The target was set equal to the annual business plan of $2.82 billion. |
34% | Overall performance against objectives: Above target (152%)
• Net income excluding the direct impact of equity markets and interest rates1, gain from sale of Taiwan Life operations and discretionary items was $3.26 billion. • The Board applied negative discretion that reduced the score from 182% to 152% for items over which management had little influence, including the positive impact of equity markets on a provision for variable annuity guarantees and changes in tax rates, offset by charges related to increasing the dynamic hedging program.
| ||||||||||||
| Threshold | Target | Maximum | Result | |||||||||||
| $500 million | $2.82 billion | $3.66 billion | $3.26 billion | |||||||||||
Operating Targets • The operating targets are quantitative measures set at the business unit and divisional level, based on each business unit/division’s priorities rather than at the Company level. • The quantitative measures include new business measures (such as sales, new business embedded value, and risk), customer retention, expense management, and investment performance. • This component is based on a weighted average of the business units and divisional scores and is composed of numerous measurements, each with various weights being applied. |
33% | Overall performance against objectives: Above target (113%)
• Achieved strong wealth sales1 of $49.7 billion for 2013, reflecting a 37 per cent increase over 2012. • Full year insurance sales of $2.8 billion declined by 13 per cent over 2012 driven by lower sales in Asia and normal variability in Canada Group Benefits. • Generated new business embedded value (“NBEV”)1,2 of $1.2 billion for 2013, reflecting a 16% increase over 2012. • Achieved 21st consecutive quarter of record funds under management1 of $599 billion as at December 31, 2013. • Expense levels were within plan. • General account asset performance continued to be a strength of the Company. • Manulife Asset Management had outstanding investment performance with all public asset classes outperforming their benchmarks on a 1, 3, and 5-year basis. | ||||||||||||
Strategic Initiatives • The Company’s strategic initiatives as outlined in the 2013 Annual Report are based on three key priorities: ¡ Building for the future ¡ Risk and Capital management ¡ Efficiency and Effectiveness |
33% | Overall performance against objectives: Above target (122%)
• In 2013 the Company made significant progress towards its strategic priorities: • Developing our Asian opportunity to the fullest; • Growing our wealth and asset management businesses in Asia, Canada, and the U.S.; • Continuing to build our balanced Canadian franchise; and • Continuing to grow higher return on equity (“ROE”), lower risk U.S. businesses.
The performance highlights for each of the Company’s operating divisions is provided below: • Asia Division continued to execute on its growth strategy by expanding agency and bank channel distribution capacity. Contracted agents were approximately 57,500 as at December 31, 2013, seven per cent more than at December 31, 2012, reflecting double digit growth in Hong Kong, the Philippines, Malaysia and Vietnam. During 2013, the division entered into an exclusive bancassurance relationship with Alliance Bank in Malaysia and completed the acquisition of MAAKL Mutual Bhd, greatly enhancing its business and presence in Malaysia and complementing its wealth management growth strategy. | ||||||||||||
| Manulife Financial Corporation Proxy Circular | 40 |
Table of Contents
Strategic Initiatives (cont’d) | • Canadian Division made strong progress across all of its diverse businesses in 2013. Record wealth management sales reflected strong momentum in Manulife Mutual Funds and Group Retirement Solutions. Group Benefits continued to lead the market in sales in 2013 according to the most recently published industry information. Manulife Bank responded to significant regulatory changes and ended the year with record net lending assets despite an overall slowdown in the residential mortgage market and an aggressive competitive environment. The division continued to drive its desired shift in product mix, reducing the proportion of sales with guaranteed features in insurance and variable annuities and launched its innovative RetirementPlus, the next step in the evolution of its variable annuity product portfolio. The division continued to expand its distribution reach through increased broker-dealer penetration, by adding new advisors and extending existing relationships, as well as through two strategic transactions in the mortgage creditor life insurance and travel insurance businesses. • In the US Division, robust sales in John Hancock Investments contributed to record funds under management in the Wealth Management business. John Hancock Investments had record sales for the full year and is well positioned for continued success. On the insurance front, the division continued to record strong sales of its repriced, lower risk insurance products and the integration of John Hancock Life and Long-Term Care businesses is largely completed. The integration will expand sales opportunities and drive operational efficiencies. • Investment Division continues to deliver strong investment results along with excellent credit experience. During 2013, the Company originated in excess of $1 billion in alternative long-duration assets, on a net basis, across various asset classes including real estate, infrastructure, private equities, and farmland. The acquisitions continue to be high quality, good relative value alternative long-duration assets which have enhanced the risk-adjusted returns and have diversified the portfolio. • Manulife Asset Management experienced significant growth in 2013 across its global franchise, with external assets under management increasing by 18 per cent to $243 billion. Several strategic additions to our portfolio management teams were made in the fourth quarter including the purchase of MAAKL Holdings Berhad in Malaysia. Outstanding investment performance continues to differentiate Manulife Asset Management; with all public asset classes outperforming their benchmarks on a 1, 3, and 5-year basis. Expansion of the third party private asset management business provides investors access to Manulife’s specialized private asset investment teams that until now have primarily served its general fund. • The Company closed 2013 with a strong Minimum Continuing Capital and Surplus Requirements (“MCCSR”) capital ratio for The Manufacturers Life Insurance Company (“MLI”) of 248 per cent, up 37 points over year end 2012. • The Company is on track with its company-wide Efficiency and Effectiveness initiative which is expected to deliver substantial efficiency gains by 2016.3 | |||||||||||||
| 1 | This item is a non-GAAP measure. See “Performance and Non-GAAP Measures” on page 70. |
| 2 | NBEV is the change in shareholders’ economic value as a result of sales in the reporting period. |
| 3 | See “Caution regarding forward-looking statements” contained in the Company’s 2013 Annual Report. |
2013 Medium-Term Incentive Plan Results
The PSUs and RSUs awarded to NEOs in 2011 vested and paid out during 2013 as outlined in the table below. As previously disclosed, the Board of Directors may adjust PSU payouts up or down depending on the Company’s progress towards achieving its risk reduction targets. In consideration of management’s achievement of its risk reduction targets well ahead of plan, the Board of Directors made the decision to make a positive adjustment to the performance factor applicable to payouts in 2013. In the view of the Board of Directors, the decision to hedge faster than planned was in the long term best interests of the Company, but resulted in incremental short-term costs which negatively impacted the performance results of these PSUs. The 8% adjustment reflects the direct financial impact of this decision on the PSU performance measures and was considered a fair recognition of management’s achievement.
| Vesting Date | Award | Performance Factor | Payout as a Percentage of Grant Value | |||||
December 15, 2013 | 2011 RSUs 2011 PSUs |
| n/a 81% |
| 117% 95% | |||
| Manulife Financial Corporation Proxy Circular | 41 |
Table of Contents
Calculation of the Performance Factor Applicable to PSUs vesting in 2013
The payout of these PSUs was below the award value, reflecting that the Company’s financial performance was below expectations in 2011 and 2012.
| Performance Period January 1, 2011 - September 30, 2013 | ||||||||||||||
Weight | Goals | Result | Performance Score | Weighted Performance Score | ||||||||||
| Threshold | Target | Maximum | ||||||||||||
| Net Income Attributed to Shareholders | 25% | $3.16 billion | $8.13 billion | $10.38 billion | $3.7 billion | 11% | 2.75% | |||||||
ROE | 25% | 4.2% | 10.8% | 13.8% | 5.4% | 19% | 4.75% | |||||||
| Average Quarterly MCCSR Score1 | 50% | 80% of target | See note (1) | 115% or 120% of target | 131% | 65.50% | ||||||||
| Unadjusted Performance Factor | 73% | |||||||||||||
| Adjustment for Direct Financial Impact of Decision to Hedge Faster | +8% | |||||||||||||
| Final Performance Factor | 81% | |||||||||||||
| 1 | The MCCSR Score represents the average of the quarterly MCCSR scores for the applicable performance period. The quarterly MCCSR scores are calculated by applying the MCCSR ratio achieved by Manufacturers Life against the internal capital target in place for the applicable quarterly reporting period. For 2011, the maximum was 120% of target. For 2012-2013, the maximum was 115% of target. |
2013 Long-Term Incentive Plan Results
All outstanding unexercised stock options granted in 2003 expired with zero value, illustrating the link between the Common Share price and compensation realized by our executive officers. In 2013, none of the NEOs exercised stock options.
2013 Medium-Term and Long-Term Incentive Plan Grants
The following table summarizes the number of units and dollar value granted in 2013 to all employees:
| Equity Award Type | 2013 Units/Options Awarded | 2013 Grant Date Value | Vesting | Term | ||||
RSUs/PSUs | 6,957,323 | $108.1 million | Cliff vest within 3 years of grant | 34 months | ||||
Stock Options | 4,334,620 | $14.1 million | 25% per year | 10 years |
The Management Resources and Compensation Committee considered the following factors when determining the compensation of the NEOs:
| • | Performance against the Company’s balanced scorecard objectives. |
| • | The Company’s overall performance relative to the performance of its peer group. |
| • | Market competitiveness of Total Target Direct Compensation relative to the peer group. |
| • | The executive’s achievement of annual objectives as agreed upon at the beginning of the year as outlined below. |
| • | Ability to retain talented executives and motivate them to deliver superior performance. |
The Management Resources and Compensation Committee reviews annually the compensation opportunity for each NEO to the Compensation Peer Group using the Target Total Direct Compensation (“TTDC”) values shown below (TTDC includes base salary, target AIP and grant date value of medium and long-term incentive awards). The Management Resources and Compensation Committee also reviews a longer term pay for performance analysis prepared by management and reviewed by Hugessen Consulting to ensure the compensation received and realized by the senior executives is aligned with Manulife’s performance over the corresponding compensation period and is appropriate relative to its peer group. The Management Resources and Compensation Committee exercises independent judgment in assessing the CEO’s performance and applies stress testing of incentive plan designs to demonstrate pay for performance and alignment with shareholder interests. The compensation awarded to each of the NEOs is set out below1.
Donald Guloien, President and CEO
Under Mr. Guloien’s leadership, and as a result of the strategic changes made over the last several years, Manulife delivered very strong financial performance in 2013. In addition to delivering strong operating results, tangible progress was made toward achieving the long-term objectives of the Company. Mr. Guloien’s efforts over the past three years to strengthen our capital position, reduce risk, and reposition our product emphasis have positioned the Company well for future success.
| 1 | Exchange rate methodology is set out in the exchange rates to the Summary Compensation Table on page 55. |
| Manulife Financial Corporation Proxy Circular | 42 |
Table of Contents
The table below outlines Mr. Guloien’s specific key individual objectives and results for 2013:
| Key Objectives | Results | |
Deliver on Financial Results | In 2013, Manulife met or exceeded its goals for net income, core earnings, Earnings excluding the direct impact of equity markets and interest rates, ROE, MCCSR, Expenses and Leverage.
Insurance sales were slightly below plan, however the profitability of those sales increased substantially. Wealth sales were far in excess of plan. | |
Execute Strategic Plan | The management team executed well against the Board approved Strategic Plan with respect to the growth of the wealth and asset management businesses.
In 2013, the Company executed a number of smaller, but highly strategic deals including an exclusive bancassurance agreement with Alliance Bank in Malaysia, and the acquisitions of Symetra; RBC’s travel insurance business in Canada; and MAAKL, the Malaysian asset management business. | |
Capital and Risk Management | In 2013, Manulife exceeded its MCCSR target while also maintaining adequate capital for growth and contingency planning.
The Company continued to improve the effectiveness of its Risk Management practices throughout the world and continued to implement new means of reducing exposure to equity market and interest rate volatility. In 2013, management took important steps to more closely define the Company’s overall risk appetite and executed the Company’s strategy and business plans within those risk limits and consistent with the risk appetite philosophy. | |
Efficiency & Effectiveness | The efficiency and effectiveness initiative produced over $200 million of pre-tax annualized run-rate savings for 2013. |
Target Total Direct Compensation
The Board reviewed Mr. Guloien’s compensation and considered his strong performance since becoming CEO in 2009 and his performance in 2013 against the specific objectives described above. In reviewing Mr. Guloien’s 2013 and 2014 TTDC, the Board considered the Company’s size and scope relative to the peer group as well as Mr. Guloien’s performance and potential for future contributions to creating long-term value for shareholders.
In 2013, Mr. Guloien received a base salary increase of US$100,000, effective March 1, 2013. His AIP target of 200% of salary and his equity target of 550% of salary remained unchanged. This moved the CEO’s compensation close to, but still slightly below the median of Manulife’s peer group.
In 2014, the Board and Mr. Guloien agreed to an amended employment agreement. Beginning in 2014, the Board has redistributed Mr. Guloien’s TTDC by reducing the weight of annual incentive and increasing the weight of equity incentive to emphasize alignment between pay and the longer-term success of Manulife. As a result, Mr. Guloien’s AIP target has been reduced from 200% to 150% of salary, his medium and long-term incentive target has been increased from 550% to 600% of salary, and his employment agreement was amended such that upon termination of employment for any reason other than cause, one half of the PSUs granted within one year prior to his termination or retirement will not be forfeited and will continue to vest with payment being made on the scheduled payout date, subject to the PSU performance conditions. This additional emphasis on medium and long-term incentives reflects his ability to impact business results and position the Company for future success. Mr. Guloien has also agreed to reduce his entitlement under his change in control agreement from 3 to 2 times annual salary and average annual incentives awarded in the prior 3 years.
The Board approved a salary increase of US$125,000 for Mr. Guloien effective March 1, 2014. This increase was the third tranche of a 3-year plan to bring the CEO’s target compensation to the median of our compensation peer group. The Board also awarded Mr. Guloien medium and long-term incentives in the amount of US$7,950,000 in February 2014, or 600% of salary.
The following table summarizes the compensation decisions taken by the Board for Mr. Guloien in 2013 and 2014.
| Target Total Direct Compensation | ||||||||||||
| 2012 (USD) | 2013 (USD) | 2014 (USD) | ||||||||||
Base Salary (March 1) | $ | 1,100,000 | $ | 1,200,000 | $ | 1,325,000 | ||||||
AIP Target1,2 | $ | 2,200,000 | $ | 2,400,000 | $ | 1,987,500 | ||||||
PSUs Awarded3,4 | $ | 1,512,500 | $ | 2,310,000 | $ | 2,782,500 | ||||||
RSUs Awarded3,4 | $ | 1,512,500 | $ | 1,650,000 | $ | 1,987,500 | ||||||
Stock Options Awarded3,4 | $ | 3,025,000 | $ | 2,640,000 | $ | 3,180,000 | ||||||
Target Total Direct Compensation | $ | 9,350,000 | $ | 10,200,000 | $ | 11,262,500 | ||||||
| 1 | For 2012 and 2013, Annual Incentive Plan payout could range from 0% to 350% of salary, reflective of business and personal performance. |
| 2 | For 2014, Annual Incentive Plan payout can range from 0% to 300% of salary, reflective of business and personal performance. |
| 3 | The CEO’s target equity award (PSUs, RSUs and Stock Options) was 550% of salary in 2012 and 2013, with a maximum grant of 650% of salary. |
| 4 | The CEO’s target equity award (PSUs, RSUs and Stock Options) is 600% of salary in 2014, with a maximum grant of 700% of salary. |
| Manulife Financial Corporation Proxy Circular | 43 |
Table of Contents
2013 Annual Incentive Plan Payout
In determining Mr. Guloien’s annual incentive for 2013, the Board assessed his performance against the specific objectives described above and the Company Performance Score, as described on page 40. Mr. Guloien received an annual incentive of US$3,870,000 (Cdn$4,249,647) based on the following:
| Base Salary | X | AIP Target
(Percentage of Base Salary) | X | Company Performance Score (Balanced Scorecard) | X | Individual Performance Multiplier | = | Annual Incentive | ||||||||
| US$1,200,000 | 200% | 129% | 125% | US$3,870,000 |
Steve Roder, Senior Executive Vice President and Chief Financial Officer
Mr. Roder is responsible for managing the financial affairs of the Company including Finance, Accounting, Capital, Valuation, Treasury, Controllers, Taxation, Investor Relations, Reinsurance and Financial Regulation. Mr. Roder is a driver of change in our organization and is one of the executives responsible for promoting the Efficiency & Effectiveness initiative. He is driving transformation of the finance function, including process re-engineering, streamlining financial information and improving expense management. He has significantly enhanced our investor relations activities, including broadening our shareholder base, and has played a prominent role in our lobbying efforts for high quality accounting standards. He has played a key role on various corporate development activities and has continued to use his deep knowledge of Asia and extensive network for the benefit of the Company. Mr. Roder is a member of the Company’s Executive Committee and Management Committee.
The table below outlines Mr. Roder’s specific key individual objectives and results for 2013:
Key Objectives | Results | |
| Oversee finance transformation program and execution of projects against agreed plans | Overall finance transformation project continues to be on track to deliver significant savings and improvements.
Majority of projects are in the execution stage with detailed plans in place.
Projects have started producing meaningful improvements in efficiency and effectiveness. | |
| Implement Organizational Design within finance to improve role clarity, speed and effectiveness of decision making and expense efficiency | Organizational Design project completed and expense goals achieved.
Speed and effectiveness of decision-making significantly enhanced and collaboration improved. | |
| Engage actively in the M&A process and corporate development activities, including nurturing his significant existing network for the benefit of the Company | Very active in the M&A process as a key contributor in the deal review process.
Has successfully maintained a significant network, in particular in Asia, for the benefit of the Company.
Successfully recruited several executives through his personal network. | |
| Lead investor relations activity, including expanding shareholder base and enhancing quarterly earnings release process | International shareholder base expanded more broadly in 2013.
Significantly enhanced investor relations activity on a global scale.
Simplified and streamlined quarterly earnings release process. | |
| Drive the management of accounting standards outcomes in a direction of maintaining good prudential regulation while maintaining shareholder value | Prominent as international conference speaker and as contributor to media debate on accounting standards and regulatory activity.
Lead engagement with other key stakeholders in Canada. |
Target Total Direct Compensation
In 2013, Mr. Roder did not receive a base salary increase. His AIP target of 125% of salary remained unchanged and he was awarded medium and long-term incentives in the amount of US$2,500,000. Mr. Roder’s 2013 TTDC package considered his performance, as well as the TTDC of his counterparts within Manulife’s peer group.
For 2014, the Board reviewed Mr. Roder’s compensation and approved a salary increase of US$20,000 effective March 1, 2014 and awarded him medium and long-term incentives in the amount of US$2,700,000 in February 2014. In reviewing Mr. Roder’s 2014 TTDC, the Board considered the Company’s size and scope relative to the peer group as well as Mr. Roder’s achievements in 2013, his strong leadership and his potential to contribute to the future success of the Company.
| Manulife Financial Corporation Proxy Circular | 44 |
Table of Contents
The following table summarizes the compensation decisions taken by the Board for Mr. Roder, on the recommendation of the CEO and the Management Resources and Compensation Committee, in 2013 and 2014.
| Target Total Direct Compensation | ||||||||||||
| 2012 (USD) | 2013 (USD) | 2014 (USD) | ||||||||||
Base Salary (March 1) | $ | 700,000 | $ | 700,000 | $ | 720,000 | ||||||
AIP Target1 | $ | 875,000 | $ | 875,000 | $ | 900,000 | ||||||
PSUs Awarded | - | $ | 875,000 | $ | 945,000 | |||||||
RSUs Awarded | $ | 730,000 | $ | 625,000 | $ | 675,000 | ||||||
Stock Options Awarded | $ | 730,000 | $ | 1,000,000 | $ | 1,080,000 | ||||||
Target Total Direct Compensation | n/a | 2 | $ | 4,075,000 | $ | 4,320,000 | ||||||
| 1 | Annual Incentive Plan payout can range from 0% to 250% of target, reflective of business and personal performance. |
| 2 | Mr. Roder commenced employment as SEVP and CFO on June 1, 2012. |
2013 Annual Incentive Plan Payout
In determining Mr. Roder’s annual incentive for 2013, the Board assessed his performance against the specific objectives described above and the Company Performance Score, as described on page 40. Mr. Roder received an annual incentive of US$1,580,250 (Cdn$1,735,273) based on the following:
| Base Salary | X | AIP Target
(Percentage of Base Salary) | X | Company Performance Score (Balanced Scorecard) | X | Individual Performance Multiplier | = | Annual Incentive | ||||||||
| US$700,000 | 125% | 129% | 140% | US$1,580,250 |
Warren Thomson, Senior Executive Vice President and Chief Investment Officer
Mr. Thomson is responsible for managing the global investment operations which include the General Fund and Manulife Asset Management, the Company’s global asset management business. Mr. Thomson is a member of the Company’s Executive Committee and Management Committee.
Under Mr. Thomson’s leadership, the Investment Division delivered strong performance for the Cdn$233 billion of General Fund assets as at December 31, 2013. This performance was evidenced by the Company’s excellent credit experience, and continuing prudent investment activities related to fixed income and alternative long-duration assets. In addition, equity and interest rate earnings sensitivities were managed within risk appetite limits throughout 2013. Strong investment performance was also delivered in 2013 by Manulife Asset Management with recognition evidenced by fund ratings and industry awards, as well as strong global retail sales. Manulife Asset Management ended 2013 with Cdn$243 billion in assets under management for external clients, representing growth of 18% over prior year.
The table below outlines Mr. Thomson’s specific key individual objectives and results for 2013:
| Key Objectives | Results | |
Deliver on strategic objectives | Introduced a new unit, Manulife Asset Management Private Markets, to bring together specialized private market teams managing funds for third party investors and provide access to other specialized teams that historically have primarily served the General Fund.
Originated in excess of Cdn$1.5 billion of alternative long-duration assets, further diversifying our portfolio and enhancing risk-adjusted returns. | |
Deliver on the 2013 financial plan | Exceeded plan with full year 2013 investment-related experience of Cdn$906 million; Cdn$200 million was included in core earnings.
Investment-related experience primarily was driven by fixed income and alternative long-duration asset investing, and strong credit experience. | |
Risk Management | Equity and interest rate sensitivities were managed within risk appetite limits on both a gross and net basis throughout 2013.
Continued to enhance the effectiveness of our hedging program and added options to reduce our re-balancing risk and currency futures to manage our currency exposure. | |
Leadership and Talent Development | Provided opportunities to high potential leaders in order to head up key functions and provide succession opportunities, demonstrating our commitment to growing talent across divisions, business units and geographies.
Recruited capabilities into Manulife Asset Management in key areas of focus.
Prioritized robust development planning and coaching for high potential talent. |
| Manulife Financial Corporation Proxy Circular | 45 |
Table of Contents
Target Total Direct Compensation
In 2013, Mr. Thomson received a base salary increase of US$20,000. His AIP target of 150% of salary remained unchanged and he was awarded medium and long-term incentives in the amount of US$2,200,000. Mr. Thomson’s 2013 TTDC package considered his performance, as well as the TTDC of his counterparts within Manulife’s peer group.
In 2014, the Board reviewed Mr. Thomson’s compensation and approved a salary increase of US$30,000 effective March 1, 2014 and awarded him medium and long-term incentives in the amount of US$2,200,000 in February 2014. In reviewing Mr. Thomson’s 2014 TTDC, the Board considered the Company’s size and scope relative to the peer group as well as Mr. Thomson’s achievements in 2013, his strong leadership and his potential to contribute to the future success of the Company.
The following table summarizes the compensation decisions taken by the Board for Mr. Thomson, on the recommendation of the CEO and the Management Resources and Compensation Committee, in 2013 and 2014.
| Target Total Direct Compensation | ||||||||||||
| 2012 (USD) | 2013 (USD) | 2014 (USD) | ||||||||||
Base Salary (March 1) | $ | 650,000 | $ | 670,000 | $ | 700,000 | ||||||
AIP Target1 | $ | 975,000 | $ | 1,005,000 | $ | 1,050,000 | ||||||
PSUs Awarded | $ | 550,000 | $ | 770,000 | $ | 770,000 | ||||||
RSUs Awarded | $ | 550,000 | $ | 550,000 | $ | 550,000 | ||||||
Stock Options Awarded | $ | 1,100,000 | $ | 880,000 | $ | 880,000 | ||||||
Target Total Direct Compensation | $ | 3,825,000 | $ | 3,875,000 | $ | 3,950,000 | ||||||
| 1 | Annual Incentive Plan payout can range from 0% to 250% of target, reflective of business and personal performance. |
2013 Annual Incentive Plan Payout
In determining Mr. Thomson’s annual incentive for 2013, the Board assessed his performance against the specific objectives described above and the Company Performance Score, as described on page 40. Mr. Thomson received an annual incentive of US$1,815,030 (Cdn$1,993,084) based on the following:
| Base Salary | X | AIP Target
(Percentage of Base Salary) | X | Company Performance Score (Balanced Scorecard) | X | Individual Performance Multiplier | = | Annual Incentive | ||||||||
| US$670,000 | 150% | 129% | 140% | US$1,815,030 |
Paul Rooney, Senior Executive Vice President and Chief Operating Officer
Mr. Rooney is responsible for overseeing areas critical to the Company’s global operations, including Corporate Strategy, Corporate Development, Capital Solutions, Human Resources, Branding & Communications, Information Services, Procurement and Global Resourcing. Mr. Rooney is also charged with leading the multi-year enterprise-wide Efficiency & Effectiveness initiative with the goal of improving the efficiency and effectiveness of the Company’s operations. Mr. Rooney is a member of the Company’s Executive Committee and Management Committee.
In this newly created COO role, Mr. Rooney drove significant change throughout the organization, focusing on Organizational Design, the Efficiency & Effectiveness initiative and transforming the Company to a new functional operating model by driving increased collaboration and a global mindset across the organization.
The Company delivered strong results on its Efficiency & Effectiveness initiative, exceeding the 2013 savings targets and instituting a disciplined approach for driving ongoing efficiencies in 2014 and beyond. A large part of the effort in 2013 was focused on Organizational Design where Manulife successfully increased its managerial spans of control, flattened the organization and significantly reduced managerial costs. On the Corporate Development front, the Company closed an asset management acquisition in Malaysia, completed a broker dealer acquisition in the U.S. and a travel insurance acquisition in Canada, and divested its Taiwan insurance business.
| Manulife Financial Corporation Proxy Circular | 46 |
Table of Contents
The table below outlines Mr. Rooney’s specific key individual objectives and results for 2013:
| Key Objectives | Results | |
| Lead the global Organizational Design and Efficiency & Effectiveness Initiative delivering on planned targets | Developed a disciplined process for driving Efficiency & Effectiveness initiatives across all divisions and functions of the company exceeding the objectives established for 2013.
Completed the company wide Organizational Design initiative achieving delayering objectives, savings targets and increased management spans of control.
Design and delivery of a global change management framework and training to enable the company wide Organizational Design initiative and Efficiency & Effectiveness projects.
Established a global Project Management Centre of Expertise to improve project delivery and change management for all businesses. | |
| Improve the company wide strategic planning process | Delivered a more comprehensive process integrating Strategy, Finance, Capital and Risk plans. | |
| Drive a disciplined approach to mergers, acquisition and divestitures aligned with our strategic priorities | Closed 3 acquisitions in 2013 and completed the sale of our Taiwan insurance business.
Maintained our disciplined approach to acquisitions by avoiding several opportunities where the deal economics were not satisfactory. | |
| Establish global strategic procurement function and global resourcing centre of expertise to support business strategy | Developed a strategic procurement function focused on driving global efficiencies in contracting, sourcing and category management.
Established a Global Resourcing Centre of Expertise to drive the development and use of our captive offshore facilities to world class levels. Alternate site in Cebu, Philippines to open in 2014. | |
| Enhance global services infrastructure capabilities and business application platforms to enable growth strategies | Successful data centre transitions in the U.S., Canada and Asia.
Introduced global employee collaboration tools to improve effectiveness and allow for increased work force mobility.
Launched shared application service centres to support the use of strategic business application platforms and services.
Increased governance of Information Security & Cyber Security.
Established global IS standards for contact centres, web sites, mobile applications. |
Target Total Direct Compensation
In 2013, Mr. Rooney was appointed SEVP and Chief Operating Officer. As a result of this appointment, he received a base salary increase of $50,000 and his pay was denominated in U.S. dollars in accordance with our policy to pay our most senior officers in the currency corresponding to their competitive market. His AIP target increased from 100% to 125% of salary and he was awarded medium and long-term incentives in the amount of US$2,300,000. Mr. Rooney’s 2013 TTDC package considered his performance, as well as the TTDC of other comparable executives within Manulife’s peer group.
In 2014, the Board reviewed Mr. Rooney’s compensation and approved a salary increase of US$20,000 effective March 1, 2014 and awarded him medium and long-term incentives in the amount of US$2,300,000 in February 2014. In reviewing Mr. Rooney’s 2014 TTDC, the Board considered the Company’s size and scope relative to the peer group as well as Mr. Rooney’s achievements in 2013, his strong leadership and his potential to contribute to the future success of the Company.
The following table summarizes the compensation decisions taken by the Board for Mr. Rooney, on the recommendation of the CEO and the Management Resources and Compensation Committee, in 2013 and 2014.
| Target Total Direct Compensation | ||||||||||||
| 2012 (CAD) | 2013 (USD) | 2014 (USD) | ||||||||||
Base Salary (March 1) | $ | 650,000 | $ | 700,000 | $ | 720,000 | ||||||
AIP Target1 | $ | 650,000 | $ | 875,000 | $ | 900,000 | ||||||
PSUs Awarded | $ | 500,000 | $ | 805,000 | $ | 805,000 | ||||||
RSUs Awarded | $ | 500,000 | $ | 575,000 | $ | 575,000 | ||||||
Stock Options Awarded | $ | 1,000,000 | $ | 920,000 | $ | 920,000 | ||||||
Target Total Direct Compensation | $ | 3,300,000 | $ | 3,875,000 | $ | 3,920,000 | ||||||
| 1 | Annual Incentive Plan payout can range from 0% to 250% of target, reflective of business and personal performance. |
2013 Annual Incentive Plan Payout
In determining Mr. Rooney’s annual incentive for 2013, the Board assessed his performance against the specific objectives described above and the Company Performance Score, as described on page 40. Mr. Rooney received an annual incentive of US$1,410,938 (Cdn$1,549,351) based on the following:
| Base Salary | X | AIP Target
(Percentage of Base Salary) | X | Company Performance Score (Balanced Scorecard) | X | Individual Performance Multiplier | = | Annual Incentive | ||||||||
| US$700,000 | 125% | 129% | 125% | US$1,410,938 |
| Manulife Financial Corporation Proxy Circular | 47 |
Table of Contents
Jean-Paul Bisnaire, Senior Executive Vice President, Corporate Affairs and General Counsel
Mr. Bisnaire is responsible for overseeing the worldwide functions of: Law; Compliance; Internal Audit; Industry, Regulatory and Government Affairs; and Corporate Secretary. He is the Chief Legal Counsel for the Company. In 2013 Mr. Bisnaire demonstrated leadership in Manulife’s expense reduction initiatives. He was also involved in several successful capital initiatives, including the sale of our Taiwan insurance business. Mr. Bisnaire is a member of the Company’s Executive Committee and Management Committee.
The table below outlines Mr. Bisnaire’s specific key individual objectives and results for 2013:
| Key Objectives | Results | |
| Meet or exceed 2013 Efficiency & Effectiveness targets | Completed Organization Design of Law and Compliance functions of Group and all divisions, Internal Audit and Industry, Regulatory and Government Affairs.
Significantly reduced overall legal spend through a variety of initiatives. | |
| Legal, Global, Compliance and Internal Audit | Continued to assess and mitigate risk to the Company from legal, regulatory and policy changes, initiatives and investigations.
Enhanced focus on Asia Division legal, compliance and audit resources.
Collaborated with other functions to build out the framework for Operational Risk Management. | |
| Corporate Development, Strategy and Capital Initiatives | Advised on several capital initiatives, including the sale of the Company’s Taiwan insurance business.
Advised on 2013 acquisitions and other opportunities.
Continued to provide advice and assistance on proposed International Accounting Standards for insurance liabilities. | |
| Industry Regulatory and Government Affairs | Continued to maintain strong relationships with regulators and government authorities. | |
| Governance | Put in place a new Corporate Secretary and hired a new head for the Corporate Secretarial office.
Continued to enhance our public disclosures.
Assisted in improving meeting agendas and materials for senior management meetings. |
Target Total Direct Compensation
In 2013, Mr. Bisnaire did not receive a base salary increase. His AIP target of 100% of salary remained unchanged and he was awarded medium and long-term incentives in the amount of US$1,800,000. Mr. Bisnaire’s 2013 TTDC package considered his performance, as well as the TTDC of his counterparts within Manulife’s peer group.
After 10 years of service, Mr. Bisnaire advised he will retire on December 31, 2014. Stephen Sigurdson has been announced as his successor to take over the General Counsel position effective May 1, 2014. The period between May 1, 2014 and December 31, 2014 will provide for an orderly transition and Mr. Bisnaire will continue to be involved in special projects such as our efforts to influence accounting standards under IFRS and other important policy matters. For 2014, Mr. Bisnaire did not receive a base salary increase or any medium and long-term incentive award. Upon retirement, he will receive an amount equivalent to his target annual incentive, in lieu of payment under the Annual Incentive Plan which he will forfeit. Other compensation elements will be treated in accordance with the applicable compensation program.
The following table summarizes the compensation decisions taken by the Board for Mr. Bisnaire, on the recommendation of the CEO and the Management Resources and Compensation Committee, in 2013 and 2014.
| Target Total Direct Compensation | ||||||||||||
| 2012 (USD) | 2013 (USD) | 2014 (USD) | ||||||||||
Base Salary (March 1) | $ | 650,000 | $ | 650,000 | $ | 650,000 | ||||||
AIP Target1 | $ | 650,000 | $ | 650,000 | $ | 650,000 | ||||||
PSUs Awarded | $ | 450,000 | $ | 630,000 | $ | 0 | ||||||
RSUs Awarded | $ | 950,000 | $ | 450,000 | $ | 0 | ||||||
Stock Options Awarded | $ | 900,000 | $ | 720,000 | $ | 0 | ||||||
Target Total Direct Compensation | $ | 3,600,000 | $ | 3,100,000 | $ | 1,300,000 | ||||||
| 1 | Annual Incentive Plan payout for 2012 and 2013 could range from 0% to 250% of target, reflective of business and personal performance. |
| Manulife Financial Corporation Proxy Circular | 48 |
Table of Contents
2013 Annual Incentive Plan Payout
In determining Mr. Bisnaire’s annual incentive for 2013, the Board assessed his performance against the specific objectives described above and the Company Performance Score, as described on page 40. Mr. Bisnaire received an annual incentive of US$964,275 (Cdn$1,058,870) based on the following:
| Base Salary | X | AIP Target
(Percentage of Base Salary) | X | Company Performance Score (Balanced Scorecard) | X | Individual Performance Multiplier | = | Annual Incentive | ||||||||
| US$650,000 | 100% | 129% | 115% | US$964,275 |
Share Ownership Guidelines
The Company requires its executives to own shares to align executive compensation with the interests of shareholders. Executives have five years from their appointment or promotion date to meet the requirement. Deferred Share Units (“DSUs”), RSUs, PSUs, personally held Common Shares and Manulife preferred shares count towards the share ownership guidelines, but stock options do not. RSUs, PSUs and DSUs are valued at the higher of the grant price or the current market price for the purposes of meeting the share ownership guidelines.
The share ownership guidelines for executives, by level, are as follows:
| Executive Level | Share Ownership Requirement as a Multiple of Base Salary | |||||
CEO | 7.0 | |||||
Senior Executive Vice President | 4.0 | |||||
Executive Vice President | 2.5 | |||||
The share ownership holdings of the NEOs as at February 28, 2014 were as follows:
| NEO | Required Ownership as Multiple of Base Salary | Total RSUs | Total PSUs | Total DSUs | Personal Shareholdings | Total Holdings | Share Ownership as Multiple of Base Salary1 | |||||||||||||||||||
Donald Guloien | 7.0 | $ | 7,202,264 | $ | 9,005,667 | $ | 4,052,013 | $ | 2,599,357 | $ | 22,859,301 | 15.6 | ||||||||||||||
Steve Roder | 4.0 | $ | 3,098,278 | $ | 2,270,371 | - | - | $ | 5,368,649 | 6.7 | ||||||||||||||||
Warren Thomson | 4.0 | $ | 2,357,981 | $ | 2,909,344 | $ | 553,196 | $ | 901,539 | $ | 6,722,060 | 8.7 | ||||||||||||||
Paul Rooney | 4.0 | $ | 2,333,633 | $ | 2,910,072 | $ | 822,233 | $ | 17,186 | $ | 6,083,124 | 7.6 | ||||||||||||||
Jean-Paul Bisnaire | 4.0 | $ | 2,322,144 | $ | 1,683,731 | $ | 774,867 | $ | 46,096 | $ | 4,826,838 | 6.7 | ||||||||||||||
| 1 | For purposes of determining compliance with the share ownership guidelines, the salary of each NEO has been converted to Canadian dollars as of February 28, 2014 using an exchange rate of US$1.00 = Cdn$1.1075. Each NEO’s total holdings multiple was calculated based on the higher of the grant price or the closing price of the Common Shares on the TSX on February 28, 2014, which was $21.01 per Common Share. |
| Manulife Financial Corporation Proxy Circular | 49 |
Table of Contents
Manulife’s compensation governance structure includes the groups outlined below. The compensation governance structure is reviewed regularly against best practices and regulatory guidelines.
Board of Directors | • Is responsible for the oversight of the Company’s compensation principles, practices and programs, including the management of compensation risk. • Approves major compensation programs and payouts, including compensation for the CEO, Executive Committee Members and Heads of Control Functions based on MRCC recommendations. • Approves the Director Compensation program based on Corporate Governance & Nominating Committee recommendations. |
Management Resources and Compensation Committee1 |
Risk Committee1 | Corporate Governance and Nominating Committee1 | ||||||
• Assists the Board in carrying out its responsibilities with respect to executive compensation and talent planning. • Most members have experience in human resources management and executive compensation, either as senior business leaders or as members of the compensation committees of other boards. • Two members serve on the Corporate Governance and Nominating Committee. • Two members serve on the Risk Committee. This cross membership supports the effective oversight of compensation and its alignment with sound risk management principles and practices. • Please see page 28 for a description of the Committee’s responsibilities and page 51 “Compensation Decision Process” for more details on how the Committee determines compensation for the Company’s executives.
| • Assists the Board in its oversight role of compensation principles, practices and programs. • Members have experience as senior business leaders or participation on other risk committees • Please see page 27 for a description of the Committee’s responsibilities, which include the review of the alignment of the Company’s incentive compensation programs and risk management objectives.
| • Assists the Board in the determination of Director Compensation. • Please see page 23 for a description of the Committee’s responsibilities and page 20 for details on how the Committee determines Director Compensation. |
Independent Advisor |
• The Corporate Governance and Nominating Committee and Management Resources and Compensation Committee have retained Hugessen Consulting as their external independent compensation advisor since 2006 (see the Reports of the Corporate Governance and Nominating Committee and of the Management Resources and Compensation Committee at pages 23 and 28 for more information). • Hugessen Consulting are independent advisors and their role involves: • attending committee meetings; • providing advice on compensation related decisions; and • reporting on compensation trends. • In 2013, the Corporate Governance and Nominating Committee also retained Pearl Meyer & Partners to provide advice respecting director compensation (see the Report of the Corporate Governance and Nominating Committee at page 23 for more information). • The table below shows the fees paid to Hugessen Consulting and Pearl Meyer & Partners over the last two years for advice regarding executive and director compensation. • The Management Resources and Compensation Committee must approve, in advance, any proposed retainer by management of any independent advisor previously retained by the Management Resources and Compensation Committee. |
| Executive Compensation Committee | Chief Risk Officer | |||
• Supports the Management Resources and Compensation Committee in its oversight of compensation risk management. • Meets several times per year and includes the Chief Risk Officer, the CFO and the Chief Human Resources Officer. • The Executive Compensation Committee’s responsibilities include: • the review of incentive plan business performance measures, targets, weightings and results to ensure alignment with the Company’s business strategy and risk management objectives; • the review of compensation program changes to ensure alignment with the Company’s risk management objectives; and • the recommendation to the CEO of compensation program changes prior to review and approval by the Management Resources and Compensation Committee. |
• Attends the Management Resources and Compensation Committee meetings at which compensation design recommendations are reviewed and approved, which facilitates effective oversight of the compensation program recommendations through informed discussion of the relevant risks. • The Chief Risk Officer is a member of the Executive Compensation Committee. |
| 1 | All members of the above Board Committees meet the independence requirements set out in the independence policy established by the Board (see the section titled “Director Independence and Committee Membership on page 19). All members are knowledgeable, senior business leaders and have broad business experience as a senior officer or chair of the board of a major organization (public, private and non-profit) (see the “Experience Matrix” on page 10) |
| Manulife Financial Corporation Proxy Circular | 50 |
Table of Contents
Fees Paid to Hugessen Consulting and Pearl Meyer & Partners
The table below shows the fees paid to Hugessen Consulting and Pearl Meyer & Partners over the last two years.
| Services Performed | Fees paid in 2012 | Fees paid in 2013 | ||||||
Hugessen Consulting | ||||||||
Executive Compensation related fees | $ | 258,905 | $ | 346,832 | ||||
Director Compensation related fees | $ | 0 | $ | 5,000 | ||||
All other fees | $ | 0 | $ | 0 | ||||
Pearl Meyer & Partners1 | ||||||||
Executive Compensation related fees | $ | 0 | $ | 0 | ||||
Director Compensation related fees | $ | 0 | $ | 31,167 | 2 | |||
All other fees | $ | 0 | $ | 0 | ||||
| 1 | Pearl Meyer & Partners were not retained in 2012 for services relating to determining compensation for any of the Company’s directors and executive officers. |
| 2 | Fees were paid in U.S. dollars and were converted to Canadian dollars at an average exchange rate of $1.038 per U.S.$1.00. |
The following summarizes the process used by the Board of Directors and the Management Resources and Compensation Committee for making compensation recommendations for the CEO, all Executive Committee members and Heads of Control Functions:
| November – December | January – February | During the year | November – January | |||
• Management presents its preliminary compensation structure recommendations, including compensation components, compensation mix and performance metrics for the upcoming year and supporting rationale. The committee discusses the recommendations and provides feedback to management. Adjustments are made as requested by the committee. • The Risk Committee reviews the risk management aspects of the executive compensation program and satisfies itself that the compensation program is aligned with the Company’s risk management objectives. • Following the Risk Committee review, the Management Resources and Compensation Committee recommends for Board approval the compensation program and structure for the coming year. • The Management Resources and Compensation Committee seeks advice and guidance on compensation issues from its independent compensation advisor. | • At the start of the year, the Board approves the CEO’s individual performance goals and the Management Resources and Compensation Committee reviews the individual performance goals of other Executive Committee members and Heads of Control Functions. • The Management Resources and Compensation Committee also reviews and approves the business performance metrics and financial targets for incentive plan purposes. Targets are intended to be achievable yet provide a performance “stretch”. • Stress testing is also conducted prior to approval of the financial targets when significant program changes are made. | • During the year, the Management Resources and Compensation Committee reviews the continuing relevance of the Compensation Peer Group and the competitive positioning of target compensation against desired market positioning and trends. Please see below for further information on the Compensation Peer Group, which is used to benchmark Manulife’s CEO and SEVPs. | • Business performance results for any performance period that has ended are presented by the CFO to, and discussed by, the Management Resources and Compensation Committee, which, in turn, approves the performance factors to be applied to the various incentive programs for that performance period. • The Board approves the AIP and PSU results for the organization and determines whether or not any adjustments are appropriate. • The CEO discusses the individual performance and compensation recommendations for all Executive Committee members and Heads of Control Functions with the committee. • During in camera sessions, the committee and the Board review the CEO’s and all Executive Committee members’ and Heads of Control Functions’ performance. The committee recommends compensation awards for approval by the Board. |
Compensation Peer Group
As described above, the Management Resources and Compensation Committee reviews the Compensation Peer Group annually. The criteria used to select peer companies include market capitalization and assets, competitor for talent, similar lines of business and international footprint. As a result of the 2013 review, the Committee elected to remove Lincoln National and Hartford Financial as they were no longer comparable to Manulife in terms of size and lines of business. The Committee added Prudential plc to the group as it met most of the inclusion criteria and to increase the representation of non-North American insurers in the Compensation Peer Group.
| Manulife Financial Corporation Proxy Circular | 51 |
Table of Contents
The 2013 Compensation Peer Group includes seven global life insurers and five Canadian banks, as outlined below:
| Global Life Insurers | ||
AFLAC Inc. Ameriprise Financial Inc. MetLife, Inc. Principal Financial Group Inc. Prudential Financial, Inc. | 2013 Median Revenue: $23.9 billion 2013 Median Total Assets: $212.2 billion Median Market Capitalization at Dec 31, 2013: $30.7 billion | |
| Canadian Banks | ||
Bank of Montreal Bank of Nova Scotia Canadian Imperial Bank of Commerce Royal Bank of Canada Toronto-Dominion Bank | 2013 Median Revenue: $22.0 billion 2013 Median Total Assets: $791.1 billion Median Market Capitalization at Dec 31, 2013: $73.5 billion | |
| Manulife Financial | 2013 Revenue: $19.3 billion 2013 Total Assets: $546.3 billion Dec 31, 2013 Market Capitalization: $36.3 billion |
Source: Bloomberg (U.S. dollars).
The Committee also considers pay information published in the Diversified Insurance Survey, a widely referenced survey of pay levels among major insurance companies in the United States, and the Financial Services Executive Compensation Survey, a survey including the major financial institutions in Canada. For the role of Senior Executive Vice President and Chief Investment Officer, Manulife also considers the pay practices of asset management advisory firms similar in size to Manulife Asset Management, the Company’s global asset management arm.
Target compensation for executives below the Senior Executive Vice President level is benchmarked against regional comparators, reflecting each executive’s level, role and location. Each element of compensation, as well as total target compensation, is benchmarked to ensure appropriate competitiveness against peers. Total target compensation for executives is targeted at the median of the peer group. Compensation for high performing executives is intended to be comparable to high performing executives at peer companies.
The process followed by the Corporate Governance and Nominating Committee and the Board to determine Director compensation is described in the “Director Compensation - Compensation Determination” section on page 20.
| Manulife Financial Corporation Proxy Circular | 52 |
Table of Contents
In all compensation decisions, the Management Resources and Compensation Committee contemplates the potential impact that the compensation program may have on risk and ensures that the compensation program contributes to meeting Manulife’s risk management objectives. Manulife has developed a Compensation Risk Framework that provides a structure for the review of risk associated with the compensation program and the design features that mitigate the risk. Within the framework, risk is identified under the following four risk categories that are closely aligned with our compensation program objectives.
Business Risk
The risk that Manulife’s compensation program may encourage behaviours that are not aligned with business strategy, the Company’s Risk Appetite Statement1 and long-term shareholder value. Conversely, business risk also includes the risk that the compensation program would discourage the taking of healthy risks. Business risk can be mitigated by the design of incentive programs that combine multiple performance metrics that are aligned with our business strategy and reflect the impact that employees have on performance.
| Talent Risk
The risk that Manulife’s compensation program may not permit the Company to attract and retain talented executives and staff. Talent risk can be mitigated by compensation practices that are externally competitive in terms of both target and total opportunity and by providing opportunities that are appealing to the talent we want to attract. | |||||||
Performance Risk
The risk that Manulife’s compensation program does not provide motivation for employees to maintain high performance standards. Performance risk can be mitigated by providing appropriate levels of linkage between pay and performance and providing compensation opportunities that will optimize business results.
| Compliance & Ethical Risk
The risk that Manulife’s compensation program will generate an incentive to engage in questionable, unethical or illegal behaviours. Compliance & ethical risk can be mitigated by strong oversight and control mechanisms and by compensation program designs that are structured in a way to minimize the potential incentive to participate in compliance and ethical breaches.
| |||||||
| 1 | The Company’s Risk Appetite Statement is an expression of the types of risk Manulife will take, the amount of each risk the Company is willing to take and the principles applied before taking risk. Both business strategy and Risk Appetite are equally critical to meeting our objectives and creating long-term shareholder value. |
While risk forms an inherent part of Manulife’s business, Manulife’s executive compensation program contains a number of features and practices that are generally considered to decrease the risk associated with compensation, including:
| • | A compensation horizon that is appropriately balanced among short-term, medium-term and long-term; |
| • | The use of multiple performance metrics in incentive plan design; |
| • | Specific risk control and capital adequacy measures embedded into various compensation components, including risk management targets for the AIP and MCCSR ratio targets for PSUs; |
| • | Stress testing of the current compensation designs to ensure potential payouts continue to be aligned with business performance; |
| • | Divisional control function heads providing oversight are compensated under the Corporate Annual Incentive Plan, under which the incentive payout is independent of the businesses they oversee; |
| • | The Board has discretion to adjust the performance factor for PSUs based on the Company’s progress towards achieving risk reduction targets and to adjust the Company Performance Scores under the AIP for significant events that result in compensation results that are unreasonable, unrepresentative or otherwise inappropriate; |
| • | A performance assessment process for all employees to ensure they are mindful of risks inherent in their jobs and are working within the boundaries of the Company’s policies and standards of practice. Employees’ performance assessments are expected to reflect how the employee improved the Company’s risk profile and also take into account any signals from Internal Audit, Compliance or Risk Management highlighting potential inappropriate actions; |
| • | A thorough review process overseen by the Management Resources and Compensation Committee which reviews the material Sales and Investments Incentive Plan designs, payout distribution, control and monitoring processes and the potential impact they may have on business risk. Division heads are responsible for monitoring material sales and investment compensation plans within their division and must approve any significant changes to these plans. Division heads must annually attest that these plans do not generate inappropriate levels of business risk to the division and to Manulife as a whole; |
| • | Limiting stock options to less than one-third of total target compensation for Senior Executives; |
| Manulife Financial Corporation Proxy Circular | 53 |
Table of Contents
| • | A policy which prohibits short selling or buying or selling a call or put option or other derivative in respect of Manulife securities designed to hedge or offset a change in price and which prohibits the monetization of unvested equity awards by executives and Directors. This policy is incorporated into our Code of Business Conduct and Ethics. All employees and Directors must certify compliance with the Code annually; |
| • | Compulsory share ownership requirements; |
| • | A clawback policy for Vice-Presidents and above, under which the Board has the discretion to cancel an executive’s unvested incentive awards and/or clawback the executive’s vested and/or paid incentive awards, as applicable, in the event of the executive’s fraud, theft, embezzlement or serious misconduct irrespective of whether there was a financial restatement; |
| • | The Company imposes additional conditions for the CEO, Chief Financial Officer (“CFO”) and Chief Operating Officer (“COO”) as follows: |
| - | Any material restatement of the Company’s financial statements related to CEO misconduct will trigger compensation clawbacks of his compensation. |
| - | Company policy requires the CEO, CFO and COO to maintain their share ownership requirement for one year after leaving the Company. |
| - | The CEO is required to hold at least 50% of the realized gains from the exercise of stock options in Common Shares during his employment and for one year post employment. The CFO and COO are also required to hold at least 50% of the realized gains from the exercise of stock options in Common Shares during their employment and for one year post employment unless the executive meets his share ownership requirement. |
| • | The Chief Risk Officer and Chief Actuary have Annual Incentive Plan and medium-term incentive awards that are delinked from the business performance of the Company to remove any potential or perceived conflicts of interest in providing unbiased oversight and advice to senior management and the Board. |
The Board is satisfied that good risk governance and sound risk reduction mechanisms as described above are effective in controlling the risk associated with compensation.
| Manulife Financial Corporation Proxy Circular | 54 |
Table of Contents
The following table summarizes compensation awarded to the NEOs during 2013 and the two prior calendar years, in Canadian dollars unless otherwise noted. As compensation for several executives is established in US dollars, the amounts noted below, which were converted to Canadian dollars, vary from year to year because of exchange rate fluctuations.
Name and Principal Position | Year | Salary1 | | Share-Based Awards2 | | | Option-Based Awards3 | | | Non-Equity Incentive Plan Compensation | | | Pension Value5 | | | All Other Compensation6 | | | Total Compensation | | ||||||||||||
| | Annual Incentive Plans4 | | ||||||||||||||||||||||||||||||
| ($) | ($) | ($) | ($) | ($) | ($) | ($) | ||||||||||||||||||||||||||
Donald Guloien President and CEO |
| 2013 2012 2011 |
|
| 1,216,641 1,083,130 986,550 |
|
| 3,975,048 3,018,043 2,711,280 |
|
| 2,650,032 3,018,043 2,711,280 |
|
| 4,249,647 2,769,250 1,584,435 |
|
| 568,800 455,400 568,300 |
|
| 103,381 101,836 103,307 |
|
| 12,763,549 10,445,702 8,665,152 |
| ||||||||
Steve Roder7 Senior Executive Vice President and Chief Financial Officer |
| 2013 2012 |
|
| 719,393 435,805 |
|
| 1,505,700 750,644 |
|
| 1,003,800 750,644 |
|
| 1,735,273 656,405 |
|
| 124,000 37,400 |
|
| 64,636 39,454 |
|
| 5,152,802 2,670,352 |
| ||||||||
Warren Thomson Senior Executive Vice President and Chief Investment Officer |
| 2013 2012 2011 |
|
| 685,241 649,986 641,257 |
|
| 1,325,016 1,097,470 887,328 |
|
| 883,344 1,097,470 887,328 |
|
| 1,993,084 1,250,845 549,271 |
|
| 189,100 115,400 103,000 |
|
| 75,116 64,636 66,112 |
|
| 5,150,901 4,275,807 3,134,296 |
| ||||||||
Paul Rooney8 Senior Executive Vice President and Chief Operating Officer |
| 2013 2012 2011 |
|
| 719,393 646,667 625,000 |
|
| 1,385,244 1,000,000 900,000 |
|
| 923,496 1,000,000 900,000 |
|
| 1,549,351 828,100 534,240 |
|
| 291,700 350,000 354,200 |
|
| 116,836 58,381 58,307 |
|
| 4,986,020 3,883,148 3,371,747 |
| ||||||||
Jean-Paul Bisnaire Senior Executive Vice President, Corporate Affairs and General Counsel |
| 2013 2012 2011 |
|
| 668,008 649,986 641,257 |
|
| 1,084,104 1,396,780 838,032 |
|
| 722,736 897,930 838,032 |
|
| 1,058,870 744,551 480,612 |
|
| 132,500 104,500 94,400 |
|
| 68,717 67,172 68,693 |
|
| 3,734,935 3,860,919 2,961,026 |
|
| 1 | Salary paid to Messrs. Guloien, Roder, Thomson, Rooney and Bisnaire is established in U.S. dollars but paid in Canadian dollars, converted on a semi-monthly basis using the Bank of Canada noon rate of exchange on the previous pay date. For 2012 and 2011, Mr. Rooney’s salary was established and paid in Canadian dollars. |
| 2 | Amounts shown represent the dollar value used to determine the number of units awarded to the NEO. The number of units awarded was determined by dividing the dollar value by the grant date fair value of each unit. The grant date fair value of each unit was the price of a Common Share on the TSX which was the higher of the closing price on the trading day preceding the grant date and the average closing price for the five trading days preceding the grant date. The grant date fair value factors in the value of dividends credited to units. Amounts shown for 2013 represent PSUs and RSUs awarded to NEOs on February 19, 2013 based on a Common Share price of $15.52 calculated as described above. The vesting of the PSUs is dependent upon the achievement of established performance conditions. Awards established in U.S. dollars were converted to Canadian dollars at an exchange rate of $1.0038 per US$1.00. |
| 3 | Amounts shown represent the dollar value used to determine the number of stock options awarded to the NEO. For option-based awards, the number of stock options awarded was determined for the years indicated using the following exercise prices and fair value factors: February 2013: $15.52 and 20.9%; February 2012: $12.64 and 25.6%; June 2012: $11.232 and 25.6%; February 2011: $18.91 and 25.6%. The Black-Scholes factor for 2013 used for determining Accounting Fair Value was calculated using the following variables: (a) expected life of the options of 6.7 years; (b) expected volatility of the Common Share price of 32%; (c) risk-free interest rate of 1.25%; and (d) expected dividend yield of the Common Shares of 3.7%. For the 2012 grants, the Management Resources and Compensation Committee elected to leave the fair value factor unchanged from 2011 at 25.6%, instead of using the factor used for determining fair value in the Company’s consolidated financial statements (“Accounting Fair Value”). Keeping the factor unchanged resulted in fewer options being granted to NEOs. The 2012 Accounting Fair Value for stock options is lower than the value shown in the Summary Compensation Table by an amount of $424,416 for Mr. Guloien, $105,559 for Mr. Roder, $154,333 for Mr. Thomson, $140,625 for Mr. Rooney and $126,273 for Mr. Bisnaire. |
| 4 | Annual incentive amounts are paid in cash in the year following the fiscal year in which they were earned. 2013 annual incentive amounts for Messrs. Guloien, Roder, Thomson, Rooney and Bisnaire were converted to Canadian dollars from U.S. dollars at an exchange rate of $1.0981 per US$1.00. |
| 5 | Pension Value amounts for 2013 are the sum of the amounts shown under the Compensatory Change column of the Pension Tables on page 63 for each NEO. |
| 6 | All Other Compensation for 2013 includes the Canadian Executive Flexible Spending Account (“EFSA”) allowance paid to each of Messrs. Guloien, Roder, Thomson, Rooney and Bisnaire of $100,000, $55,000, $55,000, $64,336 and $55,000 respectively. For Mr. Rooney, All Other Compensation also includes a $60,000 commuting allowance in respect of his new role as Chief Operating Officer. This allowance will be payable until December 31, 2014. |
| 7 | Mr. Roder commenced employment as the SEVP and CFO of Manulife Financial on June 1, 2012. |
| 8 | Mr. Rooney’s Pension Value for 2012 reported in last year’s proxy circular ($206,300) was understated by $143,700 due to the incorrect application of the early retirement factors. |
| Manulife Financial Corporation Proxy Circular | 55 |
Table of Contents
Grant Date | Option-Based Awards1 | Share-Based Awards1 | ||||||||||||||||||||||||||||||||||||||
Name | | Number of Securities Underlying Unexercised Options (#) | | | Option Exercise Price ($) | | Option Expiration Date | | Value of Unexercised In-The-Money Options ($)2 | | | Type of Share-Based Award | | | Number of Shares or Units of Shares That Have Not Vested (#)3 | | | Market or Payout Value of Share Awards That Have Not Vested ($)4 | | | Market or Payout Value of Vested Share-Based Awards Not Paid Out or Distributed ($)5 | | ||||||||||||||||||
Donald Guloien | February 11, 2004 | 128,000 | $24.03 | February 11, 2014 | $0 | |||||||||||||||||||||||||||||||||||
| February 15, 2005 | 128,286 | $29.01 | February 15, 2015 | $0 | ||||||||||||||||||||||||||||||||||||
| February 15, 2006 | 135,208 | $36.98 | February 15, 2016 | $0 | ||||||||||||||||||||||||||||||||||||
| February 16, 2007 | 139,884 | $40.38 | February 16, 2017 | $0 | ||||||||||||||||||||||||||||||||||||
| February 20, 2008 | 202,945 | $37.71 | February 20, 2018 | $0 | ||||||||||||||||||||||||||||||||||||
| February 18, 2009 | 507,629 | $15.67 | February 18, 2019 | $2,685,357 | ||||||||||||||||||||||||||||||||||||
| May 18, 2009 | 389,889 | $21.95 | May 18, 2019 | $0 | ||||||||||||||||||||||||||||||||||||
| February 23, 2010 | 617,344 | $19.48 | February 23, 2020 | $913,669 | ||||||||||||||||||||||||||||||||||||
| February 22, 2011 | 560,071 | $18.91 | February 22, 2021 | $1,148,146 | ||||||||||||||||||||||||||||||||||||
| February 21, 2012 | 932,701 | $12.64 | February 21, 2022 | $7,760,072 | PSU | 128,214 | $2,687,357 | |||||||||||||||||||||||||||||||||
| RSU | 128,214 | $2,687,357 | ||||||||||||||||||||||||||||||||||||||
| February 19, 2013 | 816,983 | $15.52 | February 19, 2023 | $4,444,388 | PSU | 153,975 | $3,227,317 | |||||||||||||||||||||||||||||||||
| RSU | 109,982 | $2,305,214 | ||||||||||||||||||||||||||||||||||||||
| DSU | $4,042,370 | |||||||||||||||||||||||||||||||||||||||
Steve Roder | June 1, 2012 | 261,058 | $11.23 | June 1, 2022 | $2,539,572 | RSU | 70,280 | $1,473,073 | ||||||||||||||||||||||||||||||||
| February 19, 2013 | 309,463 | $15.52 | February 19, 2023 | $1,683,479 | PSU | 58,324 | $1,222,464 | |||||||||||||||||||||||||||||||||
| RSU | 41,660 | $873,198 | ||||||||||||||||||||||||||||||||||||||
Warren Thomson | February 11, 2004 | 36,000 | $24.03 | February 11, 2014 | $0 | |||||||||||||||||||||||||||||||||||
| February 15, 2005 | 42,094 | $29.01 | February 15, 2015 | $0 | ||||||||||||||||||||||||||||||||||||
| February 15, 2006 | 41,150 | $36.98 | February 15, 2016 | $0 | ||||||||||||||||||||||||||||||||||||
| February 16, 2007 | 44,038 | $40.38 | February 16, 2017 | $0 | ||||||||||||||||||||||||||||||||||||
| February 20, 2008 | 58,854 | $37.71 | February 20, 2018 | $0 | ||||||||||||||||||||||||||||||||||||
| February 18, 2009 | 255,948 | $15.67 | February 18, 2019 | $1,353,965 | ||||||||||||||||||||||||||||||||||||
| May 18, 2009 | 24,202 | $21.95 | May 18, 2019 | $0 | ||||||||||||||||||||||||||||||||||||
| February 23, 2010 | 188,342 | $19.48 | February 23, 2020 | $278,746 | ||||||||||||||||||||||||||||||||||||
| February 22, 2011 | 183,296 | $18.91 | February 22, 2021 | $375,757 | ||||||||||||||||||||||||||||||||||||
| February 21, 2012 | 339,164 | $12.64 | February 21, 2022 | $2,821,844 | PSU | 46,623 | $977,219 | |||||||||||||||||||||||||||||||||
| RSU | 46,623 | $977,219 | ||||||||||||||||||||||||||||||||||||||
| February 19, 2013 | 272,328 | $15.52 | February 19, 2023 | $1,481,464 | PSU | 51,325 | $1,075,772 | |||||||||||||||||||||||||||||||||
| RSU | 36,661 | $768,412 | ||||||||||||||||||||||||||||||||||||||
| DSU | $319,465 | |||||||||||||||||||||||||||||||||||||||
Paul Rooney | February 11, 2004 | 44,000 | $24.03 | February 11, 2014 | $0 | |||||||||||||||||||||||||||||||||||
| February 15, 2005 | 37,442 | $29.01 | February 15, 2015 | $0 | ||||||||||||||||||||||||||||||||||||
| February 15, 2006 | 38,504 | $36.98 | February 15, 2016 | $0 | ||||||||||||||||||||||||||||||||||||
| February 16, 2007 | 41,447 | $40.38 | February 16, 2017 | $0 | ||||||||||||||||||||||||||||||||||||
| February 20, 2008 | 67,648 | $37.71 | February 20, 2018 | $0 | ||||||||||||||||||||||||||||||||||||
| February 18, 2009 | 159,541 | $15.67 | February 18, 2019 | $843,972 | ||||||||||||||||||||||||||||||||||||
| May 18, 2009 | 41,416 | $21.95 | May 18, 2019 | $0 | ||||||||||||||||||||||||||||||||||||
| February 23, 2010 | 160,421 | $19.48 | February 23, 2020 | $237,423 | ||||||||||||||||||||||||||||||||||||
| February 22, 2011 | 185,914 | $18.91 | February 22, 2021 | $381,124 | ||||||||||||||||||||||||||||||||||||
| February 21, 2012 | 309,039 | $12.64 | February 21, 2022 | $2,571,204 | PSU | 42,482 | $890,421 | |||||||||||||||||||||||||||||||||
| RSU | 42,482 | $890,421 | ||||||||||||||||||||||||||||||||||||||
| February 19, 2013 | 284,706 | $15.52 | February 19, 2023 | $1,548,801 | PSU | 53,658 | $1,124,677 | |||||||||||||||||||||||||||||||||
| RSU | 38,327 | $803,341 | ||||||||||||||||||||||||||||||||||||||
| DSU | $820,276 | |||||||||||||||||||||||||||||||||||||||
Jean-Paul Bisnaire | July 5, 2004 | 77,160 | $27.03 | July 4, 2014 | $0 | |||||||||||||||||||||||||||||||||||
| February 15, 2005 | 64,142 | $29.01 | February 15, 2015 | $0 | ||||||||||||||||||||||||||||||||||||
| February 15, 2006 | 58,786 | $36.98 | February 15, 2016 | $0 | ||||||||||||||||||||||||||||||||||||
| February 16, 2007 | 62,171 | $40.38 | February 16, 2017 | $0 | ||||||||||||||||||||||||||||||||||||
| February 20, 2008 | 87,943 | $37.71 | February 20, 2018 | $0 | ||||||||||||||||||||||||||||||||||||
| February 18, 2009 | 217,555 | $15.67 | February 18, 2019 | $1,150,866 | ||||||||||||||||||||||||||||||||||||
| May 18, 2009 | 36,303 | $21.95 | May 18, 2019 | $0 | ||||||||||||||||||||||||||||||||||||
| February 23, 2010 | 177,879 | $19.48 | February 23, 2020 | $263,261 | ||||||||||||||||||||||||||||||||||||
| February 22, 2011 | 173,113 | $18.91 | February 22, 2021 | $354,882 | ||||||||||||||||||||||||||||||||||||
| February 21, 2012 | 277,498 | $12.64 | February 21, 2022 | $2,308,783 | PSU | 38,146 | $799,549 | |||||||||||||||||||||||||||||||||
| RSU | 80,531 | $1,687,921 | ||||||||||||||||||||||||||||||||||||||
| February 19, 2013 | 222,814 | $15.52 | February 19, 2023 | $1,212,108 | PSU | 41,993 | $880,175 | |||||||||||||||||||||||||||||||||
| RSU | 29,995 | $628,697 | ||||||||||||||||||||||||||||||||||||||
| DSU | $418,415 | |||||||||||||||||||||||||||||||||||||||
| 1 | Stock options exercised or that have expired and RSUs and PSUs that paid out prior to December 31, 2013 are excluded. |
| 2 | The value of unexercised in-the-money stock options is at December 31, 2013 and is equal to the difference between the exercise price of the stock options and the closing price of Common Shares on the TSX on December 31, 2013, which was $20.96 per Common Share. The value of in-the-money stock options is zero in instances when the exercise price is higher than the closing price of Common Shares on the TSX on December 31, 2013. |
| 3 | The number of PSUs that have not vested is based on a performance factor of 100%. RSUs do not have a performance factor. |
| 4 | The market or payout value of PSUs and RSUs that have not vested is based on the closing price of Common Shares on the TSX on December 31, 2013, which was $20.96 per Common Share. |
| 5 | The market or payout value of DSUs that are payable after the executive leaves the Company is based on the closing price of Common Shares on the TSX on December 31, 2013, which was $20.96 per Common Share. See further details under “Additional Disclosure” on page 58. |
| Manulife Financial Corporation Proxy Circular | 56 |
Table of Contents
Incentive Plan Awards – Value Vested or Earned During the Year |
| Name | Option-Based Awards | Share-Based Awards - Value Vested During the Year ($)3 | Non-Equity Incentive Plan Compensation - Value Earned During the Year ($)4 | |||||||||||||
| Value Vested During the Year ($)1 | Value Received During the Year ($)2 | |||||||||||||||
Donald Guloien | $552,625 | $0 | $2,723,589 | $4,249,647 | ||||||||||||
Steve Roder | $338,595 | $0 | $0 | $1,735,273 | ||||||||||||
Warren Thomson | $200,955 | $0 | $891,341 | $1,993,084 | ||||||||||||
Paul Rooney | $183,106 | $0 | $904,042 | $1,549,351 | ||||||||||||
Jean-Paul Bisnaire | $164,419 | $0 | $841,816 | $1,058,870 | ||||||||||||
| 1 | The total value of stock options that vested during 2013. The value is equal to the difference between the exercise price of the options and the closing price of Common Shares on the TSX on the vesting date. |
| 2 | There were no stock options exercised and no stock option gains realized during 2013 by any NEO. |
| 3 | The total value includes RSUs and PSUs granted in 2011 that vested and paid out in 2013 as described under “2013 Medium-Term Incentive Plan Results” on page 41. |
| 4 | The total value of annual cash incentive awards for 2013. Annual incentive awards are also reported in the “Summary Compensation Table” above. |
The following graph compares the total cumulative shareholder return for $100 invested in Common Shares from December 31, 2008 to December 31, 2013 with the cumulative total return of the S&P/TSX Composite Index and the S&P/TSX Composite Financials Index over the same time period. The stock did not perform as well as the indices from 2009 to 2011, but outperformed the indices substantially in 2012 and 2013. This has been reflected in the realized compensation of Manulife’s executives as shown in the Take Home Pay graph on page 58.
Performance Graph
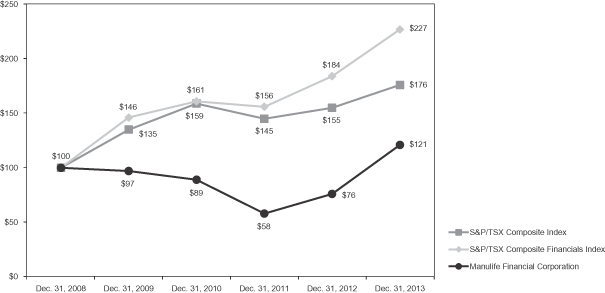
| Manulife Financial Corporation Proxy Circular | 57 |
Table of Contents
The following graph compares the Take Home Pay for NEOs over the last five years to the total shareholder return and demonstrates the strong relationship between compensation and share performance.
Take Home Pay for NEOs
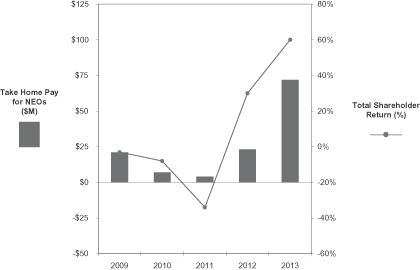
| 2009 | 2010 | 2011 | 2012 | 2013 | ||||||
Take Home Pay1 for NEOs2 | $21M | $7M | $4M | $23M | $72M | |||||
Total Shareholder Return3 | (3%) | (8%) | (34%) | 30% | 60% |
| 1 | Take Home Pay for NEOs is equal to compensation received and change in equity value, which is the sum of: |
| • | Cash compensation received by the NEOs for a given year, including salary, annual incentive earned, RSU and PSU payouts upon vesting and gains realized from option exercises, and |
| • | The change between the value of outstanding RSUs, PSUs, stock options and DSUs held by NEOs on December 31 of the year and the value of outstanding RSUs, PSUs, stock options and DSUs held by NEOs on December 31 of the previous year. |
| 2 | The NEOs in each of the last five years were: |
| • | 2013: Messrs. Guloien, Roder, Thomson, Rooney and Bisnaire; |
| • | 2012: Messrs. Guloien, Roder, Thomson, Bisnaire, Rooney and Bell; |
| • | 2011: Messrs. Guloien, Bell, Rooney, Thomson and Boyle; |
| • | 2010: Messrs. Guloien, Bell, Boyle, Thomson and Bisnaire; and |
| • | 2009: Messrs. Guloien, Bell, DesPrez, Boyle and Thomson; |
| 3 | Total shareholder return is the difference between the total cumulative shareholder return for Manulife, as reported in the Performance Graph above, on December 31 of the year and on December 31 of the previous year, expressed as a percentage. Total shareholder return reflects the gain (or loss) by common shareholders during a given year, inclusive of any dividends received. |
Medium-Term and Long-Term Incentive Program Descriptions
Medium-Term Incentives
Under Manulife’s Restricted Share Unit Plan, both RSUs and PSUs may be granted. RSUs and PSUs vest within three years and are paid at the end of the award term based on the Common Share price. PSUs are also subject to performance conditions that are approved by the Board. RSUs and PSUs are credited with additional units when dividends are paid on Common Shares. The Company does not issue any Common Shares in connection with RSUs and PSUs.
Stock Options
Stock options are awarded in February of each year and allow participants to purchase Common Shares at a specified exercise price within a specified maximum exercise period of 10 years.
| • | Stock options typically vest 25% per year over four years. |
| • | Exercise price is equal to the higher of the closing price of Common Shares on the TSX on the last trading day before the date of grant and the average closing price for the five trading days before the grant date. |
| • | Value on exercise is based on the difference between the exercise price at time of grant and the Common Share price at time of exercise. |
| • | Stock options are not granted when the Company’s reporting insiders are prohibited from trading, which is commonly referred to as a “blackout period”. Annual stock option awards are normally granted following the end of the blackout period after the annual financial results are announced. |
| • | The Company does not engage in stock option back-dating. |
| • | Stock options can be granted to select new executives at time of hire. If the hire date falls within a blackout period, the grant is delayed until after the end of the blackout period. |
| Manulife Financial Corporation Proxy Circular | 58 |
Table of Contents
The Executive Stock Option Plan was approved by shareholders at the 2000 Annual and Special Meeting. Stock options, DSUs, share appreciation rights, restricted shares and performance awards can be granted under the Executive Stock Option Plan. No amendment may be made to the Executive Stock Option Plan without the approval of the Company’s shareholders. The maximum number of Common Shares issuable under the Executive Stock Option Plan is 73,600,000, representing 4.0% of Common Shares outstanding as at March 11, 2014.
Deferred Share Units (Cash Settled)
DSUs entitle holders to receive cash equal to the market value of the same number of Common Shares when the DSUs are paid out.
| • | In 2013, executives in Canada and the U.S. were provided the opportunity to elect to exchange all or a portion of their annual incentive payment, RSUs or PSUs, into DSUs, subject to local tax rules and rulings. |
| • | DSUs may also be granted to select new hires. |
| • | DSUs assist executives in meeting the Company’s executive share ownership guidelines. |
| • | DSUs are credited with additional units when dividends are paid on Common Shares. |
| • | DSUs cannot be redeemed until an executive leaves the Company and are only transferable upon death. |
In addition, eligible U.S. executives are entitled to participate in a program that allows them to defer up to 90% of base salary, as well as any annual incentive or vested RSUs into a deferred compensation account. Deferred amounts are adjusted as though the funds had been invested in one or more investment options as designated by the Company and selected by the participant. The participant may elect to receive the total amount of their deferred compensation account in a lump sum or in annual installments at the participant’s choosing, provided the minimum deferral period is at least three years.
Total Stock Options and DSUs Outstanding
A total of 20,809,798 Common Shares have been issued in respect of stock options and DSUs under the Executive Stock Option Plan, representing 1.1% of Common Shares outstanding as at March 11, 2014. The maximum number of Common Shares that may be issued within one year or issuable at any time under the Executive Stock Option Plan together with all other share based compensation arrangements to any one participant, or to insiders in aggregate, cannot exceed 5% and 10%, respectively, of the outstanding Common Shares.
The total number of stock options, share-settled DSUs outstanding and securities available for future grant under the Executive Stock Option Plan, the Directors Equity Incentive Plan and the Stock Plan for Non-Employee Directors as of December 31, 2013 was:
Plan | Stock Options/DSUs Outstanding | Securities Available for Future Issuance | ||||||||||||||
Number | As a % of Diluted Common Shares |
Number | As a % of Diluted Common Shares | |||||||||||||
Stock Options | 32,556,813 | 1.75 | % | 20,268,769 | 1.09 | % | ||||||||||
DSUs | 1,322,351 | 0.07 | % | |||||||||||||
Directors Equity Incentive Plan | 0 | 0.00 | % | |||||||||||||
Stock Plan for Non-Employee Directors | 734,627 | 0.04 | % | |||||||||||||
Total | 34,613,791 | 1.86 | % | 20,268,769 | 1.09 | % | ||||||||||
Overhang, Dilution and Burn Rates
Overhang, dilution and burn rates for the past three years are as follows:
| 2013 | 2012 | 2011 | ||||||||||
Overhang1 | 2.95 | % | 2.97 | % | 3.03 | % | ||||||
Dilution2 | 1.86 | % | 1.81 | % | 2.01 | % | ||||||
Burn Rate3 | 0.24 | % | 0.35 | % | 0.22 | % | ||||||
| 1 | Overhang is defined as the total number of Common Shares reserved for issuance to employees and directors, less the number of stock options and share-settled DSUs redeemed, expressed as a percentage of the total number of Common Shares outstanding as at December 31 of each year on a diluted basis. |
| 2 | Dilution is defined as the total number of stock options and share-settled DSUs outstanding, expressed as a percentage of the total number of Common Shares outstanding as at December 31 of each year on a diluted basis. |
| 3 | Burn rate is defined as the number of stock options and share-settled DSUs granted annually, expressed as a percentage of the total number of Common Shares outstanding as at December 31 of each year on a diluted basis. |
| Manulife Financial Corporation Proxy Circular | 59 |
Table of Contents
Cost of Management Ratio
The following table shows the aggregate cost of NEO total compensation in 2011, 2012 and 2013 as a percentage of the Company’s net income attributed to shareholders:
| Year | NEO Total ($ thousands) | Net Income Attributed to ($ thousands) | NEO Total Compensation as a Percentage of Net Income Attributed to Shareholders | |||||||||
2013 | 31,788 | 3,130,000 | 1.02 | % | ||||||||
2012 | 27,355 | 1,736,000 | 1.58 | % | ||||||||
2011 | 23,260 | 129,000 | 18.03 | %1 | ||||||||
| 1 | Based on net income excluding the direct impact of equity markets and interest rates of $1,193,000, the percentage would have been 1.95%. |
| Note: | The NEOs in each of the last three years were: |
| • | 2013: Messrs. Guloien, Roder, Thomson, Rooney and Bisnaire |
| • | 2012: Messrs. Guloien, Roder, Thomson, Bisnaire, Rooney and Bell |
| • | 2011: Messrs. Guloien, Bell, Rooney, Thomson and Boyle |
Disclosure Under FSB Principles and Basel Commission for Banking Supervision Pillar 3 Requirements
The Report of the Management Resources and Compensation Committee on page 28 discloses the composition and mandate of the Management Resources and Compensation Committee. In addition, the decision-making process used to determine the Company-wide compensation program and the most important design characteristics of our compensation program are set out in the Executive Compensation section of the Proxy Circular.
The tables below provide aggregate information on compensation in respect of 2013 for employees whose actions have a material impact on the Company’s risk exposure (“Material Employees”). Material Employees include all executives who were members of the Company’s Executive Committee during the year.
Compensation Awarded in Respect of 20131
| Number of Material Employees | Total ($ thousands) | Fixed ($ thousands) | Variable ($ thousands) | Non-Deferred ($ thousands) | Deferred ($ thousands) | Sign-on ($ thousands) | Severance ($ thousands) | |||||||||||
12 | 46,991 | 8,338 | AIP | 15,777 | 24,115 | 22,875 | 0 | 0 | ||||||||||
| RSUs | 6,474 | |||||||||||||||||
| PSUs | 7,551 | |||||||||||||||||
| Stock Options | 8,850 | |||||||||||||||||
| Total: | 38,652 | |||||||||||||||||
| 1 | Compensation awarded in US$ was converted to Canadian dollars at an exchange rate equal to the semi-monthly Bank of Canada noon rate of exchange on the previous pay date for Fixed Compensation, $1.0981 per US$1.00 for AIP and $1.0038 per US$1.00 for RSUs, PSUs and Stock Options. |
| 2 | Represents the total of AIP and grant values of RSUs, PSUs and stock options. All Material Employees received incentive awards for 2013. |
| 3 | Represents the total grant values of RSUs, PSUs and stock options. |
| 4 | Manulife did not provide sign-on bonuses to members of the Executive Committee in 2013. |
Deferred Compensation Outstanding
| Number of Material Employees | RSUs/PSUs/DSUs1 | Stock Options2 | Total Value Of ($ thousands) | Deferred ($ thousands) | Value of ($ thousands) | Implicit Change ($ thousands) | ||||||||||||||||||||||||||
Outstanding ($ thousands) | Outstanding ($ thousands) | Outstanding ($ thousands) | Outstanding ($ thousands) | |||||||||||||||||||||||||||||
12 | 9,145 | 38,013 | 17,363 | 36,556 | 101,076 | 9,284 | 14,025 | 69,935 | ||||||||||||||||||||||||
| 1 | The values for RSUs, PSUs and DSUs are based on the closing price of Common Shares on the TSX on December 31, 2013, which was $20.96 per Common Share. |
| 2 | The value for vested and unvested unexercised in-the-money stock options is equal to the difference between the exercise price of the stock options and the closing price of Common Shares on the TSX on December 31, 2013, which was $20.96 per Common Share. |
| 3 | Represents the total value of RSUs and PSUs vested and paid out and any gains from stock options exercised in 2013. In 2013, no explicit adjustments (eg. malus, clawbacks or similar reversals or downward revaluations of awards) of deferred compensation or payouts were made. |
| 4 | The Implicit Change in Deferred Compensation Value represents the increase (or decrease) in value of the Deferred Compensation which is attributable to the change in the share price and performance vesting conditions, as applicable. |
| Manulife Financial Corporation Proxy Circular | 60 |
Table of Contents
Alignment with FSB Principles for Sound Compensation Practices
Manulife is committed to ensuring its compensation program is aligned to the FSB Principles for Sound Compensation Practices and other governance practices related to compensation. The following chart outlines each FSB Principle as well as comments demonstrating Manulife’s alignment with that Principle.
| Principle | Alignment | Comments | ||
1. The firm’s board of directors must actively oversee the compensation system’s design and operation. | Fully Aligned | • Manulife’s Management Resources and Compensation Committee is mandated to assist the Board of Directors in overseeing Manulife’s global human resources strategy, policies and programs and includes a special focus on compensation. All members of the Management Resources and Compensation Committee must be independent. • The Management Resources and Compensation Committee reviews and approves the compensation design for all executives including target compensation, performance metrics, financial targets and compensation mix. | ||
2. The firm’s board of directors must monitor and review the compensation system to ensure the system operates as intended. | Fully Aligned | • The Management Resources and Compensation Committee reviews and approves compensation outcomes for all Executive Committee members and Control Function Heads including salaries, annual incentive payouts and mid-term and long-term incentive grants and payouts. • The Management Resources and Compensation Committee regularly reviews pay for performance analyses prepared by management and reviewed by its independent advisor to ensure compensation received by Manulife’s senior executives is appropriate relative to its performance, its peers and its intended design. | ||
3. Staff engaged in financial and risk control must be independent, have appropriate authority, and be compensated in a manner that is independent of the business areas they oversee and commensurate with their key role in the firm. | Fully Aligned | • Manulife’s Chief Actuary and Chief Risk Officer are members of the Executive Committee and have direct access to the Board and its Committees. The mix of compensation for these executives differs from that of other Manulife executives to reflect the fact that their incentives are not contingent on the Company’s financial results. Their annual incentive is based solely on performance against personal objectives and they do not receive PSUs as part of their medium-term incentives. • Senior executives who primarily provide oversight have no compensation tied directly to the business units they oversee. For example, divisional oversight heads are compensated under the Corporate incentive plan. • Senior executives in divisions who primarily provide oversight have dual reporting lines to the division head and the corporate control function head. The corporate control function head has final say over goal setting, performance and compensation for these employees. | ||
4. Compensation must be adjusted for all types of risk. | Fully Aligned | • The Chief Risk Officer attends Management Resources and Compensation Committee meetings at which compensation design recommendations are reviewed and approved. • The balanced scorecard approach used in the Annual Incentive Plan contains specific risk measures within the Operating Targets and Strategic Initiatives components of the Plan. • On an individual level, results can be adjusted up or down based on overriding criteria, including the evidence of a compliance breach and signals from compliance, audit or risk. The Board has the ability to adjust total incentive compensation up or down for any significant events which would otherwise produce compensation results that are unreasonable, unrepresentative or otherwise inappropriate. The Board also has discretion to adjust PSU payouts up or down depending on the Company’s progress towards achieving its risk reduction targets. | ||
5. Compensation outcomes must be symmetric with risk outcomes. | Fully Aligned | • Manulife’s compensation philosophy is “pay for performance”. Under this philosophy, incentive compensation will be paid out above target in years where Company performance is strong. In years where Company performance is not strong, incentives will either not pay out or will be significantly reduced. • The Company Performance Score used in the Annual Incentive Plan provides a direct link between the overall size of the bonus pool and the performance of the Company and its divisions. This Company Performance Score can range from 0% to 200% of target for Annual Incentive Plan participants. • Performance goals are also established to generate symmetric compensation, such that, for a similar probability of occurrence, the upside impact on total compensation of high performance scenarios is similar or lower than the potential downside impact of low performance scenarios. • Manulife considers specific compensation risk criteria when considering changes to its compensation program. There are also many controls included in the compensation program (and described throughout this document) which provide management, the Management Resources and Compensation Committee and the Board with the discretion needed to ensure compensation outcomes are aligned with the Company’s Risk Appetite. | ||
6. Compensation payout schedules must be sensitive to the time horizon of risks. | Fully Aligned | • Manulife’s compensation program contains a mix of salary, annual, mid-term and long-term incentives. The Annual Incentive Plan is intended to reward for achievement of annual objectives while mid-term and long-term incentives provide the executive with opportunities to realize rewards over a 3 to 10 year timeframe. Manulife’s compensation plan delivers payments over the short and longer term to reflect the fact that business risks are realized over both the short and long term. • Manulife executives are subject to a clawback policy which gives the Board discretion to cancel an executive’s unvested incentive awards and/or clawback the executive’s vested and/or paid incentive awards in the event of the executive’s fraud, theft, embezzlement or serious misconduct. | ||
7. The mix of cash, equity and other forms of compensation must be consistent with risk alignment. | Fully Aligned | • Executives who have the greatest ability to influence risk have, by design, a significant proportion of total compensation delivered in the form of mid-term and long-term incentives. Executives have 50% or more of their target total direct compensation “at risk” in the form of annual, mid-term and long-term incentives. • The compensation mix is reviewed annually to ensure a compensation horizon that is appropriately balanced as well as to confirm appropriate alignment with Manulife’s business strategy and risk appetite. |
| Manulife Financial Corporation Proxy Circular | 61 |
Table of Contents
Talent and Succession Planning
The Company has a comprehensive integrated talent and succession planning process applicable to all executives. The Company’s objective is to have high performing individuals in critical roles across the Company and to ensure there is solid, talented bench strength to fill these roles in the future. Manulife believes in the importance of accelerated career development of high potential and high performing employees through meaningful and varied work experiences, cross-divisional/global mobility and formal development. Talent priorities are:
| • | The acquisition and retention of high potential talent; |
| • | The selective external hiring of seasoned, exceptional executives; |
| • | The early identification and assessment of high performers and focused development of those with potential; |
| • | Maintaining and monitoring engagement, driving high performance and retention; and |
| • | Significant differentiation of compensation for high performing and high potential employees. |
Manulife’s succession strategy is a blend of promotion from within and external sourcing for key positions, where appropriate. This strategy ensures smooth and timely transition at senior levels, minimizes disruptions caused by leadership change, maintains consistency in business strategy and practices, and at the same time allows for diverse perspectives and fresh thinking from outside the Company. Deriving the majority of succession placements from internally developed candidates assists in retaining high potential executives.
Management also focuses attention on executives below the senior executive level to ensure there is a well-trained, high-performing pool of executives with a broad range of business and functional experience and who contribute to a common culture and values for building a sustainable, high performing Company.
The Management Resources and Compensation Committee meets annually to review the depth of the talent pool and,in camera with the CEO, to review the succession capacity for critical roles in the Company. The committee also reviews the succession plan for all functional oversight roles (as defined by OSFI) and Senior Executives, including the CEO.
See the Report of the Management Resources and Compensation Committee on page 28 and the Statement of Corporate Governance Practices on page 72 for further details on the succession process for the CEO and executives.
The Company has long recognized the financial exposure associated with traditional defined benefit pension plans and, as such, has been closing these plans to new members and replacing them with capital accumulation-type retirement plans.
Capital accumulation plans include cash balance, 401(k) and defined contribution plans under which the Company’s favoured approach is to allocate a fixed percentage of each employee’s pensionable earnings taking median market practice into account. To the extent that pension benefits delivered through registered (or tax qualified) arrangements limit the benefit that would otherwise be provided to executives, the Company may sponsor supplemental arrangements, which are for the most part unfunded. Executives entitled to supplemental arrangements must comply with non-solicit and, at the most senior levels, non-compete provisions to receive full payment of their supplemental retirement benefits.
Messrs. Guloien and Rooney participate in the registered and supplemental defined benefit pension arrangements in Canada while Messrs. Roder, Thomson and Bisnaire participate in the registered and supplemental defined contribution pension arrangements in Canada. After reaching his maximum defined benefit pension on May 6, 2012, Mr. Guloien began participating in the Supplemental Defined Contribution Plan, as described in the “Summary of Defined Contribution Plans” on page 65. While in the United States from 2007 to 2009, Mr. Thomson participated in the Company’s U.S. pension arrangements, which included qualified and closed non-qualified defined benefit cash balance plans, a qualified 401(k) plan and a non-qualified defined contribution plan.
| Manulife Financial Corporation Proxy Circular | 62 |
Table of Contents
Pension Table - Defined Benefit Plans
The table below shows the following information for each NEO participating in the Company’s defined benefit pension arrangements:
| • | Years of credited service as at December 31, 2013 and as at the normal retirement age of 65; |
| • | The estimated annual benefit accrued, or earned, for service up to December 31, 2013 and up to the normal retirement age of 65; and |
| • | A reconciliation of the defined benefit obligation from December 31, 2012 to December 31, 2013. |
| Name | Number of Years of Credited Service | Annual Benefits Payable1 | Opening Present Value of Defined Benefit Obligation2 | Compensatory Change | Non- Compensatory | Closing Present Value of Defined Benefit Obligation6 | ||||||||||||||||||||||||||||||
| December 31, 2013 | Age 65
| December 31, 2013 | Age 65
| Service Cost3 | Other4
| |||||||||||||||||||||||||||||||
Donald Guloien7 | 32.8 | 35.0 | $1,200,000 | $1,200,000 | $14,389,600 | $0 | $0 | $11,300 | $14,400,900 | |||||||||||||||||||||||||||
Warren Thomson8 | 3.0 | 3.0 | $10,600 | $10,600 | $95,500 | $0 | $0 | $9,600 | $105,100 | |||||||||||||||||||||||||||
Paul Rooney9 | 27.4 | 35.0 | $627,400 | $800,000 | $6,272,100 | $241,600 | $50,100 | $114,100 | $6,677,900 | |||||||||||||||||||||||||||
| 1 | The annual benefits shown are based on current pensionable earnings and credited service to the date or age stated, are subject to the limits discussed below where applicable, and are payable from age 65 in the normal form, as described below in the “Summary of Defined Benefit Plans” on page 64. |
| 2 | The opening present value is the value of the projected pension earned for service to December 31, 2012. The values have been determined using the same actuarial assumptions used for determining the defined benefit pension obligations, as disclosed in Note 17 of the Company’s 2012 consolidated financial statements. |
| 3 | The service cost shown under the Compensatory Change column is the value of the projected pension earned for service during 2013. The values have been determined using the same actuarial assumptions used for determining the pension plan obligations, as disclosed in Note 17 of the Company’s 2013 consolidated financial statements. |
| 4 | Other values shown, if any, under the Compensatory Change column would include the impact of any plan amendments and of any differences between actual and assumed compensation. |
| 5 | The Non-Compensatory Change column includes the impact of amounts attributable to interest accruing on the opening defined benefit obligation, changes in the actuarial assumptions and methodologies, other experience gains and losses and, in the case of Mr. Thomson, any amounts due to currency fluctuations. |
| 6 | The closing present value is the value of the projected pension earned for service to December 31, 2013. The values have been determined using the same actuarial assumptions used for determining the defined benefit pension obligations, as disclosed in Note 17 of the Company’s 2013 consolidated financial statements. |
| 7 | Mr. Guloien’s annual benefit accrued to December 31, 2013, and to age 65, reflects the enhancement made to his grandfathered benefit upon his appointment as President and CEO on May 7, 2009, as discussed below in the “Summary of Defined Benefit Plans” on page 64. Mr. Guloien accrued the maximum annual defined benefit pension as of May 6, 2012. |
| 8 | Mr. Thomson’s annual benefit accrued to December 31, 2013, and to age 65, is the estimated benefit payable from age 65 that could be provided under the qualified and the closed non-qualified cash balance plans for U.S.-based employees. |
| 9 | Mr. Rooney’s annual benefit accrued to December 31, 2013, and to age 65, is capped by the maximum annual pension accrual for Senior Executive Vice Presidents, as discussed below in the “Summary of Defined Benefit Plans” on page 64. Until Mr. Rooney reaches his 35 year credited service maximum in 2021, he will continue to earn additional pension at the capped accrual amount of $22,857 for each year of service, at which point he will have accrued his maximum annual pension of $800,000. The closing defined benefit obligation reported in last year’s proxy circular for Mr. Rooney ($5,842,000) was understated by $430,100 due to the incorrect application of the early retirement factors. |
Notes:
| • | The values shown above for Messrs. Guloien and Rooney include pension benefits provided by the Canadian Staff Pension Plan and their respective individual supplemental retirement agreements and reflect the limits discussed below in the “Summary of Defined Benefit Plans” on page 64. Details regarding entitlements for Mr. Guloien under the Supplemental Defined Contribution Plan are set out in the “Summary of Defined Contribution Plans” section that follows. |
| • | For Mr. Thomson, the value includes pension benefits provided by the John Hancock Financial Services, Inc. Pension Plan, and by the Manulife Financial U.S. Supplemental Cash Balance Plan for service up to December 31, 2007, and excludes any benefits from the U.S. defined contribution plans. Details regarding entitlements for Mr. Thomson under the latter plans are set out in the “Summary of Defined Contribution Plans” section that follows. |
| • | Benefits under the U.S. cash balance plans are determined and paid in U.S. dollars. The amounts noted in the table above have been converted using exchange rates of $0.9949 per US$1.00 as at December 31, 2012 and $1.0636 per US$1.00 as at December 31, 2013. Amounts other than year end balances have been converted using an average 2013 exchange rate of $1.0298 per US$1.00. These exchange rates are the same as those used in the Company’s 2013 consolidated financial statements. |
| • | All members are currently vested in their pension entitlements earned to December 31, 2013. |
| • | The amounts above make no allowance for the different tax treatment of the portion of pension not paid from the registered or qualified pension plans. |
| • | All amounts shown above are estimated based on assumptions and represent contractual entitlements that may change over time. |
| • | The methods and assumptions used to determine estimated amounts will not be identical to the methods and assumptions used by other issuers and, as a result, the figures may not be directly comparable across issuers. |
Pension Table - Defined Contribution Plans
The table below shows a reconciliation of the account balances from December 31, 2012 to December 31, 2013 for each NEO participating in the Company’s defined contribution pension arrangements.
| Name | | Opening Accumulated Value | | Compensatory Change | Non-Compensatory Change3 | Closing Accumulated Value | ||||||||||||||
| Service Cost1 | Other2 | |||||||||||||||||||
Donald Guloien | $260,300 | $568,800 | $0 | $149,300 | $978,400 | |||||||||||||||
Steve Roder | $52,500 | $124,000 | $0 | $32,400 | $208,900 | |||||||||||||||
Warren Thomson4 | $1,314,300 | $189,100 | $0 | $119,300 | $1,622,700 | |||||||||||||||
Jean-Paul Bisnaire | $1,140,000 | $132,500 | $0 | $193,500 | $1,466,000 | |||||||||||||||
| 1 | The service cost shown under the Compensatory Change column is the aggregate of those amounts contributed, and those amounts notionally credited, by the Company to each NEO’s account under the plans during 2013. In the case of Mr. Guloien, the amount reflects only the notional credits granted by the Company under the Supplemental Defined Contribution Plan for his service in 2013. |
| 2 | Other values shown, if any, under the Compensatory Change column reflect the impact of any plan amendments and of above-market or preferential notional investment income credited on account balances. There are no such above-market or preferential notional investment credits provided under the Company’s defined contribution pension plans. |
| 3 | The Non-Compensatory Change amount includes any contributions made to the plans by the NEOs, all investment income credited during the year on the account balances and any amounts due to currency fluctuations. |
| 4 | Benefits for Mr. Thomson under the qualified 401(k) plan and the non-qualified defined contribution plan are determined and paid in U.S. dollars. The amounts shown above include amounts that were accrued under these U.S. plans and converted using exchange rates described in the Notes to the Defined Benefit Pension Plans table above. |
| Manulife Financial Corporation Proxy Circular | 63 |
Table of Contents
Summary of Defined Benefit Plans
Canada
Canadian domiciled executives promoted or hired prior to January 1, 1999 continue to participate in the defined benefit component of the Canadian Staff Pension Plan. The Company also entered into individual supplemental retirement agreements with the executives to provide unfunded supplemental pension benefits that are not registered for tax purposes. Currently, there are only six remaining executives (including Messrs. Guloien and Rooney) who continue to be covered under these agreements.
These pensions are based on credited service and average pensionable earnings at retirement. Pensionable earnings are calculated as the highest average of base salary plus annual incentive (including the amount elected to be taken in the form of DSUs) earned over any 36 consecutive months. The pension benefit is determined by taking:
| • | years of credited service (up to 35) multiplied by |
| • | the sum of: |
| - | 1.3% of pensionable earnings up to the average of the last three years maximum pensionable earnings limits under the Canada/Quebec Pension Plans (“final average YMPE”); and |
| - | 2% of the excess of pensionable earnings over the final average YMPE ($49,833 for 2013). |
This pension is determined without regard to the maximum pension limit for registered pension plans under theIncome Tax Act (Canada), but includes the pension payable from the Canadian Staff Pension Plan.
On retirement prior to age 65, the pension is payable in full without reduction if the participant is at least age 50 and the sum of their age plus service totals at least 90. If the participant has less than 90 points but is age 50 or over with 10 or more years of service, the pension is reduced 0.5% per month that retirement is before age 55 plus 0.25% for each month after age 55 that retirement is before age 60, or the participant’s 90 point date if later. Otherwise, pensions are reduced on an actuarial equivalent basis.
The normal form of pension is payable for the life of the executive, with a minimum guarantee of 120 monthly payments. Payment options of equivalent value are also available. Without a written waiver from the spouse, a married member must take a reduced pension of equivalent value that guarantees 60 months of payment and, after the member’s death, continues to provide at least two thirds of the member’s pension to the member’s spouse for his or her lifetime. With the waiver, a married member may elect another payment option with less than two thirds of the member’s pension continuing to the surviving spouse.
A participant is required to contribute 2% of pensionable earnings up to the current year’s YMPE and 4% of earnings in excess, up to an annual maximum contribution of $1,000.
The annual pension payable upon retirement under the normal form of the defined benefit plan is capped at a dollar amount, to be accrued uniformly over a maximum of 35 years of service, as outlined in the table below:
Job Grade at Retirement | Maximum Annual Pension (for 35 years of Credited Service) | |
Senior Executive Vice President | $800,000 | |
Executive Vice President | $600,000 |
Pensions earned up to December 31, 2006 which exceed the caps were grandfathered so that the actual pension payable at retirement would not be less than the pension earned to December 31, 2006, reduced for early commencement, as applicable.
Effective with Mr. Guloien’s appointment as President and CEO on May 7, 2009, the cap on his annual pension was increased from $1,039,200 to $1,200,000, over the period from May 7, 2009 to May 6, 2012. The amount of pension payable to Mr. Guloien will be less than $1,200,000 due to the spousal pension requirements. For service on and after May 7, 2012, Mr. Guloien participates in the Supplemental Defined Contribution Plan.
Under the individual supplemental retirement agreements, all executives are bound by a non-compete provision during the24-month period following their date of termination or retirement. Should an executive breach this provision, the pension due under the agreement is reduced by one-third.
| Manulife Financial Corporation Proxy Circular | 64 |
Table of Contents
U.S.
Mr. Thomson maintains the pension benefits accrued through membership in the following retirement plans from 2007 to 2009 inclusive while employed in the United States:
| • | The John Hancock Financial Services, Inc. Pension Plan, a qualified defined benefit cash balance plan; |
| • | The Manulife Financial U.S. Supplemental Cash Balance Plan, a non-qualified defined benefit cash balance plan under which benefit accruals ceased as of December 31, 2007; |
| • | The John Hancock Supplemental Retirement Plan, a non-qualified defined contribution plan that commenced on January 1, 2008; and |
| • | The Investment-Incentive Plan for John Hancock Employees, a qualified 401(k) plan. |
This section discusses the provisions of the qualified cash balance plan and the closed non-qualified cash balance plan. The terms of the non-qualified defined contribution plan and the 401(k) plan are discussed below in the Summary of Defined Contribution Plans section.
All employees are eligible for and join the John Hancock Financial Services, Inc. Pension Plan upon commencement of employment. Under the plan, a notional cash balance account is established for each participant. The account receives Company contribution credits equal to 4% of eligible compensation up to the Social Security Wage Base, plus 8% of eligible compensation over the Social Security Wage Base up to the yearly maximum amount of eligible compensation (US$255,000 for 2013). Eligible compensation is calculated as base salary plus annual incentive received. Participants do not contribute to the plan. The account earns interest credits based on the average annual yield of 10-year Treasury Constant Maturities in effect on each business day during the 12-month period ending on September 30 of the preceding calendar year. Benefits payable at the normal retirement age of 65, or at any retirement age, are determined by the value of the participant’s cash balance account on the date their pension begins. The normal form of pension payment under the plan is a life annuity, with various other choices available, including a lump sum payment. The pension benefit is not subject to any deduction or offset for U.S. Social Security.
The Manulife Financial U.S. Supplemental Cash Balance Plan is a non-contributory, non-qualified and unfunded defined benefit cash balance plan. Participants stopped receiving Company contribution credits as of December 31, 2007. Interest continues to be credited under this plan based on the yield of one-year Treasury Constant Maturities in effect on the last business day of each month in the12-month period ending on November 30 of the preceding calendar year plus 0.25%, subject to a minimum interest credit of 5.25% compounded semi-annually. The normal form of payment under the plan is a modified lump sum. Benefits are paid over 18 months beginning the seventh month after the member leaves the Company.
Under this non-qualified cash balance plan, all executives are bound by a number of post-employment conditions, including a non-solicit provision that applies during the 24-month period following the date of termination or retirement. Further, executives in a Senior Vice President or higher level position are also bound by a non-compete provision which applies during the 12-month period following termination or retirement for Senior Vice Presidents, during the 18-month period following termination or retirement for Executive Vice Presidents and during the 24-month period following termination or retirement for Senior Executive Vice Presidents. Should an executive breach any of the post-employment conditions, the full amount of the pension benefits due under the non-qualified cash balance plan may be forfeited.
Summary of Defined Contribution Plans
Canada
Canadian domiciled executives hired after January 1, 1999 participate in the defined contribution component of the Canadian Staff Pension Plan. These executives, as well as those promoted to executive status after January 1, 1999, also participate in the Supplemental Defined Contribution Plan.
Under the defined contribution component of the Canadian Staff Pension Plan, participants and the Company both contribute a percentage of pensionable earnings; participants contribute 2% while the Company contributes 3%. Additional optional contributions ranging from 0.5% to 5% of pensionable earnings may be made by participants in which case, after the first year of employment, the Company makes a 50% matching contribution. Pensionable earnings for officers include base salary and annual incentive and are subject to a limit of $194,160 for 2013. The limit on pensionable earnings is indexed annually to the percentage increase in the defined contribution limit under theIncome Tax Act ($24,270 in 2013). The investment of the contributions is participant directed with a broad array of investment options provided. Vesting of Company contributions is immediate and, at retirement, the accumulated value of the account may either be transferred to a locked-in retirement vehicle or used to purchase a life annuity.
The Supplemental Defined Contribution Plan is a non-contributory and unfunded plan which is not registered for tax purposes. The plan provides benefits on pensionable earnings above the pensionable earnings limit under the Canadian Staff Pension Plan. Pensionable earnings include base salary and annual incentive, including the amount elected to be taken in the form of DSUs. A credit equal to 10% of pensionable earnings above the annual earnings limit is granted by the Company each year and allocated to a notional account. Investment income is notionally credited to the account based on the investment performance of a limited number of investment options, as selected by the participant. Vesting of the Company credit allocation is
| Manulife Financial Corporation Proxy Circular | 65 |
Table of Contents
immediate. At retirement, the accumulated value of the notional account may be taken as instalment payments over a period of years or, with Company consent, may be withdrawn in a single lump sum. Effective May 7, 2012, Mr. Guloien began participating in this plan on the same basis, and subject to the same terms and conditions, as other eligible executives except that the Company credits allocated to Mr. Guloien’s notional account are 15% of eligible earnings above the annual pensionable earnings limit.
Under the Supplemental Defined Contribution Plan, all executives are bound by a non-solicit provision that applies during the24-month period following the date of termination or retirement. Further, executives, who were hired into or promoted to a Senior Vice President or higher level position on or after May 1, 2007, are also bound by a non-compete provision which applies during the 12-month period following termination or retirement for Senior Vice Presidents, during the 18 month period following termination or retirement for Executive Vice Presidents and during the 24 month period following termination or retirement for Senior Executive Vice Presidents and above, but only in respect of pension benefits earned after the date of hire or promotion, as applicable. Should an executive breach either of these provisions, the full amount of the pension benefits due under this supplemental plan and subject to these provisions may be forfeited.
U.S.
The Investment-Incentive Plan for John Hancock Employees is a qualified 401(k) plan that is available to employees on a voluntary basis. Employees may elect to contribute a percentage of their eligible salary up to a maximum of 50% of salary, subject to IRS prescribed limits. The yearly maximum amount of salary under the 401(k) plan in 2013 was US$255,000. The Company matches the participant’s contribution at 100%, to a maximum match of 4% of their eligible salary. Contributions are deposited into the participant’s account and are invested based on the investment elections made by the participant. The Company portion of a participant’s account balance vests after three years of service with the Company. A participant’s account may be distributed when the participant leaves the Company or becomes permanently disabled.
The John Hancock Supplemental Retirement Plan is a non-contributory, non-qualified defined contribution plan that came into effect as of January 1, 2008 and replaced the Manulife Financial U.S. Supplemental Cash Balance Plan, the prior non-qualified plan. Notional accounts have been created for each participant and are credited with Company allocations equal to 8% of eligible compensation in excess of the maximum eligible compensation permitted under qualified plans (US$255,000 for 2013). Eligible compensation is calculated as base salary and annual incentive, including any deferred compensation such as annual incentive elected to be taken in the form of DSUs. The notional investment returns credited to each account are reflective of the investment elections made by each participant. The normal form of payment under the plan is a modified lump sum, the same as under the prior non-qualified cash balance plan. Benefits are paid over 18 months beginning the seventh month after the member leaves the Company.
Under the non-qualified defined contribution plan, all executives are bound by a number of post-employment conditions, including a non-solicit provision that applies during the 24-month period following the date of termination or retirement. Further, executives in a Senior Vice President or higher level position are also bound by a non-compete provision which applies during the 12-month period following termination or retirement for Senior Vice Presidents, during the 18 month period following termination or retirement for Executive Vice Presidents and during the 24 month period following termination or retirement for Senior Executive Vice Presidents. Should an executive breach any of the post-employment conditions, the full amount of the pension benefits due under the non-qualified defined contribution plan may be forfeited.
| Manulife Financial Corporation Proxy Circular | 66 |
Table of Contents
The following table summarizes the incremental payments that would be provided to each NEO at, following, or in connection with one of the termination scenarios below. The actual amount an NEO would receive on a termination of employment can only be determined at that time since it will depend on a number of variables, such as the NEO’s age and years of service and the Common Share price. This information below is calculated as at December 31, 2013 for all NEOs.
| Name | Type of Payment | Resignation1 | Termination Cause2 | Termination Cause3 | Retirement (Early or Normal)1 | Change in Control4 | ||||||||||||||||
| ($) | ($) | ($) | ($) | ($) | ||||||||||||||||||
Donald Guloien | Total Severance Additional RSU, PSU & Stock Option Vesting5 Total Incremental Payment |
| 0 0 0 |
|
| 0 0 0 |
|
| 7,599,440 3,566,569 11,166,009 |
|
| 0 15,330,551 15,330,551 |
|
| 9,536,455 21,974,178 31,510,633 |
| ||||||
| Incremental Pension Amount | 0 | 0 | 0 | 0 | 0 | |||||||||||||||||
Steve Roder | Total Severance Additional RSU, PSU & Stock Option Vesting5 Total Incremental Payment |
| 0 0 0 |
|
| 0 0 0 |
|
| 2,427,941 0 2,427,941 |
|
| n/a n/a n/a |
|
| n/a n/a n/a |
| ||||||
| Incremental Pension Amount | 0 | 0 | 0 | n/a | n/a | |||||||||||||||||
Warren Thomson | Total Severance Additional RSU, PSU & Stock Option Vesting5 Total Incremental Payment |
| 0 0 0 |
|
| 0 0 0 |
|
| - 0 - |
|
| 0 1,290,917 1,290,917 |
|
| n/a n/a n/a |
| ||||||
| Incremental Pension Amount | 0 | 0 | 0 | 0 | n/a | |||||||||||||||||
Paul Rooney | Total Severance Additional RSU, PSU & Stock Option Vesting5 Total Incremental Payment |
| 0 0 0 |
|
| 0 0 0 |
|
| 3,237,255 0 3,237,255 |
|
| n/a n/a n/a |
|
| n/a n/a n/a |
| ||||||
| Incremental Pension Amount | 0 | 0 | 0 | n/a | n/a | |||||||||||||||||
Jean-Paul Bisnaire | Total Severance Additional RSU, PSU & Stock Option Vesting5 Total Incremental Payment |
| 0 0 0 |
|
| 0 0 0 |
|
| 2,409,847 7,183,289 9,593,136 |
|
| n/a n/a n/a |
|
| 2,409,847 7,183,289 9,593,136 |
| ||||||
| Incremental Pension Amount6 | 0 | 0 | 325,439 | n/a | 325,439 | |||||||||||||||||
| 1 | Upon resignation or retirement, no severance is paid. For purposes of the treatment of equity-based awards, Mr. Guloien is eligible for normal retirement, Mr. Thomson is eligible for early retirement and Messrs. Roder, Rooney and Bisnaire are not eligible for early or normal retirement. |
| 2 | Upon a termination with cause, no severance is paid, employment terminates immediately and PSUs, RSUs, stock options and supplemental pension are forfeited. |
| 3 | The employment agreement for Mr. Thomson does not stipulate his severance entitlement. See Termination Without Cause section below for severance entitlements for Messrs. Guloien, Roder, Rooney and Bisnaire. For all NEOs, equity-based awards will be treated in accordance with the applicable awards and plans, unless the NEO has an employment agreement and such agreement indicates otherwise. For more information, see “Medium-Term and Long-Term Incentives” on page 37. |
| 4 | See “Change in Control Agreements” below. Messrs. Roder, Thomson and Rooney do not have change in control agreements. |
| 5 | Additional amount is due to additional vesting in plans. Any vesting that has occurred as part of normal employment (exercised or not) is not reflected here. The value is based on the closing price of Common Shares on the TSX on December 31, 2013, which was $20.96 per Common Share. |
| 6 | The pension amount shown is the additional amount to which Mr. Bisnaire would have been entitled had his employment been terminated for the noted reason as of December 31, 2013. The amount is incremental to his pension entitlement upon resignation and is due to the 2 additional years of Company pension contributions/credits under the terms of his employment agreement or his Change in Control Agreement, as discussed below. |
Termination without Cause
Upon a termination without cause, Mr. Guloien’s employment agreement entitles him to 2 times annual salary, 2 times target annual incentive, 2 times annual Executive Flexible Spending Account allowance and continuation of group insurance benefits coverage (excluding life, short-term and long-term disability insurance coverage) for 2 years. Effective March 2014, Mr. Guloien’s employment agreement was amended to provide that (i) upon termination of employment for any reason other than cause, one half of the PSUs granted within one year prior to his termination or retirement will not be forfeited and will continue to vest with payment being made on the scheduled payout date, subject to the PSU performance conditions; and (ii) for all remaining equity-based awards, termination of Mr. Guloien’s employment without cause will be deemed to be a “normal retirement” and such equity-based awards will vest and be exercisable in accordance with the terms of the applicable plan and grant agreement. These entitlements are conditional on Mr. Guloien signing a full and final release and remaining bound by the confidential information (indefinite duration), intellectual property (indefinite duration), non-solicitation (2 year duration), non-competition (1 year duration) and non-disparagement covenants (indefinite duration) in his employment agreement, which if any/all are breached would entitle Manulife, in addition to any other rights and remedies it may have at law or in equity, to seek to have an injunction issued by the court.
Upon a termination without cause, Mr. Roder’s employment agreement entitles him to 18 months of notice or compensation in lieu of notice, which includes base salary at the time of termination and a pro-rated Annual Incentive Plan payment calculated at target. Mr. Roder is also entitled to 18 months of continued participation in the group benefits plan (excluding life, short-term and long-term disability insurance coverage). If Mr. Roder becomes re-employed in a comparable position during the severance period, he will no longer be eligible to participate in the group benefits plans, his severance payments will immediately cease and he will be entitled to a lump sum payment of 50% of his remaining payments. RSUs, PSUs, DSUs and/or Stock Options shall cease to vest (and, in the case of Stock Options, be exercisable) in accordance with the terms and conditions of the relevant plan documents and award agreements. These entitlements are conditional on Mr. Roder signing a full and final release and remaining bound by the confidential information (indefinite duration), intellectual property (indefinite duration), non-solicitation (2 year duration), non-competition (2 year duration) and non-disparagement covenants
| Manulife Financial Corporation Proxy Circular | 67 |
Table of Contents
(2 year duration) in his employment agreement, which if any/all are breached would entitle Manulife, in addition to any other rights and remedies it may have at law or in equity, to seek to have an injunction issued by the court.
Upon a termination without cause, Mr. Rooney’s employment agreement entitles him to 24 months of compensation (which will include base salary and target Annual Incentive Plan only). Manulife has the sole discretion to provide this compensation as a single lump sum payment or a series of payments over time or a combination thereof. If Manulife decides to provide all or any of the compensation as a series of payments over time and during the 24 months following termination Mr. Rooney secures new employment or self-employment, the payments will stop and he will be entitled to receive a final lump sum payment equal to 50% of the payments that remain. RSUs, PSUs, DSUs and/or Stock Options will cease to vest (and, in the case of Stock Options, cease to be exercisable) in accordance with the terms and conditions of the relevant plan documents and award agreements. These entitlements are conditional on Mr. Rooney signing a full and final release and remaining bound by the confidential information (indefinite duration), intellectual property (indefinite duration), non-solicitation (2 year duration), non-competition (2 year duration) and non-disparagement covenants (2 year duration) in his employment agreement, which if any/all are breached would entitle Manulife, in addition to any other rights and remedies it may have at law or in equity, to seek to have an injunction issued by the court.
Mr. Bisnaire’s employment agreement states that upon a termination without cause, his entitlements shall be determined in accordance with severance compensation provisions of his Change in Control Agreement (as described below under Change in Control).
Change in Control
Mr. Guloien and Mr. Bisnaire have change in control agreements. These agreements protect the executives from the loss of employment benefits in connection with a change in control of the Company, thereby allowing the executives to focus on the business at that time.
Under the agreements, “Change in Control” can generally be described to include any one of the following events:
| • | The incumbent Directors cease for any reason to constitute at least a majority of the Board. |
| • | Any party becomes a beneficial owner holding directly or indirectly 20% of the Company’s voting shares (for Mr. Guloien the percentage is 35%). |
| • | The Company’s shareholders approve a merger, amalgamation, consolidation, statutory share exchange or a similar transaction requiring the approval of the Company’s shareholders, unless immediately following the transaction the Company’s shareholders retain majority voting control, no person would beneficially own 20% or more of the Company’s voting shares (for Mr. Guloien, the relevant percentage is 35%), and the incumbent Directors constitute a majority of the board. |
| • | The Company’s shareholders approve the complete liquidation or dissolution of the Company or the sale of the Company’s assets, unless immediately following the transaction pre-existing beneficial owners retain majority voting control, no person would beneficially own 20% or more of the Company voting shares (for Mr. Guloien, the relevant percentage is 35%) and the incumbent Directors constitute a majority of the board. |
| • | Management of the Company is transferred to a non-affiliated party. |
Under the agreements, “Good Reason” can generally be described to include any one of the following events during the protection period specified in the agreements:
| • | The Company diminishes the executive’s position, authority or scope or scale of duties or responsibilities. |
| • | The Company requires the executive to be based at a location more than 40 km from his current work location or to travel to a significantly greater extent. |
| • | The Company reduces the executive’s annual base salary or fails to provide salary adjustments that are comparable to the adjustments provided to other executive employees of the Company. |
| • | The Company reduces the executive’s annual incentive opportunity. |
| • | The Company fails to either continue or provide an alternative to the Company’s welfare benefits plans or programs in respect of benefits, perquisites and expense reimbursements. |
| • | Any failure to maintain reasonable and adequate indemnification in respect of the executive’s services as an officer. |
Mr. Guloien entered into a change in control agreement when he was appointed President and CEO in May 2009. Under Mr. Guloien’s agreement, upon a Change in Control and an involuntary or constructive termination of his employment without cause within a specified protection period starting 90 days before and ending 24 months after a Change in Control, he is entitled to the following: payment of 3 times annual salary, payment of 3 times his average annual incentive awarded in the prior 3 years, full vesting and payment of outstanding awards, including those granted within the past year, continued group insurance benefit coverage (excluding life and disability insurance coverage) for up to 3 years, 2 years eligibility for relocation benefits under the Company’s relocation policy, extension of the stock option exercise period until the later of 1 year after the date of termination and the date specified in the applicable award (but in no event later than the option expiry date). Mr. Guloien’s change in control agreement also provides that if following a Change in Control the successor employer fails to assume or honour Mr. Guloien’s existing medium-term and long-term incentive plans and/or provide equivalent substitute plans, he is entitled to acceleration and vesting of all existing awards. As of March 2014, Mr. Guloien agreed to amend his change in control agreement to reduce his entitlement from 3 to 2 times annual salary and average annual incentive awarded in the prior 3 years with other provisions unchanged.
| Manulife Financial Corporation Proxy Circular | 68 |
Table of Contents
Mr. Bisnaire entered into a change in control agreement when he was hired in May 2004. Under Mr. Bisnaire’s agreement, upon a Change in Control and an involuntary or constructive termination of his employment without cause within a specified protection period starting 90 days before and ending 24 months after a Change in Control, he is entitled to the following: payment of 2 times annual salary, payment of 2 times his average annual incentive awarded in the 3 prior years, full vesting and payment of outstanding awards (except that Mr. Bisnaire can only exercise stock options for 1 year from the date of change in control), up to 2 additional years of Company pension contributions/credits, up to 2 years of continued group insurance coverage (excluding life and disability insurance coverage), 2 years eligibility for relocation benefits under the Company’s relocation policy, waiver of any non-competition provisions under any agreement between Mr. Bisnaire and the Company and, until the earlier of the end of the protection period and the date Mr. Bisnaire obtains employment, outplacement services and a rental office away from the Company’s premises, including secretarial support and telephone and photocopy allowance.
RSUs, PSUs, Stock Options and DSUs Upon Change of Employment Status
The following chart summarizes the treatment of RSUs, PSUs, stock options and DSUs upon retirement, death and resignation or termination without cause:
| Award | Normal Retirement1 | Early Retirement2 | Death | Resignation or Involuntary | ||||
RSUs/PSUs | RSUs/PSUs vest and full payment is made on the scheduled payout date, subject to any performance conditions. | Number of RSUs/PSUs is pro-rated and the pro-rated payment is made on the scheduled payout date, subject to any performance conditions. | RSUs/PSUs vest and are fully payable as of the date of death. Performance conditions are waived. | RSUs/PSUs are forfeited. | ||||
Stock Options | Unvested options continue to vest until the third anniversary of normal retirement. Vested options can generally be exercised until the third anniversary of normal retirement. | Unvested options terminate. Vested options can be exercised until the third anniversary of early retirement. | Unvested options vest and vested options can be exercised within one year of the date of death. | Unvested options are forfeited upon resignation and continue to vest for 90 days upon termination without cause. Vested options may be exercised within 90 days of the date of a resignation or termination without cause.4 | ||||
DSUs | Can be redeemed by December 15th of the following year for executives in Canada and on the date designated on the executive’s deferral election form for executives in the United States. | |||||||
| 1 | Normal Retirement is met for awards granted in 2008 and beyond at age 65, age 60 plus 10 years continuous service or age plus continuous service equals 75 with a minimum age 55. |
| 2 | Early Retirement is met for awards granted in 2008 and beyond at age 55 plus 10 years continuous service. |
| 3 | The treatment described in this column may be subject to the terms of an NEO’s employment agreement, as set out in the “Termination and Change in Control Benefits” section on page 67. |
| 4 | If during the severance period that follows a termination without cause an executive would reach normal or early retirement, vested options may be exercised until the end of the severance period. |
| Notes: |
| • | Stock options, PSUs and RSUs are forfeited if an executive’s employment terminates within one year of the grant date. |
| • | Stock option, PSU and RSU award agreements contain post-employment conditions which, if breached, may result in forfeiture of unvested awards. For NEOs, two-year non-competition and two-year non-solicitation conditions apply. |
| • | Beginning in 2012, stock option, PSU and RSU award agreements contain a clawback provision, which allows the Board to recoup or cancel incentive compensation in the event of fraud or serious misconduct by an executive. |
| • | Stock options, PSUs and RSUs are forfeited on a termination with cause. |
| • | Stock options, PSUs, RSUs and DSUs are transferable upon death to a beneficiary or an estate. |
| • | In no event can stock options vest or be exercised following the expiration of the ten-year option term. |
| • | In 2012, a temporary policy was implemented for terminations without cause under the Organizational Design project as follows: |
| • | If an executive would reach normal or early retirement during the severance period, 2011 and 2012 RSUs and PSUs are paid in full on the scheduled payout date, subject to any performance conditions; options continue to vest during the severance period and vested options may be exercised within three years of the date of termination; and |
| • | If an executive would not reach normal or early retirement during the severance period, 2011 and 2012 RSUs and PSUs are pro-rated to the date of termination and the pro-rated payment is made on the scheduled payout date, subject to any performance conditions; options continue to vest during the severance period and vested options may be exercised within 90 days of the end of the severance period. |
Securities Authorized for Issuance Under Equity Compensation Plans |
The shareholders of the Company have approved all equity compensation plans instituted by the Company under which Common Shares may be issued (“Equity Plans”). A description of the material features of each Equity Plan can be found in the sections “Executive Compensation” and “Director Compensation”. The following table sets out information about the Equity Plans of the Company as of December 31, 2013.
Number of securities to be issued upon exercise of outstanding options, warrants and rights | Weighted average of exercise price of outstanding options, warrants and rights | Number of securities remaining available for future issuance under Equity Plans | ||||
| (#) | ($) | (#) | ||||
| Equity compensation plans approved by security holders | 34,613,791 | $21.05 | 20,268,7691 |
| 1 | Includes 418,000 common shares reserved for issuance under the Director Equity Incentive Plan as at December 31, 2013. This plan was terminated effective February 13, 2014 and, as of the date of this Proxy Circular, no securities are reserved for issuance under this plan. See the section titled “Director Compensation” for more information. |
| Manulife Financial Corporation Proxy Circular | 69 |
Table of Contents
As of February 28, 2014 the aggregate indebtedness to the Company or any of its subsidiaries of all officers, Directors and employees and former officers, Directors and employees of the Company or its subsidiaries, excluding routine indebtedness under applicable Canadian securities laws, amounted to $922,173. As of February 28, 2014, no Director had any indebtedness to the Company or any of its subsidiaries. In addition, as of February 28, 2014, no members of the Executive Committee had any indebtedness to the Company or any of its subsidiaries, other than routine indebtedness.
The Company has adopted related party transaction procedures to ensure that any loans to Directors and senior officers, as defined under the Act, are in compliance with the provisions of SOX and the Act. Under those procedures, the Company and its subsidiaries (except Manulife Bank) will not make loans to Directors or senior officers. Manulife Bank may make loans to Directors or senior officers provided that the loan is on market terms or part of a benefit or compensation program available to all employees and does not give preference to Directors or senior officers.
Directors’ and Officers’ Insurance
The Company maintains a Directors’ and Officers’ Liability Insurance policy with a policy limit of US$300 million. The current policy expires March 31, 2014. This policy is renewed annually.
The policy provides protection to directors and officers against liability incurred by them in their capacities as directors and officers of the Company and its subsidiaries. The policy also provides protection to the Company for claims made against directors and officers. The Company has contractually indemnified directors and officers, as is required or permitted under applicable statutory or Company by-law provisions.
Financial information of the Company is provided in the Company’s consolidated annual financial statements for the year ended December 31, 2013 and Management’s Discussion and Analysis of the Company’s financial condition and results of operations for 2013.
The Company’s Annual Information Form includes additional information on the Audit Committee in the section entitled “Audit Committee”, including the Audit Committee’s charter, composition and the relevant education and experience of its members. To obtain a copy of the Company’s latest Annual Information Form, the audited annual financial statements, Management’s Discussion and Analysis of the Company’s financial condition and results of operations for 2013, any interim financial reports filed after the filing of the most recent annual financial statements, this Proxy Circular, or other information on the Company, please visit the Company’s profile on www.sedar.com or our website at www.manulife.com or send your request for a free copy of any such document to:
Shareholder Services | ||
| Manulife Financial Corporation | ||
| 200 Bloor Street East, Toronto, ON M4W 1E5 | ||
Telephone: | 1-800-795-9767 | |
Fax: | 416-926-3503 | |
E-Mail: | shareholder_services@manulife.com | |
The Company’s 2013 Annual Report is available on our website at www.manulife.com. You may also request a printed copy of the 2013 Annual Report which will be sent to you free of charge. Please include your name, full mailing address including country and postal code and quote the
Form number IR3925E for an English copy, or IR3925F for a French copy. Send your request by:
E-mail: | Manulife@datagroup.ca | |
Fax: | North America Toll-free Fax: 1- 877-886-8854 | |
Phone: | 905-494-4114 | |
| North America Toll-free: 1-855-219-4029 | ||
Mail: | DATA Group of Companies | |
| Attn: Manulife CSRs | ||
| 9195 Torbram Road | ||
| Brampton, ON | ||
| Canada L6S 6H2 | ||
Performance and Non-GAAP Measures
We use a number of non-GAAP financial measures to measure overall performance and to assess each of our businesses. A financial measure is considered a non-GAAP measure for Canadian securities law purposes if it is presented other than in accordance with generally accepted accounting principles used for the Company’s audited historical financial statements.
Non-GAAP measures referenced in this Proxy Circular include: core earnings, net income excluding the direct impact of equity markets and interest rates; sales; new business embedded value; and funds under management. Non-GAAP financial measures are not defined terms under GAAP and, therefore, are unlikely to be comparable to similar terms used by other issuers. Therefore, they should not be considered in isolation or as a substitute for any other financial information prepared in accordance with GAAP.
For further information regarding the non-GAAP measures referred to above, see “Performance and Non-GAAP Measures” in our most recent Management’s Discussion and Analysis which is available on the Company’s website at www.manulife.com.
This Proxy Circular is dated as of March 11, 2014 and, except as otherwise indicated, all the information contained in this Proxy Circular is given as of that date. The Board has approved the contents and the distribution of this Proxy Circular to shareholders.
Stephen P. Sigurdson
Corporate Secretary
March 11, 2014
| Manulife Financial Corporation Proxy Circular | 70 |
Table of Contents
Table of Contents:
• Regulatory Compliance | Page 71 | |||
• Mandate of the Board of Directors: Ø Strategic Planning Ø Risk Management Oversight Ø Succession Planning |
| Page 72 Page 72 Page 72 Page 72 |
| |
• Mandates for the Chairman, Committee Chairs, CEO and Individual Directors | Page 72 | |||
• Independence of the Board | Page 72 | |||
• Independence of the Chairman of the Board | Page 73 | |||
• Nomination of Directors | Page 73 | |||
• Board Size and Quorum | Page 73 | |||
• Shareholder Nominations | Page 73 | |||
• Board Term Limits | Page 74 | |||
• Director Resignations | Page 74 | |||
• Majority Election of Directors Policy | Page 74 | |||
• Board Committees | Page 74 | |||
• Board Committee Membership | Page 74 | |||
• Board Committee Responsibilities | Page 74 | |||
• Board, Committees, Directors and Chairman Evaluation | Page 75 | |||
• CEO Evaluation | Page 75 | |||
• Director Compensation and Equity Ownership | Page 75 | |||
• New Director Orientation and Director Continuing Education | Page 75 | |||
• Independent Directors’ Meetings | Page 77 | |||
• Board Interlocks | Page 77 | |||
• Board Access to Management | Page 77 | |||
• Retention of Outside Advisors by Directors | Page 77 | |||
• Ethical Business Conduct | Page 77 | |||
• Conflicts of Interest | Page 77 | |||
• CEO and CFO Certification of Financial Statements | Page 77 | |||
• Disclosure and Communication Policies and Procedures | Page 77 | |||
• Shareholder Engagement Program | Page 78 | |||
• Shareholder Proposals | Page 78 | |||
• Appendix “1” – Board of Directors’ Mandate | Page 79 |
The following highlights various elements of the Company’s corporate governance program.
Manulife believes that good corporate governance is critical to its long-term success and the protection of the interests of its many stakeholders. Manulife’s governance policies and practices are consistent with its vision to be the most professional financial services organization in the world providing strong, reliable, trustworthy and forward-thinking solutions for its clients’ most significant financial decisions.
Regulatory Compliance
The Company’s corporate governance practices meet or exceed the requirements of:
| • | TheInsurance Companies Act (Canada) (the “Act”); |
| • | The Corporate Governance Guidelines established by the Office of the Superintendent of Financial Institutions; |
| • | Canadian Securities Administrators’ (“CSA”) National Instruments 52-109Certification of Disclosure in issuers’Annual and Interim Filings(the “Certification Instrument”) and 52-110Audit Committees (the “Audit Committee Instrument”); |
| • | CSA National Policy 58-201Corporate GovernanceGuidelines and National Instrument 58-101Disclosure ofCorporate Governance Practices (the “Governance Instrument”); |
| • | The applicable requirements of the Sarbanes-Oxley Act of 2002 (“SOX”), including any U.S. Securities and Exchange Commission (the “SEC”) rules under SOX; and |
| • | The domestic issuer standards of the New York Stock Exchange Listed Company Manual (the “NYSE Rules”), in all material respects. |
| Manulife Financial Corporation Proxy Circular | 71 |
Table of Contents
Mandate of the Board of Directors
The Board is responsible for the stewardship of the Company and the supervision of the management of the business and affairs of the Company. The Board’s general responsibilities are set out in the Board Mandate and the Board Policies. The Board Mandate is attached as Appendix “1” and is available on the Corporate Governance page of the Company’s website at www.manulife.com.
The Board carries out its key duties of strategic planning, risk management oversight and succession planning established in its Mandate in the following ways:
Strategic Planning
| • | The Board works with management in the development of the Company’s strategy; annually approves the strategic plan, taking into account the opportunities and risks of the business; and monitors its implementation. |
| • | Annually, the Board conducts a two day strategic planning session, where the Board discusses management’s recommendations for the overall corporate strategy, reflecting the previously provided Board direction, and the Board approved risk appetite. Following this interactive session, management takes the direction of the Board into consideration in refining the plan, which is then presented to the Board for final approval in December. |
| • | The Board annually reviews and approves the business plan, which includes the financial and operational plans, the capital plan and the Company’s risk appetite. |
| • | The Board discusses updates to and progress on the implementation of the Company’s strategy at each Board meeting. These updates provide the Board with an opportunity to challenge management assumptions, evaluate progress, and provide direction on the development of further strategic plans. |
Risk Management Oversight
| • | Exercises oversight of risk management directly and through the Risk Committee, Audit Committee and the Management Resources and Compensation Committee. |
| • | Through the Risk Committee, reviews the principal risks and assesses whether the key risks of the Company have been identified. |
| • | The Risk Committee approves and assesses policies, procedures and controls to identify, assess and manage the Company’s principal risks. |
| • | The Risk Committee reviews the Company’s compliance with its risk management and legal and regulatory requirements. |
| • | The Risk Committee receives regular reports from management on the Company’s key risks, reviews the risk profile relative to the risk appetite and considers the appropriate balance of risk and return. |
| • | The Audit Committee reviews guidelines and policies governing the process by which risk assessment and management is undertaken. The Chief Risk Officer reports on the risk management process to the Audit Committee. The Audit Committee also receives key risk reports presented to the Risk Committee. |
| • | The Management Resources and Compensation Committee and the Risk Committee each review the |
alignment of the compensation program with sound risk management principles and the Company’s risk management objectives. |
A detailed description of the Risk Committee’s and the Management Resources and Compensation Committee’s responsibilities in assessing risk is set out in the respective committee reports on pages 27 and 28, respectively, as well as in the Compensation, Discussion and Analysis under the heading “Managing Risk Associated with Compensation” on page 53.
Succession Planning
| • | The Management Resources and Compensation Committee in conjunction with the Board are responsible for the succession process for the CEO and oversight of the succession process for the members of the Company’s Executive Committee and the heads of the oversight functions. This includes an annual review of the succession pool and gaps in the readiness and development plans. |
| • | The Management Resources and Compensation Committee annually reports to the Board on succession planning. |
| • | The Management Resources and Compensation Committee in conjunction with the Board annually reviews and assesses the contingency succession plans for the CEO. |
Mandates for the Chairman, Committee Chairs, CEO and Individual Directors
The Board maintains mandates outlining the accountabilities for the Chairman, the Chairs of Board committees, the CEO and the individual directors, which are reviewed and updated annually. The mandates are available on the Corporate Governance page of the Company’s website at www.manulife.com or can be obtained by contacting the Corporate Secretary.
Independence of the Board
The independence of the Board of Directors is fundamental to its stewardship role and its effectiveness. The Board Policies require that a majority of directors be independent and the Board has adopted an independence policy. Directors must satisfy the requirements of the independence policy, which includes applicable independence requirements of the laws governing the Company, the stock exchanges on which the Company’s securities are listed and applicable securities regulatory authorities.
The Board annually reviews and makes a determination as to the independence of each director. The Board reviews the directors’ employment status (and the director’s spouse and children, as applicable), other board memberships, Company shareholdings and business relationships and, for members of the (i) Audit Committee, any consulting, advisory or other compensatory fee received from the Company and its affiliates; and (ii) Management Resources and Compensation Committee, the sources of the director’s remuneration, to determine whether there are any circumstances which might interfere with a director’s ability to exercise independent judgment.
| Manulife Financial Corporation Proxy Circular | 72 |
Table of Contents
The Board has determined, based on a review of the governing definitions of “independence” under the NYSE Rules, the Governance Instrument, and the Audit Committee Instrument, an analysis of the relationships between each director and the Company, and on advice from the Corporate Governance and Nominating Committee, that only one of the directors has a direct or indirect material relationship with the Company which could, in the view of the Board, be reasonably expected to interfere with the exercise of his or her independent judgment. As an executive officer of the Company, Mr. Guloien is considered to have a material relationship with the Company and therefore does not meet the independence standards.
Independence of the Chairman of the Board
The Board is committed to a separate Chairman and CEO, which the Board first implemented in August 1993.This structure ensures independent Board leadership and oversight of the management of the Company for the long-term benefit of its stakeholders.
| • | The Chairman is an independent director and is elected each year by the independent directors following the election of the directors at the annual meeting. |
| • | The Chairman’s mandate (available at www.manulife.com) makes the Chairman accountable for ensuring that the Board carries out its responsibilities effectively and separately from management. |
| • | The Chairman’s principal accountabilities include managing the affairs of the Board, developing the composition, structure and renewal of the Board, guiding the Board’s deliberations on strategic and policy matters and ensuring proper oversight by the Board is exercised. |
Nomination of Directors
The Corporate Governance and Nominating Committee is responsible for identifying qualified candidates for nomination to the Board.
The Board acknowledges that an effective Board requires directors to have the integrity, competencies and capabilities to carry out their fiduciary duties in the best interests of the Company and its shareholders. To effectively execute their duties, directors should have the requisite experience, skill, time and commitment. The Board has identified that the following characteristics are necessary for all Board candidates:
| • | A reputation for integrity and ethical behaviour; |
| • | A demonstrated ability to exercise judgment and communicate effectively; |
| • | Be financially knowledgeable; |
| • | Be prominent in the individual’s area of expertise; |
| • | Have previous experience relevant to the Company’s operations; and |
| • | Have sufficient time to dedicate to Board and committee work. |
The Corporate Governance and Nominating Committee engages in the following activities to ensure an effective process for selecting candidates for nomination:
| • | Develops criteria for the selection of new directors. |
| • | Identifies the desired competencies, expertise, skills, background and personal qualities that are sought in potential candidates, taking into consideration the Company’s strategy and business challenges. |
| • | Maintains the desired competencies in a directors’ skills matrix. |
| • | At least annually reviews these criteria to determine whether any amendments are required or whether there are any gaps in the skills of the existing directors. |
| • | Considers gender, ethnic background, geographic representation and other personal characteristics that contribute to diversity amongst Board members recognizing that it is the skills, experience and integrity that are most important in assessing candidates and their potential contributions. |
| • | Identifies at least annually individuals with expertise in the areas identified, whose skills and characteristics complement the existing mix, and are qualified and suitable to become Board members, taking into consideration any gaps identified in the Experience Matrix (see page 10). |
| • | The committee has retained the services of an executive search firm who specializes in director searches. |
| • | Once the committee has identified potential candidates, they are interviewed by the Chairman, the Chairs of one or more of the committees, and particularly the Chairs of the committees that the potential candidate would be appointed to, and the CEO. The Chairman discusses the time commitments and performance expectations with the potential candidates. |
| • | At the completion of this process, the committee recommends that the Board approve the appointment of the potential candidate. |
Board Size and Quorum
The Board, together with the Corporate Governance and Nominating Committee, regularly considers the size of the Board, taking into account various factors, including the need for representation in the desired competencies, expertise, skills, background and personal qualities identified by the Corporate Governance and Nominating Committee. This year 14 candidates have been nominated for election at the Meeting. The Board may appoint additional directors between annual meetings.
Quorum for meetings of the Board is a majority of its members.
Shareholder Nominations
The Board will consider a nomination of a candidate for the Company’s Board from a shareholder that is submitted in accordance with the Act.A proper nomination must be submitted by shareholder proposal, signed by one or more registered or beneficial holders of shares representing in aggregate not less than five per cent of the shares of the Company entitled to vote at the meeting to which the proposal is being submitted.
| Manulife Financial Corporation Proxy Circular | 73 |
Table of Contents
Board Term Limits
To balance the benefits of experience and the need for renewal and new perspectives, the Board has established term limits for independent directors. Independent directors will not be nominated for re-election at an annual meeting after reaching 12 years of service on the Board. In exceptional circumstances, having regard to the specific expertise of the director and the needs of the Board at that time, the Board has the discretion to recommend for re-election an independent director who has reached 12 years of service for additional one year terms for up to three years.
In order to enable the transition from a mandatory retirement policy to term limits, independent directors who, as of the date of the Meeting, have reached at least 12 years of service but have not reached the mandatory retirement age in effect prior to December 5, 2013 may be recommended for re-election for additional one year terms for up to five years.
The Chairman of the Board may serve a full five year term as Chairman regardless of number of years of service on the Board.
Director Resignations
A director is expected to submit his or her resignation to the Chairman of the Board for consideration by the Board upon the recommendation of the Corporate Governance and Nominating Committee in certain circumstances, including where:
| • | the director is no longer qualified under the Act or other applicable laws to act as a director; |
| • | the director’s status in terms of conflicts or credentials changes; or |
| • | the director does not receive the required votes under the Majority Election of Directors policy. |
Majority Election of Directors Policy
The Board’s Majority Election of Directors Policy requires that in an uncontested election director nominees who do not receive a greater number of votes “for” than votes “withheld” will immediately submit their resignation to the Corporate Governance and Nominating Committee. The Corporate Governance and Nominating Committee will, in the absence of extenuating circumstances, recommend that the Board accept the resignation. The Board will consider the resignation and make its determination as soon as possible but in any event within 90 days of the annual meeting and issue a press release confirming the director’s resignation or the reason for rejecting the resignation. If a director’s resignation is accepted by the Board, the directors may fill the vacancy through the appointment of a new director whom the Board considers will have the confidence of the shareholders or call a special meeting of shareholders to elect a director or wait until the next annual meeting.
Board Committees
The Board relies on its committees to assist in fulfilling its mandate and meet its responsibilities. Committees of the
Board allow directors to share responsibility and devote the necessary resources to a particular area or issue. In 2013, there were four standing committees of the Board: the Audit Committee; the Corporate Governance and Nominating Committee; the Management Resources and Compensation Committee; and the Risk Committee.
All committees have the following common characteristics:
| • | Comprised solely of independent directors. |
| • | Have a written charter setting out the responsibilities of each committee. Each committee tracks its compliance with its charter at each meeting throughout the year. The charters are available on the Company’s website at www.manulife.com. |
| • | Report to and seek Board approvals as required after each meeting. |
| • | Meetin camera without management present at each meeting except in the rare situation where the committee agrees that it is not required. |
| • | Reviews their performance and their charter annually. |
Board Committee Membership
The Corporate Governance and Nominating Committee, whose membership consists solely of independent members, recommends committee membership for approval by the Board annually, taking into consideration director expertise, requirements of the committees and directors, distribution of committee membership, and director retirements. Members are rotated as needs dictate. The Board has implemented the following additional committee membership criteria:
| • | Management Resources and Compensation Committee – No more than one third of the members of this committee shall be current chief executive officers of other issuers and at least one committee member shall be experienced in executive compensation. |
| • | Audit Committee – The Board shall review the membership of the Audit Committee each year to confirm that no member serves on more than two other audit committees of publicly traded companies and that no member’s ability to serve on the Audit Committee is impaired in any way. The Board completed this review and confirmation in 2013. |
Board Committee Responsibilities
2013 Accomplishments
A description of the responsibilities and accomplishments of the committees are set out in the respective committee report as follows:
| • | Audit Committee: page 25. The Company’s Annual Information Form includes additional information on the Audit Committee in the section entitled “Audit Committee”, including the Audit Committee’s charter, composition and the relevant education and experience of its members. |
| • | Management Resources and Compensation Committee: page 28. |
| • | Corporate Governance and Nominating Committee: page 23. |
| • | Risk Committee: page 27. |
| Manulife Financial Corporation Proxy Circular | 74 |
Table of Contents
Board, Committees, Directors and Chairman Evaluation
The Corporate Governance and Nominating Committee, in conjunction with the Chairman of the Board, conduct annual, formal evaluations of the Board, Board committees, the Chairman and the individual directors. The process includes:
| • | Annual evaluation meetings between the Chairman and each director to discuss Board, committee and individual director performance, including a peer review. |
| • | Annual evaluation meetings between the Chairman of the Corporate Governance and Nominating Committee or the Vice Chair, where applicable, and each director to assess the performance of the Chairman of the Board. |
| • | Each director completes a biennial written Board and Committee Effectiveness and Director Self-Assessment Questionnaire, which has been approved by the Corporate Governance and Nominating Committee. |
| • | Periodically, as determined by the Corporate Governance and Nominating Committee, the effectiveness of the Board will be reviewed with the assistance of independent advisors. |
| • | The Board, Board committees and Chairs are assessed against their mandates and charters and the Board and committee decisions and accomplishments in each year. |
| • | Contributions of individual directors are assessed against the applicable mandates. |
| • | The assessments of the Board and the committees focus on identifying areas for improvement. |
| • | The results of the Board assessments are compiled by the Chairman of the Board with the assistance of the Corporate Secretary to maintain confidentiality and presented to the Corporate Governance and Nominating Committee and the Board. Based in part on the assessments, the committee identifies and recommends objectives for the coming year. The committee also considers whether any changes in the composition, structure or mandates of the Board or any committee are required. |
| • | Annual in camerameeting of the independent directors to review the results of the evaluations and to approve the Board’s objectives for the coming year recommended by the Corporate Governance and Nominating Committee. |
| • | Review of overall size and operation of the Board and its committees to ensure that they operate effectively. |
| • | Determination of whether a director’s ability to serve the Company is impaired by external obligations or by changes in the director’s principal occupation or country of residence. |
CEO Evaluation
The Management Resources and Compensation Committee and the CEO annually agree to the financial and non-financial objectives for the CEO, which are recommended for approval by the Board. The CEO’s performance is evaluated annually by the Management Resources and Compensation Committee and the Board based on these objectives and on the Company’s performance.
In 2012 and 2013, the Board enhanced the CEO evaluation process as follows:
| • | A formal questionnaire was completed by all directors evaluating the CEO based on the achievement of the Board-approved non-financial objectives and his leadership (including strategic, people, operational, balancing among stakeholders and overall leadership). The results were presented to the Management Resources and Compensation Committee for discussion and a recommendation to the full Board. |
| • | A summary of the results were also provided to the independent directors to be used in their annual evaluation of the CEO. |
Director Compensation and Equity Ownership
The Board, with the assistance of the Corporate Governance and Nominating Committee and independent external advisors, undertakes a biennial review of director compensation to ensure that it meets the objective of properly aligning the interests of directors with the long-term interests of the Company.
New Director Orientation and Director Continuing Education
The Board believes that understanding the Company’s strategies, business operations and competitive environment is crucial to their ability to provide the necessary oversight and guidance to the Company.
The goal of the Director Orientation and Continuing Education Program is to assist the directors in becoming knowledgeable about the Company’s business and in fully understanding the nature of their roles, responsibilities and duties as a director.
The Corporate Governance and Nominating Committee is responsible for the new director orientation and director continuing education programs.
New Director Orientation
New directors will participate in a comprehensive orientation program developed by management and the Corporate Governance and Nominating Committee. This program may be tailored to reflect an individual director’s specific knowledge, skills, experience and education. This program includes the following:
| • | New directors attend specialized in-depth presentations by the financial, risk, strategy, business operations, human resources and legal executives to facilitate a deeper understanding of the Company’s businesses, priorities, and challenges. |
| • | New directors meet with the Chairman of the Board, the CEO, the heads of each principal business unit, and other members of management as appropriate, to receive presentations and to discuss the Company’s strategies, operations, and business plans. |
| • | Committee Chairs arrange a specific committee orientation session for the new director, which will include applicable members of management. |
| • | New directors are provided with detailed information about the Company, including its business strategies, |
| Manulife Financial Corporation Proxy Circular | 75 |
Table of Contents
corporate information, structure and the roles and expectations of the Board and individual directors, including the legal duties and obligations of a director of a public company, Board and Committee mandates, as well as background materials, including the Annual Information Form, Proxy Circular, Annual Report, Manufacturers Life’s Report to Policyholders, Board and applicable Company policies, organizational information about the Board and its meetings and the directors’ information requirements required pursuant to applicable insurance and securities regulations. |
| • | All directors have a standing invitation to attend committee meetings and new directors are encouraged to do so to assist in their orientation. |
Director Continuing Education
Directors participate in ongoing continuing education which includes the following elements:
| • | At Board meetings, committee meetings and directors’ seminars, directors receive presentations on risk and risk management, material regulatory developments, strategic issues, annual divisional updates which provide in-depth reviews of key businesses and functions and other relevant topics. |
| • | On-site visits to the Company’s operations scheduled in conjunction with a Board meeting. On-site meetings incorporate senior management presentations on the |
business divisions’ strategies and operations which facilitate an understanding by the directors of the Company’s global operations. The full Board generally meets in Boston, Massachusetts once each year and in Asia once every three years. A subset of the Board attends educational sessions at one or more of the Company’s operations in Asia once each year. |
| • | In 2013, all directors were members of the Institute of Corporate Directors (“ICD”), a recognized educational organization for directors to enhance their knowledge of directors’ responsibilities and current governance trends. |
| • | Additional educational needs are identified by the Board in its annual effectiveness evaluation or on an as needed basis, and by management for emerging issues, new areas of business or other areas that management feels the Board should be made aware of in more depth. |
| • | Educational reading materials on topics relevant to the financial services and insurance industries are provided to the Board from time to time. Directors also have access to the ICD publications. |
| • | Directors may seek additional professional development education at the expense of the Company and are encouraged to do so. In 2013, directors participated in additional professional development respecting their roles as directors and the business of the Company. |
The following chart illustrates the education sessions held in 2013.
| Director Educational Presentations | 2013 | Presented By | Attendees | |||
| Risk Management | April | Chief Risk Officer | • All directors | |||
| Life Products | June | EVP Retail, Canadian Division | • All directors | |||
| Asia Health Products | June | EVP & CEO, Manulife Hong Kong EVP & GM, Manulife Japan | • All directors | |||
| Retail Distribution | June | President, JH Financial Network | • All directors | |||
| Manulife Bank | August | President & CEO, Manulife Bank | • All directors | |||
| Affinity Business in Canada | August | General Manager, Affinity Markets | • All directors | |||
| Overview of Business in Japan | September | Asia Management | • Joseph Caron • Susan Dabarno • Richard DeWolfe • Sheila Fraser • Donald Guloien • Robert Harding • Lorna Marsden • Jim Prieur • Lesley Webster | |||
| Code of Business Conduct & Ethics | September | On-Line Training and Certification | • All directors | |||
| Group Retirement | December | SVP, Group Business Development | • All directors | |||
| Mutual Funds | December | SVP, John Hancock Investment | • All directors |
| Manulife Financial Corporation Proxy Circular | 76 |
Table of Contents
Independent Directors’ Meetings
The directors meetin camera at the end of each Board and committee meeting, except in the rare situation where the Board or committee agrees that it is not required. Non-independent directors and management do not attend. These sessions have two objectives: to discuss the Board’s views on the effectiveness of the meeting and to permit discussions on any substantive matters raised by the directors. The Board also meets without management and non-independent directors at the request of any independent director for all or a portion of any meeting where a potential conflict of interest arises or where otherwise appropriate.
The independent directors of the Board meet at least once each year to review the performance and approve the compensation of the CEO, to review the Board’s effectiveness assessments and approve action plans resulting from the assessments. In 2013, one meeting of the independent directors was held.
Shareholders wishing to contact independent directors of the Company may write to the Chairman of the Board, in care of the Corporate Secretary, at the head office of the Company.
Board Interlocks
The Board does not allow its directors to serve on the same board of another company, unless such interlock is approved by the Corporate Governance and Nominating Committee. This committee reviews potential interlocking board memberships as they arise in conjunction with its determination as to whether a director’s ability to serve the Company is impaired by such external obligations, and determines if common board memberships impair the ability of the directors to act in the best interests of the Company. Currently, there are no interlocking board memberships held by the Company’s directors.
Board Access to Management
The Company provides both formal and informal means for the Board to interact with the Senior Executives. The Senior Executives attend the Board meetings and relevant committee meetings. Directors have access to the Senior Executives and are encouraged to raise any questions or concerns directly with the Senior Executives. The Board and Committee Chairs meet regularly with applicable Senior Executives.
Retention of Outside Advisors by Directors
The Board and its committees may retain outside advisors at the Company’s expense, as they deem necessary.
The Corporate Governance and Nominating Committee and the Management Resources and Compensation Committee retained outside advisors in 2013.
Individual directors may also retain outside advisors, at the Company’s expense with the approval of the Corporate Governance and Nominating Committee, to provide advice on any matter before the Board or committee.
Ethical Business Conduct
The Company has adopted the Code of Business Conduct and Ethics (the “Code”), which applies to directors, officers,
employees and those who perform services for or on behalf of the Company.
The Code complies with the requirements of the NYSE Rules, the SEC rules and the Governance Instrument.
The Code is available on the Company’s website at www.manulife.com.
All employees of the Company and the directors annually review the Code, complete an online training course, certify compliance with the Code and disclose any conflicts of interest. Any changes to an employee’s or director’s status during the year is reported to the applicable human resources representative or Global Compliance.
The Board annually reviews the Code and the compliance with the Code with the assistance of the Audit Committee (previously with the Conduct Review and Ethics Committee) and reports from the Global Compliance Chief on compliance with the Code, the Ethics Hotline (the third party reporting system that permits employees to submit their ethics concerns anonymously through the internet or telephone) and Code violations including those relating to accounting, internal controls or audit matters.
The Board, through the Management Resources and Compensation Committee, annually reviews the integrity of the CEO and the executive officers, and their promotion of a culture of integrity.
Conflicts of Interest
Directors and executive officers are required to disclose their interest in a material contract or material transaction with the Company. Each director is required to inform the Board of any potential or actual conflicts, or what might appear to be a conflict of interest the director may have with the Company. If a director has a personal interest in a matter before the Board or a committee, he or she will not be present for or participate in the discussion or any vote on the matter except where the Board or the committee has expressly determined that it is appropriate for him or her to do so.
CEO and CFO Certification of Financial Statements
The CEO and CFO certify the annual financial statements and quarterly financial statements as required by SOX and the Certification Instrument.
The CEO provides an annual certification to the NYSE stating the CEO is not aware of any violations of the governance requirements in the NYSE Rules.
The Company submits written affirmations as required by the NYSE Rules.
Disclosure and Communication Policies and Procedures
The Company has policies relating to the treatment and disclosure of information about the Company on a timely, accurate, understandable and broadly disseminated basis. Media releases relating to the Company are reviewed by Legal, Investor Relations and Communications, senior management and others as required, for both content and appropriateness of timing.
| Manulife Financial Corporation Proxy Circular | 77 |
Table of Contents
The Company’s Executive Committee also serves as its Disclosure Committee. The Disclosure Committee is responsible for overseeing and monitoring disclosure processes and practices within the Company and determining whether events constitute “material information” or a “material change” for applicable regulatory purposes. Its members are the Chief Executive Officer, Chief Operating Officer, Chief Financial Officer, General Counsel, Chief Risk Officer, Chief Investment Officer, Chief Actuary, the senior officer responsible for human resources and the principal officers of each of the main operating business units. The Disclosure Committee is chaired by the General Counsel. The Disclosure Committee reports, as appropriate, to the Audit Committee and Risk Committee.
The Company has also established a Risk Disclosure Committee. The Risk Disclosure Committee is responsible for reviewing, considering and making recommendations as to appropriate risk disclosure based on, among other things, its review of internal risk and reports related thereto. Its members are the Chief Executive Officer, Chief Financial Officer, General Counsel, Chief Risk Officer, Chief Actuary and Controller. The Risk Disclosure Committee is also chaired by the General Counsel. It reports to the Disclosure Committee.
The Company has reviewed its disclosure policies and practices which are intended to ensure compliance by the Company with the disclosure requirements applicable to public companies.
The Company communicates with individual shareholders, institutional investors and financial analysts through its Investor Relations and Shareholder Services departments and to the media and employees through its Communication department.
Investor Relations provides a quarterly report to the Board of Directors. The scope of the report includes: investor sentiment in regard to quarterly results, analyst estimates
and recommendations, market movements, relative valuation to peers, rating actions for the Company and peers, and a summary of recent Investor Relations activities.
Shareholder Engagement Program
For each of the last three years, the Chairman of the Board has hosted a shareholder engagement outreach program. In 2013, this included ten meetings and five conference calls with a number of the Company’s largest Canadian shareholders and, for the first time, included one of the Company’s largest Asian shareholders. Combined, the participating shareholders represent approximately 500 million shares or approximately 40%1 of the total outstanding value of shares held by the Company’s institutional shareholders. Some of the frequently referenced topics of discussion included: executive compensation, merger and acquisition activity, financial and other disclosures, pre-conditions to a dividend increase, management’s 2016 financial objectives and strategic initiatives.
The Company’s website, www.manulife.com, features webcasts of the quarterly investor conference calls and presentations made by senior management to the investment community, as well as annual reports, Board Mandate and committee charters and other investor information.
Shareholders can access voting results of all shareholder votes at the Company’s website www.manulife.com or at www.sedar.com.
Shareholder Proposals
Based on the Company’s risk-based approach to its investments in relation to global climate change, Vancity Investment Management Inc. agreed to withdraw a shareholder proposal relating to the potential impact on the Company’s holdings of stranded carbon assets in the fossil fuel industry.
| 1 | Based on estimates of the breakdown of institutional versus retail holdings as well as information provided by NASDAQ OMX as at September 30, 2013. |
| Manulife Financial Corporation Proxy Circular | 78 |
Table of Contents
Board of Directors’ Mandate
The Board of Directors (the “Board”) is responsible for providing independent oversight of the management of the business and affairs of the Company.
The Board shall, directly or through a Board committee, carry out the duties referred to in this Mandate.
Culture of Integrity and Ethics
| • | Promote a culture of integrity at the Company. To the extent feasible, the Board shall satisfy itself as to the integrity of the Chief Executive Officer (“CEO”) and other senior executive officers, and that the CEO and other senior executive officers create a culture of integrity throughout the Company. |
| • | Approve and monitor compliance with the Company’s Code of Business Conduct and Ethics (the “Code”). Any waivers from the Code for the benefit of any Director or executive officer must be approved by the Board. |
| • | Approve significant policies and practices for dealing with all matters related to integrity and ethics, including conflicts of interest, related party transactions and the treatment of confidential information. |
Strategic Planning Process and Implementation
| • | Adopt a strategic planning process and approve, on at least an annual basis, a strategic plan which takes into account, among other things, the opportunities and risks of the business. |
| • | Monitor implementation and effectiveness of approved strategic plans. |
| • | Monitor performance against the Company’s financial objectives, including reviewing and approving significant capital allocations and expenditures and the declaration of dividends. |
| • | Approve significant strategic initiatives and business decisions. |
Risk Management and Compliance
| • | Oversee policies and processes to identify and manage the principal risks of the Company’s business and review the systems and controls to manage those risks. |
| • | Monitor risk management activities and initiatives. |
| • | Approve the Company’s risk appetite framework. |
| • | Oversee the implementation by management of a comprehensive compliance management program that addresses compliance with applicable regulatory and legal requirements. |
| • | At least annually, review and approve the Company’s significant enterprise-wide policies and practices, including those respecting liquidity, funding and capital management, and obtain assurance from management that they are being complied with. |
Succession Planning and Evaluation
| • | Oversee the succession planning processes of the Company, including the selection, appointment and development of the Chairman of the Board, the Board members, the CEO and other senior executive officers, including the heads of the Company’s oversight functions, and the termination of the CEO, if required. |
| • | Review the establishment of annual performance targets and evaluate and approve the compensation of the CEO and other senior executive officers, including the heads of the Company’s oversight functions. |
| • | Oversee the Company’s general approach to human resources and compensation philosophy. |
| • | Review the overall structure of the Company’s organization. |
Communications and Public Disclosure
| • | Oversee the Company’s communication and disclosure practices, including with respect to receiving feedback from stakeholders. |
| • | Approve the Company’s disclosure policy, which governs the release of information about the Company and requires timely, accurate and fair disclosure of such information in compliance with all legal and regulatory requirements. |
| • | The CEO or the Chairman of the Board or any other Director, when authorized by the CEO or the Chairman of the Board, may communicate with the shareholders or stakeholders on behalf of the Company. |
Internal Controls
| • | Oversee the integrity and effectiveness of the Company’s internal control framework and management information systems and obtain assurances on a regular basis that these systems and controls are designed and operating effectively. |
| • | Review and approve significant public disclosure documents, including the financial statements and related disclosures, prior to their release. |
| • | Oversee compliance with audit, accounting and actuarial practices. |
Corporate Governance
| • | Oversee the Company’s corporate governance principles and practices. |
| • | Establish appropriate structures and procedures to allow the Board to function independently of management, including undertaking regular evaluations of the Board, its Committees and individual directors, and reviewing the composition of the Board, with a view to the effectiveness and independence of the Board and its members. |
| • | Establish committees of the Board, develop their mandates and, subject to applicable law, delegate such matters to any committee in order to assist the Board in carrying out its duties and responsibilities. |
| • | Establish expectations and responsibilities of directors, including preparation for, attendance at, and participation in, Board and Committee meetings and Board educational seminars. |
| Manulife Financial Corporation Proxy Circular | 79 |
Table of Contents