FORM 6-K
SECURITIES AND EXCHANGE COMMISSION
Washington, D.C. 20549
Report of Foreign Issuer
Pursuant to Rule 13a-16 or 15d-16 of
Securities Exchange Act of 1934
For the month of Septermber 2012
SANTANDER UK PLC
(Translation of registrant's name into English)
2 Triton Square, Regent’s
Place, London NW1 3AN, England
(Address of principal executive offices)
Indicate by check mark whether the registrant files or will file annual reports under cover Form 20-F or Form 40-F.
Form 20-F x Form 40-F o
Indicate by check mark whether the registrant by furnishing the information contained in this Form is also thereby furnishing the information to the Commission pursuant to Rule 12g3-2(b) under the Securities Exchange Act of 1934.
Yes o No x
Santander UK plc
2012 Half Yearly Financial Report
Business Review and Forward-looking Statements
Forward looking Statements
Santander UK plc (the ‘Company’) and its subsidiaries (together ‘Santander UK’ or the ‘Group’) may from time to time make written or oral forward-looking statements. Examples of such forward-looking statements include, but are not limited to:
| > | projections or expectations of revenues, costs, profit (or loss), earnings (or loss) per share, dividends, capital structure or other financial items or ratios; |
| > | statements of plans, objectives or goals of Santander UK or its management, including those related to products or services; |
| > | statements of future economic performance; and |
| > | statements of assumptions underlying such statements. |
Words such as ‘believes’, ‘anticipates’, ‘expects’, ‘intends’, ‘aims’, ‘plans’, ‘targets’ and similar expressions are intended to identify forward-looking statements, but are not the exclusive means of identifying such statements.
By their very nature, forward-looking statements are not statements of historical or current facts; they cannot be objectively verified, are speculative and involve inherent risks and uncertainties, both general and specific, and risks exist that the predictions, forecasts, projections and other forward-looking statements will not be achieved. Santander UK cautions readers that a number of important factors could cause actual results to differ materially from the plans, objectives, expectations, estimates and intentions expressed in such forward-looking statements made by Santander UK or on Santander UK’s behalf. Some of these factors, which could affect the Group’s business, financial condition and/or results of operations, are considered in detail in the Risk Management Report on page 52 and the Risk Factors section on page 186 and they include:
| > | the effects of UK economic conditions (e.g. housing market correction, rising unemployment, increased taxation and reduced consumer and public spending) and particularly the UK real estate market; |
| > | the effects of conditions in global financial markets (e.g. increased market volatility and disruption, reduced credit availability and increased commercial and consumer loan delinquencies); |
| > | the effects of the ongoing economic and sovereign debt crisis in the eurozone and any effects should any member state exit the euro; |
| > | The credit quality of borrowers and the soundness of other financial institutions; |
| > | the Group’s ability to access liquidity and funding on financial terms acceptable to it; |
| > | the extent to which regulatory capital and liquidity requirements and any changes to these requirements may limit the Group’s operations; |
| > | the effects of any changes to the credit rating assigned to the Group, any member of the Group or any of their respective debt securities; |
| > | the effects of fluctuations in interest rates, currency exchange rates, basis spreads, bond and equity prices and other market factors; |
| > | the extent to the Group may be required to record negative fair value adjustments for its financial assets due to changes in market conditions; |
| > | the ability of the Group to manage any future growth effectively (e.g. efficiently managing the operations and employees of expanding businesses and maintaining or growing its existing customer base); |
| > | the ability of the Group to realise the anticipated benefits of its business combinations and the exposure, if any, of the Group to any unknown liabilities or goodwill impairments relating to the acquired businesses; |
| > | the effects of competition, or intensification of such competition, in the financial services markets in which the Group conducts business and the impact of customer perception of the Group’s customer service levels on existing or potential business; |
| > | the extent which the Group may be exposed to operational losses (e.g. failed internal or external processes, people and systems); |
| > | the ability of the Group to recruit, retain and develop appropriate senior management and skilled personnel; |
| > | the effects of any changes to the reputation of the Group, any member of the Group or any affiliate operating under the Group’s brands; |
| > | the effects of the financial services laws, regulations, administrative actions and policies and any changes thereto in each location or market in which the Group operates; |
| > | the effects of taxation requirements and any changes thereto in each location in which the Group operates; |
| > | the effects of the proposed reform and reorganisation of the structure of the UK Financial Services Authority and of the UK regulatory framework that applies to members of the Group; |
| > | the effects of any new reforms to the UK mortgage lending market; |
| > | the power of the UK Financial Services Authority (or any overseas regulator) to intervene in response to attempts by customers to seek redress from financial service institutions, including the Group, in case of industry-wide issues; |
| > | the extent to which members of the Group may be responsible for contributing to compensation schemes in the UK in respect of banks and other authorised financial services firms that are unable to meet their obligations to customers; |
| > | the effects which the UK Banking Act 2009 may have, should the HM Treasury, the Bank of England and/or the Financial Services Authority exercise their powers under this Act in the future against the Company; |
| > | the Group’s dependency on its information technology systems; |
| > | the risk of third parties using the Group as a conduit for illegal activities without the Group’s knowledge; |
| > | the effects of any changes in the pension liabilities and obligations of the Group; and |
| > | Santander UK’s success at managing the risks to which the Group is exposed, including the items above. |
Undue reliance should not be placed on forward-looking statements when making decisions with respect to Santander UK and/or its securities. Investors and others should take into account the inherent risks and uncertainties of forward-looking statements and should carefully consider the foregoing non-exhaustive list of important factors. Forward-looking statements speak only as of the date on which they are made and are based on the knowledge, information available and views taken on the date on which they are made; such knowledge, information and views may change at any time. Santander UK does not undertake any obligation to update or revise any forward-looking statement, whether as a result of new information, future events or otherwise.
Written forward-looking statements may appear in documents filed with the US Securities and Exchange Commission, including this Half Yearly Financial Report, reports to shareholders and other communications. The US Private Securities Litigation Reform Act of 1995 contains a safe harbour for forward-looking statements on which Santander UK relies in making such disclosures.
GENERAL INFORMATION
This announcement is not a form of statutory accounts. The information for the year ended 31 December 2011 does not constitute statutory accounts, as defined in section 434 of the Companies Act 2006. A copy of the statutory accounts for that year has been delivered to the Registrar of Companies. The auditor’s report on those accounts was unqualified, did not draw attention to any matters by way of emphasis and did not contain a statement under section 498(2) or (3) of the Companies Act 2006.
This report is also available on the Santander UK corporate website (www.aboutsantander.co.uk).
BRITISH BANKERS' ASSOCIATION CODE FOR FINANCIAL REPORTING DISCLOSURE
Santander UK voluntarily adopted the British Bankers’ Association Code on Financial Reporting Disclosure (the ‘BBA Code’) with effect from its 2010 Annual Report on Form 20-F. The BBA Code sets out five disclosure principles together with supporting guidance. These principles have been applied, as appropriate, in the context of the 2012 Half Yearly Financial Report.
CHIEF EXECUTIVE OFFICER’S REVIEW
OVERVIEW
In the first half of 2012 we continued to focus on the development of our UK retail and corporate banking services. We delivered a solid business performance, with profit before tax up 32% to £725m, from £549m in the first half of 2011; the first half results of 2011 included a £731m provision for customer remediation, principally in relation to payment protection insurance (‘PPI’). Our financial results continued to be impacted by low interest rates, increased term funding costs and higher liquidity costs. Despite these challenges, the uncertain prospects for economic growth and the evolving regulatory environment, Santander UK strengthened its balance sheet with an increase in its Core Tier 1 capital ratio to 12.2%.
Santander UK maintained its reputation for offering customers innovative new products with the launch of our market leading current account in March as part of the ‘1|2|3 World’ range which has been well received and seen a good take-up by new customers and existing current account holders. We also delivered an excellent performance in the cross-tax year ISA campaign and an increase in lending to small and medium-sized enterprises (‘SMEs’) which grew by 18%. Mortgage lending demand remained weak but we continued to support UK households with £8.7bn of gross mortgage lending, a level consistent with our mortgage stock market share. Improved levels of service satisfaction were achieved in our retail, corporate banking and intermediaries businesses.
The planned acquisition of certain Royal Bank of Scotland Group (‘RBS’) retail and corporate banking businesses, announced in 2010, is progressing, albeit at a slower pace than initially expected. The transaction will further accelerate the delivery of our strategic goals.
STRATEGIC FOCUS
Santander UK’s strategy is to transform its business into a market-leading retail and corporate bank. Underpinning each of the goals is our focus on making Santander UK the best for our customers, our people and our investors:
| > | Changing the focus of the retail bank to customers from products: The 1|2|3 World product suite promotes deeper relationships with customers by rewarding them for holding multiple products and offering excellent value. We launched the 1|2|3 Current Account in March 2012 following the launch of the 1|2|3 Credit Card in the second half of 2011. We are changing the commercial model with the implementation of enhanced customer segmentation and allocation of customers to branches to build deeper and longer-term customer relationships. In the first half of 2012 we increased the proportion of sales of our main products made via the direct channels as we sought to do more business face-to-face. |
| > | Growing the SME business, both organically and through acquisition: We are now in our third year of consistent organic growth in lending to UK SMEs, with balances rising 18%, building on an extended product suite available to our customers and delivering profitable growth. The first investment has been made under our £200m Breakthrough programme, our fund to provide capital to support fast growth small companies. Organic growth combined with the potential offered by the planned acquisition of certain RBS corporate assets is expected to significantly increase the scale of our corporate business and improve the overall business mix of Santander UK. |
| > | Continuing our focus on IT investment and efficiency: Improvements in our customer service are beginning to emerge following significant investment in staff, processes and training. Investment programmes continue, related both to improvements in existing processes and capability and the planned RBS businesses acquisition. |
In parallel with these commercial goals, our financial priority in 2012 has been to ensure that we further enhance Santander UK’s balance sheet strength, in terms of funding, credit quality and capital. This sound financial underpinning will provide the foundations for sustainable growth in the future as we continue to transform the business.
BUSINESS PERFORMANCE
With a distribution network across more than 1,300 branches and 33 regional Corporate Business Centres, Santander UK has a firm foundation on which to build a full-service commercial bank. Notwithstanding weaker demand in key markets, increased competitive pressures and a fragile economic outlook we achieved solid growth in lending to SMEs, a good level of mortgage lending and performed strongly in our 2012 cross-tax year ISA campaign. The launch of our new 1|2|3 Current Account in March 2012 and a joint marketing campaign with the 1|2|3 Credit Card produced good demand for both products, with customers responding well to the broad range of benefits these products offer.
We have taken actions in the first half of 2012 to manage the risks associated with higher loan-to-value and interest-only mortgages and to constrain balance sheet growth, whilst maintaining lending to key segments of UK individuals and businesses. Mortgage gross lending was £8.7bn in the six months ended 30 June 2012 equating to a gross lending market share of 13%, which was consistent with our stock market share of around 14%. SME lending balances were 18% higher than at the same time last year. Risk management and affordability measures are an important part of our lending decisions and our focus on low LTV and prime segments continues to feed through into relatively low levels of arrears in our mortgage portfolio and in Corporate Banking.
In the first six months of 2012 our retail customers opened 448,000 bank accounts and acquired 356,000 credit cards. In Retail Banking, we are seeking to develop and build deeper customer relationships through increased current account primacy and customer segmentation. The 1|2|3 World is a growing range of products which gives customers access to a broad range of benefits when the products are used on a day-to-day basis.
| > | The 1|2|3 Current Account pays cashback for a range of household bill paying transactions as well as attractive rates of interest on credit balances. This fee paying primary account is a core part of our customer driven retail banking proposition. |
| > | The 1|2|3 Credit Card moves our proposition away from a balance transfer business model to further deepen relationships. Spend on 1|2|3 Credit Cards now exceeds that of the rest of our credit card portfolio. |
| > | 392,000 1|2|3 Current Accounts and 449,000 1|2|3 Credit Cards have been opened since their respective launches in March 2012 and September 2011, with a strong take up from both existing customers and switchers from other institutions. The combined marketing of 1|2|3 World products has been effective, with many customers benefiting from using both products. |
Competition in the deposit market continued to be intense and, as a consequence, margins remained at very low levels. We continued to offer a mix of best-buy products and special offers targeted at new and existing customers and continued to reward our customers for doing more business with us. Retail deposit net inflows were £3.0bn over the period. This included a strong cross-tax year ISA campaign, with net inflows of ISAs amounting to £6.9bn. Flows were also supported by current account growth where total balances rose by £1.3bn. Offsetting these, we reduced short-term and rate-sensitive deposits that offered limited long term relationship opportunities. The cost of medium term funding (‘MTF’) issuance was high compared to historic levels, but given its duration and relative cost remained an attractive and important source of funding. In the first half of 2012, £11.8bn of medium term funding was raised across a mix of sources and geographies and at good rates, reflecting the market’s confidence in Santander UK.
Our SME balances were up 18% with £1.7bn of new facilities made available. The organic growth of Corporate Banking continued in the first half of 2012 during which five new regional Corporate Business Centres were opened to improve coverage and customer service, taking the number of centres to 33, with plans in place for more openings in the second half of the year. Our innovative Breakthrough programme, launched in 2011, continued to support fast growth small companies in their development. In business banking, we launched a new fee-paying account in the second half of 2011. In total, over 23,000 bank accounts were opened in the first half of 2012.
Our Markets business continued to perform well in the first six months of 2012 and, despite the volatile environment, profits increased compared to the same period last year. Investment in staff and technology enabled us to offer an expanded range of products in 2012, particularly in the Institutional and Foreign Exchange businesses where we continued to show growth in challenging markets.
IMPROVING CUSTOMER SERVICE
We remain committed to improving customer service within our businesses. The roll-out of a comprehensive behavioural change programme for our staff, designed to improve customer experience across our branch network, was completed in June 2012. We also finalised the recruitment of almost 200 additional telephony agents. This enabled us to launch an in-depth training and development initiative to further improve the service offered through this channel. Results from our internal monthly customer survey, Customer First, reflected the positive impact of our initiatives on customer satisfaction.
Our efforts are being recognised by the industry, as we have recently won awards from Moneywise for ‘Most Improved Service’, Your Money for ‘Best National Branch Network’ and Euromoney for ‘Best Bank in the UK’ for 2012. We were awarded the ‘UK Bank of the Year 2011’ by The Banker magazine for the third year running. We also received Moneyfacts 2012 awards for ‘Best Personal Finance Provider of the Year’ for the third consecutive year; ‘Best Current Account Provider’ for the new 1|2|3 Current Account and ‘Best Cash ISA Provider’; Card & Payments Trailblazer Awards 2012 ‘Best New Credit Card’; and Your Mortgage 2010-2011 ‘Best Direct Mortgage Lender’.
FUNDING, LIQUIDITY AND CAPITAL
Santander UK remained firmly focused on the UK with approximately 99% of its customer assets UK-related and approximately 85% of customer assets consisting of prime residential mortgages to UK customers. The non-UK element of our balance sheet related primarily to the United States. Our balance sheet has a minimal net exposure after collateral to eurozone peripheral countries, amounting to approximately 0.5% of total assets.
Customer assets were £0.5bn higher than at 30 June 2011. Increases in SME and corporate lending were partially offset by managed reductions in the retail mortgage and unsecured personal loan portfolios. Customer liabilities of £149.3bn increased relative to the year-end but were lower than at 30 June 2011, with outflows resulting from a management decision to switch funding away from rate-sensitive and shorter term deposits. This was offset by a successful ISA cross-tax year campaign, securing deposits with an attractive liquidity profile at relatively favourable margins in the first half of 2012. The loan-to-deposit ratio of 134% was 2 percentage points better than at 31 December 2011.
In the first half of 2012, £11.8bn of medium term funding was raised across a mix of sources and geographies, with only limited further issuance expected to be required in the second half. The cost of MTF issuance remains high compared to historic levels, but continues to be an attractive and important source of our diversified funding profile. We continued to be able to raise funds in wholesale markets even at times of great market uncertainty regarding the eurozone. Total liquid assets rose 23% in the half year to £69bn. This strengthened the conservative liquidity position of the balance sheet. Short-term funding balances have been actively reduced as part of the process of strengthening the balance sheet and reflecting our prudent liquidity profile.
The Core Tier 1 capital ratio increased to 12.2% at 30 June 2012. In July 2012, Santander UK launched an offer to buy back £1.9bn of certain debt capital instruments. The rate of take-up of this offer exceeded expectations and the scope of the offer was increased to meet demand.
KEY FINANCIAL HIGHLIGHTS
For the six months ended 30 June 2012, Santander UK’s profit before tax was £725m, 32% higher than the equivalent period in 2011 which included a provision of £731m for customer remediation, principally in relation to PPI.
| > | Income was down 16%, largely due to impacts associated with structural market conditions (low interest rates, increased MTF costs and higher liquidity costs). The most significant contributor was the impact of the sustained low interest rate environment given the run-off of structural hedges; |
| > | Costs were well controlled with expenses up only 1% on the equivalent period in 2011 despite inflation and investments in Corporate Banking and in Retail Banking customer-facing staff. In March 2012 we announced the closure of 56 branches where there was overlap following the combination of Abbey, Alliance & Leicester and Bradford & Bingley branch networks; |
| > | The cost-to-income ratio rose to 51%, from 42% in the first half of 2011, largely reflecting the fall in income; |
| > | Total credit provisions were 42% higher than in the first half of 2011. This was significantly due to continued pressures in the legacy non-core corporate loan portfolio and older commercial real estate exposures written before 2009. Corporate lending written in the last three years is continuing to perform better than expected to date. Mortgage NPLs coverage remained at 20% in the first half of 2012, consistent with the position at the end of 2011. |
THE ECONOMY AND UK REGULATION
The decline in economic activity (‘GDP’) in late 2011 continued into 2012, with GDP falling by 0.3% in the first quarter. The preliminary reading for the second quarter has shown a larger fall, of 0.5%, although the additional bank holiday in the quarter and the wet weather are reported to have a played a role in this and make the underlying trend more difficult to ascertain. The output figures are somewhat at variance with the employment figures so far in 2012. Over the period when output is reported to have fallen, employment has risen and the unemployment rate reduced to 8.0% in the three months to June.
With falling activity and heightened economic uncertainty, especially with regard to the prospects for the eurozone, additional quantitative easing was announced by the Monetary Policy Committee. Whilst the economic environment remains very challenging, the process of reducing the high level of public sector borrowing is continuing and demand for credit has remained subdued, prompting new policy measures. In the housing market, the number of loans approved for house purchase for the first half of 2012 was over 9% ahead of a year earlier, but part of this was due to the timing of the ending of the stamp duty relief for first-time buyers. In contrast, the mortgage market saw weaker remortgage activity in the first half of 2012, down 9% compared to a year ago. Overall, the level of housing market activity remains low relative to the experience of the previous decade.
The UK Government’s recent announcements on regulatory reform, particularly the Independent Commission on Banking (‘ICB’), imply considerable change is likely to be ahead for the banking industry. We believe that Santander UK is well placed to respond to these challenges.
LOOKING AHEAD
We believe that the remainder of 2012 and 2013 are likely to be tough for the UK banking industry. Macro-economic prospects have deteriorated markedly in recent months, and show little sign of recovery in the short term. This has inevitably affected the outlook for our profitability. Increased regulatory burdens, continued low interest rates and higher funding costs are expected to impact our results further. We will seek to mitigate the effects of these challenges and continue to tightly control costs in the coming years. A priority for 2012 is to further enhance the strength of our balance sheet. To that end we will continue to focus on maintaining the high quality of our lending, improving further our capital base and tightly managing the liquidity and funding positions.
We will continue to invest in the commercial transformation of the UK business. Our strategy remains for Santander UK to be a full-service, diversified, customer-centred commercial banking franchise and to emerge as the best bank in the country for our customers, our people and our investors. The progress we have made in becoming a full-service commercial bank is due to the effort and commitment of all our staff and I would like to extend my thanks for their hard work.
Innovation will continue be important to Santander UK. The 1|2|3 World product suite is designed to build and reinforce a long-term primary account relationship with retail customers. Putting customers at the forefront of our business is a key part of our focus and we plan to further improve and deepen our customer relationships by providing a tailored proposition and a competitive product range. We have made significant investment in improving our service quality and have further initiatives planned for the second half of the year and hope to see further improvements to customer satisfaction as a result.
A seamless handover for the retail and corporate customers involved in the planned RBS transaction is a core deliverable for both Santander UK and RBS. This is, however, a large and exceptionally complex migration. This complexity and our concern to ensure that the transfer happens smoothly for customers means that some aspects of the programme are taking longer than originally anticipated. Whilst final dates are not yet confirmed, we continue to work constructively with RBS on the detail of implementation, which will require FSA approval prior to formal implementation and completion.
Santander UK welcomes and will support recent initiatives announced by the UK Government and Bank of England to improve the flow of liquidity to UK banks to support lending to consumers and businesses.
Santander UK will continue to build on its record of strong corporate governance in risk management and compliance and to foster a professional culture that upholds high standards of ethical behaviour and puts customers’ interests first.

Ana Botín
Chief Executive Officer
BUSINESS AND FINANCIAL REVIEW
BUSINESS OVERVIEW
This Business and Financial Review contains forward-looking statements that involve inherent risks and uncertainties. Actual results may differ materially from those contained in such forward-looking statements. See “Forward-looking Statements” on page 2.
GENERAL
Santander UK plc (the ‘Company’) and its subsidiaries (together, ‘Santander UK’ or the ‘Group’) operate primarily in the UK, under UK law and regulation and are part of the Banco Santander, S.A. group (together with its subsidiaries, ‘Santander’). Santander UK is a significant financial services provider in the UK.
The structural relationship of Santander UK with the Santander group - the ‘subsidiary model’
The Santander group operates a ‘subsidiary model’. This model involves autonomous units, such as Santander UK, operating in core markets with each unit being responsible for its own liquidity, funding and capital management on an ongoing basis. The subsidiary model means that Banco Santander, S.A. has no obligation to provide any liquidity, funding or capital assistance, although it enables Banco Santander, S.A. to selectively take advantage of opportunities.
Under the subsidiary model, Santander UK primarily generates funding and liquidity through UK retail and corporate deposits, as well as in the financial markets through its own debt programmes and facilities to support its business activities and liquidity requirements. It does this in reliance on the strength of its balance sheet and profitability and its own network of investors. It does not rely on a guarantee from Santander or any other member of the Santander group to generate this funding or liquidity. Santander UK does not raise funds to finance other members of the Santander group or guarantee the debts of other members of the Santander group (other than certain of its own subsidiaries).
Exposures to other Santander group members are established and managed on an arm’s length commercial basis. All intergroup transactions are monitored by the Board Risk Committee of Santander UK and transactions which are not in the ordinary course of business must be pre-approved by the Board. In addition, Santander UK is subject to UK Financial Services Authority (‘FSA’) limits on exposures to, and on liquidity generated from, other members of the Santander group.
Planned acquisition of RBS branches (‘Project Rainbow’)
On 4 August 2010, the Company announced its agreement to acquire (subject to certain conditions) certain bank branches and business banking centres and associated assets and liabilities from RBS for a premium of £350m to net assets at closing. The consideration will be paid in cash and is subject to certain closing adjustments. The planned acquisition will further accelerate the delivery of the Company’s strategic goals. A seamless transfer of the retail and corporate customers involved is a core deliverable of the transaction for both the Company and RBS. The Company has progressed extensive work on its systems and products in preparation for the transfer and integration and is satisfied with the progress it has made. This is, however, a large and exceptionally complex migration. This complexity and concern to ensure that the transfer happens smoothly for customers means that some aspects of the integration programme are taking longer than originally anticipated. Whilst final dates are not yet confirmed, the Company continues to work constructively with RBS on the detail of implementation, which will require FSA approval prior to formal implementation and completion.
BUSINESS REVIEW - SUMMARY
Santander UK plc (‘the Company’ and its subsidiaries, together the ‘Group’ or ‘Santander UK’) sets out below its Interim Management Report for the six months ended 30 June 2012.
The results discussed below are not necessarily indicative of Santander UK’s results in future periods. The following information contains certain forward-looking statements. See “Forward-looking Statements” on page 2. The following discussion is based on and should be read in conjunction with the Condensed Consolidated Interim Financial Statements elsewhere in this Half Yearly Financial Report.
INTRODUCTION
Santander UK has prepared this Business and Financial Review in a manner consistent with the way management views the business as a whole. As a result, we present the following key sections to the Business and Financial Review:
| > | Business Review - Summary - this contains an explanation of the basis of our results and any potential changes to that basis in the future; and a summarised consolidated income statement with commentary thereon by line item; | |
| > | Divisional Results - this contains a summary of the results, and commentary thereon, for each segment; | |
| > | Balance Sheet Business Review - this contains a description of our significant assets and liabilities and our strategy and reasons for entering into such transactions, including: | |
| > | Summarised consolidated balance sheet - together with commentary on key movements, as well as analyses of the principal assets and liabilities; | |
| > | Off-Balance Sheet disclosures - a summary of our off-balance sheet arrangements, their business purpose, and importance to us; | |
| > | Capital disclosures - an analysis of our capital needs and composition; and | |
| > | Liquidity disclosures - an analysis of our sources and uses of liquidity and cash flows. | |
Basis of results presentation
The information in this Business and Financial Review reflects the reporting structure in place at the reporting date in accordance with which the segmental information in Note 2 to the Condensed Consolidated Interim Financial Statements has been presented.
The Company’s board of directors (the ‘Board’) is the chief operating decision maker for the Group. The segment information below is presented on the basis used by the Board to evaluate performance and allocate resources. The Board reviews discrete financial information for each segment of the business which follows the Group’s normal accounting policies and principles, including measures of operating results, assets and liabilities.
In the first half of 2012, certain non-core portfolios were transferred to Corporate Centre (formerly known as Group Infrastructure) where this was felt to be more appropriate for the management of these assets and liabilities. The non-core portfolios transferred into Corporate Centre included certain Social Housing assets and commercial mortgage loans, previously managed within Corporate Banking. With respect to the former, even though there are no credit concerns the terms of these loans are unfavourable in the current funding environment. The latter are typically medium to long-term arrangements primarily written via agents or intermediaries. The Group’s intention is to hold these assets to maturity and as such the balances will gradually decrease over time. The corporate legacy portfolio in run-off (largely relating to assets acquired as part of the acquisition of Alliance & Leicester) was also transferred to Corporate Centre from Corporate Banking. Non-core customer deposits are financial intermediary/institutional deposits which are managed centrally for liquidity purposes, most of which were previously managed within Corporate Banking or Markets. In addition, the management of reorganisation, customer remediation, and other costs, and hedging and other variances has been transferred to Corporate Centre, principally from Retail Banking.
The prior period’s segmental analysis has been adjusted to reflect the fact that reportable segments have changed.
GROUP SUMMARY
SUMMARISED CONSOLIDATED INCOME STATEMENT AND SELECTED RATIOS
Six months ended 30 June 2012 £m | Six months ended 30 June 2011 £m | |||||||
| Net interest income | 1,559 | 1,981 | ||||||
| Non-interest income | 671 | 686 | ||||||
| Total operating income | 2,230 | 2,667 | ||||||
| Administrative expenses | (1,010 | ) | (985 | ) | ||||
| Depreciation, amortisation and impairment | (120 | ) | (138 | ) | ||||
| Total operating expenses excluding provisions and charges | (1,130 | ) | (1,123 | ) | ||||
| Impairment losses on loans and advances | (368 | ) | (259 | ) | ||||
| Provisions for other liabilities and charges | (7 | ) | (736 | ) | ||||
| Total operating provisions and charges | (375 | ) | (995 | ) | ||||
| Profit before tax | 725 | 549 | ||||||
| Taxation charge | (175 | ) | (136 | ) | ||||
| Profit for the period | 550 | 413 | ||||||
| 30 June 2012 | 31 December 2011 | |||||||
| Core Tier 1 capital ratio (%) | 12.2 | % | 11.4 | % | ||||
| Total capital ratio (%) | 21.7 | % | 20.6 | % | ||||
| Risk weighted assets | £ | 77,443m | £ | 77,455m | ||||
Six months ended 30 June 2012 compared to six months ended 30 June 2011
Profit before tax increased by £176m to £725m (2011: £549m), benefiting from the non-recurrence of the significant customer remediation provision, principally in relation to payment protection insurance ('PPI'), of £731m before tax made in the first half of 2011. Profit before tax continued to be adversely impacted by structural changes in the market including holding higher levels of liquid assets, higher funding costs and the low interest rate environment. By income statement line, the movements were:
| > | Net interest income decreased by £422m to £1,559m (2011: £1,981m). The key drivers of the decrease were sustained lower interest rates which reduced income earned on the structural hedge and the increased cost of term funding and retail deposits. In addition, interest on overdraft accounts was lower with interest charges replaced by daily fees, included within non-interest income. These decreases were partly offset by the favourable impact in Retail Banking of improved lending margins as more customers reverted to standard variable rate mortgages in the current low interest rate environment, and improved margins on new business in both the mortgage and unsecured loan portfolios. Within Corporate Banking, net interest income increased as a result of growth in customer loans, with much of this growth generated through our network of 33 regional Corporate Business Centres which serve our clients in the UK SME market (total SME lending balances increased by 18% compared to 30 June 2011). Interest margins on loans continued to improve as market pricing better reflected incremental higher funding and liquidity costs. |
| > | Non interest income decreased by £15m to £671m (2011: £686m). In Retail Banking, the increase in fees driven by the replacement of overdraft net interest income with daily fees was more than offset by a decrease in monthly overdraft fees charged to customers, a change in the mix of fees charged, and a higher volume of fees waived. Within Corporate Banking, non interest income increased reflecting volume growth in the core businesses, particularly SMEs, resulting in increases in income from treasury services, banking and cash transmission services, invoice discounting and asset finance. In Markets, the increase was largely driven by relative improvements in the Fixed Income business (especially in the first quarter) where there was a lack of profitable business in the market in the prior year. In Corporate Centre, the decrease in non interest income was principally due to increased repo costs relating to the management of the liquid asset buffer being reported in net trading and other income, lower operating lease income reflecting reduced non-core assets and some losses on mark-to-market volatility. |
| > | Administrative expenses increased by only £25m to £1,010m (2011: £985m), despite inflation and continued investment in the business including five newly-opened regional Corporate Business Centres. |
| > | Depreciation, amortisation and impairment costs decreased by £18m to £120m (2011: £138m). The decrease reflected lower software depreciation costs following the impairment of certain intangible assets in December 2011. |
| > | Impairment losses on loans and advances increased by £109m to £368m (2011: £259m). The increase was partly due to higher impairment losses in the non-core corporate portfolios in Corporate Centre primarily a result of increased stress in the legacy portfolios in run-off of shipping and structured finance, as well as other legacy commercial real estate exposures written before 2009, particularly within the care home and leisure industry sectors. The overall increase also reflected the increase in levels of non-performing mortgage loans in Retail Banking following changes in collections policy. The underlying performance of the mortgage book remains broadly stable due to the continued low interest rate environment and the high quality of the book. |
| > | Provisions for other liabilities and charges decreased by £729m to £7m (2011: £736m). The decrease primarily reflected the non-recurrence of the significant charge for customer remediation, principally payment protection insurance, incurred in the six months ended 30 June 2011 as described in Note 25 to the Condensed Consolidated Interim Financial Statements. |
Taxation
The tax on the Group’s profit before tax differs from the theoretical amount that would arise using the basic corporation tax rate of the Company as follows:
Six months ended 30 June 2012 £m | Six months ended 30 June 2011 £m | |||||||
| Profit before tax | 725 | 549 | ||||||
| Tax calculated at a tax rate of 24.5% (2011: 26.5%) | 178 | 145 | ||||||
| Non deductible preference dividends paid | 1 | 1 | ||||||
| Non deductible UK Bank Levy | 10 | — | ||||||
| Effect of non-taxable income, non-allowable impairment losses, provisions and other non-equalised items | (17 | ) | (13 | ) | ||||
| Effect of non-UK profits and losses | (1 | ) | (1 | ) | ||||
| Effect of change in tax rate on deferred tax provision | 8 | 10 | ||||||
| Adjustment to prior period provisions | (4 | ) | (6 | ) | ||||
| Tax expense | 175 | 136 | ||||||
| Effective tax rate | 24.1 | % | 24.8 | % | ||||
Six months ended 30 June 2012 compared to six months ended 30 June 2011
The effective tax rate for the first six months of 2012, based on profit before tax was 24.1% (2011: 24.8%). The effective tax rate differed from the UK corporation tax rate of 24.5% (2011: 26.5%) principally because of the effect of non-equalised items, the reduction in deferred tax asset as a result of the change in the tax rate and the impact of the non-deductible UK Bank Levy.
CUSTOMER ASSETS AND LIABILITIES
| 30 June 2012 | 31 December 2011 | 30 June 2011 | ||||||||||
| £bn | £bn | £bn | ||||||||||
| Customer assets: | ||||||||||||
| Retail Banking | 172.2 | 175.4 | 174.6 | |||||||||
| Corporate Banking | 19.1 | 19.0 | 15.7 | |||||||||
| Corporate Centre | 11.3 | 11.9 | 11.8 | |||||||||
| 202.6 | 206.3 | 202.1 | ||||||||||
| - of which SME loans | 11.4 | 10.7 | 9.6 | |||||||||
| Customer liabilities: | ||||||||||||
| Retail Banking | 120.7 | 117.7 | 121.2 | |||||||||
| Corporate Banking | 14.9 | 15.8 | 15.0 | |||||||||
| Corporate Centre | 13.7 | 15.7 | 17.1 | |||||||||
| 149.3 | 149.2 | 153.3 | ||||||||||
LENDING AND DEPOSIT FLOWS
| Six months ended | Six months ended | |||||||||||
| 30 June 2012 | 30 June 2011 | Change | ||||||||||
| £bn | £bn | £bn | ||||||||||
| Customer Net Lending | ||||||||||||
| Retail Banking | (3.2 | ) | (0.9 | ) | (2.3 | ) | ||||||
| Corporate Banking | 0.1 | 1.0 | (0.9 | ) | ||||||||
| Corporate Centre | (0.6 | ) | (0.1 | ) | (0.5 | ) | ||||||
| Total | (3.7 | ) | — | (3.7 | ) | |||||||
| Customer Net Deposit Flows | ||||||||||||
| Retail Banking | 3.0 | (1.7 | ) | 4.7 | ||||||||
| Corporate Banking | (0.9 | ) | 1.1 | (2.0 | ) | |||||||
| Corporate Centre | (2.0 | ) | 0.5 | (2.5 | ) | |||||||
| Total | 0.1 | (0.1 | ) | 0.2 | ||||||||
| > | Customer assets of £202.6bn decreased relative to the year-end but were higher than at 30 June 2011. Increases in SME and corporate lending were more than offset by managed reductions in the retail mortgage and unsecured personal loan portfolios. |
| > | Customer liabilities of £149.3bn increased relative to the year-end but were lower than at 30 June 2011, with outflows resulting from a management decision to switch funding away from rate-sensitive and shorter term deposits. This was offset by a successful cross tax year ISA campaign, securing deposits with an attractive liquidity profile at relatively favourable margins in the first half of 2012. The first six months of 2012 also benefited from £1.3bn increase in current account balances following the launch of the 1|2|3 account. |
CAPITAL
Discussion and analysis of the Core Tier 1 capital ratio, the total capital ratio and risk-weighted assets is set out in the “Balance Sheet Business Review – Capital management and resources” on pages 40 to 44.
Business Review – Divisional Results
This section contains a summary of the results, and commentary thereon, by Income Statement line item for each segment.
PROFIT BEFORE TAX BY SEGMENT
| 30 June 2012 | Retail Banking £m | Corporate Banking £m | Markets £m | Corporate Centre £m | Total £m | |||||||||||||||
| Net interest income/(expense) | 1,594 | 191 | (3 | ) | (223 | ) | 1,559 | |||||||||||||
| Non-interest income | 330 | 199 | 137 | 5 | 671 | |||||||||||||||
| Total operating income/(expense) | 1,924 | 390 | 134 | (218 | ) | 2,230 | ||||||||||||||
| Administration expenses | (796 | ) | (139 | ) | (54 | ) | (21 | ) | (1,010 | ) | ||||||||||
| Depreciation, amortisation and impairment | (89 | ) | (8 | ) | (1 | ) | (22 | ) | (120 | ) | ||||||||||
| Total operating expenses excluding provisions and charges | (885 | ) | (147 | ) | (55 | ) | (43 | ) | (1,130 | ) | ||||||||||
| Impairment losses on loans and advances | (234 | ) | (61 | ) | — | (73 | ) | (368 | ) | |||||||||||
| Provisions for other liabilities and charges | (4 | ) | — | — | (3 | ) | (7 | ) | ||||||||||||
| Total operating provisions and charges | (238 | ) | (61 | ) | — | (76 | ) | (375 | ) | |||||||||||
| Profit/(loss) before tax | 801 | 182 | 79 | (337 | ) | 725 | ||||||||||||||
| 30 June 2011 | Retail Banking £m | Corporate Banking £m | Markets £m | Corporate Centre £m | Total £m | |||||||||||||||
| Net interest income/(expense) | 1,693 | 171 | (2 | ) | 119 | 1,981 | ||||||||||||||
| Non-interest income | 374 | 184 | 86 | 42 | 686 | |||||||||||||||
| Total operating income | 2,067 | 355 | 84 | 161 | 2,667 | |||||||||||||||
| Administration expenses | (795 | ) | (119 | ) | (51 | ) | (20 | ) | (985 | ) | ||||||||||
| Depreciation, amortisation and impairment | (103 | ) | (6 | ) | (1 | ) | (28 | ) | (138 | ) | ||||||||||
| Total operating expenses excluding provisions and charges | (898 | ) | (125 | ) | (52 | ) | (48 | ) | (1,123 | ) | ||||||||||
| Impairment losses on loans and advances | (172 | ) | (59 | ) | — | (28 | ) | (259 | ) | |||||||||||
| Provisions for other liabilities and charges | — | — | — | (736 | ) | (736 | ) | |||||||||||||
| Total operating provisions and charges | (172 | ) | (59 | ) | — | (764 | ) | (995 | ) | |||||||||||
| Profit/(loss) before tax | 997 | 171 | 32 | (651 | ) | 549 | ||||||||||||||
RETAIL BANKING
Retail Banking offers a comprehensive range of banking products and related financial services (residential mortgages, savings and banking, and other personal financial services products) to customers throughout the UK. It serves customers through the Santander UK network of branches and ATMs, as well as through telephone, internet channels and intermediaries. It also includes the private banking business which offers private banking and other specialist banking services to our customers.
Summarised income statement
Six months ended 30 June 2012 £m | Six months ended 30 June 2011 £m | |||||||
| Net interest income | 1,594 | 1,693 | ||||||
| Non-interest income | 330 | 374 | ||||||
| Total operating income | 1,924 | 2,067 | ||||||
| Administration expenses | (796 | ) | (795 | ) | ||||
| Depreciation, amortisation and impairment | (89 | ) | (103 | ) | ||||
| Total operating expenses excluding provisions and charges | (885 | ) | (898 | ) | ||||
| Impairment losses on loans and advances | (234 | ) | (172 | ) | ||||
| Provisions for other liabilities and charges | (4 | ) | — | |||||
| Total operating provisions and charges | (238 | ) | (172 | ) | ||||
| Profit before tax | 801 | 997 | ||||||
Segment balances
30 June 2012 £bn | 31 December 2011 £bn | |||||||
| Customer assets | 172.2 | 175.4 | ||||||
| Risk weighted assets | 39.3 | 40.1 | ||||||
| Customer deposits | 120.7 | 117.7 | ||||||
Mortgage NPLs ratio(1) | 1.57 | % | 1.46 | % | ||||
Mortgage coverage ratio(1)(2) | 20 | % | 20 | % | ||||
(1) Accrued interest is excluded for purposes of these analyses.
(2) Mortgage impairment loss allowances as a percentage of mortgage NPLs.
Business volumes
| 30 June 2012 | 30 June 2011 | Change | ||||||||||
Mortgage gross lending (1) | £ | 8.7bn | £ | 9.7bn | £ | (1.0 | )bn | |||||
Mortgage net lending (1) | £ | (2.8 | )bn | £ | (0.4 | )bn | £ | (2.4 | )bn | |||
| UPL gross lending | £ | 0.6bn | £ | 0.7bn | £ | (0.1 | )bn | |||||
| Retail deposit flows | £ | 3.0bn | £ | (1.7 | )bn | £ | 4.7bn | |||||
| Investment sales API | £ | 1.0bn | £ | 1.5bn | £ | (0.5 | )bn | |||||
| Residential retail mortgage loans | £ | 163.2bn | £ | 165.2bn | £ | (2.0 | )bn | |||||
| Unsecured personal loans (‘UPLs’) | £ | 2.6bn | £ | 3.1bn | £ | (0.5 | )bn | |||||
Bank account openings (2) (000’s) | 448 | 409 | 39 | |||||||||
Credit card sales (3) (000’s) | 356 | 274 | 82 | |||||||||
Market share (4) | ||||||||||||
| Mortgage gross lending | 12.9 | % | 15.2 | % | (2.3 | %) | ||||||
| Mortgage stock | 13.6 | % | 13.8 | % | (0.2 | %) | ||||||
| Bank account stock | 9.2 | % | 9.1 | % | 0.1 | % | ||||||
| (1) | Includes Social Housing loans held within Corporate Centre, to align with CML reporting. |
| (2) | Bank account openings include personal, SME and private banking current accounts. |
| (3) | Credit card sales only include personal credit cards distributed through the branches. |
| (4) | Market share of mortgage gross lending and mortgage stock estimated by Santander UK for each half, having regard to individual lending data published by the Bank of England for the first five months of each half year. Historic data is adjusted to reflect actual data published for the period. Market share of bank account stock estimated by Santander UK for each half year, having regard to market research published by CACI. |
Retail Banking profit before tax
Six months ended 30 June 2012 compared to six months ended 30 June 2011
Profit before tax decreased by £196m to £801m (2011: £997m). By income statement line, the movements were:
| > | Net interest income decreased by £99m to £1,594m (2011: £1,693m). The key drivers of the decrease in net interest income were the higher cost of retail deposits, and the higher cost of new term funding applied to the business. In addition, interest on overdraft accounts was lower with interest charges replaced by daily fees, which are included within non-interest income. These decreases were partly offset by the favourable impact of improved lending margins as more customers reverted to standard variable rate mortgages in the current low interest rate environment, and improved margins on new business in both the mortgage and unsecured loan portfolios. |
| > | Non-interest income decreased by £44m to £330m (2011: £374m). The replacement of overdraft net interest income with daily fees as a result of the new pricing structure for current accounts resulted in higher fees, but these were more than offset by a decrease in monthly overdraft fees charged to customers, a change in the mix of fees charged, and a higher volume of fees waived. |
| > | Administration expenses were broadly flat at £796m (2011: £795m). Reduced costs driven by further efficiencies were largely offset by increased investment in new Retail Banking products. |
| > | Depreciation and amortisation expenses decreased by £14m to £89m (2011: £103m). The decrease reflected lower software depreciation costs following the impairment of certain intangible assets in December 2011. |
| > | Impairment losses on loans and advances increased by £62m to £234m (2011: £172m), with most of the increase relating to mortgages and unsecured loans. The increase in mortgages was largely due to the increase in the level of non-performing mortgage loans following a change in collections policy. The underlying performance remains broadly stable due to the continued low interest rate environment and the high quality of the book. The increase in UPL provisions largely reflects the strengthening of reserve levels. Secured coverage remained conservative at 20%, whilst the stock of properties in possession (‘PIP’) increased slightly to 999 cases from 965 at 31 December 2011 and 939 at 30 June 2011. This level of PIP represented only 0.06% of the portfolio and remained well below the industry average. |
| > | Provisions for other liabilities and charges increased by £4m to £4m (2011: £nil). |
Retail Banking segment balances
| > | Customer assets decreased by 2% to £172.2bn (2011: £175.4bn) due to management actions taken to tighten the lending criteria associated with higher loan-to-value and interest-only mortgages. |
| > | Risk weighted assets decreased by 2% to £39.3bn (2011: £40.1bn), reflecting the reduction in the mortgage asset and the 9% reduction in unsecured personal loans. |
| > | Customer deposits increased by 3% to £120.7bn (2011: £117.7bn) (but were 0.4% lower than at 30 June 2011). The first six months of 2012 benefited from a strong cross tax year ISA campaign and £1.3bn of current account balance growth following the launch of the new 1|2|3 account. During the 12 month period from 30 June 2011, the benefit of the strong cross tax year ISA campaign and current account balance growth was more than offset by a reduction in short-term and rate-sensitive deposits that offered limited long-term relationship opportunities. |
| > | The mortgage NPL ratio increased to 1.57% (December 2011: 1.46%). The underlying performance remained broadly stable, with the overall increase largely due to a change in NPL collections policy resulting in more cases being classified as NPL’s. In addition, a small portion of the increase in the ratio was driven by the asset reduction. The mortgage NPL ratio remained considerably below the UK industry average based on Council of Mortgage Lenders (‘CML’) published data. |
| > | The strong mortgage coverage ratio has been maintained at 20% (2011: 20%). |
Retail Banking business volumes
| > | Mortgage gross lending in the first half of 2012 was £8.7bn, equivalent to a market share of 12.9%, with £2.8bn negative net lending due to a managed reduction in the mortgage stock. The expectation for the second half is for a further managed reduction in the mortgage stock and a lower market share. |
| > | Total gross unsecured personal lending in the first half of 2012 decreased by 14% to £0.6bn due to lending continuing to focus on higher credit quality customers focusing on existing customers. The de-leveraging of the unsecured personal loans book resulted in a 15% reduction in the asset to £2.6bn. |
| > | Bank account openings were up 10%, primarily due to the new 1|2|3 Current Account launched in March 2012. |
| > | Credit card sales through the Santander brand of approximately 356,000 cards grew by 30% with a continued focus on existing customers, and benefiting from approximately 303,000 new 1|2|3 credit cards opened in the first half of 2012. |
CORPORATE BANKING
Santander UK started to develop its corporate banking capability in 2006 and, with the acquisition of Alliance & Leicester plc, significantly increased this capacity from 2008. The investment in, and development of, these operations has been significant, with good progress being made ahead of the acquisition of certain customers from RBS.
Corporate Banking provides a range of banking services principally to UK companies, with a focus on services for SMEs, providing a broad range of banking products including loans, bank accounts, deposits, treasury services, invoice discounts, cash transmission and asset finance. Small businesses with a turnover of less than £250,000 are serviced through the Business Banking division, while a network of 33 regionally-based Corporate Business Centres offers services to businesses with a turnover of £250,000 to £150m. In addition, Corporate Banking includes specialist teams servicing Real Estate, Social Housing and UK infrastructure clients.
Within Corporate Banking, the Large Corporates business is responsible for larger multinational corporate clients, including related activities principally comprising foreign exchange, money market and credit activities. These related activities are structured into two main product areas: Foreign exchange and money markets, and Credit. Foreign exchange offers a range of foreign exchange products and money markets runs the securities lending/borrowing and repo businesses. Credit originates loan and bond transactions in primary markets as well as their intermediation in secondary markets.
Summarised income statement
Six months ended 30 June 2012 £m | Six months ended 30 June 2011 £m | |||||||
| Net interest income | 191 | 171 | ||||||
| Non-interest income | 199 | 184 | ||||||
| Total operating income | 390 | 355 | ||||||
| Administration expenses | (139 | ) | (119 | ) | ||||
| Depreciation, amortisation and impairment | (8 | ) | (6 | ) | ||||
| Total operating expenses excluding provisions and charges | (147 | ) | (125 | ) | ||||
| Impairment losses on loans and advances | (61 | ) | (59 | ) | ||||
| Total operating provisions and charges | (61 | ) | (59 | ) | ||||
| Profit before tax | 182 | 171 | ||||||
Segment balances
30 June 2012 £bn | 31 December 2011 £bn | |||||||
| Total customer assets | 19.1 | 19.0 | ||||||
| Corporate SMEs | 9.8 | 9.1 | ||||||
Total SMEs(1) | 11.4 | 10.7 | ||||||
| Risk weighted assets | 20.4 | 20.1 | ||||||
| Customer deposits | 14.9 | 15.8 | ||||||
(1) Total SMEs includes assets held within Corporate Centre
Corporate Banking profit before tax
Six months ended 30 June 2012 compared to six months ended 30 June 2011
Profit before tax increased by £11m to £182m (2011: £171m). By income statement line, the movements were:
| > | Net interest income increased by £20m to £191m (2011: £171m) as a result of growth in customer loans, with much of this growth generated through the network of 33 regional Corporate Business Centres which serve our clients in the UK SME market (SME lending balances increased by 8% compared to 31 December 2011 and by 24% compared to 30 June 2011). Interest margins on loans continued to improve as market pricing better reflected incremental higher funding and liquidity costs. |
| > | Non-interest income increased by £15m to £199m (2011: £184m). Volume growth in the SME business resulted in increases in income from treasury services, banking and cash transmission services, invoice discounting and asset finance. |
| > | Administration expenses increased by £20m to £139m (2011: £119m). The increase reflected the continued investment in the growth of the business. During the first six months of 2012 we opened five regional Corporate Business Centres and significantly increased our capacity to serve small and medium sized businesses by recruiting 175 customer-facing people into our business. |
| > | Depreciation and amortisation increased by £2m to £8m (2011: £6m) due to the continued investment in the IT systems to support growth in the business banking and Corporate business. |
| > | Impairment losses on loans and advances increased by £2m to £61m (2011: £59m), with the credit quality of business written in the last three years continuing to perform better than expected to date. |
Corporate Banking segment balances
| > | Total customer assets increased by 1% to £19.1bn (2011: £19.0bn) (22% higher than at 30 June 2011) driven by a strong performance via our 33 regional Corporate Business Centres and a broader product offering. We continued to build our growing SME franchise, with lending to this group totalling £9.8bn, an increase of 8% compared to 31 December 2011 (24% compared to 30 June 2011). This was largely offset by the early repayment of a significant large corporate loan in the first six months of 2012. |
| > | Risk weighted assets increased by 2% to £20.4bn (2011: £20.1bn) due to higher SME and specialised lending. |
| > | Customer deposits decreased by 6% to £14.9bn (2011: £15.8bn) as a result of outflows occurring in the second quarter of 2012 following ratings agency downgrades and continued eurozone economic uncertainty. Notwithstanding this, the deposit base proved to be resilient. The division continues to focus on maintaining strong relationships with its core clients, as this has served us well over the period. |
MARKETS
Markets is a financial markets business focused on providing value added financial services to financial institutions, as well as to the rest of Santander UK’s business. It is structured into two main product areas: Fixed income and Equity. Fixed Income covers sales and trading activity for fixed income products. Equity covers equity derivatives, property derivatives and commodities. Equity derivatives activities include the manufacture of structured products sold to both the Group and other financial institutions who sell or distribute them on to their customers.
Summarised income statement
Six months ended 30 June 2012 £m | Six months ended 30 June 2011 £m | |||||||
| Net interest expense | (3 | ) | (2 | ) | ||||
| Non-interest income | 137 | 86 | ||||||
| Total operating income | 134 | 84 | ||||||
| Administration expenses | (54 | ) | (51 | ) | ||||
| Depreciation, amortisation and impairment | (1 | ) | (1 | ) | ||||
| Total operating expenses excluding provisions and charges | (55 | ) | (52 | ) | ||||
| Profit before tax | 79 | 32 | ||||||
Segment balances
30 June 2012 £bn | 31 December 2011 £bn | |||||||
| Total assets | 27.2 | 28.7 | ||||||
| Risk weighted assets | 6.8 | 5.8 | ||||||
Markets profit before tax
Six months ended 30 June 2012 compared to six months ended 30 June 2011
Profit before tax increased by £47m to £79m (2011: £32m). By income statement line, the movements were:
| > | Net interest expense increased by £1m to £3m (2011: £2m) due to increased funding costs reflecting the higher cost of new wholesale medium-term funding. |
| > | Non-interest income increased by £51m to £137m (2011: £86m), largely driven by relative improvements in the Fixed Income business (especially in the first quarter) where there was a lack of profitable business in the market in the prior year. |
| > | Administration expenses increased by £3m to £54m (2011: £51m), reflecting continued investment in growth initiatives relating to new products, markets and customer segments. |
| > | Depreciation and amortisation was unchanged at £1m. |
Markets segment balances
| > | Total assets decreased by 5% to £27.2bn (2011: £28.7bn), primarily reflecting a decrease in fair values of interest rate derivatives as a result of upward shifts in yield curves. There was a corresponding decrease in derivatives liabilities. |
| > | Risk weighted assets increased by 17% to £6.8bn (2011: £5.8bn) due to higher levels of trading activity increasing the stressed VaR. |
CORPORATE CENTRE
Corporate Centre (formerly known as Group Infrastructure) consists of Asset and Liability Management (‘ALM’), which is responsible for the Group’s capital, and certain non-core and legacy portfolios being run-down and/or managed for value. ALM is responsible for managing the Group’s structural balance sheet composition and strategic and tactical liquidity risk management. This includes short-term and medium-term funding, covered bond and securitisation programmes. ALM's responsibilities also include management of Santander UK’s banking products and structural exposure to interest rates.
Summarised income statement
Six months ended 30 June 2012 £m | Six months ended 30 June 2011 £m | |||||||
| Net interest (expense)/ income | (223 | ) | 119 | |||||
| Non-interest income | 5 | 42 | ||||||
| Total operating (expense)/income | (218 | ) | 161 | |||||
| Administration expenses | (21 | ) | (20 | ) | ||||
| Depreciation, amortisation and impairment | (22 | ) | (28 | ) | ||||
| Total operating expenses excluding provisions and charges | (43 | ) | (48 | ) | ||||
| Impairment losses on loans and advances | (73 | ) | (28 | ) | ||||
| Provisions for other liabilities and charges | (3 | ) | (736 | ) | ||||
| Total operating provisions and charges | (76 | ) | (764 | ) | ||||
| Loss before tax | (337 | ) | (651 | ) | ||||
Segment balances
30 June 2012 £bn | 31 December 2011 £bn | |||||||
| Customer assets | 11.3 | 11.9 | ||||||
| Risk weighted assets | 10.9 | 11.5 | ||||||
| Customer deposits | 13.7 | 15.7 | ||||||
Corporate Centre loss before tax
Six months ended 30 June 2012 compared to six months ended 30 June 2011
Loss before tax decreased by £314m to £337m (2011: £651m). By income statement line, the movements were:
| > | Net interest (expense)/income decreased by £342m to £(223)m (2011: £119m). The key drivers of the decrease were sustained lower interest rates which reduced income earned on the net structural position and the increased cost of term funding. The latter was partially offset by the allocation of some of these impacts to business units in line with the ongoing customer repricing. |
| > | Non-interest income decreased by £37m to £5m (2011: £42m), principally due to increased repo costs relating to the management of the liquid asset buffer being reported in net trading and other income, lower operating lease income reflecting reduced non-core assets and some losses on mark-to-market volatility. |
| > | Administration expenses increased by £1m to £21m (2011: £20m). |
| > | Depreciation and amortisation decreased by £6m to £22m (2011: £28m), due to lower operating lease depreciation resulting from lower balances in the non-core portfolio in run-off following the continued de-leveraging process. |
| > | Impairment losses on loans and advances increased by £45m to £73m (2011: £28m) due to the non-core corporate portfolios primarily a result of increased stress in the legacy portfolios in run-off of shipping, structured finance and real estate, as well as other legacy commercial real estate exposures written before 2009, particularly within the care home and leisure industry sectors. |
| > | Provisions for other liabilities and charges decreased by £733m to £3m (2011: £736m). The decrease primarily reflected the non-recurrence of the significant charge for customer remediation, principally payment protection insurance, incurred in the six months ended 30 June 2011 as described in Note 25 to the Condensed Consolidated Interim Financial Statements. |
Corporate Centre segment balances
| > | Customer assets decreased by 5% to £11.3bn (2011: £11.9bn) due to the run-down of the non-core portfolios and changes in credit spreads on Social housing loans accounted for at fair value. |
| > | Risk-weighted assets decreased by 5% to £10.9bn (2011: £11.5bn) in line with the reduction in customer assets. |
| > | Customer deposits decreased by 13% to £13.7bn (2011: £15.7bn), as a result of outflows of institutional balances occurring in the second quarter of 2012 following ratings agency downgrades and continued eurozone economic uncertainty. |
BALANCE SHEET BUSINESS REVIEW
Throughout this section, references to UK and non-UK, in the geographic analysis, refer to the location of the office where the transaction is recorded.
SUMMARY
This balance sheet business review describes the Group’s significant assets and liabilities and its strategy and reasons for entering into such transactions. The balance sheet business review is divided into the following sections:
| Page | ||
| Summarised consolidated balance sheet | 23 | |
| In the remaining sections of the Balance Sheet Business Review, the principal assets and liabilities are summarised by their nature, rather than by their classification in the balance sheet. | ||
| Reconciliation to classifications in the Consolidated Balance Sheet | 26 | |
Securities: | 27 | |
| > | Analysis by type of issuer | 27 |
Loans and advances to customers: | 27 | |
| > | Impairment loss allowances on loans and advances to customers | 27 |
| Country risk exposure | 28 | |
| > | Sovereign debt | 30 |
| > | Other country risk exposures | 31 |
| > | Peripheral eurozone countries | 32 |
| > | Balances with other Santander companies | 33 |
| > | Redenomination risk | 36 |
| Derivative assets and liabilities | 37 | |
| Tangible fixed assets | 37 | |
| Deposits by banks | 37 | |
| Deposits by customers | 38 | |
| Short-term borrowings | 38 | |
| Debt securities in issue | 39 | |
| Retirement benefit assets and obligations | 39 | |
| Off-balance sheet arrangements | 39 | |
| Capital management and resources | 40 | |
| Funding and Liquidity | 45 | |
| > | Sources of funding and liquidity | 45 |
| > | Encumbrance | 46 |
| > | Funding sources, including wholesale funding | 46 |
| > | Credit rating | 47 |
| > | Liquid assets | 48 |
| > | Uses of funding and liquidity | 48 |
| > | Cash flows | 49 |
| Interest rate sensitivity | 50 | |
| Average balance sheet | 51 | |
SUMMARISED CONSOLIDATED BALANCE SHEET
30 June 2012 £m | 31 December 2011 £m | |||||||
| Assets | ||||||||
| Cash and balances at central banks | 30,067 | 25,980 | ||||||
| Trading assets | 32,833 | 21,891 | ||||||
| Derivative financial instruments | 30,549 | 30,780 | ||||||
| Financial assets designated at fair value | 4,221 | 5,005 | ||||||
| Loans and advances to banks | 2,496 | 4,487 | ||||||
| Loans and advances to customers | 198,323 | 201,069 | ||||||
| Available for sale securities | 4,851 | 46 | ||||||
| Loans and receivables securities | 1,399 | 1,771 | ||||||
| Macro hedge of interest rate risk | 1,215 | 1,221 | ||||||
| Property, plant and equipment | 1,544 | 1,596 | ||||||
| Retirement benefit assets | 411 | 241 | ||||||
| Tax, intangibles and other assets | 3,625 | 3,487 | ||||||
| Total assets | 311,534 | 297,574 | ||||||
| Liabilities | ||||||||
| Deposits by banks | 15,249 | 11,626 | ||||||
| Deposits by customers | 149,340 | 148,342 | ||||||
| Derivative financial instruments | 28,639 | 29,180 | ||||||
| Trading liabilities | 28,235 | 25,745 | ||||||
| Financial liabilities designated at fair value | 4,977 | 6,837 | ||||||
| Debt securities in issue | 62,176 | 52,651 | ||||||
| Subordinated liabilities | 6,558 | 6,499 | ||||||
| Retirement benefit obligations | 36 | 216 | ||||||
| Tax, other liabilities and provisions | 2,963 | 3,812 | ||||||
| Total liabilities | 298,173 | 284,908 | ||||||
| Equity | ||||||||
| Total shareholders’ equity | 13,361 | 12,666 | ||||||
| Total equity | 13,361 | 12,666 | ||||||
| Total liabilities and equity | 311,534 | 297,574 | ||||||
A more detailed consolidated balance sheet is contained in the Condensed Consolidated Interim Financial Statements.
Assets
Cash and balances at central banks
Cash and balances held at central banks increased by 16% to £30,067m at 30 June 2012 (31 December 2011: £25,980m) due to increased holdings of liquid assets maintained with the Bank of England as part of the Group’s liquidity management activity.
Trading assets
Trading assets increased by 50% to £32,833m at 30 June 2012 (31 December 2011: £21,891m). The increase principally reflected the higher repurchase agreements activity during the period.
Derivative assets
Derivative assets decreased by 1% to £30,549m at 30 June 2012 (31 December 2011: £30,780m). The decrease was driven by a decrease in fair values of interest rate derivatives as a result of upward shifts in yield curves. There was a corresponding decrease in derivatives liabilities.
Financial assets designated at fair value through profit and loss
Financial assets designated at fair value through profit and loss decreased by 16% to £4,221m at 30 June 2012 (31 December 2011: £5,005m). The decrease was primarily attributable to the maturity of, and changes in credit spreads on loans to UK Social Housing associations. New loans are not designated at fair value.
Loans and advances to banks
Loans and advances to banks decreased by 44% to £2,496m at 30 June 2012 (31 December 2011: £4,487m). The decrease was due to lower reverse repurchase agreement activity with Banco Santander, S.A..
Loans and advances to customers
Loans and advances to customers decreased by 1% to £198,323m at 30 June 2012 (31 December 2011: £201,069m), primarily due to a managed reduction in the mortgage stock.
Available for sale securities
Available for sale securities increased substantially to £4,851m at 30 June 2012 (31 December 2011: £46m). The increase reflected the purchase of government securities for liquidity management purposes.
Loans and receivable securities
Loans and receivable securities decreased by 21% to £1,399m at 30 June 2012 (31 December 2011: £1,771m). The decrease principally reflected the continuing run-down of the Treasury Asset Portfolio.
Macro hedge of interest rate risk
The macro (or portfolio) hedge decreased by less than 1% to £1,215m at 30 June 2012 (31 December 2011: £1,221m). The decrease was mainly due to increases in interest rates.
Property, plant and equipment
Property, plant and equipment decreased by 3% to £1,544m at 30 June 2012 (31 December 2011: £1,596m). The decrease was principally due to the depreciation charge for the period, partially offset by property acquired during the period.
Retirement benefit assets
Retirement benefit assets increased by 71% to £411m at 30 June 2012 (31 December 2011: £241m). For the Group’s defined benefit pension schemes which had surpluses, the key drivers of the increase were Company contributions during the period together with an increase in the net discount rate which generated a reduction in the present value of scheme liabilities.
Tax, intangibles and other assets
Tax, intangibles and other assets increased by 4% to £3,625m at 30 June 2012 (31 December 2011: £3,487m). The increase was primarily driven by capitalisation of software development costs partially offset by a slight decrease in tax assets.
Liabilities
Deposits by banks
Deposits by banks increased by 31% to £15,249m at 30 June 2012 (31 December 2011: £11,626m). The increase was driven by the increase in medium-term repurchase agreements as part of the Group’s funding strategy.
Deposits by customers
Deposits by customers increased by 1% to £149,340m at 30 June 2012 (31 December 2011: £148,342m). The increase is a result of a strong cross tax year campaign with the major ISA, as well as the launch of the keystone 1|2|3 current account.
Derivatives
Derivative liabilities decreased by 2% to £28,639m at 30 June 2012 (31 December 2011: £29,180m). The decrease was driven by a decrease in the fair values of interest rate derivatives as a result of upward shifts in yield curves.
Trading liabilities
Trading liabilities increased by 10% to £28,235m at 30 June 2012 (31 December 2011: £25,745m. The increase was mainly attributable to higher repurchase agreements activity during the period.
Financial liabilities designated at fair value
Financial liabilities designated at fair value decreased by 27% to £4,977m at 30 June 2012 (31 December 2011: £6,837m). The decrease reflected the maturity of debt securities from the medium term note programme that had been designated at fair value. These were replaced by longer medium term funding via the issuance of debt from the securitisation and Covered Bond programmes that are recorded at amortised cost. This resulted in a corresponding increase in Debt Securities in Issue.
Debt securities in issue
Debt securities in issue increased by 18% to £62,176m at 30 June 2012 (31 December 2011: £52,651m). The increase reflected the Group’s strategy of increasing the level of medium-term funding principally through the issuance of debt in the Covered Bond programme. These increases were partially offset by significant decreases in short term funding in the US$20bn Commercial Paper Programme and in Certificates of Deposit in issue. In addition, there were further maturities of debt outstanding under the US $40bn Euro Medium Term Note programme.
Subordinated liabilities
Subordinated liabilities increased by 1% to £6,558m at 30 June 2012 (31 December 2011: £6,499m). The small increase was primarily attributable to foreign exchange movements.
Retirement benefit obligations
Retirement benefit obligations decreased by 83% to £36m at 30 June 2012 (31 December 2011: £216m). For the Group’s defined benefit pension schemes which had deficits, the key driver of the decrease in obligations was an increase in the net discount rate which generated a reduction in the present value of scheme liabilities.
Tax, other liabilities and provisions
Tax, other liabilities and provisions decreased by 22% to £2,963m at 30 June 2012 (31 December 2011: £3,812m). The decrease principally reflected the payment of the dividend held in other liabilities at 31 December 2011 and the higher balance of accruals at the year end than the current period end and utilisation of provisions during the period in respect of customer remediation.
Equity
Total shareholders equity increased by 5% to £13,361m at 30 June 2012 (31 December 2011: £12,666m). The increase was principally attributable to retained profits for the period of £550m and an actuarial gain on retirement benefit obligations.
RECONCILIATION TO CLASSIFICATIONS IN THE CONSOLIDATED BALANCE SHEET - IBID
The classifications of assets and liabilities in the Group’s consolidated balance sheet, including the note reference, and in the balance sheet business review may be reconciled as follows:
| 30 June 2012 | Balance sheet business review section | |||||||||||||||||||||||||||||||||||
| Balance sheet line item and note | Note | Loans and advances to banks | Loans and advances to customers | Securities | Derivatives | Tangible fixed assets | Retirement benefit assets | Other | Balance sheet total | |||||||||||||||||||||||||||
| £m | £m | £m | £m | £m | £m | £m | £m | |||||||||||||||||||||||||||||
| Assets | ||||||||||||||||||||||||||||||||||||
| Cash and balances at central banks | — | — | — | — | — | — | 30,067 | 30,067 | ||||||||||||||||||||||||||||
| Trading assets | 7 | 8,027 | 18,380 | 6,426 | — | — | — | — | 32,833 | |||||||||||||||||||||||||||
| Derivative financial instruments | 8 | — | — | — | 30,549 | — | — | — | 30,549 | |||||||||||||||||||||||||||
| Financial assets designated at fair value | 9 | — | 3,618 | 603 | — | — | — | — | 4,221 | |||||||||||||||||||||||||||
| Loans and advances to banks | 10 | 2,496 | — | — | — | — | — | — | 2,496 | |||||||||||||||||||||||||||
| Loans and advances to customers | 11 | — | 198,323 | — | — | — | — | — | 198,323 | |||||||||||||||||||||||||||
| Available for sale securities | 15 | — | — | 4,851 | — | — | — | — | 4,851 | |||||||||||||||||||||||||||
| Loans and receivables securities | 16 | 396 | 1,003 | — | — | — | — | — | 1,399 | |||||||||||||||||||||||||||
| Macro hedge of interest rate risk | — | — | — | — | — | — | 1,215 | 1,215 | ||||||||||||||||||||||||||||
| Property, plant and equipment | 18 | — | — | — | — | 1,544 | — | — | 1,544 | |||||||||||||||||||||||||||
| Retirement benefit assets | 26 | — | — | — | — | — | 411 | — | 411 | |||||||||||||||||||||||||||
| Tax, intangibles and other assets | — | — | — | — | — | — | 3,625 | 3,625 | ||||||||||||||||||||||||||||
| Total assets | 10,919 | 221,324 | 11,880 | 30,549 | 1,544 | 411 | 34,907 | 311,534 | ||||||||||||||||||||||||||||
| Deposits by banks | Deposits by customers | Debt securities in issue | Derivatives | Retirement benefit obligations | Other | Balance sheet total | ||||||||||||||||||||||||||||||
| £m | £m | £m | £m | £m | £m | £m | ||||||||||||||||||||||||||||||
| Liabilities | ||||||||||||||||||||||||||||||||||||
| Deposits by banks | 20 | 15,249 | — | — | — | — | — | 15,249 | ||||||||||||||||||||||||||||
| Deposits by customers | — | 149,340 | — | — | — | — | 149,340 | |||||||||||||||||||||||||||||
| Derivative financial instruments | 8 | — | — | — | 28,639 | — | — | 28,639 | ||||||||||||||||||||||||||||
| Trading liabilities | 21 | 7,969 | 18,568 | 1,698 | — | — | — | 28,235 | ||||||||||||||||||||||||||||
| Financial liabilities designated at fair value | 22 | — | — | 4,977 | — | — | — | 4,977 | ||||||||||||||||||||||||||||
| Debt securities in issue | 23 | — | — | 62,176 | — | — | — | 62,176 | ||||||||||||||||||||||||||||
| Subordinated liabilities | 24 | — | — | 6,558 | — | — | — | 6,558 | ||||||||||||||||||||||||||||
| Retirement benefit obligations | 26 | — | — | — | — | 36 | — | 36 | ||||||||||||||||||||||||||||
| Tax, other liabilities and provisions | — | — | — | — | — | 2,963 | 2,963 | |||||||||||||||||||||||||||||
| Total liabilities | 23,218 | 167,908 | 75,409 | 28,639 | 36 | 2,963 | 298,173 | |||||||||||||||||||||||||||||
| 31 December 2011 | Balance sheet business review section | |||||||||||||||||||||||||||||||||||
| Balance sheet line item and note | Note | Loans and advances to banks | Loans and advances to customers | Securities | Derivatives | Tangible fixed assets | Retirement benefit assets | Other | Balance sheet total | |||||||||||||||||||||||||||
| £m | £m | £m | £m | £m | £m | £m | £m | |||||||||||||||||||||||||||||
| Assets | ||||||||||||||||||||||||||||||||||||
| Cash and balances at central banks | — | — | — | — | — | — | 25,980 | 25,980 | ||||||||||||||||||||||||||||
| Trading assets | 7 | 6,144 | 6,687 | 9,060 | — | — | — | — | 21,891 | |||||||||||||||||||||||||||
| Derivative financial instruments | 8 | — | — | — | 30,780 | — | — | — | 30,780 | |||||||||||||||||||||||||||
| Financial assets designated at fair value | 9 | — | 4,376 | 629 | — | — | — | — | 5,005 | |||||||||||||||||||||||||||
| Loans and advances to banks | 10 | 4,487 | — | — | — | — | — | — | 4,487 | |||||||||||||||||||||||||||
| Loans and advances to customers | 11 | — | 201,069 | — | — | — | — | — | 201,069 | |||||||||||||||||||||||||||
| Available for sale securities | 15 | — | — | 46 | — | — | — | — | 46 | |||||||||||||||||||||||||||
| Loans and receivables securities | 16 | 957 | 814 | — | — | — | — | — | 1,771 | |||||||||||||||||||||||||||
| Macro hedge of interest rate risk | — | — | — | — | — | — | 1,221 | 1,221 | ||||||||||||||||||||||||||||
| Property, plant and equipment | 18 | — | — | — | — | 1,596 | — | — | 1,596 | |||||||||||||||||||||||||||
| Retirement benefit assets | 26 | — | — | — | — | — | 241 | — | 241 | |||||||||||||||||||||||||||
| Tax, intangibles and other assets | — | — | — | — | — | — | 3,487 | 3,487 | ||||||||||||||||||||||||||||
| Total assets | 11,588 | 212,946 | 9,735 | 30,780 | 1,596 | 241 | 30,688 | 297,574 | ||||||||||||||||||||||||||||
| Deposits by banks | Deposits by customers | Debt securities in issue | Derivatives | Retirement benefit obligations | Other | Balance sheet total | ||||||||||||||||||||||||||||||
| £m | £m | £m | £m | £m | £m | £m | ||||||||||||||||||||||||||||||
| Liabilities | ||||||||||||||||||||||||||||||||||||
| Deposits by banks | 20 | 11,626 | — | — | — | — | — | 11,626 | ||||||||||||||||||||||||||||
| Deposits by customers | — | 148,342 | — | — | — | — | 148,342 | |||||||||||||||||||||||||||||
| Derivative financial instruments | 8 | — | — | — | 29,180 | — | — | 29,180 | ||||||||||||||||||||||||||||
| Trading liabilities | 21 | 14,508 | 10,482 | 755 | — | — | — | 25,745 | ||||||||||||||||||||||||||||
| Financial liabilities designated at fair value | 22 | — | — | 6,837 | — | — | — | 6,837 | ||||||||||||||||||||||||||||
| Debt securities in issue | 23 | — | — | 52,651 | — | — | — | 52,651 | ||||||||||||||||||||||||||||
| Subordinated liabilities | 24 | — | — | 6,499 | — | — | — | 6,499 | ||||||||||||||||||||||||||||
| Retirement benefit obligations | 26 | — | — | — | — | 216 | — | 216 | ||||||||||||||||||||||||||||
| Tax, other liabilities and provisions | — | — | — | — | — | 3,812 | 3,812 | |||||||||||||||||||||||||||||
| Total liabilities | 26,134 | 158,824 | 66,742 | 29,180 | 216 | 3,812 | 284,908 | |||||||||||||||||||||||||||||
SECURITIES
The Group’s holdings of securities only represent a small proportion of its total assets. The Group holds securities principally in its trading portfolio. These securities primarily consist of Government and Government-guaranteed securities held for liquidity purposes.
Securities analysis by type of issuer
The following table sets out the book and market values of securities at 30 June 2012 and 31 December 2011. For further information, see the Notes to the Condensed Consolidated Interim Financial Statements.
30 June 2012 £m | 31 December 2011 £m | |||||||
| Trading portfolio | ||||||||
| Debt securities: | ||||||||
| UK Government | 1,889 | 1,078 | ||||||
| US Treasury and other US Government agencies and corporations | 197 | 65 | ||||||
| Other OECD governments – Switzerland and Japan | 1,782 | 1,800 | ||||||
| Other issuers: | ||||||||
| - Fixed and floating rate notes – Government guaranteed | 2,081 | 5,754 | ||||||
| - Fixed and floating rate notes | — | 14 | ||||||
| Ordinary shares and similar securities | 477 | 349 | ||||||
| 6,426 | 9,060 | |||||||
| Available for sale securities | ||||||||
| Debt securities: | ||||||||
| UK Government | 3,765 | — | ||||||
| Other OECD Governments – France | 918 | — | ||||||
| Other issuers – Other | 146 | — | ||||||
| Ordinary shares and similar securities | 22 | 46 | ||||||
| 4,851 | 46 | |||||||
| Financial assets designated at fair value through profit and loss | ||||||||
| Debt securities: | ||||||||
| Bank and building society certificates of deposit | — | — | ||||||
| Other issuers: | ||||||||
| - Mortgage-backed securities | 314 | 328 | ||||||
| - Other asset-backed securities | 47 | 51 | ||||||
| - Other securities | 242 | 250 | ||||||
| 603 | 629 | |||||||
| Total | 11,880 | 9,735 | ||||||
LOANS AND ADVANCES TO CUSTOMERS
The Group provides lending facilities primarily to personal customers in the form of mortgages secured on residential properties and lending facilities to corporate customers. Purchase and resale agreements represent sale and repurchase activity with professional non-bank customers by the Markets, Short Term Markets business.
Impairment loss allowances on loans and advances to customers
Details of the Group’s impairment loss allowances policy are set out in Note 1 to the Consolidated Financial Statements in the Group’s 2011 Annual Report. An analysis of period-end impairment loss allowances on loans and advances to customers, movements in impairment loss allowances, and Group non-performing loans and advances are set out in the “Loans and Advances” section of the Risk Management Report on page 71 and Note 11 to the Condensed Consolidated Interim Financial Statements.
COUNTRY RISK EXPOSURE
The Group manages its country risk exposure under its global limits framework. Within this framework, the Group sets its individual risk appetite for each country, taking into account any factors that may influence the risk profile of each country, including political events, the macro-economic situation and the nature of the risk incurred. Exposures are actively managed if it is considered appropriate. Accordingly, and over recent years, the Group has intensified its monitoring of exposures to sovereigns and counterparties in eurozone countries, and has proceeded to selectively divest assets directly or indirectly affected by events in those countries. As a result, the Group has insignificant exposure to Greece (30 June 2012: £3m, 31 December 2011: £3m) and Cyprus (30 June 2012: £nil, 31 December 2011: £nil). Spanish exposure is subject to ongoing monitoring, with reductions in non-parent related risk. Parent-related risk is considered separately.
The country risk tables below show the Group’s exposures to central and local governments, government guaranteed counterparties, banks, other financial institutions, retail customers and corporate customers at 30 June 2012 and 31 December 2011. Total exposures consist of the total of balance sheet values and off-balance sheet values. Balance sheet values are calculated in accordance with IFRS (i.e. after the effect of netting agreements recognised in accordance with the requirements of IFRS, principally with respect to derivatives) except for credit provisions which have been added back. Off balance sheet values consist of undrawn facilities and letters of credit.
The country of exposure has been assigned based on the counterparty’s country of incorporation except where the Group is aware that a guarantee is in place, in which case the country of incorporation of the guarantor has been used. The exposures are presented by type of counterparty other than where the specific exposures have been guaranteed by a sovereign counterparty in which case they are presented within the “Government guaranteed” category.
Separate disclosure is presented individually for each country where the exposure exceeds £50m, and aggregated for exposures of less than £50m. The domicile of an exposure is based on the country location of the ultimate risk, wherever possible. Given the ongoing interest in eurozone economies, disclosures relating to those economies are presented first and highlighted separately.
The tables exclude credit risk exposures to other Santander group companies, which are presented separately on pages 33 to 36.
| 30 June 2012 | Central and local governments £bn | Government guaranteed £bn | Banks (2) £bn | Other financial institutions £bn | Retail £bn | Corporate £bn | Total(1) £bn | |||||||||||||||||||||
| Eurozone: | ||||||||||||||||||||||||||||
| Peripheral eurozone countries: | ||||||||||||||||||||||||||||
| Spain (excluding Santander) | — | — | 0.2 | — | 0.1 | 0.2 | 0.5 | |||||||||||||||||||||
| Ireland | — | — | — | — | — | 0.3 | 0.3 | |||||||||||||||||||||
| Italy | — | — | 0.2 | — | — | — | 0.2 | |||||||||||||||||||||
| Portugal | — | — | — | — | — | 0.1 | 0.1 | |||||||||||||||||||||
| Other eurozone countries: | ||||||||||||||||||||||||||||
| Germany | — | 0.1 | 3.2 | — | — | 0.3 | 3.6 | |||||||||||||||||||||
| France | 0.9 | 0.1 | 2.1 | — | — | 0.2 | 3.3 | |||||||||||||||||||||
| Netherlands | — | — | 0.2 | 0.1 | — | 0.6 | 0.9 | |||||||||||||||||||||
| Luxembourg | — | — | — | 0.1 | — | 0.2 | 0.3 | |||||||||||||||||||||
| Belgium | — | — | 0.1 | — | — | — | 0.1 | |||||||||||||||||||||
All other eurozone, each < £50m(3) | — | — | — | — | — | — | — | |||||||||||||||||||||
| 0.9 | 0.2 | 6.0 | 0.2 | 0.1 | 1.9 | 9.3 | ||||||||||||||||||||||
| All other countries: | ||||||||||||||||||||||||||||
| UK | 32.9 | 1.7 | 15.6 | 17.3 | 194.5 | 41.5 | 303.5 | |||||||||||||||||||||
| US | 2.5 | — | 10.7 | — | 0.1 | 1.1 | 14.4 | |||||||||||||||||||||
| Switzerland | 0.2 | — | 2.2 | 0.8 | — | 0.5 | 3.7 | |||||||||||||||||||||
| Japan | 1.6 | — | 1.4 | — | — | — | 3.0 | |||||||||||||||||||||
| Australia | — | — | 0.2 | — | 0.1 | 0.3 | 0.6 | |||||||||||||||||||||
| Canada | — | — | 0.5 | — | — | 0.1 | 0.6 | |||||||||||||||||||||
| Isle of Man | — | — | — | — | 0.2 | 0.1 | 0.3 | |||||||||||||||||||||
| Bermuda | — | — | — | — | — | 0.2 | 0.2 | |||||||||||||||||||||
| Cayman Islands | — | — | — | — | — | 0.2 | 0.2 | |||||||||||||||||||||
| Lichtenstein | — | — | — | — | — | 0.2 | 0.2 | |||||||||||||||||||||
| Norway | — | — | 0.1 | — | — | 0.1 | 0.2 | |||||||||||||||||||||
| Denmark | — | 0.1 | — | — | — | — | 0.1 | |||||||||||||||||||||
| Jersey | — | — | — | — | — | 0.1 | 0.1 | |||||||||||||||||||||
| Liberia | — | — | — | — | — | 0.1 | 0.1 | |||||||||||||||||||||
| Singapore | — | — | — | — | — | 0.1 | 0.1 | |||||||||||||||||||||
| All others, each < £50m | — | — | — | — | 0.1 | 0.3 | 0.4 | |||||||||||||||||||||
| 37.2 | 1.8 | 30.7 | 18.1 | 195.0 | 44.9 | 327.7 | ||||||||||||||||||||||
| (1) | Credit exposures exclude the macro hedge of interest rate risk, intangible assets, property, plant and equipment, current and deferred tax assets, retirement benefit assets and other assets. Loans and advances to customers are included gross of loan loss allowances. |
| (2) | Excludes balances with central banks. |
| (3) | Includes Greece of £3m and Cyprus of £nil. |
| 31 December 2011 | Central and local governments(2) £bn | Government guaranteed £bn | Banks (3) £bn | Other financial institutions £bn | Retail £bn | Corporate £bn | Total(1) £bn | |||||||||||||||||||||
| Eurozone: | ||||||||||||||||||||||||||||
| Peripheral eurozone countries: | ||||||||||||||||||||||||||||
| Spain (excluding Santander) | — | — | 0.3 | — | 0.1 | — | 0.4 | |||||||||||||||||||||
| Ireland | — | — | 0.1 | — | — | 0.2 | 0.3 | |||||||||||||||||||||
| Italy | — | — | 0.2 | — | — | — | 0.2 | |||||||||||||||||||||
| Portugal | — | — | — | — | — | 0.1 | 0.1 | |||||||||||||||||||||
| Other eurozone countries: | ||||||||||||||||||||||||||||
| Germany | — | 0.1 | 3.2 | — | — | 0.2 | 3.5 | |||||||||||||||||||||
| France | — | 0.1 | 1.4 | 1.0 | — | 0.3 | 2.8 | |||||||||||||||||||||
| Luxembourg | — | — | — | 0.4 | — | 0.6 | 1.0 | |||||||||||||||||||||
| Netherlands | — | — | 0.2 | 0.1 | — | 0.6 | 0.9 | |||||||||||||||||||||
| Belgium | — | — | 0.1 | — | — | — | 0.1 | |||||||||||||||||||||
All other eurozone, each < £50m(4) | — | — | — | — | — | — | — | |||||||||||||||||||||
| — | 0.2 | 5.5 | 1.5 | 0.1 | 2.0 | 9.3 | ||||||||||||||||||||||
| All other countries: | ||||||||||||||||||||||||||||
| UK | 19.0 | 5.2 | 15.6 | 5.6 | 196.6 | 40.2 | 282.2 | |||||||||||||||||||||
| US | 7.1 | — | 9.9 | 1.1 | 0.1 | 1.3 | 19.5 | |||||||||||||||||||||
| Switzerland | 1.2 | — | 2.3 | 0.4 | — | 0.5 | 4.4 | |||||||||||||||||||||
| Japan | 0.6 | — | — | 0.4 | — | — | 1.0 | |||||||||||||||||||||
| Australia | — | 0.1 | 0.1 | — | 0.1 | 0.4 | 0.7 | |||||||||||||||||||||
| Denmark | — | 0.3 | 0.3 | — | — | 0.1 | 0.7 | |||||||||||||||||||||
| Canada | — | — | 0.5 | — | — | — | 0.5 | |||||||||||||||||||||
| Isle of Man | — | — | — | — | 0.2 | — | 0.2 | |||||||||||||||||||||
| Lichtenstein | — | — | — | — | — | 0.2 | 0.2 | |||||||||||||||||||||
| Cayman Islands | — | — | — | — | — | 0.1 | 0.1 | |||||||||||||||||||||
| China | — | — | — | — | — | 0.1 | 0.1 | |||||||||||||||||||||
| Jersey | — | — | — | — | — | 0.1 | 0.1 | |||||||||||||||||||||
| Liberia | — | — | — | — | — | 0.1 | 0.1 | |||||||||||||||||||||
| Norway | — | — | 0.1 | — | — | — | 0.1 | |||||||||||||||||||||
| All others, each < £50m | �� | — | — | 0.1 | — | 0.2 | 0.1 | 0.4 | ||||||||||||||||||||
| 27.9 | 5.6 | 28.9 | 7.5 | 197.2 | 43.2 | 310.3 | ||||||||||||||||||||||
(1) | Credit exposures exclude the macro hedge of interest rate risk, intangible assets, property, plant and equipment, current and deferred tax assets, retirement benefit assets and other assets. Loans and advances to customers are included gross of loan loss allowances. |
| (2) | Excludes the exposure on margin given with respect to the Bank of England's Special Liquidity Scheme. Includes balances with central banks. |
| (3) | Excludes balances with central banks. |
| (4) | Includes Greece of £3m and Cyprus of £nil. |
The assets held at amortised cost are principally classified as loans to banks, loans to customers and loan and receivable securities. The Group has no held-to-maturity securities.
The assets held at fair value are classified as either trading assets or have been designated as held at fair value through profit or loss, with the exception of UK Government and French Government debt held for liquidity purposes, which are classified as available-for-sale securities.
The Group has made no reclassifications to/from the assets which are held at fair value from/to any other category.
30 June 2012 compared to 31 December 2011
Key changes in sovereign and other country risk exposures during the period ended 30 June 2012 were as follow:
| > | An increase of £21.3bn in exposure to the UK to £303.5bn. This was primarily due to overall balance sheet growth coupled with an increase in deposits with the Bank of England reserve account instead of at the US Federal Reserve. |
| > | A decrease of £5.1bn in exposure to the US to £14.4bn. This was primarily due to reduced deposits at the US Federal Reserve as deposits were placed at the Bank of England instead. |
| > | An increase of £2.0bn in exposure to Japan to £3.0bn. This was primarily due to increased bond holdings as part of liquidity positions. |
| > | A decrease of £0.7bn in exposure to Switzerland to £3.7bn. This was primarily due to decreased Swiss Government debt for liquidity purposes. |
| > | Movements in remaining country risk exposures were minimal and exposures to these countries remained at low levels. |
Presented below separately for sovereign debt and other country risk exposures is additional analysis of exposures into those that are accounted for on-balance sheet (further analysed into those measured at amortised cost and those measured at fair value) and those that are off-balance sheet.
Sovereign Debt
30 June 2012
| Assets held at Amortised Cost | Assets held at Fair Value | |||||||||||||||||||||||||||||||||||
| Trading assets and FVTPL | AFS | |||||||||||||||||||||||||||||||||||
Central and local governments £bn | Government guaranteed £bn | Total at amortised cost £bn | Central and local governments £bn | Government guaranteed £bn | Central and local governments £bn | Total at fair value £bn | Total on Balance Sheet Asset £bn | Total(1) £bn | ||||||||||||||||||||||||||||
| Eurozone countries: | ||||||||||||||||||||||||||||||||||||
| France | — | — | — | — | 0.1 | 0.9 | 1.0 | 1.0 | 1.0 | |||||||||||||||||||||||||||
| Germany | — | — | — | — | 0.1 | — | 0.1 | 0.1 | 0.1 | |||||||||||||||||||||||||||
| — | — | — | — | 0.2 | 0.9 | 1.1 | 1.1 | 1.1 | ||||||||||||||||||||||||||||
| All other countries: | ||||||||||||||||||||||||||||||||||||
| UK | 27.0 | — | 27.0 | 2.0 | 1.7 | 3.9 | 7.6 | 34.6 | 34.6 | |||||||||||||||||||||||||||
| US | 2.3 | — | 2.3 | 0.2 | — | — | 0.2 | 2.5 | 2.5 | |||||||||||||||||||||||||||
| Switzerland | — | — | — | 0.2 | — | — | 0.2 | 0.2 | 0.2 | |||||||||||||||||||||||||||
| Japan | — | — | — | 1.6 | — | — | 1.6 | 1.6 | 1.6 | |||||||||||||||||||||||||||
| Denmark | — | — | — | — | 0.1 | — | 0.1 | 0.1 | 0.1 | |||||||||||||||||||||||||||
| 29.3 | — | 29.3 | 4.0 | 1.8 | 3.9 | 9.7 | 39.0 | 39.0 | ||||||||||||||||||||||||||||
31 December 2011
| Assets held at Amortised Cost | Assets held at Fair Value | |||||||||||||||||||||||||||||||||||
| Trading assets and FVTPL | AFS | |||||||||||||||||||||||||||||||||||
Central and local governments(2) £bn | Government guaranteed £bn | Total at amortised cost £bn | Central and local governments £bn | Government guaranteed £bn | Central and local governments £bn | Total at fair value £bn | Total on Balance Sheet Asset £bn | Total(1) £bn | ||||||||||||||||||||||||||||
| Eurozone countries: | ||||||||||||||||||||||||||||||||||||
| France | — | — | — | — | 0.1 | — | 0.1 | 0.1 | 0.1 | |||||||||||||||||||||||||||
| Germany | — | — | — | — | 0.1 | — | 0.1 | 0.1 | 0.1 | |||||||||||||||||||||||||||
| — | — | — | — | 0.2 | — | 0.2 | 0.2 | 0.2 | ||||||||||||||||||||||||||||
| All other countries: | ||||||||||||||||||||||||||||||||||||
| UK | 18.0 | — | 18.0 | 1.0 | 5.2 | — | 6.2 | 24.2 | 24.2 | |||||||||||||||||||||||||||
| US | 7.0 | — | 7.0 | 0.1 | — | — | 0.1 | 7.1 | 7.1 | |||||||||||||||||||||||||||
| Switzerland | — | — | — | 1.2 | — | — | 1.2 | 1.2 | 1.2 | |||||||||||||||||||||||||||
| Japan | — | — | — | 0.6 | — | — | 0.6 | 0.6 | 0.6 | |||||||||||||||||||||||||||
| Denmark | — | — | — | — | 0.3 | — | 0.3 | 0.3 | 0.3 | |||||||||||||||||||||||||||
| Australia | — | — | — | — | 0.1 | — | 0.1 | 0.1 | 0.1 | |||||||||||||||||||||||||||
| 25.0 | — | 25.0 | 2.9 | 5.6 | — | 8.5 | 33.5 | 33.5 | ||||||||||||||||||||||||||||
| (1) | There are no sovereign debt commitments and undrawn facilities. |
| (2) | Excludes the exposure on margin given with respect to the Bank of England's Special Liquidity Scheme. |
The Group has not recognised any impairment losses against sovereign debt which is held at amortised cost, as this sovereign debt was all issued by the UK Government, US Government and governments of other OECD countries with strong credit ratings.
The Group has no exposures to credit default swaps (either written or purchased) which are directly referenced to sovereign debt or other instruments that are directly referenced to sovereign debt.
Other country risk exposures
The tables below exclude balances with other Santander companies which are presented separately on pages 33 to 36.
| 30 June 2012 | Assets held at Amortised Cost | Assets held at Fair Value(1) | ||||||||||||||||||||||||||||||||||||||||||||||||||
Banks £bn | Other financial institutions £bn | Retail £bn | Corporate £bn | Total £bn | Banks £bn | Other financial institutions £bn | Retail £bn | Corporate £bn | Total £bn | Total on Balance Sheet Asset £bn | Commitments and undrawn facilities £bn | Total £bn | ||||||||||||||||||||||||||||||||||||||||
| Eurozone: | ||||||||||||||||||||||||||||||||||||||||||||||||||||
Peripheral eurozone countries: | ||||||||||||||||||||||||||||||||||||||||||||||||||||
| Spain | 0.2 | — | 0.1 | 0.2 | 0.5 | — | — | — | — | — | 0.5 | — | 0.5 | |||||||||||||||||||||||||||||||||||||||
| Ireland | — | — | — | 0.2 | 0.2 | — | — | — | — | — | 0.2 | 0.1 | 0.3 | |||||||||||||||||||||||||||||||||||||||
| Italy | 0.1 | — | — | — | 0.1 | 0.1 | — | — | — | 0.1 | 0.2 | — | 0.2 | |||||||||||||||||||||||||||||||||||||||
| Portugal | — | — | — | 0.1 | 0.1 | — | — | — | — | — | 0.1 | — | 0.1 | |||||||||||||||||||||||||||||||||||||||
Other eurozone countries: | ||||||||||||||||||||||||||||||||||||||||||||||||||||
| Germany | — | — | — | 0.3 | 0.3 | 3.2 | — | — | — | 3.2 | 3.5 | — | 3.5 | |||||||||||||||||||||||||||||||||||||||
| France | 0.1 | — | — | 0.2 | 0.3 | 2.0 | — | — | — | 2.0 | 2.3 | — | 2.3 | |||||||||||||||||||||||||||||||||||||||
| Netherlands | — | 0.1 | — | 0.1 | 0.2 | 0.2 | — | — | — | 0.2 | 0.4 | 0.5 | 0.9 | |||||||||||||||||||||||||||||||||||||||
| Luxembourg | — | 0.1 | — | 0.2 | 0.3 | — | — | — | — | — | 0.3 | — | 0.3 | |||||||||||||||||||||||||||||||||||||||
| Belgium | — | — | — | — | — | 0.1 | — | — | — | 0.1 | 0.1 | — | 0.1 | |||||||||||||||||||||||||||||||||||||||
| Other<£50m | — | — | — | — | — | — | — | — | — | — | — | — | — | |||||||||||||||||||||||||||||||||||||||
| 0.4 | 0.2 | 0.1 | 1.3 | 2.0 | 5.6 | — | — | — | 5.6 | 7.6 | 0.6 | 8.2 | ||||||||||||||||||||||||||||||||||||||||
| All other countries: | ||||||||||||||||||||||||||||||||||||||||||||||||||||
| UK | 1.0 | — | 171.1 | 25.3 | 197.4 | 14.3 | 17.3 | — | 6.1 | 37.7 | 235.1 | 33.8 | 268.9 | |||||||||||||||||||||||||||||||||||||||
| US | 0.8 | — | 0.1 | 0.8 | 1.7 | 9.9 | — | — | 0.2 | 10.1 | 11.8 | 0.1 | 11.9 | |||||||||||||||||||||||||||||||||||||||
| Switzerland | — | — | — | 0.3 | 0.3 | 2.2 | 0.8 | — | — | 3.0 | 3.3 | 0.2 | 3.5 | |||||||||||||||||||||||||||||||||||||||
| Japan | — | — | — | — | — | 1.4 | — | — | — | 1.4 | 1.4 | — | 1.4 | |||||||||||||||||||||||||||||||||||||||
| Australia | — | — | 0.1 | 0.2 | 0.3 | 0.2 | — | — | — | 0.2 | 0.5 | 0.1 | 0.6 | |||||||||||||||||||||||||||||||||||||||
| Canada | 0.1 | — | — | 0.1 | 0.2 | 0.4 | — | — | — | 0.4 | 0.6 | — | 0.6 | |||||||||||||||||||||||||||||||||||||||
| Isle of Man | — | — | 0.2 | 0.1 | 0.3 | — | — | — | — | — | 0.3 | — | 0.3 | |||||||||||||||||||||||||||||||||||||||
| Bermuda | — | — | — | 0.2 | 0.2 | — | — | — | — | — | 0.2 | — | 0.2 | |||||||||||||||||||||||||||||||||||||||
| Cayman Is. | — | — | — | 0.2 | 0.2 | — | — | — | — | — | 0.2 | — | 0.2 | |||||||||||||||||||||||||||||||||||||||
| Lichtenstein | — | — | — | 0.2 | 0.2 | — | — | — | — | — | 0.2 | — | 0.2 | |||||||||||||||||||||||||||||||||||||||
| Norway | — | — | — | — | — | 0.1 | — | — | — | 0.1 | 0.1 | 0.1 | 0.2 | |||||||||||||||||||||||||||||||||||||||
| Jersey | — | — | — | — | — | — | — | — | 0.1 | 0.1 | 0.1 | — | 0.1 | |||||||||||||||||||||||||||||||||||||||
| Liberia | — | — | — | 0.1 | 0.1 | — | — | — | — | — | 0.1 | — | 0.1 | |||||||||||||||||||||||||||||||||||||||
| Singapore | — | — | — | 0.1 | 0.1 | — | — | — | — | — | 0.1 | — | 0.1 | |||||||||||||||||||||||||||||||||||||||
| Other<£50m | — | — | 0.1 | 0.2 | 0.3 | — | — | — | 0.1 | 0.1 | 0.4 | — | 0.4 | |||||||||||||||||||||||||||||||||||||||
| 1.9 | — | 171.6 | 27.8 | 201.3 | 28.5 | 18.1 | — | 6.5 | 53.1 | 254.4 | 34.3 | (2) | 288.7 | |||||||||||||||||||||||||||||||||||||||
| (1) | The assets held at fair value were classified as either trading assets or designated as held at fair value through profit or loss. The Group did not hold any significant available-for-sale securities, with the exception of UK Government and French Government debt held for liquidity purposes, as described on the previous page. |
| (2) | Includes £23.4bn for Retail Banking, £10.6bn for Corporate Banking and £0.3bn for Banks. |
| 31 December 2011 | Assets held at Amortised Cost | Assets held at Fair Value(1) | ||||||||||||||||||||||||||||||||||||||||||||||||||
Banks £bn | Other financial institutions £bn | Retail £bn | Corporate £bn | Total £bn | Banks £bn | Other financial institutions £bn | Retail £bn | Corporate £bn | Total £bn | Total on Balance Sheet Asset £bn | Commitments and undrawn facilities £bn | Total £bn | ||||||||||||||||||||||||||||||||||||||||
Eurozone: | ||||||||||||||||||||||||||||||||||||||||||||||||||||
Peripheral eurozone countries: | ||||||||||||||||||||||||||||||||||||||||||||||||||||
| Spain | 0.3 | — | 0.1 | — | 0.4 | — | — | — | — | — | 0.4 | — | 0.4 | |||||||||||||||||||||||||||||||||||||||
| Ireland | — | — | — | 0.1 | 0.1 | 0.1 | — | — | — | 0.1 | 0.2 | 0.1 | 0.3 | |||||||||||||||||||||||||||||||||||||||
| Italy | 0.1 | — | — | — | 0.1 | 0.1 | — | — | — | 0.1 | 0.2 | — | 0.2 | |||||||||||||||||||||||||||||||||||||||
| Portugal | — | — | — | 0.1 | 0.1 | — | — | — | — | — | 0.1 | — | 0.1 | |||||||||||||||||||||||||||||||||||||||
Other eurozone countries: | ||||||||||||||||||||||||||||||||||||||||||||||||||||
| Germany | 0.1 | — | — | 0.1 | 0.2 | 3.1 | — | — | 0.1 | 3.2 | 3.4 | — | 3.4 | |||||||||||||||||||||||||||||||||||||||
| France | — | — | — | 0.1 | 0.1 | 1.4 | 1.0 | — | — | 2.4 | 2.5 | 0.2 | 2.7 | |||||||||||||||||||||||||||||||||||||||
| Luxembourg | — | 0.4 | — | 0.6 | 1.0 | — | — | — | — | — | 1.0 | — | 1.0 | |||||||||||||||||||||||||||||||||||||||
| Netherlands | 0.1 | 0.1 | — | 0.1 | 0.3 | 0.1 | — | — | — | 0.1 | 0.4 | 0.5 | 0.9 | |||||||||||||||||||||||||||||||||||||||
| Belgium | — | — | — | — | — | 0.1 | — | — | — | 0.1 | 0.1 | — | 0.1 | |||||||||||||||||||||||||||||||||||||||
| Other < £50m | — | — | — | — | — | — | — | — | — | — | — | — | — | |||||||||||||||||||||||||||||||||||||||
| 0.6 | 0.5 | 0.1 | 1.1 | 2.3 | 4.9 | 1.0 | — | 0.1 | 6.0 | 8.3 | 0.8 | 9.1 | ||||||||||||||||||||||||||||||||||||||||
| All other countries: | ||||||||||||||||||||||||||||||||||||||||||||||||||||
| UK | 2.3 | — | 174.7 | 24.1 | 201.1 | 13.3 | 5.6 | — | 5.9 | 24.8 | 225.9 | 32.1 | 258.0 | |||||||||||||||||||||||||||||||||||||||
| US | — | — | 0.1 | 1.3 | 1.4 | 9.9 | 1.1 | — | — | 11.0 | 12.4 | — | 12.4 | |||||||||||||||||||||||||||||||||||||||
| Switzerland | — | — | — | 0.3 | 0.3 | 2.3 | 0.4 | — | — | 2.7 | 3.0 | 0.2 | 3.2 | |||||||||||||||||||||||||||||||||||||||
| Australia | — | — | 0.1 | 0.3 | 0.4 | 0.1 | — | — | — | 0.1 | 0.5 | 0.1 | 0.6 | |||||||||||||||||||||||||||||||||||||||
| Canada | — | — | — | — | — | 0.5 | — | — | — | 0.5 | 0.5 | — | 0.5 | |||||||||||||||||||||||||||||||||||||||
| Denmark | — | — | — | 0.1 | 0.1 | 0.3 | — | — | — | 0.3 | 0.4 | — | 0.4 | |||||||||||||||||||||||||||||||||||||||
| Japan | — | — | — | — | — | — | 0.4 | — | — | 0.4 | 0.4 | — | 0.4 | |||||||||||||||||||||||||||||||||||||||
| Isle of Man | — | — | 0.2 | — | 0.2 | — | — | — | — | — | 0.2 | — | 0.2 | |||||||||||||||||||||||||||||||||||||||
| Lichtenstein | — | — | — | 0.2 | 0.2 | — | — | — | — | — | 0.2 | — | 0.2 | |||||||||||||||||||||||||||||||||||||||
| Cayman Is. | — | — | — | 0.1 | 0.1 | — | — | — | — | — | 0.1 | — | 0.1 | |||||||||||||||||||||||||||||||||||||||
| China | — | — | — | 0.1 | 0.1 | — | — | — | — | — | 0.1 | — | 0.1 | |||||||||||||||||||||||||||||||||||||||
| Jersey | — | — | — | 0.1 | 0.1 | — | — | — | — | — | 0.1 | — | 0.1 | |||||||||||||||||||||||||||||||||||||||
| Liberia | — | — | — | 0.1 | 0.1 | — | — | — | — | — | 0.1 | — | 0.1 | |||||||||||||||||||||||||||||||||||||||
| Norway | — | — | — | — | — | 0.1 | — | — | — | 0.1 | 0.1 | — | 0.1 | |||||||||||||||||||||||||||||||||||||||
| Other < £50m | — | — | 0.2 | — | 0.2 | 0.1 | — | — | — | 0.1 | 0.3 | 0.1 | 0.4 | |||||||||||||||||||||||||||||||||||||||
| 2.3 | — | 175.3 | 26.7 | 204.3 | 26.6 | 7.5 | — | 5.9 | 40.0 | 244.3 | 32.5 | (2) | 276.8 | |||||||||||||||||||||||||||||||||||||||
| (1) | The assets held at fair value were classified as either trading assets or designated as held at fair value through profit or loss. The Group did not hold any significant available-for-sale securities. |
| (2) | Of which £21.9bn is for Retail Banking and the remainder is for Corporate Banking. |
Commitments and undrawn facilities principally consist of formal standby facilities and credit lines in the Group’s Retail Banking and Corporate Banking operations. Within Retail Banking, these represent credit card, mortgage and overdraft facilities. Within Corporate Banking, these represent standby loan facilities. A summary of the key terms and a maturity analysis of formal standby facilities, credit lines and other commitments are set out in Note 27 to the Condensed Consolidated Interim Financial Statements.
Peripheral eurozone countries
The tables below further analyse the Group's direct exposure to peripheral eurozone countries at 30 June 2012 by type of financial instrument.
The tables below exclude balances with other Santander companies which are presented separately on pages 33 to 36.
(i) Spain
| 30 June 2012 | Banks £bn | Other financial institutions £bn | Corporate £bn | Retail £bn | Total £bn | |||||||||||||||
| Loans and advances to customers | — | — | 0.2 | 0.1 | 0.3 | |||||||||||||||
| Loans and receivables securities | 0.2 | — | — | — | 0.2 | |||||||||||||||
| Total | 0.2 | — | 0.2 | 0.1 | 0.5 | |||||||||||||||
(ii) Ireland
| 30 June 2012 | Banks £bn | Other financial institutions £bn | Corporate £bn | Retail £bn | Total £bn | |||||||||||||||
| Loans and advances to banks | — | — | 0.1 | — | 0.1 | |||||||||||||||
| Loans and receivables securities | — | — | 0.1 | — | 0.1 | |||||||||||||||
| Total | — | — | 0.2 | — | 0.2 | |||||||||||||||
(iii) Italy
| 30 June 2012 | Banks £bn | Other financial institutions £bn | Corporate £bn | Retail £bn | Total £bn | |||||||||||||||
| Loans and receivables securities | 0.1 | — | — | — | 0.1 | |||||||||||||||
| Derivatives | ||||||||||||||||||||
| - Derivative assets | 0.1 | — | — | — | 0.1 | |||||||||||||||
| - Derivative liabilities | (0.1 | ) | — | — | — | (0.1 | ) | |||||||||||||
| Net derivatives position | — | — | — | — | — | |||||||||||||||
| Total | 0.1 | — | — | — | 0.1 | |||||||||||||||
(iv) Portugal
| 30 June 2012 | Banks £bn | Other financial institutions £bn | Corporate £bn | Retail £bn | Total £bn | |||||||||||||||
| Loans and advances to customers | — | — | 0.1 | — | 0.1 | |||||||||||||||
| Total | — | — | 0.1 | — | 0.1 | |||||||||||||||
Balances with other Santander companies
The Group enters into transactions with other Santander companies in the ordinary course of business. Such transactions are undertaken in areas of business where the Group has a particular advantage or expertise and where Santander companies can offer commercial opportunities, substantially on the same terms as for comparable transactions with third party counterparties. These transactions also arise in support of the activities of, or with, larger multinational corporate clients and financial institutions which may have relationships with a number of entities in the Santander group. In early 2012, the Group raised funding from certain members of the Santander group through repo transactions and debt issuance. All such activities are conducted in a manner that manages the credit risk arising against such other Santander companies and within limits acceptable to the UK Financial Services Authority.
At 30 June 2012 and 31 December 2011, the Group had balances with other Santander companies as follows:
| 30 June 2012 | Banks £bn | Other financial institutions £bn | Corporate £bn | Total £bn | ||||||||||||
| Assets: | ||||||||||||||||
| - Spain | 3.1 | 0.1 | — | 3.2 | ||||||||||||
| - Chile | 0.1 | — | — | 0.1 | ||||||||||||
| - Other < £50m | 0.1 | — | — | 0.1 | ||||||||||||
| 3.3 | 0.1 | — | 3.4 | |||||||||||||
Liabilities: | ||||||||||||||||
| - Spain | (8.7 | ) | (0.9 | ) | (0.1 | ) | (9.7 | ) | ||||||||
| - UK | — | (2.1 | ) | (0.1 | ) | (2.2 | ) | |||||||||
| - Belgium | — | (1.9 | ) | — | (1.9 | ) | ||||||||||
| - Ireland | — | (0.2 | ) | — | (0.2 | ) | ||||||||||
| - Chile | (0.1 | ) | — | — | (0.1 | ) | ||||||||||
| - USA | (0.1 | ) | — | — | (0.1 | ) | ||||||||||
| - Italy | — | (0.2 | ) | — | (0.2 | ) | ||||||||||
| - Other < £50m | — | — | — | — | ||||||||||||
| (8.9 | ) | (5.3 | ) | (0.2 | ) | (14.4 | ) | |||||||||
| 31 December 2011 | Banks £bn | Other financial institutions £bn | Corporate £bn | Total £bn | ||||||||||||
| Assets: | ||||||||||||||||
| - Spain | 5.0 | 0.2 | — | 5.2 | ||||||||||||
| - Other < £50m | — | 0.1 | — | 0.1 | ||||||||||||
| 5.0 | 0.3 | — | 5.3 | |||||||||||||
Liabilities: | ||||||||||||||||
| - Spain | (6.5 | ) | (0.2 | ) | — | (6.7 | ) | |||||||||
| - UK | — | (2.1 | ) | — | (2.1 | ) | ||||||||||
| - Belgium | — | (0.6 | ) | — | (0.6 | ) | ||||||||||
| - Ireland | — | (0.2 | ) | — | (0.2 | ) | ||||||||||
| - Other < £50m | — | (0.3 | ) | — | (0.3 | ) | ||||||||||
| (6.5 | ) | (3.4 | ) | — | (9.9 | ) | ||||||||||
The above balances with other Santander companies at 30 June 2012 principally consisted of:
| > | Reverse repos of £431m (31 December 2011: £2,071m), all of which were collateralised by OECD Government (but not Spanish) securities. The reverse repos were classified as “Loans and Advances to banks” in the balance sheet. See Note 10 to the Condensed Consolidated Interim Financial Statements. This was more than offset by repo liabilities of £5,140m (31 December 2011: £3,082m) with a wider range of collateral being given. See Note 20 ‘Deposits by banks’ to the Condensed Consolidated Interim Financial Statements. This included the funding repo liabilities described above. |
| > | Derivative assets of £2,598m (31 December 2011: £2,710m) subject to ISDA Master Agreements including the Credit Support Annex. These balances were partially offset by derivative liabilities of £2,014m (31 December 2011: £2,179m) and cash collateral received, as described below. These derivatives are included in Note 8 to the Condensed Consolidated Interim Financial Statements. The overall derivative exposure after netting and collateral was £203m. |
| > | Cash collateral of £249m (31 December 2011: £270m) given in relation to derivatives futures contracts. The cash collateral was classified as “Trading assets” in the balance sheet. This was more than offset by cash collateral received in relation to other derivatives of £630m (31 December 2011: £671m) which was classified as ‘’Trading liabilities’’ in the balance sheet. See Notes 7 and 21 to the Condensed Consolidated Interim Financial Statements. |
| > | Floating rate notes of £26m (31 December 2011: £123m) classified as “Trading assets” and “Loan and receivable securities” in the balance sheet. See Notes 7 and 16 to the Condensed Consolidated Interim Financial Statements. |
| > | Asset-backed securities of £44m (31 December 2011: £51m), which were classified as “Financial assets designated at fair value” in the balance sheet. See Note 9 to the Condensed Consolidated Interim Financial Statements. |
| > | Deposits by customers of £1,413m (2011: £531m) classified as “Deposits by Customers” in the balance sheet. |
| Debt securities in issue of £2,369m (31 December 2011: £244m), which were classified as “Debt Securities in Issue” in the balance sheet. See Note 23 to the Condensed Consolidated Interim Financial Statements. These balances represent holdings of debt securities by the wider Santander group as a result of market purchases and for liability management purposes. In addition, although Santander UK does not rely on other members of the Santander group for funding, at the time that central bank facilities were available, funding was obtained from our parent and other members of the Santander group through debt issuance facilities. |
| > | Other liabilities of £97m (31 December 2011: £464m), principally represented, at 31 December 2011, dividends payable subsequently paid in the first half of 2012, which were classified as “Other Liabilities” in the balance sheet. |
| > | Subordinated liabilities of £2,700m (31 December 2011: £2,697m), which were classified as “Subordinated Liabilities” in the balance sheet. See Note 24 to the Condensed Consolidated Interim Financial Statements. These balances represent holdings of debt securities by the wider Santander group as a result of market purchases and for liability management purposes. |
The above activities are conducted in a manner that appropriately manages the credit risk arising against such other Santander group companies within limits acceptable to the UK Financial Services Authority. The tables below further analyse the balances with other Santander group companies at 30 June 2012 and 31 December 2011 by type of financial instrument and country of the counterparty, including the additional mitigating impact of collateral arrangements (which are not included in the summary tables above, as they are accounted for off-balance sheet) and the resulting net credit exposures:
(i) Spain
| 30 June 2012 | Banks £bn | Other financial institutions £bn | Corporate £bn | Total £bn | ||||||||||||
| Repurchase agreements | ||||||||||||||||
| - Asset balance - reverse repo | 0.4 | — | — | 0.4 | ||||||||||||
| - Impact of collateral held (off balance sheet) | (0.4 | ) | — | — | (0.4 | ) | ||||||||||
| - Net repo asset | — | — | — | — | ||||||||||||
| - Liability balance - repo | (3.2 | ) | — | — | (3.2 | ) | ||||||||||
| - Impact of collateral placed (off balance sheet) | 3.5 | — | — | 3.5 | ||||||||||||
| - Net repo | 0.3 | — | — | 0.3 | ||||||||||||
| Net repurchase agreement position | 0.3 | — | — | 0.3 | ||||||||||||
| Derivatives | ||||||||||||||||
| - Derivative assets | 2.5 | — | — | 2.5 | ||||||||||||
| - Derivative liabilities | (1.9 | ) | — | — | (1.9 | ) | ||||||||||
Cash collateral in relation to derivatives: - placed | 0.2 | — | — | 0.2 | ||||||||||||
| - held | (0.6 | ) | — | — | (0.6 | ) | ||||||||||
| Net derivatives position | 0.2 | — | — | 0.2 | ||||||||||||
| Floating rate notes and asset-backed securities | — | 0.1 | — | 0.1 | ||||||||||||
| Total assets, after the impact of collateral | 0.5 | 0.1 | — | 0.6 | ||||||||||||
| Deposits by customers | — | (0.8 | ) | (0.1 | ) | (0.9 | ) | |||||||||
| Debt securities in issue | (2.0 | ) | (0.1 | ) | — | (2.1 | ) | |||||||||
| Subordinated liabilities | (1.0 | ) | — | — | (1.0 | ) | ||||||||||
| Total liabilities | (3.0 | ) | (0.9 | ) | (0.1 | ) | (4.0 | ) | ||||||||
| 31 December 2011 | Banks £bn | Other financial institutions £bn | Corporate £bn | Total £bn | ||||||||||||
| Repurchase agreements | ||||||||||||||||
| - Asset balance - reverse repo | 2.1 | — | — | 2.1 | ||||||||||||
| - Impact of collateral held (off balance sheet) | (2.1 | ) | — | — | (2.1 | ) | ||||||||||
| - Net repo asset | — | — | — | — | ||||||||||||
| - Liability balance - repo | (2.5 | ) | — | — | (2.5 | ) | ||||||||||
| - Impact of collateral placed (off balance sheet) | 2.7 | — | — | 2.7 | ||||||||||||
| - Net repo | 0.2 | — | — | 0.2 | ||||||||||||
| Net repurchase agreement position | 0.2 | — | — | 0.2 | ||||||||||||
| Derivatives | ||||||||||||||||
| - Derivative assets | 2.7 | — | — | 2.7 | ||||||||||||
| - Derivative liabilities | (2.2 | ) | — | — | (2.2 | ) | ||||||||||
Cash collateral in relation to derivatives: - placed | 0.3 | — | — | 0.3 | ||||||||||||
| - held | (0.6 | ) | — | — | (0.6 | ) | ||||||||||
| Net derivatives position | 0.2 | — | — | 0.2 | ||||||||||||
| Floating rate notes and asset-backed securities | — | 0.2 | — | 0.2 | ||||||||||||
| Total assets, after the impact of collateral | 0.4 | 0.2 | — | 0.6 | ||||||||||||
| Debt securities in issue | (0.1 | ) | (0.1 | ) | — | (0.2 | ) | |||||||||
| Other liabilities | (0.3 | ) | (0.1 | ) | — | (0.4 | ) | |||||||||
| Subordinated liabilities | (0.9 | ) | — | — | (0.9 | ) | ||||||||||
| Total liabilities | (1.3 | ) | (0.2 | ) | — | (1.5 | ) | |||||||||
(ii) UK
| 30 June 2012 | Banks £bn | Other financial institutions £bn | Corporate £bn | Total £bn | ||||||||||||
Deposits by customers | — | (0.3 | ) | — | (0.3 | ) | ||||||||||
| Other liabilities | — | — | (0.1 | ) | (0.1 | ) | ||||||||||
| Subordinated liabilities | — | (1.8 | ) | — | (1.8 | ) | ||||||||||
| Total liabilities | — | (2.1 | ) | (0.1 | ) | (2.2 | ) | |||||||||
| 31 December 2011 | Banks £bn | Other financial institutions £bn | Corporate £bn | Total £bn | ||||||||||||
Deposits by customers | — | (0.3 | ) | — | (0.3 | ) | ||||||||||
| Subordinated liabilities | — | (1.8 | ) | — | (1.8 | ) | ||||||||||
| Total liabilities | — | (2.1 | ) | — | (2.1 | ) | ||||||||||
(iii) Belgium
| 30 June 2012 | Banks £bn | Other financial institutions £bn | Corporate £bn | Total £bn | ||||||||||||
| Repurchase agreements | ||||||||||||||||
| - Liability balance - repo | — | (1.9 | ) | — | (1.9 | ) | ||||||||||
| - Impact of collateral given (off balance sheet) | — | 2.2 | — | 2.2 | ||||||||||||
| Net repurchase agreement position | — | 0.3 | — | 0.3 | ||||||||||||
| Total assets, after the impact of collateral | — | 0.3 | — | 0.3 | ||||||||||||
| 31 December 2011 | Banks £bn | Other financial institutions £bn | Corporate £bn | Total £bn | ||||||||||||
| Repurchase agreements | ||||||||||||||||
| - Liability balance - repo | — | (0.6 | ) | — | (0.6 | ) | ||||||||||
| - Impact of collateral given (off balance sheet) | — | 0.8 | — | 0.8 | ||||||||||||
| Net repurchase agreement position | — | 0.2 | — | 0.2 | ||||||||||||
| Total assets, after the impact of collateral | — | 0.2 | — | 0.2 | ||||||||||||
(iv) Ireland
| 30 June 2012 | Banks £bn | Other financial institutions £bn | Corporate £bn | Total £bn | ||||||||||||
| Deposits by customers | — | (0.2 | ) | — | (0.2 | ) | ||||||||||
| Total liabilities | — | (0.2 | ) | — | (0.2 | ) | ||||||||||
| 31 December 2011 | Banks £bn | Other financial institutions £bn | Corporate £bn | Total £bn | ||||||||||||
| Deposits by customers | — | (0.2 | ) | — | (0.2 | ) | ||||||||||
| Total liabilities | — | (0.2 | ) | — | (0.2 | ) | ||||||||||
(v) Chile
| 30 June 2012 | Banks £bn | Other financial institutions £bn | Corporate £bn | Total £bn | ||||||||||||
| Derivatives | ||||||||||||||||
| - Derivative assets | 0.1 | — | — | 0.1 | ||||||||||||
| - Derivative liabilities | (0.1 | ) | — | — | (0.1 | ) | ||||||||||
| Net derivatives position | — | — | — | — | ||||||||||||
| Total assets | — | — | — | — | ||||||||||||
31 December 2011
None.
(vi) USA
| 30 June 2012 | Banks £bn | Other financial institutions £bn | Corporate £bn | Total £bn | ||||||||||||
Deposits by banks | (0.1 | ) | — | — | (0.1 | ) | ||||||||||
| Total liabilities | (0.1 | ) | — | — | (0.1 | ) | ||||||||||
31 December 2011
None.
(vii) Italy
| 30 June 2012 | Banks £bn | Other financial institutions £bn | Corporate £bn | Total £bn | ||||||||||||
| Debt securities in issue | — | (0.2 | ) | — | (0.2 | ) | ||||||||||
| Total liabilities | — | (0.2 | ) | — | (0.2 | ) | ||||||||||
31 December 2011
None.
Redenomination risk
As a result of the continuing distressed conditions experienced by the peripheral eurozone countries, there is an increased possibility of a member state exiting from the eurozone. There is currently no established legal framework within the European treaties to facilitate such an event; consequently, it is not possible to predict the course of events and legal, market and practical consequences that would ensue.
Redenomination risk arises from the uncertainties arising from an exit of a member state from the euro or a total dissolution of euro and how that exit or dissolution would be implemented. It is generally expected that an exiting member state would introduce a new national currency to replace the euro and re-denominate (or purport to re-denominate) euro contracts into the new national currency at an official rate of exchange, exposing the holders of the new currency to the risk of changes in the value of the new currency against the euro. The re-denomination may be supplemented by exchange and/or capital controls and additional bank holidays in order to give effect to the exit. In the case of a total dissolution of the eurozone, the euro would cease to be a valid currency, and all member states would revert to currency units on the basis of the likely EU treaty to give effect to the dissolution.
It is not possible to predict what the total financial impact on Santander UK might be of a eurozone member state exit or the dissolution of the euro. The determination of which assets and liabilities would be legally redenominated is potentially complex and depends on a numbers of factors, including the precise exit scenario, as the consequences on external contracts of a disorderly exit or one sanctioned under EU law may be different. Redenomination may impact too on contracts with entities who are not domiciled in the exiting member state if the contracts reference an asset or liability that is subject to the re-denomination. Any exchange and/or capital controls and additional bank holidays may impact the timing or ability to make payments or settlements and/or the availability of price sources or may trigger or result in defaults, termination events or other legal effects.
However, in order to provide an indication of the value of contracts that might potentially be affected, the table below identifies assets and liabilities arising in connection with contracts which are denominated in euro. These assets and liabilities predominantly comprise debt securities (covered bonds and securitisations) issued by the Group as part of its medium term funding activities, related interest rate derivatives which swap the euro exposures back into sterling, and trading repos. The debt securities in issue and related interest rate swaps are governed by English law and subject to the jurisdiction of the English courts.
| Contracts denominated in euro | £bn | |||
| Assets | ||||
| Trading repos | 9.6 | |||
| Other loans and securities | 2.9 | |||
| 12.5 | ||||
| Liabilities | ||||
| Debt securities in issue | (27.2 | ) | ||
| Trading repos | (8.2 | ) | ||
| Medium term repos | (8.7 | ) | ||
| Other deposits | (3.3 | ) | ||
| (47.4 | ) | |||
| Associated hedges | 35.0 | |||
| Total net position | 0.1 | |||
The Group has been actively identifying and monitoring potential redenomination risks and, where possible, taking steps with the potential to mitigate them and/or reduce the Group’s overall exposure to losses that might arise in the event of a redenomination. It should be emphasised, however, that a euro exit could take a number of different forms giving rise to distinct legal, market and practical consequences which could significantly alter the potential effectiveness of any steps taken, and it is accordingly not possible to predict how effective particular measures may be until they are tested against the precise circumstances of a redenomination event. Management actions to mitigate the impact of such scenarios are kept under close review and if eurozone prospects continue to deteriorate, management would expect to evaluate and implement action to reduce further the impact of such deterioration on its business.
There is an established framework for dealing with counterparty and systemic crisis situations which is complemented by regular stress testing and scenario planning. The framework ensures that the Group has operational plans in case an adverse scenario materialises.
DERIVATIVE ASSETS AND LIABILITIES
30 June 2012 £m | 31 December 2011 £m | |||||||
| Assets | ||||||||
| - held for trading | 26,679 | 27,394 | ||||||
| - held for fair value hedging | 3,870 | 3,386 | ||||||
| 30,549 | 30,780 | |||||||
| Liabilities | ||||||||
| - held for trading | 27,283 | 27,787 | ||||||
| - held for fair value hedging | 1,356 | 1,393 | ||||||
| 28,639 | 29,180 | |||||||
Derivatives are held for trading or for risk management purposes. All derivatives are classified as held at fair value through profit or loss. For accounting purposes, the Group chooses to designate certain derivatives as in a hedging relationship if they meet specific criteria. The main hedging derivatives are interest rate and cross-currency swaps, which are used to hedge fixed-rate lending and structured savings products and medium-term note issuances, capital issuances and other capital markets funding.
Corporate Banking deals with commercial customers who wish to enter into derivative contracts. Any market risk arising from such transactions is hedged by Markets. Markets is responsible for implementing Group derivative hedging with the external market together with its own trading activities. Further details about market risk are set out in the Risk Management Report.
A summary of the Group’s derivative activities, the related risks associated with such activities and the types of hedging derivatives used in managing such risks, as well as notional amounts and assets and liabilities analysed by contract type are contained in Note 15 of the Group’s 2011 Annual Report.
TANGIBLE FIXED ASSETS
30 June 2012 £m | 31 December 2011 £m | |||||||
| Property, plant and equipment | 1,544 | 1,596 | ||||||
| Capital expenditure incurred during the period | 90 | 205 | ||||||
Details of capital expenditure in respect of tangible fixed assets are set out in Note 18 to the Condensed Consolidated Interim Financial Statements. Management believes its existing properties and those under construction, together with those it leases, are adequate and suitable for its business as presently conducted and to meet future business needs. All properties are adequately maintained.
DEPOSITS BY BANKS(1)
The balances below include deposits by banks that are classified in the balance sheet as trading liabilities and financial liabilities designated at fair value.
Six months ended 30 June 2012 £m | Six months ended 30 June 2011 £m | |||||||
Period-end balance(1) | 23,218 | 33,234 | ||||||
Average balance(2) | 25,395 | 35,404 | ||||||
Average interest rate(2) | 1.11 | % | 1.00 | % | ||||
| (1) | The period end deposits by banks balance include non-interest bearing items in the course of transmission of £423m (30 June 2011: £1,085m). |
| (2) | Calculated using monthly data. |
At 30 June 2012, deposits by foreign banks amounted to £8,459m (30 June 2011: £16,438m).
The following tables set forth the average balances of deposits by banks by geography.
Six months ended 30 June 2012 £m | Six months ended 30 June 2011 £m | |||||||
| UK | 25,186 | 33,353 | ||||||
| Non-UK | 209 | 2,051 | ||||||
| 25,395 | 35,404 | |||||||
DEPOSITS BY CUSTOMERS
The balances below include deposits by customers that are classified in the balance sheet as trading liabilities and financial liabilities designated at fair value.
Six months ended 30 June 2012 £m | Six months ended 30 June 2011 £m | |||||||
| Period-end balance | 167,908 | 167,683 | ||||||
Average balance(1) | 162,901 | 169,056 | ||||||
Average interest rate(1) | 1.77 | % | 1.65 | % | ||||
(1) | Calculated using monthly data. |
The following tables set forth the average balances of deposits by geography and customer type.
Six months ended 30 June 2012 £m | Six months ended 30 June 2011 £m | |||||||
| UK | ||||||||
| Retail demand deposits | 72,644 | 70,997 | ||||||
| Retail time deposits | 46,442 | 51,617 | ||||||
| Wholesale deposits | 34,785 | 35,831 | ||||||
| 153,871 | 158,445 | |||||||
Non-UK(1) | ||||||||
| Retail demand deposits | 1,468 | 2,346 | ||||||
| Retail time deposits | 6,270 | 6,408 | ||||||
| Wholesale deposits | 1,292 | 1,857 | ||||||
| 9,030 | 10,611 | |||||||
| 162,901 | 169,056 | |||||||
(1) Includes Jersey (the Channel Islands) and the Isle of Man.
SHORT-TERM BORROWINGS
The Group includes short-term borrowings within deposits by banks, trading liabilities, financial liabilities designated at fair value and debt securities in issue and does not show short-term borrowings separately on the balance sheet. Short-term borrowings are defined by the US Securities and Exchange Commission as amounts payable for short-term obligations that are US Federal funds purchased and securities sold under repurchase agreements, commercial paper, borrowings from banks, borrowings from factors or other financial institutions and any other short-term borrowings reflected on the Group’s balance sheet. The Group’s only significant short-term borrowings are securities sold under repurchase agreements, commercial paper, borrowings from banks, negotiable certificates of deposit, and certain other debt securities in issue. Additional information on short-term borrowings is provided in the table below for the six months ended 30 June 2012 and the six months ended 30 June 2011.
Six months ended 30 June 2012 £m | Six months ended 30 June 2011 £m | |||||||
| Securities sold under repurchase agreements | ||||||||
| - Period-end balance | 32,742 | 29,055 | ||||||
| - Period-end interest rate | 0.46 | % | 0.31 | % | ||||
- Average balance(1) | 32,552 | 35,359 | ||||||
- Average interest rate(1) | 0.40 | % | 0.48 | % | ||||
- Maximum balance(1) | 37,621 | 39,935 | ||||||
| Commercial paper | ||||||||
| - Period-end balance | 3,701 | 6,908 | ||||||
| - Period-end interest rate | 1.05 | % | 0.84 | % | ||||
- Average balance(1) | 3,803 | 5,707 | ||||||
- Average interest rate(1) | 1.07 | % | 0.65 | % | ||||
- Maximum balance(1) | 3,921 | 6,908 | ||||||
Borrowings from banks (Deposits by banks)(2) | ||||||||
| - Period-end balance | 2,779 | 4,859 | ||||||
| - Period-end interest rate | 0.71 | % | 0.69 | % | ||||
- Average balance(1) | 3,488 | 7,450 | ||||||
- Average interest rate(1) | 0.88 | % | 0.63 | % | ||||
- Maximum balance(1) | 4,910 | 9,053 | ||||||
| (1) | Calculated using monthly data. |
| (2) | The period-end deposits by banks balance includes non-interest bearing items in the course of transmission of £423m (30 June 2011: £1,085m). |
Six months ended 30 June 2012 £m | Six months ended 30 June 2011 £m | |||||||
| Negotiable certificates of deposit | ||||||||
| - Period-end balance | 2,054 | 7,087 | ||||||
| - Period-end interest rate | 1.20 | % | 1.43 | % | ||||
- Average balance(1) | 2,345 | 6,779 | ||||||
- Average interest rate(1) | 1.09 | % | 1.09 | % | ||||
- Maximum balance(1) | 2,576 | 8,083 | ||||||
| Other debt securities in issue | ||||||||
| - Period-end balance | 4,548 | 2,361 | ||||||
| - Period-end interest rate | 2.24 | % | 2.39 | % | ||||
- Average balance(1) | 5,283 | 2,827 | ||||||
- Average interest rate(1) | 2.28 | % | 1.99 | % | ||||
- Maximum balance(1) | 5,518 | 3,413 | ||||||
| (1) | Calculated using monthly data. |
| (2) | The period-end deposits by banks balance includes non-interest bearing items in the course of transmission of £1,339m (30 June 2011: £1,085m). |
DEBT SECURITIES IN ISSUE
The Group has issued debt securities in a range of maturities, interest rate structures and currencies, for purposes of meeting liquidity, funding and capital needs.
| Note | 30 June 2012 £m | 31 December 2011 £m | ||||||||||
| Trading liabilities | 21 | 1,698 | 755 | |||||||||
| Financial liabilities designated at fair value | 22 | 4,977 | 6,837 | |||||||||
| Debt securities in issue | 23 | 62,176 | 52,651 | |||||||||
| Subordinated liabilities | 24 | 6,558 | 6,499 | |||||||||
| 75,409 | 66,742 | |||||||||||
Most of the debt securities that the Group has issued are classified as “Debt securities in issue” in the balance sheet. The remaining debt securities issued by the Group are classified separately in the balance sheet, either because they qualify as “Trading liabilities” or were designated upon initial recognition as “Financial liabilities designated at fair value”, or there are key differences in the legal terms of the securities, such as liquidation preferences, or subordination of the rights of holders to the rights of holders of certain other liabilities (‘Subordinated liabilities’). Further information is set out in Notes 21 to 24 to the Condensed Consolidated Interim Financial Statements.
RETIREMENT BENEFIT ASSETS AND OBLIGATIONS
30 June 2012 £m | 31 December 2011 £m | |||||||
| Retirement benefit assets | 411 | 241 | ||||||
| Retirement benefit obligations | (36 | ) | (216 | ) | ||||
The Group operates a number of defined contribution and defined benefit pension schemes, and post retirement medical benefit plans. Detailed disclosures of the Group’s retirement benefit assets and obligations are contained in Note 26 to the Condensed Consolidated Interim Financial Statements.
OFF-BALANCE SHEET ARRANGEMENTS
In the ordinary course of business, the Group issues guarantees on behalf of customers. The significant types of guarantees are described on page 53 of the Group’s 2011 Annual Report.
Further information regarding off-balance sheet arrangements can be found in the “Financial Instruments of Special Interest” section of the Risk Management Report on page 123. See Note 27 to the Condensed Consolidated Interim Financial Statements for additional information regarding the Group’s guarantees, commitments and contingencies. In the ordinary course of business, the Group also enters into securitisation transactions as described in Note 12 to the Condensed Consolidated Interim Financial Statements. The securitisation companies are consolidated and the assets continue to be administered by the Group. The securitisation companies provide the Group with an important source of longer term funding.
CAPITAL MANAGEMENT AND RESOURCES
Capital management and capital allocation
The Group adopts a centralised capital management approach, based on an assessment of both regulatory requirements and the economic capital impacts of our businesses. Details of the Group’s objectives, policies and processes for managing capital, including the group capital table, can be found in Note 34 to the Condensed Consolidated Interim Financial Statements.
Capital and risk management disclosures required by Pillar 3
Banco Santander, S.A. is supervised by the Banco de España (the Bank of Spain) on a consolidated basis. The Group has applied Banco Santander’s approach to capital measurement and risk management in its implementation of Basel II. As a result, the Group has been classified as a significant sub-group of Banco Santander, S.A. at 30 June 2012. The relevant Pillar 3 disclosure requirements for the Group are set out below. Further information on the Basel II risk measurement of the Group’s exposures is included in Banco Santander, S.A.’s Pillar 3 report.
Scope of the Group’s capital adequacy
Santander UK plc and its subsidiaries are a UK banking group effectively subject to two tiers of supervision. Santander UK is subject to prudential supervision by both the FSA (as a UK authorised bank) and the Bank of Spain (as a member of the Santander group). As an FSA regulated entity, Santander UK is expected to satisfy the FSA liquidity and capital requirements on a standalone basis. Similarly, Santander UK must demonstrate to the FSA that it can withstand liquidity and capital stress tests without parental support. Reinforcing the corporate governance framework adopted by Santander UK, the FSA exercises oversight through its rules and regulations on the Santander UK Board and senior management appointments.
The basis of consolidation for prudential purposes is the same as the basis of consolidation for financial statement purposes. Consequently, the results of significant subsidiaries regulated by the FSA are included in the Group’s capital adequacy disclosures. Capital transferability between the Group’s subsidiaries is managed in accordance with the Group’s corporate purpose and strategy, its risk and capital management policies and with regard to UK legal and regulatory requirements. There are no other current or foreseen material practical or legal impediments to the prompt transfer of capital resources or repayment of liabilities when due between the Company and its subsidiaries and associates.
Regulatory capital resources
The table below analyses the composition of the Group’s regulatory capital resources. The calculations reflect the amounts prepared on a basis consistent with the Group’s regulatory filings.
| Note | 30 June 2012 £m | 31 December 2011 £m | ||||||||||
| Shareholders’ equity: | ||||||||||||
| Shareholders equity per consolidated balance sheet | 13,361 | 12,666 | ||||||||||
| Preference shares | 28 | (597 | ) | (597 | ) | |||||||
| Other equity instruments | 28 | (297 | ) | (297 | ) | |||||||
| 12,467 | 11,772 | |||||||||||
| Regulatory adjustments: | ||||||||||||
| Own credit | (65 | ) | (70 | ) | ||||||||
| Defined benefit pension adjustment | (284 | ) | (216 | ) | ||||||||
| Unrealised (profits)/losses on available-for-sale securities | 19 | (9 | ) | |||||||||
| (330 | ) | (295 | ) | |||||||||
| Core Tier 1 deductions: | ||||||||||||
| Goodwill and intangible assets | (2,306 | ) | (2,225 | ) | ||||||||
| 50% excess of expected losses over impairment (net of tax) | (364 | ) | (353 | ) | ||||||||
| 50% of securitisation positions | (31 | ) | (38 | ) | ||||||||
| (2,701 | ) | (2,616 | ) | |||||||||
| Core Tier 1 capital | 9,436 | 8,861 | ||||||||||
| Other Tier 1 capital: | ||||||||||||
| Preference shares | 859 | 860 | ||||||||||
| Innovative/hybrid Tier 1 securities | 1,676 | 1,659 | ||||||||||
| 50% tax benefit on excess of expected losses over impairment | 119 | 118 | ||||||||||
| 2,654 | 2,637 | |||||||||||
| Total Tier 1 capital | 12,090 | 11,498 | ||||||||||
| Qualifying Tier 2 capital: | ||||||||||||
| Undated subordinated debt | 24 | 2,267 | 2,250 | |||||||||
| Dated subordinated debt | 24 | 2,741 | 2,738 | |||||||||
| General/collective provisions on standardised portfolios | 250 | — | ||||||||||
| Unrealised gains on available-for-sale equity securities | — | 9 | ||||||||||
| 5,258 | 4,997 | |||||||||||
| Tier 2 deductions: | ||||||||||||
| 50% of securitisation positions | (31 | ) | (38 | ) | ||||||||
| 50% excess of expected losses over impairment (gross of tax) | (484 | ) | (470 | ) | ||||||||
| (515 | ) | (508 | ) | |||||||||
| Total regulatory capital | 16,833 | 15,987 | ||||||||||
The Group’s Core Tier 1 capital consists of shareholders’ equity at 30 June 2012 and 31 December 2011 after adjustment to comply with the FSA’s rules. For capital management purposes and in accordance with the FSA’s rules, Innovative Tier 1 capital instruments are treated as Tier 1 capital. The FSA’s capital gearing rules restrict the amount of Innovative Tier 1 capital included in Tier 1 capital to 15% of Tier 1 capital after deductions. The excess is classified as Tier 2.
Total regulatory capital consists of:
Shareholders’ equity
The Group’s shareholders’ equity at 30 June 2012 was £13,361m (31 December 2011: £12,666m) as per the Condensed Consolidated Balance Sheet. Preference Shares of £597m (31 December 2011: £597m) deducted from shareholders’ equity consist of the £300m fixed/floating rate non-cumulative callable preference shares and the £300m Step-up Callable Perpetual Preferred Securities. These are included within Other Tier 1 capital preference shares and Innovative/hybrid Tier 1 Instruments, respectively, as described below. Other equity instruments of £297m (31 December 2011: £297m) deducted from shareholders’ equity consist of the £300m Step-up callable Perpetual Reserve Capital Instruments.
Regulatory adjustments
The Group’s own credit adjustment of £65m (31 December 2011: £70m) relates to changes in liabilities designated at fair value through profit or loss resulting from changes in the Group’s own credit risk. Valuation adjustments relating to liabilities designated at fair value through profit or loss which are not attributable to changes in benchmark interest rates are excluded from regulatory capital resources. The defined benefit pension adjustment of £284m (31 December 2011: £216m) removes the pension surplus and deficit calculated in accordance with IFRS in the Group’s regulatory filings and replaces it (in the case of schemes in deficit), with the next five years’ contributions.
Core Tier 1 deductions
Goodwill and Intangible assets of £2,306m (31 December 2011: £2,225m) deducted from Core Tier 1 capital represent goodwill arising on the acquisition of businesses and certain capitalised computer software costs. The regulatory value of goodwill and intangible assets deducted is different from the accounting value in Note 17 to the Condensed Consolidated Interim Financial Statements as certain regulatory adjustments are made. The Group has elected to deduct certain securitisation positions of £31m (31 December 2011: £38m) from Tier 1 capital and of £31m (31 December 2011: £38m) from Tier 2 capital rather than treat these exposures as a risk weighted asset. The excess expected losses deduction of £364m (31 December 2011: £353m) net of tax from Tier 1 capital and of £484m (31 December 2011: £470m) gross of tax from Tier 2 capital represents the difference between expected loss calculated in accordance with the Group’s Retail Internal Rating-Based (‘IRB’) and Advanced Internal Rating-Based (‘AIRB’) models, and the impairment loss allowances calculated in accordance with IFRS. The Group’s accounting policy for impairment loss allowances is set out in Note 1 of the Group’s 2011 Annual Report. Expected losses are calculated using risk parameters based on either through-the-cycle, or economic downturn estimates, and are subject to conservatism due to the imposition of regulatory floors. They are therefore currently higher than the impairment loss allowances under IFRS which only reflect losses incurred at the balance sheet date.
Other Tier 1 capital
Preference Shares of £859m (31 December 2011: £860m) within Other Tier 1 capital consist of the £325m Sterling Preference Shares, the £175m Fixed/Floating Rate Tier One Preferred Income Capital Securities and the £300m fixed/floating rate non-cumulative callable preference shares. Details of these instruments are set out in Notes 24 and 28 to the Condensed Consolidated Interim Financial Statements.
Innovative/hybrid Tier 1 Instruments of £1,676m (31 December 2011: £1,659m) within Other Tier 1 capital consist of the US$1,000m Non-Cumulative Trust Preferred Securities, £300m Step-up Callable Perpetual Reserve Capital Instruments and the £300m Step Up Callable Perpetual Preferred Securities. Details of these instruments are set out in Notes 24 and 28 to the Condensed Consolidated Interim Financial Statements.
Qualifying Tier 2 capital
Details of the undated subordinated debt issues of £2,267m (31 December 2011: £2,250m) and the dated subordinated debt issues of £2,741m (31 December 2011: £2,738m) that meet the FSA’s definition of Tier 2 capital are set out in Note 24 to the Condensed Consolidated Interim Financial Statements. In accordance with the FSA’s rules, in the last five years to maturity, dated subordinated debt issues are amortised on a straight line basis. During the first half of 2012 and 2011, accounting valuation adjustments to Tier 1 and Tier 2 instruments were also included in capital as permitted in accordance with FSA rules. In addition, general provisions on standardised portfolios of £250m (31 December 2011; £nil) have been included.
Tier 2 deductions
The Group has elected to deduct certain securitisation positions as described in ‘’Core Tier 1 deductions’’ above. In addition expected losses gross of tax of £484m (31 December 2011: £470m) have been deducted from Tier 2 capital.
Risk weighted assets
The tables below analyse the composition of the Group’s risk weighted assets. The calculations reflect the amounts prepared on a basis consistent with the Group’s regulatory filings.
Risk weighted assets by risk
30 June 2012 £m | 31 December 2011 £m | |||||||
| Credit risk | 63,079 | 64,167 | ||||||
| Counterparty risk | 2,217 | 2,226 | ||||||
| Market risk | 3,905 | 2,813 | ||||||
| Operational risk | 8,242 | 8,249 | ||||||
| Total risk weighted assets | 77,443 | 77,455 | ||||||
Risk weighted assets by division
30 June 2012 £bn | 31 December 2011 £bn | |||||||
| Retail Banking | 39.3 | 40.1 | ||||||
| Corporate Banking | 20.4 | 20.1 | ||||||
| Markets | 6.8 | 5.8 | ||||||
| Corporate Centre | 10.9 | 11.5 | ||||||
| Total risk weighted assets | 77.4 | 77.5 | ||||||
Risk weighted assets by division may be further analysed as follows:
| 30 June 2012 | Balance sheet amount £bn | Regulatory exposure £bn | Risk weighting % | Risk weighted assets £bn | ||||||||||||
| Retail Banking | ||||||||||||||||
| - Secured lending | 163.2 | 171.5 | 13.7 | 23.6 | ||||||||||||
| - Unsecured lending | 9.0 | 11.8 | 82.7 | 9.7 | ||||||||||||
| - Operational risk | — | — | — | 6.0 | ||||||||||||
| Corporate Banking | ||||||||||||||||
| - Customer assets | 19.1 | 23.5 | 82.9 | 19.5 | ||||||||||||
- Non customer assets(1) | 23.4 | 0.9 | — | 0.4 | ||||||||||||
| - Operational risk | — | — | — | 0.5 | ||||||||||||
| Markets | ||||||||||||||||
| - Credit risk | 0.1 | 0.1 | 100.0 | 0.1 | ||||||||||||
| - Counterparty risk | 27.1 | 6.0 | 31.5 | 1.9 | ||||||||||||
| - Market risk | — | — | — | 3.7 | ||||||||||||
| - Operational risk | — | — | — | 1.1 | ||||||||||||
| Corporate Centre | ||||||||||||||||
| - Customer assets | 11.3 | 14.0 | 36.8 | 5.2 | ||||||||||||
- Liquid assets(2) | 40.0 | 34.8 | — | — | ||||||||||||
| - Operational risk | — | — | — | 0.7 | ||||||||||||
| Intangible assets and securitisation deductions from capital resources | 2.3 | — | — | — | ||||||||||||
Other assets(3) | 16.0 | 10.2 | 49.6 | 5.0 | ||||||||||||
| 311.5 | 77.4 | |||||||||||||||
| (1) | Non customer assets principally consist of the securities lending/borrowing and repo businesses of the money markets product area. |
| (2) | Regulatory exposure of liquid assets includes reverse repurchase agreements collateralised by UK Government securities. |
| (3) | The balance sheet amounts of other assets have not been allocated segmentally, although the RWA’s have been allocated to Corporate Centre. |
| 31 December 2011 | Balance sheet amount £bn | Regulatory exposure £bn | Risk weighting % | Risk weighted assets £bn | ||||||||||||
| Retail Banking | ||||||||||||||||
| - Secured lending | 166.2 | 175.9 | 13.9 | 24.5 | ||||||||||||
| - Unsecured lending | 9.2 | 11.7 | 82.1 | 9.6 | ||||||||||||
| - Operational risk | — | — | — | 6.0 | ||||||||||||
| Corporate Banking | ||||||||||||||||
| - Customer assets | 19.0 | 23.7 | 80.9 | 19.2 | ||||||||||||
- Non customer assets(1) | 19.4 | 0.7 | 54.7 | 0.4 | ||||||||||||
| - Operational risk | — | — | — | 0.5 | ||||||||||||
| Markets | ||||||||||||||||
| - Credit risk | 0.1 | 0.1 | 100.0 | 0.1 | ||||||||||||
| - Counterparty risk | 28.6 | 5.9 | 32.6 | 1.9 | ||||||||||||
| - Market risk | — | — | — | 2.7 | ||||||||||||
| - Operational risk | — | — | — | 1.1 | ||||||||||||
| Corporate Centre | ||||||||||||||||
| - Customer assets | 11.9 | 14.1 | 37.2 | 5.3 | ||||||||||||
- Liquid assets(2) | 28.0 | 26.1 | — | — | ||||||||||||
| - Operational risk | — | — | — | 0.6 | ||||||||||||
| Intangible assets and securitisation deductions from capital resources | 2.2 | — | — | — | ||||||||||||
Other assets(3) | 13.0 | 10.9 | 51.2 | 5.6 | ||||||||||||
| 297.6 | 77.5 | |||||||||||||||
| (1) | Non customer assets principally consist of the securities lending/borrowing and repo businesses of the money markets product area. |
| (2) | Regulatory exposure of liquid assets includes reverse repurchase agreements collateralised by UK Government securities. |
| (3) | The balance sheet amounts of other assets have not been allocated segmentally, although the RWA’s have been allocated to Corporate Centre. |
Regulatory exposure represents the Exposure at Default (‘EAD’) calculated in accordance with the FSA BIPRU handbook. EAD for customer assets includes unutilised credit facilities and is adjusted for a credit conversion factor (‘CCF’). EAD for repurchase, reverse repurchase, securities financing and derivative transactions are calculated net of any associated collateral and are adjusted for regulatory changes and potential future exposure adjustments (‘PFE’) where applicable.
The Group applies Basel II to the calculation of its capital requirement. In addition, the Group applies the Retail IRB and AIRB approaches to its credit portfolios. See the “Operational Risk” section of the Risk Management Report on page 115 for discussion of future regulatory changes, including Basel III. Residential lending capital resources requirements include securitised residential mortgages. In the first half of 2012, risk weighted assets (‘RWAs’) remained reasonably consistent reflecting a fall in credit risk RWA’s as a result of managed reductions in the retail mortgage and unsecured personal loan portfolios which was partially offset by an increase in market risk RWA’s.
Key capital ratios
The calculations of Group capital are prepared on a basis consistent with the Group’s regulatory filings. Ratios are calculated by taking the relevant capital resources as a percentage of risk weighted assets.
The table below summarises the Group’s capital ratios:
30 June 2012 % | 31 December 2011 % | |||||||
| Core Tier 1 | 12.2 | 11.4 | ||||||
| Total capital | 21.7 | 20.6 | ||||||
Movements in Core Tier 1 capital
Movements in Core Tier 1 capital during the first half of 2012 and the year ended 31 December 2011 were as follows:
30 June 2012 £m | 31 December 2011 £m | |||||||
| Opening Core Tier 1 capital | 8,861 | 8,496 | ||||||
| Contribution to Core Tier 1 capital from profit for the period: | ||||||||
| - Consolidated profits attributable to shareholders of the Company | 550 | 903 | ||||||
| - Other comprehensive income for the period | 302 | (37 | ) | |||||
| - Tax on comprehensive income | (72 | ) | 9 | |||||
| - Removal of own credit spread (net of tax) | 5 | (49 | ) | |||||
| Net dividends | (57 | ) | (482 | ) | ||||
| (Increase)/decrease in goodwill and intangible assets deducted | (81 | ) | 40 | |||||
| Pensions | (68 | ) | 5 | |||||
| Other: | ||||||||
| - Decrease in securitisation positions | 7 | 55 | ||||||
| - Increase in expected losses | (11 | ) | (79 | ) | ||||
| Closing Core Tier 1 capital | 9,436 | 8,861 | ||||||
The changes in the Group’s Core Tier 1 capital reflect movements in ordinary share capital, share premium and audited profits for the six months ended 30 June 2012 and the twelve months ended 31 December 2011 after adjustment to comply with the FSA’s rules. Santander UK complied with the FSA’s capital adequacy requirements during the first half of 2012 and 2011.
During the six months ended 30 June 2012, Core Tier 1 capital increased by £575m to £9,436m (31 December 2011: £8,861m). This increase was largely due to profits for the period of £550m net of dividends declared of £57m. During the twelve months to 31 December 2011, Core Tier 1 capital increased by £365m to £8,861m. This increase was largely due to audited profits for the year of £903m net of dividends declared of £482m.
Effect on the Core Tier 1 capital ratio of Basel III
Santander UK estimates that, based on its consolidated capital position at 30 June 2012 and the Basel III rules as currently drafted, its Core Tier 1 ratio would have been reduced by approximately 0.5 percentage points to 11.7% on a transitional Basel III basis, and by approximately 1.4 percentage points to 10.8% on a full Basel III basis. However, this does not take into account the impact of retained profits and/or capital issuance through the transitional period to mitigate this effect on Santander UK’s Core Tier 1 ratio.
FUNDING AND LIQUIDITY
The Board is responsible for the Group’s liquidity risk management and control framework and has approved key liquidity limits in setting the Group’s liquidity risk appetite. The Group has set a liquidity risk management and control framework which is reviewed annually and set out in its Individual Liquidity Adequacy Assessment (‘ILAA’). In its management of liquidity risks, the Group also looks at all times to abide by relevant regulatory best practices including all FSA requirements. Liquidity risk is the potential that, although remaining in operation, the Group does not have sufficient liquid financial resources to enable it to meet its obligations as they fall due, or can secure them only at excessive cost. In the Group’s opinion, its working capital is sufficient for its present requirements.
Under the subsidiary model, Santander UK primarily generates funding and liquidity through UK retail and corporate deposits, as well as in the financial markets through its own debt programmes and facilities to support its business activities and liquidity requirements. It does this in reliance on the strength of its balance sheet and profitability and its own network of investors. It does not rely on a guarantee from Banco Santander, S.A. or any other member of the Santander group to generate this funding or liquidity. Santander UK does not have direct access to the European Central Bank, although we do create ECB-eligible collateral in the ordinary course of business. Although Santander UK does not rely on other members of the Santander group for funding, at the time that central bank facilities were available, funding was obtained from our parent and other members of the Santander group through repo and debt issuance facilities. Santander UK does not raise funds to finance other members of the Santander group or guarantee the debts of other members of the Santander group (other than certain of Santander UK plc’s own subsidiaries). As an FSA regulated entity, Santander UK is expected to satisfy the FSA liquidity and capital requirements on a standalone basis. Similarly, Santander UK must demonstrate to the FSA that it can withstand liquidity and capital stress tests without parental support.
See the “Funding and Liquidity Risk” section of the Risk Management Report for more information.
Sources of funding and liquidity
The Group is primarily funded by retail deposits. This, together with corporate deposits, forms its commercial bank franchise, which attracts deposits through a variety of entities. More than two thirds of commercial bank customer lending is financed by commercial bank customer deposits. The retail sources primarily originate from the Retail Banking savings business. Although largely callable, these funds provide a stable and predictable core of funding due to the nature of the retail accounts and the breadth of personal customer relationships. Additionally, the Group has a strong wholesale funding base, which is diversified across product types and geography. Through the wholesale markets, the Group has active relationships with more than 500 counterparties across a range of sectors, including banks, central banks, other financial institutions, corporates and investment funds. Other sources of funding include collateralised borrowings, mortgage securitisations and long-term debt issuance. While there is no certainty regarding lines of credit extended to the Group, they are actively managed as part of the ongoing business. No committed lines of credit have been purchased as such arrangements are not common practice in the European banking industry. Short-term funding is accessed through money market instruments, including time deposits, certificates of deposit and commercial paper. Medium to long-term funding is accessed primarily through the Group’s euro medium-term note programmes. The major debt issuance programmes are managed by Abbey National Treasury Services plc on its own behalf (except for the US commercial paper programme, which is managed by Abbey National North America LLC, a guaranteed subsidiary of the Company) and are set out in Note 23 to the Condensed Consolidated Interim Financial Statements.
The ability to sell assets quickly is also an important source of liquidity for the Group. The Group holds marketable investment securities, such as central bank, eligible government and other debt securities, which could be disposed of, either by entering into sale and repurchase agreements, or by being sold to provide additional funding should the need arise. The Group also makes use of asset securitisation and covered bond arrangements to provide alternative funding sources.
Within the framework of prudent funding and liquidity management, the Group manages its commercial banking activities to minimise liquidity risk. During the first half of 2012, the Group’s loan-to-deposit ratio decreased by two percentage points to 134% (31 December 2011: 136%), largely due to the Group actively reducing its balance sheet through reduced volumes in high loan-to-value mortgages and interest-only mortgages. Medium-term funding issuances of £11.8bn during the period maintained a strong balance sheet position.
Encumbrance - Securitisation of assets and covered bonds
The Group has provided prime retail mortgage-backed securitised products to a diverse investor base through its mortgage- backed funding programmes. Funding has historically been raised via mortgage-backed notes, both issued to third parties and retained (the latter being central bank eligible collateral, both via the Bank of England's Special Liquidity Scheme facility and for contingent funding purposes in other Bank of England, Swiss National Bank, and US Federal Reserve facilities). The Group has also established a covered bond programme, whereby securities are issued to investors and are guaranteed by a pool of ring-fenced residential mortgages.
The Group remains a consistent issuer in a number of secured funding markets, in particular securitisations and covered bonds. The Group’s level of encumbrance arising from external issuance of securitisations and covered bonds increased in the first half of 2012 reflecting the Group’s continued strategy to utilise this form of term funding in place of shorter-term wholesale funding.
At 30 June 2012, total notes issued externally from secured programmes (securitisations and covered bonds) increased to £50,201m (31 December 2011: £41,007m), reflecting gross issuance of £9.6bn in the first half of 2012. At 30 June 2012, a total of £13,071m (31 December 2011: £46,111m) of notes issued under securitisation and covered bond programmes had also been retained internally, a proportion of which had been used as collateral for raising funds via third party bilateral secured funding transactions, which totalled £10.5bn at 30 June 3012, or for creating collateral which could in the future be used for liquidity purposes.
It is expected that issues to third parties and retained issuances will together represent a similar proportion of the Group’s overall funding in 2013 and 2014. In the first half of 2012, the Group raised approximately £11.2bn (six months ended 30 June 2011: £6bn) through further issuances under its securitisation and covered bond programmes, and secured bilateral funding trades.
Bank of England Special Liquidity Scheme
Along with other major UK banks and building societies, the Company participated in the Bank of England's Special Liquidity Scheme whereby it exchanged self-subscribed-for asset-backed security issuances for highly liquid Treasury Bills. All major UK banks and building societies were required to participate as part of the measures designed to improve the liquidity position of the UK banking system in general. Under the terms of the scheme the extent of usage was confidential. The remaining balances outstanding under the Special Liquidity Scheme were repaid in January 2012.
Other UK Government schemes
The Group welcomes the announcements made at the Mansion House in June 2012 aimed at increasing the supply of credit to the UK economy through the Extended Collateral Term Repo facility (‘ECTR’) and Funding for Lending.
The Company did not participate in other voluntary UK Government backed schemes; namely the Credit Guarantee Scheme and the Asset Purchase Scheme.
Funding sources
The table below shows the Group’s primary wholesale funding sources excluding short-term repurchase agreements.
| 30 June 2012 | 31 December 2011 | |||||||
| £bn | £bn | |||||||
| Deposits by banks | 11.5 | 6.6 | ||||||
| Deposits by customers | 2.6 | — | ||||||
| Debt securities in issue: | ||||||||
| - securitisations | 27.2 | 22.3 | ||||||
| - covered bonds | 22.1 | 16.6 | ||||||
| - other debt securities | 10.8 | 11.6 | ||||||
| 60.1 | 50.5 | |||||||
| Financial liabilities at fair value | 4.0 | 5.4 | ||||||
| Trading liabilities | 2.0 | 5.1 | ||||||
| Subordinated liabilities | 5.9 | 5.9 | ||||||
| Total wholesale funding | 86.1 | 73.5 | ||||||
During the first half of 2012, the Group continued reducing its dependence on short-term wholesale markets and funding a conservative proportion of retail assets in wholesale markets, as well as benefiting from a sound liquidity position. The Group’s wholesale funding is managed by ALM within Corporate Centre, to maintain a balanced duration. At 30 June 2012, 66% (31 December 2011: 73%) of wholesale funding had a maturity of greater than one year with an overall residual duration for wholesale funding of 1,122 days (31 December 2011: 1,028 days). In the first half of 2012, £11.8bn (2011: £17bn) of medium-term funding was issued, which more than funded maturities of medium-term funding.
Reconciliation of Group funding to the balance sheet at 30 June 2012
Included in funding analysis | Repos | Other(1) | Balance sheet | |||||||||||||
| £bn | £bn | £bn | £bn | |||||||||||||
| Deposits by banks | 11.5 | 1.2 | 2.5 | 15.2 | ||||||||||||
Deposits by customers(2) | 2.6 | — | — | 2.6 | ||||||||||||
| Debt securities in issue: | ||||||||||||||||
| - securitisations | 27.2 | — | — | 27.2 | ||||||||||||
| - covered bonds | 22.1 | — | 0.9 | 23.0 | ||||||||||||
| - other debt securities | 10.8 | — | 1.2 | 12.0 | ||||||||||||
| 60.1 | — | 2.1 | 62.2 | |||||||||||||
| Financial liabilities at fair value | 4.0 | — | 1.0 | 5.0 | ||||||||||||
| Trading liabilities | 2.0 | 19.7 | 6.5 | 28.2 | ||||||||||||
| Subordinated liabilities | 5.9 | — | 0.6 | 6.5 | ||||||||||||
| Total wholesale funding | 86.1 | 20.9 | 12.7 | 119.7 | ||||||||||||
| (1) | Principally consists of collateral received, nostros, items in the course of transmission and accounting adjustments such as accrued interest. |
| (2) | Included in the balance sheet total of £149,340m. |
Term Issuance
The Group continues to attract deposits in unsecured money markets and raise additional secured and unsecured term funding in a variety of markets. During the first half of 2012, the Group’s term issuance (sterling equivalent) comprised:
£m | ||||
| Securitisations | 5,882 | |||
| Covered bonds | 3,736 | |||
| Private placements | 15 | |||
| Senior unsecured | 630 | |||
| Structured issuance | 1,546 | |||
| Total Gross Issuances | 11,809 |
Credit Rating
In addition to monitoring and managing key metrics related to its financial strength, the Group subscribes to independent credit rating agency reviews by Standard & Poor’s, Moody’s and Fitch.
Santander UK plc credit ratings at 30 August 2012 | Standard & Poor’s | Moody’s | Fitch | |||||||||
| Long-term | A (Stable) | A2 (Under review) | A (Stable) | |||||||||
| Short-term | A-1 | P-1 | F1 | |||||||||
Liquid assets
The Group holds, at all times, an unencumbered liquid asset buffer to mitigate liquidity risk. The size and composition of this buffer is determined both by internal stress tests as well as the FSA’s liquidity regime.
The table below shows the liquid assets held by the Group:
| 30 June 2012 | 31 December 2011 | |||||||
| £bn | £bn | |||||||
| Cash at central banks | 29 | 25 | ||||||
| Government bonds | 11 | 3 | ||||||
| Core liquid assets | 40 | 28 | ||||||
| High quality bonds | 2 | 2 | ||||||
Other liquid assets(1) | 27 | 26 | ||||||
| Total liquid assets | 69 | 56 | ||||||
| (1) | Includes own issuances held by the Group and loans eligible for discount at central banks of £25.5bn at 30 June 2012 (31 December 2011: £24.4bn). |
Total liquid assets increased to £69bn at 30 June 2012 (31 December 2011: £56bn). The increase of core liquid assets reflected an improvement in the liquidity position from increased issuance levels reflecting the effects of planned deleveraging.
Uses of funding and liquidity
The principal uses of liquidity for the Group are the funding of the lending of Retail Banking and Corporate Banking, payment of interest expenses, dividends paid to shareholders, the repayment of debt and consideration for business combinations. The Group’s ability to pay dividends depends on a number of factors, including the Group’s regulatory capital requirements, distributable reserves and financial performance.
Current market conditions
Wholesale market funding conditions remained volatile through the first half of 2012. The Group continued to move towards more medium-term funding in 2012, reducing reliance on the short-term money markets. However, spreads continued to remain significantly above historical levels for both secured and unsecured issues. These markets have traditionally been important sources of funding and continue to be so.
During the first half of 2012, as described above, the Group issued £11.8bn (six months ended 30 June 2011: £17bn) of medium-term paper exceeding its strategic funding objectives and enabling it to comfortably meet day-to-day funding requirements.
For further information on liquidity, including its risk management and developments during the period, see the “Funding and Liquidity Risk” section in the Risk Management Report on page 110.
Cash flows
Six months ended 30 June 2012 £m | Six months ended 30 June 2011 £m | |||||||
| Net cash inflow from operating activities | 12,022 | 63 | ||||||
| Net cash (outflow)/inflow from investing activities | (4,959 | ) | 42 | |||||
| Net cash inflow from financing activities | 7,403 | 11,080 | ||||||
| Increase in cash and cash equivalents | 14,466 | 11,185 | ||||||
In the six months ended 30 June 2012 and 30 June 2011, cash and cash equivalents increased by £14,466m and £11,185m, respectively. The following discussion highlights the major activities and transactions that affected the Group’s cash flows during the first six months of 2012 and 2011.
In the six months ended 30 June 2012, the net cash inflow from operating activities of £12,022m principally resulted from an increase in sale and repurchase agreements within loans and advances to banks and customers within Note 7. In the six months ended 30 June 2011, the net cash inflow from operating activities totalled £63m. The Group’s operating activities supports the Group’s lending activities, including the origination of mortgages and unsecured personal loans. During this period, net lending remained broadly flat.
In the six months ended 30 June 2012, the net cash outflow from investing activities of £4,959m resulted principally from the acquisition of available-for-sale debt securities for £4,830m. In the six months ended 30 June 2011, the net inflow from investing activities of £42m resulted from the sale and redemption of debt securities of £124m and sales of tangible and intangibles fixed assets of £50m. This was partially offset by purchases of tangible and intangible fixed assets of £132m.
In the six months ended 30 June 2012, the net cash inflow from financing activities of £7,403m reflected new issues of loan capital of £22,711m offset by repayments of loan capital maturing in the period of £14,826m. In addition dividend payments were made during the period. In the six months ended 30 June 2011, the net inflow from financing activities of £11,080m reflected the new issues of loan capital of £22,431m offset by repayments of loan capital maturing in the period of £10,919m. Dividends of £375m were also paid during the six months ended 30 June 2011 on the ordinary share capital.
In the six months ended 30 June 2012, cash and cash equivalents increased by £14,466m, principally due to issuing of new loan capital. In the six months ended 30 June 2011, cash and cash equivalents increased by £11,185m respectively for the reasons outlined above.
Cash Flows from Operating Activities
In the six months ended 30 June 2012 and 30 June 2011, net cash inflow from operating activities was £12,022m and £63m, respectively. The Group’s operating assets and liabilities support the Group’s lending activities, including the origination of mortgages and unsecured personal loans. During 2011, the increase from the Group’s lending activities, principally corporate lending (particularly SMEs), offset by the continued de-leveraging process of legacy portfolios in run-off contributed to the majority of the cash outflow from operating activities.
The amount and timing of cash flows related to the Group’s operating activities may vary significantly in the normal course of business as a result of market conditions and trading strategies in the short term markets business of Markets.
Cash Flows from Investing Activities
The Group’s investing activities primarily involve the acquisition of available-for-sale debt securities and the purchase and sale of property, plant and equipment and intangible assets.
In the six months ended 30 June 2012, there was a net cash outflow from investing activities of £4,959m. This outflow mainly arose from the acquisition of various available-for–sale debt securities for £4,830m. A further £192m was spent on the acquisition of tangible and intangible fixed assets of which £114m related to the Group’s IT platform.
In the six months ended 30 June 2011, the net inflow from investing activities of £42m resulted from the sale and redemption of debt securities of £124m and sales of tangible and intangible fixed assets of £50m. This was partially offset by the purchase of tangible and intangible fixed assets of £132m.
Cash Flows from Financing Activities
The Group’s financing activities reflect transactions involving the issuance and repayment of long-term debt, and the issuance of, and payment of dividends on, the Company’s shares.
In the six months ended 30 June 2012, there was a net inflow of £7,885m in loan capital comprising principally new issues of mortgage-backed securities and covered bonds totalling £22,711m with repayments of £14,826m. Dividends of £425m were paid during the period on the ordinary share capital as well as £57m dividends paid on preference shares and other instruments.
In the six months ended 30 June 2011, the net inflow from financing activities of £11,080m reflected new issues (principally through mortgage backed securities and covered bonds) totalling £22,431m with repayments of £10,919m. Dividends of £375m were paid during the six months ended 30 June 2011 on the ordinary share capital.
INTEREST RATE SENSITIVITY
Interest rate sensitivity refers to the relationship between interest rates and net interest income resulting from the periodic repricing of assets and liabilities. The largest administered rate items in the Group’s balance sheet are residential mortgages and retail deposits, the majority of which bear interest at variable rates. The Group is able to mitigate the impact of interest rate movements on net interest income in Retail Banking by repricing separately the variable rate mortgages and variable rate retail deposits, subject to competitive pressures.
The Group also offers fixed-rate mortgages and savings products on which the interest rate paid by or to the customer is fixed for an agreed period of time at the start of the contract. The Group manages the margin on fixed-rate products by the use of derivatives matching the fixed-rate profiles. The risk of prepayment is reduced by imposing early termination charges if the customers terminate their contracts early.
The Group seeks to manage the risks associated with movements in interest rates as part of its management of the overall non-trading position. This is done within limits as described in the Risk Management Report beginning on page 52.
Changes in net interest income - volume and rate analysis
The following table allocates changes in interest income, interest expense and net interest income between changes in volume and changes in rate for the Group for the six months ended 30 June 2012 and 30 June 2011. Volume and rate variances have been calculated on the movement in the average balances and the change in the interest rates on average interest-earning assets and average interest-bearing liabilities. The variance caused by changes in both volume and rate has been allocated to rate changes.
| Six months ended 30 June 2012 compared to Six months ended 30 June 2011 | Six months ended 30 June 2011 compared to Six months ended 30 June 2010 | |||||||||||||||||||||||
Total change | Changes due to increase/(decrease) in | Total change | Changes due to increase/(decrease) in | |||||||||||||||||||||
£m | Volume £m | Rate £m | £m | Volume £m | Rate £m | |||||||||||||||||||
| Interest income | ||||||||||||||||||||||||
| Loans and advances to banks: | ||||||||||||||||||||||||
| - UK | 18 | 35 | (17 | ) | 1 | 21 | (20 | ) | ||||||||||||||||
| - Non-UK | (8 | ) | (19 | ) | 11 | 13 | 11 | 2 | ||||||||||||||||
| Loans and advances to customers: | ||||||||||||||||||||||||
| - UK | (115 | ) | 169 | (284 | ) | 563 | 298 | 265 | ||||||||||||||||
| - Non-UK | — | — | — | (1 | ) | (1 | ) | — | ||||||||||||||||
| Other interest earning financial assets: | ||||||||||||||||||||||||
| - UK | — | 20 | (20 | ) | (39 | ) | (89 | ) | 50 | |||||||||||||||
| Total interest income | ||||||||||||||||||||||||
| - UK | (97 | ) | 224 | (321 | ) | 525 | 230 | 295 | ||||||||||||||||
| - Non-UK | (8 | ) | (19 | ) | 11 | 12 | 10 | 2 | ||||||||||||||||
| (105 | ) | 205 | (310 | ) | 537 | 240 | 297 | |||||||||||||||||
| Interest expense | ||||||||||||||||||||||||
| Deposits by banks: | ||||||||||||||||||||||||
| - UK | 10 | 87 | (77 | ) | 78 | 15 | 63 | |||||||||||||||||
| - Non-UK | (4 | ) | (4 | ) | — | 4 | 4 | — | ||||||||||||||||
| Deposits by customers - retail demand deposits: | ||||||||||||||||||||||||
| - UK | 153 | 29 | 124 | 40 | (63 | ) | 103 | |||||||||||||||||
| - Non-UK | (7 | ) | (21 | ) | 14 | (8 | ) | (14 | ) | 6 | ||||||||||||||
| Deposits by customers - retail time deposits: | ||||||||||||||||||||||||
| - UK | (118 | ) | (95 | ) | (23 | ) | 37 | 61 | (24 | ) | ||||||||||||||
| - Non-UK | 8 | (3 | ) | 11 | 33 | 33 | — | |||||||||||||||||
| Deposits by customers - wholesale deposits: | ||||||||||||||||||||||||
| - UK | 30 | 13 | 17 | 45 | 40 | 5 | ||||||||||||||||||
| Subordinated debt: | ||||||||||||||||||||||||
| - UK | 2 | 12 | (10 | ) | (20 | ) | (25 | ) | 5 | |||||||||||||||
| - Non-UK | 1 | 1 | — | (2 | ) | (4 | ) | 2 | ||||||||||||||||
| Debt securities in issue: | ||||||||||||||||||||||||
| - UK | 246 | 224 | 22 | 263 | 96 | 167 | ||||||||||||||||||
| - Non-UK | (8 | ) | (29 | ) | 21 | 7 | (10 | ) | 17 | |||||||||||||||
| Other interest-bearing liabilities: | ||||||||||||||||||||||||
| - UK | 4 | — | 4 | (16 | ) | (32 | ) | 16 | ||||||||||||||||
| Total interest expense | ||||||||||||||||||||||||
| - UK | 327 | 270 | 57 | 427 | 92 | 335 | ||||||||||||||||||
| - Non-UK | (10 | ) | (56 | ) | 46 | 34 | 9 | 25 | ||||||||||||||||
| 317 | 214 | 103 | 461 | 101 | 360 | |||||||||||||||||||
| Net interest income | (422 | ) | (9 | ) | (413 | ) | 76 | 139 | (63 | ) | ||||||||||||||
AVERAGE BALANCE SHEET (1) (2)
As period-end statements may not be representative of the Group’s activity throughout the period, average balance sheets for the Group are presented below. The average balance sheets summarise the significant categories of assets and liabilities, together with average interest rates.
| Six months ended 30 June 2012 | Six months ended 30 June 2011 | |||||||||||||||||||||||
Average balance £m | Interest £m | Average rate % | Average balance £m | Interest £m | Average rate % | |||||||||||||||||||
| Assets | ||||||||||||||||||||||||
| Loans and advances to banks: | ||||||||||||||||||||||||
| - UK | 27,806 | 68 | 0.49 | 20,533 | 50 | 0.49 | ||||||||||||||||||
| - Non-UK | 3,863 | 6 | 0.31 | 12,049 | 14 | 0.23 | ||||||||||||||||||
Loans and advances to customers:(3) | ||||||||||||||||||||||||
| - UK | 201,263 | 3,731 | 3.71 | 196,967 | 3,846 | 3.91 | ||||||||||||||||||
| - Non-UK | 7 | — | 2.90 | 9 | — | 5.38 | ||||||||||||||||||
| Debt securities: | ||||||||||||||||||||||||
| - UK | 3,404 | 23 | 1.35 | 2,381 | 23 | 1.93 | ||||||||||||||||||
| Total average interest-earning assets, interest income | 236,343 | 3,828 | 3.24 | 231,939 | 3,933 | 3.39 | ||||||||||||||||||
| Impairment loss allowances | (1,591 | ) | — | — | (1,679 | ) | — | — | ||||||||||||||||
| Trading business | 27,700 | — | — | 37,826 | — | — | ||||||||||||||||||
| Assets designated at fair value through profit and loss | 4,848 | — | — | 6,085 | — | — | ||||||||||||||||||
| Other non-interest-earning assets | 42,412 | — | — | 34,303 | — | — | ||||||||||||||||||
| Total average assets | 309,712 | — | — | 308,474 | — | — | ||||||||||||||||||
| Non-UK assets as a % of total | 1.25 | % | — | — | 3.91 | % | — | — | ||||||||||||||||
| Liabilities | ||||||||||||||||||||||||
| Deposits by banks: | ||||||||||||||||||||||||
| - UK | (13,570 | ) | (96 | ) | 1.41 | (8,997 | ) | (86 | ) | 1.91 | ||||||||||||||
| - Non-UK | (128 | ) | — | — | (298 | ) | (4 | ) | 1.34 | |||||||||||||||
Deposits by customers - retail demand:(4) | ||||||||||||||||||||||||
| - UK | (72,644 | ) | (783 | ) | 2.16 | (70,997 | ) | (629 | ) | 1.77 | ||||||||||||||
| - Non-UK | (1,468 | ) | (21 | ) | 2.86 | (2,346 | ) | (28 | ) | 2.39 | ||||||||||||||
Deposits by customers - retail time:(4) | ||||||||||||||||||||||||
| - UK | (46,442 | ) | (357 | ) | 1.54 | (51,617 | ) | (475 | ) | 1.84 | ||||||||||||||
| - Non-UK | (6,270 | ) | (83 | ) | 2.65 | (6,408 | ) | (75 | ) | 2.34 | ||||||||||||||
Deposits by customers – wholesale:(4) | ||||||||||||||||||||||||
| - UK | (21,603 | ) | (163 | ) | 1.51 | (20,596 | ) | (133 | ) | 1.29 | ||||||||||||||
| Bonds and medium-term notes: | ||||||||||||||||||||||||
| - UK | (56,094 | ) | (649 | ) | 2.31 | (44,044 | ) | (405 | ) | 1.84 | ||||||||||||||
| - Non-UK | (3,415 | ) | (15 | ) | 0.88 | (9,165 | ) | (23 | ) | 0.50 | ||||||||||||||
| Dated and undated loan capital and other subordinated liabilities: | ||||||||||||||||||||||||
| - UK | (5,824 | ) | (68 | ) | 2.34 | (5,348 | ) | (66 | ) | 2.47 | ||||||||||||||
| - Non-UK | (643 | ) | (29 | ) | 9.02 | (627 | ) | (28 | ) | 8.93 | ||||||||||||||
| Other interest-bearing liabilities UK | (176 | ) | (5 | ) | 4.52 | (8 | ) | — | — | |||||||||||||||
| Total average interest-bearing liabilities, interest expense | (228,277 | ) | (2,269 | ) | 1.99 | (220,451 | ) | (1,952 | ) | 1.77 | ||||||||||||||
| Trading business | (30,499 | ) | — | — | (43,838 | ) | — | — | ||||||||||||||||
| Liabilities designated at fair value through profit and loss | (5,226 | ) | — | — | (5,314 | ) | — | — | ||||||||||||||||
| Non-interest-bearing liabilities: | ||||||||||||||||||||||||
| - Other | (32,713 | ) | — | — | (26,418 | ) | — | — | ||||||||||||||||
| - Shareholders’ funds | (12,997 | ) | — | — | (12,453 | ) | — | — | ||||||||||||||||
| Total average liabilities and shareholders’ funds | (309,712 | ) | — | — | (308,474 | ) | — | — | ||||||||||||||||
| Non-UK liabilities as a % of total | 3.85 | % | — | — | 6.11 | % | — | — | ||||||||||||||||
| Interest spread | — | — | 1.25 | — | — | 1.62 | ||||||||||||||||||
| Net interest margin | — | — | 1.32 | — | — | 1.71 | ||||||||||||||||||
| (1) | Average balances are based upon monthly data. |
| (2) | The ratio of average interest-earning assets to interest-bearing liabilities for the six months ended 30 June 2012 was 103.53% (Six months ended 30 June 2011: 105%). |
| (3) | Loans and advances to customers include non-performing loans. See the “Credit Risk” section of the Risk Management Report. |
| (4) | Demand deposits, time deposits and wholesale deposits are defined under “Deposits by customers” above. |
RISK MANAGEMENT REPORT
This Risk Management Report forms an integral part of the Condensed Consolidated Interim Financial Statements, except for the Operational Risk section on pages 115 to 120.
SUMMARY
This Risk Management Report describes the Risk Governance Framework of Santander UK plc (the ‘Company’, and together with its subsidiaries, ‘Santander UK’ or the ‘Group’), and includes more detail on the Group’s key risks, on a segmental basis or aggregated where relevant. It is divided into the following sections:
| Page | |||
| Executive summary | 53 | ||
| Introduction | 54 | ||
| > | Principles of risk management | 54 | |
| > | Risk Governance Framework | 55 | |
| Economic capital | 58 | ||
| > | Risk appetite | 58 | |
| > | Recovery and Resolution Plan | 58 | |
| > | Return on Risk-Adjusted Capital and value creation | 58 | |
| Principal Risks and Risk Management | 59 | ||
| > | Principal risks | 59 | |
| Credit Risk | 61 | ||
| > | Definition | 61 | |
| > | Treatment of credit risk | 61 | |
| > | Total credit risk exposures | 61 | |
| > | Measures and measurement tools | 62 | |
| > | Credit risk: concentration and mitigation | 66 | |
| > | Loans and advances | ||
| > | Credit quality of loans and advances that are neither past due nor individually impaired | 68 | |
| > | Maturity analysis of loans and advances that are past due but not individually impaired | 69 | |
| > | Impairment loss allowances | 71 | |
| > | Non-performing loans and advances, collections including forbearance, and restructured loans | 72 | |
| > | Segmental disclosures about credit risk | ||
| > | Retail Banking, including forbearance | 74 | |
| > | Corporate Banking, including forbearance | 88 | |
| > | Markets, including derivatives | 97 | |
| > | Corporate Centre | 100 | |
| Market Risk | 105 | ||
| > | Definition | 105 | |
| > | Managing market risk | 105 | |
| > | Segmental disclosures about market risk | ||
| > | Retail Banking | 108 | |
| > | Corporate Banking | 108 | |
| > | Markets | 108 | |
| > | Corporate Centre | 109 | |
| Funding and Liquidity Risk | 110 | ||
| > | Funding risk, including wholesale funding | 110 | |
| > | Liquidity risk, including liquid assets | 111 | |
| Operational Risk | 115 | ||
| Other Risks | 121 | ||
| Financial Instruments of special interest | 123 | ||
EXECUTIVE SUMMARY
Santander UK’s risk management principles page 54 | |
| > | Independence of the risk function from the business areas; |
| > | Involvement of senior management in decision-taking; |
| > | Risk Division as ultimate decision maker, although credit transactions are originated by the business; |
| > | Definition of powers; |
| > | Risk measurement; |
| > | Limitation of risk; |
| > | Establishment of risk policies and procedures; and |
| > | Definition and assessment of risk methodologies. |
Balance sheet strength A strong balance sheet is a key priority for the Group. This is reflected in: | |
| > | A strong Core Tier 1 Capital ratio of 12.2%, an increase of 0.8% from 31 December 2011. |
| > | Funding from a diversified mix of sources and geographies, with a particular focus on stable customer deposits and a reduction in short-term funding. |
| > | A conservative liquidity position including an increase in total liquid assets of 23% in the half year to £69bn. |
| > | A UK focus to the balance sheet, with approximately 99% of customer assets UK-related and approximately 85% of customer assets consisting of prime residential mortgages to UK customers. |
| > | Minimal net exposure after collateral to eurozone peripheral countries, amounting to approximately 0.5% of total assets. |
Credit risk Pages 61 to 104 Santander UK is exposed to credit risk throughout its business. The principal credit risk faced by the Group relates to UK mortgage lending, which represented 53% of the Group’s total assets at 30 June 2012 (31 December 2011: 56%). | |
| > | Santander UK's retail mortgage portfolio remains of good quality with only 12% of the portfolio having loan-to-value (‘LTV’) ratios greater than 90%. |
| > | Mortgage non-performing loans (‘NPLs’) as a percentage of mortgage assets (‘the mortgage NPL ratio’) increased to 1.57% at 30 June 2012 (31 December 2011: 1.46%). New entry arrears cases remained stable. The overall increase was due to a change in collections policy in late 2011 (resulting in accounts curing more slowly and thus remaining classified as NPL for longer). The ratio remained considerably below the UK industry average. The underlying performance remained stable, reflecting the high quality of the mortgage book, a lower than anticipated increase in unemployment and prolonged low interest rates. |
| > | Impairment loss allowances increased to £502m (31 December 2011: £478m) with the coverage ratio remaining strong at 20% (31 December 2011: 20%) as a result of higher allowances offsetting the increase in NPLs. |
Other significant credit risks arise in the retail unsecured and corporate portfolios. | |
Funding and Liquidity risk pages 110 to 114 and pages 45 to 49 within the ‘Balance Sheet Business Review’ The Group views the essential elements of funding and liquidity risk management as controlling potential cash outflows, maintaining prudent levels of highly liquid assets and ensuring that access to funding is available from a diverse range of sources. | |
| > | Liquidity risk is managed according to the Board’s liquidity risk appetite including both internal and FSA metrics that help determine the liquid asset buffer size appropriate for stress resilience and the shape of the funding maturity profile. |
| > | Various stress scenarios are considered with the aim of ensuring that sufficient liquid assets are available to cover the potential outflows under the stresses. The recovery and resolution plan contains the necessary management actions for further funding needs in case of emergency. |
Market risk pages 105 to 109 The Group aims to actively manage and control market risk by limiting the adverse impact of market movements whilst seeking to enhance earnings within clearly defined parameters. Market risk exists in both trading and non-traded portfolios. | |
| > | Appetite for traded market risk remains low and the main exposures continue to arise from trading and hedging interest rate exposures on the trading and non-traded portfolios. |
| > | The main banking book structural market risks are generated from yield curve maturity transformation and basis risk. |
Other risks
pages 121 and 122
The key other risk faced by the Group is pensions obligation risk, which is discussed principally in Note 26 to the Condensed Consolidated Interim Financial Statements, including sensitivities. The Group works closely with the pension Trustees to ensure that appropriate asset allocations are maintained, and to minimise the long-term cost of the pension scheme to the Group while managing risk and volatility.
INTRODUCTION
The Group accepts that risk arises from its full range of activities, and actively manages and controls it. The management of risk is an integral part of the Group’s activities. Risk is defined as the uncertainty around the Group’s ability to achieve its business objectives and execute its strategy effectively. Specifically, risk equates to the adverse impacts on profitability arising from different sources of uncertainty. The key risks Santander UK is exposed to are credit (including residual credit and concentration), market (including trading and non-traded), funding and liquidity, operational and other risks (including business/strategic, reputational, pension obligation and residual value). Risk measurement is used to capture the source of the uncertainty and the magnitude of its potential effect on the profitability and solvency of the Group. Effective risk management and oversight is therefore of fundamental importance to the Group’s long-term success.
Understanding and controlling risk is critical for the effective management of the business. The Group’s risk management framework aims to ensure that risk is managed and controlled on behalf of shareholders, customers, depositors, employees and the Group’s regulators. Effective and efficient risk governance together with oversight provide management assurance that the Group’s business activities will not be adversely impacted by risks that could have been reasonably foreseen. This in turn reduces the uncertainty of achieving the Group’s strategic objectives.
PRINCIPLES OF RISK MANAGEMENT
Risk management at Santander UK is based on the following principles:
| > | Independence of the risk function from the business areas. The segregation of functions between the business areas (which assume risk) and the risk areas responsible for risk management and oversight provides sufficient independence and autonomy for proper risk control. |
| > | Involvement of senior management. Santander UK's Executive Risk Committee and the senior management committees are structured so as to involve senior management in the overall risk control and oversight process. The Risk Oversight Committee supports the overall provision of risk oversight. |
| > | Risk Division as a decision maker. Credit transactions are initiated by the business areas, jointly reviewed by the Risk Division and business areas, with the final decision being taken by the Risk Division. |
| > | Definition of powers. The type of activities to be performed, segments, risks to be assumed and risk decisions to be made are clearly defined for each risk taking unit and, if appropriate, for each risk management unit, based on their delegated powers. How transactions and products should be structured, arranged, managed and where they should be accounted for is also defined. |
| > | Risk measurement. Risk measurement takes into account all risk exposures assumed across the business spectrum. It uses measures based on risk components and dimensions, over the entire risk cycle, for the management of risk at any given time. From a qualitative standpoint, this integrated vision translates into the use of certain integrating measures, which are mainly the risk capital requirement and return on risk-adjusted capital (‘RORAC’). |
| > | Limitation of risk. The limitation of risk is intended to limit, in an efficient and comprehensive manner, the maximum levels of risk for the various risk measures. It is based on knowledge of the risks incurred and supported by the necessary infrastructure for risk management, control and reporting. It also ensures that no undesired risks are assumed and that the risk-based-capital charge, risk exposures and losses do not exceed, in any case, the approved maximum levels. |
| > | Establishment of risk policies and procedures. The risk policies and procedures represent the basic regulatory framework, consisting of frameworks, policies and operating rules, through which risk activities and processes are regulated. |
| > | Definition and assessment of risk methodologies. Risk methodologies provide the definitions of the internal risk models applicable to the Group and, therefore, stipulate the risk measures, product valuation methods, yield curve and market data series building methods, calculation of risk-based capital requirements and other risk analysis methods, together with the respective calibration and testing processes. |
Phases of risk management
The risk management and control process at Santander UK is structured into the following phases:
| > | Establishment of risk management frameworks and policies that reflect the principles and standards governing the general modus operandi of Santander UK’s risk activities. These are based on a corporate risk management framework, which comprises the organisational model and the management model, and on a series of more specific corporate frameworks of the functions reporting to the Risk Division. The Risk Division transposes corporate risk regulations into its internal policies and develops the procedures required to implement them. |
| > | Definition of the Group's risk appetite by setting overall and specific limits for the various types of risks, products, customers, groups, sectors and geographical locations. |
| > | Identification of risks, through the constant review and monitoring of exposures, the assessment of new products, businesses and the specific analysis of singular transactions, or events. |
| > | Measurement of risks using methodologies and models implemented subject to a validation and approval process. |
Key techniques and tools
For many years, Santander UK has managed risk using a number of techniques and tools which are described in detail in this Risk Management Report. The key techniques and tools used are as follows:
| > | Internal ratings and scorings-based models which, by assessing the various qualitative and quantitative risk components by customer and transaction or product, make it possible to estimate, initially, the probability of default and, subsequently, the expected loss, based on estimates of loss given default. For operational risk, risks are assessed by self-assessments, supplemented by use of loss data and subjected to review at least annually. |
| > | Economic capital, as a homogeneous measure of the risk assumed and a basis for the measurement of the management performed. |
| > | RORAC, which is used both as a transaction and product pricing tool (bottom-up approach) and in the analysis of portfolios and units (top-down approach). |
| > | Value at Risk (‘VaR’), which is used for controlling market risk and setting the market risk limits for the various trading portfolios. |
| > | Scenario analysis and stress testing to supplement market, credit and operational risk analyses in order to assess the impact of alternative scenarios, including on impairment loss allowances and capital. |
RISK GOVERNANCE FRAMEWORK
The Group’s risk governance framework is structured to ensure that there is segregation of duties between those who have responsibilities for:
| > | Risk management; |
| > | Risk control and oversight; and |
| > | Risk assurance. |
The framework is based on the following five principles:
| > | Clearly allocating accountability for risk; |
| > | Embedded risk culture, starting at the highest levels of our organisation; |
| > | Shareholder value creation; |
| > | Independent risk assurance and transparency; and |
| > | Ensuring that the UK Financial Services Authority’s ‘Treating Customers Fairly’ principles are embedded into policies and processes. |
Enhanced Risk Management Framework
Following a review of Santander UK’s risk governance in 2011 an enhanced Risk Management Framework (“Framework”) was approved by the Santander UK Board (the “Board”) in November 2011 and, following further refinement, was formally adopted in April 2012. The Framework, which takes into account the increasing size and capacity of the Group and recent changes to regulation and best practice, will further strengthen the Group’s risk management controls. The new Framework:
| > | Reinforces the executive risk responsibility of the Chief Executive Officer for the management and control of all key risks; |
| > | Reinforces the role of the risk oversight function, its independence and global risk overview, under the leadership of the Chief Risk Officer; |
| > | Proposes a new risk appetite framework and statements that cover all risks and links to risk policies; |
| > | Redefines the main policies and frameworks that define the way the Group manages and controls risk and ensures that all significant risks, both financial and non-financial, are identified and addressed; |
| > | Provides greater clarification of accountabilities for origination, management, control and oversight of all risk across the Group; and |
| > | Enhances the risk governance structure and reporting of risk within the Group. |
The Group is now in a period of transition to the new Framework and a number of changes have been made to the risk committee governance structure. The focus is now on continuing to implement and embed the new Framework across the Group during the remainder of 2012 and ensuring that all employees are aware of their role in risk management and control.
Risk Governance
The overall risk appetite and Framework are approved by the Board, which also approves the strategy for managing risk and is responsible for the Group’s system of internal control. Responsibility for identifying, monitoring and managing risk and ensuring adherence to the risk appetite is delegated by the Board to the Chief Executive Officer and from her to specific individuals. Formal committees are maintained to assist the responsible individual in their effective management or oversight.
The Chief Risk Officer has overall accountability for risk management under authority delegated by the Chief Executive Officer. He provides oversight and challenge to the business and central functions to ensure that they are compliant with the risk policies and limits set by the Board and he provides assurance that all material risks are correctly identified, measured and controlled. The Chief Risk Officer also proposes the Framework for adoption by the Board (through the Board Risk Committee) and advises on any matters relating to risk management.
The principal responsibilities of the committees and functions that comprise the Group’s risk governance structure are as follows:
Board Risk Committee
The Board Risk Committee comprises independent Non-Executive Directors and is a formally constituted committee of the Board. Its responsibilities include oversight and advice to the Board on the overall risk appetite, tolerance and risk strategy of the Group; monitoring the effectiveness of the Group’s risk management and risk controls; oversight and advice to the Board on current risk exposures and future risk strategy, including the strategy for capital and liquidity management; advising the Remuneration Oversight Committee on the risk weightings applied in executive remuneration; and the oversight and challenge of the design and execution of stress and scenario testing.
Board Audit Committee
The Board Audit Committee comprises independent Non-Executive Directors and is a committee formally constituted by the Board. It provides advice to the Board Risk Committee on matters within its remit which impact on the Group’s risk management including the effectiveness of the Internal Audit function in the context of the overall risk management system.
Internal Audit Function
The Internal Audit function supports the Board Risk Committee by providing independent and objective opinions on the effectiveness and integrity of the Group’s risk management arrangements. It does this via a systematic programme of risk-based audits of the controls established and operated by operational management and support functions and also those exercised by the risk oversight function.
The audit opinions and underlying rationale of findings and recommendations form the basis upon which the Board Risk Committee can take reasonable (but not absolute) assurance that the risk management arrangements are fit for purpose and are working properly.
The Board Risk Committee also receives reports from management, the Board Audit Committee, the risk function and other business functions to help them to discharge their risk oversight responsibilities.
Executive Risk Committee
The Executive Risk Committee is the most senior risk committee within the Group at the executive level. It monitors the control and management of all key risks in the Group ensuring they are managed within the Board approved Framework, appetite and associated policies. It also ensures that the Board risk management policy decisions are appropriately implemented and that effective procedures are in place to monitor risk exposures and deal effectively with any breach of limits. The Executive Risk Committee is also responsible for approving material wholesale, corporate and commercial banking credit and market risk transactions above the level delegated to the Credit Approvals Committee (see below). Responsibility has been delegated for certain aspects of risk within defined thresholds to four new sub-committees: the Risk Management Committee; the Internal Control Committee; the Capital Committee; and the Credit Approvals Committee.
(i) Risk Management Committee
The Risk Management Committee ensures the effective management and control of all material financial risks within the Group. Its responsibilities include reviewing and monitoring financial risk management information and ensuring that adequate and effective risk control processes and reporting systems are in place so that all material financial risks are correctly identified and addressed. It also ensures that there is clear allocation and accountability for risk management and mitigation. The Risk Management Committee reports on its activities to the Executive Risk Committee and will escalate significant matters, as appropriate.
(ii) Internal Control Committee
The Internal Control Committee ensures effective management and control of material non-financial risks within the Group. These include, but are not limited to, Operational Risk (which can include financial crime risk, cyber security risk, human resources risk, customer and conduct risk, and regulatory, legal and compliance risk); Business/Strategic Risk; and Reputational Risk. The Internal Control Committee reviews and monitors non-financial risk management information and ensures that adequate and effective control processes and reporting systems are in place so that all material non-financial risks are correctly identified and addressed and there is clear allocation and accountability for risk management and mitigation. The Internal Control Committee reports on its activities to the Executive Risk Committee and will escalate significant matters, as appropriate.
(iii) Capital Committee
The Capital Committee ensures the effective management and control of capital within Board approved parameters. Its responsibilities include monitoring capital risk and ensuring that adequate and effective risk control processes are in place to manage and address capital risks. It also proposes and reviews actions and plans to optimise capital consumption and considers the effectiveness of capital measurement processes. In addition, the Capital Committee oversees the implementation of the Basel II and Basel III programmes. Any key issues will be escalated to the Executive Risk Committee, as appropriate.
(iv) Credit Approvals Committee (‘CAC’)
CAC is responsible for reviewing and approving wholesale, corporate and commercial banking transactions within certain defined limits over and above individual authority limits. Transactions which exceed the threshold limits set are referred for final approval to Banco Santander, S.A.’s Risk Division and the Executive Risk Committee, following agreement by CAC.
Risk Oversight Committee
The Risk Oversight Committee assists the Chief Risk Officer in the effective oversight of the control and management of all key financial and non-financial risks within the Group. Its remit includes the review and challenge of the risk appetite statements and associated business plan, the risk profile and stress testing results, in addition to providing assurance that the Group is operating within the defined risk management framework limits approved by the Board.
ECONOMIC CAPITAL
Economic capital is an internal measure of the minimum equity and preference capital required for the Group to maintain its credit rating based upon its risk profile. The concept of economic capital differs from that of regulatory capital, the latter being the capital required by capital adequacy regulations. Economic capital is calculated using the Banco Santander, S.A. economic capital model.
The economic capital model enables the Group to quantify the consolidated risk profile taking into account the significant risks of the business, as well as the diversification effect inherent in a multi-business group such as Santander UK. The Group uses this model to prepare the economic capital forecasts as part of its internal capital adequacy assessment report in accordance with the UK Financial Services Authority regulations within the framework of Pillar 2 of Basel II. Santander UK monitors the economic capital utilisation and its sufficiency on a monthly basis at the Executive Risk Committee.
The concept of diversification is fundamental to the proper measurement of the risk profile of a multi-business group. Diversification can be explained in terms of the imperfect correlation between the various risks, which means that the largest loss events do not occur simultaneously in all portfolios or for all types of risk. Consequently, the sum of the economic capital of the various portfolios and types of risk, taken separately, is higher than the Group’s total economic capital. In other words, the risk borne by Santander UK as a whole is less than the risk arising from the sum of its various components considered separately.
The economic capital model also considers the concentration risk for corporate and markets portfolios, in terms of both the size of their exposure and their sector or geographic concentration. Product concentration in retail portfolios is captured through the application of an appropriate correlation model.
RISK APPETITE
The risk appetite is principally set by defining the economic capital limits by risk types. The Board agrees on high level limits for each principal risk type. The authority for managing and monitoring the risk appetite then flows to the Chief Executive Officer and from her to specific individuals. The Chief Risk Officer is responsible for setting other limits to support the monitoring of Board-approved limits, which is in turn supported by the Risk Division and the Risk Oversight function.
The risk appetite statement is recommended by the Chief Executive Officer and approved by the Board, under advice from the Board Risk Committee. The risk appetite statement is reviewed by the Board at least annually or more frequently if necessary (e.g. in the case of significant methodological change). This ensures that the risk appetite continues to be consistent with Santander UK’s current and planned business activities. The Chief Executive Officer under advice from the Executive Risk Committee approves the detailed allocation of risk appetite to different businesses or portfolios. The Chief Risk Officer, supported by the Risk Division, is responsible for the ongoing maintenance of the risk appetite statement.
RECOVERY AND RESOLUTION PLAN (‘RRP’)
The FSA’s draft rules and guidance on RRPs are part of an international initiative to make the financial system safer. The Company was one of the banks involved in the pilot phase of RRP planning. It has had a number of discussions in relation to its draft RRP with both the FSA and the Bank of England but no part has been formally approved. Santander UK plc filed the current version of its RRP with the FSA by the 30 June 2012 deadline which applied to the pilot banks.
The Board is ultimately responsible for reviewing and approving the recovery section of the RRP and for approving the processes for the preparation of resolution information. The Executive Committee is responsible for the review and challenge of the recovery section of the RRP and for recommending it to the Board, and is also responsible for ensuring that the resolution information is complete and accurate.
RETURN ON RISK-ADJUSTED CAPITAL AND VALUE CREATION
Santander UK uses the RORAC methodology in its credit risk management, with the following activities and objectives:
| > | Calculation of economic capital requirement and of the return thereon for the Group's business units and for business segments and portfolios in order to facilitate an optimal allocation of economic capital. |
| > | Budgeting of capital requirement and RORAC of the Group's business units. |
| > | Analysis and setting of prices in the decision-making process for transactions or products, such as loan approval. |
The RORAC methodology facilitates the comparison, on a consistent basis, of the performance of transactions, customers, portfolios and businesses. It also identifies those which achieve a risk-adjusted return higher than the Group’s cost of capital, thus aligning risk management and business management with the aim of maximising value creation.
PRINCIPAL RISKS AND RISK MANAGEMENT
The principal risks affecting the Group are discussed below. Risks are generally managed through tailored management policies within the business division or operating segment in which they are originated. Within Santander UK, these risks are divided into two populations:
| > | Population 1: Risks that are deemed to be material and are mitigated by a combination of internal controls and allocation of capital (both regulatory and economic). |
| > | Population 2: Risks that are deemed to be material but where Santander UK seeks to mitigate its exposure primarily by its internal control arrangements rather than by allocation of capital. |
All risks are classified as population 1 risks except for Funding and Liquidity risk and Reputational risk which are classified as population 2 risks.
PRINCIPAL RISKS
The principal risks are:
| Risk type | Definition | |
Credit Risk (including residual credit and concentration) | Credit risk is the risk of financial loss arising from the default of a customer or counterparty to which the Group has directly provided credit, or for which the Group has assumed a financial obligation, after realising collateral held. Credit risk includes residual credit risk, which arises when credit risk measurement and mitigation techniques prove less effective than expected. In addition, concentration risk, which is part of credit risk, includes large (connected) individual exposures, and significant exposures to groups of counterparties whose likelihood of default is driven by common underlying factors, e.g. sector, economy, geographical location or instrument type. Credit risk in Corporate Banking, Markets and Corporate Centre is managed through the assignment of dedicated credit analysts with responsibility over a portfolio of customers, a thorough understanding of the client’s financial strengths and weaknesses, the utilisation of market standard documentation, the implementation of risk mitigation where available to the Group, (e.g. collateral in the form of cash or securities, assignment of assets, general covenants) and the monitoring of trends in the quality of the portfolio through regular management reports. Credit risk in Retail Banking is managed through the use of a set of Board approved risk appetite limits to cover credit risk arising in Retail Banking. Within these limits, credit mandates and policies are approved with respect to products sold by the Group. The largest area of exposure to credit risk in Retail Banking is in residential lending. Residential lending is subject to lending policy and lending authority levels. Criteria for assessment include credit references, Loan-to-Value (‘LTV’) ratio, borrower status and the mortgage credit score and the implementation of credit risk mitigation by the fact that all mortgages provided are secured on UK or Isle of Man properties and that the quality of the mortgage assets are monitored to ensure that they are within agreed portfolio limits. | |
Market Risk (including trading and non-traded) | Market risk is the risk of a reduction in economic value or reported income resulting from a change in the variables of financial instruments including interest rate, equity, credit spread, property and foreign currency risks. Market risk consists of trading and non-traded market risks. Trading market risk includes risks on exposures held with the intention of benefiting from short term price differences in interest rate variations and other market price shifts. Non-traded market risk includes interest rate risk in investment portfolios. The Group aims to actively manage and control market risk by limiting the adverse impact of market movements whilst seeking to enhance earnings within clearly defined parameters. The Market Risk Manual, which is reviewed and approved annually, sets the framework under which market risks are managed and controlled. Business area policies, risk limits and mandates are established within the context of the Market Risk Manual. | |
Funding and Liquidity Risk | Funding risk is the risk that the Group does not have sufficiently stable and diverse sources of funding, that funding structures are inefficient, or that a funding programme such as debt issuance subsequently fails. For example, a securitisation arrangement may fail to operate as anticipated or the values of the assets transferred to a funding vehicle do not emerge as expected creating additional risks for the Group and its depositors. Risks arising from the encumbrance of assets are included within this definition. Liquidity risk is the risk that the Group, although solvent, either does not have available sufficient financial resources to enable it to meet its obligations as they fall due, or can secure them only at excessive cost. In order to mitigate funding risk the Group utilises stable sources of funding such as longer term retail or corporate deposits to fund its commercial balance sheet – consisting primarily of retail mortgages and corporate lending. In addition a range of wholesale funding sources are used to supplement customer deposits and provide diversity of tenor, size and market. Liquidity risk is mitigated primarily through maintenance of a buffer of highly liquid securities and cash that may be realised at short notice and with minimal cost as well as through the diversification of funding sources and the maintenance of a funding profile that limits the level of maturities within a defined period. Other marketable but less liquid securities are also held from which cash may be realised over longer time periods. A series of management actions are identified that can be taken in times of stress in order to further mitigate and manage liquidity risk. |
Operational Risk | Operational risk is the risk of loss to the Group resulting from inadequate or failed internal processes, people and systems, or from external events. This includes financial crime risk, cyber security risk, human resources risk, customer and conduct risk, and regulatory, legal and compliance risk. Business areas use risk control assessments and risk indicators to monitor the likelihood of risks and give early warning signs of potential risk events. Control frameworks are reworked where preset risk thresholds are breached. Operational Risk events which do materialise are investigated to ensure the most appropriate actions are taken. All loss events are recorded and events above certain thresholds are mitigated. Rapid escalation to the most senior staff is mandatory for major incidents. Summaries of operational loss events are routinely reported to business committees, risk committees with commentary on all the key mitigating actions being undertaken. | |
| Other Risks | Other risks consist of pension obligation risk, business/strategic risk, reputational risk and residual value risk. | |
Pension obligation risk is the risk of an unplanned increase in funding required by the Group’s pension schemes, either because of a loss of net asset value or because of changes in legislation or regulatory action. Santander UK monitors the risks around the potential for underfunding of the pension fund and this analysis is regularly reported to management, for example via the Executive Risk Committee and Strategic Pensions Committee. The Trustees of the defined benefit pension schemes undertake a funding valuation every three years and, where it is determined that the schemes are underfunded a schedule of deficit funding contributions is agreed with Santander UK in order to repair the funding deficit over an appropriate time horizon. | ||
Business/strategic risk is the current or prospective risk to earnings and capital arising from changes in the business environment and from adverse business decisions, improper implementation of decisions or lack of responsiveness to changes in the business environment. This includes pro-cyclicality and capital planning risk. The internal component is the risk related to implementing the strategy. The external component is the risk of the business environment change on the Group’s strategy. Economically driven risks are assessed through management’s stress testing programme of the Group and mitigation measures are implemented based on the resulting information. Other business/strategic risks are managed through the operational risk programme and the Executive Risk Committee. | ||
Reputational risk is the risk of financial loss or reputational damage arising from treating customers unfairly, a failure to manage risk, a breakdown in internal controls, or poor communication with stakeholders. This includes the risk of decline in the value of the Group’s franchise potentially arising from reduced market share, complexity, tenor and performance of products and distribution mechanisms. The reputational risk arising from operational risk events is managed within the operational risk framework. The principal areas of reputational risk are managed through attention to customer and client interests, and through ensuring adherence to laws and regulations. | ||
Residual value risk is the risk that the value of an asset at the end of a contract may be worth less than that required to achieve the minimum return from the transaction that had been assumed at its inception. Residual value risk is controlled through asset specific policies and delegated authorities agreed by the Executive Risk Committee. |
CREDIT RISK
Definition
Credit risk is the risk of financial loss arising from the default of a customer or counterparty to which the Group has directly provided credit, or for which the Group has assumed a financial obligation, after realising collateral held. Credit risk includes residual credit risk, which arises when credit risk measurement and mitigation techniques prove less effective than expected. In addition, concentration risk which is part of credit risk, includes large (connected) individual exposures, and significant exposures to groups of counterparties whose likelihood of default is driven by common underlying factors, e.g. sector, economy, geographical location or instrument type.
Treatment of credit risk
The specialisation of Santander UK’s Risk Division is based on the type of customer and, accordingly, a distinction is made between non-standardised customers and standardised customers in the risk management process:
| > | Non-standardised customers are defined as those to which a risk analyst has been assigned. This category includes medium and large corporate customers and financial institutions. Risk management is performed through expert analysis supplemented by decision-making support tools based on internal risk assessment models. |
| > | Standardised customers are those which have not been expressly assigned a risk analyst. This category generally includes individuals and small businesses not classified as non-standardised customers. Management of these risks is based on internal risk assessment and automatic decision-making models, and supported by teams of analysts specialising in this type of risk. |
TOTAL CREDIT RISK EXPOSURES
The Group’s exposures to credit risk arise in the following businesses:
| > | Retail exposures consist of residential mortgages, banking, and other personal financial services products and are managed by Retail Banking. | |
| > | Corporate exposures consist of loans, bank accounts, treasury services, asset finance, cash transmission, trade finance and invoice discounting to large corporates, small and medium-sized (‘SME’) UK companies and specialist businesses. Corporate exposures are managed by Corporate Banking. | |
| > | Sovereign exposures consist of deposits with central banks, loans and debt securities issued or guaranteed by central and local governments. Sovereign exposures are managed and monitored by the Strategic Risk and Financial Management Committee (‘SRFM’) in Corporate Centre and by the Short Term Markets desk in Corporate Banking. | |
| > | Other exposures arise in a variety of ways: | |
| > | As part of the Group’s treasury trading activities, which are managed by Corporate Banking and Markets; | |
| > | For yield and liquidity purposes, including Asset and Liability Management in Corporate Centre; and | |
| > | In the Treasury Asset Portfolio which is being run down. This is managed by Corporate Centre. | |
Maximum exposure to credit risk
The following table presents the Group’s estimated maximum exposure to credit risk at 30 June 2012 and 31 December 2011 without taking account of any collateral held or other credit enhancements:
30 June 2012 £m | 31 December 2011 £m | |||||||
| Balances with central banks | 29,297 | 24,956 | ||||||
| Trading assets | 9,626 | 12,497 | ||||||
| Securities purchased under resale agreements | 23,639 | 11,464 | ||||||
| Derivative financial instruments | 30,549 | 30,780 | ||||||
| Financial assets designated at fair value | 4,221 | 5,005 | ||||||
| Available-for-sale securities | 4,851 | 46 | ||||||
| Loan and receivable securities | 1,399 | 1,771 | ||||||
| Loans and advances to customers | 198,323 | 201,069 | ||||||
| Loans and advances to banks | 2,065 | 2,417 | ||||||
| Other | 1,332 | 1,281 | ||||||
Total exposure(1) | 305,302 | 291,286 | ||||||
| (1) | In addition, the Group is exposed to credit risk in respect of guarantees granted, loan commitments and stock borrowing and lending agreements. The estimated maximum exposure to credit risk is described in Note 27 of the Condensed Consolidated Interim Financial Statements. |
MEASURES AND MEASUREMENT TOOLS
Rating tools
The Group uses proprietary internal rating models to measure the credit quality of a given customer or transaction. Each rating relates to a certain probability of default or non-payment, determined on the basis of the Company’s historical experience, with the exception of certain portfolios classified as “low default portfolios”, where the probability is assigned using external sources, as described below.
Banco Santander, S.A. global rating tools are applied to the sovereign, financial institution and large corporates segments. Management of the rating tools for these segments is centralised at Banco Santander, S.A. group level, with rating calculation and risk monitoring devolved to the Group under Banco Santander, S.A. group supervision. These tools assign a rating to each customer, which is obtained from a quantitative or automatic module, based on balance sheet ratios or macroeconomic variables, supplemented by the analyst’s expert judgement. The ratings are reviewed at least annually or more frequently in the case of watchlist counterparties.
For non-standardised corporates and financial institutions, Banco Santander, S.A. has defined a single methodology for the construction of a rating in each country, based on an automatic module which includes an initial participation of the analyst that can be supplemented subsequently if required. The automatic module determines the rating in two phases, a quantitative phase and a qualitative phase. The latter is based on a corrective questionnaire which enables the analyst to modify the automatic score up or down in a controlled manner. The quantitative rating is determined by analysing the credit performance of a sample of customers and the correlation with their financial statements. Ratings assigned to customers are reviewed at least annually to include any new financial information available and the Group’s experience in its banking relationship with the customer. The frequency of the reviews is increased when customers reach certain levels in the automatic warning systems or are classified as requiring special monitoring. The rating tools are also reviewed in order to progressively fine-tune the ratings they provide.
For standardised customers, both legal entities and individuals, the Group has scoring tools that automatically assign a score to the proposed transactions. The ratings are reviewed and updated periodically, depending on performance.
Credit risk parameters
The assessment of customers or transactions using rating or scoring systems constitutes a judgement of their credit quality, which is quantified through the probability of default (‘PD’), in accordance with Basel II terminology. In addition to PD, the quantification of credit risk requires the estimation of other parameters, such as exposure at default (‘EAD’) and the percentage of EAD that will not be recovered (loss given default or ‘LGD’). In estimating the risk involved in transactions, other factors such as any off-balance sheet exposure and collateral valuations are also taken into account.
The combination of these risk parameters (i.e. PD, LGD and EAD) enables calculation of the probable loss or expected loss (‘EL’). The risk parameters also make it possible to calculate the Basel II regulatory capital.
For portfolios with limited internal default experience (e.g. banks) parameter estimates are based on alternative sources, such as market prices or studies conducted by external agencies gathering the shared experience of a sufficient number of entities. These portfolios are known as “low default portfolios”.
For other portfolios, parameter estimates are based on internal risk models. The PD is calculated by observing the cases of new defaults in relation to the final rating assigned to customers or to the scoring assigned to the related transactions. The LGD is calculated by observing the recoveries of defaulted loans, taking into account not only the income and expenses associated with the recovery process, but also the timing thereof and the indirect costs arising from the recovery process. EAD is calculated by comparing the use of committed facilities at the time of default and their use under normal (i.e. performing) circumstances, so as to estimate the eventual extent of use of the facilities in the event of default.
The parameters estimated for global portfolios (e.g. banks) are the same throughout the Banco Santander, S.A. group. Therefore, a financial institution will have the same PD for a specific rating, regardless of the Banco Santander, S.A. group entity in which the exposure is booked. By contrast, local portfolios (e.g. residential mortgages) have specific score and rating systems. PDs are assessed specifically for each local portfolio.
Master scale of global ratings
The following tables are used to calculate regulatory capital. They assign a PD on the basis of the internal rating, with a minimum value of 0.03%. These PDs are applied uniformly throughout the Santander group in accordance with the global management of these portfolios. As can be seen, the PD assigned to the internal rating is not exactly equal for the same rating in each portfolio, although it is very similar in the tranches where most of the exposure is concentrated (i.e. in tranches with a rating of more than six).
Probability of default
| Large Corporate | Banks | |||
| Internal Rating | Probability of default % | Internal Rating | Probability of default % | |
| 8.5 to 9.3 | 0.030 | 8.5 to 9.3 | 0.030 | |
| 8.0 to 8.5 | 0.033 | 8.0 to 8.5 | 0.039 | |
| 7.5 to 8.0 | 0.056 | 7.5 to 8.0 | 0.066 | |
| 7.0 to 7.5 | 0.095 | 7.0 to 7.5 | 0.111 | |
| 6.5 to 7.0 | 0.161 | 6.5 to 7.0 | 0.186 | |
| 6.0 to 6.5 | 0.271 | 6.0 to 6.5 | 0.311 | |
| 5.5 to 6.0 | 0.458 | 5.5 to 6.0 | 0.521 | |
| 5.0 to 5.5 | 1.104 | 5.0 to 5.5 | 0.874 | |
| 4.5 to 5.0 | 2.126 | 4.5 to 5.0 | 1.465 | |
| 4.0 to 4.5 | 3.407 | 4.0 to 4.5 | 2.456 | |
| 3.5 to 4.0 | 5.462 | 3.5 to 4.0 | 4.117 | |
| 3.0 to 3.5 | 8.757 | 3.0 to 3.5 | 6.901 | |
| 2.5 to 3.0 | 14.038 | 2.5 to 3.0 | 11.569 | |
| 2.0 to 2.5 | 22.504 | 2.0 to 2.5 | 19.393 | |
| 1.5 to 2.0 | 36.077 | 1.5 to 2.0 | 32.509 | |
| < 1.5 | 57.834 | < 1.5 | 54.496 | |
Credit risk cycle
The risk management process consists of identifying, measuring, analysing, controlling, negotiating and deciding on, as appropriate, the risks incurred in the Group’s operations. The parties involved in this process are the risk-taking areas, senior management and the risk units.
The process begins at senior management level, through the Board of Directors, the Executive Committee and the Executive Risk Committee, which establishes the risk policies and procedures, and the limits and delegations of authorities, and approves and supervises the scope of action of the risk function.
The risk cycle comprises three different phases:
| > | Pre-sale: this phase includes the risk planning and target setting processes, determination of the Group’s risk appetite, approval of new products, risk analysis and credit rating process, and limit setting per counterparty. Limits can be established either through the framework of pre-approved or pre-classified limits or by the granting of a specific approval. |
| > | Sale: this is the decision-making phase for both transactions under pre-classified limits and those which have received specific approval. |
| > | Post-sale: this phase comprises the risk monitoring, measurement and control processes and the recovery process. |
Risk limit planning and setting
Risk limit planning and setting is the first of the pre-sale risk management procedures and is a dynamic process that identifies the Group’s risk appetite through the discussion of business proposals and the attitude to risk. This process is defined in the global risk limit plan, a comprehensive document for the integrated management of the balance sheet and its inherent risks, which establishes risk appetite on the basis of the various factors involved. The risk limits are founded on two basic structures: customers/segments and products.
For non-standardised risks, a top-level risk limit is approved if the quantum of risk required to support the customer is material when compared to its overall financing needs. This limit covers a variety of products (such as lending, trade finance or derivatives) enabling the Group to define a total risk appetite with that customer based on its current and expected financial needs. For global corporate groups, a pre-classification model based on an economic capital measurement and monitoring system is used. For the large corporate customers, a simplified pre-classification model is applied for customers meeting certain requirements.
For standardised risks, the risk limits are planned and set using the credit management programme, a document agreed upon by the business areas and the Risk Division and approved by the Executive Risk Committee, which contains the expected results of transactions in terms of risk and return, as well as the limits applicable to the activity and the related risk management.
Risk analysis and credit rating process
Risk analysis is another key pre-sale procedure and is a pre-requisite for the approval of credit to customers by the Group. This analysis consists of examining the customer's ability to meet its contractual obligations to the Group, which involves analysing the customer’s credit quality, its risk transactions, its solvency and the return to be obtained in view of the risk assumed.
The risk analysis is conducted when a new customer or transaction arises or with a pre-established frequency, depending on the segment involved. Additionally, the credit rating is examined and reviewed whenever a warning is triggered or an event affecting the credit risk of the customer or transaction occurs.
Transaction decision-making
The purpose of the transaction decision-making process is to analyse transactions and then make a decision about whether or not to approve the transaction, taking into account the risk appetite and any transaction elements that are important in achieving a balance between risk and return. The Group uses, among others, the RORAC methodology for risk analysis and pricing in the decision-making process on transactions and deals.
Risk monitoring and control
In order to ensure adequate credit quality control in addition to the tasks performed by the Internal Audit function, the Risk Division has a specific risk monitoring function that covers all non-standardised portfolios and to which specific resources and persons in charge have been assigned.
This monitoring function is based on an ongoing process of observation to enable early detection of any incidents that might arise in the evolution of the risk, the transactions, the customers and their environment, with a view to adopting mitigating actions. The risk monitoring function is specialised by customer segment.
For this purpose a system called “companies under special watch” (FEVE, using the Spanish acronym) has been designed that distinguishes four categories, three of which are considered as ‘proactive‘ (extinguish, secure and reduce) and one of which is considered ‘enhanced monitoring’ (monitor). The inclusion of a customer in the FEVE system does not mean that there has been a default, but rather that it is deemed advisable to adopt a specific policy for this customer, to place a person in charge of the execution of this strategy and to set the implementation period. Customers classified as FEVE are reviewed monthly and the assigned rating is reviewed at least every six months, or every three months for those classified in the proactive categories. A customer can be classified as FEVE as a result of the monitoring process itself, a review performed by the Internal Audit function, a decision made by the sales manager responsible for that customer or the triggering of the automatic warning system.
For exposures to standardised customers, the key indicators are monitored in order to detect any variance in the performance of the loan portfolio compared to the forecasts contained in the credit management programmes.
Analysis of the mortgage portfolio
With regard to standardised exposures, the mortgage loan portfolio is particularly noteworthy because of its significance with respect to the Group's total loans and receivables. Disclosures relating to the mortgage portfolio are set out in the section entitled Credit Risk - Retail Banking.
Risk control function
Supplementing the management process, the risk control function obtains a global view of the Group’s loan portfolio, through the various phases of the risk cycle, with a sufficient level of detail to permit the assessment of the current risk position and any changes therein. Changes in the Group’s risk position are controlled on an ongoing and systematic basis against budgets, limits and benchmarks, and the impacts of these changes in future situations, both of an external nature and those arising from strategic decisions, are assessed in order to establish measures that place the profile and amount of the loan portfolio within the parameters set by the Group.
The risk control function assesses risks from various complementary perspectives, including geographical location, business area, management model and product and process, thus facilitating the detection of specific areas requiring management actions to control the risk profile of the group.
Within the corporate framework established in the wider Banco Santander, S.A. group for compliance with the US Sarbanes-Oxley Act of 2002, a corporate tool is used for the documentation and certification of all the sub-processes, operational risks and related mitigating controls. The Risk Division assesses annually the efficiency of the internal control of its activities.
Scenario analysis
As part of the ongoing risk management and oversight process, the Group performs simulations of the portfolio performance in different adverse and stress scenarios (‘stress testing’) which enable it to assess the Group's capital adequacy in certain future situations. These simulations cover the Group's main portfolios and are conducted systematically using a corporate methodology which:
| > | Determines the sensitivity of risk factors (PD, LGD) to macroeconomic variables. |
| > | Characterises benchmark scenarios. |
| > | Identifies "break-off scenarios" (the levels above which the sensitivity of the risk factors to macroeconomic variables is more accentuated) and the distance of these break-off scenarios from the current situation and the benchmark scenarios. |
| > | Estimates the expected loss associated with each scenario and the changes in the risk profile of each portfolio arising from variations in macroeconomic variables. |
The simulation models used by the Group use data of a full business cycle to calibrate the performance of risk factors, given certain movements in macroeconomic variables. In the corporate banking area, since low-default portfolios are involved, there is insufficient historical default data available to perform the calibration and, therefore, expert judgement is used.
The main macroeconomic variables contained in the Group’s scenarios are as follows:
| > | Unemployment rate; |
| > | Property prices; |
| > | Gross domestic product (‘GDP’); |
| > | Interest rates; and |
| > | Inflation rate. |
The scenario analysis enables management to better understand the expected performance of the portfolio given certain changing market conditions and situations. The analyses performed, both in benchmark and in stressed scenarios, with a time horizon of five years, show the strength of the balance sheet against the macroeconomic situations simulated.
Recovery management
Recovery management is defined as a strategic, integrated business activity. Banco Santander, S.A. has a global model which is applied and implemented locally by the Group, considering the specific features of the business in each area of activity.
The objectives of the recovery process are as follows:
| > | To collect payments in arrears so that accounts return to performing status. If this is not possible within a reasonable time period, the aim is to fully or partially recover debts, regardless of their status for accounting or management purposes. |
| > | To maintain and strengthen the relationship with customers, paying attention to customer payment behaviour. Specifically to ensure that the individual circumstances and reason for arrears are carefully considered when agreeing solutions with customers to ensure that arrangements are affordable and support repayment of arrears in a timely and sustainable manner. |
CREDIT RISK: CONCENTRATION AND MITIGATION
Certain areas and/or specific views of credit risk deserve specialist attention, complementary to global risk management.
Significant concentrations of credit risk
The management of risk concentration is a key part of risk management. The Group tracks the degree of concentration of its credit risk portfolios using various criteria, including geographic areas and countries, economic sectors, products and groups of customers.
During 2012, the Group’s most significant exposures to credit risk derived from:
| > | the residential mortgage portfolio and unsecured personal lending portfolio in Retail Banking; |
| > | secured lending and derivatives exposures to companies in Corporate Banking; |
| > | derivatives exposure to financial institutions in Markets; and |
| > | the Treasury Asset Portfolio in run down, as well as other portfolios of assets inconsistent with the Group’s future strategy such as social housing associations, shipping and aviation within Corporate Centre. |
In Retail Banking, the business consists of a relatively large number of homogenous loans where a problem with one customer will have a relatively small impact. In Corporate Banking, the business consists of a relatively small number of high value balances where a problem with one customer may cause a relatively large impact.
The residential mortgage portfolio comprises loans to private individuals secured against residential properties in the UK. This is a prime portfolio with total exposure of £163.2bn at 30 June 2012 (31 December 2011: £166.2bn). The Unsecured Personal Loan portfolio comprises unsecured loans to private individuals in the UK. Total exposure stood at £2.6bn at 30 June 2012 (31 December 2011: £2.9bn).
In Corporate Banking the Mid-corporate and SME portfolios are largely unsecured, and the real estate portfolio comprise loans and associated derivatives secured on UK property. The total committed facilities exposure to these portfolios was £34.5bn at 30 June 2012 (31 December 2011: £37.2bn).
The derivatives exposures in Markets are mitigated by collateralisation as described in the section on Markets – Derivatives.
The holdings in the Treasury Asset Portfolio benefit from senior positions in the creditor cascade or are covered by derivatives with well rated market counterparties with additional protection given by daily collateralisation under market standard documentation.
Although the operations of Corporate Banking, Markets and Corporate Centre are based mainly in the UK, they have built up exposures to various entities around the world and are therefore exposed to concentrations of risk related to geographic area. These exposures are classified by the country of domicile of the counterparty and are further analysed below:
| 30 June 2012 | 31 December 2011 | |||||||||||||||||||||||||||||||
| Corporate Banking | Markets | Corporate Centre | Corporate Banking | Markets | Corporate Centre | |||||||||||||||||||||||||||
Non derivatives | Derivatives(1) | Non derivatives | Derivatives(1) | |||||||||||||||||||||||||||||
| Country | % | % | % | % | % | % | % | % | ||||||||||||||||||||||||
| UK | 87 | 66 | 26 | 84 | 85 | 68 | 23 | 73 | ||||||||||||||||||||||||
| Rest of Europe | 5 | 8 | 42 | 8 | 9 | 18 | 41 | 7 | ||||||||||||||||||||||||
| US | 2 | — | 23 | 7 | 2 | 14 | 28 | 18 | ||||||||||||||||||||||||
| Other, including non-OECD | 6 | 26 | 9 | 1 | 4 | — | 8 | 2 | ||||||||||||||||||||||||
| 100 | 100 | 100 | 100 | 100 | 100 | 100 | 100 | |||||||||||||||||||||||||
| (1) | Derivative counterparty exposures are managed and reported on a group basis |
Geographical exposures are governed by country limits set by Banco Santander, S.A. centrally and determined according to the classification of the country (whether it is a developed Organisation for Economic Co-operation and Development (‘OECD’) country or not), the rating of the country, its gross domestic product and the type of business activities and products the Banco Santander, S.A. group wishes to engage in within that country. The Group is constrained in its country risk exposure, within the Banco Santander, S.A. group limits, and by its capital base.
Credit risk mitigation
In managing its gross exposures, the Group uses the policies and processes described in the Credit Risk sections below. Collateral, when received, can be held in the form of security over mortgaged property, debentures over a company’s assets and through market-standard collateral agreements (cash or highly liquid securities).
LOANS AND ADVANCES
The following tables categorise the Group’s loans and advances into three categories as: neither past due nor impaired, past due but not individually impaired, or individually impaired. For certain homogeneous portfolios of loans and advances, impairment is assessed on a collective basis and each loan is not individually assessed for impairment. Loans in this category are classified as neither past due nor impaired, or past due but not individually impaired, depending upon their arrears status. The impairment loss allowances include allowances against financial assets that have been individually assessed for impairment and those that are subject to collective assessment for impairment.
| 30 June 2012 | Neither past due nor impaired | Past due but not individually impaired | Individually impaired | Total | Impairment loss allowances | Total carrying value | ||||||||||||||||||
| Statutory balance sheet line items | £m | £m | £m | £m | £m | £m | ||||||||||||||||||
| Trading assets | ||||||||||||||||||||||||
| - Loans and advances to banks | 8,027 | — | — | 8,027 | — | 8,027 | ||||||||||||||||||
| - Loans and advances to customers | 18,380 | — | — | 18,380 | — | 18,380 | ||||||||||||||||||
| Financial assets designated at fair value through profit and loss | ||||||||||||||||||||||||
| - Loans and advances to customers | 3,618 | — | — | 3,618 | — | 3,618 | ||||||||||||||||||
| Loans and advances to banks | ||||||||||||||||||||||||
| - Placements with other banks | 2,058 | — | — | 2,058 | — | 2,058 | ||||||||||||||||||
| - Amounts due from parent | 438 | — | — | 438 | — | 438 | ||||||||||||||||||
| Loans and advances to customers | ||||||||||||||||||||||||
| - Advances secured on residential property | 158,820 | 4,401 | 904 | 164,125 | (502 | ) | 163,623 | |||||||||||||||||
| - Corporate loans | 21,144 | 315 | 1,007 | 22,466 | (480 | ) | 21,986 | |||||||||||||||||
| - Finance leases | 3,019 | — | 10 | 3,029 | (42 | ) | 2,987 | |||||||||||||||||
| - Other secured advances | 3,054 | 154 | 203 | 3,411 | (128 | ) | 3,283 | |||||||||||||||||
| - Other unsecured advances | 6,513 | 162 | 203 | 6,878 | (448 | ) | 6,430 | |||||||||||||||||
| - Amounts due from fellow subsidiaries | 14 | — | — | 14 | — | 14 | ||||||||||||||||||
| Loans and receivables securities | 1,384 | — | 21 | 1,405 | (6 | ) | 1,399 | |||||||||||||||||
| Total loans and advances | 226,469 | 5,032 | 2,348 | 233,849 | (1,606 | ) | 232,243 | |||||||||||||||||
| 31 December 2011 | Neither past due nor impaired | Past due but not individually impaired | Individually impaired | Total | Impairment loss allowances | Total carrying value | ||||||||||||||||||
| Statutory balance sheet line items | £m | £m | £m | £m | £m | £m | ||||||||||||||||||
| Trading assets | ||||||||||||||||||||||||
| - Loans and advances to banks | 6,144 | — | — | 6,144 | — | 6,144 | ||||||||||||||||||
| - Loans and advances to customers | 6,687 | — | — | 6,687 | — | 6,687 | ||||||||||||||||||
| Financial assets designated at fair value through profit and loss | ||||||||||||||||||||||||
| - Loans and advances to customers | 4,376 | — | — | 4,376 | — | 4,376 | ||||||||||||||||||
| Loans and advances to banks | ||||||||||||||||||||||||
| - Placements with other banks | 2,405 | — | — | 2,405 | — | 2,405 | ||||||||||||||||||
| - Amounts due from parent | 2,082 | — | — | 2,082 | — | 2,082 | ||||||||||||||||||
| Loans and advances to customers | ||||||||||||||||||||||||
| - Advances secured on residential property | 161,767 | 4,143 | 937 | 166,847 | (478 | ) | 166,369 | |||||||||||||||||
| - Corporate loans | 20,746 | 306 | 850 | 21,902 | (432 | ) | 21,470 | |||||||||||||||||
| - Finance leases | 2,937 | — | 7 | 2,944 | (37 | ) | 2,907 | |||||||||||||||||
| - Other secured advances | 3,411 | 144 | 155 | 3,710 | (107 | ) | 3,603 | |||||||||||||||||
| - Other unsecured advances | 6,745 | 186 | 266 | 7,197 | (509 | ) | 6,688 | |||||||||||||||||
| - Amounts due from fellow subsidiaries | 32 | — | — | 32 | — | 32 | ||||||||||||||||||
| Loans and receivables securities | 1,756 | — | 21 | 1,777 | (6 | ) | 1,771 | |||||||||||||||||
| Total loans and advances | 219,088 | 4,779 | 2,236 | 226,103 | (1,569 | ) | 224,534 | |||||||||||||||||
Credit quality of loans and advances that are neither past due nor individually impaired
The credit quality of loans and advances that are neither past due nor individually impaired is as follows:
30 June 2012 | Good | Satisfactory | Higher Risk | Total | ||||||||||||
| £m | £m | £m | £m | |||||||||||||
| Trading assets | ||||||||||||||||
| - Loans and advances to banks | 7,489 | 523 | 15 | 8,027 | ||||||||||||
| - Loans and advances to customers | 18,380 | — | — | 18,380 | ||||||||||||
| Financial assets designated at fair value through profit and loss | ||||||||||||||||
| - Loans and advances to customers | 3,618 | — | — | 3,618 | ||||||||||||
| Loans and advances to banks | ||||||||||||||||
| - Placements with other banks | 2,054 | 4 | — | 2,058 | ||||||||||||
| - Amounts due from parent | 438 | — | — | 438 | ||||||||||||
| Loans and advances to customers | ||||||||||||||||
| - Advances secured on residential property | 146,385 | 12,080 | 355 | 158,820 | ||||||||||||
| - Corporate loans | 12,560 | 8,278 | 306 | 21,144 | ||||||||||||
| - Finance leases | 2,657 | 358 | 4 | 3,019 | ||||||||||||
| - Other secured advances | 1,490 | 1,506 | 58 | 3,054 | ||||||||||||
| - Other unsecured advances | 857 | 5,511 | 145 | 6,513 | ||||||||||||
| - Amounts due from fellow subsidiaries | 14 | — | — | 14 | ||||||||||||
| Loans and receivables securities | 1,114 | 100 | 170 | 1,384 | ||||||||||||
| Total loans and advances | 197,056 | 28,360 | 1,053 | 226,469 | ||||||||||||
| 31 December 2011 | ||||||||||||||||
| Good | Satisfactory | Higher Risk | Total | |||||||||||||
| £m | £m | £m | £m | |||||||||||||
| Trading assets | ||||||||||||||||
| - Loans and advances to banks | 5,647 | 486 | 11 | 6,144 | ||||||||||||
| - Loans and advances to customers | 6,678 | 9 | — | 6,687 | ||||||||||||
| Financial assets designated at fair value through profit and loss | ||||||||||||||||
| - Loans and advances to customers | 4,376 | — | — | 4,376 | ||||||||||||
| Loans and advances to banks | ||||||||||||||||
| - Placements with other banks | 2,405 | — | — | 2,405 | ||||||||||||
| - Amounts due from parent | 2,082 | — | — | 2,082 | ||||||||||||
| Loans and advances to customers | ||||||||||||||||
| - Advances secured on residential property | 148,799 | 12,537 | 431 | 161,767 | ||||||||||||
| - Corporate loans | 12,831 | 7,701 | 214 | 20,746 | ||||||||||||
| - Finance leases | 2,582 | 351 | 4 | 2,937 | ||||||||||||
| - Other secured advances | 1,662 | 1,671 | 78 | 3,411 | ||||||||||||
| - Other unsecured advances | 972 | 5,580 | 193 | 6,745 | ||||||||||||
| - Amounts due from fellow subsidiaries | 32 | — | — | 32 | ||||||||||||
| Loans and receivables securities | 1,208 | 153 | 395 | 1,756 | ||||||||||||
| Total loans and advances | 189,274 | 28,488 | 1,326 | 219,088 | ||||||||||||
Internal measures of credit quality have been used in the table analysing credit quality, above. Different measures are applied to retail and corporate lending, as follows:
| Retail Lending | Corporate Lending | |||||||||||
| Expected loss | Probability of default | Probability of default | ||||||||||
| Financial statements description | Unsecured(1) | Secured(2) | ||||||||||
| Good | 0.0 - 0.5 | % | 0.0 - 0.5 | %(3) | 0.0 - 0.5 | % | ||||||
| Satisfactory | 0.5 - 12.5 | % | 0.5 – 12.5 | % | 0.5 - 12.5 | % | ||||||
| Higher Risk | 12.5 | %+ | 12.5 | %+ | 12.5 | %+ | ||||||
| (1) | Unsecured consists of other unsecured advances to individuals. |
| (2) | Secured consists of advances to individuals secured on residential property. |
| (3) | Or a loan-to-value (‘LTV’) ratio of less than 75%. |
Summarised descriptions of credit quality used in the financial statements relating to retail and corporate lending are as follows:
| Good | There is a very high likelihood that the asset will not default and will be recovered in full. The exposure has a negligible or low probability of default. Such exposure also exhibits a strong capacity to meet financial commitments and only exceptionally shows any period of delinquency. |
| Satisfactory | There is a high likelihood that the asset will be recovered and is therefore of no cause for concern to the Group. The asset has low to moderate probability of default, strong recovery rates and may typically show only short periods of delinquency. Moderate to high application scores, credit bureau scores or behavioural scores characterise this credit quality. |
| Higher Risk | All rated accounts that are not viewed as Good or Satisfactory are rated as higher risk. The assets are characterised by some concern over the obligor’s ability to make payments when due. There may also be doubts over the value of collateral or security provided. However, the borrower or counterparty is continuing to make payments when due i.e. the assets have not yet converted to actual delinquency and is expected to settle all outstanding amounts of principal and interest. |
Maturity analysis of loans and advances that are past due but not individually impaired
A maturity analysis of loans and advances that are past due but not individually impaired is set out below.
In the retail loan portfolio, a loan or advance is considered past due when any contractual payments have been missed and for secured loans, when they are more than 30 days in arrears. The amounts disclosed in the table are the total financial asset of the account, not just the past due payments. All retail accounts are classified as non-impaired as impairment loss allowances are raised collectively with the exception of properties in possession, where an impairment loss allowance is raised on a case by case basis and hence are not included in the table below.
In the corporate loan portfolio, a loan or advance is considered past due when it is 90 days or more in arrears, and also when the Group has reason to believe that full repayment of the loan is in doubt.
| 30 June 2012 | Past due up to 1 month | Past due 1-2 months | Past due 2-3 months | Past due 3-6 months | Past due 6 months and over | Total | ||||||||||||||||||
| £m | £m | £m | £m | £m | £m | |||||||||||||||||||
| Loans and advances to customers | ||||||||||||||||||||||||
| - Advances secured on residential property | — | 1,474 | 937 | 1,181 | 809 | 4,401 | ||||||||||||||||||
| - Corporate loans | — | — | — | 315 | — | 315 | ||||||||||||||||||
| - Other secured advances | — | 33 | 46 | 68 | 7 | 154 | ||||||||||||||||||
| - Other unsecured advances | 44 | 79 | 15 | 14 | 10 | 162 | ||||||||||||||||||
| Total loans and advances | 44 | 1,586 | 998 | 1,578 | 826 | 5,032 | ||||||||||||||||||
| 31 December 2011 | Past due up to 1 month | Past due 1-2 months | Past due 2-3 months | Past due 3-6 months | Past due 6 months and over | Total | ||||||||||||||||||
| £m | £m | £m | £m | £m | £m | |||||||||||||||||||
| Loans and advances to customers | ||||||||||||||||||||||||
| - Advances secured on residential property | — | 1,451 | 899 | 1,121 | 672 | 4,143 | ||||||||||||||||||
| - Corporate loans | — | — | — | 306 | — | 306 | ||||||||||||||||||
| - Other secured advances | — | 24 | 25 | 71 | 24 | 144 | ||||||||||||||||||
| - Other unsecured advances | 47 | 81 | 23 | 24 | 11 | 186 | ||||||||||||||||||
| Total loans and advances | 47 | 1,556 | 947 | 1,522 | 707 | 4,779 | ||||||||||||||||||
Renegotiated loans and advances to customers
The following tables provides a breakdown of the population of loans and advances to customers which have been subject to renegotiation or forbearance programmes and are included in the previous tables. For further detail regarding these programmes refer to pages 80 and 92.
| 30 June 2012 | Neither past due nor impaired | Past due but not individually impaired | Individually impaired | Total | Impairment loss allowances | Total carrying value | ||||||||||||||||||
| £m | £m | £m | £m | £m | £m | |||||||||||||||||||
| Loans and advances to customers | ||||||||||||||||||||||||
| - Advances secured on residential property | 1,071 | 1,864 | 305 | 3,240 | (82 | ) | 3,158 | |||||||||||||||||
| - Corporate loans | 516 | 292 | 418 | 1,226 | (136 | ) | 1,090 | |||||||||||||||||
| - Finance leases | 10 | — | — | 10 | — | 10 | ||||||||||||||||||
| - Other secured advances | 140 | 51 | 49 | 240 | (23 | ) | 217 | |||||||||||||||||
| - Other unsecured advances | 23 | 25 | 48 | 96 | (42 | ) | 54 | |||||||||||||||||
| Total renegotiated loans and advances to customers | 1,760 | 2,232 | 820 | 4,812 | (283 | ) | 4,529 | |||||||||||||||||
| 31 December 2011 | Neither past due nor impaired | Past due but not individually impaired | Individually impaired | Total | Impairment loss allowances | Total carrying value | ||||||||||||||||||
| £m | £m | £m | £m | £m | £m | |||||||||||||||||||
| Loans and advances to customers | ||||||||||||||||||||||||
| - Advances secured on residential property | 718 | 1,617 | 261 | 2,596 | (71 | ) | 2,525 | |||||||||||||||||
| - Corporate loans | 532 | 278 | 359 | 1,169 | (123 | ) | 1,046 | |||||||||||||||||
| - Finance leases | 1 | 10 | — | 11 | — | 11 | ||||||||||||||||||
| - Other secured advances | 140 | 47 | 43 | 230 | (20 | ) | 210 | |||||||||||||||||
| - Other unsecured advances | 25 | 31 | 57 | 113 | (48 | ) | 65 | |||||||||||||||||
| Total renegotiated loans and advances to customers | 1,416 | 1,983 | 720 | 4,119 | (262 | ) | 3,857 | |||||||||||||||||
Impairment loss allowances on loans and advances to customers
The Group’s impairment loss allowances policy is set out in Note 1 of the Group’s 2011 Annual Report.
Period/Year-end impairment loss allowances on loans and advances to customers
An analysis of the Group’s impairment loss allowances on loans and advances to customers is presented below. The geographical analysis presented in the tables below is based on the location of the office from which the loans and advances to customers are made, rather than the domicile of the borrower. Further geographical analysis, showing the country of domicile of the borrower rather than the office of lending is contained within the “Country Risk Exposure” tables on pages 28 to 29.
30 June 2012 £m | 31 December 2011 £m | |||||||
| Observed impairment loss allowances | ||||||||
| Advances secured on residential properties - UK | 404 | 381 | ||||||
| Corporate loans - UK | 369 | 325 | ||||||
| Finance leases - UK | 6 | 6 | ||||||
| Other secured advances - UK | 104 | 83 | ||||||
| Unsecured personal advances - UK | 275 | 330 | ||||||
| Total observed impairment loss allowances | 1,158 | 1,125 | ||||||
| Incurred but not yet observed impairment loss allowances | ||||||||
| Advances secured on residential properties - UK | 98 | 97 | ||||||
| Corporate loans - UK | 111 | 107 | ||||||
| Finance leases - UK | 36 | 31 | ||||||
| Other secured advances - UK | 24 | 24 | ||||||
| Unsecured personal advances - UK | 173 | 179 | ||||||
| Total incurred but not yet observed impairment loss allowances | 442 | 438 | ||||||
| Total impairment loss allowances | 1,600 | 1,563 | ||||||
Movements in impairment loss allowances on loans and advances to customers
An analysis of movements in the Group’s impairment loss allowances on loans and advances is presented below.
Six months ended 30 June 2012 £m | 12 months ended 31 December 2011 £m | |||||||
| Impairment loss allowances at 1 January | 1,563 | 1,655 | ||||||
| Amounts written off | ||||||||
| Advances secured on residential properties - UK | (36 | ) | (92 | ) | ||||
| Corporate loans - UK | (46 | ) | (124 | ) | ||||
| Finance leases - UK | (7 | ) | (9 | ) | ||||
| Other secured advances - UK | (22 | ) | (48 | ) | ||||
| Unsecured personal advances - UK | (249 | ) | (458 | ) | ||||
| Total amounts written off | (360 | ) | (731 | ) | ||||
| Observed impairment losses charged against profit | ||||||||
| Advances secured on residential properties - UK | 59 | 104 | ||||||
| Corporate loans - UK | 90 | 178 | ||||||
| Finance leases - UK | 7 | 14 | ||||||
| Other secured advances - UK | 43 | 76 | ||||||
| Unsecured personal advances - UK | 194 | 407 | ||||||
| Total observed impairment losses charged against profit | 393 | 779 | ||||||
| Incurred but not yet observed impairment losses charged against profit | 4 | (140 | ) | |||||
| Total impairment losses charged against profit | 397 | 639 | ||||||
| Impairment loss allowances at the end of the period/year | 1,600 | 1,563 | ||||||
Recoveries
An analysis of the Group’s recoveries is presented below.
Six months ended 30 June 2012 £m | 12 months ended 31 December 2011 £m | |||||||
| Advances secured on residential properties - UK | 2 | 3 | ||||||
| Corporate loans - UK | — | 2 | ||||||
| Finance leases - UK | 2 | 3 | ||||||
| Other secured advances - UK | 2 | 10 | ||||||
| Unsecured personal advances - UK | 23 | 56 | ||||||
| Total amount recovered | 29 | 74 | ||||||
Group non-performing loans and advances(1,3)
An analysis of the Group’s non-performing loans and advances is presented below.
30 June 2012 £m | 31 December 2011 £m | |||||||
| Non-performing loans and advances that are impaired - UK | 1,655 | 1,725 | ||||||
| Non-performing loans and advances that are not impaired - UK | 2,480 | 2,251 | ||||||
Total non-performing loans and advances(2) | 4,135 | 3,976 | ||||||
Total Group loans and advances to customers(3,4) | 202,900 | 206,311 | ||||||
| Total Group impairment loss allowances | 1,600 | 1,563 | ||||||
| % | % | |||||||
| Non-performing loans and advances as a % of customers assets | 2.04 | 1.93 | ||||||
Coverage ratio(5) | 39 | 39 | ||||||
| (1) | Loans and advances are classified as non-performing typically when the counterparty fails to make payments when contractually due for three months or in the case of individually significant corporate loans where it is assessed as being unlikely to pay. |
| (2) | All non-performing loans continue accruing interest. |
| (3) | Accrued interest is excluded for purposes of these analyses. |
| (4) | Loans and advances to customers include social housing loans and finance leases, and exclude trading assets. |
| (5) | Impairment loan loss allowances as a percentage of non-performing loans and advances. |
In the six months ended 30 June 2012, the value of non-performing loans increased to £4,135m (31 December 2011: £3,976m) and non-performing loans as a percentage of loans and advances to customers increased to 2.04% (31 December 2011: 1.93%). Non-performing loans increased as a result of changes to the residential mortgage collections policy which has resulted in more cases remaining in NPLs for longer and further stress in the legacy portfolios including shipping, structured finance and real estate, as well as other legacy commercial real estate exposures written pre 2009.
The overall coverage ratio has remained flat at 39% as reserves have been increased in line with the increase in non-performing loans. Equally, mortgage coverage remained stable at 20%.
Further analyses on the Group non-performing loans and advances are set out in the Retail Banking, Corporate Banking and Corporate Centre credit risk discussions below.
Group loan collections, including forbearance
The Collections and Recoveries Department (‘Collections & Recoveries’) is responsible for debt management initiatives by Retail Banking. The Workouts and Collections Department (‘Workouts & Collections’) is responsible for debt management activities on the other portfolios. Debt management strategies, which include affordability assessment, use of collection tools, negotiation of appropriate repayment arrangements and debt counselling, can start prior to actual payment default or as early as the day after a repayment is past due and can continue until legal action. Different collection strategies are applied to different segments of the portfolio subject to the perceived levels of risk.
Forbearance
To support customers that encounter actual or apparent financial difficulties, the Group may grant a concession whether temporary or permanent to amend contractual amounts or timings where a customer’s financial distress indicates the potential that satisfactory repayment may not be made within the original terms and conditions of the contract. These arrangements are known as forbearance.
A range of forbearance strategies are employed in order to improve the management of customer relationships, maximise opportunities for positive customer outcomes in collections, and, if possible, avoid foreclosure or repossession. The Group’s policies and practices are based on criteria which, in the judgement of management, indicate that repayment is likely to continue.
The Group also aims to ensure that after the initial period of financial difficulties the customer can revert to the previous terms, with appropriate support where necessary. These agreements may be initiated by the customer, the Group or by a third party.
| > | Retail – In the retail portfolios, forbearance strategies can include approved debt counselling plans, payment arrangements, capitalisation, term extensions and switches from capital and interest repayments to interest-only payments. For further information, refer to the discussions of forbearance and restructured loans in “Credit Risk - Retail Banking”. |
| > | Corporate - In the corporate portfolios, forbearance strategies can include term extensions, interest only concessions, provision of additional security or guarantees, resetting of covenants, seeking additional equity and debt for equity swaps. For further information, refer to the discussions of forbearance and restructured loans in “Credit Risk - Corporate Banking”. |
Other support for customers
| In addition, the Group participates in the following UK Government-sponsored programmes: | |
| > | Income Support for Mortgage Interest: This is a medium-term Government initiative that provides certain defined categories of customers, principally those who are unemployed, access to a benefit scheme, paid for by the Government, which covers all or part of the interest on the mortgage. Qualifying customers are able to claim for mortgage interest on up to £200,000 of the mortgage, and the benefit is payable for a maximum of two years. All decisions regarding an individual’s eligibility and any amounts payable under the scheme rest solely with the Government. Payments are made directly to the Group by the appropriate Government department. |
| > | Mortgage Rescue Scheme: This is a short-term Government initiative for borrowers in difficulty and facing repossession, who would have priority for re-housing by a local authority (e.g. the elderly, disabled, single parents). Eligible customers can have their property bought in full or part by the social rented sector and then remain in their home as a tenant or shared equity partner. If the property is sold outright the mortgage is redeemed in full. |
| > | Delay Repossession: Under this initiative lenders will not begin any litigation or repossession proceedings until the customer is at least three full months payments in arrears, and will then only do so when other appropriate opportunities have been exhausted (i.e. three months is not a “trigger” to litigation). This does not apply to fraud cases. The undertaking is in addition to the procedures of the Pre-Action Protocol, under which mortgage providers are obliged to explore a range of options to avoid repossession and substantiate actions they have taken before submitting a court application for a Possession Order. |
| > | HomeBuy Direct: This scheme covers certain newly built homes on specific housing developments across England. The scheme is provided through ‘HomeBuy agents’. HomeBuy agents are housing associations that have been authorised to run schemes for people who have difficulty buying a home. Customers can only buy a home through HomeBuy Direct if their household earnings are no more than £60,000 per annum, and they cannot otherwise afford to buy a home in their area. The HomeBuy Direct scheme is open to people who rent council or housing association properties; ‘key workers’ in the public sector (e.g. teachers) and first-time buyers. The scheme provides up to 30% of the purchase price through an equity loan that has no repayments for the first five years. After this there is an annual fee of 1.75%, which will increase annually with inflation. The customer can increase their share of ownership at any time. |
| > | ‘Breathing space’ initiative: This is a Government led initiative (targeted at unsecured products) which requires the banking industry to allow a ‘breathing space’ of up to 60 days to allow borrowers in difficulty to agree a repayment plan through a debt advice charity prior to any action being taken by the bank to recover the outstanding debt. |
| In addition to these retail-related initiatives, the Group participates in a number of other initiatives designed to assist borrowers. These include: | |
| > | Statement of Principles: The Group through a number of its businesses has signed up to the Statement of Principles outlining an agreed approach to working with micro-enterprises (entities with fewer than 10 employees and having a turnover of less than euro 2m). The principles include how to ensure that the right relationship is established from the start, how to help if the business faces difficulties and how businesses can work most effectively with their bank. As part of the Group’s commitment to the Statement of Principles, it issues a Letter of Concern to customers when it has concerns about their business or the Group’s relationship with them. This ensures that the customer understands the Group’s concerns. The approach aims to generate early dialogue between the customer and the Group, so that a joint approach to the situation can be developed. |
| > | The Lending Code: The Lending Code is a voluntary set of commitments and standards of good practice, introduced by the British Bankers’ Association, to ensure that lenders act fairly and reasonably in all dealings with customers. |
| > | Business Lending Taskforce: The Group is actively involved in the Business Lending Taskforce, which has committed to 17 actions in three broad areas: (i) improving customer relationships; (ii) ensuring better access to finance; and (iii) providing better information and promoting understanding. |
Group restructured loans
At 30 June 2012, the carrying amount of financial assets that would otherwise be past due or impaired whose terms have been renegotiated was £2,366m (31 December 2011: £1,914m).
CREDIT RISK - RETAIL BANKING
Definition
Credit risk is the risk of financial loss arising from the default of a customer or counterparty to which the Group has directly provided credit, or for which the Group has assumed a financial obligation, after realising collateral held. Credit risk arises principally in connection with Retail Banking’s loan and investment assets (including residential mortgages, unsecured lending, and finance leases and credit cards).
MANAGING CREDIT RISK
Retail Banking aims to actively manage and control credit risk. The Group is principally a retail prime lender and has no appetite or product offering for any type of sub-prime business. The Group’s credit policy explicitly prohibits such lending and is specifically designed to ensure that any business written is responsible, affordable (both initially and on an on-going basis) and of a good credit quality.
The Board has approved a set of risk appetite limits to cover credit risk arising in Retail Banking. Within these limits, credit mandates and policies are approved with respect to products sold by the Group.
RETAIL BANKING CUSTOMER ASSETS
Retail Banking offers a comprehensive range of banking products and related financial services to customers throughout the UK, including residential mortgages, other banking and consumer credit products such as current account facilities and overdrafts, and provides unsecured personal loans, credit cards, finance leases and other secured loans.
An analysis of Retail Banking customer assets is presented below.
30 June 2012 £bn | 31 December 2011 £bn | |||||||
Advances secured on residential properties(1) | 163.2 | 166.2 | ||||||
| Unsecured loans: | ||||||||
- Overdrafts(2) | 0.5 | 0.5 | ||||||
- Unsecured Personal Loans(2,3) | 2.6 | 2.9 | ||||||
- Other loans (cards and consumer) (2) | 2.7 | 2.8 | ||||||
Finance leases(4) | 3.2 | 3.0 | ||||||
| Total | 172.2 | 175.4 | ||||||
| (1) | Excludes loans to UK Social Housing Associations, which are managed within Corporate Banking and Corporate Centre, accrued interest and other items. |
| (2) | Overdrafts, UPLs and other loans relating to cards and consumer are disclosed within unsecured loans and other loans. |
| (3) | Includes cahoot UPLs of £0.1bn (31 December 2011: £0.1bn). |
| (4) | Additional finance leases of £1.0bn (31 December 2011: £1.1bn) are managed and classified within Corporate Banking. |
Further discussion and analysis is set out below on the main products and services offered by Retail Banking, consisting of residential mortgages, and banking and consumer credit, including current account facilities, unsecured personal loans, finance lease arrangements and credit cards.
RESIDENTIAL MORTGAGES
Retail Banking grants mortgage loans for house purchases as well as home improvement loans to new and existing mortgage customers.
Residential mortgage lending(1)
An analysis of movements in Retail Banking mortgage balances is presented below.
30 June 2012 £bn | 31 December 2011 £bn | 30 June 2011 £bn | ||||||||||
| At 1 January | 166.2 | 165.8 | 165.9 | |||||||||
| Gross mortgage lending in the period/year | 8.6 | 23.0 | 9.4 | |||||||||
| Redemptions and repayments in the period/year | (11.6 | ) | (22.6 | ) | (10.1 | ) | ||||||
| At 30 June/31 December | 163.2 | 166.2 | 165.2 | |||||||||
| (1) | Excludes loans to UK Social Housing Associations, which are managed within Corporate Banking and Corporate Centre, accrued interest and other items. |
Managing Credit Risk
Retail Banking lends on many types of property but only after a credit risk assessment of the borrower, including affordability modelling (i.e. an assessment of the customer’s capacity to repay) and an assessment of the property is undertaken. The quality of the mortgage assets are monitored to ensure that they are within agreed portfolio limits. Residential lending is subject to lending policy and lending authority levels, which are used to structure lending decisions to the same standard across the retail network, a process further improved by mortgage credit scoring, underwriter accreditation and regular compliance reviews. Details concerning the prospective borrower and the mortgage are subject to a criteria-based decision-making process. Criteria for assessment include credit references, Loan-to-Value (‘LTV’) ratio, borrower status and the mortgage credit score.
All mortgages provided by Retail Banking are secured on UK or Isle of Man properties. All properties must be permanent in construction; mobile homes are not acceptable. The Group can provide a loan for the purchase of properties outside the UK where the property is a second home and the loan is secured on the main property located in the UK.
Collateralisation
Prior to granting any first mortgage loan on a property, the Group has the property valued by an approved and qualified surveyor. The valuation is based on Group guidelines, which build upon the Royal Institution of Chartered Surveyors (‘RICS’) guidance on valuation methods. In the case of re-mortgages, where the LTV is 75% or lower, the risk judged by the size of the advance requested is medium to low, the credit score of the applicant is considered medium or high, and an accurate, reputable automated valuation is available, this may substitute for a surveyor’s valuation.
For existing mortgages, the current values of the properties on which individual mortgages are secured are estimated quarterly. For each individual property, details such as address, type of property and number of bedrooms are supplied to an independent agency that estimates current property valuations using information from recent property transactions and valuations in that local area. All additional loans require an automated valuation or surveyor’s valuation. The use of an automated valuation depends upon the availability of a reliable automated valuation, and the level of credit risk posed by the proposed loan.
30 June 2012 £m | 31 December 2011 £m | |||||||
| Advances secured on residential properties carrying value | 163,241 | 166,201 | ||||||
Collateral value of residential properties (1) | 162,126 | 165,206 | ||||||
| (1) | The collateral held excludes the impact of over-collateralisation – where the collateral held is of a higher value than the loan balance held. The carrying value of loans where the LTV is greater than 100% (i.e. negative equity) is £8,259m (2011: £7,867m), the total which is therefore effectively uncollateralized is £1,115m (2011: £995m). |
Higher risk loans
The Group is principally a retail prime lender and does not originate second charge mortgages. Certain mortgage products may be considered higher risk. Operating as a prime lender in the UK mortgage market, the Group does not have any material sub-portfolio demonstrating very poor performance. The portfolio’s arrears performance has continued to be relatively stable and favourable to industry benchmarks. Arrears rates and loss rates continued to be very low. Nonetheless, there are some mortgage types that present higher risks than others. These products consist of:
a) Interest-only loans
Interest-only mortgages require monthly interest payments and the repayment of principal at maturity. This can be arranged via investment products including Individual Savings Accounts and pension policies, or by the sale of the property. It is the customer’s responsibility to ensure that they have sufficient funds to repay the principal in full at maturity.
Interest-only mortgages are well-established and common in the UK market. Lending policies to mitigate the risks inherent in this repayment structure are in place and mature. While the risks are higher than capital repayment mortgages, they are only modestly so. The performance of this significant sub-portfolio has been in line with expectations and stable.
b) Flexible loans
Flexible mortgages allow customers to vary their monthly payment, or take payment holidays, within predetermined criteria and/or up to an agreed credit limit. Customers are also permitted to draw down additional funds at any time up to the limit or redraw amounts that have been previously overpaid.
c) Loans with original loan-to-value >100%
Progressively stricter lending criteria have been applied to mortgages above a loan-to-value (LTV) of 75% with less than 0.1% of new secured loan advances having an LTV of more than 90%. Loans with higher LTV ratios carry a higher risk due to the increased likelihood that liquidation of the collateral will not yield sufficient funds to cover the loan advanced, arrears and the costs of liquidation. However, the recently implemented government “New Buy” scheme whereby LTV’s of up to 95% are allowed will mean there will be a small proportion of >90% LTV lending in 2012. The extra risk associated with these higher LTV mortgages is offset as the companies who build the new homes as part of this scheme must offer an indemnity guarantee to the mortgage lender to cover any shortfall in collateral should the home become repossessed.
d) Sub-prime lending
The Group has no appetite or product offering for sub-prime business. The Group’s credit policy explicitly prohibits such lending and is designed to ensure that any business written is responsible, affordable (both initially and on an on-going basis) and of a good credit quality.
Mortgage credit quality and credit risk mitigation – loan-to-value analysis(1)
| Loan-to-value analysis: | 30 June 2012 | 31 December 2011 | ||||||
| New business | ||||||||
| < 75% | 65 | % | 70 | % | ||||
| 75% - 90% | 35 | % | 30 | % | ||||
| > 90% | — | — | ||||||
| 100 | % | 100 | % | |||||
| Average loan-to-value of new business (at inception) | 65 | % | 64 | % | ||||
| Stock | ||||||||
| < 75% | 65 | % | 66 | % | ||||
| 75% - 90% | 23 | % | 22 | % | ||||
| 90% - 100% | 7 | % | 7 | % | ||||
| >100% i.e. negative equity | 5 | % | 5 | % | ||||
| 100 | % | 100 | % | |||||
| Average loan-to-value of stock (indexed) | 53 | % | 52 | % | ||||
| Average loan-to-value of impaired loans | 67 | % | 67 | % | ||||
| Average loan-to-value of unimpaired loans | 53 | % | 52 | % | ||||
| (1) | Excludes any fees added to the loan, and only includes the drawn loan amount, not drawdown limits. |
During the first half of 2012, the average LTV on new business completions increased slightly from 64% to 65%, due to the continuing competition between lenders to write low LTV mortgages. At 30 June 2012, the retail mortgage portfolio with an LTV over 100% remained at 5% and the portfolio with an LTV of 90-100% remained at 7%.
At 30 June 2012, the indexed LTV of the book had increased to 53% from 52% at 31 December 2011. This was due to three factors: a small fall in the house price index, new business lending during 2012 having a slightly higher LTV than the current stock average and the average LTV of redemptions being slightly lower than the current stock average. The average LTV of impaired loans is higher than that of unimpaired loans due to higher LTV business being inherently riskier and hence more likely to go into arrears.
Mortgage credit quality and credit risk mitigation – borrower profile(1)
| Borrower profile: | 30 June 2012 | 31 December 2011 | ||||||
| New business | ||||||||
| First-time buyers | 25 | % | 21 | % | ||||
| Home movers | 51 | % | 48 | % | ||||
| Remortgagers | 24 | % | 31 | % | ||||
| 100 | % | 100 | % | |||||
Of which:(2) | ||||||||
| - Interest-only loans | 24 | % | 29 | % | ||||
| - Flexi loans | 12 | % | 9 | % | ||||
| - Loans with original LTV >100% | — | — | ||||||
| Stock | ||||||||
| First-time buyers | 19 | % | 19 | % | ||||
| Home movers | 41 | % | 39 | % | ||||
| Remortgagers | 40 | % | 42 | % | ||||
| 100 | % | 100 | % | |||||
Of which: (2) | ||||||||
| - Interest-only loans | 41 | % | 41 | % | ||||
| - Flexi loans | 17 | % | 18 | % | ||||
| - Loans with original LTV >100% | — | — | ||||||
| (1) | Excludes any fees added to the loan, and only includes the drawn loan amount, not drawdown limits. |
| (2) | Where a loan exhibits more than one of the higher risk criteria, it is included in all the applicable categories |
During the first half of 2012, the proportion of new business for first-time buyers and home movers increased while the proportion of re-mortgages decreased. This was mainly due to a continued stagnation in the re-mortgage market brought about by prolonged low interest rates. A lower percentage of new interest-only loans was written in 2012 compared with 2011 due to no longer accepting interest-only applications with an LTV greater than 50%. The percentage of flexible loans written increased during the first half of 2012.
Average earnings multiple (at inception)
| Six months ended 30 June 2012 | Six months ended 30 June 2011 | |||||||
| Average earnings multiple (at inception) | 3.0 | 2.9 | ||||||
The average earnings multiple (at inception) remained static during the first half of 2012.
Mortgages – Non-performing loans and advances
30 June 2012 £m | 31 December 2011 £m | |||||||
Total mortgages non-performing loans and advances(1)(2) - UK | 2,570 | 2,434 | ||||||
Total mortgage loans and advances to customers(2) | 163,241 | 166,201 | ||||||
| Total impairment loan loss allowances for mortgages - UK | 502 | 478 | ||||||
| % | % | |||||||
| Mortgages non-performing loans and advances as a percentage of total mortgage loans and advances to customers | 1.57 | 1.46 | ||||||
Coverage ratio(3) | 20 | 20 | ||||||
| (1) | Mortgages are classified as non-performing when the counterparty fails to make a payment when contractually due for typically three months. |
| (2) | Excludes accrued interest. |
| (3) | Impairment loan loss allowances as a percentage of non-performing loans and advances. |
During the first half of 2012, mortgage non-performing loans as a percentage of mortgage loans and advances to customers increased to 1.57% (31 December 2011: 1.46%). The overall increase was due to a change in collections policy implemented in late 2011 that holds more accounts in NPL for longer, in addition to which the asset reduced. The ratio remained considerably below the UK industry average based on Council of Mortgage Lenders (‘CML’) published data. After considering the impact of the change in collections policy, the underlying performance remained broadly stable reflecting the high quality of the mortgage book, a lower than anticipated increase in unemployment and prolonged low interest rates.
Impairment loss allowances increased to £502m (31 December 2011: £478m) due to the increase in non-performing loans. The coverage ratio was broadly unchanged at 20% (31 December 2011: 20%).
Mortgages - non-performing loans and advances by higher risk loan type(1)
30 June 2012 £m | 31 December 2011 £m | |||||||
| Total mortgages non-performing loans and advances | 2,570 | 2,434 | ||||||
| Of which: | ||||||||
| - Interest only loans | 1,678 | 1,557 | ||||||
| - Flexi loans | 248 | 232 | ||||||
| - Loans with original LTV > 100% | 18 | 20 | ||||||
| (1) | Where a loan exhibits more than one of the higher risk criteria, it is included in all the applicable categories. |
Mortgages – Arrears
The following table analyses the residential mortgage arrears status at 30 June 2012 and 31 December 2011 for Retail Banking by volume and value.
| 30 June 2012 | 31 December 2011 | |||||||||||||||
Volume ‘000 | Value(1) £m | Volume ‘000 | Value(1) £m | |||||||||||||
| Performing | 1,532 | 157,963 | 1,558 | 161,145 | ||||||||||||
Early arrears(2) | 24 | 2,567 | 24 | 2,488 | ||||||||||||
Late arrears(3) | 25 | 2,570 | 26 | 2,434 | ||||||||||||
| Properties in possession | 1 | 141 | 1 | 134 | ||||||||||||
| 1,582 | 163,241 | 1,609 | 166,201 | |||||||||||||
| (1) | Excludes accrued interest. |
| (2) | Early arrears refer to mortgages that are between 31 days and 90 days in arrears. |
| (3) | Late arrears refer to mortgages that are typically over 90 days in arrears, past maturity and sole deceased. |
In the first half of 2012, arrears and repossession levels remained significantly better than UK industry benchmarks from the Council of Mortgage Lenders. Mortgage arrears increased due to a change in collections policy implemented in late 2011 that holds more accounts in NPL for longer. The underlying performance remained stable supported by continued low interest rates and a high quality book. Properties in possession increased slightly but remained stable at 0.06% of the total mortgage book by volume. Properties in possession by value increased slightly during the period and the ratio of properties in possession to the total mortgage book was considerably better than the industry average. This was due to stable sales performance of repossessed assets.
The following table set forth information on UK residential mortgage arrears by volume of accounts (separately for higher risk loans and the remaining loan portfolio) at 30 June 2012 and 31 December 2011 for Retail Banking compared to the industry average as provided by the Council of Mortgage Lenders (‘CML’).
Group(1) | CML(2) | |||||||||||||||||||||||
Higher risk loans(3) | Remaining loan portfolio | |||||||||||||||||||||||
| Mortgage arrears | Interest-only loans | Flexible loans | Loans with original LTV > 100% | Total(3) | ||||||||||||||||||||
| (Percentage of total mortgage loans by number) | ||||||||||||||||||||||||
| 31 to 60 days in arrears: | ||||||||||||||||||||||||
| 31 December 2011 | 0.44 | 0.07 | 0.01 | 0.49 | 0.95 | — | ||||||||||||||||||
| 30 June 2012 | 0.42 | 0.07 | 0.01 | 0.51 | 0.98 | — | ||||||||||||||||||
| 61 to 90 days in arrears: | ||||||||||||||||||||||||
| 31 December 2011 | 0.27 | 0.04 | — | 0.28 | 0.56 | — | ||||||||||||||||||
| 30 June 2012 | 0.26 | 0.04 | — | 0.30 | 0.59 | — | ||||||||||||||||||
| Over 3 to 6 months in arrears: | ||||||||||||||||||||||||
| 31 December 2011 | 0.40 | 0.06 | — | 0.36 | 0.77 | 0.86 | ||||||||||||||||||
| 30 June 2012 | 0.36 | 0.06 | — | 0.36 | 0.82 | 0.87 | ||||||||||||||||||
| Over 6 to 12 months in arrears: | ||||||||||||||||||||||||
| 31 December 2011 | 0.24 | 0.04 | — | 0.17 | 0.42 | 0.64 | ||||||||||||||||||
| 30 June 2012 | 0.26 | 0.04 | — | 0.22 | 0.50 | 0.62 | ||||||||||||||||||
| Over 12 months in arrears: | ||||||||||||||||||||||||
| 31 December 2011 | 0.13 | 0.02 | — | 0.10 | 0.23 | 0.48 | ||||||||||||||||||
| 30 June 2012 | 0.12 | 0.02 | — | 0.11 | 0.25 | 0.44 | ||||||||||||||||||
| (1) | Group data is not readily available for arrears less than 31 days. |
| (2) | Council of Mortgage Lenders data is not available for arrears less than three months. |
| (3) | Where a loan exhibits more than one of the higher risk criteria, it is included in all the applicable categories. As a result, the total of the mortgage arrears for higher risk loans and remaining loan portfolio will not agree to the total mortgage arrears percentages. |
Arrears rates increased slightly during the first half of 2012, mainly in the 6 to 12 months arrears category but generally not in the higher risk areas. This increase was mainly due to process changes made within Collections & Recoveries to meet evolving regulatory requirements. Overall, the arrears rate remained well below the industry average as provided by the Council of Mortgage Lenders.
Arrears rates at 30 June 2012 also included loans that had a capital balance outstanding 90 days after the contractual maturity date of the loan even if they were not in payment arrears.
Mortgages - arrears management
When a mortgage is in arrears, the account is considered due and classified in the Collections category. Collections & Recoveries is responsible for all debt management initiatives on the secured loan portfolio for Retail Banking. Debt management strategies, which include affordability assessment, negotiating appropriate repayment arrangements and concessions and debt counselling, can start as early as the day after a repayment is past due and will continue until legal action. Different collection strategies are applied to different segments of the portfolio subject to the perceived levels of risk for example, loan-to-value, collections score and account characteristics. Policies and processes are designed to ensure that collections staff tailor repayment arrangements to suit the individual circumstances and financial situation of the customer.
Collections & Recoveries’ activities exist to ensure customers who have failed to make their contractual or required minimum payments or have exceeded their agreed credit limits are encouraged, subject to assessment of circumstances and affordability, to enter into appropriate arrangements to pay back the required amounts, and in the event they are unable to do so to pursue recovery of the debt in order to maximise the net recovered balance. The overall aim is to minimise losses by helping customers repay their debts in a timely but affordable and sustainable manner whilst not adversely affecting brand, customer loyalty, fee income, or compliance with relevant legal and regulatory standards.
Collections & Recoveries activity is performed within either:
| > | Santander UK, by Collections & Recoveries, utilising the Group’s operational centres and involves the use of selected third party specialists where appropriate; or |
| > | additional outsourced providers, using operational centres approved by the Group as sufficiently capable to deal with the Group customers to the high standards expected by the Group. |
The Collections & Recoveries department follows the Collections & Recoveries policies and makes use of various collection and rehabilitation tools with the aim to bring the customer account up to date as soon as possible. The policies comply with the UK Financial Services Authority Treating Customers Fairly (‘TCF’) and Mortgage: Conduct of Business (‘MCOB’) rules and principles. The MCOB rules govern the relationship between mortgage lenders and borrowers in the UK, and are designed to improve the information available to consumers and increase their ability to make informed choices in the mortgage market.
General principles of collections
The general principles of the Group’s collections consist of:
| > | Wherever possible, rehabilitation tools are used to encourage customers to find their own way out of difficulties but this solution should be agreeable to the Group as well as appropriate to the customer circumstance; |
| > | The Group will be sympathetic and not make unreasonable demands of the customer; |
| > | Customer retention, where appropriate, is important and helping customers through difficult times can improve loyalty; |
| > | Guarantors are pursued only after it is established that the borrower is unable or unwilling to fulfil their contractual arrangements or if contact with the borrower cannot be made; and |
| > | Litigation and repossession is the last resort. |
Effective collections and recoveries activity is dependent on:
| > | Predicting customer behaviours and treating customers fairly: By monitoring and modelling customer profiles and designing and implementing appropriate customer communication and repayment strategies, the Group’s strategies are designed to balance treating customers fairly with prioritising monies owed to the Group by customers. |
| > | Negotiation: Ongoing communication, dialogue and negotiation with the customer are the dominant criteria in recovery management at any time during the life of the account (even the legal phase) so as to meet the objective of recovering the arrears in the shortest affordable and sustainable period and at the least cost. |
| > | Monitoring customer repayment promises: It is essential that agreements or promises agreed with the customer for the repayment of debts are monitored and evaluated to ensure that they are reducing the indebtedness of the customer and are cost effective for the organisation (i.e. adding positive financial value over operational costs). |
| An agreement or promise is defined as any transaction in which a firm commitment is made with the customer, in relation to a specific payment schedule. In most instances, where repayment is maintained in accordance with the promise, fees and charges to the account are withheld. Where the customer fails to meet their obligations, enforcement activity will resume where appropriate. This will involve statutory notice of default, termination of agreement and the account may be referred to debt recovery agents. | |
| > | Management aimed at the customer: Effective collections management is focussed on assisting customers in finding affordable and sustainable repayment solutions based on their financial circumstances and needs. This approach builds customer loyalty and the priority of repayment to the Group, and enables the Group to arrange repayment solutions which are best for the customer while meeting the Group’s financial objectives. |
| > | Customer relationship management: Collections & Recoveries will have sight of information about some of a customer’s other Santander UK retail products (e.g. banking, unsecured personal loan and mortgage) and this will be taken into consideration when agreeing repayment plans. For example, a repayment plan for unsecured personal loans will not be agreed if such a plan compromises the customer’s ability to repay their Santander UK bank account. This approach reduces the risk of duplicating collections and recoveries activity and associated costs (e.g. payment of fees to external companies and the fees of lawyers taking the same measures). |
| > | Standardisation and automation of recovery proceedings: Standard processes are defined based on the number of payments or cycles of delinquency. Strategies are defined to automate the production of legislatively required documentation (such as Consumer Credit Act (‘CCA’) statutory notices of default) and to automate, so far as is possible, the transfer of customers to appropriate post write-off recovery action at pre-defined strategy stages. |
| > | Ongoing management and coordination between all parties involved: Appropriate coordination is required between Santander UK internal collection departments, outsource and in-source collections services providers and in-house and outsourced post write-off collection agents in order to assure a smooth transfer of cases from one area to another and to quickly resolve any problems which might arise. |
If the agreed repayment arrangement is not maintained, and all other appropriate solutions or options have been exhausted, legal proceedings may be undertaken and may result in the property being taken into possession. The Group sells the repossessed property in a reasonable time frame for the best possible price based on fair market value and uses the sale proceeds, net of costs, to pay off the outstanding value of the mortgage. The stock of repossessed properties held by the Group varies according to the number of new possessions and the buoyancy of the housing market.
Collection tools
The Group uses the following collection tools to recover mortgage arrears:
| a) | Use of external agents – external agents may be engaged to trace customers during the collection and recoveries phase. Remuneration is on a fixed fee basis. The Group manages external agents and suppliers to ensure that they follow a consistent approach to any collections and recoveries activity, and relevant management information is received from them in a consistent style. In addition, suppliers are audited and reviewed to ensure that they are fully compliant with TCF, MCOB and other UK Financial Services Authority requirements. |
| b) | Field collections - Field visits are undertaken by agents acting on behalf of Santander UK visiting a mortgaged property in person. Field visits are only used where the borrower is two or more instalments in arrears and has not responded satisfactorily to other forms of communication. Customers are pre-notified of such visits to enable them to contact us in order to cancel or make other arrangements. Where unauthorised letting or abandonment of the property is suspected, a field visit may be made irrespective of the arrears situation. |
| c) | Exercise the legal right of set-off – other designated bank accounts may be combined to clear the arrears and any other fees, charges or sums which are due but not to make principal repayments. Right of set-off may only be performed on available funds; this does not include funds in a bank account intended for priority debts such as council tax. If a payment arrangement is in place, right to set-off will not apply. The repayment period cannot be extended to defer collection or arrears. |
| d) | Arrears fees - An arrears fee charge is typically raised on the anniversary of a missed payment i.e. when payment has not been received before the next payment is due and/or on the anniversary of a missed payment when the customer has not kept to an agreed repayment plan with Collections & Recoveries (i.e. a broken promise). A customer will only be charged a maximum of one fixed fee per month. |
Entry and exit criteria from the collections category
There are specific criteria for entry into and exit from the collections category. The entry and exit criteria vary according to mortgage product. The trigger for entry will vary from the account being one penny in arrears for flexible mortgages, to a fixed number of days after the arrears are equal to or greater than one instalment. Generally, the trigger for exit will vary from arrears being cleared for flexible mortgages, to arrears being reduced to below £100 or the account being restructured or entering the forbearance process, as described below.
Mortgages - forbearance
Forbearance or repayment arrangements allow a mortgage customer to repay a monthly amount which is lower than their contractual monthly payment for a short period. This period is usually for no more than 24 months (although shorter concessionary periods may be agreed where appropriate and suitable for the given circumstances of the customer) and is negotiated with the customer by the mortgage collectors. During the period of forbearance, arrears management activity continues with the aim to rehabilitate accounts. There is no clearing down of arrears such that unless the customer is paying more than their contractual minimum payment, arrears balances will remain. When customers come to the end of their arrangement period they will continue to be managed as a mainstream collections case and if Santander UK is unable to recover any remaining arrears, then the account will move toward possession proceedings.
Mortgages restructured or renegotiated
Capitalisation is the process whereby outstanding arrears are added to the loan balance to be repaid over the remaining loan term. Capitalisation can be offered to borrowers under the forms of payment arrangements and refinancing (either a term extension or an interest only concession), subject to customer negotiation and agreement:
| a) | Payment arrangements – discretion exists to vary the repayment schedule to allow customers to bring the account up to date. The objective is to bring the account up to date as soon as possible. | |
| If a customer has repeatedly broken previous arrangements to the extent that the advisor does not believe the payment arrangement will be adhered to, payment arrangements are not agreed without an upfront payment. If a payment arrangement is refused, the customer is notified of this in writing, as per requirements under the pre-action protocol. In the event a customer breaks an arrangement, Santander UK will wait at least 15 business days before passing them to litigation / continuing with litigation, as per requirements under the pre-action protocol. New arrangements will not be agreed in these fifteen days; however the original arrangement may be reinstated. | ||
| b) | Refinancing – Collections & Recoveries may offer to pay off an existing mortgage and replace it with a new one, only to accounts in arrears or with significant financial difficulties or if customer is up to date but states they are experiencing financial hardship. Collections & Recoveries may offer a term extension or interest only concession. The eligibility criteria for refinancing are: | |
| > | If the account is at least one instalment in arrears; or | |
| > | If the customer has been consistently underpaying their instalment (for at least the last two months) then this can be taken as evidence of financial hardship; or | |
| > | If the customer claims a medium-term temporary change in financial circumstances has caused financial distress. Pre-delinquent customers are not required to submit evidence of financial hardship. | |
| To qualify for either a term extension or an interest only concession, affordability is assessed, and the customer must also meet the specific criteria detailed below, in addition to the eligibility criteria for refinancing. The customer must confirm that he or she is aware of the implications of refinancing. | ||
| > | Term Extensions - the repayment period/program may be extended to reduce monthly repayments if all other collections tools have been exhausted. Customers may be offered a term extension where they are up-to-date but showing evidence of financial difficulties, or are already in the Collections & Recoveries process, and no other refinancing has been performed in the last 12 months. The term can be extended to no more than 40 years and the customer must be no more than 75 years old at the end of the revised term of the mortgage. | |
| > | Interest Only Concessions – the monthly repayment may be reduced to interest payment only with capital repayment deferred if all other collections tools have been exhausted and a term extension is either not possible or affordable. Customers may be offered an interest only concession where they are up-to-date but showing evidence of financial difficulties, or are already in the Collections & Recoveries process. Interest only concessions are offered up to a two year maximum period (although shorter concessionary periods may be agreed where appropriate and suitable for the given circumstances of the customer), after which a review is carried out. The expectation is that the customer will return to repayment on a capital and interest basis after the expiry of this concession, however, in exceptional circumstances, a further extension may be granted. Agreements are made through the use of a data driven tool including such factors as affordability and customer indebtedness. Periodic reviews of the customer financial situation are undertaken to assess when the customer can afford to return to the repayment method. | |
| > | Capitalisation – the customer’s arrears may be capitalised and added to the mortgage balance where the customer is consistently repaying the agreed monthly amounts (typically for a minimum period of 6 months) but where they are unable to increase repayments to repay these arrears over a reasonable period. | |
The incidence of the main types of arrangements described above which occurred during the six months ended 30 June 2012 and the twelve months ended 31 December 2011 was:
| Six months ended 30 June 2012 | 12 months ended 31 December 2011 | |||||||||||||||
| £m | % of loans by value | £m | % of loans by value | |||||||||||||
Capitalisation | 103 | 28 | 386 | 51 | ||||||||||||
| Term extensions | 82 | 23 | 53 | 7 | ||||||||||||
| Interest only concessions | 175 | 49 | 318 | 42 | ||||||||||||
| 360 | 100 | 757 | 100 | |||||||||||||
The status of the cumulative number of accounts in forbearance at 30 June 2012 and 31 December 2011 when they originally entered forbearance, analysed by type of forbearance applied, was:
| 30 June 2012 | Interest only | Term extension | Capitalisation | Total | ||||||||||||||||||||||||||||
| No. | £m | No. | £m | No. | £m | No. | £m | |||||||||||||||||||||||||
| Performing | 3,854 | 425 | 1,233 | 103 | 8,388 | 767 | 13,475 | 1,295 | ||||||||||||||||||||||||
| In arrears | 6,010 | 619 | 1,321 | 111 | 12,874 | 1,233 | 20,205 | 1,963 | ||||||||||||||||||||||||
| Total | 9,864 | 1,044 | 2,554 | 214 | 21,262 | 2,000 | 33,680 | 3,258 | ||||||||||||||||||||||||
| 31 December 2011 | Interest only | Term extension | Capitalisation | Total | ||||||||||||||||||||||||||||
| No. | £m | No. | £m | No. | £m | No. | £m | |||||||||||||||||||||||||
| Performing | 2,966 | 335 | 765 | 78 | 4,644 | 447 | 8,375 | 860 | ||||||||||||||||||||||||
| In arrears | 6,054 | 622 | 1,493 | 121 | 10,606 | 1,004 | 18,153 | 1,747 | ||||||||||||||||||||||||
| Total | 9,020 | 957 | 2,258 | 199 | 15,250 | 1,451 | 26,528 | 2,607 | ||||||||||||||||||||||||
The current status of accounts in forbearance analysed by type of forbearance applied, at 30 June 2012 and 31 December 2011 was:
| 30 June 2012 | Interest only | Term extension | Capitalisation | Total | Impairment allowance | |||||||||||||||||||||||||||||||
| No. | £m | No. | £m | No. | £m | No. | £m | £m | ||||||||||||||||||||||||||||
| Performing | 5,656 | 592 | 1,657 | 137 | 15,625 | 1,473 | 22,938 | 2,202 | 51 | |||||||||||||||||||||||||||
| In arrears | 4,208 | 452 | 897 | 77 | 5,637 | 527 | 10,742 | 1,056 | 57 | |||||||||||||||||||||||||||
| Total | 9,864 | 1,044 | 2,554 | 214 | 21,262 | 2,000 | 33,680 | 3,258 | 108 | |||||||||||||||||||||||||||
| Proportion of portfolio (%) | 0.6 | % | 0.6 | % | 0.2 | % | 0.1 | % | 1.3 | % | 1.2 | % | 2.1 | % | 2.0 | % | — | |||||||||||||||||||
| 31 December 2011 | Interest only | Term extension | Capitalisation | Total | Impairment allowance | |||||||||||||||||||||||||||||||
| No. | £m | No. | £m | No. | £m | No. | £m | £m | ||||||||||||||||||||||||||||
| Performing | 4,940 | 518 | 1,295 | 120 | 11,393 | 1,114 | 17,628 | 1,752 | 47 | |||||||||||||||||||||||||||
| In arrears | 4,080 | 439 | 963 | 79 | 3,857 | 337 | 8,900 | 855 | 45 | |||||||||||||||||||||||||||
| Total | 9,020 | 957 | 2,258 | 199 | 15,250 | 1,451 | 26,528 | 2,607 | 92 | |||||||||||||||||||||||||||
| Proportion of portfolio (%) | 0.6 | % | 0.6 | % | 0.1 | % | 0.1 | % | 0.9 | % | 0.9 | % | 1.6 | % | 1.6 | % | — | |||||||||||||||||||
In the first half of 2012, the value of accounts in forbearance increased, reflecting changes to the Group’s policies to focus the application of forbearance activities.
At 30 June 2012, 68% of the accounts in forbearance were performing in accordance with the revised terms agreed under the Group’s forbearance arrangements. When forbearance activities began, only 40% of these accounts were performing in accordance with the original contractual terms. A customer’s ability to adhere to any revised terms agreed is a significant indicator of the sustainability of the Group’s forbearance arrangements. The improvement in the percentage of accounts performing supports the Group’s view that its forbearance arrangements provide a valuable tool to improve the prospects of recovery of amounts owed. Those accounts that reach the end of the concessionary forbearance period show a good propensity to return to full repayments in accordance with the original contractual terms after the period of financial difficulty has passed.
At 30 June 2012, impairment loss allowances as a percentage of the balance of accounts for the Group’s overall mortgage portfolio was 0.3% (31 December 2011: 0.3%). The equivalent ratio for accounts in forbearance which were performing was 2.3% (31 December 2011: 2.7%), and for accounts in forbearance which were in arrears was 5.4% (31 December 2011: 5.3%). The higher ratios for accounts in forbearance reflect the higher levels of impairment loss allowances held against such accounts, as a result of the higher risk characteristics inherent in such accounts.
The tables below provide a further analysis of the accounts in forbearance at 30 June 2012 and 31 December 2011 that are classified as performing by length of time since they entered forbearance.
30 June 2012 - Values | 0 to 6 months | > 6 to 12 months | > 12 to 18 months | > 18 to 24 months | More than 24 months | Total | ||||||||||||||||||
| £m | £m | £m | £m | £m | £m | |||||||||||||||||||
| Capitalisation | 61 | 123 | 213 | 167 | 909 | 1,473 | ||||||||||||||||||
| Term extensions | 18 | 9 | 14 | 21 | 75 | 137 | ||||||||||||||||||
| Interest only concessions | 75 | 59 | 90 | 80 | 288 | 592 | ||||||||||||||||||
| Total | 154 | 191 | 317 | 268 | 1,272 | 2,202 | ||||||||||||||||||
| Proportion of forborne performing accounts (%) | 7 | % | 9 | % | 14 | % | 12 | % | 58 | % | 100 | % | ||||||||||||
30 June 2012 - Volumes | 0 to 6 months | > 6 to 12 months | > 12 to 18 months | > 18 to 24 months | More than 24 months | Total | ||||||||||||||||||
| No. | No. | No. | No. | No. | No. | |||||||||||||||||||
| Capitalisation | 530 | 1,136 | 1,899 | 1,583 | 10,477 | 15,625 | ||||||||||||||||||
| Term extensions | 226 | 126 | 180 | 243 | 882 | 1,657 | ||||||||||||||||||
| Interest only concessions | 643 | 523 | 850 | 704 | 2,936 | 5,656 | ||||||||||||||||||
| Total | 1,399 | 1,785 | 2,929 | 2,530 | 14,295 | 22,938 | ||||||||||||||||||
| Proportion of forborne performing accounts (%) | 6 | % | 8 | % | 13 | % | 11 | % | 62 | % | 100 | % | ||||||||||||
31 December 2011 - Values | 0 to 6 months | > 6 to 12 months | > 12 to 18 months | > 18 to 24 months | More than 24 months | Total | ||||||||||||||||||
| £m | £m | £m | £m | £m | £m | |||||||||||||||||||
| Capitalisation | 143 | 173 | 197 | 126 | 475 | 1,114 | ||||||||||||||||||
| Term extensions | 8 | 17 | 28 | 40 | 27 | 120 | ||||||||||||||||||
| Interest only concessions | 54 | 66 | 100 | 98 | 200 | 518 | ||||||||||||||||||
| Total | 205 | 256 | 325 | 264 | 702 | 1,752 | ||||||||||||||||||
| Proportion of forborne performing accounts (%) | 12 | % | 15 | % | 18 | % | 15 | % | 40 | % | 100 | % | ||||||||||||
31 December 2011 - Volumes | 0 to 6 months | > 6 to 12 months | > 12 to 18 months | > 18 to 24 months | More than 24 months | Total | ||||||||||||||||||
| No. | No. | No. | No. | No. | No. | |||||||||||||||||||
| Capitalisation | 1,277 | 1,495 | 1,737 | 1,234 | 5,650 | 11,393 | ||||||||||||||||||
| Term extensions | 98 | 174 | 304 | 404 | 315 | 1,295 | ||||||||||||||||||
| Interest only concessions | 455 | 620 | 871 | 907 | 2,087 | 4,940 | ||||||||||||||||||
| Total | 1,830 | 2,289 | 2,912 | 2,545 | 8,052 | 17,628 | ||||||||||||||||||
| Proportion of forborne performing accounts (%) | 10 | % | 13 | % | 17 | % | 14 | % | 46 | % | 100 | % | ||||||||||||
The sustainability of the Group’s forbearance arrangements is further demonstrated by the fact that 73% and 70% (2011: 60% and 55%) by volume and value, respectively, of the accounts in forbearance classified as performing arose from forbearance undertaken more than 18 months ago.
The table below analyses residential mortgages that have been restructured or renegotiated by capitalising the arrears on the customer’s account, as a result of a revised payment arrangement (i.e. adherence to a repayment plan over a specified period) or a refinancing (either a term extension or an interest only concession).
| Six months ended 30 June 2012 | 12 months ended 31 December 2011 | |||||||||||||||
| £m | % | £m | % | |||||||||||||
Mortgages restructured during the period/year (1, 2) | 360 | 100 | 757 | 100 | ||||||||||||
Of which(3): | ||||||||||||||||
| - Interest only loans | 150 | 42 | 430 | 57 | ||||||||||||
| - Flexi loans | 48 | 13 | 63 | 8 | ||||||||||||
| - Loans with original LTV >100% | 1 | — | 2 | — | ||||||||||||
| (1) | All mortgages originated by the Group are first charge. |
| (2) | Mortgages are included within the period/year that they were restructured. |
| (3) | Where a loan exhibits more than one of the higher risk criteria, it is included in all the applicable categories. |
At 30 June 2012, the stock of mortgage accounts that had either had their term extended or converted to interest only amounted to less than 1% of all mortgage accounts, both by number and value (31 December 2011: less than 1%).
Levels of adherence to revised payment terms remained high during the period and remained in line with the level seen during 2011 at approximately 74% (31 December 2011: 71%) by value.
Litigation and recovery
The account is escalated to the litigation and recovery phase when a customer is unwilling or unable to adhere to an agreement regarding arrears that is acceptable to Santander UK, after the above options have been exhausted. In most cases, this will occur when a customer reaches three instalments in arrears and has been in the collections category for at least 90 days. The following specifically trigger customers to be referred to litigation:
| > | Three or more missed instalments and having reached the end of strategy. |
| > | Upon breaking an agreement while having more than three missed instalments. Accounts are given at least 15 business days to make up the payment missed under the agreement before being passed to litigation as per the pre-action protocol. |
| > | Legal disputes. |
| > | Voluntary repossession. |
Santander UK will consider delaying referral to litigation, or delaying action once in litigation under certain circumstances, such as where the customer presents evidence that the mortgage will be redeemed or the arrears cleared, or where the mortgage has a very low balance and arrears, or where the customer is making a regular payment of at least the instalment amount. These policies exist to ensure that repossession is only used as a last resort for customers with an ability to repay and where mortgage arrears pose reduced risks to the Group.
Application of impairment loss methodology to accounts in arrears and collection
Customer accounts that have had restructuring or forbearance policies applied continue to be reported in arrears until the arrears are capitalised. As a result, the impairment loss allowances on these accounts are calculated in the same manner as any other account that is in arrears. Once arrears are capitalised, the account is reclassified as a performing asset.
The accounts within the collections category classified as ‘performing assets’ continue to be assessed for impairment collectively under the Group’s normal collective assessment methodology, as described in ‘Collective assessment’ in Note 1 of the Group’s 2011 Annual Report. The accounts within the collections category classified as ‘performing assets’ have the loss propensity factor for the IBNO segment applied, rather than the loss propensity factor for the observed segment.
The remaining accounts in the collections category have the loss propensity factor for the observed segment applied, as they are individually impaired. The loss propensity factor for the observed segment is normally higher than for the IBNO segment.
Accounts that have had forbearance policies applied, and accounts within certain regions, are assessed separately from other accounts within the IBNO and observed segments. Different loss propensity factors and loss factors are used in order to reflect the different risk characteristics which are inherent within these loans.
Separate adjustments to the loss propensity factors are made to the performing accounts within the collections category that were previously in arrears and the performing accounts within the collections category that have always been performing, to reflect their differing risk profiles. The full observed loss propensity factors are not applied to these accounts, as it is not expected that all accounts in the collections category will default, particularly as the Group’s lending policies only permit a mortgage restructure, refinance or forbearance in circumstances where the customer is expected to be able to meet the related requirements and ultimately repay in full.
Repossessed collateral
The following tables set forth information on properties in possession, at 30 June 2012 and 31 December 2011 for Retail Banking compared to the industry average as provided by the Council of Mortgage Lenders, as well as the carrying amount of assets obtained as collateral. Two independent valuations are requested on all possessions and form the basis for impairment reserving. Where the valuations are still pending, the latest losses experienced are used to assess the impairment reserves. This, together with the additional disposal costs considered, ensures that anticipated losses inherent in the stock of possession are realistic in relation to the current economic conditions.
| Industry Average CML | ||||||||||||||||
| Properties in possession | Number of properties | Value £m | Percentage of total mortgage loans by number | |||||||||||||
| % | % | |||||||||||||||
| 31 December 2011 | 965 | 134 | 0.06 | 0.12 | ||||||||||||
| 30 June 2012 | 999 | 141 | 0.06 | 0.12 | ||||||||||||
Banking and Consumer Credit
Retail Banking also grants current account facilities and overdrafts, and provides unsecured personal loans, credit cards, finance leases and other secured loans.
Unsecured personal lending(1)
Retail Banking uses systems and processes to manage the risks involved in unsecured personal lending. These include the use of application and behavioural scoring systems to assist in the granting of credit facilities as well as regular monitoring of scorecard performance and the quality of the unsecured lending portfolios.
Unsecured personal loans (‘UPLs’) are assessed by the use application scoring and control policies to determine lending decisions. In combination with other relevant criteria, such as the loan amount, these determine the price offered to the customer as well as accept/reject decisions. No revolving or flexible facilities are available to customers through UPL products.
Current account facilities rely on behavioural scoring in addition to the application scoring systems. Behavioural scoring examines the lending relationships that a customer has with Retail Banking and how the customer uses their bank account. This information generates a score that is used to assist in deciding the level of risk (in terms of overdraft facility amount facilities granted) for each customer that Retail Banking is willing to accept. Individual customer scores are normally updated on a monthly basis.
An analysis of movements in Retail Banking’s unsecured personal lending balances is presented below.
30 June 2012 £bn | 31 December 2011 £bn | 30 June 2011 £bn | ||||||||||
| At 1 January | 2.9 | 3.3 | 3.3 | |||||||||
| Gross lending in the period/year | 0.6 | 1.5 | 0.7 | |||||||||
| Redemptions and repayments in the period/year | (0.9 | ) | (1.9 | ) | (0.9 | ) | ||||||
| At 30 June/31 December | 2.6 | 2.9 | 3.1 | |||||||||
| (1) | Excludes overdrafts and credit cards. |
Unsecured personal loans – Non-performing loans and advances
30 June 2012 £m | 31 December 2011 £m | |||||||
Total unsecured non-performing loans and advances - UK (1,2) | 113 | 154 | ||||||
Total unsecured loans and advances to customers(2) | 4,456 | 4,722 | ||||||
| Total impairment loan loss allowances for unsecured loans and advances -UK | 254 | 297 | ||||||
| % | % | |||||||
| Non-performing loans as a percentage of unsecured loans and advances to customers | 2.54 | 3.27 | ||||||
Coverage ratio(3)(4) | 224 | 192 | ||||||
| (1) | Unsecured personal loans and advances are classified as non-performing when the counterparty fails to make a payment when contractually due for three months or longer. |
| (2) | Includes UPLs, overdrafts, cahoot, and consumer finance (excluding finance leases). Accrued interest is excluded for purposes of these analyses. |
| (3) | Impairment loan loss allowances as a percentage of non-performing loans and advances. |
| (4) | The coverage ratio, as recognised across the industry, is based on the total impairment loan loss allowances relative to the stock of NPLs. Total loan loss allowances will relate to early arrears as well as performing assets and hence, the ratio exceeds 100%. |
During the first half of 2012, unsecured non-performing loans and advances as a percentage of unsecured loans and advances to customers decreased to 2.54% (31 December 2011: 3.27%). The level of UPLs non-performing loans and advances decreased to £113m at 30 June 2012 (31 December 2011: £155m), reflecting the improved quality of the unsecured lending book. Impairment loss allowances decreased to £254m (31 December 2011: £297m). The coverage ratio increased to 224% at 30 June 2012 (31 December 2011: 192%) as overall new business risk profile has increased slightly due to a change in the new business mix between channels albeit that the risk profile for individual channels is unchanged.
Unsecured personal loans - forbearance
If a customer with an unsecured personal loan experiences financial difficulties then the main type of forbearance strategy offered has typically been by way of a term extension as described in “Mortgages – forbearance” above. During 2011, forbearance options for UPLs were reviewed and the process is now to agree an affordable repayment plan rather than to extend the term. See the accounting policy “Impairment of Financial Assets” on pages 177 to 180 of the Group’s 2011 Annual Report for details of how impairment losses are calculated for these loans subject to forbearance.
At 30 June 2012, the proportion of the stock of unsecured personal loans for which term extensions had been agreed was less than 2% by number and value (31 December 2011: less than 2%).
Credit cards
Credit card applications are assessed via a combination of credit policy rules and scoring models to determine acceptance decisions and assign appropriate credit limits. Behavioural scoring and trigger events identified through a wide variety of internal performance and credit bureau data are utilised to inform ongoing portfolio management decisions such as credit line management and transaction authorisation.
Credit cards – Non-performing loans and advances
30 June 2012 £m | 31 December 2011 £m | |||||||
Total credit cards non-performing loans and advances – UK (1,2) | 44 | 48 | ||||||
Total credit cards loans and advances to customers(2) | 2,614 | 2,733 | ||||||
| Total impairment loan loss allowances for credit cards loans and advances - UK | 193 | 212 | ||||||
| % | % | |||||||
| Non-performing loans as a % of credit cards loans and advances to customers | 1.67 | 1.75 | ||||||
Coverage ratio(3)(4) | 442 | 441 | ||||||
| (1) | Credit card loans and advances are classified as non-performing when the counterparty fails to make a payment when contractually due for three months or longer. |
| (2) | Includes Santander Cards and cahoot credit cards. Accrued interest is excluded for purposes of these analyses. |
| (3) | Impairment loan loss allowances as a percentage of non-performing loans and advances. |
| (4) | The coverage ratio as recognised across the industry is based on the total impairment loan loss allowances relative to the stock of NPLs. Total loan loss allowances will relate to early arrears as well as performing assets and hence, the ratio exceeds 100%. |
During the first half of 2012, credit cards non-performing loans and advances as a percentage of the credit cards loans and advances to customers decreased to 1.67% (31 December 2011: 1.75%) mainly due to reduced levels of non-performing loans following risk initiatives that have improved the quality of the book. The coverage ratio remained stable at 442% (31 December 2011: 441%).
Credit cards – forbearance
Forbearance arrangements allow credit card customers to manage repayments when they experience financial difficulties. The forbearance arrangements may be available to credit card customers are:
| a) | Reduced repayments via a Debt Management Plan – where customers experience financial difficulty collection activities and fees and interest can be frozen for up to 60 days. A reduced payment plan is agreed and if payments maintained then the fees and interest will not be reinstated. |
| b) | Informal reduced payment arrangements – the same flexibility as noted above is offered where a customer does not have a formal Debt Management Plan in place but is experiencing financial difficulties. |
| c) | Reduced settlement – a reduced lump sum payment may be accepted with the remaining balance written off. |
In addition to these forbearance strategies, the Group complies with insolvency solutions which are governed by relevant regulations and codes of practice. Insolvency solutions are not considered forbearance as they are not at the discretion of the Group but rather are complied with when applicable.
The accounts to which forbearance is applied are a small proportion of the total loan portfolio, with just over 1% by volume and just over 2% by value of accounts being in forbearance at 30 June 2012 (31 December 2011: less than 1% by volume, over 2% by value).
Finance Leases
Retail Banking enters into funding arrangements for the financing of motor vehicles using either Conditional Sale agreements or Restricted Use Personal Loans, with the former allowing title to the car to be retained until full payment is made. A deposit is taken on the majority of loans and repayment periods are linked to the depreciation curves of the vehicles. In products where the Group retains an interest in the residual value of the vehicle then industry standard valuations for the predicted value of the vehicle at the end of the agreement are employed to ensure that the collateral value is appropriate.
Finance leases – Non-performing loans and advances
30 June 2012 £m | 31 December 2011 £m | |||||||
Total finance leases non-performing loans and advances(1,2) -UK | 10 | 7 | ||||||
Total finance leases loans and advances to customers(2) | 1,919 | 1,760 | ||||||
| Total impairment loan loss allowances for finance leases loans and advances -UK | 42 | 36 | ||||||
| % | % | |||||||
| Non-performing loans as a % of finance leases loans and advances to customers | 0.51 | 0.39 | ||||||
Coverage ratio(3)(4) | 426 | 532 | ||||||
| (1) | Finance leases are classified as non-performing when the counterparty fails to make a payment when contractually due for three months or longer. |
| (2) | Accrued interest is excluded for purposes of these analyses. |
| (3) | Impairment loan loss allowances as a percentage of non-performing loans and advances. |
| (4) | The coverage ratio as recognised across the industry is based on the total impairment loan loss allowances relative to the stock of NPLs. Total loan loss allowances will relate to early arrears as well as performing assets and hence, the ratio exceeds 100%. |
During the first half of 2012, finance leases non-performing loans and advances as a percentage of the finance leases loans and advances to customers increased to 0.51% (31 December 2011: 0.39%) as a result of a new definition applied that includes certain accounts less than 3 months in arrears such as fraud, insolvency and deceased. The coverage ratio decreased to 426% (31 December 2011: 532%) due to higher levels of NPLs due to the new arrears definition.
Finance leases - forbearance
There is no significant forbearance activity within the finance lease business.
Impairment losses on loans and advances to customers
The Group’s impairment loss allowances policy for retail assets is set out in Note 1 of the Group’s 2011 Annual Report.
Retail Banking analysis of impairment loss allowances on loans and advances to customers
An analysis of the Retail Banking impairment loss allowances on loans and advances to customers is presented below.
30 June 2012 £m | 31 December 2011 £m | |||||||
| Observed impairment loss allowances | ||||||||
| Advances secured on residential properties - UK | 404 | 381 | ||||||
| Finance leases - UK | 6 | 6 | ||||||
| Unsecured advances - UK | 275 | 330 | ||||||
Total observed impairment loss allowances (1) | 685 | 717 | ||||||
| Incurred but not yet observed impairment loss allowances | ||||||||
| Advances secured on residential properties - UK | 98 | 97 | ||||||
| Finance leases - UK | 35 | 30 | ||||||
| Unsecured advances - UK | 173 | 179 | ||||||
| Total incurred but not yet observed impairment loss allowances | 306 | 306 | ||||||
| Total impairment loss allowances | 991 | 1,023 | ||||||
| (1) | The Observed Impairment loss allowance consists of the required level of provisioning on accounts in early arrears as well as NPLs and hence the total can be higher than the absolute value of NPLs. |
Retail Banking movements in impairment loss allowances on loans and advances
An analysis of movements in the Retail Banking impairment loss allowances on loans and advances is presented below.
Six months ended 30 June 2012 £m | 12 months ended 31 December 2011 £m | |||||||
| Impairment loss allowances at 1 January | 1,023 | 1,181 | ||||||
| Amounts written off | ||||||||
| Advances secured on residential properties - UK | (36 | ) | (92 | ) | ||||
| Finance leases - UK | (7 | ) | (9 | ) | ||||
| Unsecured advances - UK | (249 | ) | (458 | ) | ||||
| Total amounts written off | (292 | ) | (559 | ) | ||||
| Observed impairment losses charged against profit | ||||||||
| Advances secured on residential properties - UK | 59 | 104 | ||||||
| Finance leases - UK | 7 | 14 | ||||||
| Unsecured advances - UK | 194 | 407 | ||||||
| Total observed impairment losses charged against profit | 260 | 525 | ||||||
| Incurred but not yet observed impairment losses charged against profit | — | (124 | ) | |||||
| Total impairment losses charged against profit | 260 | 401 | ||||||
| Impairment loss allowances at 30 June/31 December | 991 | 1,023 | ||||||
Retail Banking recoveries
An analysis of the Retail Banking recoveries is presented below.
Six months ended 30 June 2012 £m | 12 months ended 31 December 2011 £m | |||||||
| Advances secured on residential properties - UK | 2 | 3 | ||||||
| Finance leases - UK | 1 | 3 | ||||||
| Unsecured advances - UK | 23 | 56 | ||||||
| Total amount recovered | 26 | 62 | ||||||
Retail Banking non-performing loans and advances (1,3)
An analysis of Retail Banking’s non-performing loans and advances is presented below.
30 June 2012 £m | 31 December 2011 £m | |||||||
Retail Banking non-performing loans and advances that are impaired(2) | 737 | 834 | ||||||
| Retail Banking non-performing loans and advances that are not impaired | 2,000 | 1,809 | ||||||
Total Retail Banking non-performing loans and advances(3,4) | 2,737 | 2,643 | ||||||
Total Retail Banking loans and advances to customers(4) | 172,230 | 175,416 | ||||||
| Total Retail Banking impairment loan loss allowances | 991 | 1,023 | ||||||
| % | % | |||||||
| Non-performing loans and advances as a % of customers assets | 1.59 | 1.51 | ||||||
Coverage ratio(5) | 36 | 39 | ||||||
| (1) | Loans and advances are classified as non-performing typically when the counterparty fails to make payments when contractually due for three months. |
| (2) | Non-performing loans against which an impairment loss allowance has been established. |
| (3) | All non-performing loans are UK and continue accruing interest. |
| (4) | Excludes accrued interest. |
| (5) | Impairment loan loss allowances as a percentage of non-performing loans and advances. |
During the first half of 2012, non-performing loans and advances as a percentage of loans and advances to customers increased to 1.59% (31 December 2011: 1.51%). The increase in NPL ratio was mainly due to a change in residential mortgages collections policy implemented in late 2011 that holds more accounts in NPL for longer. The unsecured and credit card books have lower levels of NPLs reflecting the good quality of the books.
Impairment loss allowances reduced slightly to £991m (31 December 2011: £1,023m). The coverage ratio decreased to 36% (31 December 2011: 39%) due to lower impairment loss allowances, offset slightly by the increase in non-performing loans and advances, whilst maintaining the mortgage coverage ratio stable at 20%.
Interest income recognised on impaired loans amounted to £43m in the first half of 2012 (2011: £63m).
Retail Banking restructured loans
As described above, loans have been restructured or renegotiated by capitalising the arrears on the customer’s account, as a result of a revised payment arrangement (i.e. adherence to a repayment plan over a specified period) or a refinancing (either a term extension or an interest only concession). The value of capitalised arrears on these loans during the first half of 2012 was £2m (2011: £7m).
The table below shows Retail Banking’s loans not included in non-performing loans that have been restructured or renegotiated by capitalising the arrears.
30 June 2012 £m | 31 December 2011 £m | |||||||
Restructured loans(1) | 277 | 612 | ||||||
| (1) | Loans are included within the period/year that they were restructured. |
At 30 June 2012, the carrying amount of financial assets that would otherwise be past due or impaired whose terms have been renegotiated was £2,225m (31 December 2011: £1,784m).
CREDIT RISK - CORPORATE BANKING
Definition
Credit risk is the risk of financial loss arising from the default of a customer or counterparty to which the Group has directly provided credit, or for which the Group has assumed a financial obligation, after realising collateral held. Credit risk arises by Corporate Banking making loans, investing in other financial instruments or entering into financing transactions or derivatives.
MANAGING CREDIT RISK
Corporate Banking aims to minimise and control credit risk. The Board has approved a set of risk appetite limits to cover different types of risk, including credit risk, arising in Corporate Banking. The Group’s credit risk appetite is measured and controlled by a maximum Economic Capital value, which is defined as the maximum level of unexpected loss that the Group is willing to sustain over a one-year period. Within these limits, credit policies are approved to cover detailed industry, sector and product limits. All transactions falling within these policies are accommodated under credit limits approved by the appropriate credit authority. Specific approval is usually required by the Credit Approvals Committee (‘CAC’) for any transaction that falls outside the policies. Transactions or exposures above the authority limit for the CAC will be referred to the relevant approval authorities in Banco Santander, S.A. and the Executive Risk Committee. The Credit Risk Department is responsible for controlling credit risk in the portfolios.
Analysis of credit exposures and credit risk trends are provided each month to business risk fora, with key issues escalated to the Executive Risk Committee as appropriate. Large Exposures (as defined by the UK Financial Services Authority) are reported quarterly to the Executive Risk Committee and the UK Financial Services Authority. Credit risk on derivative instruments is calculated using the potential future mark-to-market exposure of the instruments at a 97.5% statistical confidence level and adding this value to the current value. The resulting “loan equivalent” or credit risk is then included against credit limits, along with other non-derivative exposures. In addition, there is a policy framework to enable the collateralisation of derivative instruments including swaps. If collateral is deemed necessary to reduce credit risk, any unsecured risk threshold, and the nature of any collateral to be accepted, is determined by management’s credit evaluation of the counterparty.
Corporate Banking is an area where the Group aims to achieve controlled growth, mainly through the expansion of a regional business centre network supporting lending to the Large Corporate, SME and Real Estate sectors. Focus is continuing to be given to the control of credit risks within this expansion based on robust Credit Policies and models covering both risk appetite and ratings.
CORPORATE BANKING ASSETS
30 June 2012 £bn | 31 December 2011 £bn | 30 June 2011 £bn | ||||||||||
| Large Corporate | 3.4 | 4.3 | 4.5 | |||||||||
| Large Corporate - repos | 16.7 | 10.4 | 8.1 | |||||||||
| Sovereign | 5.4 | 7.7 | 16.8 | |||||||||
| Structured Finance | 0.4 | 0.5 | 0.5 | |||||||||
Mid Corporate & SME(1) | 9.5 | 8.7 | 7.7 | |||||||||
Social housing(2) | 0.1 | — | — | |||||||||
Real estate(1) | 3.9 | 3.9 | 3.5 | |||||||||
Other(1)(3) | 2.8 | 2.6 | 2.3 | |||||||||
Total (4) | 42.2 | 38.1 | 43.4 | |||||||||
| (1) | Includes corporate loans classified as Loans and advances to customers. |
| (2) | Includes loans held at amortised cost. |
| (3) | Includes finance leases classified as Loans and advances to customers and operating lease assets |
| (4) | Excluding provisions |
In Corporate Banking, credit risk arises on assets and off-balance sheet transactions. Consequently, the credit risk exposure below arises from on balance sheet assets, and off-balance sheet transactions such as committed and undrawn credit facilities or guarantees. Credit risk exposures are stated net of short positions. The following tables provide additional information on commitments relating to customers only.
CORPORATE BANKING CUSTOMER COMMITMENTS
30 June 2012 £bn | 31 December 2011 £bn | |||||||
| Large Corporate | 7.6 | 8.5 | ||||||
| Sovereign | 4.6 | 7.8 | ||||||
| Structured Finance | 0.4 | 0.5 | ||||||
Mid Corporate & SME (1) | 12.7 | 11.7 | ||||||
| Social housing | 0.3 | — | ||||||
Real estate (1) | 8.9 | 8.7 | ||||||
| Total | 34.5 | 37.2 | ||||||
| (1) | In this table commercial mortgages arise within both SME and Real Estate, which reflects the type of risk being monitored, whereas in the table above they are included solely within SME to reflect the status of the borrower. |
Corporate Banking committed facilities by credit rating of the issuer or counterparty(1)(2)
30 June 2012 | Sovereign £m | Large Corporate £m | Structured Finance £m | Mid Corporate and SME £m | Real Estate £m | Social Housing £m | Total £m | |||||||||||||||||||||
| AAA | 2,863 | 188 | — | 57 | 201 | — | 3,309 | |||||||||||||||||||||
| AA | 1,700 | 330 | 21 | 133 | — | 11 | 2,195 | |||||||||||||||||||||
| A | 57 | 2,368 | — | 1,076 | 1,148 | 180 | 4,829 | |||||||||||||||||||||
| BBB | — | 4,462 | 48 | 4,852 | 3,533 | 115 | 13,010 | |||||||||||||||||||||
| BB | — | 269 | 190 | 3,550 | 2,916 | — | 6,925 | |||||||||||||||||||||
| B | — | — | 55 | 172 | 59 | — | 286 | |||||||||||||||||||||
| CCC | — | — | 104 | 39 | 19 | — | 162 | |||||||||||||||||||||
| D | — | — | — | 111 | 464 | — | 575 | |||||||||||||||||||||
Other(3) | — | — | — | 2,674 | 515 | — | 3,189 | |||||||||||||||||||||
Total (4) | 4,620 | 7,617 | 418 | 12,664 | 8,855 | 306 | 34,480 | |||||||||||||||||||||
31 December 2011 | Sovereign £m | Large Corporate £m | Structured Finance £m | Mid Corporate and SME £m | Real Estate £m | Social Housing £m | Total £m | |||||||||||||||||||||
| AAA | 6,965 | 63 | — | 42 | — | — | 7,070 | |||||||||||||||||||||
| AA | 819 | 511 | 25 | 147 | 219 | — | 1,721 | |||||||||||||||||||||
| A | 25 | 3,045 | — | 1,063 | 1,395 | — | 5,528 | |||||||||||||||||||||
| BBB | — | 4,770 | 83 | 4,608 | 2,904 | — | 12,365 | |||||||||||||||||||||
| BB | — | 108 | 276 | 2,989 | 3,088 | — | 6,461 | |||||||||||||||||||||
| B | — | — | 105 | 125 | 176 | — | 406 | |||||||||||||||||||||
| CCC | — | — | — | 24 | 23 | — | 47 | |||||||||||||||||||||
| D | — | — | — | 136 | 284 | — | 420 | |||||||||||||||||||||
Other(3) | — | — | — | 2,631 | 563 | — | 3,194 | |||||||||||||||||||||
Total (4) | 7,809 | 8,497 | 489 | 11,765 | 8,652 | — | 37,212 | |||||||||||||||||||||
| (1) | The committed facilities exposure includes OTC derivatives. |
| (2) | All exposures are internally rated. External ratings are taken into consideration in the rating process, where available. |
| (3) | Individual exposures of £1m or less. |
| (4) | Of the total exposure £2,136m (31 December 2011: £2,093m) are off-balance sheet transactions. Large Corporates represent 49% of this with the remaining 51% occurring in the Mid Corporate and Real Estate portfolios. |
Corporate Banking committed facilities by geographical area (1)
| 30 June 2012 | Sovereign £m | Large Corporate £m | Structured Finance £m | Mid Corporate and SME £m | Real Estate £m | Social Housing £m | Total £m | |||||||||||||||||||||
| UK | 2,455 | 5,993 | 202 | 12,292 | 8,855 | 306 | 30,103 | |||||||||||||||||||||
| Rest of Europe | 462 | 923 | 106 | 127 | — | — | 1,618 | |||||||||||||||||||||
| US | — | 580 | 89 | — | — | — | 669 | |||||||||||||||||||||
| Other, including non-OECD | 1,703 | 121 | 21 | 245 | — | — | 2,090 | |||||||||||||||||||||
| Total | 4,620 | 7,617 | 418 | 12,664 | 8,855 | 306 | 34,480 | |||||||||||||||||||||
| 31 December 2011 | Sovereign £m | Large Corporate £m | Structured Finance £m | Mid Corporate and SME £m | Real Estate £m | Social Housing £m | Total £m | |||||||||||||||||||||
| UK | 5,477 | 5,946 | 233 | 11,405 | 8,652 | — | 31,713 | |||||||||||||||||||||
| Rest of Europe | 1,591 | 1,536 | 144 | 108 | — | — | 3,379 | |||||||||||||||||||||
| US | — | 576 | 112 | 1 | — | — | 689 | |||||||||||||||||||||
| Other, including non-OECD | 741 | 439 | — | 251 | — | — | 1,431 | |||||||||||||||||||||
| Total | 7,809 | 8,497 | 489 | 11,765 | 8,652 | — | 37,212 | |||||||||||||||||||||
| (1) | The geographic location is classified by country of domicile of the counterparty. |
The increases in Mid Corporate and SME, and Real Estate exposures in the first half of 2012 arose from the continued development of a UK corporate banking franchise and were offset by a reduction in the sovereign and large corporate exposures. The decrease in sovereign exposures principally reflected changes in holdings of UK and Organisation of Economic Co-operation and Development (‘OECD’) government securities as part of the Group’s liquidity management activity. The older social housing portfolio has transferred to Corporate Centre with only new business written in 2012 remaining in Corporate Banking.
Credit risk mitigation
Collateralisation
Santander UK provides a range of banking services to UK companies via a broad range of banking products including loans, bank accounts, deposits, treasury services, asset finance, cash transmission, trade finance and invoice discounting.
Corporate Banking lends to these different types of business after undertaking a credit risk assessment of the borrower, including consideration of the customer’s capacity to repay, and an assessment, where collateral is taken, of its likely realisable value. At 30 June 2012, the Group held collateral against impaired corporate loans amounting to 42% (31 December 2011: 49%) of the carrying amount of impaired loan balances.
a) Sovereigns
Assets held with Sovereign counterparties are mainly with issuers or counterparties with a AAA rating. It is normal market practice that there is no collateral associated with these financial assets.
b) Large Corporates
The Large Corporate portfolio is primarily unsecured but credit agreements are underpinned by both financial and non-financial covenants. Typically for this type of business the initial, and ongoing, lending decision is based upon factors relating to the financial strength of the client, its position within its industry, its management strengths and other factors as evaluated by the specialised analyst assigned to each customer.
There is also a small number of acquisition or project finance transactions with a total value at 30 June 2012 of £310m (31 December 2011: £292m) where collateral is held in the form of a charge over the assets being acquired. This type of assignment of all assets is combined with other covenants to provide security to the lenders.
c) Mid Corporate and SME
The Mid Corporate and SME portfolio typically incorporates guarantee structures underpinned by both financial and non-financial covenants and debenture security. Typically for this type of business these guarantees are not classified as collateral and value is not attributed to them unless supported by tangible security. Lending decisions to these businesses are assessed against trading cash flows and the financial strength of the client and in the event of a default the Group does not typically take possession of the assets of the business, although an Administrator may be appointed in more severe cases.
In addition the portfolio includes commercial mortgage lending where collateral is taken in the form of a charge over the property being mortgaged. A professional valuation of the real estate security is undertaken at the point of lending but no contractual right of revaluation exists. However, revaluations are undertaken in the event that cases become distressed. Collateral is rarely taken into possession. The Group seeks to ensure the disposal of the collateral, either consensually or via an insolvency process, as early as practical in order to minimise the loss to the Group.
The Group also provides asset finance as well as invoice finance to certain UK corporate clients. The assets financed (typically vehicles, and equipment) are reviewed prior to lending and their value assessed. In the case of invoice finance, the companies’ ledgers are subject to periodic reviews with funding provided against eligible debtors meeting pre-agreed criteria. In the event of a default, these assets will be repossessed and sold, or debtors collected out respectively.
d) Social Housing
The Social Housing portfolio is secured on residential real estate owned and let by UK Housing Associations. This collateral is revalued at least every five years and the valuation is based on standard housing methodologies, which generally involve the properties’ continued use as social housing, if the valuation were based upon normal residential use the value would be considerably higher. To date, Santander UK has suffered no defaults or losses on this type of lending and has not had to take possession of any collateral.
e) Real Estate
In the real estate portfolio, collateral is in the form of commercial real estate assets. Lending to commercial real estate is undertaken against an approved policy setting minimum criteria including such aspects as the quality (e.g. condition and age) and location of the property, the quality of the tenant, the terms and length of the lease, and the experience and creditworthiness of the sponsors. Properties are viewed by the Group prior to lending and annually thereafter. An independent professional valuation is obtained prior to lending, providing both a value and an assessment of the property, the tenant and future demand for the property (e.g. market rent compared to the current rent). Loan agreements typically permit bi-annual valuations thereafter or more frequently if it is likely that the covenants may be breached.
When a commercial real estate loan is transferred to FEVE or Workouts & Collections, the Group typically undertakes a revaluation of the collateral as part of the process for determining the strategy to be pursued (e.g. whether to restructure the loan or to realise the collateral). An assessment is made of the need to establish an impairment loss allowance based on the valuation in relation to the loan amount outstanding while also taking into consideration any loan restructuring solution to be adopted (e.g. whether provision of additional security or guarantees is available, the prospects of additional equity and the ability to enhance value through asset management initiatives etc.).
Collateral is rarely taken into possession. Where collateral has been taken into possession, the Group would seek to dispose of the collateral as early as practical in order to minimise the loss to the Group.
Corporate Banking – Watchlist
In order to ensure adequate credit quality control the Group monitors exposures within these portfolios through an ongoing process of observation to enable early detection of any incidents that might arise in the evolution of the risk, the transactions, the customers and their environment, with a view to implement mitigating actions.
Summaries of the watchlist and workout cases at 30 June 2012 and 31 December 2011 by portfolio and assessment of risk are:
| Impairment loss allowances | ||||||||||||||||||||||||||||||||||||||||||||
| 30 June 2012 | Portfolio £m | Enhanced Monitoring £m | Enhanced Monitoring % | Pro- active £m | Pro- active % | Workout £m | Workout % | NPL(1) £m | NPL % | Observed £m | IBNO £m | |||||||||||||||||||||||||||||||||
| Large Corporates (including Sovereign) | 12,237 | 90 | 0.7 | 46 | 0.4 | — | — | — | — | — | — | |||||||||||||||||||||||||||||||||
| Structured Finance | 418 | 95 | 22.7 | 196 | 46.9 | 33 | 7.9 | — | — | 17 | — | |||||||||||||||||||||||||||||||||
| Mid Corporate and SME | 12,664 | 851 | 6.7 | 264 | 2.1 | 488 | 3.9 | 342 | 2.7 | 88 | 56 | |||||||||||||||||||||||||||||||||
| Real Estate | 8,855 | 420 | 4.7 | 416 | 4.7 | 587 | 6.6 | 461 | 5.2 | 157 | 19 | |||||||||||||||||||||||||||||||||
| Social Housing (Core) | 306 | — | — | — | — | — | — | — | — | — | — | |||||||||||||||||||||||||||||||||
| Total | 34,480 | 1,456 | 4.2 | 922 | 2.7 | 1,108 | 3.2 | 803 | 2.3 | 262 | 75 | |||||||||||||||||||||||||||||||||
| Impairment loss allowances | ||||||||||||||||||||||||||||||||||||||||||||
| 31 December 2011 | Portfolio £m | Enhanced Monitoring £m | Enhanced Monitoring % | Pro- active £m | Pro- active % | Workout £m | Workout % | NPL(1) £m | NPL % | Observed £m | IBNO £m | |||||||||||||||||||||||||||||||||
| Large Corporates (including Sovereign) | 16,306 | 87 | 0.5 | 29 | 0.2 | — | — | — | — | — | — | |||||||||||||||||||||||||||||||||
| Structured Finance | 489 | 152 | 31.1 | 144 | 29.4 | — | — | — | — | 17 | — | |||||||||||||||||||||||||||||||||
| Mid Corporate and SME | 11,765 | 531 | 4.5 | 300 | 2.5 | 287 | 2.4 | 272 | 2.3 | 63 | 53 | |||||||||||||||||||||||||||||||||
| Real Estate | 8,652 | 243 | 2.8 | 401 | 4.6 | 573 | 6.6 | 497 | 5.7 | 143 | 22 | |||||||||||||||||||||||||||||||||
| Social Housing (Core) | — | — | — | — | — | — | — | — | — | — | — | |||||||||||||||||||||||||||||||||
| Total | 37,212 | 1,013 | 2.7 | 874 | 2.3 | 860 | 2.3 | 769 | 2.1 | 223 | 75 | |||||||||||||||||||||||||||||||||
(1) Includes committed facilities and swaps.
Exposures are classified as ‘workout’ if they are non-performing loans or have been passed to the Risk Division for intensive management. Exposures are classified as ‘proactive’ if they are included in the three categories (extinguish, secure and reduce) being actively managed. Exposures are classified as ‘enhanced monitoring’ where they are subject to more intense and frequent monitoring. These are described in ‘Risk monitoring and control’ above. Non-performing loans are discussed in ‘Corporate Banking non-performing loans and advances’ below.
There are a range of indicators that may trigger a case being added to FEVE, including downturn in trade, covenant breaches, major contract loss, and resignation of key management. Such cases are assessed to determine the potential financial implications of these trigger events and in consultation with the borrower, the range of options available is considered which may include some form of forbearance.
In the first half of 2012, assets classified as ‘enhanced monitoring’ increased due to the impact of the challenging economic environment especially within the Mid Corporate and SME portfolios as well as the transfer of cases back from ‘proactive’. Assets classified as ‘proactive’ were relatively stable as a result of the successful execution of manage-down strategies together with cases moving to ‘workouts’ offsetting new cases. Assets classified as ‘workout’ increased as cases worked through from ‘proactive’ in the light of the more challenging environment, limiting the ability of clients to achieve turnaround in their prospects unaided. Assets classified as ‘NPL’ increased modestly, which reflected the challenging environment seen, especially in the UK care and leisure sector within the Mid Corporate and SME portfolio.
Corporate Banking arrears
30 June 2012 £m | 31 December 2011 £m | |||||||
| Total Corporate Banking loans and advances to customers in arrears | 585 | 551 | ||||||
Total Corporate Banking loans and advances to customers(1) | 19,117 | 18,949 | ||||||
| Corporate Banking loans and advances to customers in arrears as a % of Corporate Banking loans and advances to customers | 3.06 | % | 2.91 | % | ||||
| (1) | Corporate Banking loans and advances to customers include social housing loans and finance leases. |
| (2) | Accrued interest is excluded for purposes of these analyses. |
In the first half of 2012, loans and advances to customers in arrears increased to £585m (31 December 2011: £551m) due to ongoing stress in the SME portfolio, particularly within the care home and leisure industry sectors. Loans and advances to customers in arrears as a percentage of loans and advances to customers increased to 3.06% (31 December 2011: 2.91%) as a result of the increased arrears as described above.
Corporate Banking – restructuring (a form of forbearance)
Restructurings (a form of forbearance) allow a customer by negotiation to vary the amount of their contractual payments for an agreed period (such as interest-only period or term extensions). During the period of forbearance, arrears management activity continues with the aim to rehabilitate accounts. When customers come to the end of their arrangement period they will either be returned to the performing portfolio if they are able to resume agreed payment terms or continue to be managed as a mainstream workout or collections case, which may include the use of other restructuring or collections options.
Corporate Banking – arrears management
The Workouts & Collections department, as well as credit partners, are responsible for debt management initiatives on the Corporate Banking loan portfolio. Debt management strategies, including negotiation of restructuring or repayment arrangements and concessions, often commence prior to actual payment default. Different collection strategies are applied to different segments of the portfolio subject to the perceived levels of risk and the individual circumstances of each case.
Workouts & Collections activities exist to ensure customers who have failed or are likely to fail to make their contractual payments when due or have exceeded their agreed credit limits are encouraged to pay back the required amounts, and in the event they are unable to do so to pursue recovery of the debt in order to maximise the net recovered balance.
The overall aim is to minimise losses by helping customers to repay their debt in a timely but affordable and sustainable manner whilst not adversely affecting brand, customer loyalty, fee income, or compliance with relevant legal and regulatory standards.
Problem debt management activity is performed within Santander UK:
| > | Initially by the relationship manager and, for non standardised cases, the credit partner, and for standardised cases, the Business Support Unit and; |
| > | Subsequently by Workouts & Collections where the circumstances of the case become more acute or specialist expertise is required. |
Santander UK seeks to detect weakening financial performance early through close monitoring of regular financial and trading information, periodic testing to ensure compliance with both financial and non-financial covenants and regular dialogue with corporate clients.
The FEVE process is used proactively on cases which need enhanced management activity ranging from increased frequency and intensity of monitoring through to more specific activities to reduce the Group’s exposure, enhance the Group’s security or in some cases seek to exit the position altogether.
Once categorised as FEVE, a strategy is agreed with Credit Risk and this is monitored through monthly FEVE meetings for each portfolio. Where circumstances dictate a more dedicated debt management expertise is required or where the case has been categorised as non-performing (be that through payment arrears or through management judgement that a payment default is likely), the case is transferred to Workouts & Collections.
Corporate loans restructured
Loans may be restructured by following strategies that are bespoke to each individual case and achieved through negotiation with the customer. The aim of agreeing to a restructuring with a customer is to bring the Group’s exposure back within acceptable risk levels by negotiating suitable revised terms, conditions and pricing, including reducing the amount of the outstanding debt or increasing the amount of collateral provided to the Group. The Group seeks to retain the customer relationship where possible, provided the Group’s risk position is not unduly compromised. Loans are considered to be a “refinancing” if non-performing at the time of the restructuring and a “renegotiation” if in early arrears or up to date at the point of restructure.
Solutions in a restructuring, whether a refinancing or renegotiation, may include:
| > | Term Extensions - the term of the credit facility may be extended to reduce the regular periodic repayments, and where as a minimum, the interest can be serviced and there is a realistic prospect of full or improved recoveries in the foreseeable future. Customers may be offered a term extension where they are up-to-date but showing evidence of financial difficulties, or where the maturity of the loan is about to fall due and near term refinancing is not possible on current market terms. |
| > | Interest Only Concessions – the regular periodic repayment may be reduced to interest payment only for a limited period with capital repayment deferred where other options, such as a term extension, are not appropriate. Customers may be offered an interest only concession where they are up-to-date but showing evidence of financial difficulties, or are already in the Workouts & Collections process. Periodic reviews of the customer financial situation are undertaken to assess when the customer can afford to return to the repayment method. |
| The Group may offer a term extension or interest only concession provided that the forecasts indicate that the borrower will be able to meet the revised payment arrangements. Restructures will typically also involve revised and reset loan covenants. | |
The table below also includes debt-for-equity swaps where, on occasion, the Group may agree to exchange a proportion of the amount owed by the borrower for equity in that borrower. In circumstances where a borrower’s balance sheet is materially over-leveraged but the underlying business is viewed as capable of being turned around, the Group may agree to reduce the debt by exchanging a portion of it for equity in the company. This will typically only be done alongside new cash equity being raised, the implementation of a detailed business plan to effect a turnaround in the prospects of the business, and satisfaction with management’s ability to deliver the strategy.
The incidence of the main types of restructures above at 30 June 2012 and 31 December 2011 was:
| 30 June 2012 | 31 December 2011 | |||||||||||||||
| £m | % | £m | % | |||||||||||||
| Refinancing | 264 | 17 | 306 | 20 | ||||||||||||
| Renegotiations | 1,253 | 80 | 1,146 | 77 | ||||||||||||
| Debt-for-equity swaps | 46 | 3 | 48 | 3 | ||||||||||||
| 1,563 | 100 | 1,500 | 100 | |||||||||||||
Within the total portfolio above, the incidence of the main types of restructures applied to Commercial Real Estate loans were:
| 30 June 2012 | 31 December 2011 | |||||||||||||||
| £m | % | £m | % | |||||||||||||
| Refinancing | 85 | 14 | 132 | 22 | ||||||||||||
| Renegotiations | 520 | 84 | 467 | 76 | ||||||||||||
| Debt-for-equity swaps | 12 | 2 | 12 | 2 | ||||||||||||
| 617 | 100 | 611 | 100 | |||||||||||||
In the first half of 2012, the level of restructures increased by £63m. The level of refinanced deals (i.e. of cases in NPL at the point of restructure) decreased which reflected a number of cases being successfully repaid. The level of renegotiations however rose over the period as a result of the challenging economic environment and the earlier recognition of the need to restructure cases before payment difficulties were experienced. The level of debt-for-equity swaps remained modest and stable.
In Commercial Real Estate the overall level of restructured cases was stable with successful exits offsetting new cases. This sub portfolio is following a similar pattern to the wider portfolio of higher renegotiations versus refinancing.
Where a refinancing has been agreed, the case is initially retained in the ‘non-performing’ loan category, until evidence of consistent compliance with the new terms is demonstrated (typically a minimum of three months) before being reclassified as ‘substandard’.
For renegotiations, the case is reclassified to substandard. Once a substandard case has demonstrated continued compliance with the new terms and the risk profile is deemed to have improved, it may be reclassified as ‘performing’. Under the Group’s restructuring methodology, a case will remain as a restructured asset until full repayment is made even when full payments are recommenced.
The majority of corporate loan restructurings to date have been by way of term extensions and payment re-profiling (e.g. interest only concessions), with only a limited number of debt for equity swaps. Loan loss allowances are assessed on a case-by-case basis taking into account amongst other factors, the value of collateral held as confirmed by third party professional valuations as well as the cash flow available to service debt over the period of the restructuring. These loan loss allowances are assessed regularly and are independently reviewed both at quarterly provision review forum, as well as by the Internal Audit function. In the case of a debt for equity conversion, the converted debt is written off against the existing loan loss allowance upon completion of the restructuring. The value of the equity acquired is initially held at nil value and reassessed periodically in light of subsequent performance of the restructured company.
Other forms of debt management
In addition to the restructurings and debt-for-equity swaps, the Group also uses other forms of debt management which can include:
| > | Provision of additional security or guarantees – Where a borrower has unencumbered assets, these may be charged as new or additional security in return for the Group restructuring existing facilities. Alternatively, the Group may take a guarantee from other companies within the borrower’s group and/or major shareholders provided it can be established the proposed guarantor has the resources to support such a commitment. |
| > | Resetting of covenants and trapping surplus cash flow – Financial covenants may be reset at levels which more accurately reflect the current and forecast trading position of the borrower. This may also be accompanied by a requirement for all surplus cash after operating costs to be trapped and used in reduction of the Group’s lending. |
| > | Seeking additional equity – Where a business is over-leveraged, fresh equity capital will be sought from existing or new investors to adjust the capital structure in conjunction with the Group agreeing to restructure the residual debt. |
Exit the position consensually
Where it is not possible to agree a restructuring, the Group may seek to exit the position consensually by:
| > | Agreeing with the borrower an orderly sale of the business or assets outside insolvency to pay down the Group’s debt; |
| > | Arranging for the refinance of the debt with another lender; or |
| > | Sale of the debt where a secondary market exists (either individual loans or on occasion as a portfolio sale). |
Litigation and recovery
Where it is not possible to agree a restructuring or to exit the position consensually, the Group will pursue recovery by:
| > | Pursuing its rights through an insolvency process; |
| > | Optimising the sale proceeds of any collateral held; and |
| > | Seeking compensation from third parties, as appropriate. |
Where the Group has to pursue recovery through the appointment of an Administrator (or a Receiver under the Law of Property Act in the case of real estate security), the Group’s shortfall is assessed against the Administrator’s estimate of the outcome and an appropriate loan loss allowance is raised. In cases where a sale of the debt is deemed to offer the optimum recovery outcome, the shortfall, if the debt is sold below its par value, is written off upon sale.
Impairment losses on loans and advances to customers
The Group’s impairment loss allowances policy for corporate assets is set out in Note 1 of the Group’s 2011 Annual Report.
Corporate Banking analysis of impairment loss allowances on loans and advances to customers
An analysis of the Corporate Banking impairment loss allowances on loans and advances to customers is presented below.
30 June 2012 £m | 31 December 2011 £m | |||||||
| Observed impairment loss allowances | ||||||||
| Corporate loans – UK | 222 | 194 | ||||||
| Finance leases – UK | — | — | ||||||
| Other secured advances - UK | 42 | 32 | ||||||
| Total observed impairment loss allowances | 264 | 226 | ||||||
| Incurred but not yet observed impairment loss allowances | ||||||||
| Corporate loans - UK | 69 | 65 | ||||||
| Finance leases – UK | 1 | 1 | ||||||
| Other secured advances - UK | 9 | 9 | ||||||
| Total incurred but not yet observed impairment loss allowances | 79 | 75 | ||||||
| Total impairment loss allowances | 343 | 301 | ||||||
Corporate Banking movements in impairment loss allowances on loans and advances
An analysis of movements in the Corporate Banking impairment loss allowances on loans and advances is presented below.
Six months ended 30 June 2012 £m | 12 months ended 31 December 2011 £m | |||||||
| Impairment loss allowances at 1 January | 301 | 209 | ||||||
| Amounts written off: | ||||||||
| Corporate loans - UK | (17 | ) | (54 | ) | ||||
| Finance leases - UK | — | — | ||||||
| Other secured advances - UK | (4 | ) | (3 | ) | ||||
| Total amounts written off | (21 | ) | (57 | ) | ||||
| Observed impairment losses charged against profit: | ||||||||
| Corporate loans - UK | 44 | 135 | ||||||
| Finance leases - UK | — | — | ||||||
| Other secured advances - UK | 15 | 21 | ||||||
| Total observed impairment losses charged against profit | 59 | 156 | ||||||
| Incurred but not yet observed impairment losses charged against/ (released into) profit | 4 | (7 | ) | |||||
| Total impairment losses charged against profit | 63 | 149 | ||||||
| Impairment loss allowances at 30 June/31 December | 343 | 301 | ||||||
Corporate Banking recoveries
An analysis of Corporate Banking recoveries is presented below.
Six months ended 30 June 2012 £m | 12 months ended 31 December 2011 £m | |||||||
| Corporate loans - UK | — | 2 | ||||||
| Finance Leases - UK | 1 | — | ||||||
| Other secured advances - UK | 1 | 4 | ||||||
| Total amount recovered | 2 | 6 | ||||||
Corporate Banking non-performing loans and advances(1)
An analysis of Corporate Banking’s non-performing loans and advances is presented below.
30 June 2012 £m | 31 December 2011 £m | |||||||
| Corporate Banking non-performing loans and advances that are impaired - UK | 475 | 449 | ||||||
| Corporate Banking non-performing loans and advances that are not impaired - UK | 303 | 305 | ||||||
Total Corporate Banking non-performing loans and advances(2) | 778 | 754 | ||||||
Total Corporate Banking loans and advances to customers(3) | 19,117 | 18,949 | ||||||
| Total Corporate Banking impairment loan loss allowances | 343 | 301 | ||||||
| % | % | |||||||
| Non-performing loans and advances as a % of loans and advances to customers | 4.07 | 3.98 | ||||||
Coverage ratio(4) | 44 | 40 | ||||||
| (1) | Loans and advances are classified as non-performing typically when the counterparty fails to make payments when contractually due for three months or where it is deemed unlikely that the counterparty will be able to maintain payments. |
| (2) | All non-performing loans continue accruing interest. |
| (3) | Corporate Banking loans and advances to customers include social housing loans and finance leases. |
| (4) | Accrued interest is excluded for purposes of these analyses. |
At 30 June 2012, non-performing loans and advances as a percentage of loans and advances to customers increased to 4.07% from 3.98% at 31 December 2011. This increase reflected the continuing challenges faced by corporate clients in the current economic conditions particularly in the care home sector and certain parts of the commercial real estate market. This was partially offset by several larger real estate loans moving out of non-performing status either via a full exit by way of a sale of the underlying collateral or the debt or a successful restructuring and return to performing status.
The level of new non-performing loans was broadly in line with expectations. The options available for managing them, particularly the ability to raise equity capital, to sell assets or to conclude refinancing, remained limited. The real estate market continued to be challenging with reduced sales activity, especially for development finance and land-bank transactions and for older transactions underwritten in near the market peak. The Group’s real estate development finance exposure represented less than 8% (31 December 2011: less than 8%) of the total core real estate book.
Interest income recognised on impaired loans amounted to £7m (2011: £4m).
Corporate Banking restructured loans
As described above, loans may be restructured or renegotiated. At 30 June 2012, the carrying amount of financial assets that would otherwise be past due or impaired whose terms have been renegotiated was £141m (31 December 2011: £130m). This includes assets managed within both Corporate Banking and Corporate Centre.
CREDIT RISK – MARKETS
The wholesale activities of the Group are undertaken by Markets and Corporate Centre. Each division is responsible for managing its on balance sheet credit exposures. Off balance sheet exposures (through derivatives, repos, reverse repos and stock borrow or stock lending contracts) entered into with Financial Institutions are managed under a single limit structure for each counterparty.
Definition
Credit risk is the risk of financial loss arising from the default of a customer or counterparty to which the Group has directly provided credit, or for which the Group has assumed a financial obligation, after realising collateral held. Credit risk arises by Markets making loans, investing in debt securities or other financial instruments or entering into financing transactions or derivative contracts.
MANAGING CREDIT RISK
Markets aims to actively manage and control credit risk. The Board has approved a set of risk appetite limits to cover different types of risk, including credit risk, arising in Markets. The Group’s credit risk appetite is measured and controlled by a maximum Economic Capital value, which is defined as the maximum level of unexpected loss that the Group is willing to sustain over a one-year period. Markets exposures, including intra-group items, are captured on the global risk management systems.
All transactions are accommodated under credit limits approved by the appropriate credit authority. For transactions that fall under Santander UK’s delegated authority, approval is required from the CAC or those individuals directly mandated by the CAC. Transactions or exposures above the authority limit for the CAC will be referred to the relevant approval authorities in Banco Santander, S.A. and the Executive Risk Committee. The Wholesale Credit Risk Department is responsible for controlling credit risk in Markets portfolios. Analysis of credit exposures and credit risk trends are provided each month to the Wholesale Risk Oversight and Control Forum with key issues escalated to the Executive Risk Committee as required. Large Exposures (as defined by the UK Financial Services Authority) are reported monthly to the Executive Risk Committee and quarterly to the UK Financial Services Authority.
MARKETS ASSETS
30 June 2012 £bn | 31 December 2011 £bn | |||||||
| Derivatives | 25.7 | 27.5 | ||||||
| UK Treasury bills, equities and other | 1.5 | 1.2 | ||||||
| Total | 27.2 | 28.7 | ||||||
Markets is a business focused on providing value added financial services to financial institutions (banks, insurance companies and funds) and corporates, as well as treasury products to the rest of Santander UK’s business (including Retail Banking and Corporate Banking).
In the first half of 2012 Markets continued to be active in the financial markets focusing its activities on derivative products (as analysed in the section on counterparty risk) while limiting direct lending to financial institutions.
Markets commitments by credit rating of the issuer or counterparty (1) (2) (3)
30 June 2012 | Sovereign £m | Credit £m | Derivatives £m | Total £m | ||||||||||||
| AAA | 171 | — | 25 | 196 | ||||||||||||
| AA | — | 2 | 311 | 313 | ||||||||||||
| A | 86 | 64 | 4,662 | 4,812 | ||||||||||||
| BBB and below | — | 6 | 304 | 310 | ||||||||||||
| Total | 257 | 72 | 5,302 | 5,631 | ||||||||||||
31 December 2011 | Sovereign £m | Credit £m | Derivatives £m | Total £m | ||||||||||||
| AAA | 71 | — | 26 | 97 | ||||||||||||
| AA | — | 2 | 1,572 | 1,574 | ||||||||||||
| A | — | 72 | 3,375 | 3,447 | ||||||||||||
| BBB and below | — | 1 | 259 | 260 | ||||||||||||
| Total | 71 | 75 | 5,232 | 5,378 | ||||||||||||
| (1) | External ratings are applied to all exposures where available. |
| (2) | Credit includes core financing facilities to insurance companies |
| (3) | Exposure to Sovereigns is incurred when entering into derivative contracts under market standard documentation |
Markets commitments by geographical area(1)
30 June 2012 | Sovereign £m | Credit £m | Derivatives £m | Total £m | ||||||||||||
| UK | 154 | 63 | 1,402 | 1,619 | ||||||||||||
| Rest of Europe | 17 | 8 | 2,236 | 2,261 | ||||||||||||
| US | — | 1 | 1,187 | 1,188 | ||||||||||||
| Rest of the world | 86 | — | 477 | 563 | ||||||||||||
| Total | 257 | 72 | 5,302 | 5,631 | ||||||||||||
31 December 2011 | Sovereign £m | Credit £m | Derivatives £m | Total £m | ||||||||||||
| UK | 34 | 66 | 1,196 | 1,296 | ||||||||||||
| Rest of Europe | 17 | 9 | 2,168 | 2,194 | ||||||||||||
| US | 20 | — | 1,460 | 1,480 | ||||||||||||
| Rest of the world | — | — | 408 | 408 | ||||||||||||
| Total | 71 | 75 | 5,232 | 5,378 | ||||||||||||
(1) The geographic location is classified by country of domicile of the counterparty.
Markets – Watchlist
In order to ensure adequate credit quality control, in addition to the tasks performed by the Internal Audit function, the Wholesale Credit Risk Department analysts monitor the exposures within their assigned portfolios through an ongoing process of observation to enable early detection of any incidents that might arise in the evolution of the risk, the transactions, the customers and their environment, with a view to implement mitigating actions.
For this purpose, the Wholesale Credit Risk Department follows the Group’s risk monitoring and control processes for FEVE, where risks are classified into four levels of monitoring, three of which are considered as ‘Proactive’ (through the implementation of actions that can be classified as extinguish, secure and reduce) and one of which is considered ‘enhanced monitoring’ (monitor). This is further explained in the ‘Credit risk cycle – Risk monitoring and control’ section above. Markets Banks and Financial Institutions exposures are managed at the Wholesale FEVE forum.
At 30 June 2012 and 31 December 2011, there were no significant impaired or non-performing loans or exposures. At 30 June 2012, assets in the Proactive category amounted to £33m (31 December 2011: £40m).
Restructured loans
At 30 June 2012 and 31 December 2011, there were no financial assets that would otherwise be past due or impaired whose terms have been renegotiated.
DERIVATIVES
Derivatives are financial instruments whose value is derived from the price of one or more underlying items such as equities, equity indices, interest rates, foreign exchange rates, property indices, commodities and credit spreads. Derivatives enable users to manage exposure to credit or market risks. The Group sells derivatives to its customers and uses derivatives to manage its own exposure to credit and market risks.
For details about the Group’s use of derivatives, trading derivatives and hedging derivatives, see Note 15 of the Group’s 2011 Annual Report.
Corporate Banking deals with commercial customers who wish to enter into derivative contracts. Any market risk arising from such transactions is hedged by Markets. Markets is responsible for implementing Group derivative hedging with the external market together with its own trading activities. For trading activities, its objectives are to gain value by:
| > | Marketing derivatives to end users and hedging the resulting exposures efficiently; and |
| > | The management of trading exposure reflected on the Group’s balance sheet. |
Markets – Derivatives
Credit risk on derivative instruments (OTC derivatives, repos and stock borrowing/lending) is taken under specific limits approved for each counterparty. This credit risk is controlled by the Wholesale Risk department, and managed and reported on a counterparty basis, regardless of whether the exposure is incurred by Markets or Corporate Centre.
Credit risk on derivative instruments is calculated using the potential future mark-to-market exposure (‘PFE’) of the instruments at a 97.5% statistical confidence level and adding this value to the current mark-to-market value. The resulting PFE or credit risk is then included against the credit limits approved for individual counterparties (financial institutions, corporates or structured finance), along with other non-derivative exposures.
In addition, there is a policy around the collateralisation of derivative instruments. If collateral is deemed necessary to reduce credit risk, any unsecured risk threshold, and the nature of any collateral to be accepted, is determined by the Wholesale Risk department’s management’s credit evaluation of the counterparty.
Credit risk mitigation in derivative transactions
(i) Netting arrangements for derivative transactions
The Group restricts its credit risk by entering into transactions under industry standard agreements which facilitate netting of transactions in the jurisdictions where netting agreements are recognised and have legal force. The netting arrangements do not generally result in an offset of balance sheet assets and liabilities for accounting purposes, as transactions are usually settled on a gross basis.
However, there is scope for the credit risk associated with favourable contracts to be reduced by netting arrangements embodied in the agreements to the extent that if an event of default occurs, all amounts with the counterparty under the specific agreement can be terminated and settled on a net basis. In line with industry practice, the Group executes the standard documentation according to the type of contract being entered into. For example, derivatives will be contracted under the International Swaps and Derivatives Association (‘ISDA’) Master Agreements), repurchase and reverse repurchase transactions will be governed by Global Master Repurchase Agreement (‘GMRA’), stock borrowing/lending transactions and other securities financing transactions are covered by Global Master Securities Lending Agreement (‘GMSLA’).
(ii) Collateralisation for derivative transactions
The Group also mitigates its credit risk to counterparties with which it primarily transacts financial instruments through collateralisation, using industry standard collateral agreements (i.e. the Credit Support Annex (‘CSA’)) in conjunction with the ISDA Master Agreement. Under these agreements, net exposures with counterparties are collateralised with cash, securities or equities. Exposures and collateral are generally revalued daily and collateral is adjusted accordingly to reflect deficits/surpluses. Collateral taken must comply with the Group’s collateral parameters policy. This policy is designed to control the quality and concentration risk of collateral taken such that collateral held can be liquidated when a counterparty defaults. Cash collateral in respect of derivatives held at 30 June 2012 was £1.3bn (31 December 2011: £1.3bn), not all derivative arrangements being subject to collateral agreements. Collateral obtained during the period in respect of purchase and resale agreements (including securities financing) is equal to at least 100% of the amount of the exposure.
(iii) Use of Central Counterparties
The Group continues to use Central Counterparties (‘CCPs’) as an additional means to mitigate counterparty credit risk in derivative transactions.
CREDIT RISK IN CORPORATE CENTRE
Definition
Credit risk is the risk of financial loss arising from the default of a customer or counterparty to which the Group has directly provided credit, or for which the Group has assumed a financial obligation, after realising collateral held. Credit risk arises by Corporate Centre making loans (including to other businesses within the Group) and investing in debt securities. Credit risk also arises by Corporate Centre investing in other financial instruments (including assets held for liquidity purposes and assets held in the Treasury Asset Portfolio which is being run down) or entering into financing transactions or derivative contracts.
MANAGING CREDIT RISK
Corporate Centre aims to actively manage and control credit risk. Credit risk is controlled by the Wholesale Credit Risk Department and the Corporate and Commercial Credit Risk Department in accordance with limits, asset quality plans and criteria approved by the Board with respect to risk appetite parameters, and as set out in other relevant policy statements. All exposures, including intra-group items, are captured in the global risk management systems and fall within limits approved by the appropriate credit authority. For transactions that fall under Santander UK’s delegated authority, approval is required from the CAC or those individuals directly mandated by the CAC. Transactions or exposures above the authority limit for the CAC will be referred to the relevant approval authorities in Banco Santander, S.A. and the Executive Risk Committee.
The Treasury Asset Portfolio is monitored for potential impairment through a detailed expected cashflow analysis taking into account the structure and underlying assets of each individual security. Once specific events give rise to a reasonable expectation that future anticipated cash flows may not be received, the asset originating these doubtful cash flows will be deemed to be impaired. Objective evidence of loss events includes significant financial distress of the issuer and default or delinquency in interest and principal payments (breach of contractual terms).
The corporate and legacy assets include older social housing assets and Commercial Mortgage loans together with the residual legacy assets from the acquisition of Alliance & Leicester which were not consistent with the Group’s business strategy. These assets are managed in a manner consistent with the Corporate Banking assets as described in the section “Credit Risk in Corporate Banking”.
CORPORATE CENTRE ASSETS
30 June 2012 £bn | 31 December 2011 £bn | |||||||
| Balances at central banks | 29.3 | 25.0 | ||||||
Treasury Asset Portfolio (1) | 2.0 | 2.5 | ||||||
Collateral (2) | 9.7 | 3.5 | ||||||
Other assets (3) | 13.2 | 7.5 | ||||||
| Customer assets | 11.3 | 11.9 | ||||||
| Total | 65.5 | 50.4 | ||||||
| (1) | These assets were acquired as part of the transfer of Alliance & Leicester plc to the Group in 2008 and as part of an alignment of portfolios across the Banco Santander, S.A. group in 2010 and are being run down. The assets in the Treasury Asset Portfolio are principally classified as loan and receivable securities, as set out in Note 16 to the Condensed Consolidated Interim Financial Statements, and debt securities designated at fair value through profit or loss, as set out in Note 9 to the Condensed Consolidated Interim Financial Statements. The credit derivatives within this portfolio have a fair value of £14m (31 December 2011: £17m) with a notional value of £55m (31 December 2011: notional £64m). |
| (2) | Includes inter-segmental collateral balances. |
| (3) | Other assets consists primarily of cash, derivatives and government securities held as available-for-sale. |
Corporate Centre Customer Assets
30 June 2012 £bn | 31 December 2011 £bn | 30 June 2011 £bn | ||||||||||
Social Housing(1) | 7.3 | 7.5 | 7.1 | |||||||||
| Legacy portfolios in run-off: | ||||||||||||
| - Aviation | 0.7 | 0.8 | 0.8 | |||||||||
| - Shipping | 0.8 | 0.9 | 1.1 | |||||||||
- Other (2) | 2.5 | 2.7 | 2.8 | |||||||||
| Total | 11.3 | 11.9 | 11.8 | |||||||||
| (1) | Social Housing Includes loans held at amortised cost and loans designated at fair value through profit or loss. Excludes social housing bonds of £0.3bn (31 December 2011: £0.3bn) designated at fair value through profit or loss. |
| (2) | Other includes SME loans of £1.5bn and Structured Finance. |
The Corporate Centre assets tables above comprise gross asset balances. The table below shows the exposures in Corporate Centre after taking into account the credit mitigation procedures described in Markets on page 99 above.
In addition, on lending to customers, credit risk arises on assets and off-balance sheet transactions. Consequently, the credit risk exposure below arises from on balance sheet assets, and off-balance sheet transactions such as committed and undrawn credit facilities or guarantees.
CORPORATE CENTRE CUSTOMER COMMITMENTS
30 June 2012 £bn | 31 December 2011 £bn | |||||||
| Social housing | 9.7 | 9.9 | ||||||
| Legacy portfolios in run-off: | ||||||||
| - Aviation | 0.8 | 0.8 | ||||||
| - Shipping | 0.9 | 1.1 | ||||||
| - Other | 3.1 | 3.5 | ||||||
| Total | 14.5 | 15.3 | ||||||
Corporate Centre exposure by credit rating of the issuer or counterparty(1)
| 30 June 2012 | Sovereign £m | Structured Products £m | Derivatives £m | Legacy Portfolios in run-off(2) £m | Social Housing(2) £m | Total £m | ||||||||||||||||||
| AAA | 33,297 | 424 | — | — | — | 33,721 | ||||||||||||||||||
| AA | 916 | 354 | — | — | 2,605 | 3,875 | ||||||||||||||||||
| A | — | 413 | 2,177 | 215 | 5,794 | 8,599 | ||||||||||||||||||
| BBB and below | — | 312 | — | 3,010 | 1,348 | 4,670 | ||||||||||||||||||
Other(3) | — | — | 1 | 1,516 | — | 1,517 | ||||||||||||||||||
| Total | 34,213 | 1,503 | 2,178 | 4,741 | 9,747 | 52,382 | ||||||||||||||||||
| 31 December 2011 | Sovereign £m | Structured Products £m | Derivatives £m | Legacy Portfolios in run-off(2) £m | Social Housing(2) £m | Total £m | ||||||||||||||||||
| AAA | 25,720 | 704 | — | — | — | 26,424 | ||||||||||||||||||
| AA | — | 348 | 587 | — | 2,651 | 3,586 | ||||||||||||||||||
| A | — | 380 | 1,123 | 195 | 5,990 | 7,688 | ||||||||||||||||||
| BBB and below | — | 319 | — | 3,508 | 1,300 | 5,127 | ||||||||||||||||||
| Other | — | — | — | 1,636 | — | 1,636 | ||||||||||||||||||
| Total | 25,720 | 1,751 | 1,710 | 5,339 | 9,941 | 44,461 | ||||||||||||||||||
| (1) | External ratings are applied to all exposures where available. |
| (2) | Of the total Legacy Portfolios and Social Housing exposures £143m (31 December 2011: £165m) were off-balance sheet transactions. Social Housing represented 72% of this with the remaining 28% occurring in the Legacy Portfolios. |
Corporate Centre exposure by geographical area (1)
| 30 June 2012 | Sovereign £m | Structured Products £m | Derivatives £m | Legacy Portfolios in run-off £m | Social Housing £m | Total £m | ||||||||||||||||||
| UK | 30,781 | 324 | — | 3,106 | 9,747 | 43,958 | ||||||||||||||||||
| Rest of Europe | 916 | 824 | 1,586 | 669 | — | 3,995 | ||||||||||||||||||
| US | 2,516 | 317 | 592 | 246 | — | 3,671 | ||||||||||||||||||
| Rest of world | — | 38 | — | 720 | — | 758 | ||||||||||||||||||
| Total | 34,213 | 1,503 | 2,178 | 4,741 | 9,747 | 52,382 | ||||||||||||||||||
31 December 2011 | Sovereign £m | Structured Products £m | Derivatives £m | Legacy Portfolios in run-off £m | Social Housing £m | Total £m | ||||||||||||||||||
| UK | 18,671 | 234 | — | 3,586 | 9,941 | 32,432 | ||||||||||||||||||
| Rest of Europe | — | 1,126 | 1,111 | 692 | — | 2,929 | ||||||||||||||||||
| US | 7,049 | 286 | 599 | 273 | — | 8,207 | ||||||||||||||||||
| Rest of world | — | 105 | — | 788 | — | 893 | ||||||||||||||||||
| Total | 25,720 | 1,751 | 1,710 | 5,339 | 9,941 | 44,461 | ||||||||||||||||||
(1) The geographic location is classified by country of domicile of the counterparty.
The exposure to sovereigns in the UK and US principally reflects the holdings of liquid assets.
Credit Risk Mitigation
Collateralisation
The specialist businesses within Corporate Centre service customers in various business sectors including Real Estate and Social Housing. Corporate Centre is also responsible for certain legacy portfolios in run-off, including aviation and shipping.
a) Social Housing
The Social Housing portfolio is secured on residential real estate owned and let by UK Housing Associations. This collateral is revalued at least every five years and the valuation is based on standard housing methodologies, which generally involve the properties’ continued use as social housing, if the valuation were based upon normal residential use the value would be considerably higher. To date, Santander UK has suffered no defaults or losses on this type of lending and has not had to take possession of any collateral. Of the Social Housing portfolio of £9.7bn, the value of the collateral is in all cases in excess of the loan balance. Typically, the loan balance represents between 25% and 50% of the implied market value of collateral using the Group’s approved LGD methodology.
b) Legacy portfolio
Within the legacy portfolio in run-off, which comprises assets inconsistent with the Group’s future strategy, collateral is regularly held through a charge over the underlying asset and in some circumstances in the form of cash. At 30 June 2012, the Group held £577m (31 December 2011: £612m) of cash collateral. There are also a small number of Private Finance Initiative (‘PFI’) transactions where collateral is held in the form of a charge over the underlying concession contract.
The Group obtains independent third party valuations on other fixed charge security such as aircraft or shipping assets. These valuations are undertaken in accordance with industry guidelines. An assessment is made of the need to establish an impairment loss allowance based on the valuation in relation to the loan amount outstanding (i.e. the LTV). This takes into account a range of factors including the future cashflow generation capability and the age of the assets as well as whether the loan in question continues to perform satisfactorily, whether or not the reduction in value is assessed to be temporary and whether other forms of recourse exist.
Of the aviation portfolio of £0.8bn, 91% of the loans are collateralised by aircraft and 90% of these loans have collateral valued in excess of the loan balance. Typically, the value of collateral represents between 45% and 90% of the loan balance. The Group would seek to ensure the disposal of the collateral, either consensually or via an insolvency process, as early as practical in order to minimise the loss to the Group but has not to date taken any planes into possession.
Of the shipping portfolio of £0.9bn, loan balances are in excess of the value of the collateral for 20% of the portfolio. Typically, the value of collateral represents between 50% and 120% of the loan balance. Collateral is rarely taken into possession, £30m in the first half of 2012 (31 December 2011: £34m) and the Group would seek to ensure the disposal of the collateral, either consensually or via an insolvency process, as early as practical in order to minimise the loss to the Group.
The collateral held against the remainder of the legacy portfolio in run off is immaterial.
Corporate Centre – Watchlist
Treasury exposures are managed by the Wholesale Credit Risk Department using the same process as for the Markets Banks and Financial Institutions and Global Corporates exposures described in ‘Markets – Watchlist’ above.
At 30 June 2012 there were no Financial Institutions non-performing loans (31 December 2011: one) as the remaining balance of euro 2.4m was fully written off. Assets in the ProActive category were £nil (31 December 2011: £1m) following the repayment of the exposure previously held.
The non-core and legacy portfolios are managed by the Corporate and Commercial Credit Risk Department using the same monitoring process described in ‘Corporate – Watchlist’ above. Summaries of the watchlist and workout cases at 30 June 2012 and 31 December 2011 by portfolio and assessment of risk are:
Impairment loss allowances(2) | ||||||||||||||||||||||||||||||||||||||||||||
| 30 June 2012 | Portfolio £m | Enhanced Monitoring £m | Enhanced Monitoring % | Pro- active £m | Pro- active % | Workout £m | Workout % | NPL(1) £m | NPL % | Observed £m | IBNO £m | |||||||||||||||||||||||||||||||||
| Legacy portfolios in run-off | 4,741 | 485 | 10.2 | 346 | 7.3 | 678 | 14.3 | 650 | 13.7 | 208 | 57 | |||||||||||||||||||||||||||||||||
| Social Housing | 9,747 | 255 | 2.6 | — | — | — | — | — | — | — | — | |||||||||||||||||||||||||||||||||
| Total | 14,488 | 740 | 5.1 | 346 | 2.4 | 678 | 4.7 | 650 | 4.5 | 208 | 57 | |||||||||||||||||||||||||||||||||
Impairment loss allowances(2) | ||||||||||||||||||||||||||||||||||||||||||||
| 31 December 2011 | Portfolio £m | Enhanced Monitoring £m | Enhanced Monitoring % | Pro- active £m | Pro- active % | Workout £m | Workout % | NPL(1) £m | NPL % | Observed £m | IBNO £m | |||||||||||||||||||||||||||||||||
| Legacy portfolios in run-off | 5,339 | 543 | 10.2 | 249 | 4.7 | 668 | 12.5 | 624 | 11.7 | 181 | 57 | |||||||||||||||||||||||||||||||||
| Social Housing | 9,941 | 212 | 2.1 | — | — | — | — | — | — | — | — | |||||||||||||||||||||||||||||||||
| Total | 15,280 | 755 | 4.9 | 249 | 1.6 | 668 | 4.4 | 624 | 4.1 | 181 | 57 | |||||||||||||||||||||||||||||||||
| (1) | Includes committed facilities and swaps. |
| (2) | Includes Insurance Funding Solutions (‘IFS’) and First National Motor Finance (‘FNMF’). |
Impairment losses on loans and advances to customers
The Group’s impairment loss allowances policy for corporate assets is set out in Note 1 of the Group’s 2011 Annual Report.
Corporate Centre analysis of impairment loss allowances on loans and advances to customers
An analysis of Corporate Centre impairment loss allowances on loans and advances to customers is presented below.
30 June 2012 £m | 31 December 2011 £m | |||||||
| Observed impairment loss allowances | ||||||||
| Corporate loans – UK | 147 | 131 | ||||||
| Other secured advances - UK | 62 | 51 | ||||||
| Total observed impairment loss allowances | 209 | 182 | ||||||
| Incurred but not yet observed impairment loss allowances | ||||||||
| Corporate loans - UK | 42 | 42 | ||||||
| Other secured advances - UK | 15 | 15 | ||||||
| Total incurred but not yet observed impairment loss allowances | 57 | 57 | ||||||
| Total impairment loss allowances | 266 | 239 | ||||||
Corporate Centre movements in impairment loss allowances on loans and advances
An analysis of movements in Corporate Centre impairment loss allowances on loans and advances is presented below.
Six months ended 30 June 2012 £m | 12 months ended 31 December 2011 £m | |||||||
| Impairment loss allowances at 1 January | 239 | 265 | ||||||
| Amounts written off: | ||||||||
| Corporate loans - UK | (29 | ) | (70 | ) | ||||
| Other secured advances - UK | (18 | ) | (45 | ) | ||||
| Total amounts written off | (47 | ) | (115 | ) | ||||
| Observed impairment losses charged against profit: | ||||||||
| Corporate loans - UK | 46 | 43 | ||||||
| Other secured advances - UK | 28 | 55 | ||||||
| Total observed impairment losses charged against profit | 74 | 98 | ||||||
| Incurred but not yet observed impairment losses charged against/ (released into) profit | — | (9 | ) | |||||
| Total impairment losses charged against profit | 74 | 89 | ||||||
| Impairment loss allowances at 30 June/31 December | 266 | 239 | ||||||
Corporate Centre recoveries
An analysis of Corporate Centre recoveries is presented below.
Six months ended 30 June 2012 £m | 12 months ended 31 December 2011 £m | |||||||
| Corporate loans - UK | — | — | ||||||
| Other secured advances - UK | 1 | 6 | ||||||
| Total amount recovered | 1 | 6 | ||||||
Corporate Centre Arrears
30 June 2012 £m | 31 December 2011 £m | |||||||
| Total Corporate Centre loans and advances to customers in arrears | 702 | 689 | ||||||
Total Corporate Centre loans and advances to customers(1) | 11,295 | 11,946 | ||||||
| Corporate Centre loans and advances to customers in arrears as a % of Corporate Centre loans and advances to customers | 6.22 | % | 5.77 | % | ||||
In the first half of 2012, loans and advances to customers in arrears increased to £702m (31 December 2011: £689m) due to ongoing stress in the legacy portfolios in run-off, including legacy commercial real estate exposures written pre-2009, particularly within the care home and leisure industry sectors. Loans and advances to customers in arrears as a percentage of loans and advances to customers increased to 6.22% (31 December 2011: 5.77%) as a result of the increased arrears as described above.
Corporate Centre loans and advances
An analysis of Corporate Centre’s non-performing loans and advances is presented below.
30 June 2012 £m | 31 December 2011 £m | |||||||
Corporate Centre non-performing loans and advances that are impaired - UK | 444 | 439 | ||||||
Corporate Centre non-performing loans and advances that are not impaired - UK | 176 | 140 | ||||||
Total Corporate Centre non-performing loans and advances(2) | 620 | 579 | ||||||
Total Corporate Centre loans and advances to customers(3) | 11,295 | 11,946 | ||||||
Total Corporate Centre impairment loan loss allowances | 266 | 239 | ||||||
| % | % | |||||||
| Non-performing loans and advances as a % of loans and advances to customers | 5.36 | 4.85 | ||||||
Coverage ratio(4) | 43 | 41 | ||||||
| (1) | Loans and advances are classified as non-performing typically when the counterparty fails to make payments when contractually due for three months or where it is deemed unlikely that the counterparty will be able to maintain payments. |
| (2) | All non-performing loans continue accruing interest. |
| (3) | Corporate Centre loans and advances to customers include social housing loans and finance leases. |
| (4) | Accrued interest is excluded for purposes of these analyses. |
At 30 June 2012, non-performing loans and advances as a percentage of loans and advances to customers increased to 5.36% from 4.85% at 31 December 2011. This increase reflects the continuing challenges faced by corporate clients in the current economic conditions particularly in the care home sector and certain parts of the commercial real estate market.
The level of new non-performing loans was broadly in line with expectations and the options available for managing them, particularly the ability to raise equity capital, to sell assets or to conclude refinancing, remain limited. The shipping sector continued to experience stress especially with regards to older vessels where achieving sufficiently profitable re-employment on expiry of charters has proven to be difficult which together with a limited number of buyers and the shortage of finance for purchasers, has impacted on potential recovery levels for distressed assets.
Interest income recognised on impaired loans amounted to £6m (2011: £4m).
MARKET RISK
Definition
Market risk is the risk of a reduction in economic value or reported income resulting from a change in the variables of financial instruments including interest rate, equity, credit spread, property and foreign currency risks. Market risk consists of trading and non-traded market risks. Trading market risk includes risks on exposures held with the intention of benefiting from short-term price differences in interest rate variations and other market price shifts. Non-traded market risk primarily consists of structural interest rate risks from long term positions.
Interest rate risks primarily result from exposures to changes in the level, slope and curvature of the yield curve, the volatility of interest rates and mortgage prepayment rates. Equity risks result from exposures to changes in prices and volatilities of individual equities, equity baskets and equity indices. Credit spread risk arises from the possibility that changes in credit spreads will affect the value of financial instruments. Property risks result from exposures to changes in property prices. Foreign currency risks result from exposures to changes in spot prices, forward prices and volatilities of currency rates. The Group accepts that market risk arises from its full range of activities.
MANAGING MARKET RISK
Activities giving rise to market risk
Market risk arises in connection with the following activities:
| > | Trading: this includes financial services for customers and the buying and selling and positioning mainly in fixed-income, equity and foreign currency products. Trading activities are undertaken by Markets and Corporate Banking. |
| > | Balance sheet management: Interest rate and liquidity risk arises from mismatches between maturities and repricing of assets and liabilities. For a discussion of liquidity risk, see “Liquidity Risk” in “Funding and Liquidity Risk”. The exchange rate risk related to funding raised in currencies other than sterling in excess of balance sheet requirements is swapped back into sterling. Balance sheet management activities are undertaken by Corporate Centre. |
The Group aims to actively manage and control market risk by limiting the adverse impact of market movements whilst seeking to enhance earnings within clearly defined parameters. The Market Risk Manual, which is reviewed and approved annually, sets the framework under which market risks are managed and controlled. Business area policies, risk limits and mandates are established within the context of the Market Risk Manual.
Executive directors are responsible for ensuring that they have sufficient expertise to manage the risks originated and retained within their business divisions. The business areas are responsible for ensuring that they have sufficient expertise to manage the risks associated with their operations. The independent Risk function, under the direction of the Chief Risk Officer, aims to ensure that risk-taking and risk control occur within the framework prescribed by the Market Risk Manual. The Risk function also provides oversight of all risk-taking activities through a process of reviews.
The Group aims to ensure that exposure to market risks is measured and reported on an accurate and timely basis to senior management. In addition to the regular reporting for the purposes of active risk management, the Board also receives reporting of all significant market risk exposures on a monthly basis where actual exposure levels are measured against limits. Market activity and liquidity of financial instruments are discussed in the relevant monthly Risk Forum. Senior management recognise that different risk measures are required to best reflect the risks faced in different types of business activities. In measuring exposure to market risk, the Group uses a range of complementary measures, covering both value and income as appropriate.
Trading market risk exposure arises only in the Abbey National Treasury Services plc group. Exposures are managed on a continuous basis, and are marked to market daily.
Methodologies
Trading Activities
For trading activities the standardised risk measure adopted is VaR. This is calculated at a 99% confidence level over a one-day time horizon in accordance with the standard used throughout the Banco Santander, S.A. group. In 2012, to further align with the Banco Santander, S.A. group, the Group moved to using a 520 day dataset period for VaR from the previous 250 day dataset methodology.
On a daily basis, market risk factor sensitivities, VaR measures and stress tests are produced, reported and monitored against limits for each major activity and at the aggregate divisional level. These limits are used to align risk appetite with the business’ risk-taking activities and are reviewed on a regular basis.
Measurement of risks can involve the use of complex quantitative methods and mathematical principles to model and predict the changes in instruments and portfolio valuation. These methods are essential tools to understand the risk exposures.
The range of possible statistical modelling techniques and assumptions mean these measures are not precise indicators of expected future losses, but are estimates of the potential change in the value of the portfolio over a specified time horizon and within a given confidence interval. Historical simulation models are used with appropriate add-ons to reflect unobservable inputs.
From time to time, losses may exceed the amounts stated where the movements in market rates fall outside the statistical confidence interval used in the calculation of the VaR analysis. The 99% confidence interval means that the theoretical loss at a risk factor level is likely to be exceeded in one period in a hundred. This risk is addressed by monitoring stress-testing measures across the different business areas. For trading instruments the actual, average, highest and lowest VaR exposures shown below are all calculated to a 99% level of confidence using a simulation of actual one day market movements over a one-year period. The effect of historic correlations between risk factors is additionally shown below. The use of a one-day time horizon for all risks associated with trading instruments reflects the horizon over which market movements will affect the measured profit and loss of these activities.
The Group’s risk performance with regards to trading activity in financial markets in both Corporate Banking and Markets during the 12 months to 30 June 2012 was as follows:
Back-testing of business portfolios 2011/2012: daily results versus previous day’s VaR
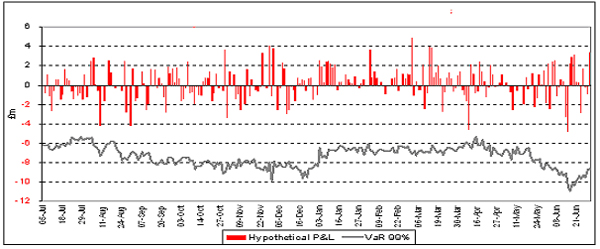
VaR is not the only measure used by the Group. It is used because it is easy to calculate and because it provides a good reference of the level of risk incurred by the Group. However, other measures are also used to enable the Group to exercise greater risk control in the markets in which it operates.
One of these measures is scenario analysis, which consists of defining behaviour scenarios for various financial variables and determining the impact on results of applying them to the Group's activities. These scenarios can replicate past events (such as crises) or determine plausible scenarios that are unrelated to past events. A minimum of three types of scenarios are defined (plausible, severe and extreme) which, together with VaR, make it possible to obtain a more complete spectrum of the risk profile. In addition, the market risk area, in accordance with the principle of independence of the business units, monitors daily the positions of each unit through an exhaustive control of changes in the portfolios, the aim being to detect possible incidents and correct them immediately. The daily preparation of an income statement is an important risk indicator, insofar as it allows the Group to identify the impact of changes in financial variables on the portfolios.
All activities are controlled daily using specific measures. Sensitivities to price fluctuations are calculated for cash instruments, while sensitivities to changes in underlyings, volatilities, correlations and time (theta) are calculated for derivatives.
Balance sheet management
The Group analyses the sensitivity of net interest margin (‘NIM’) and market value of equity (‘MVE’) to changes in interest rates. See “Managing market risk” in “Market Risk – Corporate Centre” below.
MARKET RISK - RETAIL BANKING
Market risks are originated in Retail Banking only as a by-product of writing customer business and are transferred out of Retail Banking insofar as possible. Only prepayment and launch risk exposures are retained within Retail Banking, as these behavioural risks are influenced by internal marketing and pricing activity under the authority of the Chief Executive Officer. Other market risks are transferred to the ALM operation within Corporate Centre, where they can be managed in conjunction with exposures arising from the funding, liquidity or capital management activities of ALM. Funds received with respect to deposits taken are lent on to Corporate Centre on matching terms as regards interest rate re-pricing and maturity. Similarly, loans are funded through matching borrowings from Corporate Centre. Market risks arising from structured products, including exposure to changes in the levels of equity markets, are hedged within Markets.
MARKET RISK – CORPORATE BANKING
Non traded market risk
Market risks originated in Corporate Banking are transferred from the originating business to ALM within Corporate Centre, where they can be managed in conjunction with exposures arising from the funding, liquidity or capital management activities of ALM. Funds received with respect to deposits taken are lent on to Corporate Centre on matching terms as regards interest rate repricing and maturity. Similarly, loans are funded through matching borrowings from Corporate Centre. Any permitted retained market risk exposure is minimal, and is monitored against limits approved by the Chief Risk Management Officer.
Trading market risk
For trading activities the standardised risk measure adopted is VaR, as described above. The following table shows the VaR-based consolidated exposures for the major risk classes at 30 June 2012 and 31 December 2011, together with the highest, lowest and average exposures for the period. Exposures within each risk class reflect a range of exposures associated with movements in that financial market. For example, interest rate risks include the impact of absolute rate movements, movements between interest rate bases and movements in implied volatility on interest rate options.
The amounts below represent the potential change in market values of trading instruments. Since trading instruments are recorded at market value, these amounts also represent the potential effect on income.
| Actual exposure | ||||||||
Trading instruments | 30 June 2012 £m | 31 December 2011 £m | ||||||
| Interest rate risks | 2.1 | 1.9 | ||||||
| Equity risks | 1.0 | 0.5 | ||||||
| Credit spread risks | — | 0.2 | ||||||
Correlation offsets(1) | (0.9 | ) | (0.6 | ) | ||||
| Total correlated one-day VaR | 2.2 | 2.0 | ||||||
| Exposure for the period ended | ||||||||||||||||||||||||
| Average exposure | Highest exposure | Lowest exposure | ||||||||||||||||||||||
| Trading instruments | 30 June 2012 £m | 31 December 2011 £m | 30 June 2012 £m | 31 December 2011 £m | 30 June 2012 £m | 31 December 2011 £m | ||||||||||||||||||
| Interest rate risks | 2.3 | 1.9 | 3.8 | 2.6 | 1.7 | 1.4 | ||||||||||||||||||
| Equity risks | 0.9 | 0.5 | 1.4 | 0.7 | 0.6 | 0.2 | ||||||||||||||||||
| Credit spread risks | 0.3 | 0.6 | 0.8 | 0.9 | — | 0.2 | ||||||||||||||||||
Correlation offsets(1) | (1.0 | ) | (0.6 | ) | — | — | — | — | ||||||||||||||||
| Total correlated one-day VaR | 2.5 | 2.4 | 3.9 | 3.6 | 1.9 | 1.6 | ||||||||||||||||||
| (1) | The highest and lowest exposure figures reported for each risk type did not necessarily occur on the same day as the highest and lowest total correlated one-day Value-at-Risk. A corresponding correlation offset effect cannot be calculated and is therefore omitted from the above tables. |
MARKET RISK - MARKETS
Market risk-taking is performed within the framework established by the Market Risk Manual. A major portion of the market risk arises from exposures to changes in the levels of interest rates, equity markets and credit spreads. Interest rate exposure is generated from most trading activities. Exposure to equity markets is generated by the creation and risk management of structured products by Markets for the personal financial services market and trading activities. Credit spread exposure arises indirectly from trading activities within Markets.
Managing market risk
Risks are managed within limits approved by the Chief Risk Officer (supported by the Deputy Chief Risk Officer) or Banco Santander, S.A.’s Board Risk Committee and within the risk control framework defined by the Market Risk Manual. For trading activities the primary risk exposures for Markets are interest rate, equity, credit spread and residual exposure to property indices. Interest rate risks are managed via interest rate swaps, futures and options (caps, floors and swaptions).
Equity risks are managed via equity stock, index futures, options and structured equity derivatives. Credit spread risks are managed via vanilla credit derivatives. Property index risk is managed via insurance contracts and property derivatives.
To facilitate understanding and communication of different risks, risk categories have been defined. Exposure to all market risk factors is assigned to one of these categories. The Group considers two categories:
| > | Short-term liquid market risk covers activities where exposures are subject to frequent change and could be closed out over a short-time horizon. Most of the exposure is generated by Markets. |
| > | Structural market risk includes exposures arising as a result of the structure of portfolios of assets and liabilities, or where the liquidity of the market is such that the exposure could not be closed out over a short-time horizon. The risk exposure is generated by features inherent in either a product or portfolio and normally presented over the life of the portfolio or product. Such exposures are a result of the decision to undertake specific business activities, can take a number of different forms, and are generally managed over a longer-time horizon. |
Markets operates within a market risk framework designed to ensure that it has the capability to manage risk in a well-controlled manner. A comprehensive set of policies, procedures and processes have been developed and implemented to identify, measure, report, monitor and control risk across Markets.
Trading market risk
For trading activities the standardised risk measure adopted is VaR, as described above. The following table shows the VaR-based consolidated exposures for the major risk classes at 30 June 2012 and 31 December 2011, together with the highest, lowest and average exposures for the period. Exposures within each risk class reflect a range of exposures associated with movements in that financial market.
The amounts below represent the potential change in market values of trading instruments. Since trading instruments are recorded at market value, these amounts also represent the potential effect on income.
| Actual exposure | ||||||||
Trading instruments | 30 June 2012 £m | 31 December 2011 £m | ||||||
| Interest rate risks | 4.6 | 1.6 | ||||||
| Equity risks | 3.6 | 5.3 | ||||||
| Property risks | 2.5 | 2.1 | ||||||
Other risks(1) | 0.7 | 1.9 | ||||||
Correlation offsets(2) | (1.6 | ) | (2.4 | ) | ||||
| Total correlated one-day VaR | 9.8 | 8.5 | ||||||
| Exposure for the period ended | ||||||||||||||||||||||||
| Average exposure | Highest exposure | Lowest exposure | ||||||||||||||||||||||
| Trading instruments | 30 June 2012 £m | 31 December 2011 £m | 30 June 2012 £m | 31 December 2011 £m | 30 June 2012 £m | 31 December 2011 £m | ||||||||||||||||||
| Interest rate risks | 3.2 | 2.3 | 5.9 | 3.8 | 1.7 | 1.2 | ||||||||||||||||||
| Equity risks | 4.9 | 2.6 | 6.2 | 6.9 | 3.6 | 0.6 | ||||||||||||||||||
| Property risks | 2.4 | 2.2 | 2.6 | 2.9 | 2.2 | 1.9 | ||||||||||||||||||
Other risks(1) | 1.3 | 0.4 | 2.3 | 1.9 | 0.7 | 0.2 | ||||||||||||||||||
Correlation offsets(2) | (2.8 | ) | (1.1 | ) | — | — | — | — | ||||||||||||||||
| Total correlated one-day VaR | 9.0 | 6.4 | 11.3 | 10.0 | 6.8 | 3.9 | ||||||||||||||||||
| (1) | Other risks include foreign exchange risk. |
| (2) | The highest and lowest exposure figures reported for each risk type did not necessarily occur on the same day as the highest and lowest total correlated one-day Value-at-Risk. A corresponding correlation offset effect cannot be calculated and is therefore omitted from the above tables. |
Derivatives held for Trading Purposes
Markets is responsible for implementing Group derivative hedging with the external market together with its own trading activities. For trading activities, its objectives are to gain value by:
| > | Marketing derivatives to end users and hedging the resulting exposures efficiently; and |
| > | The management of trading exposure reflected on the Group’s balance sheet. |
Trading derivatives include interest rate, cross currency, equity, property and other index related swaps, forwards, caps, floors, swaptions, as well as credit default and total return swaps, equity index contracts and exchange traded interest rate futures and equity index options.
Under IAS 39, all derivatives are classified as “held for trading” (except for derivatives which are designated as effective hedging instruments in accordance with the detailed requirements of IAS 39) even if this is not the purpose of the transaction. The held for trading classification therefore includes two types of derivatives: those used in sales activities; and those used for risk management purposes but, for various reasons, either the Group does not elect to claim hedge accounting for or they do not meet the qualifying criteria for hedge accounting. See Note 15 of the Group’s 2011 Annual Report.
Derivatives held for Hedging Purposes
The Group uses derivatives (principally interest rate swaps and cross-currency swaps) for hedging purposes in the management of its own asset and liability portfolios, including fixed-rate lending, fixed-rate asset purchases, medium-term note issues, capital issues, and structural positions. This enables the Group to optimise the overall cost to it of accessing debt capital markets, and to mitigate the market risk which would otherwise arise from structural imbalances in the maturity and other profiles of its assets and liabilities. See Note 15 of the Group’s 2011 Annual Report.
MARKET RISK - CORPORATE CENTRE
Most market risks arising from Retail Banking and Corporate Banking are transferred from the originating business to the ALM function within Corporate Centre, where they can be managed in conjunction with exposures arising from the funding, liquidity or capital management activities of ALM. As a consequence, non-trading risk exposures are substantially transferred to Corporate Centre. Market risks mainly arise through the provision of banking products and services to personal and corporate/business customers, as well as structural exposures arising in the Group’s balance sheet. These risks impact the Group’s current earnings and economic value.
The most significant market risk in Corporate Centre is interest rate risk which includes yield curve and basis risks. Yield curve risk arises from the timing mismatch in the repricing of fixed and variable rate assets, liabilities and off-balance sheet instruments, as well as the investment of non-interest-bearing liabilities in interest-bearing assets. Basis risk arises, to the extent that the volume of administered variable rate assets and liabilities are not precisely matched, which exposes the balance sheet to changes in the relationship between administered rates and market rates.
Other risks that are inherent in Corporate Centre include credit spread, foreign currency, prepayment and launch risks. Credit spread risk arises principally on Corporate Centre’s holdings of mortgage-backed securities. Foreign exchange risk arises from differences in the present value of existing foreign–currency denominated assets and liabilities, and future known cashflows. The Group is also exposed to risks arising from features in retail products that give customers the right to alter the expected cash flows of a financial contract. This creates prepayment risk, for example where customers may prepay loans before their contractual maturity. In addition, the Group is exposed to product launch risk, for example where the customers may not take up the expected volume of new fixed rate mortgages or other loans.
Managing market risk
SRFM, on the recommendation of ALCO, is responsible for managing the Group’s overall balance sheet position. Natural offsets are used as far as possible to mitigate yield curve exposures but the overall balance sheet position is generally managed using derivatives that are transacted through Markets and with external counterparties. The Finance Director is responsible for managing risks in accordance with SRFM’s direction and on behalf of the Chief Financial Officer.
Risks are managed within a three-tier limit structure defined by the Market Risk Manual:
| > | Global limits approved by Banco Santander, S.A.’s Board Risk Committee; |
| > | Limits and triggers approved by the Chief Risk Management Officer; and |
| > | Local sub-limits set to control the exposures retained within individual business areas. |
The key risk metrics, NIM and MVE, measure the Group’s exposure to yield curve risk. The following table shows the results of these measures at 30 June 2012 and 31 December 2011:
30 June 2012 £m | 31 December 2011 £m | |||||||
| Net Interest Margin sensitivity to +100 basis points shift in yield curve | 438 | 225 | ||||||
| Market Value of Equity sensitivity to +100 basis points shift in yield curve | 608 | 387 | ||||||
NIM and MVE sensitivities are calculated based on market rate paths implied by the current yield curve, and based on contractual product features including re-pricing and maturity dates. The NIM and MVE sensitivities reflect how the base case valuations would be affected by a 100 basis point parallel shift applied instantaneously to the yield curve, and provide complementary views of the Group’s exposure to interest rate movements.
MVE sensitivity provides a long-term view covering the present value of all future cash flows, whereas NIM sensitivity considers the impact on net interest margin over the next 12 months. The calculations for NIM and MVE sensitivities involve many assumptions, including expected customer behaviour (e.g. early repayment of loans) and how interest rates will evolve. The assumptions are reviewed and updated on a regular basis.
Corporate Centre – Derivatives
Corporate Centre enters into derivative contracts with Markets to manage the risks associated with its activities. Medium term funding may also be hedged directly with third parties. See Note 15 of Group’s 2011 Annual Report.
FUNDING AND LIQUIDITY RISK
The Group views the essential elements of funding and liquidity risk management as controlling potential cash outflows, maintaining prudent levels of highly liquid assets and ensuring that access to funding is available from a diverse range of sources. The Board targets a funding strategy that avoids excessive reliance on wholesale funding and attracts enduring commercial deposits by understanding the behavioural aspects of customer deposits under different scenarios, appropriately reflecting product features and types of customers. The funding strategy aims to provide effective diversification in the sources and tenor of funding as well as establishing the capacity to raise additional unplanned funding from those sources quickly. An excessive concentration in either liquid assets or contractual liabilities also contributes to potential liquidity risk, and so limits have been defined under the Liquidity Risk framework.
The Group primarily generates funding and liquidity through UK retail and corporate deposits, as well as in the financial markets through its own debt programmes and facilities to support its business activities and liquidity requirements. It does this on the strength of its balance sheet and profitability and its own network of investors. It does not rely on a guarantee from Banco Santander, S.A. or any other member of the Santander group to generate this funding or liquidity. The Group does not raise funds to finance other members of the Santander group or guarantee the debts of other members of the Santander group (other than certain of Santander UK plc’s own subsidiaries).
Whilst the Group manages its funding and maintains adequate liquidity on a stand-alone basis, the Group co-ordinates issuance plans with Banco Santander, S.A., where appropriate. In addition to the Group’s liquidity risk being consolidated and centrally controlled, liquidity risk is also measured, monitored and controlled within the specific business area or the subsidiary where it arises.
FUNDING RISK
Definition
Funding risk is the risk that the Group does not have sufficiently stable and diverse sources of funding or the funding structure is inefficient or a funding programme such as debt issuance subsequently fails. For example, a securitisation arrangement may fail to operate as anticipated or the values of the assets transferred to a funding vehicle do not emerge as expected creating additional risks for the Group and its depositors. Risks arising from the encumbrance of assets are included within this definition. Primary sources of funding include:
| > | Customer deposits; |
| > | Secured and unsecured money-market funding (including unsecured cash, repo, CD and CP issuance); |
| > | Senior debt issuance (including discrete bond issues and MTNs); |
| > | Mortgage-backed funding (including securitisation and covered bond issuance); and |
| > | Subordinated debt and capital issuance (although the primary purpose is not funding). |
For accounting purposes, wholesale funding comprises deposits by customers, deposits by banks, debt securities in issue and subordinated liabilities. Retail Banking and Corporate Banking funding primarily comprises deposits by customers.
Managing funding risk
The Chief Financial Officer has delegated responsibility for day-to-day management of Funding to the Finance Director who in turn delegates to the Director, ALM and the Director, Funding. The Director, Funding is responsible for all aspects of short and long term funding in both secured and unsecured markets. The Director, ALM is responsible for the preparation, maintenance and revision of funding plans consistent with the Group’s strategic business plan and limits. These plans are subject to a set of stress tests aimed at assessing the sensitivity of the Group’s structural funding position to different growth assumptions applied to each funding source. The stress tests also assess the impact of undershooting targets set within the plan for each of the funding sources. The stress tests are reviewed by the Executive Committee.
Financial adaptability The Group also considers its ability to take effective action to alter the amounts and timing of cash flows so that it can respond to unexpected needs or opportunities. In determining its financial adaptability, the Group has considered its ability to: | ||
| > | Obtain new sources of finance The Group minimises refinancing risk by sourcing funds from a variety of markets as appropriate and subject to consideration of the appropriate leverage ratio and funding mix for the Group, and in particular customer deposit levels and medium-term funding. The Group actively manages its relationships with existing providers of funding and considers new sources of funds as and when they arise. Day-to-day sources of finance consist primarily of retail deposits. To the extent that wholesale funding is required, a variety of sources are usually available from a range of markets, including: | |
| > | money markets: both unsecured (including interbank and customer deposits, and issuances of certificates of deposit and commercial paper) and secured (including repos in open market operations); | |
| > | debt capital markets (including discrete bond issues and medium term notes); | |
| > | mortgage-backed funding (including securitisation and covered bond issuance); and | |
| > | capital instruments (although primarily issued to maintain capital ratios). | |
In addition to day-to-day funding sources, the Group has access to contingent sources from central banks, including the Bank of England, the Swiss National Bank, and the US Federal Reserve. The Group ensures that it has access to these contingent facilities as part of its prudent liquidity risk management. The Group minimises reliance on any one market by maintaining a diverse funding base, and avoiding concentrations by maturity, currency and institutional type. | |
| > | Obtain financial support from other Santander group companies For capital, funding and liquidity purposes, the Group operates on a stand-alone basis. However, in case of stress conditions, it would consult with its ultimate parent company, Banco Santander, S.A. about financial support. |
| > | Continue business by making limited reductions in the level of operations or by making use of alternative resources The Group maintains and regularly updates a Recovery and Resolution Plan which is designed to enable the Group to proactively manage stress situations at an early stage. In addition, the 3-Year Plan is stressed, as part of the Internal Capital Adequacy Assessment Process (‘ICAAP’), to ensure that the Group can accommodate extreme scenarios and the impact this would have on the 3-Year Plan and profits. In accommodating these extreme scenarios, various management actions would be utilised, including the encashment of certain liquid assets and a reduction in new business in Retail Banking and Corporate Banking. |
Wholesale funding
Details of the Group’s wholesale funding are set out in the Balance Sheet Business Review on pages 46 to 47.
LIQUIDITY RISK
Definition
Liquidity risk is the risk that the Group, although solvent, either does not have available sufficient financial resources to enable it to meet its obligations as they fall due, or can secure them only at excessive cost. Liquidity risks arise throughout the Group. The Group’s primary business activity is commercial banking and, as such, it engages in maturity transformation, whereby callable and short-term commercial deposits (including retail and corporate) are invested in longer-term customer loans.
Managing liquidity risk
Liquidity risk is managed under a comprehensive and prudent liquidity risk management framework. The primary objective of the framework is to ensure that Santander UK is liquidity risk resilient by holding sufficient financial resources to withstand a series of stresses as well as complying with regulatory requirements at all times.
The stress tests that Santander UK runs on a frequent basis to ensure it is holding sufficient financial resources are:
| > | Santander UK Internal Liquidity Adequacy Assessment (‘ILAA’) stress test. A comprehensive stress test considering all risk drivers applicable to Santander UK during an idiosyncratic shock experienced during a protracted market-wide stress. |
| > | Funding plan stress tests. A set of stress tests performed on the base-case strategic funding plan aimed at assessing the sensitivity of Santander UK’s structural funding position to the different growth assumptions applied to each funding source and the impact of undershooting the targets set. |
| > | Santander UK credit ratings downgrade. This stress test assesses the impact on the Group of a downgrade of the credit ratings of Santander UK, including its effects on the Group’s collateral requirements and liquidity position. |
| > | Eurozone stress test. Given the continuing interest in the eurozone, Santander UK also stress tests a more extreme scenario where eurozone contagion or collapse results in significant retail, corporate and wholesale deposit outflows, combined with a reduction in the management actions available to it. |
The key ongoing liquidity risks are:
| Key liquidity risk | Definition | |
Retail funding risk | Risk of loss of retail deposits. | |
Corporate funding risk | Risk of loss of corporate deposits. | |
Wholesale secured and unsecured funding risk | Risk of wholesale unsecured and secured deposits failing to roll over. | |
| Intra-day liquidity risk | Risk of dislocation in payment and settlement systems in which the Group is either a direct or indirect participant. | |
Off-balance sheet liquidity risk | Risk of insufficent financial resources required to service off-balance sheet assets or commitments. | |
| Derivatives and contingent liquidity risks | Risk of ratings downgrades that could trigger events leading to increased outflows of financial resources, for example, to cover additional margin or collateral requirements. |
Liquidity risk appetite
The Board’s risk objective is to be a risk resilient institution at all times, and to be perceived as such by stakeholders, preserving the short and long-term viability of the institution. While recognising that a bank engaging in maturity transformation cannot hold sufficient liquidity to cover all possible stress scenarios, the Board requires the Group to hold sufficient liquidity to cover extreme situations. The requirements arising from the FSA’s regulatory liquidity regime are reflected in the Board’s liquidity risk appetite. The liquidity risk appetite has been recommended by the Chief Executive Officer and approved by the Board, under advice from the Board Risk Committee. The liquidity risk appetite, within the context of the overall risk appetite statement, is reviewed and approved by the Board at least annually or more frequently if necessary (e.g. in the case of significant methodological or business change). This is designed to ensure that the liquidity risk appetite will continue to be consistent with the Group’s current and planned business activities.
The Chief Executive Officer, under advice from the Board Risk Committee, approves more detailed allocation of liquidity risk limits. The Chief Risk Officer, supported by the Risk Division, is responsible for the ongoing maintenance of the liquidity risk appetite.
Governance and oversight
All key liquidity risks are identified and encompassed within the Group’s risk framework and subject to the Group’s risk governance. The Board delegates day-to-day responsibility for liquidity risk to the Chief Executive Officer. The Chief Executive Officer has in turn delegated the responsibilities for liquidity risk management to the Chief Financial Officer who in turn delegates to the Finance Director, and liquidity risk oversight to the Chief Risk Officer with risk assurance being provided by the Internal Audit function reporting through to the Board Audit Committee and Board Risk Committee.
Risk Framework
Adherence to the Group’s liquidity risk appetite is monitored on a daily, weekly and monthly basis through different committees and levels of management including SRFM and the Executive Risk Committee, and by the Board and other Board Committees. SRFM is responsible for overseeing the management of the Group’s balance sheet in accordance with the Board-approved funding plan and adequacy of liquidity, consistent with the liquidity risk appetite. This includes consideration of relevant macro-economic factors and conditions in the financial markets.
Operating Framework
The Group operates centralised liquidity governance and control processes. The Director, Funding is responsible for the day-to-day management of the Group’s balance sheet, including the adequacy of liquidity. ALM operates two dedicated teams within a unified management and reporting structure: one focuses on the management of strategic liquidity risk (i.e. over one year) and the other focuses on the management of tactical liquidity (i.e. within one year).
Management also monitors the Group’s compliance with limits set by the FSA. Actual liquidity positions are tracked and reported daily against approved limits, triggers and other metrics through both liquidity management and liquidity risk oversight. Any breaches are escalated according to the Group’s risk framework. The adequacy of the agreed liquidity buffer is monitored through stress testing which is undertaken daily. Resilience to the defined stresses is reported daily to management, and monthly to ALCO, SRFM and Executive Risk Committee, or more frequently depending on market conditions.
Liquid assets
The Group holds, at all times, an unencumbered liquid asset buffer to mitigate liquidity risk. The size and composition of this buffer is determined both by internal stress tests as well as the FSA’s liquidity regime, and is set out in the Balance Sheet Business Review on page 48.
The key element of the Group’s liquidity risk management is focused on holding sufficient liquidity to withstand a series of stress tests. Within the framework of prudent funding and liquidity management, Santander UK manages its activities to minimise liquidity risk, differentiating between short-term and strategic activities.
Short-term, tactical liquidity management
| > | Liquid assets – a buffer of liquid assets is held to cover unexpected demands on cash in extreme but plausible stress scenarios. In the Group’s case, the most significant stress events include large and unexpected deposit withdrawals by retail customers and a loss of unsecured wholesale funding. |
| > | Funding profile – metrics to help control the level of outflows within different maturity buckets. |
| > | Intra-day collateral management – to ensure that adequate collateral is available to support payments in each payment or settlement system in which the Group participates, as they fall due. |
Strategic funding management
| > | Structural balance sheet shape – to manage the extent of maturity transformation (investment of shorter term funding in longer term assets), the funding of non-marketable assets with wholesale funding and the extent to which non-marketable assets can be used to generate liquidity. |
| > | Wholesale funding strategy – to avoid over-reliance on any individual counterparty, currency, market or product, or group of counterparties, currencies, markets or products that may become highly correlated in a stress scenario; and to avoid excessive concentrations in the maturity of wholesale funding. |
| > | Wholesale funding capacity – to maintain and promote counterparty relationships, monitor line availability and ensure funding capacity is maintained through ongoing use of lines and markets. |
Collateral calls on derivatives positions can pose a significant liquidity risk. Collateral calls may arise at times of market stress and when asset liquidity may be tightening. The timing of the cash flows on a derivative hedging an asset may be different to the timing of the cash flows of the asset being hedged, even if they are similar in all other respects. Collateral calls may be triggered by a credit downgrading. The Group manages these risks by including collateral calls in stress tests on liquidity, and by maintaining a portfolio of assets held for managing liquidity risk.
Risk limits and triggers are set for the key tactical and strategic liquidity risk drivers. These are monitored by the Risk Division and reported monthly to ALCO, SRFM, Executive Risk Committee and the Board.
Maturities of financial liabilities
The table below analyses the maturities of the undiscounted cash flows relating to financial liabilities of the Group based on the remaining period to the contractual maturity date at the balance sheet date. Deposits by customers are largely made up of Retail Deposits. In particular, the ‘Demand’ grouping includes current accounts and other variable rate savings products. The ‘Up to 3 months’ grouping largely constitutes wholesale funding of wholesale assets of a similar maturity. There are no significant financial liabilities related to financial guarantee contracts. This table is not intended to show the liquidity of the Group.
| At 30 June 2012 | Demand £m | Up to 3 months £m | 3-12 months £m | 1-5 years £m | Over 5 years £m | Total £m | ||||||||||||||||||
| Deposits by banks | 2,609 | 1,373 | 5,129 | 6,264 | 261 | 15,636 | ||||||||||||||||||
| Deposits by customers | 107,332 | 11,193 | 16,661 | 14,297 | 982 | 150,465 | ||||||||||||||||||
| Trading liabilities | 3,587 | 19,864 | 2,356 | 982 | 1,646 | 28,435 | ||||||||||||||||||
| Financial liabilities designated at fair value | — | 808 | 1,285 | 2,277 | 983 | 5,353 | ||||||||||||||||||
| Debt securities in issue | — | 4,916 | 7,230 | 18,453 | 58,236 | 88,835 | ||||||||||||||||||
| Loan commitments | 17,515 | 1,135 | 2,447 | 8,009 | 7,536 | 36,642 | ||||||||||||||||||
| Subordinated liabilities | — | 238 | 289 | 1,686 | 8,696 | 10,909 | ||||||||||||||||||
| 131,043 | 39,527 | 35,397 | 51,968 | 78,340 | 336,275 | |||||||||||||||||||
| Derivative financial instruments | — | 6 | 47 | 382 | 1,005 | 1,440 | ||||||||||||||||||
| Total financial liabilities | 131,043 | 39,533 | 35,444 | 52,350 | 79,345 | 337,715 | ||||||||||||||||||
| At 31 December 2011 | Demand £m | Up to 3 months £m | 3-12 months £m | 1-5 years £m | Over 5 years £m | Total £m | ||||||||||||||||||
| Deposits by banks | 2,980 | 3,061 | 37 | 5,887 | — | 11,965 | ||||||||||||||||||
| Deposits by customers | 104,113 | 10,063 | 21,135 | 13,575 | 475 | 149,361 | ||||||||||||||||||
| Trading liabilities | 7,781 | 14,488 | 1,415 | 1,564 | 656 | 25,904 | ||||||||||||||||||
| Financial liabilities designated at fair value | — | 1,632 | 1,635 | 3,074 | 1,015 | 7,356 | ||||||||||||||||||
| Debt securities in issue | — | 5,133 | 4,177 | 18,245 | 48,156 | 75,711 | ||||||||||||||||||
| Loan commitments | 16,013 | 1,847 | 4,044 | 7,846 | 7,730 | 37,480 | ||||||||||||||||||
| Subordinated liabilities | — | 194 | 293 | 1,554 | 9,023 | 11,064 | ||||||||||||||||||
| 130,887 | 36,418 | 32,736 | 51,745 | 67,055 | 318,841 | |||||||||||||||||||
| Derivative financial instruments | — | 6 | 24 | 504 | 974 | 1,508 | ||||||||||||||||||
| Total financial liabilities | 130,887 | 36,424 | 32,760 | 52,249 | 68,029 | 320,349 | ||||||||||||||||||
As the above table is based on contractual maturities, no account is taken of call features related to subordinated liabilities. The repayment terms of debt securities may be accelerated in line with the covenants described in Note 34 of the Group’s 2011 Annual Report. In addition, no account is taken of the possible early repayment of the Group’s mortgage-backed non-recourse finance which is redeemed by the Group as funds become available from redemptions of the residential mortgages. The Group has no control over the timing and amount of redemptions of residential mortgages.
The maturity analyses above for derivative financial liabilities include the remaining contractual maturities for those derivative financial liabilities for which contractual maturities are essential for an understanding of the timing of the cash flows. These consist of interest rate swaps and cross-currency swaps which are used to hedge the Group’s exposure to interest rates and exchange rates, and all loan commitments.
OPERATIONAL RISK
Definition
Operational risk is the risk of loss to the Group, resulting from inadequate or failed internal processes, people and systems, or from external events. This includes regulatory, legal and compliance risk. Such risks can materialise as frauds, process failures, system downtime or damage to assets due to fire, floods for example. When such risks materialise they have not only immediate financial consequences for the Group but also an effect on its business objectives, customer service and regulatory responsibilities.
Objective
As operational risk is inherent in the processes the Group operates in order to provide services to customers and generate profit for investors, an objective of operational risk management is not to remove operational risk altogether but to manage the risk to an acceptable level, taking into account the cost/benefits of minimisation as opposed to the inherent risk levels.
The Operational Risk Framework
Operational risk exposures arise across the Group’s business divisions and operating units, and are managed on a consistent basis. The aim pursued by the Group in operational risk management is to identify, measure/assess, control/mitigate and inform regarding this risk. The Group’s priority is to identify and minimise the risk of loss wherever appropriate, irrespective of whether losses have occurred. Measurement of the risk also contributes to the establishment of priorities in operational risk management, and includes the use of such methods as:
| > | Scenario analysis; |
| > | Risk and control self-assessment; |
| > | Capture and analysis of losses and incidents; and |
| > | The use of key risk indicators to monitor risks and set tolerance levels. |
The operational risk framework creates the consistent approach to how the Group controls and manages its operational risks and helps everyone understand their responsibilities within this approach. The operational risk framework is a core component of the overall risk framework and crucially involves the setting of risk appetite, risk and issue escalation processes, and underpins management approaches to the control environment. The framework facilitates the ongoing reassessment of risk, appetites and controls, in order to ensure that the Group manages its risks at all times in line with its business objectives.
Further enhancements to the risk framework have been approved by the Board during 2012 with the aim of extending the methods for managing operational risks increasing the transparency of risk management, and producing a tighter internal control framework which enhances the assurance that risks are being managed consistently and appropriately across the business.
For the purpose of calculating capital for operational risk, the Group employs the standardised approach provided for under Basel II rules in line with the Banco Santander, S.A. group. The Group also uses its operational risk data and especially its stress and scenario data to assess its capital adequacy.
Managing operational risk
The framework defines the operational risk requirements to be adhered to. The Group obtains assurance that the appropriate standards of risk management are being maintained through the application of the Group’s risk governance framework as follows:
| > | The day-to-day management of operational risk is the responsibility of business managers who identify, assess and monitor the risks in line with the processes described in the operational risk framework. The Group undertakes extensive activity to minimise the impact operational risks may have on business areas. A specialist operational risk function (IT & Operational Risk) co-ordinates this activity. They are responsible for challenging the adequacy of the risk and control processes operating in the business and monitoring adherence to the operational risk framework. They are also responsible for co-ordinating the implementation and maintenance of the operational risk framework tools and methodologies and ensuring that all key risks are regularly reported, as appropriate, to the Executive Risk Committee and the Executive Committee. |
| > | An independent central operational risk function has responsibility for establishing the framework within which the risks are managed, providing the direction for delivering effective operational risk management, as well as overseeing its implementation to ensure consistent approaches are applied across the Group. The primary purpose of the framework is to define and articulate the Group-wide policy, processes, roles and responsibilities. The framework incorporates industry practice and regulatory requirements. |
| > | The Internal Audit function provides an independent assurance around the design, implementation, and effectiveness of the Group’s operational risk framework. |
This approach applies throughout the Group and is implemented taking account of the materiality and perceived risk of the different business areas by using the following key operational risk management techniques:
Scenario Analysis
The Group performs simulations of control failures that may cause the most extreme loss events. These simulations are developed around high impact risks likely to exceed the Group’s future appetite. The scenario analysis allows management to better understand the potential impacts and remediate issues:
| > | identifying the high impact events that would most damage the Company financially and reputationally; |
| > | ensuring that the business is focused on its most critical risks; and |
| > | facilitating the assessment of capital adequacy. |
Risk and Control Self Assessments
Business units identify and assess their operational risks to ensure they are being effectively managed and controlled, and actions prioritised and aligned to the Group’s risk appetite.
Key Risk Indicators
The Group uses key risk indicators to monitor, and mitigation strategies to manage, operational risks. Indicator metrics are used to provide insight into the changing risk profile of the organisation and are also used to assess the performance of key controls.
Key risk indicator performance is monitored against tolerances and trigger points that prompt an early warning to potential exposures, whilst the creation of mitigation strategies help address potential concerns.
Loss Data Management
Loss data capture and analysis processes exist to capture all operational risk loss events. The data is used to identify and correct control weaknesses using events as opportunities to prevent or reduce the impacts of recurrence, identify emerging themes, inform risk and control assessments, scenario analysis and risk reporting. Escalation of single or aggregated events to senior management and risk fora is determined by threshold breaches.
Reporting
Reporting forms an integral part of operational risk management ensuring that issues are identified, escalated and managed on a timely basis. Exposures for each business area are reported through monthly risk and control reports which include details on risk exposures and mitigating plans. Events that have a material impact on the Group’s finances, reputation, or customers are prioritised and reported immediately to key executives.
Measurement
A high proportion of the Group’s operational risk events have a low financial cost associated with them and only a very small proportion have a material impact. Operational risk loss events are categorised using the international Basel standards as follows:
2012 operational risk loss profile
The percentage distribution of the value and number of loss events by event type during first half of 2012 is shown in the table below:
| Event type | 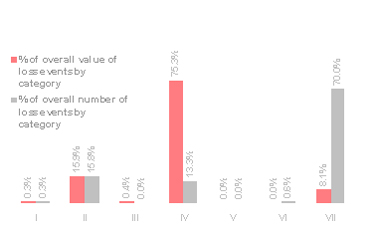 |
I Internal Fraud | |
II External Fraud | |
III Employment Practices | |
IV Clients Products & Business Practices | |
V Business Disruption | |
VI Damage To Physical Assets | |
| VII Execution, Delivery & Process Management |
In the first half of 2012, 70% of operational risk events fell within execution, delivery and process management category and yet these accounted for only 8.1% of the losses by value. In contrast, over 75% of losses by value were caused by only 13% of operational risk events. These principally represented payouts on the sales of payment protection insurance (‘PPI’) products under the ‘clients, products and business practices’ category. See Note 25 to the Condensed Consolidated Interim Financial Statements for more information on PPI. This demonstrates the critical operational risk challenges for the Group in reducing the volume and impact of operational risk events (some of the Company’s critical responses are contained in its approach to service quality and conduct risk – see section on customer risk activity below).
Key operational risk activity in the first half of 2012
Santander UK manages its key operational risks in the interest of all its stakeholders, responding to critical developments both within the Group and in the environment in which it operates. Below are some of the key risks and the activities undertaken to manage them during the first half of 2012.
Financial crime risk
Financial crime risk is the risk of reductions in earnings and/or value, through financial or reputational loss, associated with financial crime and failure to comply with related legal and regulatory obligations, these losses may include censure, fines or the cost of litigation.
The Group has continued to invest in staff education and improved fraud detection and prevention systems, processes and controls in order to counter the increasing threat of financial crime and to safeguard the investments of the Group’s customers and assets. The introduction of sophisticated chip and pin terminals at counters in the Group’s retail branches, for example, has reduced the risk of fraudulent account takeovers by organised criminals by enhancing our customer identification protocols in a customer-friendly manner.
The Group Financial Crime Team and Fraud Oversight function continually monitor emerging fraud trends and losses on a case-by-case basis. Action plans are formulated and tracked to ensure root causes have been identified and effective remediation conducted.
Losses and prevention strategies deployed in response to financial crime are escalated to the Executive Risk Committee as appropriate.
Cyber security risk
Cyber security risk is the risk of reductions in earnings and/or value, through financial or reputational loss, associated with the failure of electronic information security or failure to comply with related legal and regulatory obligations. These losses may include censure, fines or the cost of litigation.
All customer, employee and Group data is considered confidential and appropriate security is applied to protect it. The Group continues to invest in the protection of customer, employee and Group information to reduce the risks associated with the loss of confidentiality, integrity and of availability of this information. Measures taken to reduce the risks include staff education, data encryption and the deployment of specialist software such as Rapport which identifies when internet banking customers are at risk of disclosing information to unauthorised parties.
Losses and prevention strategies deployed in response to cyber security are escalated to the Executive Risk Committee as appropriate.
Human resources risk
The risk of reductions in earnings and/or value, through financial or reputational loss, from inappropriate colleague actions and behaviour, industrial action, legal action in relation to people, or health and safety issues. Loss can also be incurred through failure to recruit, retain, train, reward and incentivise appropriately skilled staff to achieve business objectives and through failure to take appropriate action as a result of staff underperformance.
The Group takes a robust approach to managing human resources risk in full alignment with the operational risk framework. The Group has a mandatory training suite and policies which set out minimum standards and aim to mitigate risk in the areas of:
| > | Attraction and retention of suitable employees, using appropriate recruitment and pre-employment checks; |
| > | Reward; |
| > | Performance Management, Training & Development of employees; |
| > | Succession Planning and continuing investment in people; |
| > | Whistleblowing, Disciplinary & Grievance Management; |
| > | Gathering employee opinion and managing employee engagement; |
| > | Hiring former employees of the statutory auditor; and |
| > | Health and Safety. |
Conformance to policies is monitored through a comprehensive committee structure which reviews and actions enhancements on an ongoing basis. Risks are identified, managed and mitigated through ongoing risk management practices. Significant risks are reported to the Internal Control Committee and the Executive Risk Committee, as appropriate.
The Group has a robust employee relations governance framework in place that enables regular consultation at both national and local levels with its recognised trade unions enabling the Group to maintain a stable employee relations climate minimising any risk of disruption.
Significant progress has been made on harmonising terms and conditions from the Group’s acquisitions, and a key focus for 2012 is preparing for the acquisition and integration from RBS of a number of branches, regional offices and associated customers to ensure strong risk controls are maintained.
The Group has worked to develop its employer brand to embed an identity and a set of recognisable cultural values in a sector that is dominated by established brand names. The outcomes of this activity will underpin the Group’s recruitment proposition and communications, to support attracting new talent into the organisation.
Customer and conduct risk
The risk of reductions in earnings and/or value, through financial or reputational loss, from inappropriate or poor customer treatment (customer treatment risk) or reductions resulting from poor externally-facing business processes (customer process risk). Customer process risk includes customer transaction and processing errors due to incorrect capturing of customer information and/or system failure.
Customer risks are primarily managed through the Group Service Quality framework. Service Quality is an independent function which guides, supports, reviews and reports on customer satisfaction as measured through surveys (20,000 retail customers each month), agreed service levels and feedback via complaints. There is regular reporting to Executive Committee members and other senior directors across the business. Payments arising from complaints and root cause improvement initiatives are managed within the operational risk and losses framework.
Over recent years, the Group has grown significantly. It has integrated Abbey, the Bradford & Bingley savings business and Alliance & Leicester into its UK operations. Currently, preparations are continuing for the acquisition and integration of a number of branches, regional offices and associated customers from RBS. This period of growth and business change has been challenging in a time of turbulence in financial markets and many actions have been taken to minimise the operational risks arising whilst meeting key customer requirements by enhancing the network including expanding the number of branches and customer facing roles as well as providing more dedicated customer help lines to resolve any customer problems that might arise.
Conduct risk reviews of the Group’s product offering began in 2011 in response to this emerging risk. Reviews are focused on the simplification of the Group’s product offerings and product communications. A conduct risk management framework has been produced with a governance structure which includes the Internal Control Committee and an executive level Product Approval & Oversight Committee created to provide challenge and oversight for product development proposals and post-implementation reviews, as well as a Product Office to centralise product information and monitoring.
A number of customer service initiatives began in 2012, including the launch of Customer Experience Working Groups whilst significant time has been invested in Treating Customers Fairly training in the branch network.
Regulatory, legal and compliance risk
Regulatory, legal and compliance risk includes the risk of reductions in earnings and/or value, through financial or reputational loss, from failing to comply with the laws, regulations or codes applicable or through incomplete legal documentation.
Regulatory, legal and compliance exposure is driven by the significant volume of current legislation and regulation with which the Group has to comply, along with new legislation and regulation which needs to be reviewed, assessed and embedded into day-to-day operational and business practices across the Group as a whole. Following the financial crisis, the pace and extent of regulatory reform proposals, both in the UK and internationally, have increased significantly, and can be expected to remain at high levels. Future changes in regulation, fiscal or other policies are unpredictable and beyond the control of the Group, but could for instance affect the Group’s future business strategy, structure or approach to funding. Further uncertainties arise where regulations are principles-based without the regulator defining supporting minimum standards either for the benefit of the consumer or firms. This gives rise to both the risk of retrospection from any one regulator and also to the risk of differing interpretation by individual regulators.
For legal and regulatory issues there are significant reputational impacts associated with potential censure which drive the Group’s stance on the appetites referred to above. There are clear accountabilities and processes in place for reviewing new and changing requirements. Each division and significant business areas have a nominated individual with ‘compliance oversight’ responsibility under UK Financial Services Authority rules. The role of such individuals is to advise and assist management to ensure that each business has a control structure which creates awareness of the FSA rules and regulations, to which the Group is subject, and to monitor and report on adherence to these rules and regulations.
Basel II
Santander UK’s risk management complies with Basel principles. The Group applies the retail internal ratings-based approach for credit risk to its key retail portfolios. Beyond retail, a combination of internal ratings-based approaches is employed for the principal portfolios. For the remaining credit exposures, currently on the Basel II standardised approach, a rolling programme of transition to the appropriate IRB approach continues. The standardised approach for operational risk continues to be applied.
The Group applied Basel II to its capital disclosures made to the market. The Group has applied Banco Santander, S.A.’s approach to risk management in its application of Basel II. Further information on the Group’s capital position under Basel II is included in Note 34 to the Condensed Consolidated Interim Financial Statements.
Further information on the Basel II risk measurement of the Group’s exposures is included in Banco Santander, S.A.’s 2011 Pillar 3 disclosures report. The Group’s Pillar 3 disclosures are set out in the Balance Sheet Business Review section on page 40.
Forthcoming regulatory changes
In forecasting the Group’s capital and liquidity positions, the implications of forthcoming regulatory changes (commonly referred to as Basel III), have been taken into account. In cases where proposed rules are still in the formative stage, the Group has applied appropriately conservative assumptions. Similarly, a conservative approach has been adopted in respect of the proposed implementation timescales, to allow for acceleration by the regulatory authorities.
Further information on Basel III and additional potential forthcoming regulatory changes, specifically the Independent Commission on Banking (‘ICB’) are listed below.
(i) Independent Commission on Banking and White Paper on banking reform
The Government appointed an Independent Commission on Banking (‘ICB’) to review possible measures to reform the banking system and promote stability and competition. The ICB published its final report on the 12 September 2011 putting forward recommendations to require ring-fencing of the retail activities of banks from their investment banking activities and additional capital requirements beyond those required under current drafts of the Capital Requirements Directive IV. The report also makes recommendations in relation to the competitiveness of the UK banking market, including enhancing the competition remit of the new Financial Conduct Authority (‘FCA’), implementing a new industry-wide switching solution by September 2013, and improving transparency.
The ICB recommended that ring-fenced banks should hold a common equity capital base of at least 10% and primary loss-absorbing capacity of at least 17% to absorb the impact of potential losses or financial crises. The ICB, which following the final report completed its mandate, had the authority only to make recommendations, which the Government could choose to accept or reject.
The Government published its response to the ICB recommendations on 19 December 2011 and, following an extensive first consultation, it published a White Paper on 14 June 2012, setting out its more detailed proposals for implementing the ICB’s recommendations. Its intention remains to complete primary and secondary legislation before the end of the current Parliamentary term in May 2015 and for banks to comply with all the measures proposed in the paper by 2019, as the ICB recommended. The Government also reaffirmed its determination that changes to the account switching process should be completed by September 2013, as already scheduled. A further period of consultation has now been established, which runs until 6 September 2012.
The content of the White Paper was broadly in line with expectations following the Response, with ring-fencing to be implemented as set out in the ICB recommendations and loss-absorbency requirements also largely consistent.
Given that the Group is predominantly a retail and commercial bank, it would expect to be less affected by the implementation of a retail ringfence, but believes it will be important for any transition period to be flexible in order to minimise any impact on economic growth, and for banks to implement the required structural changes.
(ii) Basel III
Basel III is a comprehensive set of reform measures, developed by the Basel Committee on Banking Supervision, to strengthen the regulation, supervision and risk management of the banking sector. These measures aim to: (i) improve the banking sector's ability to absorb shocks arising from financial and economic stress, whatever the source; (ii) improve risk management and governance; and (iii) strengthen banks' transparency and disclosures. The reforms target: (a) bank-level, or micro-prudential, regulation, with the aim of helping raise the resilience of individual banking institutions to periods of stress, and (b) macro-prudential, system-wide risks that can build up across the banking sector as well as the pro-cyclical amplification of these risks over time. These two approaches to supervision are complementary as greater resilience at the individual bank level reduces the risk of system-wide shocks. The European Commission published its proposed legislation for the CRD and the Capital Requirements Regulation, which together form the CRD IV package, in July 2011. As well as reflecting the Basel III capital proposals, the CRD IV package also includes new proposals on sanctions for non-compliance with prudential rules, corporate governance and remuneration. These changes are due to be implemented beginning in January 2013. The Group is currently engaged in the assessment of the impact of the Basel III measures. See “Basel III” in “Capital Management and resources” on page 40 of the Balance Sheet Business Review for further information, including an estimate of the effect of Basel III.
(iii) Crisis Management Directive and European Banking Union
The financial crisis provided clear evidence of the need for more robust crisis management arrangements as well as the need for better cross border banking arrangements. On 6 June 2012, the European Commission adopted a legislative proposal known as the Crisis Management Directive for bank recovery and resolution. The framework set out necessary steps and powers to ensure that bank failures across the EU are managed in a way which avoids financial instability and minimises costs for the taxpayer. The proposals establish a framework for the recovery and resolution of banks and investment firms. Proposals within the Directive include having a resolution ‘Bail-In’ tool which will see the costs borne by the taxpayer being borne by bank shareholders and creditors. The draft Directive also proposes ‘resolution funding’ whereby a fund is created to which banks contribute. In addition, the Directive proposed a mechanism whereby national funds can borrow from each other. The proposals are expected to come into force from 1 January 2015, although the Bail-In regime will be delayed until 1 January 2018. In June, the European Commission published ideas for a European Banking Union to help pave the way towards deeper economic integration. The Commission proposed (i) an integrated system for the supervision of cross-border banks, (ii) a single deposit guarantee scheme and (iii) an EU resolution fund. Later that month the President of the European Council published a report on establishing a stable economic and monetary union. The report proposed a vision for a stable and prosperous union based on a number of essential building blocks: (i) an integrated financial framework; (ii) an integrated budgetary framework; and (iii) an integrated economic policy framework. A further report is expected by 11 September 2012 and consultations with Member States and EU institutions will take place in due course.
(iv) Liquidity Risk Management
The Group notes the Basel Committee’s Principles of Sound Liquidity Risk Management and Supervision (Sound Principles). The planned introduction of the Liquidity Coverage Ratio (LCR – January 2015) and Net Stable Funding Ratio (NSFR – January 2018) contained within CRD IV are intended to raise the resilience of banks to potential liquidity shocks and provide the basis for a harmonised approach to liquidity risk management. The LCR measure promotes short-term resilience of the liquidity profile by ensuring that banks have sufficient high quality liquid assets to meet potential funding outflows in a stressed environment within a one month period. The NSFR promotes resilience over a longer time horizon by requiring banks to fund their activities with a more stable source of funding on a going concern basis. This has a time horizon of one year and has been developed to ensure a sustainable maturity structure of assets and liabilities.
The guidance issued by the Basel Committee is still subject to final ratification by the EU and the methodology is likely to be refined on the basis of feedback from banks and regulators during the observation period.
(v) Other
There are a number of other regulatory developments going through a consultation and implementation process which may have some effect on the Group’s business. These include the FSCS arrangements, consumer credit regulations, financial stability, and conduct of business arrangements such as those resulting from the Retail Distribution Review, and the Mortgage Market Review.
OTHER RISKS
PENSION OBLIGATION RISK
Definition
Pension obligation risk is the risk of an unplanned increase in funding required by the Group’s pension schemes, either because of a loss of net asset value or because of changes in legislation or regulatory action.
Managing pension obligation risk
The Group has statutory funding obligations as the sponsoring employer for a number of defined benefit pension schemes. The schemes are managed by independent trustees in accordance with legislation and trust deeds and rules, for the benefit of members. The Group accepts that it is exposed to pension obligation risk that could give rise to an unexpected increase in the Group’s obligations to fund the schemes, either because of a loss of net asset value or because of changes in legislation or regulatory action. The principal risks to the net asset value of the schemes arise from an increase in the value of the liabilities due to reductions in the discount rate, increases in inflation, adverse changes in the longevity assumptions, and the scheme assets being adversely affected by market movements.
The Group works closely with the pension Trustees to ensure that appropriate asset allocations are maintained, and to minimise the long-term cost of the pension scheme to the Group while managing risk and volatility. The Chief Financial Officer is responsible for managing the Group’s exposure to pension obligation risk, in conjunction with the trustees. The Group’s Strategic Pensions Committee, under the authority of the Chief Executive Officer, is responsible for the strategic management of pensions strategy and reviews actuarial valuations and assumptions and the impact on the Group’s contributions, capital and funding arrangements, in addition to reviewing the pension risk exposure and impact to ensure it is in line with the Group’s risk appetite. Further information on pensions can be found in ‘Critical Accounting Policies’ in Note 1 and in Note 26 to the Condensed Consolidated Interim Financial Statements.
BUSINESS/STRATEGIC RISK
Definition
Business/strategic risk is the current or prospective risk to earnings and capital arising from changes in the business environment and from adverse business decisions, improper implementation of decisions or lack of responsiveness to changes in the business environment. This includes pro-cyclicality and capital planning risk. The internal component is the risk related to implementing the strategy. The external component is the risk of the business environment change on the Group’s strategy.
Managing business/strategic risk
Business/strategic risk is managed on a monthly basis by the Executive Risk Committee via the Economic Capital model. This is further discussed in the ‘Economic Capital’ section. In addition, economically driven risks are assessed through the Group’s stress-testing programme.
REPUTATIONAL RISK
Definition
Reputational risk is the risk of financial loss or reputational damage arising from treating customers unfairly, a failure to manage risk, a breakdown in internal controls, or poor communication with stakeholders. This includes the risk of decline in the value of the Group’s franchise potentially arising from reduced market share, a change in business development expectations, complexity, tenor and performance of products and distribution mechanisms. Reputational risk also relates to judicial, economic-financial, ethical, social and environmental aspects, amongst others.
Managing reputational risk
Reputational risk is managed within the operational risk framework and other internal control and approval processes, and is undertaken by various governance structures, depending on where the risk originated from. The management of reputational risk which could arise from an inadequate product sales process or an inappropriate provision of service, or non-compliance is undertaken by the following bodies:
a) The Executive Risk Committee
As the senior body responsible for the management of risk, the committee assesses reputational risk whenever it is relevant to its activities and decision-making.
b) The Product Approval and Oversight Committee
This committee is currently chaired by the Chief Financial Officer and has representatives from Risk, Product Development and Marketing, Regulatory Affairs, Compliance, Manufacturing, Customer Experience, Finance, Legal, Human Resources, and Internal Governance and Control as members. It is the decision-making body which approves and monitors products and services. The scope of the Product Approval and Oversight Committee in respect of new products is as follows:
| > | Approving all new products; |
| > | Ensuring each division has stated its opinion and given the required approvals; |
| > | Ensuring adherence to all applicable new product approval policies; |
| > | Reviewing policies established for the control of all new product approvals; |
| > | Defining the Company’s culture in terms of managing conduct risk; and |
| > | Ensuring the policy for approving the launch of new products is complied with across all business areas. |
The Product Approval and Oversight Committee pays particular attention to ensuring that any product or service sold adheres to the risk management framework and especially to ensuring that:
| > | Each product or service is sold by someone who knows how to sell it; |
| > | The client knows what he or she is investing in and the risk of each product or service and this can be evidenced by relevant documents; |
| > | The product or service fits the customer’s risk profile; |
| > | Each product or service sold meets legal or tax requirements in the relevant jurisdiction and takes into account the prevailing financial culture; and |
| > | When a product or service is approved the maximum limits for placement are set. |
RESIDUAL VALUE RISK
Definition
Residual value risk is the risk that the value of an asset at the end of a contract may be worth less than that required to achieve the minimum return from the transaction that had been assumed at its inception. Residual value risk relates to the operating lease assets of the Group, which consist of commercial vehicles and other assets to its corporate customers, of which the Group is the lessor, and the finance lease assets, which consist mainly of office fixtures and equipment of which the Group is the lessee.
Managing residual value risk
Residual value risk is controlled through asset specific policies and delegated authorities agreed by the Executive Risk Committee. The residual value risk is reassessed each time a new lease is written or an existing lease renewed and extended. In addition, portfolio impairment reviews are undertaken and independently evaluated and signed-off by the Risk Division, with impairment loss allowances being raised where appropriate.
Use of outsourcing
Following the outsourcing of key IT and operations processes (including information technology support, maintenance and consultancy services in connection with Partenon, the global banking informational technology platform utilised by Banco Santander, S.A. to which the Group transitioned in 2008) to Banco Santander, S.A. group companies, risk governance of these entities is crucial. The Group uses written service level agreements with these entities that include key service performance metrics to support this governance. The high-level governance processes include relationship management, service delivery management and contract management. Across these, there are a number of more detailed processes including:
| > | Policy processes acceptance, development and implementation, |
| > | Compliance, |
| > | Dispensation, |
| > | Performance management, |
| > | Business control, |
| > | Change control, |
| > | Environment management, and |
| > | Billing analysis and review. |
The Group works closely, and continues to enhance its interaction, with outsourced service providers via the application of appropriate risk frameworks. These frameworks include processes and procedures designed to ensure that, with appropriate periodicity, arrangements are in place to ensure continuity of critical services up to and including disaster scenarios and that these plans are regularly validated through testing.
FINANCIAL INSTRUMENTS OF SPECIAL INTEREST
This section summarises the types of financial instruments which have been of special interest as a result of the economic environment of the last few years. The table below shows the type of financial instrument and where they are classified on the Group’s Consolidated Balance Sheet. It also provides cross references to the Notes to the Condensed Consolidated Interim Financial Statements containing additional analysis of the significant assets.
The Group’s financial instruments which are considered to have been most affected by the current credit environment include floating rate notes (‘FRNs’), asset-backed securities (‘ABS’) (including mortgage-backed securities (‘MBS’) and the Group’s exposures to monoline insurers), Collateralised Debt Obligations (‘CDOs’), Collateralised Loan Obligations (‘CLOs’), loans to banks, certain credit derivatives in the Treasury Asset Portfolio, and off-balance sheet entities. The Group has no holdings in Structured Investment Vehicles.
The Group aims to actively manage these exposures. Additional information on the Group’s exposures by country is disclosed in ‘Balance Sheet Business Review – Country risk exposure’.
CLASSIFICATION IN THE CONSOLIDATED BALANCE SHEET
The classification of these assets in the Group’s Consolidated Balance Sheet, and cross references to the Notes to the Condensed Consolidated Interim Financial Statements containing additional analysis of the significant assets, is as follows:
| 30 June 2012 | Type of Financial Instruments | |||||||||||||||||||||||||||||||||||||||
| Note | FRN | ABS | CDO | CLO | Loans | Derivatives(1) | OECD Govt debts | Other | Total | |||||||||||||||||||||||||||||||
| Balance sheet line item | £m | £m | £m | £m | £m | £m | £m | £m | £m | |||||||||||||||||||||||||||||||
| Trading assets – debt securities | 7 | 2,081 | — | — | — | — | — | 3,868 | — | 5,949 | ||||||||||||||||||||||||||||||
| Derivatives – equity & credit contracts | 8 | — | — | — | — | — | 13 | — | — | 13 | ||||||||||||||||||||||||||||||
Financial assets designated at fair value – debt securities | 9 | — | 361 | — | — | — | — | — | 242 | 603 | ||||||||||||||||||||||||||||||
| Loans and advances to banks | 10 | — | — | — | 2,496 | — | — | — | 2,496 | |||||||||||||||||||||||||||||||
| Available-for-sale – debt securities | 15 | 146 | — | — | — | — | — | 4,683 | — | 4,829 | ||||||||||||||||||||||||||||||
| Loans and receivables securities | 16 | 226 | 1,062 | 3 | 87 | — | — | — | 21 | 1,399 | ||||||||||||||||||||||||||||||
| 2,453 | 1,423 | 3 | 87 | 2,496 | 13 | 8,551 | 263 | 15,289 | ||||||||||||||||||||||||||||||||
| 31 December 2011 | Type of Financial Instruments | |||||||||||||||||||||||||||||||||||||||
| Note | FRN | ABS | CDO | CLO | Loans | Derivatives(1) | OECD Govt debts | Other | Total | |||||||||||||||||||||||||||||||
| Balance sheet line item | £m | £m | £m | £m | £m | £m | £m | £m | £m | |||||||||||||||||||||||||||||||
| Trading assets – debt securities | 7 | 5,768 | — | — | — | — | — | 2,943 | — | 8,711 | ||||||||||||||||||||||||||||||
| Derivatives – equity & credit contracts | 8 | — | — | — | — | — | 16 | — | — | 16 | ||||||||||||||||||||||||||||||
| Financial assets designated at fair value – debt securities | 9 | — | 379 | — | — | — | — | — | 250 | 629 | ||||||||||||||||||||||||||||||
| Loans and advances to banks | 10 | — | — | — | — | 4,487 | — | — | — | 4,487 | ||||||||||||||||||||||||||||||
| Loans and receivables securities | 16 | 515 | 1,142 | 3 | 90 | — | — | — | 21 | 1,771 | ||||||||||||||||||||||||||||||
| 6,283 | 1,521 | 3 | 90 | 4,487 | 16 | 2,943 | 271 | 15,614 | ||||||||||||||||||||||||||||||||
| (1) | Credit derivatives – Treasury Asset Portfolio. In November 2010, the Group acquired a portfolio of loans to banks, asset-backed securities and related credit derivatives, as part of an alignment of portfolios across the Banco Santander, S.A. group. Disclosures regarding the geographic location of the counterparties to the credit derivatives recognised as a result of the acquisition of that portfolio are set out in the “Corporate Centre” section within “Credit Risk” on page 100. Further information on all the Group’s holdings of derivatives (including these credit derivatives) is set out in Note 8 to the Condensed Consolidated Interim Financial Statements. |
EXPOSURE TO OFF-BALANCE SHEET ENTITIES SPONSORED BY THE GROUP
Certain Special Purpose Entities (‘SPEs’) are formed by the Group to accomplish specific and well-defined objectives, such as securitising financial assets. The Group consolidates these SPEs when the substance of the relationship indicates control, as described in Note 1 of the Consolidated Financial Statements in the Group’s 2011 Annual Report. Details of SPEs sponsored by the Group (including SPEs not consolidated by the Group) are set out in Notes 12 and 13 to the Condensed Consolidated Interim Financial Statements.
The only SPEs sponsored but not consolidated by the Group are SPEs which issue shares that back retail structured products. The Group’s arrangements with these entities comprise the provision of equity derivatives and a secondary market-making service to those retail customers who wish to exit early from these products.
Principal Risks and Uncertainties
Our Group’s 2011 Annual Report outlines our assessment of the principal risks and uncertainties facing the Group, together with the processes that are in place to monitor and mitigate those risks where possible. Material risk factors are described in the Risk Factors section on page 186 to 199 of this Half Yearly Financial Report. Financial risks are described in the Risk Management Report for each segment of the business by type of risk on pages 61 to 114 of this Half Yearly Financial Report.
Financial risks are:
| > | Credit risk; |
| > | Market risk; |
| > | Funding and Liquidity risk; |
| > | Operational risk; and |
| > | Other risks, including business/strategic risk, reputational risk, pension obligation risk and residual value risk |
Material risk factors are:
| > | The Group’s operating results, financial condition and prospects may be materially impacted by economic conditions in the UK; |
| > | The Group’s operating results, financial condition and prospects may be negatively affected by conditions in global financial markets; |
| > | The Group may suffer adverse effects as a result of the ongoing economic and sovereign debt crisis in the eurozone; |
| > | The Group may suffer adverse effects should eurozone member states exit the euro or the euro be totally abandoned; |
| > | The Group’s risk management measures may not be successful; |
| > | The Group has a significant exposure to the UK real estate market; |
| > | Risks concerning borrower credit quality are inherent in the Group’s business; |
| > | The soundness of other financial institutions could materially and adversely affect the Group’s business; |
| > | Risks associated with liquidity and funding are inherent in the Group’s business; |
| > | The Group is subject to regulatory capital and liquidity requirements that could limit its operations, and changes to these requirements may further limit and adversely affect its operating results, financial condition and prospects; |
| > | Any reduction in the credit rating assigned to the Group, any member of the Group or to any Group debt securities would be likely to increase the Group’s cost of funding, require additional collateral to be placed and adversely affect its interest margins and liquidity position; |
| > | Fluctuations in interest rates, bond and equity prices and other market factors are inherent in the Group’s business; |
| > | Currency fluctuations may adversely affect the Group’s operating results, financial condition and prospects; |
| > | Market conditions have, and could result, in material changes to the estimated fair values of financial assets of the Group. Negative fair value adjustments could have a material adverse effect on the Group’s operating results, financial condition and prospects; |
| > | A core strategy of the Company is to grow the Group’s operations and it may not be able to manage such growth effectively, which could have an adverse impact on its profitability; |
| > | The Company may incur unanticipated losses related to its business combinations; |
| > | The Group may fail to realise the anticipated benefits of the Company’s recent or proposed business combinations; |
| > | Goodwill impairments may be required in relation to certain of the Company’s acquired businesses; |
| > | The Group’s business is conducted in a highly competitive environment; |
| > | Operational risks are inherent in the Group’s business; |
| > | The Group relies on recruiting, retaining and developing appropriate senior management and skilled personnel; |
| > | Reputational risk could cause harm to the Group and its business prospects; |
| > | Legislative, regulatory and governmental oversight and current banking reform initiatives and requirements could have a material adverse effect on the Group; |
| > | Tax and compliance changes (including the UK bank levy and FATCA) could have a material adverse effect on the Group’s business; |
| > | The Group is exposed to various forms of legal and regulatory risk which could have a material adverse effect on its operating results, financial condition and prospects or relations with its customers; |
| > | The structure of the financial regulatory authorities in the UK and the UK regulatory framework that applies to members of the Group is the subject of reform and reorganisation; |
| > | Various reforms to the mortgage lending market have been proposed which could require significant implementation costs or changes to the business strategy of the Group; |
| > | Potential intervention by the UK Financial Services Authority (or an overseas regulator) may occur, particularly in response to customer complaints; |
| > | Members of the Group are responsible for contributing to compensation schemes in the UK in respect of banks and other authorised financial services firms that are unable to meet their obligations to customers; |
| > | The Banking Act may adversely affect the Group’s business; |
| > | The Group’s operations are highly dependent on its information technology systems; |
| > | Third parties may use the Group as a conduit for illegal activities without the Group’s knowledge, which could have a material adverse effect on the Group; |
| > | Changes in the pension liabilities and obligations of the Group could have a materially adverse effect on the Group; and |
| > | Risks concerning enforcement of judgements made in the United States. |
Looking forward to the second half of the current financial year, we believe that the risks and uncertainties identified above are still applicable.
Related Party Transactions
For a full description of related party activity at 31 December 2011, please refer to Note 44 of the Group’s 2011 Annual Report. Significant changes to these arrangements during the first half of the year are described in Note 31 of the Group’s 2012 Condensed Consolidated Interim Financial Statements.
Directors’ Responsibility Statement
This Half Yearly Financial Report is the responsibility of the Directors. See ‘Directors’ Responsibility Statement’ on page 208.
FINANCIAL STATEMENTS
PRIMARY FINANCIAL STATEMENTS
Condensed Consolidated Income Statement
For the six months ended 30 June 2012 and 2011
| Notes | Six months ended 30 June 2012 £m | Six months ended 30 June 2011 £m | ||||||||||
| Interest and similar income | 3,828 | 3,933 | ||||||||||
| Interest expense and similar charges | (2,269 | ) | (1,952 | ) | ||||||||
| Net interest income | 1,559 | 1,981 | ||||||||||
| Fee and commission income | 557 | 526 | ||||||||||
| Fee and commission expense | (122 | ) | (94 | ) | ||||||||
| Net fee and commission income | 435 | 432 | ||||||||||
| Net trading and other income | 3 | 236 | 254 | |||||||||
| Total operating income | 2,230 | 2,667 | ||||||||||
| Administration expenses | (1,010 | ) | (985 | ) | ||||||||
| Depreciation, amortisation and impairment | (120 | ) | (138 | ) | ||||||||
| Total operating expenses excluding provisions and charges | (1,130 | ) | (1,123 | ) | ||||||||
| Impairment losses on loans and advances | 4 | (368 | ) | (259 | ) | |||||||
| Provisions for other liabilities and charges | 4 | (7 | ) | (736 | ) | |||||||
| Total operating provisions and charges | (375 | ) | (995 | ) | ||||||||
| Profit before tax | 725 | 549 | ||||||||||
| Taxation charge | 5 | (175 | ) | (136 | ) | |||||||
| Profit for the period | 550 | 413 | ||||||||||
| Attributable to: | ||||||||||||
| Equity holders of the parent | 550 | 413 | ||||||||||
All profits during the period were generated from continuing operations.
Condensed Consolidated Statement of Comprehensive Income
For the six months ended 30 June 2012 and 2011
| Notes | Six months ended 30 June 2012 £m | Six months ended 30 June 2011 £m | ||||||||||
| Profit for the period | 550 | 413 | ||||||||||
| Other comprehensive income/(expense): | ||||||||||||
| Actuarial gains on retirement benefit obligations | 26 | 302 | 54 | |||||||||
| Losses on available-for-sale securities | 15 | (16 | ) | (7 | ) | |||||||
| Exchange differences on translation of foreign operations | — | (1 | ) | |||||||||
| Tax on above items | (67 | ) | (11 | ) | ||||||||
| Net gain recognised directly in equity | 219 | 35 | ||||||||||
| Gains on available-for-sale securities transferred to profit or loss on sale | (22 | ) | — | |||||||||
| Tax on items transferred to profit or loss | 5 | — | ||||||||||
| Net transfers to profit | (17 | ) | — | |||||||||
| Total other comprehensive income for the period before tax | 264 | 46 | ||||||||||
| Tax relating to components of other comprehensive income | (62 | ) | (11 | ) | ||||||||
| Total comprehensive income for the period | 752 | 448 | ||||||||||
Attributable to: Equity holders of the parent | 752 | 448 | ||||||||||
The accompanying Notes on pages 131 to 185 and the sections of the Risk Management Report described in the head note on page 52 and the information in the Balance Sheet Business Review on pages 28 to 36 and 46 to 48 form an integral part of these Condensed Consolidated Interim Financial Statements.
Condensed Consolidated Balance Sheet
At 30 June 2012 and 31 December 2011
| Notes | 30 June 2012 £m | 31 December 2011 £m | ||||||||||
| Assets | ||||||||||||
| Cash and balances at central banks | 30,067 | 25,980 | ||||||||||
| Trading assets | 7 | 32,833 | 21,891 | |||||||||
| Derivative financial instruments | 8 | 30,549 | 30,780 | |||||||||
| Financial assets designated at fair value | 9 | 4,221 | 5,005 | |||||||||
| Loans and advances to banks | 10 | 2,496 | 4,487 | |||||||||
| Loans and advances to customers | 11 | 198,323 | 201,069 | |||||||||
| Available-for-sale securities | 15 | 4,851 | 46 | |||||||||
| Loans and receivables securities | 16 | 1,399 | 1,771 | |||||||||
| Macro hedge of interest rate risk | 1,215 | 1,221 | ||||||||||
| Intangible assets | 17 | 2,225 | 2,142 | |||||||||
| Property, plant and equipment | 18 | 1,544 | 1,596 | |||||||||
| Deferred tax assets | 19 | 151 | 257 | |||||||||
| Retirement benefit assets | 26 | 411 | 241 | |||||||||
| Other assets | 1,249 | 1,088 | ||||||||||
| Total assets | 311,534 | 297,574 | ||||||||||
| Liabilities | ||||||||||||
| Deposits by banks | 20 | 15,249 | 11,626 | |||||||||
| Deposits by customers | 149,340 | 148,342 | ||||||||||
| Derivative financial instruments | 8 | 28,639 | 29,180 | |||||||||
| Trading liabilities | 21 | 28,235 | 25,745 | |||||||||
| Financial liabilities designated at fair value | 22 | 4,977 | 6,837 | |||||||||
| Debt securities in issue | 23 | 62,176 | 52,651 | |||||||||
| Subordinated liabilities | 24 | 6,558 | 6,499 | |||||||||
| Other liabilities | 2,037 | 2,571 | ||||||||||
| Provisions | 25 | 808 | 970 | |||||||||
| Current tax liabilities | 118 | 271 | ||||||||||
| Retirement benefit obligations | 26 | 36 | 216 | |||||||||
| Total liabilities | 298,173 | 284,908 | ||||||||||
| Equity | ||||||||||||
| Share capital and other equity instruments | 28 | 3,999 | 3,999 | |||||||||
| Share premium | 28 | 5,620 | 5,620 | |||||||||
| Retained earnings | 3,744 | 3,021 | ||||||||||
| Other reserves | (2 | ) | 26 | |||||||||
| Total shareholders’ equity | 13,361 | 12,666 | ||||||||||
| Total liabilities and equity | 311,534 | 297,574 | ||||||||||
The accompanying Notes on pages 131 to 185 and the sections of the Risk Management Report described in the head note on page 52 and the information in the Balance Sheet Business Review on pages 28 to 36 and 46 to 48 form an integral part of these Condensed Consolidated Interim Financial Statements.
Condensed Consolidated Statement of Changes in Equity
For the six months ended 30 June 2012 and 2011
| Other reserves | |||||||||||||||||||||||||
| Notes | Share capital £m | Share premium £m | Available for sale reserve £m | Foreign currency translation reserve £m | Retained earnings £m | Total £m | |||||||||||||||||||
| 1 January 2012 | 3,999 | 5,620 | 9 | 17 | 3,021 | 12,666 | |||||||||||||||||||
| Total comprehensive income/(expense): | |||||||||||||||||||||||||
| - Profit for the period | — | — | — | — | 550 | 550 | |||||||||||||||||||
| - Other comprehensive income/(expense) for the period | — | — | (38 | ) | — | 302 | 264 | ||||||||||||||||||
| - Tax on other comprehensive income | — | — | 10 | — | (72 | ) | (62 | ) | |||||||||||||||||
| — | — | (28 | ) | — | 780 | 752 | |||||||||||||||||||
| Dividends and other distributions | — | — | — | — | (57 | ) | (57 | ) | |||||||||||||||||
| 30 June 2012 | 3,999 | 5,620 | (19 | ) | 17 | 3,744 | 13,361 | ||||||||||||||||||
| 1 January 2011 | 3,999 | 5,620 | 10 | 17 | 2,628 | 12,274 | |||||||||||||||||||
| Total comprehensive income/(expense): | |||||||||||||||||||||||||
| - Profit for the period | — | — | — | — | 413 | 413 | |||||||||||||||||||
| - Other comprehensive income(expense) for the period | — | — | (7 | ) | (1 | ) | 54 | 46 | |||||||||||||||||
| - Tax on other comprehensive income | — | — | 3 | — | (14 | ) | (11 | ) | |||||||||||||||||
| — | — | (4 | ) | (1 | ) | 453 | 448 | ||||||||||||||||||
| Dividends and other distributions | — | — | — | — | (482 | ) | (482 | ) | |||||||||||||||||
| 30 June 2011 | 3,999 | 5,620 | 6 | 16 | 2,599 | 12,240 | |||||||||||||||||||
The accompanying Notes on pages 131 to 185 and the sections of the Risk Management Report described in the head note on page 52 and the information in the Balance Sheet Business Review on pages 28 to 36 and 46 to 48 form an integral part of these Condensed Consolidated Interim Financial Statements.
Condensed Consolidated Cash Flow Statement
For the six months ended 30 June 2012 and 2011
| Notes | Six months ended 30 June 2012 £m | Six months ended 30 June 2011 £m | ||||||||||
| Net cash flow from operating activities | ||||||||||||
| Profit for the period | 550 | 413 | ||||||||||
| Adjustments for: | ||||||||||||
| Non cash items included in net profit | 166 | 1,662 | ||||||||||
| Change in operating assets | 5,224 | 566 | ||||||||||
| Change in operating liabilities | 7,451 | (2,521 | ) | |||||||||
| Income taxes paid | (149 | ) | (78 | ) | ||||||||
| Effects of exchange rate differences | (1,220 | ) | 21 | |||||||||
| Net cash flow from operating activities | 29 | 12,022 | 63 | |||||||||
| Net cash flow (used in)/from investing activities | ||||||||||||
| Purchase of property, plant and equipment and intangible assets | 17,18 | (192 | ) | (132 | ) | |||||||
| Proceeds from sale of property, plant and equipment and intangible assets | 43 | 50 | ||||||||||
| Purchase of non-trading securities | (4,830 | ) | — | |||||||||
| Proceeds from sale of non-trading securities | 20 | 124 | ||||||||||
| Net cash flow (used in)/from investing activities | (4,959 | ) | 42 | |||||||||
| Net cash flow from financing activities | ||||||||||||
| Issue of loan capital | 22,711 | 22,431 | ||||||||||
| Repayment of loan capital | (14,826 | ) | (10,919 | ) | ||||||||
| Dividends paid on ordinary shares | 6 | (425 | ) | (375 | ) | |||||||
| Dividends paid on preference shares classified in equity | 6 | (19 | ) | (19 | ) | |||||||
| Dividends paid on Reserve Capital Instruments | 6 | (21 | ) | (21 | ) | |||||||
| Dividends paid on Perpetual Preferred Securities | 6 | (17 | ) | (17 | ) | |||||||
| Net cash flow from financing activities | 7,403 | 11,080 | ||||||||||
| Net increase in cash and cash equivalents | 14,466 | 11,185 | ||||||||||
| Cash and cash equivalents at beginning of the period | 42,946 | 45,500 | ||||||||||
| Effects of exchange rate changes on cash and cash equivalents | (305 | ) | 663 | |||||||||
| Cash and cash equivalents at the end of the period | 29 | 57,107 | 57,348 | |||||||||
The accompanying Notes on pages 131 to 185 and the sections of the Risk Management Report described in the head note on page 52 and the information in the Balance Sheet Business Review on pages 28 to 36 and 46 to 48 form an integral part of these Condensed Consolidated Interim Financial Statements.
Notes to the Condensed Financial Statements
1. ACCOUNTING POLICIES
Going Concern
The Directors have assessed the ability of Santander UK plc (the ‘Company’) and its subsidiaries (together the ‘Group’) to continue as a going concern, in the light of uncertain current and anticipated economic conditions, including analysing the financial resources available to it and stress testing performance forecasts through various scenarios. The Directors confirm they are satisfied that the Group has adequate resources to continue in business for the foreseeable future. For this reason, they continue to adopt the ‘going concern’ basis of accounting for preparing financial statements.
BASIS OF PREPARATION
These Condensed Consolidated Interim Financial Statements are not a form of statutory accounts. The information for the year ended 31 December 2011 does not constitute statutory accounts as defined in section 434 of the Companies Act 2006. A copy of the statutory accounts for that year has been delivered to the Registrar of Companies. The auditor’s report on those accounts was unqualified, did not draw attention to any matters by way of emphasis and did not contain a statement under section 498(2) or (3) of the Companies Act 2006.
Compliance with International Financial Reporting Standards
The Condensed Consolidated Interim Financial Statements have been prepared in accordance with International Accounting Standards (‘IAS’) 34 ‘Interim Financial Reporting’, as issued by the International Accounting Standards Board (‘IASB’), and as adopted or use in the European Union. Accordingly, certain information and disclosures normally required to be included in the notes to the annual financial statements have been omitted or condensed. The Condensed Consolidated Interim Financial Statements should be read in conjunction with the Consolidated Financial Statements of the Group for the year ended 31 December 2011 which were prepared in accordance with International Financial Reporting Standards (‘IFRS’) as issued by the IASB in addition to being consistent with IFRS as adopted for use in the European Union.
Disclosures required by IFRS 7 “Financial Instruments: Disclosure” relating to the nature and extent of risks arising from financial instruments can be found in the Risk Management Report on pages 52 to 123 which form an integral part of these Condensed Consolidated Interim Financial Statements.
The same accounting policies, presentation and methods of computation are followed in these Condensed Consolidated Interim Financial Statements as were applied in the presentation of the Group’s 2011 Annual Report except as described below:
Recent accounting developments
The Group has adopted the following amendments to standards which became effective for financial years beginning on 1 January 2012.
| a) | IFRS 7 ‘Financial Instruments: Disclosures’ – In October 2010, the IASB issued amendments to IFRS 7 that increase the disclosure requirements for transactions involving transfers of financial assets. The amendments are intended to provide greater transparency around risk exposures when a financial asset is transferred but the transferor retains some level of continuing exposure in the asset. The amendments also require disclosures where transfers of financial assets are not evenly distributed throughout the period. The amendments to IFRS 7 are effective for annual periods beginning on or after 1 July 2011, with earlier application permitted. Disclosures are not required for comparative periods before the date of initial application of the amendments. |
| The Group does not anticipate that these amendments to IFRS 7 will have a significant impact on its disclosures regarding transfers of financial assets (see Note 14). However, if the Group enters into other types of transfers of financial assets in the future, disclosures regarding those transfers may be affected. Where appropriate, these disclosures will be made in the Group’s financial statements for the year ended 31 December 2012. | |
| b) | There are a number of other changes to IFRS that were effective from 1 January 2012. Those changes did not have a significant impact on the Group’s financial statements. |
Future accounting developments
The Group has not yet adopted the following significant new or revised standards and interpretations, and amendments thereto, which have been issued but which are not yet effective for the Group:
| a) | IAS 1 ‘Presentation of Financial Statements’ – In June 2011, the IASB issued amendments to IAS 1 that retain the option to present profit or loss and other comprehensive income in either a single statement or in two separate but consecutive statements. However, the amendments to IAS 1 require additional disclosures to be made in the other comprehensive income section such that items of other comprehensive income are grouped into two categories: (i) items that will not be reclassified subsequently to profit or loss; and (ii) items that will be reclassified subsequently to profit or loss when specific conditions are met. Income tax on items of other comprehensive income is required to be allocated on the same basis. The amendments to IAS 1 are effective for annual periods beginning on or after 1 July 2012. | |
The Group anticipates that IAS 1 (2011) will be adopted in the Group’s financial statements for the annual period beginning on 1 January 2013 and that the application of the new Standard will modify the presentation of items of other comprehensive income accordingly. Retrospective application is required. The Group does not anticipate that these amendments to IAS 1 will have a significant impact on the Group’s disclosures. | ||
| b) | IFRS 10 ‘Consolidated Financial Statements’, IFRS 11 ‘Joint Arrangements’, IFRS 12 ‘Disclosure of Interests in Other Entities’, IAS 27 ‘Separate Financial Statements’ and IAS 28 ‘Investments in Associates and Joint Ventures’ – In May 2011, the IASB issued new and amended guidance on consolidated financial statements and joint arrangements. IFRS 10, IFRS 11 and IFRS 12 were new standards issued while IAS 27 and IAS 28 were amended. Each of the standards issued is effective for annual periods beginning on or after 1 January 2013 with earlier application permitted as long as each of the other standards is also applied earlier. | |
| > | Under IFRS 10 ‘Consolidated Financial Statements’, control is the single basis for consolidation, irrespective of the nature of the investee; this standard therefore eliminates the risks-and-rewards approach. IFRS 10 identifies the three elements of control as power over the investee, exposure, or rights, to variable returns from involvement with the investee and the ability to use power over the investee to affect the amount of the investor’s returns. An investor must possess all three elements to conclude that it controls an investee. The assessment of control is based on all facts and circumstances, and the conclusion is reassessed if there are changes to at least one of the three elements. Retrospective application is required subject to certain transitional provisions. | |
| > | IFRS 11 applies to all entities that are parties to a joint arrangement. A joint arrangement is an arrangement of which two or more parties have joint control. IFRS 11 establishes two types of joint arrangements, joint operations and joint ventures, which are distinguished by the rights and obligations of the parties to the arrangement. In a joint operation, the parties to the joint arrangement (referred to as ‘joint operators’) have rights to the assets and obligations for the liabilities of the arrangement. By contrast, in a joint venture, the parties to the arrangement (referred to as ‘joint venturers’) have rights to the net assets of the arrangement. IFRS 11 requires that a joint operator recognise its share of the assets, liabilities, revenues, and expenses in accordance with applicable IFRSs; however, a joint venturer would account for its interest by using the equity method of accounting under IAS 28 (2011). Transitional provisions vary depending on how an interest is accounted for under IAS 31 and what its nature is under IFRS 11. | |
| > | IFRS 12 integrates the disclosure requirements on interests in other entities, currently included in several standards to make it easier to understand and apply the disclosure requirements for subsidiaries, joint arrangements, associates and unconsolidated structured entities. The standard also contains additional requirements on a number of topics. Under IFRS 12, an entity should disclose information about significant judgements and assumptions (and any changes to those assumptions) made in determining whether it has control, joint control, or significant influence over another entity and the type of joint arrangement. IFRS 12 also requires additional disclosures to make it easier to understand and evaluate the nature, extent, and financial effects of the Group’s transactions with its subsidiaries, joint arrangements, associates and unconsolidated structured entities as well as any changes in and risks associated with these entities or arrangements. Disclosures shall be aggregated or disaggregated so that useful information is not obscured by either the inclusion of a large amount of insignificant detail or the aggregation of items that have different characteristics. The standard applies prospectively from the beginning of the annual period in which it is adopted. | |
| The Group anticipates that IFRS 10, IFRS 11 and IFRS 12 will be adopted in the Group’s financial statements for the annual period beginning on 1 January 2013 and that the application of the new standards may have a significant impact on the Group’s disclosures and on amounts reported in respect of the Group’s financial assets and financial liabilities. However, it is not practicable to provide a reasonable estimate of that effect until a detailed review has been completed. | ||
| > | IAS 27 was amended for the issuance of IFRS 10 but retains the current guidance on separate financial statements. | |
| > | IAS 28 was amended for conforming changes on the basis of the issuance of IFRS 10 and IFRS 11. | |
The Group anticipates that IAS 27 (2011) and IAS 28 (2011) will be adopted in the Group’s financial statements for the annual period beginning on 1 January 2013. The Group does not anticipate that these amendments to IAS 27 and IAS 28 will have a significant impact on its disclosures and on amounts reported in respect of the Group’s financial assets and financial liabilities. However, it is not practicable to provide a reasonable estimate of that effect until a detailed review has been completed. | ||
| c) | IFRS 13 ‘Fair Value Measurement’ - In May 2011, the IASB issued IFRS 13, which establishes a single source of guidance for fair value measurement. IFRS 13 defines fair value, establishes a framework for measuring fair value, and requires disclosures about fair value measurements. IFRS 13 applies to both financial instrument items and non-financial instrument items for which other IFRSs require or permit fair value measurements and disclosures about fair value measurements, except in specified circumstances. In general, the disclosure requirements in IFRS 13 are more extensive than those required in the current accounting standards. IFRS 13 is effective for annual periods beginning on or after 1 January 2013, with early adoption permitted, and applies prospectively from the beginning of the annual period in which it is adopted. | |
The Group anticipates that IFRS 13 will be adopted in the Group’s financial statements for the annual period beginning on 1 January 2013 and that the application of the new standard may affect the amounts reported in the financial statements and result in more extensive disclosures in the financial statements. However, it is not practicable to provide a reasonable estimate of that effect until a detailed review has been completed. | ||
| d) | IFRS 9 ‘Financial Instruments’ – In November 2009, the IASB issued IFRS 9 ‘Financial Instruments (‘IFRS 9’) which introduced new requirements for the classification and measurement of financial assets. In October 2010, the IASB issued an amendment to IFRS 9 incorporating requirements for financial liabilities. Together, these changes represent the first phase in the IASB’s planned replacement of IAS 39 ‘Financial Instruments: Recognition and Measurement’ (‘IAS 39’) with a less complex and improved standard for financial instruments. Following the IASB’s decision in December 2011 to defer the effective date, the standard is effective for annual periods beginning on or after 1 January 2015 with early adoption permitted. IFRS 9 is required to be applied retrospectively but prior periods need not be restated. The second and third phases in the IASB’s project to replace IAS 39 will address impairment of financial assets measured at amortised cost and hedge accounting. The IASB re-opened the requirements for classification and measurement in IFRS 9 in 2012 to address practice and other issues, with an exposure draft of revised proposals expected in the second half of 2012. The Group anticipates that IFRS 9 will be adopted in the Group’s financial statements for the annual period beginning on 1 January 2015 and that the application of the new Standard may have a significant impact on amounts reported in respect of the Group’s financial assets and financial liabilities. However, it is not practicable to provide a reasonable estimate of that effect until a detailed review has been completed. | |
| e) | IAS 19 ‘Employee Benefits’ – In June 2011, the IASB issued amendments to IAS 19 that change the accounting for defined benefit plans and termination benefits. The most significant change relates to the accounting for changes in defined benefit obligations and plan assets. The amendments require the recognition of changes in defined benefit obligations and in fair value of plan assets when they occur, and hence eliminate the ‘corridor approach’ permitted under the previous version of IAS 19 and accelerate the recognition of past service costs. The amendments require all actuarial gains and losses to be recognised immediately through other comprehensive income in order for the net pension asset or liability recognised in the consolidated statement of financial position to reflect the full value of the plan deficit or surplus. The amendments to IAS 19 are effective for annual periods beginning on or after 1 January 2013 and require retrospective application with certain exceptions. | |
The Group anticipates that IAS 19 (2011) will be adopted in the Group’s financial statements for the annual period beginning on 1 January 2013. The Group does not anticipate that these amendments to IAS 19 will have a significant impact on its profit or loss or financial position as the Group does not utilise the ‘corridor approach’. | ||
| f) | There are a number of other standards which have been issued or amended that are expected to be effective in future periods. However, it is not practicable to provide a reasonable estimate of their effects on the Group’s financial statements until a detailed review has been completed. | |
The Condensed Consolidated Interim Financial Statements reflect all adjustments that, in the opinion of management of the Group, are necessary for a fair presentation of the results of operations for the interim period. All such adjustments to the financial information are of a normal, recurring nature. Because the results from common banking activities are so closely related and responsive to changes in market conditions, the results for any interim period are not necessarily indicative of the results that can be expected for the year.
CRITICAL ACCOUNTING POLICIES AND AREAS OF SIGNIFICANT MANAGEMENT JUDGEMENT
The preparation of the Group’s Condensed Consolidated Interim Financial Statements requires management to make estimates and judgements that affect the reported amount of assets and liabilities at the date of the financial statements and the reported amount of income and expenses during the reporting period. Management evaluates its estimates and judgements on an ongoing basis. Management bases its estimates and judgements on historical experience and on various other factors that are believed to be reasonable under the circumstances. Actual results may differ from these estimates under different assumptions or conditions.
The following accounting estimates and judgements are considered important to the portrayal of the Group’s financial results and financial condition because: (i) they are highly susceptible to change from period to period as assumptions are made to calculate the estimates, and (ii) any significant difference between the Group’s estimated amounts and actual amounts could have a material impact on the Group’s future financial results and financial condition.
In calculating each estimate, a range of outcomes was calculated based principally on management’s conclusions regarding the input assumptions relative to historic experience. The actual estimates were based on what management concluded to be the most probable assumptions within the range of reasonably possible assumptions.
(a) Impairment loss allowances for loans and advances
The Group estimates impairment losses for loans and advances to customers, loans and receivables securities, and loans and advances to banks as described in the accounting policy “Impairment of financial assets” on page 177 of the Group’s 2011 Annual Report. The Group’s assumptions about estimated losses are based on past performance, past customer behaviour, the credit quality of recent underwritten business and general economic conditions, which are not necessarily an indication of future losses.
(i) Loans and advances to customers
The net impairment loss (i.e. after recoveries) for loans and advances to customers in the Retail Banking segment recognised in the six months ended 30 June 2012 was £234m (six months ended 30 June 2011: £172m), in the Corporate Banking segment was £61m (six months ended 30 June 2011: £59m) and in the Corporate Centre segment was £73m (six months ended 30 June 2011: £28m). In calculating the Retail Banking and Corporate Banking impairment loss allowances, a range of outcomes was calculated, either for each individual loan or by portfolio, based on management’s conclusions regarding the estimated number of accounts that will be written off or repossessed (the ‘loss propensity’), the estimated proportion of such cases that will result in a loss (the ‘loss factor’) and the average loss incurred (the ‘loss per case’) relative to historic experience.
Had management used different assumptions, a larger or smaller impairment loss allowance would have resulted that could have had a material impact on the Group’s reported profit before tax. Specifically, if management’s conclusions as to the loss propensity, the loss factor and the estimated loss per case were different, but within the range of what management deemed to be reasonably possible, the impairment loss for loans and advances in the Retail Banking segment could have decreased in the first half of 2012 from an actual impairment loss of £234m (six months ended 30 June 2011: £172m) by up to £51m (six months ended 30 June 2011: £72m), with a potential corresponding increase in the Group’s profit before tax in the first half of 2012 of up to 7% (six months ended 2011: 13%), or increased by up to £28m (six months ended 30 June 2011: £52m), with a potential corresponding decrease in the Group’s profit before tax in the first half of 2012 of up to 4% (six months ended 30 June 2011: 9%). Similarly, the impairment loss for loans and advances in the Corporate Banking and Corporate Centre segments could have decreased in the first half of 2012 from an actual impairment loss of £134m (six months ended 30 June 2011: £87m) by up to £21m (six months ended 30 June 2011: £13m), with a potential corresponding increase in the Group’s profit before tax in the first half of 2012 of up to 3% (six months ended 30 June 2011: 2%), or increased by up to £19m (six months ended 30 June 2011: £27m), with a potential corresponding decrease in the Group’s profit before tax in the first half of 2012 of up to 3% (six months ended 30 June 2011: 5%).
(ii) Loans and receivables securities
In the six months ended 30 June 201 and 20112, the Group did not incur any impairment losses in respect of loans and receivables securities. Based on the conditions at the balance sheet date, management determined that a reasonably possible change in any of its assumptions would not cause an impairment loss to be recognised.
(iii) Loans and advances to banks
In the six months ended 30 June 2012 and 2011, the Group did not incur any impairment losses in respect of loans and advances to banks. Based on the conditions at the balance sheet date, management determined that a reasonably possible change in any of its assumptions would not cause an impairment loss to be recognised.
(b) Valuation of financial instruments
The Group trades in a wide variety of financial instruments in the major financial markets. When estimating the value of its financial instruments, including derivatives where quoted market prices are not available, management therefore considers a range of interest rates, volatility, exchange rates, counterparty credit ratings, valuation adjustments and other similar inputs, all of which vary across maturity bands. These are chosen to best reflect the particular characteristics of each transaction.
Had management used different assumptions, a larger or smaller change in the valuation of financial instruments including derivatives where quoted market prices are not available would have resulted that could have had a material impact on the Group’s reported profit before tax.
Detailed disclosures on financial instruments, including sensitivities, can be found in Note 33. Further information about sensitivities to market risk (including Value-at-Risk (‘VaR’)) arising from financial instrument trading activities can be found in the Risk Management Report on page 105.
(c) Goodwill impairment
A goodwill impairment loss of £nil was recognised in the first half of 2012 (six months ended 30 June 2011: £nil). The carrying amount of goodwill was £1,834m at 30 June 2012 (31 December 2011: £1,834m). The Group evaluates whether the carrying value of goodwill is impaired and performs impairment testing annually or more frequently if there are impairment indicators present. Details of the Group’s approach to identifying and quantifying impairment of goodwill are set out in Note 17. Assumptions about the measurement of the estimated recoverable amount of goodwill are based on management’s estimates of future cash flows and growth rates of the cash-generating units. The Group’s assumptions about estimated future cash flows and growth rates are based on management’s view of future business prospects at the time of the assessment and are subject to a high degree of uncertainty.
Had management used different assumptions, a larger or smaller goodwill impairment loss would have resulted that could have had a material impact on the Group’s reported profit before tax. Detailed disclosures on the assumptions used, including sensitivities, can be found in Note 17.
(d) Provision for customer remediation, principally payment protection insurance (‘PPI’)
The provision charge for customer remediation, principally PPI, relating to products sold recognised in the first half of 2012 was £1m (year ended 31 December 2011: charge of £753m) before tax. The balance sheet provision amounted to £613m (31 December 2011: £671m). Detailed disclosures on the provision for customer remediation can be found in Note 25.
The provision represents management’s best estimate of the anticipated costs of related customer contact and/or redress, including administration expenses. However, there are still a number of uncertainties as to the eventual costs from any such contact and/or redress given the inherent difficulties in assessing the impact of detailed implementation of the FSA Policy Statement of 10 August 2010 for all PPI complaints, uncertainties around the ultimate emergence period for complaints, the availability of supporting evidence and the activities of claims management companies, all of which will significantly affect complaints volumes, uphold rates and redress costs.
The provision requires significant judgement by management in determining appropriate assumptions, which include the level of complaints, of those, the number that will be upheld, as well as redress costs for each of the different populations of customers identified by the Group in its analyses used to determine the best estimate of the anticipated costs of redress.
Had management used different assumptions, a larger or smaller provision release/charge would have resulted that could have had a material impact on the Group’s reported profit before tax. Specifically, if the level of complaints had been one percentage point higher/(lower) than estimated for all policies written then the provision at 30 June 2012 would have increased/(decreased) by approximately £33m (31 December 2011: £36m). There are a large number of inter-dependent assumptions under-pinning the provision; this sensitivity assumes that all assumptions, other than the level of complaints, remain constant.
The Group will re-evaluate the assumptions underlying its analysis at each reporting date as more information becomes available. As noted above, there is inherent uncertainty in making estimates; actual results in future periods may differ from the amount provided.
(e) Pensions
The Group operates a number of defined benefit pension schemes as described in Note 26 and estimates their fair values as described in the accounting policy “Pensions and other post retirement benefits” on page 172 of the Group’s 2011 Annual Report.
The defined benefit service cost recognised in the six months ended 30 June 2012 of £15m (six months ended 30 June 2011: £14m) was broadly unchanged from the previous period. The defined benefit pension schemes which were in a net asset position had a surplus of £411m (31 December 2011: £241m) and the defined benefit pension schemes which were in a net liability position had a deficit of £36m (31 December 2011: £216m).
Accounting for defined benefit pension schemes requires management to make assumptions, principally about mortality, but also about price inflation, discount rates, pension increases, and earnings growth. Management’s assumptions are based on past experience and current economic trends, which are not necessarily an indication of future experience.
Detailed disclosures on the current period service cost and surplus, including sensitivities and the date of the last formal actuarial valuations of the assets and liabilities of the schemes can be found in Note 26.
2. SEGMENTS
The principal activity of the Group is financial services. The Group’s business is managed and reported on the basis of the following segments:
| > | Retail Banking; |
| > | Corporate Banking; |
| > | Markets; and |
| > | Corporate Centre (formerly known as Group Infrastructure). |
In the first half of 2012, certain non-core portfolios were transferred to Corporate Centre (formerly known as Group Infrastructure) where this was felt to be more appropriate for the management of these assets and liabilities. The non-core portfolios transferred into Corporate Centre included certain Social Housing assets and Commercial Mortgage loans, previously managed within Corporate Banking. With respect to the former, even though there are no credit concerns the terms of these loans are unfavourable in the current funding environment. The latter are typically medium to long-term arrangements primarily written via agents or intermediaries. The Group’s intention is to hold these assets to maturity and as such the balances will gradually decrease over time. The corporate legacy portfolio in run-off (largely relating to assets acquired as part of the acquisition of Alliance & Leicester) was also transferred to Corporate Centre from Corporate Banking. Non-core customer deposits are financial intermediary/institutional deposits which are managed centrally for liquidity purposes, most of which were previously managed within Corporate Banking or Markets. In addition, the management of reorganisation, customer remediation, and other costs, and hedging and other variances has been transferred to Corporate Centre, principally from Retail Banking.
The prior period’s segmental analysis has been adjusted to reflect the fact that reportable segments have changed.
The Group’s segments are strategic business units that offer different products and services. They are managed separately because each business requires different technology and marketing strategies. The Group has four segments:
| > | Retail Banking offers a comprehensive range of banking products and related financial services (residential mortgages, savings and banking, and other personal financial services products) to customers throughout the UK. It serves customers through the Santander UK network of branches and ATMs, as well as through telephone, internet channels and intermediaries. It also includes the private banking business which offers private banking and other specialist banking services to our customers. |
| > | Corporate Banking provides a range of banking services principally to UK companies, with a focus on services for SMEs, providing a broad range of banking products including loans, bank accounts, deposits, treasury services, invoice discounts, cash transmission and asset finance. Small businesses with a turnover of less than £250,000 are serviced through the Business Banking division, while a network of 33 regionally-based Corporate Business Centres offers services to businesses with a turnover of £250,000 to £150m. In addition, Corporate Banking includes specialist teams servicing Real Estate, Social Housing and UK infrastructure clients. Within Corporate Banking, the Large Corporates business is responsible for larger multinational corporate clients, including related activities principally comprising foreign exchange, money market and credit activities. These related activities are structured into two main product areas: Foreign exchange and money markets, and Credit. Foreign exchange offers a range of foreign exchange products and money markets runs the securities lending/borrowing and repo businesses. Credit originates loan and bond transactions in primary markets as well as their intermediation in secondary markets. |
| > | Markets is a financial markets business focused on providing value added financial services to financial institutions, as well as to the rest of Santander UK’s business. It is structured into two main product areas: Fixed income and Equity. Fixed Income covers sales and trading activity for fixed income products. Equity covers equity derivatives, property derivatives and commodities. Equity derivatives activities include the manufacture of structured products sold to both the Group and other financial institutions who sell or distribute them on to their customers. |
| > | Corporate Centre (formerly known as Group Infrastructure) consists of Asset and Liability Management (‘ALM’), which is responsible for the Group’s capital, and certain non-core and legacy portfolios being run-down and/or managed for value. ALM is responsible for managing the Group’s structural balance sheet composition and strategic and tactical liquidity risk management. This includes short-term and medium-term funding, covered bond and securitisation programmes. ALM’s responsibilities also include management of Santander UK’s banking products and structural exposure to interest rates. |
The Company’s board of directors (the ‘Board’) is the chief operating decision maker for the Group. The segment information below is presented on the basis used by the Board to evaluate performance and allocate resources. The Board reviews discrete financial information for each segment of the business which follows the Group’s normal accounting policies and principles, including measures of operating results, assets and liabilities.
Transactions between the business segments are on normal commercial terms and conditions. The accounting policies of the segments are the same as those described in the summary of significant accounting policies in the Group’s 2011 Annual Report. Internal charges and transfer pricing adjustments have been reflected in the performance of each business. Revenue sharing agreements are used to allocate external customer revenues to a business segment on a reasonable basis. Funds are ordinarily reallocated between segments. Interest charged for these funds is based on the Group’s cost of capital.
Interest receivable and interest payable have not been reported separately. The majority of the revenues from the segments presented below are interest income in nature and the Board relies primarily on net interest revenues to both assess the performance of the segment and to make decisions regarding allocation of segmental resources.
30 June 2012 | Retail Banking £m | Corporate Banking £m | Markets £m | Corporate Centre £m | Total £m | |||||||||||||||
| Net interest income/(expense) | 1,594 | 191 | (3 | ) | (223 | ) | 1,559 | |||||||||||||
| Non-interest income | 330 | 199 | 137 | 5 | 671 | |||||||||||||||
| Total operating income | 1,924 | 390 | 134 | (218 | ) | 2,230 | ||||||||||||||
| Administrative expenses | (796 | ) | (139 | ) | (54 | ) | (21 | ) | (1,010 | ) | ||||||||||
| Depreciation, amortisation and impairment | (89 | ) | (8 | ) | (1 | ) | (22 | ) | (120 | ) | ||||||||||
| Total operating expenses excluding provisions and charges | (885 | ) | (147 | ) | (55 | ) | (43 | ) | (1,130 | ) | ||||||||||
| Impairment losses on loans and advances | (234 | ) | (61 | ) | — | (73 | ) | (368 | ) | |||||||||||
| Provisions for other liabilities and charges | (4 | ) | — | — | (3 | ) | (7 | ) | ||||||||||||
| Total operating provisions and charges | (238 | ) | (61 | ) | — | (76 | ) | (375 | ) | |||||||||||
| Profit before tax | 801 | 182 | 79 | (337 | ) | 725 | ||||||||||||||
| Customer assets | 172,230 | 19,117 | — | 11,295 | 202,642 | |||||||||||||||
Total assets(1) | 176,580 | 42,203 | 27,245 | 65,506 | 311,534 | |||||||||||||||
| Customer deposits | 120,725 | 14,934 | — | 13,662 | 149,321 | |||||||||||||||
| Total liabilities | 125,736 | 27,234 | 26,390 | 118,813 | 298,173 | |||||||||||||||
(1) Includes customer assets, net of impairment loss allowances.
30 June 2011 | Retail Banking £m | Corporate Banking £m | Markets £m | Corporate Centre £m | Total £m | |||||||||||||||
| Net interest income/(expense) | 1,693 | 171 | (2 | ) | 119 | 1,981 | ||||||||||||||
| Non-interest income | 374 | 184 | 86 | 42 | 686 | |||||||||||||||
| Total operating income | 2,067 | 355 | 84 | 161 | 2,667 | |||||||||||||||
| Administrative expenses | (795 | ) | (119 | ) | (51 | ) | (20 | ) | (985 | ) | ||||||||||
| Depreciation, amortisation and impairment | (103 | ) | (6 | ) | (1 | ) | (28 | ) | (138 | ) | ||||||||||
| Total operating expenses excluding provisions and charges | (898 | ) | (125 | ) | (52 | ) | (48 | ) | (1,123 | ) | ||||||||||
| Impairment losses on loans and advances | (172 | ) | (59 | ) | — | (28 | ) | (259 | ) | |||||||||||
| Provisions for other liabilities and charges | — | — | — | (736 | ) | (736 | ) | |||||||||||||
| Total operating provisions and charges | (172 | ) | (59 | ) | — | (764 | ) | (995 | ) | |||||||||||
| Profit before tax | 997 | 171 | 32 | (651 | ) | 549 | ||||||||||||||
31 December 2011 | ||||||||||||||||||||
| Customer assets | 175,416 | 18,949 | — | 11,946 | 206,311 | |||||||||||||||
Total assets(1) | 180,443 | 38,110 | 28,652 | 50,369 | 297,574 | |||||||||||||||
| Customer deposits | 117,701 | 15,806 | — | 15,685 | 149,192 | |||||||||||||||
| Total liabilities | 126,153 | 24,857 | 32,760 | 101,138 | 284,908 | |||||||||||||||
(1) Includes customer assets, net of impairment loss allowances.
3. NET TRADING AND OTHER INCOME
Six months ended 30 June 2012 £m | Six months ended 30 June 2011 £m | |||||||
| Net trading and funding of other items by the trading book | 181 | 231 | ||||||
| Income from operating lease assets | 27 | 36 | ||||||
| (Expense)/income on assets designated at fair value through profit or loss | (175 | ) | 173 | |||||
| Expense on liabilities designated at fair value through profit or loss | (14 | ) | (30 | ) | ||||
| Losses on derivatives managed with assets/liabilities held at fair value through profit or loss | (88 | ) | (150 | ) | ||||
| Share of profit from associates | — | 1 | ||||||
| Profit on sale of available-for-sale assets | 22 | — | ||||||
| Hedge ineffectiveness and other | 283 | (7 | ) | |||||
| 236 | 254 | |||||||
4. IMPAIRMENT LOSSES AND PROVISIONS
Six months ended 30 June 2012 £m | Six months ended 30 June 2011 £m | |||||||
| Impairment losses on loans and advances: | ||||||||
| - loans and advances to customers (Note 11) | 397 | 278 | ||||||
| - loans and advances to banks (Note 10) | — | — | ||||||
| - loans and receivables securities (Note 16) | — | — | ||||||
| Recoveries of loans and advances (Note 11) | (29 | ) | (19 | ) | ||||
| 368 | 259 | |||||||
| Impairment losses on available-for-sale financial assets (Note 15) | — | — | ||||||
| Provisions for other liabilities and charges: (Note 25) | ||||||||
| - New and increased allowances | 8 | 744 | ||||||
| - Provisions released | (1 | ) | (8 | ) | ||||
| 7 | 736 | |||||||
| Total impairment losses and provisions charged to the income statement | 375 | 995 | ||||||
5. TAXATION CHARGE
Interim period corporation tax is accrued based on the estimated average annual effective corporation tax rate for the year of 23.5% (2011: 25%). The standard rate of UK corporation tax was 24.5% (2011: 26.5%).
The standard rate of UK corporation tax was reduced from 26% to 24% with effect from 1 April 2012. Taxation for other jurisdictions is calculated at the rates prevailing in the relevant jurisdictions.
The Finance Bill 2012 proposed a reduction in the main rate of UK corporation tax from 26% to 24% effective from 1 April 2012. This reduction in the rate to 24% was enacted on 26 March 2012 under the Provisional Collection of Taxes Act 1968. As this change in rate was substantively enacted prior to 30 June 2012, it has been reflected in the deferred tax balance at 30 June 2012. The UK Government has also indicated that it intends to enact future 1% reductions each year down to 22% by 1 April 2014. These changes in the rate had not been substantively enacted at the balance sheet date and, therefore, are not included in these financial statements. The estimated financial effect of these changes is insignificant.
The tax on the Group’s profit before tax differs from the theoretical amount that would arise using the basic corporation tax rate of the Group as follows:
Six months ended 30 June 2012 £m | Six months ended 30 June 2011 £m | |||||||
| Profit before tax | 725 | 549 | ||||||
| Tax calculated at a tax rate of 24.5% (2011: 26.5%) | 178 | 145 | ||||||
| Non deductible preference dividends paid | 1 | 1 | ||||||
| Non deductible UK Bank Levy | 10 | — | ||||||
Effect of non taxable income, non-allowable impairment losses, provisions and other non-equalised items | (17 | ) | (13 | ) | ||||
| Effect of non-UK profits and losses | (1 | ) | (1 | ) | ||||
| Effect of change in tax rate on deferred tax provision | 8 | 10 | ||||||
| Adjustment to prior period provisions | (4 | ) | (6 | ) | ||||
| Tax expense | 175 | 136 | ||||||
The effective tax rate for the first six months of 2012, based on profit before tax, was 24.1% (30 June 2011: 24.8%). The effective tax rate differed from the UK corporation tax rate of 24.5% (30 June 2011: 26.5%) principally because of the effect of non-equalised items, the reduction in deferred tax asset as a result of the change in the tax rate and the impact of the non deductible UK Bank Levy.
6. DIVIDENDS
Dividends of £425m (2011: £375m) were paid on Santander UK plc’s ordinary shares in issue during the period. The annual dividend of £21m on the Step-Up Callable Perpetual Reserve Capital Instruments was paid on 14 February 2012, the annual dividend of £17m on the £300m Step-up Callable Perpetual Preferred Securities, was paid on 22 March 2012, and the annual dividend of £19m on the £300m fixed/floating rate non-cumulative callable preference shares was paid on 24 May 2012.
7. TRADING ASSETS
30 June 2012 £m | 31 December 2011 £m | |||||||
| Loans and advances to banks - securities purchased under resale agreements | 5,086 | 3,056 | ||||||
- other(1) | 2,941 | 3,088 | ||||||
| Loans and advances to customers - securities purchased under resale agreements | 18,120 | 6,338 | ||||||
- other(2) | 260 | 349 | ||||||
| Debt securities | 5,949 | 8,711 | ||||||
| Equity securities | 477 | 349 | ||||||
| 32,833 | 21,891 | |||||||
(1) | Comprises short-term loans of £205m (31 December 2011: £84m) and cash collateral placed of £2,736m (31 December 2011: £3,004m). |
| (2) | Comprises short-term loans. |
Debt securities can be analysed by type of issuer as follows:
30 June 2012 £m | 31 December 2011 £m | |||||||
| Issued by public bodies: | ||||||||
| - Government securities | 3,868 | 2,943 | ||||||
| Issued by other issuers: | ||||||||
- Fixed and floating rate notes(1): Government guaranteed | 2,081 | 5,754 | ||||||
- Fixed and floating rate notes(1): Other | — | 14 | ||||||
| 5,949 | 8,711 | |||||||
(1) The FRNs are 40% AAA and 60% A rated (2011: 100% AAA rated).
Debt securities and equity securities can be analysed by listing status as follows:
30 June 2012 £m | 31 December 2011 £m | |||||||
| Debt securities: | ||||||||
| - Listed in the UK | 3,601 | 5,904 | ||||||
| - Listed elsewhere | 2,221 | 1,165 | ||||||
| - Unlisted | 127 | 1,642 | ||||||
| 5,949 | 8,711 | |||||||
| Equity securities: | ||||||||
| - Listed in the UK | 426 | 335 | ||||||
| - Listed elsewhere | 51 | 14 | ||||||
| 477 | 349 | |||||||
Included in the above balances are amounts owed to the Group by the ultimate parent undertaking and by fellow subsidiaries of £249m (31 December 2011: £270m) and £nil (31 December 2011: £14m) respectively.
8. DERIVATIVE FINANCIAL INSTRUMENTS
Derivatives are financial instruments whose value is derived from the price of one or more underlying items such as equities, equity indices, interest rates, foreign exchange rates, property indices, commodities and credit spreads. Derivatives enable users to manage exposure to credit or market risks. The Group sells derivatives to its customers and uses derivatives to manage its own exposure to credit and market risks.
Details of the Group’s uses of derivatives are set out in Note 15 of the Group’s 2011 Annual Report.
30 June 2012 Derivatives held for trading | Contract/notional amount £m | Fair value assets £m | Fair value liabilities £m | |||||||||
| Exchange rate contracts: | ||||||||||||
| - Cross-currency swaps | 115,386 | 2,093 | 1,864 | |||||||||
| - Foreign exchange swaps, options and forwards | 27,134 | 286 | 164 | |||||||||
| 142,520 | 2,379 | 2,028 | ||||||||||
| Interest rate contracts: | ||||||||||||
| - Interest rate swaps | 485,083 | 19,203 | 19,274 | |||||||||
- Caps, floors and swaptions(1) | 62,816 | 3,469 | 3,490 | |||||||||
| - Futures | 45,348 | 59 | 27 | |||||||||
| - Forward rate agreements | 129,445 | 10 | 12 | |||||||||
| 722,692 | 22,741 | 22,803 | ||||||||||
| Equity and credit contracts: | ||||||||||||
| - Equity index swaps and similar products | 31,944 | 1,090 | 1,391 | |||||||||
| - Equity index options | 41,052 | 413 | 1,025 | |||||||||
| - Credit default swaps and similar products | 1,145 | 36 | 17 | |||||||||
| 74,141 | 1,539 | 2,433 | ||||||||||
| Commodity contracts: | ||||||||||||
| - OTC swaps | 417 | 20 | 19 | |||||||||
| 417 | 20 | 19 | ||||||||||
| Total derivative assets and liabilities held for trading | 939,770 | 26,679 | 27,283 | |||||||||
30 June 2012 Derivatives held for fair value hedging | Contract/notional amount £m | Fair value assets £m | Fair value liabilities £m | |||||||||
| Exchange rate contracts: | ||||||||||||
| - Cross-currency swaps | 10,672 | 920 | 243 | |||||||||
| Interest rate contracts: | ||||||||||||
| - Interest rate swaps | 51,648 | 2,950 | 1,113 | |||||||||
| Total derivative assets and liabilities held for fair value hedging | 62,320 | 3,870 | 1,356 | |||||||||
| Total recognised derivative assets and liabilities | 1,002,090 | 30,549 | 28,639 | |||||||||
(1) A swaption is an option on a swap that gives the holder the right but not the obligation to buy or sell a swap.
31 December 2011 Derivatives held for trading | Contract/notional amount £m | Fair value assets £m | Fair value liabilities £m | |||||||||
| Exchange rate contracts: | ||||||||||||
| - Cross-currency swaps | 89,457 | 1,556 | 1,077 | |||||||||
| - Foreign exchange swaps, options and forwards | 19,866 | 155 | 253 | |||||||||
| 109,323 | 1,711 | 1,330 | ||||||||||
| Interest rate contracts: | ||||||||||||
| - Interest rate swaps | 475,853 | 20,625 | 20,221 | |||||||||
- Caps, floors and swaptions(1) | 62,907 | 3,485 | 3,523 | |||||||||
| - Futures | 32,503 | 54 | 41 | |||||||||
| - Forward rate agreements | 78,090 | 21 | 31 | |||||||||
| 649,353 | 24,185 | 23,816 | ||||||||||
| Equity and credit contracts: | ||||||||||||
| - Equity index swaps and similar products | 32,421 | 1,034 | 1,369 | |||||||||
| - Equity index options | 43,708 | 407 | 1,240 | |||||||||
| - Credit default swaps and similar products | 1,455 | 45 | 21 | |||||||||
| 77,584 | 1,486 | 2,630 | ||||||||||
| Commodity contracts: | ||||||||||||
| - OTC swaps | 542 | 12 | 11 | |||||||||
| 542 | 12 | 11 | ||||||||||
| Total derivative assets and liabilities held for trading | 836,802 | 27,394 | 27,787 | |||||||||
31 December 2011 Derivatives held for fair value hedging | Contract/notional amount £m | Fair value assets £m | Fair value liabilities £m | |||||||||
Exchange rate contracts: | ||||||||||||
| - Cross-currency swaps | 7,992 | 1,094 | 61 | |||||||||
| Interest rate contracts: | ||||||||||||
| - Interest rate swaps | 46,447 | 2,292 | 1,332 | |||||||||
| Total derivative assets and liabilities held for fair value hedging | 54,439 | 3,386 | 1,393 | |||||||||
| Total recognised derivative assets and liabilities | 891,241 | 30,780 | 29,180 | |||||||||
(1) A swaption is an option on a swap that gives the holder the right but not the obligation to buy or sell a swap.
Included in the above balances are amounts owed to the Group by the ultimate parent undertaking and by fellow subsidiaries of £2,435m (31 December 2011: £2,644m) and £163m (31 December 2011: £66m) respectively and amounts owed by the Group to the ultimate parent undertaking and to fellow subsidiaries of £1,904m (31 December 2011: £2,144m) and £110m (31 December 2011: £35m). The net exposures after collateral to the ultimate parent undertaking and fellow subsidiaries at 30 June 2012 amounted to £195m (31 December 2011: £149m) and £6m (31 December 2011: £nil) respectively.
Net gains or losses arising from fair value hedges included in net trading and other income
Six months ended 30 June 2012 £m | Six months ended 31 June 2011 £m | |||||||
| Net (losses)/gains: | ||||||||
| - on hedging instruments | 640 | 42 | ||||||
| - on hedged items attributable to hedged risks | (364 | ) | (39 | ) | ||||
| 276 | 3 | |||||||
The Group hedges its exposures to various risks, including interest rate risk and foreign currency risk, in connection with certain mortgage assets, covered bond issuances, and subordinated and senior debt securities in issue. The gains/(losses) arising on these assets and liabilities are presented in the table above on a combined basis.
9. FINANCIAL ASSETS DESIGNATED AT FAIR VALUE
30 June 2012 £m | 31 December 2011 £m | |||||||
| Loans and advances to customers | 3,618 | 4,376 | ||||||
| Debt securities | 603 | 629 | ||||||
| 4,221 | 5,005 | |||||||
Included in the above balances are amounts owed to the Group by the ultimate parent undertaking and by fellow subsidiaries of £nil (31 December 2011: £nil) and £44m (31 December 2011: £51m) respectively.
The maximum exposure to credit risk on loans and advances designated as held at fair value through profit or loss at the balance sheet date was £3,618m (31 December 2011: £4,376m). The maximum exposure was mitigated by a charge over the residential properties in respect of lending to housing associations amounting to £3,978m (31 December 2011: £4,609m).
Debt securities can be analysed by type of issuer as follows:
30 June 2012 £m | 31 December 2011 £m | |||||||
| Bank and building society certificates of deposit | — | — | ||||||
| Other issuers: | ||||||||
| - Mortgage-backed securities | 314 | 328 | ||||||
| - Other asset-backed securities | 47 | 51 | ||||||
| 361 | 379 | |||||||
| Other securities | 242 | 250 | ||||||
| 603 | 629 | |||||||
Asset-backed securities can be analysed by the geographical location of the issuer or counterparty as follows:
| 30 June 2012 | 31 December 2011 | Income statement | ||||||||||||||||||||||||||||||||||||||
| Nominal value | Book value | Fair value | Fair value as % of nominal | Nominal value | Book value | Fair value | Fair value as % of nominal | Six months ended 30 June 2012 | Six months ended 30 June 2011 | |||||||||||||||||||||||||||||||
| Country | £m | £m | £m | % | £m | £m | £m | % | £m | £m | ||||||||||||||||||||||||||||||
| UK | ||||||||||||||||||||||||||||||||||||||||
| MBS | 188 | 255 | 255 | 136 | 187 | 263 | 263 | 141 | 8 | 6 | ||||||||||||||||||||||||||||||
| 188 | 255 | 255 | 136 | 187 | 263 | 263 | 141 | 8 | 6 | |||||||||||||||||||||||||||||||
| US | ||||||||||||||||||||||||||||||||||||||||
| MBS | 8 | 9 | 9 | 113 | 8 | 9 | 9 | 113 | — | 1 | ||||||||||||||||||||||||||||||
| 8 | 9 | 9 | 113 | 8 | 9 | 9 | 113 | — | 1 | |||||||||||||||||||||||||||||||
| Rest of Europe | ||||||||||||||||||||||||||||||||||||||||
| ABS | 75 | 47 | 47 | 63 | 80 | 51 | 51 | 64 | — | 1 | ||||||||||||||||||||||||||||||
| MBS | 33 | 50 | 50 | 152 | 35 | 56 | 56 | 160 | (10 | ) | (1 | ) | ||||||||||||||||||||||||||||
| 108 | 97 | 97 | 90 | 115 | 107 | 107 | 93 | (10 | ) | — | ||||||||||||||||||||||||||||||
| Total | 304 | 361 | 361 | 119 | 310 | 379 | 379 | 122 | (2 | ) | 7 | |||||||||||||||||||||||||||||
Asset-backed securities can be analysed by the credit rating of the issuer or counterparty as follows:
| 30 June 2012 | 31 December 2011 | Income statement | ||||||||||||||||||||||||||||||||||||||
| Nominal value | Book value | Fair value | Fair value as % of nominal | Nominal value | Book value | Fair value | Fair value as % of nominal | Six months ended 30 June 2012 | Six months ended 30 June 2011 | |||||||||||||||||||||||||||||||
| Credit rating | £m | £m | £m | % | £m | £m | £m | % | £m | £m | ||||||||||||||||||||||||||||||
| AAA | ||||||||||||||||||||||||||||||||||||||||
| ABS | — | — | — | — | 28 | 16 | 16 | 57 | — | 1 | ||||||||||||||||||||||||||||||
| MBS | 68 | 97 | 97 | 143 | 175 | 247 | 247 | 141 | — | 7 | ||||||||||||||||||||||||||||||
| 68 | 97 | 97 | 143 | 203 | 263 | 263 | 130 | — | 8 | |||||||||||||||||||||||||||||||
| AA+ | �� | |||||||||||||||||||||||||||||||||||||||
| ABS | 3 | 2 | 2 | 67 | 46 | 30 | 30 | 65 | — | — | ||||||||||||||||||||||||||||||
| 3 | 2 | 2 | 67 | 46 | 30 | 30 | 65 | — | — | |||||||||||||||||||||||||||||||
| AA | ||||||||||||||||||||||||||||||||||||||||
| ABS | 27 | 18 | 18 | 67 | 3 | 3 | 3 | 100 | 1 | — | ||||||||||||||||||||||||||||||
| MBS | 44 | 68 | 68 | 155 | 46 | 76 | 76 | 165 | (5 | ) | (1 | ) | ||||||||||||||||||||||||||||
| 71 | 86 | 86 | 121 | 49 | 79 | 79 | 161 | (4 | ) | (1 | ) | |||||||||||||||||||||||||||||
| A | ||||||||||||||||||||||||||||||||||||||||
| ABS | 43 | 26 | 26 | 61 | 3 | 2 | 2 | 67 | (1 | ) | — | |||||||||||||||||||||||||||||
| MBS | 109 | 144 | 144 | 132 | — | — | — | — | 3 | — | ||||||||||||||||||||||||||||||
| 152 | 170 | 170 | 112 | 3 | 2 | 2 | 67 | 2 | — | |||||||||||||||||||||||||||||||
| Below BBB | ||||||||||||||||||||||||||||||||||||||||
| ABS | 2 | 1 | 1 | 50 | — | — | — | — | — | — | ||||||||||||||||||||||||||||||
| MBS | 8 | 5 | 5 | 63 | 9 | 5 | 5 | 56 | — | — | ||||||||||||||||||||||||||||||
| 10 | 6 | 6 | 60 | 9 | 5 | 5 | 56 | — | — | |||||||||||||||||||||||||||||||
| Total | 304 | 361 | 361 | 119 | 310 | 379 | 379 | 122 | (2 | ) | 7 | |||||||||||||||||||||||||||||
10. LOANS AND ADVANCES TO BANKS
30 June 2012 £m | 31 December 2011 £m | |||||||
| Placements with other banks - securities purchased under resale agreements | — | — | ||||||
- other(1) | 2,058 | 2,405 | ||||||
| Amounts due from Banco Santander - securities purchased under resale agreements | 431 | 2,071 | ||||||
| - other | 7 | 11 | ||||||
| 2,496 | 4,487 | |||||||
(1) Principally comprises primarily time deposits, cash in the course of collection, cash held with foreign banks and unsettled financial transactions.
During the period, £nil impairment losses were incurred on loans and advances to banks (31 December 2011: £nil).
Loans and advances to banks can be analysed by the geographical location of the issuer or counterparty as follows:
| Country | 30 June 2012 £m | 31 December 2011 £m | ||||||
| UK | 1,346 | 1,727 | ||||||
| Spain | 438 | 2,071 | ||||||
| France | 3 | — | ||||||
| Rest of Europe | — | 117 | ||||||
| US | 639 | 257 | ||||||
| Rest of world | 70 | 315 | ||||||
| Total | 2,496 | 4,487 | ||||||
Loans and advances to banks can be analysed by the credit rating of the issuer or counterparty as follows:
| Credit rating | 30 June 2012 £m | 31 December 2011 £m | ||||||
| AAA | 308 | 235 | ||||||
| AA | — | 2 | ||||||
| AA- | 268 | 3,265 | ||||||
| A+ | 70 | 34 | ||||||
| A | 710 | 54 | ||||||
| A- | 1,136 | 896 | ||||||
| BB+ | — | 1 | ||||||
| D | 4 | — | ||||||
| Total | 2,496 | 4,487 | ||||||
11. LOANS AND ADVANCES TO CUSTOMERS
Movement in impairment loss allowances:
| 30 June 2012 | Loans secured on residential property £m | Corporate Loans £m | Finance leases £m | Other secured advances £m | Other unsecured advances £m | Total £m | ||||||||||||||||||
| At 1 January 2012: | ||||||||||||||||||||||||
| - Observed | 381 | 325 | 6 | 83 | 330 | 1,125 | ||||||||||||||||||
| - Incurred but not yet observed | 97 | 107 | 31 | 24 | 179 | 438 | ||||||||||||||||||
| 478 | 432 | 37 | 107 | 509 | 1,563 | |||||||||||||||||||
| Charge/(release) to the income statement: | ||||||||||||||||||||||||
| - Observed | 59 | 90 | 7 | 43 | 194 | 393 | ||||||||||||||||||
| - Incurred but not yet observed | 1 | 4 | 5 | — | (6 | ) | 4 | |||||||||||||||||
| 60 | 94 | 12 | 43 | 188 | 397 | |||||||||||||||||||
| Write offs | (36 | ) | (46 | ) | (7 | ) | (22 | ) | (249 | ) | (360 | ) | ||||||||||||
| At 30 June 2012 | ||||||||||||||||||||||||
| - Observed | 404 | 369 | 6 | 104 | 275 | 1,158 | ||||||||||||||||||
| - Incurred but not yet observed | 98 | 111 | 36 | 24 | 173 | 442 | ||||||||||||||||||
| 502 | 480 | 42 | 128 | 448 | 1,600 | |||||||||||||||||||
| 31 December 2011 | Loans secured on residential property £m | Corporate Loans £m | Finance leases £m | Other secured advances £m | Other unsecured advances £m | Total £m | ||||||||||||||||||
| At 1 January 2011: | ||||||||||||||||||||||||
| - Observed | 369 | 271 | 2 | 55 | 381 | 1,078 | ||||||||||||||||||
| - Incurred but not yet observed | 157 | 125 | 17 | 22 | 256 | 577 | ||||||||||||||||||
| 526 | 396 | 19 | 77 | 637 | 1,655 | |||||||||||||||||||
| Charge/(release) to the income statement: | ||||||||||||||||||||||||
| - Observed | 104 | 178 | 14 | 76 | 407 | 779 | ||||||||||||||||||
| - Incurred but not yet observed | (60 | ) | (18 | ) | 13 | 2 | (77 | ) | (140 | ) | ||||||||||||||
| 44 | 160 | 27 | 78 | 330 | 639 | |||||||||||||||||||
| Write offs | (92 | ) | (124 | ) | (9 | ) | (48 | ) | (458 | ) | (731 | ) | ||||||||||||
| At 31 December 2011: | ||||||||||||||||||||||||
| - Observed | 381 | 325 | 6 | 83 | 330 | 1,125 | ||||||||||||||||||
| - Incurred but not yet observed | 97 | 107 | 31 | 24 | 179 | 438 | ||||||||||||||||||
| 478 | 432 | 37 | 107 | 509 | 1,563 | |||||||||||||||||||
Recoveries:
Loans secured on residential property £m | Corporate Loans £m | Finance leases £m | Other secured advances £m | Other unsecured advances £m | Total £m | |||||||||||||||||||
| 30 June 2012 | 2 | 1 | 1 | 2 | 23 | 29 | ||||||||||||||||||
| 31 December 2011 | 3 | 2 | 3 | 10 | 56 | 74 | ||||||||||||||||||
12. SECURITISATIONS AND COVERED BONDS
The Group uses Special Purpose Entities (‘SPEs’) to securitise some of the mortgage and other loans to customers that it originated. The Group also issues covered bonds, which are guaranteed by a pool of the Group’s mortgage loans that it has transferred into Abbey Covered Bonds LLP. The Group issues mortgage-backed securities, other asset-backed securities and covered bonds mainly in order to obtain diverse, low cost funding, but also to be used as collateral for raising funds via third party bilateral secured funding transactions or for creating collateral which could in the future be used for liquidity purposes. The Group has successfully used bilateral secured transactions as an additional form of medium term funding; this has allowed the Group to further diversify its medium term funding investor base. The Group’s principal securitisation programmes and covered bond programme, together with the balances of the advances subject to securitisation and the carrying value of the notes in issue at 30 June 2012 and 31 December 2011 are listed below. The related notes in issue are set out in Note 23.
Loans and advances to customers include portfolios of residential mortgage loans, and receivables derived from credit agreements with retail customers for the purchases of financed vehicles, which are subject to non-recourse finance arrangements. These loans and receivables have been purchased by, or assigned to, SPEs or Abbey Covered Bonds LLP, and have been funded primarily through the issue of mortgage-backed securities, asset backed securities or covered bonds. No gain or loss has been recognised as a result of these sales. The SPEs and Abbey Covered Bonds LLP are consolidated in the Group financial statements as subsidiaries. The Company and its subsidiaries do not own directly, or indirectly, any of the share capital of the SPEs.
a) Securitisations
The balances of advances subject to securitisation at 30 June 2012 and 31 December 2011 were:
| 30 June 2012 | 31 December 2011 | |||||||
Gross assets securitised £m | Gross assets securitised £m | |||||||
| Master Trust Structures: | ||||||||
| - Holmes | 14,393 | 10,247 | ||||||
| - Fosse | 19,502 | 18,717 | ||||||
| - Langton | 15,065 | 45,449 | ||||||
| Other securitisation structures: | ||||||||
| - Motor | 546 | 813 | ||||||
| 49,506 | 75,226 | |||||||
(i) Master Trust Structures
The Group makes use of a type of securitisation known as a master trust structure. In this structure, a pool of assets is assigned to a trust company by the asset originator. A funding entity acquires a beneficial interest in the pool of assets held by the trust company with funds borrowed from qualifying SPEs, which at the same time issue asset-backed securities to third-party investors or the Group. The trust company holds the pool of assets on trust for the funding entity and the originator. The originator holds a beneficial interest over the share of the pool of assets not purchased by the funding entity, known as the seller share.
The Company and its subsidiaries are under no obligation to support any losses that may be incurred by the securitisation companies or holders of the securities and do not intend to provide such further support. Holders of the securities are only entitled to obtain payment of principal and interest to the extent that the resources of the securitisation companies are sufficient to support such payments, and the holders of the securities have agreed in writing not to seek recourse in any other form.
The Company and its subsidiaries receive payments from the securitisation companies in respect of fees for administering the loans, and payment of deferred consideration for the sale of the loans. The Company and its subsidiaries have no right or obligation to repurchase any securitised loan, except if certain representations and warranties given by the Company or its subsidiaries at the time of transfer are breached and, in certain cases, if there is a product switch.
Holmes
Outstanding balances of assets securitised and notes in issue (non-recourse finance) under the Holmes securitisation structure at 30 June 2012 and 31 December 2011 were:
| 30 June 2012 | 31 December 2011 | ||||||||||||||||||||||||
Securitisation company | Closing date of securitisation | Gross assets securitised £m | Notes in issue £m | Issued to Santander UK plc as collateral £m | Gross assets securitised £m | Notes in issue £m | Issued to Santander UK plc as collateral £m | ||||||||||||||||||
| Holmes Master Issuer plc – 2007/1 | 28 March 2007 | 597 | 638 | — | 515 | 644 | — | ||||||||||||||||||
| Holmes Master Issuer plc – 2007/2 | 20 June 2007 | 447 | 479 | — | 377 | 483 | — | ||||||||||||||||||
| Holmes Master Issuer plc – 2010/1 | 12 November 2010 | 2,426 | 1,992 | 600 | 2,623 | 2,035 | 600 | ||||||||||||||||||
| Holmes Master Issuer plc – 2011/1 | 9 February 2011 | 2,019 | 1,707 | 450 | 2,194 | 2,070 | 450 | ||||||||||||||||||
| Holmes Master Issuer plc – 2011/2 | 24 March 2011 | 235 | 250 | — | 250 | 251 | — | ||||||||||||||||||
| Holmes Master Issuer plc – 2011/3 | 21 September 2011 | 2,251 | 2,402 | — | 2,399 | 2,437 | — | ||||||||||||||||||
| Holmes Master Issuer plc – 2012/1 | 24 January 2012 | 2,597 | 2,163 | 610 | — | — | — | ||||||||||||||||||
| Holmes Master Issuer plc – 2012/2 | 17 April 2012 | 912 | 798 | 175 | — | — | — | ||||||||||||||||||
| Holmes Master issuer plc – 2012/3 | 7 June 2012 | 595 | 635 | — | — | — | — | ||||||||||||||||||
| Beneficial interest in mortgages held by Holmes Trustees Ltd | 2,314 | — | — | 1,889 | — | — | |||||||||||||||||||
| 14,393 | 11,064 | 1,835 | 10,247 | 7,920 | 1,050 | ||||||||||||||||||||
| Less: Held by the Group | (93 | ) | (91 | ) | |||||||||||||||||||||
| Total securitisations (See Note 23) | 10,971 | 7,829 | |||||||||||||||||||||||
Using a master trust structure, the Company has assigned portfolios of residential mortgages and their related security to Holmes Trustees Limited, a trust company that holds the portfolios of mortgages on trust for the Company and Holmes Funding Limited. Proceeds from notes issued to third party investors or the Group by SPE’s under the Holmes master trust structure have been loaned to Holmes Funding Limited, which in turn used the funds to purchase its beneficial interests in the portfolio of assets held by Holmes Trustees Limited. As part of a restructure in October 2010 to return the Holmes securitisation structure to a third party issuance programme a £5.7bn existing note redemption reserve fund with Holmes Trustees Limited was created. The existing note redemption reserve fund can in certain circumstances be used to fund any shortfall of principal receipts in relation to the scheduled redemption of the Holmes Master Issuer plc Series 2007-1 and Series 2007-2 notes on an interest payment date.
The minimum value of assets required to be held by Holmes Trustee Limited is a function of the notes in issue under the Holmes master trust structure and the Company’s required minimum share. Holmes Funding Limited has cash deposits totalling £0.4bn (31 December 2011: £0.1bn), which have been accumulated to finance the redemption of a number of securities issued by the Holmes securitisation companies. The share of Holmes Funding Limited in the trust assets is therefore reduced by this amount.
Holmes Funding Limited has a beneficial interest of £12.1bn (31 December 2011: £8.4bn) in the residential mortgage loans held by Holmes Trustees Limited, the remaining share of the beneficial interest in residential mortgage loans held by Holmes Trustees Limited belongs to Santander UK plc, and amounts to £2.3bn (31 December 2011: £1.9bn).
In the first half of 2012, £4.4bn (six months ended 30 June 2011: £2.8bn) of mortgage-backed notes were issued from Holmes Master Issuer plc. Mortgage-backed securities totalling £0.3bn (six months ended 30 June 2011: £3.5bn) equivalent were redeemed during the period.
Fosse
Outstanding balances of assets securitised and notes in issue (non-recourse finance) under the Fosse securitisation structure at 30 June 2012 and 31 December 2011 were:
| 30 June 2012 | 31 December 2011 | ||||||||||||||||||||||||
Securitisation company | Closing date of securitisation | Gross assets securitised £m | Notes in issue £m | Issued to Santander UK plc as collateral £m | Gross assets securitised £m | Notes in issue £m | Issued to Santander UK plc as collateral £m | ||||||||||||||||||
| Fosse Master Issuer plc | 28 November 2006 | 470 | 503 | — | 652 | 601 | — | ||||||||||||||||||
| Fosse Master Issuer plc | 1 August 2007 | 1,328 | 1,421 | — | 1,713 | 1,579 | — | ||||||||||||||||||
| Fosse Master Issuer plc | 21 August 2008 | 167 | 179 | — | 218 | 201 | — | ||||||||||||||||||
| Fosse Master Issuer plc | 12 March 2010 | 1,643 | 1,368 | 390 | 1,509 | 1,391 | 390 | ||||||||||||||||||
| Fosse Master Issuer plc | 3 June 2010 | 1,322 | 1,162 | 252 | 1,439 | 1,326 | 252 | ||||||||||||||||||
| Fosse Master Issuer plc | 27 July 2010 | 3,695 | 3,450 | 502 | 3,810 | 3,510 | 502 | ||||||||||||||||||
| Fosse Master Issuer plc | 9 September 2010 | 1,163 | 1,244 | — | 1,372 | 1,265 | — | ||||||||||||||||||
| Fosse Master Issuer plc | 25 May 2011 | 4,152 | 3,472 | 968 | 4,162 | 3,835 | 968 | ||||||||||||||||||
| Fosse Master Issuer plc | 6 December 2011 | 1,254 | 1,106 | 235 | 1,207 | 1,113 | 234 | ||||||||||||||||||
| Fosse Master Issuer plc | 23 May 2012 | 2,420 | 2,304 | 285 | — | — | — | ||||||||||||||||||
| Beneficial interest in mortgages held by Fosse Master Trust Ltd | 1,888 | — | — | 2,635 | — | — | |||||||||||||||||||
| 19,502 | 16,209 | 2,632 | 18,717 | 14,821 | 2,346 | ||||||||||||||||||||
| Less: Held by the Group | (93 | ) | (102 | ) | |||||||||||||||||||||
| Total securitisations (See Note 23) | 16,116 | 14,719 | |||||||||||||||||||||||
Alliance & Leicester plc established the Fosse Master Trust securitisation structure in 2006. Notes were issued by Fosse Master Issuer plc to third party investors and the proceeds loaned to Fosse Funding (No.1) Limited, which in turn used the funds to purchase beneficial interests in mortgages held by Fosse Trustee Limited. Alliance & Leicester plc’s roles in the Fosse transaction were transferred to the Company with effect from 28 May 2010.
Both Fosse Funding (No.1) Limited and the Company have a beneficial interest in the mortgages held in trust by Fosse Trustee Limited. The minimum value of assets required to be held by Fosse Trustee Limited is a function of the notes in issue under the Fosse master trust structure and the Company’s required minimum share.
Fosse Funding (No.1) Limited has cash deposits totalling £1,199m (31 December 2011: £350m), which have been accumulated to finance the redemption of a number of securities issued by Fosse Master Issuer plc. Fosse Funding (No.1) Limited’s beneficial interest in the assets held by Fosse Trustee Limited is therefore reduced by this amount.
In the first half of 2012, £2.6bn (six months ended 30 June 2011: £4.7bn) of mortgage-backed notes were issued from Fosse Master Issuer plc. Mortgage-backed notes totalling £0.8bn (six months ended 30 June 2011: £0.2bn) equivalent were redeemed during the period.
Langton
Outstanding balances of assets securitised and notes in issue (non-recourse finance) under the Langton securitisation structure at 30 June 2012 and 31 December 2011 were:
| 30 June 2012 | 31 December 2011 | ||||||||||||||||||||||||
Securitisation company | Closing date of securitisation | Gross assets securitised £m | Notes in issue £m | Issued to Santander UK plc as collateral £m | Gross assets securitised £m | Notes in issue £m | Issued to Santander UK plc as collateral £m | ||||||||||||||||||
| Langton Securities (2010-1) plc (1) | 1 October 2010 | 1,644 | — | 1,598 | 7,726 | — | 7,928 | ||||||||||||||||||
| Langton Securities (2010-1) plc (2) | 12 October 2010 | 1,318 | — | 1,281 | 9,895 | — | 10,153 | ||||||||||||||||||
| Langton Securities (2010-2) plc | 12 October 2010 | 1,543 | — | 1,499 | 5,591 | — | 5,737 | ||||||||||||||||||
| Langton Securities (2010-2) plc (2) | 28 July 2011 | 1,567 | — | 1,523 | 1,661 | — | 1,704 | ||||||||||||||||||
| Langton Securities (2008-1) plc (2) | 23 March 2011 | 2,133 | — | 2,072 | 15,999 | — | 16,417 | ||||||||||||||||||
| Beneficial interest in mortgages held by Langton Master Trust Ltd | 6,860 | — | — | 4,577 | — | — | |||||||||||||||||||
| 15,065 | — | 7,973 | 45,449 | — | 41,939 | ||||||||||||||||||||
Alliance & Leicester plc established the Langton Master Trust securitisation structure on 25 January 2008. Notes were issued by Langton Securities (2008-1) plc, Langton Securities (2008-2) plc and Langton Securities (2008-3) plc to Alliance & Leicester plc, for the purpose of creating collateral to be used for funding and liquidity. Alliance & Leicester plc’s roles in the Langton transaction were transferred to the Company with effect from 28 May 2010.
Each entity loaned the proceeds of the Notes issued to Langton Funding (No.1) Limited, which in turn used the funds to purchase a beneficial interest in the mortgages held by Langton Mortgages Trustee Limited.
Both Langton Funding (No. 1) Limited and the Company have a beneficial interest in the mortgages held in trust by Langton Mortgages Trustee Limited. The minimum value of assets required to be held by Langton Mortgages Trustee Limited is a function of the notes in issue under the Langton master trust structure and the Company’s required minimum share.
Langton Funding (No.1) Limited has no cash deposits (31 December 2011: £nil), which have been accumulated to finance the redemption of a number of securities issued by the Langton securitisation companies. Langton Funding (No.1) Limited’s beneficial interest in the assets held by Langton Mortgages Trustee Limited is therefore reduced by this amount.
In the first half of 2012 and the first half of 2011, there were no issuances from any of the Langton issuing companies. Mortgage-backed notes totalling £33.9bn (six months ended 30 June 2011: £5.8bn) equivalent were redeemed during the period.
(ii) Other securitisation structures
Motor 2011 plc
In April 2011, the Group issued £1.3bn notes through Motor 2011 plc, a pass-through stand-alone vehicle for the securitisation of receivables derived from credit agreements with retail customers for the purchases of financed vehicles.
Outstanding balances of assets securitised and notes in issue (non-recourse finance) under the Motor 2011 securitisation structure at 30 June 2012 and 31 December 2011 were:
| 30 June 2012 | 31 December 2011 | ||||||||||||||||||||||||
Securitisation company | Closing date of securitisation | Gross assets securitised £m | Notes in issue £m | Issued to Santander Consumer (UK) plc as collateral £m | Gross assets securitised £m | Notes in issue £m | Issued to Santander Consumer (UK) plc as collateral £m | ||||||||||||||||||
| Motor 2011 plc | 21 April 2011 | 546 | 135 | 445 | 813 | 268 | 583 | ||||||||||||||||||
| Less: Held by the Group | — | — | |||||||||||||||||||||||
| Total securitisations (See Note 23) | 135 | 268 | |||||||||||||||||||||||
b) Covered Bonds
The Group also issues covered bonds. In this structure, Abbey National Treasury Services plc (the ‘Issuer’) issues covered bonds, which are a direct, unsecured and unconditional obligation of the Issuer. The covered bonds benefit from a guarantee from the Company and Abbey Covered Bonds LLP. The Issuer makes a term advance to Abbey Covered Bonds LLP equal to the sterling proceeds of each issue of covered bonds. Abbey Covered Bonds LLP uses the proceeds of the term advance to purchase portfolios of residential mortgage loans and their security from the Company. Under the terms of the guarantee, Abbey Covered Bonds LLP has agreed to pay an amount equal to the guaranteed amounts when the same shall become due for payment but which would otherwise be unpaid by the Issuer or the Company.
Outstanding balances of loans and advances assigned to the covered bond programme at 30 June 2012 and 31 December 2011 were:
| 30 June 2012 | 31 December 2011 | |||||||||||||||
Gross assets assigned £m | Notes in issue £m | Gross assets assigned £m | Notes in issue £m | |||||||||||||
| Euro 35bn Global Covered Bond Programme | 39,135 | 22,979 | 25,081 | 18,191 | ||||||||||||
For further information on the euro 35bn Global Covered Bond Programme, see Note 23.
13. SPECIAL PURPOSE ENTITIES
Special Purpose Entities are formed by the Group to accomplish specific and well-defined objectives. The Group consolidates these SPEs when the substance of the relationship indicates control,
as described in Note 1 of the Group’s 2011 Annual Report.
Consolidated special purpose entities
In addition to the SPEs disclosed in Note 12 which are used for securitisation and covered bond programmes, the only other SPEs sponsored and consolidated by the Group are described below. All the external assets in these entities are included in the relevant Notes in these Condensed Consolidated Interim Financial Statements.
Santander UK Foundation Limited
Santander UK Foundation Limited supports disadvantaged people throughout the UK through the following three charitable priorities: education, financial capability and community regeneration. Santander UK Foundation Limited’s only third party assets consist of available-for-sale securities of £11m (31 December 2011: £11m), loans and advances to banks of £3m (31 December 2011: £nil) and other assets of £2m (31 December 2011: £nil).
Details of the Group’s other consolidated special purpose entities are set out in Note 20 of the Group’s 2011 Annual Report.
Off balance sheet special purpose entities
The only SPEs sponsored but not consolidated by the Group are SPEs which issue shares that back retail structured products. At 30 June 2012, the total value of products issued by these SPEs was £22m (31 December 2011: £36m). The Group's arrangements with these entities comprise the provision of equity derivatives and a secondary market-making service to those retail customers who wish to exit early from these products.
At 30 June 2012, the maximum exposure to the SPEs sponsored but not consolidated by the Group was £14m (31 December 2011: £17m).
14. TRANSFERS OF FINANCIAL ASSETS NOT QUALIFYING FOR DERECOGNITION
The Group enters into transactions in the normal course of business by which it transfers recognised financial assets directly to third parties or to SPEs. These transfers may give rise to the full or partial derecognition of the financial assets concerned. A description of financial assets that do not qualify for derecognition is set out in Note 21 of the Group’s 2011 Annual Report.
The following table analyses the carrying amount of financial assets that did not qualify for derecognition and their associated financial liabilities:
30 June 2012 £m | 30 June 2012 £m | 31 December 2011 £m | 31 December 2012 £m | |||||||||||||
| Nature of transaction | Carrying amount of transferred assets | Carrying amount of associated liabilities | Carrying amount of transferred assets | Carrying amount of associated liabilities | ||||||||||||
| Sale and repurchase agreements (See Note 30) | 4,412 | 4,599 | 3,678 | 3,905 | ||||||||||||
| Securities lending agreements | 6,418 | 6,844 | 2,913 | 2,964 | ||||||||||||
| Securitisations (See Notes 12 and 23) | 49,506 | 27,222 | 75,226 | 22,816 | ||||||||||||
| 60,336 | 38,665 | 81,817 | 29,685 | |||||||||||||
15. AVAILABLE-FOR-SALE SECURITIES
30 June 2012 £m | 31 December 2011 £m | |||||||
| Debt securities | 4,829 | — | ||||||
| Equity securities | 22 | 46 | ||||||
| 4,851 | 46 | |||||||
Debt securities principally consist of UK Government and French Government securities.
Debt securities and equity securities can be analysed by listing status as follows:
30 June 2012 £m | 31 December 2011 £m | |||||||
| Debt securities: | ||||||||
| - Listed in the UK | 3,879 | — | ||||||
| - Listed elsewhere | 950 | — | ||||||
| 4,829 | — | |||||||
| Equity securities: | ||||||||
| - Listed in the UK | 12 | 11 | ||||||
| - Listed elsewhere | 1 | 25 | ||||||
| - Unlisted | 9 | 10 | ||||||
| 22 | 46 | |||||||
Debt securities at 30 June 2012 by contractual maturity and the related yield:
| 30 June 2012 | On demand £m | In not more than 3 months £m | In more than 3 months but not more than 1 year £m | In more than 1 year but not more than 5 years £m | In more than five years but not more than ten years £m | In more than ten years £m | Total £m | |||||||||||||||||||||
| Issued by public bodies: | ||||||||||||||||||||||||||||
| - UK Government | — | — | — | 3,765 | — | — | 3,765 | |||||||||||||||||||||
| - Other OECD | — | — | — | 918 | — | — | 918 | |||||||||||||||||||||
| - Banks | — | — | — | 111 | — | — | 111 | |||||||||||||||||||||
| - Building societies | — | — | — | 35 | — | — | 35 | |||||||||||||||||||||
| Weighted average yield for period % | — | — | — | 2.56 | % | — | — | 2.56 | % | |||||||||||||||||||
The movement in available-for-sale securities can be summarised as follows:
| £m | ||||
| At 1 January 2012 | 46 | |||
| Additions | 4,830 | |||
| Redemptions and maturities | (9 | ) | ||
| Movement in fair value | (16 | ) | ||
| At 30 June 2012 | 4,851 | |||
16. LOAN AND RECEIVABLE SECURITIES
30 June 2012 £m | 31 December 2011 £m | |||||||
| Floating rate notes | 232 | 521 | ||||||
| Asset-backed securities | 1,062 | 1,142 | ||||||
| Collateralised debt obligations | 3 | 3 | ||||||
| Collateralised loan obligations | 87 | 90 | ||||||
Other(1) | 21 | 21 | ||||||
| Loan and receivable securities | 1,405 | 1,777 | ||||||
| Less: Impairment allowances | (6 | ) | (6 | ) | ||||
| Loan and receivable securities, net of impairment allowances | 1,399 | 1,771 | ||||||
(1) Comprises £21m principal protected notes (31 December 2011: £21m).
These assets were acquired as part of the transfer of Alliance & Leicester plc to the Group in 2008 and as part of an alignment of portfolios across the Banco Santander, S.A. group in 2010 and are in run-off. Detailed analysis of these securities is set out below.
Included in the above balances are amounts owed to the Group by fellow subsidiaries of £26m (31 December 2011: £109m).
Floating rate notes
Floating rate notes can be analysed by the geographic location of the issuer or counterparty as follows:
| 30 June 2012 | 31 December 2011 | Income statement | ||||||||||||||||||||||||||||||||||||||
| Nominal value | Net Book value | Fair value | Fair value as % of nominal | Nominal value | Net Book value | Fair value | Fair value as % of nominal | Six months ended 30 June 2012 | Six months ended 30 June 2011 | |||||||||||||||||||||||||||||||
| Country | £m | £m | £m | % | £m | £m | £m | % | £m | £m | ||||||||||||||||||||||||||||||
| UK | — | — | — | — | 37 | 37 | 27 | 73 | — | 3 | ||||||||||||||||||||||||||||||
| Italy | 74 | 73 | 68 | 92 | 80 | 80 | 71 | 89 | 1 | — | ||||||||||||||||||||||||||||||
| Spain | 77 | 76 | 71 | 92 | 256 | 255 | 247 | 96 | 1 | 2 | ||||||||||||||||||||||||||||||
| Rest of Europe | 52 | 51 | 44 | 85 | 123 | 115 | 101 | 82 | 1 | (1 | ) | |||||||||||||||||||||||||||||
| US | 27 | 26 | 25 | 93 | 30 | 28 | 26 | 87 | — | 4 | ||||||||||||||||||||||||||||||
| Total | 230 | 226 | 208 | 90 | 526 | 515 | 472 | 90 | 3 | 8 | ||||||||||||||||||||||||||||||
Floating rate notes can be analysed by the credit rating of the issuer or counterparty as follows:
| 30 June 2012 | 31 December 2011 | Income statement | ||||||||||||||||||||||||||||||||||||||
| Nominal value | Net Book value | Fair value | Fair value as % of nominal | Nominal value | Net Book value | Fair value | Fair value as % of nominal | Six months ended 30 June 2012 | Six months ended 30 June 2011 | |||||||||||||||||||||||||||||||
| Credit rating | £m | £m | £m | % | £m | £m | £m | % | £m | £m | ||||||||||||||||||||||||||||||
| AA | 47 | 46 | 43 | 91 | 165 | 165 | 159 | 96 | 1 | 5 | ||||||||||||||||||||||||||||||
| A | 152 | 150 | 139 | 91 | 273 | 270 | 252 | 92 | 2 | 4 | ||||||||||||||||||||||||||||||
| BBB | 19 | 18 | 16 | 84 | 75 | 73 | 61 | 81 | — | (1 | ) | |||||||||||||||||||||||||||||
| Below BBB | 12 | 12 | 10 | 83 | 13 | 7 | — | — | — | — | ||||||||||||||||||||||||||||||
| Total | 230 | 226 | 208 | 90 | 526 | 515 | 472 | 90 | 3 | 8 | ||||||||||||||||||||||||||||||
Asset-Backed Securities
Asset-backed securities can be analysed by the geographic location of the issuer or counterparty as follows:
| 30 June 2012 | 31 December 2011 | Income statement | ||||||||||||||||||||||||||||||||||||||
| Nominal value | Net Book value | Fair value | Fair value as % of nominal | Nominal value | Net Book value | Fair value | Fair value as % of nominal | Six months ended 30 June 2012 | Six months ended 30 June 2011 | |||||||||||||||||||||||||||||||
| Country | £m | £m | £m | % | £m | £m | £m | % | £m | £m | ||||||||||||||||||||||||||||||
| UK | ||||||||||||||||||||||||||||||||||||||||
| ABS | 74 | 74 | 74 | 100 | 74 | 74 | 74 | 100 | — | 1 | ||||||||||||||||||||||||||||||
| MBS | 199 | 187 | 157 | 79 | 223 | 211 | 169 | 76 | 2 | 3 | ||||||||||||||||||||||||||||||
| 273 | 261 | 231 | 85 | 297 | 285 | 243 | 82 | 2 | 4 | |||||||||||||||||||||||||||||||
| US | ||||||||||||||||||||||||||||||||||||||||
| ABS | 324 | 299 | 272 | 84 | 330 | 304 | 273 | 83 | 2 | 4 | ||||||||||||||||||||||||||||||
| MBS | 45 | 38 | 32 | 71 | 49 | 41 | 33 | 67 | 1 | (12 | ) | |||||||||||||||||||||||||||||
| 369 | 337 | 304 | 82 | 379 | 345 | 306 | 81 | 3 | (8 | ) | ||||||||||||||||||||||||||||||
| Rest of Europe | ||||||||||||||||||||||||||||||||||||||||
| ABS | 102 | 101 | 89 | 87 | 112 | 112 | 99 | 88 | — | 1 | ||||||||||||||||||||||||||||||
| MBS | 350 | 335 | 284 | 81 | 377 | 364 | 305 | 81 | — | (1 | ) | |||||||||||||||||||||||||||||
| 452 | 436 | 373 | 83 | 489 | 476 | 404 | 83 | — | — | |||||||||||||||||||||||||||||||
| Rest of world | ||||||||||||||||||||||||||||||||||||||||
| ABS | 12 | 10 | 10 | 83 | 17 | 15 | 15 | 88 | — | — | ||||||||||||||||||||||||||||||
| MBS | 19 | 18 | 16 | 84 | 22 | 21 | 18 | 82 | — | — | ||||||||||||||||||||||||||||||
| 31 | 28 | 26 | 84 | 39 | 36 | 33 | 85 | — | — | |||||||||||||||||||||||||||||||
| Total | 1,125 | 1,062 | 934 | 83 | 1,204 | 1,142 | 986 | 82 | 5 | (4 | ) | |||||||||||||||||||||||||||||
Asset-backed securities can be analysed by the credit rating of the issuer or counterparty as follows:
| 30 June 2012 | 31 December 2011 | Income statement | ||||||||||||||||||||||||||||||||||||||
| Nominal value | Net Book value | Fair value | Fair value as % of nominal | Nominal value | Net Book value | Fair value | Fair value as % of nominal | Six months ended 30 June 2012 | Six months ended 30 June 2011 | |||||||||||||||||||||||||||||||
| Credit rating | £m | £m | £m | % | £m | £m | £m | % | £m | £m | ||||||||||||||||||||||||||||||
| AAA | ||||||||||||||||||||||||||||||||||||||||
| ABS | 354 | 331 | 295 | 83 | 367 | 346 | 305 | 83 | 2 | 6 | ||||||||||||||||||||||||||||||
| MBS | 414 | 397 | 342 | 83 | 416 | 396 | 324 | 78 | 4 | 3 | ||||||||||||||||||||||||||||||
| 768 | 728 | 637 | 83 | 783 | 742 | 629 | 80 | 6 | 9 | |||||||||||||||||||||||||||||||
| AA+ | ||||||||||||||||||||||||||||||||||||||||
| MBS | 38 | 37 | 35 | 92 | 102 | 97 | 94 | 92 | — | — | ||||||||||||||||||||||||||||||
| 38 | 37 | 35 | 92 | 102 | 97 | 94 | 92 | — | — | |||||||||||||||||||||||||||||||
| AA | ||||||||||||||||||||||||||||||||||||||||
| ABS | 10 | 10 | 7 | 70 | 9 | 8 | 5 | 56 | — | — | ||||||||||||||||||||||||||||||
| MBS | 102 | 94 | 69 | 68 | 109 | 103 | 75 | 69 | 1 | 2 | ||||||||||||||||||||||||||||||
| 112 | 104 | 76 | 68 | 118 | 111 | 80 | 68 | 1 | 2 | |||||||||||||||||||||||||||||||
| A | ||||||||||||||||||||||||||||||||||||||||
| ABS | 76 | 75 | 75 | 99 | 88 | 86 | 86 | 98 | — | — | ||||||||||||||||||||||||||||||
| MBS | 37 | 34 | 28 | 76 | 35 | 31 | 27 | 77 | — | — | ||||||||||||||||||||||||||||||
| 113 | 109 | 103 | 91 | 123 | 117 | 113 | 92 | — | — | |||||||||||||||||||||||||||||||
| BBB | ||||||||||||||||||||||||||||||||||||||||
| MBS | 5 | 4 | 4 | 80 | 6 | 5 | 4 | 67 | — | (1 | ) | |||||||||||||||||||||||||||||
| 5 | 4 | 4 | 80 | 6 | 5 | 4 | 67 | — | (1 | ) | ||||||||||||||||||||||||||||||
| Below BBB | ||||||||||||||||||||||||||||||||||||||||
| ABS | 72 | 68 | 68 | 94 | 69 | 65 | 65 | 94 | — | — | ||||||||||||||||||||||||||||||
| MBS | 17 | 12 | 11 | 65 | 3 | 5 | 1 | 33 | (2 | ) | (14 | ) | ||||||||||||||||||||||||||||
| 89 | 80 | 79 | 89 | 72 | 70 | 66 | 92 | (2 | ) | (14 | ) | |||||||||||||||||||||||||||||
| Total | 1,125 | 1,062 | 934 | 83 | 1,204 | 1,142 | 986 | 82 | 5 | (4 | ) | |||||||||||||||||||||||||||||
Asset-backed securities above include the following:
| > | ALT-A US asset-backed securities – securities with book values of £20m (31 December 2011: £22m) and fair values of £16m (31 December 2011: £16m). |
| > | Monoline insurer exposures - The Group has a £72m (31 December 2011: £73m) exposure to corporate bonds and securitisations which are wrapped by monoline insurers. The principal risk exposures are recorded against the securitisations, with the monoline wraps being viewed as contingent exposures. |
Collateralised Loan Obligations (‘CLOs’)
The Group acquired a portfolio of CLOs as part of the acquisition of Alliance & Leicester plc in 2008. This portfolio is in run-off. At 30 June 2012, the Group had an exposure to CLOs with a nominal value of £96m (31 December 2011: £99m), a book value of £87m (31 December 2011: £90m) and a fair value of £72m (31 December 2011: £72m). In the first half of 2012, impairment losses of £nil (Six months ended 30 June 2011: £nil) were recognised in the income statement. The geographical locations of the issuer or counterparty of the CLO exposures are the UK, the rest of Europe and the US. 51% of the nominal values are rated BBB (31 December 2011: 51%) with 2% rated AAA (31 December 2011: 2%), 25% rated AA (31 December 2011: 25%), 20% rated A (31 December 2011: 20%) and 2% related below BBB (31 December 2011: 2%).
17. INTANGIBLE ASSETS
a) Goodwill
30 June 2012 £m | 31 December 2011 £m | |||||||
| Cost | ||||||||
| At 1 January | 1,916 | 1,916 | ||||||
| Acquisitions | — | — | ||||||
| At 30 June/31 December | 1,916 | 1,916 | ||||||
| Accumulated impairment | ||||||||
| At 1 January | 82 | 22 | ||||||
| Impairment charge | — | 60 | ||||||
| At 30 June/31 December | 82 | 82 | ||||||
| Net book value | 1,834 | 1,834 | ||||||
Impairment of goodwill
During the period there was no impairment of goodwill (Six months ended 30 June 2011: £nil). Impairment testing in respect of goodwill allocated to each cash-generating unit is performed annually or more frequently if there are impairment indicators present. For the purpose of impairment testing, the cash-generating units are based on customer groups within the relevant business divisions.
The cash flow projections for each cash-generating unit are based on plans approved by the Company’s Board. The assumptions included in the expected future cash flows for each cash-generating unit take into consideration the UK economic environment and financial outlook within which the cash-generating unit operates. Key assumptions include projected GDP growth rates, the level of interest rates and the level and change in unemployment rates in the UK. The discount rate used to discount the cash flows is based on a pre-tax rate that reflects the weighted average cost of capital (‘WACC’) allocated by the Group to investments in the business division within which the cash-generating unit operates. The growth rate used reflects management’s five-year forecasts, with a terminal growth rate of 2% applied thereafter, in line with the estimated long-term average UK GDP growth rate.
Based on the conditions at the balance sheet date, management determined that a reasonably possible change in any of the key assumptions described above would not cause an impairment to be recognised in respect of goodwill arising on the Group’s business combinations.
The following cash-generating units include in their carrying values goodwill that comprises the goodwill reported by the Group. The cash-generating units do not carry on their balance sheets any other intangible assets with indefinite useful lives.
30 June 2012
Business Division | Cash-Generating Unit | Goodwill £m | Basis of valuation | Key assumptions | Discount rate | Growth rate(1) | |||||||||
| Retail Banking | Personal financial services | 1,169 | Value in use: cash flow | 5 year plan | 11.0 | % | 3 | % | |||||||
| Retail Banking | Santander Cards | 456 | Value in use: cash flow | 5 year plan | 11.0 | % | 1 | % | |||||||
| Retail Banking | Santander Consumer | 175 | Value in use: cash flow | 5 year plan | 11.0 | % | 2 | % | |||||||
| Retail Banking | Cater Allen Private Bank | 30 | Value in use: cash flow | 5 year plan | 11.0 | % | 4 | % | |||||||
| Retail Banking | Other | 4 | Value in use: cash flow | 5 year plan | 11.0 | % | 2 | % | |||||||
| 1,834 | |||||||||||||||
| (1) | Average growth rate based on the 5 year plan for the first five years and a growth rate of 2% applied thereafter. |
31 December 2011
Business Division | Cash-Generating Unit | Goodwill £m | Basis of valuation | Key assumptions | Discount rate | Growth rate(1) | |||||||||
| Retail Banking | Personal financial services | 1,169 | Value in use: cash flow | 5 year plan | 11.2 | % | 2 | % | |||||||
| Retail Banking | Santander Cards | 456 | Value in use: cash flow | 5 year plan | 11.2 | % | 9 | % | |||||||
| Retail Banking | Santander Consumer | 175 | Value in use: cash flow | 5 year plan | 11.2 | % | 2 | % | |||||||
| Retail Banking | Cater Allen Private Bank | 30 | Value in use: cash flow | 5 year plan | 11.2 | % | 2 | % | |||||||
| Retail Banking | Other | 4 | Value in use: cash flow | 5 year plan | 11.2 | % | 2 | % | |||||||
| 1,834 | |||||||||||||||
| (1) | Average growth rate based on the 5 year plan for the first five years and a growth rate of 2% applied thereafter. |
In the first half of 2012, the discount rate decreased by 0.2 percentage points to 11.0% (31 December 2011: 11.2%). The decrease reflected changes in current market and economic conditions. In the first half of 2012, the change in growth rates reflected the revised forecast performance of the businesses in the context of latest forecast economic conditions.
b) Other intangibles
30 June 2012 £m | 31 December 2011 £m | |||||||
| Cost | ||||||||
| At 1 January | 550 | 368 | ||||||
| Additions | 102 | 192 | ||||||
| Disposals | (9 | ) | (10 | ) | ||||
| At 30 June/31 December | 643 | 550 | ||||||
| Accumulated amortisation/impairment | ||||||||
| At 1 January | 242 | 84 | ||||||
| Impairment | — | 112 | ||||||
| Disposals | (5 | ) | (5 | ) | ||||
| Charge for the period | 15 | 51 | ||||||
| At 30 June/31 December | 252 | 242 | ||||||
| Net book value | 391 | 308 | ||||||
Other intangible assets of the Group consist of computer software together with marketing rights acquired by the Group during 2010. The marketing rights had a cost of £16m. Accumulated amortisation at the start of the period was £5m and amortisation of £1m (2011: £4m) was charged in the period, giving a net book value of £10m (2011: £11m) at 30 June 2012.
18. PROPERTY, PLANT AND EQUIPMENT
During the period, the Group spent approximately £29m (six months ended 30 June 2011: £13m) on the refurbishment of its branches and office premises, £30m (six months ended 30 June 2011: £16m) on additions to its office fixtures and equipment, £nil (six months ended 30 June 2011: £1m) on computer software and £31m (six months ended 30 June 2011: £46m) on the acquisition of operating lease assets. The Group disposed of £6m (six months ended 30 June 2011: £2m) of property, £nil (six months ended 30 June 2011: £nil) of office fixtures and equipment and £30m (six months ended 30 June 2011: £46m) of operating lease assets during the period.
At 30 June 2012, capital expenditure contracted, but not provided for was £16m (2011: £nil) in respect of property, plant and equipment. Of carrying value at the balance sheet date, £51m (2011: £176m) related to assets under construction.
19. DEFERRED TAX
Deferred taxes are calculated on temporary differences under the liability method using the tax rates expected to apply when the liability is settled or the asset is realised. The movement on the deferred tax account was as follows:
30 June 2012 £m | 31 December 2011 £m | |||||||
| At 1 January | 257 | 357 | ||||||
| Income statement charge | (44 | ) | (129 | ) | ||||
| (Charged)/credited to other comprehensive income: | ||||||||
| - retirement benefit obligations | (72 | ) | 9 | |||||
| - available-for-sale financial assets | 10 | 2 | ||||||
| (62 | ) | 11 | ||||||
| Disposal of subsidiary undertaking | — | 18 | ||||||
| At 30 June/31 December | 151 | 257 | ||||||
Deferred tax assets and liabilities are attributable to the following items:
30 June 2012 £m | 31 December 2011 £m | |||||||
| Deferred tax liabilities | ||||||||
| Pensions and other post retirement benefits | (89 | ) | (5 | ) | ||||
| Accelerated tax depreciation | (83 | ) | (97 | ) | ||||
| Other temporary differences | (48 | ) | (60 | ) | ||||
| (220 | ) | (162 | ) | |||||
| Deferred tax assets | ||||||||
| Accelerated book depreciation | 90 | 93 | ||||||
| IAS 32 and IAS 39 transitional adjustments | 62 | 73 | ||||||
| Other temporary differences | 102 | 97 | ||||||
| Tax losses carried forward | 117 | 156 | ||||||
| 371 | 419 | |||||||
Deferred tax balances are presented in the balance sheet after offsetting assets and liabilities where the Group has the legal right to off set and intends to settle on a net basis, as follows:
30 June 2012 £m | 31 December 2011 £m | |||||||
| Deferred tax assets | 371 | 419 | ||||||
| Deferred tax liabilities | (220 | ) | (162 | ) | ||||
| Net deferred tax asset | 151 | 257 | ||||||
The deferred tax assets scheduled above have been recognised on the basis that sufficient future taxable profits are forecast within the foreseeable future, in excess of the profits arising from the reversal of existing taxable temporary differences, to allow for the utilisation of the assets as they reverse. Based on the conditions at the balance sheet date, management determined that a reasonably possible change in any of the key assumptions underlying the estimated future taxable profits in the Group’s 3 Year plan would not cause a reduction in the deferred tax assets recognised.
The Group recognises deferred tax assets in respect of trading losses relating to the former Alliance & Leicester business which was transferred to Santander UK plc in May 2010 under Part VII of the Financial Services and Markets Act 2010. HM Revenue & Customs confirmed in 2010 that the availability of losses was unaffected by the transfer. Under current UK tax legislation, the tax losses do not time expire and the benefit of the tax losses carried forward may only be realised by the utilisation against the future taxable profits of the former Alliance & Leicester business. The tax losses will be utilised as soon as practical taking into account discussions with HM Revenue & Customs over the level of profits attributable to the former Alliance & Leicester business. Management currently expect that these tax losses will be fully utilised within two years.
At 30 June 2012, the Group had UK capital losses carried forward of £66m (31 December 2011: £66m). These losses are available for offset against future UK chargeable gains and under current UK tax legislation do not time expire. No deferred tax asset has been recognised in respect of these capital losses on the basis that the timing of any benefit is uncertain.
The deferred tax charge in the income statement comprises the following temporary differences:
Six months ended 30 June 2012 £m | Six months ended 30 June 2011 £m | |||||||
| Accelerated tax depreciation | 11 | 21 | ||||||
| Pensions and other post-retirement benefits | (12 | ) | 60 | |||||
| IAS 32 and IAS 39 transition adjustments | (11 | ) | 11 | |||||
| Tax losses carried forward | (39 | ) | (12 | ) | ||||
| Other temporary differences | 7 | 67 | ||||||
| (44 | ) | 147 | ||||||
20. DEPOSITS BY BANKS
30 June 2012 £m | 31 December 2011 £m | |||||||
| Items in the course of transmission | 423 | 1,045 | ||||||
| Deposits by banks - securities sold under agreements to repurchase | 7,330 | 5,574 | ||||||
| Amounts due to ultimate parent - securities sold under repurchase agreements | 3,200 | 2,517 | ||||||
| - other | 13 | — | ||||||
| Amounts due to fellow Banco Santander subsidiaries – securities sold under repurchase agreements | 1,940 | 565 | ||||||
| – other | 68 | 40 | ||||||
| Other deposits | 2,275 | 1,885 | ||||||
| 15,249 | 11,626 | |||||||
21. TRADING LIABILITIES
30 June 2012 £m | 31 December 2011 £m | |||||||
| Deposits by banks - securities sold under repurchase agreements | 3,724 | 10,105 | ||||||
- other(1) | 4,245 | 4,403 | ||||||
| Deposits by customers - securities sold under repurchase agreements | 16,011 | 5,519 | ||||||
- other(2) | 2,557 | 4,963 | ||||||
| Short positions in securities and unsettled trades | 1,698 | 755 | ||||||
| 28,235 | 25,745 | |||||||
(1) | Comprises cash collateral held of £2,633m (31 December 2011: £2,401m) and short-term deposits of £1,612m (31 December 2011: £2,002m). |
| (2) | Comprises short-term deposits of £1,327m (31 December 2011: £3,662m) and equity index-linked deposits of £1,230m (31 December 2011: £1,301m). |
Included in the above balances are amounts owed by the Group to the ultimate parent undertaking of £583m (31 December 2011: £620m) and to fellow subsidiaries of £47m (31 December 2011: £51m).
22. FINANCIAL LIABILITIES DESIGNATED AT FAIR VALUE
30 June 2012 £m | 31 December 2011 £m | |||||||
| Debt securities in issue - US$10bn Euro Commercial Paper Programme | 1,516 | 429 | ||||||
| - US$20bn Euro Medium Term Note Programme | 1,568 | 4,594 | ||||||
| - Note, Certificate and Warrant Programme | 1,728 | 1,744 | ||||||
| - Other bonds | — | 62 | ||||||
| Warrants | 165 | 8 | ||||||
| 4,977 | 6,837 | |||||||
The net loss during the period attributable to changes in the Group’s own credit risk on the above debt securities in issue was £23m (2011: net gain of £64m). The cumulative net gain attributable to changes in the Group’s own credit risk on the above debt securities in issue at 30 June 2012 was £70m (2011: net gain of £93m).
The amount that would be required to be contractually paid at maturity of the deposits by banks, deposits by customers, and debt securities in issue above is £387m (2011: £366m) higher than the carrying value.
Details of the Group’s US$10bn Euro Commercial Paper Programme, US$20bn Euro Medium Term Note Programme and Warrants Programme are set out in Note 32 of the Group’s 2011 Annual Report.
Note, Certificate and Warrant Programme (formerly known as the Euro 10bn structured note programme)
Abbey National Treasury Services plc may from time to time issue notes, redeemable certificates and warrants (together the ‘’Securities’’) denominated in any currency as agreed between Abbey National Treasury Services plc and the relevant dealers under the Note, Certificate and Warrant programme (the ‘’Omnibus Programme’’). The Securities are direct, unsecured and unconditional obligations of Abbey National Treasury Services plc that rank pari passu without preference among themselves and, subject as to any applicable statutory provisions or judicial order, at least equally with all other present and future unsecured and unsubordinated obligations of Abbey National Treasury Services plc. The payments of all amounts due in respect of the Securities have been unconditionally and irrevocably guaranteed by the Company.
The Omnibus Programme provides for the issuance of commodity linked securities, credit linked securities, currency linked securities, equity linked securities, equity index linked securities, fixed rate securities, floating rate securities, fund linked securities, inflation linked securities, property linked securities, zero-coupon/discount securities and any other structured securities as agreed between Abbey National Treasury Services plc and the relevant dealers. Securities may be issued in bearer or global form and may be listed on the London Stock Exchange or any other or further stock exchange(s) or may be unlisted, as agreed between Abbey National Treasury Services plc and the relevant dealers.
The maximum aggregate nominal amount of all structured notes from time to time outstanding under the Omnibus programme will not exceed euro 10bn (or its equivalent in other currencies). The Securities and the Guarantee are governed by English Law.
German Note and Certificate programme
Abbey National Treasury Services plc may from time to time issue notes and redeemable certificates (together the “German Securities”) denominated in any currency as agreed between Abbey National Treasury Services plc and the relevant dealers under the German Note and Certificate programme (the “German Programme”). The German Securities are direct, unsecured and unconditional obligations of Abbey National Treasury Services plc that rank pari passu without preference among themselves and, subject as to any applicable statutory provisions or judicial order, at least equally with all other present and future unsecured and unsubordinated obligations of Abbey National Treasury Services plc. The payments of all amounts due in respect of the Securities have been unconditionally and irrevocably guaranteed by the Company.
The German Programme provides for the issuance of commodity linked securities, currency linked securities, equity linked securities, equity index linked securities, fixed rate securities, floating rate securities, fund linked securities, inflation linked securities, zero-coupon/discount securities and any other structured securities as agreed between Abbey National Treasury Services plc and the relevant dealers. Securities are issued in bearer form and may be listed on the London Stock Exchange or any other or further stock exchange(s) or may be unlisted, as agreed between Abbey National Treasury Services plc and the relevant dealers.
The maximum aggregate nominal amount of all German Securities from time to time outstanding under the programme will not exceed euro 2bn (or its equivalent in other currencies). The Securities are governed by German law. The Guarantee is governed by English law. At 30 June 2012, no issuances had been made under this programme.
23. DEBT SECURITIES IN ISSUE
30 June 2012 £m | 31 December 2011 £m | |||||||
| Bonds and medium term notes: | ||||||||
- Euro 35bn Global Covered Bond Programme(1) | 22,979 | 18,191 | ||||||
| - US$20bn euro Medium Term Note Programme | 7,016 | 4,295 | ||||||
| - US$40bn euro Medium Term Note Programme | 710 | 1,609 | ||||||
| - US$20bn Commercial Paper Programme | 2,185 | 3,069 | ||||||
| - Certificates of deposit in issue | 2,064 | 2,671 | ||||||
| 34,954 | 29,835 | |||||||
| Securitisation programmes: | ||||||||
| - Holmes | 10,971 | 7,829 | ||||||
| - Fosse | 16,116 | 14,719 | ||||||
| - Motor | 135 | 268 | ||||||
| 62,176 | 52,651 | |||||||
| (1) | Conversions from euro are made at the time of pricing of an issuance to determine availability under the programme. |
Included in the above balances are amounts owed by the Group to the ultimate parent undertaking and to fellow subsidiaries of £2,042m (31 December 2011: £107m) and £327m (31 December 2011: £137m) respectively.
Details of the euro 35bn Global Covered Bond Programme, US$20bn Commercial Paper Programme and Securitisation programmes are set out in Note 33 of the Group’s 2011 Annual Report.
US$40bn Euro Medium Term Note Programme
In January 2009, it was decided that no further issuance would be made under the US$40bn Euro Medium Term Note Programme. Alliance & Leicester plc issued both senior notes and subordinated notes and from time to time issued notes denominated in any currency as agreed with the relevant dealer under the US$40bn Euro Medium Term Note Programme. The Programme provided for issuance of fixed rate Notes, floating rate notes, index linked notes, dual currency notes and zero-coupon notes. The notes are listed on the London Stock Exchange or may be listed on any other or further stock exchange(s) or may be unlisted, as agreed.
The notes were issued in bearer form. The maximum aggregate nominal amount of all notes from time to time outstanding under the Programme did not exceed US$40bn (or its equivalent in other currencies), subject to any modifications in accordance with the terms of the Programme agreement. The notes were direct, unsecured and unconditional obligations of Alliance & Leicester plc. The notes transferred to the Company with effect from 28 May 2010. As a result, the notes are now direct, unsecured and unconditional obligations of the Company.
24. SUBORDINATED LIABILITIES
30 June 2012 £m | 31 December 2011 £m | |||||||
| £325m Sterling Preference Shares | 344 | 344 | ||||||
| £175m Fixed/Floating Rate Tier One Preferred Income Capital Securities | 215 | 216 | ||||||
| US$1,000m Non-Cumulative Trust Preferred Securities | 1,082 | 1,065 | ||||||
| Undated subordinated liabilities | 2,267 | 2,250 | ||||||
| Dated subordinated liabilities | 2,650 | 2,624 | ||||||
| 6,558 | 6,499 | |||||||
There have been no redemptions or issuances of subordinated debt in the first half of the year.
Included in the above balances are amounts owed by the Group to the ultimate parent undertaking and to fellow subsidiaries of £927m (2011: £919m) and £1,773m (2011: £1,778m) respectively.
25. PROVISIONS
Customer remediation £m | Other(1) £m | Total £m | ||||||||||
| At 1 January 2012 | 747 | 223 | 970 | |||||||||
| Additional provisions | 1 | 7 | 8 | |||||||||
| Provisions released | — | (1 | ) | (1 | ) | |||||||
| Used during the period | (135 | ) | (34 | ) | (169 | ) | ||||||
| At 30 June 2012 | 613 | 195 | 808 | |||||||||
| To be settled: | ||||||||||||
| Within 12 months | 305 | 74 | 379 | |||||||||
| In more than 12 months | 308 | 121 | 429 | |||||||||
| 613 | 195 | 808 | ||||||||||
| (1) | Includes regulatory-related provisions of £156m in respect of the Financial Services Compensation Scheme at 30 June 2012. |
Customer remediation £m | Other(1) £m | Total £m | ||||||||||
| At 1 January 2011 | 139 | 46 | 185 | |||||||||
| Additional provisions | 753 | 176 | 929 | |||||||||
| Provisions released | — | (12 | ) | (12 | ) | |||||||
| Used during the period | (145 | ) | (33 | ) | (178 | ) | ||||||
| Reclassifications | — | 46 | 46 | |||||||||
| At 31 December 2011 | 747 | 223 | 970 | |||||||||
| To be settled: | ||||||||||||
| Within 12 months | 231 | 170 | 401 | |||||||||
| In more than 12 months | 516 | 53 | 569 | |||||||||
| 747 | 223 | 970 | ||||||||||
| (1) | Includes regulatory-related provisions of £176m in respect of the Financial Services Compensation Scheme and the UK Bank Levy at 31 December 2011. |
The charge disclosed in the income statement in respect of provisions for other liabilities and charges of £7m (year ended 31 December 2011: £917m), comprises the additional provisions of £8m (year ended 31 December 2011: £929m), less the provisions released of £1m (year ended 31 December 2011: £12m) in the table above. Provisions principally comprise amounts in respect of customer remediation, regulatory-related provisions, litigation and related expenses, restructuring expenses and vacant property costs.
Customer remediation including Payment Protection Insurance (‘PPI’)
The amounts in respect of customer remediation comprise the estimated cost of making redress payments with respect to the past sales of products. In calculating the customer remediation provision, management’s best estimate of the provision was calculated based on conclusions regarding the number of claims, of those, the number that will be upheld, and the estimated average settlement per case. Further information on the provision for customer remediation can be found in “Critical Accounting Policies and Areas of Significant Management Judgement” in Note 1.
Payment protection insurance is an insurance product offering payment protection on unsecured personal loans (and credit cards). The nature and profitability of the product has changed materially since 2008, in part due to customer and regulatory pressure. The product was sold by all UK banks – the mis-selling issues are predominantly related to business written before 2009.
On 1 July 2008, the UK Financial Ombudsman Service (‘FOS’) referred concerns regarding the handling of PPI complaints to the UK Financial Services Authority (‘FSA’) as an issue of wider implication. On 29 September 2009 and 9 March 2010, the FSA issued consultation papers on PPI complaints handling. The FSA published its Policy Statement on 10 August 2010, setting out evidential provisions and guidance on the fair assessment of a complaint and the calculation of redress, as well as a requirement for firms to reassess historically rejected complaints which had to be implemented by 1 December 2010.
On 8 October 2010, the British Bankers’ Association (‘BBA’), the principal trade association for the UK banking and financial services sector, filed an application for permission to seek judicial review against the FSA and the FOS. The BBA sought an order quashing the FSA Policy Statement and an order quashing the decision of the FOS to determine PPI sales in accordance with the guidance published on its website in November 2008. The Judicial Review was heard in January 2011 and on 20 April 2011 judgement was handed down by the High Court dismissing the BBA’s application.
Santander UK did not participate in the legal action undertaken by other UK banks and has been consistently making a provision and settling claims with regards to PPI complaints liabilities since they began to increase in recent years. However, a detailed review of the provision was performed in the first half of 2011 in light of current conditions, including the High Court ruling in April 2011, the BBA’s subsequent decision not to appeal it and the consequent increase in actual claims levels. As a result, the provision was revised in 2011 to reflect the new information. The overall effect of the above was a substantial increase in the provision requirement for 2011.
The provision represents management’s best estimate of the anticipated costs of related customer contact and/or redress, including administration expenses. However, there are still a number of uncertainties as to the eventual costs from any such contact and/or redress given the inherent difficulties in assessing the impact of detailed implementation of the FSA Policy Statement of 10 August 2010 for all PPI complaints, uncertainties around the ultimate emergence period for complaints, the availability of supporting evidence and the activities of claims management companies, all of which will significantly affect complaints volumes, uphold rates and redress costs.
Regulatory-related provisions
Included in other provisions at 30 June 2012 were regulatory-related provisions of £156m (31 December 2011: £176m) in respect of the Financial Services Compensation Scheme and, at the year end, the UK Bank Levy.
Bank levy
The Finance Act 2011 introduced an annual bank levy in the UK, for which legislation was enacted in July 2011. The levy is collected through the existing quarterly Corporation Tax collection mechanism. The current year impact of the UK bank levy has not been reflected in these results in accordance with International Financial Reporting Standards. Under IFRS, these charges for a year may only be recognised on the last day of the year, not accrued over the period. The total cost for 2012 is expected to be approximately £60m.
26. RETIREMENT BENEFIT ASSETS AND OBLIGATIONS
The amounts recognised in the balance sheet were as follows:
30 June 2012 £m | 31 December 2011 £m | |||||||
| Assets/(liabilities) | ||||||||
| Funded defined benefit pension scheme | 411 | 241 | ||||||
| Funded defined benefit pension scheme | — | (180 | ) | |||||
| Unfunded defined benefit pension scheme | (36 | ) | (36 | ) | ||||
| Total net assets | 375 | 25 | ||||||
Actuarial gains recognised in other comprehensive income during the period were as follows:
Six months ended 30 June 2012 £m | Six months ended 30 June 2011 £m | |||||||
| Actuarial gains on defined benefit schemes | (302 | ) | (54 | ) | ||||
| Actuarial loss on unfunded medical benefit plans | — | — | ||||||
| Total net actuarial (gains) | (302 | ) | (54 | ) | ||||
a) Defined Contribution Pension schemes
The Group operates a number of defined contribution pension schemes. The Santander Retirement Plan, an occupational defined contribution scheme is the plan into which eligible employees are enrolled automatically. The defined contribution section of the Alliance & Leicester Pension Scheme was closed to new members employed from 29 May 2010.
The assets of the schemes are held and administered separately from those of the Company. For both the Santander Retirement Plan and the Alliance & Leicester Pension Scheme, the assets are held in separate trustee-administered funds. On 1 July 2012, the Alliance & Leicester Pension Scheme (DC Section) was merged on a segregated basis with the Santander UK Group Pension Scheme.
An expense of £17m (six months ended 30 June 2011: £15m) was recognised for defined contribution plans in the period, and is included in staff costs classified within administration expenses in the Income Statement. None of this amount was recognised in respect of key management personnel for the six months ended 30 June 2012 and 30 June 2011.
b) Defined Benefit Pension schemes
The Group operates a number of defined benefit pension schemes. The principal pension schemes are the Abbey National Amalgamated Pension Fund, Santander UK Group Pension Scheme, Abbey National Associated Bodies Pension Fund, the National & Provincial Building Society Pension Fund, the Scottish Mutual Assurance Staff Pension Scheme, the Scottish Provident Institution Staff Pension Fund and the Alliance & Leicester Pension Scheme (DB Section). On 1 July 2012, the principal schemes were merged on a segregated basis into the Santander UK Group Pension scheme.
The schemes cover 20% (31 December 2011: 20%) of the Group’s employees, are all funded defined benefit schemes and are all closed to new members. Under the projected unit method, the current service cost when expressed as a percentage of pensionable salaries will gradually increase over time.
Formal actuarial valuations of the assets and liabilities of the schemes are carried out on at least a triennial basis by independent professionally qualified actuaries and valued for accounting purposes at each balance sheet date. The latest formal actuarial valuation was made at 31 March 2010 for the Abbey National Amalgamated Pension Fund, Santander UK Group Pension Scheme, Abbey National Associated Bodies Pension Fund, the National & Provincial Building Society Pension Fund and the Alliance & Leicester Pension Scheme; and at 31 December 2009 for the Scottish Mutual Assurance Staff Pension Scheme and the Scottish Provident Institution Staff Pension Fund.
The total amount charged/(credited) to the income statement, including amounts classified as redundancy costs, was as follows:
Six months ended 30 June 2012 £m | Six months ended 30 June 2011 £m | |||||||
| Current service cost | 15 | 14 | ||||||
| Expected return on pension scheme assets | (175 | ) | (196 | ) | ||||
| Interest cost | 173 | 181 | ||||||
| 13 | (1 | ) | ||||||
The net asset recognised in the balance sheet is determined as follows:
30 June 2012 £m | 31 December 2011 £m | |||||||
| Present value of defined benefit obligation | (6,863 | ) | (7,056 | ) | ||||
| Fair value of plan assets | 7,255 | 7,097 | ||||||
| Net defined benefit asset | 392 | 41 | ||||||
Movements in the present value of defined benefit obligations during the period were as follows:
30 June 2012 £m | 31 December 2011 £m | |||||||
| Balance at 1 January | (7,056 | ) | (6,716 | ) | ||||
Current service cost(1) | (20 | ) | (34 | ) | ||||
| Interest cost | (173 | ) | (362 | ) | ||||
| Employee contributions | — | (3 | ) | |||||
| Employer salary sacrifice contributions | (4 | ) | (4 | ) | ||||
| Past service cost | — | (1 | ) | |||||
| Settlement | — | 1 | ||||||
| Actuarial gain/(loss) | 280 | (141 | ) | |||||
| Actual benefit payments | 110 | 204 | ||||||
| Balance at 30 June/31 December | (6,863 | ) | (7,056 | ) | ||||
| (1) | The current service cost above includes £5m recharged to fellow subsidiaries who participate in the Santander UK defined benefit pension schemes |
Movements in the fair value of scheme assets during the period were as follows:
30 June 2012 £m | 31 December 2011 £m | |||||||
| Balance at 1 January | 7,097 | 6,556 | ||||||
| Expected return on scheme assets | 175 | 388 | ||||||
| Actuarial gain on scheme assets | 22 | 105 | ||||||
| Company contributions paid | 65 | 237 | ||||||
| Contributions paid by subsidiaries and fellow group subsidiaries | 6 | 12 | ||||||
| Employee contributions | — | 3 | ||||||
| Actual benefit payments | (110 | ) | (204 | ) | ||||
| Balance at 30 June/31 December | 7,255 | 7,097 | ||||||
The amounts recognised in the Consolidated Statement of Comprehensive Income during the period were as follows:
Six months ended 30 June 2012 £m | Six months ended 30 June 2011 £m | |||||||
| Actuarial (gain)/loss on scheme assets | (22 | ) | 9 | |||||
| Experience loss on scheme liabilities | 42 | 14 | ||||||
| Gain from changes in actuarial assumptions | (322 | ) | (77 | ) | ||||
| Actuarial gain on scheme liabilities | (280 | ) | (63 | ) | ||||
| Total net actuarial gain | (302 | ) | (54 | ) | ||||
Cumulative net actuarial losses are £478m (31 December 2011: £780m). The movement for the period is recognised in the Consolidated Statement of Comprehensive Income. The actual gain/(loss) on scheme assets was £197m (six months ended 30 June 2011: £187m).
The Group’s pension schemes did not directly hold any equity securities of the Company or any of its related parties at 30 June 2012 and 31 December 2011. The Group’s pension scheme assets do not include any property or other assets that are occupied or used by the Group. In addition, the Group does not hold insurance policies over the schemes, and has not entered into any significant transactions with the schemes.
The assets of the funded plans are held independently of the Group’s assets in separate trustee administered funds. The principal duty of the trustees is to act in the best interests of the members of the schemes. Ultimate responsibility for investment strategy rests with the trustees of the schemes who are required under the Pensions Act 2004 to prepare a statement of investment principles.
The trustees of the Group’s schemes have developed the following investment principles:
| > | To maintain a portfolio of suitable assets of appropriate quality, suitability and liquidity which will generate income and capital growth to meet, together with new contributions from members and the employers, the cost of current and future benefits which the pension scheme provides, as set out in the trust deed and rules; |
| > | To limit the risk of the assets failing to meet the liabilities, over the long-term and on a shorter-term basis as required by prevailing legislation; and |
| > | To minimise the long-term costs of the pension scheme by maximising the return on the assets whilst having regard to the objectives shown above. |
Investment strategy across the schemes remains under regular review.
The existing strategic benchmarks of the schemes were retained at the point of consolidation into the new scheme structure on 1 July 2012, and are expected to be reviewed and amended as appropriate during the second half of the year. At 30 June 2012, the actual allocations of the Abbey National Amalgamated Pension Fund, Abbey National Group Pension Scheme, Abbey National Associated Bodies Pension Fund, and the National & Provincial Building Society Pension Fund remained somewhat higher than the benchmark level in fixed interest, and lower in equities, property and alternatives. Other schemes were broadly in line with the benchmark level.
In the first half of 2012, Fixed Income assets were restructured as planned to improve the risk characteristics of the bond portfolio and to diversify the corporate bond portfolio in terms of both assets used and managers employed. The government bond portfolio was switched into long-dated index linked gilts resulting in an improvement in the alignment of the duration and inflation sensitivities of the bond portfolio with those of the pension fund liabilities. In the credit portfolio, £400m was invested across three new managers who manage their products against an absolute return benchmark, as opposed to a traditional fixed income benchmark. This allocation to bond products with an absolute return objective will provide greater diversification and, given the historically low level of bond yields currently, will also provide scope for positive returns even in a rising yield environment.
The recent equity restructure allowed the pension fund to benefit from a strong relative performance from the new managers brought on board last year. In addition, equity derivatives have been employed to construct an equity collar in the pension fund to reduce equity market volatility. The collar provides protection against some downward moves in global equity markets, paid for by limiting the upside return if markets rally strongly. The current fundamental economic backdrop suggests it is more advantageous to be holding the downside protection.
The property portfolio continued to grow organically in the period. The managers are expected to continue to focus on high quality property with strong covenants, and where appropriate long dated RPI-linked leases, combined with assets which offer the opportunity for managed outperformance.
The categories of assets in the scheme by value and as a percentage of total scheme assets, and the expected rates of return were:
| Fair value of scheme assets | Expected rate of return | Fair value of scheme assets | Expected rate of return | |||||||||||||||||||||
30 June 2012 £m | 30 June 2012 % | 30 June 2012 % | 31 December 2011 £m | 31 December 2011 % | 31 December 2011 % | |||||||||||||||||||
| UK equities | 637 | 9 | 7 | 631 | 9 | 8 | ||||||||||||||||||
| Overseas equities | 1,567 | 22 | 8 | 1,480 | 21 | 8 | ||||||||||||||||||
| Corporate bonds | 1,706 | 24 | 4 | 1,519 | 21 | 5 | ||||||||||||||||||
| Government fixed interest bonds | 514 | 7 | 3 | 730 | 10 | 4 | ||||||||||||||||||
| Government index linked bonds | 1,868 | 25 | 3 | 1,544 | 22 | 4 | ||||||||||||||||||
| Property | 209 | 3 | 6 | 137 | 2 | 6 | ||||||||||||||||||
| Cash | 382 | 5 | 2 | 663 | 9 | 4 | ||||||||||||||||||
| Other assets | 372 | 5 | 7 | 393 | 6 | 8 | ||||||||||||||||||
| 7,255 | 100 | 5 | 7,097 | 100 | 6 | |||||||||||||||||||
Other assets consist of asset-backed securities, annuities, funds (including private equity funds) and derivatives that are used to protect against exchange rate, equity market, inflation and interest rate movements. Private equity funds are classified as equities.
The expected return on plan assets is determined by considering the expected returns available on the assets underlying the current investment policy, as follows:
| > | Equities | Long-term median real rate of return experienced after considering projected moves in asset indices |
| > | Corporate bonds | Gross redemption yields at the balance sheet date, less a margin for default risk |
| > | Government bonds | Gross redemption yields at the balance sheet date |
| > | Property | Average of returns for UK equities and government bonds |
| > | Cash | Expected long-term bank rate, after considering projected inflation rate |
The following tables summarise the fair values at 30 June 2012 and 31 December 2011 of the financial asset classes accounted for at fair value, by the valuation methodology used by the investment managers of the schemes assets to determine their fair value. The tables also disclose the percentages that the recorded fair values of financial assets represent of the schemes total financial assets that are recorded at fair value.
At 30 June 2012
| Quoted prices in active markets | Internal models based on market observable data | Total | ||||||||||||||||||||||
| Category of plan assets | £m | % | £m | % | £m | % | ||||||||||||||||||
| UK equities | 622 | 9 | 15 | — | 637 | 9 | ||||||||||||||||||
| Overseas equities | 1,567 | 23 | — | — | 1,567 | 23 | ||||||||||||||||||
| Corporate bonds | 1,706 | 25 | — | — | 1,706 | 25 | ||||||||||||||||||
| Government fixed interest bonds | 514 | 8 | — | — | 514 | 8 | ||||||||||||||||||
| Government index linked bonds | 1,868 | 27 | — | — | 1,868 | 27 | ||||||||||||||||||
| Property | — | — | 209 | 3 | 209 | 3 | ||||||||||||||||||
| Other | 357 | 5 | 15 | — | 372 | 5 | ||||||||||||||||||
| Total | 6,634 | 97 | 239 | 3 | 6,873 | 100 | ||||||||||||||||||
At 31 December 2011
| Quoted prices in active markets | Internal models based on market observable data | Total | ||||||||||||||||||||||
| Category of plan assets | £m | % | £m | % | £m | % | ||||||||||||||||||
| UK equities | 614 | 10 | 17 | — | 631 | 10 | ||||||||||||||||||
| Overseas equities | 1,480 | 23 | — | — | 1,480 | 23 | ||||||||||||||||||
| Corporate bonds | 1,519 | 24 | — | — | 1,519 | 24 | ||||||||||||||||||
| Government fixed interest bonds | 730 | 11 | — | — | 730 | 11 | ||||||||||||||||||
| Government index linked bonds | 1,544 | 24 | — | — | 1,544 | 24 | ||||||||||||||||||
| Property | — | — | 137 | 2 | 137 | 2 | ||||||||||||||||||
| Other | 378 | 6 | 15 | — | 393 | 6 | ||||||||||||||||||
| Total | 6,265 | 98 | 169 | 2 | 6,434 | 100 | ||||||||||||||||||
Plan assets are stated at fair value based upon quoted prices in active markets with the exception of property and those classified under “Other”. The property was valued using market valuations prepared by an independent expert. Of the assets in the “Other” category, investments in absolute return funds and foreign exchange, equity and interest rate derivatives were valued by investment managers by reference to market observable data. Private equity funds were valued by reference to their latest published accounts whilst the insured annuities were valued by scheme actuaries based on the liabilities insured.
Actuarial assumptions
The principal actuarial assumptions used for the defined benefit schemes were as follows:
30 June 2012 % | 31 December 2011 % | |||||||
| To determine benefit obligations: | ||||||||
| - Discount rate for scheme liabilities | 5.0 | 5.0 | ||||||
| - General price inflation | 2.9 | 3.1 | ||||||
| - General salary increase | 2.9 | 3.1 | ||||||
| - Expected rate of pension increase | 2.8 | 3.0 | ||||||
| To determine net periodic benefit cost: | ||||||||
| - Discount rate | 5.0 | 5.4 | ||||||
| - Expected rate of pension increase | 3.1 | 3.4 | ||||||
| - Expected rate of return on plan assets | 5.0 | 5.7 | ||||||
| Years | Years | |||||||
| Longevity at 60 for current pensioners, on the valuation date: | ||||||||
| - Males | 28.8 | 28.8 | ||||||
| - Females | 29.4 | 29.4 | ||||||
| Longevity at 60 for future pensioners currently aged 40, on the valuation date: | ||||||||
| - Males | 31.2 | 31.1 | ||||||
| - Females | 31.0 | 31.0 | ||||||
The rate used to discount the retirement benefit obligation is determined to reflect duration of the liabilities based on the annual yield at 30 June and 31 December of the sterling 15+ year AA Corporate Bond iBoxx Index, representing the market yield of high quality corporate bonds on that date, adjusted to match the terms of the scheme liabilities. The inflation assumption is set based on the Bank of England projected inflation rates over the duration of scheme liabilities weighted by projected scheme cash flows.
In the six months ended 30 June 2012 and 2011, the mortality assumption used in the preparation of the valuation was based on the Continuous Mortality Investigation Table S1 Light with a future improvement underpin of 1.5% for males and 1.0% for females. The table above shows that a participant retiring at age 60 at 30 June 2012 is assumed to live for, on average, 28.8 years in the case of a male and 29.4 years in the case of a female. In practice, there will be variation between individual members but these assumptions are expected to be appropriate across all participants. It is assumed that younger members will live longer in retirement than those retiring now. This reflects the expectation that mortality rates will continue to fall over time as medical science and standards of living improve. To illustrate the degree of improvement assumed the table also shows the life expectancy for members aged 40 now, when they retire in 20 years’ time at age 60.
The Group determined its expense measurements above based upon long-term assumptions taking into account target asset allocations of assets set at the beginning of the period, offset by actual returns during the period. Period-end obligation measurements are determined by reference to market conditions at the balance sheet date. Assumptions are set in consultation with third party advisors and in-house expertise.
Actuarial assumption sensitivities
The discount rate is sensitive to changes in market conditions arising during the reporting period. The mortality rates used are sensitive to experience from the plan member profile. The following table shows the potential effect of changes in these and the other key assumptions on the principal pension schemes of the Group:
| Increase/(decrease) | |||||||||
30 June 2012 £m | 31 December 2011 £m | ||||||||
| Discount rate | Change in pension obligation at period-end from a 25 bps increase | (352 | ) | (365 | ) | ||||
| General price inflation | Change in pension obligation at period-end from a 25 bps increase | 329 | 332 | ||||||
| Mortality | Change in pension obligation at period-end from each additional year of longevity assumed | 200 | 242 | ||||||
The benefits expected to be paid in each of the next five years, and in the aggregate for the five years thereafter are:
| Year ending 31 December: | £m | |||
| 2012 | 216 | |||
| 2013 | 230 | |||
| 2014 | 245 | |||
| 2015 | 261 | |||
| 2016 | 279 | |||
| Five years ended 2021 | 1,705 | |||
Funding
In 2010, in compliance with the Pensions Act 2004, the Group and the trustees agreed a scheme-specific funding target, statement of funding principles, and a schedule of contributions for the principal pension schemes. This agreement forms the basis of the Group’s commitment that the schemes have sufficient assets to make payments to members in respect of their accrued benefits as and when they fall due. In accordance with the terms of the agreement, the Group contributed £48m to the schemes in 2012 (2011: £209m). The agreed schedule of the Group’s remaining contributions to the schemes is as set out below:
| Year ending 31 December: | £m | |||
| 2012 | 102 | |||
| 2013 | 64 | |||
| 2014 | 64 | |||
| 2015 | 64 | |||
| 2016 | 70 | |||
| 2017 | 70 | |||
| 2018 | 70 | |||
| 2019 | 70 | |||
As part of the previous arrangements relating to the funding of the Group’s defined benefit pension schemes, £nil (31 December 2011: £14m) of securities and other assets have been pledged to cover the Group’s obligations.
27. CONTINGENT LIABILITIES AND COMMITMENTS
The estimated maximum exposure in respect of contingent liabilities and commitments granted is:
30 June 2012 £m | 31 December 2011 £m | |||||||
| Guarantees given to third parties | 934 | 553 | ||||||
| Formal standby facilities, credit lines and other commitments with original term to maturity of: | ||||||||
| - One year or less | 3,770 | 3,841 | ||||||
| - More than one year | 30,775 | 29,153 | ||||||
| Other contingent liabilities | 8 | 8 | ||||||
| 35,487 | 33,555 | |||||||
Guarantees given to subsidiaries
The Company has fully and unconditionally guaranteed the obligations of each of Abbey National Treasury Services plc, Abbey Stockbrokers Limited and Cater Allen Limited, all of which are wholly owned subsidiaries of the Company, that have been or will be incurred before 30 June 2015. In addition, the Company has fully and unconditionally guaranteed the deposit obligations of Abbey National International Limited and Alliance & Leicester International Limited, both of which are wholly owned subsidiaries of the Company, that have been or will be incurred before 30 June 2015.
Financial Services Compensation Scheme (‘FSCS’)
The FSCS is the UK's independent statutory compensation fund for customers of authorised financial services firms and pays compensation if a firm is unable to pay claims against it. The FSCS is funded by levies on the industry (and recoveries and borrowings where appropriate). The levies raised comprise both management expenses levies and, where necessary, compensation levies on authorised firms. Following the default of a number of deposit takers since 2008, the FSCS borrowed funds from HM Treasury to meet the compensation costs for customers of those firms. The borrowings with HM Treasury, which totalled approximately £20bn, are on an interest-only basis until 31 March 2012 and, with effect from 1 April 2012, the interest on the borrowings will increase to 12 month LIBOR plus 100 basis points. Each deposit-taking institution contributes towards the management expenses levies in proportion to their share of total protected deposits on 31 December of the year preceding the scheme year, which runs from 1 April to 31 March. In determining an appropriate accrual in respect of the management expenses levy, certain assumptions have been made including the proportion of total protected deposits held by the Group.
Whilst it is expected that the substantial majority of the principal will be repaid from funds the FSCS receives from asset sales, surplus cash flow or other recoveries in relation to the assets of the firms that defaulted, to the extent that there remains a shortfall, the FSCS expects to recover any shortfall of the principal by levying the deposit-taking sector in three approximately equal instalments beginning in scheme year 2013/14. The FSCS and HM Treasury have agreed that the terms of the repayment of the borrowings will be reviewed every three years in light of market conditions and of the actual repayment from the estates of failed banks. The ultimate amount of any compensation levies to be charged in future years also depends on a number of factors including the level of protected deposits and the population of deposit-taking participants and will be determined at a later date. As such, the Group’s share of such compensation levies could be significant.
In accordance with the requirements of International Financial Reporting Standards, the Group accounts for costs in respect of the FSCS on 31 December each year. As a result, the Group did not charge any amount to the income statement in respect of the costs of the FSCS during the six month periods ended 30 June 2012 and 2011.
Overseas tax claim
A claim was filed against Abbey National Treasury Services plc by tax authorities abroad in relation to the refund of certain tax credits and other associated amounts. A favourable judgement at first instance was handed down in September 2006, although the judgement was appealed against by the tax authorities in January 2007 and the court found in favour of the latter in June 2010. Abbey National Treasury Services plc appealed against this decision at a higher court and in December 2011 the tax authorities confirmed their intention to file the related pleadings. Although the matter remained in dispute, in January 2012, following a demand from the tax authorities, Abbey National Treasury Services plc paid £67m, for which it already held a provision. The higher court hearing took place in April 2012 and the judgement found in favour of the tax authorities upholding their appeal. There is no recourse for further appeal.
Regulatory
The Group engages in discussion, and co-operates, with the UK Financial Services Authority in its supervision of the Group, including reviews exercised under statutory powers, regarding its interaction with past and present customers and policyholders, both as part of the UK Financial Services Authority's general thematic work and in relation to specific products and services, including payment protection insurance. Some of these reviews are currently expected to complete in the second half of 2012 and it is not yet possible to reliably determine their outcome. Though these reviews have not triggered a requirement to recognise a provision in relation to any costs to be incurred, this will be reviewed in the second half of the year.
Obligations under stock borrowing and lending agreements
Obligations under stock borrowing and lending agreements represent contractual commitments to return stock borrowed. These obligations are offset by a contractual right to receive stock under other contractual agreements. See Note 30.
Operating lease commitments
30 June 2012 £m | 31 December 2011 £m | |||||||
| Rental commitments under non-cancellable operating leases expiring: | ||||||||
| - No later than 1 year | 85 | 83 | ||||||
| - Later than 1 year but no later than 5 years | 292 | 255 | ||||||
| - Later than 5 years | 268 | 234 | ||||||
| 645 | 572 | |||||||
Under the terms of these leases, the Group has the opportunity to extend its occupation of properties by a minimum of three years subject to 12 months’ notice and lease renewal being available from external landlords during the term of the lease. At expiry, the Group has the option to reacquire the freehold of certain properties.
Group rental expense comprises:
30 June 2012 £m | 31 December 2011 £m | |||||||
| In respect of minimum rentals | 41 | 77 | ||||||
| Less: sub-lease rentals | — | — | ||||||
| 41 | 77 | |||||||
Included in the above Group rental expense was £3m (six months ended 30 June 2011: £3m) relating to contingent rent expense.
Appropriate provisions are maintained to cover the above matters.
28. SHARE CAPITAL AND OTHER EQUITY INSTRUMENTS
30 June 2012 £m | 31 December 2011 £m | |||||||
| Ordinary share capital | 3,105 | 3,105 | ||||||
| £300m fixed/floating rate non-cumulative callable preference shares | 300 | 300 | ||||||
| £300m Step-up Callable Perpetual Reserve Capital Instruments | 297 | 297 | ||||||
| £300m Step Up Callable Perpetual Preferred Securities | 297 | 297 | ||||||
| 3,999 | 3,999 | |||||||
a) Share capital
Movements in share capital during the period were as follows.
| Issued and fully paid share capital | Ordinary shares of £0.10 each £m | £300m Preference shares of £1 each £m | £325m Preference shares of £1 each £m | Preference shares of US$0.01 each £m | Preference shares of euro 0.01 each £m | Total £m | ||||||||||||||||||
| At 1 January 2011 | 3,105 | 300 | 325 | — | — | 3,730 | ||||||||||||||||||
| Shares issued | — | — | — | — | — | — | ||||||||||||||||||
| At 31 December 2011 | 3,105 | 300 | 325 | — | — | 3,730 | ||||||||||||||||||
| Shares issued | — | — | — | — | — | — | ||||||||||||||||||
| At 30 June 2012 | 3,105 | 300 | 325 | — | — | 3,730 | ||||||||||||||||||
The Company’s £325m sterling preference shares are classified as Subordinated Liabilities as described in Note 24 of the Group’s 2011 Annual Report.
| Share premium | 2012 £m | 2011 £m | ||||||
| At 1 January | 5,620 | 5,620 | ||||||
| Shares issued | — | — | ||||||
| At 30 June | 5,620 | 5,620 |
The Company has one class of ordinary shares which carries no right to fixed income.
£300m Fixed/Floating Rate Non-Cumulative Callable Preference Shares
On 28 April 2010, the Company issued £300m fixed/floating rate non-cumulative callable preference shares (pursuant to a scheme of arrangement under Part 26 of the UK Companies Act 2006) on substantially similar terms to, and in exchange for, the £300m fixed/floating rate non-cumulative callable preference shares previously issued by Alliance & Leicester plc. The preference shares entitle the holders to a fixed non-cumulative dividend, at the discretion of the Company, of 6.22% per annum payable annually from 24 May 2010 until 24 May 2019 and quarterly thereafter at a rate of 1.13% per annum above three month sterling LIBOR. The preference shares are redeemable only at the option of the Company on 24 May 2019 or on each quarterly dividend payment date thereafter. No such redemption may be made without the consent of the UK Financial Services Authority.
b) Other equity instruments
£300m Step-up Callable Perpetual Reserve Capital Instruments
The £300m Step-up Callable Perpetual Reserve Capital Instruments were issued in 2001 by the Company. Reserve Capital Instruments are redeemable by the Company on 14 February 2026 or on any coupon payment date thereafter, subject to the prior approval of the UK Financial Services Authority and provided that the auditors have reported to the trustee within the previous six months that the solvency condition is met. The Reserve Capital Instruments bear interest at a rate of 7.037% per annum, payable annually in arrears, from 14 February 2001 to 14 February 2026. Thereafter, the reserve capital instruments will bear interest at a rate, reset every five years, of 3.75% per annum above the gross redemption yield on the UK five-year benchmark gilt rate. Interest payments may be deferred by the Company.
The Reserve Capital Instruments are not redeemable at the option of the holders and the holders do not have any rights against other Group companies. Upon the occurrence of certain tax or regulatory events, the Reserve Capital Instruments may be exchanged, their terms varied, or redeemed. Where interest payments have been deferred, the Company may not declare or pay dividends on or redeem or repurchase any junior securities until it next makes a scheduled payment on the Reserve Capital Instruments and Tier One Preferred Income Capital Securities.
The Reserve Capital Instruments are unsecured securities of the Company and are subordinated to the claims of unsubordinated creditors and subordinated creditors holding loan capital of the Company. Upon the winding up of the Company, holders of Reserve Capital Instruments will rank pari passu with the holders of the most senior class or classes of preference shares (if any) of the Company then in issue and in priority to all other Company shareholders.
£300m Step-up Callable Perpetual Preferred Securities
The £300m Step Up Callable Perpetual Preferred Securities were originally issued by Alliance & Leicester plc and were transferred to the Company with effect from 28 May 2010. The Perpetual Preferred securities are perpetual securities and pay a coupon on 22 March each year. At each payment date, the Company can decide whether to declare or defer the coupon indefinitely. If a coupon is deferred then the Company may not pay a dividend on any share until it next makes a coupon payment (including payment of any deferred coupons). The Company can be obliged to make payment in the event of winding up. The coupon is 5.827% per annum until 22 March 2016. Thereafter the coupon steps up to a rate, reset every five years, of 2.13% per annum above the gross redemption yield on a UK Government Treasury Security. The Perpetual Preferred securities are redeemable at the option of the Company on 22 March 2016 or on each payment date thereafter. No such redemption may be made without the consent of the UK Financial Services Authority.
29. CASH FLOW STATEMENT
a) Reconciliation of profit after tax to net cash inflow from operating activities:
Six months ended 30 June 2012 £m | Six months ended 30 June 2011 £m | |||||||
| Profit for the period | 550 | 413 | ||||||
| Non-cash items included in net profit: | ||||||||
| Depreciation and amortisation | 120 | 138 | ||||||
| Increase in prepayments and accrued income | (189 | ) | (97 | ) | ||||
| (Decrease)/increase in accruals and deferred income | (464 | ) | 365 | |||||
| Provisions for liabilities and charges | 7 | 736 | ||||||
| Impairment losses | 397 | 278 | ||||||
| Corporation tax charge | 175 | 136 | ||||||
| Other non-cash items | 120 | 106 | ||||||
| Net cash flow from trading activities | 716 | 2,075 | ||||||
| Changes in operating assets and liabilities: | ||||||||
| Net increase in cash and balances held at central banks | (6 | ) | (7 | ) | ||||
| Net decrease/(increase) in trading assets | 1,200 | (2,638 | ) | |||||
| Net decrease in derivative assets | 231 | 847 | ||||||
| Net decrease in financial assets designated at fair value | 783 | 1,301 | ||||||
| Net decrease in loans and advances to banks & customers | 2,979 | 486 | ||||||
| Net decrease in other assets | 37 | 577 | ||||||
| Net increase in deposits by banks and customers | 5,359 | 2,422 | ||||||
| Net decrease in derivative liabilities | (541 | ) | (712 | ) | ||||
| Net increase/(decrease) in trading liabilities | 2,495 | (2,410 | ) | |||||
| Net (decrease)/increase in financial liabilities designated at fair value | (226 | ) | 219 | |||||
| Net increase/(decrease) in debt securities in issue | 977 | (1,772 | ) | |||||
| Net decrease in other liabilities | (613 | ) | (268 | ) | ||||
| Effects of exchange rate differences | (1,220 | ) | 21 | |||||
| Net cash flow from operating activities before tax | 12,171 | 141 | ||||||
| Income tax paid | (149 | ) | (78 | ) | ||||
| Net cash flow from operating activities | 12,022 | 63 | ||||||
b) Analysis of the balances of cash and cash equivalents in the balance sheet
30 June 2012 £m | 31 December 2011 £m | |||||||
| Cash and balances with central banks | 30,067 | 25,980 | ||||||
| Less: regulatory minimum cash balances | (201 | ) | (195 | ) | ||||
| 29,866 | 25,785 | |||||||
| Debt securities | 2,681 | 4,093 | ||||||
| Net trading other cash equivalents | 22,863 | 9,500 | ||||||
| Net non trading other cash equivalents | 1,697 | 3,568 | ||||||
| Cash and cash equivalents | 57,107 | 42,946 | ||||||
c) Sale of subsidiaries
In 2011, a subsidiary of the Company completed the disposal of certain leasing companies for cash consideration of approximately £3m. The net assets disposed of consisted of net investment in finance leases of £93m and provisions for liabilities and charges of £18m. In addition, debt of £72m was repaid.
30. ASSETS CHARGED AS SECURITY FOR LIABILITIES AND COLLATERAL ACCEPTED AS SECURITY FOR ASSETS
The following transactions are conducted under terms that are usual and customary to collateralised transactions, including, where relevant, standard securities lending and repurchase agreements.
a) Financial assets pledged to secure liabilities
The financial assets below are analysed between those assets accounted for on the balance sheet and off-balance sheet in accordance with IFRS.
30 June 2012 £m | 31 December 2011 £m | |||||||
| On balance sheet: | ||||||||
| Treasury bills and other eligible securities | 5,949 | 6,141 | ||||||
| Cash | 2,736 | 3,004 | ||||||
| Loans and advances to customers - securitisations and covered bonds (See Note 12) | 88,641 | 100,307 | ||||||
| Loans and advances to customers | 1,792 | — | ||||||
| Debt securities | 3,120 | 129 | ||||||
| Equity securities | 477 | 321 | ||||||
| 102,715 | 109,902 | |||||||
| Off balance sheet: | ||||||||
| Treasury bills and other eligible securities | 8,763 | 16,245 | ||||||
| Debt securities | 10,557 | 7,779 | ||||||
| Equity securities | — | 195 | ||||||
| 19,320 | 24,219 | |||||||
The Group provides assets as collateral in the following areas of the business.
Sale and repurchase agreements
Subsidiaries of the Company enter into sale and repurchase agreements and similar transactions of equity and debt securities, which are accounted for as secured borrowings. Upon entering into such transactions, the subsidiaries provide collateral equal to 100%-131% of the borrowed amount. The carrying amount of assets that were so provided at 30 June 2012 was £30,505m (31 December 2011: £26,232m), of which £9,975m (31 December 2011: £6,160m) were classified as “loans and advances to customers – securitisations and covered bonds” in the table above.
Securitisations and covered bonds
As described in Note 12, the Company and certain of its subsidiaries enter into securitisation transactions whereby portfolios of residential mortgage loans and other loans are purchased by or assigned to special purpose securitisation companies, and have been funded through the issue of mortgage backed securities. Holders of the securities are only entitled to obtain payments of principal and interest to the extent that the resources of the securitisation companies are sufficient to support such payments and the holders of the securities have agreed in writing not to seek recourse in any other form. At 30 June 2012, £49,506m (31 December 2011: £75,226m) of loans were so assigned by the Group.
A subsidiary of the Company has also established a covered bond programme, whereby securities are issued to investors and are guaranteed by a pool of ring-fenced residential mortgages. At 30 June 2012, the pool of ring-fenced residential mortgages for the covered bond programme was £39,135m (31 December 2011: £25,081m).
At 30 June 2012, total notes issued externally from secured programmes (securitisations and covered bonds) increased to £50,201m (31 December 2011: £41,007m), reflecting gross issuance of £9.6bn in the first half of 2012. At 30 June 2012, a total of £13,071m (31 December 2011: £46,111m) of notes issued under securitisation and covered bond programmes had also been retained internally, a proportion of which had been used as collateral for raising funds via third party bilateral secured funding transactions, which totalled £10.5bn at 30 June 2012, or for creating collateral which could in the future be used for liquidity purposes.
Stock borrowing and lending agreements
Asset balances under stock borrowing and lending agreements represent stock lent by the Group. These balances amounted to £8,337m at 30 June 2012 (31 December 2011: £14,380m) and are offset by contractual commitments to return stock borrowed or cash received.
Derivatives business
In addition to the arrangements described above, collateral is also provided in the normal course of derivative business to counterparties. At 30 June 2012 £2,736m (31 December 2011: £2,642m) of such collateral in the form of cash had been provided by the Group and is included in the table above.
b) Collateral held as security for assets
30 June 2012 £m | 31 December 2011 £m | |||||||
| On balance sheet: | ||||||||
| Trading liabilities | 2,633 | 2,401 | ||||||
| 2,633 | 2,401 | |||||||
| Off balance sheet: | ||||||||
| Trading liabilities | 46,791 | 23,357 | ||||||
| Deposits by banks | 423 | 2,054 | ||||||
| 47,214 | 25,411 | |||||||
Purchase and resale agreements
Subsidiaries of the Company also enter into purchase and resale agreements and similar transactions of equity and debt securities, which are accounted for as collateralised loans. Upon entering into such transactions, the subsidiaries receive collateral equal to 100%-105% of the loan amount. The level of collateral held is monitored daily and if required, further calls are made to ensure the market values of collateral remains equal to the loan balance. The subsidiaries are permitted to sell or repledge the collateral held in the absence of default. At 30 June 2012 the fair value of such collateral received was £38,155m (31 December 2011: £11,776m). Of the collateral received, almost all was sold or repledged. The subsidiaries have an obligation to return collateral that they have sold or pledged.
Structured transactions
As part of structured transactions entered into by subsidiaries of the Company, assets are received as collateral. At 30 June 2012, the fair value of such collateral was £325m (31 December 2011: £526m). Of the collateral received, £325m (31 December 2011: £526m) was sold or repledged, which the subsidiaries have an obligation to return.
Stock borrowing and lending agreements
Obligations under stock borrowing and lending agreements represent contractual commitments to return stock borrowed. These obligations amounted to £8,735m at 30 June 2012 (31 December 2011: £13,109m) and are offset by contractual rights to receive stock lent by the Group.
Derivatives business
In addition to the arrangements described above, collateral is also received in the normal course of derivative business from counterparties. At 30 June 2012, £2,633m (31 December 2011: £2,401m) of such collateral in the form of cash had been received by the Group and is included in the table above.
Lending activities
In addition to the above collateral held as security for assets, the Group may obtain a charge over a customer’s property in connection with its lending activities. See the “Credit Risk” section of the Risk Management Report for each business segment.
31. RELATED PARTY DISCLOSURES
The financial position and performance of the Group have not been materially affected in the first six months of the current year by any related party transactions, or changes to related party transactions, except as disclosed in Note 23.
Information on balances due from/(to) other Santander group companies is set out in the section “Balances with other Santander companies” in the Balance Sheet Business Review on pages 33 to 36.
32. ACQUISITIONS AND PLANNED ACQUISITIONS
Planned acquisition of Royal Bank of Scotland Group (‘RBS’) branches (‘Project Rainbow’)
On 4 August 2010, the Company announced its agreement to acquire (subject to certain conditions) certain bank branches and business banking centres and associated assets and liabilities from RBS for a premium of £350m to net assets at closing. The consideration will be paid in cash and is subject to certain closing adjustments. The planned acquisition will further accelerate the delivery of the Company’s strategic goals. A seamless transfer of the retail and corporate customers involved is a core deliverable of the transaction for both the Company and RBS. The Company has progressed extensive work on its systems and products in preparation for the transfer and integration and is satisfied with the progress it has made. This is, however, a large and exceptionally complex migration. This complexity and concern to ensure that the transfer happens smoothly for customers means that some aspects of the integration programme are taking longer than originally anticipated. Whilst final dates are not yet confirmed, the Company continues to work constructively with RBS on the detail of implementation, which will require FSA approval prior to formal implementation and completion.
33. FINANCIAL INSTRUMENTS
a) Measurement basis of financial assets and liabilities
Financial assets and financial liabilities are measured on an ongoing basis either at fair value or at amortised cost. Note 1 of the Group’s 2011 Annual Report describes how the classes of financial instruments are measured, and how income and expenses, including fair value gains and losses, are recognised. The following tables analyse the Group’s financial instruments into those measured at fair value and those measured at amortised cost in the balance sheet:
| Held at fair value | Held at amortised cost | |||||||||||||||||||||||||||||||
| 30 June 2012 | Trading | Derivatives designated as hedges | Designated at fair value through P&L | Available- for-sale | Financial assets at amortised cost | Financial liabilities at amortised cost | Non-financial assets/ liabilities | Total | ||||||||||||||||||||||||
| £m | £m | £m | £m | £m | £m | £m | £m | |||||||||||||||||||||||||
| Assets | ||||||||||||||||||||||||||||||||
| Cash & balances at central banks | — | — | — | — | 30,067 | — | — | 30,067 | ||||||||||||||||||||||||
| Trading assets | 32,833 | — | — | — | — | — | — | 32,833 | ||||||||||||||||||||||||
| Derivative financial instruments | 26,679 | 3,870 | — | — | — | — | — | 30,549 | ||||||||||||||||||||||||
| Financial assets designated at FVTPL | — | — | 4,221 | — | — | — | — | 4,221 | ||||||||||||||||||||||||
| Loans and advances to banks | — | — | — | — | 2,496 | — | — | 2,496 | ||||||||||||||||||||||||
| Loans and advances to customers | — | — | — | — | 198,323 | — | — | 198,323 | ||||||||||||||||||||||||
| Available-for-sale securities | — | — | — | 4,851 | — | — | — | 4,851 | ||||||||||||||||||||||||
| Loans and receivables securities | — | — | — | — | 1,399 | — | — | 1,399 | ||||||||||||||||||||||||
| Macro hedge of interest rate risk | — | — | — | — | 1,215 | — | — | 1,215 | ||||||||||||||||||||||||
| Intangible assets | — | — | — | — | — | — | 2,225 | 2,225 | ||||||||||||||||||||||||
| Property, plant and equipment | — | — | — | — | — | — | 1,544 | 1,544 | ||||||||||||||||||||||||
| Deferred tax assets | — | — | — | — | — | — | 151 | 151 | ||||||||||||||||||||||||
| Retirement benefit assets | — | — | — | — | — | — | 411 | 411 | ||||||||||||||||||||||||
| Other assets | — | — | — | — | — | — | 1,249 | 1,249 | ||||||||||||||||||||||||
| 59,512 | 3,870 | 4,221 | 4,851 | 233,500 | — | 5,580 | 311,534 | |||||||||||||||||||||||||
| Liabilities | ||||||||||||||||||||||||||||||||
| Deposits by banks | — | — | — | — | — | 15,249 | — | 15,249 | ||||||||||||||||||||||||
| Deposits by customers | — | — | — | — | — | 149,340 | — | 149,340 | ||||||||||||||||||||||||
| Derivative financial liabilities | 27,283 | 1,356 | — | — | — | — | — | 28,639 | ||||||||||||||||||||||||
| Trading liabilities | 28,235 | — | — | — | — | — | — | 28,235 | ||||||||||||||||||||||||
| Financial liabilities designated at FVTPL | — | — | 4,977 | — | — | — | — | 4,977 | ||||||||||||||||||||||||
| Debt securities in issue | — | — | — | — | — | 62,176 | — | 62,176 | ||||||||||||||||||||||||
| Subordinated liabilities | — | — | — | — | — | 6,558 | — | 6,558 | ||||||||||||||||||||||||
| Other liabilities | — | — | — | — | — | 2,037 | — | 2,037 | ||||||||||||||||||||||||
| Provisions | — | — | — | — | — | — | 808 | 808 | ||||||||||||||||||||||||
| Current tax liabilities | — | — | — | — | — | — | 118 | 118 | ||||||||||||||||||||||||
| Retirement benefit obligations | — | — | — | — | — | — | 36 | 36 | ||||||||||||||||||||||||
| 55,518 | 1,356 | 4,977 | — | — | 235,360 | 962 | 298,173 | |||||||||||||||||||||||||
| Held at fair value | Held at amortised cost | |||||||||||||||||||||||||||||||
| 31 December 2011 | Trading | Derivatives designated as hedges | Designated at fair value through P&L | Available- for-sale | Financial assets at amortised cost | Financial liabilities at amortised cost | Non-financial assets/ liabilities | Total | ||||||||||||||||||||||||
| £m | £m | £m | £m | £m | £m | £m | £m | |||||||||||||||||||||||||
| Assets | ||||||||||||||||||||||||||||||||
| Cash & balances at central banks | — | — | — | — | 25,980 | — | — | 25,980 | ||||||||||||||||||||||||
| Trading assets | 21,891 | — | — | — | — | — | — | 21,891 | ||||||||||||||||||||||||
| Derivative financial instruments | 27,394 | 3,386 | — | — | — | — | — | 30,780 | ||||||||||||||||||||||||
| Financial assets designated at FVTPL | — | — | 5,005 | — | — | — | — | 5,005 | ||||||||||||||||||||||||
| Loans and advances to banks | — | — | — | — | 4,487 | — | — | 4,487 | ||||||||||||||||||||||||
| Loans and advances to customers | — | — | — | — | 201,069 | — | — | 201,069 | ||||||||||||||||||||||||
| Available-for-sale securities | — | — | — | 46 | — | — | — | 46 | ||||||||||||||||||||||||
| Loans and receivables securities | — | — | — | — | 1,771 | — | — | 1,771 | ||||||||||||||||||||||||
| Macro hedge of interest rate risk | — | — | — | — | 1,221 | — | — | 1,221 | ||||||||||||||||||||||||
| Intangible assets | — | — | — | — | — | — | 2,142 | 2,142 | ||||||||||||||||||||||||
| Property, plant and equipment | — | — | — | — | — | — | 1,596 | 1,596 | ||||||||||||||||||||||||
| Current tax assets | — | — | — | — | — | — | 257 | 257 | ||||||||||||||||||||||||
| Deferred tax assets | — | — | — | — | — | — | 241 | 241 | ||||||||||||||||||||||||
| Other assets | — | — | — | — | — | — | 1,088 | 1,088 | ||||||||||||||||||||||||
| 49,285 | 3,386 | 5,005 | 46 | 234,528 | — | 5,324 | 297,574 | |||||||||||||||||||||||||
| Liabilities | ||||||||||||||||||||||||||||||||
| Deposits by banks | — | — | — | — | — | 11,626 | — | 11,626 | ||||||||||||||||||||||||
| Deposits by customers | — | — | — | — | — | 148,342 | — | 148,342 | ||||||||||||||||||||||||
| Derivative financial liabilities | 27,787 | 1,393 | — | — | — | — | — | 29,180 | ||||||||||||||||||||||||
| Trading liabilities | 25,745 | — | — | — | — | — | — | 25,745 | ||||||||||||||||||||||||
| Financial liabilities designated at FVTPL | — | — | 6,837 | — | — | — | — | 6,837 | ||||||||||||||||||||||||
| Debt securities in issue | — | — | — | — | — | 52,651 | — | 52,651 | ||||||||||||||||||||||||
| Subordinated liabilities | — | — | — | — | — | 6,499 | — | 6,499 | ||||||||||||||||||||||||
| Other liabilities | — | — | — | — | — | 2,571 | — | 2,571 | ||||||||||||||||||||||||
| Provisions | — | — | — | — | — | — | 970 | 970 | ||||||||||||||||||||||||
| Current tax liabilities | — | — | — | — | — | — | 271 | 271 | ||||||||||||||||||||||||
| Retirement benefit obligations | — | — | — | — | — | — | 216 | 216 | ||||||||||||||||||||||||
| 53,532 | 1,393 | 6,837 | — | — | 221,689 | 1,457 | 284,908 | |||||||||||||||||||||||||
b) Fair values of financial instruments carried at amortised cost
The following tables analyse the fair value of financial instruments not measured at fair value in the balance sheet:
| 30 June 2012 | Carrying value £m | Fair value £m | Surplus/(deficit) £m | |||||||||
| Assets | ||||||||||||
| Cash and balances at central banks | 30,067 | 30,067 | — | |||||||||
| Loans and advances to banks | 2,496 | 2,496 | — | |||||||||
| Loans and advances to customers | 198,323 | 203,807 | 5,484 | |||||||||
| Loans and receivables securities | 1,399 | 1,207 | (192 | ) | ||||||||
| Liabilities | ||||||||||||
| Deposits by banks | 15,249 | 15,319 | (70 | ) | ||||||||
| Deposits by customers | 149,340 | 150,850 | (1,510 | ) | ||||||||
| Debt securities in issue | 62,176 | 62,290 | (114 | ) | ||||||||
| Subordinated liabilities | 6,558 | 7,347 | (789 | ) | ||||||||
| 31 December 2011 | Carrying value £m | Fair value £m | Surplus/(deficit) £m | |||||||||
| Assets | ||||||||||||
| Cash and balances at central banks | 25,980 | 25,980 | — | |||||||||
| Loans and advances to banks | 4,487 | 4,487 | — | |||||||||
| Loans and advances to customers | 201,069 | 206,725 | 5,656 | |||||||||
| Loans and receivables securities | 1,771 | 1,553 | (218 | ) | ||||||||
| Liabilities | ||||||||||||
| Deposits by banks | 11,626 | 11,644 | (18 | ) | ||||||||
| Deposits by customers | 148,342 | 149,424 | (1,082 | ) | ||||||||
| Debt securities in issue | 52,651 | 52,420 | 231 | |||||||||
| Subordinated liabilities | 6,499 | 7,305 | (806 | ) | ||||||||
The surplus/(deficit) in the table above represents the surplus/(deficit) of fair value compared to the carrying amount of those financial instruments for which fair values have been estimated. The carrying value above of any financial assets and liabilities that are designated as hedged items in a portfolio (or macro) fair value hedge relationship excludes gains and losses attributable to the hedged risk, as this is presented as a single separate line item on the balance sheet.
Valuation methodology
The fair value of financial instruments is the estimated amount at which the instrument could be exchanged in a current transaction between willing parties, other than in a forced or liquidation sale. If a quoted market price is available for an instrument, the fair value is calculated based on the market price. Where quoted market prices are not available, fair value is determined using pricing models which use a mathematical methodology based on accepted financial theories, depending on the product type and its components. Further information on fair value measurement can be found in Note 1 of the Group’s 2011 Annual Report and the valuation techniques section below.
Fair value management
The fair value exposures, as tabled above, are managed by using a combination of hedging derivatives and offsetting on balance sheet positions. The approach to specific categories of financial instruments is described below.
(i) Assets:
Cash and balances at central banks
The carrying amount of cash and balances at central banks is deemed a reasonable approximation of the fair value.
Loans and advances to banks
The fair value of loans and advances to banks has been estimated using the same valuation technique for financial instruments accounted for at fair value as described in the valuation techniques section below.
Loans and advances to customers
Loans and advances to personal customers are made both at variable and at fixed rates. As there is no active secondary market in the UK for such loans and advances, there is no reliable market value available for such a significant portfolio.
a) Variable rate
The Directors believe that the carrying value of the variable rate loans may be assumed to be their fair value.
b) Fixed rate
Certain of the loans secured on residential properties are at a fixed rate for a limited period, typically two to five years from their commencement. At the end of this period these loans revert to the relevant variable rate. The excess of fair value over carrying value of each of these loans has been estimated by reference to the market rates available at the balance sheet date for similar loans of maturity equal to the remaining fixed period.
Loan and receivable securities
These debt securities are valued with the assistance of valuations prepared by an independent, specialist valuation firm.
(ii) Liabilities:
Deposits by banks
The fair value of deposits by banks has been estimated using the same valuation technique for financial instruments accounted for at fair value as described in the Valuation techniques section below.
Deposits by customers
The majority of deposit liabilities are payable on demand and therefore can be deemed short-term in nature with the fair value equal to the carrying value. However, given the long-term and continuing nature of the relationships with the Group’s customers, the Directors believe there is significant value to the Group in this source of funds. Certain of the deposit liabilities are at a fixed rate until maturity. The deficit of fair value over carrying value of these liabilities has been estimated by reference to the market rates available at the balance sheet date for similar deposit liabilities of similar maturities.
The fair value of such deposits liabilities has been estimated using the same valuation technique for financial instruments accounted for at fair value as described in the Valuation techniques section below.
Debt securities in issue and subordinated liabilities
Where reliable prices are available, the fair value of debt securities in issue and subordinated liabilities has been calculated using quoted market prices. Other market values have been determined using the same valuation technique for financial instruments accounted for at fair value as described in the Valuation techniques section below.
c) Fair value valuation bases of financial instruments carried at fair value
The following tables summarise the fair values at 30 June 2012 and 31 December 2011 of the financial asset and liability classes accounted for at fair value, analysed by the valuation methodology used by the Group to determine their fair value. The tables also disclose the percentages that the recorded fair values of financial assets and liabilities represent of the total assets and liabilities, respectively, that are recorded at fair value in the balance sheet:
| 30 June 2012 | Internal models based on | ||||||||||||||||||||||||||||||||||||
| Balance sheet category | Quoted prices in active markets (Level 1) | Market observable data (Level 2) | Significant unobservable data (Level 3) | Total | Valuation technique | ||||||||||||||||||||||||||||||||
| £m | % | £m | % | £m | % | £m | % | ||||||||||||||||||||||||||||||
| Assets | |||||||||||||||||||||||||||||||||||||
| Trading assets | Loans and advances to banks | — | — | 8,027 | 11 | — | — | 8,027 | 11 | A | |||||||||||||||||||||||||||
| Loans and advances to customers | — | — | 18,380 | 25 | — | — | 18,380 | 25 | A | ||||||||||||||||||||||||||||
| Debt securities | 5,949 | 8 | — | — | — | — | 5,949 | 8 | — | ||||||||||||||||||||||||||||
| Equity securities | 477 | 1 | — | — | — | — | 477 | 1 | — | ||||||||||||||||||||||||||||
| Derivative assets | Exchange rate contracts | — | — | 3,238 | 4 | 61 | — | 3,299 | 4 | A | |||||||||||||||||||||||||||
| Interest rate contracts | 59 | — | 25,632 | 35 | — | — | 25,691 | 35 | A & C | ||||||||||||||||||||||||||||
| Equity and credit contracts | 140 | — | 1,224 | 2 | 175 | — | 1,539 | 2 | B & D | ||||||||||||||||||||||||||||
| Commodity contracts | — | — | 20 | — | — | — | 20 | — | A | ||||||||||||||||||||||||||||
| Financial assets at FVTPL | Loans and advances to customers | — | — | 3,559 | 5 | 59 | — | 3,618 | 5 | A | |||||||||||||||||||||||||||
| Debt securities | — | — | 314 | 1 | 289 | 1 | 603 | 2 | A & B | ||||||||||||||||||||||||||||
| Available-for-sale financial assets | Debt securities | 4,829 | 7 | — | — | — | — | 4,829 | 7 | B | |||||||||||||||||||||||||||
| Equity securities | 13 | — | 9 | — | — | — | 22 | — | |||||||||||||||||||||||||||||
| Total assets at fair value | 11,467 | 16 | 60,403 | 83 | 584 | 1 | 72,454 | 100 | |||||||||||||||||||||||||||||
| Liabilities | |||||||||||||||||||||||||||||||||||||
| Trading liabilities | Deposits by banks | — | — | 7,969 | 13 | — | — | 7,969 | 13 | A | |||||||||||||||||||||||||||
| Deposits by customers | — | — | 18,568 | 30 | — | — | 18,568 | 30 | A | ||||||||||||||||||||||||||||
| Short positions | 1,698 | 3 | — | — | — | — | 1,698 | 3 | — | ||||||||||||||||||||||||||||
| Derivative liabilities | Exchange rate contracts | — | — | 2,271 | 4 | — | — | 2,271 | 4 | A | |||||||||||||||||||||||||||
| Interest rate contracts | 27 | — | 23,889 | 38 | — | — | 23,916 | 38 | A & C | ||||||||||||||||||||||||||||
| Equity and credit contracts | 1,025 | 2 | 1,350 | 2 | 58 | — | 2,433 | 4 | B | ||||||||||||||||||||||||||||
| Commodity contracts | — | — | 19 | — | — | — | 19 | — | A | ||||||||||||||||||||||||||||
| Financial liabilities at FVTPL | Debt securities in issue | — | — | 4,850 | 8 | 127 | — | 4,977 | 8 | A | |||||||||||||||||||||||||||
| Total liabilities at fair value | 2,750 | 5 | 58,916 | 95 | 185 | — | 61,851 | 100 | |||||||||||||||||||||||||||||
| 31 December 2011 | Internal models based on | ||||||||||||||||||||||||||||||||||||
| Balance sheet category | Quoted prices in active markets (Level 1) | Market observable data (Level 2) | Significant unobservable data (Level 3) | Total | Valuation technique | ||||||||||||||||||||||||||||||||
| £m | % | £m | % | £m | % | £m | % | ||||||||||||||||||||||||||||||
| Assets | |||||||||||||||||||||||||||||||||||||
| Trading assets | Loans and advances to banks | — | — | 6,144 | 11 | — | — | 6,144 | 11 | A | |||||||||||||||||||||||||||
| Loans and advances to customers | — | — | 6,687 | 12 | — | — | 6,687 | 12 | A | ||||||||||||||||||||||||||||
| Debt securities | 8,711 | 15 | — | — | — | — | 8,711 | 15 | — | ||||||||||||||||||||||||||||
| Equity securities | 349 | 1 | — | — | — | — | 349 | 1 | — | ||||||||||||||||||||||||||||
| Derivative assets | Exchange rate contracts | — | — | 2,735 | 5 | 70 | — | 2,805 | 5 | A | |||||||||||||||||||||||||||
| Interest rate contracts | 54 | — | 26,674 | 46 | — | — | 26,728 | 46 | A & C | ||||||||||||||||||||||||||||
| Equity and credit contracts | 407 | — | 657 | 2 | 171 | — | 1,235 | 2 | B & D | ||||||||||||||||||||||||||||
| Commodity contracts | — | — | 12 | — | — | — | 12 | — | A | ||||||||||||||||||||||||||||
| Financial assets at FVTPL | Loans and advances to customers | — | — | 4,318 | 7 | 58 | — | 4,376 | 7 | A | |||||||||||||||||||||||||||
| Debt securities | — | — | 328 | 1 | 301 | 1 | 629 | 1 | A & B | ||||||||||||||||||||||||||||
Available-for-sale financial assets | Equity securities | 36 | — | 10 | — | — | — | 46 | — | B | |||||||||||||||||||||||||||
| Total assets at fair value | 9,557 | 16 | 47,565 | 83 | 600 | 1 | 57,722 | 100 | |||||||||||||||||||||||||||||
| Liabilities | |||||||||||||||||||||||||||||||||||||
| Trading liabilities | Deposits by banks | — | — | 14,508 | 24 | — | — | 14,508 | 24 | A | |||||||||||||||||||||||||||
| Deposits by customers | — | — | 10,482 | 17 | — | — | 10,482 | 17 | A | ||||||||||||||||||||||||||||
| Short positions | 755 | 1 | — | — | — | — | 755 | 1 | — | ||||||||||||||||||||||||||||
| Derivative liabilities | Exchange rate contracts | — | — | 1,391 | 2 | — | — | 1,391 | 2 | A | |||||||||||||||||||||||||||
| Interest rate contracts | 41 | — | 25,107 | 41 | — | — | 25,148 | 41 | A & C | ||||||||||||||||||||||||||||
| Equity and credit contracts | 1,240 | — | 88 | 4 | 73 | — | 1,401 | 4 | B | ||||||||||||||||||||||||||||
| Commodity contracts | — | — | 11 | — | — | — | 11 | — | A | ||||||||||||||||||||||||||||
| Financial liabilities at FVTPL | Debt securities in issue | — | — | 6,696 | 11 | 141 | — | 6,837 | 11 | A | |||||||||||||||||||||||||||
| Total liabilities at fair value | 2,036 | 1 | 58,283 | 99 | 214 | — | 60,533 | 100 | |||||||||||||||||||||||||||||
The following tables present the fair values at 30 June 2012 and 31 December 2011 of the above financial assets and liabilities by product, analysed by the valuation methodology used by the Group to determine their fair value. The tables also disclose the percentages that the recorded fair values of products represent of the total assets and liabilities, respectively, that are recorded at fair value in the balance sheet:
| 30 June 2012 | Internal models based on | |||||||||||||||||||||||||||||||
| Product | Quoted prices in active markets | Market observable data | Significant unobservable data | Total | ||||||||||||||||||||||||||||
| £m | % | £m | % | £m | % | £m | % | |||||||||||||||||||||||||
| Assets | ||||||||||||||||||||||||||||||||
| Government and government-guaranteed debt securities | 3,868 | 5 | — | — | — | — | 3,868 | 5 | ||||||||||||||||||||||||
| Asset-backed securities | — | — | 314 | 1 | 289 | 1 | 603 | 2 | ||||||||||||||||||||||||
| Floating rate notes | 2,081 | 3 | — | — | — | — | 2,081 | 3 | ||||||||||||||||||||||||
| Other debt securities | 4,829 | 7 | — | — | 59 | — | 4,888 | 7 | ||||||||||||||||||||||||
| UK Social housing association loans | — | — | 3,559 | 5 | — | — | 3,559 | 5 | ||||||||||||||||||||||||
| Term deposits and money market instruments | — | — | 26,407 | 36 | — | — | 26,407 | 36 | ||||||||||||||||||||||||
| Exchange rate derivatives | — | — | 3,238 | 4 | 61 | — | 3,299 | 4 | ||||||||||||||||||||||||
| Interest rate derivatives | 59 | — | 25,632 | 35 | — | — | 25,691 | 35 | ||||||||||||||||||||||||
| Equity & credit derivatives | 140 | — | 1,224 | 2 | 175 | — | 1,539 | 2 | ||||||||||||||||||||||||
| Commodity derivatives | — | — | 20 | — | — | — | 20 | — | ||||||||||||||||||||||||
| Ordinary shares and similar securities | 490 | 1 | 9 | — | — | — | 499 | 1 | ||||||||||||||||||||||||
| 11,467 | 16 | 60,403 | 83 | 584 | 1 | 72,454 | 100 | |||||||||||||||||||||||||
| Liabilities | ||||||||||||||||||||||||||||||||
| Exchange rate derivatives | — | — | 2,271 | 4 | — | — | 2,271 | 4 | ||||||||||||||||||||||||
| Interest rate derivatives | 27 | — | 23,889 | 38 | — | — | 23,916 | 38 | ||||||||||||||||||||||||
| Equity & credit derivatives | 1,025 | 2 | 1,350 | 2 | 58 | — | 2,433 | 4 | ||||||||||||||||||||||||
| Commodity derivatives | — | — | 19 | — | — | — | 19 | — | ||||||||||||||||||||||||
| Deposits and debt securities in issue | 1,698 | 3 | 31,387 | 51 | — | — | 33,085 | 54 | ||||||||||||||||||||||||
| Debt securities in issue | — | — | — | — | 127 | — | 127 | — | ||||||||||||||||||||||||
| 2,750 | 5 | 58,916 | 95 | 185 | - | 61,851 | 100 | |||||||||||||||||||||||||
| 31 December 2011 | Internal models based on | |||||||||||||||||||||||||||||||
| Product | Quoted prices in active markets | Market observable data | Significant unobservable data | Total | ||||||||||||||||||||||||||||
| £m | % | £m | % | £m | % | £m | % | |||||||||||||||||||||||||
| Assets | ||||||||||||||||||||||||||||||||
| Government and government-guaranteed debt securities | 2,943 | 5 | — | — | — | — | 2,943 | 5 | ||||||||||||||||||||||||
| Asset-backed securities | — | — | 328 | 1 | 301 | 1 | 629 | 2 | ||||||||||||||||||||||||
| Floating rate notes | 5,768 | 10 | — | — | — | — | 5,768 | 10 | ||||||||||||||||||||||||
| Other debt securities | — | — | — | — | 58 | — | 58 | — | ||||||||||||||||||||||||
| UK Social housing association loans | — | — | 4,318 | 7 | — | — | 4,318 | 7 | ||||||||||||||||||||||||
| Term deposits and money market instruments | — | — | 12,831 | 22 | — | — | 12,831 | 22 | ||||||||||||||||||||||||
| Exchange rate derivatives | — | — | 2,735 | 5 | 70 | — | 2,805 | 5 | ||||||||||||||||||||||||
| Interest rate derivatives | 54 | — | 26,674 | 46 | — | — | 26,728 | 46 | ||||||||||||||||||||||||
| Equity & credit derivatives | 407 | — | 657 | 2 | 171 | — | 1,235 | 2 | ||||||||||||||||||||||||
| Commodity derivatives | — | — | 12 | — | — | — | 12 | — | ||||||||||||||||||||||||
| Ordinary shares and similar securities | 385 | 1 | 10 | — | — | — | 395 | 1 | ||||||||||||||||||||||||
| 9,557 | 16 | 47,565 | 83 | 600 | 1 | 57,722 | 100 | |||||||||||||||||||||||||
| Liabilities | ||||||||||||||||||||||||||||||||
| Exchange rate derivatives | — | — | 1,391 | 2 | — | — | 1,391 | 2 | ||||||||||||||||||||||||
| Interest rate derivatives | 41 | — | 25,107 | 41 | — | — | 25,148 | 41 | ||||||||||||||||||||||||
| Equity & credit derivatives | 1,240 | — | 88 | 4 | 73 | — | 1,401 | 4 | ||||||||||||||||||||||||
| Commodity derivatives | — | — | 11 | — | — | — | 11 | — | ||||||||||||||||||||||||
| Deposits and debt securities in issue | 755 | 1 | 31,686 | 52 | — | — | 32,441 | 53 | ||||||||||||||||||||||||
| Debt securities in issue | — | — | — | — | 141 | — | 141 | — | ||||||||||||||||||||||||
| 2,036 | 1 | 58,283 | 99 | 214 | — | 60,533 | 100 | |||||||||||||||||||||||||
The main valuation techniques employed in the Group’s internal models to measure the fair value of the financial instruments disclosed above at 30 June 2012 and 31 December 2011 are set out below. In substantially all cases, the principal inputs into these models are derived from observable market data. The Group did not make any material changes to the valuation techniques and internal models it used during the six month ended 30 June 2012 and the year ended 31 December 2011.
| A | In the valuation of financial instruments requiring static hedging (for example interest rate, currency derivatives and commodity swaps) and in the valuation of loans and advances and deposits, the ‘present value’ method is used. Expected future cash flows are discounted using the interest rate curves of the applicable currencies or forward commodity prices as appropriate. The interest rate curves are generally observable market data and reference yield curves derived from quoted interest rates in appropriate time bandings, which match the timings of the cashflows and maturities of the instruments. The forward commodity prices are generally observable market data. |
| B | In the valuation of equity financial instruments requiring dynamic hedging (principally equity securities, options and other structured instruments), proprietary local volatility and stochastic volatility models are used. These types of models are widely accepted in the financial services industry. Observable market inputs used in these models include the bid-offer spread, foreign currency exchange rates, volatility and correlation between indices. In limited circumstances, other inputs may be used in these models that are based on data other than observable market data, such as the Halifax’s UK House Price Index (‘HPI’) volatility, HPI forward growth, HPI spot rate, and mortality. |
| C | In the valuation of financial instruments exposed to interest rate risk that require either static or dynamic hedging (such as interest rate futures, caps and floors, and options), the present value method (futures), Black’s model (caps/floors) and the Hull/White and Markov functional models (Bermudan options) are used. These types of models are widely accepted in the financial services industry. ��The significant inputs used in these models are observable market data, including appropriate interest rate curves, volatilities, correlations and exchange rates. In limited circumstances, other inputs may be used in these models that are based on data other than observable market data, such as HPI volatility, HPI forward growth, HPI spot rate and mortality. |
| D | In the valuation of linear instruments such as credit risk and fixed-income derivatives, credit risk is measured using dynamic models similar to those used in the measurement of interest rate risk. In the case of non-linear instruments, if the portfolio is exposed to credit risk such as credit derivatives, the probability of default is determined using the par spread level. The main inputs used to determine the underlying cost of credit of credit derivatives are quoted credit risk premiums and the correlation between the quoted credit derivatives of various issuers. |
The fair values of the financial instruments arising from the Group’s internal models take into account, among other things, contract terms and observable market data, which include such factors as bid-offer spread, interest rates, credit risk, exchange rates, the quoted market price of raw materials and equity securities, volatility and prepayments. In all cases, when it is not possible to derive a valuation for a particular feature of an instrument, management uses judgement to determine the fair value of the particular feature. In exercising this judgement, a variety of tools are used including proxy observable data, historical data and extrapolation techniques. Extrapolation techniques take into account behavioural characteristics of equity markets that have been observed over time, and for which there is a strong case to support an expectation of a continuing trend in the future. Estimates are calibrated to observable market prices when they become available.
The estimates thus obtained could vary if other valuation methods or assumptions were used. The Group believes its valuation methods are appropriate and consistent with other market participants. Nevertheless, the use of different valuation methods or assumptions, including imprecision in estimating unobservable market inputs, to determine the fair value of certain financial instruments could result in different estimates of fair value at the reporting date and the amount of gain or loss recorded for a particular instrument. Most of the valuation models are not significantly subjective, because they can be tested and, if necessary, recalibrated by the internal calculation of and subsequent comparison to market prices of actively traded securities, where available.
e) Fair value adjustments
The internal models incorporate assumptions that the Group believes would be made by a market participant to establish fair value. Fair value adjustments are adopted when the Group considers that there are additional factors that would be considered by a market participant in the determination of fair value of the instrument that are not incorporated in the valuation model. The magnitude of fair value adjustments depends upon many entity-specific factors, including modelling sophistication, the nature of products traded, and the size and type of risk exposures. For this reason, fair value adjustments may not be comparable across the banking industry.
The Group classifies fair value adjustments as either ‘risk-related’ or ‘model-related’. The fair value adjustments form part of the portfolio fair value and are included in the balance sheet values of the product types to which they have been applied. The majority of these adjustments relate to Markets. The magnitude and types of fair value adjustment adopted by Markets are listed in the following table:
30 June 2012 £m | 31 December 2011 £m | |||||||
| Risk-related: | ||||||||
| - Bid-offer and trade specific adjustments | 33 | 71 | ||||||
| - Uncertainty | 47 | 47 | ||||||
| - Credit valuation adjustment | 77 | 70 | ||||||
| 157 | 188 | |||||||
| Model-related: | ||||||||
| - Model limitation | 17 | 23 | ||||||
| Day One profits | — | — | ||||||
| 174 | 211 | |||||||
Risk-related adjustments
‘Risk-related’ adjustments are driven, in part, by the magnitude of the Group’s market or credit risk exposure, and by external market factors, such as the size of market spreads.
(i) Bid-offer and trade specific adjustments
IAS 39 requires that portfolios are marked at bid or offer, as appropriate. Bid prices represent the price at which a long position could be sold and offer prices represent the price at which a short position could be bought back. Valuation models will typically generate mid market values. The bid-offer adjustment reflects the cost that would be incurred if substantially all residual net portfolio market risks were closed using available hedging instruments or by disposing of or unwinding the actual position.
The majority of the bid-offer adjustment relates to OTC derivative portfolios. For each portfolio, the major risk types are identified. These may include, inter alia, delta (the sensitivity to changes in the price of an underlying), vega (the sensitivity to changes in volatilities) and basis risk (the sensitivity to changes in the spread between two rates). For each risk type, the net portfolio risks are first classified into buckets, and then a bid-offer spread is applied to each risk bucket based upon the market bid-offer spread for the relevant hedging instrument.
The granularity of the risk bucketing is determined by reference to several factors, including the actual risk management practice undertaken by the Group, the granularity of risk bucketing within the risk reporting process, and the extent of correlation between risk buckets. Within a risk type, the bid-offer adjustment for each risk bucket may be aggregated without offset or limited netting may be applied to reflect correlation between buckets. There is no netting applied between risk types or between portfolios that are not managed together for risk management purposes. There is no netting across legal entities.
As bid-offer spreads vary by maturity and risk type to reflect different spreads in the market, for positions where there is no observable quote, a trade specific adjustment is further made. This is to reflect widened spreads in comparison to proxies due to reduced liquidity or observability. Trade specific adjustments can also be made to incorporate liquidity triggers whereby wider spreads are applied to risks above pre-defined thresholds or on exotic products to ensure overall reserves match market close-out costs. These market close-out costs inherently incorporate risk decay and cross-effects which are unlikely to be adequately reflected in the static hedge based on vanilla instruments.
(ii) Uncertainty
Certain model inputs may be less readily determinable from market data, and/or the choice of model itself may be more subjective, with less market evidence available from which to determine general market practice. In these circumstances, there exists a range of possible values that the financial instrument or market parameter may assume and an adjustment may be necessary to reflect the likelihood that in estimating the fair value of the financial instrument, market participants would adopt rather more conservative values for uncertain parameters and/or model assumptions than those used in the valuation model. Uncertainty adjustments are derived by considering the potential range of derivative portfolio valuation given the available market data. The objective of an uncertainty adjustment is to arrive at a fair value that is not overly prudent but rather reflects a level of prudence believed to be consistent with market pricing practice.
Uncertainty adjustments are applied to various types of exotic OTC derivative. For example, the mean reversion speed of interest rates may be an important component of an exotic derivative value and an uncertainty adjustment may be taken to reflect the range of possible values that market participants may assume for this parameter.
(iii) Credit valuation adjustment
The Group adopts a credit valuation adjustment (‘CVA’) against OTC derivative transactions to reflect within fair value the possibility that the counterparty may default, and the Group may not receive the full market value of the transactions. The Group calculates a separate CVA for each Santander UK legal entity, and within each entity for each counterparty to which the entity has exposure. The Group attempts to mitigate credit risk to third parties by entering into netting and collateral arrangements. The net counterparty exposure (i.e. counterparty positions netted by offsetting transactions and both cash and securities collateral) is then assessed for counterparty creditworthiness. The Group has only a limited exposure to monolines, consisting of exposure to securitisations which are wrapped by monoline insurers. The principal risk exposures are recorded against the securitisations, with the monoline wraps being viewed as contingent exposures, as described in Note 16. The description below relates to the CVA taken against counterparties other than monolines.
The Group calculates the CVA by applying the probability of default of the counterparty to the expected positive exposure to the counterparty, and multiplying the result by the loss expected in the event of default (i.e. the loss given default (‘LGD’)). The timing of the expected losses is reflected by using a discount factor. The calculation is performed over the life of the potential exposure i.e. the CVA is measured as a lifetime expected loss.
The expected positive exposure is calculated at a portfolio level and is based on the underlying risks of the portfolio. The main drivers of the expected positive exposure are the size of the risk position with the counterparty along with the prevailing market environment. The probability of default assumptions are based upon analysis of historic default rates. The credit rating used for a particular counterparty is that determined by the Group’s internal credit process. The LGD is calculated at the facility level and takes into account the counterparty characteristics. Credit ratings and LGD are updated by the credit team as new relevant information becomes available and at periodic reviews performed at least annually.
The Group also considers its own creditworthiness when determining the fair value of an instrument, including OTC derivative instruments and financial liabilities held at fair value through profit or loss if the Group believes market participants would take that into account when transacting the respective instrument. The approach to measuring the impact of the Group’s credit risk on an instrument is done in the same manner as for third party credit risk. The impact of the Group’s credit risk is considered when calculating the fair value of an instrument, even when credit risk is not readily observable such as in OTC derivatives. The Group has not realised any profit or loss on revaluing fair values of derivatives to reflect its own creditworthiness. If the Group had reflected such adjustments it would not have had a material impact on the valuations. Consequently, the Group does not derive the adjustment on a bilateral basis and has a zero adjustment against derivative liabilities, often referred to as a ‘debit valuation adjustment’.
For certain types of exotic derivatives where the products are not currently supported by the standard methodology, the Group adopts an alternative methodology. Alternative methodologies used by the Group fall into two categories. One method maps transactions against the results for similar products which are accommodated by the standard methodology. Where such a mapping approach is not appropriate, a bespoke methodology is used, generally following the same principles as the standard methodology, reflecting the key characteristics of the instruments but in a manner that is computationally less intensive. The calculation is applied at a trade level, with more limited recognition of credit mitigants such as netting or collateral agreements than used in the standard methodology described previously.
The methodologies do not, in general, account for ‘wrong-way risk’. Wrong-way risk arises where the underlying value of the derivative prior to any CVA is related to the probability of default of the counterparty. A more detailed description of wrong-way risk is set out below.
The Group includes all third-party counterparties in the CVA calculation and the Group does not net CVAs across Group entities. During 2011, the methodologies used to calculate the CVA were refined in line with evolving market practice.
Wrong-way risk
Wrong-way risk arises when there is a strong correlation between the counterparty’s probability of default and the mark-to-market value of the underlying transaction. Wrong-way risk can be seen in the following examples:
| > | when the counterparty is resident and/or incorporated in an emerging market and seeks to sell a non-domestic currency in exchange for its home currency; |
| > | when the trade involves the purchase of an equity put option from a counterparty whose shares are the subject of the option; |
| > | the purchase of credit protection from a counterparty who is closely associated with the reference entity of the credit default swap or total return swap; and |
| > | the purchase of credit protection on an asset type which is highly concentrated in the exposure of the counterparty selling the credit protection. |
Exposure to ‘wrong way risk’ is limited via internal governance processes and deal pricing. The Group considers that an appropriate adjustment to reflect wrong way risk is currently £nil (31 December 2011: £nil).
Model-related adjustments
These adjustments are primarily related to internal factors, such as the ability of the Group’s models to incorporate all material market characteristics. Models used for portfolio valuation purposes, particularly for exotic derivative products, may be based upon a simplifying set of assumptions that do not capture all material market characteristics or may be less reliable under certain market conditions. Additionally, markets evolve, and models that were adequate in the past may require development to capture all material market characteristics in current market conditions. In these circumstances, model limitation adjustments are adopted outside the core valuation model. The adjustment methodologies vary according to the nature of the model. The Quantitative Risk Group (‘QRG’), an independent quantitative support function reporting into Risk Department, highlights the requirement for model limitation adjustments and develops the methodologies employed. Over time, as model development progresses, model limitations are addressed within the core revaluation models and a model limitation adjustment is no longer needed.
Day One profits adjustments
Day One profit adjustments are adopted where the fair value estimated by a valuation model is based on one or more significant unobservable inputs, in accordance with IAS 39. Day One profits adjustments are amounts that have yet to be recognised in the income statement, which represent the difference between a transaction price (i.e. the fair value at initial recognition) and the amount that would have arisen had valuation models using unobservable inputs been used on initial recognition), less amounts subsequently recognised. Day One profits adjustments are calculated and reported on a portfolio basis. At 30 June 2012, the Day One profits adjustments were less than £1m (31 December 2011: less than £1m).
f) Control framework
Fair values are subject to a control framework designed to ensure that they are either determined or validated by a function independent of the risk-taker. To this end, ultimate responsibility for the determination of fair values lies with the Risk Department and the Finance Department. For all financial instruments where fair values are determined by reference to externally quoted prices or observable pricing inputs to models, independent price determination or validation is utilised. In inactive markets, direct observation of a traded price may not be possible. In these circumstances, the Group will source alternative market information to validate the financial instrument’s fair value, with greater weight given to information that is considered to be more relevant and reliable.
The factors that are considered in this regard include:
| > | the extent to which prices may be expected to represent genuine traded or tradable prices; |
| > | the degree of similarity between financial instruments; |
| > | the degree of consistency between different sources; |
| > | the process followed by the pricing provider to derive the data; |
| > | the elapsed time between the date to which the market data relates and the balance sheet date; and |
| > | the manner in which the data was sourced. |
The source of pricing data is considered as part of the process that determines the classification of the level of a financial instrument. Consideration is given to the quality of the information available that provides the current mark-to-model valuation and estimates of how different these valuations could be on an actual trade, taking into consideration how active the market is. For spot assets that cannot be sold due to illiquidity, forward estimates are discounted to provide an estimate of a realisable value over time. All adjustments for illiquid positions are regularly reviewed to reflect changing market conditions.
Internal valuation model review
Models provide a logical framework for the capture and processing of necessary valuation inputs. For fair values determined using a valuation model, the control framework may include, as applicable, independent development or validation of:
| > | the logic within valuation models; |
| > | the inputs to those models; |
| > | any adjustments required outside the valuation models; and |
| > | where possible, model outputs. |
All internal valuation models are validated independently by QRG. A validation report is produced for each model-derived valuation that assesses the mathematical assumptions behind the model and the implementation of the model and its integration within the trading system. Where there is observable market data, the models calibrate to market. Where pricing data is unobservable then the input parameters are regularly reviewed by QRG.
The independent valuation process applies fair value adjustments in line with the Group’s established documented policies. The results of the independent validation process are reported to, and considered monthly by Risk Fora. Each Risk Forum is composed of representatives from several independent support functions (Product Control, Market Risk, QRG and Finance) in addition to senior management and the front office. The members of each Risk Forum consider the appropriateness and adequacy of the fair value adjustments and the effectiveness of valuation models. Changes to the fair value adjustments methodologies are considered by the Risk Fora and signed off by the Head of Wholesale Risk. The Risk Fora are overseen by the Wholesale Risk Oversight and Control Forum and Risk Committee.
g) Internal models based on observable market data (Level 2)
During the first half of 2012 there were no transfers between Level 1 and Level 2 financial instruments (Year ended 31 December 2011: none).
1. Trading Assets
Loans and advances to banks and loans and advances to customers - securities purchased under resale agreements
These instruments consist of reverse repos with both professional non-bank customers and bank counterparties as part of the Group’s trading activities. The fair value of reverse repos is estimated by using the ‘present value’ method. Future cash flows are evaluated taking into consideration any derivative features of the reverse repos and are then discounted using the appropriate market rates for the applicable maturity and currency. Under these agreements, the Group receives collateral with a market value equal to, or in excess of, the principal amount loaned. The level of collateral held is monitored daily and if required, further calls are made to ensure the market values of collateral remains at least equal to the loan balance. As a result, there would be no adjustment, or an immaterial adjustment, to reflect the credit quality of the counterparty related to these agreements. As the inputs used in the valuation are based on observable market data, these reverse repos are classified within level 2 of the valuation hierarchy.
Loans and advances to banks and loans and advances to customers - other
These instruments consist of term deposits placed which are short-term in nature and are both utilised and managed as part of the funding requirements of the trading book. The fair value of loans and advances to banks and loans and advances to customers is estimated using the ‘present value’ method. Expected future cash flows are discounted using the interest rate curves of the applicable currencies. The interest rate curves are generally observable market data and reference yield curves derived from quoted interest rates in appropriate time bandings, which match the timings of the cashflows and maturities of the instruments. As the inputs used in the valuation are based on observable market data, these loans are classified within level 2 of the valuation hierarchy.
2. Derivative assets and liabilities
These instruments consist of exchange rate contracts, interest rate contracts, equity and credit contracts and equity derivatives. The models used in estimating the fair value of these derivatives do not contain a high level of subjectivity as the methodologies used in the models do not require significant judgement, and the inputs used in the models are observable market data such as plain vanilla interest rate swaps and option contracts. As the inputs used in the valuation are based on observable market data, these derivatives are classified within level 2 of the valuation hierarchy.
Certain derivatives which represent cross currency swaps, reversionary property interests, credit default swaps and options and forwards contain significant unobservable inputs or are traded less actively or traded in less-developed markets, and so are classified within level 3 of the valuation hierarchy. The valuation of such instruments is further discussed in the ‘internal models based on information other than market data’ section below.
3. Financial assets at fair value through profit or loss (‘FVTPL’)
Loans and advances to customers
These instruments consist of loans secured on residential property to housing associations. The fair value of these social housing loans is estimated using the ‘present value’ model based on a credit curve derived from current market spreads observable in the social housing bond data. Observable market data include current market spreads for new accepted mandates and bids for comparable loans and are used to support or challenge the benchmark level. This provides a range of reasonably possible estimates of fair value. As the inputs used in the valuation are based on market observable data, these loans are classified within level 2 of the valuation hierarchy.
Certain loans and advances to customers which represent a portfolio of roll-up mortgages contain significant unobservable inputs and so are classified within level 3 of the valuation hierarchy. The valuation of such instruments is further discussed below.
Debt securities
These instruments consist of holdings of asset-backed securities. A significant portion of these securities are priced using the ‘present value’ models, based on observable market data e.g. LIBOR, credit spreads. Where there are quoted prices for these instruments, the model value is checked against the quoted prices for reference purposes, but is not used as the fair value as the market for these instruments are lacking in liquidity and depth. As the inputs used in the valuation are based on observable market data, these debt securities are classified within level 2 of the valuation hierarchy.
Certain debt securities which represent reversionary property securities and securities issued by Santander entities contain significant unobservable inputs, and so are classified within level 3 of the valuation hierarchy. The valuation of such instruments is further discussed below.
4. Available-for-sale financial assets – Equity securities
These instruments consist of unquoted equity investments in companies providing infrastructure services to the financial services industry and a small portfolio held within the Santander UK Foundation (which is consolidated by the Group). In the valuation of equity financial instruments requiring dynamic hedging, proprietary local volatility and stochastic volatility models are used. These types of models are widely accepted in the financial services industry.
Observable market inputs used in these models include the bid-offer spread, foreign currency exchange rates, volatility and correlation between indices. As the inputs used in the valuation are based on observable market data, these equity securities are classified within level 2 of the valuation hierarchy.
5. Trading liabilities
Deposits by banks and deposits by customers - securities sold under repurchase agreements
These instruments consist of repos with both professional non-bank customers and bank counterparties as part of the Group’s trading activities. The fair value of repos is estimated using the same technique as those reverse repos in trading assets discussed above. Under these agreements, the Group is required to provide and maintain collateral with a market value equal to, or in excess of, the principal amount borrowed. As a result, there would be no adjustment, or an immaterial adjustment, to reflect the credit quality of the Group related to these agreements. As the inputs used in the valuation are based on observable market data, these repos are classified within level 2 of the valuation hierarchy.
Deposits by banks and deposits by customers - other
These instruments consist of certain term and time deposits which tend to be short-term in nature and are both utilised and managed as part of the funding requirements of the trading book. These instruments are valued using the same techniques as those instruments in trading assets - loans and advances to banks and loans and advances to customers discussed above. As the inputs used in the valuation are based on observable market data, these deposits are classified within level 2 of the valuation hierarchy.
6. Financial liabilities at FVTPL
Debt securities in issue
These instruments include commercial paper, medium term notes and other bonds and are valued using the same techniques as those instruments in financial assets at FVTPL - debt securities discussed above. As the inputs used in the valuation are based on observable market data, these debt securities are classified within level 2 of the valuation hierarchy.
Certain debt securities in issue which represent the more exotic senior debt issuances, consisting of power reverse dual currency (‘PRDC’) notes contain significant unobservable inputs and so are classified within level 3 of the valuation hierarchy. The valuation of such instruments is further discussed below.
h) Internal models based on information other than market data (Level 3)
The table below provides an analysis of financial instruments valued using internal models based on information other than market data together with the subsequent valuation technique used for each type of instrument. Each instrument is initially valued at transaction price:
Balance sheet value | Amount recognised in income/(expense) | ||||||||||||||||||
| Balance sheet line item | Financial instrument product type | 30 June 2012 | 31 December 2011 | 30 June 2012 | 30 June 2011 | ||||||||||||||
| Category | £m | £m | £m | £m | |||||||||||||||
| 1. Derivative assets | Exchange rate contracts | Cross-currency swaps | 61 | 70 | (2 | ) | 1 | ||||||||||||
| 2. Derivative assets | Equity and credit contracts | Reversionary property interests | 77 | 78 | 1 | (1 | ) | ||||||||||||
| 3. Derivative assets | Credit contracts | Credit default swaps | 13 | 16 | (3 | ) | — | ||||||||||||
| 4. Derivative assets | Equity contracts | Options and forwards | 85 | 77 | 1 | (1 | ) | ||||||||||||
| 5. FVTPL | Loans and advances to customers | Roll-up mortgage portfolio | 59 | 58 | 1 | (1 | ) | ||||||||||||
| 6. FVTPL | Debt securities | Reversionary property securities | 242 | 250 | 5 | 2 | |||||||||||||
| 7. FVTPL | Debt securities | Mortgage-backed securities | 47 | 51 | — | 1 | |||||||||||||
| 8. Derivative liabilities | Equity contracts | Options and forwards | (58 | ) | (73 | ) | 2 | — | |||||||||||
| 9. FVTPL | Debt securities in issue | Non-vanilla debt securities | (127 | ) | (141 | ) | 2 | (1 | ) | ||||||||||
| Total net assets | 399 | 386 | — | — | |||||||||||||||
| Total income/(expense) | — | — | 7 | — | |||||||||||||||
Valuation technique
1. Derivative assets - Exchange rate contracts
These cross currency swaps are used to hedge the foreign currency risks arising from the power reverse dual currency (‘PRDC’) notes issued by the Group, as described in Instrument 9 below. These derivatives are valued using a standard valuation model valuing each leg of the swap, with expected future cash flows less notional amount exchanged at maturity date discounted using an appropriate floating rate. The floating rate is adjusted by the relevant cross currency basis spread. Interest rates, foreign exchange rates, cross currency basis spread and long-dated foreign exchange (‘FX’) volatility are used as inputs to determine fair value. Interest rates, foreign exchange rates are observable on the market.
Cross currency spreads may be market observable or unobservable depending on the liquidity of the cross currency pair. As the Japanese Yen-US dollar cross currency pair related to the PRDC notes is liquid, the cross currency spreads (including long-dated cross currency spread) for these swaps are market observable.
The significant unobservable inputs for the valuation of these financial instruments are the long-dated FX volatility and the correlation between the underlying assets. The correlation between the underlying assets is assumed to be zero, as there are no actively traded options from which correlations between the underlying assets could be implied. Furthermore, the zero correlation assumption implies that the sources of the long-dated FX volatility are independent.
Long-dated FX volatility
Long-dated FX volatility is extrapolated from shorter-dated FX volatilities which are directly observable on the market. Short-dated FX volatility is observable from the trading of FX options. As there is no active market for FX options with maturities greater than five years (long-dated FX options), long-dated FX volatility is not market observable. Furthermore, as historical prices are not relevant in determining the cost of hedging long-dated FX risk, long-dated FX volatility cannot be inferred from historical volatility. The Group extrapolates the long-dated FX volatility from the shorter-dated FX volatilities using Black’s model.
FX volatility is modelled as the composition of the domestic interest rate, foreign interest rates and FX spot volatilities using standard Hull-White formulae. The Hull-White approach is used for estimating the future distribution of domestic and foreign zero-coupon rates, constructed from the relevant yield curves. Using short-dated FX options, the FX spot volatility is calculated which is then extrapolated to derive the long-dated FX volatility.
2. Derivative assets - Equity and credit contracts
These reversionary property derivatives are valued using a probability weighted set of HPI forward prices, which are assumed to be a reasonable representation of the increase in value of the Group’s reversionary interest portfolio underlying the derivatives. The probability used reflects the likelihood of the home owner vacating the property and is calculated from mortality rates and acceleration rates which are a function of age and gender, obtained from the relevant mortality tables. Indexing is felt to be appropriate due to the size and geographical dispersion of the Group’s reversionary interest portfolio. These are determined using HPI Spot Rates adjusted to reflect estimated forward growth. Launched in 1984, the Halifax’s UK HPI is the UK's longest running monthly house price data series covering the whole country. The indices calculated are standardised and represent the price of a typically transacted house. Both national and regional HPI are published. The national HPI is published monthly. The regional HPI reflects the national HPI disaggregated into 12 UK regions and is published quarterly. Both indices are published on two bases, including and excluding seasonal adjustments in the housing market. The Group uses the non-seasonally adjusted (‘NSA’) national and regional HPI in its valuation model to avoid any subjective judgement in the adjustment process which is made by Halifax.
The inputs used to determine the value of the reversionary property derivatives are HPI spot, HPI forward growth and mortality rates. The principal pricing parameters are HPI spot and HPI forward growth.
HPI Spot Rate
The HPI spot rate used in the model is a weighted average of NSA regional HPI spot rates i.e. adjusted for difference in the actual regional composition of the property underlying the Group’s reversionary interest portfolio and the composition of the published regional indices. The regional HPI spot rate (which is observable market data) is only published on specific quarterly dates. In between these dates, its value is estimated by applying the growth rate over the relevant time period inferred from the national HPI spot rates (which are observable market data and published monthly) to the most recently calculated weighted average regional HPI spot rate based on published regional indices.
An adjustment is also made to reflect the specific property risk i.e. possible deviation between the actual growth in the house prices underlying the Group’s reversionary interest portfolio and their assumed index-linked growth, which is based on the regional HPI. This adjustment is based on the average historical deviation of price changes of the Group’s actual property portfolio from that of the published indices over the time period since the last valuation date.
HPI Forward Growth Rate
Long-dated HPI forward growth rate is not directly observable in the market but is estimated from broker quotes and traded forward contracts. A specific spread is applied to the long-dated forward growth rate to reflect the uncertainty surrounding long dated data. This spread is calculated by analysing the historical volatility of the HPI, whilst incorporating mean reversion. An adjustment is made to reflect the specific property risk as for the HPI spot rate above.
Mortality Rate
Mortality rates are obtained from the PNMA00 and PNFA00 Continuous Mortality Investigation Tables published by the UK Institute and Faculty of Actuaries. These mortality rates are adjusted by acceleration rates to reflect the mortality profile of the holders of Group’s reversionary property products underlying the derivatives.
3. Derivative assets - Equity and credit contracts
These derivative assets are credit default swaps held against certain bonds. The credit default swaps are valued using the credit spreads of the referenced bonds. These referenced bonds are valued with the assistance of valuations prepared by an independent, specialist valuation firm as a deep and liquid market does not exist.
In valuing the credit default swaps, the main inputs used to determine the underlying cost of credit are quoted risk premiums and the correlation between the quoted credit derivatives of various issuers. The assumptions relating to the correlation between the values of quoted and unquoted assets are based on historical correlations between the impact of adverse changes in market variables and the corresponding valuation of the associated unquoted assets. The measurement of the assets will vary depending on whether a more or less conservative scenario is selected. The other main input is the probability of default of the referenced bonds. The significant unobservable input for the valuation of these financial instruments is the probability of default.
Probability of default
The probability of default is assessed by considering the credit quality of the underlying referenced bonds. However, as no deep and liquid market exists for these assets the assessment of the probability of default is not directly observable and instead an estimate is calculated using the Standard Gaussian Copula model.
4. Derivative assets - Equity contracts
There are three types of derivatives within this category:
European options
These derivatives are valued using a modified Black-Scholes model where the HPI is log-normally distributed with the forward rates determined from the HPI forward growth.
Asian options
Asian (or average value) options are valued using a modified Black-Scholes model, with an amended strike price and volatility assumption to account for the average exercise period, through a closed form adjustment that reflects the strike price relative to the distribution of stock prices at each relevant date. This is also known as the Curran model.
Forward contracts
Forward contracts are valued using a standard forward pricing model.
The inputs used to determine the value of the above instruments are HPI spot rate, HPI forward growth rate and HPI volatility. The principal pricing parameter is HPI forward growth rate.
HPI Spot Rate
The HPI spot rate used is the NSA national HPI spot rate which is published monthly and directly observable in the market. This HPI rate used is different from the weighted average regional HPI spot rate used in the valuation of Instrument 2 above, as the underlying of these derivatives is the UK national HPI spot rate.
HPI Forward Growth Rate
The HPI forward growth rate used is unobservable and is the same as used in the valuation of Instrument 2 above.
HPI Volatility
Long-dated HPI volatility is not directly observable in the market but is estimated from the most recent traded values. An adjustment is applied to the long-dated HPI volatility rate to reflect the uncertainty surrounding long-dated data. This adjustment is based on the empirical standard deviation of historical volatility over a range of time horizons.
5. FVTPL – Loans and advances to customers
These loans and advances to customers represent roll-up mortgages, which are an equity release scheme under which a property owner takes out a loan secured against their home. The owner does not make any interest payments during their lifetime and the fixed interest payments are rolled up into the mortgage. The loan or mortgage (capital and rolled-up interest) is repaid upon the owner’s vacation of the property and the value of the loan is only repaid from the value of the property. This is known as a ‘no negative pledge’. The Group suffers a loss if the sale proceeds from the property are insufficient to repay the loan, as it is unable to pursue the homeowner’s estate or beneficiaries for the shortfall.
The value of the mortgage ‘rolls up’ or accretes until the owner vacates the property. In order to value the roll-up mortgages, the Group uses a probability-weighted set of European option prices (puts) determined using the Black-Scholes model, in which the ‘no negative pledges’ are valued as short put options. The probability weighting applied is calculated from mortality rates and acceleration rates as a function of age and gender, taken from mortality tables.
The inputs used to determine the value of these instruments are HPI spot, HPI forward growth, HPI volatility, mortality rates and repayment rates. The principal pricing parameter is HPI forward growth. The HPI forward growth rate used is unobservable and is the same as used in the valuation of Instrument 2 above. The other parameters do not have a significant effect on the value of the instruments.
6. FVTPL – Debt securities
These debt securities consisting of reversionary property securities are an equity release scheme, where the property owner receives an upfront lump sum in return for paying a fixed percentage of the sales proceeds of the property when the owner vacates the property. These reversionary property securities are valued using a probability-weighted set of HPI forward prices which are assumed to be a reasonable representation of the increase in value of the Group’s reversionary interest portfolio underlying the derivatives. The probability weighting used reflects the probability of the home owner vacating the property through death and is calculated from death rates and acceleration factors which are a function of age and gender, obtained from the relevant mortality table.
The inputs used to determine the value of these instruments are HPI spot, HPI forward growth and mortality rates. The principal pricing parameter is HPI forward growth. Discussion of the HPI spot rate, HPI forward growth rate and mortality rates for this financial instrument is the same as Instrument 3 above.
An adjustment is also made to reflect the specific property risk. Discussion of the specific property risk adjustment is the same as Instrument 2 above.
7. FVTPL – Debt securities
These securities consist of residential mortgage-backed securities issued by Santander entities. Each instrument is valued with reference to the price from a consensus pricing service. This is then corroborated against the price from another consensus pricing service due to the lack of depth in the number of available market quotes. An average price is used where there is a more than insignificant difference between the two sources. The significant unobservable input is the adjustment to the credit spread embedded in the pricing consensus quotes.
8. Derivative liabilities - Equity contracts
These derivatives are the same as Instrument 4 with the exception that they have a negative fair value.
9. FVTPL - Debt securities in issue
These debt securities in issue are power reverse dual currency notes. These notes are financial structured products where an investor is seeking a better return and a borrower/issuer a lower rate by taking advantage of the interest rate differential between two countries. The note pays a foreign interest rate in the investor’s domestic currency. The power component of the name denotes higher initial coupons and the fact that coupons rise as the domestic/foreign exchange rate depreciates. The power feature comes with a higher risk for the investor. Cash flows may have a digital cap feature where the rate gets locked once it reaches a certain threshold. Other add-on features are barriers such as knockouts and cancellation provisions for the issuer.
These debt securities in issue are valued using a three-factor Gaussian Model. The three factors used in the valuation are domestic interest rates, foreign interest rates and foreign exchange rates. The correlations between the factors are assumed to be zero within the valuation.
The Hull-White approach is used for estimating the future distribution of domestic and foreign zero-coupon rates, constructed from the relevant yield curves. A Geometric Brownian Motion model is used for estimating the future distribution of spot foreign exchange rates. The foreign exchange and interest rate volatilities are the most crucial pricing parameters; the model calibrates to the relevant swaption volatility surface.
The significant unobservable inputs for the valuation of these financial instruments are the long dated FX volatility and the correlation between the underlying assets and are the same as Instrument 1.
Reconciliation of fair value measurements in Level 3 of the fair value hierarchy
The following table provides a reconciliation of the movement between opening and closing balances of Level 3 financial instruments, measured at fair value using a valuation technique with significant unobservable inputs:
| Assets | Liabilities | |||||||||||||||||||||||
| Derivatives | Fair value through P&L | Total | Derivatives | Fair value through P&L | Total | |||||||||||||||||||
| £m | £m | £m | £m | £m | £m | |||||||||||||||||||
| At 1 January 2012 | 241 | 359 | 600 | (73 | ) | (141 | ) | (214 | ) | |||||||||||||||
| Total gains/(losses) recognised in profit/(loss): | ||||||||||||||||||||||||
| - Fair value movements | (3 | ) | 6 | 3 | 2 | 2 | 4 | |||||||||||||||||
| - Foreign exchange and other movements | (5 | ) | (2 | ) | (7 | ) | — | 8 | 8 | |||||||||||||||
| Purchases | 8 | — | 8 | — | — | — | ||||||||||||||||||
| Sales | — | (13 | ) | (13 | ) | — | — | — | ||||||||||||||||
| Settlements | (5 | ) | (2 | ) | (7 | ) | 13 | 4 | 17 | |||||||||||||||
| At 30 June 2012 | 236 | 348 | 584 | (58 | ) | (127 | ) | (185 | ) | |||||||||||||||
| Total gains/(losses) recognised in profit/(loss) relating to assets and liabilities held at the end of the period | (8 | ) | 4 | (4 | ) | 2 | 10 | 12 | ||||||||||||||||
| Assets | Liabilities | |||||||||||||||||||||||
| Derivatives | Fair value through P&L | Total | Derivatives | Fair value through P&L | Total | |||||||||||||||||||
| £m | £m | £m | £m | £m | £m | |||||||||||||||||||
| At 1 January 2011 | 231 | 359 | 590 | (102 | ) | (137 | ) | (239 | ) | |||||||||||||||
| Total gains/(losses) recognised in profit/(loss): | ||||||||||||||||||||||||
| - Fair value movements | (1 | ) | 2 | 1 | — | (1 | ) | (1 | ) | |||||||||||||||
| - Foreign exchange and other movements | (4 | ) | 4 | — | — | 4 | 4 | |||||||||||||||||
| Purchases | 23 | — | 23 | — | — | — | ||||||||||||||||||
| Sales | (25 | ) | (24 | ) | (49 | ) | — | — | — | |||||||||||||||
| Settlements | (8 | ) | (4 | ) | (12 | ) | 31 | — | 31 | |||||||||||||||
| At 30 June 2011 | 216 | 337 | 553 | (71 | ) | (134 | ) | (205 | ) | |||||||||||||||
| Total gains/(losses) recognised in profit/(loss) relating to assets and liabilities held at the end of the period | (5 | ) | 6 | 1 | — | 3 | 3 | |||||||||||||||||
Financial instrument assets and liabilities at 30 June 2012
Financial instrument assets valued using internal models based on information other than market data were 1% (31 December 2011: 1%) of total assets measured at fair value and 0.2% (31 December 2011: 0.2%) of total assets at 30 June 2012.
Derivative assets decreased in the first half of 2012 principally due to settlements and decreases in fair value movements partially offset by additional advances made during the period. Assets designated at fair value through profit or loss decreased in the first half of 2012 due to sales and settlements partially offset by increases in fair value movements.
Financial instrument liabilities valued using internal models based on information other than market data were 0.3% (31 December 2011: 0.3%) of total liabilities measured at fair value and 0.1% (31 December 2011: 0.1%) of total liabilities at 30 June 2012.
Derivative liabilities decreased in the first half of 2012 due to settlements. Liabilities designated at fair value through profit or loss decreased due to fair value and foreign exchange movements and settlements.
Gains and losses for the six months ended 30 June 2012
Losses of £8m in respect of derivative assets principally reflected changes in credit spreads and the HPI Index and movements in foreign exchange rates. Gains of £4m in respect of assets designated at fair value through profit or loss principally reflect the mark-to-market volatility on the reversionary property securities arising from a continued low interest rate environment, changes in the HPI index and a maturing portfolio.
Gains of £2m in respect of derivative liabilities principally reflected changes in credit spreads and the HPI Index. Gains of £10m in respect of liabilities designated at fair value through profit or loss principally reflected changes in foreign exchange and interest rates. They are fully matched with derivatives.
Gains and losses for the six months ended 30 June 2011
Losses of £5m in respect of derivatives assets principally reflected changes in fair value and unfavourable movements in foreign exchange rates. Gains of £6m in respect of assets designated at fair value through profit or loss are mainly attributable to foreign exchange movements on the reduced portfolio of asset-backed and mortgage-backed securities held during the period.
Gains of £3m in respect of liabilities designated at fair value through profit or loss principally reflected changes in foreign exchange rates.
Effect of changes in significant unobservable assumptions to reasonably possible alternatives (Level 3)
As discussed above, the fair value of financial instruments are, in certain circumstances, measured using valuation techniques that incorporate assumptions that are not evidenced by prices from observable current market transactions in the same instrument and are not based on observable market data and, as such require the application of a degree of judgement. Changing one or more of the inputs to the valuation models to reasonably possible alternative assumptions would change the fair values significantly. The following table shows the sensitivity of these fair values to reasonably possible alternative assumptions.
Favourable and unfavourable changes are determined on the basis of changes in the value of the instrument as a result of varying the levels of the unobservable input as described in the table below. The potential effects do not take into effect any offsetting or hedged positions.
At 30 June 2012
| Reflected in income statement | |||||||||||||||||
| Balance sheet note line item and product | Fair value | Assumptions | Shift | Favourable changes | Unfavourable changes | ||||||||||||
| £m | £m | £m | |||||||||||||||
2. Derivative assets – Equity and credit contracts: – Reversionary property derivatives | 77 | HPI Forward growth rate HPI Spot rate Mortality rate | 1 10 2 yrs | % % | 11 8 1 | (11 (8 (1 | ) ) ) | ||||||||||
3. Derivative assets – Equity and credit contracts: – Credit default swaps | 13 | Probability of default | 20 | % | 3 | (3 | ) | ||||||||||
4. Derivative assets – Equity and credit contracts: – Options and forwards | 85 | HPI Forward growth rate HPI Spot rate HPI Volatility | 1 10 1 | % % % | 7 12 1 | (7 (11 (1 | ) ) ) | ||||||||||
5. FVTPL – Loans and advances to customers: – Roll-up mortgage portfolio | 59 | HPI Forward growth rate | 1 | % | 2 | (2 | ) | ||||||||||
6. FVTPL – Debt securities: – Reversionary property securities | 242 | HPI Forward growth rate HPI Spot rate Mortality rate | 1 10 2 yrs | % % | 20 23 1 | (20 (23 (1 | ) ) ) | ||||||||||
7. FVTPL – Debt securities: – Mortgage-backed securities | 47 | Credit spread | 10 | % | 5 | (5 | ) | ||||||||||
8. Derivative liabilities - Equity and credit contracts: – Options and forwards | (58 | ) | HPI Forward growth rate HPI Spot rate HPI Volatility | 1 10 1 | % % % | 3 7 1 | (3 (11 (1 | ) ) ) | |||||||||
At 31 December 2011
| Reflected in income statement | |||||||||||||||||
| Balance sheet note line item and product | Fair value | Assumptions | Shift | Favourable changes | Unfavourable changes | ||||||||||||
| £m | £m | £m | |||||||||||||||
2. Derivative assets – Equity and credit contracts: – Reversionary property derivatives | 78 | HPI Forward growth rate HPI Spot rate Mortality rate | 1 10 2 yrs | % | 11 8 — | (11 (8 | ) ) - | ||||||||||
3. Derivative assets – Equity and credit contracts: – Credit default swaps | 16 | Probability of default | 20 | % | 3 | (3 | ) | ||||||||||
4. Derivative assets – Equity and credit contracts: – Options and forwards | 77 | HPI Forward growth rate HPI Spot rate HPI Volatility | 1 10 1 | % % | 7 4 1 | (7 (3 (1 | ) ) ) | ||||||||||
5. FVTPL – Loans and advances to customers: – Roll-up mortgage portfolio | 58 | HPI Forward growth rate | 1 | % | 2 | (2 | ) | ||||||||||
6. FVTPL – Debt securities: – Reversionary property securities | 250 | HPI Forward growth rate HPI Spot rate Mortality rate | 1 10 2 yrs | % % | 20 23 1 | (20 (23 (1 | ) ) ) | ||||||||||
7. FVTPL – Debt securities: – Mortgage-backed securities | 51 | Credit spread | 10 | % | 5 | (5 | ) | ||||||||||
8. Derivative liabilities - Equity and credit contracts: – Options and forwards | (73 | ) | HPI Forward growth rate HPI Spot rate HPI Volatility | 1 10 1 | % % % | 4 13 2 | (4 (17 (2 | ) ) ) | |||||||||
No sensitivities are presented for the FVTPL - debt securities in issue (instrument 9) and related exchange rate derivatives (instrument 1), as the terms of these instruments are fully matched. As a result, any changes in the valuation of the debt securities in issue would be exactly offset by an equal and opposite change in the valuation of the exchange rate derivatives.
34. CAPITAL MANAGEMENT AND RESOURCES
This note reflects the transactions and amounts reported on a basis consistent with the Group’s regulatory filings.
Capital management and capital allocation
Santander UK plc and its subsidiaries are a UK banking group effectively subject to two tiers of supervision. Santander UK is subject to prudential supervision by both the FSA (as a UK authorised bank) and the Bank of Spain (as a member of the Santander group). As an FSA-regulated entity, Santander UK is expected to satisfy the FSA liquidity and capital requirements on a standalone basis. Similarly, Santander UK must demonstrate to the FSA that it can withstand liquidity and capital stress tests without parental support. Reinforcing the corporate governance framework adopted by Santander UK, the FSA exercises oversight through its rules and regulations on the Santander UK Board and senior management appointments.
The Board is responsible for capital management strategy and policy and ensuring that capital resources are appropriately monitored and controlled within regulatory and internal limits. Authority for capital management flows to the Chief Executive Officer and from her to specific individuals who are members of the Group’s Strategic Risk and Financial Management (‘SRFM’) Committee and supported by the Asset and Liability Management Committee (‘ALCO’).
SFRM and ALCO adopt a centralised capital management approach that is driven by the Group’s corporate purpose and strategy. This approach takes into account the regulatory and commercial environment in which the Group operates, the Group’s risk appetite, the management strategy for each of the Group’s material risks (including whether or not capital provides an appropriate risk mitigant) and the impact of appropriate adverse scenarios and stresses on the Group’s capital requirements. This approach is reviewed annually as part of the Group’s Internal Capital Adequacy Assessment Process (‘ICAAP’).
The Group manages its capital requirements, debt funding and liquidity on the basis of policies and plans reviewed regularly at ALCO. Capital requirements are also reviewed as part of the ICAAP while debt funding and liquidity are also reviewed as part of the Internal Liquidity Adequacy Assessment (‘ILAA’) process. To support its capital and senior debt issuance programmes, the Group is rated on a stand alone basis from Banco Santander, S.A..
On an ongoing basis, and in accordance with the latest ICAAP review, the Group forecasts its regulatory and internal capital requirements based on the approved capital volumes allocated to business units as part of the corporate planning process which generates the strategic 3 Year Plan. Alongside this plan, the Group develops a series of macro economic scenarios to stress test its capital requirements and confirm that it has adequate regulatory capital resources to meet its projected and stressed regulatory capital requirement and to meet its obligations as they fall due. Internally assigned buffers augment the various regulatory minimum capital criteria. Buffers are held in order to ensure there is sufficient time for management actions to be implemented against unexpected movements.
Decisions on the allocation of capital resources are conducted as part of the Group’s strategic three year planning process based on the relative returns on capital using both economic and regulatory capital measures. Capital allocations are reviewed in response to changes in risk appetite and risk management strategy, changes to the commercial environment, changes in key economic indicators or when additional capital requests are received.
This combination of regulatory and economic capital ratios and limits, internal buffers and restrictions, together with the relevant costs of differing capital instruments and a consideration of the various other capital management techniques are used to shape the most cost-effective structure to fulfil the Group’s capital needs.
Capital adequacy
The Group manages its capital on a Basel II basis. During the six months ended 30 June 2012 and the year end 31 December 2011, the Group held capital over and above its regulatory requirements, and managed internal capital allocations and targets in accordance with its capital and risk management policies.
Group Capital
30 June 2012 £m | 31 December 2011 £m | |||||||
| Core Tier 1 capital | 12,137 | 11,477 | ||||||
| Deductions from Core Tier 1 capital | (2,701 | ) | (2,616 | ) | ||||
| Total Core Tier 1 capital after deductions | 9,436 | 8,861 | ||||||
| Other Tier 1 capital | 2,654 | 2,637 | ||||||
| Total Tier 1 capital after deductions | 12,090 | 11,498 | ||||||
| Tier 2 capital | 5,258 | 4,997 | ||||||
| Deductions from Tier 2 capital | (515 | ) | (508 | ) | ||||
| Total Tier 2 capital after deductions | 4,743 | 4,489 | ||||||
| Total capital resources | 16,833 | 15,987 | ||||||
Tier 1 includes profits for six months ended 30 June 2012 and audited profits for the year ended 31 December 2011 respectively after adjustment to comply with UK Financial Services Authority rules. Tier 1 deductions primarily relate to goodwill and expected losses. In addition, the Group has elected to deduct certain securitisation positions from capital rather than treat these exposures as a risk weighted asset. The expected losses deduction represents the difference between expected loss calculated in accordance with the Group’s Retail Internal Rating-Based (‘IRB’) and Advanced Internal Rating-Based (‘AIRB’) models, and the impairment loss allowances calculated in accordance with IFRS. The Group’s accounting policy for impairment loss allowances is set out in Note 1 of the Group’s 2011 Annual Report. Expected losses are calculated using risk parameters based on either through-the-cycle, or economic downturn estimates, and are subject to conservatism due to the imposition of regulatory floors. They are therefore currently higher than the impairment loss allowances under IFRS which only reflect losses incurred at the balance sheet date. Tier 2 deductions also represent expected losses and securitisation positions described above.
During the first half of 2012, Core Tier 1 capital increased by £575m to £9,436m (31 December 2011: £8,861m). This increase was largely due to profits attributable to shareholders of the Company for the period amounting to £550m, net of dividends declared of £57m. During the first half of 2012, Total Tier 2 capital increased by £254m to £4,743m (31 December 2011: £4,489m). This increase was largely due to the inclusion of general provisions on standardised portfolios of £250m (31 December 2011: £nil).
35. EVENTS AFTER THE BALANCE SHEET DATE
On 3 July 2012, Santander UK launched an offer to buy back certain debt capital instruments. Under current regulations these securities qualify as Total Capital but are excluded from Core Tier 1 Capital. Under the full Basel III basis they would be excluded from capital completely. The rate of take-up of this offer exceeded expectations and the scope of the offer was increased to meet demand. The exercise completed on 16 July. The net impact of the purchase and crystallisation of mark-to-market positions on associated derivatives is expected to increase Core Tier 1 Capital in the second half of 2012.
Shareholder Information
Risk Factors
An investment in Santander UK plc (the ‘Company’) and its subsidiaries (together, the ‘Group’) involves a number of risks, the material ones of which are set forth below.
The Group’s operating results, financial condition and prospects may be materially impacted by economic conditions in the UK
The Group’s business activities are concentrated in the UK and on the offering of mortgage and savings-related products and services. As a consequence, the Group’s operating results, financial condition and prospects are significantly affected by economic conditions in the UK generally, and by the UK property market in particular.
In 2008 and 2009, the UK property market suffered a significant correction as a consequence of housing demand being constrained by a combination of rising unemployment, subdued earnings growth, greater pressure on disposable income, a decline in the availability of mortgage finance and the continued effect of global market volatility. Although the UK economy began to grow again in 2009 after the recession that followed the financial crisis, the ongoing sovereign debt crisis throughout the eurozone, elevated unemployment rates and high inflation (which hit real average earnings growth and consequently consumer spending) led to slower growth in 2011 of 0.8%. GDP fell by 0.4% in the final quarter of 2011, 0.3% in the first quarter and 0.5% in the second quarter of 2012, which raised the prospect of a renewed economic downturn in the UK. The Bank of England has held the base rate at a record low of 0.5% since March 2009, and announced a further quantitative easing programme in October 2011 and extensions to this in February and July 2012 to support economic activity. Consumer price inflation peaked at 5.2% in September 2011, falling to 2.4% in June 2012.
Adverse changes in the credit quality of the Group’s borrowers and counterparties or a general deterioration in UK or global economic conditions could reduce the recoverability and value of the Group’s assets and require an increase in the Group’s level of provisions for bad and doubtful debts. Likewise, a significant reduction in the demand for the Group’s products and services could negatively impact Santander UK’s business and financial condition.UK economic conditions and uncertainties may have an adverse effect on the quality of the Group’s loan portfolio and may result in a rise in delinquency and default rates. The Group recorded impairment loss allowances on loans and advances to customers of £1,600m and £1,563m at 30 June 2012 and 31 December 2011, respectively. There can be no assurance that the Group will not have to increase its provisions for loan losses in the future as a result of increases in non-performing loans or for other reasons beyond its control. Any increases in the Group’s provisions for loan losses and write-offs/charge-offs could have a material adverse effect on the Group’s operating results, financial condition and prospects.
As in several other economies, the UK Government has taken measures to address the exceptionally high level of national debt, including tax increases and public spending cuts. Political involvement in the regulatory process and in the major financial institutions in which the UK Government has a direct financial interest is set to continue. UK Government demands for financial institutions to increase lending to support the economic recovery will increase competition for deposits, potentially narrowing margins.
Although both the Office for Budget Responsibility and the Bank of England expect stronger economic growth in 2013 than in 2012, credit quality could be adversely affected by a further increase in unemployment. This plus the combination of slow economic recovery, UK Government intervention and competition for deposits, together with any related significant reduction in the demand for the Group’s products and services, could have a material adverse effect on the Group’s operating results, financial condition and prospects.
The Group’s operating results, financial condition and prospects may be negatively affected by conditions in global financial markets
The extreme volatility and disruption in global capital and credit markets since 2008 has led to severe dislocation of financial markets around the world, an unprecedented reduction in available liquidity and increased credit risk premiums for many market participants. This has caused severe problems at many of the world’s largest commercial banks, investment banks and insurance companies, a number of which are the Group’s counterparties or customers in the ordinary course of business. These conditions have also resulted in a material reduction in the availability of financing, both for financial institutions and their customers, compelling many financial institutions to rely on central banks and governments to provide liquidity and, in some cases, additional capital during this period. Governments around the world have sought to provide this liquidity in order to stabilise financial markets and prevent the failure of financial institutions.
Although conditions have eased to some extent since 2009, the volatility of the capital and credit markets has continued and liquidity problems remain, exacerbated recently by fears concerning the financial health of a number of European governments. Greece and other eurozone economies came under increased pressure in 2011 which continues in 2012, with concerns focused on the sustainability of their sovereign debt. These continuing sovereign debt concerns and the related fiscal deterioration in eurozone economies may continue to accentuate the existing disruption in the capital and credit markets. The continuing market instability and reduction of available credit have contributed to lower consumer confidence, increased market volatility, increased funding costs, reduced business activity and, consequently, increasing commercial and consumer loan delinquencies, and market value declines on debt securities held by the Group, all of which could have a material adverse effect on the Group’s operating results, financial condition and prospects.
The Group may suffer adverse effects as a result of the ongoing economic and sovereign debt crisis in the eurozone
The financial health of a number of European governments was shaken by a sovereign debt crisis that escalated throughout 2011, contributing to volatility of the capital and credit markets. The sustainability of the sovereign debt of Greece and certain other eurozone economies remains uncertain.
The risk of contagion throughout and beyond the eurozone remains. A significant number of financial institutions throughout Europe have substantial exposures to sovereign debt issued by nations which are under considerable financial pressure. Should any of those nations default on their debt, or experience a significant widening of credit spreads, major financial institutions and banking systems throughout Europe could be destabilised, resulting in the further spread of the ongoing economic crisis. Although the Group conducts the majority of its business in the UK, it has some limited direct and indirect exposure to financial and economic conditions throughout the eurozone economies. For further description of the Group’s exposures to eurozone countries, eurozone banks and other financial institutions and corporates see ‘Balance Sheet Business Review – Country Risk Exposure’ on pages 28 to 32. In addition, general financial and economic conditions in the UK, which directly affect the Group’s operating results, financial condition and prospects, may deteriorate as a result of conditions in the eurozone.
While authorities throughout the European Union continue to work towards developing a political structure or economic plan to address the fiscal instability of certain eurozone nations, the ongoing economic crisis has increased the risk of a break-up of the eurozone. A break-up of the eurozone could have a dramatic impact on the whole financial sector, creating new challenges in sovereign and corporate lending and resulting in significant disruptions in financial activities at both the market and retail levels. This could materially and adversely affect the Group’s operating results, financial position and prospects.
The Group may suffer adverse effects should eurozone member states exit the euro or the euro be totally abandoned
Concerns that the eurozone sovereign debt crisis could worsen may lead to the reintroduction of national currencies in one or more eurozone countries or possibly the abandonment of the euro. The departure or risk of departure from the euro by one or more eurozone countries and/or the abandonment of the euro as a currency could have major negative effects on both existing contractual relations and the fulfilment of obligations by the Group and/or customers of the Group, which would have a significant negative impact on the activity, operating results and capital and financial position of the Group.
There is currently no established legal framework within the European treaties to facilitate a member state exiting from the euro; consequently, it is not possible to accurately predict the course of events and legal consequences that would ensue. This redenomination risk stems from this uncertainty, including how an exiting member state would deal with its existing euro-denominated assets and liabilities, the valuation of any newly-adopted currency against the euro and any aspects of the way in which the exit takes place, meaning it is not possible to predict what the total consequential loss might be to the Group. For further details see “Redenomination Risk” on page 36. The significant upheaval in the eurozone that might arise from any such member state exit, or the abandonment of the euro could materially and adversely affect the Group’s operating results, financial condition and prospects.
The Group’s risk management measures may not be successful
The management of risk is an integral part of all of the Group’s activities. Risk constitutes the Group’s exposure to uncertainty and the consequent variability of return. Specifically, risk equates to the adverse effect on profitability or financial condition arising from different sources of uncertainty including credit risk (retail, wholesale and corporate), market risk, operational risk, securitisation risk, non-traded market risk, concentration risk, liquidity and funding risk, reputational risk, strategic risk, pension obligation risk, residual value risk and regulatory risk. The Group seeks to monitor and manage its risk exposure through a variety of separate but complementary financial, credit, market, operational, compliance and legal reporting systems. For further description of our risk management policies see the Risk Management Report on pages 52 to 123. While the Group employs a broad and diversified set of risk monitoring and risk mitigation techniques, such techniques, and the judgements that accompany their application, cannot anticipate every unfavourable event or the specifics and timing of every outcome. Accordingly, the Group’s ability to successfully identify and balance risks and rewards, and to manage all material risks, is important. Failure to manage such risks appropriately could have a significant effect on the Group’s operating results, financial condition and prospects. For example, failure to manage the credit risk (retail) associated with mortgage lending could result in the Group making mortgage loans outside of appropriate risk parameters and potentially resulting in higher levels of default or delinquency on the Group’s mortgage loan assets.
The Group has a significant exposure to the UK real estate market
The residential mortgage loan portfolio is one of the Group’s principal assets, comprising 85% of its loan portfolio as of 30 June 2012. As a result, the Group is highly exposed to developments in the residential property market in the UK.
From 2002 to 2006, demand for housing and mortgage finance in the UK increased significantly driven by, among other things, sustained economic growth, declining unemployment rates, restrictions on new residential property building, demographic trends and the increasing prominence of London as an international financial centre. During 2007, the housing market began to adjust in the UK as a result of deteriorating affordability, slower real income growth and some reduction in credit availability.
From 2007, economic growth stalled, recession hit and unemployment rose in the UK and as a consequence housing demand decreased and credit availability reduced. Real estate prices declined and mortgage delinquencies increased. This adversely affected the credit performance of real estate-related exposures, in residential mortgages and also loans to the real estate sector by Corporate Banking. These property market conditions may continue to affect consumer confidence levels and cause further adverse movements in real estate markets. In turn this may cause adverse changes in repayment patterns, causing increases in delinquencies and default rates, which may impact the Group’s provision for credit losses and write-offs/charge-offs. Trends such as these could have a material adverse effect on the Group’s operating results, financial condition and prospects.
Risks concerning borrower credit quality are inherent in the Group’s business
Risks arising from changes in credit quality and the recoverability of loans and amounts due from borrowers and counterparties are inherent in a wide range of the Group’s businesses. Adverse changes in the credit quality of the Group’s borrowers and counterparties, as a result of a general deterioration in UK or global economic conditions, or arising from systemic risks in the financial systems, could reduce the recoverability and value of the Group’s assets and require an increase in the Group’s level of provisions for bad and doubtful debts.
The Group estimates and establishes reserves for credit risks and potential credit losses inherent in its credit exposure. This process, which is critical to its results and financial condition, requires difficult, subjective and complex judgements, including forecasts of how these economic conditions might impair the ability of its borrowers to repay their loans. As is the case with any such assessments, the Group may fail to estimate accurately the impact of factors that it identifies. Any such failure may have a material adverse impact on the Group’s operating results, financial condition and prospects.
The soundness of other financial institutions could materially and adversely affect the Group’s business
The Group’s ability to engage in routine funding transactions could be adversely affected by the actions and commercial soundness, or perceived commercial soundness, of other financial institutions. Financial services institutions are interrelated as a result of trading, clearing, counterparty or other relationships. The Group has exposure to many different industries and counterparties, and routinely executes transactions with counterparties in the financial industry, including brokers and dealers, commercial banks, investment banks, mutual funds and other institutional clients. Defaults by or even rumours or questions about one or more financial services institutions, or the financial services industry generally, can lead to market-wide liquidity problems and could result in losses for the Group or other institutions as well as increased funding costs. Many transactions expose the Group to credit risk in the event of default of the Group’s counterparty or client. In addition, the Group’s credit risk may be exacerbated when the collateral held by the Group cannot be realised or is liquidated at prices not sufficient to recover the full amount of the loan or derivative exposure due to the Group. There is no assurance that any such losses would not materially and adversely affect the Group’s operating results, financial condition and prospects.
Risks associated with liquidity and funding are inherent in the Group’s business
Liquidity risk is the risk that the Group, although solvent, either does not have available sufficient financial resources to enable it to meet its obligations as they fall due or can secure them only at excessive cost. This risk is inherent in any retail and commercial banking business and can be heightened by a number of enterprise-specific factors, including over-reliance on a particular source of funding, changes in credit ratings or market-wide phenomena such as market dislocation. While the Group has implemented liquidity management processes to seek to mitigate and control these risks, unforeseen systemic market factors in particular make it difficult to eliminate completely these risks. Adverse and continued constraints in the supply of liquidity, including inter-bank lending, has affected and may materially and adversely affect the cost of funding the Group’s business, and extreme liquidity constraints may affect the Group’s current operations as well as limit growth possibilities. Such events may also have a material adverse effect on the market value and liquidity of bonds issued by the Group in the secondary markets. Global investor confidence also remains low and other forms of wholesale funding remain relatively scarce.
Continued or worsening disruption and volatility in the global financial markets could have a material adverse effect on the Group’s ability to access capital and liquidity on financial terms acceptable to it.
The Group’s cost of obtaining funding is directly related to prevailing market interest rates and to its credit spreads. Credit spreads are the amount in excess of the interest rate of Government benchmark securities, of the same maturity that the Group needs to pay to its funding providers. Increases in interest rates and its credit spreads can significantly increase the cost of the Group’s funding. Changes in the Group’s credit spreads are market-driven, and may be influenced by market perceptions of its creditworthiness. Changes to interest rates and its credit spreads occur continuously and may be unpredictable and highly volatile.
If wholesale markets financing ceases to become available, or becomes excessively expensive, the Group may be forced to raise the rates it pays on deposits, with a view to attracting more customers, and/or to sell assets, potentially at depressed prices. While central banks around the world have made coordinated efforts to increase liquidity in the financial markets, by taking measures such as increasing the amounts they lend directly to financial institutions, lowering interest rates and significantly increasing temporary reciprocal currency arrangements (or swap lines), it is not known how long central bank schemes will continue or on what terms. The Bank of England’s Special Liquidity Scheme was not extended when it expired at the end of January 2012, although the Bank of England has since announced the Extended Collateral Term Repo facility (‘ECTR’) and Funding for Lending schemes with the aim to increase liquidity in the market. As yet it is not clear how banks might participate in these schemes and their effect on the market. There are no indications from the Monetary Policy Committee that policy interest rates are likely to be raised in the near future and financial markets do not expect rates to rise in 2012. If the Bank of England raises interest rates this would increase the cost of the Group’s funding. The persistence or worsening of these adverse market conditions, and the lack of availability of such central bank schemes or an increase in base interest rates, could have a material adverse effect on the Group’s ability to access liquidity and cost of funding (whether directly or indirectly).
The Group relies, and will continue to rely, primarily on commercial deposits to fund lending activities. The ongoing availability of this type of funding is sensitive to a variety of factors outside the Group’s control, such as general economic conditions and the confidence of commercial depositors in the economy, in general, and the financial services industry in particular, and the availability and extent of deposit guarantees, as well as competition between banks for deposits. Any of these factors could significantly increase the amount of commercial deposit withdrawals in a short period of time, thereby reducing the Group’s ability to access commercial deposit funding on appropriate terms, or at all, in the future. If these circumstances were to arise, this could have a material adverse effect on the Group’s operating results, financial condition and prospects.
For additional information about the Group’s liquidity position and other liquidity matters, including credit ratings and outlooks and the policies and procedures the Group uses to manage its liquidity risks, see ‘Balance Sheet Business Review - Capital Management and Resources’ on pages 40 to 44, ‘Balance Sheet Business Review - Funding and Liquidity’ on pages 45 to 49 and ‘Risk Management Report – Funding and Liquidity Risk’ on pages 110 to 114.
The Group is subject to regulatory capital and liquidity requirements that could limit its operations, and changes to these requirements may further limit and adversely affect its operating results, financial condition and prospects
As a bank the Company is subject to capital adequacy requirements adopted by the UK Financial Services Authority (the ‘FSA’) which provide for a minimum ratio of total capital to risk-adjusted assets both on a consolidated basis and on a solo-consolidated basis (the basis used by the FSA solely for the purpose of the calculation of capital resources and capital resources requirements, which comprises the Company and certain subsidiaries), expressed as a percentage. Any failure by the Group to maintain its ratios may result in administrative actions or sanctions which may affect the Group’s ability to fulfil its obligations.
In response to the recent financial crisis, the FSA has imposed, and may continue to impose, more stringent capital adequacy requirements across the UK banking industry, including increasing the minimum regulatory capital requirements imposed on the Group. For instance, the FSA has adopted a supervisory approach in relation to certain UK banks, including the Company, under which those banks are expected to maintain Tier 1 Capital in excess of the minimum levels required by the existing rules and guidance of the FSA. The FSA is currently considering, and in the process of consulting on, changes to the eligibility criteria for Tier 1 Capital as well as provisions that may result in banks being required to increase the level of regulatory capital held in respect of trading book risks. This consultation is taking place ahead of the UK implementation of the recent amendments and proposed amendments to the EU-wide capital adequacy requirements (as set out in the amended Directive 2006/48/EC and Directive 2006/49/EC, collectively referred to as the ‘Capital Requirements Directive’).
On 5 October 2009, the FSA published its new liquidity rules which significantly broadened the scope of the existing liquidity regime. These are designed to enhance regulated firms’ liquidity risk management practices. As part of these reforms, the FSA has implemented requirements for financial institutions to hold prescribed levels of specified liquid assets and have in place other sources of liquidity to address the institution-specific and market-wide liquidity risks that institutions may face in short-term and prolonged stress scenarios.
On 16 December 2010 and 13 January 2011, the Basel Committee on Banking Supervision issued its final guidance on a number of fundamental reforms to the regulatory capital framework intended to strengthen minimum capital requirements (referred to as Basel III). The changes in Basel III include, among other things, phasing out Innovative Tier 1 Capital instruments with incentives to redeem and implementing a leverage ratio on institutions in addition to current risk-based regulatory capital requirements. As essentially a retail bank lending mostly on secured residential mortgages, the Company’s current leverage ratio is high, reflecting the low risk-weighting of its assets. Basel III also requires institutions to build counter-cyclical capital buffers that may be drawn upon in stress scenarios, as well as increasing the amount and quality of Tier 1 Capital that institutions are required to hold. The changes brought about by Basel III will be phased in gradually between January 2013 and January 2019. The most recent Basel capital rules have raised the minimum level of tangible common equity capital from 2 to 7 per cent of risk-weighted assets, however it is not yet known whether the FSA will require UK banks to hold a further buffer above this level.
In the UK and world-wide a range of proposals for future legislative and regulatory changes have been produced which could force the Group to comply with certain operational restrictions or take steps to raise further capital, or could increase the Group’s expenses, or otherwise adversely affect its operating results, financial condition and prospects. These changes have, among other things included:
| > | the introduction of recovery and resolution planning requirements (popularly known as ‘living wills’) for banks and other financial institutions as contingency planning for the failure of a financial institution that may affect the stability of the financial system; |
| > | implementation of the Financial Services Act 2010, which enhances the FSA’s disciplinary and enforcement powers; |
| > | the introduction of more regular and detailed reporting obligations; and |
| > | a proposal in the ICB’s recommendations to require large UK retail banks to hold a minimum Core Tier 1 to risk-weighted assets ratio of at least 10 per cent., which is, broadly, 3 per cent. higher than the minimum capital levels required under Basel III. |
These measures could have a material adverse effect on the Group’s operating results, financial condition and prospects. There is a risk that changes to the UK capital adequacy regime (including any introduction of a minimum leverage ratio) may result in increased minimum capital requirements, which could reduce available capital and thereby adversely affect the Group’s profitability and ability to pay dividends, continue organic growth (including increased lending), or pursue acquisitions or other strategic opportunities (unless the Group were to restructure its balance sheet in order to reduce the capital charges incurred pursuant to the FSA’s rules in relation to the assets held, or alternatively raise additional capital but at increased cost and subject to prevailing market conditions). In addition, changes to the eligibility criteria for Tier 1 Capital may affect the Group’s ability to raise Tier 1 Capital or the eligibility of existing Tier 1 Capital resources.
There is also a risk that implementing and maintaining enhanced liquidity risk management systems may incur significant costs and more stringent requirements to hold liquid assets may materially affect the Group’s lending business as more funds may be required to acquire or maintain a liquidity buffer, thereby reducing future profitability.
Any reduction in the credit rating assigned to the Group, any member of the Group or to any Group debt securities would be likely to increase the Group’s cost of funding, require additional collateral to be placed and adversely affect its interest margins and liquidity position
Credit ratings affect the cost and other terms upon which the Group is able to obtain funding. Rating agencies regularly evaluate the Group and certain members of the Group, as well as their respective debt securities. Their ratings are based on a number of factors, including the perceived financial strength of the Group or of the relevant member, sovereign perceived risk, as well as conditions affecting the financial services industry generally. There can be no assurance that the rating agencies will maintain the Group’s or the relevant member’s current ratings or outlook, or with regard to those rating agencies who may have a negative outlook on the Group, there can be no assurances that such agencies will revise such outlooks upwards, especially in light of the difficulties in the financial services industry and the financial markets.
Any reduction in those ratings and outlook would be likely to increase the cost of the Group’s funding, limit access to capital markets, and require additional collateral to be placed, and consequently, adversely affect the Group’s interest margins and/or affect its liquidity position. For example, a ratings downgrade could adversely affect the Group’s ability to sell or market certain of its products, such as subordinated securities and engage in certain longer-term and derivatives transactions. It could also adversely affect the Group’s ability to retain customers or attract new investors, particularly those who look for a minimum rating threshold in order to invest. Any of these could, in turn, reduce the Group’s liquidity and have an adverse effect on the Group’s operating results, financial condition and prospects.
For example, at 30 June 2012, a hypothetical simultaneous one or two notch downgrade of the Group’s long-term debt rating from all major rating agencies, triggering a short-term ratings downgrade, could have resulted in the following outflows of cash and liquidity which are more than covered by the Group’s total liquid assets: an outflow of £3.2bn of cash, £6.5bn of collateral posting associated with secured funding and £1.2bn of collateral posting associated with derivative contracts for a one notch downgrade and an additional outflow of £nil of cash, £1.7bn of collateral posting associated with secured funding and £nil of collateral posting associated with derivative contracts for a two notch downgrade. Actual outflows could be higher or lower than this hypothetical example, depending upon certain factors including which rating agency had downgraded the Company’s credit rating, any management or restructuring actions that could be taken to reduce cash outflows and the potential liquidity impact from loss of unsecured funding (such as from money market funds) or loss of secured funding capacity. However, unsecured and secured funding stresses are included in the Group’s stress testing scenarios and a portion of Group’s total liquid assets is held against these risks.
Fluctuations in interest rates, bond and equity prices and other market factors are inherent in the Group’s business
The Group faces significant interest rate and bond and equity price risks. Fluctuations in interest rates could adversely affect the Group’s operations and financial condition in a number of different ways. An increase in interest rates generally may decrease the relative value of the Group’s fixed rate loans and raise the Group’s funding costs, although such an increase would be offset to some extent by an increase in income from variable rate loans. Such an increase could also generally decrease the relative value of fixed rate debt securities in the Group’s securities portfolio. In addition, an increase in interest rates may reduce overall demand for new loans and increase the risk of customer default, while general volatility in interest rates may result in a gap between the Group’s interest rate-sensitive assets and liabilities. Interest rates are sensitive to many factors beyond the Group’s control, including the policies of central banks and, in particular, the Bank of England, as well as domestic and international economic conditions and political factors. It remains difficult to predict any changes in economic or financial market conditions.
Continued declines in housing markets over the past four years have adversely affected the credit performance of real estate-related loans and resulted in write-downs of asset values by many financial institutions (including the Group). These write-downs, initially of asset-backed securities but spreading to other securities and loans, have caused many financial institutions to seek additional capital, to reduce or eliminate dividends, to merge with larger and stronger institutions and, in some cases, to fail. Reflecting concern about the stability of the financial markets generally and the strength of counterparties, many lenders and institutional investors have reduced funding to borrowers, including to other financial institutions. As a result of these market forces, volatility in interest rates and basis spreads has increased, which has increased the Group’s borrowing costs.
Any further increase in wholesale funding costs or deposit rates could precipitate a re-pricing of loans to customers, which could result in a reduction of volumes, and could also have an adverse effect on the Group’s interest margins. While the Group would also expect to increase lending rates, there can be no assurance that it would be able to offset in full or at all its funding costs and, in addition, may face competitive pressure to pass on interest rate rises to retain existing and attract new customer deposits.
The Group also sponsors a number of defined benefit staff pension schemes, and its obligations to those schemes may increase depending on the performance of financial markets. Although the Group is taking measures to mitigate and control the effects of these conditions, there can be no assurances that such controls will insulate the Group from deteriorating market conditions.
Currency fluctuations may adversely affect the Group’s operating results, financial condition and prospects
The Group is exposed to risk from fluctuations in exchange rates for currencies, particularly the US dollar and the euro. In particular, a substantial portion of the Group’s outstanding debt is denominated in currencies other than the British pound sterling, which is the primary currency of the Group’s financial reporting. The Group’s capital is also stated in pound sterling and it does not fully hedge its capital position against changes in currency exchange rates. Although the Group seeks to hedge most of its currency risk through hedging and purchase of cross-currency swaps, these hedges do not eliminate currency risk and the Group can make no assurance that it will not suffer adverse financial consequences as a result of currency fluctuations. Significant exchange rate volatility and the depreciation of the pound sterling in particular could have an adverse impact on the Group’s results of operations and its ability to meet its US dollar and euro-denominated obligations, and could have a material adverse effect on the Group’s operating results, financial condition and prospects.
Market conditions have, and could result, in material changes to the estimated fair values of financial assets of the Group. Negative fair value adjustments could have a material adverse effect on the Group’s operating results, financial condition and prospects
In the past four years, financial markets have been subject to significant stress resulting in steep falls in perceived or actual financial asset values, particularly due to the recent volatility in global financial markets and the resulting widening of credit spreads. The Group has material exposures to securities and other investments that are recorded at fair value and are therefore exposed to potential negative fair value adjustments. Asset valuations in future periods, reflecting then prevailing market conditions, may result in negative changes in the fair values of the Group’s financial assets and these may also translate into increased impairments. In addition, the value ultimately realised by the Group on disposal may be lower than the current fair value. Any of these factors could require the Group to record negative fair value adjustments, which may have a material adverse effect on its operating results, financial condition or prospects.
In addition, to the extent that fair values are determined using financial valuation models, such values may be inaccurate or subject to change, as the data used by such models may not be available or may become unavailable due to changes in market conditions, particularly for illiquid assets, and particularly in times of economic instability. In such circumstances, the Group’s valuation methodologies require it to make assumptions, judgements and estimates in order to establish fair value, and reliable assumptions are difficult to make and are inherently uncertain and valuation models are complex, making them inherently imperfect predictors of actual results. Any consequential impairments or write-downs could have a material adverse effect on the Group’s operating results, financial condition and prospects.
A core strategy of the Company is to grow the Group’s operations and it may not be able to manage such growth effectively, which could have an adverse impact on its profitability
The Group allocates management and planning resources to develop strategic plans for organic growth, and to identify possible acquisitions and disposals and areas for restructuring the Group’s businesses. The Group cannot provide assurance that it will, in all cases, be able to manage its growth effectively or deliver its strategic growth objectives. Challenges that may result from the strategic growth decisions include the Group’s ability to:
| > | manage efficiently the operations and employees of expanding businesses; |
| > | maintain or grow its existing customer base; |
| > | assess the value, strengths and weaknesses of investment or acquisition candidates; |
| > | finance strategic investments or acquisitions; |
| > | fully integrate strategic investments, or newly-established entities or acquisitions in line with its strategy; |
| > | align its current information technology systems adequately with those of an enlarged Group; |
| > | apply its risk management policy effectively to an enlarged Group; and |
| > | manage a growing number of entities without over-committing management or losing key personnel. |
Any failure to manage growth effectively, including relating to any or all of the above challenges associated with the Group’s growth plans, could have a material adverse effect on the Group’s operating results, financial condition and prospects.
The Company may incur unanticipated losses related to its business combinations
The Company has made several business acquisitions in recent years, including the acquisition of Alliance & Leicester plc in January 2009 and the retail deposits, branch network and related employees of Bradford & Bingley in September 2008. In October and November 2010, the Company also acquired the following Banco Santander, S.A. entities:
| > | Santander Cards Limited, Santander Cards UK Limited (and its subsidiaries) and Santander Cards Ireland Limited; |
| > | Santander Consumer (UK) plc (of which the Company already held 49.9%); and |
| > | Santander PB UK (Holdings) Limited (of which the Company already held 51%) and its subsidiaries. |
In addition, in August 2010, the Company reached an agreement to acquire (subject to certain conditions) bank branches and business banking centres and associated assets and liabilities from the Royal Bank of Scotland Group (the ‘RBS Acquisition’).
The Company’s assessment of the businesses acquired in October and November 2010 and to be acquired under the RBS Acquisition is based on certain assumptions with respect to operations, profitability, asset quality and other matters that may prove to be incorrect. In the case of the RBS Acquisition, this assessment was also based on limited information, as there were no standalone audited financial statements in respect of the relevant assets. There can be no assurance that the Group will not be exposed to currently unknown liabilities resulting from these business combinations. Any unanticipated losses or liabilities could have a material adverse effect on the Group’s operating results, financial condition and prospects.
The Group may fail to realise the anticipated benefits of the Company’s recent or proposed business combinations
The success of the Group’s business combinations will depend, in part, on the Group’s ability to realise the anticipated benefits from combining the businesses of Alliance & Leicester, Bradford & Bingley, those acquired in October and November 2010 and the assets to be acquired under the RBS Acquisition, with the Group’s business. It is possible that the integration process could take longer or be more costly than anticipated. The eventual integration of the assets to be acquired under the RBS Acquisition is dependent upon, among other things, the successful transition to Partenon (the proprietary IT platform used by the Banco Santander group). Any delay could result in additional costs to the Group and mean that the Group does not receive the full benefit anticipated from such acquisition. The Group’s efforts to integrate these businesses are also likely to divert management attention and resources. If the Group takes longer than anticipated or is not able to integrate these businesses, the anticipated benefits of the Group’s business combinations may not be realised fully or at all. Any failure to realise all or any of the anticipated benefits of these business combinations could have a material adverse effect on the Group’s operating results, financial condition and prospects.
Goodwill impairments may be required in relation to certain of the Company’s acquired businesses
The Company has made business acquisitions in recent years and will acquire certain assets under the RBS Acquisition. It is possible that the goodwill which has been attributed, or will be attributed, to these businesses may have to be written-down if the Company’s valuation assumptions are required to be reassessed as a result of any deterioration in their underlying profitability, asset quality and other relevant matters. In 2011 there was a £60m impairment related to Cater Allen Private Bank as a result of a reassessment of the value of certain parts of the business in light of recent market conditions and regulatory developments Impairment testing in respect of goodwill is performed annually, more frequently if there are impairment indicators present, and comprises a comparison of the carrying amount of the cash-generating unit with its recoverable amount. There can be no assurances that the Company will not have to write down the value attributed to goodwill in the future, which would adversely affect the Group’s results and net assets.
The Group’s business is conducted in a highly competitive environment
The market for UK financial services is highly competitive, and the recent financial crisis has reshaped the banking landscape in the UK, reinforcing both the importance of a retail deposit funding base and strong capitalisation. The Group expects such competition to intensify in response to consumer demand, technological changes, the impact of consolidation, regulatory actions and other factors. If financial markets remain unstable, financial institution consolidation may continue (whether as a result of the UK Government taking ownership and control over other financial institutions in the UK or otherwise). Financial institution consolidation could also result from the UK Government disposing of its stake in those financial institutions it currently controls. Such consolidation could adversely affect the Group’s operating results, financial condition and prospects. The potential increase in competition could result in declining lending margins or competition for savings driving up funding costs that cannot be recovered from borrowers, all of which could adversely affect the Group’s operating results, financial condition and prospects.
In addition, if the Group’s customer service levels were perceived by the market to be materially below those of its UK competitor financial institutions, the Group could lose existing and potential business. If the Group is not successful in retaining and strengthening customer relationships, it may lose market share, incur losses on some or all of its activities or fail to attract new deposits or retain existing deposits, which could have a material adverse effect on its operating results, financial condition and prospects.
Operational risks are inherent in the Group’s business
Operational Risk losses can result from many actions, including fraud, criminal acts, errors by employees, employee misconduct, unauthorised breaches of authorities, failure to document transactions properly or to obtain proper authorisation, failure to comply with regulatory requirements and conduct of business rules, failure or breakdown of accounting, data processing and other record keeping systems, natural disasters, or failure or breakdown of external systems, including those of the Group’s suppliers or counterparties. Such operational losses could have a material adverse effect on the Group’s operating results, financial condition and prospects.
The Group relies on recruiting, retaining and developing appropriate senior management and skilled personnel
The Group’s continued success depends in part on the continued service of key members of its management team. The ability to continue to attract, train, motivate and retain highly qualified and talented professionals is a key element of the Company’s strategy. The successful implementation of the Company’s growth strategy depends on the availability of skilled management, both at its head office and at each of its business units. If the Company or one of its business units or other functions fails to staff their operations appropriately or loses one or more of its key senior executives, and fails to replace them in a satisfactory and timely manner, its operating results, financial condition and prospects, including control and operational risks, may be adversely affected. Likewise, if the Company fails to attract and appropriately train, motivate and retain qualified and talented professionals, its business may be affected.
Reputational risk could cause harm to the Group and its business prospects
The Group’s ability to attract and retain customers and conduct business transactions with its counterparties could be adversely affected to the extent that its reputation, the reputation of Banco Santander, S.A. (as the majority shareholder in the Company), or the reputation of affiliates operating under the “Santander” brand or any of its other brands is damaged. Failure to address, or appearing to fail to address, various issues that could give rise to reputational risk could cause harm to the Group and its business prospects. Reputational issues include, but are not limited to: appropriately addressing potential conflicts of interest; legal and regulatory requirements; ethical issues; adequacy of anti-money laundering processes; privacy issues; customer service issues; record-keeping; sales and trading practices; proper identification of the legal, reputational, credit, liquidity and market risks inherent in products offered; and general company performance (including the quality of the Company’s customer services). A failure to address these issues appropriately could make customers unwilling to do business with the Group, which could adversely affect its operating results, financial condition and prospects.
Legislative, regulatory and governmental oversight and current banking reform initiatives and requirements could have a material adverse effect on the Group
The Group is subject to extensive financial services laws, regulations, administrative actions and policies in each location in which the Group operates (including in the US and, indirectly, in Spain as a result of being part of the Banco Santander, S.A. group). During the recent market turmoil, there have been unprecedented levels of government and regulatory intervention and scrutiny, and changes to the regulations governing financial institutions and the conduct of business. In addition, in light of the financial crisis, regulatory and governmental authorities are considering, or may consider, further enhanced or new legal or regulatory requirements intended to prevent future crises or otherwise assure the stability of institutions under their supervision. It is anticipated that this intensive approach to supervision will be continued by the successor regulatory authorities to the FSA.
Recent proposals and measures taken by governmental, tax and regulatory authorities and future changes in supervision and regulation, in particular in the UK, which are beyond the Group’s control, could materially affect the Group’s business, value of assets and the Group’s operations, and result in significant increases in operational costs. Products and services offered by the Group could also be affected. The FSA is taking a more intrusive approach in respect of financial products and this power will be further enhanced with the introduction of the successor conduct regulatory authority to the FSA. Changes in UK legislation and regulation to address the stability of the financial sector may also affect the competitive position of the UK banks, including the Company, particularly if such changes are implemented before international consensus is reached on key issues affecting the industry, for instance in relation to the FSA’s regulations on liquidity risk management and also the UK Government’s introduction of the bank levy. Although the Group works closely with its regulators and continually monitors the situation, future changes in law, regulation, fiscal or other policies can be unpredictable and are beyond the control of the Group. No assurance can be given generally that laws or regulations will be adopted, enforced or interpreted in a manner that will not have an adverse effect on the Group’s business.
On 16 June 2010, the Chancellor of the Exchequer announced the creation of the Independent Commission on Banking (the ‘ICB’), chaired by Sir John Vickers. The ICB was asked to consider structural and related non-structural reforms to the UK banking sector to promote financial stability and competition, and to make recommendations to the Government by the end of September 2011. The ICB gave its recommendations on 12 September 2011 and proposed: (i) implementation of a retail ring fence, (ii) increased capital requirements and (iii) improvement of competition. The Government published its response to the ICB’s recommendations on 19 December 2011, broadly endorsing them. A White Paper was published on 14 June 2012 detailing how the Government intend to implement the recommendations of the ICB. The Government expects the legislation to be in place by 2015 and to take effect by 2019. Implementation of the proposals may require the Group to make changes to its structure and business.
The resolution of a number of issues, including regulatory investigations and reviews and court cases, affecting the UK financial services industry could have an adverse effect on the Group’s operating results, financial condition and prospects, or its relations with its customers and potential customers.
Tax and compliance changes (including the UK bank levy and FATCA) could have a material adverse effect on the Group’s business
HM Treasury introduced an annual bank levy via legislation in the Finance Act 2011. The UK bank levy is imposed on (amongst other entities) UK banking groups and subsidiaries, and therefore applies to the Group. The amount of the bank levy is based on a bank’s total liabilities, excluding (amongst other things) Tier 1 Capital, insured retail deposits and repos secured on sovereign debt. A reduced rate is applied to longer-term liabilities.
HM Treasury has emphasised that the bank levy will not be regarded as insurance against future bank failures and that it is exploring the costs and benefits of imposing a financial activities tax on the profits and remuneration of banking groups. 2011 receipts from the bank levy are expected to fall short of the £2.5 billion target, accordingly, periodic increases have been announced by HM Treasury to these bank levy rates from 1 January 2012.
The US published draft regulations on the proposed Foreign Account Tax Compliance Act (‘FATCA’) on 8 February 2012. FATCA may require members of the Group to undertake significant compliance activity and failure to comply may result in payments to the Group from the US being subject to a withholding tax. The exact scope of FATCA is still developing so its full effect is still uncertain.
The UK bank levy, FATCA and possible future changes in the taxation of banking groups in the European Union, including financial transaction taxes or similar levies, could have a material adverse effect on the Group’s operating results, financial condition and prospects, and the competitive position of UK banks, including the Company.
The Group is exposed to various forms of legal and regulatory risk which could have a material adverse effect on its operating results, financial condition and prospects or relations with its customers
The Group is exposed to many forms of legal and regulatory risk, which may arise in a number of ways. Primarily:
| > | certain aspects of the Group’s business may be determined by the Bank of England, the FSA, HM Treasury, the Financial Ombudsman Service (‘FOS’) or the courts as not being conducted in accordance with applicable laws or regulations, or, in the case of the FOS, with what is fair and reasonable in the FOS’s opinion; |
| > | the alleged misselling of financial products, resulting in disciplinary action or requirements to amend sales processes, withdraw products, or provide restitution to affected customers, all of which may require additional provisions. |
| > | the Group holds accounts for entities that might be or are subject to interest from various regulators, including the UK’s Serious Fraud Office, those in the US and others. The Group is not aware of any current investigation into the Group as a result of any such enquiries, but cannot exclude the possibility of the Group’s conduct being reviewed as part of any such investigations; and |
| > | the Group may be liable for damages to third parties harmed by the conduct of its business. |
The FSA carries out regular and frequent reviews of the conduct of business by financial institutions including banks. An adverse finding by the regulator could result in the need for extensive changes in systems and controls, business policies, and practices coupled with customer redress, fines and reputational damage. For a discussion of the Group’s approach to its provision for payment protection insurance complaints in connection with the related FSA policy statement and April 2011 High Court ruling see “Potential intervention by the UK Financial Services Authority (or an overseas regulator) may occur, particularly in response to customer complaints” on page 196.
In addition, the Group faces both financial and reputational risk where legal or regulatory proceedings, or the Financial Ombudsman Service, or other complaints are brought against it in the UK High Court or elsewhere, or in jurisdictions outside the UK, including other European countries and the United States.
Failure to manage these risks adequately could have a material adverse effect on the Group’s reputation, its operating results, financial condition and prospects.
The structure of the financial regulatory authorities in the UK and the UK regulatory framework that applies to members of the Group is the subject of reform and reorganisation
The UK Government announced proposals in June 2010 to reform the institutional framework for UK financial regulation. Specifically, the UK Government intends to replace the FSA with two new successor bodies.
In July 2010 and February 2011, HM Treasury published consultations on proposals to replace the FSA with a new Prudential Regulation Authority (the ‘PRA’), which will be responsible for micro-prudential regulation of financial institutions that manage significant risks on their balance sheets, and a new Financial Conduct Authority (the ‘FCA’) which will be responsible for regulation of conduct of business. HM Treasury proposes, amongst other things, that the FCA will have product intervention powers, and that cooperation will exist between the FCA and the FOS, particularly where issues identified potentially have wider implications. Draft guidance has also been published on how the FCA and PRA will interact.
In June 2011 HM Treasury published a further consultation document, including a draft Bill, which reiterated the proposal to replace the FSA with the PRA and the FCA and suggested that the regulatory approach under the new regime will be more intrusive than the existing regime and will challenge business models and governance culture in particular. HM Treasury intends that the Bill will become law by the end of 2012, with the new regime intended to come into effect in 2013. To prepare for this change, the FSA has adopted a ‘twin peaks’ model internally and now has two supervisors; one focusing on prudential matters and the other on conduct.
Substantial reorganisation of the regulatory framework could cause administrative and operational disruption for the regulatory authorities concerned. This disruption could impact on the resources which the FSA or the successor authorities are able to devote to the supervision of regulated financial services firms, the nature of their approach to supervision and accordingly, the ability of regulated financial sector firms (including members of the Group) to deal effectively with their supervisors and to anticipate and respond appropriately to developments in regulatory policy.
It is anticipated that future changes in the nature of, or policies for, prudential and conduct of business supervision, as performed by the successor authorities to the FSA, will differ from the current approach taken by the FSA and that this could lead to a period of some uncertainty for members of the Group. The Financial Services Bill, which has been put before Parliament, not only details proposals for the creation of the FCA and PRA but also contains provisions enabling consumer credit regulation to be transferred from the OFT to the FCA. This decision will be subject to further consultation. Should this change occur, its introduction will bring about another reform to the institutional framework.
No assurance can be given that further changes will not be made to the regulatory regime in the UK generally, the Group’s particular business sectors in the market or specifically in relation to the Grssoup. Any or all of these factors could have a material adverse effect on the conduct of the business of the Group and, therefore, also on its strategy and profitability, and its ability to respond to and satisfy the supervisory requirements of the relevant UK regulatory authorities.
Various reforms to the mortgage lending market have been proposed which could require significant implementation costs or changes to the business strategy of the Group
In March 2009, the Turner Review, “A regulatory response to the global banking crisis”, was published and set out a detailed analysis of how the global financial crisis began along with a number of recommendations for future reforms and proposals for consultation. In the Turner Review, it was announced that the FSA would publish a discussion paper considering the possibility of a move towards the regulation of mortgage products (in addition to the product providers) and other options for reform of the mortgage market. This discussion paper (Discussion Paper 09/3) was published in October 2009 and launched the FSA’s Mortgage Market Review (“MMR”). The review involved a consultation concerning various potential reforms to the regulatory framework applicable to mortgage lenders and mortgage intermediaries, including mortgage firms’ conduct of business, product distribution and advice, and their handling of arrears and repossessions.
Separately, in January 2011, HM Treasury announced a package of measures with the aim of enhancing consumer protection in the mortgage market. The measures provide for the transfer of the regulation of new and existing second charge residential mortgages from the OFT to the FSA, and provide for consumer protection when a mortgage book is sold by a regulated mortgage lender to an unregulated firm.
On 19 December 2011, the FSA issued its latest MMR consultation containing proposals for a change in the rules relating to the UK mortgage market. Key changes will require lenders to (i) verify borrowers income; (ii) check that interest-only mortgages can be repaid; and (iii) make sure that borrowers can pay for their mortgage after retirement. The consultation closed on 30 March 2012 and the FSA hopes to make a final decision on the definitive form of rules by the end of Summer 2012, with implementation due in 2013. The ultimate impact of such measures on the Group is uncertain and no assurance can be given that such changes and any further reforms considered as part of the MMR will not adversely affect the Group and its business and operations. Further, it is possible that such reforms, if adopted, could lead to a period of change for the Company, particularly as regards changes that may be required to the operational strategy and capital management of the Company, and the supervisory approach taken by the FSA in relation to second charge mortgages, a portfolio of which the Group acquired as a result of its acquisition of Alliance & Leicester plc and any second charge mortgages which may be acquired under the RBS Acquisition.
As a consequence of such changes and any associated costs that may arise, it is possible that there could be a material adverse effect on the operating results, financial condition and prospects of the Group.
Potential intervention by the UK Financial Services Authority (or an overseas regulator) may occur, particularly in response to customer complaints
Customers of financial services institutions, including customers of the Group, may seek redress if they consider that they have suffered loss as a result of the misselling of a particular product, or through incorrect application of the terms and conditions of a particular product. Given the inherent unpredictability of litigation and the evolution of judgements by the FOS, it is possible that an adverse outcome in some matters could have a material adverse effect on the operating results, financial condition and prospects of the Group arising from any penalties imposed or compensation awarded, together with the costs of defending such an action.
The Financial Services Act 2010 has provided a new power for the FSA which enables the FSA to require authorised firms, including members of the Group, to establish a consumer redress scheme if it considers that consumers have suffered loss or damage as a consequence of a widespread or regular regulatory failing, including misselling.
In recent years there have been several industry-wide issues in which the FSA has intervened directly. One such issue is the misselling of payment protection insurance (‘PPI’), about which, in August 2010, the FSA published Policy Statement 10/12 entitled “The assessment and redress of Payment Protection Insurance complaints”. This policy statement contains rules from the FSA which alter the basis on which the FSA regulated firms (including the Company and certain members of the Group) must consider and deal with complaints in relation to the sale of PPI and may potentially increase the amount of compensation payable to customers whose complaints are upheld. In October 2010 the British Bankers’ Association (the ‘BBA’) applied for judicial review of these new rules and on 20 April 2011, the High Court rejected the BBA’s legal challenge and upheld the FSA’s policy statement about misselling of PPI. On 9 May 2011, the BBA announced its decision not to appeal against the High Court’s PPI judgment. The High Court judgment on the misselling of PPI resulted in very significant provisions for customer redress being made by several UK financial services providers. The Company did not participate in the UK High Court case, and has taken a prudent approach in consistently settling claims over the last two years as they have arisen.
In light of the High Court ruling in April 2011, the BBA’s decision not to appeal it and the consequent increase in claims levels the Group performed a detailed review of the provision requirement. As a result, the Company revised its provision for PPI complaint liabilities to reflect the new information. The overall effect of the above was a substantial increase in the provision requirement for 2011.
The ultimate financial impact on the Group of the claims arising from PPI complaints is uncertain and will depend on a number of factors, including the implementation of the FSA’s Policy Statement, the rate at which new complaints arise, the content and quality of the complaints (including the availability of supporting evidence), the role of claims management companies and the average uphold rates and redress costs. The Group can make no assurance that expenses associated with PPI complaints will not exceed the provision it has taken relating to these claims. More generally, the Group can make no assurance that its estimates for potential liabilities are correct, and the reserves taken as a result may prove inadequate. If the Group were to incur additional expenses that exceed provisions for PPI liabilities or other provisions, these expenses could have a material adverse effect on the Group’s operating results, financial condition and prospects. For further information about the provision for PPI complaint liabilities see Note 25 to the Condensed Consolidated Interim Financial Statements.
The FSA may identify future industry-wide misselling or other issues that could affect the Group. This may lead from time to time to: (i) significant direct costs or liabilities (including in relation to misselling); and (ii) changes in the practices of such businesses which benefit customers at a cost to shareholders.
Decisions taken by the FOS (or any overseas equivalent that has jurisdiction) could, if applied to a wider class or grouping of customers, have a material adverse effect on the operating results, financial condition and prospects of the Group.
Members of the Group are responsible for contributing to compensation schemes in the UK in respect of banks and other authorised financial services firms that are unable to meet their obligations to customers
In the UK, the Financial Services Compensation Scheme (‘FSCS’) was established under the Financial Services and Markets Act 2000 and is the UK’s statutory fund of last resort for customers of authorised financial services firms. The FSCS can pay compensation to customers if an FSA-authorised firm is unable, or likely to be unable, to pay claims against it (for instance, an authorised bank is unable to pay claims by depositors). The FSCS is funded by levies on firms authorised by the FSA, including the Company and other members of the Group.
In the event that the FSCS raises funds from authorised firms, raises those funds more frequently or significantly increases the levies to be paid by such firms, the associated costs to the Group may have a material adverse effect on its operating results, financial condition and prospects. The recent measures taken to protect the depositors of deposit-taking institutions involving the FSCS have resulted in a significant increase in the levies made by the FSCS on the industry and such levies may continue to go up if similar measures are required to protect depositors of other institutions.
In addition, regulatory reform initiatives in the UK and internationally may result in further changes to the FSCS, which could result in additional costs and risks for the Group. For instance, the FSA announced in October 2011 that it was restarting its review of the funding of the FSCS and on 25 July 2012 it announced a consultation on proposed changes to the funding of the FSCS, with comments due by 25 October 2012. Changes as a result of this may affect the profitability of the Company (and other members of the Group required to contribute to the FSCS).
As a result of the structural reorganisation and reform of the UK financial regulatory authorities, it is proposed that the FSCS levies will be collected by the FCA under the new regime. It is possible that future policy of the FSCS and future levies on the firms authorised by the FSA may differ from those at present and that this could lead to a period of some uncertainty for members of the Group. In addition, it is possible that other jurisdictions where the Group operates could introduce similar compensation, contributory or reimbursement schemes. As a result of any such developments, the Group may incur additional costs and liabilities which may adversely affect its operating results, financial condition and prospects.
The Banking Act may adversely affect the Group’s business
The Banking Act came into force on 12 February 2009. It provides HM Treasury, the Bank of England and the FSA with a variety of tools for dealing with UK institutions which are authorised deposit takers and are failing. If the position of a relevant entity in the Group were to decline so dramatically that it was considered to be failing, or likely to fail, to meet threshold authorisation conditions set out in FSMA (for example, if there were a mass withdrawal of deposits over solvency fears surrounding the Group, in a manner analogous to the situation that occurred at Northern Rock, adversely affecting the ability of the Group to continue to trade), it could become subject to the exercise of powers by HM Treasury, the Bank of England and the FSA under the special resolution regime set out in the Banking Act. The special resolution regime provides HM Treasury, the Bank of England and the FSA with a variety of powers for dealing with UK deposit taking institutions that are failing or likely to fail, including: (i) to take a bank or bank holding company into temporary public ownership; (ii) to transfer all or part of the business of a bank to a private sector purchaser; or (iii) to transfer all or part of the business of a bank to a “bridge bank”. The special resolution regime also comprises a separate insolvency procedure and administration procedure each of which is of specific application to banks. These insolvency and administration measures may be invoked prior to the point at which an application for insolvency proceedings with respect to a relevant institution could be made.
If an instrument or order were made under the Banking Act in respect of the Company, such instrument or order (as the case may be) may (among other things): (i) result in a compulsory transfer of shares or other securities or property of the Company; (ii) impact on the rights of the holders of shares or other securities in the Company or result in the nullification or modification of the terms and conditions of such shares or securities; or (iii) result in the de-listing of the Company’s shares and/or other securities. In addition, such an order may affect matters in respect of the Company and/or other aspects of the Company’s shares or other securities which may negatively affect the ability of the Company to meet its obligations in respect of such shares or securities.
At present, no instruments or orders have been made under the Banking Act in respect of the Group and there has been no indication that any such order will be made, but there can be no assurance that holders of shares or other securities in the Company would not be adversely affected by any such order if made in the future.
The Group’s operations are highly dependent on its information technology systems
The Group’s business, financial performance and ability to meet its strategic objectives depend to a significant extent upon the functionality of its information technology systems (including Partenon, the global banking informational technology platform utilised by Banco Santander, S.A and the Group), and its ability to increase systems capacity. The proper functioning of the Group’s financial control, risk management, credit analysis and reporting, accounting, customer service and other information technology systems, as well as the communication networks between its branches and main data processing centres, are critical to the Group’s business and its ability to compete. For example, the Group’s ability to process credit card and other electronic transactions for its customers is an essential element of its business. A disruption (even short-term) to the functionality of the Group’s information technology system (whether as a result of so-called unintentional “cyber incidents” or targeted “cyber attacks,” security breaches, the Company’s own migration of new business onto Partenon or otherwise) could impose a significant financial loss, result in a disruption to the Group’s businesses, liability to clients, regulatory intervention or reputational damage. Likewise, delays or other problems in increasing the capacity of the information technology systems or increased costs associated with such systems could have a material adverse effect on the Group’s operating results, financial condition and prospects. Although the Group has implemented certain preventative measures to protect its information and data systems, it can give no assurance that such measures will be effective in preventing a cyber attack or other IT disruption. Any such event could also require the Group to expend significant additional resources to modify its protective measures or to investigate and remediate vulnerabilities or other exposures, and may subject the Group to additional litigation and financial losses. Operation losses related to a successful cyber attack or other operational risks could have a material adverse effect on the Group’s operating results, financial condition and prospects.
The Group relies upon certain outsourced services (including information technology support, maintenance and consultancy services in connection with Partenon) provided by certain other members of the Banco Santander, S.A. group. Any material change in the basis upon which these services are provided to the Group or the extent to which they are available to the Group could have a material adverse effect on the Group’s operating results, financial condition and prospects.
In addition, if the Group fails to update and develop its existing information technology systems as effectively as its competitors, this may result in a loss of the competitive advantages that the Group believes its information technology systems provide, which could also have a material adverse effect on the Group’s operating results, financial condition and prospects.
Third parties may use the Group as a conduit for illegal activities without the Group’s knowledge, which could have a material adverse effect on the Group
The Group is required to comply with applicable anti-money laundering laws and regulations and has adopted various policies and procedures, including internal control and “know-your-customer” procedures, aimed at preventing use of the Group for money laundering. For example, a major focus of US governmental policy relating to financial institutions in recent years has been combating money laundering and enforcing compliance with US economic sanctions. The outcome of any proceeding or complaint is inherently uncertain and could have a material adverse effect on the Group’s operations or financial condition, especially to the extent that the scope of any such proceedings expands beyond its original focus.
In addition, while the Group reviews its relevant counterparties’ internal policies and procedures with respect to such matters, the Group, to a large degree, relies upon its relevant counterparties to maintain and properly apply their own appropriate anti-money laundering procedures. Such measures, procedures and compliance may not be completely effective in preventing third parties from using the Group (and its relevant counterparties) as a conduit for money laundering (including illegal cash operations) without the Group’s (and its relevant counterparties’) knowledge. If the Group is associated with, or even accused of being associated with, or becomes a party to, money laundering, then its reputation could suffer and/or it could become subject to fines, sanctions and/or legal enforcement (including being added to any “black lists’’ that would prohibit certain parties from engaging in transactions with the Group), any one of which could have a material adverse effect on the Group’s operating results, financial condition and prospects.
Changes in the pension liabilities and obligations of the Group could have a materially adverse effect on the Group
The Group provides retirement benefits for many of its former and current employees in the United Kingdom through a number of defined benefit pension schemes established under trust. The Group has only limited control over the rate at which it pays into such schemes. Under the UK statutory funding requirements, employers are usually required to contribute to the schemes at the rate they agree with the scheme trustees, although if they cannot agree, such rate can be set by the Pensions Regulator. The scheme trustees may, in the course of discussions about future valuations, seek higher employer contributions. The scheme trustees’ power in relation to the payment of pension contributions depends on the terms of the trust deed and rules governing the pension schemes.
The UK Pensions Regulator has the power to issue a financial support direction to companies within a group in respect of the liability of employers participating in the UK defined benefit pension plans where that employer is a service company, or is otherwise “insufficiently resourced” (as defined for the purposes of the relevant legislation). As some of the employers within the Group are service companies, if they become insufficiently resourced, other companies within the Group which are connected with or an associate of those employers are at risk of a financial support direction in respect of those employers’ liabilities to the defined benefit pension schemes in circumstances where the Pensions Regulator properly considers it reasonable to issue one. Such a financial support direction could require the companies to guarantee or provide security for the pension liabilities of those employers, or could require additional amounts to be paid into the relevant pension schemes in respect of them.
The UK courts have decided that liabilities under financial support directions issued by the Pensions Regulator against companies after they have gone into administration were payable as an expense of the administration, and did not rank as provable debts. This means that such liabilities will have to be satisfied before any distributions to unsecured creditors could be made. It is understood that leave to appeal to the Supreme Court has been requested and therefore it is likely that there will be a further decision to come.
The Pensions Regulator can also issue contribution notices if it is of the opinion that an employer has taken actions, or failed to take actions, deliberately designed to avoid meeting its pension promises or which are materially detrimental to the scheme’s ability to meet its pension promises. A contribution notice can be moved to any company which is connected with or an associate of such employer in circumstances where the Regulator considers it reasonable to issue. The risk of a contribution notice being imposed may inhibit the freedom of the Group to restructure itself or to undertake certain corporate activities.
Changes in the size of the deficit in the defined benefit schemes operated by the Group, due to reduction in the value of the pension fund assets (depending on the performance of financial markets) or an increase in the pension fund liabilities due to changes in mortality assumptions, the rate of increase of salaries, discount rate assumptions, inflation, the expected rate of return on plan assets, or other factors, could result in the Group having to make increased contributions to reduce or satisfy the deficits which would divert resources from use in other areas of the Group’s business and reduce the Company’s capital resources. While a number of the above factors can be controlled by the Group, there are some over which it has no or limited control. Although the trustees of the defined benefit pension schemes are obliged to consult the Group before changing the pension schemes’ investment strategy, the trustees have the final say. Increases in the pension liabilities and obligations of the Group could have a material adverse effect on the Group’s operating results, financial condition and prospects.
The ongoing changes in the UK supervision and regulatory regime and particularly the implementation of the ICB’s recommendations may require the Group to make changes to its structure and business which could have an impact on the Group’s pension schemes or liabilities. For a discussion of the ICB’s recommendations see “Legislative, regulatory and governmental oversight and current banking reform initiatives and requirements could have a material adverse effect on the Group” on pages 193 to 194.
Risks concerning enforcement of judgements made in the United States
Santander UK plc is a public limited company registered in England and Wales. All of the Company’s Directors live outside the United States of America. As a result, it may not be possible to serve process on such persons in the United States of America or to enforce judgements obtained in US courts against them or Santander UK based on the civil liability provisions of the US federal securities laws or other laws of the United States of America or any state thereof. The Directors’ Report on pages 138 to 151 of the Group’s 2011 Annual Report has been prepared and presented in accordance with and in reliance upon English company law and the liabilities of the Directors in connection with that Report shall be subject to the limitations and restrictions provided by such law. Under the UK Companies Act 2006, a safe harbour limits the liability of Directors in respect of statements in and omissions from the Directors’ Report on pages 138 to 151 of the Group’s 2011 Annual Report. Under this safe harbour, the Directors would be liable to the Company (but not to any third party) if the Directors’ Report contains errors as a result of recklessness or knowing misstatement or dishonest concealment of a material fact, but would not otherwise be liable.
Glossary of Financial Services Industry Terms
Term used in the Half Yearly Financial Report | US equivalent or brief description of meaning | |
| Accounts | Financial statements | |
| Allotted | Issued | |
| Articles of Association | Bylaws | |
| Attributable profit | Net income | |
| Balance sheet | Statement of financial position | |
| Bills | Notes | |
| Called up share capital | Ordinary shares or common stock and preferred stock, issued and fully paid | |
| Capital allowances | Tax depreciation allowances | |
| Creditors | Payables | |
| Current account | Checking account | |
| Dealing | Trading | |
| Debtors | Receivables | |
| Deferred tax | Deferred income tax | |
| Depreciation | Amortisation | |
| Fees and commissions payable | Fees and commissions expense | |
| Fees and commissions receivable | Fees and commissions income | |
| Finance lease | Capital lease | |
| Freehold | Ownership with absolute rights in perpetuity | |
| Interest payable | Interest expense | |
| Interest receivable | Interest income | |
| Loans and advances | Lendings | |
| Loan capital | Long-term debt | |
| Members | Shareholders | |
| Nominal value | Par value | |
| One-off | Non-recurring | |
| Ordinary shares | Common stock | |
| Preference shares | Preferred stock | |
| Premises | Real estate | |
| Profit | Income | |
| Provisions | Liabilities | |
| Share capital | Ordinary shares, or common stock, and preferred stock | |
| Shareholders | Stockholders | |
| Share premium account | Additional paid-in capital | |
| Shares in issue | Shares outstanding | |
| Undistributable reserves | Restricted surplus | |
| Write-offs | Charge-offs |
| Term used in the Half Yearly Financial Report | Definition | |
| Alternative A-paper (‘Alt-A’) | A US description for loans regarded as lower risk than sub-prime, but with higher risk characteristics than lending under normal criteria. | |
| Arrears | Customers are said to be in arrears when they are behind in fulfilling their obligations with the result that an outstanding loan is unpaid or overdue. Such a customer is also said to be in a state of delinquency. When a customer is in arrears, his entire outstanding balance is said to be delinquent, meaning that delinquent balances are the total outstanding loans on which payments are overdue. | |
| Asset Backed Securities (‘ABS’) | Securities that represent an interest in an underlying pool of referenced assets. The referenced pool can comprise any assets which attract a set of associated cash flows but are commonly pools of residential or commercial mortgages but could also include leases, credit card receivables, motor vehicles or student loans. | |
| Bank Levy (‘UK Bank Levy’) | The levy that applies to certain UK banks, UK building societies and the UK operations of foreign banks from 1 January 2011. The levy is payable based on a percentage of the chargeable equity and liabilities of the bank at the balance sheet date. | |
| Basel II | The capital adequacy framework issued by the Basel Committee on Banking Supervision in June 2006 in the form of the ‘International Convergence of Capital Measurement and Capital Standards’. | |
| Basel III | In December 2010, the Basel Committee on Banking Supervision issued the Basel III rules text, which presents the details of strengthened global regulatory standards on bank capital adequacy and liquidity. The standards will be phased in gradually from 2013. | |
| Basis point | One hundredth of a per cent (i.e. 0.01%), so 100 basis points is 1%. Used in quoting movements in interest rates or yields on securities. | |
| BIPRU | The prudential sourcebook for banks, building societies and investment firms which sets out the UK Financial Services Authority’s capital requirements. | |
| Collateralised Bond Obligation (‘CBO’) | A security backed by the repayments from a pool of bonds, some of which may be sub-investment grade but because of their different types of credit risk, they are considered to be sufficiently diversified to be of investment grade. | |
| Collateralised Debt Obligation (‘CDO’) | Securities issued by a third party which reference ABS and/or certain other related assets purchased by the issuer. Santander UK has not established any programmes creating CDOs but acquired instruments issued by other banking groups as a result of the acquisition of Alliance & Leicester. The CDO portfolio is in run-off. | |
| Collateralised Loan Obligation (‘CLO’) | A security backed by the repayments from a pool of commercial loans. The payments may be made to different classes of owners (in tranches). | |
| Collectively assessed loan impairment provisions | Impairment losses assessment on a collective basis for loans that are part of homogeneous pools of similar loans and that are not individually significant, using appropriate statistical techniques. See “Impairment of financial assets” in Note 1 “Accounting Policies” of the Group’s 2011 Annual Report. | |
| Commercial Banking margin | Net interest income (adjusted to remove net interest income from the Treasury asset portfolio in run-off) over average commercial assets. | |
| Commercial lending | Loans secured on UK commercial property, and corporate loans. | |
| Commercial Mortgage-Backed Securities (‘CMBS’) | Securities that represent interests in a pool of commercial mortgages. Investors in these securities have the right to cash received from future mortgage payments (interest and/or principal). | |
| Commercial Paper | An unsecured promissory note issued to finance short-term credit needs. It specifies the face amount paid to investors on the maturity date. Commercial paper can be issued as an unsecured obligation of the Group and is usually issued for periods ranging from one week up to nine months. However, the depth and reliability of some CP markets means that issuers can repeatedly roll over CP issuance and effectively achieve longer term funding. CP can be issued in a range of denominations and can be either discounted or interest-bearing. | |
| Commercial Real Estate | Includes office buildings, industrial property, medical centres, hotels, malls, retail stores, shopping centres, farm land, multifamily housing buildings, warehouses, garages, and industrial properties. |
| Contractual maturity | The final payment date of a loan or other financial instrument, at which point all the remaining outstanding principal will be repaid and interest is due to be paid. | |
| Core Tier 1 capital | Called-up share capital and eligible reserves plus equity non-controlling interests, less intangible assets and deductions relating to the excess of expected loss over regulatory impairment loss allowance and securitisation positions as specified by the UK Financial Services Authority. | |
| Core Tier 1 capital ratio | Core Tier 1 capital as a percentage of risk weighted assets. |
| Cost:income ratio | Operating expenses as a percentage of total income. | |
| Coverage ratio | Impairment loss allowances as a percentage of total non-performing loans and advances. | |
Covered bonds | Debt securities backed by a portfolio of mortgages that is segregated from the issuer’s other assets solely for the benefit of the holders of the covered bonds. The Group issues covered bonds as part of its funding activities. | |
| Credit Default Swap (‘CDS’) | A credit derivative contract where the protection seller receives premium or interest-related payments in return for contracting to make payments to the protection buyer in the event of a defined credit event. Credit events normally include bankruptcy, payment default on a reference asset or assets, or downgrades by a rating agency. | |
| Credit derivative | A contractual agreement whereby the credit risk of an asset (the reference asset) is transferred from the buyer to the seller of protection. The buyer of the credit derivative pays a periodic fee in return for a payment by the protection seller upon the occurrence, if any, of a credit event defined at the inception of the transaction. Credit events normally include bankruptcy, payment default on a reference asset or assets, or downgrades by a rating agency. Credit derivatives include credit default swaps, total return swaps and credit swap options. | |
| Credit risk | The risk of financial loss arising from the default of a customer or counterparty to which the Group has directly provided credit, or for which the Group has assumed a financial obligation, after realising collateral held. Credit risk includes residual credit risk and concentration risk. | |
| Credit risk adjustment | An adjustment to the valuation of OTC derivative contracts to reflect the creditworthiness of OTC derivative counterparties. It is measured as a lifetime expected loss for each counterparty based on the probability of default, the loss given default and the expected exposure of the OTC derivative position with the counterparty. | |
| Credit risk mitigation | A technique to reduce the credit risk associated with an exposure by application of credit risk mitigants such as collateral, guarantee and credit protection. | |
| Credit risk spread | The yield spread between securities with the same coupon rate and maturity structure but with different associated credit risks, with the yield spread rising as the credit rating worsens. It is the premium over the benchmark or risk-free rate required by the market to accept a lower credit quality. | |
| Credit Valuation Adjustment (‘CVA’) | Adjustments to the fair values of derivative assets to reflect the creditworthiness of the counterparty. | |
| Currency swap | An arrangement in which two parties exchange specific principal amounts of different currencies at inception and subsequently interest payments on the principal amounts. Often, one party will pay a fixed interest rate, while the other will pay a floating exchange rate (though there are also fixed-fixed and floating-floating arrangements). At the maturity of the swap, the principal amounts are usually re-exchanged. | |
| Customer accounts/customer deposits | Money deposited by all individuals and companies that are not credit institutions. Such funds are recorded as liabilities in the Group’s balance sheet under Deposits by Customers, Trading Liabilities or Financial Liabilities designated at Fair Value. | |
| Debt restructuring | This occurs when the terms and provisions of outstanding debt agreements are changed. This is often done in order to improve cash flow and the ability of the borrower to repay the debt. It can involve altering the repayment schedule as well as reducing the debt or interest charged on the loan. | |
| Debt securities | Transferable instruments creating or acknowledging indebtedness. They include debentures, bonds, certificates of deposit, notes and commercial paper. The holder of a debt security is typically entitled to the payment of principal and interest, together with other contractual rights under the terms of the issue, such as the right to receive certain information. Debt securities are generally issued for a fixed term and redeemable by the issuer at the end of that term. Debt securities can be secured or unsecured. | |
| Debt securities in issue | Transferable certificates of indebtedness of the Group to the bearer of the certificates. These are liabilities of the Group and include commercial paper, certificates of deposit, bonds and medium-term notes. | |
| Deferred tax asset | Income taxes that are recoverable in future periods as a result of deductible temporary differences and the carry-forward of tax losses and unused tax credits. Temporary differences arise due to timing differences between the accounting value of an asset or liability recorded and its value for tax purposes (tax base) that result in tax deductible amounts in future periods. |
| Deferred tax liability | Income taxes that are payable in future periods as a result of taxable temporary differences. Temporary differences arise due to timing differences between the accounting value of an asset or liability and its value for tax purposes (tax base) that result in taxable amounts in future periods. | |
| Defined benefit obligation | The present value of expected future payments required to settle the obligations of a defined benefit plan resulting from employee service. |
| Defined benefit plan | A pension plan that defines an amount of pension benefit to be provided, usually as a function of one or more factors such as age, years of service or compensation. The employer’s obligation can be more or less than its contributions to the fund. | |
| Defined contribution plan | A pension plan under which the Group pays fixed contributions as they fall due into a separate entity (a fund) and will have no legal or constructive obligations to pay further contributions if the fund does not hold sufficient assets to pay all employees benefits relating to employee service in the current and prior periods, i.e. the employer’s obligation is limited to its contributions to the fund. | |
| Delinquency | See ‘Arrears’. | |
| Deposits by banks | Money deposited by banks and other credit institutions. They include money-market deposits, securities sold under repurchase agreements, and other short-term deposits. Such funds are recorded as liabilities in the Group’s balance sheet under Deposits by Banks Trading Liabilities or Financial Liabilities designated at Fair Value. | |
| Derivative | A contract or agreement whose value changes with changes in an underlying index such as interest rates, foreign exchange rates, share prices or indices and which requires no initial investment or an initial investment that is smaller than would be required for other types of contracts with a similar response to market factors. The principal types of derivatives are: swaps, forwards, futures and options. | |
| Economic capital | An internal measure of the minimum equity and preference capital required for the Group to maintain its credit rating based upon its risk profile. | |
Effective Interest rate method | A method of calculating the amortised cost or carrying value of a financial asset or financial liability (or group of financial assets or liabilities) and of allocating the interest income or interest expense over the expected life of the asset or liability. | |
| Effective tax rate | The actual tax on profits on ordinary activities as a percentage of profit on ordinary activities before taxation. | |
| Expected loss | The Group measure of anticipated loss for exposures captured under an internal ratings-based credit risk approach for capital adequacy calculations. It is measured as the Group-modelled view of anticipated loss based on Probability of Default, Loss Given Default and Exposure at Default, with a one-year time horizon. | |
| Exposure | The maximum loss that a financial institution might suffer if a borrower, counterparty or group fails to meet their obligations or assets and off-balance sheet positions have to be realised. | |
| Exposure at default (‘EAD’) | The estimation of the extent to which the Group may be exposed to a customer or counterparty in the event of, and at the time of, that counterparty’s default. At default, the customer may not have drawn the loan fully or may already have repaid some of the principal, so that exposure is typically less than the approved loan limit. | |
Fair value adjustment | An adjustment to the fair value of a financial instrument which is determined using a valuation technique (level 2 and level 3) to include additional factors that would be considered by a market participant that are not incorporated within the valuation model. | |
| Financial Services Compensation Scheme (‘FSCS’) | The UK’s statutory fund of last resort for customers of authorised financial services firms, established under the Financial Services and Markets Act (‘FSMA’) 2000. The FSCS can pay compensation to customers if a UK Financial Services Authority authorised firm is unable, or likely to be unable, to pay claims against it (for instance, an authorised bank is unable to pay claims by depositors). The FSCS is funded by levies on firms authorised by the UK Financial Services Authority, including Santander UK and other members of the Group. | |
| First/Second Charge | First charge (also known as first lien): debt that places its holder first in line to collect compensation from the sale of the underlying collateral in the event of a default on the loan. Second charge (also known as second lien): debt that is issued against the same collateral as a higher charge debt but that is subordinate to it. In the case of default, compensation for this debt will only be received after the first charge has been repaid and thus represents a riskier investment than the first charge. | |
| Forbearance | A term generally applied to arrangements provided to support borrowers experiencing temporary financial difficulty. Such arrangements include reduced or nil payments, term extensions, transfers to interest only and the capitalisation of arrears. | |
| Foundation Internal Ratings-based (‘IRB’) approach | A method for calculating credit risk capital requirements using the Group’s internal Probability of Default models but with supervisory estimates of Loss Given Default and conversion factors for the calculation of Exposure at Default. |
| Full time equivalent | Full time equivalent employee units are the on-job hours paid for employee services divided by the number of ordinary-time hours normally paid for a full-time staff member when on the job (or contract employee where applicable). | |
| Funded/unfunded | Exposures where the notional amount of the transaction is either funded or unfunded. Represents exposures where a commitment to provide future funding has been made and the funds have been released/not released. | |
| Gain on acquisition | The amount by which the acquirer’s interest in the net fair value of the identifiable assets, liabilities and contingent liabilities, recognised in a business combination, exceeds the cost of the combination. | |
| Home loan (Residential mortgage) | A loan to purchase a residential property which is then used as collateral to guarantee repayment of the loan. The borrower gives the lender a lien against the property, and the lender can foreclose on the property if the borrower does not repay the loan per the agreed terms. Also known as a residential mortgage. |
| Impaired loans | Loans where an individual identified impairment loss allowance has been raised and also include loans which are fully collateralised or where indebtedness has already been written down to the expected realisable value. The impaired loan category may include loans, which, while impaired, are still performing. | |
Impairment allowance (Loan impairment provisions) | A loss allowance held on the balance sheet as a result of the raising of a charge against profit for the incurred loss inherent in the lending book. An impairment loss allowance may either be identified or unidentified and individual or collective. | |
Impairment losses | The raising of a charge against profit for the incurred loss inherent in the lending book following an impairment review. For financial assets carried at amortised cost, impairment losses are recognised in the income statement and the carrying amount of the financial asset or group of financial assets is reduced by establishing an allowance for impairment losses. For available-for-sale financial assets, the cumulative loss including impairment losses is removed from equity and recognised in the income statement. | |
| Individually assessed loan impairment provisions | Impairment is measured individually for assets that are individually significant. For these assets, the Group measures the amount of the impairment loss as the difference between the carrying amount of the asset or group of assets and the present value of the estimated future cash flows from the asset or group of assets discounted at the original effective interest rate of the asset. | |
| Interest spread | The difference between the gross yield on average interest-earning assets and the interest rate paid on average interest-bearing liabilities. | |
| Internal Capital Adequacy Assessment Process (‘ICAAP’) | The Group’s own assessment of its regulatory capital requirements, as part of Basel II. It takes into account the regulatory and commercial environment in which the Group operates, the Group’s risk appetite, the management strategy for each of the Group’s material risks and the impact of appropriate adverse scenarios and stresses on the Group’s capital requirements. | |
Internal ratings-based approach (‘IRB’) | The Group’s method, under Basel II framework, of calculating credit risk capital requirements using internal, rather than supervisory, estimates of risk parameters. It is a more sophisticated technique in credit risk management and can be Foundation IRB or Advanced IRB. | |
| Investment grade | A debt security, treasury bill or similar instrument with a credit rating measured by external agencies of AAA to BBB. | |
ISDA (International Swaps and Derivatives Association) Master agreement | Standardised contract developed by ISDA used as an umbrella under which bilateral derivatives contracts are entered into. | |
| Level 1 – quoted market prices | The fair value of these financial instruments is based on unadjusted quoted prices for identical assets or liabilities in an active market that the Group has the ability to access at the measurement date. | |
| Level 2 – valuation techniques using observable inputs | The fair value of these financial instruments is based on quoted prices in markets that are not active or quoted prices for similar assets or liabilities, recent market transactions, inputs other than quoted market prices for the asset or liability that are observable either directly or indirectly for substantially the full term, and inputs to valuation techniques that are derived principally from or corroborated by observable market data through correlation or other statistical means for substantially the full term of the asset or liability. | |
Level 3 - valuation techniques with significant unobservable inputs | The fair value of these financial instruments is based on inputs to the pricing or valuation techniques that are significant to the overall fair value measurement of the asset or liability are unobservable. | |
| Liquidity and Credit enhancements | Credit enhancement facilities are used to enhance the creditworthiness of financial obligations and cover losses due to asset default. Two general types of credit enhancement are third-party loan guarantees and self-enhancement through over collateralisation. Liquidity enhancement makes funds available if required, for other reasons than asset default, e.g. to ensure timely repayment of maturing commercial paper. |
| Loan loss rate | Defined as total credit impairment charge (excluding available for sale assets and reverse repurchase agreements) divided by gross loans and advances to customers and banks (at amortised cost). | |
| Loan to deposit ratio | The ratio of the book value of the Group’s customer assets (i.e. retail and corporate assets) divided by its customer liabilities (i.e. retail and corporate deposits). | |
| Loan to value ratio (‘LTV’) | The amount of a first mortgage charge as a percentage of the total appraised value of real property. The LTV ratio is used in determining the appropriate level of risk for the loan and therefore the price of the loan to the borrower. LTV ratios may be expressed in a number of ways, including origination LTV and indexed LTV. | |
| Loans past due | Loans are past due when a counterparty has failed to make a payment when contractually due. | |
| Loss Given Default (‘LGD’) | The fraction of Exposure at Default (defined above) that will not be recovered following default. LGD comprises the actual loss (the part that is not recovered), together with the economic costs associated with the recovery process. | |
| Master netting agreement | An industry standard agreement which facilitates netting of transactions (such as financial assets and liabilities including derivatives) in jurisdictions where netting agreements are recognised and have legal force. The netting arrangements do not generally result in an offset of balance sheet assets and liabilities for accounting purposes, as transactions are usually settled on a gross basis. |
| Medium Term Notes (‘MTNs’) | Corporate notes (or debt securities) continuously offered by a company to investors through a dealer. Investors can choose from differing maturities, ranging from nine months to 30 years. They can be issued on a fixed or floating coupon basis or with an exotic coupon; with a fixed maturity date (non-callable) or with embedded call or put options or early repayment triggers. MTNs are most generally issued as senior, unsecured debt. | |
| Monoline insurers | An entity which specialises in providing credit protection to the holders of debt instruments in the event of default by a debt security counterparty. This protection is typically held in the form of derivatives such as credit default swaps referencing the underlying exposures held. | |
| Mortgage-Backed Securities (‘MBS’) | Securities that represent interests in groups of mortgages, which may be on residential or commercial properties. Investors in these securities have the right to cash received from future mortgage payments (interest and/or principal). When the MBS references mortgages with different risk profiles, the MBS is classified according to the highest risk class. | |
| Mortgage vintage | The year the mortgage was issued. | |
| Net interest income | The difference between interest received on assets and interest paid on liabilities. | |
Net interest margin | Net interest income as a percentage of average interest-earning assets. | |
| Net structural position | A product hedging strategy to protect revenue in a low interest rate environment. It converts short-term interest margin volatility on product balances (such as non interest-bearing current accounts) into a more stable medium-term rate. This is accomplished using a continuous rolling maturity programme to achieve the desired profile. Within Corporate Centre, ALM is responsible for managing the structural balance sheet. | |
| Non-performing loans | In the Retail Banking business, loans and advances are classified as non-performing typically when the counterparty fails to make payments when contractually due for three months or longer. In the Corporate Banking business, loans and advances are classified as non-performing either when payments are more than three months past due or where there are reasonable doubts about full repayment (principal and interest) under the contractual terms. | |
| Over the counter (‘OTC’) derivatives | Contracts that are traded (and privately negotiated) directly between two parties, without going through an exchange or other intermediary. They offer flexibility because, unlike standardised exchange-traded products, they can be tailored to fit specific needs. | |
| Own credit | The effect of the Group’s own credit standing on the fair value of financial liabilities. | |
Past due | A financial asset such as a loan is past due when the counterparty has failed to make a payment when contractually due. In the Group’s retail loans book, a loan or advance is considered past due when any contractual payments have been missed. In the Group’s corporate loans book, a loan or advance is considered past due when 90 days past due, and also when the Group has reason to believe that full repayment of the loan is in doubt. | |
Potential problem loans | Loans other than non-accrual loans, accruing loans which are contractually overdue 90 days or more as to principal or interest and troubled debt restructurings where known information about possible credit problems of the borrower causes management to have serious doubts about the borrower’s ability to meet the loan’s repayment terms. |
Prime/ prime mortgage loans | A US description for mortgages granted to the most creditworthy category of borrowers. | |
| Private equity investments | Equity holdings in operating companies not quoted on a public exchange. | |
| Probability of default (‘PD’) | The likelihood that a loan will not be repaid and will fall into default. PD may be calculated for each client who has a loan (normally applicable to wholesale customers/clients) or for a portfolio of clients with similar attributes (normally applicable to retail customers). To calculate PD, the Group assesses the credit quality of borrowers and other counterparties and assigns them an internal risk rating. Multiple rating methodologies may be used to inform the rating decision on individual large credits, such as internal and external models, rating agency ratings, and for wholesale assets market information such as credit spreads. For smaller credits, a single source may suffice such as the result from an internal rating model. | |
Regulatory capital | The amount of capital that the Group holds, determined in accordance with rules established by the UK Financial Services Authority for the consolidated Group and by local regulators for individual Group companies. | |
| Renegotiated loans | Loans and advances are generally renegotiated either as part of an ongoing customer relationship or in response to an adverse change in the circumstances of the borrower. In the latter case renegotiation can result in an extension of the due date of payment or repayment plans under which the Group offers a concessionary rate of interest to genuinely distressed borrowers. This will result in the asset continuing to be overdue and will be individually impaired where the renegotiated payments of interest and principal will not recover the original carrying amount of the asset. In other cases, renegotiation will lead to a new agreement, which is treated as a new loan. | |
| Repurchase agreement (‘Repo’) | In a sale and repurchase agreement one party, the seller, sells a financial asset to another party, the buyer, under commitments to reacquire the asset at a later date. The buyer at the same time agrees to resell the asset at the same later date. From the seller’s perspective such agreements are securities sold under repurchase agreements (‘repos’) and from the buyer’s securities purchased under commitments to resell (‘reverse repos’). | |
| Residential Mortgage-Backed Securities (‘RMBS’) | Securities that represent interests in a group of residential mortgages. Investors in these securities have the right to cash received from future mortgage payments (interest and/or principal). |
| Restructured loans | Loans where, for economic or legal reasons related to the debtor’s financial difficulties, a concession has been granted to the debtor that would not otherwise be considered. Where the concession results in the expected cash flows discounted at the original effective interest rate being less than the loan’s carrying value, an impairment allowance will be raised. | |
| Retail IRB approach | The Group’s internal method of calculating credit risk capital requirements for its key retail portfolios. The UK Financial Services Authority approved the Group’s application of the Retail IRB approach to the Group’s credit portfolios with effect from 1 January 2008. | |
| Retail loans | Loans to individuals rather than institutions, including residential mortgage lending and banking and consumer credit. | |
Risk appetite | The level of risk (types and quantum) that the Group is willing to accept (or not accept) to safeguard the interests of shareholders whilst achieving business objectives. | |
| Risk weighted assets | A measure of a bank’s assets adjusted for their associated risks. Risk weightings are established in accordance with the Basel Capital Accord as implemented by the UK Financial Services Authority. | |
| Securitisation | Securitisation is a process by which a group of assets, usually loans, are aggregated into a pool, which is used to back the issuance of new securities. Securitisation is the process by which ABS (asset backed securities) are created. A company sells assets to an SPE (special purpose entity) which then issues securities backed by the assets, based on their value. This allows the credit quality of the assets to be separated from the credit rating of the original company and transfers risk to external investors. Assets used in securitisations include mortgages to create mortgage-backed securities or residential mortgage-backed securities (‘RMBS’) as well as commercial mortgage-backed securities. The Group has established several securitisation structures as part of its funding and capital management activities. | |
Small and medium-sized enterprises (‘SMEs’) | Businesses with a turnover of up to £150m per annum. | |
| Special Purpose Entities (‘SPEs’) or Special Purpose Vehicles (‘SPVs’) | Entities that are created to accomplish a narrow and well defined objective. There are often specific restrictions or limits around their ongoing activities. Transactions with SPEs/SPVs take a number of forms, including (i) The provision of financing to fund asset purchases, or commitments to provide finance for future purchases; (ii) Derivative transactions to provide investors in the SPE/SPV with a specified exposure; (iii) The provision of liquidity or backstop facilities which may be drawn upon if the SPE/SPV experiences future funding difficulties; and (iv) Direct investment in the notes issued by SPEs/SPVs. |
| Standardised approach | In relation to credit risk, a method for calculating credit risk capital requirements under Basel II, using External Credit Assessment Institutions ratings and supervisory risk weights. The Standardised approach is less risk-sensitive than IRB (see ‘IRB’ above). In relation to operational risk, a method of calculating the operational capital requirement under Basel II, by the application of a supervisory defined percentage charge to the gross income of eight specified business lines. | |
| Structured finance/notes | A structured note is an instrument which pays a return linked to the value or level of a specified asset or index and sometimes offers capital protection if the value declines. Structured notes can be linked to a range of underlying assets, including equities, interest rates, funds, commodities and foreign currency. | |
| Structured Investment Vehicles (‘SIVs’) | Special Purpose Entities which invest in diversified portfolios of interest earning assets to take advantage of the spread differentials between the assets in the SIV and the funding cost. | |
| Subordinated liabilities | Liabilities which, in the event of insolvency or liquidation of the issuer, are subordinated to the claims of depositors and other creditors of the issuer. | |
| Subordination | The state of prioritising repayments of principal and interest on debt to a creditor lower than repayments to other creditors by the same debtor. That is, claims of a security are settled by a debtor to a creditor only after the claims of securities held by other creditors of the same debtor have been settled. | |
| Sub-prime | Loans to borrowers typically having weakened credit histories that include payment delinquencies and potentially more severe problems such as court judgements and bankruptcies. They may also display reduced repayment capacity as measured by credit scores, high debt-to-income ratios, or other criteria indicating heightened risk of default. | |
| Tier 1 capital | A measure of a bank’s financial strength defined by the UK FSA. It captures Core Tier 1 capital plus other Tier 1 securities in issue, but is subject to a deduction in respect of material holdings in financial companies. | |
Tier 1 capital ratio | The ratio expresses Tier 1 capital as a percentage of risk weighted assets. | |
| Tier 2 capital | Defined by the UK Financial Services Authority. Broadly, it includes qualifying subordinated debt and other Tier 2 securities in issue, eligible collective impairment allowances, unrealised available for sale equity gains and revaluation reserves. It is subject to deductions relating to the excess of expected loss over regulatory impairment allowance, securitisation positions and material holdings in financial companies. | |
| Trading market risk | See ‘Market risk’ | |
Troubled debt restructurings | A US description for restructuring a debt whereby the creditor for economic or legal reasons related to a debtor’s financial difficulties grants a concession to the debtor that it would not otherwise consider. | |
| Value at Risk (‘VaR’) | An estimate of the potential loss which might arise from market movements under normal market conditions, if the current positions were to be held unchanged for one business day, measured to a confidence level. | |
| Write-Down | After an advance has been identified as impaired and is subject to an impairment allowance, the stage may be reached whereby it is concluded that there is no realistic prospect of further recovery. Write-downs will occur when, and to the extent that, the whole or part of a debt is considered irrecoverable. | |
| Wrong-way risk | An aggravated form of concentration risk and arises when there is an adverse correlation between the counterparty’s probability of default and the mark-to-market value of the underlying transaction. |
Directors’ Responsibility Statement
The Half Yearly Financial Report is the responsibility of the Directors who confirm to the best of their knowledge:
| (a) | the condensed set of financial statements has been prepared in accordance with IAS 34 ‘Interim Financial Reporting’; |
| (b) | the interim management report includes a fair review of the information required by DTR 4.2.7R (indication of important events during the first six months and description of principal risks and uncertainties for the remaining six months of the year); and |
| (c) | the interim management report includes a fair review of the information required by DTR 4.2.8R (disclosure of related party transactions and changes therein). |
The Directors of Santander UK plc are listed in the Group’s 2011 Annual Report.
Approved by the Board of Santander UK plc and signed on its behalf by
Ana Botín
Chief Executive Officer
30 August 2012
SIGNATURES
Pursuant to the requirements of the Securities Exchange Act of 1934, the registrant has duly caused this report to be signed on its behalf by the undersigned, thereunto duly authorized.
| SANTANDER UK PLC | ||
| Dated: 4 September 2012 | By /s/ Jessica Petrie | |
| (Authorised Signatory) |