Table of Contents
SECURITIES AND EXCHANGE COMMISSION
Washington, D.C. 20549
FORM 6-K
Report of Foreign Issuer
Pursuant to Rule 13a-16 or 15d-16 of
Securities Exchange Act of 1934
For the month of August 2015
SANTANDER UK PLC
(Translation of registrant’s name into English)
2 Triton Square, Regent’s
Place, London NW1 3AN, England
(Address of principal executive offices)
Indicate by check mark whether the registrant files or will file annual reports under cover Form 20-F or Form 40-F.
Form 20-F x Form 40-F ¨
Indicate by check mark whether the registrant by furnishing the information contained in this Form is also thereby furnishing the information to the Commission pursuant to Rule 12g3-2(b) under the Securities Exchange Act of 1934.
Yes ¨ No x
THE REGISTRANT HEREBY INCORPORATES ALL PARTS OF THIS REPORT ON FORM 6-K BY REFERENCE IN REGISTRATION STATEMENT NO. 333-190509 FILED BY THE REGISTRANT WITH THE SECURITIES AND EXCHANGE COMMISSION ON FORM F-3ASR UNDER THE SECURITIES ACT OF 1933.
Table of Contents
2015 Half Yearly Financial Report
Santander UK plc
PART OF THE SANTANDER GROUP
Table of Contents
| ||||||||||||
HY 2015 business and financial highlights
|
We are pleased to report strong results for the first half of 2015, with continued improvement in profitability and strong commercial momentum.
| |||||||||||
Net interest income |
Profit before tax |
Banking net interest margin (‘NIM’) | ||||||||||
| £1,783m | £929m | 1.86%(1) | ||||||||||
| Up 7% on the first half of 2014, driven by margin improvements and increased retail and corporate lending. | Up strongly on the first half of 2014, with continued growth in net interest income, and well-performing retail and corporate loan portfolios.
| Up 6 basis points on the first half of 2014, largely due to the lower cost of retail liabilities. | |||||||||
| Cost-to-income ratio | CET 1 capital ratio | Loan-to-deposit ratio | ||||||||||
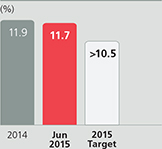
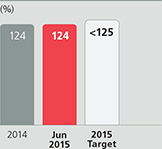
| 53% | 11.7% | 124% | ||||||||||
Improved from the first half of 2014, with administrative expenses tightly managed
| Strong capital position with an improved PRA end-point Tier 1 leverage ratio of 4.1%. | Unchanged from the end of 2014, with strong growth in Retail Banking assets and liabilities. | ||||||||||
| Gross mortgage lending | Lending to corporates | Retail customer satisfaction | ||||||||||
| £11.9bn | +11%year-on-year | 61.7% | ||||||||||
| We helped 15,800 first-time buyers and 2,800 Help to Buy customers purchase a home. | During the first half of 2015, we extended £4.5bn of new facilities to SMEs and mid-sized corporates, an increase of 15% on the first half of 2014. | Gap between Santander UK and the average of three highest performing peers closed1. Further improvement is at the heart of our plans. | ||||||||||
This Half Yearly Financial Report contains forward-looking statements that involve inherent risks and uncertainties. Actual results may differ materially from those contained in such forward-looking statements. See ‘Forward-looking Statements’ on page 138. For definitions of terms used in this Half Yearly Financial Report, see ‘Glossary’ on page 137.
Santander UK plc (the ‘Company’) and its subsidiaries (collectively ‘Santander UK’ or ‘Santander UK group’) operate primarily in the UK, and are part of the Banco Santander, S.A. group (comprising Banco Santander, S.A. and its subsidiaries, the ‘Banco Santander group’).
Santander UK plc is regulated by the UK Prudential Regulation Authority (‘PRA’) and the Financial Conduct Authority (‘FCA’), and certain other companies within the Santander UK group are regulated by the FCA.
1. Source: Customer satisfaction as measured by the Financial Research Survey (‘FRS’) run by GfK NOP (June 2015). See ‘Glossary’ on page 137.
| ||||||||||||
| (1) | Non-IFRS measure. See page 139. |
Table of Contents
| 1 |
Table of Contents
| Helping people and businesses prosper |
“I joined Santander UK as its Chair because I believe it is true in its intent to help people and businesses prosper and also has the potential to be transformative to the sector and the economy”
Baroness Shriti Vadera
Chair
12 August 2015
| (1) | CMA Retail Banking Market Investigation, |
updated issues statement, May 2015 |
Our purpose is to help people and businesses prosper as we build the Best Bank in the UK – a bank that is Simple, Personal and Fair.
Overview
The UK banking sector needs to continue its transformation to focus more on the genuine needs of households and small and medium business customers and to win their trust and that of regulators, policymakers, investors and the wider public. A better service to the domestic economy has to be the cornerstone of the sector’s ambition to remain a leading global financial centre.
Santander UK remains on course on its own journey, launched by Ana Botín during her time as CEO, to become a bank that is Simple, Personal and Fair and that wins the lasting loyalty of its customers, people, shareholders and communities. It has been a journey so far with some remarkably successful milestones. I was particularly pleased to see we won the Moneywise award for ‘Most Trusted Mainstream Bank’, as voted for by UK consumers.
But we know we have further to go. Nathan Bostock made it one of his three commitments to our shareholder in 2015 to develop a set of behaviours to underpin our values of Simple, Personal and Fair in the UK. Defining these behaviours, through the engagement of our people at roadshows across the country, has been an essential step towards embedding the culture we aspire to.
I joined Santander UK as its Chair because I believe it is true in its intent to help people and businesses prosper and also has the potential to be transformative to the sector and the economy. With its building society heritage, Santander UK has sustained its position as one of the significant mortgage providers in a highly competitive and commoditised market. In all other markets, spanning personal current accounts, credit cards and SMEs, we are a challenger bank.
In the SME market, we have grown our business steadily, but still only account for a small proportion of the SME lending market, while the Big Four UK banks together take over 85% of the outstanding volume of lending(1). But we also have a scale and the backing of our parent that give us geographic reach, brand recognition and resources – including a strong branch presence on the high street and a network of Corporate Business Centres across the UK. These help us to make a difference to significant segments of banking service provided to the population.
Santander UK has used its position as ‘scale challenger’ to launch innovative products that require substantial investment and the ability to reach a national market. These include the 1I2I3 Current Account, part of our 1I2I3 World proposition with more than four million customers, which has led to changes elsewhere in the sector as the incumbents seek to respond. Our scale challenger status has also enabled us to create Santander Breakthrough to support fast-growth SMEs. Our unique trade proposition leverages Banco Santander’s global network and is the only UK bank export scheme targeted specifically at SMEs. We will continue to aspire to be transformative as we embrace the pace of change in the digital world.
In February, Santander UK was announced as one of the UK’s best employers, placed in ‘The Sunday Times 25 Best Big Companies to Work For 2015’ awards, and in April we were named in ‘The Times Top 50 Employers for Women 2015’. Such milestones give us confidence that we are making progress against our own challenging goals.

Most Trusted Mainstream Bank
June 2015

25 Best Big Companies to Work For 2015
April 2015
| 2 | Santander UK plc |
Table of Contents
Chair’s review | Chief Executive Officer’s review | KPIs | Chief Financial Officer’s review |
Shriti Vadera sets out our position as a ‘scale challenger’ in the UK banking sector and gives an overview of changes to the Board
|
| See Our heritage and Santander UK today on pages 2 and 3 of the 2014 Annual Report | |
| See the Compass and our business model on pages 6 and 7 of the 2014 Annual Report | |
| See Governance report on page 145 of the 2014 Annual Report | |
| See Corporate Social Responsibility review on page 22 of the 2014 Annual Report | |

I would like to thank all of my colleagues for all they have done, and continue to do, to transform the business. Their dedication, commitment and loyalty underpins our success.
A priority for the coming years will be to ensure that Santander UK and our customers are well prepared for the very significant structural changes that will result from implementation of the Financial Services (Banking Reform) Act 2013. Our plans to establish a retail bank for our personal and small business customers and a corporate bank for our corporate and institutional customers and markets business will enable us to continue our growth in the UK, while also preparing us to conform with the new regulatory regime.
I do not underestimate the very significant challenges to our systems and our people of implementation on multiple simultaneous fronts – the scale of regulatory changes on our balance sheet and operations, the cultural changes that need embedding, and the digital transformation to be initiated in parallel to giving customers the choices they need as they themselves adapt to digital use. And all the while ensuring we are profitable, improve our cost-to-income ratio and win competitive market share as a challenger. I remain confident in the ability of Nathan and his team to manage this transformation risk effectively and well.
The Board
I would like to pay tribute to the Chairmanship of my predecessor Lord Burns and to personally thank him for the enormous support and advice he has provided me during and since the period of transition. His strategic leadership and courageous decisions over 14 years saw the creation of Santander UK and, with the rest of the Board and management, he steered it successfully through the financial crisis.
Terry and Ana leave behind a legacy of which we can all be proud, but importantly a bank that is well placed to look to the future under Nathan’s leadership.
To date, 2015 has been a year of considerable change on the Board. Chris Jones succeeded Rosemary Thorne as the Chair of Board Audit Committee with effect from 30 June 2015. Chris has significant experience in financial services since the mid-1980s after specialising in the audit of banks during his time as a Senior Audit Partner and leader of PwC’s EMEA Financial Services practice. Demonstrating our commitment to digital change, Genevieve Shore joined the Board as an Independent Non-Executive Director on 18 May 2015 and brings a wealth of digital experience gained through her extensive executive career at Pearson and Penguin, where she led and implemented innovative technology solutions. Scott Wheway has been appointed as a Senior Independent Director. Scott joined the Board in October 2013 and has extensive experience in retail and financial services.
We continue to review the composition, experience and skill set of the Board on an ongoing basis to ensure that we are well placed for future challenges.
I would like to thank two long-serving Directors for their commitment and dedication over many years. José María Carballo stepped down in March 2015 after 10 years, and Rosemary Thorne stepped down from her position as Independent Non-Executive Director and Chair of the Board Audit Committee on 30 June 2015 after nine years. I would also like to thank Stephen Jones, who steps down as Director and Chief Financial Officer at the end of October.
| 2015 Half Yearly Financial Report | 3 |
Table of Contents
Strategic report update | Helping people and businesses prosper |
Chief Executive
Officer’s review
“Our ongoing focus on operational and digital excellence has led to a much improved customer experience and will remain at the heart of our future plans”
Nathan Bostock
Chief Executive Officer
12 August 2015
Our strategic priorities
| 1 | Loyal and satisfied retail customers |
| 2 | ‘Bank of Choice’ for UK companies |
| 3 | Consistent profitability and a strong balance sheet |
We have delivered a strong set of results for the first half of the year, with good momentum in profitability. We have achieved our 2015 targets for 1I2I3 World and customer satisfaction ahead of schedule, and remained the first choice for UK retail customers switching their current account provider. We also grew lending to UK companies by £1.8bn in the past six months, maintaining positive momentum in an increasingly competitive market.
Economic and market backdrop
The UK economy continued to grow at a steady pace in early 2015, approaching the strongest performance for several years. Consumer spending growth in the first quarter of 2015 continued to be supported by solid gains in employment and further falls in unemployment. More recently, there has been a boost from the return of real earnings growth, due to low inflation and faster average wage increases.
Mortgage lending growth in the first half of 2015 continued the positive trend of the second half of 2014, underpinned by the positive economic fundamentals of record low mortgage rates, high consumer confidence, low unemployment and positive real earnings growth. Annual corporate borrowing growth remained subdued as companies continued to rely on other sources of finance.
The demands of high volumes of regulatory and competition reviews facing the UK banking sector continued in the first half of 2015. We remain actively engaged in formal policy consultation processes and in close dialogue with our regulators. We support proportionate developments in regulation which increase competition in the market and lead to better outcomes for our customers.
The most significant change facing the banking sector is the UK Government’s proposals for major banks to separate their wholesale and investment banking functions from their retail operations, as laid out in the Financial Services (Banking Reform) Act 2013.
Our customer-focused strategy, low risk approach and fewer legacy issues leave us well aligned to the reform agenda. We intend to establish a bank for retail and small business customers, as well as a separate bank dedicated to corporate and institutional customers and our markets business. As a scale challenger, we believe this approach will enable us to meet the distinct needs of the different segments of our retail, corporate and institutional customer base and comply with the Banking Reform Act by 1 January 2019, as required.
Improving how we do business and making our processes and systems even more simple, personal and fair is key to our continued success. We continue to invest in our digital and mobile platforms and have made a number of improvements to the service we offer this year. We have adopted the Apple Pay service to enable users to pay for goods and services using their phone and launched a new app, ‘Spendlytics’, which enables users to track, analyse and understand their debit and credit card spend in detail. In 2015, we are continuing to focus on digital developments, in particular security, new services, increased functionality across platforms and a single consolidated account view for each customer.
Loyal and satisfied retail customers
We have made significant improvements to our products and services in the past three years. We have now closed the gap between our retail customer satisfaction score and that of the average three highest performers among our peers.
Current account switchers(1)
1-in-4
We gained more customers than any other UK bank as part of the Current Account Switch Scheme (‘CASS’) since it launched in September 2013.
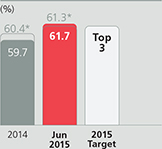
Retail customer satisfaction (‘FRS’)(2)
61.7%
Significantly improved customer satisfaction since June 2012.
| 4 | Santander UK plc |
Table of Contents
Chair’s review | Chief Executive Officer’s review | KPIs | Chief Financial Officer’s review |
Nathan Bostock reports on the backdrop to our business and performance in the first half of 2015
|
| See Top and Emerging Risks on pages 13 and 14 |
Further improvements are at the heart of our plans, as we aim to achieve the best outcomes for customers.
We now have 4.3 million 1I2I3 World customers, well above our 2015 target of four million, with an associated increase in our loyal customer base. Total banking and savings balances held by primary banking customers increased 14% to £80.4bn at 30 June 2015, enabling us to focus on lower cost, more loyal deposits.
Our 1I2I3 Current Account and much improved customer service make Santander UK the first choice for customers changing their bank. Over 500,000 customers have switched their current account to Santander UK since the introduction of the Current Account Switch Service in September 2013.
‘Bank of Choice’ for UK companies
We have made a substantial investment over the past three years to increase the business we do with SMEs and larger corporates. This investment is largely complete and we now have 68 regional Corporate Business Centres and 729 relationship managers around the UK to support local businesses. Our focus going forward is to build productivity across our platform with the broader product suite and with the extended footprint we have in place.
We continued to deliver an improvement in corporate customer satisfaction(3), as well as an improvement in our rating for overall relationship management quality compared with a year ago.
In the first half of 2015 we extended £4.5bn of new facilities to SMEs and mid-sized corporates, an increase of 15%, with total customer loans increasing to £25.7bn. Commercial bank account openings increased by 15% with acceleration in the usage of our corporate banking platform.
Consistent profitability and a strong balance sheet
Profit before tax increased to £929m in the first half of 2015, a strong result in a competitive environment. Net interest income was higher, driving an increase in the banking net interest margin(4) to 1.86%, up 6 basis points since June 2014.
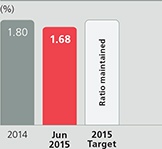
The ratio of non-performing loans to total customer loans improved to 1.68% from 1.80% at 31 December 2014, with retail and corporate loans both performing well in an improving credit environment.
The balance sheet remained strong, with a Common Equity Tier 1 capital ratio of 11.7% and an improved leverage ratio of 4.1%. In June 2015, we completed our first public issuance from Santander UK Group Holdings plc with the issuance of £750m of Additional Tier 1 securities, which was well received by the market.
Looking forward
We have done much to improve the customer experience and to begin embedding our cultural values while improving the customer experience with our new digital platforms. Making further improvements to customer satisfaction, maintaining control of costs and building our digital business remain key priorities for us.
Our current key performance indicators were set in 2012 and are measured against a target date of 2015. Our key performance indicators and targets will be updated at the Banco Santander Investor Day in late September 2015 when we will set out our new medium-term objectives.
The structural reforms of the UK banking sector will lead to significant change in the coming years; we will keep all stakeholders updated as we evolve our new operating models. I am confident that Santander UK offers a strong challenge and can continue to grow both its retail and corporate banking propositions profitably.
Sources: ‘Glossary’ on page 137 for definitions.
| (1) | Bacs, Current Account Switch Service statistics, June 2015 |
| (2) | Financial Research Survey, GfK NOP, June 2015 |
| (3) | Business Banking Survey, Charterhouse UK Q2 2015 |
| (4) | Non-IFRS measure. See page 139. |
| 2015 Half Yearly Financial Report | 5 |
Table of Contents
Strategic report update | Helping people and businesses prosper |
Performance against our KPIs | KPIs help us measure progress towards our 2015 targets. They were set in 2012 and aligned to our strategic priorities. |
1 | Loyal and satisfied
| Loyal customers As part of our transformation to a more customer-focused organisation, we seek to develop and build deeper customer relationships. We are on-track to deliver our 2015 target. | 1I2I3 World customers Our 1I2I3 World products are key to our strategy of building deeper customer relationships and delivering ongoing value to our customers. | |||
| Deepening our customers’ loyalty by meeting their changing needs |  | 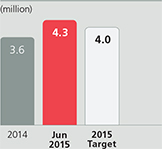 | ||||
2 | ‘Bank of Choice’ for
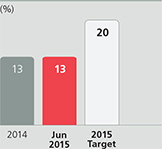
Growing our business with corporate customers, while expanding the range of products and services we offer to them | Corporate loans percentage of total customer loans A key element of our strategy is to diversify the business mix, in terms of income and customer base, and to provide a better strategic balance. We have consistently grown corporate lending since 2012, in what has been
|
a shrinking market. However, we will not compromise our prudent risk management and return objectives and do not expect to achieve our 2015 target - which was set with the prospect of an acquisition which we did not subsequently proceed with. | |||
3 | Consistent
Providing our shareholders with a sustainable return on their investment | Adjusted RoTE(1) We monitor return on tangible equity (‘RoTE’) to measure the overall profitability and sustainability of the business. We are unlikely to reach our 2015 target as we are holding more capital than we assumed when the target was set in 2012.
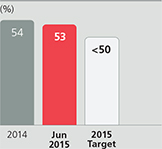
| Cost-to-income ratio We monitor this ratio to measure our operating efficiency. We are unlikely to reach our 2015 target given investment spend and regulatory compliance costs, which have been higher than anticipated when the target was set in 2012.
| |||

| (1) | Non-IFRS measure. See page 139. |
| 6 | Santander UK plc |
Table of Contents
Chair’s review | Chief Executive Officer’s review | KPIs | Chief Financial Officer’s review |
Nathan Bostock explains our KPI performance and the progress made against our strategic priorities
|
| ||
Retail customer satisfaction (‘FRS’)(1) We place a significant focus on improving the customer experience and putting the customer at the heart of what we do. See ‘Glossary’ on page 137.
*Avg. of 3 highest performing peers
| ||
| CET 1 capital ratio | Loan-to-deposit ratio (‘LDR’) | Non-performing loan (‘NPL’) ratio | Dividend payout ratio | |||
| We monitor the Common Equity Tier 1 (‘CET 1’) capital ratio to assess our capacity to grow while maintaining sufficient capital resources to meet regulatory requirements. | We monitor the LDR to assess our ability to fund customer lending with customer deposits, reducing our reliance on wholesale markets. | We monitor the NPL ratio as an important measure of risk in our business to ensure it remains consistent with our low-to-moderate risk appetite. | We monitor the dividend payout ratio to ensure we are able to grow the business while maintaining a sustainable return for our shareholder. | |||
|
|
|
| |||
| (1) | Financial Research Survey, GFK NOP, June 2015 |
| 2015 Half Yearly Financial Report | 7 |
Table of Contents
Strategic report update | Helping people and businesses prosper |
Officer’s review
“In June 2015, we successfully launched our first public issuance from Santander UK Group Holdings plc. This £750m Additional Tier 1 capital securities issuance was well-received by the market.”
Stephen Jones
Chief Financial Officer
12 August 2015
Profit before tax of £929m was up strongly in the first half of 2015, with continued growth in net interest income, underlying cost efficiency and robust credit quality.
Income statement highlights(A)
Profit after tax increased to £734m in the first half of 2015, with adjusted RoTE(1) improving to 12.8% (2014: 10.4%).
Net interest income was 7% higher, driven by improved margins and increased unsecured retail and corporate lending.
Non-interest income was 4% lower, reflecting lower net banking fee income in Retail Banking. This was partially offset by higher banking fee and international payments income in Commercial Banking as well as higher revenues from client derivative and cash sales activities in Corporate & Institutional Banking.
Operating expenses fell 2%, largely due to a number of specific gains, expenses and charges which increased operating expenses by £86m in the first half of 2014. Excluding this impact, operating expenses in the first half of 2015 increased due to investment in business growth, regulatory compliance project costs (including banking reform) and continued enhancements to our digital channels.
Operating impairment losses, provisions and charges were significantly lower, in part due to specific provisions with a net impact of £120m in the first half of 2014.
Excluding these provisions, impairment losses in the first half of 2015 were lower due to improved economic conditions, lower mortgage impairment losses as well as provision releases in Corporate & Institutional Banking and Corporate Centre following the disposal and restructuring of certain loans. Charges associated with our programme of branch de-duplication were also lower.
Customer balances(B)
Customer assets grew £5.5bn to £196.2bn following the commencement of the PSA cooperation, which added a vehicle finance loan book of £2.5bn to the balance sheet in February 2015 (See Note 35 to the Condensed Consolidated Interim Financial Statements). In addition, during the first half of the year, corporate customer loans increased by £1.8bn to £25.7bn and mortgage balances increased by £0.6bn to £150.7bn. The growth in mortgage loans was driven by stronger approval volumes in the first and second quarters of the year, following lower volumes in late 2014. Mortgage gross lending in the first half of 2015 was £11.9bn and we also retained about 80% of maturing products onto new Santander UK mortgages. Customer deposits increased £4.7bn to £157.1bn at 30 June 2015, as we focused on retaining and originating accounts held by more loyal customers.
| (A) | Income statement highlights |
| 6 months ended | 30 June 2015 £m | 30 June 2014 £m | ||||||
Net interest income | 1,783 | 1,673 | ||||||
Non-interest income(2) | 500 | 519 | ||||||
Operating expenses(3) | (1,200 | ) | (1,223 | ) | ||||
Operating impairment losses, provisions and charges | (154 | ) | (424 | ) | ||||
Profit before tax | 929 | 545 | ||||||
Profit after tax | 734 | 438 | ||||||
| (1) | Non-IFRS measure. See page 139. |
| (2) | Non-interest income is comprised of Net fee and commission income and Net trading and other income. |
| (3) | Operating expenses equals Total operating expenses excluding impairment losses, provisions and charges. |
| 8 | Santander UK plc |
Table of Contents
Chair’s review | Chief Executive Officer’s review | KPIs | Chief Financial Officer’s review |
Stephen Jones outlines the financial results for the first half of 2015.
|
Retail Banking current account balances grew by £6.6bn to a total of £47.7bn, partially offset by lower savings balances. Commercial Banking deposits grew £1.3bn as we increased the utilisation of our expanded Corporate Banking capabilities to build upon our strong customer relationships.
The loan-to-deposit ratio of 124% was unchanged from December 2014. The positive impact of continued strong growth in retail current accounts was offset by the impact of the PSA cooperation.
Credit quality(C)
The Retail Banking non-performing loan ratio improved to 1.53% at 30 June 2015, as a result of lower mortgage non-performance and overall growth in retail assets. The residential mortgage non-performing loan ratio was 1.57%, reflecting good performance of the portfolio supported by low interest rates, rising house prices and falling unemployment. We are conscious that these conditions may not continue and our provisions reflect our conservative position on the UK economy and the housing market, notwithstanding current trends. The banking and consumer credit non-performing loan ratio decreased to 1.05%, mainly as a result of the commencement of the PSA cooperation.
The Commercial Banking non-performing loan ratio decreased to 3.25% at 30 June 2015, with credit quality remaining strong. We continue to adhere to our prudent criteria as we grow lending.
The Corporate & Institutional Banking non-performing loan ratio decreased to 0.07% at 30 June 2015, due to the disposal of a single loan of £49m as well as asset growth.
Issuance and debt buy-back
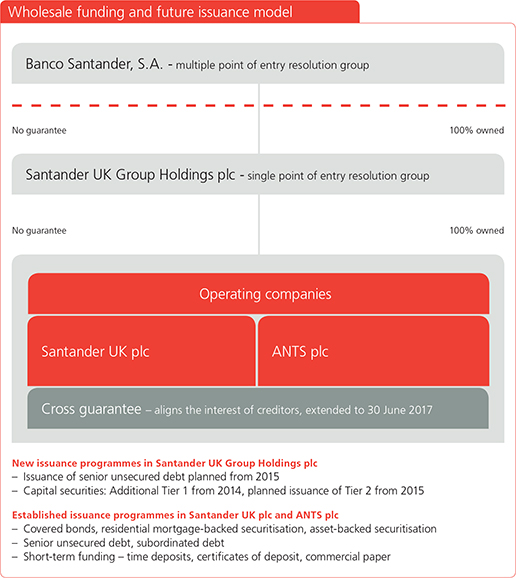
In June 2015, we successfully launched our first public issuance from Santander UK Group Holdings plc. This £750m Additional Tier 1 capital securities issuance was well-received by the market and was downstreamed to Santander UK plc in mirror form with a coupon of 7.375%.
At the same time, we also completed the partial buy-back of four capital instruments in order to improve our capital position, as under current capital regulations, these securities are impacted by both CRD IV Minority Interest and ‘grandfathering’ rules.
Capital and leverage(D)
Risk weighted assets were up £2.9bn to £85.2bn, broadly in line with asset growth and reflecting the commencement of the PSA cooperation.
(B) Customer balances
30 June 2015 £bn | 31 December 2014 £bn | |||||||
Total customer loans | 196.2 | 190.7 | ||||||
Total customer deposits | 157.1 | 152.4 | ||||||
Loan-to-deposit ratio | 124% | 124% | ||||||
(C) Credit quality
30 June 2015 % | 31 December 2014 % | |||||||
Retail Banking NPL ratio | 1.53 | 1.62 | ||||||
Commercial Banking NPL ratio | 3.25 | 3.56 | ||||||
Corporate & Institutional Banking NPL ratio | 0.07 | 1.01 | ||||||
Corporate Centre NPL ratio | 1.93 | 1.62 | ||||||
Total NPL ratio | 1.68 | 1.80 | ||||||
| 2015 Half Yearly Financial Report | 9 |
Table of Contents
Strategic report update | Helping people and businesses prosper |
Chief Financial
Officer’s review
continued
The CET 1 capital ratio was 11.7%, largely due to the increase in RWAs from the PSA cooperation. The PRA end-point Tier 1 leverage ratio was 4.1%, up from 3.8% at 31 December 2014, mainly due to the £750m Additional Tier 1 issuance.
Liquidity and funding(D)
The liquidity coverage ratio (‘LCR’)(2) eligible liquidity pool decreased £5.0bn, to £34.5bn at 30 June 2015, largely due to the phasing of short-term funding and of medium-term maturities. The decrease is expected to partially reverse in the second half of the year. Wholesale funding with a residual maturity of less than one year decreased £4.4bn, to £18.7bn, reflecting changes in the medium term funding maturity profile. The LCR(2) eligible liquidity pool significantly exceeded wholesale funding of less than one year, with a 184% coverage ratio.
Medium-term funding (‘MTF’) issuance of £8.0bn (sterling equivalent) in the first half of 2015 included £4.3bn of senior unsecured issuance and £750m of Additional Tier 1 securities outlined on the previous page. At 30 June 2015, we had total outstandings of £2.2bn under the Bank of England and HM Treasury’s Funding for Lending Scheme (‘FLS’), with no additional drawings made in 2015.
2015 outlook
We anticipate that the UK economy will continue to be supportive of our business. There is evidence of increasing liquidity in the lending market resulting in competitive pressures in many business lines, which may impact new asset margins. We also expect the implementation costs of regulatory reform to increase significantly in the months ahead as we evolve our new operating models to address ring fencing requirements.
The Banking NIM(2) for 2015 is expected to remain broadly unchanged from the 1.82% we reported for 2014, predicated on the Bank of England base rate not rising this year. Reduced stock margins and new lending margin pressures for mortgages, which started in the second half of 2014, are likely to be largely offset by improvement in liability margins.
We expect our net mortgage lending to grow in line with the market for the rest of the year, and the decline in SVR mortgage balances, which reduced by a net £3.9bn in the first half of 2015, to continue.
The bank Corporation Tax surcharge and changes to the Bank Levy announced in the UK Budget on 10 July 2015 will have a material impact on future earnings.
(D) Liquidity, funding, capital and leverage – CRD IV
30 June 2015 £bn | 31 December 2014 £bn | |||||||
LCR(2) eligible liquidity pool | 34.5 | 39.5 | ||||||
LCR(2) | 109% | 110% | ||||||
Risk Weighted Assets (‘RWAs’) | 85.2 | 82.3 | ||||||
CET 1 capital | 10.0 | 9.8 | ||||||
CET 1 capital ratio | 11.7% | 11.9% | ||||||
PRA end-point Tier 1 leverage ratio(1) | 4.1% | 3.8% | ||||||
(1) The leverage ratio defined by the PRA uses an exposure measure consistent with the Basel Committee’s January 2014 Leverage Ratio Framework.
(2) Non-IFRS measure. See page 139.
| 10 | Santander UK plc |
Table of Contents
Risk governance | Top and emerging risks | Credit risk | Market risk | Balance sheet management risk | Other important risks | Areas of focus and other items | ||||||
|
| 2015 Half Yearly Financial Report | 11 |
Table of Contents
This Risk review contains information that forms an integral part of the Condensed Consolidated Interim Financial Statements.
As a significant financial services provider, risk is at the core of Santander UK’s day-to-day activities. The understanding and control of risk on an enterprise-wide basis is critical for the effective management of the business. Santander UK aims to employ a prudent approach and advanced risk management techniques to facilitate the delivery of robust financial performance, and ultimately build sustainable value for all our stakeholders.
Santander UK aims to maintain a predictable medium-low risk profile, consistent with its business model, which is key to the successful achievement of our strategic objectives.
RISK FRAMEWORK
The Risk Framework in place at 30 June 2015 was based upon the following key components:
| – | Risk definition; |
| – | Risk culture, overriding principles and minimum standards; |
| – | Governance, roles and responsibilities; and |
| – | Internal control system. |
During the first half of 2015, there have been no significant changes to the Risk Framework or the risk governance arrangements as described in the ‘Risk governance’ section in the 2014 Annual Report.
Risk culture, overriding principles and minimum standards
Risk culture plays an important role in our aim to be the best bank for our people, customers, shareholders and communities. Having a strong unified culture is critical to success. Risk culture is embedded into all business units through the implementation of the Santander UK Risk Framework (including Risk Attestations) and a programme of initiatives aligned to our Risk Culture Statement.
During the first half of 2015 we continued our programme of initiatives to help strengthen and embed the risk management culture across Santander UK. Building on the progress made in Retail and Commercial Banking, we are extending our focus across other segments, including Corporate & Institutional Banking. The main aims of this programme are to:
| – | Help embed the Risk Framework through ensuring personal accountability for risk; |
| – | Reinforce the importance of identification, assessment, management, and reporting of all risks. This is achieved through communication, education and training at all levels; |
| – | Enhance and embed risk management across the whole employee life-cycle including recruitment, performance management, and reward; |
| – | Measure behavioural change through ‘speaking up’ campaigns and surveys; and |
| – | Improve the identification and management of risk in planning and change projects. |
Mandatory risk management training was undertaken throughout the period to promote the understanding of Santander UK’s values and risk culture.
| 12 | Santander UK plc |
Table of Contents
Risk governance | emerging risks | Credit risk | Market risk | Balance sheet management risk | Other important risks | Areas of focus and other items | ||||||
|
Top risks in H1 2015 | Strategic priority: | |||
 | Loyal and satisfied retail customers | |||
| ‘Bank of Choice’ for UK companies | |||
| Consistent profitability and a strong balance sheet | |||

| Risk indicator | Risk features, impacts and developments in the first half of 2015 | Strategic priorities | ||||
Banking market |
| Banking market risk could lead to lower income or a loss of value from changes in interest rates. The current low rate environment remains a key concern. We monitor forecasted rates closely and keep our options under review. Net interest margin (‘NIM’) and economic value of equity (‘EVE’) sensitivities were relatively unchanged during the first half of 2015 as the growth in bank account liability volumes was largely offset by additional unhedged fixed rate assets.
|  | |||
Capital |
| Capital risk has the potential to disrupt our business model and stop the normal functions of Santander UK. Failure to meet the capital requirements of regulators could lead them to constrain dividend payments or to resolve Santander UK. The CET 1 capital ratio was 11.7% at 30 June 2015 and was impacted by the commencement of the PSA cooperation in our consumer finance business. The PRA end-point Tier 1 leverage ratio was 4.1%, up from 3.8% at 31 December 2014.
| | |||
Conduct |
| Conduct risk is a key factor in determining if we are meeting our aim to be the best bank for our customers. The remaining provision for PPI redress and related costs amounted to £73m. Monthly utilisation, including proactive customer contact, during the first half of 2015 decreased to £9m per month, against an average of £11m in 2014. Excluding proactive customer contact, the average redress costs during the first half of the year were £6m per month. The high proportion of invalid complaints also continued. Existing non-PPI related conduct provisions amounted to £159m.
|  | |||
Credit |
| Credit risk could reduce the value of our assets as well as increase write-offs and impairment loan loss allowances. The total NPL ratio of 1.68% at 30 June 2015 continued to improve, with retail and corporate loans performing well in an improving credit environment.
| | |||
Liquidity |
| Liquidity risk could affect our ability to meet our financial obligations as well as disrupt our day-to-day operations, business model or lead to the insolvency of Santander UK. Although credit ratings downgrade risk (and the associated impact this might have on the group’s liquidity position) in the medium term has reduced, longer-term risk remains due to the possibility that the Santander UK group’s senior debt issuance plan fall short of expectations over the next two years (whether this is due to eurozone concerns or other causes).
|  | |||
Operational |
| Operational risk could impact any aspect of our business or support processes associated with people, systems or external events which could prevent us from achieving our desired business objectives. The industry-wide threat from cyber- attacks continues to rise; criminal methods are increasing in sophistication, and use of mobile and internet-based products continues to grow. We are mitigating these risks through IT enhancement, and further development of our cyber-threat intelligence function.
| | |||
Pension |
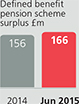
| Pension risk arises to the extent that the assets of the defined benefit pension schemes do not fully match the timing and amount of the schemes’ liabilities and can impact our financial results and capital metrics. The current low interest rate environment remains a concern, as does the potential for assets to fall in value. These risks are monitored closely and strategies to manage their impact kept under review. The Scheme’s accounting position was broadly unchanged at £180m surplus at 30 June 2015 (31 December 2014: £156m surplus).
| | |||

 See ‘Banking market risk’ on page 53.
 See ‘Capital risk’ on page 64.


| (1) | Non-IFRS measure. See page 139. |
| 2015 Half Yearly Financial Report | 13 |
Table of Contents
Risk review
Top and emerging risks
continued
Emerging and
future risks
| Timeframe | Risk description and mitigation | Strategic priorities | ||
1-3 years | The UK economy The financial performance of Santander UK is intrinsically linked to the UK economy. This is particularly so for those aspects that have greatest influence on our larger credit portfolios, such as the housing market and unemployment. In turn, the prospects for the UK are also dependent, to a degree, on the economies of other major trading areas, such as the eurozone.
If the UK economy continues to improve, interest rates are expected to rise, especially if inflation moves back towards the Bank of England’s target rate. In such a scenario, the behaviour of our customers and other market participants might change. This could include increased customer movement and more competitive product pricing.
If the UK economy doesn’t continue to recover as expected, or even experiences a downturn, Bank of England interest rates may remain at record low levels or even be reduced further. This could affect credit losses, net interest margins and pension risk.
We continue to monitor these risks regularly, and assess their potential impacts with scenario analysis. |  | ||
New and emerging regulation The aftermath of the financial crisis has seen the emergence of a significant volume of additional regulation in the UK, the US and other jurisdictions. In some cases, the impact on Santander UK has become clearer and more precisely quantified. In response to these new regulations, a number of significant change projects are already under way, including those relating to the Financial Services (Banking Reform) Act 2013. We regularly assess the potential impact of regulation to gauge its implications on our risk profile and financial resources, including capital. However, there also remains a significant body of emerging regulation where the impact and timing remain uncertain.
The first half of 2015 has also seen the advent of further market reviews which may affect our business. | | |||
IT and business change Santander UK continues to invest in new IT platforms and systems, to support its strategic growth plans. There are also a number of key business change initiatives under way, the successful delivery of which is crucial to meet regulatory demands and strategic aims. As with any significant change programmes of this nature, we continue to monitor and control the risks associated with the pace of change. | | |||
New competitors and technology Innovations in technology continued to develop at a rapid pace. We have also seen the advent of new financial services providers. These factors bring with them the potential for increased levels of competition in the medium term.
| | |||
More than 3 years | The UK and European political environments Following the May 2015 UK general election, the UK Government committed to renegotiating the terms of the UK’s membership of the European Union and subsequently holding a referendum.
The EU itself also continues to face uncertainty, especially as the economic and political environment develops, particularly in eurozone member states, including Greece. We continue to monitor the potential consequences for our business plan from any associated impacts.
| | ||
| 14 | Santander UK plc |
Table of Contents
Risk governance | Top and emerging risks | Credit risk | Market risk | Balance sheet management risk | Other important risks | Areas of focus and other items | ||||||
|
During the first half of 2015, there have been no significant changes to Santander UK’s credit risk management policies, as described in the ‘Credit risk management’ section in the 2014 Annual Report.
Maximum exposure and net exposure to credit risk
The tables below set out the main differences between the Santander UK group’s maximum exposure and net exposure to credit risk. They show the effects of collateral, netting, and risk transfer to mitigate the Santander UK group’s exposure. The tables present only those financial assets subject to credit risk.
For balance sheet assets, the maximum exposure to credit risk represents the carrying value after allowance for impairment. Off-balance sheet exposures comprise guarantees, formal standby facilities, credit lines and other commitments. For off-balance sheet guarantees, the maximum exposure is the maximum amount that Santander UK would have to pay if the guarantees were to be called upon. For formal standby facilities, credit lines and other commitments that are irrevocable over the life of the respective facilities, the maximum exposure is the full amount of the committed facilities.
| Maximum exposure | Collateral | |||||||||||||||||||||||||||||||||||
| Balance sheet asset | ||||||||||||||||||||||||||||||||||||
| Gross amounts | Loan loss allowance | Net amounts | Off-balance sheet | Cash(1) | Non-cash(1) | Netting(2) | Risk transfer(3) | Net exposure | ||||||||||||||||||||||||||||
30 June 2015 | £bn | £bn | £bn | £bn | £bn | £bn | £bn | £bn | £bn | |||||||||||||||||||||||||||
Cash and balances at central banks | 15.2 | — | 15.2 | — | — | — | — | — | 15.2 | |||||||||||||||||||||||||||
|
|
|
|
|
|
|
|
|
|
|
|
|
|
|
|
|
| |||||||||||||||||||
Trading assets: | ||||||||||||||||||||||||||||||||||||
- Loans and advances to banks | 7.1 | — | 7.1 | — | — | — | (1.7 | ) | — | 5.4 | ||||||||||||||||||||||||||
- Loans and advances to customers | 5.6 | — | 5.6 | — | — | (4.1 | ) | — | — | 1.5 | ||||||||||||||||||||||||||
- Debt securities | 5.9 | — | 5.9 | — | — | — | — | — | 5.9 | |||||||||||||||||||||||||||
|
|
|
|
|
|
|
|
|
|
|
|
|
|
|
|
|
| |||||||||||||||||||
Total trading assets | 18.6 | — | 18.6 | — | — | (4.1 | ) | (1.7 | ) | — | 12.8 | |||||||||||||||||||||||||
|
|
|
|
|
|
|
|
|
|
|
|
|
|
|
|
|
| |||||||||||||||||||
Financial assets designated at fair value: | ||||||||||||||||||||||||||||||||||||
- Loans and advances to customers | 2.1 | — | 2.1 | 0.2 | — | (2.3 | ) | — | — | — | ||||||||||||||||||||||||||
- Debt securities | 0.6 | — | 0.6 | — | — | — | — | — | 0.6 | |||||||||||||||||||||||||||
|
|
|
|
|
|
|
|
|
|
|
|
|
|
|
|
|
| |||||||||||||||||||
Total financial assets designated at fair value | 2.7 | — | 2.7 | 0.2 | — | (2.3 | ) | — | — | 0.6 | ||||||||||||||||||||||||||
|
|
|
|
|
|
|
|
|
|
|
|
|
|
|
|
|
| |||||||||||||||||||
Available-for-sale debt securities | 9.1 | — | 9.1 | — | — | — | — | — | 9.1 | |||||||||||||||||||||||||||
|
|
|
|
|
|
|
|
|
|
|
|
|
|
|
|
|
| |||||||||||||||||||
Derivative financial instruments | 20.6 | — | 20.6 | — | (0.7 | ) | — | (17.0 | ) | — | 2.9 | |||||||||||||||||||||||||
|
|
|
|
|
|
|
|
|
|
|
|
|
|
|
|
|
| |||||||||||||||||||
Loans and advances to banks | 2.5 | — | 2.5 | 1.2 | — | (0.9 | ) | — | (0.1 | ) | 2.7 | |||||||||||||||||||||||||
|
|
|
|
|
|
|
|
|
|
|
|
|
|
|
|
|
| |||||||||||||||||||
Loans and advances to customers(4): | ||||||||||||||||||||||||||||||||||||
- Advances secured on residential property | 151.2 | (0.6 | ) | 150.6 | 6.7 | — | (157.2 | ) | — | — | 0.1 | |||||||||||||||||||||||||
- Corporate loans | 30.8 | (0.4 | ) | 30.4 | 15.1 | (0.1 | ) | (22.7 | ) | — | — | 22.7 | ||||||||||||||||||||||||
- Finance leases | 6.4 | (0.1 | ) | 6.3 | — | (0.1 | ) | (5.2 | ) | — | — | 1.0 | ||||||||||||||||||||||||
- Other secured advances | — | — | — | — | — | — | — | — | — | |||||||||||||||||||||||||||
- Other unsecured advances | 6.7 | (0.2 | ) | 6.5 | 12.1 | — | — | — | — | 18.6 | ||||||||||||||||||||||||||
- Amounts due from fellow subsidiaries, associates and joint ventures | 1.1 | — | 1.1 | — | — | — | — | — | 1.1 | |||||||||||||||||||||||||||
|
|
|
|
|
|
|
|
|
|
|
|
|
|
|
|
|
| |||||||||||||||||||
Total loans and advances to customers | 196.2 | (1.3 | ) | 194.9 | 33.9 | (0.2 | ) | (185.1 | ) | — | — | 43.5 | ||||||||||||||||||||||||
|
|
|
|
|
|
|
|
|
|
|
|
|
|
|
|
|
| |||||||||||||||||||
Loans and receivables securities(4) | 0.1 | — | 0.1 | — | — | — | — | — | 0.1 | |||||||||||||||||||||||||||
|
|
|
|
|
|
|
|
|
|
|
|
|
|
|
|
|
| |||||||||||||||||||
Total | 265.0 | (1.3 | ) | 263.7 | 35.3 | (0.9 | ) | (192.4 | ) | (18.7 | ) | (0.1 | ) | 86.9 | ||||||||||||||||||||||
|
|
|
|
|
|
|
|
|
|
|
|
|
|
|
|
|
| |||||||||||||||||||
| (1) | The forms of collateral which Santander UK takes to mitigate credit risk include: residential and commercial property; other physical assets, including motor vehicles; liquid securities, including those transferred under reverse repurchase agreements; cash, including that which is used to collateralise derivative transactions; and receivables. In terms of exposure, charges on residential property represent the majority of collateral taken. |
| (2) | Credit risk exposures can be reduced by applying netting and set-off. Santander UK uses this approach mainly for derivative and repurchase transactions with financial institutions. For derivatives transactions, Santander UK uses standard master netting agreements (e.g. ISDA). These agreements allow for netting of credit risk exposure to a counterparty resulting from a derivative transaction against Santander UK’s obligations to the counterparty in the event of default, to produce a lower net credit exposure. They may also reduce settlement exposure. |
| (3) | Certain financial instruments can be used to transfer credit risk from Santander UK to another counterparty. The main form of risk transfer employed by Santander UK is the use of credit default swaps, principally transacted with other banks. |
| (4) | Loans and advances to customers and loans and receivables securities include interest charged to the customer’s account and interest accrued but not yet charged to the account. |
| 2015 Half Yearly Financial Report | 15 |
Table of Contents
Risk review
Credit risk
| Maximum exposure | Collateral | |||||||||||||||||||||||||||||||||||
| Balance sheet asset | ||||||||||||||||||||||||||||||||||||
31 December 2014 | Gross amounts £bn | Loan loss allowance £bn | Net amounts £bn | Off-balance sheet £bn | Cash(1) £bn | Non-cash(1) £bn | Netting(2) £bn | Risk transfer(3) £bn | Net exposure £bn | |||||||||||||||||||||||||||
Cash and balances at central banks | 22.6 | — | 22.6 | — | — | — | — | — | 22.6 | |||||||||||||||||||||||||||
|
|
|
|
|
|
|
|
|
|
|
|
|
|
|
|
|
| |||||||||||||||||||
Trading assets: | ||||||||||||||||||||||||||||||||||||
- Loans and advances to banks | 5.9 | — | 5.9 | — | — | — | (0.8 | ) | — | 5.1 | ||||||||||||||||||||||||||
- Loans and advances to customers | 3.0 | — | 3.0 | — | — | (2.2 | ) | — | — | 0.8 | ||||||||||||||||||||||||||
- Debt securities | 8.0 | — | 8.0 | — | — | — | — | �� | — | 8.0 | ||||||||||||||||||||||||||
|
|
|
|
|
|
|
|
|
|
|
|
|
|
|
|
|
| |||||||||||||||||||
Total trading assets | 16.9 | — | 16.9 | — | — | (2.2 | ) | (0.8 | ) | — | 13.9 | |||||||||||||||||||||||||
|
|
|
|
|
|
|
|
|
|
|
|
|
|
|
|
|
| |||||||||||||||||||
Financial assets designated at fair value: | ||||||||||||||||||||||||||||||||||||
- Loans and advances to customers | 2.3 | — | 2.3 | 0.2 | — | (2.4 | ) | — | — | 0.1 | ||||||||||||||||||||||||||
- Debt securities | 0.6 | — | 0.6 | — | — | — | — | — | 0.6 | |||||||||||||||||||||||||||
|
|
|
|
|
|
|
|
|
|
|
|
|
|
|
|
|
| |||||||||||||||||||
Total financial assets designated at fair value | 2.9 | — | 2.9 | 0.2 | — | (2.4 | ) | — | — | 0.7 | ||||||||||||||||||||||||||
|
|
|
|
|
|
|
|
|
|
|
|
|
|
|
|
|
| |||||||||||||||||||
Available-for-sale debt securities | 8.9 | — | 8.9 | — | — | — | — | — | 8.9 | |||||||||||||||||||||||||||
|
|
|
|
|
|
|
|
|
|
|
|
|
|
|
|
|
| |||||||||||||||||||
Derivative financial instruments | 23.0 | — | 23.0 | — | (1.3 | ) | — | (19.2 | ) | — | 2.5 | |||||||||||||||||||||||||
|
|
|
|
|
|
|
|
|
|
|
|
|
|
|
|
|
| |||||||||||||||||||
Loans and advances to banks | 2.1 | — | 2.1 | 1.7 | — | (0.3 | ) | — | (0.1 | ) | 3.4 | |||||||||||||||||||||||||
|
|
|
|
|
|
|
|
|
|
|
|
|
|
|
|
|
| |||||||||||||||||||
Loans and advances to customers(4): | ||||||||||||||||||||||||||||||||||||
- Advances secured on residential property | 150.5 | (0.6 | ) | 149.9 | 6.7 | — | (156.5 | ) | — | — | 0.1 | |||||||||||||||||||||||||
- Corporate loans | 29.9 | (0.6 | ) | 29.3 | 14.9 | (0.1 | ) | (20.1 | ) | — | — | 24.0 | ||||||||||||||||||||||||
- Finance leases | 2.7 | — | 2.7 | — | (0.1 | ) | (2.2 | ) | — | — | 0.4 | |||||||||||||||||||||||||
- Other secured advances | — | — | — | — | — | — | — | — | — | |||||||||||||||||||||||||||
- Other unsecured advances | 6.2 | (0.2 | ) | 6.0 | 11.2 | — | — | — | — | 17.2 | ||||||||||||||||||||||||||
- Amounts due from fellow subsidiaries, associates and joint ventures | 0.8 | — | 0.8 | — | — | — | — | — | 0.8 | |||||||||||||||||||||||||||
|
|
|
|
|
|
|
|
|
|
|
|
|
|
|
|
|
| |||||||||||||||||||
Total loans and advances to customers | 190.1 | (1.4 | ) | 188.7 | 32.8 | (0.2 | ) | (178.8 | ) | — | — | 42.5 | ||||||||||||||||||||||||
|
|
|
|
|
|
|
|
|
|
|
|
|
|
|
|
|
| |||||||||||||||||||
Loans and receivables securities(4) | 0.1 | — | 0.1 | — | — | — | — | — | 0.1 | |||||||||||||||||||||||||||
|
|
|
|
|
|
|
|
|
|
|
|
|
|
|
|
|
| |||||||||||||||||||
Total | 266.6 | (1.4 | ) | 265.2 | 34.7 | (1.5 | ) | (183.7 | ) | (20.0 | ) | (0.1 | ) | 94.6 | ||||||||||||||||||||||
|
|
|
|
|
|
|
|
|
|
|
|
|
|
|
|
|
| |||||||||||||||||||
| (1) | The forms of collateral which Santander UK takes to mitigate credit risk include: residential and commercial property; other physical assets, including motor vehicles; liquid securities, including those transferred under reverse repurchase agreements; cash, including that which is used to collateralise derivative transactions; and receivables. In terms of exposure, charges on residential property represent the majority of collateral taken. |
| (2) | Credit risk exposures can be reduced by applying netting and set-off. Santander UK uses this approach mainly for derivative and repurchase transactions with financial institutions. For derivatives transactions, Santander UK uses standard master netting agreements (e.g. ISDA). These agreements allow for netting of credit risk exposure to a counterparty resulting from a derivative transaction against Santander UK’s obligations to the counterparty in the event of default, to produce a lower net credit exposure. They may also reduce settlement exposure. |
| (3) | Certain financial instruments can be used to transfer credit risk from one counterparty to another. The main form of risk transfer employed by Santander UK is through the use of credit default swaps, principally transacted with banks. |
| (4) | Loans and advances to customers and loans and receivables securities include interest charged to the customer’s account and interest accrued but not yet charged to the account. |
Credit quality
Santander UK uses a single rating scale to provide a consistent approach for reporting default risk across all the credit risk portfolios. The scale is comprised of eight grades for non-defaulted exposures numbered from 9 (lowest risk) to 2 (highest risk). Each grade is defined by an upper and lower probability of default (‘PD’) value and is scaled so that the default risk increases by a factor of 10 for every 2 step reduction in the grade number. For example, risk grade 9 equates to an average PD of 0.01%, and risk grade 7 equates to an average PD of 0.1%. Defaulted exposures are assigned to grade 1 and a PD value of 100%. An approximation to the equivalent credit rating grade used by Standard and Poor’s Ratings Services (‘S&P’) is shown in the final column of the table.
| PD range | ||||||||||||||||
Santander UK risk grade | Mid % | Lower % | Upper % | S&P equivalent | ||||||||||||
9 | 0.010 | 0.000 | 0.021 | AAA to AA- | ||||||||||||
8 | 0.032 | 0.021 | 0.066 | A+ to A | ||||||||||||
7 | 0.100 | 0.066 | 0.208 | A- to BBB+ | ||||||||||||
6 | 0.316 | 0.208 | 0.658 | BBB to BBB- | ||||||||||||
5 | 1.000 | 0.658 | 2.081 | BB+ to BB- | ||||||||||||
4 | 3.162 | 2.081 | 6.581 | B+ to B | ||||||||||||
3 | 10.000 | 6.581 | 20.811 | B- to CCC | ||||||||||||
2 | 31.623 | 20.811 | 99.999 | CC TO C | ||||||||||||
1 Default | 100.000 | 100.000 | 100.000 | D | ||||||||||||
| 16 | Santander UK plc |
Table of Contents
Risk governance | Top and emerging risks | Credit risk | Market risk | Balance sheet management risk | Other important risks | Areas of focus and other items | ||||||
|
The tables below set out the distribution across the credit rating master scale for those financial assets subject to credit risk. For further detail and commentary on the credit rating profiles of key portfolios, see the Retail Banking (i.e. residential mortgages), Commercial Banking, Corporate & Institutional Banking and Corporate Centre sections.
| Santander UK rating guide | ||||||||||||||||||||||||||||||||||||
| 9 (AAA to AA-) | 8 (A+ to A) | 7 (A- to BBB+) | 6 (BBB to BBB-) | 5 (BB+ to BB-) | 4 (B+ to B) | 1 to 3 (B- to D) | Other(1) | Total | ||||||||||||||||||||||||||||
30 June 2015 | £bn | £bn | £bn | £bn | £bn | £bn | £bn | £bn | £bn | |||||||||||||||||||||||||||
Cash and balances at central banks | 14.1 | — | — | — | — | — | �� | — | 1.1 | 15.2 | ||||||||||||||||||||||||||
|
|
|
|
|
|
|
|
|
|
|
|
|
|
|
|
|
| |||||||||||||||||||
Trading assets: | ||||||||||||||||||||||||||||||||||||
- Loans and advances to banks | 0.2 | 2.4 | 4.4 | 0.1 | — | — | — | — | 7.1 | |||||||||||||||||||||||||||
- Loans and advances to customers | 0.7 | 4.6 | 0.3 | — | — | — | — | — | 5.6 | |||||||||||||||||||||||||||
- Debt securities | 2.0 | 2.9 | 0.5 | 0.5 | — | — | — | — | 5.9 | |||||||||||||||||||||||||||
|
|
|
|
|
|
|
|
|
|
|
|
|
|
|
|
|
| |||||||||||||||||||
Total Trading assets | 2.9 | 9.9 | 5.2 | 0.6 | — | — | — | — | 18.6 | |||||||||||||||||||||||||||
|
|
|
|
|
|
|
|
|
|
|
|
|
|
|
|
|
| |||||||||||||||||||
Financial assets designated at fair value | ||||||||||||||||||||||||||||||||||||
- Loans and advances to customers | 0.7 | 0.7 | 0.6 | — | — | — | — | 0.1 | 2.1 | |||||||||||||||||||||||||||
- Debt securities | — | 0.2 | 0.1 | 0.1 | — | — | — | 0.2 | 0.6 | |||||||||||||||||||||||||||
|
|
|
|
|
|
|
|
|
|
|
|
|
|
|
|
|
| |||||||||||||||||||
Total Financial assets designated at fair value | 0.7 | 0.9 | 0.7 | 0.1 | — | — | — | 0.3 | 2.7 | |||||||||||||||||||||||||||
|
|
|
|
|
|
|
|
|
|
|
|
|
|
|
|
|
| |||||||||||||||||||
Available-for-sale debt securities | 7.3 | 1.3 | 0.5 | — | — | — | — | — | 9.1 | |||||||||||||||||||||||||||
|
|
|
|
|
|
|
|
|
|
|
|
|
|
|
|
|
| |||||||||||||||||||
Derivative financial instruments | 0.4 | 11.5 | 6.3 | 1.5 | 0.5 | — | — | 0.4 | 20.6 | |||||||||||||||||||||||||||
|
|
|
|
|
|
|
|
|
|
|
|
|
|
|
|
|
| |||||||||||||||||||
Loans and advances to banks | 0.2 | 1.7 | 0.1 | 0.5 | — | — | — | — | 2.5 | |||||||||||||||||||||||||||
|
|
|
|
|
|
|
|
|
|
|
|
|
|
|
|
|
| |||||||||||||||||||
Loans and advances to customers(2): | ||||||||||||||||||||||||||||||||||||
- Advances secured on residential property | 1.5 | 17.4 | 67.7 | 43.6 | 7.7 | 7.0 | 6.3 | — | 151.2 | |||||||||||||||||||||||||||
- Corporate loans | 2.8 | 3.4 | 3.0 | 8.3 | 7.3 | 3.7 | 0.9 | 1.4 | 30.8 | |||||||||||||||||||||||||||
- Finance leases | — | — | 0.4 | 1.2 | 2.0 | 1.7 | 0.9 | 0.2 | 6.4 | |||||||||||||||||||||||||||
- Other secured advances | — | — | — | — | — | — | — | — | — | |||||||||||||||||||||||||||
- Other unsecured advances | — | — | 0.2 | 1.4 | 2.6 | 1.0 | 0.5 | 1.0 | 6.7 | |||||||||||||||||||||||||||
- Amounts due from fellow subsidiaries, associates & joint ventures | 1.1 | — | — | — | — | — | — | — | 1.1 | |||||||||||||||||||||||||||
|
|
|
|
|
|
|
|
|
|
|
|
|
|
|
|
|
| |||||||||||||||||||
Total Loans and advances to customers | 5.4 | 20.8 | 71.3 | 54.5 | 19.6 | 13.4 | 8.6 | 2.6 | 196.2 | |||||||||||||||||||||||||||
|
|
|
|
|
|
|
|
|
|
|
|
|
|
|
|
|
| |||||||||||||||||||
Loans and receivables securities(2) | — | — | — | — | — | 0.1 | — | — | 0.1 | |||||||||||||||||||||||||||
|
|
|
|
|
|
|
|
|
|
|
|
|
|
|
|
|
| |||||||||||||||||||
| 31.0 | 46.1 | 84.1 | 57.2 | 20.1 | 13.5 | 8.6 | 4.4 | 265.0 | ||||||||||||||||||||||||||||
|
|
|
|
|
|
|
|
|
|
|
|
|
|
|
| |||||||||||||||||||||
Loan loss allowance | (1.3 | ) | ||||||||||||||||||||||||||||||||||
|
| |||||||||||||||||||||||||||||||||||
Total | 263.7 | |||||||||||||||||||||||||||||||||||
|
| |||||||||||||||||||||||||||||||||||
Of which: | ||||||||||||||||||||||||||||||||||||
Neither past due nor impaired: | ||||||||||||||||||||||||||||||||||||
- Cash and balances at central banks | 14.1 | — | — | — | — | — | — | 1.1 | 15.2 | |||||||||||||||||||||||||||
- Trading assets | 2.9 | 9.9 | 5.2 | 0.6 | — | — | — | — | 18.6 | |||||||||||||||||||||||||||
- Financial assets designated at fair value | 0.7 | 0.9 | 0.7 | 0.1 | — | — | — | 0.3 | 2.7 | |||||||||||||||||||||||||||
- Available-for-sale debt securities | 7.3 | 1.3 | 0.5 | — | — | — | — | — | 9.1 | |||||||||||||||||||||||||||
- Derivative financial instruments | 0.4 | 11.5 | 6.3 | 1.5 | 0.5 | — | — | 0.4 | 20.6 | |||||||||||||||||||||||||||
- Loans and advances to banks | 0.2 | 1.7 | 0.1 | 0.5 | — | — | — | — | 2.5 | |||||||||||||||||||||||||||
- Loans and advances to customers | 5.4 | 20.8 | 71.3 | 54.5 | 19.5 | 13.3 | 3.8 | 2.6 | 191.2 | |||||||||||||||||||||||||||
- Loans and receivables securities | — | — | — | — | — | 0.1 | — | — | 0.1 | |||||||||||||||||||||||||||
|
|
|
|
|
|
|
|
|
|
|
|
|
|
|
|
|
| |||||||||||||||||||
Total neither past due nor impaired | 31.0 | 46.1 | 84.1 | 57.2 | 20.0 | 13.4 | 3.8 | 4.4 | 260.0 | |||||||||||||||||||||||||||
|
|
|
|
|
|
|
|
|
|
|
|
|
|
|
|
|
| |||||||||||||||||||
Past due but not impaired | — | — | — | — | 0.1 | — | 3.4 | — | 3.5 | |||||||||||||||||||||||||||
|
|
|
|
|
|
|
|
|
|
|
|
|
|
|
|
|
| |||||||||||||||||||
Impaired(3) | — | — | — | — | — | 0.1 | 1.4 | — | 1.5 | |||||||||||||||||||||||||||
|
|
|
|
|
|
|
|
|
|
|
|
|
|
|
|
|
| |||||||||||||||||||
| 31.0 | 46.1 | 84.1 | 57.2 | 20.1 | 13.5 | 8.6 | 4.4 | 265.0 | ||||||||||||||||||||||||||||
|
|
|
|
|
|
|
|
|
|
|
|
|
|
|
| |||||||||||||||||||||
Loan loss allowance | (1.3 | ) | ||||||||||||||||||||||||||||||||||
|
| |||||||||||||||||||||||||||||||||||
Total | 263.7 | |||||||||||||||||||||||||||||||||||
|
| |||||||||||||||||||||||||||||||||||
| (1) | Other items include cash in hand and smaller cases predominantly within the consumer finance and commercial mortgages portfolios which are subject to scorecards rather than rating models. |
| (2) | Loans and advances to customers and loans and receivables securities include interest charged to the customer’s account and interest accrued but not yet charged to the account. |
| (3) | Impaired loans consists of loans assessed for observed impairment loss allowances. |
| 2015 Half Yearly Financial Report | 17 |
Table of Contents
Risk review
Credit risk
continued
| Santander UK rating guide | ||||||||||||||||||||||||||||||||||||
| 9 (AAA to AA-) | 8 (A+ to A) | 7 (A- to BBB+) | 6 (BBB to BBB-) | 5 (BB+ to BB-) | 4 (B+ to B) | 1 to 3 (B- to D) | Other(1) | Total | ||||||||||||||||||||||||||||
31 December 2014 | £bn | £bn | £bn | £bn | £bn | £bn | £bn | £bn | £bn | |||||||||||||||||||||||||||
Cash and balances at central banks | 21.1 | — | — | — | — | — | — | 1.5 | 22.6 | |||||||||||||||||||||||||||
|
|
|
|
|
|
|
|
|
|
|
|
|
|
|
|
|
| |||||||||||||||||||
Trading assets: | ||||||||||||||||||||||||||||||||||||
- Loans and advances to banks | 0.1 | 1.2 | 4.6 | — | — | — | — | — | 5.9 | |||||||||||||||||||||||||||
- Loans and advances to customers | — | 2.1 | 0.7 | 0.2 | — | — | — | — | 3.0 | |||||||||||||||||||||||||||
- Debt securities | 2.3 | 4.0 | 1.1 | 0.6 | — | — | — | — | 8.0 | |||||||||||||||||||||||||||
|
|
|
|
|
|
|
|
|
|
|
|
|
|
|
|
|
| |||||||||||||||||||
Total Trading assets | 2.4 | 7.3 | 6.4 | 0.8 | — | — | — | — | 16.9 | |||||||||||||||||||||||||||
|
|
|
|
|
|
|
|
|
|
|
|
|
|
|
|
|
| |||||||||||||||||||
Financial assets designated at fair value | ||||||||||||||||||||||||||||||||||||
- Loans and advances to customers | 0.4 | 0.8 | 1.0 | 0.1 | — | — | — | — | 2.3 | |||||||||||||||||||||||||||
- Debt securities | — | 0.2 | 0.1 | 0.1 | — | 0.2 | — | — | 0.6 | |||||||||||||||||||||||||||
|
|
|
|
|
|
|
|
|
|
|
|
|
|
|
|
|
| |||||||||||||||||||
Total Financial assets designated at fair value | 0.4 | 1.0 | 1.1 | 0.2 | — | 0.2 | — | — | 2.9 | |||||||||||||||||||||||||||
|
|
|
|
|
|
|
|
|
|
|
|
|
|
|
|
|
| |||||||||||||||||||
Available-for-sale debt securities | 8.9 | — | — | — | — | — | — | — | 8.9 | |||||||||||||||||||||||||||
|
|
|
|
|
|
|
|
|
|
|
|
|
|
|
|
|
| |||||||||||||||||||
Derivative financial instruments | 0.4 | 10.8 | 9.7 | 1.4 | 0.4 | — | — | 0.3 | 23.0 | |||||||||||||||||||||||||||
|
|
|
|
|
|
|
|
|
|
|
|
|
|
|
|
|
| |||||||||||||||||||
Loans and advances to banks | 0.3 | 1.4 | 0.3 | 0.1 | — | — | — | — | 2.1 | |||||||||||||||||||||||||||
|
|
|
|
|
|
|
|
|
|
|
|
|
|
|
|
|
| |||||||||||||||||||
Loans and advances to | ||||||||||||||||||||||||||||||||||||
- Advances secured on residential property | 2.3 | 16.1 | 65.2 | 44.2 | 8.1 | 7.7 | 6.9 | — | 150.5 | |||||||||||||||||||||||||||
- Corporate loans | 2.3 | 4.0 | 2.6 | 8.0 | 7.1 | 3.6 | 0.8 | 1.5 | 29.9 | |||||||||||||||||||||||||||
- Finance leases | — | — | 0.2 | 0.5 | 0.8 | 0.7 | 0.4 | 0.1 | 2.7 | |||||||||||||||||||||||||||
- Other secured advances | — | — | — | — | — | — | — | — | — | |||||||||||||||||||||||||||
- Other unsecured advances | — | — | 0.2 | 1.0 | 2.5 | 1.0 | 0.5 | 1.0 | 6.2 | |||||||||||||||||||||||||||
- Amounts due from fellow subsidiaries, associates & joint ventures | 0.7 | — | — | — | 0.1 | — | — | — | 0.8 | |||||||||||||||||||||||||||
|
|
|
|
|
|
|
|
|
|
|
|
|
|
|
|
|
| |||||||||||||||||||
Total Loans and advances to customers | 5.3 | 20.1 | 68.2 | 53.7 | 18.6 | 13.0 | 8.6 | 2.6 | 190.1 | |||||||||||||||||||||||||||
|
|
|
|
|
|
|
|
|
|
|
|
|
|
|
|
|
| |||||||||||||||||||
Loans and receivables securities(2) | — | — | 0.1 | — | — | — | — | — | 0.1 | |||||||||||||||||||||||||||
|
|
|
|
|
|
|
|
|
|
|
|
|
|
|
|
|
| |||||||||||||||||||
| 38.8 | 40.6 | 85.8 | 56.2 | 19.0 | 13.2 | 8.6 | 4.4 | 266.6 | ||||||||||||||||||||||||||||
|
|
|
|
|
|
|
|
|
|
|
|
|
|
|
| |||||||||||||||||||||
Loan loss allowance | (1.4 | ) | ||||||||||||||||||||||||||||||||||
|
| |||||||||||||||||||||||||||||||||||
Total | 265.2 | |||||||||||||||||||||||||||||||||||
|
| |||||||||||||||||||||||||||||||||||
Of which: | ||||||||||||||||||||||||||||||||||||
Neither b past due nor impaired: | ||||||||||||||||||||||||||||||||||||
- Cash and balances at central banks | 21.1 | — | — | — | — | — | — | 1.5 | 22.6 | |||||||||||||||||||||||||||
- Trading assets | 2.4 | 7.3 | 6.4 | 0.8 | — | — | — | — | 16.9 | |||||||||||||||||||||||||||
- Financial assets designated at fair value | 0.4 | 1.0 | 1.1 | 0.2 | — | 0.2 | — | — | 2.9 | |||||||||||||||||||||||||||
- Available-for-sale debt securities | 8.9 | — | — | — | — | — | — | — | 8.9 | |||||||||||||||||||||||||||
- Derivative financial instruments | 0.4 | 10.8 | 9.7 | 1.4 | 0.4 | — | — | 0.3 | 23.0 | |||||||||||||||||||||||||||
- Loans and advances to banks | 0.3 | 1.4 | 0.3 | 0.1 | — | — | — | — | 2.1 | |||||||||||||||||||||||||||
- Loans and advances to customers | 5.3 | 20.1 | 68.2 | 53.6 | 18.4 | 12.8 | 3.5 | 2.5 | 184.4 | |||||||||||||||||||||||||||
- Loans and receivables securities | — | — | 0.1 | — | — | — | — | — | 0.1 | |||||||||||||||||||||||||||
|
|
|
|
|
|
|
|
|
|
|
|
|
|
|
|
|
| |||||||||||||||||||
Total neither past due nor impaired | 38.8 | 40.6 | 85.8 | 56.1 | 18.8 | 13.0 | 3.5 | 4.3 | 260.9 | |||||||||||||||||||||||||||
|
|
|
|
|
|
|
|
|
|
|
|
|
|
|
|
|
| |||||||||||||||||||
Past due but not impaired | — | — | — | — | 0.1 | — | 3.8 | — | 3.9 | |||||||||||||||||||||||||||
|
|
|
|
|
|
|
|
|
|
|
|
|
|
|
|
|
| |||||||||||||||||||
Impaired(3) | — | — | — | 0.1 | 0.1 | 0.2 | 1.3 | 0.1 | 1.8 | |||||||||||||||||||||||||||
|
|
|
|
|
|
|
|
|
|
|
|
|
|
|
|
|
| |||||||||||||||||||
| 38.8 | 40.6 | 85.8 | 56.2 | 19.0 | 13.2 | 8.6 | 4.4 | 266.6 | ||||||||||||||||||||||||||||
|
|
|
|
|
|
|
|
|
|
|
|
|
|
|
| |||||||||||||||||||||
Loan loss allowance | (1.4 | ) | ||||||||||||||||||||||||||||||||||
|
| |||||||||||||||||||||||||||||||||||
Total | 265.2 | |||||||||||||||||||||||||||||||||||
|
| |||||||||||||||||||||||||||||||||||
| (1) | Other items include cash in hand and smaller cases predominantly within the consumer finance and commercial mortgages portfolios which are subject to scorecards rather than rating models. |
| (2) | Loans and advances to customers and loans and receivables securities include interest charged to the customer’s account and interest accrued but not yet charged to the account. |
| (3) | Impaired loans consists of loans assessed for observed impairment loss allowances. |
| 18 | Santander UK plc |
Table of Contents
Risk governance | Top and emerging risks | Credit risk | Market risk | Balance sheet management risk | Other important risks | Areas of focus and other items | ||||||
|
Maturity analysis of loans and advances that are past due but not impaired
At 30 June 2015, loans and advances of £3.5bn (2014: £3.9bn) were past due but not impaired. Of these balances, £0.1bn (2014: £0.1bn) were due within one month, £1.1bn (2014: £1.2bn) were due after one month but within two months, £0.7bn (2014: £0.8bn) were due after two months but within three months, £0.8bn (2014: £1.0bn) were due after three months but within six months, and £0.8bn (2014: £0.8bn) were due after six months.
Concentrations of credit risk exposures
The management of risk concentration is a key part of risk management. Santander UK tracks the degree of concentration of its credit risk portfolios using various criteria, including geographical areas and countries, economic sectors, products and groups of customers. Although Santander UK’s operations are based mainly in the UK, it has built up exposures to various entities around the world and is therefore exposed to concentrations of risk related to geographical area. These are further analysed below:
Geographical concentrations
As part of its approach to credit risk management and risk appetite, Santander UK sets exposure limits to countries and certain geographical areas. These limits are set by Santander UK with reference to the country limits set by Banco Santander, S.A. These are determined according to the classification of the country (whether it is a developed OECD country or not), the rating of the country, its gross domestic product and the type of business activities and products the Banco Santander group wishes to engage in within that country.
The tables below set out the distribution, by geographical area, of loans and advances to banks and customers.
| UK £bn | Peripheral eurozone(1) £bn | Rest of eurozone £bn | Rest of Europe £bn | US £bn | Rest of world £bn | Total £bn | ||||||||||||||||||||||
30 June 2015 | ||||||||||||||||||||||||||||
Loans and advances to banks | 1.5 | — | — | — | 0.3 | 0.7 | 2.5 | |||||||||||||||||||||
Loans and advances to customers(2): | ||||||||||||||||||||||||||||
- Advances secured on residential property | 151.2 | — | — | — | — | — | 151.2 | |||||||||||||||||||||
- Corporate loans | 29.6 | 0.2 | 0.1 | 0.4 | — | 0.5 | 30.8 | |||||||||||||||||||||
- Finance leases | 6.3 | — | — | — | — | 0.1 | 6.4 | |||||||||||||||||||||
- Other secured advances | — | — | — | — | — | — | — | |||||||||||||||||||||
- Other unsecured advances | 6.7 | — | — | — | — | — | 6.7 | |||||||||||||||||||||
- Amounts due from fellow subsidiaries, associates and joint ventures | — | — | — | — | — | 1.1 | 1.1 | |||||||||||||||||||||
|
|
|
|
|
|
|
|
|
|
|
|
|
| |||||||||||||||
Loans and advances to customers (gross) | 193.8 | 0.2 | 0.1 | 0.4 | — | 1.7 | 196.2 | |||||||||||||||||||||
|
|
|
|
|
|
|
|
|
|
|
| |||||||||||||||||
Less: impairment loss allowance | (1.3 | ) | ||||||||||||||||||||||||||
|
| |||||||||||||||||||||||||||
Loans and advances to customers, net of impairment loss allowance | 194.9 | |||||||||||||||||||||||||||
|
|
|
|
|
|
|
|
|
|
|
|
|
| |||||||||||||||
| 197.4 | ||||||||||||||||||||||||||||
|
|
|
|
|
|
|
|
|
|
|
|
|
| |||||||||||||||
31 December 2014 | ||||||||||||||||||||||||||||
Loans and advances to banks | 1.3 | — | — | — | 0.7 | 0.1 | 2.1 | |||||||||||||||||||||
Loans and advances to customers(2): | ||||||||||||||||||||||||||||
- Advances secured on residential property | 150.5 | — | — | — | — | — | 150.5 | |||||||||||||||||||||
- Corporate loans | 28.5 | 0.1 | 0.2 | 0.5 | — | 0.6 | 29.9 | |||||||||||||||||||||
- Finance leases | 2.6 | — | — | — | — | 0.1 | 2.7 | |||||||||||||||||||||
- Other secured advances | — | — | — | — | — | — | — | |||||||||||||||||||||
- Other unsecured advances | 6.2 | — | — | — | — | — | 6.2 | |||||||||||||||||||||
- Amounts due from fellow subsidiaries, associates and joint ventures | — | — | — | — | — | 0.8 | 0.8 | |||||||||||||||||||||
|
|
|
|
|
|
|
|
|
|
|
|
|
| |||||||||||||||
Loans and advances to customers (gross) | 187.8 | 0.1 | 0.2 | 0.5 | — | 1.5 | 190.1 | |||||||||||||||||||||
|
|
|
|
|
|
|
|
|
|
|
| |||||||||||||||||
Less: impairment loss allowance | (1.4 | ) | ||||||||||||||||||||||||||
|
| |||||||||||||||||||||||||||
Loans and advances to customers, net of impairment loss allowance | 188.7 | |||||||||||||||||||||||||||
|
|
|
|
|
|
|
|
|
|
|
|
|
| |||||||||||||||
| 190.8 | ||||||||||||||||||||||||||||
|
|
|
|
|
|
|
|
|
|
|
|
|
| |||||||||||||||
| (1) | Peripheral eurozone comprises Ireland, Italy and Spain. |
| (2) | Loans and advances to customers include interest charged to the customer’s account and interest accrued but not yet charged to the account. |
For additional geographical information and commentary, see ‘Country Risk Exposure.’
| 2015 Half Yearly Financial Report | 19 |
Table of Contents
Risk review
Credit risk
continued
Credit risk exposures by industry
As part of its approach to credit risk management and risk appetite, Santander UK sets exposure limits to certain key industry sectors. The tables below set out the distribution, by industry sector, of loans and advances to banks and customers.
| Social Housing £bn | Banks £bn | SME £bn | Real estate £bn | Transport £bn | Residential £bn | Cards and personal unsecured lending £bn | Other £bn | Total £bn | ||||||||||||||||||||||||||||
30 June 2015 | ||||||||||||||||||||||||||||||||||||
Loans and advances to banks | — | 2.5 | — | — | — | — | — | — | 2.5 | |||||||||||||||||||||||||||
|
|
|
|
|
|
|
|
|
|
|
|
|
|
|
|
|
| |||||||||||||||||||
Loans and advances to customers(1): | ||||||||||||||||||||||||||||||||||||
- Advances secured on residential property | — | — | — | — | — | 151.2 | — | — | 151.2 | |||||||||||||||||||||||||||
- Corporate loans | 6.0 | — | 13.5 | 2.8 | 0.3 | — | — | 8.2 | 30.8 | |||||||||||||||||||||||||||
- Finance leases | — | — | — | — | 4.0 | — | — | 2.4 | 6.4 | |||||||||||||||||||||||||||
- Other secured advances | — | — | — | — | — | — | — | — | — | |||||||||||||||||||||||||||
- Other unsecured advances | — | — | — | — | — | — | 6.7 | — | 6.7 | |||||||||||||||||||||||||||
- Amounts due from fellow subsidiaries, associates and joint ventures | — | — | — | — | — | — | — | 1.1 | 1.1 | |||||||||||||||||||||||||||
|
|
|
|
|
|
|
|
|
|
|
|
|
|
|
|
|
| |||||||||||||||||||
Loans and advances to customers (gross) | 6.0 | — | 13.5 | 2.8 | 4.3 | 151.2 | 6.7 | 11.7 | 196.2 | |||||||||||||||||||||||||||
|
|
|
|
|
|
|
|
|
|
|
|
|
|
|
| |||||||||||||||||||||
Less: impairment loss allowance | (1.3 | ) | ||||||||||||||||||||||||||||||||||
|
| |||||||||||||||||||||||||||||||||||
Loans and advances to customers, net of impairment loss allowance | 194.9 | |||||||||||||||||||||||||||||||||||
|
|
|
|
|
|
|
|
|
|
|
|
|
|
|
|
|
| |||||||||||||||||||
| 197.4 | ||||||||||||||||||||||||||||||||||||
|
|
|
|
|
|
|
|
|
|
|
|
|
|
|
|
|
| |||||||||||||||||||
31 December 2014 | ||||||||||||||||||||||||||||||||||||
Loans and advances to banks | — | 2.1 | — | — | — | — | — | — | 2.1 | |||||||||||||||||||||||||||
|
|
|
|
|
|
|
|
|
|
|
|
|
|
|
|
|
| |||||||||||||||||||
Loans and advances to customers(1): | ||||||||||||||||||||||||||||||||||||
- Advances secured on residential property | — | — | — | — | — | 150.5 | — | — | 150.5 | |||||||||||||||||||||||||||
- Corporate loans | 5.8 | — | 13.1 | 2.8 | 0.9 | — | — | 7.3 | 29.9 | |||||||||||||||||||||||||||
- Finance leases | — | — | — | — | 0.3 | — | — | 2.4 | 2.7 | |||||||||||||||||||||||||||
- Other secured advances | — | — | — | — | — | — | — | — | — | |||||||||||||||||||||||||||
- Other unsecured advances | — | — | — | — | — | — | 6.2 | — | 6.2 | |||||||||||||||||||||||||||
- Amounts due from fellow subsidiaries, associates and joint ventures | — | — | — | — | — | — | — | 0.8 | 0.8 | |||||||||||||||||||||||||||
|
|
|
|
|
|
|
|
|
|
|
|
|
|
|
|
|
| |||||||||||||||||||
Loans and advances to customers (gross) | 5.8 | — | 13.1 | 2.8 | 1.2 | 150.5 | 6.2 | 10.5 | 190.1 | |||||||||||||||||||||||||||
|
|
|
|
|
|
|
|
|
|
|
|
|
|
|
| |||||||||||||||||||||
Less: impairment loss allowance | (1.4 | ) | ||||||||||||||||||||||||||||||||||
|
| |||||||||||||||||||||||||||||||||||
Loans and advances to customers, net of impairment loss allowance | 188.7 | |||||||||||||||||||||||||||||||||||
|
|
|
|
|
|
|
|
|
|
|
|
|
|
|
|
|
| |||||||||||||||||||
| 190.8 | ||||||||||||||||||||||||||||||||||||
|
|
|
|
|
|
|
|
|
|
|
|
|
|
|
|
|
| |||||||||||||||||||
| (1) | Loans and advances to customers include interest charged to the customer’s account and interest accrued but not yet charged to the account. |
For additional industry information, see ‘Country Risk Exposure.’
Forbearance summary
The following table provides a summary of the population of loans and advances to customers which have been subject to forbearance programmes and are included in the previous tables. Discussion and analysis of forbearance activities for mortgages in Retail Banking and forbearance activities in Commercial Banking, Corporate & Institutional Banking, and Corporate Centre are set out in their respective sections.
| 30 June 2015 | 31 December 2014 | |||||||||||||||||||||||
| Forbearance of NPL £m | Forbearance of non-NPL £m | Total £m | Forbearance of NPL £m | Forbearance of non-NPL £m | Total £m | |||||||||||||||||||
Retail Banking: | ||||||||||||||||||||||||
- Mortgages | 756 | 3,055 | 3,811 | 723 | 3,144 | 3,867 | ||||||||||||||||||
- Unsecured loans | 1 | 2 | 3 | 1 | 3 | 4 | ||||||||||||||||||
- Credit cards | 27 | — | 27 | 27 | — | 27 | ||||||||||||||||||
- Bank accounts | 1 | 11 | 12 | 1 | 12 | 13 | ||||||||||||||||||
Commercial Banking | 58 | 724 | 782 | 58 | 739 | 797 | ||||||||||||||||||
Corporate & Institutional Banking | 3 | — | 3 | 53 | — | 53 | ||||||||||||||||||
Corporate Centre | 21 | 304 | 325 | 18 | 313 | 331 | ||||||||||||||||||
|
|
|
|
|
|
|
|
|
|
|
| |||||||||||||
| 867 | 4,096 | 4,963 | 881 | 4,211 | 5,092 | |||||||||||||||||||
|
|
|
|
|
|
|
|
|
|
|
| |||||||||||||
| 20 | Santander UK plc |
Table of Contents
Risk governance | Top and emerging risks | Credit risk | Market risk | Balance sheet management risk | Other important risks | Areas of focus and other items | ||||||
|
Credit performance
The customer loan balances included in the Credit performance tables below and in the remainder of the ‘Credit risk’ section are presented differently from the ‘Loans and advances to customers’ statutory balance in the Condensed Consolidated Balance Sheet. The principal differences are because customer loans below are recorded on an amortised cost basis and include customer loans held within the ‘Trading assets’, ‘Financial assets designated at fair value’ and ‘Loans and advances to customers’ statutory headers. In addition, the balances below exclude interest accrued but not yet charged to customer accounts.
| Customer loans £bn | NPLs(1) £m | NPL ratio(2) % | NPL coverage(3) % | Gross write-offs(4) £m | Loan loss allowance £m | |||||||||||||||||||
30 June 2015 | ||||||||||||||||||||||||
Retail Banking | 162.6 | 2,495 | 1.53 | 35 | 108 | 870 | ||||||||||||||||||
- Residential mortgages | 150.7 | 2,371 | 1.57 | 23 | 20 | 557 | ||||||||||||||||||
- Banking and consumer credit | 11.9 | 124 | 1.05 | 252 | 88 | 313 | ||||||||||||||||||
Commercial Banking(5) | 20.0 | 652 | 3.25 | 46 | 28 | 297 | ||||||||||||||||||
Corporate & Institutional Banking(5) | 5.7 | 4 | 0.07 | 675 | 26 | 27 | ||||||||||||||||||
Corporate Centre | 7.9 | 152 | 1.93 | 89 | 17 | 135 | ||||||||||||||||||
|
|
|
|
|
|
|
|
|
|
|
| |||||||||||||
| 196.2 | 3,303 | 1.68 | 40 | 179 | 1,329 | |||||||||||||||||||
|
|
|
|
|
|
|
|
|
|
|
| |||||||||||||
31 December 2014 | ||||||||||||||||||||||||
Retail Banking | 158.5 | 2,573 | 1.62 | 34 | 273 | 881 | ||||||||||||||||||
- Residential mortgages | 150.1 | 2,459 | 1.64 | 24 | 68 | 579 | ||||||||||||||||||
- Banking and consumer credit | 8.4 | 114 | 1.35 | 265 | 205 | 302 | ||||||||||||||||||
Commercial Banking(5) | 18.7 | 664 | 3.56 | 46 | 75 | 305 | ||||||||||||||||||
Corporate & Institutional Banking(5) | 5.2 | 53 | 1.01 | 138 | 11 | 73 | ||||||||||||||||||
Corporate Centre | 8.3 | 134 | 1.62 | 134 | 64 | 180 | ||||||||||||||||||
|
|
|
|
|
|
|
|
|
|
|
| |||||||||||||
| 190.7 | 3,424 | 1.80 | 42 | 423 | 1,439 | |||||||||||||||||||
|
|
|
|
|
|
|
|
|
|
|
| |||||||||||||
| (1) | Loans and advances are classified as non-performing in accordance with the definitions provided in the ‘Credit risk management’ section in the 2014 Annual Report, except for the amendment of the NPL policy in the first half of 2015 to include Properties in Possession (‘PIP’s) exposures in NPL. |
| (2) | NPLs as a percentage of loans and advances to customers. |
| (3) | Total impairment loan loss allowances as a % of NPL stock. Total loan loss allowances relate to early arrears and performing assets (i.e. the IBNO provision) as well as accounts classified as NPL and hence the ratio can exceed 100%. |
| (4) | Gross write offs are for the six months ended 30 June 2015 and the year ended 31 December 2014 respectively. |
| (5) | Total lending to corporates is defined as the combined lending of Commercial Banking and Corporate & Institutional Banking. |
Non-performing loans and advances(1)(2)
An analysis of Santander UK’s NPLs is presented below.
| 30 June 2015 £m | 31 December 2014 £m | |||||||
Loans and advances to customers of which:(2) | 196,163 | 190,651 | ||||||
NPLs | 3,303 | 3,424 | ||||||
|
|
|
| |||||
Total impairment loan loss allowances | 1,329 | 1,439 | ||||||
|
|
|
| |||||
| % | % | |||||||
NPLs ratio(3) | 1.68 | 1.80 | ||||||
|
|
|
| |||||
Coverage ratio(4) | 40 | 42 | ||||||
|
|
|
| |||||
| (1) | Loans and advances are classified as non-performing in accordance with the definitions provided in the ‘Credit risk management’ section in the 2014 Annual Report, except for the amendment of the NPL policy in the first half of 2015 to include Properties in Possession (‘PIP’s) exposures in NPL. |
| (2) | Loans and advances to customers include social housing loans and finance leases, and exclude trading assets. |
| (3) | NPLs as a percentage of loans and advances to customers. |
| (4) | Impairment loan loss allowances as a percentage of NPLs. |
30 June 2015 compared to 31 December 2014
During the first half of 2015, the NPL ratio continued to improve to 1.68% (2014: 1.80%), with retail and corporate loans performing well in an improving credit environment. In Retail Banking, the residential mortgage NPL ratio decreased to 1.57%, reflecting good performance of the portfolio supported by low interest rates, rising house prices and falling unemployment. The banking and consumer credit NPL ratio decreased to 1.05%, mainly as a result of the commencement of the PSA cooperation. The Commercial Banking NPL ratio decreased to 3.25%, with credit quality remaining strong. We continue to adhere to our prudent lending criteria as we grow lending.
The coverage ratio remained broadly unchanged at 40% at 30 June 2015 (2014: 42%).
For further information and commentary on credit performance of the key portfolios by business segment, see the ‘Credit risk - Retail Banking’, ‘Credit risk - Commercial Banking’, ‘Credit risk - Corporate & Institutional Banking’, and ‘Credit risk - Corporate Centre’ sections.
| 2015 Half Yearly Financial Report | 21 |
Table of Contents
Risk review
Credit risk
continued
RESIDENTIAL MORTGAGES
Retail Banking grants mortgage loans for house purchases as well as granting further advances to existing mortgage customers. The property on which the mortgage is secured must always be located within the UK, with the exception of an immaterial amount of lending in the Isle of Man.
In the following chart, gross lending includes both new business and, shown separately, further advances and any flexible mortgage drawdown against available limits. The redemptions and paydowns refer to customer payments, overpayments, clearing mortgage balances or refinancing away from Santander UK. The data excludes accrued interest and is presented gross of impairment loss allowances.
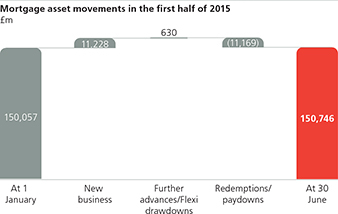
An analysis of mortgage asset movements during the first half of 2015 is presented below:
| £m | ||||
At 1 January 2015(1) | 150,057 | |||
New business | 11,228 | |||
Further advances/Flexi drawdowns | 630 | |||
Redemptions/paydowns | (11,169 | ) | ||
|
| |||
At 30 June 2015(1) | 150,746 | |||
|
| |||
| (1) | All mortgage balances are UK and continue accruing interest. The balances include interest charged to the customer’s account, but exclude interest accrued but not yet charged to the account. |
In addition, during the first half of 2015 there were internal transfers of £9.2bn (six months ended 31 December 2014: £6.4bn; six months ended 30 June 2014: £8.0bn) where we were able to support and retain existing customers with maturing products on new Santander UK mortgages.
| 22 | Santander UK plc |
Table of Contents
Risk governance | Top and emerging risks | Credit risk | Market risk | Balance sheet management risk | Other important risks | Areas of focus and other items | ||||||
|
Borrower and product profile
In the following charts, the category ‘home movers’ includes both existing customers moving house and taking out a new mortgage with us, and customers who move their mortgage to us at the point they move home. The category ‘remortgagers’ comprises external customers re-mortgaging to Santander UK only. Internal transfers, further advances and any flexible mortgage drawdowns are not included in the new business figures below.
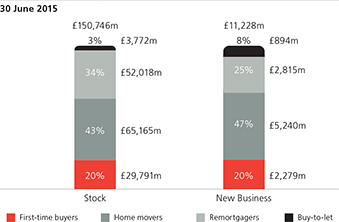
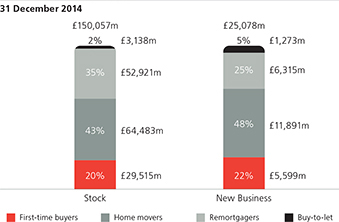
30 June 2015 compared to 31 December 2014
During the first half of 2015, the new business customer mix remained broadly unchanged compared to the year ended 31 December 2014, driven by an underlying stability in target market segments, product pricing and distribution strategy.
The proportion of Buy-to-let new business increased from 5% to 8%, in line with our refined proposition to appeal to a wider catchment, and to grow our lending with a particular focus on non-professional landlords with small portfolios. As part of this, we are improving our systems to cater for this segment, and have restructured our exposure to a maximum of five properties per landlord and with an LTV of 75%, while continuing to adhere to a prudent lending criteria. Additionally, we have increased our support for the new build market, leveraging our relationships with brokers through intermediaries, and developers, through our Commercial Banking business.
Product and interest rate profile
| 30 June 2015 | 31 December 2014 | |||||||||||||||
| £m | % | £m | % | |||||||||||||
Term product – Fixed rate | 73,578 | 48 | 69,329 | 46 | ||||||||||||
Term product – Tracker | 5,344 | 4 | 4,308 | 3 | ||||||||||||
Standard Variable Rate (‘SVR’)(1) | 39,251 | 26 | 43,072 | 29 | ||||||||||||
Base rate linked | 13,956 | 9 | 14,791 | 10 | ||||||||||||
Flexi(2) | 14,645 | 10 | 15,203 | 10 | ||||||||||||
Buy-to-let | 3,772 | 3 | 3,138 | 2 | ||||||||||||
Other | 200 | — | 216 | — | ||||||||||||
|
|
|
|
|
|
|
| |||||||||
| 150,746 | 100 | 150,057 | 100 | |||||||||||||
|
|
|
|
|
|
|
| |||||||||
| (1) | Excludes Buy-to-let on SVR of £757m (2014: £790m) included in the Buy-to-let line. |
| (2) | In addition, there were £5,672m (2014: £6,177m) of legacy Alliance & Leicester flexible loan products included in other categories as the product functionality is more limited than the current Santander UK Flexi loan product. |
30 June 2015 compared to 31 December 2014
During the first half of 2015, the proportion of SVR loan balances decreased to 26% (2014: 29%) and fixed rate mortgages increased to 48% (2014: 46%). This was driven by strong approval volumes and an improved mortgage retention rate, reflecting consumer sentiment over expected future interest rate movements as well as the availability of competitively-priced fixed rate products.
| 2015 Half Yearly Financial Report | 23 |
Table of Contents
Risk review
Credit risk
continued
Geographical distribution
The new business data in the following tables corresponds to new business originated during each of the reported periods. For the first half of 2015, the Council of Mortgage Lenders (‘CML’) new business data in the table below covers the three months ended 31 March 2015, due to timing of data availability. The percentage shown is calculated on a value weighted basis.
| 30 June 2015 | 31 December 2014 | |||||||||||||||||||||||
| Santander UK | Santander UK | |||||||||||||||||||||||
| CML | CML | |||||||||||||||||||||||
| Stock | New business | New business | Stock | New business | New business | |||||||||||||||||||
UK region | % | % | % | % | % | % | ||||||||||||||||||
East Anglia | 3 | 3 | 3 | 3 | 3 | 3 | ||||||||||||||||||
East Midlands | 5 | 5 | 6 | 5 | 5 | 6 | ||||||||||||||||||
London | 23 | 28 | 22 | 22 | 26 | 22 | ||||||||||||||||||
North | 3 | 2 | 3 | 3 | 2 | 3 | ||||||||||||||||||
North West | 8 | 6 | 7 | 8 | 6 | 7 | ||||||||||||||||||
Northern Ireland | 3 | 1 | 1 | 3 | 1 | 1 | ||||||||||||||||||
Scotland | 5 | 4 | 8 | 5 | 4 | 7 | ||||||||||||||||||
South East excluding London | 29 | 32 | 28 | 29 | 32 | 29 | ||||||||||||||||||
South West | 8 | 8 | 8 | 8 | 9 | 8 | ||||||||||||||||||
Wales | 3 | 2 | 3 | 3 | 2 | 3 | ||||||||||||||||||
West Midlands | 5 | 5 | 6 | 6 | 5 | 6 | ||||||||||||||||||
Yorkshire and Humberside | 5 | 4 | 5 | 5 | 5 | 5 | ||||||||||||||||||
|
|
|
|
|
|
|
|
|
|
|
| |||||||||||||
| 100 | 100 | 100 | 100 | 100 | 100 | |||||||||||||||||||
|
|
|
|
|
|
|
|
|
|
|
| |||||||||||||
30 June 2015 compared to 31 December 2014
During the first half of 2015, mortgage asset stock and new business geographic distribution remained broadly consistent with 2014.
The lending profile of the portfolio represents a diverse geographical footprint across the UK, while continuing to reflect a concentration around London and the South East compared to the industry as a whole. Portfolio concentrations are monitored to ensure exposures are in line with business risk appetite.
Exposures to larger loans
Exposures to larger loans across the UK increased in the period but remained at a low level, with the total mortgage asset stock of larger mortgage loans at 30 June 2015 and 31 December 2014 as follows:
Stock
| South East including London | UK | ||||||||||||||
Individual mortgage loan size | 30 June 2015 £m | 31 December 2014 £m | 30 June 2015 £m | 31 December 2014 £m | ||||||||||||
Less than £0.25m | 51,060 | 51,712 | 115,928 | 117,269 | ||||||||||||
£0.25m - £0.5m | 20,041 | 18,929 | 26,891 | 25,617 | ||||||||||||
£0.5m - £1m | 5,855 | 5,271 | 6,853 | 6,213 | ||||||||||||
£1m - £2m | 874 | 768 | 932 | 827 | ||||||||||||
>£2m | 137 | 124 | 142 | 131 | ||||||||||||
|
|
|
|
|
|
|
| |||||||||
| 77,967 | 76,804 | 150,746 | 150,057 | |||||||||||||
|
|
|
|
|
|
|
| |||||||||
Average loan size for new business
The average loan size for new business during the six months ended 30 June 2015 and the year ended 31 December 2014 was as follows:
New business
| Six months ended | Year ended | ||||||
UK region | 30 June 2015 £000 | 31 December 2014 £000 | ||||||
South East including London | 243 | 229 | ||||||
Rest of the UK | 132 | 125 | ||||||
UK as a whole | 180 | 169 | ||||||
| 24 | Santander UK plc |
Table of Contents
Risk governance | Top and emerging risks | Credit risk | Market risk | Balance sheet management risk | Other important risks | Areas of focus and other items | ||||||
|
Loan-to-value analysis
The following table sets out the LTV distribution for mortgage asset stock, NPL stock and new business. The LTV calculation includes fees added to the loan and, where the product is on flexible terms, only includes the drawn loan amount, not undrawn limits.
| 30 June 2015 | 31 December 2014 | |||||||||||||||||||||||
| of which: | of which: | |||||||||||||||||||||||
LTV | Stock % | NPL stock % | New business % | Stock % | NPL stock % | New business % | ||||||||||||||||||
Up to 50% | 37 | 28 | 17 | 36 | 25 | 17 | ||||||||||||||||||
>50 - 55% | 9 | 6 | 5 | 8 | 6 | 5 | ||||||||||||||||||
>55 - 60% | 9 | 7 | 7 | 9 | 7 | 6 | ||||||||||||||||||
>60 - 65% | 9 | 7 | 7 | 10 | 7 | 8 | ||||||||||||||||||
>65 - 70% | 9 | 7 | 8 | 9 | 8 | 11 | ||||||||||||||||||
>70 - 75% | 8 | 8 | 14 | 8 | 8 | 13 | ||||||||||||||||||
>75 - 80% | 6 | 7 | 16 | 6 | 7 | 14 | ||||||||||||||||||
>80 - 85% | 5 | 6 | 10 | 5 | 6 | 9 | ||||||||||||||||||
>85 - 90% | 3 | 5 | 12 | 3 | 6 | 12 | ||||||||||||||||||
>90 - 95% | 2 | 4 | 4 | 2 | 4 | 5 | ||||||||||||||||||
>95 - 100% | 1 | 3 | — | 1 | 4 | — | ||||||||||||||||||
>100% i.e. negative equity | 2 | 12 | — | 3 | 12 | — | ||||||||||||||||||
|
|
|
|
|
|
|
|
|
|
|
| |||||||||||||
| 100 | 100 | 100 | 100 | 100 | 100 | |||||||||||||||||||
|
|
|
|
|
|
|
|
|
|
|
| |||||||||||||
Collateral value of residential properties(1)(2) | £ | 150,295m | £ | 2,301m | £ | 11,228m | £ | 149,561m | £ | 2,342m | £ | 25,078m | ||||||||||||
|
|
|
|
|
|
|
|
|
|
|
| |||||||||||||
| % | % | % | % | % | % | |||||||||||||||||||
Simple average(3)LTV (indexed) | 47 | 52 | 65 | 47 | 55 | 65 | ||||||||||||||||||
Value weighted average(4)LTV (indexed) | 43 | 47 | 60 | 43 | 50 | 60 | ||||||||||||||||||
| (1) | Includes collateral against loans in negative equity of £2,706m at 30 June 2015 (2014: £3,073m). |
| (2) | The collateral value shown above is limited to the outstanding value of each associated individual loan and excludes the impact of overcollateralisation i.e. where the collateral held is of a higher value than the loan balance outstanding. |
| (3) | Unweighted average of LTV of all accounts. |
| (4) | Sum of all loan values divided by sum of all valuations. |
30 June 2015 compared to 31 December 2014
During the first half of 2015 we maintained our prudent lending criteria, with a simple average LTV of 65% on new lending, including Help-to-Buy, and 47% on the stock of mortgages. Help-to-Buy comprises all of the lending with an LTV over 90%. Excluding Help-to-Buy, the simple average LTV on new lending was 64% (2014: 64%) and our lending with an LTV of over 85% accounted for 13% (2014: 13%) of the new business flow.
Stock LTV continued to perform well, supported by house price increases and the improving economic environment, facilitating capital repayments by borrowers. We are conscious that these positive trends in house prices may not continue and therefore have considered this risk in assessing the level of our provisions.
At 30 June 2015, of the loans in negative equity, the total which was effectively uncollateralised before taking account of any loan loss allowances reduced to £451m (2014: £496m).
| 2015 Half Yearly Financial Report | 25 |
Table of Contents
Risk review
Credit risk
continued
Credit performance
| 30 June 2015 £m | 31 December 2014 £m | |||||||
Mortgage loans and advances to customers | 150,746 | 150,057 | ||||||
Performing(1)(3) | 146,632 | 145,598 | ||||||
Early arrears:(3) | 1,743 | 1,941 | ||||||
- 31 to 60 days | 1,069 | 1,185 | ||||||
- 61 to 90 days | 674 | 756 | ||||||
|
|
|
| |||||
Non-performing loans:(2)(3) | 2,371 | 2,459 | ||||||
- By arrears | 1,956 | 2,133 | ||||||
- By bankruptcy | 40 | 44 | ||||||
- By maturity default | 234 | 210 | ||||||
- By forbearance | 87 | 72 | ||||||
- By PIPs(2) | 54 | — | ||||||
|
|
|
| |||||
PIPs(2)not classified as NPL | — | 59 | ||||||
|
|
|
| |||||
| (1) | Excludes loans where the counterparty failed to make a payment when contractually due for between 31 and 90 days, and excludes bankruptcy, maturity default and forbearance NPL. Includes £3,917m of mortgages (2014: £4,208m) where the counterparty failed to make a payment when contractually due for 30 days or less. |
| (2) | Mortgage loans and advances are classified as non-performing in accordance with the definitions provided in the ‘Credit risk management’ section in the 2014 Annual Report, except for the amendment of the NPL policy in the first half of 2015 to include PIP’s exposures in NPL. |
| (3) | All mortgage balances are UK and continue accruing interest. The balances include interest charged to the customer’s account, but exclude interest accrued but not yet charged to the account. |
Non-performing loans and advances(1)(2)
An analysis of mortgage NPLs is presented below.
| 30 June 2015 £m | 31 December 2014 £m | |||||||
Mortgage loans and advances to customers of which:(2)(3) | 150,746 | 150,057 | ||||||
Customers in early arrears | 1,743 | 1,941 | ||||||
Mortgage NPLs | 2,371 | 2,459 | ||||||
|
|
|
| |||||
Impairment loan loss allowances | 557 | 579 | ||||||
|
|
|
| |||||
| % | % | |||||||
Early arrears ratio(4) | 1.16 | 1.29 | ||||||
NPLs ratio(5) | 1.57 | 1.64 | ||||||
Coverage ratio(6) | 23 | 24 | ||||||
| (1) | Mortgage loans and advances are classified as non-performing in accordance with the definitions provided in the ‘Credit risk management’ section in the 2014 Annual Report, except for the amendment of the NPL policy in the first half of 2015 to include PIP’s exposures in NPL. |
| (2) | Mortgage loans and advances to customers include Social Housing loans and finance leases. |
| (3) | All mortgage balances are UK and continue accruing interest. For the data presented, the balances include interest charged to the customer’s account, but exclude interest accrued but not yet charged to the account. |
| (4) | Mortgage loans and advances to customers in early arrears as a percentage of mortgage loans and advances to customers. |
| (5) | Mortgage NPLs as a percentage of mortgage loans and advances to customers. |
| (6) | Impairment loss allowances as a percentage of NPLs. |
| 26 | Santander UK plc |
Table of Contents
Risk governance | Top and emerging risks | Credit risk | Market risk | Balance sheet management risk | Other important risks | Areas of focus and other items | ||||||
|
An analysis of the NPL movements during the first half of 2015 is presented below. ‘Entries’ represent loans which have become classified as NPLs during the period and ‘Policy entries’ are due to definition changes. ‘PIP sales’ represent loans that have been legally discharged on the sale of the property, and include any written-off portion. ‘Exits’ represent loans that have been repaid (in full or in part) plus those returned to performing status. Forbearance activity does not result in a change in the NPL status.
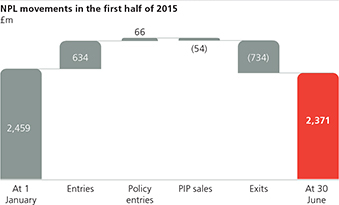
30 June 2015 compared to 31 December 2014
During the first half of 2015, the mortgage asset NPL stock decreased to £2,371m at 30 June 2015 (2014: £2,459m) and the NPL ratio decreased to 1.57% (2014: 1.64%). Exits exceeded entries by £100m due to improving delinquency trends reflecting portfolio vintage composition and associated credit quality, supported by external market factors (low interest rates, rising house prices and falling unemployment). Policy changes of £66m primarily related to the inclusion of PIPs within NPLs. We are conscious that these conditions may not continue and our provisions reflect our conservative position on the UK economy and the housing market, notwithstanding current trends.
In the first half of 2015, interest income recognised on impaired loans amounted to £38m (six months ended 30 June 2014: £42m).
| 2015 Half Yearly Financial Report | 27 |
Table of Contents
Risk review
Credit risk
continued
Forbearance
Forbearance commenced during the period(1)(2)
The balances that entered forbearance during the six months ended 30 June 2015 and the year ended 31 December 2014 were:
| 30 June 2015 | 31 December 2014 | |||||||||||||||
| £m | % | £m | % | |||||||||||||
Capitalisation | 177 | 53 | 254 | 47 | ||||||||||||
Term extensions | 137 | 41 | 175 | 33 | ||||||||||||
Interest-only | 22 | 6 | 105 | 20 | ||||||||||||
|
|
|
|
|
|
|
| |||||||||
| 336 | 100 | 534 | 100 | |||||||||||||
|
|
|
|
|
|
|
| |||||||||
| (1) | Mortgages are included within the period that they were forborne. |
| (2) | The figures by period reflect the amount of forbearance activity undertaken during the period irrespective of whether any forbearance activity has previously been undertaken on the forborne accounts. |
Forbearance cumulative position
a) Payment status when entering forbearance
The forborne balances at 30 June 2015 and 31 December 2014 when they originally entered forbearance, analysed by type of forbearance applied, were:
| Capitalisation £m | Term extension £m | Interest-only £m | Total £m | |||||||||||||
30 June 2015(1) | ||||||||||||||||
Forbearance of NPL | 379 | 97 | 280 | 756 | ||||||||||||
Forbearance of Non-NPL | 1,322 | 780 | 953 | 3,055 | ||||||||||||
|
|
|
|
|
|
|
| |||||||||
| 1,701 | 877 | 1,233 | 3,811 | |||||||||||||
|
|
|
|
|
|
|
| |||||||||
31 December 2014(1) | ||||||||||||||||
Forbearance of NPL | 331 | 95 | 297 | 723 | ||||||||||||
Forbearance of Non-NPL | 1,334 | 806 | 1,004 | 3,144 | ||||||||||||
|
|
|
|
|
|
|
| |||||||||
| 1,665 | 901 | 1,301 | 3,867 | |||||||||||||
|
|
|
|
|
|
|
| |||||||||
| (1) | Forbearance type categorisation is based on the first forbearance activity undertaken on the accounts. Tables contain only open accounts at the end of the period. |
b) Payment status at the period-end
The forborne balances analysed by type of forbearance applied at 30 June 2015 and 31 December 2014 were:
| Capitalisation £m | Term extension £m | Interest-only £m | Total £m | Impairment allowance £m | ||||||||||||||||
30 June 2015(1) | ||||||||||||||||||||
In arrears | 413 | 131 | 341 | 885 | 50 | |||||||||||||||
Performing(2) | 1,288 | 746 | 892 | 2,926 | (3) | 57 | ||||||||||||||
|
|
|
|
|
|
|
|
|
| |||||||||||
| 1,701 | 877 | 1,233 | 3,811 | 107 | ||||||||||||||||
|
|
|
|
|
|
|
|
|
| |||||||||||
Proportion of portfolio | 1.1 | % | 0.6 | % | 0.8 | % | 2.5 | % | ||||||||||||
|
|
|
|
|
|
|
|
|
| |||||||||||
31 December 2014(1) | ||||||||||||||||||||
In arrears | 425 | 144 | 390 | 959 | 59 | |||||||||||||||
Performing(2) | 1,240 | 757 | 911 | 2,908 | (3) | 55 | ||||||||||||||
|
|
|
|
|
|
|
|
|
| |||||||||||
| 1,665 | 901 | 1,301 | 3,867 | 114 | ||||||||||||||||
|
|
|
|
|
|
|
|
|
| |||||||||||
Proportion of portfolio | 1.1 | % | 0.6 | % | 0.9 | % | 2.6 | % | ||||||||||||
|
|
|
|
|
|
|
|
|
| |||||||||||
| (1) | Forbearance type categorisation is based on the first forbearance activity undertaken on the accounts. Tables contain only open accounts at the end of the period. |
| (2) | Where a loan has been classed as performing it will be continue to be classed as forborne for the duration of the life of the account. |
| (3) | This represents the carrying amount of financial assets that may otherwise be past due or impaired whose terms have been forborne. |
| 28 | Santander UK plc |
Table of Contents
Risk governance | Top and emerging risks | Credit risk | Market risk | Balance sheet management risk | Other important risks | Areas of focus and other items | ||||||
|
30 June 2015 compared to 31 December 2014
During the first half of 2015, the average monthly volume of accounts entering forbearance increased due to a policy change to capitalise unpaid property-related charges previously classified as loan arrears, in line with regulatory guidance. Property-related charges are due under a leasehold agreement and typically comprise ground rent, service charges or rental arrears.
A further forbearance policy change was implemented in March 2015, with interest-only concessions no longer offered as a solution for customers in financial difficulties. Instead, reduced repayment arrangements are offered for a period of time with the account remaining on capital and interest terms and any shortfall in capital repayment accruing as loan arrears.
Levels of adherence to revised payment terms agreed under forbearance arrangements improved during the first half of 2015 to approximately 77% by value (2014: 75%) of the accounts in forbearance.
At 30 June 2015, the proportion of accounts that had been in forbearance for more than six months that had made their last six months’ contractual payments increased slightly to 85% (2014: 83%). Accounts in forbearance classified as performing remained stable at just over £2.9bn or 77% by value (2014: £2.9bn or 75% by value). The weighted average LTV of all accounts in forbearance was 37% (2014: 38%) compared to the weighted average portfolio LTV of 43% (2014: 43%).
At 30 June 2015, impairment loss allowances as a percentage of the balance of accounts for the overall mortgage portfolio were 0.37% (2014: 0.39%). The equivalent ratio for accounts in forbearance which were performing was 1.95% (2014: 1.89%), and for accounts in forbearance which were in arrears was 5.69% (2014: 6.15%). The higher ratios for accounts in forbearance reflected the higher levels of impairment loss allowances held, as a result of the higher risk characteristics inherent in such accounts.
At 30 June 2015, the carrying value of mortgage loans classified as multiple forbearance remained broadly stable at £87m (2014: £89m).
Other changes in contractual terms
In addition, at 30 June 2015 £6.0bn (2014: £6.3bn) of loans on the balance sheet had been modified since January 2008. The modifications on these accounts are not considered to have been forbearance as the borrowers were not exhibiting signs of being in financial difficulty. These modifications were entered into in order to retain the customer relationship. The performance and profile of the modified accounts is kept under review. At 30 June 2015:
| • | The average LTV was 42% (2014: 43%) and 94% (2014: 93%) of accounts had paid their contractual monthly payment during the previous six months. |
| • | The proportion of accounts three or more monthly payments in arrears was 1.64% (2014: 1.61%), which continued to be consistent with the rest of the portfolio. |
| 2015 Half Yearly Financial Report | 29 |
Table of Contents
Risk review
Credit risk
continued
HIGHER RISK LOANS AND OTHER SEGMENTS OF PARTICULAR INTEREST
There are some mortgage types of particular interest or which present higher risks than others. These mortgages consist of:
| • | Interest-only loans; |
| • | Flexible loans; |
| • | Loans with LTV >100%; and |
| • | Buy-to-let loans. |
The arrears performance of these mortgages has continued to be relatively stable with arrears and loss rates remaining low.
Borrower profile(1)
| 30 June 2015 | 31 December 2014 | |||||||||||||||
| Stock £m | New business £m | Stock £m | New business £m | |||||||||||||
Full interest-only loans | 44,737 | 1,591 | 45,952 | 3,197 | ||||||||||||
Part interest-only, part repayment loans(2) | 15,348 | 825 | 15,602 | 2,580 | ||||||||||||
Flexi loans | 14,645 | 229 | 15,203 | 756 | ||||||||||||
Other flexible loans(3) | 5,672 | — | 6,177 | — | ||||||||||||
Loans with current LTV >100% | 3,157 | — | 3,569 | — | ||||||||||||
Buy-to-let | 3,772 | 895 | 3,138 | 1,270 | ||||||||||||
Interest-only and >100% current LTV | 2,328 | — | 2,592 | — | ||||||||||||
| (1) | Where a loan exhibits more than one of the criteria, it is included in all the applicable categories. |
| (2) | Mortgage balance includes both the interest only element of £10,842m (2014: £10,915m) and the non-interest only element of the loan. |
| (3) | Legacy Alliance & Leicester flexible loan products with more limited functionality than the current Santander UK Flexi loan product. |
30 June 2015 compared to 31 December 2014
During the first half of 2015, the value and proportion of interest-only loans together with part interest-only, part repayment loans reduced, reflecting the strategy to manage the overall exposure to this lending profile.
Buy-to-let lending in the first half of 2015 increased to 8% (2014: 5%) of new business as described in the previous section Borrower and product profile.
From a mortgage asset stock perspective, loans with a current LTV greater than 100% in the first half of 2015 decreased to 2% (2014: 3%) driven by rising house prices.
| 30 | Santander UK plc |
Table of Contents
Risk governance | Top and emerging risks | Credit risk | Market risk | Balance sheet management risk | Other important risks | Areas of focus and other items | ||||||
|
Credit performance
| Segment of particular interest(1) | ||||||||||||||||||||||||||||
| Total £m | Interest- only £m | Part interest-only part repayment £m | Flexible(2) £m | LTV > 100% £m | Buy-to-let £m | Other portfolio(3) £m | ||||||||||||||||||||||
30 June 2015 | ||||||||||||||||||||||||||||
Mortgage portfolio | 150,746 | 44,737 | 15,348 | 20,317 | 3,157 | 3,772 | 81,346 | |||||||||||||||||||||
Performing | 146,632 | 42,837 | 14,742 | 19,925 | 2,769 | 3,744 | 80,031 | |||||||||||||||||||||
Early arrears | ||||||||||||||||||||||||||||
- 31 to 60 days | 1,069 | 484 | 151 | 79 | 63 | 8 | 414 | |||||||||||||||||||||
- 61 to 90 days | 674 | 316 | 102 | 50 | 46 | 3 | 255 | |||||||||||||||||||||
|
|
|
|
|
|
|
|
|
|
|
|
|
| |||||||||||||||
NPLs | 2,371 | 1,100 | 353 | 263 | 279 | 17 | 646 | |||||||||||||||||||||
|
|
|
|
|
|
|
|
|
|
|
|
|
| |||||||||||||||
NPL ratio | 1.57 | % | 2.46 | % | 2.30 | % | 1.29 | % | 8.84 | % | 0.45 | % | 0.79 | % | ||||||||||||||
|
|
|
|
|
|
|
|
|
|
|
|
|
| |||||||||||||||
Properties In possession | 54 | 24 | 12 | 4 | 21 | 1 | 12 | |||||||||||||||||||||
|
|
|
|
|
|
|
|
|
|
|
|
|
| |||||||||||||||
31 December 2014 | ||||||||||||||||||||||||||||
Mortgage portfolio | 150,057 | 45,951 | 15,603 | 21,380 | 3,569 | 3,138 | 78,582 | |||||||||||||||||||||
Performing | 145,598 | 43,908 | 14,931 | 20,966 | 3,135 | 3,105 | 77,152 | |||||||||||||||||||||
Early arrears | ||||||||||||||||||||||||||||
- 31 to 60 days | 1,185 | 528 | 171 | 85 | 76 | 12 | 459 | |||||||||||||||||||||
- 61 to 90 days | 756 | 354 | 118 | 63 | 51 | 3 | 282 | |||||||||||||||||||||
|
|
|
|
|
|
|
|
|
|
|
|
|
| |||||||||||||||
NPLs | 2,459 | 1,134 | 372 | 262 | 285 | 18 | 675 | |||||||||||||||||||||
|
|
|
|
|
|
|
|
|
|
|
|
|
| |||||||||||||||
NPL ratio | 1.64 | % | 2.47 | % | 2.38 | % | 1.23 | % | 7.99 | % | 0.57 | % | 0.86 | % | ||||||||||||||
|
|
|
|
|
|
|
|
|
|
|
|
|
| |||||||||||||||
Properties In possession | 59 | 27 | 11 | 4 | 22 | — | 14 | |||||||||||||||||||||
|
|
|
|
|
|
|
|
|
|
|
|
|
| |||||||||||||||
| (1) | Where a loan exhibits more than one segment of particular interest, it is included in all applicable categories. As a result, the sum of the mortgages in the segments of particular interest and the other portfolio will not agree to the total mortgage portfolio. |
| (2) | Includes legacy Alliance & Leicester flexible loan products with more limited functionality than the current Santander UK Flexi loan product. |
| (3) | Includes other loans that are not in any segment of particular interest. |
Full interest-only maturity profile
| Term expired £m | Within 2 years £m | Between 2-5 years £m | Between 5-15 years £m | Greater than 15 years £m | Total £m | |||||||||||||||||||
30 June 2015 | ||||||||||||||||||||||||
Full interest-only portfolio | 402 | 1,736 | 3,639 | 20,254 | 18,706 | 44,737 | ||||||||||||||||||
of which value weighted average LTV (indexed) is greater than 75% | 20 | 239 | 496 | 3,617 | 4,860 | 9,232 | ||||||||||||||||||
31 December 2014 | ||||||||||||||||||||||||
Full interest-only portfolio | 337 | 1,631 | 3,785 | 20,225 | 19,974 | 45,952 | ||||||||||||||||||
of which value weighted average LTV (indexed) is greater than 75% | 46 | 170 | 570 | 3,871 | 5,689 | 10,346 | ||||||||||||||||||
Part interest-only, part repayment maturity profile
|
| |||||||||||||||||||||||
| Term expired £m | Within 2 years £m | Between 2-5 years £m | Between 5-15 years £m | Greater than 15 years £m | Total £m | |||||||||||||||||||
30 June 2015 | ||||||||||||||||||||||||
Part interest-only, part repayment portfolio | 5 | 229 | 735 | 6,137 | 8,242 | 15,348 | ||||||||||||||||||
of which value weighted average LTV (indexed) is greater than 75% | — | 7 | 35 | 705 | 1,635 | 2,382 | ||||||||||||||||||
31 December 2014 | ||||||||||||||||||||||||
Part interest-only, part repayment portfolio | 4 | 235 | 745 | 6,199 | 8,419 | 15,602 | ||||||||||||||||||
of which value weighted average LTV (indexed) is greater than 75% | 1 | 6 | 36 | 758 | 1,914 | 2,715 | ||||||||||||||||||
| 2015 Half Yearly Financial Report | 31 |
Table of Contents
Risk review
Credit risk
continued
30 June 2015 compared to 31 December 2014
At 30 June 2015, interest-only loans, part interest-only, part repayment loans, and loans with an LTV >100% had a higher than average NPL ratio. The NPL ratio for interest-only and part interest-only, part repayment loans improved in the first half of 2015 in line with wider portfolio trends. A slight increase in NPL ratios for flexible loans and loans with an LTV >100% was observed, driven by a reduction in assets within these lending segments. The buy-to-let portfolio remained better than average quality.
Santander UK provides full interest-only mortgages to customers whereby payments made by the customer comprise of only interest for the term of the mortgage, with the customer responsible for repaying the principal outstanding at the end of the loan term. Further details are described in ‘Credit risk management – Retail Banking’ in the 2014 Annual Report. Of the £331m balance that matured in the six months ended 30 June 2015, £101m was subsequently repaid, none was refinanced under normal credit terms, £25m was refinanced under forbearance arrangements and £205m remained unpaid and was classified as term expired at 30 June 2015. Of the balance of £402m that was term expired at 30 June 2015, 91% continued to pay the interest due under their expired contractual terms.
Santander UK also provides part interest-only, part repayment loans to customers whereby a component of the loan is repayable on a capital and interest basis through the term of the loan, with the remaining loan component requiring monthly interest payments only, with the principal of this loan component repayable only at maturity. Further details are described in ‘Credit risk management – Retail Banking’ in the 2014 Annual Report. Of the £13m balance that matured in the six months ended 30 June 2015, £9m was subsequently repaid, £2m was refinanced under forbearance arrangements and £2m remained unpaid and was classified as term expired at 30 June 2015.
Flexible mortgages permit customers to draw down additional funds at any time up to a predefined credit limit. By doing so, customers are able to vary their monthly payments, or take payment holidays. Drawdowns are subject to conditions, as described in ‘Credit risk management – Retail Banking’ in the 2014 Annual Report. Customer limits are actively managed where information collected suggests the predefined limit requires adjustment. The flexible loans portfolio is analysed to identify customers potentially using these facilities to self-forbear (e.g. repeated small drawdowns), with any evidence of increased credit risk being appropriately reflected in our provision calculations where significant. At 30 June 2015, there were 118,559 customers with flexible mortgages (2014: 122,354), with undrawn facilities of £6,593m (2014: £6,633m) and a utilisation rate of 69% (2014: 70%). The value weighted LTV (indexed) of the portfolio was 34% (2014: 35%).
During the first half of 2015, the stock of properties in possession decreased slightly.
Forbearance(1)(2)(3)(4)
The incidence of the main types of higher risk loans forbearance arrangements which commenced during the six months ended 30 June 2015 and the year ended 31 December 2014 was:
| Interest-only(4) | Flexible | LTV >100% | Buy-to-let | |||||||||||||
30 June 2015 | ||||||||||||||||
Total value | £ | 222m | £ | 35m | — | £ | 4m | |||||||||
|
|
|
|
|
|
|
| |||||||||
Proportion of portfolio(5) | 66 | % | 10 | % | — | 1 | % | |||||||||
|
|
|
|
|
|
|
| |||||||||
31 December 2014 | ||||||||||||||||
Total value | £ | 298m | £ | 59m | — | £ | 3m | |||||||||
|
|
|
|
|
|
|
| |||||||||
Proportion of portfolio(5) | 56 | % | 11 | % | — | 1 | % | |||||||||
|
|
|
|
|
|
|
| |||||||||
| (1) | Mortgages are included within the period that they were forborne. |
| (2) | The figures by period reflect the amount of forbearance activity undertaken during the period irrespective of whether any forbearance activity has previously been undertaken on the forborne accounts. |
| (3) | Where a loan exhibits more than one of the higher risk criteria, it is included in all the applicable categories. |
| (4) | Comprises full interest-only loans and part interest-only, part repayment loans. |
| (5) | Portfolio of total forbearance arrangements which commenced during the period. |
30 June 2015 compared to 31 December 2014
The average monthly value of higher risk loans entering forbearance arrangements in the first half of 2015 increased in line with overall increases seen in flows into forbearance during the period.
| 32 | Santander UK plc |
Table of Contents
Risk governance | Top and emerging risks | Credit risk | Market risk | Balance sheet management risk | Other important risks | Areas of focus and other items | ||||||
|
BANKING AND CONSUMER CREDIT
Santander UK provides a range of unsecured lending facilities including bank account overdrafts, personal loans and credit cards to personal and business banking customers, together with a range of consumer finance products including finance leases.
Lending
An analysis of movements in unsecured lending facilities is presented below.
| Overdrafts £m | Personal loans £m | Credit cards £m | Business banking £m | Consumer finance £m | Total £m | |||||||||||||||||||
30 June 2015 | ||||||||||||||||||||||||
At 1 January | 544 | 2,208 | 2,247 | 155 | 3,303 | 8,457 | ||||||||||||||||||
Net lending in the period | (35 | ) | 56 | 442 | 2 | 426 | (1) | 891 | ||||||||||||||||
Acquisitions | — | — | — | — | 2,461 | 2,461 | ||||||||||||||||||
|
|
|
|
|
|
|
|
|
|
|
| |||||||||||||
At 30 June | 509 | 2,264 | 2,689 | 157 | 6,190 | 11,809 | ||||||||||||||||||
|
|
|
|
|
|
|
|
|
|
|
| |||||||||||||
31 December 2014 | ||||||||||||||||||||||||
At 1 January | 543 | 2,016 | 1,679 | 151 | 3,145 | 7,534 | ||||||||||||||||||
Net lending in the year | 1 | 192 | 568 | 4 | 158 | (1) | 923 | |||||||||||||||||
|
|
|
|
|
|
|
|
|
|
|
| |||||||||||||
At 31 December | 544 | 2,208 | 2,247 | 155 | 3,303 | 8,457 | ||||||||||||||||||
|
|
|
|
|
|
|
|
|
|
|
| |||||||||||||
| (1) | Includes Consumer finance gross lending of £1,458m in the six months ended 30 June 2015 (year ended 31 December 2014: £1,609m). |
30 June 2015 compared to 31 December 2014
Total net lending increased by £3,352m (40%) in the first half of 2015, principally due to the commencement of the PSA cooperation which added a vehicle finance loan book of £2,461m. Growth of £442m in the credit cards portfolio was largely driven by introduction of new promotion-led products, including balance transfer and purchase promotions. Overdraft balances reduced by £35m to £509m (2014: £544m) as the risk profile of the book improved resulting from the popularity of the 1I2I3 Current Account proposition.
Credit performance
| Overdrafts £m | Personal loans £m | Credit cards £m | Business banking £m | Consumer finance £m | Total £m | |||||||||||||||||||
30 June 2015 | ||||||||||||||||||||||||
Loans and advances | 509 | 2,264 | 2,689 | 157 | 6,190 | 11,809 | ||||||||||||||||||
Performing | 450 | 2,214 | 2,626 | 143 | 6,134 | 11,567 | ||||||||||||||||||
In early arrears | 32 | 29 | 24 | 4 | 29 | 118 | ||||||||||||||||||
NPLs(1)(2) | 27 | 21 | 39 | 10 | 27 | 124 | ||||||||||||||||||
Impairment loss allowance | 45 | 60 | 84 | 14 | 110 | 313 | ||||||||||||||||||
|
|
|
|
|
|
|
|
|
|
|
| |||||||||||||
NPL ratio(2) | 1.05 | % | ||||||||||||||||||||||
Coverage ratio(3) | 252 | % | ||||||||||||||||||||||
|
|
|
|
|
|
|
|
|
|
|
| |||||||||||||
31 December 2014 | ||||||||||||||||||||||||
Loans and advances | 544 | 2,208 | 2,247 | 155 | 3,303 | 8,457 | ||||||||||||||||||
Performing | 480 | 2,151 | 2,185 | 141 | 3,259 | 8,216 | ||||||||||||||||||
In early arrears | 34 | 34 | 25 | 5 | 29 | 127 | ||||||||||||||||||
NPLs(1)(2) | 30 | 23 | 37 | 9 | 15 | 114 | ||||||||||||||||||
Impairment loss allowance | 46 | 76 | 73 | 14 | 93 | 302 | ||||||||||||||||||
|
|
|
|
|
|
|
|
|
|
|
| |||||||||||||
NPL ratio(2) | 1.35 | % | ||||||||||||||||||||||
Coverage ratio(3) | 265 | % | ||||||||||||||||||||||
|
|
|
|
|
|
|
|
|
|
|
| |||||||||||||
| (1) | Banking and consumer credit lending is classified as non-performing in accordance with the definitions provided in the ‘Credit risk management’ section in the 2014 Annual Report. |
| (2) | NPLs as a % of total loans and advances. |
| (3) | Total impairment loan loss allowances as a % of NPL stock. Total loan loss allowances relate to early arrears and performing assets (i.e. the IBNO provision) as well as accounts classified as NPL and hence the ratio exceeds 100%. |
30 June 2015 compared to 31 December 2014
During the first half of 2015, NPLs increased by £10m to £124m (2014: £114m) but the NPL ratio decreased by 30 basis points to 1.05% (2014: 1.35%). This was primarily due to the portfolio acquired as a result of the commencement of the PSA cooperation in the Consumer Finance portfolio, as well as asset growth in the Credit card portfolio.
In the first half of 2015, interest income recognised on impaired loans amounted to £2m (six months ended 30 June 2014: £1m).
| 2015 Half Yearly Financial Report | 33 |
Table of Contents
Risk review
Credit risk
continued
CREDIT RISK – COMMERCIAL BANKING
In Commercial Banking, credit risk arises on asset balances and off-balance sheet transactions such as credit facilities or guarantees. Consequently, committed exposures are typically higher than asset balances.
Commercial Banking – committed exposures
Rating distribution
The rating distribution tables show the credit risk exposure by Santander UK’s internal rating scale (see the ‘Credit quality’ section) for each portfolio. Within this scale, the higher the rating, the better the quality of the counterparty.
| Mid Corporate and SME £m | Commercial Real Estate £m | Social Housing £m | Total £m | |||||||||||||
30 June 2015 | ||||||||||||||||
9 | 13 | — | 580 | 593 | ||||||||||||
8 | 119 | 180 | 623 | 922 | ||||||||||||
7 | 376 | 673 | 397 | 1,446 | ||||||||||||
6 | 2,120 | 4,928 | 60 | 7,108 | ||||||||||||
5 | 4,028 | 3,909 | — | 7,937 | ||||||||||||
4 | 4,257 | 508 | — | 4,765 | ||||||||||||
1 to 3 | 616 | 182 | — | 798 | ||||||||||||
Other(1) | 345 | 72 | — | 417 | ||||||||||||
|
|
|
|
|
|
|
| |||||||||
| 11,874 | 10,452 | 1,660 | 23,986 | |||||||||||||
|
|
|
|
|
|
|
| |||||||||
31 December 2014 | ||||||||||||||||
9 | 109 | 1 | 378 | 488 | ||||||||||||
8 | 402 | 288 | 611 | 1,301 | ||||||||||||
7 | 489 | 579 | 234 | 1,302 | ||||||||||||
6 | 1,883 | 4,670 | 60 | 6,613 | ||||||||||||
5 | 3,653 | 3,695 | — | 7,348 | ||||||||||||
4 | 3,735 | 517 | — | 4,252 | ||||||||||||
1 to 3 | 571 | 222 | — | 793 | ||||||||||||
Other(1) | 353 | 86 | — | 439 | ||||||||||||
|
|
|
|
|
|
|
| |||||||||
| 11,195 | 10,058 | 1,283 | 22,536 | |||||||||||||
|
|
|
|
|
|
|
| |||||||||
| (1) | Represents smaller exposures predominantly within the commercial mortgages portfolio which are subject to scorecards rather than a rating model. |
| 34 | Santander UK plc |
Table of Contents
Risk governance | Top and emerging risks | Credit risk | Market risk | Balance sheet management risk | Other important risks | Areas of focus and other items | ||||||
|
Geographical distribution
The geographical location is classified by country of risk, being the country where each counterparty’s main business activity or assets are located. For clients whose operations are more geographically dispersed, the country of incorporation is applied.
| Mid Corporate and SME £m | Commercial Real Estate £m | Social Housing £m | Total £m | |||||||||||||
30 June 2015 | ||||||||||||||||
UK | 11,796 | 10,452 | 1,660 | 23,908 | ||||||||||||
Peripheral eurozone | 38 | — | — | 38 | ||||||||||||
Rest of Europe | 36 | — | — | 36 | ||||||||||||
US | — | — | — | — | ||||||||||||
Rest of world | 4 | — | — | 4 | ||||||||||||
|
|
|
|
|
|
|
| |||||||||
| 11,874 | 10,452 | 1,660 | 23,986 | |||||||||||||
|
|
|
|
|
|
|
| |||||||||
31 December 2014 | ||||||||||||||||
UK | 11,110 | 10,058 | 1,283 | 22,451 | ||||||||||||
Peripheral eurozone | 17 | — | — | 17 | ||||||||||||
Rest of Europe | 42 | — | — | 42 | ||||||||||||
US | — | — | — | — | ||||||||||||
Rest of world | 26 | — | — | 26 | ||||||||||||
|
|
|
|
|
|
|
| |||||||||
| 11,195 | 10,058 | 1,283 | 22,536 | |||||||||||||
|
|
|
|
|
|
|
| |||||||||
30 June 2015 compared to 31 December 2014
Our lending to customers has grown consistently since 2008, and we continue to operate within our prudent risk appetite parameters. The portfolio is 99% concentrated in UK-based counterparties.
During the first half of 2015, committed exposures increased by £1.5bn or 6% to £24.0bn. Mid Corporate and SME exposures grew by 6% to £11.9bn in the first half of 2015, maintaining a positive momentum despite an increasingly competitive and still contracting market. The Commercial Real Estate portfolio increased by 4% to £10.5bn with new business levels more than offsetting repayments. The Social Housing portfolio increased by 29% to £1.7bn driven by refinancing of longer-dated loans previously managed in Corporate Centre onto shorter maturities and on current market terms.
Commercial Banking – credit risk mitigation
At 30 June 2015, collateral held against impaired loans amounted to 46% (2014: 50%) of the carrying amount of impaired loan balances.
| 2015 Half Yearly Financial Report | 35 |
Table of Contents
Risk review
Credit risk
continued
Commercial Banking – credit performance
Exposures exhibiting potentially higher risk characteristics are subject to risk monitoring under the Watchlist process (described in ‘Risk monitoring’ in the ‘Credit risk management’ section in the 2014 Annual Report). The table below sets out the portfolio showing exposures subject to risk monitoring under the Watchlist process and those classified as non-performing by portfolio at 30 June 2015 and 31 December 2014:
| Mid Corporate and SME £m | Commercial Real Estate £m | Social Housing £m | Total £m | |||||||||||||
30 June 2015 | ||||||||||||||||
Total Committed Exposure of which:(1) | 11,874 | 10,452 | 1,660 | 23,986 | ||||||||||||
-Performing (Non-Watchlist) | 10,351 | 9,992 | 1,660 | 22,003 | ||||||||||||
-Watchlist: Enhanced Monitoring | 786 | 157 | — | 943 | ||||||||||||
-Watchlist: Proactive Management | 310 | 56 | — | 366 | ||||||||||||
-Non-performing exposure(2) | 427 | 247 | — | 674 | ||||||||||||
|
|
|
|
|
|
|
| |||||||||
Total impaired exposure of which: | 427 | 247 | — | 674 | ||||||||||||
-Performing | — | — | — | — | ||||||||||||
-Non-performing(2) | 427 | 247 | — | 674 | ||||||||||||
|
|
|
|
|
|
|
| |||||||||
Total Observed impairment loss allowances of which: | 163 | 94 | — | 257 | ||||||||||||
-Performing | — | — | — | — | ||||||||||||
-Non-performing(2) | 163 | 94 | — | 257 | ||||||||||||
|
|
|
|
|
|
|
| |||||||||
IBNO(3) | 40 | |||||||||||||||
Total impairment loss allowance | 297 | |||||||||||||||
|
|
|
|
|
|
|
| |||||||||
31 December 2014 | ||||||||||||||||
Total Committed Exposure of which:(1) | 11,195 | 10,058 | 1,283 | 22,536 | ||||||||||||
-Performing (Non-Watchlist) | 9,683 | 9,229 | 1,253 | 20,165 | ||||||||||||
-Watchlist: Enhanced Monitoring | 741 | 483 | 30 | 1,254 | ||||||||||||
-Watchlist: Proactive Management | 371 | 63 | — | 434 | ||||||||||||
-Non-performing exposure(2) | 400 | 283 | — | 683 | ||||||||||||
|
|
|
|
|
|
|
| |||||||||
Total impaired exposure of which: | 411 | 283 | — | 694 | ||||||||||||
-Performing | 11 | — | — | 11 | ||||||||||||
-Non-performing(2) | 400 | 283 | — | 683 | ||||||||||||
|
|
|
|
|
|
|
| |||||||||
Total Observed impairment loss allowances of which: | 158 | 99 | — | 257 | ||||||||||||
-Performing | 4 | — | — | 4 | ||||||||||||
-Non-performing(2) | 154 | 99 | — | 253 | ||||||||||||
|
|
|
|
|
|
|
| |||||||||
IBNO(3) | 48 | |||||||||||||||
Total impairment loss allowance | 305 | |||||||||||||||
|
|
|
|
|
|
|
| |||||||||
| (1) | Includes committed facilities and derivatives. The terms ‘Enhanced Monitoring’ and ‘Proactive Management’ are defined in the ‘Risk Monitoring‘ section of the Risk Review in the 2014 Annual Report. |
| (2) | Non-performing exposure in the table above include committed facilities and derivative exposures and therefore can be larger than the NPLs in the table below which only include drawn balances. |
| (3) | Allowance for incurred inherent losses (i.e. incurred but not observed (‘IBNO’)) as described in Note 1 to the Consolidated Financial Statements in the 2014 Annual Report. |
| 36 | Santander UK plc |
Table of Contents
Risk governance | Top and emerging risks | Credit risk | Market risk | Balance sheet management risk | Other important risks | Areas of focus and other items | ||||||
|
Non-performing loans and advances(1)(2)
An analysis of Commercial Banking NPLs is presented below.
| 30 June 2015 £m | 31 December 2014 £m | |||||||
Loans and advances to customers of which:(2) | 20,037 | 18,637 | ||||||
NPLs(3) | 652 | 664 | ||||||
|
|
|
| |||||
Impairment loan loss allowances | 297 | 305 | ||||||
|
|
|
| |||||
| % | % | |||||||
NPLs ratio(4) | 3.25 | 3.56 | ||||||
Coverage ratio(5) | 46 | 46 | ||||||
|
|
|
| |||||
| (1) | Loans and advances are classified as non-performing in accordance with the definitions provided in the ‘Credit risk management’ section in the 2014 Annual Report. |
| (2) | Includes Social Housing and Finance leases. |
| (3) | All NPL balances are UK based and continue accruing interest. For the data presented, the balances include interest charged to the customer’s account, but exclude interest accrued but not yet charged to the account. |
| (4) | NPLs as a percentage of loans and advances to customers. |
| (5) | Impairment loan loss allowances as a percentage of NPLs. |
An analysis of the NPL movements during the first half of 2015 is presented below. ‘Entries’ represent loans which have become classified as NPLs during the period. ‘Exits (including repayments)’ represent loans that have been repaid (in full or in part) plus those returned to performing status. ‘Write-offs’ represent the unrecovered element of a loan where recovery options, including realisation of any collateral, have been exhausted. Forbearance activity does not result in a change in the NPL status.
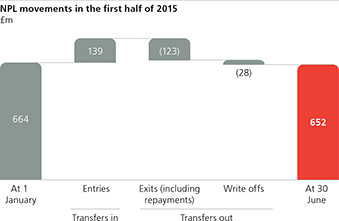
30 June 2015 compared to 31 December 2014
During the first half of 2015, exposures subject to enhanced monitoring and proactive management improved across both the Mid Corporate and SME and Commercial Real Estate portfolios.
In the Mid Corporate and SME portfolio, a small increase of £45m in enhanced monitoring was more than offset by a decrease of £61m in proactive management. In the Commercial Real Estate portfolio, exposures subject to enhanced monitoring decreased by £326m driven by successful refinancing and repayments. At 30 June 2015, none of the Social Housing portfolio exposures were subject to enhanced monitoring or proactive management (2014: 2.3% on enhanced monitoring).
Loans and advances to customers in NPL reduced slightly to £652m at 30 June 2015 (2014: £664m) with lower levels of new entries as a result of the improved trading performance of borrowers. This reduction, together with an overall increase in loans and advances to customers, resulted in a decrease in the NPL ratio to 3.25% at 30 June 2015 (2014: 3.56%).
In the first half of 2015, interest income recognised on impaired loans amounted to £4m (six months ended 30 June 2014: £9m).
| 2015 Half Yearly Financial Report | 37 |
Table of Contents
Risk review
Credit risk
continued
Commercial Banking loans – forbearance
Forbearance commenced during the period(1)
No forbearance arrangements have been necessary with respect to Social Housing counterparties. The exposures that entered forbearance during the six months ended 30 June 2015 and the year ended 31 December 2014 were:
| 30 June 2015 | 31 December 2014 | |||||||||||||||||||||||
| Mid Corporate and SME £m | Commercial Real Estate £m | Total £m | Mid Corporate and SME £m | Commercial Real Estate £m | Total £m | |||||||||||||||||||
Term extension | 33 | 11 | 44 | 23 | 78 | 101 | ||||||||||||||||||
Interest-only | 57 | 4 | 61 | 37 | 14 | 51 | ||||||||||||||||||
Other payment rescheduling | 54 | 8 | 62 | 123 | 27 | 150 | ||||||||||||||||||
|
|
|
|
|
|
|
|
|
|
|
| |||||||||||||
| 144 | 23 | 167 | 183 | 119 | 302 | |||||||||||||||||||
|
|
|
|
|
|
|
|
|
|
|
| |||||||||||||
| (1) | The figures by period reflect the amount of forbearance activity undertaken during the period irrespective of whether any forbearance activity has previously been undertaken on the forborne accounts. |
Forbearance cumulative position
a) Performance status when entering forbearance
The forborne exposures at 30 June 2015 and 31 December 2014 when they originally entered forbearance, analysed by their payment status, were:
| Term extension £m | Interest-only £m | Other payment rescheduling £m | Total £m | Impairment allowance £m | ||||||||||||||||
30 June 2015(1) | ||||||||||||||||||||
Forbearance of NPL | 17 | 23 | 18 | 58 | 23 | |||||||||||||||
Forbearance of Non-NPL | 211 | 339 | 174 | 724 | 126 | |||||||||||||||
|
|
|
|
|
|
|
|
|
| |||||||||||
| 228 | 362 | 192 | 782 | 149 | ||||||||||||||||
|
|
|
|
|
|
|
|
|
| |||||||||||
31 December 2014(1) | ||||||||||||||||||||
Forbearance of NPL | 37 | 13 | 8 | 58 | 16 | |||||||||||||||
Forbearance of Non-NPL | 234 | 318 | 187 | 739 | 124 | |||||||||||||||
|
|
|
|
|
|
|
|
|
| |||||||||||
| 271 | 331 | 195 | 797 | 140 | ||||||||||||||||
|
|
|
|
|
|
|
|
|
| |||||||||||
| (1) | Forbearance type categorisation is based on the first forbearance activity undertaken on the accounts. Tables contain only open accounts at the end of the period. |
b) Performance status at the period-end
The current status of forborne exposures analysed by their payment status, at 30 June 2015 and 31 December 2014 was:
| Term extension £m | Interest-only £m | Other payment rescheduling £m | Total £m | Impairment allowance £m | ||||||||||||||||
30 June 2015(1) | ||||||||||||||||||||
Non-performing | 132 | 171 | 97 | 400 | 147 | |||||||||||||||
Performing | 96 | 191 | 95 | 382 | (2) | 2 | ||||||||||||||
|
|
|
|
|
|
|
|
|
| |||||||||||
| 228 | 362 | 192 | 782 | 149 | ||||||||||||||||
|
|
|
|
|
|
|
|
|
| |||||||||||
Proportion of portfolio | 1.0 | % | 1.5 | % | 0.8 | % | 3.3 | % | ||||||||||||
|
|
|
|
|
|
|
|
|
| |||||||||||
31 December 2014(1) | ||||||||||||||||||||
Non-performing | 154 | 132 | 103 | 389 | 136 | |||||||||||||||
Performing | 117 | 199 | 92 | 408 | (2) | 4 | ||||||||||||||
|
|
|
|
|
|
|
|
|
| |||||||||||
| 271 | 331 | 195 | 797 | 140 | ||||||||||||||||
|
|
|
|
|
|
|
|
|
| |||||||||||
Proportion of portfolio | 1.2 | % | 1.5 | % | 0.9 | % | 3.5 | % | ||||||||||||
|
|
|
|
|
|
|
|
|
| |||||||||||
| (1) | Forbearance type categorisation is based on the first forbearance activity undertaken on the accounts. Tables contain only open accounts at the end of the period. |
| (2) | This represents the carrying amount of financial assets that may otherwise be past due or impaired whose terms have been forborne. |
| 38 | Santander UK plc |
Table of Contents
Risk governance | Top and emerging risks | Credit risk | Market risk | Balance sheet management risk | Other important risks | Areas of focus and other items | ||||||
|
This data may be further analysed by portfolio, as follows:
Mid Corporate and SME
| Term extension £m | Interest-only £m | Other payment rescheduling £m | Total £m | Impairment allowance £m | ||||||||||||||||
30 June 2015(1) | ||||||||||||||||||||
Non-performing | 26 | 134 | 84 | 244 | 93 | |||||||||||||||
Performing | 30 | 82 | 89 | 201 | (2) | 1 | ||||||||||||||
|
|
|
|
|
|
|
|
|
| |||||||||||
| 56 | 216 | 173 | 445 | 94 | ||||||||||||||||
|
|
|
|
|
|
|
|
|
| |||||||||||
Proportion of Mid Corporate and SME portfolio | 0.5 | % | 1.8 | % | 1.5 | % | 3.7 | % | ||||||||||||
|
|
|
|
|
|
|
|
|
| |||||||||||
31 December 2014(1) | ||||||||||||||||||||
Non-performing | 26 | 92 | 97 | 215 | 84 | |||||||||||||||
Performing | 28 | 79 | 85 | 192 | (2) | 4 | ||||||||||||||
|
|
|
|
|
|
|
|
|
| |||||||||||
| 54 | 171 | 182 | 407 | 88 | ||||||||||||||||
|
|
|
|
|
|
|
|
|
| |||||||||||
Proportion of Mid Corporate and SME portfolio | 0.5 | % | 1.5 | % | 1.6 | % | 3.6 | % | ||||||||||||
|
|
|
|
|
|
|
|
|
| |||||||||||
| (1) | Forbearance type categorisation is based on the first forbearance activity undertaken on the accounts. Tables contain only open accounts at the end of the period. |
| (2) | This represents the carrying amount of financial assets that would otherwise be past due or impaired whose terms have been forborne. |
Commercial Real Estate
| Term extension £m | Interest-only £m | Other payment rescheduling £m | Total £m | Impairment allowance £m | ||||||||||||||||
30 June 2015(1) | ||||||||||||||||||||
Non-performing | 106 | 37 | 13 | 156 | 54 | |||||||||||||||
Performing | 66 | 109 | 6 | 181 | (2) | 1 | ||||||||||||||
|
|
|
|
|
|
|
|
|
| |||||||||||
| 172 | 146 | 19 | 337 | 55 | ||||||||||||||||
|
|
|
|
|
|
|
|
|
| |||||||||||
Proportion of Commercial Real Estate portfolio | 1.6 | % | 1.4 | % | 0.2 | % | 3.2 | % | ||||||||||||
|
|
|
|
|
|
|
|
|
| |||||||||||
31 December 2014(1) | ||||||||||||||||||||
Non-performing | 128 | 40 | 6 | 174 | 52 | |||||||||||||||
Performing | 89 | 120 | 7 | 216 | (2) | — | ||||||||||||||
|
|
|
|
|
|
|
|
|
| |||||||||||
| 217 | 160 | 13 | 390 | 52 | ||||||||||||||||
|
|
|
|
|
|
|
|
|
| |||||||||||
Proportion of Commercial Real Estate portfolio | 2.2 | % | 1.6 | % | 0.1 | % | 3.9 | % | ||||||||||||
|
|
|
|
|
|
|
|
|
| |||||||||||
| (1) | Forbearance type categorisation is based on the first forbearance activity undertaken on the accounts. Tables contain only open accounts at the end of the period. |
| (2) | This represents the carrying amount of financial assets that would otherwise be past due or impaired whose terms have been forborne. |
30 June 2015 compared to 31 December 2014
The monthly rate of forbearance commenced in the first half of 2015 increased slightly compared to the rate for the year ended 31 December 2014, with a reduction in the Commercial Real Estate portfolio more than offset by an increase in the Mid Corporate and SME portfolio where the Care Home sector of the portfolio continues to experience challenging market conditions.
The cumulative forbearance stock decreased slightly at 30 June 2015, as cases from older vintages in the Commercial Real Estate portfolio continue to work their way through the forbearance process (see ‘Higher risk loans and other segments of particular interest’ on page 40), which more than offset the entries in the Mid Corporate and SME portfolio. The proportion of forbearance as a percentage of the portfolio decreased slightly to 3.3% at 30 June 2015 (2014: 3.5%).
The majority of initial forbearance continued to occur prior to default, which at 30 June 2015 represented 93% (2014: 93%) of exposure. Forbearance provides the opportunity for businesses to turn around and, at 30 June 2015, 49% (2014: 51%) of total forborne exposure was performing in accordance with the revised terms agreed under the forbearance arrangements indicating that the action had been effective. The remaining cases moved to NPL despite the forbearance granted.
Debt-for-equity swaps
In addition to the forbearance activities shown above, Santander UK has entered into a small number of transactions where Santander UK agreed to exchange a proportion of the amount owed by the borrower for equity in that borrower. These debt-for-equity swaps amounted to £10m at 30 June 2015 (2014: £10m).
| 2015 Half Yearly Financial Report | 39 |
Table of Contents
Risk review
Credit risk
continued
HIGHER RISK LOANS AND OTHER SEGMENTS OF PARTICULAR INTEREST
Commercial Real Estate
The Commercial Real Estate market has experienced a particularly challenging environment over recent years following the financial crisis and has been prone to regular cyclical downturns.
Credit performance
Commercial Real Estate non-performing exposures and weighted average LTVs at 30 June 2015 and 31 December 2014 are further analysed between loans originated pre-2009 and thereafter as they have different profiles:
| 30 June 2015 | 31 December 2014 | |||||||||||||||||||||||
| Original vintage | Original vintage | |||||||||||||||||||||||
| Pre-2009 | 2009 onwards | Total | Pre-2009 | 2009 onwards | Total | |||||||||||||||||||
Total committed exposure | £ | 1,058m | £ | 9,394m | £ | 10,452m | £ | 1,288m | £ | 8,770m | £ | 10,058m | ||||||||||||
Non-performing exposure ratio | 19.4 | % | 0.4 | % | 2.4 | % | 18.3 | % | 0.5 | % | 2.7 | % | ||||||||||||
Weighted average LTV | 62 | % | 52 | % | 53 | % | 66 | % | 52 | % | 54 | % | ||||||||||||
30 June 2015 compared to 31 December 2014
At 30 June 2015, 83% (2014: 85%) of the non-performing exposures related to deals originated pre-2009. The pre-2009 vintage loans were written on terms prevailing in the market at that time which, compared to more recent times, included higher original LTVs, lower interest coverage and exposure to development or letting risk. Following the significant downturn in the Commercial Real Estate market in 2008 and 2009, some of these customers suffered financial stress resulting in their inability to meet the contractual payment terms, comply with covenants, or achieve refinancing/repayment at maturity. As a result, the pre-2009 sub-portfolio has experienced higher non-performing rates in recent years.
In light of the market deterioration, Santander UK’s lending criteria were significantly tightened from 2009 onwards, with lower LTVs and the avoidance of transactions with material letting or development risks. At 30 June 2015, transactions with material letting or development risks represented only 4% (2014: 4%) of the total Commercial Real Estate portfolio. As a result, the sub-portfolio representing loans originating from 2009 onwards continues to perform significantly better than the pre-2009 sub-portfolio. At 30 June 2015, the pre-2009 sub-portfolio represented 10% (2014: 13%) of the total Commercial Real Estate portfolio.
Sector analysis
The Commercial Real Estate portfolio remained well diversified by sector at 30 June 2015 and 31 December 2014, as set out below.
Sector | 30 June 2015 % | 31 December 2014 % | ||||||
Office | 26 | 22 | ||||||
Retail | 21 | 23 | ||||||
Industrial | 15 | 16 | ||||||
Residential | 14 | 13 | ||||||
Mixed use | 10 | 12 | ||||||
Student accommodation | 4 | 3 | ||||||
Hotels and leisure | 6 | 6 | ||||||
Other | 4 | 5 | ||||||
|
|
|
| |||||
| 100 | 100 | |||||||
|
|
|
| |||||
| 40 | Santander UK plc |
Table of Contents
Risk governance | Top and emerging risks | Credit risk | Market risk | Balance sheet management risk | Other important risks | Areas of focus and other items | ||||||
|
Loan-to-value analysis
In Commercial Real Estate lending, the main form of credit mitigation is collateral. The table below analyses the LTV ratios of loans within the Commercial Real Estate portfolio at 30 June 2015 and 31 December 2014. The LTV distribution is presented for the non-standardised portfolio (see the ‘Credit Risk Management’ section in the 2014 Annual Report), which at £9.1bn represented 87% of the total Commercial Real Estate portfolio at 30 June 2015. The residual element of the portfolio consists of smaller value transactions largely in the form of commercial mortgages. These loans have therefore been excluded from the analysis below.
| 30 June 2015 | 31 December 2014 | |||||||||||||||
| Stock % | New business % | Stock % | New business % | |||||||||||||
Up to 50% | 38 | 41 | 33 | 31 | ||||||||||||
50% to 60% | 39 | 36 | 39 | 49 | ||||||||||||
60% to 70% | 18 | 22 | 21 | 20 | ||||||||||||
70% to 80% | 2 | 1 | 4 | — | ||||||||||||
80% to 90% | 1 | — | 1 | — | ||||||||||||
90% to 100% | 1 | — | 1 | — | ||||||||||||
>100% i.e. negative equity | 1 | — | 1 | — | ||||||||||||
|
|
|
|
|
|
|
| |||||||||
| 100 | 100 | 100 | 100 | |||||||||||||
|
|
|
|
|
|
|
| |||||||||
30 June 2015 compared to 31 December 2014
At 30 June 2015, the LTV profile of the portfolio remained conservative with 77% (2014: 72%) of the portfolio at or below 60% LTV. This reflects the vintage of the portfolio with 90% (2014: 87%) having been originated in 2009 or subsequent years. The majority of higher LTV deals represent older deals which remain in the portfolio.
Only 1% of new business was written above 70% LTV in the first half of 2015, with 77% written below 60% LTV. The majority of the cases with negative equity form part of the forborne element of the portfolio and are managed by the Restructuring & Recoveries team.
At 30 June 2015, the average LTV, weighted by exposure, was 53% (2014: 54%). The weighted average LTV of new deals written in the first half of 2015 was 51% (2014: 52%).
Refinancing risk
As part of the annual review process, for Commercial Real Estate loans that are approaching maturity, consideration is given to the prospects of refinancing the loan at prevailing market terms and applicable credit policy. The review considers this and other aspects (e.g. covenant compliance) which could result in the case being placed on the Watchlist. Additionally, where an acceptable refinancing proposal has not been received within six months prior to maturity, the case is placed on the Watchlist.
At 30 June 2015, Commercial Real Estate loans of £1,521m (2014: £1,342m) were due to mature within 12 months. Of these, £105m i.e. 7% (2014: £139m i.e. 10%) have an LTV ratio above that which would be considered acceptable under current credit policy, £54m of which (2014: £139m) has been placed on the Watchlist or recorded as NPL and has an impairment loss allowance of £24m (2014: £40m) associated with it. The residual balance refers to a single loan for which an acceptable exit strategy is being progressed.
| 2015 Half Yearly Financial Report | 41 |
Table of Contents
Risk review
Credit risk
continued
CREDIT RISK — CORPORATE & INSTITUTIONAL BANKING
In Corporate & Institutional Banking, credit risk arises on asset balances and off-balance sheet transactions such as credit facilities or guarantees. Consequently, committed exposures are typically higher than asset balances. However, in the following committed exposures tables, Sovereigns and Supranationals are presented net of short positions and include Sovereign and Supranational exposures established for liquidity management purposes, managed by Short Term Markets on behalf of Corporate Centre. Large Corporate reverse repurchase agreement exposures are presented net of repurchase agreement liabilities and include OTC derivatives. As a result, the committed exposures can be smaller than the asset balances recognised on the balance sheet. In addition, the derivative risk exposures in the tables below (which are classified as ‘Financial Institutions’) are lower than the balance sheet position because the overall risk exposure is monitored and therefore consideration is taken of margin posted, CSAs in ISDA Master Agreements, and master netting agreements and other financial instruments which reduce the Santander UK group’s exposures. Derivative asset balances recognised on the balance sheet reflect only the more restrictive netting permitted by IAS 32.
Corporate & Institutional Banking — committed exposures
Rating distribution
The rating distribution tables show the credit risk exposure by Santander UK’s internal rating scale (see the ‘Credit quality’ section) for each portfolio. Within this scale, the higher the rating, the better the quality of the counterparty.
| Sovereign and Supranational £m | Large Corporate £m | Structured Finance £m | Financial Institutions £m | Total £m | ||||||||||||||||
30 June 2015 | ||||||||||||||||||||
9 | 1,746 | — | — | 232 | 1,978 | |||||||||||||||
8 | 2,741 | 1,985 | — | 3,373 | 8,099 | |||||||||||||||
7 | 511 | 4,641 | — | 2,494 | 7,646 | |||||||||||||||
6 | — | 7,708 | 43 | 323 | 8,074 | |||||||||||||||
5 | — | 3,652 | 88 | 39 | 3,779 | |||||||||||||||
4 | — | 70 | — | 12 | 82 | |||||||||||||||
1 to 3 | — | 19 | 8 | 29 | 56 | |||||||||||||||
Other | — | — | — | — | — | |||||||||||||||
|
|
|
|
|
|
|
|
|
| |||||||||||
| 4,998 | 18,075 | 139 | 6,502 | 29,714 | ||||||||||||||||
|
|
|
|
|
|
|
|
|
| |||||||||||
31 December 2014 | ||||||||||||||||||||
9 | 2,679 | 20 | — | 210 | 2,909 | |||||||||||||||
8 | 4,079 | 1,631 | — | 3,229 | 8,939 | |||||||||||||||
7 | 928 | 4,444 | — | 2,928 | 8,300 | |||||||||||||||
6 | — | 8,333 | 28 | 220 | 8,581 | |||||||||||||||
5 | — | 3,050 | 96 | 79 | 3,225 | |||||||||||||||
4 | — | 56 | — | — | 56 | |||||||||||||||
1 to 3 | — | 79 | 76 | 103 | 258 | |||||||||||||||
Other | — | — | — | — | — | |||||||||||||||
|
|
|
|
|
|
|
|
|
| |||||||||||
| 7,686 | 17,613 | 200 | 6,769 | 32,268 | ||||||||||||||||
|
|
|
|
|
|
|
|
|
| |||||||||||
| 42 | Santander UK plc |
Table of Contents
Risk governance | Top and emerging risks | Credit risk | Market risk | Balance sheet management risk | Other important risks | Areas of focus and other items | ||||||
|
Geographical distribution
The geographical location is classified by country of risk, being the country where each counterparty’s main business activity or assets are located, except where a full risk transfer guarantee is in place, in which case the country of domicile of the guarantor is used. For clients whose operations are more geographically dispersed, the country of incorporation is applied.
| Sovereign and Supranational £m | Large Corporate £m | Structured Finance £m | Financial Institutions £m | Total £m | ||||||||||||||||
30 June 2015 | ||||||||||||||||||||
UK | 4 | 15,550 | 51 | 3,257 | 18,862 | |||||||||||||||
Peripheral eurozone | 511 | 681 | 17 | 719 | 1,928 | |||||||||||||||
Rest of Europe | 1,636 | 1,508 | 51 | 913 | 4,108 | |||||||||||||||
US | 58 | 49 | 20 | 1,082 | 1,209 | |||||||||||||||
Rest of world | 2,789 | 287 | — | 531 | 3,607 | |||||||||||||||
|
|
|
|
|
|
|
|
|
| |||||||||||
| 4,998 | 18,075 | 139 | 6,502 | 29,714 | ||||||||||||||||
|
|
|
|
|
|
|
|
|
| |||||||||||
31 December 2014 | ||||||||||||||||||||
UK | 850 | 14,952 | 102 | 3,197 | 19,101 | |||||||||||||||
Peripheral eurozone | 928 | 608 | 41 | 967 | 2,544 | |||||||||||||||
Rest of Europe | 1,716 | 1,684 | 57 | 916 | 4,373 | |||||||||||||||
US | 2 | 30 | — | 1,331 | 1,363 | |||||||||||||||
Rest of world | 4,190 | 339 | — | 358 | 4,887 | |||||||||||||||
|
|
|
|
|
|
|
|
|
| |||||||||||
| 7,686 | 17,613 | 200 | 6,769 | 32,268 | ||||||||||||||||
|
|
|
|
|
|
|
|
|
| |||||||||||
30 June 2015 compared to 31 December 2014
During the first half of 2015, committed exposures decreased by £2.6bn or 8% to £29.7bn principally due to decreases in the Sovereign and Supranational, Structured Finance and Financial Institutions portfolios, partially offset by a small increase in the Large Corporate portfolio.
Sovereign and Supranational exposures decreased by 35% in the first half of 2015. This reflected reduced holdings in Japanese, UK and Italian Government Securities as part of normal liquid asset portfolio management and short-term markets trading activity. The portfolio profile remained primarily short-term (up to one year) reflecting the purpose of the holdings.
Large Corporate exposures increased by £0.5bn in the first half of 2015 continuing to focus on high-rated multinational companies. Growth was focused on the UK, with some diversification in other countries with counterparties with good credit quality. The portfolio profile remained primarily short to medium-term (up to five years), reflecting the type of finance provided to support the working capital and liquidity needs of our clients. The weighted average credit quality remained broadly consistent in the first half of the year. There was a migration of £0.6bn from rating band 6 to rating band 5 in the period reflecting the impact of macro-economic changes in the UK retail and leisure sector, as well as in the oil and gas industry.
No new positions were taken in the Structured Finance portfolio in the first half of 2015 in accordance with the run-off strategy.
Financial Institutions exposures decreased by 4% in the first half of 2015, mainly driven by a reduction in the fair values of exposures cleared through Central Counterparties (‘CCPs’), as well as the maturity of Banco Santander group guarantees to support the trade finance activities of our customers in other geographies.
Corporate & Institutional Banking – credit risk mitigation
Credit risk to counterparties on derivative products is mitigated through netting arrangements, collateralisation and the use of CCPs. For details of the approach to credit risk mitigation, see the ‘Credit risk management – Corporate & Institutional Banking’ section in the 2014 Annual Report. The top 20 clients with which Santander UK had the biggest derivative exposures were banks and CCPs. These top 20 clients’ derivative exposure accounted for 73% of the total derivative exposure in Corporate & Institutional Banking at 30 June 2015 (2014: 76%). The risk exposure weighted-average credit rating was 7.6 at 30 June 2015 (2014: 7.6).
In addition, at 30 June 2015, collateral held against impaired loans in the Structured Finance portfolio amounted to 99% (2014: 8%) of the carrying amount of impaired loan balances. This improvement reflected the disposal during the period of a single loan against which no collateral had been held.
| 2015 Half Yearly Financial Report | 43 |
Table of Contents
Risk review
Credit risk
continued
Corporate & Institutional Banking – credit performance
Exposures exhibiting potentially higher risk characteristics are subject to risk monitoring under the Watchlist process (described in ‘Risk monitoring’ in the ‘Credit risk management’ section in the 2014 Annual Report). The table below sets out the portfolio showing exposures subject to risk monitoring under the Watchlist process and those classified as non-performing by portfolio at 30 June 2015 and 31 December 2014:
| Sovereign and Supranational £m | Large Corporate £m | Structured Finance £m | Financial Institutions £m | Total £m | ||||||||||||||||
30 June 2015 | ||||||||||||||||||||
Total Committed Exposure of which:(1) | 4,998 | 18,075 | 139 | 6,502 | 29,714 | |||||||||||||||
- Performing – (Non-Watchlist) | 4,998 | 16,647 | 80 | 6,455 | 28,180 | |||||||||||||||
- Watchlist: Enhanced Monitoring | — | 1,354 | 51 | 1 | 1,406 | |||||||||||||||
- Watchlist: Proactive Management | — | 74 | 4 | 46 | 124 | |||||||||||||||
- Non-performing exposure(2) | — | — | 4 | — | 4 | |||||||||||||||
|
|
|
|
|
|
|
|
|
| |||||||||||
Total impaired exposure of which: | — | — | 4 | — | 4 | |||||||||||||||
- Performing | — | — | — | — | — | |||||||||||||||
- Non-performing(2) | — | — | 4 | — | 4 | |||||||||||||||
|
|
|
|
|
|
|
|
|
| |||||||||||
Total Observed impairment loss allowances of which: | — | — | 3 | — | 3 | |||||||||||||||
- Performing | — | — | — | — | — | |||||||||||||||
- Non-performing | — | — | 3 | — | 3 | |||||||||||||||
|
|
|
|
|
|
|
|
|
| |||||||||||
IBNO(3) | 24 | |||||||||||||||||||
Total impairment loss allowance | 27 | |||||||||||||||||||
|
|
|
|
|
|
|
|
|
| |||||||||||
31 December 2014 | ||||||||||||||||||||
Total Committed Exposure of which:(1) | 7,686 | 17,613 | 200 | 6,769 | 32,268 | |||||||||||||||
- Performing – (Non-Watchlist) | 7,686 | 16,452 | 47 | 6,703 | 30,888 | |||||||||||||||
- Watchlist: Enhanced Monitoring | — | 1,095 | 77 | 5 | 1,177 | |||||||||||||||
- Watchlist: Proactive Management | — | 66 | 23 | 61 | 150 | |||||||||||||||
- Non-performing exposure(2) | — | — | 53 | — | 53 | |||||||||||||||
|
|
|
|
|
|
|
|
|
| |||||||||||
Total impaired exposure of which: | — | — | 137 | — | 137 | |||||||||||||||
- Performing | — | — | 84 | — | 84 | |||||||||||||||
- Non-performing | — | — | 53 | — | 53 | |||||||||||||||
|
|
|
|
|
|
|
|
|
| |||||||||||
Total Observed impairment loss allowances of which: | — | — | 49 | — | 49 | |||||||||||||||
- Performing | — | — | 21 | — | 21 | |||||||||||||||
- Non-performing(2) | — | — | 28 | — | 28 | |||||||||||||||
|
|
|
|
|
|
|
|
|
| |||||||||||
IBNO(3) | 24 | |||||||||||||||||||
Total impairment loss allowance | 73 | |||||||||||||||||||
|
|
|
|
|
|
|
|
|
| |||||||||||
| (1) | Includes committed facilities and derivatives. The terms ‘Enhanced Monitoring’ and ‘Proactive Management’ are defined in the ‘Risk monitoring‘ section of the Risk review in the 2014 Annual Report. |
| (2) | Non-performing exposure in the table above include committed facilities and derivative exposures and therefore can be larger than the NPLs in the table on page 45 which only include drawn balances. |
| (3) | Allowance for incurred inherent losses (i.e. incurred but not observed (‘IBNO’)) as described in Note 1 to the Consolidated Financial Statements in the 2014 Annual Report. |
| 44 | Santander UK plc |
Table of Contents
Risk governance | Top and emerging risks | Credit risk | Market risk | Balance sheet management risk | Other important risks | Areas of focus and other items | ||||||
|
Non-performing loans and advances(1)(2)
An analysis of Corporate & Institutional Banking NPLs is presented below.
| 30 June 2015 £m | 31 December 2014 £m | |||||||
Loans and advances to customers of which:(2) | 5,712 | 5,224 | ||||||
NPLs(3) | 4 | 53 | ||||||
|
|
|
| |||||
Impairment loan loss allowances | 27 | 73 | ||||||
|
|
|
| |||||
| % | % | |||||||
NPLs ratio(4) | 0.07 | 1.01 | ||||||
Coverage ratio(5) | 675 | 138 | ||||||
| (1) | Loans and advances are classified as non-performing in accordance with the definitions provided in the ‘Credit risk management’ section in the 2014 Annual Report. |
| (2) | Include finance leases. |
| (3) | All NPL balances are UK based and continue accruing interest. For the data presented, the balances include interest charged to the customer’s account, but exclude interest accrued but not yet charged to the account. |
| (4) | NPLs as a percentage of loans and advances to customers. |
| (5) | Impairment loan loss allowances as a % of NPLs. Total loan loss allowances relate to early arrears and performing assets (i.e. the IBNO provision) as well as accounts classified as NPL and hence the ratio exceeds 100%. |
An analysis of the NPL movements in the first half of 2015 is presented below. ‘Entries’ represent loans which have become classified as NPLs during the period. ‘Exits (including repayments)’ represent that element of loans to customers that have been repaid (in full or in part) plus those returned to performing status. ‘Write-offs’ represent the unrecovered element of a loan where recovery options, including realisation of any collateral, have been exhausted. Forbearance activity does not result in a change in the NPL status.
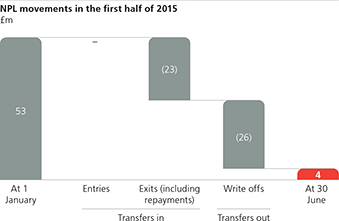
30 June 2015 compared to 31 December 2014
Watchlist exposures subject to proactive management decreased by 17% to £124m at 30 June 2015 (2014: £150m), mainly driven by the Structured Finance run-off strategy. Watchlist exposures subject to enhanced monitoring increased in the Large Corporate portfolio in the first half of the year, principally relating to holdings in the UK retail and leisure sector, as well as the oil and gas industry. In the Sovereign and Supranational portfolio, there were no exposures subject to proactive management or enhanced monitoring.
Loans and advances to customers in NPL decreased to £4m (2014: £53m) and the NPL ratio decreased to 0.07% at 30 June 2015 (2014: 1.01%) due to the combined repayment and write-off of a single loan of £49m and asset growth in the first half of the year.
In the first half of 2015, no interest income was recognised on impaired loans (2014: £nil).
Corporate & Institutional Banking – forbearance
The approach to forbearance in Corporate & Institutional Banking is the same as for Commercial Banking, although the volume of forbearance is significantly lower reflecting the higher credit quality of the majority of the portfolio. At 30 June 2015, there was a single forborne case of £3m within the Structured Finance portfolio which remains classified as NPL (2014: £53m).
At 30 June 2015, there were no financial assets that may otherwise be past due or impaired whose terms have been forborne (2014: £nil).
| 2015 Half Yearly Financial Report | 45 |
Table of Contents
Risk review
Credit risk
continued
CREDIT RISK – CORPORATE CENTRE
Credit risk arises on assets in the balance sheet and in off-balance sheet transactions. Consequently, the committed exposure (which takes into account credit mitigation procedures) is shown in the tables below. It also excludes Sovereign exposures managed by Short Term Markets within Corporate & Institutional Banking.
Corporate Centre – committed exposures
Rating distribution
The rating distribution tables below show the credit risk exposure by Santander UK’s internal rating scale (see the ‘Credit quality’ section) for each portfolio. Within this scale, the higher the rating, the better the quality of the counterparty.
| Sovereign and Supranational £m | Structured Products £m | Derivatives £m | Legacy Portfolios in run-off(2) £m | Social Housing £m | Total £m | |||||||||||||||||||
| 30 June 2015 | ||||||||||||||||||||||||
9 | 26,221 | 1,675 | — | 1 | 3,073 | 30,970 | ||||||||||||||||||
8 | — | 1,396 | 954 | 2 | 3,690 | 6,042 | ||||||||||||||||||
7 | — | 412 | 259 | 530 | 1,323 | 2,524 | ||||||||||||||||||
6 | — | — | 11 | 324 | 223 | 558 | ||||||||||||||||||
5 | — | 37 | — | 82 | — | 119 | ||||||||||||||||||
4 | — | 2 | — | 116 | — | 118 | ||||||||||||||||||
1 to 3 | — | 6 | — | 117 | — | 123 | ||||||||||||||||||
Other(1) | — | — | — | 712 | — | 712 | ||||||||||||||||||
|
|
|
|
|
|
|
|
|
|
|
| |||||||||||||
| 26,221 | 3,528 | 1,224 | 1,884 | 8,309 | 41,166 | |||||||||||||||||||
|
|
|
|
|
|
|
|
|
|
|
| |||||||||||||
31 December 2014 | ||||||||||||||||||||||||
9 | 29,029 | 1,558 | — | — | 2,784 | 33,371 | ||||||||||||||||||
8 | — | 1,013 | 741 | 3 | 4,215 | 5,972 | ||||||||||||||||||
7 | — | 753 | 561 | 615 | 1,485 | 3,414 | ||||||||||||||||||
6 | — | — | — | 385 | 223 | 608 | ||||||||||||||||||
5 | — | 7 | — | 136 | — | 143 | ||||||||||||||||||
4 | — | — | — | 165 | — | 165 | ||||||||||||||||||
1 to 3 | — | — | — | 89 | — | 89 | ||||||||||||||||||
Other(1) | — | — | — | 774 | — | 774 | ||||||||||||||||||
|
|
|
|
|
|
|
|
|
|
|
| |||||||||||||
| 29,029 | 3,331 | 1,302 | 2,167 | 8,707 | 44,536 | |||||||||||||||||||
|
|
|
|
|
|
|
|
|
|
|
| |||||||||||||
| (1) | Represents smaller exposures predominantly within the commercial mortgage portfolio which are subject to scorecards rather than a rating model. |
| (2) | Legacy portfolio in run-off consists of commercial mortgages and residual structured and asset finance loans (shipping, aviation, and structured finance). |
| 46 | Santander UK plc |
Table of Contents
Risk governance | Top and emerging risks | Credit risk | Market risk | Balance sheet management risk | Other important risks | Areas of focus and other items | ||||||
|
Geographical distribution
The geographical location is classified by country of risk, being the country where each counterparty’s main business activity or assets are located. For clients whose operations are more geographically dispersed, the country of incorporation is applied.
| Sovereign and Supranational £m | Structured Products £m | Derivatives £m | Legacy Portfolios in run-off £m | Social Housing £m | Total £m | |||||||||||||||||||
| 30 June 2015 | ||||||||||||||||||||||||
UK | 20,485 | 1,128 | 270 | 1,531 | 8,309 | 31,723 | ||||||||||||||||||
Peripheral eurozone | — | 67 | — | 8 | — | 75 | ||||||||||||||||||
Rest of Europe | 684 | 1,568 | 520 | 28 | — | 2,800 | ||||||||||||||||||
US | 3,997 | 109 | 434 | 23 | — | 4,563 | ||||||||||||||||||
Rest of world | 1,055 | 656 | — | 294 | — | 2,005 | ||||||||||||||||||
|
|
|
|
|
|
|
|
|
|
|
| |||||||||||||
| 26,221 | 3,528 | 1,224 | 1,884 | 8,309 | 41,166 | |||||||||||||||||||
|
|
|
|
|
|
|
|
|
|
|
| |||||||||||||
31 December 2014 | ||||||||||||||||||||||||
UK | 22,621 | 966 | 285 | 1,706 | 8,707 | 34,285 | ||||||||||||||||||
Peripheral eurozone | — | 73 | — | 20 | — | 93 | ||||||||||||||||||
Rest of Europe | 553 | 1,544 | 581 | 36 | — | 2,714 | ||||||||||||||||||
US | 4,823 | 85 | 436 | 25 | — | 5,369 | ||||||||||||||||||
Rest of world | 1,032 | 663 | — | 380 | — | 2,075 | ||||||||||||||||||
|
|
|
|
|
|
|
|
|
|
|
| |||||||||||||
| 29,029 | 3,331 | 1,302 | 2,167 | 8,707 | 44,536 | |||||||||||||||||||
|
|
|
|
|
|
|
|
|
|
|
| |||||||||||||
30 June 2015 compared to 31 December 2014
During the first half of 2015, committed exposures decreased by £3.4bn or 8% to £41.2bn principally in the Sovereign and Supranational portfolio, as well as the Legacy Portfolios in run-off and Social Housing.
Sovereign and Supranationals exposures principally reflect cash at central banks and holdings of highly-rated liquid assets as part of normal liquid asset portfolio management. The overall decrease in exposures in the first half of 2015 was driven by the reduction of UK government securities and deposits in the US. The slight increase in Rest of Europe exposures principally related to issues guaranteed by the German and Austrian governments.
Structured Products exposures represent holdings of good credit quality rated covered bonds, floating rate notes and residential mortgage-backed securities as part of normal liquid asset portfolio management. The increase in exposures in the first half of 2015 reflected the purchase of securitisations in the UK and US, and covered bond issuances mainly by Western European banks primarily with maturities of less than five years.
Derivative exposures decreased slightly in the period due to the continued managed reduction of the portfolio.
Legacy Portfolios in run-off decreased slightly in the first half of 2015 due to the ongoing exit strategy.
Social Housing exposures reduced in the first half of 2015 as a result of the ongoing refinancing of longer-dated loans onto shorter maturities (and on current market terms) that are subsequently managed in Commercial Banking.
| 2015 Half Yearly Financial Report | 47 |
Table of Contents
Risk review
Credit risk
continued
Corporate Centre – credit risk mitigation
Most Structured Products are unsecured but benefit from senior positions in the creditor hierarchy. Credit risk in derivatives is mitigated by netting agreements, collateralisation and the use of CCPs. For details of the approach to credit risk mitigation, see ‘Credit Risk Management – Corporate & Institutional Banking’ in the 2014 Annual Report.
In the Legacy Portfolios in run-off, at 30 June 2015, cash collateral of £553m (2014: £670m) was held, and collateral held against impaired loans amounted to 100% (2014: 100%) of the carrying amount of impaired loan balances. At 30 June 2015, of the aviation portfolio of £156m (2014: £225m), £136m (2014: £194m) was asset-backed and £20m (2014: £31m) was receivables-backed. Of the asset-backed loans, 80% (2014: 96%) had a collateral value in excess of the loan value. Of the shipping portfolio of £275m (2014: £289m), £184m (2014: £196m) was asset-backed and £91m (2014: £93m) cash or bank guaranteed. Of the asset-backed loans, 46% (2014: 47%) had a collateral value in excess of the loan value.
Corporate Centre – credit performance
Exposures exhibiting potentially higher risk characteristics are subject to risk monitoring under the Watchlist process (described in ‘Risk monitoring’ in the ‘Credit risk management’ section in the 2014 Annual Report). The table below sets out the portfolio showing exposures subject to risk monitoring under the Watchlist process and those classified as non-performing by portfolio at 30 June 2015 and 31 December 2014:
| Sovereign and Supranational £m | Structured Products £m | Derivatives £m | Legacy Portfolios in run-off £m | Social Housing £m | Total £m | |||||||||||||||||||
| 30 June 2015 | ||||||||||||||||||||||||
Total Committed Exposure of which:(1) | 26,221 | 3,528 | 1,224 | 1,884 | 8,309 | 41,166 | ||||||||||||||||||
- Performing (Non-Watchlist) | 26,221 | 3,528 | 1,224 | 1,631 | 8,241 | 40,845 | ||||||||||||||||||
- Watchlist: Enhanced Monitoring | — | — | — | 80 | 68 | 148 | ||||||||||||||||||
- Watchlist: Proactive Management | — | — | — | 11 | — | 11 | ||||||||||||||||||
- Non-performing exposure(2) | — | — | — | 162 | — | 162 | ||||||||||||||||||
|
|
|
|
|
|
|
|
|
|
|
| |||||||||||||
Total impaired exposure of which: | — | — | — | 162 | — | 162 | ||||||||||||||||||
- Performing | — | — | — | — | — | — | ||||||||||||||||||
- Non-performing(2) | — | — | — | 162 | — | 162 | ||||||||||||||||||
|
|
|
|
|
|
|
|
|
|
|
| |||||||||||||
Total Observed impairment loss allowances of which: | — | — | — | 80 | — | 80 | ||||||||||||||||||
- Performing | — | — | — | — | — | — | ||||||||||||||||||
- Non-performing(2) | — | — | — | 80 | — | 80 | ||||||||||||||||||
|
|
|
|
|
|
|
|
|
|
|
| |||||||||||||
IBNO(3) | 55 | |||||||||||||||||||||||
Total impairment loss allowance | 135 | |||||||||||||||||||||||
|
|
|
|
|
|
|
|
|
|
|
| |||||||||||||
31 December 2014 | ||||||||||||||||||||||||
Total Committed Exposure of which:(1) | 29,029 | 3,331 | 1,302 | 2,167 | 8,707 | 44,536 | ||||||||||||||||||
- Performing (Non-Watchlist) | 29,029 | 3,331 | 1,302 | 1,917 | 8,707 | 44,286 | ||||||||||||||||||
- Watchlist: Enhanced Monitoring | — | — | — | 94 | — | 94 | ||||||||||||||||||
- Watchlist: Proactive Management | — | — | — | 14 | — | 14 | ||||||||||||||||||
- Non-performing exposure(2) | — | — | — | 142 | — | 142 | ||||||||||||||||||
|
|
|
|
|
|
|
|
|
|
|
| |||||||||||||
Total impaired exposure of which: | — | — | — | 238 | — | 238 | ||||||||||||||||||
- Performing | — | — | — | 96 | — | 96 | ||||||||||||||||||
- Non-performing(2) | — | — | — | 142 | — | 142 | ||||||||||||||||||
|
|
|
|
|
|
|
|
|
|
|
| |||||||||||||
Total Observed impairment loss allowances of which: | — | — | — | 109 | — | 109 | ||||||||||||||||||
- Performing | — | — | — | 31 | — | 31 | ||||||||||||||||||
- Non-performing(2) | — | — | — | 78 | — | 78 | ||||||||||||||||||
|
|
|
|
|
|
|
|
|
|
|
| |||||||||||||
IBNO(3) | 71 | |||||||||||||||||||||||
Total impairment loss allowance | 180 | |||||||||||||||||||||||
|
|
|
|
|
|
|
|
|
|
|
| |||||||||||||
| (1) | Includes committed facilities and derivatives. The terms ‘Enhanced Monitoring’ and ‘Proactive Management’ are defined in the ‘Risk Monitoring ‘section of the Risk Review in the 2014 Annual Report. |
| (2) | Non-performing exposure in the table above include committed facilities and derivative exposures and therefore can be larger than the NPLs in the table on page 49 which only include drawn balances. |
| (3) | Allowance for incurred inherent losses (i.e. incurred but not observed (‘IBNO’)) as described in Note 1 to the Consolidated Financial Statements in the 2014 Annual Report. |
| 48 | Santander UK plc |
Table of Contents
Risk governance | Top and emerging risks | Credit risk | Market risk | Balance sheet management risk | Other important risks | Areas of focus and other items | ||||||
|
Non-performing loans and advances(1)(2)
An analysis of Corporate Centre NPLs is presented below.
| 30 June 2015 £m | 31 December 2014 £m | |||||||
Loans and advances to customers of which:(2) | 7,859 | 8,276 | ||||||
NPLs(3) | 152 | 134 | ||||||
|
|
|
| |||||
Impairment loan loss allowances | 135 | 180 | ||||||
|
|
|
| |||||
| % | % | |||||||
NPLs ratio(4) | 1.93 | 1.62 | ||||||
Coverage ratio(5) | 89 | 134 | ||||||
| (1) | Loans and advances are classified as non-performing in accordance with the definitions provided in the ‘Credit risk management’ section in the 2014 Annual Report. |
| (2) | Include Social Housing loans and finance leases. |
| (3) | All NPL balances are UK based and continue accruing interest. For the data presented, the balances include interest charged to the customer’s account, but exclude interest accrued but not yet charged to the account. |
| (4) | NPLs as a percentage of loans and advances to customers. |
| (5) | Total impairment loan loss allowances, as a % of NPL stock. Total loan loss allowances relate to early arrears and performing assets (i.e. the IBNO provision) as well as accounts classified as NPL and hence the ratio exceeded 100% in 2014. |
An analysis of the NPL movements during the first half of 2015 is presented below. ‘Entries’ represent loans which have become classified as NPLs during the period. ‘Exits (including repayments)’ represent that element of loans that have been repaid (in full or in part) plus those returned to performing status. ‘Write-offs’ represent the unrecovered element of a loan where recovery options, including realisation of any collateral, have been exhausted. Forbearance activity does not result in a change in the NPL status.
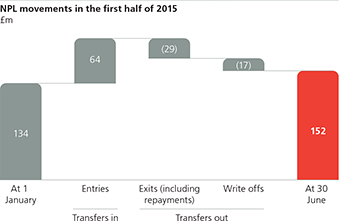
30 June 2015 compared to 31 December 2014
Watchlist exposures subject to proactive management remained stable at £11m at 30 June 2015 (2014: £14m). Watchlist exposures subject to enhancing monitoring increased to £148m (2014: £94m) due to the addition of a single Social Housing case.
Loans and advances to customers in NPL increased to £152m at 30 June 2015 (2014: £134m), with an increase in the NPL ratio to 1.93% (2014: 1.62%). This primarily reflected a single aviation loan of £21m transferring into NPL status during the period due to concerns over the declining collateral value, as well as other smaller loans. In the first half of 2015, the coverage ratio decreased to 89% (2014: 134%) reflecting exits from exposures with high provision levels.
In the first half of 2015, interest income recognised on impaired loans amounted to £1m (six months ended 30 June 2014: £4m).
| 2015 Half Yearly Financial Report | 49 |
Table of Contents
Risk review
Credit risk
continued
Corporate Centre – forbearance
Forbearance commenced during the period(1)
Forbearance arrangements have only been entered into with respect to the Legacy Portfolios in run-off.
The exposures that entered forbearance during the six months ended 30 June 2015 and the year ended 31 December 2014 were:
| 30 June 2015 £m | 31 December 2014 £m | |||||||
Term extension | — | 41 | ||||||
Interest-only | 9 | 13 | ||||||
Other payment rescheduling | 3 | 22 | ||||||
|
|
|
| |||||
| 12 | 76 | |||||||
|
|
|
| |||||
| (1) | The figures by period reflect the amount of forbearance activity undertaken during the period irrespective of whether any forbearance activity has previously been undertaken on the forborne accounts. |
a) Performance status when entering forbearance
The forborne exposures at 30 June 2015 and 31 December 2014 when they originally entered forbearance, analysed by their payment status, was:
| Term extension £m | Interest-only £m | Other payment rescheduling £m | Total £m | Impairment allowance £m | ||||||||||||||||
30 June 2015(1) | ||||||||||||||||||||
Forbearance of NPL | — | 12 | 9 | 21 | 5 | |||||||||||||||
Forbearance of Non-NPL | 60 | 55 | 189 | 304 | 39 | |||||||||||||||
|
|
|
|
|
|
|
|
|
| |||||||||||
| 60 | 67 | 198 | 325 | 44 | ||||||||||||||||
|
|
|
|
|
|
|
|
|
| |||||||||||
31 December 2014(1) | ||||||||||||||||||||
Forbearance of NPL | — | 10 | 8 | 18 | 8 | |||||||||||||||
Forbearance of Non-NPL | 61 | 64 | 188 | 313 | 42 | |||||||||||||||
|
|
|
|
|
|
|
|
|
| |||||||||||
| 61 | 74 | 196 | 331 | 50 | ||||||||||||||||
|
|
|
|
|
|
|
|
|
| |||||||||||
| (1) | Forbearance type categorisation is based on the first forbearance activity undertaken on the accounts. Tables contain only open accounts at the end of the period. |
b) Performance status at the period-end
The current status of forborne exposures analysed by their payment status, at 30 June 2015 and 31 December 2014 was:
| Term extension £m | Interest-only £m | Other payment rescheduling £m | Total £m | Impairment allowance £m | ||||||||||||||||
30 June 2015(1) | ||||||||||||||||||||
Non-performing | 57 | 22 | 7 | 86 | 42 | |||||||||||||||
Performing | 3 | 45 | 191 | 239 | 2 | |||||||||||||||
|
|
|
|
|
|
|
|
|
| |||||||||||
| 60 | 67 | 198 | 325 | (2) | 44 | |||||||||||||||
|
|
|
|
|
|
|
|
|
| |||||||||||
Proportion of Legacy Portfolios in run-off | 3.2 | % | 3.6 | % | 10.5 | % | 17.3 | % | ||||||||||||
|
|
|
|
|
|
|
|
|
| |||||||||||
31 December 2014(1) | ||||||||||||||||||||
Non-performing | 49 | 29 | 8 | 86 | 47 | |||||||||||||||
Performing | 12 | 45 | 188 | 245 | (2) | 3 | ||||||||||||||
|
|
|
|
|
|
|
|
|
| |||||||||||
| 61 | 74 | 196 | 331 | 50 | ||||||||||||||||
|
|
|
|
|
|
|
|
|
| |||||||||||
Proportion of Legacy Portfolios in run-off | 2.8 | % | 3.4 | % | 9.0 | % | 15.3 | % | ||||||||||||
|
|
|
|
|
|
|
|
|
| |||||||||||
| (1) | Forbearance type categorisation is based on the first forbearance activity undertaken on the accounts. Tables contain only open accounts at the end of the period. |
| (2) | This represents the carrying amount of financial assets that may otherwise be past due or impaired whose terms have been forborne. |
30 June 2015 compared to 31 December 2014
In the first half of 2015, the level of new forbearance undertaken decreased significantly in the Legacy Portfolios in run-off due to the declining size of the portfolio coupled with a reducing incidence of financial difficulty. The cumulative stock of forborne exposure reduced slightly during the period reflecting the strategy to exit these exposures where the opportunity arises.
| 50 | Santander UK plc |
Table of Contents
Risk governance | Top and emerging risks | Credit risk | Market risk | Balance sheet management risk | Other important risks | Areas of focus and other items | ||||||
|
Balance sheet allocation by market risk classification
Santander UK’s assets and liabilities subject to market risk may be analysed between trading and banking market risk classification as follows:
| 30 June 2015 | 31 December 2014 | |||||||||||||||||||||||||
| Market risk classification | Market risk classification | |||||||||||||||||||||||||
| Trading risk £m | Banking risk £m | Total balance sheet £m | Trading risk £m | Banking risk £m | Total balance sheet £m | Key risk factors | ||||||||||||||||||||
Assets subject to market risk | ||||||||||||||||||||||||||
Cash and balances at central banks | — | 15,218 | 15,218 | — | 21,104 | 21,104 | Interest rate, foreign exchange | |||||||||||||||||||
Trading assets | 25,625 | — | 25,625 | 21,700 | — | 21,700 | Equity, foreign exchange, interest rate | |||||||||||||||||||
Derivative financial instruments | 17,791 | 2,798 | 20,589 | 18,760 | 4,261 | 23,021 | Equity, foreign exchange, interest rate | |||||||||||||||||||
Financial assets designated at fair value | 425 | 2,304 | 2,729 | 433 | 2,448 | 2,881 | Interest rate, credit spread | |||||||||||||||||||
Loans and advances to banks | — | 2,500 | 2,500 | — | 2,057 | 2,057 | Foreign exchange, interest rate | |||||||||||||||||||
Loans and advances to customers | — | 194,939 | 194,939 | — | 188,691 | 188,691 | Interest rate | |||||||||||||||||||
Loans and receivables securities | — | 66 | 66 | — | 118 | 118 | Foreign exchange, interest rate | |||||||||||||||||||
Available-for-sale securities | — | 9,096 | 9,096 | — | 8,944 | 8,944 | Foreign exchange, interest rate, inflation, credit spread | |||||||||||||||||||
Macro hedge of interest rate risk | — | 743 | 743 | — | 963 | 963 | Interest rate | |||||||||||||||||||
Retirement benefit assets | — | 349 | 349 | — | 315 | 315 | Equity, foreign exchange, interest rate, inflation, credit spread | |||||||||||||||||||
|
|
|
|
|
|
|
|
|
|
|
| |||||||||||||||
| 43,841 | 228,013 | 271,854 | 40,893 | 228,901 | 269,794 | |||||||||||||||||||||
|
|
|
|
|
|
|
|
|
|
|
| |||||||||||||||
Liabilities subject to market risk | ||||||||||||||||||||||||||
Deposits by banks | — | 7,252 | 7,252 | — | 8,214 | 8,214 | Foreign exchange, interest rate | |||||||||||||||||||
Deposits by customers | — | 158,150 | 158,150 | — | 153,606 | 153,606 | Interest rate | |||||||||||||||||||
Trading liabilities | 15,491 | — | 15,491 | 15,333 | — | 15,333 | Equity, foreign exchange, interest rate | |||||||||||||||||||
Derivative financial instruments | 17,491 | 4,524 | 22,015 | 19,241 | 3,491 | 22,732 | Equity, foreign exchange, interest rate | |||||||||||||||||||
Financial liabilities designated at fair value | — | 2,502 | 2,502 | — | 2,848 | 2,848 | Interest rate, credit spread | |||||||||||||||||||
Debt securities in issue | — | 49,384 | 49,384 | — | 51,790 | 51,790 | Foreign exchange, interest rate | |||||||||||||||||||
Subordinated liabilities | — | 3,601 | 3,601 | — | 4,002 | 4,002 | Foreign exchange, interest rate | |||||||||||||||||||
Macro hedge of interest rate risk | — | 39 | 39 | — | 139 | 139 | Interest rate | |||||||||||||||||||
Retirement benefit obligations | — | 210 | 210 | — | 199 | 199 | Equity, foreign exchange, interest rate, inflation, credit spread | |||||||||||||||||||
|
|
|
|
|
|
|
|
|
|
|
| |||||||||||||||
| 32,982 | 225,662 | 258,644 | 34,574 | 224,289 | 258,863 | |||||||||||||||||||||
|
|
|
|
|
|
|
|
|
|
|
| |||||||||||||||
For assets and liabilities classified, either wholly or partially, as trading risk in the table above, the basis for that risk classification is as follows:
Trading assets and liabilities
Assets and liabilities are classified as held for trading if they have been acquired or incurred principally for the purpose of selling or repurchasing in the near term, or form part of a portfolio of identified financial instruments that are managed together and for which there is evidence of a recent pattern of short-term profit-taking. These assets and liabilities are treated as trading risk.
Financial assets designated at fair value
Financial assets designated at fair value representing a portfolio of roll-up mortgages, as described in Note 16 to the Consolidated Financial Statements in the 2014 Annual Report, are treated as trading risk; the remainder are treated as banking risk.
Derivative financial instruments
Derivatives are held for trading or for risk management purposes. Derivatives are classified as held for trading unless they are designated as being in a hedging relationship. Most derivative exposures arise from sales and trading activities and are treated as trading risk. Derivatives not risk managed on a trading intent basis are treated as banking risk. They include non-qualifying hedging derivatives and derivatives qualifying for fair value and cash flow hedge accounting. Details of fair value and cash flow hedge accounting relationships, and the use of non-qualifying hedges are given in Note 15 to the Consolidated Financial Statements in the 2014 Annual Report.
| 2015 Half Yearly Financial Report | 51 |
Table of Contents
Risk review
Market risk
continued
The following table shows the Internal VaR-based consolidated exposures for the major risk classes at 30 June 2015 and 31 December 2014 together with the highest, lowest and average exposures for each period. Exposures within each risk class reflect a range of exposures associated with movements in that financial market. The VaR amounts represent the potential change in fair values of trading instruments. Since trading instruments are recorded at fair value, these amounts also represent the potential effect on income.
| Period-end exposure | Average exposure | Highest exposure | Lowest exposure | |||||||||||||||||||||||||||||
Trading instruments | 30 June 2015 £m | 31 December 2014 £m | 30 June 2015 £m | 31 December 2014 £m | 30 June 2015 £m | 31 December 2014 £m | 30 June 2015 £m | 31 December 2014 £m | ||||||||||||||||||||||||
Interest rate risks(1) | 1.8 | 2.2 | 2.6 | 3.6 | 4.1 | 5.6 | 1.7 | 1.9 | ||||||||||||||||||||||||
Equity risks(2) | 0.5 | 0.6 | 0.6 | 1.0 | 1.0 | 1.9 | 0.5 | 0.5 | ||||||||||||||||||||||||
Property risks(3) | 0.1 | 0.1 | 0.1 | 0.1 | 0.1 | 0.1 | 0.1 | 0.1 | ||||||||||||||||||||||||
Credit (spread) risks(4) | — | — | — | 0.2 | 0.2 | 0.6 | — | — | ||||||||||||||||||||||||
Other risks(5) | 0.1 | 0.1 | 0.1 | — | 0.1 | 0.1 | — | — | ||||||||||||||||||||||||
|
|
|
|
|
|
|
|
|
|
|
|
|
|
|
| |||||||||||||||||
Correlation offsets(6) | (0.7 | ) | (0.6 | ) | (0.8 | ) | (1.1 | ) | — | — | — | — | ||||||||||||||||||||
|
|
|
|
|
|
|
|
|
|
|
|
|
|
|
| |||||||||||||||||
Total correlated one-day VaR | 1.8 | 2.4 | 2.6 | 3.8 | 4.0 | 6.3 | 1.6 | 1.9 | ||||||||||||||||||||||||
|
|
|
|
|
|
|
|
|
|
|
|
|
|
|
| |||||||||||||||||
| (1) | Interest rate risk measures the impact of interest rate and volatility changes on cash instruments, securities and derivatives. This includes swap spread risk (the difference between swap rates and the government bond rates), basis risk (changes in interest rate tenor basis) and inflation risk (changes in inflation rates). |
| (2) | Equity risk measures the impact on equity stocks and derivatives from changes in equity prices, volatilities and dividends. |
| (3) | Property risk measures the impact of changes in the property indices. |
| (4) | Spread risk measures the impact of changes in the credit spread of corporate bonds or credit derivatives. |
| (5) | Other risks include foreign exchange risk. Foreign exchange risk measures the impact of changes in foreign exchange rates and volatilities. |
| (6) | The highest and lowest exposure figures reported for each risk type did not necessarily occur on the same day as the highest and lowest total correlated one-day VaR. A corresponding correlation offset effect cannot be calculated and is therefore omitted from the above table. |
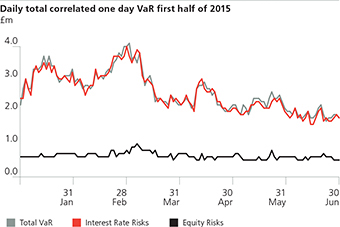
| 52 | Santander UK plc |
Table of Contents
Risk governance | Top and emerging risks | Credit risk | Market risk | management risk | Other important risks | Areas of focus and other items | ||||||
|
Banking market risk mainly arises through the provision of banking products and services to personal and corporate customers, as well as structural exposures arising in Santander UK’s balance sheet. Banking market risk arises in Retail Banking, Commercial Banking and Corporate Centre. Banking market risks are originated in Retail Banking and Commercial Banking only as a by-product of writing customer business and are typically transferred from the originating business to Corporate Centre. Funds received with respect to deposits taken are lent on to Corporate Centre on matching terms as regards interest rate re-pricing and maturity. In a similar manner, loans are funded through matching borrowings. Market risks arising from structured products, including exposure to changes in the levels of equity markets, are hedged with Corporate & Institutional Banking. Material banking market risk exposures are transferred to and reside in Corporate Centre. Only short-term mismatches due to forecasting variances in prepayment and launch risk (i.e. where customers pre-pay loans before their contractual maturity or may not take the expected volume of new products) are retained in Retail Banking and Commercial Banking. In addition, structural exposures arising in the balance sheet are managed by Corporate Centre (e.g. foreign exchange and income statement volatility risk).
Santander UK has always considered Banking market risk to be a significant risk. As a consequence of global and domestic uncertainty following the financial crisis, banking market risk has been considered an emerging and future risk.
In recent years, the Bank of England base rate has been held at historically low levels, and has been considered unlikely to rise. During the first half of 2015, the economic outlook for the UK and the expectation of interest rate rises increased. If the Bank of England base rate does not rise as expected and continues to stay at current low levels, Santander UK’s net interest margins could be negatively impacted. In this context, Banking market risk is now considered as a top risk. We continue to monitor events and forecasted rates closely while taking an enterprise-wide approach to mitigate risks.
Interest rate risk
Yield curve risk
The table below reflects how base case income and valuation across Santander UK would be affected by a 50 basis point parallel shift (both upwards and downwards) applied instantaneously to the yield curve at 30 June 2015 and 31 December 2014.
| 30 June 2015 | 31 December 2014 | |||||||||||||||
| +50bps £m | -50bps £m | +50bps £m | -50bps £m | |||||||||||||
NIM sensitivity | 16 | 12 | 15 | 5 | ||||||||||||
Economic value of equity (‘EVE’) sensitivity | 105 | (157 | ) | 103 | (195 | ) | ||||||||||
Sensitivities were relatively unchanged during the first half of 2015 as the growth in bank account liability volumes was largely offset by additional unhedged fixed rate assets.
Basis risk
Basis risk VaR decreased slightly to £2m at 30 June 2015 (31 December 2014: £3m) largely due to a reduced underlying net basis position as a result of the growth in bank account volumes and a reduction in SVR mortgages which have moved onto new Santander UK incentive products.
Inflation and spread risks
The VaR of the portfolios of securities held for liquidity and investment purposes at 30 June 2015 was £3m (31 December 2014: £5m). The main risk factors remain the inflation and spread risk exposures of these positions. The reduction of VaR in the first half of 2015 was due to a shorter duration of the underlying assets, largely attributable to the ageing of the portfolio, and historically low volatility in the market.
The portfolio of securities held for liquidity and investment purposes is regularly stress tested against a variety of historical and hypothetical scenarios. There are limits established against the potential losses estimated by the stress tests that complement the VaR-based limits discussed above. At 30 June 2015, the worst three month stressed loss for these portfolios was estimated to be £216m (31 December 2014: £218m) using historic deterministic stress tests. The stressed loss in the first half of 2015 has reduced slightly due to shorter duration following the passage of time partially offset by the changes in the composition of the bond portfolio as part of normal liquidity management activities.
| 2015 Half Yearly Financial Report | 53 |
Table of Contents
Risk review
Balance sheet management risk
continued
Compliance with internal and regulatory stress tests
Throughout 2014 and the first half of 2015, Santander UK monitored and reported both the PRA Individual Liquidity Guidance (‘ILG’) and the Basel III regime-based liquidity ratios – the Liquidity Coverage Ratio (‘LCR’)(2) and the Net Stable Funding Ratio (‘NSFR’). It is acknowledged that the calculation requirements for the NSFR continue to evolve. Santander UK monitored and managed the LCR(2) ratio based on the most recent EBA pronouncements and, from October 2014, the final delegated act of the European Commission. The LCR(2) remained in excess of 100% throughout the period.
The Santander UK Liquidity Risk Appetite is reviewed and updated annually. It currently represents the coverage of the most plausible stress by qualifying liquid resources. The current Santander UK interpretation of the NSFR is also tracked and remained in excess of 100% throughout 2014 and the first half of 2015.
| Santander UK LRA (two month Santander UK specific requirement) | EBA LCR(2) (revised text October 2014)(1) | |||||||||||||||
| 30 June 2015 £bn | 31 December 2014 £bn | 30 June 2015 £bn | 31 December 2014 £bn | |||||||||||||
Eligible liquidity pool | 28.3 | 36.6 | 33.6 | 38.9 | ||||||||||||
|
|
|
|
|
|
|
| |||||||||
Asset inflows | 0.9 | 0.5 | 0.7 | 1.0 | ||||||||||||
Stress outflows: | ||||||||||||||||
Retail and commercial deposit outflows | (5.5 | ) | (5.3 | ) | (7.3 | ) | (7.0 | ) | ||||||||
Wholesale funding and derivatives | (7.2 | ) | (12.8 | ) | (15.5 | ) | (19.0 | ) | ||||||||
Contractual credit rating downgrade exposure | (3.9 | ) | (5.3 | ) | (5.7 | ) | (7.3 | ) | ||||||||
Drawdowns of loan commitments | (2.8 | ) | (2.2 | ) | (2.9 | ) | (3.0 | ) | ||||||||
Other | (1.6 | ) | (1.6 | ) | — | — | ||||||||||
|
|
|
|
|
|
|
| |||||||||
Total stress net cash outflows | (20.1 | ) | (26.7 | ) | (30.7 | ) | (35.3 | ) | ||||||||
|
|
|
|
|
|
|
| |||||||||
Surplus | 8.2 | 9.9 | 2.9 | 3.6 | ||||||||||||
|
|
|
|
|
|
|
| |||||||||
Liquidity pool as a percentage of anticipated net cash flows | 141 | % | 137 | % | 109 | % | 110 | % | ||||||||
|
|
|
|
|
|
|
| |||||||||
| (1) | Takes into account Santander UK’s interpretation of the EU Liquidity Coverage Ratio Delegated Act ((EU) 575/2013). |
| (2) | Non-IFRS measure. See page 139. |
| 54 | Santander UK plc |
Table of Contents
Risk governance | Top and emerging risks | Credit risk | Market risk | Balance sheet management risk | Other important risks | Areas of focus and other items | ||||||
|
LIQUIDITY POOL
Santander UK holds, at all times, a portfolio of unencumbered liquid assets to mitigate liquidity risk. The size and composition of this portfolio is determined by Santander UK’s Liquidity Risk Appetite which incorporates regulatory requirements.
Eligible liquidity pool
The table below shows the carrying value and liquidity value of the eligible liquidity pool held at 30 June 2015 and 31 December 2014 and the weighted average carrying value during the period/year:
| Carrying value | Liquidity value(1) | Weighted average carrying value during the period | ||||||||||||||||||||||
30 June 2015 | 31 December 2014 | 30 June 2015 | 31 December 2014 | 30 June 2015 | 31 December 2014 | |||||||||||||||||||
| £bn | £bn | £bn | £bn | £bn | £bn | |||||||||||||||||||
Cash and deposits with central banks | 14.7 | 22.5 | 14.7 | 22.5 | 20.8 | 24.5 | ||||||||||||||||||
Government bonds | 15.3 | 13.1 | 15.1 | 13.1 | 11.7 | 5.6 | ||||||||||||||||||
Supranational bonds and multilateral development banks | 1.1 | 1.0 | 1.1 | 1.0 | 1.1 | 0.9 | ||||||||||||||||||
Covered bonds | 2.0 | 1.8 | 1.8 | 1.6 | 2.2 | 2.0 | ||||||||||||||||||
Asset-backed securities | 0.7 | 0.5 | 0.5 | 0.4 | 0.6 | 0.2 | ||||||||||||||||||
Corporate bonds | 0.1 | — | 0.1 | — | 0.1 | 0.6 | ||||||||||||||||||
Equities | 0.6 | 0.6 | 0.3 | 0.3 | 0.6 | 0.8 | ||||||||||||||||||
|
|
|
|
|
|
|
|
|
|
|
| |||||||||||||
| 34.5 | 39.5 | 33.6 | 38.9 | 37.1 | 34.6 | |||||||||||||||||||
|
|
|
|
|
|
|
|
|
|
|
| |||||||||||||
The eligible liquidity pool consists of assets which, according to Santander UK’s interpretation at 30 June 2015 and 31 December 2014, are eligible for inclusion in the LCR(2) as high quality liquid assets. Key qualifying criteria are listed below:
| • | Government bonds or government-guaranteed bonds but only where the issuer is a central government, central bank, local authority or a regional government of the European Economic Area and other sovereigns subject to minimum credit ratings; |
| • | Supranational bonds and multilateral development banks subject to minimum credit ratings; |
| • | Covered bonds subject to minimum credit ratings or RWAs, asset coverage levels, issue size and additional criteria regarding local regulation; |
| • | Senior tranches of asset-backed securities including RMBSs issued by a European Economic Area country subject to minimum credit ratings, loan-to-value levels, residual weighted average lives and exposure levels; |
| • | Corporate bonds subject to minimum credit ratings, maximum tenor on issuance and issuance size; and |
| • | Equity shares listed on major stock indices and subject to type of issuer and minimum price volatility levels. |
Santander UK periodically tests the liquidity of the eligible liquidity pool it holds, in accordance with the PRA and European Commission’s Delegated Act requirements, to realise a proportion of these assets through repurchase or outright sale to the market. Santander UK ensures that the cumulative effect of its periodic realisation over any 12 month period is that a significant proportion of the assets in its eligible liquidity pool is realised.
In deciding on the precise composition of its eligible liquidity pool, Santander UK tailors the contents of the portfolio to the needs of its business and the liquidity risk that it potentially faces. In particular, Santander UK ensures that it holds assets in its eligible liquidity pool which can be realised with the speed necessary to meet its liabilities as they fall due.
In addition to the eligible liquidity pool, Santander UK has access to other unencumbered assets which provide a source of contingent liquidity. A portion of these assets may be realised in a stress scenario to generate liquidity through either repurchase or outright sale to the market.
| (1) | Liquidity value represents the carrying value with the applicable LCR(2) haircut applied. |
| (2) | Non-IFRS measure. See page 139. |
| 2015 Half Yearly Financial Report | 55 |
Table of Contents
Risk review
Balance sheet management risk
continued
Balance sheet classification
The classification of the carrying value of the assets in the eligible liquidity pool in the Condensed Consolidated Balance Sheet, or their treatment as off-balance sheet at 30 June 2015 and 31 December 2014, was as follows:
| On balance sheet | Off balance sheet | |||||||||||||||||||||||
| Eligible liquidity pool £bn | Cash and balances at central banks £bn | Trading assets £bn | Available-for- sale securities £bn | Loans and receivables securities £bn | Collateral received/ (pledged) £bn | |||||||||||||||||||
30 June 2015 | ||||||||||||||||||||||||
Cash and deposits with central banks | 14.7 | 14.7 | — | — | — | — | ||||||||||||||||||
Government bonds | 15.3 | — | 3.3 | 4.7 | — | 7.3 | ||||||||||||||||||
Supranational bonds and multilateral development banks | 1.1 | — | — | 1.1 | — | — | ||||||||||||||||||
Covered bonds | 2.0 | — | — | 2.2 | — | (0.2 | ) | |||||||||||||||||
Asset-backed securities | 0.7 | — | — | 0.6 | 0.1 | — | ||||||||||||||||||
Corporate bonds | 0.1 | — | — | 0.1 | — | — | ||||||||||||||||||
Equities | 0.6 | — | 5.2 | — | — | (4.6 | ) | |||||||||||||||||
|
|
|
|
|
|
|
|
|
|
|
| |||||||||||||
| 34.5 | 14.7 | 8.5 | 8.7 | 0.1 | 2.5 | |||||||||||||||||||
|
|
|
|
|
|
|
|
|
|
|
| |||||||||||||
31 December 2014 | ||||||||||||||||||||||||
Cash and deposits with central banks | 22.5 | 22.5 | — | — | — | — | ||||||||||||||||||
Government bonds | 13.1 | — | 6.3 | 4.5 | — | 2.3 | ||||||||||||||||||
Supranational bonds and multilateral development banks | 1.0 | — | — | 1.1 | — | (0.1 | ) | |||||||||||||||||
Covered bonds | 1.8 | — | — | 2.2 | — | (0.4 | ) | |||||||||||||||||
Asset-backed securities | 0.5 | — | — | 0.4 | 0.1 | — | ||||||||||||||||||
Corporate bonds | — | — | — | — | — | — | ||||||||||||||||||
Equities | 0.6 | — | 3.5 | — | — | (2.9 | ) | |||||||||||||||||
|
|
|
|
|
|
|
|
|
|
|
| |||||||||||||
| 39.5 | 22.5 | 9.8 | 8.2 | 0.1 | (1.1 | ) | ||||||||||||||||||
|
|
|
|
|
|
|
|
|
|
|
| |||||||||||||
Geographical distribution
The table below shows the geographical distribution of the carrying value of the eligible liquidity pool at 30 June 2015 and 31 December 2014:
| UK | USA | EEA | Other | Total | ||||||||||||||||
| £bn | £bn | £bn | £bn | £bn | ||||||||||||||||
30 June 2015 | ||||||||||||||||||||
Cash and deposits with central banks | 12.5 | 2.2 | — | — | 14.7 | |||||||||||||||
Government bonds(3) | 9.1 | 4.6 | 0.8 | (1) | 0.8 | (2) | 15.3 | |||||||||||||
Supranational bonds and multilateral development banks(4) | 0.1 | 0.5 | 0.5 | — | 1.1 | |||||||||||||||
Covered bonds(4) | 0.4 | — | 1.3 | 0.3 | 2.0 | |||||||||||||||
Asset-backed securities(4) | 0.5 | — | 0.2 | — | 0.7 | |||||||||||||||
Corporate bonds(4) | — | — | 0.1 | — | 0.1 | |||||||||||||||
Equities | 0.5 | — | 0.1 | — | 0.6 | |||||||||||||||
|
|
|
|
|
|
|
|
|
| |||||||||||
| 23.1 | 7.3 | 3.0 | 1.1 | 34.5 | ||||||||||||||||
|
|
|
|
|
|
|
|
|
| |||||||||||
31 December 2014 | ||||||||||||||||||||
Cash and deposits with central banks | 18.1 | 4.4 | — | — | 22.5 | |||||||||||||||
Government bonds(3) | 9.2 | 3.2 | 0.6 | (1) | 0.1 | (2) | 13.1 | |||||||||||||
Supranational bonds and multilateral development banks(4) | — | 0.5 | 0.5 | — | 1.0 | |||||||||||||||
Covered bonds(4) | 0.3 | — | 1.4 | 0.1 | 1.8 | |||||||||||||||
Asset-backed securities(4) | 0.3 | — | 0.2 | — | 0.5 | |||||||||||||||
Corporate bonds(4) | — | — | — | — | — | |||||||||||||||
Equities | 0.4 | — | 0.1 | 0.1 | 0.6 | |||||||||||||||
|
|
|
|
|
|
|
|
|
| |||||||||||
| 28.3 | 8.1 | 2.8 | 0.3 | 39.5 | ||||||||||||||||
|
|
|
|
|
|
|
|
|
| |||||||||||
| (1) | Consists of Germany of £0.7bn (2014: £0.6bn) and France of £0.1bn (2014: £nil). |
| (2) | Consists of Japan of £0.8bn (2014: £nil) and Switzerland of £nil (2014: £0.1bn). |
| (3) | Consists of AAA rated bonds of £14.5bn (2014: £13.1bn) and AA rated bonds of £0.8bn (2014: £nil). |
| (4) | Consists of A- rated bonds. |
| 56 | Santander UK plc |
Table of Contents
Risk governance | Top and emerging risks | Credit risk | Market risk | Balance sheet management risk | Other important risks | Areas of focus and other items | ||||||
|
Currency analysis
The table below shows the carrying value of the eligible liquidity pool by major currencies at 30 June 2015 and 31 December 2014:
| US Dollar | Euro | Sterling | Other | Total | ||||||||||||||||
| £bn | £bn | £bn | £bn | £bn | ||||||||||||||||
30 June 2015 | 9.1 | 1.1 | 23.5 | 0.8 | 34.5 | |||||||||||||||
|
|
|
|
|
|
|
|
|
| |||||||||||
31 December 2014 | 9.6 | 1.4 | 28.3 | 0.2 | 39.5 | |||||||||||||||
|
|
|
|
|
|
|
|
|
| |||||||||||
Composition of the eligible liquidity pool
The allocation of the carrying value of the assets in the eligible liquidity pool for LRA, PRA and LCR(1) purposes at 30 June 2015 and 31 December 2014 was as follows:
Eligible liquidity | Of which LRA | Of which PRA | Of which LCR(1)-eligible | |||||||||||||||||||||
| pool | eligible | eligible | Level 1 | Level 2A | Level 2B | |||||||||||||||||||
| £bn | £bn | £bn | £bn | £bn | £bn | |||||||||||||||||||
30 June 2015 | ||||||||||||||||||||||||
Cash and deposits with central banks | 14.7 | 13.8 | 13.8 | 14.7 | — | — | ||||||||||||||||||
Government bonds | 15.3 | 15.3 | 13.7 | 14.5 | 0.8 | — | ||||||||||||||||||
Supranational bonds and multilateral development banks | 1.1 | 1.1 | 1.1 | 1.1 | — | — | ||||||||||||||||||
Covered bonds | 2.0 | 2.0 | — | 1.4 | 0.6 | — | ||||||||||||||||||
Asset backed securities | 0.7 | 0.7 | — | — | 0.7 | — | ||||||||||||||||||
Corporate bonds | 0.1 | 0.1 | — | — | 0.1 | — | ||||||||||||||||||
Equities | 0.6 | — | — | — | — | 0.6 | ||||||||||||||||||
|
|
|
|
|
|
|
|
|
|
|
| |||||||||||||
| 34.5 | 33.0 | 28.6 | 31.7 | 2.2 | 0.6 | |||||||||||||||||||
|
|
|
|
|
|
|
|
|
|
|
| |||||||||||||
31 December 2014 | ||||||||||||||||||||||||
Cash and deposits with central banks | 22.5 | 20.8 | 20.8 | 22.5 | — | — | ||||||||||||||||||
Government bonds | 13.1 | 13.1 | 12.6 | 13.1 | — | — | ||||||||||||||||||
Supranational bonds and multilateral development banks | 1.0 | 1.0 | 1.0 | 1.0 | — | — | ||||||||||||||||||
Covered bonds | 1.8 | 1.8 | — | 1.4 | 0.4 | — | ||||||||||||||||||
Asset backed securities | 0.5 | 0.5 | — | — | — | 0.5 | ||||||||||||||||||
Corporate bonds | — | — | — | — | — | — | ||||||||||||||||||
Equities | 0.6 | — | — | — | — | 0.6 | ||||||||||||||||||
|
|
|
|
|
|
|
|
|
|
|
| |||||||||||||
| 39.5 | 37.2 | 34.4 | 38.0 | 0.4 | 1.1 | |||||||||||||||||||
|
|
|
|
|
|
|
|
|
|
|
| |||||||||||||
Liquidity developments in the first half of 2015
The first half of 2015 was characterised by an easing of monetary policy following the European Central Bank (‘ECB’) announcement in January of a programme of sovereign bond purchases which is planned to continue until September 2016 or until a sustained adjustment to inflation is achieved. In addition, general concerns about global economic growth and the risk of deflation have led other central banks to ease their monetary policy. This resulted in lower short-term interest rates and, with some volatility, longer-term rates.
Investor sentiment remained positive through the period with a continuation of the trend seen in 2014 of a search for enhanced yield and increased appetite for riskier assets. This positive trend was not significantly impacted by the uncertainty surrounding Greece and the eurozone. Other geopolitical tensions did not have a discernible impact.
During the first half of 2015, Santander UK benefited from low wholesale, unsecured and secured MTF rates and continued confidence in the UK banking sector. This allowed a beneficial mix of MTF to be issued in line with funding plans. There was a notable level of issuance of secured debt and equity by banks in the first half of 2015, and investor appetite for issuances by Santander UK was strong throughout the period.
Throughout the first half of 2015, Santander UK continued to maintain a strong liquidity position and a conservative balance sheet structure as well as robust risk management controls to monitor and manage the levels of the eligible liquidity pool and encumbrance. The eligible liquidity pool significantly exceeded wholesale funding of less than one year, with a coverage ratio of 184% at 30 June 2015 (2014: 171%). The change in the coverage ratio (which is expected to be volatile due to the management of normal short-term business commitments) was driven by a decrease in eligible liquidity pool assets by £5.0bn to £34.5bn at 30 June 2015 (2014: £39.5bn) as a result of a managed reduction in short-term deposits, offset by a decrease in wholesale funding with a residual maturity of less than one year of £4.4bn to £18.7bn at 30 June 2015 (2014: £23.1bn), which reflected changes in the maturity profile of our medium-term funding. The LCR(1) remained stable at 109% at 30 June 2015 (2014: 110%).
| (1) | Non-IFRS measure. See page 139. |
| 2015 Half Yearly Financial Report | 57 |
Table of Contents
Risk review
Balance sheet management risk
continued
FUNDING STRATEGY AND STRUCTURE
Deposit funding
The table below shows customer loans, customer deposits and the loan-to-deposit ratio for Santander UK, as well as for the business divisions, at 30 June 2015 and 31 December 2014. Retail Banking and Commercial Banking activities are largely funded by customer deposits with the remaining funded with long-term debt and equity (including funding secured against customer loans and advances). The data for the business divisions excludes accrued interest. The data for Santander UK includes accrued interest but excludes repurchase agreements and reverse repurchase agreements.
| Customer loans £bn | Customer deposits £bn | Loan-to- deposit ratio % | ||||||||||
30 June 2015 | ||||||||||||
Retail Banking | 162.6 | 134.1 | 121 | |||||||||
Commercial Banking | 20.0 | 16.6 | 120 | |||||||||
Corporate & Institutional Banking | 5.7 | 2.2 | 259 | |||||||||
Corporate Centre | 7.9 | 4.2 | 188 | |||||||||
|
|
|
|
|
| |||||||
Total customer loans and deposits | 196.2 | 157.1 | ||||||||||
Adjust for: fair value loans, loan loss reserves, accrued interest and other | (1.3 | ) | 1.1 | |||||||||
|
|
|
|
|
| |||||||
Statutory loans and advances to customers/deposits by customers(1) | 194.9 | 158.2 | ||||||||||
Less: repurchase agreements and reverse repurchase agreements | (0.2 | ) | (0.6 | ) | ||||||||
|
|
|
|
|
| |||||||
Total(2) | 194.7 | 157.6 | 124 | |||||||||
|
|
|
|
|
| |||||||
31 December 2014 | ||||||||||||
Retail Banking | 158.5 | 129.6 | 122 | |||||||||
Commercial Banking | 18.7 | 15.3 | 122 | |||||||||
Corporate & Institutional Banking | 5.2 | 2.3 | 226 | |||||||||
Corporate Centre | 8.3 | 5.2 | 160 | |||||||||
|
|
|
|
|
| |||||||
Total customer loans and deposits | 190.7 | 152.4 | ||||||||||
Adjust for: fair value loans, loan loss reserves, accrued interest and other | (2.0 | ) | 1.2 | |||||||||
|
|
|
|
|
| |||||||
Statutory loans and advances to customers/deposits by customers(1) | 188.7 | 153.6 | ||||||||||
Less: repurchase agreements and reverse repurchase agreements | (0.2 | ) | (0.5 | ) | ||||||||
|
|
|
|
|
| |||||||
Total(2) | 188.5 | 153.1 | 124 | |||||||||
|
|
|
|
|
| |||||||
| (1) | Customer loans and deposits as disclosed in the Condensed Consolidated Balance Sheet. |
| (2) | Total loan-to-deposit ratio calculated as loans and advances to customers (excluding reverse repurchase agreements) divided by deposits by customers (excluding repurchase agreements). |
| 58 | Santander UK plc |
Table of Contents
Risk governance | Top and emerging risks | Credit risk | Market risk | Balance sheet management risk | Other important risks | Areas of focus and other items | ||||||
|
Wholesale funding
Composition of wholesale funding
Santander UK continues to have access to a variety of sources of wholesale funding in a range of currencies, including those available from money markets, repo markets, medium term and subordinated debt investors, across a variety of distribution channels. Santander UK is an active participant in the wholesale markets and has direct access to both money market and long-term investors through its range of funding programmes. As a result, wholesale funding is well diversified by product, maturity, geography and currency.
Maturity profile of wholesale funding
The table below shows Santander UK’s primary wholesale funding sources, excluding securities financing repurchase and reverse repurchase agreements. The tables are prepared taking into account foreign exchange rates at issue and scheduled repayments, and do not reflect the final contractual maturity of the funding.
| Not more than 1 month £bn | Over 1 but not more than 3 months £bn | Over 3 but not more than 6 months £bn | Over 6 but not more than 9 months £bn | Over 9 but not more than 12 months £bn | Sub-total less than 1 year £bn | Over 1 but not more than 2 years £bn | Over 2 but not more than 5 years £bn | Over 5 years £bn | Total £bn | |||||||||||||||||||||||||||||||
30 June 2015 | ||||||||||||||||||||||||||||||||||||||||
Deposits by banks (non-customer deposits) | 0.1 | 0.6 | 0.6 | — | — | 1.3 | — | — | — | 1.3 | ||||||||||||||||||||||||||||||
CDs and Commercial Paper | 1.5 | 3.5 | 1.2 | 1.3 | 0.6 | 8.1 | — | — | — | 8.1 | ||||||||||||||||||||||||||||||
Senior unsecured | ||||||||||||||||||||||||||||||||||||||||
- public benchmark | — | — | 0.9 | — | 0.6 | 1.5 | 0.9 | 6.0 | 3.7 | 12.1 | ||||||||||||||||||||||||||||||
- privately placed | — | 0.3 | 0.1 | 0.5 | 0.1 | 1.0 | 2.4 | 1.6 | 0.7 | 5.7 | ||||||||||||||||||||||||||||||
Covered bonds | — | — | — | — | — | — | 4.2 | 4.0 | 8.0 | 16.2 | ||||||||||||||||||||||||||||||
Securitisation and Structured Issuance | 1.0 | 0.1 | 1.5 | 2.6 | 0.9 | 6.1 | 5.5 | 4.6 | 0.7 | 16.9 | ||||||||||||||||||||||||||||||
Subordinated liabilities and equity (including AT1 issuance) | — | 0.7 | — | — | — | 0.7 | 0.1 | 1.0 | 3.2 | 5.0 | ||||||||||||||||||||||||||||||
|
|
|
|
|
|
|
|
|
|
|
|
|
|
|
|
|
|
|
| |||||||||||||||||||||
Total at 30 June 2015 | 2.6 | 5.2 | 4.3 | 4.4 | 2.2 | 18.7 | 13.1 | 17.2 | 16.3 | 65.3 | ||||||||||||||||||||||||||||||
|
|
|
|
|
|
|
|
|
|
|
|
|
|
|
|
|
|
|
| |||||||||||||||||||||
Of which: | ||||||||||||||||||||||||||||||||||||||||
- secured | 1.0 | 0.1 | 1.5 | 2.6 | 0.9 | 6.1 | 9.7 | 8.6 | 8.7 | 33.1 | ||||||||||||||||||||||||||||||
- unsecured | 1.6 | 5.1 | 2.8 | 1.8 | 1.3 | 12.6 | 3.4 | 8.6 | 7.6 | 32.2 | ||||||||||||||||||||||||||||||
|
|
|
|
|
|
|
|
|
|
|
|
|
|
|
|
|
|
|
| |||||||||||||||||||||
31 December 2014 | ||||||||||||||||||||||||||||||||||||||||
Deposits by banks (non-customer deposits) | 0.9 | 0.9 | 0.1 | — | — | 1.9 | — | — | — | 1.9 | ||||||||||||||||||||||||||||||
CDs and Commercial Paper | 2.0 | 4.4 | 1.2 | 0.4 | 0.1 | 8.1 | 0.2 | — | — | 8.3 | ||||||||||||||||||||||||||||||
Senior unsecured | — | — | 0.2 | — | 0.9 | 1.1 | 0.6 | 4.7 | 2.5 | 8.9 | ||||||||||||||||||||||||||||||
- public benchmark | ||||||||||||||||||||||||||||||||||||||||
- privately placed | — | 0.1 | 0.1 | 0.3 | 0.1 | 0.6 | 2.0 | 1.7 | 0.7 | 5.0 | ||||||||||||||||||||||||||||||
Covered bonds | — | 0.7 | 2.1 | — | — | 2.8 | 2.5 | 5.2 | 7.2 | 17.7 | ||||||||||||||||||||||||||||||
Securitisation and Structured Issuance | 2.5 | 0.1 | 2.9 | 1.1 | 1.1 | 7.7 | 6.6 | 4.6 | 0.7 | 19.6 | ||||||||||||||||||||||||||||||
Subordinated liabilities and equity (including AT1 issuance) | 0.1 | — | — | 0.8 | — | 0.9 | — | 1.3 | 2.6 | 4.8 | ||||||||||||||||||||||||||||||
|
|
|
|
|
|
|
|
|
|
|
|
|
|
|
|
|
|
|
| |||||||||||||||||||||
Total at 31 December 2014 | 5.5 | 6.2 | 6.6 | 2.6 | 2.2 | 23.1 | 11.9 | 17.5 | 13.7 | 66.2 | ||||||||||||||||||||||||||||||
|
|
|
|
|
|
|
|
|
|
|
|
|
|
|
|
|
|
|
| |||||||||||||||||||||
Of which: | ||||||||||||||||||||||||||||||||||||||||
- secured | 2.5 | 0.8 | 5.0 | 1.1 | 1.1 | 10.5 | 9.1 | 9.8 | 7.9 | 37.3 | ||||||||||||||||||||||||||||||
- unsecured | 3.0 | 5.4 | 1.6 | 1.5 | 1.1 | 12.6 | 2.8 | 7.7 | 5.8 | 28.9 | ||||||||||||||||||||||||||||||
|
|
|
|
|
|
|
|
|
|
|
|
|
|
|
|
|
|
|
| |||||||||||||||||||||
| 2015 Half Yearly Financial Report | 59 |
Table of Contents
Risk review
Balance sheet management risk
continued
Currency composition of wholesale funds
Where term funding is raised in foreign currencies, cross currency matched swaps are used to convert the foreign currency into sterling. Where short-term deposits are raised in US dollars or euros, these are used to purchase eligible liquidity pool assets, place funds at the Federal Reserve or swapped into sterling. At 30 June 2015 and 31 December 2014, the proportion of wholesale funding by major currencies was as follows:
| Sterling | US Dollar | Euro | Other currencies | |||||||||||||
| % | % | % | % | |||||||||||||
30 June 2015 | ||||||||||||||||
Deposits by banks (non-customer deposits) | 12 | 72 | 11 | 5 | ||||||||||||
CDs and Commercial Paper | 27 | 58 | 15 | — | ||||||||||||
Senior unsecured - public benchmark | 14 | 37 | 49 | — | ||||||||||||
- privately placed | 14 | 10 | 73 | 3 | ||||||||||||
Covered bonds | 34 | — | 65 | 1 | ||||||||||||
Securitisation and Structured Issuance | 46 | 29 | 24 | 1 | ||||||||||||
Subordinated liabilities and equity (including AT1 issuance) | 76 | 23 | — | 1 | ||||||||||||
|
|
|
|
|
|
|
| |||||||||
| 33 | 26 | 40 | 1 | |||||||||||||
|
|
|
|
|
|
|
| |||||||||
31 December 2014 | ||||||||||||||||
Deposits by banks (non-customer deposits) | 7 | 77 | 16 | — | ||||||||||||
CDs and Commercial Paper | 19 | 64 | 17 | — | ||||||||||||
Senior unsecured - public benchmark | 10 | 43 | 45 | 2 | ||||||||||||
- privately placed | 18 | 13 | 66 | 3 | ||||||||||||
Covered bonds | 32 | — | 67 | 1 | ||||||||||||
Securitisation and Structured Issuance | 40 | 30 | 29 | 1 | ||||||||||||
Subordinated liabilities and equity (including AT1 issuance) | 71 | 26 | — | 3 | ||||||||||||
|
|
|
|
|
|
|
| |||||||||
| 31 | 27 | 41 | 1 | |||||||||||||
|
|
|
|
|
|
|
| |||||||||
Reconciliation of wholesale funding to the balance sheet
The table below presents a reconciliation of wholesale funding to the balance sheet at 30 June 2015 and 31 December 2014.
| Balance sheet line item | ||||||||||||||||||||||||||||||||
|
| |||||||||||||||||||||||||||||||
Funding analysis | Deposits by banks | Deposits by customers(2) | Debt securities in issue | Financial liabilities at fair value | Trading liabilities | Subordinated liabilities | Share capital instruments(4) | |||||||||||||||||||||||||
| £bn | £bn | £bn | £bn | £bn | £bn | £bn | £bn | |||||||||||||||||||||||||
30 June 2015 | ||||||||||||||||||||||||||||||||
Deposits by banks (non-customer deposits) | 1.3 | — | — | — | — | 1.3 | — | — | ||||||||||||||||||||||||
CDs and Commercial Paper | 8.1 | — | — | 8.0 | 0.1 | — | — | — | ||||||||||||||||||||||||
Senior unsecured - public benchmark | 12.1 | — | — | 12.1 | — | — | — | — | ||||||||||||||||||||||||
- privately placed | 5.7 | — | — | 3.3 | 2.4 | — | — | — | ||||||||||||||||||||||||
Covered bonds | 16.2 | — | — | 16.2 | — | — | — | — | ||||||||||||||||||||||||
Securitisation and Structured Issuance | 16.9 | 4.3 | 0.5 | 11.6 | — | 0.5 | — | — | ||||||||||||||||||||||||
Subordinated liabilities and equity | 5.0 | — | — | — | — | — | 3.2 | 1.8 | ||||||||||||||||||||||||
|
|
|
|
|
|
|
|
|
|
|
|
|
|
|
| |||||||||||||||||
Total wholesale funding | 65.3 | 4.3 | 0.5 | 51.2 | 2.5 | 1.8 | 3.2 | 1.8 | ||||||||||||||||||||||||
Repos | 8.3 | — | — | — | — | 8.3 | — | — | ||||||||||||||||||||||||
Foreign exchange and hedge accounting | (1.7 | ) | — | — | (1.8 | ) | — | — | 0.1 | — | ||||||||||||||||||||||
Other | 8.7 | 3.0 | (1) | — | — | — | 5.4 | (3) | 0.3 | — | ||||||||||||||||||||||
|
|
|
|
|
|
|
|
|
|
|
|
|
|
|
| |||||||||||||||||
Balance sheet total | 80.6 | 7.3 | 0.5 | 49.4 | 2.5 | 15.5 | 3.6 | 1.8 | ||||||||||||||||||||||||
|
|
|
|
|
|
|
|
|
|
|
|
|
|
|
| |||||||||||||||||
31 December 2014 | ||||||||||||||||||||||||||||||||
Deposits by banks (non-customer deposits) | 1.9 | — | — | — | — | 1.9 | — | — | ||||||||||||||||||||||||
CDs and Commercial Paper | 8.3 | — | — | 8.0 | 0.3 | — | — | — | ||||||||||||||||||||||||
Senior unsecured - public benchmark | 8.9 | — | — | 8.9 | — | — | — | — | ||||||||||||||||||||||||
- privately placed | 5.0 | — | — | 2.5 | 2.5 | — | — | — | ||||||||||||||||||||||||
Covered bonds | 17.7 | — | — | 17.7 | — | — | — | — | ||||||||||||||||||||||||
Securitisation and Structured Issuance | 19.6 | 4.8 | 0.5 | 14.1 | — | 0.2 | — | — | ||||||||||||||||||||||||
Subordinated liabilities and equity | 4.8 | — | — | — | — | — | 3.7 | 1.1 | ||||||||||||||||||||||||
|
|
|
|
|
|
|
|
|
|
|
|
|
|
|
| |||||||||||||||||
Total wholesale funding | 66.2 | 4.8 | 0.5 | 51.2 | 2.8 | 2.1 | 3.7 | 1.1 | ||||||||||||||||||||||||
Repos | 8.4 | — | — | — | — | 8.4 | — | — | ||||||||||||||||||||||||
Foreign exchange and hedge accounting | 0.7 | — | — | 0.6 | — | — | 0.1 | — | ||||||||||||||||||||||||
Other | 8.4 | 3.4 | (1) | — | — | — | 4.8 | (3) | 0.2 | — | ||||||||||||||||||||||
|
|
|
|
|
|
|
|
|
|
|
|
|
|
|
| |||||||||||||||||
Balance sheet total | 83.7 | 8.2 | 0.5 | 51.8 | 2.8 | 15.3 | 4.0 | 1.1 | ||||||||||||||||||||||||
|
|
|
|
|
|
|
|
|
|
|
|
|
|
|
| |||||||||||||||||
| (1) | Principally consists of items in the course of transmission and other deposits. See Note 19 to the Condensed Consolidated Interim Financial Statements. |
| (2) | Included in the balance sheet total of £158,150m (2014: £153,606m). |
| (3) | Consists of short positions in securities and unsettled trades, cash collateral and short-term deposits. See Note 20 to the Condensed Consolidated Interim Financial Statements. |
| (4) | Consists of £14m (2014: £35m) fixed/floating rate non-cumulative callable preference shares, £235m (2014: £297m) Step-up Callable Perpetual Reserve Capital Instruments, £7m (2014: £7m) of Step-up Callable Perpetual Preferred Securities and £1,550m (2014: £800m) Perpetual Capital Securities. See Note 27 to the Condensed Consolidated Interim Financial Statements. |
| 60 | Santander UK plc |
Table of Contents
Risk governance | Top and emerging risks | Credit risk | Market risk | Balance sheet management risk | Other important risks | Areas of focus and other items | ||||||
|
Funding developments in the first half of 2015
Our overall funding strategy remains to develop and maintain a diversified funding base, which allows us access to a variety of funding sources. As part of this strategy, Santander UK raises funding in a number of currencies, including sterling, US dollars and euro, and converts foreign currency funding back into sterling via currency swaps to fund its commercial assets which are largely sterling denominated.
As in 2014, the focus of new issuance in the first half of 2015 was in the unsecured markets. In total, we issued four public unsecured securities. In addition to the unsecured issuance, we issued residential mortgage-backed securities and two covered bonds, forms of financing that permit us to benefit from our prime UK mortgage assets. The first four months of 2015 provided, on the whole, stable market conditions. While the latter part of the half year was dominated by market instability caused by recent focus on Greece’s membership of the eurozone, the wholesale funding markets that we operate in continued to offer economically viable sources of funding with a balanced mix of wholesale unsecured and secured new issuance. The cost of wholesale funding continued to fall due to the replacement of expensive MTF maturities with lower cost new issuance in the now lower spread environment.
In the first half of 2015, our MTF issuance was £8.0bn (year ended 31 December 2014: £12.9bn). In June 2015, the Company issued £750m of Perpetual Capital Securities to its immediate parent, Santander UK Group Holdings plc. Maturities in the first half of 2015 were £9.1bn (year ended 31 December 2014: £14.4bn). At 30 June 2015, 71% (2014: 65%) of wholesale funding had a maturity of greater than one year, with an overall residual duration of 43 months (2014: 40 months).
During the first half of 2015, our continuing strategy of building closer customer relationships through the 1I2I3 World retail offering created additional current account liabilities that further strengthened this stable funding source.
With no additional drawings made in the first half of 2015, total drawdowns of Treasury Bills under the Funding for Lending Scheme remained £2.2bn at 30 June 2015 (2014: £2.2bn).
Term issuance
In the first half of 2015, the majority of term issuance was unsecured, consistent with the issuance strategy in 2014. During the period, term issuance (sterling equivalent) comprised:
| Six months ended 30 June 2015 | Year ended 31 December 2014 | |||||||||||||||||||
| Sterling | US Dollar | Euro | Total | Total | ||||||||||||||||
| £bn | £bn | £bn | £bn | £bn | ||||||||||||||||
Securitisations | 0.9 | 0.8 | — | 1.7 | 1.8 | |||||||||||||||
Covered bonds - privately placed | — | — | — | — | — | |||||||||||||||
- publicly placed | 0.5 | — | 0.7 | 1.2 | 2.2 | |||||||||||||||
Structured notes | — | — | — | — | 0.4 | |||||||||||||||
Senior unsecured - privately placed | — | — | 0.9 | 0.9 | 3.0 | |||||||||||||||
- public benchmark | 0.8 | 0.7 | 1.9 | 3.4 | 4.7 | |||||||||||||||
Subordinated debt and equity (including AT1 issuance) | 0.8 | — | — | 0.8 | 0.8 | |||||||||||||||
|
|
|
|
|
|
|
|
|
| |||||||||||
Total gross issuances | 3.0 | 1.5 | 3.5 | 8.0 | 12.9 | |||||||||||||||
|
|
|
|
|
|
|
|
|
| |||||||||||
| 2015 Half Yearly Financial Report | 61 |
Table of Contents
Risk review
Balance sheet management risk
continued
Encumbrance
The ability to pledge assets is an integral part of a financial institution’s operations, and includes asset securitisation or related structured funding, the pledging of collateral to support the use of payment/settlement systems, and entering into derivatives, securities repurchase agreements and securities borrowing arrangements. An asset is encumbered if it has been pledged as collateral against an existing liability, and as a result is no longer available to secure funding, satisfy collateral needs or be sold to reduce potential future funding requirements.
On-balance sheet encumbered and unencumbered assets
| 30 June 2015 | 31 December 2014 | |||||||||||||||||||||||||||||||
| Unencumbered assets | Unencumbered assets | |||||||||||||||||||||||||||||||
| Encumbered assets £m | Readily realisable £m | Other £m | Total assets £m | Encumbered assets £m | Readily realisable £m | Other £m | Total assets £m | |||||||||||||||||||||||||
Cash and balances at central banks(1)(2) | 331 | 14,887 | — | 15,218 | 318 | 22,244 | — | 22,562 | ||||||||||||||||||||||||
Trading assets | 14,747 | 2,313 | 8,565 | 25,625 | 15,086 | 802 | 5,812 | 21,700 | ||||||||||||||||||||||||
Derivative financial instruments | — | — | 20,589 | 20,589 | — | — | 23,021 | 23,021 | ||||||||||||||||||||||||
Financial assets designated at fair value | — | 1,992 | 737 | 2,729 | 8 | 2,100 | 773 | 2,881 | ||||||||||||||||||||||||
Loans and advances to banks | 93 | 298 | 2,109 | 2,500 | 122 | — | 1,935 | 2,057 | ||||||||||||||||||||||||
Loans and advances to customers | 54,846 | 115,771 | 24,322 | 194,939 | 56,851 | 106,683 | 25,157 | 188,691 | ||||||||||||||||||||||||
Loans and receivables securities | — | 66 | — | 66 | — | 118 | — | 118 | ||||||||||||||||||||||||
Available-for-sale securities | 1,979 | 7,117 | — | 9,096 | 1,527 | 7,417 | — | 8,944 | ||||||||||||||||||||||||
Macro hedge of interest rate risk | — | — | 743 | 743 | — | — | 963 | 963 | ||||||||||||||||||||||||
Interests in other entities | — | — | 40 | 40 | — | — | 38 | 38 | ||||||||||||||||||||||||
Intangible assets | — | — | 2,210 | 2,210 | — | — | 2,187 | 2,187 | ||||||||||||||||||||||||
Property, plant and equipment | — | — | 1,571 | 1,571 | — | — | 1,624 | 1,624 | ||||||||||||||||||||||||
Current tax assets | — | — | 34 | 34 | — | — | — | — | ||||||||||||||||||||||||
Deferred tax | — | — | — | — | — | — | — | — | ||||||||||||||||||||||||
Retirement benefit assets | — | — | 349 | 349 | — | — | 315 | 315 | ||||||||||||||||||||||||
Other assets | — | — | 1,517 | 1,517 | — | — | 876 | 876 | ||||||||||||||||||||||||
|
|
|
|
|
|
|
|
|
|
|
|
|
|
|
| |||||||||||||||||
| 71,996 | 142,444 | 62,786 | 277,226 | 73,912 | 139,364 | 62,701 | 275,977 | |||||||||||||||||||||||||
|
|
|
|
|
|
|
|
|
|
|
|
|
|
|
| |||||||||||||||||
| (1) | Encumbered cash and balances at central banks represent minimum cash balances required to be maintained with central banks for regulatory purposes. |
| (2) | Readily realisable cash and balances at central banks represent amounts held at central banks as part of the Santander UK group’s liquidity management activities. |
Encumbrance of customer loans and advances
Santander UK has provided prime retail mortgage-backed and other asset-backed securitised products to a diverse investor base through its mortgage-backed and other asset-backed funding programmes, as described in Note 19 to the Consolidated Financial Statements in the 2014 Annual Report. Funding has historically been raised via mortgage-backed notes, both issued to third parties and retained (the latter being central bank eligible collateral for funding purposes in other Bank of England, Swiss National Bank, and US Federal Reserve facilities) and other asset-backed notes. Santander UK also has an established covered bond programme, whereby securities are issued to investors and are guaranteed by a pool of ring-fenced residential mortgages.
At 30 June 2015, total notes issued externally from secured programmes (securitisations and covered bonds) decreased to £26,832m (2014: £32,373m), including gross issuance of £2,883m (2014: £4,023m) and redemptions of £7,942m (2014: £8,440m). At 30 June 2015, a total of £12,347m (2014: £14,373m) of notes issued under securitisation and covered bond programmes had also been retained internally, a proportion of which had been used as collateral for raising funds via third party bilateral secured funding transactions, which totalled £5,987m at 30 June 2015 (2014: £6,444m), or for creating collateral which could in the future be used for liquidity purposes.
30 June 2015 compared with 31 December 2014
The level of encumbrance arising from external issuance of securitisations and covered bonds decreased in the first half of 2015 as planned, reflecting the desire to shift new wholesale funding issuance away from the secured markets where possible. It is expected that the overall level of encumbrance will remain stable in the rest of 2015.
| 62 | Santander UK plc |
Table of Contents
Risk governance | Top and emerging risks | Credit risk | Market risk | Balance sheet management risk | Other important risks | Areas of focus and other items | ||||||
|
This page intentionally left blank
| 2015 Half Yearly Financial Report | 63 |
Table of Contents
Risk review
Balance sheet management risk
continued
Santander UK adopts a centralised capital management approach, based on regulatory requirements and the economic capital impacts of our businesses. This approach operates within the Board-approved Risk Appetite, and takes into account the commercial environment in which Santander UK operates, management’s strategy for each material risk and the potential impact of adverse scenarios and stresses. Details of Santander UK’s objectives, policies and processes for managing capital can be found in Note 46 to the Consolidated Financial Statements in the 2014 Annual Report.
While Santander UK is part of the wider Banco Santander group, Santander UK plc is incorporated in the UK, regulated by the PRA and does not benefit from parental guarantees and operates as an autonomous subsidiary. As such, responsibility for the management, control and assurance of capital risk lies with the Board and, when applicable, certain subsidiary boards. The Board delegates day-to-day responsibility for capital risk to the CEO.
The Capital Risk Framework, reviewed by the Board annually, describes the high level arrangements for identifying, assessing, managing and reporting capital risk.
Scope of Santander UK’s capital adequacy
Santander UK is a UK banking group effectively subject to two tiers of supervision. Santander UK is subject to prudential supervision by both the PRA (as a UK authorised banking group) and the ECB (as a member of the Banco Santander group). The ECB commenced supervision of the Banco Santander group in November 2014 as part of the Single Supervisory Mechanism.
As a PRA regulated group, Santander UK is expected to satisfy the PRA capital requirements on a standalone basis. Similarly, Santander UK must demonstrate to the PRA that it can withstand capital stress tests without parental support. Reinforcing the corporate governance framework adopted by Santander UK, the PRA exercises oversight through its rules and regulations on the Board and senior management appointments.
Santander UK has applied Banco Santander, S.A.’s approach to capital measurement and risk management in its implementation of CRD IV. As a result, Santander UK plc has been classified as a significant subsidiary of Banco Santander, S.A. at 30 June 2015. Further information on the CRD IV risk measurement of Santander UK’s exposures is included in Banco Santander, S.A.’s Pillar 3 report.
Santander UK Group Holdings plc became the holding company of Santander UK plc with effect from 10 January 2014. From this date, Santander UK Group Holdings plc became the head of the Santander UK group for regulatory capital and leverage purposes. The basis of consolidation used for capital-related disclosures in this document reflects the Santander UK group, which corresponds to the basis of consolidation of the financial statements.
Capital transferability between subsidiaries is managed in accordance with Santander UK’s corporate purpose and strategy, its risk and capital management policies and with regard to UK legal and regulatory requirements. There are no other current or foreseen material practical or legal impediments to the prompt transfer of capital resources or repayment of liabilities when due between the Company and its subsidiaries.
| 64 | Santander UK plc |
Table of Contents
Risk governance | Top and emerging risks | Credit risk | Market risk | Balance sheet management risk | Other important risks | Areas of focus and other items | ||||||
|
CAPITAL RISK MANAGEMENT
Santander UK manages its capital based on regulatory requirements and the economic capital impacts of our businesses. Regulatory capital demand is quantified for credit, trading market, banking market, operational, pension obligation and securitisation risk in accordance with PRA requirements. Santander UK produces and shares with the PRA its ICAAP document, which can result in the PRA advising the firm of an amount and quality of capital (Pillar 2A) it considers the firm should hold in addition to Pillar 1 to meet the overall financial adequacy rule. At 30 June 2015 and 31 December 2014, the PRA’s Pillar 2A guidance to Santander UK was 3.6% of RWAs, of which 2.0% (56% of Pillar 2A) should be met by CET 1 capital.
Capital regulation developments in the first half of 2015
The Basel Committee on Banking Supervision produced a proposal for the treatment of interest rate risk in the banking book in June 2015. This proposal, with other proposed revisions to the capital treatment of trading book market risk, operational risk, credit risk standardised approaches and capital floors, has the potential to significantly impact the measurement of RWAs over the medium term and could adversely impact Santander UK’s capital ratios. Other adverse impacts to Santander UK’s capital position are possible from EBA Regulatory Technical Standards, which continue to be produced to extend the CRD IV rules, and from changes to the UK Pillar 2 regime currently proposed by the PRA.
CAPITAL MANAGEMENT AND RESOURCES
Key capital ratios
The calculations of capital are prepared on a basis consistent with Santander UK’s regulatory filings at 30 June 2015 and 31 December 2014. Ratios are calculated by taking the relevant capital resources as a percentage of RWAs.
| 30 June 2015 % | 31 December 2014 % | |||||||
CET 1 capital ratio | 11.7 | 11.9 | ||||||
Total capital ratio | 17.7 | 17.9 | ||||||
| 2015 Half Yearly Financial Report | 65 |
Table of Contents
Risk review
Balance sheet management risk
continued
Regulatory capital resources
The table below analyses the composition of regulatory capital resources. The calculations are prepared on a basis consistent with Santander UK’s regulatory filings at 30 June 2015 and 31 December 2014.
| 30 June 2015 £m | 31 December 2014 £m | |||||||
Common Equity Tier 1 (‘CET 1’) capital instruments and reserves: | ||||||||
- Capital instruments and related share premium accounts | 8,725 | 8,725 | ||||||
- Retained earnings | 4,395 | 4,056 | ||||||
- Accumulated other comprehensive income, other reserves and non-controlling interest | 270 | 273 | ||||||
|
|
|
| |||||
CET 1 capital before regulatory adjustments | 13,390 | 13,054 | ||||||
|
|
|
| |||||
CET 1 regulatory adjustments: | ||||||||
- Additional value adjustments | (96 | ) | (101 | ) | ||||
- Intangible assets (net of tax) | (2,187 | ) | (2,174 | ) | ||||
- Fair value reserves related to gains or losses on cash flow hedges | (131 | ) | (262 | ) | ||||
- Negative amounts resulting from the calculation of regulatory expected loss amounts | (535 | ) | (484 | ) | ||||
- Gains or losses on liabilities valued at fair value resulting from changes in own credit standing | (41 | ) | (17 | ) | ||||
- Deferred tax assets that rely on future profitability excluding timing differences | (10 | ) | (11 | ) | ||||
- Defined benefit pension fund assets | (273 | ) | (249 | ) | ||||
- Dividend accrual | (26 | ) | — | |||||
- Deduction for minority interests | (123 | ) | — | |||||
|
|
|
| |||||
Total regulatory adjustments to CET 1 | (3,422 | ) | (3,298 | ) | ||||
|
|
|
| |||||
CET 1 capital | 9,968 | 9,756 | ||||||
|
|
|
| |||||
Additional Tier 1 (‘AT1’) capital instruments: | ||||||||
- Capital instruments | 1,550 | 800 | ||||||
- Amounts of qualifying items subject to phase out from AT1 | 701 | 1,066 | ||||||
|
|
|
| |||||
AT1 capital before regulatory adjustments | 2,251 | 1,866 | ||||||
|
| |||||||
Total regulatory adjustments to AT1 | — | — | ||||||
|
|
|
| |||||
AT1 capital | 2,251 | 1,866 | ||||||
|
|
|
| |||||
Tier 1 capital | 12,219 | 11,622 | ||||||
|
|
|
| |||||
Tier 2 capital instruments: | ||||||||
- Capital instruments | 1,799 | 1,819 | ||||||
- Amounts of qualifying items subject to phase out from Tier 2 | 1,096 | 1,253 | ||||||
|
|
|
| |||||
Tier 2 capital before regulatory adjustments | 2,895 | 3,072 | ||||||
|
| |||||||
Total regulatory adjustments to Tier 2 | — | — | ||||||
|
|
|
| |||||
Tier 2 capital | 2,895 | 3,072 | ||||||
|
|
|
| |||||
Total capital(1) | 15,114 | 14,694 | ||||||
|
|
|
| |||||
| (1) | Includes unverified profits of £722m (2014: £nil). Total capital excluding unverified profits less accrued dividends of £26m was £14,418m (2014: £14,694m). |
Total regulatory capital consists of:
CET 1 capital instruments and reserves
Capital instruments and related share premium accounts comprise ordinary share capital of £3,105m (2014: £3,105m) and share premium of £5,620m (2014: £5,620m). Also included in CET 1 capital before regulatory adjustments are retained earnings of £4,395m (2014: £4,056m) and accumulated other comprehensive income, other reserves and non-controlling interest of £270m (2014: £273m), as per the Condensed Consolidated Balance Sheet.
| 66 | Santander UK plc |
Table of Contents
Risk governance | Top and emerging risks | Credit risk | Market risk | Balance sheet management risk | Other important risks | Areas of focus and other items | ||||||
|
CET 1 regulatory adjustments
CET 1 regulatory adjustments represent adjustments to capital and reserves attributable to ordinary shareholders required under CRD IV. The adjustments applicable to Santander UK are as follows:
| • | Additional value adjustments:Prudent valuation adjustments of £96m (2014: £101m) assessed using a PRA-defined approach. |
| • | Intangible assets:Goodwill and intangible assets of £2,187m (2014: £2,174m) net of deferred tax of £23m (2014: £22m) represent goodwill arising on the acquisition of businesses and certain capitalised computer software costs. |
| • | Fair value reserves relating to gains or losses on cash flow hedges:Gains on cash flow hedges of £131m (2014: gains of £262m) which have been recognised in reserves. |
| • | Negative amounts resulting from the calculation of regulatory expected loss amounts:Excess expected losses deduction of £535m (2014: £484m) representing the difference between expected loss calculated in accordance with Santander UK’s Internal Rating-Based (‘IRB’) and Advanced Internal Rating-Based (‘AIRB’) models, and impairment loss allowances calculated in accordance with IFRS. Santander UK’s accounting policy for impairment loss allowances is set out in Note 1 to the Consolidated Financial Statements in the 2014 Annual Report. |
Regulatory expected losses are calculated using risk parameters based on either through-the-cycle or economic downturn estimates, and are subject to conservatism due to the imposition of regulatory floors. They are therefore currently higher than the impairment loss allowances under IFRS which only reflect losses incurred at the balance sheet date.
| • | Gains or losses on liabilities valued at fair value resulting from changes in own credit standing:This consists of a debit valuation adjustment of £31m (2014: £28m) relating to changes in OTC derivatives and changes in liabilities designated at fair value through profit and loss of £10m (2014: £(11)m) relating to changes in the own credit risk of entities within the Santander UK group. |
| • | Deferred tax assets that rely on future probability excluding timing differences:Removal of deferred tax assets of £10m (2014: £11m). |
| • | Defined benefit pension fund assets:Removal of the defined benefit pension scheme assets of £273m (2014: £249m) net of deferred tax of £76m (2014: £66m). |
| • | Dividend accrual:This consists of foreseeable future dividends from current period profits of £26m. |
| • | Deduction for minority interests:This consists of the non-controlling interest relating to the PSA cooperation. |
AT1 capital instruments
AT1 capital consists of preference shares and innovative/hybrid Tier 1 securities. All such instruments issued by the Santander UK group prior to 1 January 2014 do not fully meet the CRD IV requirements for AT1 capital which became effective on that date. These instruments are subject to transitional phase out provisions under CRD IV which restrict their recognition as capital. The £750m and £800m Perpetual Capital Securities issued in the first half of 2015 and 2014, respectively, meet the CRD IV AT1 rules and are fully recognised as AT1 capital.
Tier 2 capital
Tier 2 capital consists of fully CRD IV eligible Tier 2 instruments and ‘grandfathered’ Tier 2 instruments whose capital recognition is subject to CRD IV transitional phase out provisions.
| 2015 Half Yearly Financial Report | 67 |
Table of Contents
Risk review
Balance sheet management risk
continued
Movements in regulatory capital
Movements in regulatory capital during the six months ended 30 June 2015 and the year ended 31 December 2014 are set out below. The calculations are prepared on a basis consistent with Santander UK’s regulatory filings at 30 June 2015 and 31 December 2014.
| 30 June 2015 £m | 31 December 2014 £m | |||||||
CET 1 capital | ||||||||
Opening amount | 9,756 | 8,969 | ||||||
Contribution to CET 1 for the period: | ||||||||
- Increase in retained earnings | 339 | 679 | ||||||
- Increase in opening reserves due to the adoption of IFRIC 21 | — | 70 | ||||||
- (Decrease)/increase in comprehensive income and other reserves | (3 | ) | 389 | |||||
- Decrease/(increase) in additional value adjustments | 5 | (26 | ) | |||||
- (Increase)/decrease in intangible assets (net of tax) | (13 | ) | 145 | |||||
- Increase/(decrease) in fair value reserves related to gains and losses on cash | 131 | (372 | ) | |||||
- (Increase)/decrease in negative amounts resulting from the calculation of | (51 | ) | 60 | |||||
- (Loss)/gain on liabilities valued at fair value resulting from changes in own | (24 | ) | 8 | |||||
- Increase in defined benefit pension fund assets | (24 | ) | (155 | ) | ||||
- Increase in dividend accrual | (26 | ) | — | |||||
- Increase in deductions for minority interests | (123 | ) | — | |||||
- Decrease/(increase) in deferred tax assets that rely on future profitability | 1 | (11 | ) | |||||
|
|
|
| |||||
Closing amount | 9,968 | 9,756 | ||||||
|
|
|
| |||||
AT1 capital | ||||||||
Opening amount | 1,866 | 1,298 | ||||||
- Increase in capital instruments and related share premium accounts | 750 | 800 | ||||||
- Decrease in amount of qualifying items and related share premium amounts subject to phase out from AT1 | (365 | ) | (232 | ) | ||||
|
|
|
| |||||
Closing amount | 2,251 | 1,866 | ||||||
|
|
|
| |||||
Tier 2 capital | ||||||||
Opening amount | 3,072 | 3,020 | ||||||
- (Increase)/decrease in capital instruments | (20 | ) | 52 | |||||
- Increase in qualifying items subject to phase out from Tier 2 | (157 | ) | — | |||||
- Increase in minority interest deductions | — | — | ||||||
|
|
|
| |||||
Closing amount | 2,895 | 3,072 | ||||||
|
|
|
| |||||
Total regulatory capital | 15,114 | 14,694 | ||||||
|
|
|
| |||||
30 June 2015 compared to 31 December 2014
The changes in CET 1 capital reflect movements in ordinary share capital and profits for the six months ended 30 June 2015 and the year ended 31 December 2014 after adjustment to comply with the PRA’s rules. Santander UK complied with the PRA’s capital adequacy requirements during the six months ended 30 June 2015 and the year ended 31 December 2014.
During the six months ended 30 June 2015, CET 1 capital increased by £212m to £9,968m. This was largely due to profits for the period attributable to equity holders of the parent of £722m, less interim ordinary dividends approved of £325m. During the first half of 2015, the increase in AT1 capital was due to the issuance of £750m Perpetual Capital Securities to our immediate parent company as set out in Note 27 to the Condensed Consolidated Interim Financial Statements.
| 68 | Santander UK plc |
Table of Contents
Risk governance | Top and emerging risks | Credit risk | Market risk | Balance sheet management risk | Other important risks | Areas of focus and other items | ||||||
|
Regulatory Leverage – using PRA definition
The Basel III and CRD IV rules include proposals for the use of a leverage ratio as a backstop measure to risk-based capital ratios. The methodology for the calculation of the exposure measure leverage ratio has now been defined in the EU through European Commission Delegated Regulation. Santander UK is required to meet a minimum level for the end point Tier 1 Leverage Ratio under the framework established by the Financial Policy Committee’s review of the Leverage Ratio.
The table below presents the leverage ratio calculated using the approach requested by the PRA using end-point Tier 1 capital. This is the same as the leverage ratio for the Santander UK Group Holdings plc prudential consolidation group. Santander UK exceeded the proposed minimum 3% leverage ratio at 30 June 2015 and 31 December 2014.
| 30 June 2015 £m | 31 December 2014 £m | |||||||
Regulatory exposure | 279,322 | 276,296 | ||||||
End-point Tier 1 capital | 11,518 | 10,556 | ||||||
PRA end-point Tier 1 leverage ratio | 4.1 | % | 3.8 | % | ||||
The leverage ratio framework requires certain adjustments to be made to total assets per the consolidated balance sheet to calculate an exposure for leverage purposes. A reconciliation of total assets per the consolidated balance sheet to the regulatory exposure for leverage purposes at 30 June 2015 and 31 December 2014 is as follows:
| 30 June 2015 £m | 31 December 2014 £m | |||||||
Total assets per consolidated balance sheet | 277,226 | 275,977 | ||||||
Derivatives netting adjustment and potential future exposure | (12,219 | ) | (14,385 | ) | ||||
Securities financing current exposure add-on | 2,741 | 2,275 | ||||||
Removal of IFRS netting | 1,942 | 2,036 | ||||||
Commitments calculated in accordance with Basel Committee Leverage Framework | 12,637 | 13,299 | ||||||
CET 1 regulatory adjustments | (3,005 | ) | (2,906 | ) | ||||
|
|
|
| |||||
| 279,322 | 276,296 | |||||||
|
|
|
| |||||
The adjustments are as follows:
| • | Derivatives netting and potential future exposure:Where derivative netting is allowed in the calculation of regulatory risk weights for derivatives, this is also allowed for the purposes of the leverage ratio. This is partially offset by the inclusion of the potential future exposure as used in the calculation of regulatory RWAs for derivatives. |
| • | Securities financing current exposure add-on:An add-on for securities financing transactions to reflect current exposure is included for the purposes of the leverage ratio. |
| • | Removal of IFRS netting:Where netting of assets and liabilities is permitted under IFRS, this is removed for the purposes of the leverage ratio. |
| • | Commitments calculated in accordance with Basel Committee Leverage Framework:The gross value of undrawn commitments is added to total assets for leverage purposes after applying regulatory credit conversion factors. |
| • | CET 1 regulatory adjustments:Where assets are deducted from CET 1, they can be deducted from total assets for the purposes of the leverage ratio. |
| 2015 Half Yearly Financial Report | 69 |
Table of Contents
Risk review
Balance sheet management risk
continued
Risk-weighted assets (‘RWAs’)
The tables below analyse the composition of RWAs. The calculations are prepared on a basis consistent with Santander UK’s regulatory filings at 30 June 2015 and 31 December 2014.
RWAs by risk | 30 June 2015 £bn | 31 December 2014 £bn | ||||||
Credit risk | 69.9 | 66.3 | ||||||
Counterparty risk | 5.2 | 5.1 | ||||||
Market risk | 3.5 | 4.3 | ||||||
Operational risk | 6.6 | 6.6 | ||||||
|
|
|
| |||||
| 85.2 | 82.3 | |||||||
|
|
|
| |||||
RWAs by segment | 30 June 2015 £bn | 31 December 2014 £bn | ||||||
Retail Banking | 42.2 | 38.4 | ||||||
Commercial Banking | 19.4 | 19.9 | ||||||
Corporate & Institutional Banking | 16.9 | 16.8 | ||||||
Corporate Centre | 6.7 | 7.2 | ||||||
|
|
|
| |||||
| 85.2 | 82.3 | |||||||
|
|
|
| |||||
RWAs by segment may be further analysed into the balance sheet amount, the equivalent regulatory exposure measured under the standardised and IRB approaches, the risk-weighting applied to those regulatory exposures, and the resulting RWAs calculated, as follows:
The main differences between Santander UK’s balance sheet amounts and its regulatory exposures are as follows:
| • | For Retail Banking and for Commercial Banking and Corporate Centre customer assets, the regulatory exposure is larger than the balance sheet amount as the regulatory exposure includes unutilised credit facilities, which are adjusted for using a credit conversion factor (‘CCF’). |
| • | For counterparty risk, the regulatory exposure is smaller than the balance sheet amount as regulatory exposures for repurchase, reverse repurchase, securities financing and derivative transactions are calculated net of any associated collateral and netting agreements. |
| • | For liquid assets, the regulatory exposure is smaller than the balance sheet amount as the regulatory exposure for reverse repurchase transactions are calculated net of collateral received. |
| • | For other assets, the regulatory exposure is smaller than the balance sheet amount as the regulatory exposure for derivatives hedging debt issuances is calculated net of any associated collateral and netting agreements. |
| • | Intangible assets are deducted from capital resources and therefore no regulatory exposure is recognised. |
Santander UK applies CRD IV to the calculation of its capital requirement. In addition, Santander UK applies the Retail IRB and AIRB approaches to its credit portfolios. Residential lending capital resources requirements include securitised residential mortgages.
30 June 2015 compared to 31 December 2014
Credit risk RWAs increased by £3.6bn, primarily driven by an increase in unsecured consumer and vehicle finance lending, following the commencement of the PSA cooperation, and growth in mortgages. Counterparty risk RWAs increased by £0.1bn to £5.2bn (2014: £5.1bn) in line with balance sheet exposures in securities financing transactions. Market risk RWAs reduced £0.8bn to £3.5bn (2014: £4.3bn) in the first half of the year due to position changes and market movements. Operational risk RWAs are calculated using the standardised approach based on three-year average income, and the RWAs remained stable in the first half of the year at £6.6bn (2014: £6.6bn).
Retail Banking RWAs increased by £3.8bn to £42.2bn (2014: £38.4bn) mostly reflecting the commencement of the PSA cooperation and growth in mortgages. Commercial Banking RWAs decreased by £0.5bn to £19.4bn (2014: £19.9bn) driven by improved credit quality and a risk model recalibration. This was partly offset by the growth in customer loans. RWAs in Corporate & Institutional Banking increased by £0.1bn to £16.9bn (2014: £16.8bn) due to growth in customer loans, partially offset by decreases in market risk RWAs. RWAs in Corporate Centre decreased by £0.5bn to £6.7bn (2014: £7.2bn) in line with the reduction in customer loans and due to decreases on other non-core exposures.
| 70 | Santander UK plc |
Table of Contents
Risk governance | Top and emerging risks | Credit risk | Market risk | Balance sheet management risk | Other important risks | Areas of focus and other items | ||||||
|
In the following table, regulatory exposure represents the EAD calculated in accordance with CRR and related PRA supervisory statements. EAD for customer loans includes unutilised credit facilities and is adjusted for a credit conversion factor. EAD for repurchase, reverse repurchase, securities financing and derivative transactions are calculated net of any associated collateral and are adjusted for regulatory changes and potential future exposure adjustments (‘PFE’) where applicable.
| Regulatory exposure | Risk-weighting applied | RWAs | ||||||||||||||||||||||||||||||||||||||
| Balance sheet £bn | Standardised approach £bn | IRB approach £bn | Total £bn | Standardised approach % | IRB approach % | Total % | Standardised approach £bn | IRB approach £bn | Total £bn | |||||||||||||||||||||||||||||||
30 June 2015 | ||||||||||||||||||||||||||||||||||||||||
Retail Banking | ||||||||||||||||||||||||||||||||||||||||
- Secured lending | 150.7 | 0.1 | 161.6 | 161.7 | 100.0 | 15.8 | 15.8 | 0.1 | 25.5 | 25.6 | ||||||||||||||||||||||||||||||
- Unsecured lending | 11.9 | 9.1 | 7.5 | 16.6 | 78.4 | 59.4 | 69.7 | 7.1 | 4.5 | 11.6 | ||||||||||||||||||||||||||||||
- Operational risk | — | — | — | — | — | — | — | 5.0 | — | 5.0 | ||||||||||||||||||||||||||||||
Commercial Banking | ||||||||||||||||||||||||||||||||||||||||
- Customer assets | 20.0 | 11.0 | 13.2 | 24.2 | 88.2 | 69.7 | 78.1 | 9.6 | 9.2 | 18.8 | ||||||||||||||||||||||||||||||
- Operational risk | — | — | — | — | — | — | — | 0.6 | — | 0.6 | ||||||||||||||||||||||||||||||
Corporate & Institutional Banking | ||||||||||||||||||||||||||||||||||||||||
- Credit risk | 5.7 | 5.6 | 4.5 | 10.1 | 91.1 | 53.8 | 74.4 | 5.1 | 2.4 | 7.5 | ||||||||||||||||||||||||||||||
- Counterparty risk | 32.8 | 4.2 | 6.7 | 10.9 | 23.6 | 59.6 | 45.8 | 1.0 | 4.1 | 5.1 | ||||||||||||||||||||||||||||||
- Market risk(1) | — | — | — | — | — | — | — | 3.3 | — | 3.3 | ||||||||||||||||||||||||||||||
- Operational risk | — | — | — | — | — | — | — | 1.0 | — | 1.0 | ||||||||||||||||||||||||||||||
Corporate Centre | ||||||||||||||||||||||||||||||||||||||||
- Customer assets(2) | 7.9 | 1.4 | 8.0 | 9.4 | 61.1 | 10.0 | 16.9 | 0.9 | 0.8 | 1.7 | ||||||||||||||||||||||||||||||
- Counterparty risk | — | — | — | — | — | — | — | — | 0.1 | 0.1 | ||||||||||||||||||||||||||||||
- Eligible liquid assets(3) | 18.8 | 21.1 | — | 21.1 | — | — | — | — | — | — | ||||||||||||||||||||||||||||||
- Market risk(1) | — | — | — | — | — | — | — | 0.2 | — | 0.2 | ||||||||||||||||||||||||||||||
Intangible assets and securitisation deductions | 2.2 | — | — | — | — | — | — | — | — | — | ||||||||||||||||||||||||||||||
Other assets(4) | 27.2 | 9.3 | 2.9 | 12.2 | 41.6 | 33.3 | 39.6 | 3.7 | 1.0 | 4.7 | ||||||||||||||||||||||||||||||
|
|
|
|
|
|
|
|
|
|
|
|
|
|
|
|
|
|
|
| |||||||||||||||||||||
| 277.2 | 61.8 | 204.4 | 266.2 | 37.6 | 47.6 | 85.2 | ||||||||||||||||||||||||||||||||||
|
|
|
|
|
|
|
|
|
|
|
|
|
|
|
|
|
|
|
| |||||||||||||||||||||
31 December 2014 | ||||||||||||||||||||||||||||||||||||||||
Retail Banking | ||||||||||||||||||||||||||||||||||||||||
- Secured lending | 150.1 | 0.2 | 159.2 | 159.4 | 50.0 | 15.3 | 15.3 | 0.1 | 24.3 | 24.4 | ||||||||||||||||||||||||||||||
- Unsecured lending | 8.4 | 5.8 | 7.1 | 12.9 | 77.6 | 63.4 | 69.8 | 4.5 | 4.5 | 9.0 | ||||||||||||||||||||||||||||||
- Operational risk | — | — | — | — | — | — | — | 5.0 | — | 5.0 | ||||||||||||||||||||||||||||||
Commercial Banking | ||||||||||||||||||||||||||||||||||||||||
- Customer assets | 18.7 | 11.7 | 11.4 | 23.1 | 95.7 | 71.1 | 83.5 | 11.2 | 8.1 | 19.3 | ||||||||||||||||||||||||||||||
- Operational risk | — | — | — | — | — | — | — | 0.6 | — | 0.6 | ||||||||||||||||||||||||||||||
Corporate & Institutional Banking | ||||||||||||||||||||||||||||||||||||||||
- Credit risk | 5.2 | 4.9 | 4.4 | 9.3 | 93.9 | 56.8 | 76.3 | 4.6 | 2.5 | 7.1 | ||||||||||||||||||||||||||||||
- Counterparty risk | 29.9 | 2.8 | 5.7 | 8.5 | 57.1 | 52.6 | 54.1 | 1.6 | 3.0 | 4.6 | ||||||||||||||||||||||||||||||
- Market risk(1) | — | — | — | — | — | — | — | 4.1 | — | 4.1 | ||||||||||||||||||||||||||||||
- Operational risk | — | — | — | — | — | — | — | 1.0 | — | 1.0 | ||||||||||||||||||||||||||||||
Corporate Centre | ||||||||||||||||||||||||||||||||||||||||
- Customer assets(2) | 8.3 | 1.4 | 8.5 | 9.9 | 64.3 | 11.8 | 19.2 | 0.9 | 1.0 | 1.9 | ||||||||||||||||||||||||||||||
- Counterparty risk | — | — | — | — | — | — | — | — | 0.2 | 0.2 | ||||||||||||||||||||||||||||||
- Eligible liquid assets(3) | 30.9 | 29.0 | — | 29.0 | — | — | — | — | — | — | ||||||||||||||||||||||||||||||
- Market risk(1) | — | — | — | — | — | — | — | 0.2 | — | 0.2 | ||||||||||||||||||||||||||||||
Intangible assets and securitisation deductions | 2.2 | — | — | — | — | — | — | — | — | — | ||||||||||||||||||||||||||||||
Other assets(4) | 22.3 | 8.8 | 2.8 | 11.6 | 42.0 | 42.9 | 42.2 | 3.7 | 1.2 | 4.9 | ||||||||||||||||||||||||||||||
|
|
|
|
|
|
|
|
|
|
|
|
|
|
|
|
|
|
|
| |||||||||||||||||||||
| 276.0 | 64.6 | 199.1 | 263.7 | 37.5 | 44.8 | 82.3 | ||||||||||||||||||||||||||||||||||
|
|
|
|
|
|
|
|
|
|
|
|
|
|
|
|
|
|
|
| |||||||||||||||||||||
| (1) | Market risk RWAs are determined using both the internal model-based and standardised approaches, as described in the ‘Market risk’ section in the 2014 Annual Report. |
| (2) | Largely comprise social housing. |
| (3) | Include reverse repurchase agreements collateralised by eligible sovereign securities. |
| (4) | The balance sheet amounts of other assets have not been allocated segmentally, although the RWAs have been allocated to Corporate Centre. The RWAs cover credit risk, market risk and operational risk. |
| 2015 Half Yearly Financial Report | 71 |
Table of Contents
Risk review
Other important risks
Pension developments in the first half of 2015
During the first half of 2015, the risk profile of the Santander (UK) Group Pension Scheme (the ‘Scheme’) remained stable with the focus on positive performance from return-seeking assets, whilst managing volatility through hedging a proportion of the liabilities with bond assets and derivatives. Using portfolio management and hedging, Santander UK seeks the right balance of the reward for the risk undertaken, and the potential impact from pension risk arising from market movements. Consistent with previous periods, the Scheme was managed within the risk triggers and limits.
Currently, pension risk is primarily managed using the assumptions adopted by the Trustees in their assessment of required additional contributions (“funding basis”). The key difference between the funding basis and the accounting basis is the rate used to discount liabilities, with minor differences in the inflation, mortality and commutation assumptions. For funding basis purposes, the discount rate is based on the long-term gilt yield plus a margin rather than on the AA Corporate Bond rate used for accounting purposes. Hedging is managed on a funding basis, but pension risk is also reviewed and monitored on an accounting basis.
The Scheme’s funding gap risk is modelled within the Value at Risk (‘VaR’) framework. VaR (1 year, 95% confidence interval) on a funding basis decreased over the period from £1,340m to £1,220m. The decrease in VaR reflected an updated liability profile that was modelled using the most recent cashflow data, as well as a slightly more favourable real yield environment at 30 June 2015.
In addition to this, a suite of scenario analysis and stress testing of both assets and liabilities builds a key component of the risk management framework. A number of forward-looking, historical and ad-hoc scenarios as well as key risk factor analyses are reviewed on a monthly basis at executive level committees and shared with the Scheme Trustees to drive strategic decision making. Stress testing also forms a part of the risk appetite process.
Hedge ratios on a funding basis, which show the proportion of liabilities hedged with bond assets and derivatives, were also broadly stable, with approximately 50% of the exposure to changes in interest rates on the discount rate and 65% of the exposure to changes in inflation being hedged.
During the first half of 2015, the accounting position of the Scheme and other funded arrangements was broadly unchanged with sections in surplus (retirement benefit assets) of £349m at 30 June 2015 (31 December 2014: £315m) and sections in deficit (retirement benefit obligations) of £169m at 30 June 2015 (31 December 2014: £159m). The overall position was a £180m surplus at 30 June 2015 (31 December 2014: £156m surplus). In addition there were unfunded defined benefit scheme liabilities of £41m at 30 June 2015 (31 December 2014: £40m). There were no significant re-measurement gains or losses in the period.
Further information on Santander UK’s pension obligations, including the current asset allocation and sensitivity to key risk factors, can be found in ‘Critical accounting policies and Areas of Significant Management Judgement’ in Note 1 to the Consolidated Financial Statements in the 2014 Annual Report and Note 25 to the Condensed Consolidated Interim Financial Statements.
| 72 | Santander UK plc |
Table of Contents
Risk governance | Top and emerging risks | Credit risk | Market risk | Balance sheet management risk | Other important risks | Areas of focus and other items | ||||||
|
The following table sets out the major categories of Santander UK’s operational risk loss profile for the six months ended 30 June 2015 and 2014. The operational loss categories in the table reflect the CRD IV loss event type classification, although within the Santander UK Risk Framework the responsibility for management of some of these risks may fall within other risk types (for example, conduct, regulatory and legal risk). The figures and volumes quoted reflect the loss data collection and categorisation policies in place at 30 June 2015 and at 30 June 2014.
| Six months ended 30 June 2015 | Six months ended 30 June 2014 | |||||||||||||||
| £m | Volume | £m | Volume | |||||||||||||
Internal Fraud | — | 409 | — | 234 | ||||||||||||
External Fraud | 7 | 48,016 | 10 | 68,198 | ||||||||||||
Employment Practices and Workplace Safety | — | 17 | — | 71 | ||||||||||||
Clients, Products, and Business Practices | 50 | 52,643 | 63 | 46,084 | ||||||||||||
Damage to Physical Assets | — | 6 | — | 5 | ||||||||||||
Business Disruption and Systems Failures | — | 3 | — | 133 | ||||||||||||
Execution, Delivery, and Process Management | 8 | 220,895 | 10 | 274,823 | ||||||||||||
|
|
|
|
|
|
|
| |||||||||
| 65 | 321,989 | 83 | 389,548 | |||||||||||||
|
|
|
|
|
|
|
| |||||||||
Operational risk developments in the first half of 2015
During the first half of 2015, direct operational risk losses totalled £65m (six months ended 30 June 2014: £83m) and remained within our forecasts. The majority continued to relate to redress payments (excluding related costs) for historical sales of PPI. See Note 24 to the Condensed Consolidated Interim Financial Statements for more information. The significant increase seen in external cyber-crime attempts targeted at UK banks in 2014 continued into the first half of 2015. In direct response, and given the growth in volumes of automated and online services and transactions, Santander UK increased protection levels over systems and data, resulting in a reduced loss in the period.
The Operational Risk Transformation Programme, developed in 2014 and planned to run through to the end of 2016, continues to be successfully rolled out, particularly focused on system specifications for managing and recording Operational Risk Self-Assessments, and the completion of the 2015 Scenario Analysis programme and the 2015 Operational Risk Assurance plan.
Conduct risk developments in the first half of 2015
During the first half of 2015, the Conduct Risk Strategy programme continued to enhance the management of conduct risk. The key focus remained on embedding the framework in our Retail Banking segment, with businesses taking ownership for the risks arising from their decisions and with greater alignment to the Santander UK values of Simple, Personal, Fair. Work continues to implement the framework in our Commercial Banking and Corporate & Institutional Banking segments.
With respect to the provisions for conduct remediation, the remaining provision for PPI redress and related costs amounted to £73m. Monthly utilisation, including proactive customer contact, during the first half of 2015 decreased to £9m per month, against an average of £11m in 2014. Excluding proactive customer contact (which is currently being finalised), the average redress costs during the first half of the year were £6m per month. The high proportion of invalid complaints also continued. Existing non-PPI related conduct provisions amounted to £159m.
Details of Santander UK’s provision for conduct remediation, including sensitivities, are set out in Note 24 to the Condensed Consolidated Interim Financial Statements. Further information on conduct remediation provision sensitivities is set out in ‘Critical accounting policies and Areas of Significant Management Judgement’ in Note 1 to the Consolidated Financial Statements in the 2014 Annual Report.
| 2015 Half Yearly Financial Report | 73 |
Table of Contents
Risk review
Other important risks
continued
Regulatory risk developments in the first half of 2015
There continued to be legislative and regulatory developments in the UK and abroad going through consultation and implementation processes, which may impact Santander UK’s approach to regulatory risk. Key developments which are expected to have a significant impact include the implementation of ring-fencing and new accountability regimes (senior managers and certification regimes) following the passing of the Banking Reform Act in 2013.
The two key UK regulatory developments that were implemented in 2014 (the Mortgage Market Review and the transfer of consumer credit regulation from the OFT to the FCA) continue to be embedded. Santander UK has in a place a robust approach to identifying, assessing, managing and reporting any additional risks emerging from the new requirements.
In addition, there were a number of new regulatory developments in the first half of 2015. The most significant are the implementation of the Client Asset rules changes required by the FCA, and the necessary reviews (including delivery of any enhancements) of the control environment applying to our benchmark interest and foreign exchange rate activities. Santander UK has put in place appropriate project management and governance to ensure the risks arising from these developments are effectively identified, assessed, managed and reported.
Santander UK took part in the PRA’s stress testing exercise conducted during the second quarter of the year. The results of this exercise are due to be published during the fourth quarter of the year.
Legal risk developments in the first half of 2015
Effective management of legal risk continued throughout the first half of 2015 as a key area of focus. The scale and pace of regulatory change continued to be a challenge together with other related changes in the law. As noted above, key regulatory developments were identified, assessed, managed and reported in line with Santander UK’s Risk Framework. The key risk indicator of ‘aggregated value at risk of all managed legal claims’ (litigation VaR) remained stable during most of the period and reduced in the second quarter of 2015 as a result of one case being settled. The litigation VaR remains at a level well below the threshold triggers.
Strategic risk developments in the first half of 2015
Risks to banks’ strategies continued in the first half of 2015, as factors such as regulatory, economic and to some degree political uncertainty, technological change and the emergence of new bank business models challenged the industry. The regulatory initiatives noted above and other macro-prudential, micro-prudential and conduct-related announcements continued to impact banks’ operating environment. During the first half of 2015, we made continued progress towards our strategic priorities (see the Strategic report update).
Reputational risk developments in the first half of 2015
During the first half of 2015, Santander UK continued to strengthen governance and support cultural change through the organisation. Governance and management of reputational risk continued to be enhanced with a consistent approach. This included building on the substantial increases in resources and investment in the Compliance and Risk Divisions in 2014, as well as introducing additional and more sophisticated measurement, monitoring and oversight of reputational issues. This continues to be supported more widely across Santander UK by the ongoing roll-out of Simple, Personal, Fair.
Model risk developments in the first half of 2015
During the first half of 2015, Santander UK continued to roll out its enhanced model risk management practices across the organisation following their implementation in the Risk division in 2014. There was particular focus on model identification, model inventories and model materiality in the Finance and UK Banking divisions.
Model Risk Appetite for high materiality Risk models was also launched in the first half of 2015, incorporating metrics which reflect both the coverage and model risk assessments reported from independent model reviews. This is planned to be extended in line with the model risk management roll out schedule.
| 74 | Santander UK plc |
Table of Contents
Risk governance | Top and emerging risks | Credit risk | Market risk | Balance sheet management risk | Other important risks | and other items | ||||||
|
Areas of focus and other items
Santander UK manages its country risk exposure under its global limits framework. Within this framework, Santander UK sets its individual risk appetite for each country, taking into account any factors that may influence the risk profile of each country, including political events, the macroeconomic situation and the nature of the risk incurred. Exposures are actively managed if it is considered appropriate. Accordingly, and over recent years, Santander UK has intensified its monitoring of exposures to sovereigns and counterparties in eurozone countries, and has proceeded to selectively divest assets directly or indirectly affected by events in those countries.Banco Santander group-related risk is considered separately.
The country risk tables below show Santander UK’s exposures to central and local governments, government guaranteed counterparties, banks, other financial institutions, retail customers and corporate customers at 30 June 2015 and 31 December 2014. Total exposures consist of the total of balance sheet values and off-balance sheet values. Balance sheet values are calculated in accordance with IFRS (i.e. after the effect of netting agreements recognised in accordance with the requirements of IFRS) except for credit provisions which have been added back. Off-balance sheet values consist of undrawn facilities and letters of credit.
The country of exposure has been assigned based on the counterparty’s country of incorporation except where Santander UK is aware that a guarantee is in place, in which case the country of incorporation of the guarantor has been used. The exposures are presented by type of counterparty other than where the specific exposures have been guaranteed by a sovereign counterparty in which case they are presented within the ‘Government guaranteed’ category.
Given the ongoing interest in eurozone economies, disclosures relating to those economies are presented first and highlighted separately.
The tables exclude credit risk exposures to Banco Santander and other Banco Santander group companies, which are presented separately in the ‘Balances with other Santander UK group companies’ section.
| Central and local governments £bn | Government guaranteed £bn | Banks(2) £bn | Other financial institutions £bn | Retail £bn | Corporate £bn | Total(1) £bn | ||||||||||||||||||||||
30 June 2015 | ||||||||||||||||||||||||||||
Eurozone: | ||||||||||||||||||||||||||||
Peripheral eurozone countries: | ||||||||||||||||||||||||||||
Italy | 0.5 | — | 0.1 | — | — | 0.1 | 0.7 | |||||||||||||||||||||
Ireland | — | — | — | 0.2 | — | 0.4 | 0.6 | |||||||||||||||||||||
Spain (excluding Banco Santander) | — | — | 0.1 | — | — | 0.2 | 0.3 | |||||||||||||||||||||
Portugal | — | — | — | — | — | — | — | |||||||||||||||||||||
Greece(3) | — | — | — | — | — | — | — | |||||||||||||||||||||
Other eurozone countries: | ||||||||||||||||||||||||||||
France | — | 0.3 | 2.1 | 0.1 | — | 0.2 | 2.7 | |||||||||||||||||||||
Germany | 0.2 | — | 1.2 | — | — | 0.3 | 1.7 | |||||||||||||||||||||
All other eurozone(4) | 0.3 | — | 1.1 | 0.2 | — | 1.2 | 2.8 | |||||||||||||||||||||
|
|
|
|
|
|
|
|
|
|
|
|
|
| |||||||||||||||
| 1.0 | 0.3 | 4.6 | 0.5 | — | 2.4 | 8.8 | ||||||||||||||||||||||
|
|
|
|
|
|
|
|
|
|
|
|
|
| |||||||||||||||
All other countries: | ||||||||||||||||||||||||||||
UK | 16.6 | 0.4 | 10.3 | 7.7 | 181.6 | 50.3 | 266.9 | |||||||||||||||||||||
US | 2.3 | 0.2 | 9.4 | 2.3 | — | 0.3 | 14.5 | |||||||||||||||||||||
Japan | 2.5 | — | 0.7 | 0.1 | — | 2.7 | 6.0 | |||||||||||||||||||||
Switzerland | 0.5 | — | 0.7 | 0.1 | — | 0.3 | 1.6 | |||||||||||||||||||||
Denmark | 0.2 | — | 0.1 | — | — | 0.4 | 0.7 | |||||||||||||||||||||
Russia | — | — | — | 0.2 | — | — | 0.2 | |||||||||||||||||||||
All others(5) | — | — | 2.0 | 0.4 | — | 1.7 | 4.1 | |||||||||||||||||||||
|
|
|
|
|
|
|
|
|
|
|
|
|
| |||||||||||||||
| 22.1 | 0.6 | 23.2 | 10.8 | 181.6 | 55.7 | 294.0 | ||||||||||||||||||||||
|
|
|
|
|
|
|
|
|
|
|
|
|
| |||||||||||||||
Total | 23.1 | 0.9 | 27.8 | 11.3 | 181.6 | 58.1 | 302.8 | |||||||||||||||||||||
|
|
|
|
|
|
|
|
|
|
|
|
|
| |||||||||||||||
| 2015 Half Yearly Financial Report | 75 |
Table of Contents
Risk review
Areas of focus and other items
continued
| Central and local governments £bn | Government guaranteed £bn | Banks(2) £bn | Other financial institutions £bn | Retail £bn | Corporate £bn | Total(1) £bn | ||||||||||||||||||||||
31 December 2014 | ||||||||||||||||||||||||||||
Eurozone: | ||||||||||||||||||||||||||||
Peripheral eurozone countries: | ||||||||||||||||||||||||||||
Italy | 0.9 | — | 0.1 | — | — | 0.2 | 1.2 | |||||||||||||||||||||
Ireland | — | — | — | — | — | 0.3 | 0.3 | |||||||||||||||||||||
Spain (excluding Banco Santander) | — | — | 0.3 | — | — | 0.1 | 0.4 | |||||||||||||||||||||
Portugal | — | — | — | — | — | — | — | |||||||||||||||||||||
Greece(3) | — | — | — | — | — | — | — | |||||||||||||||||||||
Other eurozone countries: | ||||||||||||||||||||||||||||
France | — | 0.4 | 2.2 | — | — | 0.1 | 2.7 | |||||||||||||||||||||
Germany | 0.2 | — | 1.9 | — | — | 0.3 | 2.4 | |||||||||||||||||||||
All other eurozone(4) | — | — | 1.3 | 0.1 | — | 1.5 | 2.9 | |||||||||||||||||||||
|
|
|
|
|
|
|
|
|
|
|
|
|
| |||||||||||||||
| 1.1 | 0.4 | 5.8 | 0.1 | — | 2.5 | 9.9 | ||||||||||||||||||||||
|
|
|
|
|
|
|
|
|
|
|
|
|
| |||||||||||||||
All other countries: | ||||||||||||||||||||||||||||
UK | 20.2 | 0.4 | 11.2 | 5.4 | 176.9 | 48.1 | 262.2 | |||||||||||||||||||||
US | 4.7 | 0.2 | 10.1 | 1.0 | — | 0.2 | 16.2 | |||||||||||||||||||||
Japan | 3.8 | — | 0.1 | 0.1 | — | 1.1 | 5.1 | |||||||||||||||||||||
Switzerland | 0.7 | — | 0.5 | — | — | 0.3 | 1.5 | |||||||||||||||||||||
Denmark | 0.3 | — | 0.2 | — | — | 0.3 | 0.8 | |||||||||||||||||||||
Russia | — | — | — | 0.2 | — | — | 0.2 | |||||||||||||||||||||
All others(5) | — | — | 1.4 | 0.3 | — | 3.6 | 5.3 | |||||||||||||||||||||
|
|
|
|
|
|
|
|
|
|
|
|
|
| |||||||||||||||
| 29.7 | 0.6 | 23.5 | 7.0 | 176.9 | 53.6 | 291.3 | ||||||||||||||||||||||
|
|
|
|
|
|
|
|
|
|
|
|
|
| |||||||||||||||
Total | 30.8 | 1.0 | 29.3 | 7.1 | 176.9 | 56.1 | 301.2 | |||||||||||||||||||||
|
|
|
|
|
|
|
|
|
|
|
|
|
| |||||||||||||||
| (1) | Credit exposures exclude cash at hand, the macro hedge of interest rate risk, intangible assets, property, plant and equipment, current and deferred tax assets, retirement benefit assets and other assets. Loans and advances to customers are included gross of loan loss allowances. |
| (2) | Excludes balances with central banks. |
| (3) | At 30 June 2015 there was no exposure to Greece (2014: £nil). |
| (4) | Includes Luxembourg, the Netherlands, Belgium and Finland, and Cyprus. Exposure to Cyprus was £35m (2014: £36m). |
| (5) | Includes Ukraine of £nil (2014: £nil). |
30 June 2015 compared to 31 December 2014
Key changes in sovereign and other country risk exposures during the six months ended 30 June 2015 were as follows:
| • | An increase of £4.7bn in exposure to the UK to £266.9bn (2014: £262.2bn). This was primarily due to an increase in loans and advances to retail customers. |
| • | A decrease of £1.7bn in exposure to the US to £14.5bn (2014: £16.2bn). This was primarily due to a decrease in deposits at the US Federal Reserve as part of normal liquid asset portfolio management activity. |
| • | A decrease of £0.5bn in exposures to Italy to £0.7bn (2014: £1.2bn). This was primarily due to a reduction in treasury bills held. |
| • | A decrease of £0.7bn in exposures to Germany to £1.7bn (2014: £2.4bn). This was primarily due to decreased trading assets held at fair value with banks. |
| • | An increase of £0.9bn in exposures to Japan to £6.0bn (2014: £5.1bn). This was primarily due to additional purchase of equity instruments listed in Japan as part of increased trading by short-term markets. The table above also includes market risk exposures to Japan of £2.7bn (2014: £1.1bn) relating to Santander UK’s secured short-term markets financing business. These market risk exposures are hedged using derivative instruments. |
| • | Movements in the remaining country risk exposures were minimal and exposures to these countries remained at low levels. |
| 76 | Santander UK plc |
Table of Contents
Risk governance | Top and emerging risks | Credit risk | Market risk | Balance sheet management risk | Other important risks | Areas of focus and other items | ||||||
|
Further analysis of sovereign debt and other country risk exposures, including peripheral eurozone exposures
Presented below for sovereign debt and other country risk exposures is additional analysis of exposures into those that are accounted for on-balance sheet (further analysed into those measured at amortised cost and those measured at fair value) and those that are off-balance sheet.
The assets held at amortised cost are principally classified as loans and advances to banks, loans and advances to customers and loans and receivables securities. Santander UK has no held-to-maturity securities. The assets held at fair value are classified as either trading assets or have been designated as held at fair value through profit or loss, with the exception of government debt held for liquidity purposes, which are classified as available-for-sale securities. Santander UK has made no reclassifications to/from the assets which are held at fair value from/to any other category.
Sovereign debt
| Assets held at amortised cost | Assets held at fair value | |||||||||||||||||||||||||||||||||||
| Central and local governments £bn | Government guaranteed £bn | Total £bn | Central and local governments £bn | Government guaranteed £bn | Total £bn | Total balance sheet asset £bn | Commitments and undrawn facilities £bn | Total £bn | ||||||||||||||||||||||||||||
30 June 2015 | ||||||||||||||||||||||||||||||||||||
Eurozone countries: | ||||||||||||||||||||||||||||||||||||
Italy | — | — | — | 0.5 | — | 0.5 | 0.5 | — | 0.5 | |||||||||||||||||||||||||||
France | — | — | — | — | 0.3 | 0.3 | 0.3 | — | 0.3 | |||||||||||||||||||||||||||
Germany | — | — | — | 0.2 | — | 0.2 | 0.2 | — | 0.2 | |||||||||||||||||||||||||||
All other eurozone | — | — | — | 0.3 | — | 0.3 | 0.3 | — | 0.3 | |||||||||||||||||||||||||||
|
|
|
|
|
|
|
|
|
|
|
|
|
|
|
|
|
| |||||||||||||||||||
| — | — | — | 1.0 | 0.3 | 1.3 | 1.3 | — | 1.3 | ||||||||||||||||||||||||||||
|
|
|
|
|
|
|
|
|
|
|
|
|
|
|
|
|
| |||||||||||||||||||
All other countries: | ||||||||||||||||||||||||||||||||||||
UK | 12.1 | — | 12.1 | 4.5 | 0.4 | 4.9 | 17.0 | — | 17.0 | |||||||||||||||||||||||||||
US | 2.2 | — | 2.2 | 0.1 | 0.2 | 0.3 | 2.5 | — | 2.5 | |||||||||||||||||||||||||||
Japan | — | — | — | 2.5 | — | 2.5 | 2.5 | — | 2.5 | |||||||||||||||||||||||||||
Switzerland | — | — | — | 0.5 | — | 0.5 | 0.5 | — | 0.5 | |||||||||||||||||||||||||||
Denmark | — | — | — | 0.2 | — | 0.2 | 0.2 | — | 0.2 | |||||||||||||||||||||||||||
|
|
|
|
|
|
|
|
|
|
|
|
|
|
|
|
|
| |||||||||||||||||||
| 14.3 | — | 14.3 | 7.8 | 0.6 | 8.4 | 22.7 | — | 22.7 | ||||||||||||||||||||||||||||
|
|
|
|
|
|
|
|
|
|
|
|
|
|
|
|
|
| |||||||||||||||||||
31 December 2014 | ||||||||||||||||||||||||||||||||||||
Eurozone countries: | ||||||||||||||||||||||||||||||||||||
Italy | — | — | — | 0.9 | — | 0.9 | 0.9 | — | 0.9 | |||||||||||||||||||||||||||
France | — | — | — | — | 0.4 | 0.4 | 0.4 | — | 0.4 | |||||||||||||||||||||||||||
Germany | — | — | — | 0.2 | — | 0.2 | 0.2 | — | 0.2 | |||||||||||||||||||||||||||
All other eurozone | — | — | — | — | — | — | — | — | — | |||||||||||||||||||||||||||
|
|
|
|
|
|
|
|
|
|
|
|
|
|
|
|
|
| |||||||||||||||||||
| — | — | — | 1.1 | 0.4 | 1.5 | 1.5 | — | 1.5 | ||||||||||||||||||||||||||||
|
|
|
|
|
|
|
|
|
|
|
|
|
|
|
|
|
| |||||||||||||||||||
All other countries: | ||||||||||||||||||||||||||||||||||||
UK | 16.9 | — | 16.9 | 3.3 | 0.4 | 3.7 | 20.6 | — | 20.6 | |||||||||||||||||||||||||||
US | 4.4 | — | 4.4 | 0.3 | 0.2 | 0.5 | 4.9 | — | 4.9 | |||||||||||||||||||||||||||
Japan | — | — | — | 3.8 | — | 3.8 | 3.8 | — | 3.8 | |||||||||||||||||||||||||||
Switzerland | — | — | — | 0.7 | — | 0.7 | 0.7 | — | 0.7 | |||||||||||||||||||||||||||
Denmark | — | — | — | 0.3 | — | 0.3 | 0.3 | — | 0.3 | |||||||||||||||||||||||||||
|
|
|
|
|
|
|
|
|
|
|
|
|
|
|
|
|
| |||||||||||||||||||
| 21.3 | — | 21.3 | 8.4 | 0.6 | 9.0 | 30.3 | — | 30.3 | ||||||||||||||||||||||||||||
|
|
|
|
|
|
|
|
|
|
|
|
|
|
|
|
|
| |||||||||||||||||||
Santander UK has no direct sovereign exposures to any other countries. Santander UK has not recognised any impairment losses against sovereign debt which is held at amortised cost. Santander UK has no exposures to credit default swaps (either written or purchased) which are directly referenced to sovereign debt or other instruments that are directly referenced to sovereign debt.
| 2015 Half Yearly Financial Report | 77 |
Table of Contents
Risk review
Areas of focus and other items
continued
Other country risk exposures(1)
| Assets held at amortised cost | Assets held at fair value(2) | |||||||||||||||||||||||||||||||||||||||||||||||
| Banks £bn | Other financial institutions £bn | Retail £bn | Corporate £bn | Total £bn | Banks £bn | Other financial institutions £bn | Corporate £bn | Total £bn | Total balance sheet asset £bn | Commitments and undrawn facilities(3) £bn | Total £bn | |||||||||||||||||||||||||||||||||||||
30 June 2015 | ||||||||||||||||||||||||||||||||||||||||||||||||
Eurozone: | ||||||||||||||||||||||||||||||||||||||||||||||||
Peripheral eurozone countries: |
| |||||||||||||||||||||||||||||||||||||||||||||||
Ireland | — | — | — | 0.2 | 0.2 | — | — | 0.1 | 0.1 | 0.3 | 0.3 | 0.6 | ||||||||||||||||||||||||||||||||||||
Spain | — | — | — | — | — | 0.1 | — | — | 0.1 | 0.1 | 0.2 | 0.3 | ||||||||||||||||||||||||||||||||||||
Italy | — | — | — | — | — | 0.1 | — | — | 0.1 | 0.1 | 0.1 | 0.2 | ||||||||||||||||||||||||||||||||||||
Portugal | — | — | — | — | — | — | — | — | — | — | — | — | ||||||||||||||||||||||||||||||||||||
Other eurozone countries: | ||||||||||||||||||||||||||||||||||||||||||||||||
France | — | — | — | 0.1 | 0.1 | 2.1 | 0.1 | 0.1 | 2.3 | 2.4 | — | 2.4 | ||||||||||||||||||||||||||||||||||||
Germany | — | — | — | 0.1 | 0.1 | 1.2 | — | 0.2 | 1.4 | 1.5 | — | 1.5 | ||||||||||||||||||||||||||||||||||||
Other | — | 0.1 | — | 0.4 | 0.5 | 1.1 | 0.1 | 0.1 | 1.3 | 1.8 | 0.7 | 2.5 | ||||||||||||||||||||||||||||||||||||
|
|
|
|
|
|
|
|
|
|
|
|
|
|
|
|
|
|
|
|
|
|
|
| |||||||||||||||||||||||||
| — | 0.1 | — | 0.8 | 0.9 | 4.6 | 0.2 | 0.5 | 5.3 | 6.2 | 1.3 | 7.5 | |||||||||||||||||||||||||||||||||||||
|
|
|
|
|
|
|
|
|
|
|
|
|
|
|
|
|
|
|
|
|
|
|
| |||||||||||||||||||||||||
All other countries: | ||||||||||||||||||||||||||||||||||||||||||||||||
UK | 1.5 | 1.0 | 162.6 | 28.5 | 193.6 | 8.8 | 6.4 | 8.1 | 23.3 | 216.9 | 33.0 | 249.9 | ||||||||||||||||||||||||||||||||||||
US | 0.4 | 0.2 | — | 0.2 | 0.8 | 9.0 | 2.1 | — | 11.1 | 11.9 | 0.1 | 12.0 | ||||||||||||||||||||||||||||||||||||
Japan | 0.6 | — | — | — | 0.6 | 0.1 | 0.1 | 2.7 | 2.9 | 3.5 | — | 3.5 | ||||||||||||||||||||||||||||||||||||
Switzerland | — | — | — | 0.3 | 0.3 | 0.7 | 0.1 | — | 0.8 | 1.1 | — | 1.1 | ||||||||||||||||||||||||||||||||||||
Denmark | — | — | — | — | — | 0.1 | — | — | 0.1 | 0.1 | 0.4 | 0.5 | ||||||||||||||||||||||||||||||||||||
Russia | — | 0.2 | — | — | 0.2 | — | — | — | — | 0.2 | — | 0.2 | ||||||||||||||||||||||||||||||||||||
Other | 0.1 | 0.1 | — | 1.3 | 1.5 | 1.9 | 0.1 | — | 2.0 | 3.5 | 0.6 | 4.1 | ||||||||||||||||||||||||||||||||||||
|
|
|
|
|
|
|
|
|
|
|
|
|
|
|
|
|
|
|
|
|
|
|
| |||||||||||||||||||||||||
| 2.6 | 1.5 | 162.6 | 30.3 | 197.0 | 20.6 | 8.8 | 10.8 | 40.2 | 237.2 | 34.1 | 271.3 | |||||||||||||||||||||||||||||||||||||
|
|
|
|
|
|
|
|
|
|
|
|
|
|
|
|
|
|
|
|
|
|
|
| |||||||||||||||||||||||||
31 December 2014 | ||||||||||||||||||||||||||||||||||||||||||||||||
Eurozone: | ||||||||||||||||||||||||||||||||||||||||||||||||
Peripheral eurozone countries: | ||||||||||||||||||||||||||||||||||||||||||||||||
Ireland | — | — | — | 0.1 | 0.1 | — | — | 0.1 | 0.1 | 0.2 | 0.1 | 0.3 | ||||||||||||||||||||||||||||||||||||
Spain | — | — | — | — | — | 0.2 | — | — | 0.2 | 0.2 | 0.2 | 0.4 | ||||||||||||||||||||||||||||||||||||
Italy | — | — | — | — | — | 0.1 | — | — | 0.1 | 0.1 | 0.2 | 0.3 | ||||||||||||||||||||||||||||||||||||
Portugal | — | — | — | — | — | — | — | — | — | — | — | — | ||||||||||||||||||||||||||||||||||||
Other eurozone countries: | ||||||||||||||||||||||||||||||||||||||||||||||||
France | — | — | — | 0.1 | 0.1 | 2.2 | — | — | 2.2 | 2.3 | — | 2.3 | ||||||||||||||||||||||||||||||||||||
Germany | — | — | — | 0.1 | 0.1 | 1.9 | — | 0.2 | 2.1 | 2.2 | — | 2.2 | ||||||||||||||||||||||||||||||||||||
Other | — | — | — | 0.5 | 0.5 | 1.3 | 0.1 | 0.3 | 1.7 | 2.2 | 0.7 | 2.9 | ||||||||||||||||||||||||||||||||||||
|
|
|
|
|
|
|
|
|
|
|
|
|
|
|
|
|
|
|
|
|
|
|
| |||||||||||||||||||||||||
| — | — | — | 0.8 | 0.8 | 5.7 | 0.1 | 0.6 | 6.4 | 7.2 | 1.2 | 8.4 | |||||||||||||||||||||||||||||||||||||
|
|
|
|
|
|
|
|
|
|
|
|
|
|
|
|
|
|
|
|
|
|
|
| |||||||||||||||||||||||||
All other countries: | ||||||||||||||||||||||||||||||||||||||||||||||||
UK | 1.3 | 0.6 | 158.9 | 26.0 | 186.8 | 9.9 | 4.4 | 8.6 | 22.9 | 209.7 | 31.9 | 241.6 | ||||||||||||||||||||||||||||||||||||
US | 0.6 | — | — | 0.1 | 0.7 | 9.5 | 1.0 | — | 10.5 | 11.2 | 0.1 | 11.3 | ||||||||||||||||||||||||||||||||||||
Japan | — | — | — | — | — | 0.1 | 0.1 | 1.1 | 1.3 | 1.3 | — | 1.3 | ||||||||||||||||||||||||||||||||||||
Switzerland | — | — | — | 0.3 | 0.3 | 0.5 | — | — | 0.5 | 0.8 | — | 0.8 | ||||||||||||||||||||||||||||||||||||
Denmark | — | — | — | — | — | 0.2 | — | — | 0.2 | 0.2 | 0.3 | 0.5 | ||||||||||||||||||||||||||||||||||||
Russia | — | 0.2 | — | — | 0.2 | — | — | — | — | 0.2 | — | 0.2 | ||||||||||||||||||||||||||||||||||||
Other | 0.1 | 0.1 | — | 2.3 | 2.5 | 1.3 | 0.1 | 0.2 | 1.6 | 4.1 | 1.2 | 5.3 | ||||||||||||||||||||||||||||||||||||
|
|
|
|
|
|
|
|
|
|
|
|
|
|
|
|
|
|
|
|
|
|
|
| |||||||||||||||||||||||||
| 2.0 | 0.9 | 158.9 | 28.7 | 190.5 | 21.5 | 5.6 | 9.9 | 37.0 | 227.5 | 33.5 | 261.0 | |||||||||||||||||||||||||||||||||||||
|
|
|
|
|
|
|
|
|
|
|
|
|
|
|
|
|
|
|
|
|
|
|
| |||||||||||||||||||||||||
| (1) | Excluding Banco Santander and other Banco Santander group companies. |
| (2) | The assets held at fair value were presented as either trading assets or designated as held at fair value through profit or loss. Santander UK did not hold any significant available-for-sale securities, with the exception of government debt held for liquidity purposes, as described on the previous page. |
| (3) | Of which £19.0bn (2014: £18.0bn) is presented in Retail Banking and the remainder is presented in Commercial Banking and Corporate & Institutional Banking. |
Commitments and undrawn facilities principally consist of formal standby facilities and credit lines in Santander UK’s Retail Banking and Commercial Banking operations. Within Retail Banking, these represent credit cards, mortgage and overdraft facilities. Within Commercial Banking and Corporate & Institutional Banking, these represent standby loan facilities. A summary of the key terms of formal standby facilities, credit lines and other commitments are set out in Note 37 to the Consolidated Financial Statements in the 2014 Annual Report.
| 78 | Santander UK plc |
Table of Contents
Risk governance | Top and emerging risks | Credit risk | Market risk | Balance sheet management risk | Other important risks | Areas of focus and other items | ||||||
|
Peripheral eurozone countries
This section discusses Santander UK’s direct exposure to peripheral eurozone countries at 30 June 2015 and 31 December 2014 by type of financial instrument.It excludes balances with other Banco Santander group companies which are presented separately below.
This section also discusses our indirect exposures to peripheral eurozone countries.
Direct and indirect risk exposures to peripheral eurozone countries arise primarily in the large corporate element of the portfolio via large multinational companies and financial institutions, which are monitored on a regular basis by the Wholesale Credit Risk Department as part of the overall risk management process. The corporate portfolio is mainly comprised of multinational UK companies which are considered to be geographically well diversified in terms of their assets, operations and profits. The remainder of the Commercial Banking portfolio is predominantly UK-based with no material peripheral eurozone exposure. In addition, the risk is further mitigated by the fact that credit agreements are underpinned by both financial and non-financial covenants.
The risk arising from indirect exposures from our transactions with financial institutions is mitigated by the short-term tenor of the transactions, and by the fact that many such transactions contain margin calls and/or collateral requirements, and are subject to standard ISDA Master Agreements permitting offsetting.
The risk arising from indirect exposures from our transactions with other corporates is mitigated by standard financial and non-financial guarantees and the fact that the companies are geographically well diversified in terms of their assets, operations and profits.
Direct exposures to peripheral eurozone countries
Balances with respect to Italy at 30 June 2015 comprised trading assets issued by central and local governments of £0.5bn (2014: £0.9bn), commitments and undrawn facilities with corporate customers of £0.1bn (2014: £0.2bn), and derivative assets issued by banks of £0.1bn (2014: £0.1bn).
Balances with respect to Spain at 30 June 2015 comprised derivative assets issued by banks of £0.1bn (2014: £0.2bn), commitments and undrawn facilities with banks of £0.1bn (2014: £0.1bn), and commitments and undrawn facilities with corporate customers of £0.1bn (2014: £0.1bn).
Balances with respect to Ireland at 30 June 2015 comprised loans and advances to corporate customers of £0.2bn (2014: £0.1bn), assets held at fair value with corporate customers of £0.1bn (2014: £0.1bn), commitments and undrawn facilities with corporate customers of £0.2bn (2014: £0.1bn), and commitments and undrawn facilities with other financial institutions of £0.1bn (2014: £nil)
Indirect exposures to peripheral eurozone countries
Indirect exposures to peripheral eurozone countries are considered to exist where our direct counterparties outside the peripheral eurozone countries themselves have a direct exposure to one or more peripheral eurozone countries. Indirect exposures are identified as part of our ongoing credit analysis and monitoring of our counterparty base by the review of available financial information to determine the countries where the material parts of a counterparty’s assets, operations or profits arise.
Our indirect exposures to peripheral eurozone countries consist of a small number of corporate loans to large multinational companies based in the UK that derive a proportion of their profits from one or more peripheral eurozone countries; trading transactions and hedging transactions with financial institutions based in the UK and Europe that derive a proportion of their profits from or have a proportion of their assets in one or more peripheral eurozone countries; and a small number of loans to other corporate entities which have either a proportion of their operations within, or profits from, one or more peripheral eurozone countries. We have no significant indirect exposure to peripheral eurozone countries in our retail business.
| 2015 Half Yearly Financial Report | 79 |
Table of Contents
Risk review
Areas of focus and other items
continued
Balances with other Banco Santander group companies
Santander UK enters into transactions with other Banco Santander group companies in the ordinary course of business. Such transactions are undertaken in areas of business where Santander UK has a particular advantage or expertise and where other Banco Santander group companies can offer commercial opportunities, substantially on the same terms as for comparable transactions with third-party counterparties. These transactions also arise in support of the activities of, or with, larger multinational corporate clients and financial institutions which may have relationships with a number of entities in the Banco Santander group. These activities are conducted in a manner that appropriately manages the credit risk arising against such other Banco Santander group companies within limits acceptable to the PRA. At 30 June 2015 and 31 December 2014, Santander UK had gross balances with other Banco Santander group companies as follows:
| Banks £bn | Other financial institutions £bn | Corporate £bn | Total £bn | |||||||||||||
30 June 2015 | ||||||||||||||||
Assets: | ||||||||||||||||
- Spain | 2.0 | 0.1 | — | 2.1 | ||||||||||||
- UK | — | 1.0 | — | 1.0 | ||||||||||||
- Chile | 0.2 | — | — | 0.2 | ||||||||||||
- Norway | 0.1 | — | — | 0.1 | ||||||||||||
- Ireland | 0.1 | — | — | 0.1 | ||||||||||||
- Other <£100m | 0.1 | — | — | 0.1 | ||||||||||||
|
|
|
|
|
|
|
| |||||||||
| 2.5 | 1.1 | — | 3.6 | |||||||||||||
|
|
|
|
|
|
|
| |||||||||
Liabilities: | ||||||||||||||||
- Spain | (4.8 | ) | (0.4 | ) | (0.1 | ) | (5.3 | ) | ||||||||
- UK | — | (0.1 | ) | (0.1 | ) | (0.2 | ) | |||||||||
- Chile | (0.2 | ) | — | — | (0.2 | ) | ||||||||||
- Ireland | (0.1 | ) | — | — | (0.1 | ) | ||||||||||
- Belgium | (0.1 | ) | — | — | (0.1 | ) | ||||||||||
- Norway | (0.1 | ) | — | — | (0.1 | ) | ||||||||||
- Italy | — | — | — | — | ||||||||||||
- Germany | — | — | — | — | ||||||||||||
- Uruguay | — | — | — | — | ||||||||||||
- Other < £100m | (0.2 | ) | (0.2 | ) | — | (0.4 | ) | |||||||||
|
|
|
|
|
|
|
| |||||||||
| (5.5 | ) | (0.7 | ) | (0.2 | ) | (6.4 | ) | |||||||||
|
|
|
|
|
|
|
| |||||||||
31 December 2014 | ||||||||||||||||
Assets: | ||||||||||||||||
- Spain | 2.1 | 0.1 | — | 2.2 | ||||||||||||
- UK | — | 0.8 | — | 0.8 | ||||||||||||
- Chile | 0.2 | — | — | 0.2 | ||||||||||||
- Norway | 0.1 | — | — | 0.1 | ||||||||||||
- Ireland | 0.1 | — | — | 0.1 | ||||||||||||
- Other <£100m | 0.1 | — | — | 0.1 | ||||||||||||
|
|
|
|
|
|
|
| |||||||||
| 2.6 | 0.9 | — | 3.5 | |||||||||||||
|
|
|
|
|
|
|
| |||||||||
Liabilities: | ||||||||||||||||
- Spain | (5.1 | ) | (0.5 | ) | (0.1 | ) | (5.7 | ) | ||||||||
- UK | — | (0.4 | ) | — | (0.4 | ) | ||||||||||
- Chile | (0.2 | ) | — | — | (0.2 | ) | ||||||||||
- Ireland | (0.1 | ) | — | — | (0.1 | ) | ||||||||||
- Belgium | (0.2 | ) | — | — | (0.2 | ) | ||||||||||
- Norway | (0.1 | ) | — | — | (0.1 | ) | ||||||||||
- Italy | (0.1 | ) | — | — | (0.1 | ) | ||||||||||
- Germany | — | (0.1 | ) | — | (0.1 | ) | ||||||||||
- Uruguay | (0.1 | ) | — | — | (0.1 | ) | ||||||||||
- Other < £100m | (0.1 | ) | (0.2 | ) | — | (0.3 | ) | |||||||||
|
|
|
|
|
|
|
| |||||||||
| (6.0 | ) | (1.2 | ) | (0.1 | ) | (7.3 | ) | |||||||||
|
|
|
|
|
|
|
| |||||||||
| 80 | Santander UK plc |
Table of Contents
Risk governance | Top and emerging risks | Credit risk | Market risk | Balance sheet management risk | Other important risks | Areas of focus and other items | ||||||
|
30 June 2015 compared to 31 December 2014
The above balances with other Banco Santander group companies at 30 June 2015 principally consisted of:
| • | Derivative assets of £2,369m (2014: £2,538m) subject to ISDA Master Agreements including the Credit Support Annex. These balances were offset by derivative liabilities of £2,412m (2014: £2,214m) and cash collateral received, as described below, and are included in Note 10. |
| • | Cash collateral of £148m (2014: £121m) given in relation to derivatives futures contracts. The cash collateral was classified as ‘Trading assets’ in the balance sheet. This was more than offset by cash collateral received in relation to other derivatives of £1,089m (2014: £1,460m), classified as ‘Trading liabilities’ and ‘Deposits by banks’. See Notes 9, 20 and 19. |
| • | Asset-backed securities of £6m and £45m (2014: £7m and £54m), which were classified as ‘Loans and receivables securities’ and ‘Financial assets designated at fair value’, respectively, in the balance sheet. See Note 11. |
| • | Deposits by customers of £613m (2014: £867m) and other liabilities of £445m (2014: £300m). |
| • | Debt securities in issue of £198m (2014: £349m). These balances represent holdings of debt securities by the wider Banco Santander group as a result of market purchases and for liability management purposes. The decrease in the first half of the year reflected contractual maturities. See Note 22. |
| • | Subordinated liabilities of £1,322m (2014: £1,867m) reflecting holdings of debt securities by the wider Banco Santander group as a result of market purchases and for liability management purposes. |
| • | Financial liabilities designed at fair value of £21m (2014: £96m). See Note 21. |
Redenomination risk
Santander UK considers the total dissolution of the eurozone to be extremely unlikely and therefore believes widespread redenomination of its euro-denominated assets and liabilities to be highly improbable, despite recent focus on Greece’s membership of the eurozone. However, for contingency planning purposes Santander UK has analysed the redenomination risk that might arise from an exit of a member state from the euro or a total dissolution of the euro and how that exit or dissolution would be implemented. It is not possible to predict what the total financial impact on Santander UK might be of a eurozone member state exit or the dissolution of the euro.
The determination of which assets and liabilities would be legally redenominated is complex and depends on a number of factors, including the precise exit scenario, as the consequences on external contracts of a disorderly exit or one sanctioned under EU law may be different. Santander UK has already identified and is monitoring these risks and has taken steps to mitigate them and/or reduce Santander UK’s overall exposure to losses that might arise in the event of a redenomination by reducing its balances and funding mismatches. As part of its objective of maintaining a diversified funding base, Santander UK raises funding in a number of currencies, including euro, and converts these back into sterling via currency swaps to fund its commercial assets which are largely sterling denominated.
Santander UK’s net asset position denominated in euro, reflecting assets and liabilities and associated swaps (which primarily comprise cross-currency derivatives entered into to swap funding raised in euro back into sterling for reasons set out above) arising in connection with contracts denominated in euro, amounted to net assets of £0.1bn at 30 June 2015 (2014: net assets of £0.7bn). This comprised debt securities (covered bonds and securitisations) of £19.3bn (2014: £20.0bn) issued by Santander UK as part of its MTF activities, medium-term repo liabilities of £0.8bn (2014: £0.8bn), other deposit liabilities of £3.6bn (2014: £1.9bn), other deposits of £1.0bn (2014: £1.7bn) by Banco Santander group companies, other loans and securities of £5.0bn (2014: £4.6bn), net trading repo liabilities of £2.7bn (2014: liabilities of £2.8bn) and related cross-currency swap assets of £22.5bn (2014: £23.3bn) which swap the resultant euro exposures back into sterling in order to ensure that assets and liabilities are currency matched in sterling.
Disclosures of Santander UK’s exposure to individual eurozone countries and total exposures to counterparties in those countries, including any euro-denominated contracts, are set out earlier in this section of the Risk review.
| 2015 Half Yearly Financial Report | 81 |
Table of Contents
Governance
83 |
| 82 | Santander UK plc |
Table of Contents
| Directors | ||||||||||
| ||||||||||
The Directors of Santander UK plc are listed in the 2014 Annual Report. In addition to those listed, on 30 March 2015, Lord Burns stepped down from the Board and Shriti Vadera succeeded him as Non-Executive Chair. Chris Jones was appointed as an Independent Non-Executive Director on 30 March 2015, and succeeded Rosemary Thorne as Non-Executive Chair of Board Audit Committee on 30 June 2015. Rosemary Thorne also stepped down from the Board on this date. Genevieve Shore was appointed as a Non-Executive Director on 18 May 2015. Chris Jones’ and Genevieve Shore’s biographical details are shown below. In addition, José María Carballo resigned as a Non-Executive Director with effect from 30 March 2015. Current Board Director Scott Wheway was appointed as the Senior Independent Director on 18 May 2015. On 27 July 2015, the Board approved a change of name of the Board Remuneration Oversight Committee to the Board Remuneration Committee. Stephen Jones will be stepping down as Director and Chief Financial Officer on 30 October 2015.
Non-Executive Directors
Chris Jones
Appointed Independent Non-Executive Director on 30 March 2015
Chris Jones has significant experience in financial services, being former leader of the PricewaterhouseCoopers Financial Services practice, EMEA, specialising in the audit of banks and other financial institutions since the mid 1980s. He is currently a Non-Executive Director of Redburn (Europe) Limited, an FCA-regulated company, their Audit and Risk Committee chair and a member of their Remuneration Committee.
Genevieve Shore
Appointed Non-Executive Director on 18 May 2015
Genevieve Shore is currently a Non-Executive Director of Moneysupermarket.com Group plc, Scottish Television (STV Group plc) and Next Fifteen Communications Group plc bringing technology and digital media expertise to their respective Boards. She currently chairs the Remuneration Committees of Next Fifteen Communications Group plc and STV Group plc, together with being a member of the STV Group plc Board Nominations Committee. She is also a member of the Board Audit and Nomination Committees of Next Fifteen Communications Group plc as well as a member of the Board Audit, Risk, Remuneration and Nominations Committees of Moneysupermarket.com Group plc.
| 2015 Half Yearly Financial Report | 83 |
Table of Contents
This page intentionally left blank
| 84 | Santander UK plc |
Table of Contents
Income statement review | Balance sheet review | Cash flows | ||
|
86 | Income statement review | |
86 | ||
87 | ||
88 | ||
91 | ||
93 | ||
95 | ||
96 | ||
96 | ||
98 | ||
99 | ||
100 |
| 2015 Half Yearly Financial Report | 85 |
Table of Contents
Financial review
SUMMARISED CONSOLIDATED INCOME STATEMENT
| Six months ended 30 June 2015 £m | Six months ended 30 June 2014 £m | |||||||
Net interest income | 1,783 | 1,673 | ||||||
Non-interest income (1) | 500 | 519 | ||||||
|
|
|
| |||||
Total operating income | 2,283 | 2,192 | ||||||
|
|
|
| |||||
Administrative expenses | (1,064 | ) | (876 | ) | ||||
Depreciation, amortisation and impairment | (136 | ) | (347 | ) | ||||
|
|
|
| |||||
Total operating expenses excluding impairment losses, provisions and charges | (1,200 | ) | (1,223 | ) | ||||
|
|
|
| |||||
Impairment losses on loans and advances | (57 | ) | (172 | ) | ||||
Provisions for other liabilities and charges | (97 | ) | (252 | ) | ||||
|
|
|
| |||||
Total operating impairment losses, provisions and charges | (154 | ) | (424 | ) | ||||
|
|
|
| |||||
Profit before tax | 929 | 545 | ||||||
Tax on profit | (195 | ) | (107 | ) | ||||
|
|
|
| |||||
Profit after tax for the period | 734 | 438 | ||||||
|
|
|
| |||||
Attributable to: | ||||||||
Equity holders of the parent | 722 | 438 | ||||||
Non-controlling interest | 12 | — | ||||||
|
|
|
| |||||
| (1) | Comprise of Net fee and commission income and Net trading and other income |
Six months ended 30 June 2015 compared to six months ended 30 June 2014
Profit before tax increased by £384m to £929m in the first half of 2015 (2014: £545m). By income statement line, the movements were:
| • | Net interest income increased by £110m to £1,783m in the first half of 2015 (2014: £1,673m), driven by margin and volume improvements in the retail and corporate portfolios, management focus on reducing the cost of retail liabilities, and increased income following the commencement of the PSA cooperation in February 2015. |
These increases were partly offset by reduced mortgage stock margins and new lending margin pressures, reflecting the lower customer rates available on incentive products as the current environment for mortgage lending led to increased activity. We have been successful in the retention of customers with maturing products on Santander UK mortgages.
| • | Non-interest income decreased by £19m to £500m in the first half of 2015 (2014: £519m), with lower net banking fee income, higher cashback on 1I2I3 World products and reduced overdraft fees in Retail Banking. This was partially offset by higher banking fee and international payments income in Commercial Banking as well as increased revenues from our client derivative and cash sales activities, partially offset by lower demand in some market-making activities in Corporate & Institutional Banking. |
| • | Administrative expenses increased by £188m to £1,064m in the first half of 2015 (2014: £876m) principally due to a net gain of £218m which arose in 2014 as a result of scheme changes that limit future defined benefit pension entitlements and provide for the longer term sustainability of our staff pension arrangement which was partially offset by additional project costs of £98m, including those relating to our investment programme, which were borne centrally. In 2015, the increase was due to the investment in the growth of the business, including growth of the business serving SME and Corporate customers, regulatory compliance costs, increased consumer finance costs as a result of the commencement of the PSA cooperation and increase in employment costs, partially offset by strong cost management discipline and by multi-branch consolidation efficiencies. |
| • | Depreciation, amortisation and impairment costs decreased by £211m to £136m in the first half of 2015 (2014: £347m). In 2014, the charge was principally due to software write-offs of £206m for the decommissioning of redundant systems following the implementation of our new digital platform and the completion of our product simplification programme. |
The remaining decrease in the first half of 2015 was principally due to fully depreciated IT software partially offset by further investment in business growth, including new branch systems and enhancements to our digital channels.
| • | Impairment losses on loans and advances decreased by £115m to £57m in the first half of 2015 (2014: £172m). The decrease in Retail Banking was largely due to lower mortgage impairment losses as a result of improving economic conditions and provision releases in Corporate & Institutional Banking and Corporate Centre. |
| • | Provisions for other liabilities and charges decreased by £155m to £97m in the first half of 2015 (2014: £252m). This was predominantly due to a decrease in branch de-duplication and conduct charges. |
The provision for PPI redress and related costs amounted to £73m at 30 June 2015. In 2014, a further provision of £70m including related costs, was taken for conduct remediation. Of this, £65m related to PPI which arose as a result of a review of claims activity which indicated that claims were expected to continue for longer than originally anticipated. Monthly PPI redress costs including pro-active customer contact decreased to a monthly average of £9m for the period, compared to a monthly average of £11m in 2014. Excluding pro-active customer contact, the average redress costs in the six months ended 30 June 2015 were £6m per month (2014: £6m). The high proportion of invalid complaints continued. There was a net £5m charge to other products relating to existing remediation activities and new provisions which relate principally to wealth and investment products. Non-PPI related conduct provisions amounted to £159m at 30 June 2015.
Regulatory costs relating to the FSCS of £74m (2014: £100m) were charged in the period.
| • | The taxation charge increased due to higher profits, offset in part by the reduction in the main corporation tax rate. The effective tax rate for 2015, based on profit before tax was 21.0% (2014: 19.6%). See Note 7 to the Condensed Consolidated Interim Financial Statements. |
| 86 | Santander UK plc |
Table of Contents
Income statement review | Balance sheet review | Cash flows | ||
|
Critical factors affecting results
The preparation of our Condensed Consolidated Interim Financial Statements requires management to make estimates and judgements that affect the reported amount of assets and liabilities at the balance sheet date and the reported amount of income and expenses during the reporting period. Management evaluates its estimates and judgements on an ongoing basis. Management bases its estimates and judgements on historical experience and other factors believed to be reasonable under the circumstances. Actual results may differ from these estimates under different assumptions or conditions. Estimates and judgements that are considered important to the portrayal of our financial condition including, where applicable, quantification of the effects of reasonably possible ranges of such estimates are set out in ‘Critical Accounting Policies and Areas of Significant Management Judgement’ in Note 1 to the Consolidated Financial Statements in the 2014 Annual Report.
The rest of this section contains a summary of the results, and commentary thereon, by income statement line item for each segment.
Basis of results presentation
The segmental information in this Half Yearly Financial Report reflects the reporting structure in place at the reporting date in accordance with which the segmental information in Note 2 to the Condensed Consolidated Interim Financial Statements has been presented. The Company’s board of directors (the ‘Board’) is the chief operating decision maker for Santander UK. The segmental information below is presented on the basis used by the Board to evaluate performance and allocate resources. The Board reviews discrete financial information for each segment of the business which follows Santander UK’s normal accounting policies and principles, including measures of operating results, assets and liabilities. As described in Note 2 to the Condensed Consolidated Interim Financial Statements, following a strategic review, the segmental financial information reported to the Board was revised in the fourth quarter of 2014, to designate three distinct customer business segments, which reflect how we now manage and operate the bank: Retail Banking, Commercial Banking and Corporate & Institutional Banking; and allocate indirect income, expenses and charges previously held at the Corporate Centre, which can be attributed to the three customer segments. This included a review of the internal transfer pricing policy, which resulted in a further allocation of funding and liquidity costs, central operating expenses and other provisions such as conduct, branch de-duplication, the UK Bank Levy and FSCS charges.
With the allocation of indirect income, expenses and charges from the Corporate Centre and with the three distinct customer business segments at differing stages of commercial maturity, we are now able to identify better and drive with greater granularity the key drivers of our business performance. This enables a more targeted apportionment of capital and other resources in line with the individual strategies and objectives of each business segment. The segmental analyses for prior periods presented in these Condensed Consolidated Interim Financial Statements have been adjusted to reflect these changes.
Retail Banking business activities remain broadly unchanged, offering a wide range of products and financial services to individuals and small businesses (with less than two directors, owners or partners). Commercial Banking provides banking services to companies with a turnover of between £250,000 and £500m per annum through our enhanced platform, distribution capability and product suite. Large corporates, with an annual turnover above £500m, are now managed in our Corporate & Institutional Banking segment, where they can be best serviced in terms of their more specialised and tailored product needs, and benefit from the Banco Santander group’s global capability. Corporate Centre now predominantly consists of the non-core corporate and legacy portfolios, mark-to-market gains/losses arising from banking book activities and residual term mismatches.
30 June 2015 | Retail Banking £m | Commercial Banking £m | Corporate & Institutional Banking £m | Corporate Centre £m | Total £m | |||||||||||||||
Net interest income/(expense) | 1,588 | 221 | 39 | (65 | ) | 1,783 | ||||||||||||||
Non-interest income(1) | 264 | 72 | 151 | 13 | 500 | |||||||||||||||
|
|
|
|
|
|
|
|
|
| |||||||||||
Total operating income/(expense) | 1,852 | 293 | 190 | (52 | ) | 2,283 | ||||||||||||||
|
|
|
|
|
|
|
|
|
| |||||||||||
Administration expenses | (792 | ) | (149 | ) | (123 | ) | — | (1,064 | ) | |||||||||||
Depreciation, amortisation and impairment | (98 | ) | (30 | ) | (8 | ) | — | (136 | ) | |||||||||||
|
|
|
|
|
|
|
|
|
| |||||||||||
Total operating expenses excluding impairment losses, provisions and charges | (890 | ) | (179 | ) | (131 | ) | — | (1,200 | ) | |||||||||||
|
|
|
|
|
|
|
|
|
| |||||||||||
Impairment (losses)/releases on loans and advances | (85 | ) | (20 | ) | 21 | 27 | (57 | ) | ||||||||||||
Provisions for other liabilities and charges | (95 | ) | (2 | ) | — | — | (97 | ) | ||||||||||||
|
|
|
|
|
|
|
|
|
| |||||||||||
Total operating impairment (losses)/releases, provisions and charges | (180 | ) | (22 | ) | 21 | 27 | (154 | ) | ||||||||||||
|
|
|
|
|
|
|
|
|
| |||||||||||
Profit/(loss) before tax | 782 | 92 | 80 | (25 | ) | 929 | ||||||||||||||
|
|
|
|
|
|
|
|
|
| |||||||||||
30 June 2014 | ||||||||||||||||||||
Net interest income/(expense) | 1,486 | 173 | 38 | (24 | ) | 1,673 | ||||||||||||||
Non-interest income(1) | 282 | 55 | 144 | 38 | 519 | |||||||||||||||
|
|
|
|
|
|
|
|
|
| |||||||||||
Total operating income | 1,768 | 228 | 182 | 14 | 2,192 | |||||||||||||||
|
|
|
|
|
|
|
|
|
| |||||||||||
Administration expenses | (752 | ) | (131 | ) | (112 | ) | 119 | (876 | ) | |||||||||||
Depreciation, amortisation and impairment | (112 | ) | (28 | ) | (1 | ) | (206 | ) | (347 | ) | ||||||||||
|
|
|
|
|
|
|
|
|
| |||||||||||
Total operating expenses excluding impairment losses, provisions and charges | (864 | ) | (159 | ) | (113 | ) | (87 | ) | (1,223 | ) | ||||||||||
|
|
|
|
|
|
|
|
|
| |||||||||||
Impairment losses on loans and advances | (107 | ) | (54 | ) | (2 | ) | (9 | ) | (172 | ) | ||||||||||
Provisions for other liabilities and charges | (257 | ) | 5 | — | — | (252 | ) | |||||||||||||
|
|
|
|
|
|
|
|
|
| |||||||||||
Total operating impairment losses, provisions and charges | (364 | ) | (49 | ) | (2 | ) | (9 | ) | (424 | ) | ||||||||||
|
|
|
|
|
|
|
|
|
| |||||||||||
Profit/(loss) before tax | 540 | 20 | 67 | (82 | ) | 545 | ||||||||||||||
|
|
|
|
|
|
|
|
|
| |||||||||||
| (1) | Comprise of Net fee and commission income and Net trading and other income |
| 2015 Half Yearly Financial Report | 87 |
Table of Contents
Financial review
Retail Banking offers a wide range of products and financial services to individuals and small businesses (with less than two directors, owners or partners), through a network of branches and ATMs, as well as through telephony, digital, mobile and intermediary channels. Retail Banking also includes Santander Consumer Finance, predominantly a vehicle finance business. Its main products are residential mortgage loans, savings and current accounts, credit cards and personal loans as well as insurance policies.
Summarised income statement
| Six months ended 30 June 2015 £m | Six months ended 30 June 2014 £m | |||||||
Net interest income | 1,588 | 1,486 | ||||||
Non-interest income | 264 | 282 | ||||||
|
|
|
| |||||
Total operating income | 1,852 | 1,768 | ||||||
|
|
|
| |||||
Administration expenses | (792 | ) | (752 | ) | ||||
Depreciation, amortisation and impairment | (98 | ) | (112 | ) | ||||
|
|
|
| |||||
Total operating expenses excluding impairment losses, provisions and charges | (890 | ) | (864 | ) | ||||
|
|
|
| |||||
Impairment losses on loans and advances | (85 | ) | (107 | ) | ||||
Provisions for other liabilities and charges | (95 | ) | (257 | ) | ||||
|
|
|
| |||||
Total operating impairment losses, provisions and charges | (180 | ) | (364 | ) | ||||
|
|
|
| |||||
Profit before tax | 782 | 540 | ||||||
|
|
|
| |||||
Six months ended 30 June 2015 compared to 30 June 2014
Profit before tax increased by £242m to £782m in the first half of 2015 (2014: £540m). By income statement line, the movements were:
| • | Net interest income increased by £102m to £1,588m in the first half of 2015 (2014: £1,486m), driven by increased lending, management focus on reducing the cost of retail liabilities, and increased income following the commencement of the PSA cooperation in February 2015. |
These increases were partly offset by reduced mortgage stock margins and new lending margin pressures, reflecting the lower customer rates available on incentive products as the current environment for mortgage lending led to increased activity.
| • | Non-interest income decreased by £18m to £264m in the first half of 2015 (2014: £282m). The decrease reflected lower net banking fee income, higher cashback on 1I2I3 World products and reduced overdraft fees. |
| • | Administration expenses increased by £40m to £792m in the first half of 2015 (2014: £752m). The increase was driven by investment in the growth of the business, regulatory compliance costs and increased consumer finance costs as a result of the commencement of the PSA cooperation, partially offset by the strong cost management discipline and by multi-branch consolidation efficiencies. |
| • | Depreciation, amortisation and impairment expenses decreased by £14m to £98m in the first half of 2015 (2014: £112m). The decrease was principally due to fully depreciated IT software partially offset by further investment in business growth, including new branch systems and enhancements to our digital channels. |
| • | Impairment losses on loans and advances decreased by £22m to £85m in the first half of 2015 (2014: £107m). This was largely driven by lower mortgage impairment losses as a result of improving economic environment. |
| • | Provisions for other liabilities and charges decreased by £162m to £95m in the first half of 2015 (2014: £257m). This was predominantly due to a decrease in branch de-duplication and conduct charges. |
The provision for PPI redress and related costs amounted to £73m at 30 June 2015. In 2014, a further provision of £70m including related costs, was taken for conduct remediation, of this, £65m related to PPI which arose as a result of a review of claims activity which indicated that claims were expected to continue for longer than originally anticipated. Monthly PPI redress costs including pro-active customer contact decreased to a monthly average of £9m for the period, compared to a monthly average of £11m in 2014. Excluding pro-active customer contact, the average redress costs in the six months ended 30 June 2015 were £6m per month (2014: £6m). The high proportion of invalid complaints continued. There was a net £5m charge to other products relating to existing remediation activities and new provisions which relate principally to wealth and investment products. Non-PPI related conduct provisions amounted to £159m at 30 June 2015.
Regulatory costs relating to the FSCS of £73m (2014: £98m) were charged in the period.
| 88 | Santander UK plc |
Table of Contents
Income statement review | Balance sheet review | Cash flows | ||
|
Balances and ratios
| 30 June 2015 £bn | 31 December 2014 £bn | |||||||
Total assets | 167.4 | 163.4 | ||||||
Customer loans | 162.6 | 158.5 | ||||||
- of which mortgages | 150.7 | 150.1 | ||||||
- of which other unsecured consumer finance - of which vehicle consumer finance |
| 5.7 6.2 |
|
| 5.1 3.3 |
| ||
Risk-weighted assets | 42.2 | 38.4 | ||||||
Customer deposits | 134.1 | 129.6 | ||||||
- of which current accounts | 47.7 | 41.1 | ||||||
NPL ratio(1) (2) | 1.53 | % | 1.62 | % | ||||
Coverage ratio(1) (3) | 35 | % | 34 | % | ||||
Mortgage NPL ratio(1)(4) | 1.57 | % | 1.64 | % | ||||
Mortgage coverage ratio(1)(5) | 23 | % | 24 | % | ||||
| (1) | The balances include interest charged to the customer’s account, but exclude interest accrued but not yet charged to the account. |
| (2) | NPLs as a percentage of customer loans. |
| (3) | Impairment loss allowance as a percentage of NPLs. |
| (4) | Mortgage NPLs as a percentage of mortgage assets. |
| (5) | Mortgage impairment loss allowance as a percentage of mortgage NPLs. |
30 June 2015 compared to 31 December 2014
| • | Total assets increased to £167.4bn at 30 June 2015 (2014: £163.4bn), mainly due to the rise in customer loans described below. |
| • | Customer loans increased to £162.6bn at 30 June 2015 (2014: £158.5bn). Mortgage customer loans increased by £0.6bn driven by strong approval volumes and mortgage retention rate with 70,200 (approximately 80%) of customers with maturing products on Santander UK mortgages. We have refined our buy-to-let proposition to appeal to a wider catchment, and are growing our lending with a particular focus on non-professional landlords with small portfolios. We have also increased our support for the new build market, leveraging our relationships with brokers, through intermediaries, and developers, through our Commercial Banking business. |
SVR mortgage loan balances decreased by £3.9bn at 30 June 2015 to £40.0bn. Interest-only mortgage balances decreased to £55.6bn (2014: £56.9bn) while Buy-to-Let mortgages increased to £3.8bn (2014: £3.1bn).
Unsecured consumer finance balances, which include bank overdrafts, unsecured personal loans, and credit cards increased 12%. This was in line with our 1I2I3 World loyalty strategy.
Vehicle consumer finance balances increased 88% to £6.2bn, as we continued to strengthen our broad and well diversified vehicle finance franchise through the PSA cooperation commenced earlier in the period.
| • | Risk-weighted assets increased by 9.9% to £42.2bn at 30 June 2015 (2014: £38.4bn), reflecting growth in both mortgages and the commencement of the PSA cooperation. |
| • | Customer deposits increased 3.5% to £134.1bn at 30 June 2015 (2014: £129.6bn) as current account balances continued to grow strongly, increasing by £6.6bn to £47.7bn. The 1I2I3 Current Account remains central to our retail customer relationship model and was the main driver of a net inflow of £6.6bn in current account balances over the last six months. This was partially offset by lower demand for savings products. Annualised Retail Banking deposit spread improved to 0.64% in the first half of 2015 (2014: 0.76%), mainly due to maturing higher cost ISAs and originating new lower cost Fixed Term Bonds. |
| • | The NPL ratio decreased to 1.53% at 30 June 2015 (2014: 1.62%), as a result of lower mortgages non-performance and overall growth in retail assets. |
| • | The mortgage NPL ratio decreased to 1.57% at 30 June 2015 (2014: 1.64%), which reflected the good credit quality of the portfolio and a growing mortgage book, supported low interest rates, rising house prices and falling unemployment. We are conscious that these conditions may not continue and our provisions reflect our conservative position on the UK economy and the housing market, notwithstanding current trends. |
| • | The mortgage NPL coverage ratio decreased to 23% at 30 June 2015 (2014: 24%) mainly due to the factors described above in the decrease of the mortgage NPL ratio. |
| 2015 Half Yearly Financial Report | 89 |
Table of Contents
Financial review
Business volumes
| 30 June 2015 £bn | 30 June 2014 £bn | |||||||
Mortgage gross lending | 11.9 | 12.8 | ||||||
Mortgage net lending | 0.6 | 0.6 | ||||||
Unsecured Personal Loans (‘UPL’) gross lending | 0.7 | 0.8 | ||||||
UPL net lending | 0.1 | 0.2 | ||||||
Vehicle consumer finance gross lending | 1.5 | 0.8 | ||||||
Vehicle consumer finance net lending | 0.4 | 0.1 | ||||||
Customer deposit flows | 4.5 | 3.7 | ||||||
30 June 2015 compared to 30 June 2014
| • | Mortgage gross lending decreased slightly to £11.9bn in the first half of 2015 (2014: £12.8bn), with applications down 2%. We maintained our prudent lending criteria with an average LTV of 65% (2014: 65%) on new lending in 2015, including the effect of higher LTV Help to Buy business. We helped 15,800 first-time buyers (£2.3bn of gross lending) and 2,800 Help to Buy customers (£395m of gross lending) purchase a home. |
| • | UPL gross lending remained broadly flat at £0.7bn in the first half of 2015 (2014: £0.8bn), with overall positive net lending. |
| • | Vehicle consumer finance gross lending increased to £1.5bn in the first half of 2015 (2014: £0.8bn), and net lending increased to £0.4bn (2014: £0.1bn) driven by a 7% increase in new car registrations and an expansion in business streams, including motorbikes and leisure vehicles. Excluding the PSA cooperation, gross lending was £0.9bn and net lending was £0.1bn at 30 June 2015. |
| • | Customer deposit flows increased to £4.5bn in the first half of 2015 (2014: £3.7bn), as we focused on retaining and originating accounts held by more loyal customers. |
| 90 | Santander UK plc |
Table of Contents
Income statement review | Balance sheet review | Cash flows | ||
|
Commercial Banking offers a wide range of products and financial services to customers through a network of regional Corporate Business Centres (‘CBCs’) and through telephony and digital channels. The management of our customers is organised according to the annual turnover £250,000 to £50m for SMEs, and £50m to £500m for mid corporates, enabling us to offer a differentiated service to SMEs and mid corporate customers. Commercial Banking also includes specialist commercial real estate and Social Housing lending businesses.
Summarised income statement
| Six months ended 30 June 2015 £m | Six months ended 30 June 2014 £m | |||||||
Net interest income | 221 | 173 | ||||||
Non-interest income | 72 | 55 | ||||||
|
|
|
| |||||
Total operating income | 293 | 228 | ||||||
|
|
|
| |||||
Administration expenses | (149 | ) | (131 | ) | ||||
Depreciation, amortisation and impairment | (30 | ) | (28 | ) | ||||
|
|
|
| |||||
Total operating expenses excluding impairment losses, provisions and charges | (179 | ) | (159 | ) | ||||
|
|
|
| |||||
Impairment losses on loans and advances | (20 | ) | (54 | ) | ||||
Provisions for other liabilities and charges | (2 | ) | 5 | |||||
|
|
|
| |||||
Total operating impairment losses, provisions and charges | (22 | ) | (49 | ) | ||||
|
|
|
| |||||
Profit before tax | 92 | 20 | ||||||
|
|
|
| |||||
Six months ended 30 June 2015 compared to six months ended 30 June 2014
Profit before tax increased by £72m to £92m in the first half of 2015 (2014: £20m). By income statement line, the movements were:
| • | Net interest income increased by £48m to £221m in the first half of 2015 (2014: £173m), principally as a result of continued growth in customer loans and an improvement in deposit margins through the improved franchise and broader range of services. |
| • | Non-interest income increased by £17m to £72m in the first half of 2015 (2014: £55m) principally due to improved levels of banking fees, international and interest rate management income. |
| • | Administration expenses increased by £18m to £149m in the first half of 2015 (2014: £131m). The increase reflected continued investment in the growth of the businesses serving SME and corporate customers and as we continue to open new CBCs and recruited new relationship managers. |
| • | Depreciation, amortisation and impairment remained broadly stable at £30m in the first half of 2015 (2014: £28m). |
| • | Impairment losses on loans and advances decreased by £34m to £20m in the first half of 2015 (2014: £54m). Credit quality in the loan books continued to be good, supported by the improving economic environment and our cautious lending policy. |
| • | Provisions for other liabilities and charges increased by £7m to £2m in the first half of 2015 (2014: release of £5m). In 2014, there was a modest conduct provision release of £10m. Regulatory costs relating to the FSCS of £1m (2014: £2m) were charged in the period. |
| 2015 Half Yearly Financial Report | 91 |
Table of Contents
Financial review
Balances and ratios
| 30 June 2015 £bn | 31 December 2014 £bn | |||||||
Total assets | 20.0 | 18.7 | ||||||
Customer loans | 20.0 | 18.7 | ||||||
- of which SMEs | 13.1 | 12.6 | ||||||
- of which mid corporate | 6.9 | 6.1 | ||||||
Risk-weighted assets | 19.4 | 19.9 | ||||||
Customer deposits | 16.6 | 15.3 | ||||||
NPL ratio(1) (2) | 3.25 | % | 3.56 | % | ||||
Coverage ratio(1) (3) | 46 | % | 46 | % | ||||
| (1) | The balances include interest charged to the customer’s account, but exclude interest accrued but not yet charged to the account. |
| (2) | NPLs as a percentage of customer loans. |
| (3) | Impairment loss allowance as a percentage of NPLs. |
30 June 2015 compared to 31 December 2014
| • | Total assets increased by 7% to £20.0bn at 30 June 2015 (2014: £18.7bn) driven by the growth in customer loans described below. |
| • | Customer loans increased by 7% to £20.0bn at 30 June 2015 (2014: £18.7bn) maintaining a positive momentum despite an increasingly competitive and still contracting market. This growth was predominantly driven by our network of regional CBCs and our additional relationship managers as we continue to invest in growing our SME business. |
| • | Risk-weighted assets decreased by 3% to £19.4bn at 30 June 2015 (2014: £19.9bn) principally due to improved credit quality and a risk model recalibration partially offset by the growth in customer loans described above. |
| • | Customer deposits increased by 8% to £16.6bn at 30 June 2015 (2014: £15.3bn). We continued to attract deposit balances where we have a strong customer relationship and to build on our new enhanced corporate cash management and deposit capabilities. |
| • | The NPL ratio decreased to 3.25% at 30 June 2015 (2014: 3.56%), largely due to credit quality remaining strong. We continue to adhere to our prudent lending criteria as we expand lending. |
Business volumes
| Six months ended 30 June 2015 | Six months ended 30 June 2014 | |||||||
New facilities | £ | 4.5bn | £ | 3.9bn | ||||
Bank account openings (No.) | 4,020 | 3,500 | ||||||
CBCs (No.) | 68 | 52 | ||||||
Relationship managers (No.) | 729 | 677 | ||||||
Online banking (‘Connect’) active users (No.) | 22,910 | 19,380 | ||||||
Six months ended 30 June 2015 compared to six months ended 30 June 2014
| • | New facilities increased 15% to £4.5bn in the first half of 2015 (2014: £3.9bn) with increases across all portfolios as a result of our expanded network of relationship managers and the improvements made to our franchise. Our pioneering Breakthrough programme continues to support SME growth across the UK. Through the range of services, workshops and masterclass programmes we can offer to businesses, SMEs are provided with the knowledge, connections and finance to grow and succeed. The programme has now supported 52 SMEs with £159m of new Santander debt facilities including £63m of Growth Capital, providing these companies with the opportunity and support to create over 2,540 jobs in the UK economy. As part of the Breakthrough programme, this year we have launched a new £100m scheme targeted at SME housebuilders, to provide much needed support to an area of the market where access to finance is a primary constraint. The flexibility of the arrangements offered, in particular bullet repayment facilities, provide additional benefits to housebuilders at the smaller end of the market. |
| • | Bank account openings showed strong growth, increasing 15% to 4,020 in the first half of 2015 (2014: 3,500) driven by our increased footprint through more CBCs and relationship managers. |
| • | We have in place a new scalable platform and are able to deliver a broader product suite with a wide range of ancillary services and we have extended our footprint and our capacity to service mid corporates and SMEs. |
| • | There was an acceleration in the usage of our new corporate internet banking platform ‘Connect’, which was completed in 2013, with active users increasing 18% in the first six months of 2015 compared to the same period last year. |
| 92 | Santander UK plc |
Table of Contents
Income statement review | Balance sheet review | Cash flows | ||
|
CORPORATE & INSTITUTIONAL BANKING
Corporate & Institutional Banking services corporate clients and financial institutions that, because of their size, complexity or sophistication, require specially-tailored services or value-added wholesale products. It offers risk management and other value-added financial services to large corporates with a turnover above £500m per annum, and financial institutions, as well as to the rest of Santander UK’s businesses. The main businesses areas include: working capital management (trade and export finance and cash management), financing (Debt Capital Markets, and corporate and specialised lending) and risk management (foreign exchange, rates and liability management).
Summarised income statement
| Six months ended 30 June 2015 £m | Six months ended 30 June 2014 £m | |||||||
Net interest income | 39 | 38 | ||||||
Non-interest income | 151 | 144 | ||||||
|
|
|
| |||||
Total operating income | 190 | 182 | ||||||
|
|
|
| |||||
Administration expenses | (123 | ) | (112 | ) | ||||
Depreciation, amortisation and impairment | (8 | ) | (1 | ) | ||||
|
|
|
| |||||
Total operating expenses excluding impairment losses, provisions and charges | (131 | ) | (113 | ) | ||||
|
|
|
| |||||
Impairment releases/(losses) on loans and advances | 21 | (2 | ) | |||||
Provisions for other liabilities and charges | — | — | ||||||
|
|
|
| |||||
Total operating impairment releases/(losses), provisions and charges | 21 | (2 | ) | |||||
|
|
|
| |||||
Profit before tax | 80 | 67 | ||||||
|
|
|
| |||||
Six months ended 30 June 2015 compared to six months ended 30 June 2014
Profit before tax increased by £13m to £80m in the first half of 2015 (2014: £67m). By income statement line, the movements were:
| • | Net interest income was broadly flat at £39m in the first half of 2015 (2014: £38m), with continued demand for project and acquisition finance transactions, syndicated loans, transactional services and factoring products. |
| • | Non-interest income increased by £7m to £151m in the first half of 2015 (2014: £144m), principally due to increased revenues from our client derivative and cash sales activities, partially offset by lower demand in some market-making activities. In addition, there have been improvements to revenues from the investment in increased service capability. |
| • | Administration expenses increased by £11m to £123m in the first half of 2015 (2014: £112m), mainly reflecting investment in developing transactional, interest rate, foreign exchange and fixed income capabilities, the transfer of a number of sales functions to London from Madrid, as well as the associated costs from related controls, systems and processes. |
| • | Depreciation, amortisation and impairment increased by £7m to £8m in the first half of 2015 (2014: £1m) due to the continued investment in systems. |
| • | Impairment releases/(losses) on loans and advances benefited from a release of £21m in the first half of 2015 (2014: £2m) reflecting more successful than expected loan disposals and loan restructurings. |
| 2015 Half Yearly Financial Report | 93 |
Table of Contents
Financial review
Balances and ratios
| 30 June 2015 £bn | 31 December 2014 £bn | |||||||
Total assets | 38.5 | 38.3 | ||||||
Customer loans | 5.7 | 5.2 | ||||||
Other assets | 32.8 | 33.1 | ||||||
Risk-weighted assets | 16.9 | 16.8 | ||||||
Customer deposits | 2.2 | 2.3 | ||||||
NPL ratio(1) (2) | 0.07 | % | 1.01 | % | ||||
Coverage ratio(1) (3) | 675 | % | 138 | % | ||||
| (1) | The balances include interest charged to the customer’s account, but exclude interest accrued but not yet charged to the account. |
| (2) | NPLs as a percentage of customer loans. |
| (3) | Impairment loss allowance as a percentage of NPLs. The impairment loan loss allowance includes provisions against both NPLs and other loans where a provision is required. As a result the ratio can exceed 100%. |
30 June 2015 compared to 31 December 2014
| • | Total assets principally consist of derivatives, fixed income products and customer loans. Total assets increased by 1% to £38.5bn at 30 June 2015 (2014: £38.3bn). The increase was driven by the growth in customer loans described below. |
| • | Customer loans increased to £5.7bn at 30 June 2015 (2014: £5.2bn), due to refinancing and origination activities related to syndicated loans and transactional services. We continue to develop our larger corporate and institutional client franchise and our product offering in banking and capital markets. We are focusing the business mix towards core banking activities, such as global transaction banking, Debt Capital Markets solutions, supply chain finance and cash management, and have recently added private placement capabilities in order to offer a full product suite. |
| • | Other assets principally consist of derivatives and fixed income products. Other assets decreased slightly by £0.3bn to £32.8bn at 30 June 2015 (2014: £33.1bn). |
| • | Risk-weighted assets increased slightly to £16.9bn at 30 June 2015 (2014: £16.8bn) reflecting customer loan growth, partially offset by decreases in market risk risk weighted assets. |
| • | Customer deposits decreased to £2.2bn at 30 June 2015 (2014: £2.3bn) as part of a continued focus on the management of our relationship driven deposit base. |
| • | The NPL ratio decreased to 0.07% at 30 June 2015 (2014: 1.01%), due to the disposal of a single loan of £49m and asset growth. |
| 94 | Santander UK plc |
Table of Contents
Income statement review | Balance sheet review | Cash flows | ||
|
Corporate Centre predominantly consists of the non-core corporate and treasury legacy portfolios. Corporate Centre is responsible for managing capital and funding, balance sheet composition and structure and strategic liquidity risk for the Santander UK group. The non-core corporate and treasury legacy portfolios include aviation, shipping, infrastructure, commercial mortgages, Social Housing loans and structured credit assets, all of which are being run-down and/or managed for value.
Summarised income statement
| Six months ended 30 June 2015 £m | Six months ended 30 June 2014 £m | |||||||
Net interest expense | (65 | ) | (24 | ) | ||||
Non-interest income | 13 | 38 | ||||||
|
|
|
| |||||
Total operating (expense)/income | (52 | ) | 14 | |||||
|
|
|
| |||||
Administration expenses | — | 119 | ||||||
Depreciation, amortisation and impairment | — | (206 | ) | |||||
|
|
|
| |||||
Total operating expenses excluding impairment releases/(losses), provisions and charges | — | (87 | ) | |||||
|
|
|
| |||||
Impairment releases/(losses) on loans and advances | 27 | (9 | ) | |||||
Provisions for other liabilities and charges | — | — | ||||||
|
|
|
| |||||
Total operating impairment releases/(losses), provisions and charges | 27 | (9 | ) | |||||
|
|
|
| |||||
Loss before tax | (25 | ) | (82 | ) | ||||
|
|
|
| |||||
Six months ended 30 June 2015 compared to six months ended 30 June 2014
Loss before tax decreased by £57m to £25m in the first half of 2015 (2014: £82m). By income statement line, the movements were:
| • | Net interest expense increased by £41m to £65m in the first half of 2015 (2014: £24m), reflecting the differing maturity and behavioural profiles between the commercial balance sheet and the re-pricing of debt funding. |
| • | Non-interest income decreased by £25m to £13m in the first half of 2015 (2014: £38m), reflecting reduced mark-to-market gains. |
| • | Administration expenses increased by £119m to £nil in the first half of 2015 (2014: benefit of £119m). In 2014, the benefit was principally due to a net gain of £218m which arose as a result of scheme changes that limit future defined benefit pension entitlements and provide for the longer term sustainability of our staff pension arrangement. This was partially offset by additional project costs of £98m, including those relating to our investment programme, which were borne centrally. |
| • | Depreciation, amortisation and impairment was £nil in the first half of 2015 (2014: £206m). In 2014, the charge was due to software write-offs of £206m for the decommissioning of redundant systems following the implementation of our new digital platform and the completion of our product simplification programme. |
| • | Impairment releases/(losses) on loans and advances decreased by £36m to a release of £27m in the first half of 2015 (2014: charge of £9m) mainly due to provision releases in the non-core portfolio as a result of successful asset disposals and repayments. |
Balances and ratios
| 30 June 2015 £bn | 31 December 2014 £bn | |||||||
Total assets | 51.3 | 55.6 | ||||||
Customer loans (non-core) | 7.9 | 8.3 | ||||||
- of which Social housing | 6.5 | 6.7 | ||||||
Risk-weighted assets | 6.7 | 7.2 | ||||||
Customer deposits | 4.2 | 5.2 | ||||||
NPL ratio(1) (2) | 1.93 | % | 1.62 | % | ||||
Coverage ratio(1) (3) | 89 | % | 134 | % | ||||
| (1) | The balances include interest charged to the customer’s account, but exclude interest accrued but not yet charged to the account. |
| (2) | NPLs as a percentage of customer loans. |
| (3) | Impairment loan loss allowance as a percentage of NPLs. The impairment loan loss allowance includes provisions against both NPLs and other loans where a provision is required. As a result the ratio can exceed 100%. |
30 June 2015 compared to 31 December 2014
| • | Total assets principally consists of liquid assets and non-core customer loans. Total assets decreased by 8% to £51.3bn at 30 June 2015 (2014: £55.6bn) principally driven by the reduction in non-core customer loans described below. |
| • | Non-core customer loans decreased by 5% to £7.9bn at 30 June 2015 (2014: £8.3bn) due to the run-down of the non-core corporate and legacy portfolios as we continued to successfully implement our ongoing exit strategy from individual loans and leases. Disposals of assets continued across the portfolios with no significant impact on the income statement. The Social Housing loan portfolio remained relatively stable, reflecting its long-term, low risk nature. |
| • | Risk-weighted assets decreased by 7% to £6.7bn at 30 June 2015 (2014: £7.2bn) largely reflecting the reduction in customer loans and the continued run-down of the other non-core corporate and legacy portfolios. |
| • | Customer deposits decreased by 19% to £4.2bn at 30 June 2015 (2014: £5.2bn), as we focused on rebalancing the deposit base tenure. |
| • | The NPL ratio increased to 1.93% at 30 June 2015 (2014: 1.62%), largely due to a single loan of £21m which moved to non-performance. |
| 2015 Half Yearly Financial Report | 95 |
Table of Contents
Financial review
This Financial Review describes Santander UK’s significant assets and liabilities and its strategy and reasons for entering into such transactions. In this section, references to UK and non-UK, in the geographical analysis, refer to the location of the office where the transaction is recorded.
SUMMARISED CONDENSED CONSOLIDATED BALANCE SHEET
| 30 June 2015 £m | 31 December 2014 £m | |||||||
Assets | ||||||||
Cash and balances at central banks | 15,218 | 22,562 | ||||||
Trading assets | 25,625 | 21,700 | ||||||
Derivative financial instruments | 20,589 | 23,021 | ||||||
Financial assets designated at fair value | 2,729 | 2,881 | ||||||
Loans and advances to banks | 2,500 | 2,057 | ||||||
Loans and advances to customers | 194,939 | 188,691 | ||||||
Loans and receivables securities | 66 | 118 | ||||||
Available for sale securities | 9,096 | 8,944 | ||||||
Macro hedge of interest rate risk | 743 | 963 | ||||||
Interest in other entities | 40 | 38 | ||||||
Property, plant and equipment | 1,571 | 1,624 | ||||||
Retirement benefit assets | 349 | 315 | ||||||
Tax, intangibles and other assets | 3,761 | 3,063 | ||||||
|
|
|
| |||||
Total assets | 277,226 | 275,977 | ||||||
|
|
|
| |||||
Liabilities | ||||||||
Deposits by banks | 7,252 | 8,214 | ||||||
Deposits by customers | 158,150 | 153,606 | ||||||
Trading liabilities | 15,491 | 15,333 | ||||||
Derivative financial instruments | 22,015 | 22,732 | ||||||
Financial liabilities designated at fair value | 2,502 | 2,848 | ||||||
Debt securities in issue | 49,384 | 51,790 | ||||||
Subordinated liabilities | 3,601 | 4,002 | ||||||
Macro hedge of interest rate risk | 39 | 139 | ||||||
Retirement benefit obligations | 210 | 199 | ||||||
Tax, other liabilities and provisions | 3,386 | 2,921 | ||||||
|
|
|
| |||||
Total liabilities | 262,030 | 261,784 | ||||||
|
|
|
| |||||
Equity | ||||||||
Total shareholders’ equity | 15,073 | 14,193 | ||||||
Non-controlling interests | 123 | — | ||||||
|
|
|
| |||||
Total liabilities and equity | 277,226 | 275,977 | ||||||
|
|
|
| |||||
A more detailed consolidated balance sheet is contained in the Condensed Consolidated Interim Financial Statements.
30 June 2015 compared to 31 December 2014
Assets
Cash and balances at central banks
Cash and balances held at central banks decreased by 33% to £15,218m at 30 June 2015 (2014: £22,562m). The decrease was mainly attributable to a reduction in balances at central banks for liquidity purposes.
Trading assets
Trading assets increased by 18% to £25,625m at 30 June 2015 (2014: £21,700m), reflecting changes in the mix of assets held for liquidity purposes, with higher levels of securities purchased under resale agreements and equities partially offset by decreased holdings of debt securities. Additionally there were higher levels of derivative collateral.
Derivative financial instruments - assets
Derivative assets decreased by 11% to £20,589m at 30 June 2015 (2014: £23,021m). The decrease was mainly attributable to decreases in the fair value of interest rate and cross currency derivatives assets principally driven by movements in yield curves and foreign exchange rates.
Financial assets designated at fair value through profit and loss
Financial assets designated at fair value through profit and loss decreased by 5% to £2,729m at 30 June 2015 (2014: £2,881m), mainly driven by the decrease in the valuation of assets and maturities within the portfolio. In accordance with Santander UK’s policy, new loans are no longer being designated at fair value.
Loans and advances to banks
Loans and advances to banks increased by 22% to £2,500m at 30 June 2015 (2014: £2,057m). The increase was mainly driven by medium term securities purchased under resale agreements.
Loans and advances to customers
Loans and advances to customers increased by 3% to £194,939m at 30 June 2015 (2014: £188,691m) due to an increase in unsecured consumer and vehicle finance, following the commencement of the PSA cooperation, and an increase in net corporate lending. Mortgage balances also increased, driven by stronger approval volumes in the first quarter of 2015.
| 96 | Santander UK plc |
Table of Contents
Income statement review | Balance sheet review | Cash flows | ||
|
Loans and receivables securities
Loans and receivables securities decreased by 44% to £66m at 30 June 2015 (2014: £118m). The decrease was attributable to sales and maturities of assets in the legacy Treasury asset portfolio.
Available for sale securities
Available for sale securities increased by 2% to £9,096m at 30 June 2015 (2014: £8,944m) largely due to the purchase of debt securities as part of normal liquid asset portfolio management activity.
Macro hedge of interest rate risk - assets
The macro (or portfolio) hedge of interest rate risk decreased by 23% to £743m at 30 June 2015 (2014: £963m), mainly driven by movements in yield curves.
Property, plant and equipment
Property, plant and equipment decreased by 3% to £1,571m at 30 June 2015 (2014: £1,624m), driven by the depreciation charge for the period.
Retirement benefit assets
Retirement benefit assets increased by 11% to £349m at 30 June 2015 (2014: £315m). For those sections of the Santander UK Group Pension Scheme which had surpluses, the key drivers of the increase were actuarial gains arising from a modest improvement in the discount rate and experience adjustments together with the acquisition of the PSA retirement benefit scheme.
Tax, intangibles and other assets
Tax, intangibles and other assets increased by 23% to £3,761m at 30 June 2015 (2014: £3,063m). The increase was primarily driven by an increase in prepayments.
Liabilities
Deposits by banks
Deposits by banks decreased by 12% to £7,252m at 30 June 2015 (2014: £8,214m) driven by maturities of medium-term securities sold under agreements to repurchase.
Deposits by customers
Deposits by customers increased by 3% to £158,150m at 30 June 2015 (2014: £153,606m) as we continued to focus on retaining and originating accounts held by more loyal customers. Retail Banking current account balances increased, partially offset by lower savings balances impacted by reduced demand. Commercial Banking deposits increased through enhanced capabilities and building on strong customer relationships.
Trading liabilities
Trading liabilities increased by 1% to £15,491m at 30 June 2015 (2014: £15,333m) as a result of an increase in short positions as part of normal trading activities, partially offset by a reduction in short-term deposits taken and collateral held.
Derivative financial instruments - liabilities
Derivative liabilities decreased by 3% to £22,015m at 30 June 2015 (2014: £22,732m). The decrease was mainly attributable to decreases in the fair value of interest rate and cross currency derivatives liabilities mainly driven by movements in yield curves and foreign exchange rates.
Financial liabilities designated at fair value through profit and loss
Financial liabilities designated at fair value through profit and loss decreased by 12% to £2,502m at 30 June 2015 (2014: £2,848m). The decrease principally reflected reduced issuances in financial liabilities designated at fair value through profit or loss.
Debt securities in issue
Debt securities in issue decreased by 5% to £49,384m at 30 June 2015 (2014: £51,790m), driven by maturities in the period, partially offset by additional medium-term funding assumed in connection with the commencement of the PSA cooperation.
Subordinated liabilities
Subordinated liabilities decreased by 10% to £3,601m at 30 June 2015 (2014: £4,002m) due to a capital management exercise in the period.
Macro hedge of interest rate risk - liabilities
Macro hedge of interest rate risk decreased by 72% to £39m at 30 June 2015 (2014: £139m) mainly driven by movements in yield curves.
Retirement benefit obligations
Retirement benefit obligations increased by 6% to £210m at 30 June 2015 (2014: £199m). The key drivers of the increase were actuarial losses arising from experience adjustments partially offset by gains arising from a modest improvement in the discount rate.
Tax, other liabilities and provisions
Tax, other liabilities and provisions increased by 16% to £3,386m at 30 June 2015 (2014: £2,921m). The increase principally reflected the increase in dividend payable and unsettled financial transactions.
Equity
Total shareholders’ equity
Total shareholders’ equity increased by 6% to £15,073m at 30 June 2015 (2014: £14,193m). The increase was principally attributable to the issuance of £750m Perpetual Capital Securities, valuation of cash flow hedges and the profit for the period, partially offset by dividends approved.
Non-controlling interests
Non-controlling interests increased to £123m at 30 June 2015 (2014: £nil) due to the acquisition of 50% of the ordinary shares of PSA Finance UK Limited. For further details on the increase of non-controlling interests, see Notes 33 and 35.
| 2015 Half Yearly Financial Report | 97 |
Table of Contents
Financial review
Santander UK includes short-term borrowings within deposits by banks, trading liabilities, financial liabilities designated at fair value and debt securities in issue and does not show short-term borrowings separately on the balance sheet. Short-term borrowings are defined by the US Securities and Exchange Commission (the ‘SEC’) as amounts payable for short-term obligations that are US Federal funds purchased and securities sold under repurchase agreements, commercial paper, borrowings from banks, borrowings from factors or other financial institutions and any other short-term borrowings reflected on Santander UK’s balance sheet. Santander UK’s only significant short-term borrowings are securities sold under repurchase agreements, commercial paper, borrowings from banks, negotiable certificates of deposit, and certain other debt securities in issue. Additional information on short-term borrowings is provided in the table below for the six months ended 30 June 2015 and 2014.
| Six months ended 30 June 2015 £m | Six months ended 30 June 2014 £m | |||||||
Securities sold under repurchase agreements | ||||||||
- Period-end balance | 11,030 | 14,673 | ||||||
- Period-end interest rate | 0.50 | % | 0.45 | % | ||||
- Average balance(1) | 17,230 | 24,479 | ||||||
- Average interest rate(1) | 0.42 | % | 0.48 | % | ||||
- Maximum balance(1) | 23,677 | 27,396 | ||||||
Commercial paper | ||||||||
- Period-end balance | 3,901 | 3,862 | ||||||
- Period-end interest rate | 0.32 | % | 0.61 | % | ||||
- Average balance(1) | 3,973 | 4,043 | ||||||
- Average interest rate(1) | 0.31 | % | 0.39 | % | ||||
- Maximum balance(1) | 5,066 | 4,610 | ||||||
Borrowings from banks (Deposits by banks)(2) | ||||||||
- Period-end balance | 2,642 | 3,213 | ||||||
- Period-end interest rate | 0.05 | % | 0.08 | % | ||||
- Average balance(1) | 3,021 | 1,485 | ||||||
- Average interest rate(1) | 0.16 | % | 0.03 | % | ||||
- Maximum balance(1) | 3,905 | 3,213 | ||||||
Negotiable certificates of deposit | ||||||||
- Period-end balance | 4,204 | 4,119 | ||||||
- Period-end interest rate | 0.44 | % | 0.38 | % | ||||
- Average balance(1) | 4,310 | 3,588 | ||||||
- Average interest rate(1) | 0.39 | % | 0.42 | % | ||||
- Maximum balance(1) | 4,431 | 4,119 | ||||||
Other debt securities in issue | ||||||||
- Period-end balance | 2,212 | 4,864 | ||||||
- Period-end interest rate | 2.86 | % | 2.86 | % | ||||
- Average balance(1) | 3,921 | 4,967 | ||||||
- Average interest rate(1) | 2.94 | % | 3.09 | % | ||||
- Maximum balance(1) | 4,717 | 5,975 | ||||||
| (1) | Calculated using monthly weighted average data. |
| (2) | The period-end deposits by banks balance includes non-interest bearing items in the course of transmission of £357m (30 June 2014: £308m). |
Commercial paper is issued by Abbey National Treasury Services plc and Abbey National North America LLC. Abbey National Treasury Services plc issues commercial paper with a minimum issuance amount of Euro 100,000 with a maximum maturity of 364 days. Abbey National North America LLC and Abbey National Treasury Services plc, US Branch issue commercial paper with minimum denominations of US$100,000 and US$250,000, respectively, with maturity of up to 270 days from the date of issue.
| 98 | Santander UK plc |
Table of Contents
Income statement review | Balance sheet review | Cash flows | ||
|
As period-end statements may not be representative of activity throughout the period, average balance sheets are presented below. The average balance sheets summarise the significant categories of assets and liabilities, together with average interest rates.
| Six months ended 30 June 2015 | Six months ended 30 June 2014 | |||||||||||||||||||||||
| Average balance(1) £m | Interest(4) (5) £m | Average rate % | Average balance(1) £m | Interest(4) (5) £m | Average rate % | |||||||||||||||||||
Assets | ||||||||||||||||||||||||
Loans and advances to banks: | ||||||||||||||||||||||||
- UK | 21,762 | 58 | 0.53 | 20,851 | 61 | 0.59 | ||||||||||||||||||
- Non-UK | 7,028 | 8 | 0.23 | 11,302 | 14 | 0.25 | ||||||||||||||||||
Loans and advances to customers:(3) | ||||||||||||||||||||||||
- UK | 193,878 | 3,261 | 3.36 | 186,180 | 3,297 | 3.54 | ||||||||||||||||||
- Non-UK | 25 | — | — | 5 | — | — | ||||||||||||||||||
Debt securities: | ||||||||||||||||||||||||
- UK | 9,239 | 44 | 0.95 | 7,933 | 49 | 1.24 | ||||||||||||||||||
|
|
|
|
|
|
|
|
|
|
|
| |||||||||||||
Total average interest-earning assets, interest income(2) | 231,932 | 3,371 | 2.91 | 226,271 | 3,421 | 3.02 | ||||||||||||||||||
Impairment loss allowances | (1,394 | ) | — | — | (1,523 | ) | — | — | ||||||||||||||||
Trading business | 21,369 | — | — | 19,321 | — | — | ||||||||||||||||||
Assets designated at FVTPL | 2,846 | — | — | 2,815 | — | — | ||||||||||||||||||
Other non-interest-earning assets | 33,411 | — | — | 33,026 | — | — | ||||||||||||||||||
|
|
|
|
|
|
|
|
|
|
|
| |||||||||||||
Total average assets | 288,164 | — | — | 279,910 | — | — | ||||||||||||||||||
|
|
|
|
|
|
|
|
|
|
|
| |||||||||||||
Non-UK assets as a % of total | 2.45 | % | — | — | 4.04 | % | — | — | ||||||||||||||||
|
|
|
|
|
|
|
|
|
|
|
| |||||||||||||
Liabilities | ||||||||||||||||||||||||
Deposits by banks: | ||||||||||||||||||||||||
- UK | (7,217 | ) | (39 | ) | 1.08 | (7,242 | ) | (46 | ) | 1.27 | ||||||||||||||
- Non-UK | (17 | ) | — | — | (2 | ) | — | — | ||||||||||||||||
Deposits by customers - retail demand: | ||||||||||||||||||||||||
- UK | (101,331 | ) | (599 | ) | 1.18 | (88,009 | ) | (493 | ) | 1.12 | ||||||||||||||
- Non-UK | (808 | ) | (1 | ) | 0.25 | (698 | ) | (2 | ) | 0.57 | ||||||||||||||
Deposits by customers - retail time: | ||||||||||||||||||||||||
- UK | (27,145 | ) | (202 | ) | 1.49 | (32,103 | ) | (360 | ) | 2.24 | ||||||||||||||
- Non-UK | (804 | ) | (6 | ) | 1.49 | (1,378 | ) | (12 | ) | 1.74 | ||||||||||||||
Deposits by customers – wholesale: | ||||||||||||||||||||||||
- UK | (24,765 | ) | (137 | ) | 1.11 | (27,319 | ) | (197 | ) | 1.44 | ||||||||||||||
- Non-UK | (665 | ) | (1 | ) | 0.30 | — | — | — | ||||||||||||||||
Bonds and medium-term notes: | ||||||||||||||||||||||||
- UK | (47,164 | ) | (468 | ) | 1.98 | (46,764 | ) | (485 | ) | 2.07 | ||||||||||||||
- Non-UK | (5,097 | ) | (8 | ) | 0.31 | (4,287 | ) | (5 | ) | 0.23 | ||||||||||||||
Dated and undated loan capital and other subordinated liabilities: | ||||||||||||||||||||||||
- UK | (3,924 | ) | (120 | ) | 6.12 | (4,390 | ) | (126 | ) | 5.74 | ||||||||||||||
Other interest-bearing liabilities: | ||||||||||||||||||||||||
- UK | (390 | ) | (7 | ) | 3.59 | (627 | ) | (22 | ) | 7.02 | ||||||||||||||
|
|
|
|
|
|
|
|
|
|
|
| |||||||||||||
Total average interest-bearing liabilities, interest expense(2) | (219,327 | ) | (1,588 | ) | 1.45 | (212,819 | ) | (1,748 | ) | 1.64 | ||||||||||||||
Trading business | (21,485 | ) | — | — | (25,339 | ) | — | — | ||||||||||||||||
Liabilities designated at FVTPL | (2,614 | ) | — | — | (4,085 | ) | — | — | ||||||||||||||||
- Other non-interest bearing liabilities | (30,214 | ) | — | — | (24,686 | ) | — | — | ||||||||||||||||
Shareholders’ funds and non-controlling interests | (14,524 | ) | — | — | (12,981 | ) | — | — | ||||||||||||||||
|
|
|
|
|
|
|
|
|
|
|
| |||||||||||||
Total average liabilities, shareholders’ funds and non-controlling interests | (288,164 | ) | — | — | (279,910 | ) | — | — | ||||||||||||||||
|
|
|
|
|
|
|
|
|
|
|
| |||||||||||||
Non-UK liabilities as a % of total | 2.56 | % | — | — | 2.27 | % | — | — | ||||||||||||||||
|
|
|
|
|
|
|
|
|
|
|
| |||||||||||||
| (1) | Average balances are based upon monthly data. |
| (2) | The ratio of average interest-earning assets to interest-bearing liabilities for the six months ended 30 June 2015 was 105.75% (six months ended 30 June 2014: 106.32%). |
| (3) | Loans and advances to customers include non-performing loans. See the ‘Credit Risk’ section of the Risk Review. |
| (4) | The net interest margin for the six months ended 30 June 2015 was 1.55% (six months ended 30 June 2014: 1.48%). Net interest margin is calculated as net interest income divided by average interest-earning assets. This differs from the Banking Net Interest Margin(6), discussed in the CFO’s review, which is calculated as net interest income divided by average customer assets. |
| (5) | The interest spread for the six months ended 30 June 2015 was 1.46% (six months ended 30 June 2014: 1.38%). Interest spread is the difference between the rate of interest earned on average interest-earning assets and the rate of interest paid on average interest-bearing liabilities. |
| (6) | Non-IFRS measure. See page 139. |
| 2015 Half Yearly Financial Report | 99 |
Table of Contents
Income statement review | Balance sheet review | Cash flows | ||
|
| Six months ended 30 June 2015 £m | Six months ended 30 June 2014 £m | |||||||
Net cash outflow from operating activities | (4,680 | ) | (252 | ) | ||||
Net cash outflow from investing activities | (519 | ) | (2,905 | ) | ||||
Net cash outflow from financing activities | (2,535 | ) | (813 | ) | ||||
|
|
|
| |||||
Decrease in cash and cash equivalents | (7,734 | ) | (3,970 | ) | ||||
|
|
|
| |||||
The major activities and transactions that affected Santander UK’s cash flows during the first six months of 2015 were as follows:
The net cash outflow from operating activities of £4,680m resulted from the reduction in trading balances, increased customer lending partially offset by increased customer savings and deposits from other banks. The net cash outflow from investing activities of £519m principally reflected the purchase and sale of available-for-sale securities and acquisition of PSA Finance UK Limited. The net cash outflow from financing activities of £2,535m reflected the repayment of debt securities maturing in the period of £10,472m offset by new issues of debt securities of £7,599m and the issuance of £750m Perpetual Capital Securities. Further outflows of cash occurred in the payment of interim dividends of £261m on ordinary shares, £23m of dividends on other equity instruments, dividends of £32m on the £500m Perpetual Capital Securities and dividends of £13m on the £300m Perpetual Capital Securities. Cash and cash equivalents decreased by £7,734m principally from the increase in customer lending and purchase of available-for-sale securities.
| 100 | Santander UK plc |
Table of Contents
Primary financial statements | Notes to the financial statements | |
|
| 2015 Half Yearly Financial Report | 101 |
Table of Contents
Financial statements
This page intentionally left blank
| 102 | Santander UK plc |
Table of Contents
statements | Notes to the financial statements | |
|
Condensed Consolidated Income Statement
For the six months ended 30 June 2015 and 2014
| Notes | Six months ended 30 June 2015 £m | Six months ended 30 June 2014 £m | ||||||||||
Interest and similar income | 3,371 | 3,421 | ||||||||||
Interest expense and similar charges | (1,588 | ) | (1,748 | ) | ||||||||
|
|
|
| |||||||||
Net interest income | 1,783 | 1,673 | ||||||||||
|
|
|
| |||||||||
Fee and commission income | 570 | 534 | ||||||||||
Fee and commission expense | (193 | ) | (169 | ) | ||||||||
|
|
|
| |||||||||
Net fee and commission income | 377 | 365 | ||||||||||
|
|
|
| |||||||||
Net trading and other income | 3 | 123 | 154 | |||||||||
|
|
|
| |||||||||
Total operating income | 2,283 | 2,192 | ||||||||||
|
|
|
| |||||||||
Administration expenses | 4 | (1,064 | ) | (876 | ) | |||||||
Depreciation, amortisation and impairment | 5 | (136 | ) | (347 | ) | |||||||
|
|
|
| |||||||||
Total operating expenses excluding impairment losses, provisions and charges | (1,200 | ) | (1,223 | ) | ||||||||
|
|
|
| |||||||||
Impairment losses on loans and advances | 6 | (57 | ) | (172 | ) | |||||||
Provisions for other liabilities and charges | 24 | (97 | ) | (252 | ) | |||||||
|
|
|
| |||||||||
Total operating impairment losses, provisions and charges | (154 | ) | (424 | ) | ||||||||
|
|
|
| |||||||||
Profit before tax | 929 | 545 | ||||||||||
Tax on profit | 7 | (195 | ) | (107 | ) | |||||||
|
|
|
| |||||||||
Profit after tax for the period | 734 | 438 | ||||||||||
|
|
|
| |||||||||
Attributable to: | ||||||||||||
Equity holders of the parent | 722 | 438 | ||||||||||
Non-controlling interest | 12 | — | ||||||||||
|
|
|
| |||||||||
Condensed Consolidated Statement of Comprehensive Income
For the six months ended 30 June 2015 and 2014
| Notes | Six months ended 30 June 2015 £m | Six months ended 30 June 2014 £m | ||||||||||
Profit for the period | 734 | 438 | ||||||||||
|
|
|
| |||||||||
Other comprehensive income/(expense): | ||||||||||||
Other comprehensive income that may be reclassified to profit or loss subsequently: | ||||||||||||
Available-for-sale securities: | ||||||||||||
- Net gains on available-for-sale securities | 13 | 38 | ||||||||||
- Net gains on available-for-sale securities transferred to profit or loss on sale | (8 | ) | — | |||||||||
- Tax on above items | (1 | ) | (8 | ) | ||||||||
|
|
|
| |||||||||
| 4 | 30 | |||||||||||
|
|
|
| |||||||||
Cash flow hedges: | ||||||||||||
- Net losses on cash flow hedges | (1,485 | ) | (329 | ) | ||||||||
- Net losses on cash flow hedges transferred to profit or loss | 1,321 | 601 | ||||||||||
- Tax on above items | 33 | (58 | ) | |||||||||
|
|
|
| |||||||||
| (131 | ) | 214 | ||||||||||
|
|
|
| |||||||||
Exchange differences on translation of foreign operations | 1 | 1 | ||||||||||
|
|
|
| |||||||||
Net other comprehensive (expense)/income that may be reclassified to profit or loss subsequently | (126 | ) | 245 | |||||||||
|
|
|
| |||||||||
Other comprehensive income that will not be reclassified to profit or loss subsequently: | ||||||||||||
Remeasurement of defined benefit pension obligations | 25 | 17 | 128 | |||||||||
Tax on above item | (3 | ) | (26 | ) | ||||||||
|
|
|
| |||||||||
Net other comprehensive income that will not be reclassified to profit or loss subsequently | 14 | 102 | ||||||||||
|
|
|
| |||||||||
Total other comprehensive (expense)/income for the period net of tax | (112 | ) | 347 | |||||||||
|
|
|
| |||||||||
Total comprehensive income for the period | 622 | 785 | ||||||||||
|
|
|
| |||||||||
Attributable to: | ||||||||||||
Equity holders of the parent | 610 | 785 | ||||||||||
Non-controlling interest | 12 | — | ||||||||||
|
|
|
| |||||||||
The accompanying Notes to the Financial Statements and the Risk Review form an integral part of these Condensed Consolidated Interim Financial Statements.
| 2015 Half Yearly Financial Report | 103 |
Table of Contents
Financial statements
Condensed Consolidated Balance Sheet
At 30 June 2015 and 31 December 2014
| Notes | 30 June 2015 £m | 31 December 2014 £m | ||||||||||
Assets | ||||||||||||
Cash and balances at central banks | 15,218 | 22,562 | ||||||||||
Trading assets | 9 | 25,625 | 21,700 | |||||||||
Derivative financial instruments | 10 | 20,589 | 23,021 | |||||||||
Financial assets designated at fair value | 11 | 2,729 | 2,881 | |||||||||
Loans and advances to banks | 12 | 2,500 | 2,057 | |||||||||
Loans and advances to customers | 13 | 194,939 | 188,691 | |||||||||
Loans and receivables securities | 66 | 118 | ||||||||||
Available-for-sale securities | 15 | 9,096 | 8,944 | |||||||||
Macro hedge of interest rate risk | 743 | 963 | ||||||||||
Interests in other entities | 16 | 40 | 38 | |||||||||
Intangible assets | 17 | 2,210 | 2,187 | |||||||||
Property, plant and equipment | 18 | 1,571 | 1,624 | |||||||||
Current tax assets | 34 | — | ||||||||||
Deferred tax assets | — | — | ||||||||||
Retirement benefit assets | 25 | 349 | 315 | |||||||||
Other assets | 1,517 | 876 | ||||||||||
|
|
|
| |||||||||
Total assets | 277,226 | 275,977 | ||||||||||
|
|
|
| |||||||||
Liabilities | ||||||||||||
Deposits by banks | 19 | 7,252 | 8,214 | |||||||||
Deposits by customers | 158,150 | 153,606 | ||||||||||
Trading liabilities | 20 | 15,491 | 15,333 | |||||||||
Derivative financial instruments | 10 | 22,015 | 22,732 | |||||||||
Financial liabilities designated at fair value | 21 | 2,502 | 2,848 | |||||||||
Debt securities in issue | 22 | 49,384 | 51,790 | |||||||||
Subordinated liabilities | 23 | 3,601 | 4,002 | |||||||||
Macro hedge of interest rate risk | 39 | 139 | ||||||||||
Other liabilities | 2,828 | 2,302 | ||||||||||
Provisions | 24 | 461 | 491 | |||||||||
Current tax liabilities | 2 | 69 | ||||||||||
Deferred tax liabilities | 95 | 59 | ||||||||||
Retirement benefit obligations | 25 | 210 | 199 | |||||||||
|
|
|
| |||||||||
Total liabilities | 262,030 | 261,784 | ||||||||||
|
|
|
| |||||||||
Equity | ||||||||||||
Share capital and other equity instruments | 27 | 4,911 | 4,244 | |||||||||
Share premium | 5,620 | 5,620 | ||||||||||
Retained earnings | 4,395 | 4,056 | ||||||||||
Other reserves | 147 | 273 | ||||||||||
|
|
|
| |||||||||
Total shareholders’ equity | 15,073 | 14,193 | ||||||||||
Non-controlling interest | 123 | — | ||||||||||
|
|
|
| |||||||||
Total liabilities and equity | 277,226 | 275,977 | ||||||||||
|
|
|
| |||||||||
The accompanying Notes to the Financial Statements and the Risk Review form an integral part of these Condensed Consolidated Interim Financial Statements.
| 104 | Santander UK plc |
Table of Contents
Primary financial statements | Notes to the financial statements | |
|
Condensed Consolidated Statement of Changes in Equity
For the six months ended 30 June 2015 and 2014
| Other reserves | ||||||||||||||||||||||||||||||||||||||||
| Notes | Share capital & other equity instruments £m | Share premium £m | Available for sale £m | Cash flow hedging £m | Foreign currency translation £m | Retained earnings(1) £m | Total £m | Non-controlling interest £m | Total £m | |||||||||||||||||||||||||||||||
1 January 2015 | 4,244 | 5,620 | (2 | ) | 262 | 13 | 4,056 | 14,193 | — | 14,193 | ||||||||||||||||||||||||||||||
Total comprehensive income/(expense) for the period: | ||||||||||||||||||||||||||||||||||||||||
- Profit for the period | — | — | — | — | — | 722 | 722 | 12 | 734 | |||||||||||||||||||||||||||||||
- Other comprehensive income/(expense) for the period: | ||||||||||||||||||||||||||||||||||||||||
- Net gains on available-for-sale securities | — | — | 13 | — | — | — | 13 | — | 13 | |||||||||||||||||||||||||||||||
- Net gains on available-for-sale securities transferred to P&L | — | — | (8 | ) | — | — | — | (8 | ) | — | (8 | ) | ||||||||||||||||||||||||||||
- Net losses on cash flow hedges | — | — | — | (1,485 | ) | — | — | (1,485 | ) | — | (1,485 | ) | ||||||||||||||||||||||||||||
- Net losses on cash flow hedges transferred to P&L | — | — | — | 1,321 | — | — | 1,321 | — | 1,321 | |||||||||||||||||||||||||||||||
- Remeasurement of defined benefit pension obligations | 25 | — | — | — | — | — | 17 | 17 | — | 17 | ||||||||||||||||||||||||||||||
- Exchange differences on translation of foreign operations | — | — | — | — | 1 | — | 1 | — | 1 | |||||||||||||||||||||||||||||||
- Tax on other comprehensive income/(expense) | — | — | (1 | ) | 33 | — | (3 | ) | 29 | — | 29 | |||||||||||||||||||||||||||||
|
|
|
|
|
|
|
|
|
|
|
|
|
|
|
|
|
| |||||||||||||||||||||||
Other comprehensive income/(expense) for the period, net of tax | — | — | 4 | (131 | ) | 1 | 14 | (112 | ) | — | (112 | ) | ||||||||||||||||||||||||||||
|
|
|
|
|
|
|
|
|
|
|
|
|
|
|
|
|
| |||||||||||||||||||||||
Acquisition of subsidiary with non-controlling interest | 35 | — | — | — | — | — | — | — | 111 | 111 | ||||||||||||||||||||||||||||||
Issue of Perpetual Capital Securities | 27 | 750 | — | — | — | — | — | 750 | — | 750 | ||||||||||||||||||||||||||||||
Repurchase of other equity instruments | 27 | (83 | ) | — | — | — | — | (16 | ) | (99 | ) | — | (99 | ) | ||||||||||||||||||||||||||
Tax on repurchase of other equity instruments | — | — | — | — | — | 12 | 12 | — | 12 | |||||||||||||||||||||||||||||||
Dividends on ordinary shares | 8 | — | — | — | — | — | (325 | ) | (325 | ) | — | (325 | ) | |||||||||||||||||||||||||||
Dividends on other equity instruments | 8 | — | — | — | — | — | (68 | ) | (68 | ) | — | (68 | ) | |||||||||||||||||||||||||||
|
|
|
|
|
|
|
|
|
|
|
|
|
|
|
|
|
| |||||||||||||||||||||||
30 June 2015 | 4,911 | 5,620 | 2 | 131 | 14 | 4,395 | 15,073 | 123 | 15,196 | |||||||||||||||||||||||||||||||
|
|
|
|
|
|
|
|
|
|
|
|
|
|
|
|
|
| |||||||||||||||||||||||
1 January 2014 | 3,709 | 5,620 | (23 | ) | (110 | ) | 17 | 3,377 | 12,590 | — | 12,590 | |||||||||||||||||||||||||||||
Total comprehensive income/(expense) for the period: | ||||||||||||||||||||||||||||||||||||||||
- Profit for the period | — | — | — | — | — | 438 | 438 | — | 438 | |||||||||||||||||||||||||||||||
- Other comprehensive income/(expense) for the period: | ||||||||||||||||||||||||||||||||||||||||
- Net gains on available-for-sale securities | — | — | 38 | — | — | — | 38 | — | 38 | |||||||||||||||||||||||||||||||
- Net losses on cash flow hedges | — | — | — | (329 | ) | — | — | (329 | ) | — | (329 | ) | ||||||||||||||||||||||||||||
- Net losses on cash flow hedges transferred to P&L | — | — | — | 601 | — | — | 601 | — | 601 | |||||||||||||||||||||||||||||||
- Remeasurement of defined benefit pension obligations | 25 | — | — | — | — | — | 128 | 128 | — | 128 | ||||||||||||||||||||||||||||||
- Exchange differences on translation of foreign operations | — | — | — | — | 1 | — | 1 | — | 1 | |||||||||||||||||||||||||||||||
- Tax on other comprehensive income/(expense) | — | — | (8 | ) | (58 | ) | — | (26 | ) | (92 | ) | — | (92 | ) | ||||||||||||||||||||||||||
|
|
|
|
|
|
|
|
|
|
|
|
|
|
|
|
|
| |||||||||||||||||||||||
Other comprehensive income for the period, net of tax | — | — | 30 | 214 | 1 | 102 | 347 | — | 347 | |||||||||||||||||||||||||||||||
|
|
|
|
|
|
|
|
|
|
|
|
|
|
|
|
|
| |||||||||||||||||||||||
Issue of Perpetual Capital Securities | 27 | 500 | — | — | — | — | — | 500 | — | 500 | ||||||||||||||||||||||||||||||
Dividends on ordinary shares | 8 | — | — | — | — | — | (237 | ) | (237 | ) | — | (237 | ) | |||||||||||||||||||||||||||
Dividends on other equity instruments | 8 | — | — | — | — | — | (40 | ) | (40 | ) | — | (40 | ) | |||||||||||||||||||||||||||
|
|
|
|
|
|
|
|
|
|
|
|
|
|
|
|
|
| |||||||||||||||||||||||
30 June 2014 | 4,209 | 5,620 | 7 | 104 | 18 | 3,640 | 13,598 | — | 13,598 | |||||||||||||||||||||||||||||||
|
|
|
|
|
|
|
|
|
|
|
|
|
|
|
|
|
| |||||||||||||||||||||||
| (1) | Includes capital redemption reserve of £286m (2014: £265m) arising from the purchase of £300m fixed/floating rate non-cumulative callable preference shares in 2014 and 2015. |
The accompanying Notes to the Financial Statements and the Risk Review form an integral part of these Condensed Consolidated Interim Financial Statements.
| 2015 Half Yearly Financial Report | 105 |
Table of Contents
Financial statements
Condensed Consolidated Cash Flow Statement
For the six months ended 30 June 2015 and 2014
| Notes | Six months ended 30 June 2015 £m | Six months ended 30 June 2014 £m | ||||||||||
Cash flows (used in)/from operating activities | ||||||||||||
Profit for the period | 734 | 438 | ||||||||||
Adjustments for: | ||||||||||||
Non-cash items included in profit | 1,463 | 918 | ||||||||||
Change in operating assets | (6,422 | ) | (1,864 | ) | ||||||||
Change in operating liabilities | 1,838 | 1,379 | ||||||||||
Corporation taxes paid | (235 | ) | (25 | ) | ||||||||
Effects of exchange rate differences | (2,058 | ) | (1,098 | ) | ||||||||
|
|
|
| |||||||||
Net cash flow used in operating activities | 28 | (4,680 | ) | (252 | ) | |||||||
|
|
|
| |||||||||
Cash flows (used in)/from investing activities | ||||||||||||
Investments in other entities | 16,35 | (111 | ) | — | ||||||||
Purchase of property, plant and equipment and intangible assets | 17,18 | (119 | ) | (147 | ) | |||||||
Proceeds from sale of property, plant and equipment and intangible assets | 10 | 17 | ||||||||||
Purchase of available-for-sale securities | (915 | ) | (3,193 | ) | ||||||||
Proceeds from sale and redemption of available-for-sale securities | 616 | 418 | ||||||||||
|
|
|
| |||||||||
Net cash flow used in investing activities | (519 | ) | (2,905 | ) | ||||||||
|
|
|
| |||||||||
Cash flows (used in)/from financing activities | ||||||||||||
Issue of Perpetual Capital Securities | 27 | 750 | 500 | |||||||||
Issue of debt securities | 7,599 | 10,983 | ||||||||||
Repayment of debt securities | (10,472 | ) | (12,046 | ) | ||||||||
Repurchase of other equity instruments | 27 | (83 | ) | — | ||||||||
Dividends paid on ordinary shares | 8 | (261 | ) | (210 | ) | |||||||
Dividends paid on preference shares classified in equity | 8 | (2 | ) | (19 | ) | |||||||
Dividends paid on Reserve Capital Instruments | 8 | (21 | ) | (21 | ) | |||||||
Dividends paid on Perpetual Capital Securities | 8 | (45 | ) | — | ||||||||
|
|
|
| |||||||||
Net cash flow used in financing activities | (2,535 | ) | (813 | ) | ||||||||
|
|
|
| |||||||||
Net decrease in cash and cash equivalents | (7,734 | ) | (3,970 | ) | ||||||||
|
|
|
| |||||||||
Cash and cash equivalents at beginning of the period | 27,363 | 37,179 | ||||||||||
Effects of exchange rate changes on cash and cash equivalents | (628 | ) | (579 | ) | ||||||||
|
|
|
| |||||||||
Cash and cash equivalents at the end of the period | 28 | 19,001 | 32,630 | |||||||||
|
|
|
| |||||||||
The accompanying Notes to the Financial Statements and the Risk Review form an integral part of these Condensed Consolidated Interim Financial Statements.
| 106 | Santander UK plc |
Table of Contents
Primary financial statements | financial statements | |
|
1. ACCOUNTING POLICIES
These Condensed Consolidated Interim Financial Statements are prepared for Santander UK plc (the ‘Company’) and the Santander UK plc group (the ‘Santander UK group’) under the UK Companies Act 2006. The principal activity of the Santander UK group is the provision of an extensive range of personal financial services, and a wide range of banking and financial services to business and public sector customers.
Santander UK plc is a public limited company, incorporated in England and Wales having a registered office in England. It is an operating company undertaking banking and financial services transactions.
Basis of preparation
The financial information in these Condensed Consolidated Interim Financial Statements does not constitute statutory accounts as defined in section 434 of the UK Companies Act 2006. Statutory accounts for the year ended 31 December 2014 have been delivered to the Registrar of Companies. The auditor’s report on those accounts was unqualified, did not draw attention to any matters by way of emphasis and did not contain a statement under section 498(2) of the UK Companies Act 2006.
Compliance with International Financial Reporting Standards
The Condensed Consolidated Interim Financial Statements have been prepared in accordance with International Accounting Standard (‘IAS’) 34 ‘Interim Financial Reporting’, as issued by the International Accounting Standards Board (‘IASB’) and adopted by the European Union, and the Disclosure Rules and Transparency Rules of the Financial Conduct Authority (‘FCA’). They do not include all the information and disclosures normally required for full annual financial statements and should be read in conjunction with the Consolidated Financial Statements of the Santander UK group for the year ended 31 December 2014 which were prepared in accordance with International Financial Reporting Standards as adopted by the European Union. Those Consolidated Financial Statements were also prepared in accordance with International Financial Reporting Standards as issued by the IASB including interpretations issued by the IFRS Interpretations Committee (‘IFRIC’) of the IASB (together ‘IFRS’). The Santander UK group has also complied with its legal obligation to comply with International Financial Reporting Standards as adopted by the European Union as there are no applicable differences between the two frameworks for the periods presented.
The same accounting policies, presentation and methods of computation are followed in these Condensed Consolidated Interim Financial Statements as were applied in the presentation of the Santander UK group’s 2014 Annual Report. Copies of the Santander UK group’s 2014 Annual Report are available on the Santander UK group’s website or upon request from Investor Relations, Santander UK plc, 2 Triton Square, Regent’s Place, London NW1 3AN.
The British Bankers’ Association Code for Financial Reporting Disclosure
The British Bankers’ Association Code for Financial Reporting Disclosure (the ‘Disclosure Code’) sets out disclosure principles together with supporting guidance in respect of the financial statements of UK banks. The Santander UK group has adopted the Disclosure Code and these Condensed Consolidated Interim Financial Statements have been prepared in compliance with the Disclosure Code’s principles.
| 2015 Half Yearly Financial Report | 107 |
Table of Contents
Financial statements
Future accounting developments
The Santander UK group has not yet adopted the following significant new or revised standards and interpretations, and amendments thereto, which have been issued but which are not yet effective for the Santander UK group:
| a) | IFRS 9 ‘Financial Instruments’ (‘IFRS 9’) – In July 2014, the IASB issued the final version of IFRS 9 which includes the completion of all phases of the project to replace IAS 39 ‘Financial Instruments: Recognition and Measurement’ as discussed below. |
Phase 1: Classification and measurement of financial assets and financial liabilities. Financial assets are classified on the basis of the business model within which they are held and their contractual cash flow characteristics. The standard also introduces a ‘fair value through other comprehensive income’ measurement category for particular simple debt instruments. The requirements for the classification and measurement of financial liabilities were carried forward unchanged from IAS 39, however, the requirements relating to the fair value option for financial liabilities were changed to address own credit risk and, in particular, the presentation of gains and losses within other comprehensive income.
Phase 2: Impairment methodology. IFRS 9 fundamentally changes the impairment requirements relating to the accounting for an entity’s expected credit losses on its financial assets and commitments to extend credit. It is no longer necessary for a credit event to have occurred before credit losses are recognised. Instead, an entity always accounts for expected credit losses, and changes in those expected credit losses. The amount of expected credit losses is updated at each reporting date to reflect changes in credit risk since initial recognition.
Phase 3: Hedge accounting. These requirements align hedge accounting more closely with risk management and establish a more principle-based approach to hedge accounting. Dynamic hedging of open portfolios is being dealt with as a separate project and until such time as that project is complete, entities can choose between applying the hedge accounting requirements of IFRS 9 or to continue to apply the existing hedge accounting requirements in IAS 39. The revised hedge accounting requirements in IFRS 9 are applied prospectively.
The effective date of IFRS 9 is 1 January 2018. For annual periods beginning before 1 January 2018, an entity may elect to early apply only the requirements for the presentation of gains and losses on financial liabilities designated at fair value through profit or loss. At the date of publication of these Condensed Consolidated Interim Financial Statements the standard is awaiting EU endorsement and the impact of the standard is currently being assessed. It is not yet practicable to quantify the effect of IFRS 9 on these Condensed Consolidated Interim Financial Statements.
| b) | IFRS 15 ‘Revenue from Contracts with Customers’ (‘IFRS 15’) – In May 2014, the IASB issued IFRS 15. The effective date of IFRS 15 is 1 January 2018. The standard establishes the principles that shall be applied in connection with revenue from contracts with customers including the core principle that the recognition of revenue must depict the transfer of promised goods or services to customers in an amount that reflects the entitlement to consideration in exchange for those goods and services. IFRS 15 applies to all contracts with customers but does not apply to lease contracts, insurance contracts, financial instruments and certain non-monetary exchanges. At the date of publication of these Condensed Consolidated Interim Financial Statements the standard is awaiting EU endorsement. Whilst it is expected that a significant proportion of the Santander UK group’s revenue will be outside the scope of IFRS 15, the impact of the standard is currently being assessed. It is not yet practicable to quantify the effect of IFRS 15 on these Condensed Consolidated Interim Financial Statements. |
| c) | There are a number of other standards which have been issued or amended that are expected to be effective in future periods. However, it is not practicable to provide a reasonable estimate of their effects on the Santander UK group’s Condensed Consolidated Interim Financial Statements until a detailed review has been completed. |
The Condensed Consolidated Interim Financial Statements reflect all adjustments that, in the opinion of management of the Santander UK group, are necessary for a fair presentation of the results of operations for the interim period. All such adjustments to the financial information are of a normal, recurring nature. Because the results from common banking activities are so closely related and responsive to changes in market conditions, the results for any interim period are not necessarily indicative of the results that can be expected for the year.
GOING CONCERN
The Directors have assessed the ability of the Santander UK group to continue as a going concern and confirm they are satisfied that the Santander UK group has adequate resources to continue in business for the foreseeable future. For this reason, they continue to adopt the ‘going concern’ basis of accounting for preparing the Condensed Consolidated Interim Financial Statements.
CRITICAL ACCOUNTING POLICIES AND AREAS OF SIGNIFICANT MANAGEMENT JUDGEMENT
The preparation of the Condensed Consolidated Interim Financial Statements requires management to make estimates and judgements that affect the reported amount of assets and liabilities at the date of the Condensed Consolidated Interim Financial Statements and the reported amount of income and expenses during the reporting period. Management evaluates its estimates and judgements on an ongoing basis. Management bases its estimates and judgements on historical experience and on various other factors that are believed to be reasonable under the circumstances. Actual results may differ from these estimates under different assumptions or conditions.
There have been no significant changes in the basis upon which estimates have been determined compared to that applied in the 2014 Annual Report.
| 108 | Santander UK plc |
Table of Contents
Primary financial statements | Notes to the financial statements | |
|
2. SEGMENTS
The principal activity of the Santander UK group is financial services. The Santander UK group’s business is managed and reported on the basis of the following segments:
| • | Retail Banking; |
| • | Commercial Banking; |
| • | Corporate & Institutional Banking; and |
| • | Corporate Centre. |
Following a strategic review, the segmental financial information reported to the Board (Santander UK’s chief operating decision maker) was revised in the fourth quarter of 2014, and prior periods restated, principally to designate three distinct customer business segments, which reflect how we now manage and operate: Retail Banking, Commercial Banking and Corporate & Institutional Banking; and allocate indirect income, expenses and charges previously held at the Corporate Centre, which can be attributed to the other customer segments. This included a review of the internal transfer pricing policy, which resulted in a further allocation of funding and liquidity costs, central operating expenses and other provisions such as conduct, branch de-duplication, the UK Bank Levy and FSCS charges.
With the allocation of indirect income, expenses and charges from the Corporate Centre and with the other distinct customer business segments at differing stages of commercial maturity, we are now able to identify better and drive with greater granularity the key drivers of our business performance. This enables a more targeted apportionment of capital and other resources in line with the individual strategies and objectives of each business segment. The segmental analyses for prior periods presented in these Condensed Consolidated Interim Financial Statements have been adjusted to reflect these changes.
The Santander UK group’s segments are strategic business units that offer different products and services. They are managed separately because each business requires different technology and marketing strategies. The Santander UK group has four segments:
| • | Retail Banking business activities remain broadly unchanged, offering a wide range of products and financial services to individuals and small businesses (with less than two directors, owners or partners) through a network of branches and ATMs, as well as through telephony, e-commerce and intermediary channels. It principally serves personal banking customers. Retail Banking products include residential mortgage loans, savings and current accounts, credit cards and personal loans as well as a range of insurance products. Retail Banking also includes Santander Consumer Finance, predominantly a vehicle finance business. |
| • | Commercial Banking provides banking services to companies with a turnover of between £250,000 and £500m per annum through our enhanced platform, distribution capability and product suite through a network of regional business centres and through telephony and e-commerce channels, and commercial real estate and Social Housing. Commercial Banking products and services include loans, bank accounts, deposits, treasury services, invoice discounting, cash transmission and asset finance. |
| • | Corporate & Institutional Banking is a financial markets business focused on providing value added financial services to large corporates, with an annual turnover above £500m, and financial institutions, where they can be best serviced in terms of their more specialised and tailored product needs, and benefit from the Banco Santander group’s global capability. It also serves the rest of Santander UK’s business (including the Retail Banking and Commercial Banking divisions) from a product perspective. It is structured into five main product areas: Rates, Foreign exchange and money markets, Equity, Credit and Transaction Banking. In addition, large and complex clients are covered by teams organised along industry lines. Rates covers sales and trading activity for fixed income products. Foreign exchange offers a range of foreign exchange products and money markets runs securities lending/borrowing and repo businesses. Equity covers equity derivatives and property derivatives. Equity derivatives activities include the manufacture of structured products sold to retail and corporate customers of both Santander UK and of other financial institutions who sell them on to their customers. Credit originates loan and bond transactions in primary markets as well as their intermediation in secondary markets. Transaction Banking provides lending and cash management services, including deposit taking and trade finance. |
| • | Corporate Centre predominantly consists of the non-core corporate and legacy portfolios, mark-to-market gains/losses arising from banking book activities and residual term mismatches. It includes Financial Management & Investor Relations (‘FMIR’) and the non-core corporate and legacy portfolios. FMIR is responsible for managing capital and funding, balance sheet composition and structure, and strategic liquidity risk for the Santander UK group. The non-core corporate and legacy portfolios include aviation, shipping, infrastructure, commercial mortgages, Social Housing loans and structured credit assets, all of which are being run-down and/or managed for value. |
The segment information below is presented on the basis used by the Board to evaluate performance and allocate resources. The Board reviews discrete financial information for each segment of the business, including measures of operating results, assets and liabilities. The segment information reviewed by the Board is prepared on a statutory basis of accounting.
Transactions between the business segments are on normal commercial terms and conditions. The accounting policies of the segments are the same as those described in the summary of significant accounting policies. Internal charges and internal UK transfer pricing adjustments have been reflected in the performance of each segment. Revenue sharing agreements are used to allocate external customer revenues to a business segment on a reasonable basis. Funds are ordinarily reallocated between segments, resulting in funding cost transfers disclosed in operating income. Interest charged for these funds is based on the Santander UK group’s cost of wholesale funding.
Interest income and interest expense have not been reported separately. The majority of the revenues from the segments presented below are interest income in nature and the Board relies primarily on net interest income to both assess the performance of the segment and to make decisions regarding allocation of segmental resources.
| 2015 Half Yearly Financial Report | 109 |
Table of Contents
Financial statements
30 June 2015 | Retail Banking £m | Commercial Banking £m | Corporate & Institutional Banking £m | Corporate Centre £m | Total £m | |||||||||||||||
Net interest income/(expense) | 1,588 | 221 | 39 | (65 | ) | 1,783 | ||||||||||||||
Non-interest income | 264 | 72 | 151 | 13 | 500 | |||||||||||||||
|
|
|
|
|
|
|
|
|
| |||||||||||
Total operating income/(expense) | 1,852 | 293 | 190 | (52 | ) | 2,283 | ||||||||||||||
|
|
|
|
|
|
|
|
|
| |||||||||||
Administration expenses | (792 | ) | (149 | ) | (123 | ) | — | (1,064 | ) | |||||||||||
Depreciation, amortisation and impairment | (98 | ) | (30 | ) | (8 | ) | — | (136 | ) | |||||||||||
|
|
|
|
|
|
|
|
|
| |||||||||||
Total operating expenses excluding impairment losses, provisions and charges | (890 | ) | (179 | ) | (131 | ) | — | (1,200 | ) | |||||||||||
|
|
|
|
|
|
|
|
|
| |||||||||||
Impairment (losses)/releases on loans and advances | (85 | ) | (20 | ) | 21 | 27 | (57 | ) | ||||||||||||
Provisions for other liabilities and charges | (95 | ) | (2 | ) | — | — | (97 | ) | ||||||||||||
|
|
|
|
|
|
|
|
|
| |||||||||||
Total operating impairment losses, provisions and charges | (180 | ) | (22 | ) | 21 | 27 | (154 | ) | ||||||||||||
|
|
|
|
|
|
|
|
|
| |||||||||||
Profit/(loss) before tax | 782 | 92 | 80 | (25 | ) | 929 | ||||||||||||||
|
|
|
|
|
|
|
|
|
| |||||||||||
Revenue from external customers | 2,244 | 367 | 214 | (542 | ) | 2,283 | ||||||||||||||
Inter-segment revenue | (392 | ) | (74 | ) | (24 | ) | 490 | — | ||||||||||||
|
|
|
|
|
|
|
|
|
| |||||||||||
Total operating income/(expense) | 1,852 | 293 | 190 | (52 | ) | 2,283 | ||||||||||||||
|
|
|
|
|
|
|
|
|
| |||||||||||
Customer loans | 162,555 | 20,037 | 5,712 | 7,859 | 196,163 | |||||||||||||||
Total assets(1) | 167,378 | 20,037 | 38,548 | 51,263 | 277,226 | |||||||||||||||
|
|
|
|
|
|
|
|
|
| |||||||||||
Customer deposits | 134,141 | 16,604 | 2,159 | 4,214 | 157,118 | |||||||||||||||
Total liabilities | 137,837 | 16,604 | 34,182 | 73,407 | 262,030 | |||||||||||||||
|
|
|
|
|
|
|
|
|
| |||||||||||
Average number of staff(2) | 17,741 | 2,006 | 884 | 8 | 20,639 | |||||||||||||||
|
|
|
|
|
|
|
|
|
| |||||||||||
30 June 2014 | ||||||||||||||||||||
Net interest income/(expense) | 1,486 | 173 | 38 | (24 | ) | 1,673 | ||||||||||||||
Non-interest income | 282 | 55 | 144 | 38 | 519 | |||||||||||||||
|
|
|
|
|
|
|
|
|
| |||||||||||
Total operating income | 1,768 | 228 | 182 | 14 | 2,192 | |||||||||||||||
|
|
|
|
|
|
|
|
|
| |||||||||||
Administration (expenses)/recoveries | (752 | ) | (131 | ) | (112 | ) | 119 | (876 | ) | |||||||||||
Depreciation, amortisation and impairment | (112 | ) | (28 | ) | (1 | ) | (206 | ) | (347 | ) | ||||||||||
|
|
|
|
|
|
|
|
|
| |||||||||||
Total operating expenses excluding impairment losses, provisions and charges | (864 | ) | (159 | ) | (113 | ) | (87 | ) | (1,223 | ) | ||||||||||
|
|
|
|
|
|
|
|
|
| |||||||||||
Impairment losses on loans and advances | (107 | ) | (54 | ) | (2 | ) | (9 | ) | (172 | ) | ||||||||||
Provisions for other liabilities and charges | (257 | ) | 5 | — | — | (252 | ) | |||||||||||||
|
|
|
|
|
|
|
|
|
| |||||||||||
Total operating impairment losses, provisions and charges | (364 | ) | (49 | ) | (2 | ) | (9 | ) | (424 | ) | ||||||||||
|
|
|
|
|
|
|
|
|
| |||||||||||
Profit/(loss) before tax | 540 | 20 | 67 | (82 | ) | 545 | ||||||||||||||
|
|
|
|
|
|
|
|
|
| |||||||||||
Revenue from external customers | 2,233 | 308 | 212 | (561 | ) | 2,192 | ||||||||||||||
Inter-segment revenue | (465 | ) | (80 | ) | (30 | ) | 575 | — | ||||||||||||
|
|
|
|
|
|
|
|
|
| |||||||||||
Total operating income | 1,768 | 228 | 182 | 14 | 2,192 | |||||||||||||||
|
|
|
|
|
|
|
|
|
| |||||||||||
31 December 2014 | ||||||||||||||||||||
Customer loans | 158,515 | 18,637 | 5,224 | 8,276 | 190,652 | |||||||||||||||
Total assets(1) | 163,430 | 18,637 | 38,301 | 55,609 | 275,977 | |||||||||||||||
|
|
|
|
|
|
|
|
|
| |||||||||||
Customer deposits | 129,584 | 15,327 | 2,325 | 5,174 | 152,410 | |||||||||||||||
Total liabilities | 132,541 | 15,327 | 36,359 | 77,557 | 261,784 | |||||||||||||||
|
|
|
|
|
|
|
|
|
| |||||||||||
Average number of staff(2) | 17,682 | 1,849 | 724 | 8 | 20,263 | |||||||||||||||
|
|
|
|
|
|
|
|
|
| |||||||||||
| (1) | Includes customer loans, net of impairment loss allowances. |
| (2) | Full-time equivalents. |
| 110 | Santander UK plc |
Table of Contents
Primary financial statements | Notes to the financial statements | |
|
3. NET TRADING AND OTHER INCOME
| Six months ended 30 June 2015 £m | Six months ended 30 June 2014 £m | |||||||
Net trading and funding of other items by the trading book | 100 | 194 | ||||||
Net income from operating lease assets | 22 | 21 | ||||||
Net (losses)/gains on assets designated at fair value through profit or loss | (4 | ) | 113 | |||||
Net losses on liabilities designated at fair value through profit or loss | (27 | ) | (82 | ) | ||||
Net gains/(losses) on derivatives managed with assets/liabilities held at fair value through profit or loss | 22 | (71 | ) | |||||
Net share of profit from associates and joint ventures | 6 | 4 | ||||||
Net profit on sale of available-for-sale assets | 8 | — | ||||||
Net losses on sale of property, plant and equipment | (3 | ) | — | |||||
Hedge ineffectiveness and other | (1 | ) | (25 | ) | ||||
|
|
|
| |||||
| 123 | 154 | |||||||
|
|
|
| |||||
‘Net trading and funding of other items by the trading book’ includes fair value losses of £7m (six months ended 30 June 2014: £15m) on embedded derivatives bifurcated from certain equity index-linked deposits. The embedded derivatives are economically hedged internally with the equity derivatives trading desk. These transactions are managed as part of the overall positions of the equity derivatives trading desk, the results of which are also included in this line item, and amounted to gains of £8m (six months ended 30 June 2014: £16m). As a result, the net fair value movements recognised on the equity index-linked deposits and the related economic hedges were net gains of £1m (six months ended 30 June 2014: £1m). In June 2015, as part of a capital management exercise, Santander UK plc purchased certain of its debt instruments pursuant to a tender offer. This had no significant impact on the income statement.
4. ADMINISTRATION EXPENSES
| Six months ended 30 June 2015 £m | Six months ended 30 June 2014 £m | |||||||
Staff costs: | ||||||||
Wages and salaries | 369 | 338 | ||||||
Performance-related payments: | 86 | 77 | ||||||
Social security costs | 47 | 44 | ||||||
Pensions costs: - defined contribution plans | 24 | 30 | ||||||
- defined benefit plans: | ||||||||
- past service credit | 1 | (230 | ) | |||||
- other | 16 | 14 | ||||||
Other share-based payments | — | — | ||||||
Other personnel costs | 29 | 35 | ||||||
|
|
|
| |||||
| 572 | 308 | |||||||
Property, plant and equipment expenses | 91 | 97 | ||||||
Information technology expenses | 195 | 243 | ||||||
Other administration expenses | 206 | 228 | ||||||
|
|
|
| |||||
| 1,064 | 876 | |||||||
|
|
|
| |||||
In 2014, a net gain of £218m arose as a result of scheme changes that limit future defined benefit pension entitlements and provide for the longer term sustainability of our staff pension arrangement, as set out in Note 25. The net gain comprised a past service credit of £230m, partially offset by a one-off contribution to the defined contribution scheme for affected members of £10m, both classified in pensions costs, and implementation costs of £2m classified in other administration expenses.
5. DEPRECIATION, AMORTISATION AND IMPAIRMENT
| Six months ended 30 June 2015 £m | Six months ended 30 June 2014 £m | |||||||
Depreciation of property, plant and equipment | 107 | 110 | ||||||
Amortisation and impairment of intangible assets | 29 | 237 | ||||||
|
|
|
| |||||
| 136 | 347 | |||||||
|
|
|
| |||||
Amortisation and impairment of intangible assets in 2014 included £206m in respect of the impairment of software, as set out in Note 17. There was no impairment in the six months ended 30 June 2015.
| 2015 Half Yearly Financial Report | 111 |
Table of Contents
Financial statements
6. IMPAIRMENT LOSSES AND PROVISIONS
| Six months ended 30 June 2015 £m | Six months ended 30 June 2014 £m | |||||||
Impairment losses on loans and advances: | ||||||||
- loans and advances to customers (Note 13) | 101 | 220 | ||||||
- loans and advances to banks (Note 12) | — | — | ||||||
- loans and receivables securities | — | — | ||||||
Recoveries of loans and advances (Note 13) | (44 | ) | (48 | ) | ||||
|
|
|
| |||||
| 57 | 172 | |||||||
|
|
|
| |||||
Impairment losses on available-for-sale financial assets (Note 15) | — | — | ||||||
|
|
|
| |||||
Provisions for other liabilities and charges (Note 24) | 97 | 252 | ||||||
|
|
|
| |||||
Total impairment losses and provisions charged to the income statement | 154 | 424 | ||||||
|
|
|
| |||||
7. TAXATION
| Six months ended 30 June 2015 £m | Six months ended 30 June 2014 £m | |||||||
Current tax: | ||||||||
UK corporation tax on profit for the period | 164 | 40 | ||||||
Adjustments in respect of prior years | (11 | ) | (4 | ) | ||||
|
|
|
| |||||
Total current tax | 153 | 36 | ||||||
|
|
|
| |||||
Deferred tax: | ||||||||
Origination and reversal of temporary differences | 38 | 79 | ||||||
Change in rate of UK corporation tax | — | (7 | ) | |||||
Adjustments in respect of prior years | 4 | (1 | ) | |||||
|
|
|
| |||||
Total deferred tax | 42 | 71 | ||||||
|
|
|
| |||||
Tax on profit | 195 | 107 | ||||||
|
|
|
| |||||
Interim period corporation tax is accrued based on the estimated average annual effective corporation tax rate for the year of 21.6% (2014: 21.2%). The standard rate of UK corporation tax was 20.25% (2014: 21.5%). The standard rate of UK corporation tax was reduced from 21% to 20% with effect from 1 April 2015. Taxation for other jurisdictions is calculated at the rates prevailing in the relevant jurisdictions.
The tax on profit before tax differs from the theoretical amount that would arise using the basic corporation tax rate of the Company as follows:
| Six months ended 30 June 2015 £m | Six months ended 30 June 2014 £m | |||||||
Profit before tax | 929 | 545 | ||||||
|
|
|
| |||||
Tax calculated at a tax rate of 20.25% (six months ended 30 June 2014: 21.5%) | 188 | 118 | ||||||
Non-deductible preference dividends paid | 1 | 1 | ||||||
Non-deductible UK Bank Levy | 12 | 7 | ||||||
Other non-equalised items | 4 | (4 | ) | |||||
Effect of non-UK profits and losses | (1 | ) | (1 | ) | ||||
Utilisation of capital losses for which credit was not previously recognised | (2 | ) | (2 | ) | ||||
Effect of change in tax rate on deferred tax provision | — | (7 | ) | |||||
Adjustment to prior year provisions | (7 | ) | (5 | ) | ||||
|
|
|
| |||||
Tax charge | 195 | 107 | ||||||
|
|
|
| |||||
The Summer Budget 2015 was delivered on 8 July 2015 and announced further reductions in the Corporation Tax rate from 20% to 19% by 2017 and to 18% by 2020. In addition, it is proposed that an 8% surcharge will apply to banking companies from 1 January 2016. As these changes were not substantially enacted by the balance sheet date, the effects are not included in the Condensed Consolidated Interim Financial Statements.
| 112 | Santander UK plc |
Table of Contents
Primary financial statements | Notes to the financial statements | |
|
8. DIVIDENDS
a) Ordinary share capital
Dividends of £261m (2014: £210m) were paid on the Company’s ordinary shares in issue during the period. Interim dividends of £0.6m and £324m were approved on 24 March 2015 and 23 June 2015, respectively on the Company’s ordinary shares in issue.
b) Other equity instruments
The annual dividend of £21m (2014: £21m) on the Step-Up Callable Perpetual Reserve Capital Instruments was paid on 14 February 2015; the annual dividend of £0.4m (2014: £0.4m) on the £300m Step-up Callable Perpetual Preferred Securities, was paid on 22 March 2015; and the annual dividend of £2m (2014: £19m) on the £300m fixed/floating rate non-cumulative callable preference shares was paid on 24 May 2015.
The quarterly dividends of £24m and £8m (2014: £nil) on the £500m Perpetual Capital Securities were paid on 24 March and 24 June 2015; the quarterly dividends of £7m and £6m (2014: £nil) on the £300m Perpetual Capital Securities were paid on 24 March and 24 June 2015.
| 2015 Half Yearly Financial Report | 113 |
Table of Contents
Financial statements
9. TRADING ASSETS
| 30 June 2015 £m | 31 December 2014 £m | |||||||||
Loans and advances to banks | - securities purchased under resale agreements | 1,743 | 785 | |||||||
- other(1) | 5,387 | 5,151 | ||||||||
Loans and advances to customers | - securities purchased under resale agreements | 4,037 | 2,200 | |||||||
- other(1) | 1,580 | 807 | ||||||||
Debt securities | 5,879 | 7,981 | ||||||||
Equity securities | 6,999 | 4,776 | ||||||||
|
|
|
| |||||||
| 25,625 | 21,700 | |||||||||
|
|
|
| |||||||
| (1) | Total ‘other’ comprises short-term loans of £612m (2014: £816m) and cash collateral of £6,355m (2014: £5,142m). |
Included in the above balances are amounts owed to the Santander UK group by Banco Santander, S.A. and other subsidiaries of Banco Santander, S.A. outside the Santander UK group of £84m (2014: £48m) and £64m (2014: £73m) respectively.
10. DERIVATIVE FINANCIAL INSTRUMENTS
Derivatives are financial instruments whose value is derived from the price of one or more underlying items such as equities, equity indices, interest rates, foreign exchange rates, property indices, commodities and credit spreads. Derivatives enable users to manage exposure to credit or market risks. The Santander UK group sells derivatives to its customers and uses derivatives to manage its own exposure to credit and market risks. Details of the Santander UK group’s use of derivatives are set out in Note 15 to the Consolidated Financial Statements in the 2014 Annual Report.
| 30 June 2015 | 31 December 2014 | |||||||||||||||||||||||
| Fair value | Fair value | |||||||||||||||||||||||
Derivatives held for trading | Notional amount £m | Assets £m | Liabilities £m | Notional amount £m | Assets £m | Liabilities £m | ||||||||||||||||||
Exchange rate contracts: | ||||||||||||||||||||||||
- Cross-currency swaps | 121,092 | 3,271 | 4,031 | 113,977 | 2,227 | 3,077 | ||||||||||||||||||
- Foreign exchange swaps, options and forwards | 39,395 | 938 | 545 | 44,786 | 1,097 | 542 | ||||||||||||||||||
|
|
|
|
|
|
|
|
|
|
|
| |||||||||||||
| 160,487 | 4,209 | 4,576 | 158,763 | 3,324 | 3,619 | |||||||||||||||||||
|
|
|
|
|
|
|
|
|
|
|
| |||||||||||||
Interest rate contracts: | ||||||||||||||||||||||||
- Interest rate swaps | 549,961 | 10,434 | 10,187 | 589,182 | 12,782 | 12,333 | ||||||||||||||||||
- Caps, floors and swaptions | 51,564 | 1,872 | 1,658 | 53,341 | 2,087 | 1,996 | ||||||||||||||||||
- Futures (exchange traded) | 87,932 | 74 | 14 | 68,434 | 4 | 16 | ||||||||||||||||||
- Forward rate agreements | 88,517 | 5 | 39 | 91,353 | 3 | 42 | ||||||||||||||||||
|
|
|
|
|
|
|
|
|
|
|
| |||||||||||||
| 777,974 | 12,385 | 11,898 | 802,310 | 14,876 | 14,387 | |||||||||||||||||||
|
|
|
|
|
|
|
|
|
|
|
| |||||||||||||
Equity and credit contracts: | ||||||||||||||||||||||||
- Equity index swaps and similar products | 26,032 | 1,906 | 2,329 | 26,667 | 1,859 | 2,451 | ||||||||||||||||||
- Equity index options (exchange traded) | 13,526 | 230 | 1 | 10,681 | 149 | 1 | ||||||||||||||||||
- Credit default swaps and similar products | 55 | 24 | 2 | 66 | 25 | 2 | ||||||||||||||||||
|
|
|
|
|
|
|
|
|
|
|
| |||||||||||||
| 39,613 | 2,160 | 2,332 | 37,414 | 2,033 | 2,454 | |||||||||||||||||||
|
|
|
|
|
|
|
|
|
|
|
| |||||||||||||
Commodity contracts: | ||||||||||||||||||||||||
- OTC swaps | — | — | — | 18 | 2 | 2 | ||||||||||||||||||
|
|
|
|
|
|
|
|
|
|
|
| |||||||||||||
| — | — | — | 18 | 2 | 2 | |||||||||||||||||||
|
|
|
|
|
|
|
|
|
|
|
| |||||||||||||
Total derivative assets and liabilities held for trading | 978,074 | 18,754 | 18,806 | 998,505 | 20,235 | 20,462 | ||||||||||||||||||
|
|
|
|
|
|
|
|
|
|
|
| |||||||||||||
Derivatives held for hedging | ||||||||||||||||||||||||
Derivatives designated as fair value hedges: | ||||||||||||||||||||||||
Exchange rate contracts: | ||||||||||||||||||||||||
- Cross-currency swaps | 2,602 | 3 | 217 | 2,405 | 80 | 82 | ||||||||||||||||||
Interest rate contracts: | ||||||||||||||||||||||||
- Interest rate swaps | 71,661 | 1,274 | 1,204 | 80,976 | 1,600 | 1,564 | ||||||||||||||||||
|
|
|
|
|
|
|
|
|
|
|
| |||||||||||||
| 74,263 | 1,277 | 1,421 | 83,381 | 1,680 | 1,646 | |||||||||||||||||||
|
|
|
|
|
|
|
|
|
|
|
| |||||||||||||
Derivatives designated as cash flow hedges: | ||||||||||||||||||||||||
Exchange rate contracts: | ||||||||||||||||||||||||
- Cross-currency swaps | 19,063 | 463 | 1,741 | 20,047 | 1,008 | 577 | ||||||||||||||||||
Interest rate contracts: | ||||||||||||||||||||||||
- Interest rate swaps | 6,860 | 95 | 46 | 6,987 | 98 | 47 | ||||||||||||||||||
Equity derivative contracts | ||||||||||||||||||||||||
- Equity derivatives | 46 | — | 1 | — | — | — | ||||||||||||||||||
|
|
|
|
|
|
|
|
|
|
|
| |||||||||||||
| 25,969 | 558 | 1,788 | 27,034 | 1,106 | 624 | |||||||||||||||||||
|
|
|
|
|
|
|
|
|
|
|
| |||||||||||||
Total derivative assets and liabilities held for hedging | 100,232 | 1,835 | 3,209 | 110,415 | 2,786 | 2,270 | ||||||||||||||||||
|
|
|
|
|
|
|
|
|
|
|
| |||||||||||||
Total recognised derivative assets and liabilities | 1,078,306 | 20,589 | 22,015 | 1,108,920 | 23,021 | 22,732 | ||||||||||||||||||
|
|
|
|
|
|
|
|
|
|
|
| |||||||||||||
Included in the above balances are amounts owed to the Santander UK group by Banco Santander, S.A. and other subsidiaries of Banco Santander, S.A. outside the Santander UK group of £1,912m (2014: £2,063m) and £457m (2014: £475m), respectively, and amounts owed by the Santander UK group to Banco Santander, S.A. and other subsidiaries of Banco Santander, S.A. outside the Santander UK group of £1,979m (2014: £1,730m) and £433m (2014: £485m), respectively. The net exposures after collateral to the ultimate parent undertaking and fellow subsidiaries at 30 June 2015 amounted to £nil (2014: £nil) and £16m (2014: £nil) respectively, with collateral held exceeding the net position.
| 114 | Santander UK plc |
Table of Contents
Primary financial statements | Notes to the financial statements | |
|
The table below analyses the notional and fair values of derivatives by trading and settlement method.
| Notional | Asset | Liability | ||||||||||||||||||||||||||||||
| Traded over the counter | ||||||||||||||||||||||||||||||||
30 June 2015 | Traded on recognised exchanges £m | Settled by central counterparties £m | Not settled by central counterparties £m | Total £m | Traded on recognised exchanges £m | Traded over the counter £m | Traded on recognised exchanges £m | Traded over the counter £m | ||||||||||||||||||||||||
Exchange rate contracts | — | — | 182,152 | 182,152 | — | 4,675 | — | 6,534 | ||||||||||||||||||||||||
Interest rate contracts | 87,932 | 465,771 | 302,792 | 856,495 | 74 | 13,680 | 14 | 13,134 | ||||||||||||||||||||||||
Equity and credit contracts | 13,526 | — | 26,133 | 39,659 | 230 | 1,930 | 1 | 2,332 | ||||||||||||||||||||||||
Commodity contracts | — | — | — | — | — | — | — | — | ||||||||||||||||||||||||
|
|
|
|
|
|
|
|
|
|
|
|
|
|
|
| |||||||||||||||||
| 101,458 | 465,771 | 511,077 | 1,078,306 | 304 | 20,285 | 15 | 22,000 | |||||||||||||||||||||||||
|
|
|
|
|
|
|
|
|
|
|
|
|
|
|
| |||||||||||||||||
31 December 2014 | ||||||||||||||||||||||||||||||||
Exchange rate contracts | — | — | 181,215 | 181,215 | — | 4,412 | — | 4,278 | ||||||||||||||||||||||||
Interest rate contracts | 68,434 | 519,273 | 302,566 | 890,273 | 4 | 16,570 | 16 | 15,982 | ||||||||||||||||||||||||
Equity and credit contracts | 10,681 | — | 26,733 | 37,414 | 149 | 1,884 | 1 | 2,453 | ||||||||||||||||||||||||
Commodity contracts | — | — | 18 | 18 | — | 2 | — | 2 | ||||||||||||||||||||||||
|
|
|
|
|
|
|
|
|
|
|
|
|
|
|
| |||||||||||||||||
| 79,115 | 519,273 | 510,532 | 1,108,920 | 153 | 22,868 | 17 | 22,715 | |||||||||||||||||||||||||
|
|
|
|
|
|
|
|
|
|
|
|
|
|
|
| |||||||||||||||||
Net gains or losses arising from fair value and cash flow hedges included in net trading and other income
| Six months ended 30 June 2015 £m | Six months ended 30 June 2014 £m | |||||||
Fair value hedging: | ||||||||
- Gains on hedging instruments | 20 | 27 | ||||||
- Gain/(losses) on hedged items attributable to hedged risks | 24 | (7 | ) | |||||
|
|
|
| |||||
Fair value hedging ineffectiveness | 44 | 20 | ||||||
Cash flow hedging ineffectiveness | (51 | ) | (44 | ) | ||||
|
|
|
| |||||
| (7 | ) | (24 | ) | |||||
|
|
|
| |||||
The Santander UK group hedges its exposures to various risks, including interest rate risk and foreign currency risk, in connection with certain mortgage assets, covered bond issuances, and subordinated and senior debt securities in issue. The gains or losses arising on these assets and liabilities are presented in the table above on a combined basis.
11. FINANCIAL ASSETS DESIGNATED AT FAIR VALUE
| 30 June 2015 £m | 31 December 2014 £m | |||||||
Loans and advances to customers | 2,162 | 2,259 | ||||||
Debt securities | 567 | 622 | ||||||
|
|
|
| |||||
| 2,729 | 2,881 | |||||||
|
|
|
| |||||
Included in the above balances are amounts owed to the Santander UK group by Banco Santander, S.A. and other subsidiaries of Banco Santander, S.A. outside the Santander UK group of £nil (2014: £nil) and £45m (2014: £54m) respectively.
The maximum exposure to credit risk on loans and advances designated as held at fair value through profit or loss at the balance sheet date was mitigated by the Santander UK group having a charge over the residential properties in respect of lending to housing associations. See ‘Maximum exposure and net exposure to credit risk’ in the ‘Credit Risk Review’ section of the Risk Review.
The net gain during the period attributable to changes in credit risk for loans and advances designated at fair value was £25m (six months ended 30 June 2014: net gain of £10m). The cumulative net loss attributable to changes in credit risk for loans and advances designated at fair value at 30 June 2015 was £223m (31 December 2014: cumulative net loss of £248m).
12. LOANS AND ADVANCES TO BANKS
| 30 June 2015 £m | 31 December 2014 £m | |||||||
Placements with other banks - securities purchased under resale agreements | 909 | 273 | ||||||
- other | 1,589 | 1,781 | ||||||
Amounts due from Banco Santander - securities purchased under resale agreements | — | — | ||||||
- other | 2 | 3 | ||||||
|
|
|
| |||||
| 2,500 | 2,057 | |||||||
|
|
|
| |||||
| 2015 Half Yearly Financial Report | 115 |
Table of Contents
Financial statements
13. LOANS AND ADVANCES TO CUSTOMERS
| 30 June 2015 £m | 31 December 2014 £m | |||||||
Loans and advances to customers | 195,198 | 189,333 | ||||||
Amounts due from immediate parent company | 2 | — | ||||||
Amounts due from fellow Banco Santander group subsidiaries and joint ventures | 1,068 | 797 | ||||||
|
|
|
| |||||
Loans and advances to customers | 196,268 | 190,130 | ||||||
Less: impairment loss allowances | (1,329 | ) | (1,439 | ) | ||||
|
|
|
| |||||
Loans and advances to customers, net of impairment loss allowances | 194,939 | 188,691 | ||||||
|
|
|
| |||||
Movement in impairment loss allowances:
30 June 2015 | Loans secured on residential property £m | Corporate Loans £m | Finance leases £m | Other unsecured advances £m | Total £m | |||||||||||||||
At 1 January 2015: | ||||||||||||||||||||
- Observed | ||||||||||||||||||||
- Individual | 27 | 354 | — | — | 381 | |||||||||||||||
- Collective | 221 | 58 | 7 | 85 | 371 | |||||||||||||||
- Incurred but not yet observed | 331 | 146 | 47 | 163 | 687 | |||||||||||||||
|
|
|
|
|
|
|
|
|
| |||||||||||
| 579 | 558 | 54 | 248 | 1,439 | ||||||||||||||||
|
|
|
|
|
|
|
|
|
| |||||||||||
Charge/(release) to the income statement: | ||||||||||||||||||||
- Observed | ||||||||||||||||||||
- Individual | (1 | ) | (17 | ) | — | — | (18 | ) | ||||||||||||
- Collective | (7 | ) | 17 | 6 | 126 | 142 | ||||||||||||||
- Incurred but not yet observed | 1 | (27 | ) | 2 | 1 | (23 | ) | |||||||||||||
|
|
|
|
|
|
|
|
|
| |||||||||||
| (7 | ) | (27 | ) | 8 | 127 | 101 | ||||||||||||||
|
|
|
|
|
|
|
|
|
| |||||||||||
Write offs and other items(1) | (15 | ) | (72 | ) | (1 | ) | (123 | ) | (211 | ) | ||||||||||
|
|
|
|
|
|
|
|
|
| |||||||||||
At 30 June 2015: | ||||||||||||||||||||
- Observed | ||||||||||||||||||||
- Individual | 26 | 271 | — | — | 297 | |||||||||||||||
- Collective | 199 | 69 | 10 | 83 | 361 | |||||||||||||||
- Incurred but not yet observed | 332 | 119 | 51 | 169 | 671 | |||||||||||||||
|
|
|
|
|
|
|
|
|
| |||||||||||
| 557 | 459 | 61 | 252 | 1,329 | ||||||||||||||||
|
|
|
|
|
|
|
|
|
| |||||||||||
31 December 2014 | ||||||||||||||||||||
At 1 January 2014: | ||||||||||||||||||||
- Observed | ||||||||||||||||||||
- Individual | 39 | 388 | — | — | 427 | |||||||||||||||
- Collective | 264 | 94 | 8 | 80 | 446 | |||||||||||||||
- Incurred but not yet observed | 290 | 151 | 36 | 205 | 682 | |||||||||||||||
|
|
|
|
|
|
|
|
|
| |||||||||||
| 593 | 633 | 44 | 285 | 1,555 | ||||||||||||||||
|
|
|
|
|
|
|
|
|
| |||||||||||
Charge/(release) to the income statement: | ||||||||||||||||||||
- Observed | ||||||||||||||||||||
- Individual | (12 | ) | 116 | — | — | 104 | ||||||||||||||
- Collective | 13 | (36 | ) | 6 | 277 | 260 | ||||||||||||||
- Incurred but not yet observed | 41 | (5 | ) | 11 | (42 | ) | 5 | |||||||||||||
|
|
|
|
|
|
|
|
|
| |||||||||||
| 42 | 75 | 17 | 235 | 369 | ||||||||||||||||
|
|
|
|
|
|
|
|
|
| |||||||||||
Write offs and other items(1) | (56 | ) | (150 | ) | (7 | ) | (272 | ) | (485 | ) | ||||||||||
|
|
|
|
|
|
|
|
|
| |||||||||||
At 31 December 2014: | ||||||||||||||||||||
- Observed | ||||||||||||||||||||
- Individual | 27 | 354 | — | — | 381 | |||||||||||||||
- Collective | 221 | 58 | 7 | 85 | 371 | |||||||||||||||
- Incurred but not yet observed | 331 | 146 | 47 | 163 | 687 | |||||||||||||||
|
|
|
|
|
|
|
|
|
| |||||||||||
| 579 | 558 | 54 | 248 | 1,439 | ||||||||||||||||
|
|
|
|
|
|
|
|
|
| |||||||||||
| (1) | Mortgage write-offs exclude the effect of the unwind over time of the discounting in estimating losses, as described in the accounting policy on page 237 of the 2014 Annual Report. Mortgage write-offs including this effect were £20m (six months ended 30 June 2014: £33m). |
Recoveries:
| Loans secured on residential property £m | Corporate Loans £m | Finance leases £m | Other unsecured advances £m | Total £m | ||||||||||||||||
30 June 2015 | 1 | 1 | 1 | 41 | 44 | |||||||||||||||
|
|
|
|
|
|
|
|
|
| |||||||||||
30 June 2014 | 2 | 4 | 1 | 41 | 48 | |||||||||||||||
|
|
|
|
|
|
|
|
|
| |||||||||||
| 116 | Santander UK plc |
Table of Contents
Primary financial statements | Notes to the financial statements | |
|
14. SECURITISATIONS AND COVERED BONDS
a) Securitisations
i) Master Trust Structures
Holmes
In the first half of 2015, there were no issuances from Holmes Master Issuer plc (2014: £nil). Mortgage-backed notes totalling £2.1bn (2014: £3.1bn) equivalent were redeemed during the period.
Fosse
In the first half of 2015, there were issuances of £1bn from Fosse Master Issuer plc (2014: £1bn). Mortgage-backed notes totalling £3.6bn (2014: £2.9bn) equivalent were redeemed during the period.
ii) Other securitisation structures
Motor
In the first half of 2015, the Santander UK group issued £1bn notes (2014: £1bn) through pass-through stand-alone vehicles for the securitisation of receivables derived from credit agreements with retail customers for the purchases of financed vehicles.
Auto ABS UK Loans plc
As part of the acquisition of PSA Finance UK Limited in the first half of 2015, as described in Note 35, the Santander UK group recognised £1.2bn notes issued through Auto ABS UK Loans plc, a pass-through stand-alone vehicle for the securitisation of receivables derived from credit agreements with retail customers for the purchases of financed vehicles.
b) Covered Bonds
At 30 June 2015, gross assets assigned amounted to £24,103m (2014: £25,598m) and notes in issue amounted to £15,507m (2014: £18,379m).
15. AVAILABLE-FOR-SALE SECURITIES
| 30 June 2015 £m | 31 December 2014 £m | |||||||
Debt securities | 9,062 | 8,919 | ||||||
Equity securities | 34 | 25 | ||||||
|
|
|
| |||||
| 9,096 | 8,944 | |||||||
|
|
|
| |||||
16. INTERESTS IN OTHER ENTITIES
Santander UK plc has interests in subsidiaries, associates, joint ventures and unconsolidated structured entities, as set out in Note 23 to the Consolidated Financial Statements in the 2014 Annual Report. The unconsolidated structured entities include Abbey National Capital Trust I and Abbey National Capital LP I, which are 100% owned finance subsidiaries (as defined in Regulation S-X under the US Securities Act 1933, as amended) of Santander UK plc. On 7 February 2000, Abbey National Capital Trust I issued US$1bn of 8.963% Non-cumulative Trust Preferred Securities, which have been registered under the US Securities Act of 1933, as amended. Abbey National Capital Trust I serves solely as a passive vehicle holding the partnership preferred securities issued by Abbey National Capital LP I and each has passed all the rights relating to such partnership preferred securities to the holders of trust preferred securities issued by Abbey National Capital Trust I. All of the trust preferred securities and the partnership preferred securities have been fully and unconditionally guaranteed on a subordinated basis by Santander UK plc. The terms of the securities do not include any significant restrictions on the ability of Santander UK plc to obtain funds, by dividend or loan, from any subsidiary.
Interests in subsidiaries
On 1 June 2015, the deposit taking business of Abbey National International Limited (‘ANIL’) was transferred to Santander UK plc Jersey branch. This followed the sanctioning by the Royal Court of Jersey on 8 May 2015 of a transfer scheme prepared under Article 48D of, and the Schedule to the Banking Business (Jersey) Law 1991. From that date, ANIL was no longer considered a principal subsidiary of the Santander UK group.
On 3 February 2015, the Santander UK group through Santander Consumer (UK) plc purchased 50% of the shares of PSA Finance UK Limited, a company that offers a range of consumer finance and insurance products and services for individuals, businesses and distribution networks in the automotive industry. For further details on the acquisition, see Note 35. PSA Finance UK Limited has been consolidated as Santander UK directs its activities.
| 2015 Half Yearly Financial Report | 117 |
Table of Contents
Financial statements
17. INTANGIBLE ASSETS
During the period, the Santander UK group spent £52m (six months ended 30 June 2014: £7m) on additions to its computer software. The Santander UK group disposed of £nil (six months ended 30 June 2014: £nil) of computer software and recognised an impairment charge of £nil (six months ended 30 June 2014: £206m) in respect of software write-offs. The write-offs were for the decommissioning of redundant systems following the implementation of our new digital platform and the completion of our product simplification programme.
18. PROPERTY, PLANT AND EQUIPMENT
During the period, the Santander UK group spent £13m (six months ended 30 June 2014: £23m) on the refurbishment of its branches and office premises, £44m (six months ended 30 June 2014: £83m) on additions to its office fixtures and equipment, £nil (six months ended 30 June 2014: £4m) on computer software and £10m (six months ended 30 June 2014: £30m) on the acquisition of operating lease assets. The Santander UK group disposed £9m (six months ended 30 June 2014: £nil) of property, £6m (six months ended 30 June 2014: £8m) of office fixtures and equipment, £1m (six months ended 30 June 2014: £nil) of computer software and £11m (six months ended 30 June 2014: £38m) of operating lease assets during the period.
At 30 June 2015, capital expenditure contracted, but not provided for was £nil (2014: £nil) in respect of property, plant and equipment. Assets under construction with a total value of £96m (2014: £209m) are included in the total carrying value of property, plant and equipment at the balance sheet date.
19. DEPOSITS BY BANKS
| 30 June 2015 £m | 31 December 2014 £m | |||||||||
Items in the course of transmission | 357 | 308 | ||||||||
Deposits by banks | - securities sold under repurchase agreements | 4,188 | 4,797 | |||||||
Amounts due to Banco Santander | ||||||||||
- securities sold under repurchase agreements | 115 | — | ||||||||
- other | 951 | 966 | ||||||||
Amounts due to fellow Banco Santander subsidiaries | ||||||||||
- securities sold under repurchase agreements | — | — | ||||||||
- other | 128 | 129 | ||||||||
Deposits held as collateral | 386 | 758 | ||||||||
Other deposits | 1,127 | 1,256 | ||||||||
|
|
|
| |||||||
| 7,252 | 8,214 | |||||||||
|
|
|
| |||||||
20. TRADING LIABILITIES
| 30 June 2015 £m | 31 December 2014 £m | |||||||||
Deposits by banks | - securities sold under repurchase agreements | 3,615 | 4,508 | |||||||
- other(1) | 1,523 | 2,715 | ||||||||
Deposits by customers | - securities sold under repurchase agreements | 5,189 | 4,040 | |||||||
- other(1) | 636 | 859 | ||||||||
Short positions in securities and unsettled trades | 4,528 | 3,211 | ||||||||
|
|
|
| |||||||
| 15,491 | 15,333 | |||||||||
|
|
|
| |||||||
| (1) | Comprises cash collateral of £1,104m (2014: £1,905m) and short-term deposits of £1,055m (2014: £1,669m). |
Included in the above balances are amounts owed by the Santander UK group to Banco Santander, S.A. of £71m (2014: £433m) and to fellow subsidiaries of Banco Santander, S.A. of £87m (2014: £84m).
| 118 | Santander UK plc |
Table of Contents
Primary financial statements | Notes to the financial statements | |
|
21. FINANCIAL LIABILITIES DESIGNATED AT FAIR VALUE
| 30 June 2015 £m | 31 December 2014 £m | |||||||||
Debt securities in issue | - US$10bn Euro Commercial Paper Programme | 835 | 854 | |||||||
- US$20bn Euro Medium Term Note Programme | 363 | 464 | ||||||||
- Euro 10bn Note Certificate and Warrant Programme and Global Structured Solutions Programme | 1,292 | 1,517 | ||||||||
Warrants programme | 12 | 13 | ||||||||
|
|
|
| |||||||
| 2,502 | 2,848 | |||||||||
|
|
|
| |||||||
Included in the above balances are amounts owed to Banco Santander, S.A. of £21m (2014: £29m) and to fellow subsidiaries of Banco Santander, S.A. of £nil (2014: £67m).
Gains and losses arising from changes in the credit spread of liabilities issued by the Santander UK group reverse over the contractual life of the debt, provided that the debt is not repaid at a premium or a discount. The net gain during the period attributable to changes in the Santander UK group’s own credit risk on the above debt securities in issue was £20m (six months ended 30 June 2014: net loss of £8m). The cumulative net gain attributable to changes in the Santander UK group’s own credit risk on the above debt securities in issue at 30 June 2015 was £13m (31 December 2014: cumulative net loss of £7m).
At 30 June 2015, the amount that would be required to be contractually paid at maturity of the debt securities in issue above was £126m (2014: £165m) higher than the carrying value.
22. DEBT SECURITIES IN ISSUE
| 30 June 2015 £m | 31 December 2014 £m | |||||||
Bonds and medium term notes: | ||||||||
- Euro 35bn Global Covered Bond Programme | 15,507 | 18,379 | ||||||
- US$20bn Euro Medium Term Note Programme (See Note 21) | 15,051 | 11,785 | ||||||
- US$40bn Euro Medium Term Note Programme | 80 | 112 | ||||||
- US$20bn Commercial Paper Programme | 3,066 | 3,510 | ||||||
- Euro 5bn Guaranteed French Certificates of Deposit Programme | 557 | 968 | ||||||
- Certificates of deposit | 3,653 | 3,042 | ||||||
|
|
|
| |||||
| 37,914 | 37,796 | |||||||
|
|
|
| |||||
Securitisation programmes (See Note 14): | ||||||||
- Holmes | 4,062 | 6,144 | ||||||
- Fosse | 5,366 | 7,104 | ||||||
- Motor | 1,032 | 746 | ||||||
- Auto ABS UK | 1,010 | — | ||||||
|
|
|
| |||||
| 49,384 | 51,790 | |||||||
|
|
|
| |||||
Included in the above balances are amounts owed to Banco Santander, S.A. and other subsidiaries of Banco Santander, S.A. outside the Santander UK group of £73m (2014: £64m) and £125m (2014: £285m) respectively.
US$20bn Commercial Paper Programme
On 1 July 2015, Abbey National Treasury Services plc, US Branch set up a US$20bn Commercial Paper Programme for the issuance of commercial paper. The new programme will replace the Abbey National North America LLC (‘ANNA LLC’) US$20bn Commercial Paper Programme, and ANNA LLC will not issue any further commercial paper going forward.
23. SUBORDINATED LIABILITIES
| 30 June 2015 £m | 31 December 2014 £m | |||||||
£325m Sterling Preference Shares | 344 | 344 | ||||||
£175m Fixed/Floating Rate Tier One Preferred Income Capital Securities | 2 | 201 | ||||||
Undated subordinated liabilities | 1,616 | 1,711 | ||||||
Dated subordinated liabilities | 1,639 | 1,746 | ||||||
|
|
|
| |||||
| 3,601 | 4,002 | |||||||
|
|
|
| |||||
Included in the above balances are amounts owed by the Santander UK group to Banco Santander, S.A. and other subsidiaries of Banco Santander, S.A. outside the Santander UK group of £1,322m (2014: £1,867m) and £nil (2014: £nil) respectively.
£175m Fixed/Floating Rate Tier One Preferred Income Capital Securities
As part of a capital management exercise, 99% of the outstanding Tier One Preferred Income Capital Securities were purchased on 11 June 2015.
Dated subordinated liabilities
As part of a capital management exercise, 43% of the outstanding 8.963% Non-cumulative Trust Preferred Securities (8.963% Subordinated notes 2030) were purchased on 11 June 2015.
| 2015 Half Yearly Financial Report | 119 |
Table of Contents
Financial statements
24. PROVISIONS
| Conduct remediation | ||||||||||||||||||||
| PPI £m | Other products £m | Regulatory-related £m | Other £m | Total £m | ||||||||||||||||
At 1 January 2015 | 129 | 162 | 85 | 115 | 491 | |||||||||||||||
Additional provisions | — | 14 | 74 | 9 | 97 | |||||||||||||||
Used during the period | (56 | ) | (17 | ) | (33 | ) | (21 | ) | (127 | ) | ||||||||||
|
|
|
|
|
|
|
|
|
| |||||||||||
At 30 June 2015 | 73 | 159 | 126 | 103 | 461 | |||||||||||||||
|
|
|
|
|
|
|
|
|
| |||||||||||
To be settled: | ||||||||||||||||||||
- Within 12 months | 62 | 139 | 126 | 26 | 353 | |||||||||||||||
- In more than 12 months | 11 | 20 | — | 77 | 108 | |||||||||||||||
|
|
|
|
|
|
|
|
|
| |||||||||||
| 73 | 159 | 126 | 103 | 461 | ||||||||||||||||
|
|
|
|
|
|
|
|
|
| |||||||||||
At 1 January 2014 | 165 | 222 | 79 | 84 | 550 | |||||||||||||||
Additional provisions | 95 | 45 | 165 | 111 | 416 | |||||||||||||||
Used during the year | (131 | ) | (128 | ) | (159 | ) | (80 | ) | (498 | ) | ||||||||||
Transfers | — | 14 | — | — | 14 | |||||||||||||||
Other | — | 9 | — | — | 9 | |||||||||||||||
|
|
|
|
|
|
|
|
|
| |||||||||||
At 31 December 2014 | 129 | 162 | 85 | 115 | 491 | |||||||||||||||
|
|
|
|
|
|
|
|
|
| |||||||||||
To be settled: | ||||||||||||||||||||
- Within 12 months | 95 | 142 | 85 | 63 | 385 | |||||||||||||||
- In more than 12 months | 34 | 20 | — | 52 | 106 | |||||||||||||||
|
|
|
|
|
|
|
|
|
| |||||||||||
| 129 | 162 | 85 | 115 | 491 | ||||||||||||||||
|
|
|
|
|
|
|
|
|
| |||||||||||
a) Conduct remediation
The amounts in respect of conduct remediation comprise the estimated cost of making redress payments, including related costs, with respect to the past sales of products. In calculating the conduct remediation provision, management’s best estimate of the provision was calculated based on conclusions regarding the number of claims, of those, the number that will be upheld, and the estimated average settlement per case. Sensitivities relating to the provision for conduct remediation can be found in ‘Critical Accounting Policies and Areas of Significant Management Judgement’ in Note 1 to the Consolidated Financial Statements in the 2014 Annual Report.
(i) Payment Protection Insurance (‘PPI’)
The table below sets out the key drivers of the provision balance and forecast assumptions used in calculating the provision, as well as the sensitivity of the provision to changes in the assumptions.
| Cumulative to 30 June 2015 | Future expected | Sensitivity analysis Increase/decrease | ||||||||
Inbound complaints(1) (‘000) | 855 | 100 | 25,000 = £11m | |||||||
Outbound contact (‘000) | 372 | — | 25,000 = £27m | |||||||
Outbound contact completion | 100 | % | — | — | ||||||
Response rate to outbound contact | 38 | % | 38 | % | 1% = £0.2m | |||||
Average uphold rate per claim(2) | 82 | % | 74 | % | 1% = £2m | |||||
Average redress per claim | 1,914 | 1,444 | £100 = £4m | |||||||
| (1) | Excludes invalid claims where the complainant has not held a PPI policy. |
| (2) | Claims include inbound and responses to outbound contact. |
Number of PPI claims outstanding
Movements in the number of PPI claims outstanding in the six months ended 30 June 2015 and the year ended 31 December 2014 were as follows:
| 30 June 2015 ‘000 | 31 December 2014 ‘000 | |||||||
Outstanding at 1 January | 20 | 14 | ||||||
Complaints received(1) | 111 | 246 | ||||||
Complaints rejected as invalid(2) | (83 | ) | (194 | ) | ||||
Complaints closed - upheld | (24 | ) | (46 | ) | ||||
|
|
|
| |||||
Outstanding at 30 June/31 December | 24 | 20 | ||||||
|
|
|
| |||||
| (1) | Includes complaints that were deemed invalid, as there is no record of a relevant PPI policy being held by the customer. |
| (2) | The customer has the right to appeal to the FOS if their claim is rejected. FOS may uphold or reject the appeal and if upheld Santander UK is required to provide redress to the customer. Claims upheld or rejected above reflect the results of any appeals. |
30 June 2015 compared with 31 December 2014
Monthly utilisation, including pro-active customer contact, during the six months ended 30 June 2015 decreased to £9m per month, against an average of £11m in the year ended 31 December 2014. Excluding pro-active customer contact, the average redress costs in the six months ended 30 June 2015 were £6m per month (six months ended 30 June 2014: £6m). The high proportion of invalid complaints also continued.
| 120 | Santander UK plc |
Table of Contents
Primary financial statements | Notes to the financial statements | |
|
(ii) Other products
A provision for conduct remediation has also been recognised in respect of other products. The provision for conduct remediation in respect of other products represents management’s best estimate of the anticipated costs of related customer contact and/or redress, including related costs. A number of uncertainties remain as to the eventual costs with respect to conduct remediation in respect of these products given the inherent difficulties in determining the number of customers involved and the amount of any redress to be provided to them.
Wealth and investment products
During 2012, the FCA (formerly known as the FSA) undertook an industry-wide thematic review of the sale of investment products, and subsequently sales of premium investment funds. The FCA’s review included Santander UK, and identified shortcomings in the collection of customer information and risk profile alignment, and concerns about product suitability, fees and charges. As a result, Santander UK initiated customer contact exercises to provide appropriate redress to customers who had suffered detriment. The redress methodology for remaining phases is under discussion with the FCA. A provision has been recognised in respect of the above sales for redress payments and related costs. At 30 June 2015, the provision was £127m (31 December 2014: £127m).
Interest rate hedging products
In 2012, the FCA identified material failings in the sale of interest rate derivatives to some small and medium sized businesses at the four largest UK banks. The FCA did not identify any mis-selling issues with Santander UK. However, in order to ensure that customers are treated consistently, the FCA requested seven other UK banks (including Santander UK) to undertake a review of the sales of interest rate hedging products to SMEs since 2001.
A provision was initially recognised based on the pilot exercise completed in the second half of 2012 and subsequently revised following the customer contact exercise that commenced in the second quarter of 2013 and ongoing updated guidelines from the FCA. The level of provision is based on full redress i.e. unwinding of the trade (reversal of mark-to-market values) and refund of net interest payments made by customers. Response rates are monitored on a regular basis, and the provision updated accordingly. The issue continues to be managed down.
b) Regulatory-related
(i) Financial Services Compensation Scheme (‘FSCS’)
The FSCS is the UK’s independent statutory compensation fund for customers of authorised financial services firms and pays compensation if a firm is unable to pay claims against it. The FSCS is funded by levies on the industry (and recoveries and borrowings where appropriate). The levies raised comprise both management expenses levies and, where necessary, compensation levies on authorised firms. The FSCS charge recognised in the six months ended 30 June 2015 was £74m (six months ended 30 June 2014: £100m).
(ii) UK Bank Levy
The UK Bank Levy is based on the total chargeable equity and liabilities as reported in the balance sheet of a Relevant Group at the end of a chargeable period. The Relevant Group for this purpose is a Foreign Banking Group whose ultimate parent is Banco Santander, S.A.. The UK Bank Levy is calculated principally on the consolidated balance sheet of the UK sub-group parented by Santander UK Group Holdings plc, of which this Company is part. During 2014, a rate of 0.156% was applied but with effect from 1 April 2015, the Finance Act 2015 increased the rate to 0.21%, resulting in a rate of 0.1967% for 2015. The current year impact of the UK Bank Levy has not been reflected in these results in accordance with IFRS. Under IFRS, these charges for the year may only be recognised on the last day of the year, not accrued over the period. The cost of the UK Bank Levy for 2014 was £74m.
In addition to the corporation tax changes the Budget in 8 July 2015 also announced a reduction to the UK Bank Levy rate from 0.21% to 0.18% from 1 January 2016 and subsequent annual reductions to 0.1% from 1 January 2021. These changes have not been substantially enacted.
c) Other
Other provisions principally comprise amounts in respect of vacant property costs, litigation and related expenses, and restructuring expenses. Vacant leasehold property provisions are made by reference to a prudent estimate of expected sub-let income, compared to the head rent, and the possibility of disposing of Santander UK’s interest in the lease, taking into account conditions in the property market.
| 2015 Half Yearly Financial Report | 121 |
Table of Contents
Financial statements
25. RETIREMENT BENEFIT PLANS
The amounts recognised in the balance sheet were as follows:
| 30 June 2015 £m | 31 December 2014 £m | |||||||
Assets/(liabilities) | ||||||||
Funded defined benefit pension scheme | 349 | 315 | ||||||
Funded defined benefit pension scheme | (169 | ) | (159 | ) | ||||
Unfunded defined benefit pension scheme | (41 | ) | (40 | ) | ||||
|
|
|
| |||||
Total net assets | 139 | 116 | ||||||
|
|
|
| |||||
Remeasurement (gains)/losses recognised in other comprehensive income during the period were as follows:
| Six months ended 30 June 2015 £m | Six months ended 30 June 2014 £m | |||||||
Remeasurement of defined benefit schemes | (17 | ) | (128 | ) | ||||
|
|
|
| |||||
a) Defined contribution pension schemes
An expense of £24m (six months ended 30 June 2014: £30m) was recognised for defined contribution plans in the period, and is included in staff costs classified within administration expenses in the Condensed Consolidated Income Statement. None of this amount was recognised in respect of key management personnel for the six months ended 30 June 2015 and 30 June 2014.
b) Defined benefit pension schemes
The total amount charged/(credited) to the income statement, including any amounts classified as redundancy costs was as follows:
| Six months ended 30 June 2015 £m | Six months ended 30 June 2014 £m | |||||||
Net interest (income)/ expense | (3 | ) | 12 | |||||
Current service cost | 20 | 19 | ||||||
Past service credit | 1 | (230 | ) | |||||
Administration costs | 2 | 3 | ||||||
|
|
|
| |||||
| 20 | (196 | ) | ||||||
|
|
|
| |||||
During the first half of 2014, following a review of the Santander UK Group pension scheme, pension arrangements for colleagues in that scheme were amended through the introduction of a cap on pensionable pay increases by 1% per annum from 1 March 2015. The impact of this change was a reduction in the defined benefit obligation of £230m, partially offset by one off contributions to the defined contribution scheme for affected member of £10m and implementation costs of £2m. Consequently, a net gain of £218m was recognised in the income statement during the period as set out in Note 4.
The amounts recognised in other comprehensive income for the period were as follows:
| Six months ended 30 June 2015 £m | Six months ended 30 June 2014 £m | |||||||
Return on plan assets (excluding amounts included in net interest expense) | 10 | (219 | ) | |||||
Actuarial gains arising from changes in demographic assumptions | — | — | ||||||
Actuarial gains arising from experience adjustments | (21 | ) | (10 | ) | ||||
Actuarial (gains)/losses arising from changes in financial assumptions | (3 | ) | 101 | |||||
Cumulative actuarial reserve acquired with subsidiary | (3 | ) | — | |||||
|
|
|
| |||||
Remeasurement of defined benefit pension schemes | (17 | ) | (128 | ) | ||||
|
|
|
| |||||
The net (liability)/asset recognised in the balance sheet was determined as follows:
| 30 June 2015 £m | 31 December 2014 £m | |||||||
Present value of defined benefit obligation | (9,403 | ) | (9,314 | ) | ||||
Fair value of plan assets | 9,542 | 9,430 | ||||||
|
|
|
| |||||
Net defined benefit asset | 139 | 116 | ||||||
|
|
|
| |||||
| 122 | Santander UK plc |
Table of Contents
Primary financial statements | Notes to the financial statements | |
|
Movements in the present value of defined benefit obligations during the period were as follows:
| 30 June 2015 £m | 31 December 2014 £m | |||||||
Balance at 1 January | (9,314 | ) | (8,432 | ) | ||||
Assumed through business combinations | (33 | ) | — | |||||
Current service cost | (15 | ) | (25 | ) | ||||
Current service cost paid by fellow Banco Santander group subsidiaries | (5 | ) | (9 | ) | ||||
Interest cost | (169 | ) | (367 | ) | ||||
Employer salary sacrifice contributions | (3 | ) | (7 | ) | ||||
Past service cost | (1 | ) | 230 | |||||
Remeasurement gains/(losses): | ||||||||
- Actuarial losses arising from changes in demographic assumptions | — | (129 | ) | |||||
- Actuarial gains/(losses) arising from experience adjustments | 21 | (59 | ) | |||||
- Actuarial gains/(losses) arising from changes in financial assumptions | 3 | (728 | ) | |||||
Actual benefit payments | 113 | 212 | ||||||
|
|
|
| |||||
Balance at 30 June/31 December | (9,403 | ) | (9,314 | ) | ||||
|
|
|
| |||||
Movements in the fair value of scheme assets during the period were as follows:
| 30 June 2015 £m | 31 December 2014 £m | |||||||
Balance at 1 January | 9,430 | 7,878 | ||||||
Acquired through business combinations | 41 | — | ||||||
Interest income | 172 | 354 | ||||||
Remeasurement (losses)/gains: | ||||||||
- Return on plan assets (excluding amounts included in net interest expense) | (10 | ) | 1,048 | |||||
Contributions paid | 19 | 360 | ||||||
Contributions paid by fellow Banco Santander group subsidiaries | 5 | 9 | ||||||
Administration costs | (2 | ) | (7 | ) | ||||
Actual benefit payments | (113 | ) | (212 | ) | ||||
|
|
|
| |||||
Balance at 30 June/31 December | 9,542 | 9,430 | ||||||
|
|
|
| |||||
Actuarial assumption sensitivities
The sensitivity analyses below have been determined based on reasonably possible changes of the respective assumptions occurring at the end of the reporting period, while holding all assumptions constant.
| Increase/(decrease) | ||||||||||
| 30 June 2015 £m | 31 December 2014 £m | |||||||||
Discount rate | Change in pension obligation at period end from a 25 bps increase | (496 | ) | (420 | ) | |||||
| Change in pension cost for the period from a 25 bps increase | (19 | ) | (19 | ) | ||||||
General price inflation | Change in pension obligation at period end from a 25 bps increase | 314 | 307 | |||||||
| Change in pension cost for the period from a 25 bps increase | 13 | 13 | ||||||||
General salary increase | Change in pension obligation at period end from a 25 bps increase | n/a | n/a | |||||||
Mortality | Change in pension obligation at period end from each additional year of longevity assumed | 271 | 226 | |||||||
| 2015 Half Yearly Financial Report | 123 |
Table of Contents
Financial statements
26. CONTINGENT LIABILITIES AND COMMITMENTS
| 30 June 2015 £m | 31 December 2014 £m | |||||||
Guarantees given to third parties | 1,436 | 1,825 | ||||||
Formal standby facilities, credit lines and other commitments with original term to maturity of: | ||||||||
- One year or less | 6,591 | 6,692 | ||||||
- More than one year | 27,304 | 26,142 | ||||||
Other contingent liabilities | — | 1 | ||||||
|
|
|
| |||||
| 35,331 | 34,660 | |||||||
|
|
|
| |||||
Where the items set out below can be reliably estimated, they are disclosed in the table above.
Guarantees given by Santander UK plc to its subsidiaries
Santander UK plc has fully and unconditionally guaranteed the obligations of each of Abbey National Treasury Services plc and Cater Allen Limited, both of which are wholly owned subsidiaries of Santander UK plc that have been or will be incurred before 30 June 2017. In addition, Santander UK plc has fully and unconditionally guaranteed the deposit obligations of Abbey National International Limited (‘ANIL’), a wholly owned subsidiary of Santander UK plc that were incurred before 30 June 2015. With effect from 1 June 2015, the deposit taking business of ANIL was transferred to Santander UK plc, Jersey branch. As a result, the deposit obligations of ANIL are now direct obligations of Santander UK plc and the guarantee ceased in relation to the transferred business from 1 June 2015. The deed poll guarantee for Abbey Stockbrokers Limited to 30 June 2015 was not renewed.
Capital Support Deed
The Company, Abbey National Treasury Services plc, and Cater Allen Limited, which are the three PRA-regulated entities within the Santander UK group, are party to a capital support deed dated 14 December 2012 (the ‘Capital Support Deed’) with certain other non-regulated subsidiaries of Santander UK plc. The parties to the Capital Support Deed constitute a core UK group for the purposes of the PRA’s rules. Under the PRA’s rules, exposures of each of the three regulated entities to other members of the core UK group are exempt from large exposure limits that would otherwise apply. The purpose of the Capital Support Deed is to facilitate the prompt transfer of available capital resources from, or repayment of liabilities by, the non-regulated parties to any of the regulated parties in the event that one of the regulated parties has breached or is at risk of breaching its capital resources requirements or risk concentrations requirements. From 1 January 2014, the applicable PRA rules were replaced by Article 113 (6) of CRR.
Defined Liquidity Group liquidity facility
Santander UK plc, Abbey National Treasury Services plc, and Cater Allen Limited are party to a defined liquidity group liquidity facility agreement dated 28 May 2010 (the ‘DLG Facility Agreement’). The DLG Facility Agreement supports a defined liquidity group for the purposes of the PRA’s rules. The PRA’s rules permit a member of a defined liquidity group to rely on the liquid resources of other members of the defined liquidity group to comply with the PRA’s liquidity adequacy requirements. Under the DLG Facility Agreement, each party agrees to lend, subject to certain conditions and limitations, its excess liquidity to each other party.
Guarantees given to third parties
Guarantees given to third parties consist primarily of letters of credit, bonds and guarantees granted as part of normal product facilities which are offered to customers.
Formal standby facilities, credit lines and other commitments
Standby facilities, credit lines and other commitments are also granted as part of normal product facilities which are offered to customers. Retail facilities comprise undrawn facilities granted on flexible mortgages, bank overdrafts and credit cards. On flexible mortgages, the credit limit is set at the point of granting the loan through property value and affordability assessments.
Subsequent assessments are made to ensure that the limit remains appropriate considering any change in the security value or the customer’s financial circumstances. On bank accounts and credit cards, the facilities are granted based on new business risk assessment and are reviewed more frequently based on internal, as well as, external data. The delinquency status of the account would result in the withdrawal of the facility. Corporate facilities comprise standby facilities which are subject to ongoing compliance with covenants and the provision of agreed security. Failure to comply with these terms can result in the withdrawal of the unutilised facility headroom.
FSCS
As described in Note 24, the Santander UK group participates in the UK’s national resolution scheme, the FSCS, and is thus subject to levies to fund the FSCS. The EU’s Recovery and Resolution Directive includes a requirement to pre-fund national resolution funds. The quantification and timing of any additional levy as a result of the pre-funding have yet to be determined and hence, although the Santander UK group’s share could be significant, no provision has yet been recognised.
Mortgage representations and warranties
In connection with its residential mortgage securitisations, and covered bond transactions, Santander UK plc makes representations and warranties relating to the mortgage loans sold as of the date of such sale which cover, among other things:
| • | Santander UK plc’s ownership of the loan |
| • | The validity of the legal charge securing the loan |
| • | The effectiveness of title insurance on the property securing the loan |
| • | The loan’s compliance with applicable laws |
| • | Whether the mortgage loan was originated in conformity with the originator’s lending criteria. |
The specific representations and warranties in relation to the mortgage loans made by Santander UK plc depend on the nature of the transaction and the requirements of the transaction structure. Santander UK plc is principally a retail prime lender and has no appetite or product offering for any type of sub-prime business. Santander UK plc’s credit policy explicitly prohibits such lending.
| 124 | Santander UK plc |
Table of Contents
Primary financial statements | Notes to the financial statements | |
|
Market conditions and credit-rating agency requirements may also affect representations and warranties Santander UK plc may agree to make upon the sale of the mortgage loans. Santander UK plc’s representations and warranties regarding the sold mortgage loans are generally not subject to stated limits in amount or time of coverage. However, contractual liability may arise when the representations and warranties are breached. In the event of a breach of these representations and warranties, Santander UK plc may be required to either repurchase the mortgage loans (generally at unpaid principal balance plus accrued interest) with the identified defects or reduce its share in the trust holding the mortgage loans by an amount equivalent to the repurchase price. In the case of a repurchase, Santander UK plc may bear any subsequent credit loss on the mortgage loan. Santander UK plc manages and monitors its securitisation activities closely to minimise potential claims. To date, Santander UK plc has only identified a small number of non-compliant mortgage loans in its securitisation transactions.
Regulatory
The Santander UK group engages in discussion, and co-operates, with the FCA and other bodies in their supervision of the Santander UK group, including reviews exercised under statutory powers, regarding its interaction with past and present customers and policyholders, both as part of general thematic work and in relation to specific products and services. The position will be monitored with particular reference to those reviews currently in progress and where it is not yet possible to reliably determine their outcome.
Consumer credit
Santander UK group’s unsecured lending and other consumer credit business is governed by consumer credit law and related regulations. Claims brought by customers in relation to potential breaches of these requirements could result in costs to the Santander UK group where such potential breaches are not found to be de minimis. It is not possible to provide any meaningful estimate or range of the possible cost.
A 2014 decision of the Supreme Court inPlevin v Paragon Personal Finance Limited held that the non-disclosure of commissions on a single premium PPI policy made the relationship between the lender and the borrower unfair under section 140A of the Consumer Credit Act 1974. The FCA is considering whether additional rules and/or guidance are required to deal with the impact of the Plevin decision and the Santander UK group, as are other lenders, is in active dialogue with the FCA and the FOS on this issue. At this stage, given the uncertainty regarding the application of the Plevin decision, it is not currently possible to determine the financial impact for the Santander UK group.
Taxation
The Santander UK group engages in discussion, and co-operates, with HM Revenue & Customs in their oversight of the Santander UK group’s tax matters. The Santander UK group adopted the UK’s Code of Practice on Taxation for Banks in 2010 and during 2013 re-confirmed its unconditional adoption of this code.
Other
As part of the sale of subsidiaries, and as is normal in such circumstances, Santander UK has given warranties and indemnities to the purchasers.
Obligations under stock borrowing and lending agreements
Obligations under stock borrowing and lending agreements represent contractual commitments to return stock borrowed. These obligations are offset by a contractual right to receive stock under other contractual agreements. See Note 29.
Other off-balance sheet commitments
Santander UK has commitments to lend at fixed interest rates which expose it to interest rate risk. For further information, see the Risk Review.
Operating lease commitments
There have been no significant changes to the operating lease commitments as set out in Note 37 in the 2014 Annual Report.
27. SHARE CAPITAL AND OTHER EQUITY INSTRUMENTS
| 30 June 2015 £m | 31 December 2014 £m | |||||||
Ordinary share capital | 3,105 | 3,105 | ||||||
£300m fixed/floating rate non-cumulative callable preference shares | 14 | 35 | ||||||
£300m Step-up Callable Perpetual Reserve Capital Instruments | 235 | 297 | ||||||
£300m Step-up Callable Perpetual Preferred Securities | 7 | 7 | ||||||
£500m Perpetual Capital Securities | 500 | 500 | ||||||
£300m Perpetual Capital Securities | 300 | 300 | ||||||
£750m Perpetual Capital Securities | 750 | — | ||||||
|
|
|
| |||||
| 4,911 | 4,244 | |||||||
|
|
|
| |||||
Other equity instruments
£750m Perpetual Capital Securities
On 10 June 2015, the Company issued £750m Perpetual Capital Securities, of which 100% was subscribed by the Company’s immediate parent, Santander UK Group Holdings plc. The securities are perpetual and pay a distribution rate on 24 March, June, September and December, commencing from September 2015. At each distribution payment date, the Company can decide whether to pay the distribution rate, which is non-cumulative, in whole or in part. The distribution rate is 7.375% per annum until 24 June 2022; thereafter, the distribution rate resets every five years to a rate 5.543% per annum above the then prevailing 5 year sterling mid swap rate. The Perpetual Capital Securities will be automatically written down should the Common Equity Tier 1 capital ratio of the Santander UK prudential consolidation group as defined in the PRA’s rules fall below 7%. The Perpetual Capital Securities are redeemable at the option of the Company on 24 June 2022 or on any reset date thereafter. No such redemption may be made without the consent of the PRA.
| 2015 Half Yearly Financial Report | 125 |
Table of Contents
Financial statements
£300m Fixed/Floating Rate Non-Cumulative Callable Preference Shares
As part of a capital management exercise, 60% of the outstanding preferences shares were purchased from the Company’s immediate parent, Santander UK Group Holdings plc on 12 June 2015.
£300m Step-up Callable Perpetual Reserve Capital Instruments
As part of a capital management exercise, 21% of the Perpetual Reserve capital instruments were purchased on 11 June 2015.
28. CASH FLOW STATEMENT
a) Reconciliation of profit after tax to net cash inflow/(outflow) from operating activities:
| Six months ended 30 June 2015 £m | Six months ended 30 June 2014 £m | |||||||
Profit for the period | 734 | 438 | ||||||
Non-cash items included in profit: | ||||||||
Depreciation and amortisation | 136 | 347 | ||||||
Amortisation of premiums/(discounts) on debt securities | 30 | — | ||||||
Provisions for liabilities and charges | 97 | 252 | ||||||
Impairment losses | 101 | 220 | ||||||
Corporation tax charge | 195 | 107 | ||||||
Other non-cash items | 888 | 208 | ||||||
Pension charge/(credit) for defined benefit pension schemes | 16 | (216 | ) | |||||
|
|
|
| |||||
| 2,197 | 1,356 | |||||||
Changes in operating assets and liabilities: | ||||||||
Net change in cash and balances held at central banks | (13 | ) | — | |||||
Net change in trading assets | (4,669 | ) | (1,202 | ) | ||||
Net change in derivative assets | 2,432 | 890 | ||||||
Net change in financial assets designated at fair value | 151 | (33 | ) | |||||
Net change in loans and advances to banks and customers | (3,726 | ) | (1,084 | ) | ||||
Net change in other assets | (597 | ) | (435 | ) | ||||
Net change in deposits by banks and customers | 2,515 | 4,294 | ||||||
Net change in derivative liabilities | (717 | ) | 167 | |||||
Net change in trading liabilities | 161 | (3,434 | ) | |||||
Net change in financial liabilities designated at fair value | 14 | 307 | ||||||
Net change in debt securities in issue | 3 | 1,130 | ||||||
Net change in other liabilities | (138 | ) | (1085 | ) | ||||
Effects of exchange rate differences | (2,058 | ) | (1,098 | ) | ||||
|
|
|
| |||||
Net cash flow used in operating activities before tax | (4,445 | ) | (227 | ) | ||||
Corporation tax paid | (235 | ) | (25 | ) | ||||
|
|
|
| |||||
Net cash flow used in operating activities | (4,680 | ) | (252 | ) | ||||
|
|
|
| |||||
b) Analysis of the balances of cash and cash equivalents in the balance sheet
| 30 June 2015 £m | 31 December 2014 £m | |||||||
Cash and balances at central banks | 15,218 | 22,562 | ||||||
Less: regulatory minimum cash balances | (331 | ) | (318 | ) | ||||
|
|
|
| |||||
| 14,887 | 22,244 | |||||||
Net trading other cash equivalents | 3,181 | 3,966 | ||||||
Net non-trading other cash equivalents | 933 | 1,153 | ||||||
|
|
|
| |||||
Cash and cash equivalents | 19,001 | 27,363 | ||||||
|
|
|
| |||||
c) Acquisition of subsidiaries
Consideration paid in connection with the acquisition of PSA Finance UK Limited on 3 February 2015 that was satisfied by cash and cash equivalents is set out in Note 35.
| 126 | Santander UK plc |
Table of Contents
Primary financial statements | Notes to the financial statements | |
|
29. ASSETS CHARGED AS SECURITY FOR LIABILITIES AND COLLATERAL ACCEPTED AS SECURITY FOR ASSETS
The following transactions are conducted under terms that are usual and customary to collateralised transactions, including, where relevant, standard securities lending and repurchase agreements.
a) Assets charged as security for liabilities
The financial assets below are analysed between those assets accounted for on balance sheet and off-balance sheet in accordance with IFRS.
| 30 June 2015 £m | 31 December 2014 £m | |||||||
On balance sheet: | ||||||||
Treasury bills and other eligible securities | 6,455 | 8,023 | ||||||
Cash | 3,728 | 3,072 | ||||||
Loans and advances to customers - securitisations and covered bonds (See Note 14) | 51,164 | 53,370 | ||||||
Loans and advances to customers | 3,672 | 3,482 | ||||||
Debt securities | 1,136 | 1,615 | ||||||
Equity securities | 5,510 | 4,032 | ||||||
|
|
|
| |||||
| 71,665 | 73,594 | |||||||
|
|
|
| |||||
Off balance sheet: | ||||||||
Treasury bills and other eligible securities | 14,905 | 17,476 | ||||||
Debt securities | 675 | 177 | ||||||
Equity securities | 796 | 1,333 | ||||||
|
|
|
| |||||
| 16,376 | 18,986 | |||||||
|
|
|
| |||||
The Santander UK group provides assets as collateral in the following areas of the business.
Sale and repurchase agreements
Subsidiaries of the Company enter into sale and repurchase agreements and similar transactions of equity and debt securities, which are accounted for as secured borrowings. Upon entering into such transactions, the subsidiaries provide collateral equal to 100%-131% of the borrowed amount. The carrying amount of assets that were so provided at 30 June 2015 was £18,078m (2014: £21,855m), of which £7,114m (2014: £7,765m) were classified within ‘loans and advances to customers – securitisations and covered bonds’ in the table above.
Securitisations and covered bonds
Santander UK plc and certain of its subsidiaries enter into securitisation transactions whereby portfolios of residential mortgage loans and other loans are purchased by or assigned to structured securitisation companies, and have been funded through the issue of mortgage-backed securities and other asset-backed securities. Holders of the securities are only entitled to obtain payments of principal and interest to the extent that the resources of the securitisation companies are sufficient to support such payments and the holders of the securities have agreed in writing not to seek recourse in any other form. At 30 June 2015, £1,003m (2014: £1,789m) of loans were so assigned by the Santander UK group.
A subsidiary of the Company has also established a covered bond programme, whereby securities are issued to investors and are secured by a pool of ring-fenced residential mortgages. At 30 June 2015, the pool of ring-fenced residential mortgages for the covered bond programme was £24,103m (2014: £25,598m).
At 30 June 2015, total notes issued externally from secured programmes (securitisations and covered bonds) decreased to £26,832m (2014: £32,373m), including gross issuance of £2,883m (2014: £4,023m) and redemptions of £7,942m (2014: £8,440m). At 30 June 2015, a total of £12,347m (2014: £14,373m) of notes issued under securitisation and covered bond programmes had also been retained internally, a proportion of which had been used as collateral for raising funds via third party bilateral secured funding transactions, which totalled £5,987m at 30 June 2015 (2014: £6,444m), or for creating collateral which could in the future be used for liquidity purposes.
Stock borrowing and lending agreements
Asset balances under stock borrowing and lending agreements represent stock lent by the Santander UK group. These balances amounted to £22,185m at 30 June 2015 (2014: £22,048m) and are offset by contractual commitments to return stock borrowed or cash received.
Derivatives business
In addition to the arrangements described above, collateral is also provided in the normal course of derivative business to counterparties. At 30 June 2015, £3,728m (2014: £3,072m) of such collateral in the form of cash had been provided by the Santander UK group and is included in the table above.
| 2015 Half Yearly Financial Report | 127 |
Table of Contents
Financial statements
b) Collateral accepted as security for assets
The collateral held as security for assets below are analysed between those liabilities accounted for on the balance sheet and off-balance sheet in accordance with IFRS.
| 30 June 2015 £m | 31 December 2014 £m | |||||||
On balance sheet: | ||||||||
Trading liabilities | 1,104 | 1,905 | ||||||
Deposits by banks | 1,319 | 1,701 | ||||||
|
|
|
| |||||
| 2,423 | 3,606 | |||||||
Off balance sheet: | ||||||||
Trading liabilities | 21,074 | 24,207 | ||||||
Deposits by banks | 150 | — | ||||||
|
|
|
| |||||
| 21,224 | 24,207 | |||||||
|
|
|
| |||||
Purchase and resale agreements
Subsidiaries of the Company also enter into purchase and resale agreements and similar transactions of equity and debt securities, which are accounted for as collateralised loans. Upon entering into such transactions, the subsidiaries receive collateral equal to 100%-105% of the loan amount. The level of collateral held is monitored daily and if required, further calls are made to ensure the market values of collateral remains at least equal to the loan balance. The subsidiaries are permitted to sell or repledge the collateral held in the absence of default. At 30 June 2015, the fair value of such collateral received was £7,010m (2014: £6,956m). Of the collateral received, almost all was sold or repledged. The subsidiaries have an obligation to return collateral that they have sold or pledged.
Stock borrowing and lending agreements
Obligations under stock borrowing and lending agreements represent contractual commitments to return stock borrowed. These obligations totalled £14,214m at 30 June 2015 (2014: £17,251m) and are offset by a contractual right to receive stock lent by the Santander UK group.
Derivatives business
In addition to the arrangements described above, collateral is also received from counterparties in the normal course of derivative business. At 30 June 2015, £2,423m (2014: £3,606m) of such collateral in the form of cash had been received by the Santander UK group and is included in the table above.
Lending activities
In addition to the above collateral held as security for assets, the Santander UK group may obtain a charge over a customer’s property in connection with its lending activities. Details of these arrangements are set out in the ‘Credit Risk’ section of the Risk Review.
30. RELATED PARTY DISCLOSURES
The financial position and performance of the Santander UK group have not been materially affected in the first six months of the year by any related party transactions, or changes to related party transactions, except as disclosed in the other Notes to these Condensed Consolidated Interim Financial Statements or otherwise described below.
Further information on balances due from/(to) other Banco Santander group companies is set out in the section ‘Balances with other Banco Santander group companies’ in the Risk Review on pages 80 and 81. In addition, transactions with pension schemes operated by the Santander UK group are described in Note 25. Further information on related party transactions during the period and balances outstanding at the period-end is described in the other Notes.
These transactions were made in the ordinary course of business and substantially on the same terms as for comparable transactions with third party counterparties and within limits acceptable to the PRA. Such transactions do not involve more than the normal risk of collectability or present any unfavourable features.
| 128 | Santander UK plc |
Table of Contents
Primary financial statements | Notes to the financial statements | |
|
31. FINANCIAL INSTRUMENTS
a) Fair values of financial instruments carried at amortised cost
The following tables analyse the fair value of the financial instruments carried at amortised cost at 30 June 2015 and 31 December 2014, including their levels in the fair value hierarchy – Level 1, Level 2 and Level 3. It does not include fair value information for financial assets and financial liabilities carried at amortised cost if the carrying amount is a reasonable approximation of fair value.
| Balance sheet category | 30 June 2015 | 31 December 2014 | ||||||||||||||||||||||||||||||||||||||||
| Fair value | Carrying | Fair value | Carrying | |||||||||||||||||||||||||||||||||||||||
| Level 1 | Level 2 | Level 3 | Total | value | Level 1 | Level 2 | Level 3 | Total | value | |||||||||||||||||||||||||||||||||
| £m | £m | £m | £m | £m | £m | £m | £m | £m | £m | |||||||||||||||||||||||||||||||||
Assets | ||||||||||||||||||||||||||||||||||||||||||
Loans and advances to banks | — | 2,006 | 411 | 2,417 | 2,500 | — | 1,210 | 798 | 2,008 | 2,057 | ||||||||||||||||||||||||||||||||
|
|
|
|
|
|
|
|
|
|
|
|
|
|
|
|
|
|
|
| |||||||||||||||||||||||
Loans and advances to customers | Advances secured on residential property | — | — | 153,685 | 153,685 | 150,623 | — | — | 151,265 | 151,265 | 149,861 | |||||||||||||||||||||||||||||||
| Corporate loans | — | 5,810 | 24,411 | 30,221 | 30,512 | — | 5,671 | 23,718 | 29,389 | 29,445 | ||||||||||||||||||||||||||||||||
| Other advances | — | — | 13,897 | 13,897 | 13,804 | — | — | 9,464 | 9,464 | 9,385 | ||||||||||||||||||||||||||||||||
|
|
|
|
|
|
|
|
|
|
|
|
|
|
|
|
|
|
|
| |||||||||||||||||||||||
| — | 5,810 | 191,993 | 197,803 | 194,939 | — | 5,671 | 184,447 | 190,118 | 188,691 | |||||||||||||||||||||||||||||||||
|
|
|
|
|
|
|
|
|
|
|
|
|
|
|
|
|
|
|
| |||||||||||||||||||||||
Loans and receivables securities | — | 81 | — | 81 | 66 | — | 135 | — | 135 | 118 | ||||||||||||||||||||||||||||||||
|
|
|
|
|
|
|
|
|
|
|
|
|
|
|
|
|
|
|
| |||||||||||||||||||||||
Liabilities | ||||||||||||||||||||||||||||||||||||||||||
Deposits by banks | Securities sold under agreements to repurchase | — | 4,458 | — | 4,458 | 4,303 | — | 4,909 | — | 4,909 | 4,797 | |||||||||||||||||||||||||||||||
| Other deposits | — | 2,374 | 584 | 2,958 | 2,949 | — | 3,172 | 671 | 3,843 | 3,417 | ||||||||||||||||||||||||||||||||
|
|
|
|
|
|
|
|
|
|
|
|
|
|
|
|
|
|
|
| |||||||||||||||||||||||
| — | 6,832 | 584 | 7,416 | 7,252 | — | 8,081 | 671 | 8,752 | 8,214 | |||||||||||||||||||||||||||||||||
|
|
|
|
|
|
|
|
|
|
|
|
|
|
|
|
|
|
|
| |||||||||||||||||||||||
Deposits by customers | Current and demand accounts | — | — | 65,187 | 65,187 | 65,187 | — | — | 66,737 | 66,737 | 66,737 | |||||||||||||||||||||||||||||||
| Savings accounts | — | — | 59,137 | 59,137 | 58,843 | ��� | — | 57,391 | 57,391 | 57,099 | ||||||||||||||||||||||||||||||||
| Time deposits | — | — | 33,755 | 33,755 | 33,616 | — | — | 29,405 | 29,405 | 29,270 | ||||||||||||||||||||||||||||||||
| Securities sold under agreements to repurchase | — | 507 | — | 507 | 504 | — | 577 | — | 577 | 500 | ||||||||||||||||||||||||||||||||
|
|
|
|
|
|
|
|
|
|
|
|
|
|
|
|
|
|
|
| |||||||||||||||||||||||
| — | 507 | 158,079 | 158,586 | 158,150 | — | 577 | 153,533 | 154,110 | 153,606 | |||||||||||||||||||||||||||||||||
|
|
|
|
|
|
|
|
|
|
|
|
|
|
|
|
|
|
|
| |||||||||||||||||||||||
Debt securities in issue | Bonds and medium term notes | — | 39,470 | — | 39,470 | 37,914 | — | 39,954 | — | 39,954 | 37,796 | |||||||||||||||||||||||||||||||
| Securitisation programmes | — | 10,684 | 1,010 | 11,694 | 11,470 | — | 13,302 | 746 | 14,048 | 13,994 | ||||||||||||||||||||||||||||||||
|
|
|
|
|
|
|
|
|
|
|
|
|
|
|
|
|
|
|
| |||||||||||||||||||||||
| — | 50,154 | 1,010 | 51,164 | 49,384 | — | 53,256 | 746 | 54,002 | 51,790 | |||||||||||||||||||||||||||||||||
|
|
|
|
|
|
|
|
|
|
|
|
|
|
|
|
|
|
|
| |||||||||||||||||||||||
Subordinated liabilities | — | 3,773 | — | 3,773 | 3,601 | — | 4,115 | — | 4,115 | 4,002 | ||||||||||||||||||||||||||||||||
|
|
|
|
|
|
|
|
|
|
|
|
|
|
|
|
|
|
|
| |||||||||||||||||||||||
| 2015 Half Yearly Financial Report | 129 |
Table of Contents
Financial statement
b) Fair values of financial instruments measured at fair value on a recurring basis
The following tables summarise the fair values of the financial asset and liability classes accounted for at fair value at 30 June 2015 and 31 December 2014, analysed by the valuation methodology used by the Santander UK group to determine their fair value, including their levels in the fair value hierarchy – Level 1, Level 2 and Level 3.
Transfers between levels of the fair value hierarchy
Transfers between levels of the fair value hierarchy are reported at the beginning of the reporting period in which they occur. During the six months ended 30 June 2015 and the year ended 31 December 2014, there were no transfers of financial instruments between Levels 1 and 2 in the fair value hierarchy.
During the six months ended 30 June 2015, there were no transfers of financial instruments between Levels 2 and 3 in the fair value hierarchy. During the year ended 31 December 2014, the following financial instruments were transferred between Level 2 and Level 3 in the fair value hierarchy:
| • | Bermudan swaptions shown within derivative assets and derivative liabilities with fair values of £29m and £10m, respectively, were transferred from Level 2 to Level 3 principally due to a lack of market transactions in these instruments. The valuation techniques applied to estimate the fair value of these financial instruments are described in Note 44(i) to the Consolidated Financial Statements in the 2014 Annual Report. |
| • | Certain asset-backed securities issued by Banco Santander group entities, with a fair value of £58m designated as fair value through profit and loss, were transferred from Level 3 to Level 2 principally due to improved transparency of market prices as a result of market transactions in these instruments. The valuation technique applied to estimate the fair value of these financial instruments is described in Note 44(i) to the Consolidated Financial Statements in the 2014 Annual Report. |
| Fair value | ||||||||||||||||||||||||||||||||||||||
| Balance sheet category | 30 June 2015 | 31 December 2014 | ||||||||||||||||||||||||||||||||||||
| Level 1 £m | Level 2 £m | Level 3 £m | Total £m | Level 1 £m | Level 2 £m | Level 3 £m | Total £m | Valuation technique | ||||||||||||||||||||||||||||||
Assets | ||||||||||||||||||||||||||||||||||||||
Trading assets | Loans and advances to banks | — | 7,130 | — | 7,130 | — | 5,936 | — | 5,936 | A | ||||||||||||||||||||||||||||
| Loans and advances to customers | — | 5,617 | — | 5,617 | — | 3,007 | — | 3,007 | A | |||||||||||||||||||||||||||||
| Debt securities | 5,879 | — | — | 5,879 | 7,981 | — | — | 7,981 | — | |||||||||||||||||||||||||||||
| Equity securities | 6,999 | — | — | 6,999 | 4,776 | — | — | 4,776 | — | |||||||||||||||||||||||||||||
Derivative assets | Exchange rate contracts | — | 4,668 | 7 | 4,675 | — | 4,407 | 5 | 4,412 | A | ||||||||||||||||||||||||||||
| Interest rate contracts | 74 | 13,667 | 13 | 13,754 | 4 | 16,550 | 20 | 16,574 | A & C | |||||||||||||||||||||||||||||
| Equity and credit contracts | 230 | 1,810 | 120 | 2,160 | 149 | 1,757 | 127 | 2,033 | B & D | |||||||||||||||||||||||||||||
| Commodity contracts | — | — | — | — | — | 2 | — | 2 | A | |||||||||||||||||||||||||||||
Financial assets at FVTPL | Loans and advances to customers | — | 2,102 | 60 | 2,162 | — | 2,198 | 61 | 2,259 | A | ||||||||||||||||||||||||||||
| Debt securities | — | 356 | 211 | 567 | — | 402 | 220 | 622 | A & B | |||||||||||||||||||||||||||||
AFS financial assets | Equity securities | 34 | — | — | 34 | 25 | — | — | 25 | — | ||||||||||||||||||||||||||||
| Debt securities | 9,062 | — | — | 9,062 | 8,919 | — | — | 8,919 | — | |||||||||||||||||||||||||||||
|
|
|
|
|
|
|
|
|
|
|
|
|
|
|
| |||||||||||||||||||||||
Total assets at fair value | 22,278 | 35,350 | 411 | 58,039 | 21,854 | 34,259 | 433 | 56,546 | ||||||||||||||||||||||||||||||
|
|
|
|
|
|
|
|
|
|
|
|
|
|
|
| |||||||||||||||||||||||
Liabilities | ||||||||||||||||||||||||||||||||||||||
Trading liabilities | Deposits by banks | — | 5,138 | — | 5,138 | — | 7,223 | — | 7,223 | A | ||||||||||||||||||||||||||||
| Deposits by customers | — | 5,825 | — | 5,825 | — | 4,899 | — | 4,899 | A | |||||||||||||||||||||||||||||
| Short positions | 4,528 | — | — | 4,528 | 3,211 | — | — | 3,211 | — | |||||||||||||||||||||||||||||
Derivative liabilities | Exchange rate contracts | — | 6,534 | — | 6,534 | — | 4,278 | — | 4,278 | A | ||||||||||||||||||||||||||||
| Interest rate contracts | 14 | 13,129 | 5 | 13,148 | 16 | 15,976 | 6 | 15,998 | A & C | |||||||||||||||||||||||||||||
| Equity and credit contracts | 1 | 2,297 | 35 | 2,333 | 1 | 2,408 | 45 | 2,454 | B & D | |||||||||||||||||||||||||||||
| Commodity contracts | — | — | — | — | — | 2 | — | 2 | A | |||||||||||||||||||||||||||||
Financial liabilities at FVTPL | Debt securities in issue | — | 2,493 | 9 | 2,502 | — | 2,835 | 13 | 2,848 | A | ||||||||||||||||||||||||||||
|
|
|
|
|
|
|
|
|
|
|
|
|
|
|
| |||||||||||||||||||||||
Total liabilities at fair value | 4,543 | 35,416 | 49 | 40,008 | 3,228 | 37,621 | 64 | 40,913 | ||||||||||||||||||||||||||||||
|
|
|
|
|
|
|
|
|
|
|
|
|
|
|
| |||||||||||||||||||||||
| 130 | Santander UK plc |
Table of Contents
Primary financial statements | Notes to the financial statements | |
|
c) Valuation techniques
The main valuation techniques employed in the Santander UK group’s internal models to measure the fair value of the financial instruments disclosed above at 30 June 2015 and 31 December 2014 are set out below. In substantially all cases, the principal inputs into these models are derived from observable market data. The Santander UK group did not make any material changes to the valuation techniques and internal models it used during the six months ended 30 June 2015 and the year ended 31 December 2014.
| A | In the valuation of financial instruments requiring static hedging (for example interest rate, currency derivatives and commodity swaps) and in the valuation of loans and advances and deposits, the ‘present value’ method is used. Expected future cash flows are discounted using the interest rate curves of the applicable currencies or forward commodity prices as appropriate. The interest rate curves are generally observable market data and reference yield curves derived from quoted interest rates in appropriate time bandings, which match the timings of the cash flows and maturities of the instruments. The forward commodity prices are generally observable market data. |
| B | In the valuation of equity financial instruments requiring dynamic hedging (principally equity securities, options and other structured instruments), proprietary local volatility and stochastic volatility models are used. These types of models are widely accepted in the financial services industry. Observable market inputs used in these models include the bid-offer spread, foreign currency exchange rates, volatility and correlation between indices. In limited circumstances, other inputs may be used in these models that are based on data other than observable market data, such as the Halifax’s UK House Price Index (‘HPI’) volatility, HPI forward growth, HPI spot rate, mortality and mean reversion. |
| C | In the valuation of financial instruments exposed to interest rate risk that require either static or dynamic hedging (such as interest rate futures, caps and floors, and options), the present value method (futures), the Black model (caps/floors) and the Hull/White and Markov functional models (Bermudan options) are used. These types of models are widely accepted in the financial services industry. The significant inputs used in these models are observable market data, including appropriate interest rate curves, volatilities, correlations and exchange rates. In limited circumstances, other inputs may be used in these models that are based on data other than observable market data, such as HPI volatility, HPI forward growth, HPI spot rate and mortality. |
| D | In the valuation of linear instruments such as credit risk and fixed-income derivatives, credit risk is measured using dynamic models similar to those used in the measurement of interest rate risk. In the case of non-linear instruments, if the portfolio is exposed to credit risk such as credit derivatives, the probability of default is determined using the par spread level. The main inputs used to determine the underlying cost of credit of credit derivatives are quoted credit risk premiums and the correlation between the quoted credit derivatives of various issuers. |
The fair values of the financial instruments arising from the Santander UK group’s internal models take into account, among other things, contract terms and observable market data, which include such factors as bid-offer spread, interest rates, credit risk, exchange rates, the quoted market price of raw materials and equity securities, volatility and prepayments. In all cases, when it is not possible to derive a valuation for a particular feature of an instrument, management uses judgement to determine the fair value of the particular feature. In exercising this judgement, a variety of tools are used including proxy observable data, historical data and extrapolation techniques. Extrapolation techniques take into account behavioural characteristics of equity markets that have been observed over time, and for which there is a strong case to support an expectation of a continuing trend in the future. Estimates are calibrated to observable market prices when they become available.
The estimates thus obtained could vary if other valuation methods or assumptions were used. The Santander UK group believes its valuation methods are appropriate and consistent with other market participants. Nevertheless, the use of different valuation methods or assumptions, including imprecision in estimating unobservable market inputs, to determine the fair value of certain financial instruments could result in different estimates of fair value at the reporting date and the amount of gain or loss recorded for a particular instrument. Most of the valuation models are not significantly subjective, because they can be tested and, if necessary, recalibrated by the internal calculation of and subsequent comparison to market prices of actively traded securities, where available.
d) Fair value adjustments
The internal models incorporate assumptions that the Santander UK group believes would be made by a market participant to establish fair value. Fair value adjustments are adopted when the Santander UK group considers that there are additional factors that would be considered by a market participant in the determination of fair value of the instrument that are not incorporated in the valuation model. The magnitude of fair value adjustments depends upon many entity-specific factors, including modelling sophistication, the nature of products traded, and the size and type of risk exposures. For this reason, fair value adjustments may not be comparable across the banking industry.
The Santander UK group classifies fair value adjustments as either ‘risk-related’ or ‘model-related’. The fair value adjustments form part of the portfolio fair value and are included in the balance sheet values of the product types to which they have been applied. The majority of these adjustments relate to Corporate & Institutional Banking. The magnitude and types of fair value adjustment adopted by Corporate & Institutional Banking are listed in the following table:
| 30 June 2015 £m | 31 December 2014 £m | |||||||
Risk-related: | ||||||||
- Bid-offer and trade specific adjustments | 37 | 34 | ||||||
- Uncertainty | 37 | 18 | ||||||
- Credit risk adjustment | 36 | 32 | ||||||
|
|
|
| |||||
| 110 | 84 | |||||||
|
|
|
| |||||
Model-related: | ||||||||
- Model limitation | 10 | 11 | ||||||
Day One profits | 1 | 2 | ||||||
|
|
|
| |||||
| 121 | 97 | |||||||
|
|
|
| |||||
Risk-related adjustments
Risk-related adjustments are driven, in part, by the magnitude of the Santander UK group’s market or credit risk exposure, and by external market factors, such as the size of market spreads. For further details, see the ‘Risk-related adjustments’ section on page 312 of the 2014 Annual Report.
| 2015 Half Yearly Financial Report | 131 |
Table of Contents
Financial statements
e) Internal models based on information other than market data (Level 3)
The table below provides an analysis of financial instruments valued using internal models based on information other than market data together with the subsequent valuation technique used for each type of instrument. Each instrument is initially valued at transaction price:
Balance sheet value | Amount recognised in income/(expense) | |||||||||||||||||||
| 30 June 2015 | 31 December 2014 | 30 June 2015 | 30 June 2014 | |||||||||||||||||
Balance sheet line item | Category | Financial instrument product type | £m | £m | £m | £m | ||||||||||||||
1. Derivative assets | Exchange rate contracts | Cross-currency swaps | 7 | 5 | 2 | (1 | ) | |||||||||||||
2. Derivative assets | Interest rate contracts | Bermudan swaptions | 13 | 20 | (5 | ) | (4 | ) | ||||||||||||
3. Derivative assets | Equity and credit contracts | Reversionary property interests | 80 | 84 | (2 | ) | 6 | |||||||||||||
4. Derivative assets | Credit contracts | Credit default swaps | 5 | 5 | (1 | ) | 3 | |||||||||||||
5. Derivative assets | Equity contracts | Options and forwards | 35 | 38 | (1 | ) | (8 | ) | ||||||||||||
6. FVTPL | Loans and advances to customers | Roll-up mortgage portfolio | 60 | 61 | — | 2 | ||||||||||||||
7. FVTPL | Debt securities | Reversionary property securities | 211 | 220 | 5 | 14 | ||||||||||||||
9. Derivative liabilities | Interest rate contracts | Bermudan swaptions | (5 | ) | (6 | ) | (1 | ) | 2 | |||||||||||
10. Derivative liabilities | Equity contracts | Options and forwards | (35 | ) | (45 | ) | (3 | ) | (5 | ) | ||||||||||
11. FVTPL | Debt securities in issue | Non-vanilla debt securities | (9 | ) | (13 | ) | (2 | ) | 1 | |||||||||||
|
|
|
|
|
|
|
| |||||||||||||
Total net assets | 362 | 369 | ||||||||||||||||||
|
|
|
|
|
|
|
| |||||||||||||
Total (expense)/income | (8 | ) | 10 | |||||||||||||||||
|
|
|
|
|
|
|
| |||||||||||||
Valuation techniques
There have been no significant changes to the valuation techniques as set out in Note 44(i) to the Consolidated Financial Statements in the 2014 Annual Report.
Reconciliation of fair value measurements in Level 3 of the fair value hierarchy
The following table provides a reconciliation of the movement between opening and closing balances of Level 3 financial instruments, measured at fair value using a valuation technique with significant unobservable inputs:
| Assets | Liabilities | |||||||||||||||||||||||
| Derivatives | Fair value through P&L | Total | Derivatives | Fair value through P&L | Total | |||||||||||||||||||
| £m | £m | £m | £m | £m | £m | |||||||||||||||||||
At 1 January 2015 | 152 | 281 | 433 | (51 | ) | (13 | ) | (64 | ) | |||||||||||||||
Total gains/(losses) recognised in profit/(loss): | ||||||||||||||||||||||||
- Fair value movements | (7 | ) | 5 | (2 | ) | (4 | ) | (2 | ) | (6 | ) | |||||||||||||
- Foreign exchange and other movements | — | — | — | — | — | — | ||||||||||||||||||
Settlements | (5 | ) | (15 | ) | (20 | ) | 15 | 6 | 21 | |||||||||||||||
|
|
|
|
|
|
|
|
|
|
|
| |||||||||||||
At 30 June 2015 | 140 | 271 | 411 | (40 | ) | (9 | ) | (49 | ) | |||||||||||||||
|
|
|
|
|
|
|
|
|
|
|
| |||||||||||||
Gains/(losses) recognised in profit/(loss) relating to assets and liabilities held at the end of the period | (7 | ) | 5 | (2 | ) | (4 | ) | (2 | ) | (6 | ) | |||||||||||||
At 1 January 2014 | 145 | 321 | 466 | (48 | ) | (37 | ) | (85 | ) | |||||||||||||||
Total gains/(losses) recognised in profit/(loss): | ||||||||||||||||||||||||
- Fair value movements | (6 | ) | 51 | 45 | (7 | ) | 1 | (6 | ) | |||||||||||||||
- Foreign exchange and other movements | (7 | ) | (1 | ) | (8 | ) | — | 2 | 2 | |||||||||||||||
Transfers in | 29 | — | 29 | (10 | ) | — | (10 | ) | ||||||||||||||||
Transfers out | — | (58 | ) | (58 | ) | — | — | — | ||||||||||||||||
Settlements | (9 | ) | (32 | ) | (41 | ) | 14 | 21 | 35 | |||||||||||||||
|
|
|
|
|
|
|
|
|
|
|
| |||||||||||||
At 31 December 2014 | 152 | 281 | 433 | (51 | ) | (13 | ) | (64 | ) | |||||||||||||||
|
|
|
|
|
|
|
|
|
|
|
| |||||||||||||
Gains/(losses) recognised in profit/(loss) relating to assets and liabilities held at the end of the year | (13 | ) | 50 | 37 | (7 | ) | 3 | (4 | ) | |||||||||||||||
| 132 | Santander UK plc |
Table of Contents
Primary financial statements | Notes to the financial statements | |
|
Effect of changes in significant unobservable assumptions to reasonably possible alternatives (Level 3)
As discussed above, the fair value of financial instruments are, in certain circumstances, measured using valuation techniques that incorporate assumptions that are not evidenced by prices from observable current market transactions in the same instrument and are not based on observable market data and, as such require the application of a degree of judgement. Changing one or more of the inputs to the valuation models to reasonably possible alternative assumptions would change the fair values significantly. The following table shows the sensitivity of these fair values to reasonably possible alternative assumptions.
Favourable and unfavourable changes are determined on the basis of changes in the value of the instrument as a result of varying the levels of the unobservable input as described in the table below. The potential effects do not take into effect any hedged positions.
30 June 2015
| Reflected in income statement | ||||||||||||||||||||||||||
Balance sheet note line item and product | Fair value | Significant unobservable input | Shift | Favourable changes | Unfavourable changes | |||||||||||||||||||||
| Assumption value | ||||||||||||||||||||||||||
| £m | Assumption description | Range(1) | Weighted average | % | £m | £m | ||||||||||||||||||||
2. Derivative assets – Interest rate contracts: | 13 | Mean reversion | 0%-4 | % | 2 | % | 1 | 1 | (1 | ) | ||||||||||||||||
– Bermudan swaptions | ||||||||||||||||||||||||||
3. Derivative assets – Equity and credit contracts: | 80 | HPI Forward growth rate | 0%-5 | % | 2.43 | % | 1 | 11 | (11 | ) | ||||||||||||||||
– Reversionary property derivatives | HPI Spot rate | n/a | 659 | (2) | 10 | 8 | (8 | ) | ||||||||||||||||||
4. Derivative assets – Credit contracts: | 5 | Probability of default | 0%-11.9 | % | 0.33 | % | 20 | 1 | (1 | ) | ||||||||||||||||
– Credit default swaps | ||||||||||||||||||||||||||
5. Derivative assets – Equity contracts: | 35 | HPI Forward growth rate | 0%-5 | % | 1.38 | % | 1 | 3 | (3 | ) | ||||||||||||||||
– Options and forwards | HPI Spot rate | n/a | 643 | (2) | 10 | 6 | (4 | ) | ||||||||||||||||||
6. FVTPL – Loans and advances to customers: | 60 | HPI Forward growth rate | 0%-5 | % | 2.69 | % | 1 | 2 | (2 | ) | ||||||||||||||||
– Roll-up mortgage portfolio | ||||||||||||||||||||||||||
7. FVTPL – Debt securities: | 211 | HPI Forward growth rate | 0%-5 | % | 2.43 | % | 1 | 15 | (15 | ) | ||||||||||||||||
– Reversionary property securities | HPI Spot rate | n/a | 659 | (2) | 10 | 20 | (20 | ) | ||||||||||||||||||
9. Derivative liabilities – Interest rate contracts: | (5 | ) | Mean reversion | 0%-4 | % | 2 | % | 1 | 1 | (1 | ) | |||||||||||||||
– Bermudan swaptions | ||||||||||||||||||||||||||
10. Derivative liabilities – Equity contracts: | (35 | ) | HPI Forward growth rate | 0%-5 | % | 1.38 | % | 1 | 4 | (4 | ) | |||||||||||||||
– Options and forwards | HPI Spot rate | n/a | 643 | (2) | 10 | 9 | (11 | ) | ||||||||||||||||||
| 31 December 2014 | ||||||||||||||||||||||||||
2. Derivative assets – Interest rate contracts: | 20 | Mean reversion | 0%-4 | % | 4 | % | 1 | 2 | (2 | ) | ||||||||||||||||
– Bermudan swaptions | ||||||||||||||||||||||||||
3. Derivative assets – Equity and credit contracts: | 84 | HPI Forward growth rate | 0%-5 | % | 2.63 | % | 1 | 11 | (11 | ) | ||||||||||||||||
– Reversionary property derivatives | HPI Spot rate | n/a | 630 | (2) | 10 | 8 | (8 | ) | ||||||||||||||||||
4. Derivative assets – Credit contracts: | 5 | Probability of default | 0.1%-0.9 | % | 0.2 | % | 20 | 1 | (1 | ) | ||||||||||||||||
– Credit default swaps | ||||||||||||||||||||||||||
5. Derivative assets – Equity contracts: | 38 | HPI Forward growth rate | 0%-5 | % | 2.14 | % | 1 | 3 | (3 | ) | ||||||||||||||||
– Options and forwards | HPI Spot rate | n/a | 607 | (2) | 10 | 1 | — | |||||||||||||||||||
6. FVTPL – Loans and advances to customers: | 61 | HPI Forward growth rate | 0%-5 | % | 2.78 | % | 1 | 2 | (2 | ) | ||||||||||||||||
– Roll-up mortgage portfolio | ||||||||||||||||||||||||||
7. FVTPL – Debt securities: | 220 | HPI Forward growth rate | 0%-5 | % | 2.63 | % | 1 | 16 | (16 | ) | ||||||||||||||||
– Reversionary property securities | HPI Spot rate | n/a | 630 | (2) | 10 | 20 | (20 | ) | ||||||||||||||||||
9. Derivative liabilities – Interest rate contracts: | (6 | ) | Mean reversion | 0%-4 | % | 4 | % | 1 | 1 | (1 | ) | |||||||||||||||
– Bermudan swaptions | ||||||||||||||||||||||||||
10. Derivative liabilities – Equity contracts: | (45 | ) | HPI Forward growth rate | 0%-5 | % | 2.14 | % | 1 | 4 | (4 | ) | |||||||||||||||
– Options and forwards | HPI Spot rate | n/a | 607 | (2) | 10 | 14 | (16 | ) | ||||||||||||||||||
| (1) | The range of actual assumption values used to calculate the weighted average disclosure. |
| (2) | Represents the HPI spot rate index level at 30 June 2015 and 31 December 2014. |
No sensitivities are presented for the FVTPL - debt securities in issue (instrument 11) and related exchange rate derivatives (instrument 1), as the terms of these instruments are fully matched. As a result, any changes in the valuation of the debt securities in issue would be exactly offset by an equal and opposite change in the valuation of the exchange rate derivatives.
| 2015 Half Yearly Financial Report | 133 |
Table of Contents
Financial statements
32. CAPITAL MANAGEMENT AND RESOURCES
This note reflects the transactions and amounts reported on a basis consistent with the Santander UK group’s regulatory filings at 30 June 2015.
a) Capital adequacy
The Santander UK group manages its capital on a CRD IV basis. During the six months ended 30 June 2015 and the year ended 31 December 2014, the Santander UK group held capital over and above its regulatory requirements, and managed internal capital allocations and targets in accordance with its capital and risk management policies.
b) Group capital
| 30 June 2015 £m | 31 December 2014 £m | |||||||
Common Equity Tier 1 (‘CET 1’) capital before regulatory adjustments | 13,390 | 13,054 | ||||||
Regulatory adjustments to CET 1 capital | (3,422 | ) | (3,298 | ) | ||||
|
|
|
| |||||
CET 1 capital | 9,968 | 9,756 | ||||||
Additional Tier 1 (‘AT1’) capital | 2,251 | 1,866 | ||||||
|
|
|
| |||||
Tier 1 capital | 12,219 | 11,622 | ||||||
Tier 2 capital | 2,895 | 3,072 | ||||||
|
|
|
| |||||
Total capital | 15,114 | 14,694 | ||||||
|
|
|
| |||||
During the first half of 2015, CET 1 capital increased by £212m to £9,968m (2014: £9,756m). This was largely due to profits for the period attributable to equity holders of the parent of £722m, less interim ordinary dividends approved of £325m. During the first half of 2015, the increase in AT1 capital was due to the issuance of £750m Perpetual Capital Securities as detailed in Note 27.
33. NON-CONTROLLING INTERESTS
| 30 June 2015 £m | 31 December 2014 £m | |||||||
PSA Finance UK Limited | 123 | — | ||||||
|
|
|
| |||||
| 123 | — | |||||||
|
|
|
| |||||
Non-controlling interests represent a 50% ordinary shareholding in PSA Finance UK Limited, see Note 35 for further information.
34. EVENTS AFTER THE BALANCE SHEET DATE
None.
| 134 | Santander UK plc |
Table of Contents
Primary financial statements | Notes to the financial statements | |
|
35. ACQUISITION OF PSA FINANCE UK LIMITED
On 3 February 2015, the Santander UK group through Santander Consumer (UK) plc (‘SCUK’) entered into an agreement with Banque PSA Finance, S.A. (‘BPF’), the auto finance unit of Group PSA Peugeot Citroën, to purchase 50% of the shares of PSA Finance UK Limited (‘PSA’). PSA, BPF and SCUK have set up a cooperation to offer a range of consumer finance and insurance products and services for individuals, businesses and distribution networks in the automotive industry. SCUK has control over PSA through its ability to direct the activities that most significantly affect SCUK’s returns.
The aggregate consideration paid by SCUK for the shares was £111m. The following table shows the amounts recognised at the acquisition date for the net assets acquired:
Net assets acquired: | £m | |||
Assets | ||||
Loans and advances to banks and customers | 2,461 | |||
Other assets, tax assets and lease assets | 60 | |||
Liabilities | ||||
Deposits by customers | (1,219 | ) | ||
Debt securities in issue | (1,014 | ) | ||
Other liabilities, tax liabilities, provisions, and retirement benefit obligations | (66 | ) | ||
|
| |||
Net identified assets and liabilities | 222 | |||
Non-controlling interest (50%) | (111 | ) | ||
|
| |||
Consideration | 111 | |||
|
| |||
Satisfied by: | ||||
Cash and cash equivalents | 111 | |||
Less: Cash and cash equivalents in business acquired | — | |||
|
| |||
Net cash outflow | 111 | |||
|
| |||
The amounts shown above are provisional as the purchase price allocation for this transaction is still being finalised.
Financial effect of the acquisition
The total operating income and profit before tax included in the Condensed Consolidated Income Statement for the six months ended 30 June 2015 contributed by the PSA business since the acquisition (before deducting non-controlling interests) were £46m and £31m, respectively. Had PSA been consolidated from 1 January 2015, Santander UK would have included total operating income of £56m and profit before tax of £38m (before deducting non-controlling interests) for the period.
| 2015 Half Yearly Financial Report | 135 |
Table of Contents
An investment in Santander UK plc (the ‘Company’) and its subsidiaries (‘us’, ‘we’ or ‘Santander UK group’) involves a number of risks, the material ones of which are set out in the 2014 Annual Report on pages 327 to 346. The principal risks described in these risk factors, a summary of which can be found on page 138, remain unchanged except for the risk factor entitled “Potential intervention by the FCA, the PRA or an overseas regulator may occur, particularly in response to customer complaints” which has been updated as follows:
Potential intervention by the FCA, the PRA or an overseas regulator may occur, particularly in response to customer complaints
The PRA and the FCA now have a more outcome-focused regulatory approach than their predecessor the FSA. This involves more proactive enforcement and more punitive penalties for infringement. As a result, we and other PRA and/or FCA-authorised firms face increased supervisory intrusion and scrutiny (resulting in increasing internal compliance costs and supervision fees), and in the event of a breach of their regulatory obligations are likely to face more stringent penalties.
In particular, the FCA has a strong focus on consumer protection, and it is taking a more interventionist approach in its increasing scrutiny of product terms and conditions. FSMA (as amended by the Financial Services Act 2012) gives the FCA the power to make temporary product intervention rules either to improve a firm’s systems and controls in relation to product design, product management and implementation, or to address problems identified with products which may potentially cause significant detriment to consumers because of certain product features or firms’ flawed governance and distribution strategies. Such rules may prevent firms from entering into product agreements with consumers until such problems have been rectified.
The regulatory regime requires us to be in compliance across all aspects of our business, including the training, authorisation and supervision of personnel, systems, processes and documentation. If we fail to be compliant with relevant regulations, there is a risk of an adverse impact on our business from sanctions, fines or other action imposed by the regulatory authorities. Customers of financial services institutions, including our customers, may seek redress if they consider that they have suffered loss as a result of the misselling of a particular product, or through incorrect application of the terms and conditions of a particular product. Given the inherent unpredictability of litigation and the evolution of judgements by the FOS, it is possible that an adverse outcome in some matters could have a material adverse effect on our operating results, financial condition and prospects arising from any penalties imposed or compensation awarded, together with the costs of defending such an action.
Under the Financial Services Act 2010, the FCA has the power to require authorised firms, including us, to establish a customer redress scheme if it considers that consumers have suffered loss or damage as a consequence of a regulatory failing, including misselling.
In recent years there have been several industry-wide issues in which the FSA (now the FCA) has intervened directly. One such issue is the misselling of PPI. In August 2010, the FSA published a policy statement entitled ‘The assessment and redress of Payment Protection Insurance complaints’ (the ‘Policy Statement’). The Policy Statement contained rules which altered the basis on which regulated firms (including the Company and certain members of our group) must consider and deal with complaints in relation to the sale of PPI and potentially increased the amount of compensation payable to customers whose complaints are upheld. A legal challenge of these rules by the British Bankers’ Association was unsuccessful. In light of this and the consequential increase in claims levels we performed a detailed review of our provision requirements in the first half of 2011 and, as a result, revised our provision for PPI complaint liabilities to reflect the new information. The overall effect of the above was a substantial increase in the provision requirement for 2011. No additional provisions were made for PPI in 2012 or in 2013. In 2014, a total charge of £140m, including related costs, was made for further conduct remediation. Of this, £95m related to PPI, following a review of recent claims activity, which indicated that claims are now expected to continue for longer than originally anticipated. The FCA has announced that it will gather evidence on current trends in PPI to assess the current process for PPI complaints. It will consider whether any new intervention is necessary and report on the matter in the summer of 2015. The FCA is also considering the impact of the decision inPlevin v Paragon Personal Finance Ltd (‘Plevin’), in which the Supreme Court ruled that a failure to disclose a large commission payment on a single premium PPI policy sold in connection with a secured personal loan made the relationship between the lender and the borrower unfair under section 140A of the Consumer Credit Act 1974. As a result, the FCA is considering whether additional rules and/or guidance are required to deal with the impact of the Plevin decision on complaints about PPI. The FCA has said that it expects to announce its views on this, including next steps, alongside the findings of its broader review. The FOS is also currently considering its position with respect to the impact of Plevin on PPI complaints. We are considering the impact of this decision on our PPI complaint liabilities, although it is not possible to determine at this time the nature or extent of that impact.
Given the above, the ultimate financial impact on us of the claims arising from PPI complaints is still uncertain and will depend on a number of factors, including the implementation of the Policy Statement, the impact of the Supreme Court’s decision in Plevin (including the nature and content of new FCA rules and/or guidance related to this decision, if any), the rate at which new complaints arise, the length of any complaints, the content and quality of the complaints (including the availability of supporting evidence) and the average uphold rates and redress costs. We can make no assurance that expenses associated with PPI complaints will not exceed the provision we have made relating to these claims. More generally, we can make no assurance that our estimates for potential liabilities, based on the key assumptions we used, are correct, and the reserves taken as a result may prove inadequate. If Santander UK were to incur additional expenses that exceed provisions for PPI liabilities or other provisions, these expenses could have a material adverse effect on our operating results, financial condition and prospects. For further information about the provisions for PPI complaint liabilities and other conduct remediation see Note 24 to our Condensed Consolidated Interim Financial Statements.
All the above is similarly relevant to any future industry-wide misselling or other issues that could affect us, such as the sale of other retail financial products and interest-rate derivative products sold to SMEs. This may lead from time to time to: (i) significant direct costs or liabilities (including in relation to misselling); and (ii) changes in the practices of such businesses which benefit customers at a cost to shareholders.
Decisions taken by the FOS (or any overseas equivalent that has jurisdiction) could, if applied to a wider class or grouping of customers, have a material adverse effect on our operating results, financial condition and prospects.
The Financial Services and Markets Act 2000 (Designated Consumer Bodies) Order 2013 (the ‘Order’) was made on 16 December 2013 and came into force on 1 January 2014. The Order designates the National Association of Citizens Advice Bureaux, the Consumers’ Association, the General Consumer Council for Northern Ireland and the National Federation of Self Employed and Small Businesses as consumer bodies that may submit a ‘super-complaint’ to the FCA. A ‘super-complaint’ is a complaint made by any of these designated consumer bodies to the FCA on behalf of consumers of financial services where it considers that a feature, or a combination of features, of the market for financial services in the UK is seriously damaging the interests of these customers. Complaints about damage to the interests of individual consumers will continue to be dealt with by the FOS. If a ‘super-complaint’ were made against a Santander UK group member under this Order, any response published or action taken by the FCA could have a material adverse effect on our operating results, financial condition and prospects.
| 136 | Santander UK plc |
Table of Contents
Risk factors | other information | Glossary | Forward-looking statements | Selected financial data | ||||||
|
Contact information
a) Santander UK registered office, principal office and investor relations department
2 Triton Square Regent’s Place London NW1 3AN | Phone number: 0870-607-6000 |
Designated agent
The designated agent for service of process on Santander UK in the United States is Abbey National Treasury Services plc (Connecticut branch), 400 Atlantic Street, Stamford, CT 06901.
b) Santander Shareholder Relations
2 Triton Square Regent’s Place London NW1 3AN | Phone numbers: 0871-384-2000 +44 (0) 121-415-7188 (outside the UK) | Email: shareholders@santander.com |
A glossary of financial services industry terms is set out on pages 348 to 352 of the 2014 Annual Report. The following additional term arose in the first half of 2015.
Term | Definition | |
| Retail customer satisfaction | The Financial Research Survey (‘FRS’) is a monthly personal finance survey of around 5,000 consumers prepared by the independent market research agency, GfK NOP. The ‘Overall Satisfaction’ score refers to proportion of extremely and very satisfied customers across mortgages, savings, main current accounts, home insurance, UPLs and credit cards, based on a weighting of those products calculated to reflect the average product distribution across Santander UK and competitor brands. Data shown is for the 12 months ending 30 June 2015 and compared against 12 months ending data for the period as indicated. The competitor set included in this analysis is Barclays, Halifax, HSBC, Lloyds Bank, TSB and NatWest. Previously this data was reported on a rolling three month basis. | |
| Corporate customer satisfaction | The Charterhouse UK Business Banking Survey is an on-going telephone based survey designed to monitor usage and attitude of UK businesses towards banks. 17,000 structured telephone interviews are conducted each year among businesses of all sizes from new start-ups to large corporates with annual sales of £1bn. The data is based upon 5,732 interviews made in the year ending 30 June 2015 with businesses turning over £250k to £50m per annum and are weighted by region and turnover to be representative of businesses in Great Britain. Satisfaction is based on a five point scale (% Excellent / Very good). The competitor set included in this analysis is Barclays, RBS, HSBC, Lloyds, TSB and NatWest. Improvement shown in overall satisfaction over last 2 years (+9pp), and significant improvement in relationship management satisfaction in last year. | |
| Current Account Switch Service (‘CASS’) guarantee | On 16 September 2013, the Payments Council (now Bacs) launched CASS. The service is free-to-use for consumers, small charities, small businesses and small trusts, and is designed to make switching from one bank or building society to another, simpler, reliable and hassle-free, thus removing customers’ perceived barriers to switching. The new service is backed by a customer guarantee and aims to increase competition in the high street, support the entry of new banks in the current account marketplace and give customers greater choice if they want to switch.
The published Payments Council branded data referenced is for switches completing between 1 January 2014 and 31 December 2014 and shows Santander UK gained 276,900 switchers, with a net gain of 186,200. The branded data is published six months in arrears. Payments Council data for the industry shows 1,847,400 full switches were completed between 16 September 2013 and 30 June 2015. Santander UK management information identifies 502,200 full switchers in the same period, representing approximately one-in-four full switches. | |
| 2015 Half Yearly Financial Report | 137 |
Table of Contents
Risk factors | Contact and other information | Glossary | Forward-looking statements | Selected financial data | ||||||
|
Santander UK plc (the ‘Company’) and its subsidiaries (together ‘Santander UK’ or the ‘Santander UK group’) may from time to time make written or oral forward-looking statements. The Company makes written forward-looking statements in this Half Yearly Financial Report and may also make forward-looking statements in its periodic reports to the SEC on Forms 20-F and 6-K, in its offering circulars and prospectuses, in press releases and other written materials and in oral statements made by its officers, directors or employees to third parties. Examples of such forward-looking statements include, but are not limited to:
| • | projections or expectations of revenues, costs, profit (or loss), earnings (or loss) per share, dividends, capital structure or other financial items or ratios; |
| • | statements of plans, objectives or goals of Santander UK or its management, including those related to products or services; |
| • | statements of future economic performance; and |
| • | statements of assumptions underlying such statements. |
Words such as ‘believes’, ‘anticipates’, ‘expects’, ‘intends’, ‘aims’, ‘plans’, ‘targets’ and similar expressions are intended to identify forward-looking statements, but are not the exclusive means of identifying such statements. By their very nature, forward-looking statements are not statements of historical or current facts; they cannot be objectively verified, are speculative and involve inherent risks and uncertainties, both general and specific, and risks exist that the predictions, forecasts, projections and other forward-looking statements will not be achieved. Santander UK cautions readers that a number of important factors could cause actual results to differ materially from the plans, objectives, expectations, estimates and intentions expressed in such forward-looking statements made by Santander UK or on its behalf. Some of these factors, which could affect the Santander UK group’s business, financial condition and/or results of operations, are considered in detail in the Risk Review and the Risk Factors section in the Shareholder Information section in this report, and they include:
| • | the ability of Santander UK to recruit, retain and develop appropriate senior management and skilled personnel; |
| • | the disruptions and volatility in the global financial markets; |
| • | the effects of UK economic conditions; |
| • | Santander UK’s exposure to UK political developments; |
| • | the extent to which regulatory capital and leverage requirements and any changes to these requirements may limit Santander UK’s operations; |
| • | the extent to which liquidity requirements and any changes to these requirements may limit Santander UK’s operations; |
| • | Santander UK’s exposure to UK Government debt; |
| • | the effects of the ongoing economic and sovereign debt tensions in the eurozone; |
| • | Santander UK’s exposure to risks faced by other financial institutions; |
| • | Santander UK’s ability to access liquidity and funding on acceptable financial terms; |
| • | the effects of an adverse movement in external credit rating assigned to the Santander UK group, any Santander UK group member or any of their respective debt securities; |
| • | the effects of fluctuations in interest rates and other market conditions; |
| • | the extent to which Santander UK may be required to record negative fair value adjustments for its financial assets due to changes in market conditions; |
| • | the risk of failing to successfully implement and continue to improve Santander UK’s credit risk management systems; |
| • | the risks associated with Santander UK’s derivative transactions; |
| • | the extent to which Santander UK may be exposed to operational risks, including risks relating to data and information collection, processing, storage and security; |
| • | the risk of failing to effectively improve or upgrade Santander UK’s information technology infrastructure and management information systems in a timely manner; |
| • | Santander UK’s exposure to unidentified or unanticipated risks despite its risk management policies, procedures and methods; |
| • | the effects of competition, or intensification of such competition, in the financial services markets in which Santander UK conducts business and the impact of customer perception of Santander UK’s customer service levels on existing or potential business; |
| • | the various risks facing Santander UK as it expands its range of products and services (e.g. risk of new products and services not being responsive to customer demands or successful, risk of changing customer needs); |
| • | Santander UK’s ability to control the level of non-performing or poor credit quality loans and whether Santander UK’s loan loss reserves are sufficient; |
| • | the extent to which Santander UK’s loan portfolio is subject to prepayment risk; |
| • | the risk that the value of the collateral, including real estate, securing Santander UK’s loans may not be sufficient and Santander UK may be unable to realise the full value of the collateral securing its loan portfolio; |
| • | the ability of Santander UK to realise the anticipated benefits of its business combinations and the exposure, if any, of Santander UK to any unknown liabilities or goodwill impairments relating to acquired businesses; |
| • | the effects of the financial services laws, regulations, governmental oversight, administrative actions and policies and any changes thereto in each location or market in which Santander UK operates; |
| • | Santander UK’s exposure to any potential uncertainty and changes to the UK regulatory regime as a result of the reform and reorganisation of the UK financial regulatory authorities and the UK regulatory framework; |
| • | the effects of any new reforms to the UK mortgage lending and the personal loans market; |
| • | Santander UK’s exposure to any risk of loss from legal and regulatory proceedings; |
| • | the power of the FCA, the PRA or an overseas regulator to potentially intervene in response to e.g. attempts by customers to seek redress from financial service institutions, including Santander UK, in case of industry-wide issues; |
| • | the effects which the Banking Act 2009 may have on Santander UK’s business; |
| • | the effects which the bail-in and write down powers under the Banking Act 2009 and the BRRD may have on Santander UK’s business; |
| • | the extent to which members of the Santander UK group may be responsible for contributing to compensation schemes in the UK in respect of banks and other authorised financial services firms that are unable to meet their obligations to customers; |
| • | the risk of third parties using Santander UK as a conduit for illegal or improper activities without Santander UK’s knowledge; |
| • | the effects of taxation requirements and other assessments and any changes thereto in each location in which Santander UK operates; |
| • | the effects of any changes in the pension liabilities and obligations of Santander UK; |
| • | the effects of any changes to the reputation of the Santander UK group, any Santander UK group member or any affiliate operating under the Santander UK brands; |
| • | the basis of the preparation of the Company’s and the Santander UK group’s financial statements and information available about the Santander UK group, including the extent to which assumptions and estimates made during such preparation are accurate; |
| • | the extent to which disclosure controls and procedures over financial reporting may not prevent or detect all errors or acts of fraud; |
| • | the extent to which changes in accounting standards could impact Santander UK’s reported earnings; |
| • | the extent to which Santander UK rely on third parties for important infrastructure support, products and services; |
| • | the possibility of risk arising in the future in relation to transactions between the Company and its parent, subsidiaries or affiliates; and |
| • | Santander UK’s success at managing the risks to which it is exposed, including the items above. |
Undue reliance should not be placed on forward-looking statements when making decisions with respect to Santander UK and/or its securities. Investors and others should take into account the inherent risks and uncertainties of forward-looking statements and should carefully consider the foregoing non-exhaustive list of important factors. Forward-looking statements speak only as of the date on which they are made and are based on the knowledge, information available and views taken on the date on which they are made; such knowledge, information and views may change at any time. Santander UK does not undertake any obligation to update or revise any forward-looking statement, whether as a result of new information, future events or otherwise.
| 138 | Santander UK plc |
Table of Contents
Risk factors | Contact and other information | Glossary | Forward-looking statements | Selected financial data | ||||||
|
Other Information for US Investors
Selected financial data
This Half Yearly Financial Report includes certain financial measures which are not accounting measures within the scope of IFRS. Such non-IFRS measures are defined as ones that measure historical or future financial performance, financial position or cash flows but which exclude or include amounts that would not be so adjusted in the most comparable IFRS measures. Such measures are defined further in the footnotes that follow including, where relevant, reconciliations to the nearest IFRS measure. These non-IFRS measures are not a substitute for IFRS measures. Such non-IFRS measures include return on tangible equity (‘RoTE’), adjusted return on tangible equity (‘Adjusted RoTE’), Banking net interest margin, and Liquidity Coverage Ratio. Details of the calculation of the Liquidity Coverage Ratio (‘LCR’) which is the ratio of the eligible liquidity pool as a percentage of the anticipated net cash flows from those assets, are shown on page 54.
| 30 June 2015 % | 31 December 2014 % | |||||||
Profitability ratios: | ||||||||
Return on assets (1) | 0.25 | 0.40 | ||||||
Return on ordinary shareholders’ funds(2) | 11.4 | 8.9 | ||||||
Adjusted RoTE/RoTE(3) | 12.8 | 10.4 | ||||||
Banking net interest margin(4) | 1.86 | 1.82 | ||||||
Cost-to-income ratio(5) | 53 | 54 | ||||||
Non-performing loans ratio(6) | 1.68 | 1.80 | ||||||
Loan-to-deposit ratio(7) | 124 | 124 | ||||||
Capital ratios: | ||||||||
Equity to assets ratio(8) | 4.52 | 4.48 | ||||||
Common Equity Tier 1 (‘CET 1’) capital ratio(9) | 11.7 | 11.9 | ||||||
Ratio of earnings to fixed charges:(10) | ||||||||
- Excluding interest on retail deposits | 255 | 208 | ||||||
- Including interest on retail deposits | 159 | 142 | ||||||
| (1) | Profit after tax divided by average total assets. |
| (2) | Profit after tax divided by average ordinary shareholders’ funds, as presented in the table below. Shareholders’ funds equal shareholders’ equity. |
| (3) | RoTE is defined as the profit attributable to equity shareholders, divided by average shareholders’ funds less average preference shares, non-controlling interests and AT1 securities and average goodwill and other intangible assets. Adjusted RoTE is presented for the half year and is computed in the same manner as RoTE described above except that the profit attributable to equity shareholders is adjusted to account for the UK Bank Levy at the half year on an accrual basis. This adjustment is computed only at interim dates and is made to spread the cost of the UK Bank Levy evenly over the year which under IFRS is only recorded at year-end. Management reviews adjusted RoTE/RoTE in order to measure the overall profitability of the Santander UK group and believes that presentation of these financial measures provides useful information to investors regarding the Santander UK group’s results of operations. Reconciliations between adjusted RoTE/RoTE and return on ordinary shareholders’ funds which is profit after tax divided by average ordinary shareholders’ funds, the nearest IFRS measure are as follows: |
| 30 June 2015 £m | 31 December 2014 £m | |||||||
Profit after tax (annualised(11)) | 1,482 | 1,110 | ||||||
Preference dividends and non-controlling interests | (48 | ) | (40 | ) | ||||
|
|
|
| |||||
Profit attributable to equity shareholders (annualised(11)) | 1,434 | 1,070 | ||||||
|
|
|
| |||||
Adjust for: UK Bank Levy | (49 | ) | — | |||||
|
|
|
| |||||
Adjusted profit attributable to equity shareholders | 1,385 | 1,070 | ||||||
|
|
|
| |||||
Average shareholders’ funds and non-controlling interests | 14,561 | 13,389 | ||||||
Average preference shares, non-controlling interests and AT1 securities | (1,534 | ) | (871 | ) | ||||
|
|
|
| |||||
Average ordinary shareholders funds | 13,027 | 12,518 | ||||||
Average goodwill and other intangible assets | (2,199 | ) | (2,261 | ) | ||||
|
|
|
| |||||
Average tangible equity | 10,828 | 10,257 | ||||||
|
|
|
| |||||
Return on ordinary shareholders’ funds | 11.4 | % | 8.9 | % | ||||
|
|
|
| |||||
Adjusted RoTE/RoTE | 12.8 | % | 10.4 | % | ||||
|
|
|
| |||||
| (4) | Banking net interest margin (‘Banking NIM’) is defined as net interest income divided by average customer assets. Management reviews Banking NIM in order to measure the overall profitability of the Santander UK group and believes that presentation of this financial measure provides useful information to investors regarding the Santander UK group’s results of operations. A reconciliation between Banking NIM and net interest margin which is defined as net interest income divided by average interest earning assets, the nearest IFRS measure, is as follows: |
| Six months ended 30 June 2015 £m | 31 December 2014 £m | |||||||
Net interest income | 1,783 | 3,434 | ||||||
|
|
|
| |||||
Average interest earning assets | 231,932 | 225,519 | ||||||
Average customer assets | 193,407 | 188,850 | ||||||
|
|
|
| |||||
Net interest margin | 1.55 | % | 1.52 | % | ||||
Banking net interest margin | 1.86 | % | 1.82 | % | ||||
|
|
|
| |||||
| (5) | The cost-to-income ratio is defined as total operating expenses excluding impairment losses, provisions and charges divided by total operating income. |
| (6) | Non-performing loans ratio is defined as non-performing loans as a percentage of customer assets. |
| (7) | The loan-to-deposit ratio is defined as loans and advances to customers (excluding reverse repos) divided by deposits by customers (excluding repos). |
| (8) | Average ordinary shareholders’ funds divided by average total assets. |
| (9) | CET 1 capital ratio is calculated in accordance with CRD IV rules which came into force on 1 January 2014. |
| (10) | For the purpose of calculating the ratios of earnings to fixed charges, earnings consist of profit before tax and before adjustment for non-controlling interests plus fixed charges. Fixed charges consist of interest expense, including the amortisation of discounts and premiums on debt securities in issue and related capitalised expenses and including or excluding interest on retail deposit as appropriate. |
| (11) | Profit figures used in the calculation of ratios for the six months ended 30 June 2015 have been annualised by multiplying the profit figure for the six months ended 30 June 2015 by 365/181. |
| 2015 Half Yearly Financial Report | 139 |
Table of Contents
SIGNATURES
Pursuant to the requirements of the Securities Exchange Act of 1934, the registrant has duly caused this report to be signed on its behalf by the undersigned, thereunto duly authorized.
| SANTANDER UK PLC | ||||||
| Dated: 13 August 2015 | By /s/ Michelle Hill | |||||
| (Authorised Signatory) | ||||||
Table of Contents
EXHIBIT INDEX
| Exhibit | ||
| 7.1 | Computation of Ratio of Earnings to Fixed Charges for the six months ended 30 June 2015. | |