UNITED STATES
SECURITIES AND EXCHANGE COMMISSION
WASHINGTON, D.C. 20549
FORM N-CSR
CERTIFIED SHAREHOLDER REPORT OF REGISTERED
MANAGEMENT INVESTMENT COMPANIES
Investment Company Act file number 811-09373
Oppenheimer Senior Floating Rate Fund
(Exact name of registrant as specified in charter)
6803 South Tucson Way, Centennial, Colorado 80112-3924
(Address of principal executive offices) (Zip code)
Arthur S. Gabinet
OFI Global Asset Management, Inc.
Two World Financial Center, New York, New York 10281-1008
(Name and address of agent for service)
Registrant’s telephone number, including area code: (303) 768-3200
Date of fiscal year end: July 31
Date of reporting period: 7/31/2014
| Item 1. | Reports to Stockholders. |
Table of Contents
Class A Shares
AVERAGE ANNUAL TOTAL RETURNS AT 7/31/14
| | | | | | | | |
| | | Class A Shares of the Fund | | | | |
| | | Without Sales Charge | | With Sales Charge | | | | Credit Suisse Leveraged Loan Index |
1-Year | | 4.62% | | 0.96% | | | | 4.95% |
5-Year | | 8.69 | | 7.92 | | | | 7.90 |
10-Year | | 5.00 | | 4.63 | | | | 4.99 |
Performance data quoted represents past performance, which does not guarantee future results. The investment return and principal value of an investment in the Fund will fluctuate so that an investor’s shares, when redeemed, may be worth more or less than their original cost. Fund returns include changes in share price, reinvested distributions, and a 3.50% maximum applicable sales charge except where “without sales charge” is indicated. Current performance may be lower or higher than the performance quoted. Returns do not consider capital gains or income taxes on an individual’s investment. For performance data current to the most recent month-end, visit oppenheimerfunds.com or call 1.800.CALL OPP (225.5677).
2 OPPENHEIMER SENIOR FLOATING RATE FUND
Fund Performance Discussion
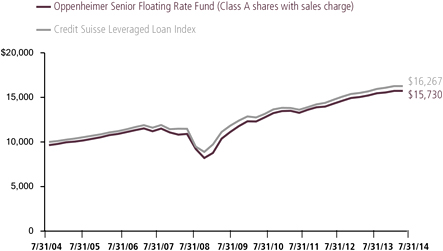
The Fund’s Class A shares (without sales charge) produced a total return of 4.62% during the 12-month reporting period ended July 31, 2014, modestly lagging its current benchmark, the Credit Suisse Leveraged Loan Index, which returned 4.95%. Bank loan yields declined modestly over the reporting period, mainly due to moderating long-term interest rates and changing supply-and-demand dynamics in 2014.
MARKET OVERVIEW
The reporting period began in the wake of market turmoil after the Federal Reserve (the “Fed”) signaled an earlier-than-expected shift away from its massive quantitative easing program. However, fixed-income markets began to stabilize by the start of the reporting period, when it became clearer that the Fed’s plans did not necessarily portend an imminent increase in short-term interest rates. In addition, economic data at the time showed a relatively mild increase in economic activity.
Although the U.S. economy strengthened in the fall, investors grew concerned when a 16-day government shutdown prompted the Fed to refrain from starting the quantitative easing tapering process. Investors responded positively to the delay, sparking a rally among longer-term bonds. However, stronger economic data over the final months of 2013—including a sharp dip in the unemployment rate to 6.7% by year end—derailed the bond market rally, and in December the Fed implemented the first in a series of gradual reductions of its bond
COMPARISON OF CHANGE IN VALUE OF $10,000 HYPOTHETICAL INVESTMENTS IN:
3 OPPENHEIMER SENIOR FLOATING RATE FUND
purchasing program. The resulting selling pressure sent yields of 10-year U.S. Treasury securities above 3% for the first time in two years.
Investor sentiment shifted again during January 2014 amid fears that political and economic instability in the world’s emerging markets might dampen the U.S. recovery. Economic activity also was constrained by harsh winter weather over much of the United States. Despite ongoing strength in U.S. labor markets, U.S. GDP contracted at a surprising 2.1% annualized rate over the first quarter of 2014. Long-term interest rates fell and bonds generally rallied.
Still, investors remained optimistic amid expectations that economic activity would bounce back in warmer weather. Indeed, the unemployment rate fell to 6.3% in April, and manufacturing activity, personal incomes, and home sales continued to grow. It later was estimated that U.S. GDP rebounded at a 4.2% annualized rate during the second quarter.
The economy continued to exhibit signs of renewed strength in June and July, with more than 200,000 jobs created each month. After dipping to 6.1% in June, the unemployment rate ticked higher to 6.2% in July, and inflation began to accelerate. The Fed implemented further reductions in its bond purchasing program, putting the quantitative easing program on track for elimination in the fall.
Despite accelerating economic growth, yields of 10-year U.S. Treasury securities remained low over the first seven months of 2014, in part due to robust demand for a relatively limited supply of newly issued securities. Short-term bond yields remained steady, as the Fed reiterated that short-term rates would remain at current levels at least through year-end. In addition to interest-rate trends, the leveraged loans market was influenced by capital flows. Over much of the reporting period, the market attracted assets from investors seeking more competitive yields than were available from most developed-market sovereign bonds, including German bunds and U.S. Treasury securities. Later in the reporting period, the leveraged loan market experienced net outflows when investors sought opportunities in other areas.
FUND REVIEW
In this environment, the Fund produced higher-than-average results in most of the industry groups represented in the Credit Suisse Leveraged Loan Index. However, shortfalls in the consumer products and gaming sectors caused the Fund to lag its benchmark for the reporting period overall. Producers of consumer products generally sat out the economic recovery as wage growth remained anemic for most workers. Within gaming, the Fund’s exposure to a troubled casino and hotel company detracted from performance.
Our note selection strategy achieved particularly strong results in the media, utilities and forest products sectors. Within
4 OPPENHEIMER SENIOR FLOATING RATE FUND
media, one of the Fund’s broadcasting holdings had converted some of its debt to equity securities when emerging from bankruptcy, and the security advanced along with the company’s prospects. Performance in the utilities sector was bolstered by a five-month opportunistic investment in a company undergoing bankruptcy. While held, the market value of the loan increased and we sold our position. The Fund benefited from its exposure to forest products, as it held higher-yielding names in the sector.
STRATEGY & OUTLOOK
Despite the anticipated end of the Fed’s quantitative easing program this fall, we currently expect the U.S. economic recovery to gain momentum over the remainder of

2014. Stronger economic growth and renewed inflationary pressures could produce higher long-term interest rates. In addition, many analysts expect the Fed to begin laying the groundwork for short-term rate hikes in 2015. Rising interest rates typically hurt prices of fixed-rate bonds, but historically have been beneficial to floating-rate loans.
Therefore, we have maintained a constructive investment approach, in which we conduct extensive research into company and market fundamentals to identify attractive relative values among leveraged loans. We recently have reduced exposure to loans that reached less compelling valuations, enabling us to focus more intently on areas that we regard as better opportunities.

5 OPPENHEIMER SENIOR FLOATING RATE FUND
Top Holdings and Allocations
| | |
TOP TEN CORPORATE LOAN INDUSTRIES |
Media | | 11.0% |
Commercial Services & Supplies | | 9.8 |
Health Care Equipment & Supplies | | 6.8 |
Hotels, Restaurants & Leisure | | 6.4 |
Energy Equipment & Services | | 4.3 |
Chemicals | | 4.2 |
Health Care Providers & Services | | 3.6 |
Diversified Telecommunication Services | | 3.2 |
Diversified Consumer Services | | 3.0 |
Industrial Conglomerates | | 2.7 |
Portfolio holdings and allocations are subject to change. Percentages are as of July 31, 2014, and are based on net assets.
| | |
CREDIT RATING BREAKDOWN | | NRSRO
ONLY
TOTAL |
AAA | | 3.5% |
BBB | | 1.0 |
BB | | 25.1 |
B | | 62.5 |
CCC | | 5.7 |
D | | 0.1 |
Unrated | | 2.1 |
Total | | 100.0% |
The percentages above are based on the market value of the Fund’s securities as of July 31, 2014, and are subject to change. Except for securities labeled “Unrated” and except for certain securities issued or guaranteed by a foreign sovereign, all securities have been rated by at least one Nationally Recognized Statistical Rating Organization (“NRSRO”), such as Standard & Poor’s (“S&P”). For securities rated only by an NRSRO other than S&P, OppenheimerFunds, Inc. (the “Sub-Adviser”) converts that rating to the equivalent S&P rating. If two or more NRSROs have assigned a rating to a security, the highest S&P equivalent rating is used. Unrated securities issued or guaranteed by a foreign sovereign are assigned a credit rating equal to the highest NRSRO rating assigned to that foreign sovereign. For securities not rated by an NRSRO, the Sub-Adviser uses its own credit analysis to assign ratings in categories similar to those of S&P. The use of similar categories is not an indication that the Sub-Adviser’s credit analysis process is consistent or comparable with any NRSRO’s process were that NRSRO to rate the same security. Fund assets invested in Oppenheimer Institutional Money Market Fund are assigned that fund’s S&P rating, which is currently AAA. For the purposes of this table, “investment-grade” securities are securities rated within the NRSROs’ four highest rating categories (AAA, AA, A and BBB). Unrated securities do not necessarily indicate low credit quality, and may or may not be the equivalent of investment-grade. Please consult the Fund’s prospectus and Statement of Additional Information for further information.
6 OPPENHEIMER SENIOR FLOATING RATE FUND
Share Class Performance
AVERAGE ANNUAL TOTAL RETURNS WITHOUT SALES CHARGE AS OF 7/31/14
| | | | | | | | | | | | | | | | | | |
| | | Inception Date | | | 1-Year | | | 5-Year | | | 10-Year | | | |
Class A (OOSAX) | | | 9/8/99 | | | | 4.62% | | | | 8.69% | | | | 5.00% | | | |
Class B (OOSBX) | | | 9/8/99 | | | | 3.93% | | | | 8.02% | | | | 4.65% | | | |
Class C (OOSCX) | | | 9/8/99 | | | | 3.77% | | | | 8.10% | | | | 4.46% | | | |
Class I (OOSIX) | | | 10/26/12 | | | | 4.72% | | | | 5.75% | * | | | N/A | | | |
Class R (OOSNX) | | | 10/26/12 | | | | 4.22% | | | | 5.13% | * | | | N/A | | | |
Class Y (OOSYX) | | | 11/28/05 | | | | 4.88% | | | | 9.00% | | | | 5.14% | * | | |
AVERAGE ANNUAL TOTAL RETURNS WITH SALES CHARGE AS OF 7/31/14
| | | | | | | | | | | | | | | | | | |
| | | Inception Date | | | 1-Year | | | 5-Year | | | 10-Year | | | |
Class A (OOSAX) | | | 9/8/99 | | | | 0.96% | | | | 7.92% | | | | 4.63% | | | |
Class B (OOSBX) | | | 9/8/99 | | | | 0.93% | | | | 7.88% | | | | 4.65% | | | |
Class C (OOSCX) | | | 9/8/99 | | | | 2.77% | | | | 8.10% | | | | 4.46% | | | |
Class I (OOSIX) | | | 10/26/12 | | | | 4.72% | | | | 5.75% | * | | | N/A | | | |
Class R (OOSNX) | | | 10/26/12 | | | | 3.22% | | | | 5.13% | * | | | N/A | | | |
Class Y (OOSYX) | | | 11/28/05 | | | | 4.88% | | | | 9.00% | | | | 5.14% | * | | |
*Shows performance since inception.
STANDARDIZED YIELDS
| | | | |
For the 30 Days Ended 7/31/14 | | | | |
Class A | | 3.88% | | |
Class B | | 3.50 | | |
Class C | | 3.26 | | |
Class I | | 4.33 | | |
Class R | | 3.76 | | |
Class Y | | 4.26 | | |
Performance data quoted represents past performance, which does not guarantee future results. The investment return and principal value of an investment in the Fund will fluctuate so that an investor’s shares, when redeemed, may be worth more or less than their original cost. Current performance may be lower or higher than the performance quoted. Returns do not consider capital gains or income taxes on an individual’s investment. For performance data current to the most recent month-end, visit oppenheimerfunds.com or call 1.800.CALL OPP (225.5677). Fund returns include changes in share price, reinvested distributions, and the applicable sales charge: for Class A shares, the current maximum initial sales charge of 3.50%; for Class B shares, the contingent deferred sales charge (“CDSC”) of 3% (1-year) and 1% (5-year); and for Class C shares, the 1% CDSC charge for the 1-year period. Prior to 7/1/14, Class R shares were named Class N shares. Beginning 7/1/14, new purchases of Class R shares will no longer be subject to a CDSC upon redemption (any CDSC will remain in effect for purchases prior to 7/1/14.) There is no sales charge for Class I and Y shares.
7 OPPENHEIMER SENIOR FLOATING RATE FUND
Standardized yield is based on net investment income for the 30-day period ended 7/31/14 and the maximum offering price at the end of the period (including the maximum sales charge) for Class A shares and the net asset value for Class B, Class C, Class I, Class R and Class Y shares. Each result is compounded semiannually and then annualized. Falling share prices will tend to artificially raise yields.
The Fund’s performance is compared to the performance of the Credit Suisse Leveraged Loan Index, a composite index of U.S. dollar denominated senior loan returns representing an unleveraged investment in senior loans that is broadly based across the spectrum of senior floating rate loans and includes reinvestment of income (to represent real assets). The Index is unmanaged and cannot be purchased directly by investors. While index comparisons may be useful to provide a benchmark for the Fund’s performance, it must be noted that the Fund’s investments are not limited to the investments comprising the Index. Index performance includes reinvestment of income, but does not reflect transaction costs, fees, expenses or taxes. Index performance is shown for illustrative purposes only as a benchmark for the Fund’s performance, and does not predict or depict performance of the Fund. The Fund’s performance reflects the effects of the Fund’s business and operating expenses.
The Fund’s investment strategy and focus can change over time. The mention of specific fund holdings does not constitute a recommendation by OppenheimerFunds, Inc. or its affiliates.
Before investing in any of the Oppenheimer funds, investors should carefully consider a fund’s investment objectives, risks, charges and expenses. Fund prospectuses and summary prospectuses contain this and other information about the funds, and may be obtained by asking your financial advisor, visiting oppenheimerfunds.com, or calling 1.800.CALL OPP (225.5677). Read prospectuses and summary prospectuses carefully before investing.
Shares of Oppenheimer funds are not deposits or obligations of any bank, are not guaranteed by any bank, are not insured by the FDIC or any other agency, and involve investment risks, including the possible loss of the principal amount invested.
8 OPPENHEIMER SENIOR FLOATING RATE FUND
Fund Expenses
Fund Expenses. As a shareholder of the Fund, you incur two types of costs: (1) transaction costs, which may include sales charges (loads) on purchase payments, contingent deferred sales charges on redemptions; and (2) ongoing costs, including management fees; distribution and service fees; and other Fund expenses. These examples are intended to help you understand your ongoing costs (in dollars) of investing in the Fund and to compare these costs with the ongoing costs of investing in other mutual funds.
The examples are based on an investment of $1,000.00 invested at the beginning of the period and held for the entire 6-month period ended July 31, 2014.
Actual Expenses. The first section of the table provides information about actual account values and actual expenses. You may use the information in this section for the class of shares you hold, together with the amount you invested, to estimate the expense that you paid over the period. Simply divide your account value by $1,000.00 (for example, an $8,600.00 account value divided by $1,000.00 = 8.60), then multiply the result by the number in the first section under the heading entitled “Expenses Paid During Period” to estimate the expenses you paid on your account during this period.
Hypothetical Example for Comparison Purposes. The second section of the table provides information about hypothetical account values and hypothetical expenses based on the Fund’s actual expense ratio for each class of shares, and an assumed rate of return of 5% per year for each class before expenses, which is not the actual return. The hypothetical account values and expenses may not be used to estimate the actual ending account balance or expenses you paid for the period. You may use this information to compare the ongoing costs of investing in the Fund and other funds. To do so, compare this 5% hypothetical example for the class of shares you hold with the 5% hypothetical examples that appear in the shareholder reports of the other funds.
Please note that the expenses shown in the table are meant to highlight your ongoing costs only and do not reflect any transactional costs, such as front-end or contingent deferred sales charges (loads). Therefore, the “hypothetical” section of the table is useful in comparing ongoing costs only, and will not help you determine the relative total costs of owning different funds. In addition, if these transactional costs were included, your costs would have been higher.
9 OPPENHEIMER SENIOR FLOATING RATE FUND
| | | | | | | | | | | | | | | | | | |
| Actual | | Beginning Account Value February 1, 2014 | | Ending Account Value July 31, 2014 | | Expenses Paid During
6 Months Ended
July 31, 2014 |
Class A | | $ | 1,000.00 | | | | | $ | 1,017.10 | | | | | $ | 5.21 | | | |
Class B | | | 1,000.00 | | | | | | 1,014.60 | | | | | | 7.72 | | | |
Class C | | | 1,000.00 | | | | | | 1,012.20 | | | | | | 8.92 | | | |
Class I | | | 1,000.00 | | | | | | 1,017.40 | | | | | | 3.71 | | | |
Class R | | | 1,000.00 | | | | | | 1,015.80 | | | | | | 6.52 | | | |
Class Y | | | 1,000.00 | | | | | | 1,018.30 | | | | | | 4.01 | | | |
| | | | | | |
| Hypothetical | | | | | | | | | | | | | | | | | | |
(5% return before expenses) | | | | | | | | | | | | | | | | | | |
Class A | | | 1,000.00 | | | | | | 1,019.64 | | | | | | 5.22 | | | |
Class B | | | 1,000.00 | | | | | | 1,017.16 | | | | | | 7.73 | | | |
Class C | | | 1,000.00 | | | | | | 1,015.97 | | | | | | 8.94 | | | |
Class I | | | 1,000.00 | | | | | | 1,021.12 | | | | | | 3.72 | | | |
Class R | | | 1,000.00 | | | | | | 1,018.35 | | | | | | 6.53 | | | |
Class Y | | | 1,000.00 | | | | | | 1,020.83 | | | | | | 4.02 | | | |
Expenses are equal to the Fund’s annualized expense ratio for that class, multiplied by the average account value over the period, multiplied by 181/365 (to reflect the one-half year period). Those annualized expense ratios, excluding indirect expenses from affiliated funds, based on the 6-month period ended July 31, 2014 are as follows:
| | | | | | |
| Class | | Expense Ratios | | | |
Class A | | | 1.04 | % | | |
Class B | | | 1.54 | | | |
Class C | | | 1.78 | | | |
Class I | | | 0.74 | | | |
Class R | | | 1.30 | | | |
Class Y | | | 0.80 | | | |
The expense ratios reflect voluntary and/or contractual waivers and/or reimbursements of expenses by the Fund’s Manager. Some of these undertakings may be modified or terminated at any time, as indicated in the Fund’s prospectus. The “Financial Highlights” tables in the Fund’s financial statements, included in this report, also show the gross expense ratios, without such waivers or reimbursements and reduction to custodian expenses, if applicable.
10 OPPENHEIMER SENIOR FLOATING RATE FUND
| | |
| |
| STATEMENT OF INVESTMENTS July 31, 2014 | | |
| | | | | | | | |
| | | Principal
Amount | | | Value | |
| |
Corporate Loans—98.6% | | | | | | | | |
| |
Consumer Discretionary—31.2% | | | | | | | | |
| |
Auto Components—2.4% | | | | | | | | |
| |
Affinia Group, Inc., Sr. Sec. Credit Facilities 1st Lien Term Loan, Tranche B2, 4.75%, 4/25/201 | | $ | 40,036,132 | | | $ | 40,236,312 | |
| |
Breed Technologies, Inc., Sr. Sec. Credit Facilities 1st Lien Term Loan, Tranche B, 4.75%, 5/10/181 | | | 41,293,662 | | | | 41,474,322 | |
| |
Cap-Con Automotive Technologies Ltd., Sr. Sec. Credit Facilities 1st Lien Term Loan, Tranche B, 6.00%, 11/15/181 | | | 29,232,344 | | | | 29,341,965 | |
| |
Cooper Standard, Sr. Sec. Credit Facilities 1st Lien Term Loan, Tranche B, 4.00%, 3/26/211 | | | 32,345,000 | | | | 32,304,569 | |
| |
FleetPride, Inc., Sr. Sec. Credit Facilities 1st Lien Term Loan, 5.25%, 11/19/191 | | | 33,556,586 | | | | 33,315,415 | |
| |
Goodyear Tire & Rubber Co. (The), Sr. Sec. Credit Facilities 2nd Lien Term Loan, 4.75%, 4/30/191 | | | 99,715,000 | | | | 100,587,506 | |
| |
Metaldyne LLC, Sr. Sec. Credit Facilities 1st Lien Term Loan, Tranche B, 4.25%, 12/18/181 | | | 50,782,976 | | | | 51,058,067 | |
| |
Remy International, Inc., Sr. Sec. Credit Facilities 1st Lien Term Loan, Tranche B, 4.25%, 3/5/201 | | | 31,509,471 | | | | 31,548,858 | |
| |
TI Group Automotive Systems LLC, Sr. Sec. Credit Facilities 1st Lien Term Loan, Tranche B, 4.25%, 7/1/211 | | | 59,210,000 | | | | 59,339,552 | |
| |
Tower Automotive Holdings, Sr. Sec. Credit Facilities 1st Lien Term Loan, Tranche B, 4.00%, 4/23/201 | | | 51,406,961 | | | | 51,246,314 | |
| |
Transtar Holding Co., Sr. Sec. Credit Facilities 1st Lien Term Loan, 5.75%, 10/9/181 | | | 33,550,305 | | | | 33,676,119 | |
| | | | | | | | |
| | | | | | | 504,128,999 | |
| | | | | | | | |
| |
Automobiles—0.7% | | | | | | | | |
| |
Chrysler LLC, Sr. Sec. Credit Facilities Term Loan, Tranche B1, 5.333%, 8/3/491,2 | | | 52,763,842 | | | | 158,292 | |
| |
Federal-Mogul Holdings Corp., Sr. Sec. Credit Facilities 1st Lien Term Loan: | | | | | | | | |
Tranche B, 4.00%, 4/3/181 | | | 41,400,000 | | | | 41,392,589 | |
Tranche C, 4.75%, 4/3/211 | | | 93,000,000 | | | | 93,069,750 | |
| | | | | | | | |
| | | | | | | 134,620,631 | |
| | | | | | | | |
| |
Distributors—1.4% | | | | | | | | |
| |
99 Cents Only Stores, Sr. Sec. Credit Facilities 1st Lien Term Loan, Tranche B2, 4.50%, 1/11/191 | | | 50,375,866 | | | | 50,701,193 | |
| |
BJ’s Wholesale Club, Inc., Sr. Sec. Credit Facilities 1st Lien Term Loan, Tranche B, 4.50%, 9/26/191 | | | 66,232,519 | | | | 66,196,290 | |
| |
BJ’s Wholesale Club, Inc., Sr. Sec. Credit Facilities 2nd Lien Term Loan, 8.50%, 3/26/201 | | | 38,534,030 | | | | 39,148,185 | |
| |
Capital Automotive LP, Sr. Sec. Credit Facilities 1st Lien Term Loan, 4.00%, 4/10/191 | | | 16,189,203 | | | | 16,258,590 | |
| |
Capital Automotive LP, Sr. Sec. Credit Facilities 2nd Lien Term Loan, 6.00%, 4/30/201 | | | 31,020,835 | | | | 31,809,291 | |
| |
Container Store, Inc. (The), Sr. Sec. Credit Facilities 1st Lien Term Loan, Tranche B, 4.25%, 4/6/191 | | | 28,783,563 | | | | 28,702,250 | |
| |
Leslie’s Poolmart, Inc., Sr. Sec. Credit Facilities 1st Lien Term Loan, Tranche B, 4.25%, 10/16/191 | | | 49,181,338 | | | | 49,196,732 | |
| | | | | | | | |
| | | | | | | 282,012,531 | |
11 OPPENHEIMER SENIOR FLOATING RATE FUND
|
|
| STATEMENT OF INVESTMENTS Continued |
| | | | | | | | |
| | | Principal
Amount | | | Value | |
| |
Diversified Consumer Services—3.0% | | | | | | | | |
| |
4L Technologies, Inc., Sr. Sec. Credit Facilities 1st Lien Term Loan, Tranche B, 5.50%, 5/8/201 | | $ | 57,320,000 | | | $ | 57,158,816 | |
| |
Affinion Group, Inc., Sr. Sec. Credit Facilities 1st Lien Term Loan, Tranche B, 6.75%, 4/30/181 | | | 57,984,487 | | | | 57,591,874 | |
| |
Affinion Group, Inc., Sr. Sec. Credit Facilities 2nd Lien Term Loan, 8.50%, 10/31/181 | | | 31,300,668 | | | | 30,909,409 | |
| |
Interactive Data Corp., Sr. Sec. Credit Facilities 1st Lien Term Loan, Tranche B, 4.75%, 4/23/211 | | | 92,690,000 | | | | 93,182,462 | |
| |
IQOR US, Inc., Sr. Sec. Credit Facilities 1st Lien Term Loan, Tranche B, 6.00%, 4/1/211 | | | 56,584,762 | | | | 54,462,833 | |
| |
IQOR US, Inc., Sr. Sec. Credit Facilities 2nd Lien Term Loan, 9.75%, 4/1/221 | | | 15,770,000 | | | | 15,020,925 | |
| |
Knowledge Universe Education LLC, Sr. Sec. Credit Facilities 1st Lien Term Loan, Tranche B, 5.25%, 3/12/211 | | | 24,937,500 | | | | 25,124,531 | |
| |
Koosharem LLC, Sr. Sec. Credit Facilities 1st Lien Exit Term Loan, 7.50%, 5/15/201 | | | 27,845,000 | | | | 28,077,033 | |
| |
Laureate Education, Inc., Sr. Sec. Credit Facilities 1st Lien Term Loan, 5.00%, 6/15/181 | | | 110,630,891 | | | | 107,588,541 | |
| |
Nord Anglia Education Finance, Sr. Sec. Credit Facilities 1st Lien Term Loan, Tranche B, 4.50%, 3/31/211 | | | 46,205,000 | | | | 46,291,635 | |
| |
Sedgwick, Inc., Sr. Sec. Credit Facilities 2nd Lien Term Loan, 6.75%, 2/28/221 | | | 45,023,869 | | | | 45,035,125 | |
| |
ServiceMaster Co. LLC (The), Sr. Sec. Credit Facilities 1st Lien Term Loan, Tranche B, 4.25%, 6/16/211 | | | 45,000,000 | | | | 44,781,750 | |
| |
TransFirst Holdings, Inc., Sr. Sec. Credit Facilities 1st Lien Term Loan, 4.00%, 12/27/171 | | | 12,741,281 | | | | 12,745,269 | |
| |
TransFirst Holdings, Inc., Sr. Sec. Credit Facilities 2nd Lien Term Loan, 7.50%, 6/27/181 | | | 12,020,000 | | | | 12,120,163 | |
| | | | | | | | |
| | | | | | | 630,090,366 | |
| | | | | | | | |
| |
Hotels, Restaurants & Leisure—6.4% | | | | | | | | |
| |
Allflex Holdings III, Inc., Sr. Sec. Credit Facilities 1st Lien Term Loan, Tranche B, 4.25%, 7/17/201 | | | 38,211,250 | | | | 38,230,356 | |
| |
Amaya BV, Sr. Sec. Credit Facilities 2nd Lien Term Loan, 5.00%, 7/29/211 | | | 106,040,000 | | | | 105,095,608 | |
| |
Amaya BV, Sr. Sec. Credit Facilities 2nd Lien Term Loan, 8.00%, 7/29/221 | | | 46,215,000 | | | | 46,811,959 | |
| |
American Casino & Entertainment Properties, Sr. Sec. Credit Facilities 1st Lien Term Loan, Tranche B, 4.50%, 7/3/191 | | | 19,800,000 | | | | 19,899,000 | |
| |
American Seafoods Group LLC, Sr. Sec. Credit Facilities 1st Lien Term Loan, 4.50%-5.50%, 3/18/181 | | | 16,469,457 | | | | 16,236,134 | |
| |
AMF Bowling Centers, Inc., Sr. Sec. Credit Facilities 1st Lien Exit Term Loan, 8.75%, 6/29/181 | | | 38,494,104 | | | | 39,263,986 | |
| |
ARG IH Corp., Sr. Sec. Credit Facilities 1st Lien Term Loan, 5.00%-6.25%, 11/15/201 | | | 21,850,200 | | | | 21,977,477 | |
| |
Caesars Entertainment Operating Co., Inc., Extended Sr. Sec. Credit Facilities 1st Lien Term Loan, Tranche B5, 4.448%, 1/28/181 | | | 24,230,949 | | | | 22,379,559 | |
| |
Caesars Entertainment Operating Co., Inc., Sr. Sec. Credit Facilities 1st Lien Term Loan: | | | | | | | | |
Tranche B4, 9.50%, 10/31/161 | | | 18,391,854 | | | | 18,434,008 | |
Tranche B5B, 6.50%, 1/28/181 | | | 242,773 | | | | 224,223 | |
Tranche B6, 5.448%, 1/28/181 | | | 55,714,572 | | | | 52,023,482 | |
12 OPPENHEIMER SENIOR FLOATING RATE FUND
| | | | | | | | |
| | | Principal
Amount | | | Value | |
| |
Hotels, Restaurants & Leisure (Continued) | | | | | | | | |
| |
Caesars Entertainment Operating Co., Inc., Sr. Sec. Credit Facilities 1st Lien Term Loan: (Continued) | | | | | | | | |
Tranche B7, 9.75%, 3/1/171 | | $ | 40,120,000 | | | $ | 39,450,156 | |
| |
Caesars Entertainment Resort Properties LLC, Sr. Sec. Credit Facilities 1st Lien Term Loan, Tranche B, 7.00%, 10/11/201 | | | 156,022,384 | | | | 156,631,807 | |
| |
Caesars Growth Properties Holdings LLC/Caesars Growth Properties Finance, Inc., Sr. Sec. Credit Facilities 1st Lien Term Loan, 6.25%, 5/10/211 | | | 88,491,000 | | | | 88,297,470 | |
| |
CCM Merger, Inc./MotorCity Casino, Sr. Sec. Credit Facilities 1st Lien Term Loan, 5.00%, 3/1/171 | | | 45,740,925 | | | | 45,798,101 | |
| |
CEC Entertainment, Inc., Sr. Sec. Credit Facilities Term Loan, Tranche B, 4.25%, 2/14/211 | | | 46,214,175 | | | | 45,925,336 | |
| |
Corner Investment Co. LLC, Sr. Sec. Credit Facilities 1st Lien Term Loan, 11.00%, 11/2/191 | | | 13,395,000 | | | | 13,763,363 | |
| |
Dave & Buster’s, Inc., Sr. Sec. Credit Facilities 1st Lien Term Loan, Tranche B, 4.50%, 7/23/201 | | | 42,425,000 | | | | 42,550,960 | |
| |
Del Monte Foods Co., Inc., Sr. Sec. Credit Facilities 1st Lien Term Loan, 4.25%-5.50%, 2/18/211 | | | 44,237,700 | | | | 43,968,115 | |
| |
Del Monte Pacific Ltd., Sr. Sec. Credit Facilities 2nd Lien Term Loan, 8.25%, 8/18/211 | | | 8,565,000 | | | | 8,375,859 | |
| |
Equinox Holdings, Inc., Sr. Sec. Credit Facilities 1st Lien Term Loan, Tranche B, 4.25%, 1/31/201 | | | 26,456,608 | | | | 26,555,820 | |
| |
Focus Brands, Inc., Sr. Sec. Credit Facilities 1st Lien Term Loan, Tranche B, 4.25%, 2/21/181 | | | 27,779,748 | | | | 27,826,056 | |
| |
Golden Nugget, Inc., Sr. Sec. Credit Facilities 1st Lien Term Loan, Tranche B, 5.50%, 11/21/191 | | | 25,816,186 | | | | 26,380,915 | |
| |
Golden Nugget, Inc., Sr. Sec. Credit Facilities 1st Lien Term Loan, Delayed Draw, Tranche B, 5.50%, 11/21/191 | | | 9,297,174 | | | | 9,500,550 | |
| |
Great Wolf Resorts, Inc., Sr. Sec. Credit Facilities 1st Lien Term Loan, 4.25%, 8/6/201 | | | 29,700,000 | | | | 29,764,984 | |
| |
Jacobs Entertainment, Inc., Sr. Sec. Credit Facilities 1st Lien Term Loan, 5.25%, 10/29/181 | | | 16,955,512 | | | | 17,040,290 | |
| |
La Quinta Intermediate Holdings LLC, Sr. Sec. Credit Facilities 1st Lien Term Loan, Tranche B, 4.00%, 4/14/211 | | | 36,552,381 | | | | 36,632,358 | |
| |
Landry’s, Inc., Sr. Sec. Credit Facilities 1st Lien Term Loan, Tranche B, 4.00%, 4/24/181 | | | 48,870,617 | | | | 49,041,665 | |
| |
Oceania Cruises, Inc., Sr. Sec. Credit Facilities 1st Lien Term Loan, Tranche B, 5.25%, 7/2/201 | | | 24,705,850 | | | | 24,922,026 | |
| |
Peninsula Gaming LLC, Sr. Sec. Credit Facilities 1st Lien Term Loan, Tranche B, 4.25%, 11/20/171 | | | 33,636,942 | | | | 33,715,585 | |
| |
Peppermill Casinos, Inc., Sr. Sec. Credit Facilities 1st Lien Term Loan, 7.25%, 11/9/181 | | | 20,975,841 | | | | 21,474,017 | |
| |
Pinnacle Operating Corp., Sr. Sec. Credit Facilities 1st Lien Term Loan, Tranche B, 4.75%, 11/15/181 | | | 27,978,643 | | | | 27,978,643 | |
| |
Revel Entertainment, Inc., Sr. Sec. Credit Facilities 2nd Lien Exit Term Loan, 14.50%, 5/20/181,2,3 | | | 36,421,136 | | | | 11,836,869 | |
| |
Town Sports International LLC, Sr. Sec. Credit Facilities 1st Lien Term Loan, Tranche B, 4.50%, 11/2/201 | | | 34,063,825 | | | | 30,998,081 | |
| |
US Foods, Inc., Sr. Sec. Credit Facilities 1st Lien Term Loan, Tranche B, 4.50%, 3/31/191 | | | 89,377,433 | | | | 89,433,294 | |
| | | | | | | | |
| | | | | | | 1,328,438,112 | |
13 OPPENHEIMER SENIOR FLOATING RATE FUND
|
|
| STATEMENT OF INVESTMENTS Continued |
| | | | | | | | |
| | | Principal
Amount | | | Value | |
| |
Household Durables—1.8% | | | | | | | | |
| |
Britax US Holdings, Inc., Sr. Sec. Credit Facilities 1st Lien Term Loan, Tranche B, 4.50%, 10/15/201 | | $ | 26,554,337 | | | $ | 25,110,445 | |
| |
KIK Custom Products, Sr. Sec. Credit Facilities 1st Lien Term Loan, 5.50%, 4/29/191 | | | 61,809,725 | | | | 61,912,762 | |
| |
KIK Custom Products, Sr. Sec. Credit Facilities 2nd Lien Term Loan, 9.50%, 10/29/191 | | | 23,595,000 | | | | 23,939,086 | |
| |
Party City Holdings, Inc., Sr. Sec. Credit Facilities 1st Lien Term Loan, Tranche B, 4.00%, 7/27/191 | | | 59,643,136 | | | | 59,296,968 | |
| |
Renfro Corp., Sr. Sec. Credit Facilities 1st Lien Term Loan, Tranche B, 5.75%, 1/30/191 | | | 15,020,059 | | | | 15,062,311 | |
| |
Revlon Consumer Products Corp., Sr. Sec. Credit Facilities 1st Lien Term Loan, 4.00%, 10/8/191 | | | 59,942,428 | | | | 60,101,635 | |
| |
SRAM Corp., Sr. Sec. Credit Facilities 1st Lien Term Loan, Tranche B, 4.00%, 4/10/201 | | | 65,830,360 | | | | 65,405,227 | |
| |
Sun Products Corp. (The), Sr. Sec. Credit Facilities 1st Lien Term Loan, Tranche B, 5.50%, 3/23/201 | | | 42,187,153 | | | | 40,921,539 | |
| |
Wilton Brands, Inc., Sr. Sec. Credit Facilities 1st Lien Term Loan, Tranche B, 7.50%, 8/30/181 | | | 30,289,961 | | | | 29,078,363 | |
| | | | | | | | |
| | | | | | | 380,828,336 | |
| | | | | | | | |
| |
Internet & Catalog Retail—0.2% | | | | | | | | |
| |
CWGS Group LLC, Sr. Sec. Credit Facilities 1st Lien Term Loan, 5.75%-6.75%, 2/20/201 | | | 36,695,179 | | | | 37,062,131 | |
| | | | | | | | |
| |
Leisure Products—1.3% | | | | | | | | |
| |
Boyd Gaming Corp., Sr. Sec. Credit Facilities 1st Lien Term Loan, Tranche B, 4.00%, 8/14/201 | | | 48,388,889 | | | | 48,496,748 | |
| |
Four Seasons Holdings, Inc., Sr. Sec. Credit Facilities 1st Lien Term Loan, 3.50%, 6/29/201 | | | 17,865,000 | | | | 17,800,793 | |
| |
Four Seasons Holdings, Inc., Sr. Sec. Credit Facilities 2nd Lien Term Loan, 6.25%, 12/28/201 | | | 10,000,000 | | | | 10,112,500 | |
| |
Hilton Worldwide, Inc., Sr. Sec. Credit Facilities 1st Lien Term Loan, 3.50%-3.75%, 10/26/201 | | | 47,615,921 | | | | 47,454,742 | |
| |
Intrawest Corp., Sr. Sec. Credit Facilities 1st Lien Term Loan, Tranche B, 5.50%, 12/9/201 | | | 33,282,750 | | | | 33,948,405 | |
| |
Pinnacle Entertainment, Inc., Sr. Sec. Credit Facilities 1st Lien Term Loan, Tranche B2, 3.75%, 8/13/201 | | | 24,750,771 | | | | 24,830,592 | |
| |
Playa Resorts Holding BV, Sr. Sec. Credit Facilities 1st Lien Term Loan, Tranche B, 4.00%, 8/9/191 | | | 21,839,975 | | | | 21,860,461 | |
| |
Station Casinos LLC, Sr. Sec. Credit Facilities 1st Lien Term Loan, Tranche B, 4.25%, 3/2/201 | | | 69,275,426 | | | | 69,362,020 | |
| |
Stockbridge/SBE Holdings LLC, Sr. Sec. Credit Facilities 1st Lien Term Loan, Tranche B, 13.00%, 5/2/171 | | | 4,035,000 | | | | 4,519,200 | |
| | | | | | | | |
| | | | | | | 278,385,461 | |
| | | | | | | | |
| |
Media—11.0% | | | | | | | | |
| |
Alpha Media Group, Inc., Sr. Sec. Credit Facilities Term Loan, Tranche B, 3.05%, 7/15/161,2,3,4 | | | 27,992,767 | | | | 2,799 | |
| |
Altice Financing SA, Sr. Sec. Credit Facilities 1st Lien Term Loan, Delayed Draw, 5.50%, 7/2/191 | | | 62,836,673 | | | | 64,387,985 | |
14 OPPENHEIMER SENIOR FLOATING RATE FUND
| | | | | | | | |
| | | Principal
Amount | | | Value | |
| |
Media (Continued) | | | | | | | | |
| |
Catalina Marketing, Sr. Sec. Credit Facilities 1st Lien Term Loan, 4.50%, 4/1/211 | | $ | 87,242,959 | | | $ | 87,461,066 | |
| |
Catalina Marketing, Sr. Sec. Credit Facilities 2nd Lien Term Loan, 7.75%, 4/11/221 | | | 27,945,000 | | | | 27,875,138 | |
| |
Cinram International, Inc., Sr. Sec. Credit Facilities 2nd Lien Term Loan, 0.432%, 8/3/491,2,3 | | | 577,191 | | | | 2,889 | |
| |
Clear Channel Communications, Inc., Extended Sr. Sec. Credit Facilities 1st Lien Term Loan, Tranche D, 6.90%, 1/30/191 | | | 102,361,554 | | | | 100,751,509 | |
| |
Clear Channel Communications, Inc., Sr. Sec. Credit Facilities 1st Lien Term Loan: | | | | | | | | |
Tranche B, 3.80%, 1/29/161 | | | 55,711,458 | | | | 55,300,474 | |
Tranche E, 7.65%, 7/30/191 | | | 50,751,807 | | | | 50,779,010 | |
| |
Cumulus Media Holdings, Inc., Sr. Sec. Credit Facilities 1st Lien Term Loan, Tranche B, 4.25%, 12/18/201 | | | 32,365,643 | | | | 32,472,579 | |
| |
Delta 2 LUX Sarl, Sr. Sec. Credit Facilities 1st Lien Term Loan, Tranche B, 4.50%, 4/30/191 | | | 81,155,324 | | | | 81,358,212 | |
| |
Deluxe Entertainment Services, Sr. Sec. Credit Facilities 1st Lien Term Loan, Tranche B, 6.50%, 2/26/201 | | | 36,326,531 | | | | 36,371,939 | |
| |
Emerald Expositions Holding, Inc., Sr. Sec. Credit Facilities 1st Lien Term Loan, Tranche B, 4.75%, 6/17/201 | | | 9,250,000 | | | | 9,250,000 | |
| |
Extreme Reach, Inc., Sr. Sec. Credit Facilities 1st Lien Term Loan, Tranche B, 6.75%, 1/24/201 | | | 27,765,413 | | | | 28,147,187 | |
| |
Extreme Reach, Inc., Sr. Sec. Credit Facilities 2nd Lien Term Loan, 10.50%, 1/22/211 | | | 13,915,000 | | | | 14,158,513 | |
| |
Getty Images, Inc., Sr. Sec. Credit Facilities 1st Lien Term Loan, Tranche B, 4.75%, 10/18/191 | | | 79,936,325 | | | | 77,293,950 | |
| |
Gray Television, Inc., Sr. Sec. Credit Facilities 1st Lien Term Loan, 3.75%, 6/10/211 | | | 36,840,000 | | | | 36,903,328 | |
| |
Harland Clarke Holdings Corp., Sr. Sec. Credit Facilities 1st Lien Term Loan, Tranche B4, 6.00%, 8/4/191 | | | 47,240,323 | | | | 48,114,269 | |
| |
Hoyts Cinemas Group, Sr. Sec. Credit Facilities 2nd Lien Term Loan, 8.25%, 11/30/201 | | | 9,250,000 | | | | 9,481,250 | |
| |
IMG Worldwide, Inc., Sr. Sec. Credit Facilities 1st Lien Term Loan, Tranche B, 5.25%, 5/6/211 | | | 92,820,000 | | | | 92,394,606 | |
| |
IMG Worldwide, Inc., Sr. Sec. Credit Facilities 2nd Lien Term Loan, 8.25%, 5/6/221 | | | 25,520,000 | | | | 25,392,400 | |
| |
Intelsat Jackson Holdings SA, Sr. Sec. Credit Facilities 1st Lien Term Loan, Tranche B2, 3.75%, 6/30/191 | | | 168,601,201 | | | | 168,601,201 | |
| |
Internet Brands, Sr. Sec. Credit Facilities 1st Lien Term Loan, 5.00%, 6/30/211 | | | 35,780,784 | | | | 35,875,818 | |
| |
Internet Brands, Sr. Sec. Credit Facilities 1st Lien Term Loan, Delayed Draw, 0.00%-5.00%, 6/25/211 | | | 3,889,216 | | | | 3,899,545 | |
| |
ION Media Networks, Inc., Sr. Sec. Credit Facilities 1st Lien Term Loan, Tranche B, 5.00%, 12/17/201 | | | 15,676,225 | | | | 15,759,513 | |
| |
Liberty Cablevision of Puerto Rico LLC, Sr. Sec. Credit Facilities 1st Lien Term Loan, 6.00%, 12/24/211 | | | 38,415,000 | | | | 38,619,099 | |
| |
Liberty Cablevision of Puerto Rico LLC, Sr. Sec. Credit Facilities 2nd Lien Term Loan, 10.00%, 6/26/231 | | | 8,070,000 | | | | 8,081,346 | |
| |
Lions Gate Entertainment Corp., Sr. Sec. Credit Facilities 2nd Lien Term Loan, 5.00%, 7/19/201 | | | 32,500,000 | | | | 33,037,875 | |
| |
Media General, Inc., Sr. Sec. Credit Facilities 1st Lien Term Loan, Delayed Draw, Tranche B, 4.25%, 7/30/201 | | | 84,102,316 | | | | 84,535,443 | |
15 OPPENHEIMER SENIOR FLOATING RATE FUND
|
|
| STATEMENT OF INVESTMENTS Continued |
| | | | | | | | |
| | | Principal
Amount | | | Value | |
| |
Media (Continued) | | | | | | | | |
| |
Mediacom Broadband LLC, Sr. Sec. Credit Facilities 1st Lien Term Loan, Tranche G, 4.00%, 1/20/201 | | $ | 9,874,372 | | | $ | 9,880,464 | |
| |
Mediacom Illinois LLC, Sr. Sec. Credit Facilities 1st Lien Term Loan, Delayed Draw, 3.75%, 6/18/211 | | | 27,665,000 | | | | 27,641,955 | |
| |
Mergermarket USA, Inc., Sr. Sec. Credit Facilities 1st Lien Term Loan, 4.50%, 2/4/211 | | | 29,261,663 | | | | 28,877,603 | |
| |
Mergermarket USA, Inc., Sr. Sec. Credit Facilities 2nd Lien Term Loan, 7.50%, 2/4/221 | | | 9,975,000 | | | | 9,825,375 | |
| |
Merrill Corp., Sr. Sec. Credit Facilities 1st Lien Term Loan, 5.75%, 3/8/181 | | | 33,136,730 | | | | 33,689,020 | |
| |
NEP/NCP Holdco, Inc., Sr. Sec. Credit Facilities 1st Lien Term Loan, Tranche B, 4.25%, 1/22/201 | | | 64,655,495 | | | | 64,716,142 | |
| |
Penton Media, Inc., Sr. Sec. Credit Facilities 1st Lien Term Loan, 5.50%, 10/3/191 | | | 40,136,700 | | | | 40,554,804 | |
| |
Radio One, Inc., Sr. Sec. Credit Facilities 1st Lien Term Loan, Tranche B, 7.50%, 3/31/161 | | | 35,662,701 | | | | 36,197,642 | |
| |
Rovi Solutions Corp., Sr. Sec. Credit Facilities 1st Lien Term Loan, Tranche B, 3.75%, 6/6/211 | | | 51,730,000 | | | | 51,665,338 | |
| |
Salem Communications Corp., Sr. Sec. Credit Facilities 1st Lien Term Loan, Tranche B, 4.50%, 3/13/201 | | | 27,127,987 | | | | 27,144,617 | |
| |
Sensus USA, Inc., Sr. Sec. Credit Facilities 1st Lien Term Loan, Tranche B, 8.00%, 2/28/191 | | | 15,244,524 | | | | 15,454,136 | |
| |
SuperMedia, Inc., Sr. Sec. Credit Facilities 1st Lien Term Loan, 11.60%, 12/30/161 | | | 13,770,000 | | | | 11,936,869 | |
| |
Tech Finance & Co. SCA, Sr. Sec. Credit Facilities 1st Lien Term Loan, Tranche B, 5.50%, 7/11/201 | | | 40,250,125 | | | | 40,635,842 | |
| |
Tribune Co., Sr. Sec. Credit Facilities 1st Lien Term Loan, Tranche B, 4.00%, 12/27/201 | | | 93,978,000 | | | | 94,024,519 | |
| |
TWCC Holding Corp., Sr. Sec. Credit Facilities 2nd Lien Term Loan, 7.00%, 6/26/201 | | | 53,481,154 | | | | 52,712,362 | |
| |
Univision Communications, Inc., Sr. Sec. Credit Facilities 1st Lien Term Loan: | | | | | | | | |
Tranche C2, 4.00%, 3/1/201 | | | 47,775,250 | | | | 47,524,430 | |
Tranche C4, 4.00%, 3/1/201 | | | 86,024,689 | | | | 85,594,565 | |
| |
US Finco, Sr. Sec. Credit Facilities 1st Lien Term Loan, Tranche B, 4.00%, 5/29/201 | | | 25,791,480 | | | | 25,751,194 | |
| |
Virgin Media Investment Holdings, Sr. Sec. Credit Facilities 1st Lien Term Loan, 3.50%, 6/8/201 | | | 13,000,000 | | | | 12,897,417 | |
| |
WaveDivision Holdings LLC, Sr. Sec. Credit Facilities 1st Lien Term Loan, Tranche B, 4.00%, 10/12/191 | | | 43,598,593 | | | | 43,634,911 | |
| |
Wide Open West Finance LLC, Sr. Sec. Credit Facilities 1st Lien Term Loan, Tranche B, 4.75%, 4/1/191 | | | 157,430,170 | | | | 158,155,766 | |
| |
Yankee Cable Acquisition LLC, Sr. Sec. Credit Facilities 1st Lien Term Loan, Tranche B, 4.50%, 3/1/201 | | | 61,190,844 | | | | 61,506,344 | |
| |
YP LLC, Sr. Sec. Credit Facilities 1st Lien Term Loan, Tranche B, 8.00%, 6/4/181 | | | 25,413,594 | | | | 25,620,079 | |
| | | | | | | | |
| | | | | | | 2,271,950,337 | |
| | | | | | | | |
| |
Multiline Retail—1.2% | | | | | | | | |
| |
Hudson Bay Co., Sr. Sec. Credit Facilities 1st Lien Term Loan, Tranche B, 4.75%, 11/4/201 | | | 42,337,250 | | | | 42,734,162 | |
16 OPPENHEIMER SENIOR FLOATING RATE FUND
| | | | | | | | |
| | | Principal
Amount | | | Value | |
| |
Multiline Retail (Continued) | | | | | | | | |
| |
J.C. Penny Corp., Sr. Sec. Credit Facilities 1st Lien Term Loan, 6.00%, 5/22/181 | | $ | 62,079,154 | | | $ | 62,788,656 | |
| |
J.C. Penny Corp., Sr. Sec. Credit Facilities 1st Lien Term Loan, 5.00%, 6/14/191 | | | 13,770,000 | | | | 13,850,830 | |
| |
Neiman Marcus Group, Inc., Sr. Sec. Credit Facilities Term Loan, 4.25%, 10/25/201 | | | 122,574,862 | | | | 122,168,895 | |
| | | | | | | | |
| | | | | | | 241,542,543 | |
| | | | | | | | |
| |
Specialty Retail—1.6% | | | | | | | | |
| |
Anchor Hocking LLC, Sr. Sec. Credit Facilities 1st Lien Term Loan, 8.50%, 5/21/201,3 | | | 24,146,534 | | | | 17,958,985 | |
| |
Breed Technologies, Inc., Sr. Sec. Credit Facilities 1st Lien Term Loan, 4.75%, 7/23/211 | | | 32,085,000 | | | | 32,105,053 | |
| |
Burlington Coat Factory Warehouse Corp., Sr. Sec. Credit Facilities 1st Lien Term Loan: | | | | | | | | |
Tranche B2, 4.25%, 2/23/171 | | | 59,710,661 | | | | 59,897,257 | |
Tranche B3, 4.25%, 7/24/211 | | | 91,805,000 | | | | 91,805,000 | |
| |
Harbor Freight Tools USA, Inc., Sr. Sec. Credit Facilities 1st Lien Term Loan, Tranche B, 4.75%, 7/26/191 | | | 91,803,006 | | | | 92,342,348 | |
| |
National Vision, Sr. Sec. Credit Facilities 1st Lien Term Loan, Tranche B, 4.00%, 3/5/211 | | | 32,398,800 | | | | 32,169,319 | |
| |
National Vision, Sr. Sec. Credit Facilities 2nd Lien Term Loan, 6.75%, 3/11/221 | | | 11,565,000 | | | | 11,456,578 | |
| | | | | | | | |
| | | | | | | 337,734,540 | |
| | | | | | | | |
| |
Textiles, Apparel & Luxury Goods—0.2% | | | | | | | | |
| |
Vogue International LLC, Sr. Sec. Credit Facilities 1st Lien Term Loan, Tranche B, 5.25%, 2/14/201 | | | 36,992,288 | | | | 37,177,249 | |
| | | | | | | | |
| |
Consumer Staples—3.2% | | | | | | | | |
| |
Food & Staples Retailing—1.5% | | | | | | | | |
| |
Albertsons LLC, Sr. Sec. Credit Facilities 1st Lien Term Loan, Tranche B2, 4.75%, 3/21/191 | | | 74,804,068 | | | | 75,278,026 | |
| |
Fairway Group Acquisition, Sr. Sec. Credit Facilities 1st Lien Term Loan, Tranche B, 5.00%, 8/17/181 | | | 31,438,131 | | | | 31,143,399 | |
| |
New Albertsons, Inc., Sr. Sec. Credit Facilities 1st Lien Term Loan, Tranche B, 4.75%, 6/25/211 | | | 68,925,000 | | | | 69,217,587 | |
| |
Rite Aid Corp., Sr. Sec. Credit Facilities 2nd Lien Term Loan, Tranche 6, 5.75%, 8/21/201 | | | 36,533,334 | | | | 37,300,534 | |
| |
Smart & Final, Inc., Sr. Sec. Credit Facilities 1st Lien Term Loan, Tranche B, 4.75%, 11/15/191 | | | 70,386,354 | | | | 70,540,359 | |
| |
Supervalu, Inc., Sr. Sec. Credit Facilities 1st Lien Term Loan, 4.50%, 3/21/191 | | | 32,587,195 | | | | 32,589,444 | |
| | | | | | | | |
| | | | | | | 316,069,349 | |
| | | | | | | | |
| |
Food Products—1.5% | | | | | | | | |
| |
AdvancePierre Foods, Inc., Sr. Sec. Credit Facilities 1st Lien Term Loan, Tranche B, 5.75%, 7/10/171 | | | 45,570,320 | | | | 45,722,206 | |
| |
AdvancePierre Foods, Inc., Sr. Sec. Credit Facilities 2nd Lien Term Loan, 9.50%, 10/10/171 | | | 4,110,000 | | | | 4,002,112 | |
| |
CSM Bakery Solutions LLC, Sr. Sec. Credit Facilities 1st Lien Term Loan, Tranche B, 5.00%, 7/3/201 | | | 7,860,000 | | | | 7,830,525 | |
17 OPPENHEIMER SENIOR FLOATING RATE FUND
|
|
| STATEMENT OF INVESTMENTS Continued |
| | | | | | | | |
| | | Principal
Amount | | | Value | |
| |
Food Products (Continued) | | | | | | | | |
| |
Dole Food Co., Inc., Sr. Sec. Credit Facilities 1st Lien Term Loan, 4.50%-5.75%, 11/1/181 | | $ | 55,119,350 | | | $ | 55,165,044 | |
| |
H.J. Heinz Co., Sr. Sec. Credit Facilities 1st Lien Term Loan, 3.50%, 6/5/201 | | | 39,600,000 | | | | 39,649,500 | |
| |
Hostess Brands, Inc., Sr. Sec. Credit Facilities 1st Lien Term Loan, Tranche B, 6.75%, 4/9/201 | | | 36,534,487 | | | | 37,767,526 | |
| |
JBS USA LLC, Sr. Sec. Credit Facilities 1st Lien Term Loan: | | | | | | | | |
Tranche B, 3.75%, 5/25/181 | | | 14,645,614 | | | | 14,572,386 | |
Tranche B, 3.75%, 9/18/201 | | | 29,775,000 | | | | 29,672,276 | |
| |
Mill US Acquisition LLC, Sr. Sec. Credit Facilities 1st Lien Term Loan, Tranche B, 4.75%, 7/3/201 | | | 34,793,550 | | | | 34,779,041 | |
| |
Mill US Acquisition LLC, Sr. Sec. Credit Facilities 2nd Lien Term Loan, 8.50%, 7/5/211 | | | 13,840,000 | | | | 13,909,200 | |
| |
Performance Food Group, Inc., Sr. Sec. Credit Facilities 2nd Lien Term Loan, 6.25%, 11/14/191 | | | 28,593,956 | | | | 28,862,024 | |
| | | | | | | | |
| | | | | | | 311,931,840 | |
| | | | | | | | |
| |
Household Products—0.2% | | | | | | | | |
| |
PFS Holding Corp., Sr. Sec. Credit Facilities 1st Lien Term Loan, 4.50%, 1/29/211 | | | 26,623,275 | | | | 25,558,344 | |
| |
PFS Holding Corp., Sr. Sec. Credit Facilities 2nd Lien Term Loan, 8.25%, 1/28/221 | | | 16,695,000 | | | | 15,442,875 | |
| | | | | | | | |
| | | | | | | 41,001,219 | |
| | | | | | | | |
| |
Energy—5.3% | | | | | | | | |
| |
Energy Equipment & Services—4.3% | | | | | | | | |
| |
American Energy-Marcellus LLC, Sr. Sec. Credit Facilities 1st Lien Term Loan, 5.25%, 6/20/201 | | | 27,545,000 | | | | 27,579,431 | |
| |
Ameriforge Group, Inc., Sr. Sec. Credit Facilities 1st Lien Term Loan, 5.00%, 12/19/191 | | | 21,605,158 | | | | 21,740,190 | |
| |
Ameriforge Group, Inc., Sr. Sec. Credit Facilities 2nd Lien Term Loan, 8.75%, 12/21/201 | | | 22,710,000 | | | | 23,277,750 | |
| |
BBTS Borrower LP, Sr. Sec. Credit Facilities 1st Lien Term Loan, Tranche B, 8.75%, 6/4/191 | | | 18,468,403 | | | | 18,655,969 | |
| |
CITGO Petroleum Corp., Sr. Sec. Credit Facilities 1st Lien Term Loan, Tranche B, 4.50%, 7/23/211 | | | 18,445,000 | | | | 18,560,281 | |
| |
Drillships Financing Holding, Inc., Sr. Sec. Credit Facilities 1st Lien Term Loan, Tranche B1, 6.00%, 3/31/211 | | | 111,250,410 | | | | 112,362,915 | |
| |
Fieldwood Energy LLC, Sr. Sec. Credit Facilities 2nd Lien Term Loan, 8.375%, 9/30/201 | | | 54,592,942 | | | | 56,008,974 | |
| |
HGIM, Sr. Sec. Credit Facilities 1st Lien Term Loan, Tranche B, 5.50%, 6/18/201 | | | 49,828,462 | | | | 49,672,749 | |
| |
Larchmount Resources LLC, Sr. Sec. Credit Facilities 1st Lien Term Loan, 8.25%, 8/7/191 | | | 24,750,000 | | | | 25,306,875 | |
| |
McDermott Finance LLC, Sr. Sec. Credit Facilities 1st Lien Term Loan, Tranche B, 5.25%, 4/16/191 | | | 27,605,000 | | | | 27,915,556 | |
| |
Offshore Group Investment Ltd., Sr. Sec. Credit Facilities 1st Lien Term Loan: | | | | | | | | |
Tranche B, 5.00%, 10/25/171 | | | 32,713,147 | | | | 32,624,559 | |
Tranche B, 5.75%, 3/28/191 | | | 32,429,500 | | | | 32,341,681 | |
| |
Pacific Drilling SA, Sr. Sec. Credit Facilities 1st Lien Term Loan, Tranche B, 4.50%, 6/3/181 | | | 23,220,450 | | | | 23,307,527 | |
18 OPPENHEIMER SENIOR FLOATING RATE FUND
| | | | | | | | |
| | | Principal
Amount | | | Value | |
| |
Energy Equipment & Services (Continued) | | | | | | | | |
| |
ProPetro Services, Inc., Sr. Sec. Credit Facilities 1st Lien Term Loan, Tranche B, 7.25%, 9/30/191 | | $ | 103,728,625 | | | $ | 104,506,590 | |
| |
Quicksilver Resources, Inc., Sr. Sec. Credit Facilities 2nd Lien Term Loan, 7.00%, 6/21/191 | | | 52,050,000 | | | | 50,380,080 | |
| |
Sabine Oil & Gas LLC, Sr. Sec. Credit Facilities 2nd Lien Term Loan, 8.75%, 12/31/181 | | | 38,730,000 | | | | 39,383,569 | |
| |
Seadrill Operating LP, Sr. Sec. Credit Facilities 1st Lien Term Loan, Tranche B, 4.00%, 2/12/211 | | | 134,244,215 | | | | 132,912,244 | |
| |
Sheridan Investment Partners I LLC, Sr. Sec. Credit Facilities 1st Lien Term Loan, Tranche B2, 4.25%, 10/1/191 | | | 47,293,640 | | | | 47,485,794 | |
| |
Sheridan Production Partners I-A LLC, Sr. Sec. Credit Facilities 1st Lien Term Loan, Tranche B2, 4.25%, 10/1/191 | | | 6,266,795 | | | | 6,282,462 | |
| |
Sheridan Production Partners I-M LLC, Sr. Sec. Credit Facilities 1st Lien Term Loan, Tranche B2, 4.25%, 10/1/191 | | | 3,827,795 | | | | 3,837,364 | |
| |
Templar Energy, Sr. Sec. Credit Facilities 2nd Lien Term Loan, 8.00%, 11/25/201 | | | 46,780,000 | | | | 46,429,150 | |
| | | | | | | | |
| | | | | | | 900,571,710 | |
| | | | | | | | |
| |
Oil, Gas & Consumable Fuels—1.0% | | | | | | | | |
| |
Blackbrush, Sr. Sec. Credit Facilities 2nd Lien Term Loan, 7.50%, 7/21/211 | | | 25,245,000 | | | | 25,434,338 | |
| |
Samson Investment Co., Sr. Sec. Credit Facilities 2nd Lien Term Loan, 5.00%, 9/25/181 | | | 92,620,000 | | | | 92,520,804 | |
| |
Sheridan Investment Partners II LLC, Sr. Sec. Credit Facilities 1st Lien REV Term Loan, 4.25%, 12/11/201 | | | 34,831,657 | | | | 34,846,182 | |
| |
Sheridan Investment Partners II-A LLC, Sr. Sec. Credit Facilities 1st Lien Term Loan, Tranche B2, 4.25%, 12/11/201 | | | 4,845,336 | | | | 4,847,356 | |
| |
Sheridan Production Partners II-M LLC, Sr. Sec. Credit Facilities 1st Lien REV Term Loan, Tranche B2, 4.25%, 12/11/201 | | | 1,807,045 | | | | 1,807,798 | |
| |
Southcross Energy Partners LP, Sr. Sec. Credit Facilities 1st Lien Term Loan, Tranche B, 6.00%, 7/30/211 | | | 4,590,000 | | | | 4,615,764 | |
| |
Southcross Holdings LP, Sr. Sec. Credit Facilities 1st Lien Term Loan, 5.25%, 7/29/211 | | | 32,130,000 | | | | 32,330,009 | |
| | | | | | | | |
| | | | | | | 196,402,251 | |
| | | | | | | | |
| |
Financials—3.0% | | | | | | | | |
| |
Capital Markets—0.7% | | | | | | | | |
| |
Nuveen Investments, Inc., Sr. Sec. Credit Facilities 1st Lien Term Loan, Tranche B, 4.155%, 5/13/171 | | | 104,633,121 | | | | 104,756,693 | |
| |
Nuveen Investments, Inc., Sr. Sec. Credit Facilities 2nd Lien Term Loan, 6.50%, 2/28/191 | | | 38,535,000 | | | | 38,647,406 | |
| | | | | | | | |
| | | | | | | 143,404,099 | |
| | | | | | | | |
| |
Commercial Banks—0.2% | | | | | | | | |
| |
Hub International Ltd., Sr. Sec. Credit Facilities 1st Lien Term Loan, Tranche B, 4.75%, 10/2/201 | | | 42,807,500 | | | | 42,962,677 | |
| | | | | | | | |
| |
Consumer Finance—0.4% | | | | | | | | |
| |
Fly Leasing Ltd., Sr. Sec. Credit Facilities 1st Lien Term Loan, 4.50%, 8/9/191 | | | 43,004,090 | | | | 43,380,377 | |
19 OPPENHEIMER SENIOR FLOATING RATE FUND
|
|
| STATEMENT OF INVESTMENTS Continued |
| | | | | | | | |
| | | Principal
Amount | | | Value | |
| |
Consumer Finance (Continued) | | | | | | | | |
| |
Grosvenor Capital Management Holdings LLP, Sr. Sec. Credit Facilities 1st Lien Term Loan, Tranche B, 3.75%, 1/4/211 | | $ | 31,412,150 | | | $ | 31,264,921 | |
| | | | | | | | |
| | | | | | | 74,645,298 | |
| | | | | | | | |
| |
Diversified Financial Services—0.6% | | | | | | | | |
| |
Altisource Solutions Sarl, Sr. Sec. Credit Facilities 1st Lien Term Loan, Tranche B, 4.50%, 12/9/201 | | | 37,991,651 | | | | 37,991,651 | |
| |
Guggenheim Partners Investment Management, Sr. Sec. Credit Facilities 1st Lien Term Loan, Tranche B, 4.25%, 7/22/201 | | | 39,662,812 | | | | 39,687,601 | |
| |
RCS Capital, Sr. Sec. Credit Facilities 1st Lien Term Loan, 6.50%, 4/29/191 | | | 49,790,000 | | | | 50,692,444 | |
| | | | | | | | |
| | | | | | | 128,371,696 | |
| | | | | | | | |
| |
Insurance—0.9% | | | | | | | | |
| |
Aqgen Liberty Management I, Inc., Sr. Sec. Credit Facilities 1st Lien Term Loan, 6.50%, 7/1/191 | | | 105,383,650 | | | | 105,251,920 | |
| |
National Financial Partners Corp., Sr. Sec. Credit Facilities 1st Lien Term Loan, Tranche B, 4.50%, 7/1/201 | | | 88,194,379 | | | | 88,693,581 | |
| | | | | | | | |
| | | | | | | 193,945,501 | |
| | | | | | | | |
| |
Real Estate Management & Development—0.2% | | | | | | | | |
| |
Realogy Group LLC, Sr. Sec. Credit Facilities 1st Lien Term Loan, Tranche B, 3.75%, 3/5/201 | | | 43,230,268 | | | | 43,297,837 | |
| | | | | | | | |
| |
Health Care—11.9% | | | | | | | | |
| |
Biotechnology—0.1% | | | | | | | | |
| |
eResearch Technology, Inc., Sr. Sec. Credit Facilities 1st Lien Term Loan, Tranche B, 6.00%, 5/2/181 | | | 20,979,870 | | | | 21,058,545 | |
| | | | | | | | |
| |
Health Care Equipment & Supplies—6.8% | | | | | | | | |
| |
Accellent. Inc., Sr. Sec. Credit Facilities 2nd Lien Term Loan, 4.50%, 3/12/211 | | | 37,077,075 | | | | 37,044,633 | |
| |
Akorn, Inc., Sr. Sec. Credit Facilities 1st Lien Term Loan, Tranche B, 4.50%, 4/16/211 | | | 50,595,000 | | | | 50,784,731 | |
| |
Alliance Healthcare Services, Inc., Sr. Sec. Credit Facilities 1st Lien Term Loan, 4.25%, 6/3/191 | | | 46,237,804 | | | | 46,266,702 | |
| |
Alvogen Pharma US, Inc., Sr. Sec. Credit Facilities 1st Lien Term Loan, Tranche B, 7.00%, 5/23/181 | | | 24,458,539 | | | | 24,917,136 | |
| |
Carestream Health, Inc., Sr. Sec. Credit Facilities Term Loan, 5.00%, 6/7/191 | | | 40,830,090 | | | | 40,943,107 | |
| |
Connolly Corp., Sr. Sec. Credit Facilities 1st Lien Term Loan, Tranche B, 5.00%, 5/9/211 | | | 46,185,000 | | | | 46,560,253 | |
| |
ConvaTec Ltd., Sr. Sec. Credit Facilities 1st Lien Term Loan, Tranche B, 5.00%, 12/22/161 | | | 56,832,372 | | | | 56,938,933 | |
| |
Covis Pharmaceuticals Holdings, Sr. Sec. Credit Facilities 1st Lien Term Loan, 6.00%, 4/4/191 | | | 29,667,278 | | | | 29,704,362 | |
| |
DJO Finance LLC/DJO Finance Corp., Sr. Sec. Credit Facilities 1st Lien Term Loan, Tranche B, 4.25%, 9/15/171 | | | 63,089,374 | | | | 63,312,836 | |
| |
Drumm Investors LLC, Sr. Sec. Credit Facilities 1st Lien Term Loan, 6.75%, 5/4/181 | | | 51,192,878 | | | | 51,304,888 | |
| |
Envision Pharmaceutical Services, Inc., Sr. Sec. Credit Facilities 1st Lien Term Loan, Tranche B, 5.75%, 11/4/201 | | | 42,369,825 | | | | 42,846,486 | |
20 OPPENHEIMER SENIOR FLOATING RATE FUND
| | | | | | | | |
| | | Principal
Amount | | | Value | |
| |
Health Care Equipment & Supplies (Continued) | | | | | | | | |
| |
Envision Pharmaceutical Services, Inc., Sr. Sec. Credit Facilities 2nd Lien Term Loan, 9.75%, 11/4/211 | | $ | 5,000,000 | | | $ | 5,078,125 | |
| |
Generic Drug Holdings, Inc., Sr. Sec. Credit Facilities 1st Lien Term Loan, Tranche B, 5.00%, 8/16/201 | | | 25,157,629 | | | | 25,291,292 | |
| |
HCR ManorCare, Inc., Sr. Sec. Credit Facilities 1st Lien Term Loan, 5.00%, 4/6/181 | | | 48,858,783 | | | | 47,087,652 | |
| |
Healthport, Inc., Sr. Sec. Credit Facilities 1st Lien Term Loan, 5.25%, 10/4/191 | | | 18,905,000 | | | | 19,023,156 | |
| |
Healthport, Inc., Sr. Sec. Credit Facilities 2nd Lien Term Loan, 9.25%, 10/5/201 | | | 6,700,000 | | | | 6,775,375 | |
| |
IASIS Healthcare LLC, Sr. Sec. Credit Facilities 1st Lien Term Loan, Tranche B2, 4.50%, 5/3/181 | | | 48,554,827 | | | | 48,729,333 | |
| |
Kinetic Concepts, Inc., Sr. Sec. Credit Facilities 1st Lien Term Loan, Tranche E1, 4.00%, 5/4/181 | | | 59,270,541 | | | | 59,333,842 | |
| |
LHP Hospital Group, Inc., Sr. Sec. Credit Facilities 1st Lien Term Loan, Tranche B, 9.00%, 7/3/181 | | | 30,535,830 | | | | 29,238,057 | |
| |
LifeCare Holdings LLC, Sr. Sec. Credit Facilities 1st Lien Exit Term Loan, Tranche A, 6.50%, 11/30/181 | | | 45,277,650 | | | | 44,711,679 | |
| |
Medpace, Sr. Sec. Credit Facilities 1st Lien Term Loan, Tranche B, 4.75%, 3/31/211 | | | 21,133,774 | | | | 21,239,442 | |
| |
MHP Acquisition Holdings LLC, Sr. Sec. Credit Facilities 1st Lien Term Loan, Tranche B, 4.00%, 3/31/211 | | | 48,636,364 | | | | 48,479,317 | |
| |
National Mentor, Sr. Sec. Credit Facilities 1st Lien Term Loan, Tranche B, 4.75%, 1/31/211 | | | 34,698,038 | | | | 34,857,059 | |
| |
New Trident Holdcorp, Inc., Sr. Sec. Credit Facilities 1st Lien Term Loan, Tranche B, 6.50%, 7/31/191 | | | 35,074,950 | | | | 35,140,715 | |
| |
Opal Acquisition, Inc., Sec. Credit Facilities 1st Lien Term Loan, Tranche B, 5.00%, 11/27/201 | | | 80,985,793 | | | | 81,218,627 | |
| |
Ortho-Clinical Diagnostics, Inc., Sr. Sec. Credit Facilities 1st Lien Term Loan, Tranche B, 4.75%, 6/30/211 | | | 69,265,000 | | | | 69,337,174 | |
| |
P2 Lower Acquisition LLC, Sr. Sec. Credit Facilities 1st Lien Term Loan, 5.50%, 10/22/201 | | | 33,343,256 | | | | 33,468,293 | |
| |
PRA Holdings, Inc., Sr. Sec. Credit Facilities 1st Lien Term Loan, 5.00%, 9/23/201 | | | 81,762,150 | | | | 81,557,745 | |
| |
Quintiles Transnational Co., Sr. Sec. Credit Facilities 1st Lien Term Loan, Tranche B3, 3.75%, 6/8/181 | | | 62,250,220 | | | | 62,289,127 | |
| |
Sage Products Holdings III LLC, Sr. Sec. Credit Facilities 1st Lien Term Loan, Tranche B, 4.25%, 12/13/191 | | | 30,846,164 | | | | 30,904,001 | |
| |
Salix Pharmaceuticals Ltd., Sr. Sec. Credit Facilities 1st Lien Term Loan, Tranche B, 4.25%, 1/2/201 | | | 46,297,875 | | | | 46,565,523 | |
| |
United Surgical Partners, Sr. Sec. Credit Facilities 1st Lien Term Loan, Tranche B, 4.75%, 4/3/191 | | | 19,931,156 | | | | 19,993,441 | |
| |
US Renal Care, Inc., Sr. Sec. Credit Facilities 1st Lien Term Loan, Tranche B2, 4.25%, 7/3/191 | | | 51,820,144 | | | | 51,771,588 | |
| |
US Renal Care, Inc., Sr. Sec. Credit Facilities 2nd Lien Term Loan, Tranche B1, 8.50%, 7/3/201 | | | 5,188,000 | | | | 5,239,880 | |
| | | | | | | | |
| | | | | | | 1,397,954,510 | |
| | | | | | | | |
| |
Health Care Providers & Services—3.6% | | | | | | | | |
| |
American Renal Holdings, Inc., Sr. Sec. Credit Facilities 1st Lien Term Loan, Delayed Draw, Tranche B, 4.50%, 8/20/191 | | | 42,277,399 | | | | 42,242,182 | |
21 OPPENHEIMER SENIOR FLOATING RATE FUND
|
|
| STATEMENT OF INVESTMENTS Continued |
| | | | | | | | |
| | | Principal
Amount | | | Value | |
| |
Health Care Providers & Services (Continued) | | | | | | | | |
| |
Ardent Medical Services, Inc., Sr. Sec. Credit Facilities 1st Lien Term Loan, Tranche B, 6.75%, 7/2/181 | | $ | 40,691,446 | | | $ | 40,882,207 | |
| |
Ardent Medical Services, Inc., Sr. Sec. Credit Facilities 2nd Lien Term Loan, 11.00%, 1/2/191 | | | 1,785,714 | | | | 1,796,130 | |
| |
CHS/Community Health Systems, Inc., Sr. Sec. Credit Facilities Term Loan, 4.25%, 1/27/211 | | | 57,222,450 | | | | 57,437,034 | |
| |
CRC Health, Sr. Sec. Credit Facilities 1st Lien Term Loan, 5.25%, 3/26/211 | | | 36,872,588 | | | | 37,183,718 | |
| |
DaVita HealthCare Partners, Inc., Sr. Sec. Credit Facilities 1st Lien Term Loan, Tranche B, 3.50%, 6/4/211 | | | 45,890,000 | | | | 45,877,701 | |
| |
Envision Healthcare Intermedia, Sr. Sec. Credit Facilities 1st Lien Term Loan, Tranche B, 4.00%, 5/25/181 | | | 44,020,736 | | | | 44,094,119 | |
| |
Genesis Healthcare Corp., Sr. Sec. Credit Facilities 1st Lien Term Loan, Tranche B, 10.00%, 12/4/171 | | | 25,018,160 | | | | 25,560,228 | |
| |
Gentiva Health Services, Inc., Sr. Sec. Credit Facilities 1st Lien Term Loan, Tranche B, 6.50%, 10/18/191 | | | 28,800,275 | | | | 28,867,610 | |
| |
Ikaria, Inc., Sr. Sec. Credit Facilities 1st Lien Term Loan, Tranche B, 5.00%, 2/11/211 | | | 43,600,000 | | | | 43,891,946 | |
| |
Ikaria, Inc., Sr. Sec. Credit Facilities 2nd Lien Term Loan, Tranche B, 8.75%, 2/14/221 | | | 6,490,000 | | | | 6,598,708 | |
| |
inVentiv Health, Inc., Sr. Sec. Credit Facilities 1st Lien Term Loan: | | | | | | | | |
Tranche B, 7.75%, 8/4/161 | | | 19,281,949 | | | | 19,354,256 | |
Tranche B4, 7.75%, 5/15/181 | | | 2,905,238 | | | | 2,912,501 | |
| |
Kindred Healthcare, Inc., Sr. Sec. Credit Facilities 1st Lien Term Loan, Tranche B, 4.00%, 4/9/211 | | | 75,850,356 | | | | 75,779,284 | |
| |
Millennium Laboratories LLC, Sr. Sec. Credit Facilities 1st Lien Term Loan, Tranche B, 5.25%, 4/14/211 | | | 115,100,000 | | | | 115,482,708 | |
| |
Steward Health Care System LLC, Sr. Sec. Credit Facilities 1st Lien Term Loan, 6.75%, 4/10/201 | | | 22,522,500 | | | | 22,381,734 | |
| |
STHI Holding Corp., Sr. Sec. Credit Facilities 1st Lien Term Loan, Tranche B, 4.50%, 5/9/211 | | | 9,180,000 | | | | 9,151,313 | |
| |
Surgery Center Holdings LLC, Sr. Sec. Credit Facilities 1st Lien Term Loan, 6.00%, 4/11/191 | | | 35,103,605 | | | | 35,147,484 | |
| |
Surgery Center Holdings LLC, Sr. Sec. Credit Facilities 1st Lien Term Loan, 5.25%, 7/22/211 | | | 64,260,000 | | | | 64,500,975 | |
| |
Surgery Center Holdings LLC, Sr. Sec. Credit Facilities 2nd Lien Term Loan, 9.75%, 4/11/201 | | | 19,595,000 | | | | 19,619,494 | |
| |
Surgery Center Holdings LLC, Sr. Sec. Credit Facilities 2nd Lien Term Loan, 8.50%, 7/22/221 | | | 4,590,000 | | | | 4,572,788 | |
| | | | | | | | |
| | | | | | | 743,334,120 | |
| | | | | | | | |
| |
Health Care Technology—0.1% | | | | | | | | |
| |
Vitera Healthcare Solutions LLC, Sr. Sec. Credit Facilities 1st Lien Term Loan, 6.00%, 11/4/201 | | | 26,153,585 | | | | 26,186,277 | |
| | | | | | | | |
| |
Life Sciences Tools & Services—0.3% | | | | | | | | |
| |
JLL/Delta Dutch Newco BV, Sr. Sec. Credit Facilities 1st Lien Term Loan, Tranche B, 4.25%, 3/11/211 | | | 52,110,000 | | | | 51,784,313 | |
| | | | | | | | |
| |
Pharmaceuticals—1.0% | | | | | | | | |
| |
Catalent Pharma Solutions, Inc., Sr. Sec. Credit Facilities 1st Lien Term Loan, 6.50%, 12/31/171 | | | 7,664,791 | | | | 7,712,696 | |
22 OPPENHEIMER SENIOR FLOATING RATE FUND
| | | | | | | | |
| | | Principal
Amount | | | Value | |
| |
Pharmaceuticals (Continued) | | | | | | | | |
| |
Catalent Pharma Solutions, Inc., Sr. Sec. Credit Facilities 1st Lien Term Loan, Tranche B, 4.50%, 5/7/211 | | $ | 30,000,000 | | | $ | 30,161,730 | |
| |
Par Pharmaceutical, Inc., Sr. Sec. Credit Facilities 1st Lien Term Loan, Tranche B2, 4.00%, 9/30/191 | | | 107,393,234 | | | | 107,335,672 | |
| |
Valeant Pharmaceuticals International, Sr. Sec. Credit Facilities 1st Lien Term Loan, Tranche B, 4.50%, 8/5/201 | | | 69,367,281 | | | | 69,497,344 | |
| | | | | | | | |
| | | | | | | 214,707,442 | |
| | | | | | | | |
| |
Industrials—21.7% | | | | | | | | |
| |
Aerospace & Defense—1.2% | | | | | | | | |
| |
AM General LLC, Sr. Sec. Credit Facilities 1st Lien Term Loan, Tranche B, 10.25%, 3/22/181 | | | 24,886,421 | | | | 23,393,236 | |
| |
Doncasters Group Ltd., Sr. Sec. Credit Facilities 1st Lien Term Loan, Tranche B, 4.50%, 4/9/201 | | | 59,061,381 | | | | 59,252,090 | |
| |
Doncasters Group Ltd., Sr. Sec. Credit Facilities 2nd Lien Term Loan, 9.50%, 10/9/201 | | | 7,062,069 | | | | 7,190,069 | |
| |
IAP Worldwide Services, Inc., Sr. Sec. Credit Facilities 1st Lien Term Loan, Tranche B, 10.139%, 12/31/151,2 | | | 30,286,585 | | | | 8,783,110 | |
| |
IAP Worldwide Services, Inc., Sr. Sec. Credit Facilities 2nd Lien Term Loan, 10.589%, 6/30/161,2 | | | 10,182,637 | | | | 208,744 | |
| |
Landmark Aviation FBO Canada, Sr. Sec. Credit Facilities 1st Lien Term Loan, Tranche B, 5.75%, 10/25/191 | | | 23,500,000 | | | | 23,562,416 | |
| |
LM US Member LLC, Sr. Sec. Credit Facilities 1st Lien Term Loan, Tranche B, 4.75%, 10/25/191 | | | 35,068,603 | | | | 35,161,745 | |
| |
Sequa Corp., Sr. Sec. Credit Facilities 1st Lien Term Loan, Tranche B, 5.25%, 6/19/171 | | | 28,740,915 | | | | 28,435,543 | |
| |
TurboCombustor Technology, Inc., Sr. Sec. Credit Facilities 1st Lien Term Loan, Tranche B, 5.50%, 12/2/201 | | | 22,641,225 | | | | 22,825,185 | |
| |
WP CPP Holdings LLC, Sr. Sec. Credit Facilities 1st Lien Term Loan, 4.75%, 12/28/191 | | | 49,141,238 | | | | 49,427,878 | |
| | | | | | | | |
| | | | | | | 258,240,016 | |
| | | | | | | | |
| |
Air Freight & Couriers—0.2% | | | | | | | | |
| |
US Airways, Inc., Sr. Sec. Credit Facilities 1st Lien Term Loan, Tranche B1, 3.50%, 5/23/191 | | | 38,907,000 | | | | 38,761,099 | |
| | | | | | | | |
| |
Airlines—0.6% | | | | | | | | |
| |
American Airlines, Inc., Sr. Sec. Credit Facilities 1st Lien Exit Term Loan, Tranche B, 3.75%, 6/27/191 | | | 120,045,899 | | | | 120,335,330 | |
| | | | | | | | |
| |
Building Products—0.2% | | | | | | | | |
| |
ABC Supply Co., Inc., Sr. Sec. Credit Facilities 1st Lien Term Loan, Tranche B, 3.50%, 4/16/201 | | | 17,431,700 | | | | 17,354,077 | |
| |
Wilsonart International Holdings, Sr. Sec. Credit Facilities 1st Lien Term Loan, 4.00%, 10/31/191 | | | 30,265,934 | | | | 30,067,329 | |
| | | | | | | | |
| | | | | | | 47,421,406 | |
| | | | | | | | |
| |
Commercial Services & Supplies—9.8% | | | | | | | | |
| |
AlixPartners LLP, Sr. Sec. Credit Facilities 1st Lien Term Loan, Tranche B2, 4.00%, 7/10/201 | | | 37,562,500 | | | | 37,585,977 | |
| |
AlixPartners LLP, Sr. Sec. Credit Facilities 2nd Lien Term Loan, 9.00%, 7/10/211 | | | 13,600,000 | | | | 13,821,000 | |
| |
23 OPPENHEIMER SENIOR FLOATING RATE FUND
|
|
| STATEMENT OF INVESTMENTS Continued |
| | | | | | | | |
| | | Principal
Amount | | | Value | |
| |
Commercial Services & Supplies (Continued) | | | | | | | | |
| |
Allied Security Holdings LLC, Sr. Sec. Credit Facilities 1st Lien Term Loan, Tranche B, 4.25%, 2/12/211 | | $ | 30,703,376 | | | $ | 30,607,428 | |
| |
Allied Security Holdings LLC, Sr. Sec. Credit Facilities 1st Lien Term Loan, Delayed Draw, Tranche B, 3.25%, 2/12/211 | | | 10,920,727 | | | | 10,886,600 | |
| |
Allied Security Holdings LLC, Sr. Sec. Credit Facilities 2nd Lien Term Loan, Tranche B, 8.00%, 8/12/211 | | | 25,262,123 | | | | 25,209,502 | |
| |
Allied Security Holdings LLC, Sr. Sec. Credit Facilities 2nd Lien Term Loan, Delayed Draw, Tranche B, 7.00%, 8/12/211 | | | 7,615,068 | | | | 7,599,206 | |
| |
Allied Security Holdings LLC, Sr. Sec. Credit Facilities 2nd Lien Term Loan, Delyed Draw, Tranche B, 8.00%, 8/12/211 | | | 1,917,808 | | | | 1,913,813 | |
| |
Ascend Learning LLC, Sr. Sec. Credit Facilities 1st Lien Term Loan, 6.00%-7.25%, 7/26/191 | | | 16,153,825 | | | | 16,340,612 | |
| |
Asurion LLC, Sr. Sec. Credit Facilities 1st Lien Term Loan: | | | | | | | | |
Tranche B1, 5.00%, 5/24/191 | | | 58,155,035 | | | | 58,485,646 | |
Tranche B2, 4.25%, 7/8/201 | | | 54,895,500 | | | | 54,809,753 | |
| |
Asurion LLC, Sr. Sec. Credit Facilities 2nd Lien Term Loan, 8.50%, 3/3/211 | | | 51,560,000 | | | | 53,300,150 | |
| |
Audio Visual Services Corp., Sr. Sec. Credit Facilities 1st Lien Term Loan, 4.50%, 1/22/211 | | | 46,264,050 | | | | 46,336,361 | |
| |
Brand Energy & Infrastructure Services, Inc., Sr. Sec. Credit Facilities 1st Lien Term Loan, Tranche B, 4.75%, 11/26/201 | | | 85,235,437 | | | | 85,402,839 | |
| |
Brock Holdings III, Inc., Sr. Sec. Credit Facilities 1st Lien Term Loan, Tranche B, 6.00%, 3/16/171 | | | 13,338,245 | | | | 13,384,009 | |
| |
Brock Holdings III, Inc., Sr. Sec. Credit Facilities 2nd Lien Term Loan, 10.00%, 3/16/181 | | | 14,670,000 | | | | 14,850,324 | |
| |
Ceridian Corp., Sr. Sec. Credit Facilities 1st Lien Term Loan, Tranche B, 4.405%, 8/14/151 | | | 71,864,374 | | | | 72,056,899 | |
| |
CEVA Group plc, Sr. Sec. Credit Facilities 1st Lien Term Loan, 6.50%, 3/14/211 | | | 10,058,498 | | | | 9,865,183 | |
| |
CEVA Group plc, Sr. Sec. Credit Facilities 1st Lien Term Loan, 6.50%, 3/19/211 | | | 12,404,871 | | | | 12,161,946 | |
| |
CEVA Logistics U.S. Holdings, Inc., Sr. Sec. Credit Facilities Term Loan, 6.50%, 3/14/211 | | | 14,593,966 | | | | 14,313,484 | |
| |
Crossmark Holdings, Inc., Sr. Sec. Credit Facilities 1st Lien Term Loan, 4.50%, 12/20/191 | | | 36,929,693 | | | | 36,791,207 | |
| |
Crossmark Holdings, Inc., Sr. Sec. Credit Facilities 2nd Lien Term Loan, 8.75%, 12/21/201 | | | 15,000,000 | | | | 14,974,995 | |
| |
EWT Holdings III Corp., Sr. Sec. Credit Facilities 1st Lien Term Loan, 4.75%, 1/15/211 | | | 46,158,793 | | | | 46,187,642 | |
| |
EWT Holdings III Corp., Sr. Sec. Credit Facilities 2nd Lien Term Loan, 8.50%, 1/15/221 | | | 9,315,000 | | | | 9,367,397 | |
| |
Expert Global Solutions, Inc., Sr. Sec. Credit Facilities 1st Lien Term Loan, Tranche B, 8.50%, 4/3/181 | | | 32,371,488 | | | | 32,366,438 | |
| |
First Data Corp., Extended Sr. Sec. Credit Facilities 1st Lien Term Loan, Tranche C1, 4.154%, 3/23/181 | | | 74,010,797 | | | | 74,163,852 | |
| |
First Data Corp., Sr. Sec. Credit Facilities 1st Lien Term Loan: | | | | | | | | |
Tranche B, 4.154%, 9/24/181 | | | 27,204,695 | | | | 27,261,362 | |
Tranche B, 4.155%, 3/24/211 | | | 58,835,094 | | | | 58,866,630 | |
| |
Garda World Security Co., Sr. Sec. Credit Facilities 1st Lien Term Loan, Tranche B, 4.00%, 11/6/201 | | | 22,635,960 | | | | 22,607,665 | |
24 OPPENHEIMER SENIOR FLOATING RATE FUND
| | | | | | | | |
| | | Principal
Amount | | | Value | |
| |
Commercial Services & Supplies (Continued) | | | | | | | | |
| |
Garda World Security Co., Sr. Sec. Credit Facilities 1st Lien Term Loan, Delayed Draw, Tranche B, 4.00%, 11/6/201 | | $ | 5,790,594 | | | $ | 5,783,356 | |
| |
GCA Services Group, Inc., Sr. Credit Facilities 1st Lien Term Loan, 4.25%-5.50%, 11/1/191 | | | 17,464,633 | | | | 17,486,464 | |
| |
GCA Services Group, Inc., Sr. Sec. Credit Facilities 2nd Lien Term Loan, Tranche B, 9.25%, 11/1/201 | | | 10,516,000 | | | | 10,669,355 | |
| |
IG Investments Holdings LLC, Inc., Sr. Sec. Credit Facilities 1st Lien Term Loan, Tranche B, 5.25%, 10/31/191 | | | 52,692,087 | | | | 53,054,345 | |
| |
Information Resources, Inc., Sr. Sec. Credit Facilities 1st Lien Term Loan, Tranche B, 4.75%, 9/30/201 | | | 23,611,575 | | | | 23,705,030 | |
| |
Inmar, Inc., Sr. Sec. Credit Facilities 1st Lien Term Loan, Tranche B, 4.25%, 1/27/211 | | | 27,830,000 | | | | 27,551,700 | |
| |
Inmar, Inc., Sr. Sec. Credit Facilities 2nd Lien Term Loan, Tranche B, 8.00%, 1/27/221 | | | 9,275,000 | | | | 9,251,812 | |
| |
iPayment, Inc., Sr. Sec. Credit Facilities 1st Lien Term Loan, Tranche B, 6.75%, 5/8/171 | | | 31,520,000 | | | | 31,201,396 | |
| |
JHCI Acquisition, Inc., Sr. Sec. Credit Facilities 1st Lien Term Loan, Tranche B, 7.00%, 7/11/191 | | | 26,862,248 | | | | 27,198,026 | |
| |
JHCI Acquisition, Inc., Sr. Sec. Credit Facilities 2nd Lien Term Loan, 11.00%, 7/11/201 | | | 11,000,000 | | | | 11,137,500 | |
| |
Language Line LLC, Sr. Sec. Credit Facilities 1st Lien Term Loan, Tranche B, 6.25%, 6/20/161 | | | 49,566,770 | | | | 49,684,491 | |
| |
Language Line LLC, Sr. Sec. Credit Facilities 2nd Lien Term Loan, 10.50%, 12/20/161 | | | 18,060,000 | | | | 18,001,305 | |
| |
Livingston International, Inc., Sr. Sec. Credit Facilities 1st Lien Term Loan, Tranche B1, 5.00%, 4/18/191 | | | 29,997,000 | | | | 30,059,484 | |
| |
Livingston International, Inc., Sr. Sec. Credit Facilities 2nd Lien Term Loan, 9.00%, 4/17/201 | | | 14,900,330 | | | | 15,044,685 | |
| |
Neff Rental LLC, Sr. Sec. Credit Facilities 2nd Lien Term Loan, 7.25%, 5/21/211 | | | 41,360,000 | | | | 41,230,750 | |
| |
New Breed Logistics, Inc., Sr. Sec. Credit Facilities 1st Lien Term Loan, Tranche B, 6.00%, 10/1/191 | | | 23,560,003 | | | | 23,692,528 | |
| |
Novitex Acquisition LLC, Sr. Sec. Credit Facilities 1st Lien Term Loan, 7.50%, 7/1/201 | | | 27,540,000 | | | | 27,402,300 | |
| |
Novitex Acquisition LLC, Sr. Sec. Credit Facilities 2nd Lien Term Loan, 11.75%, 7/1/211 | | | 12,850,000 | | | | 12,817,875 | |
| |
OPE USIC Holdings, Inc., Sr. Sec. Credit Facilities 1st Lien Term Loan, 4.00%, 7/10/201 | | | 47,025,000 | | | | 46,495,969 | |
| |
Orbitz Worldwide, Inc., Sr. Sec. Credit Facilities 1st Lien Term Loan, 4.50%, 4/10/211 | | | 35,676,219 | | | | 35,869,477 | |
| |
Osmose Holdings, Inc., Sr. Sec. Credit Facilities 1st Lien Term Loan, Tranche B, 4.75%, 11/26/181 | | | 23,384,080 | | | | 23,403,956 | |
| |
Ozburn-Hessey Holding Co. LLC, Sr. Sec. Credit Facilities 1st Lien Term Loan, Tranche B, 6.75%, 5/23/191 | | | 26,827,488 | | | | 26,911,323 | |
| |
Protection One, Inc., Sr. Sec. Credit Facilities 1st Lien Term Loan, Tranche B, 4.25%, 3/21/191 | | | 50,204,190 | | | | 50,235,567 | |
| |
Sabre, Inc., Sr. Sec. Credit Facilities 1st Lien Term Loan, Tranche B, 4.25%, 2/19/191 | | | 86,464,970 | | | | 86,347,896 | |
| |
Sabre, Inc., Sr. Sec. Credit Facilities Incremental 1st Lien Term Loan, Tranche B2, 4.50%, 2/19/191 | | | 33,199,125 | | | | 33,257,921 | |
| |
25 OPPENHEIMER SENIOR FLOATING RATE FUND
|
|
| STATEMENT OF INVESTMENTS Continued |
| | | | | | | | |
| | | Principal
Amount | | | Value | |
| |
Commercial Services & Supplies (Continued) | | | | | | | | |
| |
Ship Midco Ltd., Sr. Sec. Credit Facilities 1st Lien Term Loan, Tranche C, 4.75%, 11/29/191 | | $ | 33,205,000 | | | $ | 33,443,677 | |
| |
Sourcehov, Sr. Sec. Credit Facilities 1st Lien Term Loan, Tranche B, 5.25%, 4/30/181 | | | 35,169,750 | | | | 35,492,151 | |
| |
Sourcehov, Sr. Sec. Credit Facilities 2nd Lien Term Loan, 8.75%, 4/30/191 | | | 13,680,000 | | | | 13,885,200 | |
| |
STG Fairway Acquisitions, Inc., Sr. Sec. Credit Facilities 1st Lien Term Loan, Tranche B, 6.25%, 2/28/191 | | | 34,599,898 | | | | 34,708,023 | |
| |
SurveyMonkey.com LLC, Sr. Sec. Credit Facilities 1st Lien Term Loan, 5.50%, 2/7/191 | | | 29,106,537 | | | | 29,397,603 | |
| |
Synagro Infrastructure Co., Inc., Sr. Sec. Credit Facilities 1st Lien Term Loan, 6.25%, 8/22/201 | | | 24,812,500 | | | | 24,595,391 | |
| |
Tervita Corp., Sr. Sec. Credit Facilities 1st Lien Term Loan, Tranche B, 6.25%, 5/15/181 | | | 75,130,346 | | | | 75,499,311 | |
| |
Travelport LLC, Sr. Sec. Credit Facilities 1st Lien Term Loan, 6.25%, 6/26/191 | | | 114,243,238 | | | | 116,266,257 | |
| |
WasteQuip LLC, Sr. Sec. Credit Facilities 1st Lien Term Loan, Tranche B, 5.50%, 8/9/191 | | | 21,285,000 | | | | 21,364,819 | |
| | | | | | | | |
| | | | | | | 2,023,664,863 | |
| | | | | | | | |
| |
Electrical Equipment—2.2% | | | | | | | | |
| |
Alcatel-Lucent USA, Inc., Sr. Sec. Credit Facilities 1st Lien Term Loan, Tranche C, 4.50%, 1/30/191 | | | 68,969,849 | | | | 69,020,128 | |
| |
Applied Systems, Inc., Sr. Sec. Credit Facilities 1st Lien Term Loan, Tranche B, 4.25%, 1/25/211 | | | 23,074,050 | | | | 23,059,629 | |
| |
Applied Systems, Inc., Sr. Sec. Credit Facilities 2nd Lien Term Loan, Tranche B, 7.50%, 1/24/221 | | | 12,975,000 | | | | 13,181,796 | |
| |
Attachmate Corp., Sr. Sec. Credit Facilities 1st Lien Term Loan, 7.25%, 11/22/171 | | | 62,962,640 | | | | 63,749,673 | |
| |
Attachmate Corp., Sr. Sec. Credit Facilities 2nd Lien Term Loan, 11.00%, 11/22/181 | | | 19,201,940 | | | | 19,489,969 | |
| |
EIG Investors Corp., Sr. Sec. Credit Facilities 1st Lien Term Loan, Tranche B, 5.00%, 11/9/191 | | | 40,752,050 | | | | 40,955,810 | |
| |
Freescale Semiconductor, Inc., Sr. Sec. Credit Facilities 1st Lien Term Loan: | | | | | | | | |
Tranche B4, 4.25%, 2/28/201 | | | 112,647,123 | | | | 112,242,269 | |
Tranche B5, 5.00%, 1/15/211 | | | 78,295,813 | | | | 78,516,059 | |
| |
Internap Network Services Corp., Sr. Sec. Credit Facilities 1st Lien Term Loan, 6.00%, 11/22/191 | | | 33,252,900 | | | | 33,377,598 | |
| | | | | | | | |
| | | | | | | 453,592,931 | |
| | | | | | | | |
| |
Industrial Conglomerates—2.7% | | | | | | | | |
| |
Apex Tool Group LLC, Sr. Sec. Credit Facilities 1st Lien Term Loan, Tranche B, 4.50%, 1/31/201 | | | 47,279,609 | | | | 46,708,330 | |
| |
Crosby US Acquisition Corp., Sr. Sec. Credit Facilities 1st Lien Term Loan, 4.00%, 11/23/201 | | | 57,212,500 | | | | 57,019,408 | |
| |
Custom Sensors & Technologies, Inc., Sr. Sec. Credit Facilities 1st Lien Term Loan, 4.50%, 7/1/211 | | | 45,750,000 | | | | 45,892,969 | |
| |
DAE Aviation Holdings, Inc., Sr. Sec. Credit Facilities 1st Lien Term Loan: | | | | | | | | |
Tranche B1, 5.00%, 11/2/181 | | | 24,631,202 | | | | 24,777,462 | |
Tranche B2, 5.00%, 11/2/181 | | | 9,886,285 | | | | 9,944,990 | |
26 OPPENHEIMER SENIOR FLOATING RATE FUND
| | | | | | | | |
| | | Principal
Amount | | | Value | |
| |
Industrial Conglomerates (Continued) | | | | | | | | |
| |
DAE Aviation Holdings, Inc., Sr. Sec. Credit Facilities 2nd Lien Term Loan, 7.75%, 7/30/191 | | $ | 20,390,000 | | | $ | 20,632,131 | |
| |
Dayco Products LLC, Sr. Sec. Credit Facilities 1st Lien Term Loan, Tranche B, 5.25%, 12/12/191 | | | 35,411,250 | | | | 35,544,042 | |
| |
Doosan Bobcat, Sr. Sec. Credit Facilities 1st Lien Term Loan, Tranche B, 4.50%, 5/28/211 | | | 48,300,000 | | | | 48,561,206 | |
| |
Excelitas Technologies Corp., Sr. Sec. Credit Facilities 1st Lien Term Loan, 6.00%, 11/2/201 | | | 35,836,725 | | | | 36,045,760 | |
| |
Filtration Group Corp., Sr. Sec. Credit Facilities 1st Lien Term Loan, Tranche B, 4.50%, 11/20/201 | | | 22,840,225 | | | | 23,017,123 | |
| |
Gardner Denver, Inc., Sr. Sec. Credit Facilities 1st Lien Term Loan, 4.25%, 7/30/201 | | | 95,160,900 | | | | 94,841,255 | |
| |
Hillman Group, Inc. (The), Sr. Sec. Credit Facilities 1st Lien Term Loan, Tranche B, 4.50%, 6/13/211 | | | 32,180,000 | | | | 32,315,767 | |
| |
Minimax GmbH & Co. KG, Sr. Sec. Credit Facilities 1st Lien Term Loan, Tranche B, 4.50%, 8/14/201 | | | 24,955,182 | | | | 25,204,733 | |
| |
Sensus USA, Inc., Sr. Sec. Credit Facilities 1st Lien Term Loan, Tranche B, 4.75%, 5/9/171 | | | 42,470,563 | | | | 42,629,827 | |
| |
Wencor Group, Sr. Sec. Credit Facilities 1st Lien Term Loan, 4.50%, 6/25/211 | | | 29,370,000 | | | | 29,363,891 | |
| | | | | | | | |
| | | | | | | 572,498,894 | |
| | | | | | | | |
| |
Machinery—2.3% | | | | | | | | |
| |
Accudyne Industries Borrower SCA, Sr. Sec. Credit Facilities 1st Lien Term Loan, 4.00%, 12/13/191 | | | 35,313,388 | | | | 35,233,368 | |
| |
Alliance Laundry Systems LLC, Sr. Sec. Credit Facilities 1st Lien Term Loan, Tranche B, 4.25%, 12/10/181 | | | 54,022,483 | | | | 54,326,359 | |
| |
August LuxUk Holding Co., Sr. Sec. Credit Facilities 1st Lien Term Loan, Tranche B2, 5.00%, 4/27/181 | | | 17,477,067 | | | | 17,629,992 | |
| |
August US Holding Co., Inc., Sr. Sec. Credit Facilities 1st Lien Term Loan, Tranche B2, 5.00%, 4/27/181 | | | 14,881,001 | | | | 15,011,210 | |
| |
Boomerang Tube LLC, Sr. Sec. Credit Facilities 1st Lien Term Loan, Tranche B, 11.00%, 10/11/171 | | | 17,913,077 | | | | 16,480,031 | |
| |
Capital Safety, Sr. Sec. Credit Facilities Term Loan, 4.00%, 3/22/211 | | | 64,588,125 | | | | 64,191,166 | |
| |
CPM Holdings, Inc., Sr. Sec. Credit Facilities 1st Lien Term Loan, Tranche B, 6.25%, 8/29/171 | | | 19,760,367 | | | | 19,908,569 | |
| |
International Equipment Solutions LLC, Sr. Sec. Credit Facilities 1st Lien Term Loan, Tranche B, 6.75%, 8/16/191 | | | 33,721,593 | | | | 33,932,353 | |
| |
Milacron LLC, Sr. Sec. Credit Facilities 1st Lien Term Loan, Tranche B, 4.00%, 3/28/201 | | | 39,051,372 | | | | 39,039,188 | |
| |
Pelican Products, Inc., Sr. Sec. Credit Facilities 1st Lien Term Loan, Tranche B, 5.25%, 4/8/201 | | | 21,969,938 | | | | 22,189,637 | |
| |
RBS Global, Inc., Sr. Sec. Credit Facilities 1st Lien Term Loan, Tranche B, 4.00%, 8/21/201 | | | 81,136,875 | | | | 81,080,566 | |
| |
Veyance Technologies, Inc., Sr. Sec. Credit Facilities 1st Lien Term Loan, 5.25%, 9/8/171 | | | 74,130,047 | | | | 74,280,161 | |
| | | | | | | | |
| | | | | | | 473,302,600 | |
27 OPPENHEIMER SENIOR FLOATING RATE FUND
|
|
| STATEMENT OF INVESTMENTS Continued |
| | | | | | | | |
| | | Principal
Amount | | | Value | |
| |
Marine—0.6% | | | | | | | | |
| |
Commercial Barge Line Co., Sr. Sec. Credit Facilities 1st Lien Term Loan, Tranche B, 7.50%, 9/22/191 | | $ | 33,676,234 | | | $ | 33,928,806 | |
| |
Navistar, Inc., Sr. Sec. Credit Facilities 1st Lien Term Loan, Tranche B, 5.75%, 8/17/171 | | | 48,350,000 | | | | 48,924,156 | |
| |
Overseas Shipholding, Sr. Sec. Credit Facilities 1st Lien Exit Term Loan, Tranche B, 5.25%, 3/7/191 | | | 27,500,000 | | | | 27,603,125 | |
| |
Swift Transportation Co. LLC, Sr. Sec. Credit Facilities 1st Lien Term Loan, Tranche B, 3.75%, 6/4/211 | | | 14,962,500 | | | | 15,004,589 | |
| | | | | | | | |
| | | | | | | 125,460,676 | |
| | | | | | | | |
| |
Road & Rail—0.4% | | | | | | | | |
| |
Wabash National Corp., Sr. Sec. Credit Facilities 1st Lien Term Loan, Tranche B, 4.50%, 5/8/191 | | | 24,350,759 | | | | 24,404,039 | |
| |
YRC Worldwide, Inc., Sr. Sec. Credit Facilities 1st Lien Term Loan, 8.00%, 2/13/191 | | | 53,965,147 | | | | 54,976,993 | |
| | | | | | | | |
| | | | | | | 79,381,032 | |
| | | | | | | | |
| |
Trading Companies & Distributors—1.5% | | | | | | | | |
| |
Home Loan Servicing Solutions, Sr. Sec. Credit Facilities 1st Lien Term Loan, Tranche B, 4.50%, 6/26/201 | | | 32,437,350 | | | | 32,589,416 | |
| |
iStar Financial, Inc., Sr. Sec. Credit Facilities 1st Lien Term Loan, Tranche A2, 7.00%, 3/19/171 | | | 50,632,634 | | | | 52,404,776 | |
| |
Ocwen Financial Corp., Sr. Sec. Credit Facilities 1st Lien Term Loan, 5.00%, 2/15/181 | | | 51,113,206 | | | | 51,330,437 | |
| |
Orchard Acquisition Co., Sr. Sec. Credit Facilities 1st Lien Term Loan, Tranche B, 7.00%, 2/8/191 | | | 42,292,087 | | | | 42,344,952 | |
| |
Walter Investment Management Corp., Sr. Sec. Credit Facilities 1st Lien Term Loan, 4.75%, 12/11/201 | | | 130,862,613 | | | | 129,349,580 | |
| | | | | | | | |
| | | | | | | 308,019,161 | |
| |
Information Technology—6.4% | | | | | | | | |
| |
Communications Equipment—0.2% | | | | | | | | |
| |
Birch Communications, Inc., Sr. Sec. Credit Facilities 1st Lien Term Loan, Tranche B, 7.25%, 7/17/201 | | | 41,625,000 | | | | 41,000,625 | |
| | | | | | | | |
| |
Electronic Equipment, Instruments, & Components—0.7% | | | | | | | | |
| |
Aeroflex, Inc., Sr. Sec. Credit Facilities 1st Lien Term Loan, Tranche B1, 4.50%, 11/9/191 | | | 24,096,610 | | | | 24,191,984 | |
| |
Aricent Technologies, Sr. Sec. Credit Facilities 1st Lien Term Loan, 5.50%, 4/14/211 | | | 41,585,000 | | | | 41,922,878 | |
| |
Aricent Technologies, Sr. Sec. Credit Facilities 2nd Lien Term Loan, 9.50%, 4/14/221 | | | 18,480,000 | | | | 18,456,900 | |
| |
Kronos, Inc., Sr. Sec. Credit Facilities 1st Lien Term Loan, 4.50%, 10/30/191 | | | 39,746,147 | | | | 39,944,878 | |
| |
Kronos, Inc., Sr. Sec. Credit Facilities 2nd Lien Term Loan, Tranche B, 9.75%, 4/30/201 | | | 13,744,451 | | | | 14,251,277 | |
| | | | | | | | |
| | | | | | | 138,767,917 | |
| | | | | | | | |
| |
Internet Software & Services—1.5% | | | | | | | | |
| |
Active Network, Inc. (The), Sr. Sec. Credit Facilities 1st Lien Term Loan, 5.50%, 11/13/201 | | | 39,635,901 | | | | 39,404,705 | |
28 OPPENHEIMER SENIOR FLOATING RATE FUND
| | | | | | | | |
| | | Principal
Amount | | | Value | |
| |
Internet Software & Services (Continued) | | | | | | | | |
| |
Active Network, Inc. (The), Sr. Sec. Credit Facilities 2nd Lien Term Loan, 9.50%, 11/15/211 | | $ | 10,515,000 | | | $ | 10,488,713 | |
| |
Avaya, Inc., Extended Sr. Sec. Credit Facilities 1st Lien Term Loan, Tranche B3, 4.762%, 10/26/171 | | | 39,613,896 | | | | 38,413,120 | |
| |
Avaya, Inc., Sr. Sec. Credit Facilities 1st Lien Term Loan, Tranche B6, 6.50%, 3/31/181 | | | 45,374,958 | | | | 45,176,443 | |
| |
Blue Coat Systems, Inc., Sr. Sec. Credit Facilities 2nd Lien Term Loan, 9.50%, 6/26/201 | | | 5,800,000 | | | | 5,937,750 | |
| |
Blue Coat Systems, Inc., Sr. Sec. Credit Facilities Term Loan, 4.00%, 5/31/191 | | | 31,113,160 | | | | 31,145,580 | |
| |
Hyland Software, Inc., Sr. Sec. Credit Facilities Term Loan, Tranche B, 4.75%, 2/18/211 | | | 27,486,441 | | | | 27,652,514 | |
| |
Mitchell International, Inc., Sr. Sec. Credit Facilities 1st Lien Term Loan, Tranche B, 4.50%, 10/12/201 | | | 32,188,250 | | | | 32,248,603 | |
| |
Mitchell International, Inc., Sr. Sec. Credit Facilities 2nd Lien Term Loan, 8.50%, 10/11/211 | | | 23,162,360 | | | | 23,538,748 | |
| |
Renaissance Learning, Inc., Sr. Sec. Credit Facilities 1st Lien REV Term Loan, 8.00%, 4/1/221 | | | 18,622,000 | | | | 18,536,655 | |
| |
Renaissance Learning, Inc., Sr. Sec. Credit Facilities 1st Lien Term Loan, 4.50%, 4/2/211 | | | 28,461,188 | | | | 28,449,319 | |
| | | | | | | | |
| | | | | | | 300,992,150 | |
| | | | | | | | |
| |
IT Services—0.4% | | | | | | | | |
| |
Telx Group, Inc. (The), Sr. Sec. Credit Facilities 1st Lien Term Loan, Tranche B, 4.50%, 4/9/201 | | | 18,565,000 | | | | 18,565,000 | |
| |
Telx Group, Inc. (The), Sr. Sec. Credit Facilities 2nd Lien Term Loan, 7.50%, 4/9/211 | | | 5,570,000 | | | | 5,576,962 | |
| |
Vetafore, Inc., Sr. Sec. Credit Facilities 1st Lien Term Loan, 4.25%, 10/3/191 | | | 58,869,906 | | | | 58,980,288 | |
| | | | | | | | |
| | | | | | | 83,122,250 | |
| | | | | | | | |
| |
Office Electronics—0.9% | | | | | | | | |
| |
BMC Foreign Holding, Sr. Sec. Credit Facilities 1st Lien Term Loan, Tranche B, 5.00%, 9/10/201 | | | 25,074,013 | | | | 24,870,286 | |
| |
BMC Software Finance, Inc., Sr. Sec. Credit Facilities 1st Lien Term Loan, Tranche B, 5.00%, 9/10/201 | | | 166,862,391 | | | | 166,002,049 | |
| | | | | | | | |
| | | | | | | 190,872,335 | |
| | | | | | | | |
| |
Software—1.9% | | | | | | | | |
| |
Aptean, Inc., Sr. Sec. Credit Facilities 1st Lien Term Loan, Tranche B, 5.25%, 2/21/201 | | | 25,905,075 | | | | 25,986,028 | |
| |
Aptean, Inc., Sr. Sec. Credit Facilities 2nd Lien Term Loan, 8.50%, 2/19/211 | | | 9,275,000 | | | | 9,390,938 | |
| |
Blackboard, Inc., Sr. Sec. Credit Facilities 1st Lien Term Loan, Tranche B3, 4.75%, 10/4/181 | | | 69,313,223 | | | | 69,672,196 | |
| |
Deltek, Inc., Sr. Sec. Credit Facilities 1st Lien Term Loan, 4.50%, 10/10/181 | | | 61,281,099 | | | | 61,616,245 | |
| |
Deltek, Inc., Sr. Sec. Credit Facilities 2nd Lien Term Loan, 10.00%, 10/10/191 | | | 14,560,000 | | | | 14,887,600 | |
| |
Infor US, Inc., Sr. Sec. Credit Facilities 1st Lien Term Loan, Tranche B5, 3.75%, 6/3/201 | | | 62,779,169 | | | | 62,347,562 | |
29 OPPENHEIMER SENIOR FLOATING RATE FUND
|
|
| STATEMENT OF INVESTMENTS Continued |
| | | | | | | | |
| | | Principal
Amount | | | Value | |
| |
Software (Continued) | | | | | | | | |
| |
RP Crown Parent LLC, Sr. Sec. Credit Facilities 1st Lien Term Loan, Tranche B, 6.00%, 12/21/181 | | $ | 99,012,534 | | | $ | 99,492,151 | |
| |
RP Crown Parent LLC, Sr. Sec. Credit Facilities 2nd Lien Term Loan, 11.25%, 12/21/191 | | | 21,105,000 | | | | 21,242,182 | |
| |
Sybil Finance BV, Sr. Sec. Credit Facilities 1st Lien Term Loan, 5.00%, 3/18/201 | | | 30,928,500 | | | | 30,992,924 | |
| | | | | | | | |
| | | | | | | 395,627,826 | |
| | | | | | | | |
| |
Technology Hardware, Storage & Peripherals—0.8% | | | | | | | | |
| |
Dell International LLC, Sr. Sec. Credit Facilities 1st Lien Term Loan, Tranche B, 4.50%, 4/29/201 | | | 172,262,056 | | | | 172,755,243 | |
| | | | | | | | |
| |
Materials—10.0% | | | | | | | | |
| |
Chemicals—4.2% | | | | | | | | |
| |
Allnex Luxembourg & CY SCA, Sr. Sec. Credit Facilities 1st Lien Term Loan: | | | | | | | | |
Tranche B1, 4.50%, 10/4/191 | | | 16,208,584 | | | | 16,249,105 | |
Tranche B2, 4.50%, 10/4/191 | | | 8,409,855 | | | | 8,430,880 | |
| |
American Pacific Corp., Sr. Sec. Credit Facilities 1st Lien Term Loan, Tranche B, 7.00%, 2/26/191 | | | 23,127,038 | | | | 23,473,943 | |
| |
Arysta Lifescience SPC LLC, Sr. Sec. Credit Facilities 1st Lien Term Loan, 4.50%, 5/29/201 | | | 51,052,884 | | | | 51,074,173 | |
| |
Ashland Water, Sr, Sec. Credit Facilities 1st Lien Term Loan, 4.25%, 7/2/211 | | | 36,830,000 | | | | 36,561,436 | |
| |
Axalta Coating Systems U.S. Holdings/Dutch Holdings BV, Sr. Sec. Credit Facilities 1st Lien Term Loan, Tranche B, 4.00%, 2/1/201 | | | 61,618,361 | | | | 61,387,292 | |
| |
AZ Chem US, Inc., Sr. Sec. Credit Facilities 1st Lien Term Loan, Tranche B, 4.50%, 6/10/211 | | | 4,732,596 | | | | 4,774,744 | |
| |
CeramTec Acquisition Corp., Sr. Sec. Credit Facilities 1st Lien Term Loan, Tranche B2, 4.25%, 8/28/201 | | | 2,928,114 | | | | 2,934,826 | |
| |
CeramTec Service GmbH, Sr. Sec. Credit Facilities 1st Lien Term Loan, Tranche B, 4.25%, 8/28/201 | | | 38,502,124 | | | | 38,590,371 | |
| |
Cyanco Intermediate Corp., Sr. Sec. Credit Facilities 1st Lien Term Loan, Tranche B, 5.50%, 5/1/201 | | | 41,441,729 | | | | 41,661,909 | |
| |
Emerald Performance Materials LLC, Sr. Sec. Credit Facilities 1st Lien Term Loan, 4.50%, 7/23/211 | | | 32,135,000 | | | | 32,135,000 | |
| |
Emerald Performance Materials LLC, Sr. Sec. Credit Facilities 2nd Lien Term Loan, 7.75%, 7/23/221 | | | 6,885,000 | | | | 6,895,761 | |
| |
Ineos US Finance LLC, Sr. Sec. Credit Facilities 1st Lien Term Loan, Tranche B, 3.75%, 5/4/181 | | | 39,851,718 | | | | 39,712,954 | |
| |
IPC Systems, Inc., Sr. Sec. Credit Facilities 1st Lien Term Loan, 6.00%, 11/9/201 | | | 47,520,000 | | | | 47,817,000 | |
| |
Nexeo Solutions LLC, Sr. Sec. Credit Facilities 1st Lien Term Loan: | | | | | | | | |
Tranche B1, 5.00%, 9/8/171 | | | 8,462,625 | | | | 8,473,203 | |
Tranche B2, 5.00%, 9/9/171 | | | 15,570,336 | | | | 15,583,306 | |
Tranche B3, 5.00%, 9/9/171 | | | 13,835,475 | | | | 13,887,358 | |
| |
Nusil Technology LLC, Sr. Sec. Credit Facilities 1st Lien Term Loan, Tranche B, 5.25%, 4/7/171 | | | 24,761,493 | | | | 24,359,119 | |
| |
OCI Beaumont LLC, Sr. Sec. Credit Facilities 1st Lien Term Loan, Tranche B3, 5.00%, 8/20/191 | | | 42,881,845 | | | | 43,471,471 | |
| |
OXEA Sarl, Sr. Sec. Credit Facilities 1st Lien Term Loan, Tranche B2, 4.25%, 1/15/201 | | | 47,367,473 | | | | 47,397,078 | |
| |
30 OPPENHEIMER SENIOR FLOATING RATE FUND
| | | | | | | | |
| | | Principal
Amount | | | Value | |
| |
Chemicals (Continued) | | | | | | | | |
| |
OXEO Sarl, Sr. Sec. Credit Facilities 2nd Lien Term Loan, 8.25%, 7/15/201 | | $ | 8,880,000 | | | $ | 8,968,800 | |
| |
PQ Corp., Sr. Sec. Credit Facilities 1st Lien Term Loan, Tranche B, 4.00%, 8/7/171 | | | 65,289,859 | | | | 65,422,463 | |
| |
Road Infrastructure Investment, Sr. Sec. Credit Facilities 1st Lien Term Loan, 4.25%, 3/19/211 | | | 25,644,625 | | | | 25,640,625 | |
| |
Royal Adhesives & Sealants LLC, Sr. Sec. Credit Facilities 1st Lien Term Loan, Tranche B, 5.50%, 7/31/181 | | | 33,920,462 | | | | 34,174,865 | |
| |
Royal Adhesives & Sealants LLC, Sr. Sec. Credit Facilities 2nd Lien Term Loan, 9.75%, 1/31/191 | | | 5,225,000 | | | | 5,331,679 | |
| |
Tronox, Inc., Sr. Sec. Credit Facilities 1st Lien Term Loan, Tranche B, 4.00%, 3/19/201 | | | 87,290,026 | | | | 87,408,216 | |
| |
Univar, Inc., Sr. Sec. Credit Facilities 1st Lien Term Loan, 4.50%-5.00%, 6/30/171 | | | 71,587,002 | | | | 71,765,969 | |
| | | | | | | | |
| | | | | | | 863,583,546 | |
| | | | | | | | |
| |
Construction Materials—1.5% | | | | | | | | |
| |
Atkore, Sr. Sec. Credit Facilities 1st Lien Term Loan, 4.50%, 3/26/211 | | | 36,840,000 | | | | 36,809,312 | |
| |
Atkore, Sr. Sec. Credit Facilities 2nd Lien Term Loan, 7.75%, 9/27/211 | | | 18,420,000 | | | | 18,396,975 | |
| |
Continental Building Products LLC, Sr. Sec. Credit Facilities 1st Lien Term Loan, Tranche B, 4.25%, 8/28/201 | | | 45,776,439 | | | | 45,509,425 | |
| |
CPG International, Inc., Sr. Sec. Credit Facilities Term Loan, 4.75%, 9/30/201 | | | 34,737,500 | | | | 34,780,922 | |
| |
GYP Holdings, Sr. Sec. Credit Facilities 1st Lien Term Loan, 4.75%, 3/27/211 | | | 36,104,513 | | | | 35,856,294 | |
| |
HD Supply, Inc., Sr. Sec. Credit Facilities 1st Lien Term Loan, 4.00%, 6/28/181 | | | 38,751,820 | | | | 38,782,976 | |
| |
Quikrete Cos., Inc. (The), Sr. Sec. Credit Facilities 1st Lien Term Loan, Tranche B, 4.00%, 9/26/201 | | | 82,848,938 | | | | 82,974,702 | |
| |
Quikrete Cos., Inc. (The), Sr. Sec. Credit Facilities 2nd Lien Term Loan, 7.00%, 3/26/211 | | | 9,530,000 | | | | 9,744,425 | |
| | | | | | | | |
| | | | | | | 302,855,031 | |
| | | | | | | | |
| |
Containers & Packaging—1.3% | | | | | | | | |
| |
Ardagh Holdings USA, Inc., Sr. Sec. Credit Facilities 1st Lien Term Loan, Delayed Draw, Tranche B, 4.00%, 12/17/191 | | | 36,478,575 | | | | 36,508,962 | |
| |
Berry Plastics Group, Inc., Sr. Sec. Credit Facilities 1st Lien Term Loan, Tranche E, 3.75%, 1/6/211 | | | 46,229,138 | | | | 45,907,706 | |
| |
Caraustar Industries, Inc., Sr. Sec. Credit Facilities 1st Lien Term Loan, Tranche B, 7.50%, 5/1/191 | | | 13,874,958 | | | | 14,019,493 | |
| |
Consolidated Container Holdings LLC, Sr. Sec. Credit Facilities 1st Lien Term Loan, Tranche B, 5.00%, 7/3/191 | | | 34,742,508 | | | | 34,887,280 | |
| |
Exopack LLC/Cello-Foil Products, Inc., Sr. Sec. Credit Facilities 1st Lien Term Loan, Tranche B, 5.25%, 5/8/191 | | | 33,173,300 | | | | 33,636,333 | |
| |
Expera Specialty Solutions LLC, Sr. Sec. Credit Facilities 1st Lien Term Loan, 7.50%, 12/21/181 | | | 37,125,000 | | | | 37,589,063 | |
| |
NewPage Corp., Sr. Sec. Credit Facilities 1st Lien Term Loan, 9.50%, 2/5/211 | | | 55,165,000 | | | | 55,394,652 | |
31 OPPENHEIMER SENIOR FLOATING RATE FUND
|
|
| STATEMENT OF INVESTMENTS Continued |
| | | | | | | | |
| | | Principal
Amount | | | Value | |
| |
Containers & Packaging (Continued) | | | | | | | | |
| |
Xerium Technologies, Inc., Sr. Sec. Credit Facilities 1st Lien Term Loan, Tranche B, 5.75%, 5/17/191 | | $ | 12,903,500 | | | $ | 13,012,380 | |
| | | | | | | | |
| | | | | | | 270,955,869 | |
| | | | | | | | |
| |
Metals & Mining—2.1% | | | | | | | | |
| |
Arch Coal, Inc., Sr. Sec. Credit Facilities 1st Lien Term Loan, 6.25%, 5/16/181 | | | 53,240,019 | | | | 52,374,869 | |
| |
Bowie Resources Ltd., Sr. Sec. Credit Facilities 1st Lien Term Loan, Tranche B, 6.75%, 8/16/201 | | | 19,250,000 | | | | 19,394,375 | |
| |
Fairmount Minerals Ltd., Sr. Sec. Credit Facilities 1st Lien Term Loan, Tranche B2, 4.50%, 9/5/191 | | | 95,402,417 | | | | 96,217,345 | |
| |
FMG Resources August 2006 Pty Ltd., Sr. Sec. Credit Facilities 1st Lien Term Loan, Tranche B, 3.75%, 6/28/191 | | | 75,475,297 | | | | 75,347,970 | |
| |
Foresight Energy LLC, Sr. Sec. Credit Facilities 1st Lien Term Loan, Tranche B, 5.50%, 8/21/201 | | | 21,133,333 | | | | 21,344,667 | |
| |
Murray Energy Corp., Sr. Sec. Credit Facilities 1st Lien Term Loan, Tranche B, 5.25%, 12/5/191 | | | 61,909,838 | | | | 62,470,926 | |
| |
Norander Aluminum Acquisition Corp., Sr. Sec. Credit Facilities 1st Lien Term Loan, Tranche B, 5.75%, 2/28/191 | | | 32,715,402 | | | | 31,883,874 | |
| |
Peabody Energy Corp., Sr. Sec. Credit Facilities 1st Lien Term Loan, Tranche B, 4.25%, 9/24/201 | | | 49,625,000 | | | | 49,664,898 | |
| |
Walter Industries, Inc., Sr. Sec. Credit Facilities 1st Lien Term Loan, Tranche B, 7.25%, 4/2/181 | | | 33,673,561 | | | | 31,973,046 | |
| | | | | | | | |
| | | | | | | 440,671,970 | |
| | | | | | | | |
| |
Paper & Forest Products—0.9% | | | | | | | | |
| |
Appvion, Inc., Sr. Sec. Credit Facilities 1st Lien Term Loan, Tranche B, 5.75%, 6/28/191 | | | 55,821,150 | | | | 56,414,250 | |
| |
Berlin Packaging LLC, Sr. Sec. Credit Facilities 1st Lien Term Loan, 4.75%, 4/2/191 | | | 19,662,528 | | | | 19,805,907 | |
| |
Berlin Packaging LLC, Sr. Sec. Credit Facilities 2nd Lien Term Loan, 8.75%, 4/2/201 | | | 5,165,000 | | | | 5,295,199 | |
| |
Signode Industrial Group US, Inc., Sr. Sec. Credit Facilities 1st Lien Term Loan, Tranche B, 4.00%, 4/30/211 | | | 44,601,354 | | | | 44,443,376 | |
| |
Tekni-Plex, Inc., Sr. Sec. Credit Facilities 1st Lien Term Loan, 4.75%-6.00%, 8/10/191 | | | 56,319,543 | | | | 56,319,543 | |
| | | | | | | | |
| | | | | | | 182,278,275 | |
| | | | | | | | |
| |
Telecommunication Services—3.4% | | | | | | | | |
| |
Diversified Telecommunication Services—3.2% | | | | | | | | |
| |
Cincinnati Bell, Sr. Sec. Credit Facilities 1st Lien Term Loan, Tranche B, 4.00%, 9/10/201 | | | 53,095,019 | | | | 53,050,791 | |
| |
Fairpoint Communications, Inc., Sr. Sec. Credit Facilities 1st Lien Term Loan, Tranche B, 7.50%, 2/14/191 | | | 62,961,837 | | | | 64,981,841 | |
| |
Global Tel Link Corp., Sr. Sec. Credit Facilities 1st Lien Term Loan, 5.00%, 5/22/201 | | | 46,756,241 | | | | 46,590,631 | |
| |
Global Tel Link Corp., Sr. Sec. Credit Facilities 2nd Lien Term Loan, 9.00%, 11/23/201 | | | 25,000,000 | | | | 24,898,450 | |
| |
Greenneden US Holdings II LLC, Sr. Sec. Credit Facilities 1st Lien Term Loan, 4.50%, 11/13/201 | | | 24,875,000 | | | | 24,929,103 | |
| |
Integra Telecom, Inc., Sr. Sec. Credit Facilities 1st Lien Term Loan, 5.25%, 2/22/191 | | | 25,670,063 | | | | 25,827,292 | |
32 OPPENHEIMER SENIOR FLOATING RATE FUND
| | | | | | | | |
| | | Principal
Amount | | | Value | |
| |
Diversified Telecommunication Services (Continued) | | | | | | | | |
| |
Integra Telecom, Inc., Sr. Sec. Credit Facilities 2nd Lien Term Loan, 9.75%, 2/21/201 | | $ | 8,000,000 | | | $ | 8,176,000 | |
| |
IPC Systems, Inc., Sr. Sec. Credit Facilities 2nd Lien Term Loan, 9.50%, 5/10/211 | | | 24,285,000 | | | | 24,269,822 | |
| |
Level 3 Financing, Inc., Sr. Sec. Credit Facilities 1st Lien Term Loan: | | | | | | | | |
Tranche BI, 4.00%, 1/15/201 | | | 104,580,000 | | | | 104,482,008 | |
Tranche BIII, 4.00%, 8/1/191 | | | 8,865,000 | | | | 8,856,693 | |
| |
LTS Buyer LLC, Sr. Sec. Credit Facilities 1st Lien Term Loan, Tranche B, 4.00%, 4/13/201 | | | 85,756,614 | | | | 85,568,464 | |
| |
LTS Buyer LLC, Sr. Sec. Credit Facilities 2nd Lien Term Loan, 8.00%, 4/12/211 | | | 14,185,041 | | | | 14,374,171 | |
| |
Securus Technologies Holdings, Sr. Sec. Credit Facilities 1st Lien Term Loan, Tranche B2, 4.75%, 4/30/201 | | | 35,561,291 | | | | 35,635,365 | |
| |
Securus Technologies Holdings, Sr. Sec. Credit Facilities 2nd Lien Term Loan, 9.00%, 4/30/211 | | | 15,245,000 | | | | 15,441,920 | |
| |
US TelePacific Corp., Sr. Sec. Credit Facilities 1st Lien Term Loan, Tranche B, 5.75%, 2/23/171 | | | 43,423,503 | | | | 43,613,481 | |
| |
XO Communications, Sr. Sec. Credit Facilities 1st Lien Term Loan, 4.25%, 3/22/221 | | | 37,037,175 | | | | 37,195,916 | |
| |
Zayo Group LLC, Sr. Sec. Credit Facilities 1st Lien Term Loan, Tranche B, 4.00%, 7/2/191 | | | 45,402,738 | | | | 45,250,230 | |
| | | | | | | | |
| | | | | | | 663,142,178 | |
| | | | | | | | |
| |
Wireless Telecommunication Services—0.2% | | | | | | | | |
| |
NTELOS, Inc., Sr. Sec. Credit Facilities 1st Lien Term Loan, Tranche B, 5.75%, 11/9/191 | | | 48,389,510 | | | | 48,449,610 | |
| | | | | | | | |
| |
Utilities—2.5% | | | | | | | | |
| |
Electric Utilities—2.2% | | | | | | | | |
| |
Alinta Energy Finance Pty Ltd., Sr. Sec. Credit Facilities 1st Lien Term Loan, Tranche B, 6.375%, 8/13/191 | | | 90,861,099 | | | | 92,138,879 | |
| |
Alinta Energy Finance Pty Ltd., Sr. Sec. Credit Facilities 1st Lien Term Loan, Delayed Draw, Tranche B, 0.50%, 8/13/181 | | | 5,989,102 | | | | 6,073,274 | |
| |
Atlantic Power LP, Sr. Sec. Credit Facilities 1st Lien Term Loan, 4.75%, 2/20/211 | | | 30,910,502 | | | | 31,258,245 | |
| |
Energy Future Intermediate Holding Co. LLC, Sr. Sec. Credit Facilities 1st Lien Term Loan, Debtor in Possession, 4.25%, 6/6/161 | | | 32,730,000 | | | | 32,873,194 | |
| |
Energy Future Intermediate Holding Co. LLC, Sr. Sec. Credit Facilities 1st Lien Term Loan, Delayed Draw, 4.25%, 6/6/161 | | | 27,540,000 | | | | 27,660,488 | |
| |
Intergen NV, Sr. Sec. Credit Facilities 1st Lien Term Loan, 5.50%, 6/15/201 | | | 39,600,000 | | | | 39,913,513 | |
| |
LA Frontera Generation LLC, Sr. Sec. Credit Facilities 1st Lien Term Loan, 4.50%, 9/30/201 | | | 43,534,565 | | | | 43,725,029 | |
| |
Moxie Liberty LLC, Sr. Sec. Credit Facilities 1st Lien Term Loan, Tranche B1, 7.50%, 8/21/201 | | | 36,000,000 | | | | 37,170,000 | |
| |
Moxie Patriot LLC, Sr. Sec. Credit Facilities 1st Lien Term Loan, Tranche B1, 6.75%, 12/19/201 | | | 23,985,000 | | | | 24,764,512 | |
| |
Sandy Creek Energy Associates LP, Sr. Sec. Credit Facilities 1st Lien Term Loan, Tranche B, 5.00%, 11/9/201 | | | 73,307,927 | | | | 73,926,499 | |
| |
Texas Competitive Electric Holdings Co. LLC, Extended Sr. Sec. Credit Facilities 1st Lien Term Loan, 4.736%, 10/10/171,2 | | | 9,335,000 | | | | 7,117,937 | |
33 OPPENHEIMER SENIOR FLOATING RATE FUND
| | |
| |
| STATEMENT OF INVESTMENTS Continued | | |
| | | | | | | | |
| | | Principal
Amount | | | Value | |
| |
Electric Utilities (Continued) | | | | | | | | |
| |
Texas Competitive Electric Holdings Co. LLC, Sr. Sec. Credit Facilities 1st Lien Term Loan, Debtor in Possession, 4.00%, 4/28/161 | | $ | 17,810,000 | | | $ | 17,907,403 | |
| |
Texas Competitive Electric Holdings Co. LLC, Sr. Sec. Credit Facilities 1st Lien Term Loan, Delayed Draw, 3.75%, 4/28/161 | | | 26,059,540 | | | | 26,202,059 | |
| | | | | | | | |
| | | | | | | 460,731,032 | |
| | | | | | | | |
| |
Gas Utilities—0.1% | | | | | | | | |
| |
Panda Temple Power II LLC, Sr. Sec. Credit Facilities 1st Lien Term Loan, Tranche B, 7.25%, 4/3/191 | | | 25,090,000 | | | | 25,905,425 | |
| | | | | | | | |
| |
Independent Power and Renewable Electricity Producers—0.2% | | | | | | | | |
| |
Dynegy, Inc., Sr. Sec. Credit Facilities 1st Lien Term Loan, Tranche B2, 4.00%, 4/23/201 | | | 40,542,646 | | | | 40,580,664 | |
| | | | | | | | |
Total Corporate Loans (Cost $20,416,149,423) | | | | | | | 20,434,569,874 | |
| | | | | | | | |
| |
Corporate Bonds and Notes—0.1% | | | | | | | | |
| |
Erickson Air-Crane, Inc., 6% Sub. Nts., 11/2/20 | | | 2,744,300 | | | | 2,406,047 | |
| |
Western Express, Inc., 12.50% Sr. Sec. Nts., 4/15/155 | | | 21,760,000 | | | | 18,550,400 | |
| | | | | | | | |
Total Corporate Bonds and Notes (Cost $21,140,578) | | | | | | | 20,956,447 | |
| | | | | | | | |
| | |
| | | Shares | | | | |
| |
Preferred Stock—0.0% | | | | | | | | |
| |
Alpha Media Group, Inc., Preferred4,6 (Cost $—) | | | 1,145 | | | | — | |
| | | | | | | | |
| |
Common Stocks—0.8% | | | | | | | | |
| |
Alpha Media Group, Inc.4,6 | | | 8,587 | | | | — | |
| |
Cinram International Income Fund6 | | | 17,849,008 | | | | — | |
| |
Eningen Realty, Inc.6 | | | 1,642 | | | | 7,184 | |
| |
ION Media Networks, Inc.6 | | | 35,695 | | | | 9,245,005 | |
| |
Mach Gen LLC | | | 313,469 | | | | 15,830,184 | |
| |
Media General, Inc.4,6 | | | 6,819,744 | | | | 137,486,039 | |
| |
Precision Partners6 | | | 185 | | | | 32,233 | |
| |
Revel Entertainment, Inc.6 | | | 365,409 | | | | — | |
| | | | | | | | |
Total Common Stocks (Cost $112,645,509) | | | | | | | 162,600,645 | |
| | | | | | | | |
| |
Investment Companies—4.1% | | | | | | | | |
| |
Oppenheimer Institutional Money Market Fund, Cl. E, 0.09%4,7 | | | 740,758,943 | | | | 740,758,943 | |
| |
Oppenheimer Ultra-Short Duration Fund, Cl. Y4 | | | 10,026,390 | | | | 100,464,427 | |
| | | | | | | | |
Total Investment Companies (Cost $841,223,415) | | | | | | | 841,223,370 | |
| | | | | | | | |
| |
Total Investments, at Value (Cost $21,391,158,925) | | | 103.6 | % | | | 21,459,350,336 | |
| |
Net Other Assets (Liabilities) | | | (3.6 | ) | | | (742,598,926 | ) |
| | | | |
Net Assets | | | 100.0 | % | | $ | 20,716,751,410 | |
| | | | |
34 OPPENHEIMER SENIOR FLOATING RATE FUND
Footnotes to Statement of Investments
1. Represents the current interest rate for a variable or increasing rate security.
2. This security is not accruing income because the issuer has missed an interest payment on it and/or is not anticipated to make future interest and or principal payments. The rate shown is the original contractual interest rate. See Note 1 of the accompanying Notes.
3. Interest or dividend is paid-in-kind, when applicable.
4. Is or was an affiliate, as defined in the Investment Company Act of 1940, at or during the period ended July 31, 2014, by virtue of the Fund owning at least 5% of the voting securities of the issuer or as a result of the Fund and the issuer having the same investment adviser. Transactions during the period in which the issuer was an affiliate are as follows:
| | | | | | | | | | | | | | | | |
| | | Shares/Principal
July 31, 2013 | | | Gross
Additions | | | Gross
Reductions | | | Shares/Principal
July 31, 2014 | |
| |
Alpha Media Group, Inc. | | | 8,587 | | | | — | | | | — | | | | 8,587 | |
Alpha Media Group, Inc., Preferred | | | 1,145 | | | | — | | | | — | | | | 1,145 | |
| Alpha Media Group, Inc., Sr. Sec. Credit Facilities Term Loan, 3.05%, 7/15/16 | | | 25,238,104 | | | | 3,213,053 | | | | 458,390 | | | | 27,992,767 | |
Media General, Inc. | | | — | | | | 6,819,744 | a | | | — | | | | 6,819,744 | |
Oppenheimer Institutional Money Market Fund, Cl. E | | | 1,101,188,372 | | | | 6,172,194,921 | | | | 6,532,624,350 | | | | 740,758,943 | |
Oppenheimer Ultra-Short Duration Fund, Cl. Y | | | 7,501,219 | | | | 2,525,193 | | | | 22 | | | | 10,026,390 | |
| | | | | | | | | | | | |
| | | Value | | | Income | | | Realized Gain | |
| |
Alpha Media Group, Inc. | | $ | — | | | $ | — | | | $ | — | |
Alpha Media Group, Inc., Preferred | | | — | | | | — | | | | — | |
Alpha Media Group, Inc., Sr. Sec. Credit Facilities Term Loan, 3.05%, 7/15/16 | | | 2,799 | | | | 79,079 | | | | 134,868 | |
Media General, Inc. | | | 137,486,039 | | | | — | | | | — | |
Oppenheimer Institutional Money Market Fund, Cl. E | | | 740,758,943 | | | | 533,432 | | | | — | |
Oppenheimer Ultra-Short Duration Fund, Cl. Y | | | 100,464,427 | | | | 304,197 | | | | — | |
| | | | |
Total | | $ | 978,712,208 | | | $ | 916,708 | | | $ | 134,868 | |
| | | | |
a. All or a portion is the result of a corporate action.
5. Restricted security. The aggregate value of restricted securities as of July 31, 2014 was $ 18,550,400, which represents 0.09% of the Fund’s net assets. See Note 7 of the accompanying Notes. Information concerning restricted securities is as follows:
| | | | | | | | | | | | | | | | |
| Security | | Acquisition
Dates | | | Cost | | | Value | | | Unrealized
Depreciation | |
| |
Western Express, Inc., 12.50% Sr. Sec. Nts., 4/15/15 | | | 9/18/12-5/20/14 | | | $ | 18,615,387 | | | $ | 18,550,400 | | | $ | 64,987 | |
6. Non-income producing security.
7. Rate shown is the 7-day yield as of July 31, 2014.
| | | | | | | | | | | | | | | | | | | | | | | | |
| |
| Over-the-Counter Total Return Swaps at July 31, 2014 | |
| Reference Asset | | Counterparty | | | Pay/Receive
Total
Return | | | Floating Rate | | | Maturity
Date | | | Notional Amount
(000’s) | | | Value | |
| |
iBoxx USD Liquid
Leveraged Loans Index | | | JPM | | | | Pay | | |
| Three-Month
USD BBA LIBOR |
| | | 9/25/14 | | | | USD 5,000 | | | $ | (60,459) | |
35 OPPENHEIMER SENIOR FLOATING RATE FUND
|
|
| STATEMENT OF INVESTMENTS Continued |
Glossary:
Counterparty Abbreviations
JPM JPMorgan Chase Bank NA
Definitions
BBA LIBOR British Bankers’ Association London - Interbank Offered Rate
See accompanying Notes to Financial Statements.
36 OPPENHEIMER SENIOR FLOATING RATE FUND
STATEMENTOF ASSETS AND LIABILITIES July 31, 2014
| | | | |
Assets | | | | |
Investments, at value—see accompanying statement of investments: | | | | |
Unaffiliated companies (cost $20,499,250,606) | | $ | 20,480,638,128 | |
Affiliated companies (cost $891,908,319) | | | 978,712,208 | |
| | | | |
| | | 21,459,350,336 | |
| |
Cash | | | 63,270,336 | |
| |
Cash used for collateral on OTC derivatives | | | 10,000 | |
| |
Receivables and other assets: | | | | |
Investments sold | | | 518,741,181 | |
Interest, dividends and principal paydowns | | | 81,426,349 | |
Shares of beneficial interest sold | | | 26,033,712 | |
Other | | | 5,042,267 | |
| | | | |
Total assets | | | 22,153,874,181 | |
|
| |
Liabilities | | | | |
Swaps, at value | | | 60,459 | |
| |
Payables and other liabilities: | | | | |
Investments purchased | | | 1,344,211,533 | |
Shares of beneficial interest redeemed | | | 75,218,806 | |
Dividends | | | 10,481,329 | |
Distribution and service plan fees | | | 2,462,135 | |
Trustees’ compensation | | | 115,057 | |
Shareholder communications | | | 49,355 | |
Other | | | 4,524,097 | |
| | | | |
Total liabilities | | | 1,437,122,771 | |
|
| |
Net Assets | | $ | 20,716,751,410 | |
| | | | |
|
| |
Composition of Net Assets | | | | |
Par value of shares of beneficial interest | | $ | 2,469,724 | |
| |
Additional paid-in capital | | | 21,183,706,812 | |
| |
Accumulated net investment loss | | | (4,320,948 | ) |
| |
Accumulated net realized loss on investments | | | (533,235,130 | ) |
| |
Net unrealized appreciation on investments and translation of assets and liabilities denominated in foreign currencies | | | 68,130,952 | |
| | | | |
Net Assets | | $ | 20,716,751,410 | |
| | | | |
37 OPPENHEIMER SENIOR FLOATING RATE FUND
STATEMENTOF ASSETS AND LIABILITIES Continued
| | | | |
Net Asset Value Per Share | | | | |
Class A Shares: | | | | |
| |
| Net asset value and redemption price per share (based on net assets of $6,881,421,109 and 819,657,562 shares of beneficial interest outstanding) | | $ | 8.40 | |
| |
| Maximum offering price per share (net asset value plus sales charge of 3.50% of offering price) | | $ | 8.70 | |
| |
| |
Class B Shares: | | | | |
| |
| Net asset value, redemption price (excludes applicable contingent deferred sales charge) and offering price per share (based on net assets of $83,999,040 and 10,001,623 shares of beneficial interest outstanding) | | $ | 8.40 | |
| |
| |
Class C Shares: | | | | |
| |
| Net asset value, redemption price (excludes applicable contingent deferred sales charge) and offering price per share (based on net assets of $4,303,006,079 and 511,973,890 shares of beneficial interest outstanding) | | $ | 8.40 | |
| |
| |
Class I Shares: | | | | |
| |
| Net asset value, redemption price and offering price per share (based on net assets of $1,302,876,117 and 155,588,764 shares of beneficial interest outstanding) | | $ | 8.37 | |
| |
| |
Class R Shares: | | | | |
| |
| Net asset value, redemption price (excludes applicable contingent deferred sales charge) and offering price per share (based on net assets of $22,949,313 and 2,734,987 shares of beneficial interest outstanding) | | $ | 8.39 | |
| |
| |
Class Y Shares: | | | | |
| |
| Net asset value, redemption price and offering price per share (based on net assets of $8,122,499,752 and 969,767,461 shares of beneficial interest outstanding) | | $ | 8.38 | |
| |
See accompanying Notes to Financial Statements.
38 OPPENHEIMER SENIOR FLOATING RATE FUND
|
|
| STATEMENTOF OPERATIONS For the Year Ended July 31, 2014 |
| | | | | | |
|
Investment Income | | | | | | |
Interest: | | | | | | |
Unaffiliated companies | | $ | 1,003,610,984 | | | |
Affiliated companies | | | 79,079 | | | |
|
Dividends: | | | | | | |
Unaffiliated companies | | | 15,914,622 | | | |
Affiliated companies | | | 837,629 | | | |
|
Other income | | | 4,798,889 | | | |
| | | |
Total investment income | | | 1,025,241,203 | | | |
|
Expenses | | | | | | |
Management fees | | | 109,577,314 | | | |
|
Distribution and service plan fees: | | | | | | |
Class A | | | 17,283,135 | | | |
Class B | | | 689,394 | | | |
Class C | | | 38,050,011 | | | |
Class R1 | | | 78,144 | | | |
|
Transfer and shareholder servicing agent fees: | | | | | | |
Class A | | | 7,272,407 | | | |
Class B | | | 131,721 | | | |
Class C | | | 3,887,523 | | | |
Class I | | | 184,590 | | | |
Class R1 | | | 17,453 | | | |
Class Y | | | 7,520,913 | | | |
|
Shareholder communications: | | | | | | |
Class A | | | 400,737 | | | |
Class B | | | 12,017 | | | |
Class C | | | 189,423 | | | |
Class I | | | 2,224 | | | |
Class R1 | | | 1,305 | | | |
Class Y | | | 388,396 | | | |
|
Borrowing fees | | | 16,175,925 | | | |
|
Custodian fees and expenses | | | 3,827,588 | | | |
|
Trustees’ compensation | | | 337,799 | | | |
|
Other | | | 1,597,580 | | | |
| | | |
Total expenses | | | 207,625,599 | | | |
Less waivers and reimbursements of expenses | | | (892,742 | ) | | |
| | | |
Net expenses | | | 206,732,857 | | | |
|
Net Investment Income | | | 818,508,346 | | | |
39 OPPENHEIMER SENIOR FLOATING RATE FUND
|
|
| STATEMENTOF OPERATIONS Continued |
| | | | | | |
|
Realized and Unrealized Gain (Loss) | | | | | | |
Net realized gain on: | | | | | | |
Investments from: | | | | | | |
Unaffiliated companies | | $ | 13,015,592 | | | |
Affiliated companies | | | 134,868 | | | |
Swap contracts | | | 46,608 | | | |
Net realized gain | | | 13,197,068 | | | |
|
Net change in unrealized appreciation/depreciation on: | | | | | | |
Investments | | | (15,583,155 | ) | | |
Translation of assets and liabilities denominated in foreign currencies | | | (42,346 | ) | | |
Swap contracts | | | (60,459 | ) | | |
Net change in unrealized appreciation/depreciation | | | (15,685,960 | ) | | |
|
Net Increase in Net Assets Resulting from Operations | | $ | 816,019,454 | | | |
| | | |
1. Effective July 1, 2014, Class N shares were renamed Class R. See Note 1 of the accompanying Notes.
See accompanying Notes to Financial Statements.
40 OPPENHEIMER SENIOR FLOATING RATE FUND
STATEMENTSOF CHANGES IN NET ASSETS
| | | | | | | | | | |
| | | Year Ended
July 31, 2014 | | | | | Year Ended
July 31, 2013 | |
Operations | | | | | | | | | | |
Net investment income | | $ | 818,508,346 | | | | | $ | 435,782,859 | |
Net realized gain (loss) | | | 13,197,068 | | | | | | (667,347 | ) |
Net change in unrealized appreciation/depreciation | | | (15,685,960 | ) | | | | | 137,841,592 | |
Net increase in net assets resulting from operations | | | 816,019,454 | | | | | | 572,957,104 | |
Dividends and/or Distributions to Shareholders | | | | | | | | | | |
Dividends from net investment income: | | | | | | | | | | |
Class A | | | (304,342,806 | ) | | | | | (166,395,707 | ) |
Class B | | | (3,556,586 | ) | | | | | (3,808,969 | ) |
Class C | | | (144,917,813 | ) | | | | | (99,790,333 | ) |
Class I | | | (28,527,246 | ) | | | | | (1,723,172 | ) |
Class R1 | | | (641,183 | ) | | | | | (80,040 | ) |
Class Y | | | (334,807,132 | ) | | | | | (127,987,582 | ) |
| | | | (816,792,766 | ) | | | | | (399,785,803 | ) |
Beneficial Interest Transactions | | | | | | | | | | |
Net increase (decrease) in net assets resulting from beneficial interest transactions: | | | | | | | | | | |
Class A | | | 1,535,010,870 | | | | | | 2,613,863,253 | |
Class B | | | (5,359,383 | ) | | | | | (8,569,211 | ) |
Class C | | | 1,171,067,141 | | | | | | 1,236,905,452 | |
Class I | | | 1,145,142,998 | | | | | | 159,429,369 | |
Class R1 | | | 15,385,707 | | | | | | 7,558,234 | |
Class Y | | | 3,405,940,662 | | | | | | 3,257,063,133 | |
| | | 7,267,187,995 | | | | | | 7,266,250,230 | |
Net Assets | | | | | | | | | | |
| Total increase | | | 7,266,414,683 | | | | | | 7,439,421,531 | |
| Beginning of period | | | 13,450,336,727 | | | | | | 6,010,915,196 | |
| | | |
| End of period (including accumulated net investment loss of $4,320,948 and $2,145,805, respectively) | | $ | 20,716,751,410 | | | | | $ | 13,450,336,727 | |
| | | | | | | | | | |
| | | | | | | | | | |
| | | | | | | | | | |
1. Effective July 1, 2014, Class N shares were renamed Class R. See Note 1 of the accompanying Notes.
See accompanying Notes to Financial Statements.
41 OPPENHEIMER SENIOR FLOATING RATE FUND
FINANCIAL HIGHLIGHTS
| | | | | | | | | | | | | | | | | | | | |
| Class A | | Year Ended
July 31, 2014 | | | Year Ended
July 31, 2013 | | | Year Ended
July 31, 2012 | | | Year Ended
July 29, 2011 1 | | | Year Ended
July 30,
2010 1 | |
| |
| Per Share Operating Data | | | | | | | | | | | | | | | | | | | | |
| Net asset value, beginning of period | | $ | 8.39 | | | $ | 8.19 | | | $ | 8.33 | | | $ | 8.04 | | | $ | 7.18 | |
| |
| Income (loss) from investment operations: | | | | | | | | | | | | | | | | | | | | |
| Net investment income2 | | | 0.37 | | | | 0.44 | | | | 0.44 | | | | 0.49 | | | | 0.50 | |
| Net realized and unrealized gain (loss) | | | 0.01 | | | | 0.17 | | | | (0.16) | | | | 0.27 | | | | 0.82 | |
| | | | |
| Total from investment operations | | | 0.38 | | | | 0.61 | | | | 0.28 | | | | 0.76 | | | | 1.32 | |
| |
| Dividends and/or distributions to shareholders: | | | | | | | | | | | | | | | | | | | | |
| Dividends from net investment income | | | (0.37) | | | | (0.41) | | | | (0.42) | | | | (0.47) | | | | (0.46) | |
| |
| Net asset value, end of period | | $ | 8.40 | | | $ | 8.39 | | | $ | 8.19 | | | $ | 8.33 | | | $ | 8.04 | |
| | | | |
| |
| |
| Total Return, at Net Asset Value3 | | | 4.62% | | | | 7.63% | | | | 3.58% | | | | 9.65% | | | | 18.64% | |
| |
| Ratios/Supplemental Data | | | | | | | | | | | | | | | | | | | | |
| Net assets, end of period (in thousands) | | $ | 6,881,421 | | | $ | 5,345,041 | | | $ | 2,657,114 | | | $ | 3,125,845 | | | $ | 838,425 | |
| |
| Average net assets (in thousands) | | $ | 6,947,675 | | | $ | 3,403,854 | | | $ | 2,558,060 | | | $ | 1,961,051 | | | $ | 666,512 | |
| |
| Ratios to average net assets:4 | | | | | | | | | | | | | | | | | | | | |
| Net investment income | | | 4.39% | | | | 5.32% | | | | 5.47% | | | | 5.89% | | | | 6.47% | |
| Expenses excluding interest and fees from borrowings | | | 0.97% | | | | 1.01% | | | | 1.06% | | | | 1.01% | | | | 1.14% | |
| Interest and fees from borrowings | | | 0.09% | | | | 0.06% | | | | 0.11% | | | | 0.06% | | | | 0.29% | |
| | | | |
| Total expenses5 | | | 1.06% | | | | 1.07% | | | | 1.17% | | | | 1.07% | | | | 1.43% | |
| Expenses after payments, waivers and/or reimbursements and reduction to custodian expenses | | | 1.06% | | | | 1.06% | | | | 1.16% | | | | 1.06% | | | | 1.42% | |
| |
| Portfolio turnover rate | | | 57% | | | | 68% | | | | 54% | | | | 52% | | | | 67% | |
1. July 29, 2011 and July 30, 2010 represent the last business days of the Fund’s respective reporting periods.
2. Per share amounts calculated based on the average shares outstanding during the period.
3. Assumes an initial investment on the business day before the first day of the fiscal period, with all dividends and distributions reinvested in additional shares on the reinvestment date, and redemption at the net asset value calculated on the last business day of the fiscal period. Sales charges are not reflected in the total returns. Total returns are not annualized for periods less than one full year. Returns do not reflect the deduction of taxes that a shareholder would pay on fund distributions or the redemption of fund shares.
4. Annualized for periods less than one full year.
5. Total expenses including indirect expenses from affiliated fund were as follows:
| | | | | | |
| | Year Ended July 31, 2014 | | | 1.06 | % |
| | Year Ended July 31, 2013 | | | 1.08 | % |
| | Year Ended July 31, 2012 | | | 1.18 | % |
| | Year Ended July 29, 2011 | | | 1.08 | % |
| | Year Ended July 30, 2010 | | | 1.44 | % |
See accompanying Notes to Financial Statements.
42 OPPENHEIMER SENIOR FLOATING RATE FUND
| | | | | | | | | | | | | | | | | | | | |
| Class B | | Year Ended
July 31,
2014 | | | Year Ended
July 31,
2013 | | | Year Ended
July 31,
2012 | | | Year Ended
July 29,
2011 1 | | | Year Ended
July 30,
2010 1 | |
| |
| Per Share Operating Data | | | | | | | | | | | | | | | | | | | | |
| Net asset value, beginning of period | | $ | 8.40 | | | $ | 8.20 | | | $ | 8.34 | | | $ | 8.05 | | | $ | 7.18 | |
| |
| Income (loss) from investment operations: | | | | | | | | | | | | | | | | | | | | |
| Net investment income2 | | | 0.33 | | | | 0.40 | | | | 0.39 | | | | 0.44 | | | | 0.46 | |
| Net realized and unrealized gain (loss) | | | (0.01 | ) | | | 0.16 | | | | (0.16) | | | | 0.27 | | | | 0.82 | |
| | | | |
| Total from investment operations | | | 0.32 | | | | 0.56 | | | | 0.23 | | | | 0.71 | | | | 1.28 | |
| |
| Dividends and/or distributions to shareholders: | | | | | | | | | | | | | | | | | | | | |
| Dividends from net investment income | | | (0.32) | | | | (0.36) | | | | (0.37) | | | | (0.42) | | | | (0.41) | |
| |
| Net asset value, end of period | | $ | 8.40 | | | $ | 8.40 | | | $ | 8.20 | | | $ | 8.34 | | | $ | 8.05 | |
| | | | |
| |
| |
| Total Return, at Net Asset Value3 | | | 3.93% | | | | 6.96% | | | | 2.92% | | | | 8.92% | | | | 18.04% | |
| |
| Ratios/Supplemental Data | | | | | | | | | | | | | | | | | | | | |
| Net assets, end of period (in thousands) | | $ | 83,999 | | | $ | 89,319 | | | $ | 95,676 | | | $ | 107,129 | | | $ | 87,676 | |
| |
| Average net assets (in thousands) | | $ | 91,943 | | | $ | 87,671 | | | $ | 95,258 | | | $ | 94,654 | | | $ | 96,622 | |
| |
| Ratios to average net assets:4 | | | | | | | | | | | | | | | | | | | | |
| Net investment income | | | 3.88% | | | | 4.78% | | | | 4.84% | | | | 5.34% | | | | 5.86% | |
| Expenses excluding interest and fees from borrowings | | | 1.51% | | | | 1.64% | | | | 1.69% | | | | 1.70% | | | | 1.80% | |
| Interest and fees from borrowings | | | 0.09% | | | | 0.06% | | | | 0.11% | | | | 0.06% | | | | 0.29% | |
| | | | |
| Total expenses5 | | | 1.60% | | | | 1.70% | | | | 1.80% | | | | 1.76% | | | | 2.09% | |
| Expenses after payments, waivers and/or reimbursements and reduction to custodian expenses | | | 1.60% | | | | 1.69% | | | | 1.79% | | | | 1.75% | | | | 2.08% | |
| |
| Portfolio turnover rate | | | 57% | | | | 68% | | | | 54% | | | | 52% | | | | 67% | |
1. July 29, 2011 and July 30, 2010 represent the last business days of the Fund’s respective reporting periods.
2. Per share amounts calculated based on the average shares outstanding during the period.
3. Assumes an initial investment on the business day before the first day of the fiscal period, with all dividends and distributions reinvested in additional shares on the reinvestment date, and redemption at the net asset value calculated on the last business day of the fiscal period. Sales charges are not reflected in the total returns. Total returns are not annualized for periods less than one full year. Returns do not reflect the deduction of taxes that a shareholder would pay on fund distributions or the redemption of fund shares.
4. Annualized for periods less than one full year.
5. Total expenses including indirect expenses from affiliated fund were as follows:
| | | | | | |
| | Year Ended July 31, 2014 | | | 1.60 | % |
| | Year Ended July 31, 2013 | | | 1.71 | % |
| | Year Ended July 31, 2012 | | | 1.81 | % |
| | Year Ended July 29, 2011 | | | 1.77 | % |
| | Year Ended July 30, 2010 | | | 2.10 | % |
See accompanying Notes to Financial Statements.
43 OPPENHEIMER SENIOR FLOATING RATE FUND
|
|
| FINANCIAL HIGHLIGHTS Continued |
| | | | | | | | | | | | | | | | | | | | |
| Class C | | Year Ended
July 31,
2014 | | | Year Ended
July 31,
2013 | | | Year Ended
July 31,
2012 | | | Year Ended
July 29,
2011 1 | | | Year Ended
July 30,
2010 1 | |
| |
| Per Share Operating Data | | | | | | | | | | | | | | | | | | | | |
| Net asset value, beginning of period | | $ | 8.40 | | | $ | 8.20 | | | $ | 8.34 | | | $ | 8.05 | | | $ | 7.19 | |
| |
| Income (loss) from investment operations: | | | | | | | | | | | | | | | | | | | | |
| Net investment income2 | | | 0.31 | | | | 0.40 | | | | 0.41 | | | | 0.45 | | | | 0.47 | |
| Net realized and unrealized gain (loss) | | | 0.00 | | | | 0.17 | | | | (0.16) | | | | 0.27 | | | | 0.81 | |
| | | | |
| Total from investment operations | | | 0.31 | | | | 0.57 | | | | 0.25 | | | | 0.72 | | | | 1.28 | |
| |
| Dividends and/or distributions to shareholders: | | | | | | | | | | | | | | | | | | | | |
| Dividends from net investment income | | | (0.31) | | | | (0.37) | | | | (0.39) | | | | (0.43) | | | | (0.42) | |
| |
| Net asset value, end of period | | $ | 8.40 | | | $ | 8.40 | | | $ | 8.20 | | | $ | 8.34 | | | $ | 8.05 | |
| | | | |
| |
| |
| Total Return, at Net Asset Value3 | | | 3.77% | | | | 7.11% | | | | 3.10% | | | | 9.10% | | | | 18.06% | |
| |
| Ratios/Supplemental Data | | | | | | | | | | | | | | | | | | | | |
| Net assets, end of period (in thousands) | | $ | 4,303,006 | | | $ | 3,132,135 | | | $ | 1,845,423 | | | $ | 1,877,203 | | | $ | 831,166 | |
| |
| Average net assets (in thousands) | | $ | 3,949,603 | | | $ | 2,258,041 | | | $ | 1,750,570 | | | $ | 1,320,002 | | | $ | 740,664 | |
| |
| Ratios to average net assets:4 | | | | | | | | | | | | | | | | | | | | |
| Net investment income | | | 3.68% | | | | 4.85% | | | | 5.00% | | | | 5.44% | | | | 6.01% | |
| Expenses excluding interest and fees from borrowings | | | 1.67% | | | | 1.49% | | | | 1.52% | | | | 1.51% | | | | 1.62% | |
| Interest and fees from borrowings | | | 0.09% | | | | 0.06% | | | | 0.11% | | | | 0.06% | | | | 0.29% | |
| | | | |
| Total expenses5 | | | 1.76% | | | | 1.55% | | | | 1.63% | | | | 1.57% | | | | 1.91% | |
| Expenses after payments, waivers and/or reimbursements and reduction to custodian expenses | | | 1.76% | | | | 1.54% | | | | 1.62% | | | | 1.56% | | | | 1.90% | |
| |
| Portfolio turnover rate | | | 57% | | | | 68% | | | | 54% | | | | 52% | | | | 67% | |
1. July 29, 2011 and July 30, 2010 represent the last business days of the Fund’s respective reporting periods.
2. Per share amounts calculated based on the average shares outstanding during the period.
3. Assumes an initial investment on the business day before the first day of the fiscal period, with all dividends and distributions reinvested in additional shares on the reinvestment date, and redemption at the net asset value calculated on the last business day of the fiscal period. Sales charges are not reflected in the total returns. Total returns are not annualized for periods less than one full year. Returns do not reflect the deduction of taxes that a shareholder would pay on fund distributions or the redemption of fund shares.
4. Annualized for periods less than one full year.
5. Total expenses including indirect expenses from affiliated fund were as follows:
| | | | | | | | |
| | | | Year Ended July 31, 2014 | | | 1.76 | % |
| | | | Year Ended July 31, 2013 | | | 1.56 | % |
| | | | Year Ended July 31, 2012 | | | 1.64 | % |
| | | | Year Ended July 29, 2011 | | | 1.58 | % |
| | | | Year Ended July 30, 2010 | | | 1.92 | % |
See accompanying Notes to Financial Statements.
44 OPPENHEIMER SENIOR FLOATING RATE FUND
| | | | | | | | | | | | | | |
| Class I | | Year Ended
July 31,
2014 | | | Period Ended
July 31,
2013 1 | | | | | | | |
| | | | | | | |
| Per Share Operating Data | | | | | | | | | | | | | | |
| Net asset value, beginning of period | | $ | 8.38 | | | $ | 8.27 | | | | | | | |
| | | | | | | |
| Income (loss) from investment operations: | | | | | | | | | | | | | | |
| Net investment income2 | | | 0.39 | | | | 0.35 | | | | | | | |
| Net realized and unrealized gain | | | 0.00 | | | | 0.09 | | | | | | | |
| | | | | | | | | | |
| Total from investment operations | | | 0.39 | | | | 0.44 | | | | | | | |
| | | | | | | |
| Dividends and/or distributions to shareholders: | | | | | | | | | | | | | | |
| Dividends from net investment income | | | (0.40) | | | | (0.33) | | | | | | | |
| | | | | | | |
| Net asset value, end of period | | $ | 8.37 | | | $ | 8.38 | | | | | | | |
| | | | | | | | | | |
|
| | | | | | | |
| Total Return, at Net Asset Value3 | | | 4.72% | | | | 5.39% | | | | | | | |
| | | | | | | |
| Ratios/Supplemental Data | | | | | | | | | | | | | | |
| Net assets, end of period (in thousands) | | $ | 1,302,876 | | | $ | 159,260 | | | | | | | |
| | | | | | | |
| Average net assets (in thousands) | | $ | 620,338 | | | $ | 45,348 | | | | | | | |
| | | | | | | |
| Ratios to average net assets:4 | | | | | | | | | | | | | | |
| Net investment income | | | 4.62% | | | | 5.55% | | | | | | | |
| Expenses excluding interest and fees from borrowings | | | 0.65% | | | | 0.63% | | | | | | | |
| Interest and fees from borrowings | | | 0.09% | | | | 0.06% | | | | | | | |
| | | | | | | | | | |
| Total expenses5 | | | 0.74% | | | | 0.69% | | | | | | | |
| Expenses after payments, waivers and/or reimbursements and reduction to custodian expenses | | | 0.74% | | | | 0.68% | | | | | | | |
| | | | | | | |
| Portfolio turnover rate | | | 57% | | | | 68% | | | | | | | |
1. For the period from October 26, 2012 (inception of offering) to July 31, 2013.
2. Per share amounts calculated based on the average shares outstanding during the period.
3. Assumes an initial investment on the business day before the first day of the fiscal period, with all dividends and distributions reinvested in additional shares on the reinvestment date, and redemption at the net asset value calculated on the last business day of the fiscal period. Sales charges are not reflected in the total returns. Total returns are not annualized for periods less than one full year. Returns do not reflect the deduction of taxes that a shareholder would pay on fund distributions or the redemption of fund shares.
4. Annualized for periods less than one full year.
5. Total expenses including indirect expenses from affiliated fund were as follows:
| | | | | | |
| | Year Ended July 31, 2014 | | | 0.74 | % |
| | Period Ended July 31, 2013 | | | 0.70 | % |
See accompanying Notes to Financial Statements.
45 OPPENHEIMER SENIOR FLOATING RATE FUND
|
|
| FINANCIAL HIGHLIGHTS Continued |
| | | | | | | | | | | | | | |
| Class R | | Year Ended
July 31,
2014 | | | Period Ended
July 31,
20131 | | | | | | | |
| | | | | | | |
| Per Share Operating Data | | | | | | | | | | | | | | |
| Net asset value, beginning of period | | $ | 8.39 | | | $ | 8.29 | | | | | | | |
| | | | | | | |
| Income (loss) from investment operations: | | | | | | | | | | | | | | |
| Net investment income2 | | | 0.34 | | | | 0.31 | | | | | | | |
| Net realized and unrealized gain | | | 0.01 | | | | 0.08 | | | | | | | |
| | | | | | | | | | |
| Total from investment operations | | | 0.35 | | | | 0.39 | | | | | | | |
| | | | | | | |
| Dividends and/or distributions to shareholders: | | | | | | | | | | | | | | |
| Dividends from net investment income | | | (0.35) | | | | (0.29) | | | | | | | |
| | | | | | | |
| Net asset value, end of period | | $ | 8.39 | | | $ | 8.39 | | | | | | | |
| | | | | | | | | | |
|
| | | | | | | |
| Total Return, at Net Asset Value3 | | | 4.22% | | | | 4.80% | | | | | | | |
| | | | | | | |
| Ratios/Supplemental Data | | | | | | | | | | | | | | |
| Net assets, end of period (in thousands) | | $ | 22,949 | | | $ | 7,577 | | | | | | | |
| | | | | | | |
| Average net assets (in thousands) | | $ | 15,672 | | | $ | 2,375 | | | | | | | |
| | | | | | | |
| Ratios to average net assets:4 | | | | | | | | | | | | | | |
| Net investment income | | | 4.09% | | | | 4.99% | | | | | | | |
| Expenses excluding interest and fees from borrowings | | | 1.23% | | | | 1.27% | | | | | | | |
| Interest and fees from borrowings | | | 0.09% | | | | 0.06% | | | | | | | |
| | | | | | | | | | |
| Total expenses5 | | | 1.32% | | | | 1.33% | | | | | | | |
| Expenses after payments, waivers and/or reimbursements and reduction to custodian expenses | | | 1.32% | | | | 1.32% | | | | | | | |
| | | | | | | |
| Portfolio turnover rate | | | 57% | | | | 68% | | | | | | | |
1. For the period from October 26, 2012 (inception of offering) to July 31, 2013.
2. Per share amounts calculated based on the average shares outstanding during the period.
3. Assumes an initial investment on the business day before the first day of the fiscal period, with all dividends and distributions reinvested in additional shares on the reinvestment date, and redemption at the net asset value calculated on the last business day of the fiscal period. Sales charges are not reflected in the total returns. Total returns are not annualized for periods less than one full year. Returns do not reflect the deduction of taxes that a shareholder would pay on fund distributions or the redemption of fund shares.
4. Annualized for periods less than one full year.
5. Total expenses including indirect expenses from affiliated fund were as follows:
| | | | | | |
| | Year Ended July 31, 2014 | | | 1.32 | % |
| | Period Ended July 31, 2013 | | | 1.34 | % |
See accompanying Notes to Financial Statements.
46 OPPENHEIMER SENIOR FLOATING RATE FUND
| | | | | | | | | | | | | | | | | | | | |
| Class Y | | Year Ended
July 31,
2014 | | | Year Ended
July 31,
2013 | | | Year Ended
July 31,
2012 | | | Year Ended
July 29,
2011 1 | | | Year Ended
July 30,
2010 1 | |
| |
| Per Share Operating Data | | | | | | | | | | | | | | | | | | | | |
| Net asset value, beginning of period | | $ | 8.37 | | | $ | 8.17 | | | $ | 8.31 | | | $ | 8.03 | | | $ | 7.16 | |
| |
| Income (loss) from investment operations: | | | | | | | | | | | | | | | | | | | | |
| Net investment income2 | | | 0.39 | | | | 0.46 | | | | 0.46 | | | | 0.50 | | | | 0.52 | |
| Net realized and unrealized gain (loss) | | | 0.01 | | | | 0.17 | | | | (0.16) | | | | 0.27 | | | | 0.83 | |
| | | | |
| Total from investment operations | | | 0.40 | | | | 0.63 | | | | 0.30 | | | | 0.77 | | | | 1.35 | |
| |
| Dividends and/or distributions to shareholders: | | | | | | | | | | | | | | | | | | | | |
| Dividends from net investment income | | | (0.39) | | | | (0.43) | | | | (0.44) | | | | (0.49) | | | | (0.48) | |
| |
| Net asset value, end of period | | $ | 8.38 | | | $ | 8.37 | | | $ | 8.17 | | | $ | 8.31 | | | $ | 8.03 | |
| | | | |
| |
| |
| Total Return, at Net Asset Value3 | | | 4.88% | | | | 7.93% | | | | 3.85% | | | | 9.81% | | | | 19.18% | |
| |
| Ratios/Supplemental Data | | | | | | | | | | | | | | | | | | | | |
| Net assets, end of period (in thousands) | | $ | 8,122,500 | | | $ | 4,717,005 | | | $ | 1,412,702 | | | $ | 1,290,014 | | | $ | 42,002 | |
| |
| Average net assets (in thousands) | | $ | 7,250,969 | | | $ | 2,502,666 | | | $ | 1,141,887 | | | $ | 557,932 | | | $ | 17,679 | |
| |
| Ratios to average net assets:4 | | | | | | | | | | | | | | | | | | | | |
| Net investment income | | | 4.63% | | | | 5.55% | | | | 5.73% | | | | 6.01% | | | | 6.67% | |
| Expenses excluding interest and fees from borrowings | | | 0.72% | | | | 0.72% | | | | 0.79% | | | | 0.72% | | | | 0.76% | |
| Interest and fees from borrowings | | | 0.09% | | | | 0.06% | | | | 0.11% | | | | 0.06% | | | | 0.29% | |
| | | | |
| Total expenses5 | | | 0.81% | | | | 0.78% | | | | 0.90% | | | | 0.78% | | | | 1.05% | |
| Expenses after payments, waivers and/or reimbursements and reduction to custodian expenses | | | 0.81% | | | | 0.77% | | | | 0.89% | | | | 0.77% | | | | 1.04% | |
| |
| Portfolio turnover rate | | | 57% | | | | 68% | | | | 54% | | | | 52% | | | | 67% | |
1. July 29, 2011 and July 30, 2010 represent the last business days of the Fund’s respective reporting periods.
2. Per share amounts calculated based on the average shares outstanding during the period.
3. Assumes an initial investment on the business day before the first day of the fiscal period, with all dividends and distributions reinvested in additional shares on the reinvestment date, and redemption at the net asset value calculated on the last business day of the fiscal period. Sales charges are not reflected in the total returns. Total returns are not annualized for periods less than one full year. Returns do not reflect the deduction of taxes that a shareholder would pay on fund distributions or the redemption of fund shares.
4. Annualized for periods less than one full year.
5. Total expenses including indirect expenses from affiliated fund were as follows:
| | | | | | |
| | Year Ended July 31, 2014 | | | 0.81 | % |
| | Year Ended July 31, 2013 | | | 0.79 | % |
| | Year Ended July 31, 2012 | | | 0.91 | % |
| | Year Ended July 29, 2011 | | | 0.79 | % |
| | Year Ended July 30, 2010 | | | 1.06 | % |
See accompanying Notes to Financial Statements.
47 OPPENHEIMER SENIOR FLOATING RATE FUND
|
|
NOTES TO FINANCIAL STATEMENTS July 31, 2014 |
1. Significant Accounting Policies
Oppenheimer Senior Floating Rate Fund (the “Fund”) is registered under the Investment Company Act of 1940, as amended, as an open-end diversified management investment company. The Fund’s investment objective is to seek income. The Fund’s investment adviser is OFI Global Asset Management, Inc. (“OFI Global” or the “Manager”), a wholly-owned subsidiary of OppenheimerFunds, Inc. (“OFI” or the “Sub-Adviser”). The Manager has entered into a sub-advisory agreement with OFI.
The Fund offers Class A, Class C, Class I, Class R and Class Y shares, and previously offered Class B shares for new purchase through June 29, 2012. Subsequent to that date, no new purchases of Class B shares are permitted, however reinvestment of dividend and/or capital gain distributions and exchanges of Class B shares into and from other Oppenheimer funds will be allowed. As of July 1, 2014, Class N shares were renamed Class R shares. Class N shares subject to a CDSC on July 1, 2014, will continue to be subject to a CDSC after the shares are renamed. Purchases of Class R shares occurring on or after July 1, 2014, will not be subject to a CDSC upon redemption. Class A shares are sold at their offering price, which is normally net asset value plus a front-end sales charge. Class C and Class R shares are sold, and Class B shares were sold, without a front-end sales charge but may be subject to a contingent deferred sales charge (“CDSC”). Class R shares are sold only through retirement plans. Retirement plans that offer Class R shares may impose charges on those accounts. Class I and Class Y shares are sold to certain institutional investors or intermediaries without either a front-end sales charge or a CDSC, however, the intermediaries may impose charges on their accountholders who beneficially own Class I and Class Y shares. All classes of shares have identical rights and voting privileges with respect to the Fund in general and exclusive voting rights on matters that affect that class alone. Earnings, net assets and net asset value per share may differ due to each class having its own expenses, such as transfer and shareholder servicing agent fees and shareholder communications, directly attributable to that class. Class A, B, C and R shares have separate distribution and/or service plans under which they pay fees. Class I and Class Y shares do not pay such fees. Class B shares will automatically convert to Class A shares 72 months after the date of purchase.
The following is a summary of significant accounting policies consistently followed by the Fund.
Securities on a When-Issued or Delayed Delivery Basis. The Fund purchases and sells interests in Senior Loans and other portfolio securities on a “when issued” basis, and may purchase or sell securities on a “delayed delivery” basis. “When-issued” or “delayed delivery” refers to securities whose terms and indenture are available and for which a market exists, but which are not available for immediate delivery. Delivery and payment for securities that have been purchased by the Fund on a when-issued basis normally takes place within six months and possibly as long as two years or more after the trade date. During this period, such securities do not earn interest, are subject to market fluctuation and may increase or decrease in value prior to their delivery. The purchase of securities on a when-issued basis may increase the volatility of the Fund’s net asset value to the extent the Fund executes such transactions while remaining substantially fully invested. When the Fund engages in when-issued or delayed delivery transactions, it relies on the buyer or seller, as the case may be, to
48 OPPENHEIMER SENIOR FLOATING RATE FUND
1. Significant Accounting Policies (Continued)
complete the transaction. Their failure to do so may cause the Fund to lose the opportunity to obtain or dispose of the security at a price and yield it considers advantageous. The Fund may also sell securities that it purchased on a when-issued basis or forward commitment prior to settlement of the original purchase.
Senior Loans. Under normal market conditions, the Fund will invest at least 80% of its net assets (plus borrowings for investment purposes) in floating rate Senior Loans made to U.S. and foreign borrowers that are corporations, partnerships or other business entities. The Fund will do so either as an original lender or as a purchaser of a loan assignment or a participation interest in a loan. While most of these loans will be collateralized, the Fund can also under normal market conditions invest up to 10% of its net assets (plus borrowings for investment purposes) in uncollateralized floating rate Senior Loans. Senior Loans are often issued in connection with recapitalizations, acquisitions, leveraged buyouts, and refinancing of borrowers. The Senior Loans pay interest at rates that float above (or are adjusted periodically based on) a benchmark that reflects current interest rates. Senior Loans generally are not listed on any national securities exchange or automated quotation system and no active trading market exists for some Senior Loans. As a result, some Senior Loans are illiquid, which may make it difficult for the Fund to value them or dispose of them at an acceptable price when necessary. To the extent that a secondary market does exist for certain Senior Loans, the market may be subject to irregular trading activity, wide bid/ask spreads and extended trade settlement periods.
As of July 31, 2014, securities with an aggregate market value of $20,434,569,874, representing 98.6% of the Fund’s net assets were comprised of Senior Loans.
Credit Risk. Senior loans are subject to credit risk. Credit risk relates to the ability of the borrower under a senior loan to make interest and principal payments as they become due. The Fund’s investments in senior loans are subject to risk of missing an interest payment. Information concerning securities not accruing income as of July 31, 2014 is as follows:
| | | | |
Cost | | $ | 101,809,738 | |
Market Value | | $ | 28,110,640 | |
Market Value as % of Net Assets | | | 0.14 | % |
Investment in Oppenheimer Institutional Money Market Fund. The Fund is permitted to invest daily available cash balances in an affiliated money market fund. The Fund may invest the available cash in Class E shares of Oppenheimer Institutional Money Market Fund (“IMMF”) to seek current income while preserving liquidity. IMMF is a registered open-end management investment company, regulated as a money market fund under the Investment Company Act of 1940, as amended. The Manager is the investment adviser of IMMF, and the Sub-Adviser provides investment and related advisory services to IMMF. When applicable, the Fund’s investment in IMMF is included in the Statement of Investments. Shares of IMMF are valued at their net asset value per share. As a shareholder, the Fund is subject to its proportional share of IMMF’s Class E expenses, including its management fee. The Manager will waive fees and/or reimburse Fund expenses in an amount equal to the indirect management fees incurred through the Fund’s investment in IMMF.
49 OPPENHEIMER SENIOR FLOATING RATE FUND
|
|
NOTES TO FINANCIAL STATEMENTS Continued 1. Significant Accounting Policies (Continued) |
Foreign Currency Translation. The Fund’s accounting records are maintained in U.S. dollars. The values of securities denominated in foreign currencies and amounts related to the purchase and sale of foreign securities and foreign investment income are translated into U.S. dollars as of the close of the New York Stock Exchange (the “Exchange”), normally 4:00 P.M. Eastern time, on each day the Exchange is open for trading. Foreign exchange rates may be valued primarily using a reliable bank, dealer or service authorized by the Board of Trustees.
Reported net realized gains and losses from foreign currency transactions arise from sales of portfolio securities, sales and maturities of short-term securities, sales of foreign currencies, exchange rate fluctuations between the trade and settlement dates on securities transactions, and the difference between the amounts of dividends, interest, and foreign withholding taxes recorded on the Fund’s books and the U.S. dollar equivalent of the amounts actually received or paid. Net unrealized appreciation and depreciation on the translation of assets and liabilities denominated in foreign currencies arise from changes in the values of assets and liabilities, including investments in securities at fiscal period end, resulting from changes in exchange rates.
The effect of changes in foreign currency exchange rates on investments is separately identified from the fluctuations arising from changes in market values of securities held and reported with all other foreign currency gains and losses in the Fund’s Statement of Operations.
Allocation of Income, Expenses, Gains and Losses. Income, expenses (other than those attributable to a specific class), gains and losses are allocated on a daily basis to each class of shares based upon the relative proportion of net assets represented by such class. Operating expenses directly attributable to a specific class are charged against the operations of that class.
Federal Taxes. The Fund intends to comply with provisions of the Internal Revenue Code applicable to regulated investment companies and to distribute substantially all of its investment company taxable income, including any net realized gain on investments not offset by capital loss carryforwards, if any, to shareholders. Therefore, no federal income or excise tax provision is required. The Fund files income tax returns in U.S. federal and applicable state jurisdictions. The statute of limitations on the Fund’s tax return filings generally remain open for the three preceding fiscal reporting period ends.
The tax components of capital shown in the following table represent distribution requirements the Fund must satisfy under the income tax regulations, losses the Fund may be able to offset against income and gains realized in future years and unrealized appreciation or depreciation of securities and other investments for federal income tax purposes.
50 OPPENHEIMER SENIOR FLOATING RATE FUND
1. Significant Accounting Policies (Continued)
| | | | | | | | | | | | |
Undistributed
Net Investment
Income | | Undistributed
Long-Term
Gain | | | Accumulated
Loss
Carryforward1,2,3,4 | | | Net Unrealized
Appreciation
Based on cost of
Securities and
Other Investments
for Federal Income
Tax Purposes | |
$21,437,473 | | | $— | | | | $521,600,835 | | | | $42,396,573 | |
1. As of July 31, 2014, the Fund had $521,600,835 of net capital loss carryforwards available to offset future realized capital gains, if any, and thereby reduce future taxable gain distributions. Details of the capital loss carryforwards are included in the table below. Capital loss carryovers with no expiration, if any, must be utilized prior to those with expiration dates.
| | | | |
| Expiring | |
2015 | | $ | 6,897,861 | |
2016 | | | 50,471,975 | |
2017 | | | 186,215,370 | |
2018 | | | 203,947,679 | |
2019 | | | 29,853,127 | |
No expiration | | | 44,214,823 | |
| | | | |
Total | | $ | 521,600,835 | |
| | | | |
2. During the fiscal year ended July 31, 2014, the Fund utilized $14,556,690 of capital loss carryforward to offset capital gains realized in that fiscal year.
3. During the fiscal year ended July 31, 2013, the Fund utilized $30,714,422 of capital loss carryforward to offset capital gains realized in that fiscal year.
4. During the fiscal year ended July 31, 2014, $4,679,034 of unused capital loss carryforward expired.
Net investment income (loss) and net realized gain (loss) may differ for financial statement and tax purposes. The character of dividends and distributions made during the fiscal year from net investment income or net realized gains may differ from their ultimate characterization for federal income tax purposes. Also, due to timing of dividends and distributions, the fiscal year in which amounts are distributed may differ from the fiscal year in which the income or net realized gain was recorded by the Fund.
Accordingly, the following amounts have been reclassified for July 31, 2014. Net assets of the Fund were unaffected by the reclassifications.
| | | | | | | | |
Reduction
to Paid-in Capital | | Increase
to Accumulated
Net Investment
Loss | | | Reduction
to Accumulated Net
Realized Loss
on Investments | |
$4,679,059 | | | $3,890,723 | | | | $8,569,782 | |
51 OPPENHEIMER SENIOR FLOATING RATE FUND
|
|
NOTES TO FINANCIAL STATEMENTS Continued 1. Significant Accounting Policies (Continued) |
The tax character of distributions paid during the years ended July 31, 2014 and July 31, 2013 was as follows:
| | | | | | | | |
| | | Year Ended
July 31, 2014 | | | Year Ended
July 31, 2013 | |
Distributions paid from: | | | | | | | | |
Ordinary income | | $ | 816,792,766 | | | $ | 399,785,803 | |
The aggregate cost of securities and other investments and the composition of unrealized appreciation and depreciation of securities and other investments for federal income tax purposes as of July 31, 2014 are noted in the following table. The primary difference between book and tax appreciation or depreciation of securities and other investments, if applicable, is attributable to the tax deferral of losses or tax realization of financial statement unrealized gain or loss.
| | | | |
Federal tax cost of securities | | $ | 21,416,893,304 | |
| | | | |
Gross unrealized appreciation | | $ | 233,186,362 | |
Gross unrealized depreciation | | | (190,789,789 | ) |
| | | | |
Net unrealized appreciation | | $ | 42,396,573 | |
| | | | |
Trustees’ Compensation. The Board of Trustees has adopted a compensation deferral plan for independent trustees that enables trustees to elect to defer receipt of all or a portion of the annual compensation they are entitled to receive from the Fund. For purposes of determining the amount owed to the Trustee under the plan, deferred amounts are treated as though equal dollar amounts had been invested in shares of the Fund or in other Oppenheimer funds selected by the Trustee. The Fund purchases shares of the funds selected for deferral by the Trustee in amounts equal to his or her deemed investment, resulting in a Fund asset equal to the deferred compensation liability. Such assets are included as a component of “Other” within the asset section of the Statement of Assets and Liabilities. Deferral of trustees’ fees under the plan will not affect the net assets of the Fund, and will not materially affect the Fund’s assets, liabilities or net investment income per share. Amounts will be deferred until distributed in accordance with the compensation deferral plan.
Dividends and Distributions to Shareholders. Dividends and distributions to shareholders, which are determined in accordance with income tax regulations and may differ from U.S. generally accepted accounting principles, are recorded on the ex-dividend date. Income distributions, if any, are declared daily and paid monthly. Capital gain distributions, if any, are declared and paid annually.
Investment Income. Dividend income is recorded on the ex-dividend date or upon ex-dividend notification in the case of certain foreign dividends where the ex-dividend date may have passed. Non-cash dividends included in dividend income, if any, are recorded at the fair market value of the securities received. Interest income is recognized on an accrual basis. Discount and premium, which are included in interest income on the Statement of Operations, are amortized or accreted daily.
52 OPPENHEIMER SENIOR FLOATING RATE FUND
1. Significant Accounting Policies (Continued)
Security Transactions. Security transactions are recorded on the trade date. Realized gains and losses on securities sold are determined on the basis of identified cost.
Indemnifications. The Fund’s organizational documents provide current and former trustees and officers with a limited indemnification against liabilities arising in connection with the performance of their duties to the Fund. In the normal course of business, the Fund may also enter into contracts that provide general indemnifications. The Fund’s maximum exposure under these arrangements is unknown as this would be dependent on future claims that may be made against the Fund. The risk of material loss from such claims is considered remote.
Other. The preparation of financial statements in conformity with accounting principles generally accepted in the United States of America requires management to make estimates and assumptions that affect the reported amounts of assets and liabilities and disclosure of contingent assets and liabilities at the date of the financial statements and the reported amounts of increases and decreases in net assets from operations during the reporting period. Actual results could differ from those estimates.
2. Securities Valuation
The Fund calculates the net asset value of its shares as of the close of the New York Stock Exchange (the “Exchange”), normally 4:00 P.M. Eastern time, on each day the Exchange is open for trading.
The Fund’s Board has adopted procedures for the valuation of the Fund’s securities and has delegated the day-to-day responsibility for valuation determinations under those procedures to the Manager. The Manager has established a Valuation Committee which is responsible for determining a “fair valuation” for any security for which market quotations are not “readily available.” The Valuation Committee’s fair valuation determinations are subject to review, approval and ratification by the Fund’s Board at its next regularly scheduled meeting covering the calendar quarter in which the fair valuation was determined.
Valuation Methods and Inputs
Securities are valued using unadjusted quoted market prices, when available, as supplied primarily by third party pricing services or dealers.
The following methodologies are used to determine the market value or the fair value of the types of securities described below:
Securities traded on a registered U.S. securities exchange (including exchange-traded derivatives other than futures and futures options) are valued based on the last sale price of the security reported on the principal exchange on which it is traded, prior to the time when the Fund’s assets are valued. In the absence of a sale, the security is valued at the last sale price on the prior trading day, if it is within the spread of the current day’s closing “bid” and “asked” prices, and if not, at the current day’s closing bid price. A security of a foreign issuer traded on a foreign exchange, but not listed on a registered U.S. securities exchange, is valued based on the last sale price on the principal exchange on which the security is traded,
53 OPPENHEIMER SENIOR FLOATING RATE FUND
|
|
NOTES TO FINANCIAL STATEMENTS Continued 2. Securities Valuation (Continued) |
as identified by the third party pricing service used by the Manager, prior to the time when the Fund’s assets are valued. If the last sale price is unavailable, the security is valued at the most recent official closing price on the principal exchange on which it is traded. If the last sales price or official closing price for a foreign security is not available, the security is valued at the mean between the bid and asked price per the exchange or, if not available from the exchange, obtained from two dealers. If bid and asked prices are not available from either the exchange or two dealers, the security is valued by using one of the following methodologies (listed in order of priority): (1) using a bid from the exchange, (2) the mean between the bid and asked price as provided by a single dealer, or (3) a bid from a single dealer.
Shares of a registered investment company that are not traded on an exchange are valued at that investment company’s net asset value per share.
Corporate and government debt securities (of U.S. or foreign issuers) and municipal debt securities, event-linked bonds, loans, mortgage-backed securities, collateralized mortgage obligations, and asset-backed securities are valued at the mean between the “bid” and “asked” prices utilizing evaluated prices obtained from third party pricing services or broker-dealers who may use matrix pricing methods to determine the evaluated prices.
Short-term money market type debt securities with a remaining maturity of sixty days or less are valued at cost adjusted by the amortization of discount or premium to maturity (amortized cost), which approximates market value. Short-term debt securities with a remaining maturity in excess of sixty days are valued at the mean between the “bid” and “asked” prices utilizing evaluated prices obtained from third party pricing services or broker-dealers.
Structured securities, swaps, swaptions, and other over-the-counter derivatives are valued utilizing evaluated prices obtained from third party pricing services or broker-dealers.
A description of the standard inputs that may generally be considered by the third party pricing vendors in determining their evaluated prices is provided below.
| | |
| Security Type | | Standard inputs generally considered by third-party pricing vendors |
| Corporate debt, government debt, municipal, mortgage-backed and asset-backed securities | | Reported trade data, broker-dealer price quotations, benchmark yields, issuer spreads on comparable securities, the credit quality, yield, maturity, and other appropriate factors. |
| Loans | | Information obtained from market participants regarding reported trade data and broker-dealer price quotations. |
| Event-linked bonds | | Information obtained from market participants regarding reported trade data and broker-dealer price quotations. |
| Swaps | | Relevant market information, including underlying reference assets such as credit spreads, credit event probabilities, index values, individual security values, forward interest rates, variable interest rates, volatility measures, and forward currency rates. |
If a market value or price cannot be determined for a security using the methodologies described above, or if, in the “good faith” opinion of the Manager, the market value or price obtained does not constitute a “readily available market quotation,” or a significant event
54 OPPENHEIMER SENIOR FLOATING RATE FUND
2. Securities Valuation (Continued)
has occurred that would materially affect the value of the security the security is fair valued either (i) by a standardized fair valuation methodology applicable to the security type or the significant event as previously approved by the Valuation Committee and the Fund’s Board or (ii) as determined in good faith by the Manager’s Valuation Committee. The Valuation Committee considers all relevant facts that are reasonably available, through either public information or information available to the Manager, when determining the fair value of a security. Fair value determinations by the Manager are subject to review, approval and ratification by the Fund’s Board at its next regularly scheduled meeting covering the calendar quarter in which the fair valuation was determined. Those fair valuation standardized methodologies include, but are not limited to, valuing securities at the last sale price or initially at cost and subsequently adjusting the value based on: changes in company specific fundamentals, changes in an appropriate securities index, or changes in the value of similar securities which may be further adjusted for any discounts related to security-specific resale restrictions. When possible, such methodologies use observable market inputs such as unadjusted quoted prices of similar securities, observable interest rates, currency rates and yield curves. The methodologies used for valuing securities are not necessarily an indication of the risks associated with investing in those securities nor can it be assured that the Fund can obtain the fair value assigned to a security if it were to sell the security.
To assess the continuing appropriateness of security valuations, the Manager, or its third party service provider who is subject to oversight by the Manager, regularly compares prior day prices, prices on comparable securities, and sale prices to the current day prices and challenges those prices exceeding certain tolerance levels with the third party pricing service or broker source. For those securities valued by fair valuations, whether through a standardized fair valuation methodology or a fair valuation determination, the Valuation Committee reviews and affirms the reasonableness of the valuations based on such methodologies and fair valuation determinations on a regular basis after considering all relevant information that is reasonably available.
Classifications
Each investment asset or liability of the Fund is assigned a level at measurement date based on the significance and source of the inputs to its valuation. Various data inputs are used in determining the value of each of the Fund’s investments as of the reporting period end. These data inputs are categorized in the following hierarchy under applicable financial accounting standards:
1) Level 1-unadjusted quoted prices in active markets for identical assets or liabilities (including securities actively traded on a securities exchange)
2) Level 2-inputs other than unadjusted quoted prices that are observable for the asset or liability (such as unadjusted quoted prices for similar assets and market corroborated inputs such as interest rates, prepayment speeds, credit risks, etc.)
3) Level 3-significant unobservable inputs (including the Manager’s own judgments about assumptions that market participants would use in pricing the asset or liability).
55 OPPENHEIMER SENIOR FLOATING RATE FUND
|
|
NOTES TO FINANCIAL STATEMENTS Continued 2. Securities Valuation (Continued) |
The inputs used for valuing securities are not necessarily an indication of the risks associated with investing in those securities.
The table below categorizes amounts that are included in the Fund’s Statement of Assets and Liabilities as of July 31, 2014 based on valuation input level:
| | | | | | | | | | | | | | | | |
| | | Level 1—
Unadjusted
Quoted Prices | | | Level 2— Other Significant
Observable Inputs | | | Level 3—
Significant
Unobservable
Inputs | | | Value | |
Assets Table | | | | | | | | | | | | | | | | |
Investments, at Value: | | | | | | | | | | | | | | | | |
Corporate Loans | | $ | — | | | $ | 20,434,567,075 | | | $ | 2,799 | | | $ | 20,434,569,874 | |
Corporate Bonds and Notes | | | — | | | | 20,956,447 | | | | — | | | | 20,956,447 | |
Preferred Stock | | | — | | | | — | | | | — | | | | — | |
Common Stocks | | | 137,486,039 | | | | 15,830,184 | | | | 9,284,422 | | | | 162,600,645 | |
Investment Companies | | | 841,223,370 | | | | — | | | | — | | | | 841,223,370 | |
| | | | |
Total Assets | | $ | 978,709,409 | | | $ | 20,471,353,706 | | | $ | 9,287,221 | | | $ | 21,459,350,336 | |
| | | | |
| | | | |
Liabilities Table | | | | | | | | | | | | | | | | |
Other Financial Instruments: | | | | | | | | | | | | | | | | |
Swaps, at value | | $ | — | | | $ | (60,459 | ) | | $ | — | | | $ | (60,459 | ) |
| | | | |
Total Liabilities | | $ | — | | | $ | (60,459 | ) | | $ | — | | | $ | (60,459 | ) |
| | | | |
Forward currency exchange contracts and futures contracts, if any, are reported at their unrealized appreciation/depreciation at measurement date, which represents the change in the contract’s value from trade date. All additional assets and liabilities included in the above table are reported at their market value at measurement date.
The table below shows the transfers between Level 2 and Level 3. The Fund’s policy is to recognize transfers in and transfers out as of the beginning of the reporting period.
| | | | | | | | |
| | | Transfers out of Level 2* | | | Transfers into Level 3* | |
Assets Table | | | | | | | | |
Investments, at Value: | | | | | | | | |
Common Stocks | | $ | (20,799,334 | ) | | $ | 20,799,334 | |
| | | | |
Total Assets | | $ | (20,799,334 | ) | | $ | 20,799,334 | |
| | | | |
* Transferred from Level 2 to Level 3 because of the lack of observable market data due to a decrease in market activity for these securities.
3. Shares of Beneficial Interest
The Fund has authorized an unlimited number of $0.001 par value shares of beneficial interest of each class. Transactions in shares of beneficial interest were as follows:
56 OPPENHEIMER SENIOR FLOATING RATE FUND
3. Shares of Beneficial Interest (Continued)
| | | | | | | | | | | | | | | | |
| | | Year Ended July 31, 2014 | | | Year Ended July 31, 20131 | |
| | | Shares | | | Amount | | | Shares | | | Amount | |
| Class A | | | | | | | | | | | | | | | | |
Sold | | | 502,299,944 | | | $ | 4,220,183,583 | | | | 407,709,356 | | | $ | 3,408,860,964 | |
Dividends and/or distributions reinvested | | | 32,333,409 | | | | 271,739,818 | | | | 17,639,583 | | | | 147,204,021 | |
Redeemed | | | (351,702,584 | ) | | | (2,956,912,531 | ) | | | (112,950,000 | ) | | | (942,201,732 | ) |
| | | | |
Net increase | | | 182,930,769 | | | $ | 1,535,010,870 | | | | 312,398,939 | | | $ | 2,613,863,253 | |
| | | | |
| | | | |
| | | | | | | | | | | | | | | | | |
| Class B | | | | | | | | | | | | | | | | |
Sold | | | 2,869,914 | | | $ | 24,107,845 | | | | 2,793,510 | | | $ | 23,352,560 | |
Dividends and/or distributions reinvested | | | 373,679 | | | | 3,141,087 | | | | 392,523 | | | | 3,273,144 | |
Redeemed | | | (3,877,305 | ) | | | (32,608,315 | ) | | | (4,223,730 | ) | | | (35,194,915 | ) |
| | | | |
Net decrease | | | (633,712 | ) | | $ | (5,359,383 | ) | | | (1,037,697 | ) | | $ | (8,569,211 | ) |
| | | | |
| | | | |
| | | | | | | | | | | | | | | | | |
| Class C | | | | | | | | | | | | | | | | |
Sold | | | 219,154,990 | | | $ | 1,843,239,025 | | | | 182,467,507 | | | $ | 1,527,016,773 | |
Dividends and/or distributions reinvested | | | 13,628,263 | | | | 114,653,645 | | | | 9,068,811 | | | | 75,747,636 | |
Redeemed | | | (93,506,590 | ) | | | (786,825,529 | ) | | | (43,839,662 | ) | | | (365,858,957 | ) |
| | | | |
Net increase | | | 139,276,663 | | | $ | 1,171,067,141 | | | | 147,696,656 | | | $ | 1,236,905,452 | |
| | | | |
| | | | |
| | | | | | | | | | | | | | | | | |
| Class I | | | | | | | | | | | | | | | | |
Sold | | | 153,649,351 | | | $ | 1,288,376,843 | | | | 18,985,257 | | | $ | 159,180,441 | |
Dividends and/or distributions reinvested | | | 3,127,315 | | | | 26,225,668 | | | | 167,601 | | | | 1,402,787 | |
Redeemed | | | (20,202,936 | ) | | | (169,459,513 | ) | | | (137,824 | ) | | | (1,153,859 | ) |
| | | | |
Net increase | | | 136,573,730 | | | $ | 1,145,142,998 | | | | 19,015,034 | | | $ | 159,429,369 | |
| | | | |
| | | | |
| | | | | | | | | | | | | | | | | |
| Class R2 | | | | | | | | | | | | | | | | |
Sold | | | 2,140,392 | | | $ | 17,976,793 | | | | 926,309 | | | $ | 7,754,479 | |
Dividends and/or distributions reinvested | | | 71,097 | | | | 597,276 | | | | 9,120 | | | | 76,414 | |
Redeemed | | | (379,332 | ) | | | (3,188,362 | ) | | | (32,599 | ) | | | (272,659 | ) |
| | | | |
Net increase | | | 1,832,157 | | | $ | 15,385,707 | | | | 902,830 | | | $ | 7,558,234 | |
| | | | |
| | | | |
| | | | | | | | | | | | | | | | | |
| Class Y | | | | | | | | | | | | | | | | |
Sold | | | 768,942,536 | | | $ | 6,445,465,142 | | | | 474,905,029 | | | $ | 3,961,109,317 | |
Dividends and/or distributions reinvested | | | 33,916,350 | | | | 284,389,219 | | | | 12,489,460 | | | | 104,100,230 | |
Redeemed | | | (396,362,390 | ) | | | (3,323,913,699 | ) | | | (96,982,627 | ) | | | (808,146,414 | ) |
| | | | |
Net increase | | | 406,496,496 | | | $ | 3,405,940,662 | | | | 390,411,862 | | | $ | 3,257,063,133 | |
| | | | |
1. For the year ended July 31, 2013 for Class A, Class B, Class C and Class Y shares, and for the period from October 26, 2012 (inception of offering) to July 31, 2013 for Class I and Class R shares.
2. Effective July 1, 2014, Class N shares were renamed Class R.
57 OPPENHEIMER SENIOR FLOATING RATE FUND
|
|
NOTES TO FINANCIAL STATEMENTS Continued 4. Purchases and Sales of Securities |
The aggregate cost of purchases and proceeds from sales of securities, other than short-term obligations and investments in IMMF, for the year ended July 31, 2014 were as follows:
| | | | | | | | |
| | | Purchases | | | Sales | |
Investment securities | | $ | 17,541,025,269 | | | $ | 10,746,642,260 | |
5. Fees and Other Transactions with Affiliates
Management Fees. Under the investment advisory agreement, the Fund pays the Manager a management fee based on the daily net assets of the Fund at an annual rate as shown in the following table:
| | | | | | | | | | | | | | |
| Fee Schedule through September 30, 2013 | | | | | | | Fee Schedule effective October 1, 2013 | |
Up to $200 million | | | 0.75 | % | | | | | | Up to $200 million | | | 0.75 | % |
Next $200 million | | | 0.72 | | | | | | | Next $200 million | | | 0.72 | |
Next $200 million | | | 0.69 | | | | | | | Next $200 million | | | 0.69 | |
Next $200 million | | | 0.66 | | | | | | | Next $200 million | | | 0.66 | |
Next $4.2 billion | | | 0.60 | | | | | | | Next $4.2 billion | | | 0.60 | |
Over $5 billion | | | 0.58 | | | | | | | Next $5 billion | | | 0.58 | |
Sub-Adviser Fees. The Manager has retained the Sub-Adviser to provide the day-to-day portfolio management of the Fund. Under the Sub-Advisory Agreement, the Manager pays the Sub-Adviser an annual fee in monthly installments, equal to a percentage of the investment management fee collected by the Manager from the Fund, which shall be calculated after any investment management fee waivers. The fee paid to the Sub-Adviser is paid by the Manager, not by the Fund.
Transfer Agent Fees. OFI Global (the “Transfer Agent”) serves as the transfer and shareholder servicing agent for the Fund. The Fund pays the Transfer Agent a fee based on annual net assets. Fees incurred and average net assets for each class with respect to these services are detailed in the Statement of Operations and Financial Highlights, respectively.
Sub-Transfer Agent Fees. The Transfer Agent has retained Shareholder Services, Inc., a wholly-owned subsidiary of OFI (the “Sub-Transfer Agent”), to provide the day-to-day transfer agent and shareholder servicing of the Fund. Under the Sub-Transfer Agency Agreement, the Transfer Agent pays the Sub-Transfer Agent an annual fee in monthly installments, equal to a percentage of the transfer agent fee collected by the Transfer Agent from the Fund, which shall be calculated after any applicable fee waivers. The fee paid to the Sub-Transfer Agent is paid by the Transfer Agent, not by the Fund.
Distribution and Service Plan (12b-1) Fees. Under its General Distributor’s Agreement with the Fund, OppenheimerFunds Distributor, Inc. (the “Distributor”) acts as the Fund’s principal underwriter in the continuous public offering of the Fund’s classes of shares.
58 OPPENHEIMER SENIOR FLOATING RATE FUND
5. Fees and Other Transactions with Affiliates (Continued)
Service Plan for Class A Shares. The Fund has adopted a Service Plan (the “Plan”) for Class A shares under Rule 12b-1 of the Investment Company Act of 1940. Under the Plan, the Fund reimburses the Distributor for a portion of its costs incurred for services provided to accounts that hold Class A shares. Reimbursement is made periodically at an annual rate of up to 0.25% of the daily net assets of Class A shares of the Fund. The Distributor currently uses all of those fees to pay dealers, brokers, banks and other financial institutions periodically for providing personal service and maintenance of accounts of their customers that hold Class A shares. Any unreimbursed expenses the Distributor incurs with respect to Class A shares in any fiscal year cannot be recovered in subsequent periods. Fees incurred by the Fund under the Plan are detailed in the Statement of Operations.
Distribution and Service Plans for Class B, Class C and Class R Shares. The Fund has adopted Distribution and Service Plans (the “Plans”) for Class B, Class C and Class R shares under Rule 12b-1 of the Investment Company Act of 1940 to compensate the Distributor for distributing those share classes, maintaining accounts and providing shareholder services. Under the Plans, the Fund pays the Distributor an annual asset-based sales charge of 0.75% on Class B and Class C shares daily net assets and 0.25% on Class R shares daily net assets. The Fund also pays a service fee under the Plans at an annual rate of 0.25% of daily net assets. The Plans continue in effect from year to year only if the Fund’s Board of Trustees vote annually to approve its continuance at an in person meeting called for that purpose. Fees incurred by the Fund under the Plans are detailed in the Statement of Operations.
Sales Charges. Front-end sales charges and contingent deferred sales charges (“CDSC”) do not represent expenses of the Fund. They are deducted from the proceeds of sales of Fund shares prior to investment or from redemption proceeds prior to remittance, as applicable. The sales charges retained by the Distributor from the sale of shares and the CDSC retained by the Distributor on the redemption of shares is shown in the following table for the period indicated.
| | | | | | | | | | | | | | | | | | | | |
| Year Ended | | Class A
Front-End
Sales Charges
Retained by
Distributor | | | Class A
Contingent
Deferred Sales
Charges
Retained by
Distributor | | | Class B
Contingent
Deferred Sales
Charges
Retained by
Distributor | | | Class C
Contingent
Deferred Sales
Charges
Retained by
Distributor | | | Class R
Contingent
Deferred Sales
Charges
Retained by
Distributor | |
July 31, 2014 | | | $1,861,912 | | | | $428,782 | | | | $84,199 | | | | $901,756 | | | | $1,405 | |
Waivers and Reimbursements of Expenses. The Manager will waive fees and/or reimburse Fund expenses in an amount equal to the indirect management fees incurred through the Fund’s investment in IMMF and Oppenheimer Ultra Short Duration Fund. During the year ended July 31, 2014, the Manager waived fees and/or reimbursed the Fund $892,742.
The Transfer Agent has contractually agreed to limit transfer and shareholder servicing agent fees for Classes B, C, R and Y shares to 0.35% of average annual net assets per class and for Class A shares to 0.30% of average annual net assets of the class.
59 OPPENHEIMER SENIOR FLOATING RATE FUND
|
|
NOTES TO FINANCIAL STATEMENTS Continued 5. Fees and Other Transactions with Affiliates (Continued) |
Some of these undertakings may be modified or terminated at any time; some may not be modified or terminated until after one year from the date of the current prospectus, as indicated therein.
6. Risk Exposures and the Use of Derivative Instruments
The Fund’s investment objective not only permits the Fund to purchase investment securities, it also allows the Fund to enter into various types of derivatives contracts, including, but not limited to, futures contracts, forward currency exchange contracts, credit default swaps, interest rate swaps, total return swaps, variance swaps and purchased and written options. In doing so, the Fund will employ strategies in differing combinations to permit it to increase, decrease, or change the level or types of exposure to market risk factors. These instruments may allow the Fund to pursue its objectives more quickly and efficiently than if it were to make direct purchases or sales of securities capable of effecting a similar response to market factors. Such contracts may be entered into through a bilateral over-the-counter (“OTC”) transaction, or through a securities or futures exchange and cleared through a clearinghouse.
Market Risk Factors. In accordance with its investment objectives, the Fund may use derivatives to increase or decrease its exposure to one or more of the following market risk factors:
Commodity Risk. Commodity risk relates to the change in value of commodities or commodity indexes as they relate to increases or decreases in the commodities market. Commodities are physical assets that have tangible properties. Examples of these types of assets are crude oil, heating oil, metals, livestock, and agricultural products.
Credit Risk. Credit risk relates to the ability of the issuer to meet interest and principal payments, or both, as they come due. In general, lower-grade, higher-yield bonds are subject to credit risk to a greater extent than lower-yield, higher-quality bonds.
Equity Risk. Equity risk relates to the change in value of equity securities as they relate to increases or decreases in the general market.
Foreign Exchange Rate Risk. Foreign exchange rate risk relates to the change in the U.S. dollar value of a security held that is denominated in a foreign currency. The U.S. dollar value of a foreign currency denominated security will decrease as the dollar appreciates against the currency, while the U.S. dollar value will increase as the dollar depreciates against the currency.
Interest Rate Risk. Interest rate risk refers to the fluctuations in value of fixed-income securities resulting from the inverse relationship between price and yield. For example, an increase in general interest rates will tend to reduce the market value of already issued fixed-income investments, and a decline in general interest rates will tend to increase their value. In addition, debt securities with longer maturities, which tend to have higher yields, are subject to potentially greater fluctuations in value from changes in interest rates than obligations with shorter maturities.
60 OPPENHEIMER SENIOR FLOATING RATE FUND
6. Risk Exposures and the Use of Derivative Instruments (Continued)
Volatility Risk. Volatility risk refers to the magnitude of the movement, but not the direction of the movement, in a financial instrument’s price over a defined time period. Large increases or decreases in a financial instrument’s price over a relative time period typically indicate greater volatility risk, while small increases or decreases in its price typically indicate lower volatility risk.
Derivatives may have little or no initial cash investment relative to their market value exposure and therefore can produce significant gains or losses in excess of their cost due to unanticipated changes in the market risk factors and the overall market. This use of embedded leverage allows the Fund to increase its market value exposure relative to its net assets and can substantially increase the volatility of the Fund’s performance. In instances where the Fund is using derivatives to decrease, or hedge, exposures to market risk factors for securities held by the Fund, there are also risks that those derivatives may not perform as expected resulting in losses for the combined or hedged positions. Some derivatives have the potential for unlimited loss, regardless of the size of the Fund’s initial investment.
Additional associated risks from investing in derivatives also exist and potentially could have significant effects on the valuation of the derivative and the Fund. Typically, the associated risks are not the risks that the Fund is attempting to increase or decrease exposure to, per its investment objectives, but are the additional risks from investing in derivatives. Examples of these associated risks are liquidity risk, which is the risk that the Fund will not be able to sell the derivative in the open market in a timely manner, and counterparty credit risk, which is the risk that the counterparty will not fulfill its obligation to the Fund.
The Fund’s actual exposures to these market risk factors and associated risks during the period are discussed in further detail, by derivative type, below.
Swap Contracts
The Fund may enter into swap contract agreements with a counterparty to exchange a series of cash flows based on either specified reference rates, the price or volatility of asset or non-asset references, or the occurrence of a credit event, over a specified period. Swaps can be executed in a bi-lateral privately negotiated arrangement with a dealer in an OTC transaction (“OTC swaps”) or executed on a regulated market. Certain swaps, regardless of the venue of their execution, are required to be cleared through a clearinghouse (“centrally cleared swaps”). Swap contracts may include interest rate, equity, debt, index, total return, credit default, currency, and volatility swaps.
Swap contracts are reported on a schedule following the Statement of Investments. The values of centrally cleared swap and OTC swap contracts are aggregated by positive and negative values and disclosed separately on the Statement of Assets and Liabilities. The unrealized appreciation (depreciation) related to the change in the valuation of the notional amount of the swap is combined with the accrued interest due to (owed by) the Fund, if any, at termination or settlement. The net change in this amount during the period is included on the Statement of Operations. The Fund also records any periodic payments received from (paid to) the counterparty, including at termination, under such contracts as realized gain (loss) on the Statement of Operations.
61 OPPENHEIMER SENIOR FLOATING RATE FUND
|
|
NOTES TO FINANCIAL STATEMENTS Continued 6. Risk Exposures and the Use of Derivative Instruments (Continued) |
Swap contract agreements are exposed to the market risk factor of the specific underlying reference rate or asset. Swap contracts are typically more attractively priced compared to similar investments in related cash securities because they isolate the risk to one market risk factor and eliminate the other market risk factors. Investments in cash securities (for instance bonds) have exposure to multiple risk factors (credit and interest rate risk). Because swaps have embedded leverage, they can expose the Fund to substantial risk in the isolated market risk factor.
Total Return Swap Contracts. A total return swap is an agreement between counterparties to exchange periodic payments based on the value of asset or non-asset references. One cash flow is typically based on a non-asset reference (such as an interest rate) and the other on the total return of a reference asset (such as a security or a basket of securities or securities index). The total return of the reference asset typically includes appreciation or depreciation on the reference asset, plus any interest or dividend payments.
Total return swap contracts are exposed to the market risk factor of the specific underlying financial instrument or index. Total return swaps are less standard in structure than other types of swaps and can isolate and/or include multiple types of market risk factors including equity risk, credit risk, and interest rate risk.
The Fund has entered into total return swaps to increase exposure to the credit risk of various indexes or basket of securities. These credit risk related total return swaps require the Fund to pay to, or receive payments from, the counterparty based on the movement of credit spreads of the related indexes or securities.
The Fund has entered into total return swaps to decrease exposure to the credit risk of various indexes or basket of securities. These credit risk related total return swaps require the fund to pay to, or receive payments from, the counterparty based on the movement of credit spreads of the related indexes or securities.
For the year ended July 31, 2014, the Fund had ending monthly average notional amounts of $1,153,846 and $1,538,462 on total return swaps which are long the reference asset and total return swaps which are short the reference asset, respectively.
Additional associated risks to the Fund include counterparty credit risk and liquidity risk.
Counterparty Credit Risk. Derivative positions are subject to the risk that the counterparty will not fulfill its obligation to the Fund. The Fund intends to enter into derivative transactions with counterparties that the Manager believes to be creditworthy at the time of the transaction.
The Fund’s risk of loss from counterparty credit risk on OTC derivatives is generally limited to the aggregate unrealized gain netted against any collateral held by the Fund. For OTC options purchased, the Fund bears the risk of loss of the amount of the premiums paid plus the positive change in market values net of any collateral held by the Fund should the counterparty fail to perform under the contracts. Options written by the Fund do not typically give rise to counterparty credit risk, as options written generally obligate the Fund and not the counterparty to perform.
62 OPPENHEIMER SENIOR FLOATING RATE FUND
6. Risk Exposures and the Use of Derivative Instruments (Continued)
To reduce counterparty risk with respect to OTC transactions, the Fund has entered into master netting arrangements, established within the Fund’s International Swap and Derivatives Association, Inc. (“ISDA”) master agreements, which allow the Fund to make (or to have an entitlement to receive) a single net payment in the event of default (close-out netting) for outstanding payables and receivables with respect to certain OTC positions in swaps, options, swaptions, and forward currency exchange contracts for each individual counterparty. In addition, the Fund may require that certain counterparties post cash and/or securities in collateral accounts to cover their net payment obligations for those derivative contracts subject to ISDA master agreements. If the counterparty fails to perform under these contracts and agreements, the cash and/or securities will be made available to the Fund.
ISDA master agreements include credit related contingent features which allow counterparties to OTC derivatives to terminate derivative contracts prior to maturity in the event that, for example, the Fund’s net assets decline by a stated percentage or the Fund fails to meet the terms of its ISDA master agreements, which would cause the Fund to accelerate payment of any net liability owed to the counterparty.
For financial reporting purposes, the Fund does not offset derivative assets and derivative liabilities that are subject to netting arrangements in the Statement of Assets and Liabilities. Bankruptcy or insolvency laws of a particular jurisdiction may impose restrictions on or prohibitions against the right of offset in bankruptcy, insolvency or other events.
The Fund’s risk of loss from counterparty credit risk on exchange-traded derivatives cleared through a clearinghouse and for centrally cleared swaps is generally considered lower than as compared to OTC derivatives. However, counterparty credit risk exists with respect to initial and variation margin deposited/paid by the Fund that is held in futures commission merchant, broker and/or clearinghouse accounts for such exchange-traded derivatives and for centrally cleared swaps.
With respect to centrally cleared swaps, such transactions will be submitted for clearing, and if cleared, will be held in accounts at futures commission merchants or brokers that are members of clearinghouses. While brokers, futures commission merchants and clearinghouses are required to segregate customer margin from their own assets, in the event that a broker, futures commission merchant or clearinghouse becomes insolvent or goes into bankruptcy and at that time there is a shortfall in the aggregate amount of margin held by the broker, futures commission merchant or clearinghouse for all its customers, U.S. bankruptcy laws will typically allocate that shortfall on a pro-rata basis across all the broker’s, futures commission merchant’s or clearinghouse’s customers, potentially resulting in losses to the Fund.
There is the risk that a broker, futures commission merchant or clearinghouse will decline to clear a transaction on the Fund’s behalf, and the Fund may be required to pay a termination fee to the executing broker with whom the Fund initially enters into the transaction. Clearinghouses may also be permitted to terminate centrally cleared swaps at any time. The Fund is also subject to the risk that the broker or futures commission merchant will improperly use the Fund’s assets deposited/paid as initial or variation margin to satisfy payment obligations of another customer. In the event of a default by another customer of
63 OPPENHEIMER SENIOR FLOATING RATE FUND
|
|
NOTES TO FINANCIAL STATEMENTS Continued 6. Risk Exposures and the Use of Derivative Instruments (Continued) |
the broker or futures commission merchant, the Fund might not receive its variation margin payments from the clearinghouse, due to the manner in which variation margin payments are aggregated for all customers of the broker/futures commission merchant.
Collateral and margin requirements differ by type of derivative. Margin requirements are established by the broker, futures commission merchant or clearinghouse for exchange-traded and cleared derivatives, including centrally cleared swaps. Brokers, futures commission merchants and clearinghouses can ask for margin in excess of the regulatory minimum, or increase the margin amount, in certain circumstances.
Collateral terms are contract specific for OTC derivatives. For derivatives traded under an ISDA master agreement, the collateral requirements are typically calculated by netting the mark to market amount for each transaction under such agreement and comparing that amount to the value of any collateral currently pledged by the Fund or the counterparty.
For financial reporting purposes, cash collateral that has been pledged to cover obligations of the Fund, if any, is reported separately on the Statement of Assets and Liabilities as cash pledged as collateral. Non-cash collateral pledged by the Fund, if any, is noted in the Statement of Investments. Generally, the amount of collateral due from or to a party must exceed a minimum transfer amount threshold (e.g. $250,000) before a transfer has to be made. To the extent amounts due to the Fund from its counterparties are not fully collateralized, contractually or otherwise, the Fund bears the risk of loss from counterparty nonperformance.
The following table presents by counterparty the Fund’s OTC derivative liabilities net of the related collateral pledged by the Fund at July 31, 2014:
| | | | | | | | | | | | | | | | | | | | |
| | | Gross Amounts Not Offset in the Statement of
Assets & Liabilities | |
| Counterparty | | Gross Amount
of Liabilities in
the Statement
of Assets &
Liabilities* | | | Financial
Instruments
Available for
Offset | | | Financial
Instruments
Collateral
Pledged** | | | Cash Collateral
Pledged** | | | Net Amount | |
JPMorgan Chase Bank NA | | $ | (60,459 | ) | | $ | — | | | $ | — | | | $ | 10,000 | | | $ | (50,459 | ) |
* OTC derivatives are reported gross on the Statement of Assets and Liabilities. Exchange traded options and margin related to cleared swaps and futures are excluded from these reported amounts.
** Reported collateral pledged within this table is limited to the net outstanding amount due from the Fund. The securities pledged as collateral by the Fund as reported on the Statements of investments may exceed these amounts.
The following table presents the valuations of derivative instruments by risk exposure as reported within the Statement of Assets and Liabilities as of July 31, 2014:
| | | | | | |
| | | Liability Derivatives | |
Derivatives Not Accounted for as Hedging
Instruments | | Statement of Assets
and Liabilities Location | | Value | |
Credit contracts | | Swaps, at value | | $ | 60,459 | |
64 OPPENHEIMER SENIOR FLOATING RATE FUND
6. Risk Exposures and the Use of Derivative Instruments (Continued)
The effect of derivative instruments on the Statement of Operations is as follows:
| | | | | | | | | | | | |
| Amount of Realized Gain or (Loss) Recognized on Derivatives | |
Derivatives Not Accounted for as Hedging Instruments | | Swap contracts | | | | | | | Total | |
Credit contracts | | | $46,608 | | | | | | | | $46,608 | |
|
| Amount of Change in Unrealized Gain or (Loss) Recognized on Derivatives | |
Derivatives Not Accounted for as Hedging Instruments | | Swap contracts | | | | | | | Total | |
Credit contracts | | | $(60,459) | | | | | | | | $(60,459) | |
7. Restricted Securities
As of July 31, 2014, investments in securities included issues that are restricted. A restricted security may have a contractual restriction on its resale and is valued under methods approved by the Board of Trustees as reflecting fair value. Securities that are restricted are marked with an applicable footnote on the Statement of Investments. Restricted securities are reported on a schedule following the Statement of Investments.
8. Loan Commitments
Pursuant to the terms of certain credit agreements, the Fund has unfunded loan commitments of $26,614,590 at July 31, 2014. The Fund generally will maintain with its custodian, liquid investments having an aggregate value at least equal to the par value of unfunded loan commitments. At July 31, 2014, these liquid investments have a market value of $26,652,423 and have been included as Corporate Loans in the Statement of Investments.
9. Borrowings
The Fund can borrow money from banks in amounts up to one third of its total assets (including the amount borrowed) less all liabilities and indebtedness other than borrowings (meaning that the value of those assets must be at least 300% of the amount borrowed). The Fund can use those borrowings for investment-related purposes such as purchasing senior loans and other portfolio securities. The Fund also may borrow to meet redemption obligations or for temporary and emergency purposes. When the Fund invests borrowed money in senior loans or other portfolio securities, it is using a speculative investment technique known as leverage and changes in the value of the Fund’s investments will have a larger effect on its share price than if it did not borrow because of the effect of leverage.
The Fund will pay interest and may pay other fees in connection with loans. If the Fund does borrow, it will be subject to greater expenses than funds that do not borrow. The interest on borrowed money and the other fees incurred in conjunction with loans are an expense that might reduce the Fund’s yield and return. Expenses incurred by the Fund with respect to interest on borrowings and related fees are disclosed separately or as other expenses on the Statement of Operations.
65 OPPENHEIMER SENIOR FLOATING RATE FUND
|
|
NOTES TO FINANCIAL STATEMENTS Continued 9. Borrowings (Continued) |
The Fund has entered into a Loan and Security Agreement (the “Agreement”) with several banks, as lenders, that enables it to borrow up to $2.5 billion. To secure loans under the Agreement, the Fund may grant a security interest in its senior loans and other portfolio securities to the lending banks. Interest is charged to the Fund, when applicable, based on borrowings, at a spread above the three-month LIBOR (0.24% as of July 31, 2014). The Fund pays additional fees annually under the Agreement for management and administration of the facility as well as ongoing commitment fees all of which are based on the total facility size. Total fees and interest that are included in expenses on the Fund’s Statement of Operations related to its participation in the loan facility during the period ended July 31, 2014 equal 0.09% of the Fund’s average net assets on an annualized basis. Under the Agreement, the Fund has the right to prepay loans and terminate its participation in the loan facility at any time upon prior notice to the lenders.
As of July 31, 2014, the Fund did not have any outstanding borrowings under the Agreement.
Details of the borrowings for the year ended July 31, 2014 are as follows:
10. Pending Litigation
In 2009, seven class action lawsuits were filed in the U.S. District Court for the District of Colorado against OppenheimerFunds, Inc. (“OFI”), OppenheimerFunds Distributor, Inc., the Fund’s principal underwriter and distributor (the “Distributor”), and certain funds (but not including the Fund) advised by OFI Global Asset Management, Inc. and distributed by the Distributor (the “Defendant Funds”). The lawsuits also named as defendants certain officers and current and former trustees of the respective Defendant Funds. The lawsuits raised claims under federal securities law and alleged, among other things, that the disclosure documents of the respective Defendant Funds contained misrepresentations and omissions and that the respective Defendant Funds’ investment policies were not followed. The plaintiffs in these actions sought unspecified damages, equitable relief and awards of attorneys’ fees and litigation expenses. The Defendant Funds’ Boards of Trustees also engaged counsel to represent the Funds and the present and former Independent Trustees named in those suits. On March 5, 2014, the parties in six of these lawsuits executed stipulations and agreements of settlement resolving those actions. On July 31, 2014, the court entered an order and final judgment approving the settlements as fair, reasonable and adequate. The settlements do not resolve a seventh outstanding lawsuit relating to Oppenheimer Rochester California Municipal Fund.
Other class action and individual lawsuits have been filed since 2008 in various state and federal courts against OFI and certain of its affiliates by investors seeking to recover investments they allegedly lost as a result of the “Ponzi” scheme run by Bernard L. Madoff and his firm, Bernard L. Madoff Investment Securities, LLC (“BLMIS”). Plaintiffs in these suits allege that they suffered losses as a result of their investments in several funds managed by an affiliate of OFI and assert a variety of claims, including breach of fiduciary duty, fraud,
66 OPPENHEIMER SENIOR FLOATING RATE FUND
10. Pending Litigation (Continued)
negligent misrepresentation, unjust enrichment, and violation of federal and state securities laws and regulations, among others. They seek unspecified damages, equitable relief and awards of attorneys’ fees and litigation expenses. Neither the Distributor, nor any of the Oppenheimer mutual funds, their independent trustees or directors are named as defendants in these lawsuits. None of the Oppenheimer mutual funds invested in any funds or accounts managed by Madoff or BLMIS. On February 28, 2011, a stipulation of partial settlement of three groups of consolidated putative class action lawsuits relating to these matters was filed in the U.S. District Court for the Southern District of New York. On August 19, 2011, the court entered an order and final judgment approving the settlement as fair, reasonable and adequate. In September 2011, certain parties filed notices of appeal from the court’s order approving the settlement. In June 2014, the appellate court affirmed the lower court’s order approving the settlement. Certain parties subsequently filed a petition for certiorari before the U.S. Supreme Court further challenging the settlement approval order. The settlement does not resolve other outstanding lawsuits against OFI and its affiliates relating to BLMIS.
OFI believes the lawsuits and appeals described above are without legal merit and, with the exception of actions it has settled, is defending against them vigorously. While it is premature to render any opinion as to the outcome in these lawsuits, or whether any costs that the Defendant Funds may bear in defending the suits might not be reimbursed by insurance, OFI believes that these suits should not impair the ability of OFI or the Distributor to perform their respective duties to the Fund, and that the outcome of all of the suits together should not have any material effect on the operations of any of the Oppenheimer mutual funds.
67 OPPENHEIMER SENIOR FLOATING RATE FUND
REPORTOF INDEPENDENT REGISTERED PUBLIC
ACCOUNTING FIRM
The Board of Trustees and Shareholders of Oppenheimer Senior Floating Rate Fund:
We have audited the accompanying statement of assets and liabilities of Oppenheimer Senior Floating Rate Fund, including the statement of investments, as of July 31, 2014, and the related statement of operations for the year then ended, the statements of changes in net assets for each of the years in the two-year period then ended, and the financial highlights for each of the years or periods in the five-year period then ended. These financial statements and financial highlights are the responsibility of the Fund’s management. Our responsibility is to express an opinion on these financial statements and financial highlights based on our audits.
We conducted our audits in accordance with the standards of the Public Company Accounting Oversight Board (United States). Those standards require that we plan and perform the audit to obtain reasonable assurance about whether the financial statements and financial highlights are free of material misstatement. An audit includes examining, on a test basis, evidence supporting the amounts and disclosures in the financial statements. Our procedures included confirmation of securities owned as of July 31, 2014, by correspondence with the custodian, transfer agent and brokers, or by other appropriate auditing procedures where replies from brokers were not received. An audit also includes assessing the accounting principles used and significant estimates made by management, as well as evaluating the overall financial statement presentation. We believe that our audits provide a reasonable basis for our opinion.
In our opinion, the financial statements and financial highlights referred to above present fairly, in all material respects, the financial position of Oppenheimer Senior Floating Rate Fund as of July 31, 2014, the results of its operations for the year then ended, the changes in its net assets for each of the years in the two-year period then ended, and the financial highlights for each of the years or periods in the five-year period then ended, in conformity with U.S. generally accepted accounting principles.
KPMGLLP
Denver, Colorado
September 19, 2014
68 OPPENHEIMER SENIOR FLOATING RATE FUND
FEDERAL INCOME TAX INFORMATION Unaudited
In early 2014, if applicable, shareholders of record received information regarding all dividends and distributions paid to them by the Fund during calendar year 2013.
None of the dividends paid by the Fund during the fiscal year ended July 31, 2014 are eligible for the corporate dividend-received deduction.
Dividends, if any, paid by the Fund during the fiscal year ended July 31, 2014 which are not designated as capital gain distributions, may be eligible for lower individual income tax rates to the extent that the Fund has received qualified dividend income as stipulated by recent tax legislation. In early 2014, shareholders of record received information regarding the percentage of distributions that are eligible for lower individual income tax rates. The amount will be the maximum amount allowed.
Recent tax legislation allows a regulated investment company to designate distributions not designated as capital gain distributions, as either interest related dividends or short-term capital gain dividends, both of which are exempt from the U.S. withholding tax applicable to non U.S. taxpayers. For the fiscal year ended July 31, 2014, the maximum amount allowable but not less than $800,683,100 of the ordinary distributions to be paid by the Fund qualifies as an interest related dividend.
The foregoing information is presented to assist shareholders in reporting distributions received from the Fund to the Internal Revenue Service. Because of the complexity of the federal regulations which may affect your individual tax return and the many variations in state and local tax regulations, we recommend that you consult your tax advisor for specific guidance.
69 OPPENHEIMER SENIOR FLOATING RATE FUND
PORTFOLIO PROXY VOTING POLICIESAND PROCEDURES;
UPDATES TO STATEMENTS OF INVESTMENTS Unaudited
The Fund has adopted Portfolio Proxy Voting Policies and Procedures under which the Fund votes proxies relating to securities (“portfolio proxies”) held by the Fund. A description of the Fund’s Portfolio Proxy Voting Policies and Procedures is available (i) without charge, upon request, by calling the Fund toll-free at 1.800.CALL OPP (225.5677), (ii) on the Fund’s website at oppenheimerfunds.com, and (iii) on the SEC’s website at www.sec.gov. In addition, the Fund is required to file Form N-PX, with its complete proxy voting record for the 12 months ended June 30th, no later than August 31st of each year. The Fund’s voting record is available (i) without charge, upon request, by calling the Fund toll-free at 1.800.CALL OPP (225.5677), and (ii) in the Form N-PX filing on the SEC’s website at www.sec.gov.
The Fund files its complete schedule of portfolio holdings with the SEC for the first quarter and the third quarter of each fiscal year on Form N-Q. The Fund’s Form N-Q filings are available on the SEC’s website at www.sec.gov. Those forms may be reviewed and copied at the SEC’s Public Reference Room in Washington, D.C. Information on the operation of the Public Reference Room may be obtained by calling 1-800-SEC-0330.
Householding—Delivery of Shareholder Documents
This is to inform you about OppenheimerFunds’ “householding” policy. If more than one member of your household maintains an account in a particular fund, OppenheimerFunds will mail only one copy of the fund’s prospectus (or, if available, the fund’s summary prospectus), annual and semiannual report and privacy policy. The consolidation of these mailings, called householding, benefits your fund through reduced mailing expense, and benefits you by reducing the volume of mail you receive from OppenheimerFunds. Householding does not affect the delivery of your account statements.
Please note that we will continue to household these mailings for as long as you remain an OppenheimerFunds shareholder, unless you request otherwise. If you prefer to receive multiple copies of these materials, please call us at 1.800.CALL-OPP (225-5677). You may also notify us in writing or via email. We will begin sending you individual copies of the prospectus (or, if available, the summary prospectus), reports and privacy policy within 30 days of receiving your request to stop householding.
70 OPPENHEIMER SENIOR FLOATING RATE FUND
TRUSTEES AND OFFICERS Unaudited
| | |
| Name, Position(s) Held with the Fund, Length of Service, Year of Birth | | Principal Occupation(s) During the Past 5 Years; Other Trusteeships/Directorships Held; Number of Portfolios in the Fund Complex Currently Overseen |
| |
| INDEPENDENT TRUSTEES | | The address of each Trustee in the chart below is 6803 S. Tucson Way, Centennial, Colorado 80112-3924. Each Trustee serves for an indefinite term, or until his or her resignation, retirement, death or removal. |
| |
Sam Freedman, Chairman of the Board of Trustees (since 2012) and Trustee (since 1999) Year of Birth: 1940 | | Director of Colorado UpLIFT (charitable organization) (since September 1984). Mr. Freedman held several positions with the Sub-Adviser and with subsidiary or affiliated companies of the Sub-Adviser (until October 1994). Oversees 39 portfolios in the OppenheimerFunds complex. Mr. Freedman has served on the Boards of certain Oppenheimer funds since 1996, during which time he has become familiar with the Fund’s (and other Oppenheimer funds’) financial, accounting, regulatory and investment matters and has contributed to the Boards’ deliberations. |
| |
Edward L. Cameron, Trustee (since 1999) Year of Birth: 1938 | | Member of The Life Guard of Mount Vernon (George Washington historical site) (June 2000-June 2006); Partner of PricewaterhouseCoopers LLP (accounting firm) (July 1974-June 1999); Chairman of Price Waterhouse LLP Global Investment Management Industry Services Group (accounting firm) (July 1994-June 1998). Oversees 39 portfolios in the OppenheimerFunds complex. Mr. Cameron has served on the Boards of certain Oppenheimer funds since 1999, during which time he has become familiar with the Fund’s (and other Oppenheimer funds’) financial, accounting, regulatory and investment matters and has contributed to the Boards’ deliberations. |
| |
Jon S. Fossel, Trustee (since 1999) Year of Birth: 1942 | | Chairman of the Board (2006-December 2011) and Director (June 2002-December 2011) of UNUMProvident (insurance company); Director of Northwestern Energy Corp. (public utility corporation) (November 2004-December 2009); Director of P.R. Pharmaceuticals (October 1999-October 2003); Director of Rocky Mountain Elk Foundation (non-profit organization) (February 1998-February 2003 and February 2005-February 2007); Chairman and Director (until October 1996) and President and Chief Executive Officer (until October 1995) of the Sub-Adviser; President, Chief Executive Officer and Director of the following: Oppenheimer Acquisition Corp. (“OAC”) (parent holding company of the Sub-Adviser), Shareholders Services, Inc. and Shareholder Financial Services, Inc. (until October 1995). Oversees 39 portfolios in the OppenheimerFunds complex. Mr. Fossel has served on the Boards of certain Oppenheimer funds since 1990, during which time he has become familiar with the Fund’s (and other Oppenheimer funds’) financial, accounting, regulatory and investment matters and has contributed to the Boards’ deliberations. |
| |
Richard F. Grabish, Trustee (since 2008) Year of Birth: 1948 | | Formerly Senior Vice President and Assistant Director of Sales and Marketing (March 1997-December 2007), Director (March 1987-December 2007) and Manager of Private Client Services (June 1985-June 2005) of A.G. Edwards & Sons, Inc. (broker/dealer and investment firm); Chairman and Chief Executive Officer of A.G. Edwards Trust Company, FSB (March 2001-December 2007); President and Vice Chairman of A.G. Edwards Trust Company, FSB (investment adviser) (April 1987-March 2001); President of A.G. Edwards Trust Company, FSB (investment adviser) (June 2005- |
71 OPPENHEIMER SENIOR FLOATING RATE FUND
|
|
| TRUSTEES AND OFFICERS Unaudited / Continued |
| | |
Richard F. Grabish, Continued | | December 2007). Oversees 39 portfolios in the OppenheimerFunds complex. Mr. Grabish has served on the Boards of certain Oppenheimer funds since 2001, during which time he has become familiar with the Fund’s (and other Oppenheimer funds’) financial, accounting, regulatory and investment matters and has contributed to the Boards’ deliberations. |
| |
Beverly L. Hamilton, Trustee (since 2005) Year of Birth: 1946 | | Trustee of Monterey Institute for International Studies (educational organization) (since February 2000); Board Member of Middlebury College (educational organization) (December 2005-June 2011); Chairman (since 2010) of American Funds’ Emerging Markets Growth Fund, Inc. (mutual fund); Director of The California Endowment (philanthropic organization) (April 2002-April 2008); Director (February 2002-2005) and Chairman of Trustees (2006-2007) of the Community Hospital of Monterey Peninsula; Director (October 1991-2005); Vice Chairman (2006-2009) of American Funds’ Emerging Markets Growth Fund, Inc. (mutual fund); President of ARCO Investment Management Company (February 1991-April 2000); Member of the investment committees of The Rockefeller Foundation (2001-2006) and The University of Michigan (since 2000); Advisor at Credit Suisse First Boston’s Sprout venture capital unit (venture capital fund) (1994-January 2005); Trustee of MassMutual Institutional Funds (investment company) (1996-June 2004); Trustee of MML Series Investment Fund (investment company) (April 1989-June 2004); Member of the investment committee of Hartford Hospital (2000-2003); and Advisor to Unilever (Holland) pension fund (2000-2003). Oversees 39 portfolios in the OppenheimerFunds complex. Ms. Hamilton has served on the Boards of certain Oppenheimer funds since 2002, during which time she has become familiar with the Fund’s (and other Oppenheimer funds’) financial, accounting, regulatory and investment matters and has contributed to the Boards’ deliberations. |
| |
Victoria J. Herget, Trustee (since 2012) Year of Birth:1951 | | Independent Director of the First American Funds (mutual fund family) (2003-2011); former Managing Director (1993-2001), Principal (1985-1993), Vice President (1978-1985) and Assistant Vice President (1973-1978) of Zurich Scudder Investments (and its predecessor firms); Board Chair (2008-Present) and Director (2004-Present), United Educators (insurance company); Trustee (1992-2007), Chair of the Board of Trustees (1999-2007), Investment Committee Chair (1994-1999) and Investment Committee member (2007-2010) of Wellesley College; Trustee (since 2000) and Chair (since 2010), Newberry Library; Trustee, Mather LifeWays (since 2001); Trustee, BoardSource (2006-2009) and Chicago City Day School (1994-2005). Oversees 39 portfolios in the OppenheimerFunds complex. Ms. Herget has served on the Boards of certain Oppenheimer funds since 2012, during which time she has become familiar with the Fund’s (and other Oppenheimer funds’) financial, accounting, regulatory and investment matters and has contributed to the Boards’ deliberations. |
| |
Robert J. Malone, Trustee (since 2005) Year of Birth: 1944 | | Chairman of the Board (since 2012) and Director (since August 2005) of Jones International University (educational organization) (since August 2005); Chairman, Chief Executive Officer and Director of Steele Street Bank Trust (commercial banking) (since August 2003); Trustee of the Gallagher Family Foundation (non-profit organization) (since 2000); Board of Directors of Opera Colorado Foundation (non-profit organization) (2008-2012); Director of Colorado UpLIFT (charitable organization) (1986-2010); Director of Jones Knowledge, Inc. (2006-2010); Former Chairman of U.S. Bank- |
72 OPPENHEIMER SENIOR FLOATING RATE FUND
| | |
Robert J. Malone, Continued | | Colorado (subsidiary of U.S. Bancorp and formerly Colorado National Bank) (July 1996-April 1999); Director of Commercial Assets, Inc. (real estate investment trust) (1993-2000); Director of U.S. Exploration, Inc. (oil and gas exploration) (1997-February 2004); Chairman of the Board (1991-1994) and Trustee (1985-1994) of Regis University; and Chairman of the Board (1990-1991 and Trustee (1984-1999) of Young Presidents Organization. Oversees 39 portfolios in the OppenheimerFunds complex. Mr. Malone has served on the Boards of certain Oppenheimer funds since 2002, during which time he has become familiar with the Fund’s (and other Oppenheimer funds’) financial, accounting, regulatory and investment matters and has contributed to the Boards��� deliberations. |
| |
F. William Marshall, Jr., Trustee (since 2000) Year of Birth: 1942 | | Trustee Emeritus of Worcester Polytech Institute (WPI) (private university) (since 2009); Trustee of MassMutual Select Funds (formerly MassMutual Institutional Funds) (investment company) (since 1996), MML Series Investment Fund (investment company) (since 1996) and Mass Mutual Premier Funds (investment company) (since January 2012); President and Treasurer of the SIS Fund (private charitable fund) (January 1999 – March 2011); Former Trustee of WPI (1985-2008); Former Chairman of the Board (2004-2006) and Former Chairman of the Investment Committee of WPI (1994-2008); Chairman of SIS & Family Bank, F.S.B. (formerly SIS Bank) (commercial bank) (January 1999-July 1999); Executive Vice President of Peoples Heritage Financial Group, Inc. (commercial bank) (January 1999-July 1999); and Former President and Chief Executive Officer of SIS Bancorp. (1993-1999). Oversees 43 portfolios in the OppenheimerFunds complex. Mr. Marshall has served on the Boards of certain Oppenheimer funds since 2000, during which time he has become familiar with the Fund’s (and other Oppenheimer funds’) financial, accounting, regulatory and investment matters and has contributed to the Boards’ deliberations. |
| |
Karen L. Stuckey, Trustee (since 2012) Year of Birth: 1953 | | Partner (1990-2012) of PricewaterhouseCoopers LLP (held various positions 1975-1990); Emeritus Trustee (since 2006), Trustee (1992-2006) and member of Executive, Nominating and Audit Committees and Chair of Finance Committee of Lehigh University; and member, Women’s Investment Management Forum since inception. Oversees 39 portfolios in the OppenheimerFunds complex. Ms. Stuckey has served on the Boards of certain Oppenheimer funds since 2012, during which time she has become familiar with the Fund’s (and other Oppenheimer funds’) financial, accounting, regulatory and investment matters and has contributed to the Boards’ deliberations. |
| |
James D. Vaughn, Trustee (since 2012) Year of Birth:1945 | | Retired; former managing partner (1994-2001) of Denver office of Deloitte & Touche LLP, (held various positions 1969-1993); Trustee and Chairman of the Audit Committee of Schroder Funds (2003-2012); Board member and Chairman of Audit Committee of AMG National Trust Bank (since 2005); Trustee and Investment Committee member, University of South Dakota Foundation (since 1996); Board member, Audit Committee Member and past Board Chair, Junior Achievement (since 1993); former Board member, Mile High United Way, Boys and Girls Clubs, Boy Scouts, Colorado Business Committee for the Arts, Economic Club of Colorado and Metro Denver |
73 OPPENHEIMER SENIOR FLOATING RATE FUND
|
|
| TRUSTEES AND OFFICERS Unaudited / Continued |
| | |
James D. Vaughn, Continued | | Network. Oversees 39 portfolios in the OppenheimerFunds complex. Mr. Vaughn has served on the Boards of certain Oppenheimer funds since 2012, during which time he has become familiar with the Fund’s (and other Oppenheimer funds’) financial, accounting, regulatory and investment matters and has contributed to the Boards’ deliberations. |
| | |
| INTERESTED TRUSTEE AND OFFICER | | Mr. Glavin is an “Interested Trustee” because he is affiliated with the Manager and the Sub-Adviser by virtue of his positions as an officer and director of the Manager and a director of the Sub-Adviser, and as a shareholder of the Sub-Adviser’s parent company. Both as a Trustee and as an officer, he serves for an indefinite term, or until his resignation, retirement, death or removal. Mr. Glavin’s address is 225 Liberty Street, 11th Floor, New York, New York 10281-1008. |
| |
William F. Glavin, Jr., Trustee, President and Principal Executive Officer (since 2009) Year of Birth: 1958 | | Chairman of the Sub-Adviser (since July 2014 and December 2009-December 2012) and Director of the Sub-Adviser (since January 2009); Chairman, Director and Chief Executive Officer (January 2013-June 2014) of the Manager; President of the Manager (January 2013-May 2013); Chief Executive Officer (January 2009-December 2012); President of the Sub-Adviser (May 2009-December 2012); Management Director (June 2009-June 2014), President (December 2009-June 2014) and Chief Executive Officer (January 2011-June 2014) of Oppenheimer Acquisition Corp. (“OAC”) (the Sub-Adviser’s parent holding company); Director of Oppenheimer Real Asset Management, Inc. (March 2010-June 2014); Executive Vice President (March 2006-February 2009) and Chief Operating Officer (July 2007-February 2009) of Massachusetts Mutual Life Insurance Company (OAC’s parent company); Director (May 2004-March 2006) and Chief Operating Officer and Chief Compliance Officer (May 2004-January 2005), President (January 2005-March 2006) and Chief Executive Officer (June 2005-March 2006) of Babson Capital Management LLC; Director (March 2005-March 2006), President (May 2003-March 2006) and Chief Compliance Officer (July 2005-March 2006) of Babson Capital Securities, Inc. (a brokerdealer); President (May 2003-March 2006) of Babson Investment Company, Inc.; Director (May 2004-August 2006) of Babson Capital Europe Limited; Director (May 2004-October 2006) of Babson Capital Guernsey Limited; Director (May 2004-March 2006) of Babson Capital Management LLC; Non-Executive Director (March 2005-March 2007) of Baring Asset Management Limited; Director (February 2005-June 2006) Baring Pension Trustees Limited; Director and Treasurer (December 2003-November 2006) of Charter Oak Capital Management, Inc.; Director (May 2006-September 2006) of C.M. Benefit Insurance Company; Director (May 2008-June 2009) and Executive Vice President (June 2007-July 2009) of C.M. Life Insurance Company; President (March 2006-May 2007) of MassMutual Assignment Company; Director (January 2005-December 2006), Deputy Chairman (March 2005-December 2006) and President (February 2005-March 2005) of MassMutual Holdings (Bermuda) Limited; Director (May 2008-June 2009) and Executive Vice President (June 2007-July 2009) of MML Bay State Life Insurance Company; Chief Executive Officer and President (April 2007-January 2009) of MML Distributors, LLC; and Chairman (March 2006-December 2008) and Chief Executive Officer (May 2007-December 2008) of MML Investors Services, Inc. An officer of 91 |
74 OPPENHEIMER SENIOR FLOATING RATE FUND
| | |
William F. Glavin, Jr., Continued | | portfolios in the OppenheimerFunds complex. Mr. Glavin has served on the Boards of certain Oppenheimer funds since December 2009, during which time he has become familiar with the Fund’s (and other Oppenheimer funds’) financial, accounting, regulatory and investment matters and has contributed to the Boards’ deliberations. |
| | |
| OTHER OFFICERS OF THE FUND | | The addresses of the Officers in the chart below are as follows: for Mr. Gabinet, Mss. Nasta and Picciotto, 225 Liberty Street, New York, New York 10281-1008, for Messrs. Welsh, Wixted and Ms. Hui, 6803 S. Tucson Way, Centennial, Colorado 80112-3924. Each Officer serves for an indefinite term or until his or her resignation, retirement, death or removal. |
| |
Joseph Welsh, Vice President (since 1999) Year of Birth: 1964 | | Head of High Yield Corporate Debt Team (since April 2009), Senior Vice President of the Sub-Adviser (since May 2009). Vice President of the Sub-Adviser (December 2000-April 2009). A portfolio manager and officer of other portfolios in the OppenheimerFunds complex. |
| |
Margaret Hui, Vice President (since 1999) Age: 1958 | | Vice President of the Sub-Adviser (since February 2005); Senior Portfolio Manager of the Sub-Adviser (since January 2005); Assistant Vice President of the Sub-Adviser (October 1999-January 2005). A portfolio manager and officer of other portfolios in the OppenheimerFunds complex. |
| |
Arthur S. Gabinet, Secretary and Chief Legal Officer (since 2011) Year of Birth: 1958 | | Executive Vice President, Secretary and General Counsel of the Manager (since January 2013); General Counsel OFI SteelPath, Inc. (since January 2013); Executive Vice President (May 2010-December 2012) and General Counsel (since January 2011) of the Sub-Adviser; General Counsel of the Distributor (since January 2011); General Counsel of Centennial Asset Management Corporation (January 2011-December 2012); Executive Vice President (January 2011-December 2012) and General Counsel of HarbourView Asset Management Corporation (since January 2011); Assistant Secretary (since January 2011) and Director (since January 2011) of OppenheimerFunds International Ltd. and OppenheimerFunds plc; Director of Oppenheimer Real Asset Management, Inc. (January 2011-December 2012) and General Counsel (since January 2011); Executive Vice President (January 2011-December 2011) and General Counsel of Shareholder Financial Services, Inc. and Shareholder Services, Inc. (since January 2011); Executive Vice President (January 2011-December 2012) and General Counsel of OFI Private Investments Inc. (since January 2011); Vice President of OppenheimerFunds Legacy Program (January 2011-December 2011); Executive Vice President (January 2011-December 2012) and General Counsel of OFI Institutional Asset Management, Inc. (since January 2011); General Counsel, Asset Management of the Sub-Adviser (May 2010-December 2010); Principal, The Vanguard Group (November 2005-April 2010); District Administrator, U.S. Securities and Exchange Commission (January 2003-October 2005). An officer of 91 portfolios in the OppenheimerFunds complex. |
| |
Christina M. Nasta, Vice President and Chief Business Officer (since 2011) Year of Birth: 1973 | | Senior Vice President of OppenheimerFunds Distributor, Inc. (since January 2013); Senior Vice President of the Sub-Adviser (July 2010-December 2012); Vice President of the Sub-Adviser (January 2003-July 2010); Vice President of OppenheimerFunds Distributor, Inc. (January 2003-July 2010). An officer of 91 portfolios in the OppenheimerFunds complex. |
75 OPPENHEIMER SENIOR FLOATING RATE FUND
|
|
| TRUSTEES AND OFFICERS Unaudited / Continued |
| | |
Mary Ann Picciotto, Chief Compliance Officer and Chief Anti-Money Laundering Officer (since 2014) Year of Birth: 1973 | | Senior Vice President and Chief Compliance Officer of the Manager (since March 2014); Chief Compliance Officer of the Sub-Adviser, OFI SteelPath, Inc., OFI Global Trust Company, OFI Global Institutional, Inc., Oppenheimer Real Asset Management, Inc., OFI Private Investments, Inc., Harborview Asset Management Corporation, Trinity Investment Management Corporation, and Shareholder Services, Inc. (since March 2014); Managing Director of Morgan Stanley Investment Management Inc. and certain of its various affiliated entities; Chief Compliance Officer of various Morgan Stanley Funds (May 2010-January 2014); Chief Compliance Officer of Morgan Stanley Investment Management Inc. (April 2007-January 2014). An officer of 91 portfolios in the OppenheimerFunds complex. |
| |
Brian W. Wixted, Treasurer and Principal Financial & Accounting Officer (since 1999) Year of Birth: 1959 | | Senior Vice President of the Manager (since January 2013); Treasurer of the Sub-Adviser, HarbourView Asset Management Corporation, Shareholder Financial Services, Inc., Shareholder Services, Inc., and Oppenheimer Real Asset Management, Inc. (March 1999-June 2008), OFI Private Investments, Inc. (March 2000-June 2008), OppenheimerFunds International Ltd. and OppenheimerFunds plc (since May 2000), OFI Institutional Asset Management, Inc. (November 2000-June 2008), and OppenheimerFunds Legacy Program (charitable trust program established by the Sub-Adviser) (June 2003-December 2011); Treasurer and Chief Financial Officer of OFI Trust Company (since May 2000); Assistant Treasurer of Oppenheimer Acquisition Corporation (March 1999-June 2008). An officer of 91 portfolios in the OppenheimerFunds complex. |
The Fund’s Statement of Additional Information contains additional information about the Fund’s Trustees and Officers and is available without charge upon request by calling 1.800.CALL OPP (225.5677).
76 OPPENHEIMER SENIOR FLOATING RATE FUND
OPPENHEIMER SENIOR FLOATING RATE FUND
| | |
| |
| Manager | | OFI Global Asset Management, Inc. |
| |
| Sub-Adviser | | OppenheimerFunds, Inc. |
| |
| Distributor | | OppenheimerFunds Distributor, Inc. |
| |
| Transfer and Shareholder Servicing Agent | | OFI Global Asset Management, Inc. |
| |
| Sub-Transfer Agent | | Shareholder Services, Inc. |
| |
| | DBA OppenheimerFunds Services |
| |
| Independent Registered Public Accounting Firm | | KPMG LLP |
| |
| Counsel | | K&L Gates LLP |
© 2014 OppenheimerFunds, Inc. All rights reserved.
77 OPPENHEIMER SENIOR FLOATING RATE FUND
PRIVACY POLICY NOTICE
As an Oppenheimer fund shareholder, you are entitled to know how we protect your personal information and how we limit its disclosure.
Information Sources
We obtain nonpublic personal information about our shareholders from the following sources:
| • | | Applications or other forms |
| • | | When you create a user ID and password for online account access |
| • | | When you enroll in eDocs Direct, our electronic document delivery service |
| • | | Your transactions with us, our affiliates or others |
| • | | A software program on our website, often referred to as a “cookie,” which indicates which parts of our site you’ve visited |
| • | | When you set up challenge questions to reset your password online |
If you visit oppenheimerfunds.com and do not log on to the secure account information areas, we do not obtain any personal information about you. When you do log on to a secure area, we do obtain your user ID and password to identify you. We also use this information to provide you with products and services you have requested, to inform you about products and services that you may be interested in and assist you in other ways.
We do not collect personal information through our website unless you willingly provide it to us, either directly by email or in those areas of the website that request information. In order to update your personal information (including your mailing address, email address and phone number) you must first log on and visit your user profile.
If you have set your browser to warn you before accepting cookies, you will receive the warning message with each cookie. You can refuse cookies by turning them off in your browser. However, doing so may limit your access to certain sections of our website.
We use cookies to help us improve and manage our website. For example, cookies help us recognize new versus repeat visitors to the site, track the pages visited, and enable some special features on the website. This data helps us provide a better service for our website visitors.
Protection of Information
We do not disclose any non-public personal information (such as names on a customer list) about current or former customers to anyone, except as permitted by law.
Disclosure of Information
We send your financial advisor (as designated by you) copies of confirmations, account statements and other documents reporting activity in your fund accounts. We may also use details about you and your investments to help us, our financial service affiliates, or firms that jointly market their financial products and services with ours, to better serve your investment needs or suggest financial services or educational material that may be of interest to you. If this requires us to provide you with an opportunity to “opt in” or “opt out” of such information sharing with a firm not affiliated with us, you will receive notification on how to do so, before any such sharing takes place.
Right of Refusal
We will not disclose your personal information to unaffiliated third parties (except as permitted by law), unless we first offer you a reasonable opportunity to refuse or “opt out” of such disclosure.
78 OPPENHEIMER SENIOR FLOATING RATE FUND
Internet Security and Encryption
In general, the email services provided by our website are encrypted and provide a secure and private means of communication with us. To protect your own privacy, confidential and/or personal information should only be communicated via email when you are advised that you are using a secure website.
As a security measure, we do not include personal or account information in non-secure emails, and we advise you not to send such information to us in non-secure emails. Instead, you may take advantage of the secure features of our website to encrypt your email correspondence. To do this, you will need to use a browser that supports Secure Sockets Layer (SSL) protocol.
We do not guarantee or warrant that any part of our website, including files available for download, are free of viruses or other harmful code. It is your responsibility to take appropriate precautions, such as use of an anti-virus software package, to protect your computer hardware and software.
| • | | All transactions, including redemptions, exchanges and purchases, are secured by SSL and 128-bit encryption. SSL is used to establish a secure connection between your PC and OppenheimerFunds’ server. It transmits information in an encrypted and scrambled format. |
| • | | Encryption is achieved through an electronic scrambling technology that uses a “key” to code and then decode the data. Encryption acts like the cable converter box you may have on your television set. It scrambles data with a secret code so that no one can make sense of it while it is being transmitted. When the data reaches its destination, the same software unscrambles the data. |
| • | | You can exit the secure area by either closing your browser, or for added security, you can use the Log Out button before you close your browser. |
Other Security Measures
We maintain physical, electronic and procedural safeguards to protect your personal account information. Our employees and agents have access to that information only so that they may offer you products or provide services, for example, when responding to your account questions.
How You Can Help
You can also do your part to keep your account information private and to prevent unauthorized transactions. If you obtain a user ID and password for your account, do not allow it to be used by anyone else. Also, take special precautions when accessing your account on a computer used by others.
Who We Are
This joint notice describes the privacy policies of the Oppenheimer funds, OppenheimerFunds, Inc., and each of its investment adviser subsidiaries, OppenheimerFunds Distributor, Inc. and OFI Global Trust Co. It applies to all Oppenheimer fund accounts you presently have, or may open in the future, using your Social Security number—whether or not you remain a shareholder of our funds. This notice was last updated November 2013. In the event it is updated or changed, we will post an updated notice on our website at oppenheimerfunds.com. If you have any questions about these privacy policies, write to us at P.O. Box 5270, Denver, CO 80217-5270, email us by clicking on the Contact Us section of our website at oppenheimerfunds.com or call us at 1.800.CALL OPP (225.5677).
79 OPPENHEIMER SENIOR FLOATING RATE FUND

The registrant has adopted a code of ethics that applies to the registrant’s principal executive officer, principal financial officer, principal accounting officer or controller or persons performing similar functions.
| Item 3. | Audit Committee Financial Expert. |
The Board of Trustees of the registrant has determined that F. William Marshall, Jr., the Chairman of the Board’s Audit Committee, is the audit committee financial expert and that Mr. Marshall is “independent” for purposes of this Item 3.
| Item 4. | Principal Accountant Fees and Services. |
The principal accountant for the audit of the registrant’s annual financial statements billed $72,300 in fiscal 2014 and $57,600 in fiscal 2013.
The principal accountant for the audit of the registrant’s annual financial statements billed no such fees in fiscal 2014 and no such fees in fiscal 2013.
The principal accountant for the audit of the registrant’s annual financial statements billed $727,131 in fiscal 2014 and $611,580 in fiscal 2013 to the registrant’s investment adviser or any entity controlling, controlled by, or under common control with the adviser that provides ongoing services to the registrant.
Such services include: Internal control reviews, GIPS attestation procedures, internal audit training, Surprise Exam, reorganization, and system conversion testing.
The principal accountant for the audit of the registrant’s annual financial statements billed no such fees in fiscal 2014 and no such fees in fiscal 2013.
The principal accountant for the audit of the registrant’s annual financial statements billed $202,044 in fiscal 2014 and $443,073 in fiscal 2013 to the registrant’s investment adviser or any entity controlling, controlled by, or under common control with the adviser that provides ongoing services to the registrant.
Such services include: tax compliance, tax planning and tax advice. Tax compliance generally involves preparation of original and amended tax returns, claims for a refund and tax payment-planning services. Tax planning and tax advice includes assistance with tax audits and appeals, tax advice related to mergers and acquisitions and requests for rulings or technical advice from taxing authorities.
The principal accountant for the audit of the registrant’s annual financial statements billed no such fees in fiscal 2014 and no such fees in fiscal 2013.
The principal accountant for the audit of the registrant’s annual financial statements billed no such fees in fiscal 2014 and no such fees in fiscal 2013 to the registrant’s investment adviser or any entity controlling, controlled by, or under common control with the adviser that provides ongoing services to the registrant.
Such fees would include the cost to the principal accountant of attending audit committee meetings and consultations regarding the registrant’s retirement plan with respect to its Trustees.
| (e) | (1) During its regularly scheduled periodic meetings, the registrant’s audit committee will pre-approve all audit, audit-related, tax and other services to be provided by the principal accountants of the registrant. |
The audit committee has delegated pre-approval authority to its Chairman for any subsequent new engagements that arise between regularly scheduled meeting dates provided that any fees such pre-approved are presented to the audit committee at its next regularly scheduled meeting.
Under applicable laws, pre-approval of non-audit services may be waived provided that: 1) the aggregate amount of all such services provided constitutes no more than five percent of the total amount of fees paid by the registrant to its principal accountant during the fiscal year in which services are provided 2) such services were not recognized by the registrant at the time of engagement as non-audit services and 3) such services are promptly brought to the attention of the audit committee of the registrant and approved prior to the completion of the audit.
(2) 0%
| (f) | Not applicable as less than 50%. |
| (g) | The principal accountant for the audit of the registrant’s annual financial statements billed $929,175 in fiscal 2014 and $1,054,653 in fiscal 2013 to the registrant and the registrant’s investment adviser or any entity controlling, controlled by, or under common control with the adviser that provides ongoing services to the registrant related to non-audit fees. Those billings did not include any prohibited non-audit services as defined by the Securities Exchange Act of 1934. |
| (h) | The registrant’s audit committee of the board of Trustees has considered whether the provision of non-audit services that were rendered to the registrant’s investment adviser, and any entity controlling, controlled by, or under common control with the investment adviser that provides ongoing services to the registrant that were not pre-approved pursuant to paragraph (c)(7)(ii) of Rule 2-01 of Regulation S-X is compatible with maintaining the principal accountant’s independence. No such services were rendered. |
| Item 5. | Audit Committee of Listed Registrants |
Not applicable.
| Item 6. | Schedule of Investments. |
a) Not applicable. The complete schedule of investments is included in Item 1 of this Form N-CSR.
b) Not applicable.
| Item 7. | Disclosure of Proxy Voting Policies and Procedures for Closed-End Management Investment Companies. |
Not applicable.
| Item 8. | Portfolio Managers of Closed-End Management Investment Companies. |
Not applicable.
| Item 9. | Purchases of Equity Securities by Closed-End Management Investment Company and Affiliated Purchasers. |
Not applicable.
| Item 10. | Submission of Matters to a Vote of Security Holders. |
The Fund’s Governance Committee Provisions with Respect to Nominations of Directors/Trustees to the Respective Boards
None
| Item 11. | Controls and Procedures. |
Based on their evaluation of the registrant’s disclosure controls and procedures (as defined in rule 30a-3(c) under the Investment Company Act of 1940 (17 CFR 270.30a-3(c)) as of 7/31/2014, the registrant’s principal executive officer and principal financial officer found the registrant’s disclosure controls and procedures to provide reasonable assurances that information required to be disclosed by the registrant in the reports that it files under the Securities Exchange Act of 1934 (a) is accumulated and communicated to registrant’s management, including its principal executive officer and principal financial officer, to allow timely decisions regarding required disclosure, and (b) is recorded, processed, summarized and reported, within the time periods specified in the rules and forms adopted by the U.S. Securities and Exchange Commission.
There have been no changes in the registrant’s internal controls over financial reporting that occurred during the registrant’s second fiscal quarter of the period covered by this report that have materially affected, or are reasonably likely to materially affect, the registrant’s internal control over financial reporting.
| (a) | (1) Exhibit attached hereto. |
(2) Exhibits attached hereto.
(3) Not applicable.
| (b) | Exhibit attached hereto. |
SIGNATURES
Pursuant to the requirements of the Securities Exchange Act of 1934 and the Investment Company Act of 1940, the registrant has duly caused this report to be signed on its behalf by the undersigned, thereunto duly authorized.
Oppenheimer Senior Floating Rate Fund
| | |
| By: | | /s/ William F. Glavin, Jr. |
| | William F. Glavin, Jr. |
| | Principal Executive Officer |
| |
| Date: | | 9/10/2014 |
Pursuant to the requirements of the Securities Exchange Act of 1934 and the Investment Company Act of 1940, this report has been signed below by the following persons on behalf of the registrant and in the capacities and on the dates indicated.
| | |
| By: | | /s/ William F. Glavin, Jr. |
| | William F. Glavin, Jr. |
| | Principal Executive Officer |
| |
| Date: | | 9/10/2014 |
| | |
| By: | | /s/ Brian W. Wixted |
| | Brian W. Wixted |
| | Principal Financial Officer |
| |
| Date: | | 9/10/2014 |