INVESTMENT ADVISER NAME CHANGE
Effective January 1, 2011, Nuveen Asset Management, the Funds’ investment adviser, changed its name to Nuveen Fund Advisors, Inc. (“Nuveen Fund Advisors”). Concurrently, Nuveen Fund Advisors formed a wholly-owned subsidiary, Nuveen Asset Management, LLC, to house its portfolio management capabilities.
NUVEEN INVESTMENTS COMPLETES STRATEGIC COMBINATION WITH FAF ADVISORS
On December 31, 2010, Nuveen Investments completed the strategic combination between Nuveen Asset Management, LLC, the largest investment affiliate of Nuveen Investments, and FAF Advisors. As part of this transaction, U.S. Bancorp – the parent of FAF Advisors – received cash consideration and a 9.5% stake in Nuveen Investments in exchange for the long term investment business of FAF Advisors, including investment-management responsibilities for the non-money market mutual funds of the First American Funds family.
The approximately $27 billion of mutual fund and institutional assets managed by FAF Advisors, along with the investment professionals managing these assets and other key personnel, have become part of Nuveen Asset Management, LLC. With these additions to Nuveen Asset Management, LLC, this affiliate now manages more than $100 billion of assets across a broad range of strategies from municipal and taxable fixed income to traditional and specialized equity investments.
This combination does not affect the investment objectives or strategies of the Funds in this report. Over time, Nuveen Investments expects that the combination will provide even more ways to meet the needs of investors who work with financial advisors and consultants by enhancing the multi-boutique model of Nuveen Investments, which also includes highly respected investment teams at HydePark, NWQ Investment Management, Santa Barbara Asset Management, Symphony Asset Management, Tradewinds Global Investors and Winslow Capital. Nuveen Investments managed approximately $197 billion of assets as of December 31, 2010.
Table of Contents
| | |
Chairman’s Letter to Shareholders | 4 |
Portfolio Manager’s Comments | 5 |
Common Share Dividend and Share Price Information | 14 |
Performance Overviews | 16 |
Shareholder Meeting Report | 23 |
Report of Independent Registered Public Accounting Firm | 26 |
Portfolios of Investments | 27 |
Statement of Assets and Liabilities | 63 |
Statement of Operations | 65 |
Statement of Changes in Net Assets | 67 |
Statement of Cash Flows | 70 |
Financial Highlights | 71 |
Notes to Financial Statements | 80 |
Board Members & Officers | 94 |
Annual Investment Management Agreement Approval Process | 99 |
Board Approval of Sub-Advisory Arrangements | 106 |
Reinvest Automatically, Easily and Conveniently | 107 |
Glossary of Terms Used in this Report | 109 |
Other Useful Information | 111 |
Chairman’s
Letter to Shareholders
Dear Shareholders,
In 2010, the global economy recorded another year of recovery from the financial and economic crises of 2008, but many of the factors that caused the downturn still weigh on the prospects for continued improvement. In the U.S., ongoing weakness in housing values has put pressure on homeowners and mortgage lenders. Similarly, the strong earnings recovery for corporations and banks is only slowly being translated into increased hiring or more active lending. Globally, deleveraging by private and public borrowers has inhibited economic growth and that process is far from complete.
Encouragingly, constructive actions are being taken by governments around the world to deal with economic issues. In the U.S., the recent passage of a stimulatory tax bill relieved some of the pressure on the Federal Reserve to promote economic expansion through quantitative easing and offers the promise of sustained economic growth. A number of European governments are undertaking programs that could significantly reduce their budget deficits. Governments across the emerging markets are implementing various steps to deal with global capital flows without undermining international trade and investment.
The success of these government actions could determine whether 2011 brings further economic recovery and financial market progress. One risk associated with the extraordinary efforts to strengthen U.S. economic growth is that the debt of the U.S. government will continue to grow to unprecedented levels. Another risk is that over time there could be inflationary pressures on asset values in the U.S. and abroad, because what happens in the U.S. impacts the rest of the world economy. Also, these various actions are being taken in a setting of heightened global economic uncertainty, primarily about the supplies of energy and other critical commodities. In this challenging environment, your Nuveen investment team continues to seek sustainable investment opportunities and to remain alert to potential risks in a recovery still facing many headwinds. On your behalf, we monitor their activities to assure they maintain their investment disciplines.
As you will note elsewhere in this report, on December 31, 2010, Nuveen Investments completed a strategic combination with FAF Advisors, Inc., the manager of the First American Funds. The combination adds highly respected and distinct investment teams to meet the needs of investors and their advisors and is designed to benefit all fund shareholders by creating a fund organization with the potential for further economies of scale and the ability to draw from even greater talent and expertise to meet those investor needs.
As of the end of April, 2011, Nuveen Investments had completed the refinancing of all of the Auction Rate Preferred Securities issued by its taxable closed-end funds and 80% of the Muni Preferred shares issued by its tax-exempt closed-end funds. Please consult the Nuveen Investments web site, www.Nuveen.com, for the current status of this important refi-nancing program.
As always, I encourage you to contact your financial consultant if you have any questions about your investment in a Nuveen Fund. On behalf of the other members of your Fund Board, we look forward to continuing to earn your trust in the months and years ahead.
Sincerely,
Robert P. Bremner
Chairman of the Board
April 26, 2011
4 Nuveen Investments
Portfolio Manager’s Comments
Nuveen Michigan Quality Income Municipal Fund, Inc. (NUM)
Nuveen Michigan Premium Income Municipal Fund, Inc. (NMP)
Nuveen Michigan Dividend Advantage Municipal Fund (NZW)
Nuveen Ohio Quality Income Municipal Fund, Inc. (NUO)
Nuveen Ohio Dividend Advantage Municipal Fund (NXI)
Nuveen Ohio Dividend Advantage Municipal Fund 2 (NBJ)
Nuveen Ohio Dividend Advantage Municipal Fund 3 (NVJ)
Portfolio manager Daniel Close discusses economic and municipal market conditions at both the national and state levels, key investment strategies, and the twelve-month performance of the Nuveen Michigan and Ohio Funds. Dan, who joined Nuveen in 2000, assumed portfolio management responsibility for these seven Funds in 2007.
What factors affected the U.S. economic and municipal market environments during the twelve-month reporting period ended February 28, 2011?
During this period, the U.S. economy demonstrated some signs of improvement, supported by the efforts of both the Federal Reserve (Fed) and the federal government. For its part, the Fed continued to hold the benchmark fed funds rate in a target range of zero to 0.25% since cutting it to this record low level in December 2008. At its March 2011 meeting (after the end of this reporting period), the central bank renewed its commitment to keeping the fed funds rate at “exceptionally low levels” for an “extended period.” The Fed also left unchanged its second round of quantitative easing, which calls for purchasing $600 billion in U.S. Treasury bonds by June 30, 2011. The goal of this plan is to lower long-term interest rates and thereby stimulate economic activity and create jobs. The federal government continued to focus on implementing the economic stimulus package passed in early 2009 and aimed at providing job creation, tax relief, fiscal assistance to state and local governments and expansion of unemployment benefits and other federal social welfare programs.
In the fourth quarter of 2010, the U.S. economy, as measured by the U.S. gross domestic product (GDP), grew at an annualized rate of 3.1%, marking the first time the economy put together six consecutive quarters of positive growth since 2006-2007. In February 2011, national unemployment dropped below 9% for the first time in 21 months, standing at 8.9%, down from 9.7% a year earlier. At the same time, inflation posted its largest gain since April 2009, as the Consumer Price Index (CPI) rose 2.1% year-over-year as of February 2011, driven mainly by increased prices for energy. The core CPI (which excludes food and energy) increased 1.1% over this period. The housing market continued to be
Certain statements in this report are forward-looking statements. Discussions of specific investments are for illustration only and are not intended as recommendations of individual investments. The forward-looking statements and other views expressed herein are those of the portfolio manager as of the date of this report. Actual future results or occurrences may differ significantly from those anticipated in any forward-looking statements, and the views expressed herein are subject to change at any time, due to numerous market and other factors. The Funds disclaim any obligation to update publicly or revise any forward-looking statements or views expressed herein.
Any reference to credit ratings for portfolio holdings denotes the highest rating assigned by a Nationally Recognized Statistical Rating Organization (NRSRO) such as Standard & Poor’s (S&P), Moody’s or Fitch. AAA, AA, A and BBB ratings are investment grade; BB, B, CCC, CC, C and D ratings are below investment grade. Holdings and ratings may change over time.
Nuveen Investments 5
the weak spot in the economy. For the twelve months ended January 2011 (most recent data available at the time this report was prepared), the average home price in the Standard & Poor’s (S&P)/Case-Shiller index of 20 major metropolitan areas lost 3.1%, with 11 of the 20 metropolitan areas hitting their lowest levels since housing prices peaked in 2006.
Municipal bond prices generally rose during the first eight months of this period, as the combination of strong demand and tight supply of new tax-exempt issuance created favorable market conditions. One reason for the decrease in new tax-exempt supply was the heavy issuance of taxable municipal debt under the Build America Bond (BAB) program, which was created as part of the American Recovery and Reinvestment Act of February 2009 and which expired December 31, 2010. Build America Bonds generally offered municipal issuers a federal subsidy equal to 35% of a bond’s interest payments, providing issuers with an alternative to traditional tax-exempt debt that often was lower in cost. For the period March 1, 2010 through December 31, 2010, taxable Build America Bonds issuance totaled $117.3 billion, accounting for 24% of new bonds issued in the municipal market. After rallying strongly over most of the period, the municipal market suffered a reversal in mid-November 2010, due largely to investor concerns about inflation, the federal deficit, and its impact on demand for U.S. Treasuries. Adding to this situation was the popular media’s coverage of the strained finances of many state and local governments, which often failed to differentiate between gaps in operating budgets and those entities’ ability to meet their debt service obligation. As a result, money began to flow out of municipal funds, yields rose and valuations fell. Toward the end of this period, we saw the environment in the municipal market improve, as crossover buyers—including hedge funds and life insurance companies—were attracted by municipal bond prices and tax-exempt yields, resulting in decreased outflows, declining yields and rising valuations.
Over the twelve months ended February 28, 2011, municipal bond issuance nationwide—both tax-exempt and taxable—totaled $423.4 billion. Demand for municipal bonds was exceptionally strong during the majority of this period, especially from individual investors. In recent months, crossover buyers have provided support for the market.
How were the economic and market environments in Michigan and Ohio during this period?
Michigan, which has one of the weakest state economies in the nation, continued to face serious challenges as it struggled to emerge from recession. In 2009 (latest data available at the time this report was prepared), the state saw its economy contract at a rate of -5.2%, compared with the national average of -2.1%. As of February 2011, Michigan’s jobless rate was 10.4%, its best reading since November 2008, down from 13.5% in February 2010, although some of the decrease was attributable to fewer job seekers in the state. The state also continued to experience declining home values. According to the S&P/Case-Shiller home price index of 20 major metropolitan areas, housing prices in Detroit fell 8.1% over the twelve months ended January 2011, hitting a new low. This drop, which ranked as the second largest in the index for this period (after Phoenix), compared with an average decrease of 3.1% nationwide. For fiscal 2011, Michigan
6 Nuveen Investments
closed the shortfall in its $46.7 billion state budget through the use of spending cuts, including a 3% reduction for all state agencies, federal stimulus money, debt restructuring, a state employee retirement incentive plan and a tax amnesty program. Because these were largely one-time measures, the state faces a structural gap in fiscal 2012 estimated at $1.4 billion. As of February 2011, Moody’s and Standard & Poor’s (S&P) rated Michigan general obligation (GO) debt at Aa2 and AA-, respectively, with stable outlooks. During the twelve months ended February 2011, municipal issuance (both taxable & tax-exempt) in Michigan totaled $8.3 billion, an increase of 32.5% compared with the twelve months ended February 2010.
Ohio’s economy continued to be weak and overly reliant on manufacturing, although that was offset to some degree by the state’s large and diverse tax base and highly educated workforce in major metropolitan areas. For 2009, Ohio posted negative GDP growth of –2.7%, compared with the national average of –2.1%, which ranked Ohio 38th in percent change of economic growth by state. As of February 2011, Ohio’s unemployment rate was 9.2%, the lowest since February 2009, down from 10.6% in February 2010. The state’s housing market, while improving, has yet to make the transition to recovery. According to the S&P/Case-Shiller home price index of 20 major metropolitan areas, housing prices in Cleveland fell 3.8% during the twelve months ended January 2011, compared with an average decline of 3.1% nationally. On the fiscal front, state officials forecast the general fund will end fiscal 2011 with a cash balance of $154 million. After depleting the budget stabilization fund in fiscal 2009 and drawing down general fund reserves in fiscal 2010, Ohio has limited options to deal with future budget pressures. The budget gap for fiscal 2012 is currently estimated at $4 billion. As of February 2011, Moody’s and Standard & Poor’s (S&P) rated Ohio general obligation debt at Aa1 and AA+, respectively, with negative outlooks. For the twelve months ended February 2011, municipal issuance (both taxable & tax-exempt) in Ohio totaled $15.9 billion, an increase of approximately 30% compared with the twelve months ended February 2010.
What key strategies were used to manage the Michigan and Ohio Funds during this reporting period?
As previously mentioned, the supply of tax-exempt bonds declined nationally during this period, due largely to the issuance of taxable bonds under the BABs program (which expired December 31, 2010). This program also impacted the availability of tax-exempt bonds in Ohio and Michigan, which ranked 5th and 19th, respectively, in terms of dollar amount of BABs issued in 2010. Between March 1, 2010, and the end of the program in December 2010, Build America Bonds accounted for approximately 15% of municipal supply in Michigan and over 36% of Ohio’s supply. Since interest payments from Build America Bonds represent taxable income, we did not view these bonds as good investment opportunities for these Funds.
Despite the constrained issuance on tax-exempt municipal bonds, we continued to take a bottom-up approach to discovering undervalued sectors and individual credits with the potential to perform well over the long term. During this period, the Michigan Funds found value in several areas of the market, including health care, single-family housing
Nuveen Investments 7
and tobacco bonds. Because of the limitations placed on tax-exempt supply by the Build America Bond program, we also purchased territorial paper when necessary to keep the Funds fully invested, including a lower-rated, investment grade water and sewer bond issued by Puerto Rico for NUM and NZW. All of the bonds purchased for the Michigan Funds during this period offered longer maturities.
In the Ohio Funds, our purchases included a number of health care issues with longer maturities and an intermediate-maturity tax-backed credit issued for Cuyahoga County. NUO also bought a couple of additional credits offering intermediate maturities: an electric utility bond and a higher education issue both lower-rated, investment grade. In NXI, we purchased the same higher education credit as NUO as well as the Puerto Rico water and sewer bond. The Ohio Funds also swapped some of their higher dollar priced Buckeye tobacco holdings for tobacco bonds with lower dollar prices. This swap benefited the Funds by enhancing income generation through higher book yields and recognizing losses for tax purposes.
Some of this investment activity resulted from opportunities created by the provisions of the Build America Bond program. For example, tax-exempt supply was more plentiful in the health care and higher education sectors because, as 501(c)(3) (nonprofit) organizations, hospitals and private universities generally did not qualify for the Build America Bond program and continued to issue bonds in the tax-exempt municipal market. Bonds with proceeds earmarked for refundings, working capital and private activities also were not covered by the Build America Bond program, and this resulted in attractive opportunities in various other sectors of the market.
The impact of the Build America Bond program was also evident in the area of longer-term issuance, as municipal issuers sought to take full advantage of the attractive financing terms offered by these bonds. Approximately 70% of Build America Bonds were issued with maturities of at least 30 years. Although this had a significant impact on the availability of tax-exempt credits with longer maturities, the Funds continued to focus on purchasing bonds at the longer end of the yield curve when appropriate bonds became available.
Cash for new purchases during this period was generated primarily by the proceeds from bond calls and maturing bonds, which we worked to redeploy to keep the Funds fully invested. In the Michigan Funds, holdings of bonds issued for the Detroit Medical Center were called as part of the center’s acquisition by the for-profit Vanguard Health Systems in 2010. This produced a substantial amount of cash for reinvestment. In addition, the Michigan Funds closed out positions in some out-of-state paper from New Mexico and Virginia and reinvested the proceeds in additional Michigan bonds. The Ohio Funds also sold some short-dated pre-refunded bonds to fund purchases during this period.
As of February 28, 2011, all seven of these Funds continued to use inverse floating rate securities. We employ inverse floaters as a form of leverage for a variety of reasons, including duration management, income enhancement and total return enhancement.
8 Nuveen Investments
How did the Funds perform?
Individual results for these Nuveen Michigan and Ohio Funds, as well as relevant index and peer group information, are presented in the accompanying table.
| | | | | | | | | | |
Average Annual Total Returns on Common Share Net Asset Value | | | | | | | | | |
For periods ended 2/28/11 | | | | | | | | | |
| | | 1-Year | | | 5-Year | | | 10-Year | |
Michigan Funds | | | | | | | | | |
NUM | | | 1.39 | % | | | 3.39 | % | | | 5.32 | % |
NMP | | | 2.55 | % | | | 3.53 | % | | | 5.26 | % |
NZW | | | 0.70 | % | | | 2.93 | % | | | N/A | |
Standard & Poor’s (S&P) Michigan Municipal Bond Index1 | | | 2.21 | % | | | 3.65 | % | | | 4.72 | % |
Standard & Poor’s (S&P) National Municipal Bond Index2 | | | 1.63 | % | | | 3.74 | % | | | 4.75 | % |
Lipper Michigan Municipal Debt Funds Average3 | | | -0.71 | % | | | 2.80 | % | | | 4.92 | % |
| | | | | | | | | | | | | |
Ohio Funds | | | | | | | | | | | | |
NUO | | | 1.09 | % | | | 3.92 | % | | | 5.39 | % |
NXI | | | -0.23 | % | | | 3.83 | % | | | N/A | |
NBJ | | | 1.00 | % | | | 3.73 | % | | | N/A | |
NVJ | | | -0.66 | % | | | 3.88 | % | | | N/A | |
Standard & Poor’s (S&P) Ohio Municipal Bond Index1 | | | 0.02 | % | | | 3.09 | % | | | 4.36 | % |
Standard & Poor’s (S&P) National Municipal Bond Index2 | | | 1.63 | % | | | 3.74 | % | | | 4.75 | % |
Lipper Other States Municipal Debt Funds Average4 | | | 0.54 | % | | | 3.14 | % | | | 5.11 | % |
For the twelve months ended February 28, 2011, the total return on common share net asset value (NAV) for NMP exceeded the return for the Standard & Poor’s (S&P) Michigan Municipal Bond Index, while NUM and NZW lagged this return. Among the Ohio Funds, NUO and NBJ outperformed the Standard & Poor’s (S&P) Ohio Municipal Bond Index, while NXI and NVJ underperformed this index. For the same period, NMP surpassed the return on the Standard & Poor’s (S&P) National Municipal Bond Index, while the remaining six Funds trailed the national index. All three Michigan Funds outperformed the average return for the Lipper Michigan Municipal Debt Funds Average, while NUO and NBJ exceeded the average return for the Lipper Other States Municipal Debt Funds Average and NXI and NVJ lagged the Other States average.
Key management factors that influenced the Funds’ returns during this period included duration and yield curve positioning, credit exposure and sector allocation. In addition, NUO, NBJ and NMP benefited from strong individual security selection. The use of financial leverage also factored into the Funds’ performance. Leverage is discussed in more detail on page ten.
During this period, municipal bonds with intermediate maturities, especially those in the long intermediate segment of the yield curve, generally outperformed other maturity groupings, with credits at both the shortest and longest ends of the curve posting the weakest returns. In general, duration and yield curve positioning was a positive contributor to the performances of NMP, NZW, NUO and NBJ. These Funds tended to have less exposure to the underperforming longest part of the yield curve and more exposure to
Past performance is not predictive of future results. Current performance may be higher or lower than the data shown. Returns do not reflect the deduction of taxes that shareholders may have to pay on Fund distributions or upon the sale of Fund shares.
For additional information, see the individual Performance Overview for your Fund in this report.
| 1 | The Standard & Poor’s (S&P) Municipal Bond Indexes for Michigan and Ohio are unleveraged, market value-weighted indexes designed to measure the performance of the tax-exempt, investment-grade municipal bond markets in Michigan and Ohio, respectively. These indexes do not reflect any initial or ongoing expenses and are not available for direct investment. |
| 2 | The Standard & Poor’s (S&P) National Municipal Bond Index is an unleveraged, market value-weighted index designed to measure the performance of the tax-exempt, investment-grade U.S. municipal bond market. This index does not reflect any initial or ongoing expenses and is not available for direct investment. |
| 3 | The Lipper Michigan Municipal Debt Funds Average is calculated using the returns of all closed-end funds in this category for each period as follows: 1-year, 7 funds; 5-year, 7 funds; and 10-year, 4 funds. Lipper returns account for the effects of management fees and assume reinvestment of dividends, but do not reflect any applicable sales charges. The Lipper average is not available for direct investment. |
| 4 | The Lipper Other States Municipal Debt Funds Average is calculated using the returns of all leveraged and unleveraged closed-end funds in this category for each period as follows: 1-year, 46 funds; 5-year, 46 funds; and 10-year, 20 funds. The performance of the Lipper Other States category represents the overall average of returns for funds from ten different states with a wide variety of municipal market conditions. Shareholders should note that the performance of the Lipper Other States category represents the overall average of returns for funds from ten different states with a wide variety of municipal market conditions, making direct comparisons less meaningful. Lipper returns account forthe effects of management fees and assume reinvestment of dividends, but do not reflect any applicable sales charges. The Lipper average is not available for direct investment. |
Nuveen Investments 9
the intermediate segments of the curve that outperformed. NUM, NXI, and NVJ were not as advantageously positioned, due mainly to their overweightings in the longest part of the curve. This detracted from the performance of these three Funds.
Credit exposure also played an important role in performance during these twelve months. During the market reversal of late 2010, as the demand for high-yield bonds decreased, prices on lower quality credits generally fell. For the period, bonds rated BBB typically underperformed those rated AAA or A. In general, these Funds tended to be overweight in bonds rated A, which benefited their performance. NUM also benefited by having the smallest weighting of bonds rated BBB among these Funds.
Holdings that generally made positive contributions to the Funds’ returns during this period included general obligation and other tax-supported bonds, industrial development revenue (IDR) bonds, and housing credits. The Funds’ allocations of tax-supported bonds, especially the Ohio Funds’ underexposure to state GOs, generally limited their participation in the outperformance of this sector. An overweight in IDRs helped to boost the returns of the Michigan Funds. In general, all of these Funds had relatively small allocations to housing bonds, which lessened the positive impact of this sector.
In contrast, the hospital, education and transportation sectors turned in relatively weak performance, and tobacco bonds were among the poorest performers. While the Ohio Funds’ overweighting in hospitals detracted from their performance, the Michigan Funds were helped by their underweights in transportation. The insured segment also failed to keep pace with the general municipal market return for the twelve months, as did pre-refunded bonds, which are typically backed by U.S. Treasury securities. Among these Funds, NVJ had the heaviest exposure to pre-refunded bonds and NMP the smallest allocation.
IMPACT OF THE FUNDS’ LEVERAGE STRATEGIES ON PERFORMANCE
One important factor impacting the returns of most of these Funds relative to the comparative indexes was the Funds’ use of structural leverage. The Funds use leverage because their managers believe that, over time, leveraging provides opportunities for additional income and total return for common shareholders. However, use of leverage also can expose common shareholders to additional volatility. For example, as the prices of securities held by a Fund decline, the negative impact of these valuation changes on common share net asset value and common shareholder total return is magnified by the use of leverage. Conversely, leverage may enhance common share returns during periods when the prices of securities held by a Fund generally are rising. Leverage made a positive contribution to the performance of these Funds over this reporting period.
10 Nuveen Investments
RECENT DEVELOPMENTS REGARDING THE FUNDS’ REDEMPTION OF AUCTION RATE PREFERRED SHARES
Shortly after their respective inception, each of the Funds issued auction rate preferred shares (ARPS) to create structural leverage. As noted in past shareholder reports, the ARPS issued by many closed-end funds, including these Funds, have been hampered by a lack of liquidity since February 2008. Since that time, more ARPS have been submitted for sale in each of their regularly scheduled auctions than there have been offers to buy. In fact, offers to buy have been almost completely non-existent since late February 2008. This means that these auctions have “failed to clear,” and that many, or all, of the ARPS shareholders who wanted to sell their shares in these auctions were unable to do so. This lack of liquidity in ARPS did not lower the credit quality of these shares, and ARPS shareholders unable to sell their shares continued to receive distributions at the “maximum rate” applicable to failed auctions, as calculated in accordance with the pre-established terms of the ARPS. In the recent market, with short-term rates at multigenerational lows, those maximum rates also have been low.
One continuing implication for common shareholders from the auction failures is that each Fund’s cost of leverage likely has been incrementally higher at times than it otherwise might have been had the auctions continued to be successful. As a result, each Fund’s common share earnings likely have been incrementally lower at times than they otherwise might have been.
As noted in past shareholder reports, the Nuveen funds’ Board of Directors/Trustees authorized several methods that can be used separately or in combination to refinance a portion of the Nuveen funds’ outstanding ARPS. Some funds have utilized tender option bonds (TOBs), also known as inverse floating rate securities, for leverage purposes. The amount of TOBs that a fund may use varies according to the composition of each fund’s portfolio. Some funds have a greater ability to use TOBs than others. Some funds have issued Variable Rate Demand Preferred (VRDP) Shares as well as Variable MuniFund Term Preferred (VMTP) Shares, which are a floating rate form of preferred stock with a mandatory term redemption. Some funds have issued MuniFund Term Preferred (MTP) Shares, a fixed rate form of preferred stock with a mandatory redemption period of three to five years.
While all these efforts have reduced the total amount of outstanding ARPS issued by the Nuveen funds, the funds cannot provide any assurance on when the remaining outstanding ARPS might be redeemed.
During 2010 and 2011, certain Nuveen leveraged closed-end funds (excluding all of the Funds in this report) received a demand letter from a law firm on behalf of purported holders of common shares of each such fund, alleging that Nuveen and the funds’ officers and Board of Directors/Trustees breached their fiduciary duties related to the redemption at par of the funds’ ARPS. In response, the Board established an ad hoc Demand Committee consisting of certain of its disinterested and independent Board members to investigate the claims. The Demand Committee retained independent
Nuveen Investments 11
counsel to assist it in conducting an extensive investigation. Based upon its investigation, the Demand Committee found that it was not in the best interests of each fund or its shareholders to take the actions suggested in the demand letters, and recommended that the full Board reject the demands made in the demand letters. After reviewing the findings and recommendation of the Demand Committee, the full Board of each fund unanimously adopted the Demand Committee’s recommendation.
Subsequently, the funds that received demand letters (excluding all of the Funds in this report) were named in a consolidated complaint as nominal defendants in a putative shareholder derivative action captioned Martin Safier, et al. v. Nuveen Asset Management, et al. that was filed in the Circuit Court of Cook County, Illinois, Chancery Division (the “Cook County Chancery Court”) on February 18, 2011 (the “Complaint”). The Complaint, filed on behalf of purported holders of each fund’s common shares, also name Nuveen Fund Advisors, Inc as a defendant, together with current and former Officers and interested Director/Trustees of each of the funds (together with the nominal defendants, collectively, the “Defendants”). The Complaint contains the same basic allegations contained in the demand letters. The suits seek a declaration that the Defendants have breached their fiduciary duties, an order directing the Defendants not to redeem any ARPS at their liquidation value using fund assets, indeterminate monetary damages in favor of the funds and an award of plaintiffs’ costs and disbursements in pursuing the action. Nuveen Fund Advisors, Inc. believes that the Complaint is without merit, and is defending vigorously against these charges.
As of February 28, 2011, the amount of ARPS redeemed by the Funds is shown in the accompanying table.
| | | |
| | Auction Rate | % of Original |
| | Preferred Shares | Auction Rate |
Fund | Redeemed | Preferred Shares |
NUM | $ 6,675,000 | 7.1% |
NMP | $ 2,300,000 | 4.1% |
NZW | $16,000,000 | 100.0% |
NUO | $ 4,000,000 | 5.2% |
NXI | $18,500,000 | 59.7% |
NBJ | $ 2,400,000 | 10.0% |
NVJ | $ 1,000,000 | 6.1% |
During the twelve-month reporting period, NZW and NXI successfully completed the issuance of MTP, which trade on the New York Stock Exchange (NYSE) under the ticker symbols as noted in the following table. The net proceeds from these offerings were used to refinance all, or a portion of, each Fund’s remaining outstanding ARPS at par.
| | | | | |
| | | | | NYSE |
Fund | MTP Issued | Series | Rate | Ticker |
NZW | $16,313,000 | 2015 | 2.30% | NZW PrC |
NXI | $19,450,000 | 2015 | 2.35% | NXI PrC |
12 Nuveen Investments
Subsequent to the reporting period, NXI completed the issuance of $10.6 million of 2.95%, Series 2016 MTP. The newly issued MTP shares trade on the NYSE under the symbol “NXI Pr D.” The net proceeds from this offering were used to refinance the Fund’s remaining outstanding ARPS at par. Immediately following its MTP issuance, NXI noticed for redemption at par its remaining $12.5 million ARPS outstanding using the MTP proceeds.
Subsequent to the reporting period, NBJ completed the issuance of $24.2 million of 2.35%, Series 2014 MTP. The newly issued MTP shares trade on the NYSE under the symbol “NBJ Pr A.” The net proceeds from this offering were used to refinance the Fund’s remaining outstanding ARPS at par. Immediately following its MTP issuance, NXI noticed for redemption at par its remaining $21.6 million ARPS outstanding using the MTP proceeds.
Subsequent to the reporting period, NVJ completed the issuance of $16.1 million of 2.35%, Series 2014 MTP. The newly issued MTP shares trade on the NYSE under the symbol “NVJ Pr A.” The net proceeds from this offering were used to refinance the Fund’s remaining outstanding ARPS at par. Immediately following its MTP issuance, NVJ noticed for redemption at par its remaining $15.5 million ARPS outstanding using the MTP proceeds.
(Refer to Notes to Financial Statements, Footnote 1 – General Information and Significant Accounting Policies and Footnote 4 – Fund Shares for further details on MTP Shares.)
At the time this report was prepared, all 84 of the Nuveen closed-end municipal funds that had issued ARPS have redeemed at par all or a portion of these shares. These redemptions bring the total amount of Nuveen’s municipal closed-end funds’ ARPS redemptions to approximately $8.8 billion of the approximately $11.0 billion originally outstanding.
For up-to-date information, please visit the Nuveen CEF Auction Rate Preferred Resource Center at: http://www.nuveen.com/arps.
Nuveen Investments 13
Common Share Dividend and Share Price Information
During the twelve months ended February 28, 2011, each of the seven Funds in this report had one monthly dividend increase.
All of the Funds in this report seek to pay stable dividends at rates that reflect each Fund’s past results and projected future performance. During certain periods, each Fund may pay dividends at a rate that may be more or less than the amount of net investment income actually earned by the Fund during the period. If a Fund has cumulatively earned more than it has paid in dividends, it holds the excess in reserve as undistributed net investment income (UNII) as part of the Fund’s NAV. Conversely, if a Fund has cumulatively paid dividends in excess of its earnings, the excess constitutes negative UNII that is likewise reflected in the Fund’s NAV. Each Fund will, over time, pay all of its net investment income as dividends to shareholders. As of February 28, 2011, all of the Funds in this report had positive UNII balances for both tax purposes and financial reporting purposes.
COMMON SHARE REPURCHASES AND SHARE PRICE INFORMATION
As of February 28, 2011, and the since inception of the Funds’ repurchase program, the following Funds have cumulatively repurchased and retired common shares as shown in the accompanying table.
| | | |
| | Common Shares | % of Outstanding |
Fund | Repurchased and Retired | Common Shares |
NUM | 157,300 | 1.4% |
NMP | 145,400 | 2.0% |
NZW | 13,900 | 0.7% |
NUO | | |
NXI | 600 | 0.0%* |
NBJ | – | – |
NVJ | 1,700 | 0.1% |
* Rounds to less than 0.1%.
14 Nuveen Investments
During the twelve-month reporting period, the following Funds repurchased and retired common shares at a weighted average price and a weighted average discount per common share as shown in the accompanying table.
| | | | |
| | | Weighted Average | Weighted Average |
| | Common Shares | Price Per Share | Discount Per Share |
| | Repurchased | Repurchased | Repurchased |
Fund | and Retired | and Retired | and Retired |
NUM | 3,400 | $12.75 | 13.81% |
NMP | 8,300 | $12.63 | 12.55% |
NZW | 1,700 | $11.98 | 11.21% |
As of February 28, 2011, the Funds’ common share prices were trading at (-)discounts to their common share NAVs as shown in the accompanying table.
| | | |
| | 2/28/11 | Twelve-Month Average |
Fund | (-)Discount | (-)Discount |
NUM | (-)10.08% | (-)8.30% |
NMP | (-)9.25% | (-)8.42% |
NZW | (-)10.15% | (-)8.32% |
NUO | (-)3.82% | (-)2.58% |
NXI | (-)6.73% | (-)2.26% |
NBJ | (-)7.47% | (-)3.12% |
NVJ | (-)4.39% | (-)0.09% |
Nuveen Investments 15
| | |
NUM | Nuveen Michigan |
| | Quality Income |
Performance | Municipal Fund, Inc. |
OVERVIEW | |
| | as of February 28, 2011 |
| | | |
Fund Snapshot | | |
Common Share Price | | $12.75 |
Common Share Net Asset Value (NAV) | $14.18 |
Premium/(Discount) to NAV | | -10.08% |
Market Yield | | 6.59% |
Taxable-Equivalent Yield1 | | 9.56% |
Net Assets Applicable to | | |
Common Shares ($000) | | $163,876 |
| | | |
Average Annual Total Return | | |
(Inception 10/17/91) | | |
| | On Share Price | On NAV |
1-Year | 4.69% | 1.39% |
5-Year | 1.86% | 3.39% |
10-Year | 4.67% | 5.32% |
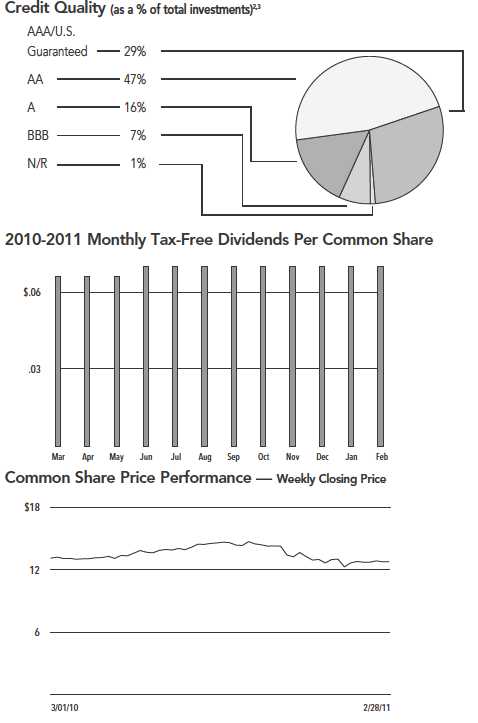
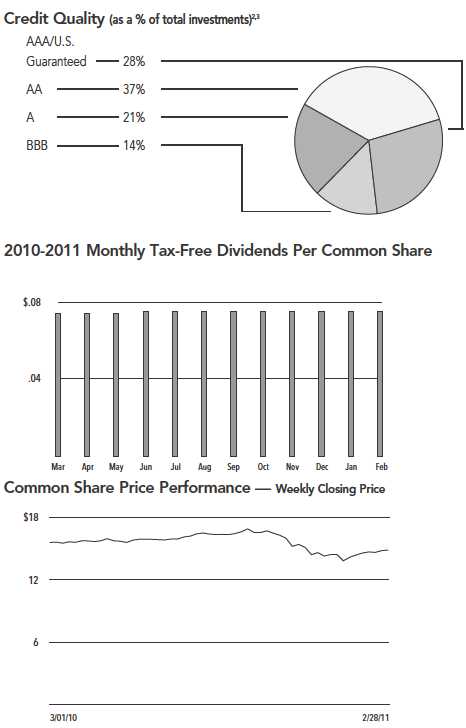
Portfolio Composition3 | | |
(as a % of total investments) | | |
Tax Obligation/General | | 35.8% |
U.S. Guaranteed | | 16.5% |
Tax Obligation/Limited | | 11.9% |
Utilities | | 9.9% |
Health Care | | 9.1% |
Water and Sewer | | 7.8% |
Other | | 9.0% |
| | Refer to the Glossary of Terms Used in this Report for further definition of the terms used within this Fund’s Performance Overview page. |
| 1 | Taxable-Equivalent Yield represents the yield that must be earned on a fully taxable investment in order to equal the yield of the Fund on an after-tax basis. It is based on a combined federal and state income tax rate of 31.1%. When comparing this Fund to investments that generate qualified dividend income, the Taxable-Equivalent Yield is lower. |
| 2 | Ratings shown are the highest of Standard & Poor’s Group, Moody’s Investor Service, Inc. or Fitch, Inc. AAA includes bonds with an implied AAA rating since they are backed by U.S. Government or agency securities. AAA, AA, A and BBB ratings are investment grade; BB, B, CCC, CC, C and D ratings are below-investment grade. Holdings designated N/R are not rated by any of these national rating agencies. |
| 3 | Holdings are subject to change. |
16 Nuveen Investments
| | |
NMP | Nuveen Michigan |
| | Premium Income |
Performance | Municipal Fund, Inc. |
OVERVIEW | |
| | as of February 28, 2011 |
| | Refer to the Glossary of Terms Used in this Report for further definition of the terms used within this Fund’s Performance Overview page. |
| 1 | Taxable-Equivalent Yield represents the yield that must be earned on a fully taxable investment in order to equal the yield of the Fund on an after-tax basis. It is based on a combined federal and state income tax rate of 31.1%. When comparing this Fund to investments that generate qualified dividend income, the Taxable-Equivalent Yield is lower. |
| 2 | Ratings shown are the highest of Standard & Poor’s Group, Moody’s Investor Service, Inc. or Fitch, Inc. AAA includes bonds with an implied AAA rating since they are backed by U.S. Government or agency securities. AAA, AA, A and BBB ratings are investment grade; BB, B, CCC, CC, C and D ratings are below-investment grade. Holdings designated N/R are not rated by any of these national rating agencies. |
| 3 | Holdings are subject to change. |
| | | |
Fund Snapshot | | |
Common Share Price | | $12.66 |
Common Share Net Asset Value (NAV) | $13.95 |
Premium/(Discount) to NAV | | -9.25% |
Market Yield | | 6.59% |
Taxable-Equivalent Yield1 | | 9.56% |
Net Assets Applicable to | | |
Common Shares ($000) | | $106,083 |
| | | |
Average Annual Total Return | | |
(Inception 12/17/92) | | |
| | On Share Price | On NAV |
1-Year | 7.72% | 2.55% |
5-Year | 1.88% | 3.53% |
10-Year | 5.42% | 5.26% |
| | | |
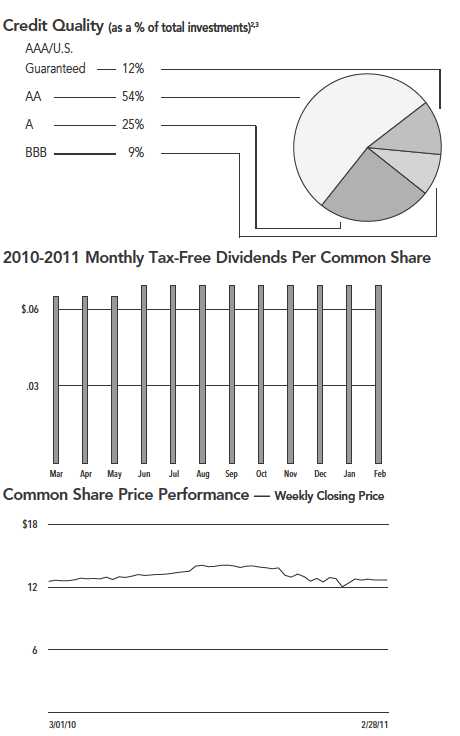
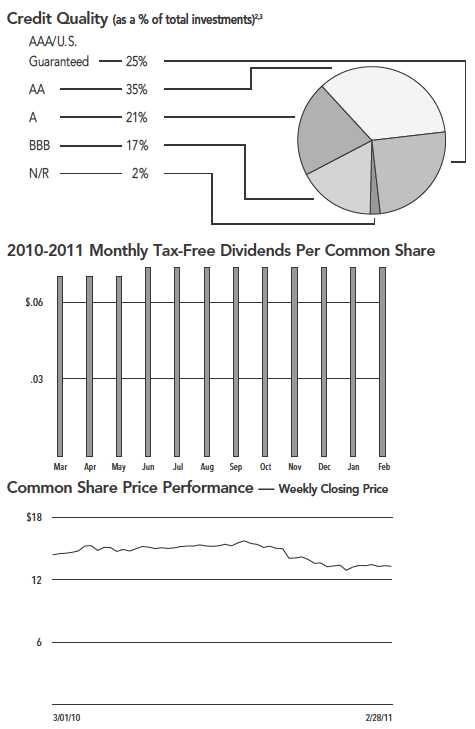
Portfolio Composition3 | | |
(as a % of total investments) | | |
Tax Obligation/General | | 36.4% |
Tax Obligation/Limited | | 13.9% |
Water and Sewer | | 11.9% |
Utilities | | 10.2% |
Health Care | | 8.9% |
U.S. Guaranteed | | 8.6% |
Other | | 10.1% |
Nuveen Investments 17
| | |
NZW | Nuveen Michigan |
| | Dividend Advantage |
Performance | Municipal Fund |
OVERVIEW | |
| | as of February 28, 2011 |
| | | |
Fund Snapshot | | |
Common Share Price | | $12.13 |
Common Share Net Asset Value (NAV) | $13.50 |
Premium/(Discount) to NAV | | -10.15% |
Market Yield | | 6.63% |
Taxable-Equivalent Yield1 | | 9.62% |
Net Assets Applicable to | | |
Common Shares ($000) | | $27,710 |
| | | |
Average Annual Total Return | | |
(Inception 9/25/01) | | |
| | On Share Price | On NAV |
1-Year | 3.72% | 0.70% |
5-Year | 0.09% | 2.93% |
Since Inception | 3.56% | 5.03% |
| | | |
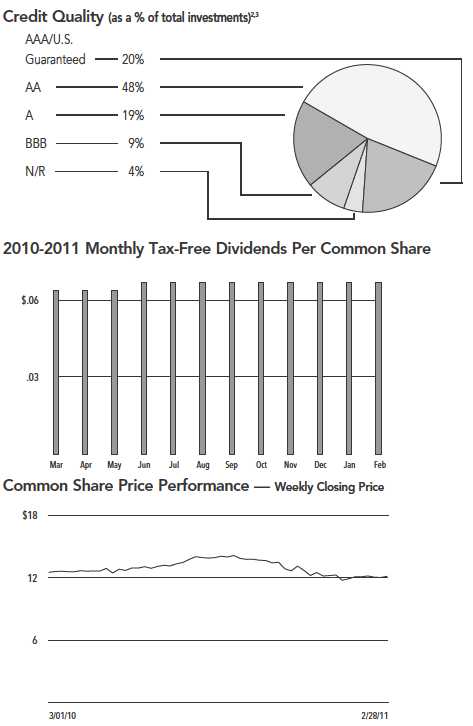
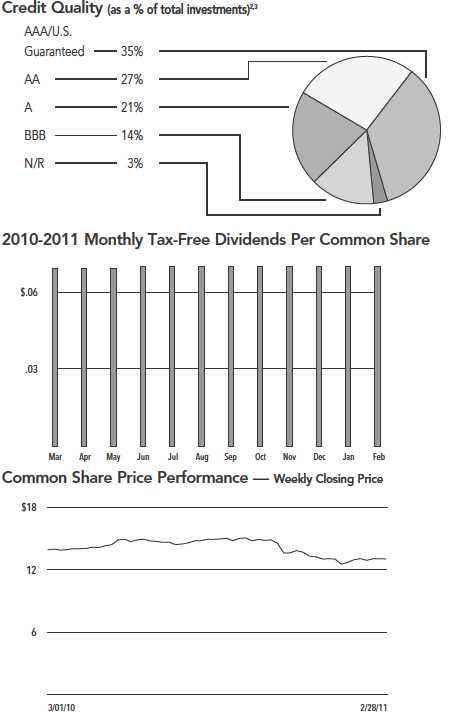
Portfolio Composition3 | | |
(as a % of total investments) | | |
Tax Obligation/General | | 28.2% |
U.S. Guaranteed | | 12.9% |
Utilities | | 12.2% |
Health Care | | 11.1% |
Tax Obligation/Limited | | 10.6% |
Water and Sewer | | 10.4% |
Other | | 14.6% |
| | Refer to the Glossary of Terms Used in this Report for further definition of the terms used within this Fund’s Performance Overview page. |
| 1 | Taxable-Equivalent Yield represents the yield that must be earned on a fully taxable investment in order to equal the yield of the Fund on an after-tax basis. It is based on a combined federal and state income tax rate of 31.1%. When comparing this Fund to investments that generate qualified dividend income, the Taxable-Equivalent Yield is lower. |
| 2 | Ratings shown are the highest of Standard & Poor’s Group, Moody’s Investor Service, Inc. or Fitch, Inc. AAA includes bonds with an implied AAA rating since they are backed by U.S. Government or agency securities. AAA, AA, A and BBB ratings are investment grade; BB, B, CCC, CC, C and D ratings are below-investment grade. Holdings designated N/R are not rated by any of these national rating agencies. |
| 3 | Holdings are subject to change. |
| | |
NUO | Nuveen Ohio |
| | Quality Income |
Performance | Municipal Fund, Inc. |
OVERVIEW | |
| | as of February 28, 2011 |
| | Refer to the Glossary of Terms Used in this Report for further definition of the terms used within this Fund’s Performance Overview page. |
| 1 | Taxable-Equivalent Yield represents the yield that must be earned on a fully taxable investment in order to equal the yield of the Fund on an after-tax basis. It is based on a combined federal and state income tax rate of 31.9%. When comparing this Fund to investments that generate qualified dividend income, the Taxable-Equivalent Yield is lower. |
| 2 | Ratings shown are the highest of Standard & Poor’s Group, Moody’s Investor Service, Inc. or Fitch, Inc. AAA includes bonds with an implied AAA rating since they are backed by U.S. Government or agency securities. AAA, AA, A and BBB ratings are investment grade; BB, B, CCC, CC, C and D ratings are below-investment grade. Holdings designated N/R are not rated by any of these national rating agencies. |
| 3 | Holdings are subject to change. |
| | | |
Fund Snapshot | | |
Common Share Price | | $14.85 |
Common Share Net Asset Value (NAV) | $15.44 |
Premium/(Discount) to NAV | | -3.82% |
Market Yield | | 6.06% |
Taxable-Equivalent Yield1 | | 8.90% |
Net Assets Applicable to | | |
Common Shares ($000) | | $150,555 |
| | | |
Average Annual Total Return | | |
(Inception 10/17/91) | | |
| | On Share Price | On NAV |
1-Year | 0.91% | 1.09% |
5-Year | 2.69% | 3.92% |
10-Year | 4.33% | 5.39% |
| | | |
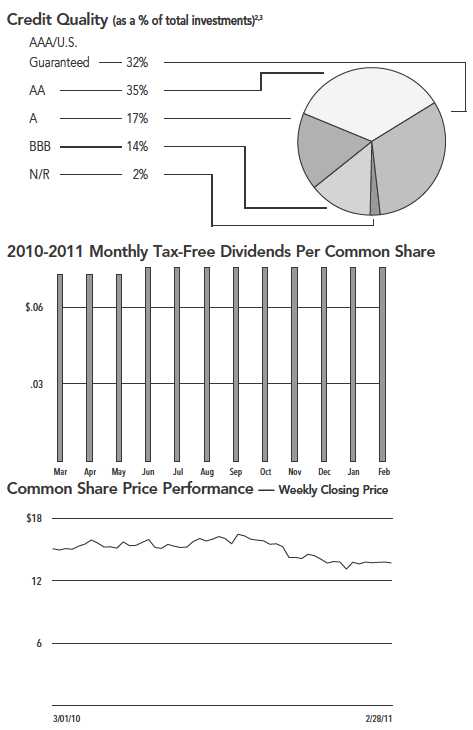
Portfolio Composition3 | | |
(as a % of total investments) | | |
Tax Obligation/General | | 24.8% |
Health Care | | 18.0% |
U.S. Guaranteed | | 15.3% |
Tax Obligation/Limited | | 11.7% |
Education and Civic Organizations | | 9.5% |
Utilities | | 5.0% |
Consumer Staples | | 4.8% |
Other | | 10.9% |
Nuveen Investments 19
| | |
NXI | Nuveen Ohio |
| | Dividend Advantage |
Performance | Municipal Fund |
OVERVIEW | |
| | as of February 28, 2011 |
| | | |
Fund Snapshot | | |
Common Share Price | | $13.30 |
Common Share Net Asset Value (NAV) | $14.26 |
Premium/(Discount) to NAV | | -6.73% |
Market Yield | | 6.63% |
Taxable-Equivalent Yield1 | | 9.74% |
Net Assets Applicable to | | |
Common Shares ($000) | | $60,550 |
| | | |
Average Annual Total Return | | |
(Inception 3/27/01) | | |
| | On Share Price | On NAV |
1-Year | -2.52% | -0.23% |
5-Year | 0.80% | 3.83% |
Since Inception | 4.56% | 5.74% |
| | | |
Portfolio Composition3 | | |
(as a % of total investments) | | |
U.S. Guaranteed | | 16.5% |
Health Care | | 16.5% |
Tax Obligation/General | | 16.3% |
Tax Obligation/Limited | | 15.7% |
Education and Civic Organizations | | 8.5% |
Utilities | | 6.9% |
Housing/Multifamily | | 4.8% |
Other | | 14.8% |
| | Refer to the Glossary of Terms Used in this Report for further definition of the terms used within this Fund’s Performance Overview page. |
| 1 | Taxable-Equivalent Yield represents the yield that must be earned on a fully taxable investment in order to equal the yield of the Fund on an after-tax basis. It is based on a combined federal and state income tax rate of 31.9%. When comparing this Fund to investments that generate qualified dividend income, the Taxable-Equivalent Yield is lower. |
| 2 | Ratings shown are the highest of Standard & Poor’s Group, Moody’s Investor Service, Inc. or Fitch, Inc. AAA includes bonds with an implied AAA rating since they are backed by U.S. Government or agency securities. AAA, AA, A and BBB ratings are investment grade; BB, B, CCC, CC, C and D ratings are below-investment grade. Holdings designated N/R are not rated by any of these national rating agencies. |
| 3 | Holdings are subject to change. |
| | |
NBJ | Nuveen Ohio |
| | Dividend Advantage |
Performance | Municipal Fund 2 |
OVERVIEW | |
| | as of February 28, 2011 |
| | Refer to the Glossary of Terms Used in this Report for further definition of the terms used within this Fund’s Performance Overview page. |
| 1 | Taxable-Equivalent Yield represents the yield that must be earned on a fully taxable investment in order to equal the yield of the Fund on an after-tax basis. It is based on a combined federal and state income tax rate of 31.9%. When comparing this Fund to investments that generate qualified dividend income, the Taxable-Equivalent Yield is lower. |
| 2 | Ratings shown are the highest of Standard & Poor’s Group, Moody’s Investor Service, Inc. or Fitch, Inc. AAA includes bonds with an implied AAA rating since they are backed by U.S. Government or agency securities. AAA, AA, A and BBB ratings are investment grade; BB, B, CCC, CC, C and D ratings are below-investment grade. Holdings designated N/R are not rated by any of these national rating agencies. |
| 3 | Holdings are subject to change. |
| | | |
Fund Snapshot | | |
Common Share Price | | $13.01 |
Common Share Net Asset Value (NAV) | $14.06 |
Premium/(Discount) to NAV | | -7.47% |
Market Yield | | 6.46% |
Taxable-Equivalent Yield1 | | 9.49% |
Net Assets Applicable to | | |
Common Shares ($000) | | $43,909 |
| | | |
Average Annual Total Return | | |
(Inception 9/25/01) | | |
| | On Share Price | On NAV |
1-Year | -0.37% | 1.00% |
5-Year | 1.78% | 3.73% |
Since Inception | 4.19% | 5.42% |
| | | |
Portfolio Composition3 | | |
(as a % of total investments) | | |
Tax Obligation/General | | 23.5% |
U.S. Guaranteed | | 19.3% |
Health Care | | 15.6% |
Tax Obligation/Limited | | 11.0% |
Education and Civic Organizations | | 8.1% |
Industrials | | 7.3% |
Utilities | | 6.7% |
Other | | 8.5% |
Nuveen Investments 21
| | |
NVJ | Nuveen Ohio |
| | Dividend Advantage |
Performance | Municipal Fund 3 |
OVERVIEW | |
| | as of February 28, 2011 |
| | | |
Fund Snapshot | | |
Common Share Price | | $13.72 |
Common Share Net Asset Value (NAV) | $14.35 |
Premium/(Discount) to NAV | | -4.39% |
Market Yield | | 6.60% |
Taxable-Equivalent Yield1 | | 9.69% |
Net Assets Applicable to | | |
Common Shares ($000) | | $30,968 |
| | | |
Average Annual Total Return | | |
(Inception 3/25/02) | | |
| | On Share Price | On NAV |
1-Year | -4.13% | -0.66% |
5-Year | 3.30% | 3.88% |
Since Inception | 4.72% | 5.63% |
| | | |
Portfolio Composition3 | | |
(as a % of total investments) | | |
U.S. Guaranteed | | 23.7% |
Tax Obligation/General | | 22.6% |
Health Care | | 19.5% |
Tax Obligation/Limited | | 7.2% |
Utilities | | 5.4% |
Industrials | | 4.8% |
Consumer Staples | | 4.3% |
Other | | 12.5% |
| | Refer to the Glossary of Terms Used in this Report for further definition of the terms used within this Fund’s Performance Overview page. |
| 1 | Taxable-Equivalent Yield represents the yield that must be earned on a fully taxable investment in order to equal the yield of the Fund on an after-tax basis. It is based on a combined federal and state income tax rate of 31.9%. When comparing this Fund to investments that generate qualified dividend income, the Taxable-Equivalent Yield is lower. |
| 2 | Ratings shown are the highest of Standard & Poor’s Group, Moody’s Investor Service, Inc. or Fitch, Inc. AAA includes bonds with an implied AAA rating since they are backed by U.S. Government or agency securities. AAA, AA, A and BBB ratings are investment grade; BB, B, CCC, CC, C and D ratings are below-investment grade. Holdings designated N/R are not rated by any of these national rating agencies. |
| 3 | Holdings are subject to change. |
22 Nuveen Investments
| | |
NUM | Shareholder Meeting Report (Unaudited) |
NMP | |
| NZW | The annual meeting of shareholders was held in the offices of Nuveen Investments on |
| | November 16, 2010; at this meeting the shareholders were asked to vote on the election |
| | of Board Members. |
| | | | | | | | | | |
| | NUM | | NMP | | | NZW | |
| | Common and | | | Common and | | | Common and | | |
| | Preferred | | Preferred | Preferred | | Preferred | Preferred | | Preferred |
| | shares voting | | shares voting | shares voting | | shares voting | shares voting | | shares voting |
| | together | | together | together | | together | together | | together |
| | as a class | | as a class | as a class | | as a class | as a class | | as a class |
Approval of the Board Members was reached | | | | | | | | | |
as follows: | | | | | | | | | |
John P. Amboian | | | | | | | | | |
For | 10,382,765 | | — | 6,562,500 | | — | — | | — |
Withhold | 432,093 | | — | 538,740 | | — | — | | — |
Total | 10,814,858 | | — | 7,101,240 | | — | — | | — |
Robert P. Bremner | | | | | | | | | |
For | 10,374,179 | | — | 6,556,984 | | — | — | | — |
Withhold | 440,679 | | — | 544,256 | | — | — | | — |
Total | 10,814,858 | | — | 7,101,240 | | — | — | | — |
Jack B. Evans | | | | | | | | | |
For | 10,381,519 | | — | 6,564,715 | | — | — | | — |
Withhold | 433,339 | | — | 536,525 | | — | — | | — |
Total | 10,814,858 | | — | 7,101,240 | | — | — | | — |
William C. Hunter | | | | | | | | | |
For | — | | 2,080 | — | | 1,399 | — | | 440 |
Withhold | — | | 5 | — | | 14 | — | | 1 |
Total | — | | 2,085 | — | | 1,413 | — | | 441 |
David J. Kundert | | | | | | | | | |
For | 10,379,259 | | — | 6,604,896 | | — | — | | — |
Withhold | 435,599 | | — | 496,344 | | — | — | | — |
Total | 10,814,858 | | — | 7,101,240 | | — | — | | — |
William J. Schneider | | | | | | | | | |
For | — | | 2,080 | — | | 1,399 | — | | 440 |
Withhold | — | | 5 | — | | 14 | — | | 1 |
Total | — | | 2,085 | — | | 1,413 | — | | 441 |
Judith M. Stockdale | | | | | | | | | |
For | 10,355,215 | | — | 6,549,737 | | — | 1,923,260 | | — |
Withhold | 459,643 | | — | 551,503 | | — | 94,798 | | — |
Total | 10,814,858 | | — | 7,101,240 | | — | 2,018,058 | | — |
Carole E. Stone | | | | | | | | | |
For | 10,367,165 | | — | 6,608,417 | | — | 1,923,370 | | — |
Withhold | 447,693 | | — | 492,823 | | — | 94,688 | | — |
Total | 10,814,858 | | — | 7,101,240 | | — | 2,018,058 | | — |
Terence J. Toth | | | | | | | | | |
For | 10,378,257 | | — | 6,565,715 | | — | — | | — |
Withhold | 436,601 | | — | 535,525 | | — | — | | — |
Total | 10,814,858 | | — | 7,101,240 | | — | — | | — |
Nuveen Investments 23
NUO Shareholder Meeting Report (continued) (Unaudited)
NXI
NBJ
| | | | | | | | | | |
| | | NUO | | | NXI | | | NBJ | |
| | Common and | | | Common and | | | Common and | | |
| | Preferred | | Preferred | Preferred | | Preferred | Preferred | | Preferred |
| | shares voting | | shares voting | shares voting | | shares voting | shares voting | | shares voting |
| | together | | together | together | | together | together | | together |
| | as a class | | as a class | as a class | | as a class | as a class | | as a class |
Approval of the Board Members was reached | | | | | | | | | |
as follows: | | | | | | | | | |
John P. Amboian | | | | | | | | | |
For | 8,917,338 | | — | — | | — | — | | — |
Withhold | 141,024 | | — | — | | — | — | | — |
Total | 9,058,362 | | — | — | | — | — | | — |
Robert P. Bremner | | | | | | | | | |
For | 8,908,751 | | — | — | | — | — | | — |
Withhold | 149,611 | | — | — | | — | — | | — |
Total | 9,058,362 | | — | — | | — | — | | — |
Jack B. Evans | | | | | | | | | |
For | 8,920,878 | | — | — | | — | — | | — |
Withhold | 137,484 | | — | — | | — | — | | — |
Total | 9,058,362 | | — | — | | — | — | | — |
William C. Hunter | | | | | | | | | |
For | — | | 1,081 | — | | 531 | — | | 423 |
Withhold | — | | 108 | — | | 1 | — | | 7 |
Total | — | | 1,189 | — | | 532 | — | | 430 |
David J. Kundert | | | | | | | | | |
For | 8,906,691 | | — | — | | — | — | | — |
Withhold | 151,671 | | — | — | | — | — | | — |
Total | 9,058,362 | | — | — | | — | — | | — |
William J. Schneider | | | | | | | | | |
For | — | | 1,081 | — | | 531 | — | | 423 |
Withhold | — | | 108 | — | | 1 | — | | 7 |
Total | — | | 1,189 | — | | 532 | — | | 430 |
Judith M. Stockdale | | | | | | | | | |
For | 8,914,402 | | — | 4,006,869 | | — | 2,879,638 | | — |
Withhold | 143,960 | | — | 54,814 | | — | 91,768 | | — |
Total | 9,058,362 | | — | 4,061,683 | | — | 2,971,406 | | — |
Carole E. Stone | | | | | | | | | |
For | 8,912,689 | | — | 4,004,591 | | — | 2,879,638 | | — |
Withhold | 145,673 | | — | 57,092 | | — | 91,768 | | — |
Total | 9,058,362 | | — | 4,061,683 | | — | 2,971,406 | | — |
Terence J. Toth | | | | | | | | | |
For | 8,909,599 | | — | — | | — | — | | — |
Withhold | 148,763 | | — | — | | — | — | | — |
Total | 9,058,362 | | — | — | | — | — | | — |
24 Nuveen Investments
NVJ
| | | | |
| | | NVJ | |
| | Common and | | |
| | Preferred | | Preferred |
| | shares voting | | shares voting |
| | together | | together |
| | as a class | | as a class |
Approval of the Board Members was reached | | | |
as follows: | | | |
John P. Amboian | | | |
For | — | | — |
Withhold | — | | — |
Total | — | | — |
Robert P. Bremner | | | |
For | — | | — |
Withhold | — | | — |
Total | — | | — |
Jack B. Evans | | | |
For | — | | — |
Withhold | — | | — |
Total | — | | — |
William C. Hunter | | | |
For | — | | 374 |
Withhold | — | | 2 |
Total | — | | 376 |
David J. Kundert | | | |
For | — | | — |
Withhold | — | | — |
Total | — | | — |
William J. Schneider | | | |
For | — | | 374 |
Withhold | — | | 2 |
Total | — | | 376 |
Judith M. Stockdale | | | |
For | 1,984,171 | | — |
Withhold | 95,890 | | — |
Total | 2,080,061 | | — |
Carole E. Stone | | | |
For | 2,039,240 | | — |
Withhold | 40,821 | | — |
Total | 2,080,061 | | — |
Terence J. Toth | | | |
For | — | | — |
Withhold | — | | — |
Total | — | | — |
Nuveen Investments 25
Report of Independent
Registered Public Accounting Firm
The Board of Directors/Trustees and Shareholders
Nuveen Michigan Quality Income Municipal Fund, Inc.
Nuveen Michigan Premium Income Municipal Fund, Inc.
Nuveen Michigan Dividend Advantage Municipal Fund
Nuveen Ohio Quality Income Municipal Fund, Inc.
Nuveen Ohio Dividend Advantage Municipal Fund
Nuveen Ohio Dividend Advantage Municipal Fund 2
Nuveen Ohio Dividend Advantage Municipal Fund 3
We have audited the accompanying statements of assets and liabilities, including the portfolios of investments, of Nuveen Michigan Quality Income Municipal Fund, Inc., Nuveen Michigan Premium Income Municipal Fund, Inc., Nuveen Michigan Dividend Advantage Municipal Fund, Nuveen Ohio Quality Income Municipal Fund, Inc., Nuveen Ohio Dividend Advantage Municipal Fund, Nuveen Ohio Dividend Advantage Municipal Fund 2, and Nuveen Ohio Dividend Advantage Municipal Fund 3 (the “Funds”) as of February 28, 2011, and the related statements of operations and cash flows (Nuveen Michigan Dividend Advantage Municipal Fund only) for the year then ended, the statements of changes in net assets for the periods indicated therein, and the financial highlights for each of the periods indicated therein. These financial statements and financial highlights are the responsibility of the Funds’ management. Our responsibility is to express an opinion on these financial statements and financial highlights based on our audits.
We conducted our audits in accordance with the standards of the Public Company Accounting Oversight Board (United States). Those standards require that we plan and perform the audits to obtain reasonable assurance about whether the financial statements and financial highlights are free of material misstatement. We were not engaged to perform an audit of the Funds’ internal control over financial reporting. Our audits included consideration of internal control over financial reporting as a basis for designing audit procedures that are appropriate in the circumstances, but not for the purpose of expressing an opinion on the effectiveness of the Funds’ internal control over financial reporting. Accordingly, we express no such opinion. An audit also includes examining, on a test basis, evidence supporting the amounts and disclosures in the financial statements and financial highlights, assessing the accounting principles used and significant estimates made by management, and evaluating the overall financial statement presentation. Our procedures included confirmation of securities owned as of February 28, 2011, by correspondence with the custodian and brokers or by other appropriate auditing procedures where replies from brokers were not received. We believe that our audits provide a reasonable basis for our opinion.
In our opinion, the financial statements and financial highlights referred to above present fairly, in all material respects, the financial positions of Nuveen Michigan Quality Income Municipal Fund, Inc., Nuveen Michigan Premium Income Municipal Fund, Inc., Nuveen Michigan Dividend Advantage Municipal Fund, Nuveen Ohio Quality Income Municipal Fund, Inc., Nuveen Ohio Dividend Advantage Municipal Fund, Nuveen Ohio Dividend Advantage Municipal Fund 2, and Nuveen Ohio Dividend Advantage Municipal Fund 3 at February 28, 2011, and the results of their operations and cash flows (Nuveen Michigan Dividend Advantage Municipal Fund only) for the year then ended, the changes in their net assets for the periods indicated therein, and the financial highlights for each of the periods indicated therein in conformity with U.S. generally accepted accounting principles.
Chicago, Illinois
April 27, 2011
26 Nuveen Investments
| | | | | | |
| | | Nuveen Michigan Quality Income Municipal Fund, Inc. | | |
NUM | | Portfolio of Investments | | |
| | | | February 28, 2011 | |
Principal | | | Optional Call | | |
Amount (000) | | Description (1) | Provisions (2) | Ratings (3) | Value |
| | | Consumer Staples – 4.0% (2.6% of Total Investments) | | | |
$ 7,500 | | Michigan Tobacco Settlement Finance Authority, Tobacco Settlement Asset-Backed Revenue Bonds, | 6/18 at 100.00 | Baa3 | $ 6,565,575 |
| | | Series 2008A, 6.875%, 6/01/42, DD1 | | | |
| | | Education and Civic Organizations – 3.5% (2.3% of Total Investments) | | | |
1,685 | | Michigan Higher Education Facilities Authority, Limited Obligation Revenue Refunding Bonds, | 9/11 at 100.00 | N/R | 1,683,163 |
| | | Kettering University, Series 2001, 5.500%, 9/01/17 – AMBAC Insured | | | |
1,000 | | Michigan Higher Education Student Loan Authority, Revenue Bonds, Series 2002 XVII-G, 5.200%, | 9/12 at 100.00 | AA | 1,005,140 |
| | | 9/01/20 – AMBAC Insured (Alternative Minimum Tax) | | | |
2,000 | | Michigan State University, General Revenue Bonds, Refunding Series 2010C, 5.000%, 2/15/40 | 2/20 at 100.00 | Aa1 | 1,980,320 |
1,115 | | Michigan Technological University, General Revenue Bonds, Series 2004A, 5.000%, 10/01/22 – | 10/13 at 100.00 | Aa3 | 1,134,423 |
| | | NPFG Insured | | | |
5,800 | | Total Education and Civic Organizations | | | 5,803,046 |
| | | Health Care – 14.0% (9.1% of Total Investments) | | | |
1,080 | | Jackson County Hospital Finance Authority, Michigan, Hospital Revenue Bonds, Alligiance | 6/20 at 100.00 | AA+ | 982,368 |
| | | Health, Refunding Series 2010A, 5.000%, 6/01/37 – AGM Insured | | | |
4,100 | | Michigan State Hospital Finance Authority, Hospital Revenue Bonds, Henry Ford Health System, | 11/19 at 100.00 | A1 | 3,832,762 |
| | | Refunding Series 2009, 5.750%, 11/15/39 | | | |
4,075 | | Michigan State Hospital Finance Authority, Hospital Revenue Bonds, Oakwood Obligated Group, | 4/13 at 100.00 | A | 3,963,223 |
| | | Series 2002A, 5.750%, 4/01/32 | | | |
2,500 | | Michigan State Hospital Finance Authority, Hospital Revenue Bonds, MidMichigan Obligated Group, | 6/19 at 100.00 | AA+ | 2,516,950 |
| | | Series 2009A, 5.875%, 6/01/39 – AGC Insured | | | |
1,000 | | Michigan State Hospital Finance Authority, Hospital Revenue Refunding Bonds, Memorial | 5/11 at 100.50 | BBB | 1,001,180 |
| | | Healthcare Center Obligated Group, Series 1999, 5.875%, 11/15/21 | | | |
1,500 | | Michigan State Hospital Finance Authority, Hospital Revenue Refunding Bonds, Trinity Health | 12/12 at 100.00 | AA | 1,456,350 |
| | | Credit Group, Series 2002C, 5.375%, 12/01/30 | | | |
| | | Michigan State Hospital Finance Authority, Revenue Bonds, Marquette General Hospital, | | | |
| | | Series 2005A: | | | |
1,500 | | 5.000%, 5/15/26 | 5/15 at 100.00 | Baa3 | 1,302,840 |
2,055 | | 5.000%, 5/15/34 | 5/15 at 100.00 | Baa3 | 1,652,446 |
1,150 | | Royal Oak Hospital Finance Authority, Michigan, Hospital Revenue Bonds, William Beaumont | 9/18 at 100.00 | A1 | 1,286,896 |
| | | Hospital, Refunding Series 2009V, 8.250%, 9/01/39 | | | |
5,500 | | Royal Oak Hospital Finance Authority, Michigan, Hospital Revenue Bonds, William Beaumont | 11/11 at 100.00 | A1 | 4,924,095 |
| | | Hospital, Series 2001M, 5.250%, 11/15/31 – NPFG Insured | | | |
24,460 | | Total Health Care | | | 22,919,110 |
| | | Housing/Multifamily – 3.7% (2.4% of Total Investments) | | | |
2,675 | | Michigan Housing Development Authority, FNMA Limited Obligation Multifamily Housing Revenue | 12/20 at 101.00 | AAA | 2,687,653 |
| | | Bonds, Parkview Place Apartments, Series 2002A, 5.550%, 12/01/34 (Alternative Minimum Tax) | | | |
140 | | Michigan Housing Development Authority, Rental Housing Revenue Bonds, Series 1999A, 5.300%, | 4/11 at 100.00 | AA | 133,847 |
| | | 10/01/37 – NPFG Insured (Alternative Minimum Tax) | | | |
1,300 | | Michigan Housing Development Authority, Rental Housing Revenue Bonds, Series 2006D, 5.125%, | 7/15 at 100.00 | AA+ | 1,259,830 |
| | | 4/01/31 – AGM Insured (Alternative Minimum Tax) | | | |
200 | | Michigan Housing Development Authority, Rental Housing Revenue Bonds, Series 2009A, | 10/18 at 100.00 | AA | 202,320 |
| | | 5.700%, 10/01/39 | | | |
1,825 | | Michigan Housing Development Authority, Rental Housing Revenue Bonds, Series 2010A, | 10/20 at 100.00 | AA | 1,712,033 |
| | | 5.000%, 10/01/35 | | | |
6,140 | | Total Housing/Multifamily | | | 5,995,683 |
| | | Housing/Single Family – 1.2% (0.7% of Total Investments) | | | |
2,000 | | Michigan Housing Development Authority, Single Family Homeownership Revenue Bonds, Series | 6/20 at 100.00 | AA | 1,916,740 |
| | | 2010C, 5.500%, 12/01/28 (Alternative Minimum Tax) | | | |
Nuveen Investments 27
| | | | | | |
Nuveen Michigan Quality Income Municipal Fund, Inc. (continued) | | |
NUM Portfolio of Investments February 28, 2011 | | | |
| | | | |
Principal | | | Optional Call | | |
Amount (000) | | Description (1) | Provisions (2) | Ratings (3) | Value |
| | | Tax Obligation/General – 55.3% (35.8% of Total Investments) | | | |
$ 1,000 | | Anchor Bay School District, Macomb and St. Clair Counties, Michigan, General Obligation | 5/12 at 100.00 | Aa2 | $ 1,004,820 |
| | | Refunding Bonds, Series 2002, 5.000%, 5/01/25 | | | |
| | | Anchor Bay School District, Macomb and St. Clair Counties, Michigan, Unlimited Tax General | | | |
| | | Obligation Refunding Bonds, Series 2001: | | | |
2,500 | | 5.000%, 5/01/21 | 5/11 at 100.00 | Aa2 | 2,513,225 |
3,200 | | 5.000%, 5/01/29 | 5/11 at 100.00 | Aa2 | 3,200,416 |
1,000 | | Ann Arbor, Michigan, General Obligation Bonds, Court & Police Facilities Capital Improvement | 5/18 at 100.00 | AA+ | 1,002,620 |
| | | Series 2008, 5.000%, 5/01/38 | | | |
1,320 | | Bridgeport Spaulding Community School District, Saginaw County, Michigan, General Obligation | 5/12 at 100.00 | Aa2 | 1,383,413 |
| | | Bonds, Series 2002, 5.500%, 5/01/16 | | | |
2,110 | | Caledonia Community Schools, Kent, Allegan and Barry Counties, Michigan, General Obligation | 5/13 at 100.00 | Aa2 | 2,246,074 |
| | | Bonds, Series 2003, 5.250%, 5/01/20 | | | |
1,000 | | Caledonia Community Schools, Kent, Allegan and Barry Counties, Michigan, General Obligation | 5/15 at 100.00 | Aa2 | 1,018,850 |
| | | Bonds, Series 2005, 5.000%, 5/01/25 – NPFG Insured | | | |
2,319 | | Caledonia Community Schools, Kent, Allegan and Barry Counties, Michigan, General Obligation | 5/17 at 100.00 | Aa2 | 2,058,576 |
| | | Bonds, Tender Option Bond Trust 2008-1096, 7.922%, 5/01/32 – NPFG Insured (IF) | | | |
2,000 | | Detroit City School District, Wayne County, Michigan, General Obligation Bonds, Series 2002A, | No Opt. Call | Aa2 | 2,278,240 |
| | | 6.000%, 5/01/19 – FGIC Insured | | | |
700 | | Detroit-Wayne County Stadium Authority, Michigan, Limited Tax General Obligation Building | 2/11 at 100.00 | A– | 701,064 |
| | | Authority Stadium Bonds, Series 1997, 5.500%, 2/01/17 – FGIC Insured | | | |
285 | | East Grand Rapids Public Schools, County of Kent, State of Michigan, General Obligation Bonds, | 5/11 at 100.00 | AA | 285,063 |
| | | Series 2001, Refunding, 5.125%, 5/01/29 | | | |
| | | Grand Rapids and Kent County Joint Building Authority, Michigan, Limited Tax General | | | |
| | | Obligation Bonds, Devos Place Project, Series 2001: | | | |
8,900 | | 0.000%, 12/01/25 | No Opt. Call | AAA | 4,270,487 |
3,000 | | 0.000%, 12/01/26 | No Opt. Call | AAA | 1,338,000 |
5,305 | | 0.000%, 12/01/29 | No Opt. Call | AAA | 1,927,731 |
1,700 | | Grand Rapids, Michigan, General Obligation Bonds, Capital Improvement Series 2007, 5.000%, | 9/17 at 100.00 | AA | 1,742,194 |
| | | 9/01/27 – NPFG Insured | | | |
2,000 | | Hartland Consolidated School District, Livingston County, Michigan, General Obligation | 5/11 at 100.00 | Aa2 | 2,001,120 |
| | | Refunding Bonds, Series 2001, 5.125%, 5/01/29 | | | |
1,400 | | Howell Public Schools, Livingston County, Michigan, General Obligation Bonds, Series 2003, | 11/13 at 100.00 | Aa2 | 1,444,576 |
| | | 5.000%, 5/01/21 | | | |
1,065 | | Jackson Public Schools, Jackson County, Michigan, General Obligation School Building and Site | 5/14 at 100.00 | AA+ | 1,118,974 |
| | | Bonds, Series 2004, 5.000%, 5/01/22 – AGM Insured | | | |
1,935 | | Kalamazoo Public Schools, Michigan, General Obligation Bonds, Series 2006, 5.000%, 5/01/25 – | 5/16 at 100.00 | AA+ | 1,975,693 |
| | | AGM Insured | | | |
200 | | L’Anse Creuse Public Schools, Macomb County, Michigan, General Obligation Bonds, Series 2005, | 5/15 at 100.00 | AA+ | 193,848 |
| | | 5.000%, 5/01/35 – AGM Insured | | | |
2,505 | | Lincoln Consolidated School District, Washtenaw and Wayne Counties, Michigan, General | 5/16 at 100.00 | Aa2 | 2,554,223 |
| | | Obligation Bonds, Series 2006, 5.000%, 5/01/25 – NPFG Insured | | | |
2,810 | | Livonia Public Schools, Wayne County, Michigan, General Obligation Bonds, Series 2004A, | 5/14 at 100.00 | Aa2 | 2,899,864 |
| | | 5.000%, 5/01/21 – NPFG Insured | | | |
865 | | Lowell Area Schools, Counties of Ionia and Kent, Michigan, General Obligation Bonds, Series | 5/17 at 100.00 | AA+ | 831,386 |
| | | 2007, 5.000%, 5/01/37 – AGM Insured | | | |
1,500 | | Marshall Public Schools, Calhoun County, Michigan, General Obligation Bonds, Series 2007, | 5/17 at 100.00 | AA– | 1,501,080 |
| | | 5.000%, 5/01/30 – SYNCORA GTY Insured | | | |
2,100 | | Michigan Municipal Bond Authority, General Obligation Bonds, Detroit City School District, | 6/15 at 100.00 | AA+ | 2,162,601 |
| | | Series 2005, 5.000%, 6/01/18 – AGM Insured | | | |
100 | | Michigan, General Obligation Bonds, Environmental Program, Series 2009A, 5.500%, 11/01/25 | 5/19 at 100.00 | Aa2 | 105,649 |
2,500 | | Montrose School District, Michigan, School Building and Site Bonds, Series 1997, 6.000%, | No Opt. Call | Aa3 | 2,895,725 |
| | | 5/01/22 – NPFG Insured | | | |
1,100 | | Muskegon County, Michigan, Limited Tax General Obligation Wastewater Management System 2 | 7/11 at 100.00 | AA | 1,104,136 |
| | | Revenue Bonds, Series 2002, 5.000%, 7/01/26 – FGIC Insured | | | |
28 Nuveen Investments
| | | | | | |
Principal | | | Optional Call | | |
Amount (000) | | Description (1) | Provisions (2) | Ratings (3) | Value |
| | | Tax Obligation/General (continued) | | | |
$ 1,000 | | Oakland County Building Authority, Michigan, General Obligation Bonds, Series 2002, | 9/11 at 100.00 | AAA | $ 1,009,050 |
| | | 5.125%, 9/01/22 | | | |
3,950 | | Oakland Intermediate School District, Oakland County, Michigan, General Obligation Bonds, | 5/17 at 100.00 | Aaa | 3,869,381 |
| | | Series 2007, 5.000%, 5/01/36 – AGM Insured | | | |
1,595 | | Oakridge Public Schools, Muskegon County, Michigan, General Obligation Bonds, Series 2005, | 5/15 at 100.00 | AA– | 1,676,217 |
| | | 5.000%, 5/01/22 – NPFG Insured | | | |
| | | Ottawa County, Michigan, Water Supply System, General Obligation Bonds, Series 2007: | | | |
4,330 | | 5.000%, 8/01/26 – NPFG Insured (UB) | 8/17 at 100.00 | Aaa | 4,460,463 |
1,120 | | 5.000%, 8/01/30 – NPFG Insured (UB) | 8/17 at 100.00 | Aaa | 1,132,522 |
1,245 | | Parchment School District, Kalamazoo County, Michigan, General Obligation Bonds, Tender Option | No Opt. Call | AA+ | 967,863 |
| | | Bond Trust 2836, 11.061%, 5/01/15 – AGM Insured (IF) | | | |
4,340 | | Plymouth-Canton Community School District, Wayne and Washtenaw Counties, Michigan, General | 5/14 at 100.00 | Aa2 | 4,402,626 |
| | | Obligation Bonds, Series 2004, 5.000%, 5/01/26 – FGIC Insured | | | |
1,000 | | Rockford Public Schools, Kent County, Michigan, General Obligation Bonds, Series 2008, 5.000%, | 5/18 at 100.00 | AA+ | 982,180 |
| | | 5/01/33 – AGM Insured | | | |
200 | | South Haven, Van Buren County,Michigan, General Obligation Bonds, Capital Improvement Series | 12/19 at 100.00 | AA+ | 202,874 |
| | | 2009, 5.125%, 12/01/33 – AGC Insured | | | |
3,175 | | South Redford School District, Wayne County, Michigan, General Obligation Bonds, School | 5/15 at 100.00 | Aa2 | 3,176,556 |
| | | Building and Site, Series 2005, 5.000%, 5/01/30 – NPFG Insured | | | |
1,655 | | Southfield Library Building Authority, Michigan, General Obligation Bonds, Series 2005, | 5/15 at 100.00 | AA+ | 1,688,911 |
| | | 5.000%, 5/01/26 – NPFG Insured | | | |
2,200 | | Thornapple Kellogg School District, Barry County, Michigan, General Obligation Bonds, Series | 5/17 at 100.00 | Aa2 | 2,170,146 |
| | | 2007, 5.000%, 5/01/32 – NPFG Insured | | | |
2,000 | | Trenton Public Schools District, Michigan, General Obligation Bonds, Series 2008, 5.000%, | 5/18 at 100.00 | AA+ | 1,950,280 |
| | | 5/01/34 – AGM Insured | | | |
2,275 | | Troy City School District, Oakland County, Michigan, General Obligation Bonds, Series 2006, | 5/16 at 100.00 | Aa1 | 2,432,794 |
| | | 5.000%, 5/01/19 – NPFG Insured | | | |
| | | Van Dyke Public Schools, Macomb County, Michigan, General Obligation Bonds, School Building | | | |
| | | and Site, Series 2008: | | | |
310 | | 5.000%, 5/01/31 – AGM Insured | 5/18 at 100.00 | AA+ | 307,064 |
575 | | 5.000%, 5/01/38 – AGM Insured | 5/18 at 100.00 | AA+ | 551,465 |
1,200 | | Wayne Charter County, Michigan, General Obligation Bonds, Building Improvements, Series 2009A, | 12/19 at 100.00 | A– | 1,209,684 |
| | | 6.750%, 11/01/39 | | | |
5,000 | | Wayne County, Michigan, Limited Tax General Obligation Airport Hotel Revenue Bonds, Detroit | 12/11 at 101.00 | A– | 4,996,750 |
| | | Metropolitan Wayne County Airport, Series 2001A, 5.000%, 12/01/21 – NPFG Insured | | | |
3,350 | | Wayne Westland Community Schools, Michigan, General Obligation Bonds, Series 2004, 5.000%, | 11/14 at 100.00 | AA+ | 3,642,221 |
| | | 5/01/17 – AGM Insured | | | |
1,725 | | Williamston Community School District, Michigan, Unlimited Tax General Obligation QSBLF Bonds, | No Opt. Call | Aa3 | 1,946,231 |
| | | Series 1996, 5.500%, 5/01/25 – NPFG Insured | | | |
98,664 | | Total Tax Obligation/General | | | 90,534,926 |
| | | Tax Obligation/Limited – 18.4% (11.9% of Total Investments) | | | |
1,000 | | Grand Rapids Building Authority, Kent County, Michigan, Limited Tax General Obligation Bonds, | No Opt. Call | AA | 1,112,480 |
| | | Series 1998, 5.000%, 4/01/16 | | | |
1,345 | | Grand Rapids Building Authority, Kent County, Michigan, Limited Tax General Obligation Bonds, | 10/11 at 100.00 | AA | 1,366,533 |
| | | Series 2001, 5.125%, 10/01/26 – NPFG Insured | | | |
20 | | Michigan Municipal Bond Authority, Local Government Loan Program Revenue Sharing Bonds, Series | 5/11 at 100.00 | Aa3 | 20,083 |
| | | 1992D, 6.650%, 5/01/12 | | | |
2,135 | | Michigan State Building Authority, Revenue Bonds, Facilities Program, Series 2005II, 5.000%, | 10/15 at 100.00 | Aa3 | 2,005,512 |
| | | 10/15/33 – AMBAC Insured | | | |
| | | Michigan State Building Authority, Revenue Bonds, Refunding Series 2006IA: | | | |
7,000 | | 0.000%, 10/15/27 – FGIC Insured | 10/16 at 58.27 | AAA | 2,570,750 |
6,200 | | 0.000%, 10/15/28 – FGIC Insured | 10/16 at 55.35 | AAA | 2,105,334 |
4,440 | | 5.000%, 10/15/36 – FGIC Insured | 10/16 at 100.00 | Aa3 | 4,056,961 |
Nuveen Investments 29
| | | | | | |
Nuveen Michigan Quality Income Municipal Fund, Inc. (continued) | | |
NUM Portfolio of Investments February 28, 2011 | | | |
| | | | |
Principal | | | Optional Call | | |
Amount (000) | | Description (1) | Provisions (2) | Ratings (3) | Value |
| | | Tax Obligation/Limited (continued) | | | |
| | | Michigan State Building Authority, Revenue Refunding Bonds, Facilities Program, Series 2003II: | | | |
$ 5,100 | | 5.000%, 10/15/22 – NPFG Insured | 10/13 at 100.00 | Aa3 | $ 5,156,406 |
5,000 | | 5.000%, 10/15/23 – NPFG Insured | 10/13 at 100.00 | Aa3 | 5,036,800 |
3,500 | | Michigan State Trunk Line, Fund Refunding Bonds, Series 2002, 5.250%, 10/01/21 – AGM Insured | 10/12 at 100.00 | AA+ | 3,677,380 |
17,000 | | Puerto Rico Sales Tax Financing Corporation, Sales Tax Revenue Bonds, Series 2007A, 0.000%, | No Opt. Call | Aa2 | 1,812,710 |
| | | 8/01/44 – NPFG Insured | | | |
1,000 | | Virgin Islands Public Finance Authority, Matching Fund Loan Notes Revenue Bonds, Series 2009B, | 10/19 at 100.00 | BBB | 953,610 |
| | | 5.000%, 10/01/25 | | | |
420 | | Virgin Islands Public Finance Authority, Revenue Bonds, Senior Lien Matching Fund Loan | 10/19 at 100.00 | BBB | 347,542 |
| | | Notes,Series 2009A-1, 5.000%, 10/01/39 | | | |
54,160 | | Total Tax Obligation/Limited | | | 30,222,101 |
| | | Transportation – 1.5% (1.0% of Total Investments) | | | |
1,000 | | Capital Region Airport Authority, Michigan, Revenue Refunding Bonds, Series 2002, 5.250%, | 7/12 at 100.00 | A3 | 1,004,100 |
| | | 7/01/21 – NPFG Insured (Alternative Minimum Tax) | | | |
1,750 | | Metropolitan Washington DC Airports Authority, Virginia, Dulles Toll Road Revenue Bonds, | 10/28 at 100.00 | BBB+ | 997,605 |
| | | Dulles Metrorail Capital Appreciation, Series 2010B, 0.000%, 10/01/44 | | | |
500 | | Wayne County Airport Authority, Michigan, Revenue Bonds, Detroit Metropolitan Airport, | No Opt. Call | A | 521,575 |
| | | Refunding Series 2007, 5.000%, 12/01/12 – FGIC Insured | | | |
3,250 | | Total Transportation | | | 2,523,280 |
| | | U.S. Guaranteed – 25.4% (16.5% of Total Investments) (4) | | | |
1,200 | | Birmingham, Michigan, General Obligation Bonds, Series 2002, 5.000%, 10/01/20 | 10/12 at 100.50 | AAA | 1,289,748 |
| | | (Pre-refunded 10/01/12) | | | |
935 | | Detroit, Michigan, Senior Lien Sewerage Disposal System Revenue Bonds, Series 2003A, 5.000%, | 7/13 at 100.00 | AA+ (4) | 1,028,322 |
| | | 7/01/17 (Pre-refunded 7/01/13) – AGM Insured | | | |
| | | Detroit, Michigan, Senior Lien Water Supply System Revenue Bonds, Series 2001A: | | | |
3,400 | | 5.750%, 7/01/28 (Pre-refunded 7/01/11) – FGIC Insured | 7/11 at 101.00 | A+ (4) | 3,492,174 |
770 | | 5.250%, 7/01/33 (Pre-refunded 7/01/11) – FGIC Insured | 7/11 at 100.00 | A+ (4) | 781,889 |
730 | | 5.250%, 7/01/33 (Pre-refunded 7/01/11) – FGIC Insured | 7/11 at 100.00 | A+ (4) | 742,315 |
| | | Detroit, Michigan, Senior Lien Water Supply System Revenue Bonds, Series 2003A: | | | |
4,025 | | 5.000%, 7/01/24 (Pre-refunded 7/01/13) – NPFG Insured | 7/13 at 100.00 | A+ (4) | 4,409,951 |
1,500 | | 5.000%, 7/01/25 (Pre-refunded 7/01/13) – NPFG Insured | 7/13 at 100.00 | A+ (4) | 1,643,460 |
2,000 | | Lake Fenton Community Schools, Genesee County, Michigan, General Obligation Bonds, Series | 5/12 at 100.00 | Aa2 (4) | 2,106,320 |
| | | 2002, 5.000%, 5/01/24 (Pre-refunded 5/01/12) | | | |
1,790 | | Lansing Building Authority, Michigan, General Obligation Bonds, Series 2003A, 5.000%, 6/01/26 | 6/13 at 100.00 | AA (4) | 1,962,646 |
| | | (Pre-refunded 6/01/13) – NPFG Insured | | | |
3,880 | | Mayville Community Schools, Tuscola County, Michigan, General Obligation Bonds, School | 11/14 at 100.00 | Aa2 (4) | 4,425,140 |
| | | Building and Site Project, Series 2004, 5.000%, 5/01/34 (Pre-refunded 11/01/14) – FGIC Insured | | | |
250 | | Michigan South Central Power Agency, Power Supply System Revenue Bonds, Series 2000, 6.000%, | No Opt. Call | A3 (4) | 252,303 |
| | | 5/01/12 (ETM) | | | |
1,500 | | Michigan State Hospital Finance Authority, Hospital Revenue Refunding Bonds, Henry Ford Health | 3/13 at 100.00 | A1 (4) | 1,648,185 |
| | | System, Series 2003A, 5.625%, 3/01/17 (Pre-refunded 3/01/13) | | | |
3,460 | | Michigan State Hospital Finance Authority, Hospital Revenue Refunding Bonds, St. John’s Health | 5/11 at 100.00 | Aaa | 3,471,729 |
| | | System, Series 1998A, 5.000%, 5/15/28 – AMBAC Insured (ETM) | | | |
| | | Michigan State Hospital Finance Authority, Revenue Bonds, Chelsea Community Hospital, | | | |
| | | Series 2005: | | | |
1,025 | | 5.000%, 5/15/30 (Pre-refunded 5/15/15) | 5/15 at 100.00 | AAA | 1,172,518 |
500 | | 5.000%, 5/15/37 (Pre-refunded 5/15/15) | 5/15 at 100.00 | AAA | 571,960 |
1,000 | | Michigan State Trunk Line, Fund Bonds, Series 2001A, 5.000%, 11/01/25 (Pre-refunded | 11/11 at 100.00 | AA+ (4) | 1,031,170 |
| | | 11/01/11) – AGM Insured | | | |
4,000 | | Michigan, General Obligation Bonds, Environmental Protection Program, Series 2003A, 5.250%, | 5/13 at 100.00 | Aa2 (4) | 4,393,760 |
| | | 5/01/20 (Pre-refunded 5/01/13) | | | |
4,100 | | Puerto Rico, Highway Revenue Bonds, Highway and Transportation Authority, Series 1996Y, | 7/16 at 100.00 | Aaa | 4,918,934 |
| | | 5.500%, 7/01/36 (Pre-refunded 7/01/16) | | | |
30 Nuveen Investments
| | | | | | |
Principal | | | Optional Call | | |
Amount (000) | | Description (1) | Provisions (2) | Ratings (3) | Value |
| | | U.S. Guaranteed (4) (continued) | | | |
| | | Puerto Rico Public Finance Corporation, Commonwealth Appropriation Bonds, Series 2002E: | | | |
$ 85 | | 6.000%, 8/01/26 (ETM) | No Opt. Call | Baa1 (4) | $ 105,037 |
915 | | 6.000%, 8/01/26 (ETM) | No Opt. Call | AAA | 1,130,693 |
1,050 | | Warren Consolidated School District, Macomb and Oakland Counties, Michigan, General Obligation | 11/11 at 100.00 | AA+ (4) | 1,085,742 |
| | | Bonds, Series 2001, 5.375%, 5/01/19 (Pre-refunded 11/01/11) – AGM Insured | | | |
38,115 | | Total U.S. Guaranteed | | | 41,663,996 |
| | | Utilities – 15.3% (9.9% of Total Investments) | | | |
| | | Lansing Board of Water and Light, Michigan, Steam and Electric Utility System Revenue Bonds, | | | |
| | | Series 2008A: | | | |
215 | | 5.000%, 7/01/28 | 7/18 at 100.00 | AA– | 217,156 |
5,000 | | 5.000%, 7/01/32 | 7/18 at 100.00 | AA– | 4,931,900 |
3,000 | | Michigan Public Power Agency, Revenue Bonds, Combustion Turbine 1 Project, Series 2001A, | 1/12 at 100.00 | A2 | 3,009,330 |
| | | 5.250%, 1/01/27 – AMBAC Insured | | | |
2,695 | | Michigan South Central Power Agency, Power Supply System Revenue Bonds, Series 2000, | No Opt. Call | A3 | 2,778,114 |
| | | 6.000%, 5/01/12 | | | |
1,000 | | Michigan Strategic Fund, Collateralized Limited Obligation Pollution Control Revenue Refunding | 3/11 at 101.00 | A | 993,710 |
| | | Bonds, Detroit Edison Company, Series 1999A, 5.550%, 9/01/29 – NPFG Insured (Alternative | | | |
| | | Minimum Tax) | | | |
4,000 | | Michigan Strategic Fund, Collateralized Limited Obligation Pollution Control Revenue Refunding | 9/11 at 100.00 | A | 4,002,640 |
| | | Bonds, Detroit Edison Company, Series 2001C, 5.450%, 9/01/29 | | | |
2,050 | | Michigan Strategic Fund, Limited Obligation Pollution Control Revenue Refunding Bonds, Detroit | No Opt. Call | BBB+ | 2,073,247 |
| | | Edison Company, Series 1995CC, 4.850%, 9/01/30 (Mandatory put 9/01/11) – AMBAC Insured | | | |
3,630 | | Michigan Strategic Fund, Limited Obligation Revenue Refunding Bonds, Detroit Edison Company, | No Opt. Call | A | 4,191,234 |
| | | Series 1991BB, 7.000%, 5/01/21 – AMBAC Insured | | | |
3,000 | | Michigan Strategic Fund, Limited Obligation Revenue Refunding Bonds, Detroit Edison Company, | 12/12 at 100.00 | BBB+ | 2,837,790 |
| | | Series 2002C, 5.450%, 12/15/32 – SYNCORA GTY Insured (Alternative Minimum Tax) | | | |
24,590 | | Total Utilities | | | 25,035,121 |
| | | Water and Sewer – 12.0% (7.8% of Total Investments) | | | |
5,500 | | Detroit Water Supply System, Michigan, Water Supply System Revenue Bonds, Series 2006A, | 7/16 at 100.00 | AA+ | 4,895,660 |
| | | 5.000%, 7/01/34 – AGM Insured | | | |
1,500 | | Detroit, Michigan, Senior Lien Sewerage Disposal System Revenue Bonds, Series 2001B, 5.500%, | No Opt. Call | A | 1,454,745 |
| | | 7/01/29 – FGIC Insured | | | |
565 | | Detroit, Michigan, Senior Lien Sewerage Disposal System Revenue Bonds, Series 2003A, 5.000%, | 7/13 at 100.00 | AA+ | 583,611 |
| | | 7/01/17 – AGM Insured | | | |
1,500 | | Detroit, Michigan, Senior Lien Water Supply System Revenue Bonds, Series 2003A, 5.000%, | 7/13 at 100.00 | A+ | 1,468,350 |
| | | 7/01/25 – NPFG Insured | | | |
425 | | Detroit, Michigan, Sewage Disposal System Revenue Bonds, Second Lien Series 2006A, 5.500%, | 7/18 at 100.00 | AA+ | 420,950 |
| | | 7/01/36 – BHAC Insured | | | |
675 | | Grand Rapids, Michigan, Sanitary Sewer System Revenue Bonds, Series 2008, 5.000%, 1/01/38 | 1/18 at 100.00 | AA+ | 658,874 |
2,030 | | Grand Rapids, Michigan, Water Supply System Revenue Bonds, Series 2009, 5.100%, 1/01/39 – | 1/19 at 100.00 | AA+ | 2,035,704 |
| | | AGC Insured | | | |
4,210 | | Michigan Municipal Bond Authority, Clean Water Revolving Fund Revenue Bonds, Series 2004, | 10/14 at 100.00 | AAA | 4,597,952 |
| | | 5.000%, 10/01/19 | | | |
1,150 | | Michigan Municipal Bond Authority, Drinking Water Revolving Fund Revenue Bonds, Series 2004, | 10/14 at 100.00 | AAA | 1,215,033 |
| | | 5.000%, 10/01/23 | | | |
Nuveen Investments 31
| | | | | | |
Nuveen Michigan Quality Income Municipal Fund, Inc. (continued) | | |
NUM Portfolio of Investments February 28, 2011 | | | |
| | | | |
Principal | | | Optional Call | | |
Amount (000) | | Description (1) | Provisions (2) | Ratings (3) | Value |
| | | Water and Sewer (continued) | | | |
$ 1,000 | | Michigan Municipal Bond Authority, Water Revolving Fund Revenue Bonds, Series 2007, | 10/17 at 100.00 | AAA | $ 1,060,500 |
| | | 5.000%, 10/01/24 | | | |
1,000 | | Puerto Rico Aqueduct and Sewerage Authority, Revenue Bonds, Senior Lien Series 2008A, | 7/18 at 100.00 | Baa1 | 929,530 |
| | | 6.000%, 7/01/44 | | | |
300 | | Saginaw, Michigan, Water Supply System Revenue Bonds, Series 2008, 5.250%, 7/01/22 – | 7/18 at 100.00 | A | 305,370 |
| | | NPFG Insured | | | |
19,855 | | Total Water and Sewer | | | 19,626,279 |
$ 284,534 | | Total Investments (cost $250,966,685) – 154.3% | | | 252,805,857 |
| | | Floating Rate Obligations – (2.2)% | | | (3,630,000) |
| | | Other Assets Less Liabilities – 1.2% | | | 2,024,786 |
| | | Auction Rate Preferred Shares, at Liquidation Value – (53.3)% (5) | | | (87,325,000) |
| | | Net Assets Applicable to Common Shares – 100% | | | $ 163,875,643 |
| | | |
(1) | | All percentages shown in the Portfolio of Investments are based on net assets applicable to Common shares unless otherwise noted. |
(2) | | Optional Call Provisions (not covered by the report of independent registered public accounting firm): Dates (month and year) and prices of the earliest |
| | | optional call or redemption. There may be other call provisions at varying prices at later dates. Certain mortgage-backed securities may be subject to |
| | | periodic principal paydowns. |
(3) | | Ratings (not covered by the report of independent registered public accounting firm): Using the highest of Standard & Poor’s Group (“Standard & Poor’s”), |
| | | Moody’s Investor Service, Inc. (“Moody’s”) or Fitch, Inc. (“Fitch”) rating. Ratings below BBB by Standard & Poor’s, Baa by Moody’s or BBB by Fitch are |
| | | considered to be below investment grade. Holdings designated N/R are not rated by any of these national rating agencies. |
(4) | | Backed by an escrow or trust containing sufficient U.S. Government or U.S. Government agency securities, which ensure the timely payment of principal |
| | | and interest. Such investments are normally considered to be equivalent to AAA rated securities. |
(5) | | Auction Rate Preferred Shares, at Liquidation Value as a percentage of Total Investments is 34.5%. |
N/R | | Not rated. |
DD1 | | Investment or portion of investment purchased on a delayed delivery basis. |
(ETM) | | Escrowed to maturity. |
(IF) | | Inverse floating rate investment. |
(UB) | | Underlying bond of an inverse floating rate trust reflected as a financing transaction. See Notes to Financial Statements, Footnote 1 – General Information |
| | | and Significant Accounting Policies, Inverse Floating Rate Securities for more information. |
See accompanying notes to financial statements.
32 Nuveen Investments
| | | | | | |
| | | Nuveen Michigan Premium Income Municipal Fund, Inc. | |
NMP | | Portfolio of Investments | | |
| | | | February 28, 2011 | |
Principal | | | Optional Call | | |
Amount (000) | | Description (1) | Provisions (2) | Ratings (3) | Value |
| | | Consumer Staples – 3.7% (2.4% of Total Investments) | | | |
$ 4,420 | | Michigan Tobacco Settlement Finance Authority, Tobacco Settlement Asset-Backed Revenue Bonds, | 6/18 at 100.00 | BBB | $ 3,869,312 |
| | | Series 2008A, 6.875%, 6/01/42, DD1 | | | |
| | | Education and Civic Organizations – 3.3% (2.2% of Total Investments) | | | |
2,000 | | Michigan Higher Education Student Loan Authority, Revenue Bonds, Series 2002 XVII-G, 5.200%, | 9/12 at 100.00 | AA | 2,010,280 |
| | | 9/01/20 – AMBAC Insured (Alternative Minimum Tax) | | | |
1,500 | | Michigan State University, General Revenue Bonds, Refunding Series 2010C, 5.000%, 2/15/40 | 2/20 at 100.00 | Aa1 | 1,485,240 |
3,500 | | Total Education and Civic Organizations | | | 3,495,520 |
| | | Health Care – 13.5% (8.9% of Total Investments) | | | |
630 | | Jackson County Hospital Finance Authority, Michigan, Hospital Revenue Bonds, Alligiance | 6/20 at 100.00 | AA+ | 573,048 |
| | | Health, Refunding Series 2010A, 5.000%, 6/01/37 – AGM Insured | | | |
2,725 | | Michigan State Hospital Finance Authority, Hospital Revenue Bonds, Henry Ford Health System, | 11/19 at 100.00 | A1 | 2,547,385 |
| | | Refunding Series 2009, 5.750%, 11/15/39 | | | |
3,050 | | Michigan State Hospital Finance Authority, Hospital Revenue Bonds, Oakwood Obligated Group, | 4/13 at 100.00 | A | 2,966,339 |
| | | Series 2002A, 5.750%, 4/01/32 | | | |
1,350 | | Michigan State Hospital Finance Authority, Hospital Revenue Bonds, MidMichigan Obligated Group, | 6/19 at 100.00 | AA+ | 1,359,153 |
| | | Series 2009A, 5.875%, 6/01/39 – AGC Insured | | | |
1,000 | | Michigan State Hospital Finance Authority, Hospital Revenue Refunding Bonds, Trinity Health | 12/12 at 100.00 | AA | 970,900 |
| | | Credit Group, Series 2002C, 5.375%, 12/01/30 | | | |
| | | Michigan State Hospital Finance Authority, Revenue Bonds, Marquette General Hospital, | | | |
| | | Series 2005A: | | | |
2,435 | | 5.000%, 5/15/26 | 5/15 at 100.00 | Baa3 | 2,114,944 |
200 | | 5.000%, 5/15/34 | 5/15 at 100.00 | Baa3 | 160,822 |
3,500 | | Royal Oak Hospital Finance Authority, Michigan, Hospital Revenue and Refunding Bonds, William | 8/19 at 100.00 | A1 | 3,348,380 |
| | | Beaumont Hospital Obligated Group, Series 2009W, 6.000%, 8/01/39 | | | |
250 | | Royal Oak Hospital Finance Authority, Michigan, Hospital Revenue Bonds, William Beaumont | 9/18 at 100.00 | A1 | 279,760 |
| | | Hospital, Refunding Series 2009V, 8.250%, 9/01/39 | | | |
15,140 | | Total Health Care | | | 14,320,731 |
| | | Housing/Multifamily – 6.2% (4.1% of Total Investments) | | | |
855 | | Michigan Housing Development Authority, GNMA Collateralized Limited Obligation Multifamily | 4/12 at 102.00 | Aaa | 850,614 |
| | | Housing Revenue Bonds, Burkshire Pointe Apartments, Series 2002A, 5.400%, 10/20/32 | | | |
| | | (Alternative Minimum Tax) | | | |
1,260 | | Michigan Housing Development Authority, Limited Obligation Revenue Bonds, Breton Village Green | 4/11 at 100.00 | AA+ | 1,261,651 |
| | | Project, Series 1993, 5.625%, 10/15/18 – AGM Insured | | | |
1,890 | | Michigan Housing Development Authority, Limited Obligation Revenue Bonds, Walled Lake Villa | 4/11 at 100.00 | Aaa | 1,893,402 |
| | | Project, Series 1993, 6.000%, 4/15/18 – AGM Insured | | | |
800 | | Michigan Housing Development Authority, Rental Housing Revenue Bonds, Series 2006D, 5.125%, | 7/15 at 100.00 | AA+ | 775,280 |
| | | 4/01/31 – AGM Insured (Alternative Minimum Tax) | | | |
25 | | Michigan Housing Development Authority, Rental Housing Revenue Bonds, Series 2009A, | 10/18 at 100.00 | AA | 25,290 |
| | | 5.700%, 10/01/39 | | | |
| | | Mt. Clemens Housing Corporation, Michigan, FHA-Insured Section 8 Assisted Multifamily Housing | | | |
| | | Revenue Refunding Bonds, Clinton Place Project, Series 1992A: | | | |
310 | | 6.600%, 6/01/13 | 6/11 at 100.00 | AA+ | 311,175 |
1,500 | | 6.600%, 6/01/22 | 6/11 at 100.00 | AA+ | 1,502,250 |
6,640 | | Total Housing/Multifamily | | | 6,619,662 |
| | | Housing/Single Family – 0.9% (0.6% of Total Investments) | | | |
1,000 | | Michigan Housing Development Authority, Single Family Homeownership Revenue Bonds, Series | 6/20 at 100.00 | AA | 958,370 |
| | | 2010C, 5.500%, 12/01/28 (Alternative Minimum Tax) | | | |
Nuveen Investments 33
| | | | | | |
Nuveen Michigan Premium Income Municipal Fund, Inc. (continued) | | |
NMP Portfolio of Investments February 28, 2011 | | | |
| | | | |
Principal | | | Optional Call | | |
Amount (000) | | Description (1) | Provisions (2) | Ratings (3) | Value |
| | | Materials – 1.0% (0.7% of Total Investments) | | | |
$ 1,050 | | Dickinson County Economic Development Corporation, Michigan, Pollution Control Revenue Bonds, | 11/14 at 100.00 | BBB | $ 1,054,746 |
| | | International Paper Company, Series 2004A, 4.800%, 11/01/18 | | | |
| | | Tax Obligation/General – 55.2% (36.4% of Total Investments) | | | |
1,475 | | Anchor Bay School District, Macomb and St. Clair Counties, Michigan, General Obligation Bonds, | 11/13 at 100.00 | Aa2 | 1,534,133 |
| | | Series 2003, 5.000%, 5/01/21 | | | |
2,500 | | Anchor Bay School District, Macomb and St. Clair Counties, Michigan, Unlimited Tax General | 5/11 at 100.00 | Aa2 | 2,513,225 |
| | | Obligation Refunding Bonds, Series 2001, 5.000%, 5/01/21 | | | |
1,000 | | Ann Arbor, Michigan, General Obligation Bonds, Court & Police Facilities Capital Improvement | 5/18 at 100.00 | AA+ | 1,002,620 |
| | | Series 2008, 5.000%, 5/01/38 | | | |
100 | | Battle Creek School District, Calhoun County, Michigan, General Obligation Bonds, Series 2007, | 5/17 at 100.00 | AA+ | 97,080 |
| | | 5.000%, 5/01/37 – AGM Insured | | | |
2,250 | | Caledonia Community Schools, Kent, Allegan and Barry Counties, Michigan, General Obligation | 5/15 at 100.00 | Aa2 | 2,282,400 |
| | | Bonds, Series 2005, 5.000%, 5/01/26 – NPFG Insured | | | |
1,501 | | Caledonia Community Schools, Kent, Allegan and Barry Counties, Michigan, General Obligation | 5/17 at 100.00 | Aa2 | 1,332,438 |
| | | Bonds, Tender Option Bond Trust 2008-1096, 7.922%, 5/01/32 – NPFG Insured (IF) | | | |
| | | Detroit City School District, Wayne County, Michigan, General Obligation Bonds, Series 2002A: | | | |
1,815 | | 6.000%, 5/01/20 – FGIC Insured | No Opt. Call | Aa2 | 2,069,663 |
750 | | 6.000%, 5/01/21 – FGIC Insured | No Opt. Call | Aa2 | 852,473 |
2,500 | | Detroit City School District, Wayne County, Michigan, General Obligation Bonds, Series 2003B, | 5/13 at 100.00 | Aa2 | 2,528,825 |
| | | 5.000%, 5/01/23 – FGIC Insured | | | |
| | | Detroit-Wayne County Stadium Authority, Michigan, Limited Tax General Obligation Building | | | |
| | | Authority Stadium Bonds, Series 1997: | | | |
770 | | 5.500%, 2/01/17 – FGIC Insured | 8/11 at 100.00 | A– | 771,170 |
6,990 | | 5.250%, 2/01/27 – FGIC Insured | 8/11 at 100.00 | A– | 6,990,280 |
860 | | Grand Rapids, Michigan, General Obligation Bonds, Capital Improvement Series 2007, 5.000%, | 9/17 at 100.00 | AA | 898,571 |
| | | 9/01/24 – NPFG Insured | | | |
1,500 | | Hartland Consolidated School District, Livingston County, Michigan, General Obligation | 5/11 at 100.00 | Aa2 | 1,500,840 |
| | | Refunding Bonds, Series 2001, 5.125%, 5/01/29 | | | |
1,650 | | Holly Area School District, Oakland County, Michigan, General Obligation Bonds, Series 2006, | 5/16 at 100.00 | Aa2 | 1,651,370 |
| | | 5.125%, 5/01/32 – NPFG Insured | | | |
2,000 | | Howell Public Schools, Livingston County, Michigan, General Obligation Bonds, Series 2003, | 11/13 at 100.00 | Aa2 | 2,063,640 |
| | | 5.000%, 5/01/22 | | | |
1,250 | | Kalamazoo Public Schools, Michigan, General Obligation Bonds, Series 2006, 5.000%, 5/01/25 – | 5/16 at 100.00 | AA+ | 1,276,288 |
| | | AGM Insured | | | |
500 | | Lansing School District, Ingham County, Michigan, General Obligation Bonds, Series 2004, | 5/14 at 100.00 | Aa2 | 525,340 |
| | | 5.000%, 5/01/22 | | | |
1,000 | | Livonia Public Schools, Wayne County, Michigan, General Obligation Bonds, Series 2004A, | 5/14 at 100.00 | Aa2 | 1,031,980 |
| | | 5.000%, 5/01/21 – NPFG Insured | | | |
865 | | Lowell Area Schools, Counties of Ionia and Kent, Michigan, General Obligation Bonds, Series | 5/17 at 100.00 | AA+ | 831,386 |
| | | 2007, 5.000%, 5/01/37 – AGM Insured | | | |
425 | | Marshall Public Schools, Calhoun County, Michigan, General Obligation Bonds, Series 2007, | 5/17 at 100.00 | AA– | 425,306 |
| | | 5.000%, 5/01/30 – SYNCORA GTY Insured | | | |
1,000 | | Michigan Municipal Bond Authority, General Obligation Bonds, Detroit City School District, | 6/15 at 100.00 | AA+ | 1,029,810 |
| | | Series 2005, 5.000%, 6/01/18 – AGM Insured | | | |
800 | | Michigan, General Obligation Bonds, Environmental Program, Series 2009A, 5.500%, 11/01/25 | 5/19 at 100.00 | Aa2 | 845,192 |
2,450 | | Oakland Intermediate School District, Oakland County, Michigan, General Obligation Bonds, | 5/17 at 100.00 | Aaa | 2,399,996 |
| | | Series 2007, 5.000%, 5/01/36 – AGM Insured | | | |
3,500 | | Ottawa County, Michigan, Water Supply System, General Obligation Bonds, Series 2007, 5.000%, | 8/17 at 100.00 | Aaa | 3,539,130 |
| | | 8/01/30 – NPFG Insured (UB) | | | |
1,100 | | Oxford Area Community Schools, Oakland and Lapeer Counties, Michigan, General Obligation | 5/14 at 100.00 | AA+ | 1,114,795 |
| | | Bonds, Series 2004, 5.000%, 5/01/25 – AGM Insured | | | |
34 Nuveen Investments
| | | | | | |
Principal | | | Optional Call | | |
Amount (000) | | Description (1) | Provisions (2) | Ratings (3) | Value |
| | | Tax Obligation/General (continued) | | | |
$ 805 | | Parchment School District, Kalamazoo County, Michigan, General Obligation Bonds, Tender Option | No Opt. Call | AA+ | $ 625,807 |
| | | Bond Trust 2836, 11.061%, 5/01/15 – AGM Insured (IF) | | | |
1,000 | | Rockford Public Schools, Kent County, Michigan, General Obligation Bonds, Series 2005, 5.000%, | 5/15 at 100.00 | AA+ | 982,520 |
| | | 5/01/27 – AGM Insured | | | |
1,000 | | Rockford Public Schools, Kent County, Michigan, General Obligation Bonds, Series 2008, 5.000%, | 5/18 at 100.00 | AA+ | 982,180 |
| | | 5/01/33 – AGM Insured | | | |
125 | | South Haven, Van Buren County, Michigan, General Obligation Bonds, Capital Improvement Series | 12/19 at 100.00 | AA+ | 126,796 |
| | | 2009, 5.125%, 12/01/33 – AGC Insured | | | |
1,100 | | Thornapple Kellogg School District, Barry County, Michigan, General Obligation Bonds, Series | 5/17 at 100.00 | Aa2 | 1,085,073 |
| | | 2007, 5.000%, 5/01/32 – NPFG Insured | | | |
1,500 | | Trenton Public Schools District, Michigan, General Obligation Bonds, Series 2008, 5.000%, | 5/18 at 100.00 | AA+ | 1,462,710 |
| | | 5/01/34 – AGM Insured | | | |
| | | Van Dyke Public Schools, Macomb County, Michigan, General Obligation Bonds, School Building | | | |
| | | and Site, Series 2008: | | | |
800 | | 5.000%, 5/01/31 – AGM Insured | 5/18 at 100.00 | AA+ | 792,424 |
1,350 | | 5.000%, 5/01/38 – AGM Insured | 5/18 at 100.00 | AA+ | 1,294,745 |
2,830 | | Warren Consolidated School District, Macomb and Oakland Counties, Michigan, General Obligation | 5/13 at 100.00 | AA | 2,918,268 |
| | | Refunding Bonds, Series 2003, 5.250%, 5/01/20 | | | |
1,705 | | Wayne Charter County, Michigan, General Obligation Bonds, Building Improvements, Series 2009A, | 12/19 at 100.00 | A– | 1,718,759 |
| | | 6.750%, 11/01/39 | | | |
| | | Wayne County, Michigan, Limited Tax General Obligation Airport Hotel Revenue Bonds, Detroit | | | |
| | | Metropolitan Wayne County Airport, Series 2001A: | | | |
1,500 | | 5.500%, 12/01/18 – NPFG Insured | 12/11 at 101.00 | A– | 1,526,265 |
4,435 | | 5.000%, 12/01/30 – NPFG Insured | 12/11 at 101.00 | A– | 3,894,994 |
58,701 | | Total Tax Obligation/General | | | 58,518,492 |
| | | Tax Obligation/Limited – 21.0% (13.9% of Total Investments) | | | |
| | | Michigan State Building Authority, Revenue Bonds, Facilities Program, Series 2001I: | | | |
2,420 | | 5.500%, 10/15/19 | 10/11 at 100.00 | Aa3 | 2,469,199 |
6,205 | | 5.000%, 10/15/24 | 10/11 at 100.00 | Aa3 | 6,213,004 |
1,600 | | Michigan State Building Authority, Revenue Bonds, Facilities Program, Series 2005II, 5.000%, | 10/15 at 100.00 | Aa3 | 1,547,456 |
| | | 10/15/30 – AMBAC Insured | | | |
2,880 | | Michigan State Building Authority, Revenue Bonds, Refunding Series 2006IA, 5.000%, 10/15/36 – | 10/16 at 100.00 | Aa3 | 2,631,542 |
| | | FGIC Insured | | | |
| | | Michigan State Building Authority, Revenue Refunding Bonds, Facilities Program, Series 2003II: | | | |
5,000 | | 5.000%, 10/15/22 – NPFG Insured | 10/13 at 100.00 | Aa3 | 5,055,300 |
2,480 | | 5.000%, 10/15/23 – NPFG Insured | 10/13 at 100.00 | Aa3 | 2,498,253 |
1,500 | | Michigan, Comprehensive Transportation Revenue Refunding Bonds, Series 2001A, 5.000%, | 11/11 at 100.00 | AA+ | 1,538,550 |
| | | 11/01/19 – AGM Insured | | | |
450 | | Virgin Islands Public Finance Authority, Revenue Bonds, Senior Lien Matching Fund Loan | 10/19 at 100.00 | BBB | 372,366 |
| | | Notes,Series 2009A-1, 5.000%, 10/01/39 | | | |
22,535 | | Total Tax Obligation/Limited | | | 22,325,670 |
| | | Transportation – 0.2% (0.1% of Total Investments) | | | |
230 | | Kent County, Michigan, Airport Revenue Bonds, Gerald R. Ford International Airport, Series | 1/17 at 100.00 | AAA | 225,752 |
| | | 2007, 5.000%, 1/01/32 | | | |
| | | U.S. Guaranteed – 13.1% (8.6% of Total Investments) (4) | | | |
915 | | Detroit, Michigan, Second Lien Sewerage Disposal System Revenue Bonds, Series 2005A, 5.000%, | 7/15 at 100.00 | A (4) | 1,053,064 |
| | | 7/01/30 (Pre-refunded 7/01/15) – NPFG Insured | | | |
1,135 | | Detroit, Michigan, Senior Lien Water Supply System Revenue Bonds, Series 2001A, 5.250%, | 7/11 at 100.00 | A+ (4) | 1,152,524 |
| | | 7/01/33 (Pre-refunded 7/01/11) – FGIC Insured | | | |
Nuveen Investments 35
| | | | | | |
Nuveen Michigan Premium Income Municipal Fund, Inc. (continued) | | |
NMP Portfolio of Investments February 28, 2011 | | | |
| | | | |
Principal | | | Optional Call | | |
Amount (000) | | Description (1) | Provisions (2) | Ratings (3) | Value |
| | | U.S. Guaranteed (4) (continued) | | | |
$ 500 | | Lansing School District, Ingham County, Michigan, General Obligation Bonds, Series 2004, | 5/14 at 100.00 | Aa2 (4) | $ 562,090 |
| | | 5.000%, 5/01/22 (Pre-refunded 5/01/14) | | | |
75 | | Michigan South Central Power Agency, Power Supply System Revenue Bonds, Series 2000, 6.000%, | No Opt. Call | A3 (4) | 75,691 |
| | | 5/01/12 (ETM) | | | |
150 | | Michigan State Building Authority, Revenue Bonds, Facilities Program, Series 2001I, 5.500%, | 10/11 at 100.00 | A+ (4) | 154,734 |
| | | 10/15/19 (Pre-refunded 10/15/11) | | | |
1,500 | | Michigan State Hospital Finance Authority, Hospital Revenue Refunding Bonds, Henry Ford Health | 3/13 at 100.00 | A1 (4) | 1,648,185 |
| | | System, Series 2003A, 5.625%, 3/01/17 (Pre-refunded 3/01/13) | | | |
500 | | Michigan State Hospital Finance Authority, Hospital Revenue Refunding Bonds, Sparrow Obligated | 11/11 at 101.00 | A+ (4) | 523,385 |
| | | Group, Series 2001, 5.625%, 11/15/31 (Pre-refunded 11/15/11) | | | |
1,900 | | Michigan State Hospital Finance Authority, Hospital Revenue Refunding Bonds, St. John’s | 5/11 at 100.00 | N/R (4) | 2,000,168 |
| | | Hospital, Series 1992A, 6.000%, 5/15/13 – AMBAC Insured (ETM) | | | |
| | | Michigan State Hospital Finance Authority, Revenue Bonds, Chelsea Community Hospital, | | | |
| | | Series 2005: | | | |
425 | | 5.000%, 5/15/25 (Pre-refunded 5/15/15) | 5/15 at 100.00 | AAA | 486,166 |
150 | | 5.000%, 5/15/30 (Pre-refunded 5/15/15) | 5/15 at 100.00 | AAA | 171,588 |
| | | Michigan, General Obligation Bonds, Environmental Protection Program, Series 2003A: | | | |
1,000 | | 5.250%, 5/01/20 (Pre-refunded 5/01/13) | 5/13 at 100.00 | Aa2 (4) | 1,098,440 |
2,000 | | 5.250%, 5/01/21 (Pre-refunded 5/01/13) | 5/13 at 100.00 | Aa2 (4) | 2,196,880 |
1,000 | | Otsego Public Schools District, Allegan and Kalamazoo Counties, Michigan, General Obligation | 5/14 at 100.00 | AA+ (4) | 1,124,180 |
| | | Bonds, Series 2004, 5.000%, 5/01/25 (Pre-refunded 5/01/14) – AGM Insured | | | |
1,425 | | Walled Lake Consolidated School District, Oakland County, Michigan, General Obligation Bonds, | 5/14 at 100.00 | AA– (4) | 1,613,057 |
| | | Series 2004, 5.250%, 5/01/20 (Pre-refunded 5/01/14) – NPFG Insured | | | |
12,675 | | Total U.S. Guaranteed | | | 13,860,152 |
| | | Utilities – 15.4% (10.2% of Total Investments) | | | |
100 | | Farmington, New Mexico, Pollution Control Revenue Refunding Bonds, Public Service Company of | 6/20 at 100.00 | Baa3 | 96,104 |
| | | New Mexico San Juan Project, Series 2010D, 5.900%, 6/01/40 | | | |
| | | Lansing Board of Water and Light, Michigan, Steam and Electric Utility System Revenue Bonds, | | | |
| | | Series 2008A: | | | |
125 | | 5.000%, 7/01/28 | 7/18 at 100.00 | AA– | 126,254 |
2,500 | | 5.000%, 7/01/32 | 7/18 at 100.00 | AA– | 2,465,950 |
1,000 | | Michigan Public Power Agency, Revenue Bonds, Combustion Turbine 1 Project, Series 2001A, | 1/12 at 100.00 | A2 | 1,003,110 |
| | | 5.250%, 1/01/27 – AMBAC Insured | | | |
775 | | Michigan South Central Power Agency, Power Supply System Revenue Bonds, Series 2000, | No Opt. Call | A3 | 798,901 |
| | | 6.000%, 5/01/12 | | | |
1,000 | | Michigan Strategic Fund, Collateralized Limited Obligation Pollution Control Revenue Refunding | 3/11 at 101.00 | A | 993,710 |
| | | Bonds, Detroit Edison Company, Series 1999A, 5.550%, 9/01/29 – NPFG Insured (Alternative | | | |
| | | Minimum Tax) | | | |
5,000 | | Michigan Strategic Fund, Collateralized Limited Obligation Pollution Control Revenue Refunding | 9/11 at 100.00 | A | 5,003,300 |
| | | Bonds, Detroit Edison Company, Series 2001C, 5.450%, 9/01/29 | | | |
3,000 | | Michigan Strategic Fund, Limited Obligation Pollution Control Revenue Refunding Bonds, Detroit | No Opt. Call | BBB+ | 3,034,020 |
| | | Edison Company, Series 1995CC, 4.850%, 9/01/30 (Mandatory put 9/01/11) – AMBAC Insured | | | |
3,000 | | Michigan Strategic Fund, Limited Obligation Revenue Refunding Bonds, Detroit Edison Company, | 12/12 at 100.00 | BBB+ | 2,837,790 |
| | | Series 2002C, 5.450%, 12/15/32 – SYNCORA GTY Insured (Alternative Minimum Tax) | | | |
16,500 | | Total Utilities | | | 16,359,139 |
| | | Water and Sewer – 18.0% (11.9% of Total Investments) | | | |
3,500 | | Detroit Water Supply System, Michigan, Water Supply System Revenue Bonds, Series 2006A, | 7/16 at 100.00 | AA+ | 3,115,420 |
| | | 5.000%, 7/01/34 – AGM Insured | | | |
1,085 | | Detroit, Michigan, Second Lien Sewerage Disposal System Revenue Bonds, Series 2005A, 5.000%, | 7/15 at 100.00 | A | 1,008,616 |
| | | 7/01/30 – NPFG Insured | | | |
36 Nuveen Investments
| | | | | | |
Principal | | | Optional Call | | |
Amount (000) | | Description (1) | Provisions (2) | Ratings (3) | Value |
| | | Water and Sewer (continued) | | | |
$ 1,500 | | Detroit, Michigan, Senior Lien Sewerage Disposal System Revenue Bonds, Series 2001B, 5.500%, | No Opt. Call | A | $ 1,454,745 |
| | | 7/01/29 – FGIC Insured | | | |
1,120 | | Detroit, Michigan, Senior Lien Sewerage Disposal System Revenue Bonds, Series 2003A, 5.000%, | 7/13 at 100.00 | AA+ | 1,156,893 |
| | | 7/01/17 – AGM Insured | | | |
1,330 | | Grand Rapids, Michigan, Sanitary Sewer System Revenue Bonds, Series 2005, 5.000%, 1/01/30 – | 7/15 at 100.00 | AA+ | 1,340,494 |
| | | NPFG Insured | | | |
| | | Grand Rapids, Michigan, Sanitary Sewer System Revenue Bonds, Series 2008: | | | |
400 | | 5.000%, 1/01/27 | No Opt. Call | AA+ | 410,340 |
450 | | 5.000%, 1/01/38 | 1/18 at 100.00 | AA+ | 439,250 |
425 | | Grand Rapids, Michigan, Water Supply System Revenue Bonds, Series 2009, 5.100%, 1/01/39 – | 1/19 at 100.00 | AA+ | 426,193 |
| | | AGC Insured | | | |
1,000 | | Michigan Municipal Bond Authority, Water Revolving Fund Revenue Bonds, Series 2007, | 10/17 at 100.00 | AAA | 1,060,499 |
| | | 5.000%, 10/01/24 | | | |
8,245 | | North Kent Sewer Authority, Michigan, Sewer Revenue Bonds, Series 2006, 5.000%, 11/01/31 – | 11/16 at 100.00 | Aa3 | 8,292,985 |
| | | NPFG Insured | | | |
350 | | Saginaw, Michigan, Water Supply System Revenue Bonds, Series 2008, 5.250%, 7/01/22 – | 7/18 at 100.00 | A | 356,264 |
| | | NPFG Insured | | | |
19,405 | | Total Water and Sewer | | | 19,061,699 |
$ 161,796 | | Total Investments (cost $161,200,271) – 151.5% | | | 160,669,245 |
| | | Floating Rate Obligations – (2.2)% | | | (2,330,000) |
| | | Other Assets Less Liabilities – 1.3% | | | 1,443,396 |
| | | Auction Rate Preferred Shares, at Liquidation Value – (50.6)% (5) | | | (53,700,000) |
| | | Net Assets Applicable to Common Shares – 100% | | | $ 106,082,641 |
| | | |
(1) | | All percentages shown in the Portfolio of Investments are based on net assets applicable to Common shares unless otherwise noted. |
(2) | | Optional Call Provisions (not covered by the report of independent registered public accounting firm): Dates (month and year) and prices of the earliest |
| | | optional call or redemption. There may be other call provisions at varying prices at later dates. Certain mortgage-backed securities may be subject to |
| | | periodic principal paydowns. |
(3) | | Ratings (not covered by the report of independent registered public accounting firm): Using the highest of Standard & Poor’s Group (“Standard & Poor’s”), |
| | | Moody’s Investor Service, Inc. (“Moody’s”) or Fitch, Inc. (“Fitch”) rating. Ratings below BBB by Standard & Poor’s, Baa by Moody’s or BBB by Fitch are |
| | | considered to be below investment grade. Holdings designated N/R are not rated by any of these national rating agencies. |
(4) | | Backed by an escrow or trust containing sufficient U.S. Government or U.S. Government agency securities, which ensure the timely payment of principal |
| | | and interest. Such investments are normally considered to be equivalent to AAA rated securities. |
(5) | | Auction Rate Preferred Shares, at Liquidation Value as a percentage of Total Investments is 33.4%. |
N/R | | Not rated. |
DD1 | | Investment or portion of investment purchased on a delayed delivery basis. |
(ETM) | | Escrowed to maturity. |
(IF) | | Inverse floating rate investment. |
(UB) | | Underlying bond of an inverse floating rate trust reflected as a financing transaction. See Notes to Financial Statements, Footnote 1 – General Information |
| | | and Significant Accounting Policies, Inverse Floating Rate Securities for more information. |
| | | |
| | | See accompanying notes to financial statements. |
Nuveen Investments 37
| | | | | | |
| | | Nuveen Michigan Dividend Advantage Municipal Fund | | |
NZW | | Portfolio of Investments | | |
| | | | February 28, 2011 | |
Principal | | | Optional Call | | |
Amount (000) | | Description (1) | Provisions (2) | Ratings (3) | Value |
| | | Consumer Staples – 4.0% (2.5% of Total Investments) | | | |
$ 1,250 | | Michigan Tobacco Settlement Finance Authority, Tobacco Settlement Asset-Backed Revenue Bonds, | 6/18 at 100.00 | BBB | $ 1,094,263 |
| | | Series 2008A, 6.875%, 6/01/42, DD1 | | | |
| | | Education and Civic Organizations – 6.0% (3.8% of Total Investments) | | | |
1,150 | | Michigan Higher Education Facilities Authority, Limited Obligation Revenue Refunding Bonds, | 9/11 at 100.00 | N/R | 968,105 |
| | | Kettering University, Series 2001, 5.000%, 9/01/26 – AMBAC Insured | | | |
250 | | Michigan Public Educational Facilities Authority, Charter School Revenue Bonds, American | 12/17 at 100.00 | N/R | 208,595 |
| | | Montessori Academy, Series 2007, 6.500%, 12/01/37 | | | |
500 | | Michigan State University, General Revenue Bonds, Refunding Series 2010C, 5.000%, 2/15/40 | 2/20 at 100.00 | Aa1 | 495,080 |
1,900 | | Total Education and Civic Organizations | | | 1,671,780 |
| | | Health Care – 17.6% (11.1% of Total Investments) | | | |
90 | | Jackson County Hospital Finance Authority, Michigan, Hospital Revenue Bonds, Alligiance | 6/20 at 100.00 | AA+ | 81,864 |
| | | Health, Refunding Series 2010A, 5.000%, 6/01/37 – AGM Insured | | | |
475 | | Michigan State Hospital Finance Authority, Hospital Revenue Bonds, Henry Ford Health System, | 11/19 at 100.00 | A1 | 444,040 |
| | | Refunding Series 2009, 5.750%, 11/15/39 | | | |
775 | | Michigan State Hospital Finance Authority, Hospital Revenue Bonds, Oakwood Obligated Group, | 4/13 at 100.00 | A | 753,742 |
| | | Series 2002A, 5.750%, 4/01/32 | | | |
150 | | Michigan State Hospital Finance Authority, Hospital Revenue Bonds, MidMichigan Obligated Group, | 6/19 at 100.00 | AA+ | 151,017 |
| | | Series 2009A, 5.875%, 6/01/39 – AGC Insured | | | |
80 | | Michigan State Hospital Finance Authority, Hospital Revenue Refunding Bonds, McLaren | No Opt. Call | Aa3 | 74,308 |
| | | Healthcare Corporation, Series 1998A, 5.000%, 6/01/28 | | | |
1,000 | | Michigan State Hospital Finance Authority, Hospital Revenue Refunding Bonds, Trinity Health | 12/12 at 100.00 | AA | 970,900 |
| | | Credit Group, Series 2002C, 5.375%, 12/01/30 | | | |
| | | Michigan State Hospital Finance Authority, Revenue Bonds, Marquette General Hospital, | | | |
| | | Series 2005A: | | | |
500 | | 5.000%, 5/15/26 | 5/15 at 100.00 | Baa3 | 434,280 |
400 | | 5.000%, 5/15/34 | 5/15 at 100.00 | Baa3 | 321,644 |
100 | | Royal Oak Hospital Finance Authority, Michigan, Hospital Revenue Bonds, William Beaumont | 9/18 at 100.00 | A1 | 111,904 |
| | | Hospital, Refunding Series 2009V, 8.250%, 9/01/39 | | | |
1,700 | | Royal Oak Hospital Finance Authority, Michigan, Hospital Revenue Bonds, William Beaumont | 11/11 at 100.00 | A1 | 1,521,993 |
| | | Hospital, Series 2001M, 5.250%, 11/15/31 – NPFG Insured | | | |
5,270 | | Total Health Care | | | 4,865,692 |
| | | Housing/Multifamily – 7.2% (4.5% of Total Investments) | | | |
1,700 | | Michigan Housing Development Authority, GNMA Collateralized Limited Obligation Multifamily | 8/12 at 102.00 | Aaa | 1,699,966 |
| | | Housing Revenue Bonds, Cranbrook Apartments, Series 2001A, 5.400%, 2/20/31 (Alternative | | | |
| | | Minimum Tax) | | | |
200 | | Michigan Housing Development Authority, Rental Housing Revenue Bonds, Series 2006D, 5.125%, | 7/15 at 100.00 | AA+ | 193,820 |
| | | 4/01/31 – AGM Insured (Alternative Minimum Tax) | | | |
100 | | Michigan Housing Development Authority, Rental Housing Revenue Bonds, Series 2009A, | 10/18 at 100.00 | AA | 101,160 |
| | | 5.700%, 10/01/39 | | | |
2,000 | | Total Housing/Multifamily | | | 1,994,946 |
| | | Housing/Single Family – 1.7% (1.1% of Total Investments) | | | |
500 | | Michigan Housing Development Authority, Single Family Homeownership Revenue Bonds, Series | 6/20 at 100.00 | AA | 479,185 |
| | | 2010C, 5.500%, 12/01/28 (Alternative Minimum Tax) | | | |
| | | Industrials – 1.8% (1.1% of Total Investments) | | | |
500 | | Michigan Strategic Fund, Limited Obligation Revenue Bonds, Republic Services Inc., Series | No Opt. Call | BBB+ | 504,165 |
| | | 2001, 4.250%, 8/01/31 (Mandatory put 4/01/14) (Alternative Minimum Tax) | | | |
38 Nuveen Investments
| | | | | | |
Principal | | | Optional Call | | |
Amount (000) | | Description (1) | Provisions (2) | Ratings (3) | Value |
| | | Tax Obligation/General – 44.8% (28.2% of Total Investments) | | | |
$ 200 | | Ann Arbor, Michigan, General Obligation Bonds, Court & Police Facilities Capital Improvement | 5/18 at 100.00 | AA+ | $ 200,524 |
| | | Series 2008, 5.000%, 5/01/38 | | | |
437 | | Caledonia Community Schools, Kent, Allegan and Barry Counties, Michigan, General Obligation | 5/17 at 100.00 | Aa2 | 387,925 |
| | | Bonds, Tender Option Bond Trust 2008-1096, 7.922%, 5/01/32 – NPFG Insured (IF) | | | |
50 | | Detroit-Wayne County Stadium Authority, Michigan, Limited Tax General Obligation Building | 8/11 at 100.00 | A– | 50,076 |
| | | Authority Stadium Bonds, Series 1997, 5.500%, 2/01/17 – FGIC Insured | | | |
300 | | Grand Rapids, Michigan, General Obligation Bonds, Capital Improvement Series 2007, 5.000%, | 9/17 at 100.00 | AA | 307,446 |
| | | 9/01/27 – NPFG Insured | | | |
940 | | Huron Valley School District, Oakland and Livingston Counties, Michigan, General Obligation | 11/11 at 100.00 | Aa2 | 940,150 |
| | | Bonds, Series 2001, 5.000%, 5/01/27 | | | |
500 | | Jackson Public Schools, Jackson County, Michigan, General Obligation School Building and Site | 5/14 at 100.00 | AA+ | 525,340 |
| | | Bonds, Series 2004, 5.000%, 5/01/22 – AGM Insured | | | |
430 | | Lowell Area Schools, Counties of Ionia and Kent, Michigan, General Obligation Bonds, Series | 5/17 at 100.00 | AA+ | 413,290 |
| | | 2007, 5.000%, 5/01/37 – AGM Insured | | | |
400 | | Michigan Municipal Bond Authority, General Obligation Bonds, Detroit City School District, | 6/15 at 100.00 | AA+ | 411,924 |
| | | Series 2005, 5.000%, 6/01/18 – AGM Insured | | | |
100 | | Michigan, General Obligation Bonds, Environmental Program, Series 2009A, 5.500%, 11/01/25 | 5/19 at 100.00 | Aa2 | 105,649 |
1,150 | | Muskegon County, Michigan, Limited Tax General Obligation Wastewater Management System 2 | 7/11 at 100.00 | AA | 1,154,324 |
| | | Revenue Bonds, Series 2002, 5.000%, 7/01/26 – FGIC Insured | | | |
1,410 | | New Haven Community Schools, Macomb County, Michigan, General Obligation Bonds, Series 2006, | 5/16 at 100.00 | AA+ | 1,437,707 |
| | | 5.000%, 5/01/25 – AGM Insured | | | |
420 | | Oakland Intermediate School District, Oakland County, Michigan, General Obligation Bonds, | 5/17 at 100.00 | Aaa | 411,428 |
| | | Series 2007, 5.000%, 5/01/36 – AGM Insured | | | |
1,000 | | Ottawa County, Michigan, Water Supply System, General Obligation Bonds, Series 2007, 5.000%, | 8/17 at 100.00 | Aaa | 1,011,180 |
| | | 8/01/30 – NPFG Insured (UB) | | | |
235 | | Parchment School District, Kalamazoo County, Michigan, General Obligation Bonds, Tender Option | No Opt. Call | AA+ | 182,689 |
| | | Bond Trust 2836, 11.061%, 5/01/15 – AGM Insured (IF) | | | |
750 | | Plainwell Community Schools, Allegan County, Michigan, General Obligation Bonds, School | 5/18 at 100.00 | AA+ | 757,380 |
| | | Building & Site, Series 2008, 5.000%, 5/01/28 – AGC Insured | | | |
100 | | Rockford Public Schools, Kent County, Michigan, General Obligation Bonds, Series 2008, 5.000%, | 5/18 at 100.00 | AA+ | 98,218 |
| | | 5/01/33 – AGM Insured | | | |
25 | | South Haven, Van Buren County, Michigan, General Obligation Bonds, Capital Improvement Series | 12/19 at 100.00 | AA+ | 25,359 |
| | | 2009, 5.125%, 12/01/33 – AGC Insured | | | |
330 | | Thornapple Kellogg School District, Barry County, Michigan, General Obligation Bonds, Series | 5/17 at 100.00 | Aa2 | 325,522 |
| | | 2007, 5.000%, 5/01/32 – NPFG Insured | | | |
100 | | Trenton Public Schools District, Michigan, General Obligation Bonds, Series 2008, 5.000%, | 5/18 at 100.00 | AA+ | 97,514 |
| | | 5/01/34 – AGM Insured | | | |
225 | | Van Dyke Public Schools, Macomb County, Michigan, General Obligation Bonds, School Building | 5/18 at 100.00 | AA+ | 215,791 |
| | | and Site, Series 2008, 5.000%, 5/01/38 – AGM Insured | | | |
25 | | Wayne Charter County, Michigan, General Obligation Bonds, Building Improvements, Series 2009A, | 12/19 at 100.00 | A– | 25,202 |
| | | 6.750%, 11/01/39 | | | |
1,690 | | Wayne County, Michigan, Limited Tax General Obligation Airport Hotel Revenue Bonds, Detroit | 12/11 at 101.00 | A– | 1,484,226 |
| | | Metropolitan Wayne County Airport, Series 2001A, 5.000%, 12/01/30 – NPFG Insured | | | |
500 | | Wayne Westland Community Schools, Michigan, General Obligation Bonds, Series 2004, 5.000%, | 11/14 at 100.00 | AA+ | 543,615 |
| | | 5/01/17 – AGM Insured | | | |
1,300 | | Willow Run Community Schools, Washtenaw County, Michigan, General Obligation Bonds, Series | 5/11 at 100.00 | Aa2 | 1,306,877 |
| | | 2001, 5.000%, 5/01/21 | | | |
12,617 | | Total Tax Obligation/General | | | 12,419,356 |
Nuveen Investments 39
| | | | | | |
Nuveen Michigan Dividend Advantage Municipal Fund (continued) | | |
NZW Portfolio of Investments February 28, 2011 | | | |
| | | | |
Principal | | | Optional Call | | |
Amount (000) | | Description (1) | Provisions (2) | Ratings (3) | Value |
| | | Tax Obligation/Limited – 16.9% (10.6% of Total Investments) | | | |
$ 1,100 | | Grand Rapids Building Authority, Kent County, Michigan, Limited Tax General Obligation Bonds, | 10/11 at 100.00 | AA | $ 1,117,611 |
| | | Series 2001, 5.125%, 10/01/26 – NPFG Insured | | | |
630 | | Kalkaska County Hospital Authority, Michigan, Hospital Revenue Bonds, Series 2007, | No Opt. Call | N/R | 651,943 |
| | | 5.125%, 5/01/14 | | | |
1,150 | | Michigan State Building Authority, Revenue Bonds, Facilities Program, Series 2001I, | 10/11 at 100.00 | Aa3 | 1,151,484 |
| | | 5.000%, 10/15/24 | | | |
| | | Michigan State Building Authority, Revenue Bonds, Refunding Series 2006IA: | | | |
1,520 | | 0.000%, 10/15/28 – FGIC Insured | 10/16 at 55.35 | AAA | 516,146 |
720 | | 5.000%, 10/15/36 – FGIC Insured | 10/16 at 100.00 | Aa3 | 657,886 |
700 | | Virgin Islands Public Finance Authority, Revenue Bonds, Senior Lien Matching Fund Loan | 10/19 at 100.00 | BBB | 579,236 |
| | | Notes, Series 2009A-1, 5.000%, 10/01/39 | | | |
5,820 | | Total Tax Obligation/Limited | | | 4,674,306 |
| | | Transportation – 2.5% (1.6% of Total Investments) | | | |
750 | | Metropolitan Washington DC Airports Authority, Virginia, Dulles Toll Road Revenue Bonds, | 10/28 at 100.00 | BBB+ | 427,545 |
| | | Dulles Metrorail Capital Appreciation, Series 2010B, 0.000%, 10/01/44 | | | |
250 | | Wayne County Airport Authority, Michigan, Revenue Bonds, Detroit Metropolitan Airport, | No Opt. Call | A | 260,788 |
| | | Refunding Series 2007, 5.000%, 12/01/12 – FGIC Insured | | | |
1,000 | | Total Transportation | | | 688,333 |
| | | U.S. Guaranteed – 20.5% (12.9% of Total Investments) (4) | | | |
1,000 | | Detroit City School District, Wayne County, Michigan, Unlimited Tax School Building and Site | 5/12 at 100.00 | AA+ (4) | 1,057,790 |
| | | Improvement Bonds, Series 2001A, 5.500%, 5/01/21 (Pre-refunded 5/01/12) – AGM Insured | | | |
720 | | Detroit, Michigan, Senior Lien Sewerage Disposal System Revenue Bonds, Series 2003A, 5.000%, | 7/13 at 100.00 | AA+ (4) | 791,863 |
| | | 7/01/17 (Pre-refunded 7/01/13) – AGM Insured | | | |
1,000 | | Garden City School District, Wayne County, Michigan, General Obligation Bonds, Refunding | 5/11 at 100.00 | Aa2 (4) | 1,008,220 |
| | | Series 2001, 5.000%, 5/01/26 (Pre-refunded 5/01/11) | | | |
1,000 | | Kent Hospital Finance Authority, Michigan, Revenue Bonds, Spectrum Health, Series 2001A, | 7/11 at 101.00 | AA (4) | 1,028,300 |
| | | 5.250%, 1/15/21 (Pre-refunded 7/15/11) | | | |
55 | | Michigan State Building Authority, Revenue Bonds, Facilities Program, Series 2001I, 5.000%, | 10/11 at 100.00 | A+ (4) | 56,563 |
| | | 10/15/24 (Pre-refunded 10/15/11) | | | |
| | | Michigan State Hospital Finance Authority, Revenue Bonds, Chelsea Community Hospital, | | | |
| | | Series 2005: | | | |
425 | | 5.000%, 5/15/30 (Pre-refunded 5/15/15) | 5/15 at 100.00 | AAA | 486,166 |
335 | | 5.000%, 5/15/37 (Pre-refunded 5/15/15) | 5/15 at 100.00 | AAA | 383,213 |
| | | Puerto Rico Public Finance Corporation, Commonwealth Appropriation Bonds, Series 2002E: | | | |
85 | | 6.000%, 8/01/26 (ETM) | No Opt. Call | Baa1 (4) | 105,037 |
615 | | 6.000%, 8/01/26 (ETM) | No Opt. Call | AAA | 759,974 |
5,235 | | Total U.S. Guaranteed | | | 5,677,126 |
| | | Utilities – 19.4% (12.2% of Total Investments) | | | |
1,115 | | Lansing Board of Water and Light, Michigan, Steam and Electric Utility System Revenue Bonds, | 7/13 at 100.00 | AA+ | 1,136,876 |
| | | Series 2003A, 5.000%, 7/01/21 – AGM Insured | | | |
| | | Lansing Board of Water and Light, Michigan, Steam and Electric Utility System Revenue Bonds, | | | |
| | | Series 2008A: | | | |
50 | | 5.000%, 7/01/28 | 7/18 at 100.00 | AA– | 50,502 |
750 | | 5.000%, 7/01/32 | 7/18 at 100.00 | AA– | 739,785 |
1,235 | | Michigan Public Power Agency, Revenue Bonds, Combustion Turbine 1 Project, Series 2001A, | 1/12 at 100.00 | A2 | 1,242,484 |
| | | 5.250%, 1/01/24 – AMBAC Insured | | | |
2,215 | | Michigan Strategic Fund, Collateralized Limited Obligation Pollution Control Revenue Refunding | 9/11 at 100.00 | A | 2,215,487 |
| | | Bonds, Fixed Rate Conversion, Detroit Edison Company, Series 1999C, 5.650%, 9/01/29 – | | | |
| | | SYNCORA GTY Insured (Alternative Minimum Tax) | | | |
5,365 | | Total Utilities | | | 5,385,134 |
40 Nuveen Investments
| | | | | | |
Principal | | | Optional Call | | |
Amount (000) | | Description (1) | Provisions (2) | Ratings (3) | Value |
| | | Water and Sewer – 16.5% (10.4% of Total Investments) | | | |
$ 1,000 | | Detroit Water Supply System, Michigan, Water Supply System Revenue Bonds, Series 2006A, | 7/16 at 100.00 | AA+ | $ 890,120 |
| | | 5.000%, 7/01/34 – AGM Insured | | | |
1,000 | | Detroit, Michigan, Senior Lien Sewerage Disposal System Revenue Bonds, Series 2001B, 5.500%, | No Opt. Call | A | 969,830 |
| | | 7/01/29 – FGIC Insured | | | |
280 | | Detroit, Michigan, Senior Lien Sewerage Disposal System Revenue Bonds, Series 2003A, 5.000%, | 7/13 at 100.00 | AA+ | 289,223 |
| | | 7/01/17 – AGM Insured | | | |
125 | | Grand Rapids, Michigan, Sanitary Sewer System Revenue Bonds, Series 2008, 5.000%, 1/01/38 | 1/18 at 100.00 | AA+ | 122,014 |
150 | | Grand Rapids, Michigan, Water Supply System Revenue Bonds, Series 2009, 5.100%, 1/01/39 – | 1/19 at 100.00 | AA+ | 150,422 |
| | | AGC Insured | | | |
1,000 | | Michigan Municipal Bond Authority, Clean Water Revolving Fund Revenue Bonds, Series 2005, | 10/15 at 100.00 | AAA | 1,101,669 |
| | | 5.000%, 10/01/19 | | | |
500 | | Michigan Municipal Bond Authority, Water Revolving Fund Revenue Bonds, Series 2007, | 10/17 at 100.00 | AAA | 534,319 |
| | | 5.000%, 10/01/23 | | | |
500 | | Puerto Rico Aqueduct and Sewerage Authority, Revenue Bonds, Senior Lien Series 2008A, | 7/18 at 100.00 | Baa1 | 464,764 |
| | | 6.000%, 7/01/44 | | | |
50 | | Saginaw, Michigan, Water Supply System Revenue Bonds, Series 2008, 5.250%, 7/01/22 – | 7/18 at 100.00 | A | 50,894 |
| | | NPFG Insured | | | |
4,605 | | Total Water and Sewer | | | 4,573,255 |
$ 46,062 | | Total Investments (cost $44,477,774) – 158.9% | | | 44,027,541 |
| | | Floating Rate Obligations – (2.4)% | | | (665,000) |
| | | MuniFund Term Preferred Shares, at Liquidation Value – (58.9)% (5) | | | (16,313,000) |
| | | Other Assets Less Liabilities – 2.4% | | | 660,098 |
| | | Net Assets Applicable to Common Shares – 100% | | | $ 27,709,639 |
| | | |
(1) | | All percentages shown in the Portfolio of Investments are based on net assets applicable to Common shares unless otherwise noted. |
(2) | | Optional Call Provisions (not covered by the report of independent registered public accounting firm): Dates (month and year) and prices of the earliest |
| | | optional call or redemption. There may be other call provisions at varying prices at later dates. Certain mortgage-backed securities may be subject to |
| | | periodic principal paydowns. |
(3) | | Ratings (not covered by the report of independent registered public accounting firm): Using the highest of Standard & Poor’s Group (“Standard & Poor’s”), |
| | | Moody’s Investor Service, Inc. (“Moody’s”) or Fitch, Inc. (“Fitch”) rating. Ratings below BBB by Standard & Poor’s, Baa by Moody’s or BBB by Fitch are |
| | | considered to be below investment grade. Holdings designated N/R are not rated by any of these national rating agencies. |
(4) | | Backed by an escrow or trust containing sufficient U.S. Government or U.S. Government agency securities, which ensure the timely payment of principal |
| | | and interest. Such investments are normally considered to be equivalent to AAA rated securities. |
(5) | | MuniFund Term Preferred Shares, at Liquidation Value as a percentage of Total Investments is 37.1%. |
N/R | | Not rated. |
DD1 | | Investment or portion of investment purchased on a delayed delivery basis. |
(IF) | | Inverse floating rate investment. |
(UB) | | Underlying bond of an inverse floating rate trust reflected as a financing transaction. See Notes to Financial Statements, Footnote 1 – General Information |
| | | and Significant Accounting Policies, Inverse Floating Rate Securities for more information. |
| | | |
| | | See accompanying notes to financial statements. |
Nuveen Investments 41
| | | | | | |
| | | Nuveen Ohio Quality Income Municipal Fund, Inc. | | |
NUO | | Portfolio of Investments | | |
| | | | February 28, 2011 | |
Principal | | | Optional Call | | |
Amount (000) | | Description (1) | Provisions (2) | Ratings (3) | Value |
| | | Consumer Staples – 7.0% (4.8% of Total Investments) | | | |
| | | Buckeye Tobacco Settlement Financing Authority, Ohio, Tobacco Settlement Asset-Backed Revenue | | | |
| | | Bonds, Senior Lien, Series 2007A-2: | | | |
$ 6,230 | | 5.875%, 6/01/30 | 6/17 at 100.00 | Baa3 | $ 4,496,627 |
1,650 | | 5.750%, 6/01/34 | 6/17 at 100.00 | Baa3 | 1,133,187 |
7,255 | | 5.875%, 6/01/47 | 6/17 at 100.00 | Baa3 | 4,832,846 |
115 | | Puerto Rico, The Children’s Trust Fund, Tobacco Settlement Asset-Backed Refunding Bonds, | 5/12 at 100.00 | BBB | 104,788 |
| | | Series 2002, 5.375%, 5/15/33 | | | |
15,250 | | Total Consumer Staples | | | 10,567,448 |
| | | Education and Civic Organizations – 13.9% (9.5% of Total Investments) | | | |
1,650 | | Ohio Higher Education Facilities Commission, General Revenue Bonds, Kenyon College, Series | 7/16 at 100.00 | A+ | 1,542,618 |
| | | 2006, 5.000%, 7/01/41 | | | |
1,750 | | Ohio Higher Education Facilities Commission, General Revenue Bonds, Oberlin College, Series | 10/13 at 100.00 | AA | 1,846,985 |
| | | 2003, 5.125%, 10/01/24 | | | |
1,000 | | Ohio Higher Education Facilities Commission, Revenue Bonds, Wittenberg University, Series | 12/15 at 100.00 | Baa2 | 861,960 |
| | | 2005, 5.000%, 12/01/29 | | | |
2,420 | | Ohio Higher Educational Facilities Commission, General Revenue Bonds, University of Dayton, | 12/16 at 100.00 | A | 2,392,872 |
| | | 2006 Project, Series 2006, 5.000%, 12/01/30 – AMBAC Insured | | | |
1,415 | | Ohio Higher Educational Facilities Commission, Revenue Bonds, Denison University, Series 2004, | 11/14 at 100.00 | AA | 1,473,199 |
| | | 5.000%, 11/01/21 | | | |
1,320 | | Ohio Higher Educational Facilities Commission, Revenue Bonds, University of Dayton, Series | 12/14 at 100.00 | A | 1,338,850 |
| | | 2004, 5.000%, 12/01/25 – AMBAC Insured | | | |
1,000 | | Ohio Higher Educational Facilities Commission, Revenue Bonds, Wittenberg University, Series | 12/11 at 100.00 | Baa2 | 1,013,200 |
| | | 2001, 5.500%, 12/01/15 | | | |
1,500 | | Ohio State Higher Education Facilities, Revenue Bonds, Case Western Reserve University, Series | 12/16 at 100.00 | AA– | 1,430,625 |
| | | 2006, 5.000%, 12/01/44 – NPFG Insured | | | |
2,000 | | Ohio State Higher Educational Facility Commission, Higher Education Facility Revenue Bonds, | 11/18 at 100.00 | A– | 2,103,580 |
| | | Xavier University 2008C, 5.750%, 5/01/28 | | | |
550 | | Ohio State University, General Receipts Bonds, Series 2003B, 5.250%, 6/01/22 | 6/13 at 100.00 | Aa1 | 586,553 |
1,510 | | University of Akron, Ohio, General Receipts Bonds, Series 2003A, 5.000%, 1/01/21 – | 1/13 at 100.00 | A1 | 1,539,974 |
| | | AMBAC Insured | | | |
850 | | University of Cincinnati, Ohio, General Receipts Bonds, Series 2003C, 5.000%, 6/01/22 – | 6/13 at 100.00 | A+ | 860,880 |
| | | FGIC Insured | | | |
| | | University of Cincinnati, Ohio, General Receipts Bonds, Series 2004D: | | | |
1,200 | | 5.000%, 6/01/19 – AMBAC Insured | 6/14 at 100.00 | A+ | 1,274,460 |
2,605 | | 5.000%, 6/01/25 – AMBAC Insured | 6/14 at 100.00 | A+ | 2,628,940 |
20,770 | | Total Education and Civic Organizations | | | 20,894,696 |
| | | Energy – 0.2% (0.1% of Total Investments) | | | |
250 | | Virgin Islands Public Finance Authority, Refinery Facilities Revenue Bonds, Hovensa Coker | 1/13 at 100.00 | Baa3 | 244,465 |
| | | Project, Senior Lien Series 2002, 6.500%, 7/01/21 (Alternative Minimum Tax) | | | |
| | | Health Care – 26.4% (18.0% of Total Investments) | | | |
2,000 | | Akron, Bath and Copley Joint Township Hospital District, Ohio, Hospital Facilities Revenue | 5/11 at 100.00 | Baa1 | 1,920,160 |
| | | Bonds, Summa Health System, Series 1998A, 5.375%, 11/15/24 | | | |
3,000 | | Butler County, Ohio, Hospital Facilities Revenue Bonds, UC Health, Series 2010, | 11/20 at 100.00 | BBB+ | 2,528,310 |
| | | 5.500%, 11/01/40 | | | |
3,405 | | Butler County, Ohio, Hospital Facilities Revenue Bonds, Cincinnati Children’s Medical Center | 5/16 at 100.00 | N/R | 3,159,363 |
| | | Project, Series 2006K, 5.000%, 5/15/31 – FGIC Insured | | | |
42 Nuveen Investments
| | | | | | |
Principal | | | Optional Call | | |
Amount (000) | | Description (1) | Provisions (2) | Ratings (3) | Value |
| | | Health Care (continued) | | | |
$ 1,000 | | Cuyahoga County, Ohio, Hospital Revenue Refunding and Improvement Bonds, MetroHealth System, | 8/11 at 100.00 | A2 | $ 1,001,390 |
| | | Series 1997, 5.625%, 2/15/17 – NPFG Insured | | | |
2,000 | | Cuyahoga County, Ohio, Revenue Refunding Bonds, Cleveland Clinic Health System, Series 2003A, | 7/13 at 100.00 | Aa2 | 2,015,360 |
| | | 6.000%, 1/01/32 | | | |
1,000 | | Erie County, Ohio, Hospital Facilities Revenue Bonds, Firelands Regional Medical Center, | 8/12 at 101.00 | A– | 902,660 |
| | | Series 2002A, 5.625%, 8/15/32 | | | |
180 | | Franklin County, Ohio, Hospital Revenue Bonds, Holy Cross Health System Corporation, Series | 6/11 at 100.00 | AA | 178,344 |
| | | 1998, 5.000%, 6/01/28 – NPFG Insured | | | |
| | | Franklin County, Ohio, Hospital Revenue Bonds, Nationwide Children’s Hospital Project, | | | |
| | | Improvement Series 2009: | | | |
250 | | 5.000%, 11/01/34 | 11/19 at 100.00 | Aa2 | 231,055 |
300 | | 5.250%, 11/01/40 | 11/19 at 100.00 | Aa2 | 284,451 |
1,200 | | Franklin County, Ohio, Hospital Revenue Bonds, Nationwide Children’s Hospital Project, Series | 11/18 at 100.00 | Aa2 | 1,094,688 |
| | | 2005, 5.000%, 11/01/40 | | | |
2,455 | | Hamilton County, Ohio, Revenue Bonds, Children’s Hospital Medical Center, Series 2004J, | 5/14 at 100.00 | BBB | 2,584,231 |
| | | 5.250%, 5/15/16 – FGIC Insured | | | |
1,000 | | Lorain County, Ohio, Hospital Revenue Refunding and Improvement Bonds, Catholic Healthcare | 10/12 at 100.00 | AA– | 969,910 |
| | | Partners, Refunding Series 2002, 5.375%, 10/01/30 | | | |
| | | Lucas County, Ohio, Hospital Revenue Bonds, ProMedica Healthcare Obligated Group, Series 1999: | | | |
2,075 | | 5.375%, 11/15/29 – AMBAC Insured | 5/11 at 100.50 | AA– | 1,995,528 |
140 | | 5.375%, 11/15/39 – AMBAC Insured | 5/11 at 100.50 | AA– | 128,073 |
| | | Lucas County, Ohio, Hospital Revenue Bonds, ProMedica Healthcare Obligated Group, Series 2008D: | | | |
90 | | 5.000%, 11/15/38 | 11/18 at 100.00 | AA– | 79,785 |
40 | | 5.125%, 11/15/40 | 11/18 at 100.00 | AA– | 35,120 |
2,665 | | Lucas County, Ohio, Hospital Revenue Bonds, ProMedica Healthcare Obligated Group, Series | 11/21 at 100.00 | AA– | 2,681,443 |
| | | 2011A, 6.000%, 11/15/41 | | | |
785 | | Miami County, Ohio, Hospital Facilities Revenue Refunding Bonds, Upper Valley Medical Center | 5/16 at 100.00 | A– | 798,895 |
| | | Inc., Series 2006, 5.250%, 5/15/21 | | | |
| | | Montgomery County, Ohio, Revenue Bonds, Catholic Health Initiatives, Series 2004A: | | | |
1,500 | | 5.000%, 5/01/30 | 5/14 at 100.00 | AA | 1,460,205 |
2,500 | | 5.000%, 5/01/32 | No Opt. Call | AA | 2,401,975 |
1,350 | | Montgomery County, Ohio, Revenue Bonds, Miami Valley Hospital, Series 2009A, 6.250%, 11/15/39 | 11/14 at 100.00 | Aa3 | 1,387,098 |
95 | | Ohio Higher Educational Facilities Commission, Revenue Bonds, University Hospitals Health | No Opt. Call | AA+ | 93,279 |
| | | System Inc., Series 2007A, 5.250%, 1/15/46 – BHAC Insured | | | |
| | | Ohio State Higher Educational Facilities Commission, Hospital Revenue Bonds, Cleveland Clinic | | | |
| | | Health System Obligated Group, Series 2008A: | | | |
1,315 | | 5.000%, 1/01/25 | 1/18 at 100.00 | Aa2 | 1,334,699 |
50 | | 5.250%, 1/01/33 | 1/18 at 100.00 | Aa2 | 48,604 |
1,200 | | Ohio State Higher Educational Facilities Commission, Hospital Revenue Bonds, Summa Health | 5/20 at 100.00 | AA+ | 1,116,192 |
| | | System Project, Series 2010, 5.250%, 11/15/40 – AGM Insured | | | |
1,500 | | Ohio State Higher Educational Facilities Commission, Hospital Revenue Bonds, University | 1/15 at 100.00 | A | 1,542,480 |
| | | Hospitals Health System, Series 2009, 6.750%, 1/15/39 | | | |
1,000 | | Ohio State, Hospital Facility Revenue Refunding Bonds, Cleveland Clinic Health System | 1/19 at 100.00 | Aa2 | 1,002,440 |
| | | Obligated Group, Series 2009A, 5.500%, 1/01/39 | | | |
| | | Ohio State, Hospital Facility Revenue Refunding Bonds, Cleveland Clinic Health System | | | |
| | | Obligated Group, Tender Option Bond Trust 3551: | | | |
375 | | 19.708%, 1/01/17 (IF) | No Opt. Call | Aa2 | 359,310 |
2,700 | | 64.415%, 1/01/33 (IF) | 1/19 at 100.00 | Aa2 | 2,726,352 |
1,100 | | Ohio State, Hospital Facility Revenue Refunding Bonds, Cleveland Clinic Health System | 1/19 at 100.00 | Aa2 | 1,110,736 |
| | | Obligated Group, Tender Option Bond Trust 3591, 64.573%, 1/01/17 (IF) | | | |
830 | | Richland County, Ohio, Hospital Facilities Revenue Improvement Bonds, MedCentral Health System | 11/12 at 100.00 | A– | 838,126 |
| | | Obligated Group, Series 2000B, 6.375%, 11/15/30 | | | |
Nuveen Investments 43
| | | | | | |
Nuveen Ohio Quality Income Municipal Fund, Inc. (continued) | | | |
NUO Portfolio of Investments February 28, 2011 | | | |
| | | | |
Principal | | | Optional Call | | |
Amount (000) | | Description (1) | Provisions (2) | Ratings (3) | Value |
| | | Health Care (continued) | | | |
$ 1,200 | | Richland County, Ohio, Hospital Revenue Bonds, MidCentral Health System Group, Series 2006, | 11/16 at 100.00 | A– | $ 1,084,140 |
| | | 5.250%, 11/15/36 | | | |
600 | | Ross County, Ohio, Hospital Revenue Refunding Bonds, Adena Health System Series 2008, | 12/18 at 100.00 | A | 592,140 |
| | | 5.750%, 12/01/35 | | | |
40,900 | | Total Health Care | | | 39,686,542 |
| | | Housing/Multifamily – 5.7% (3.9% of Total Investments) | | | |
1,385 | | Clermont County, Ohio, GNMA Collateralized Mortgage Revenue Bonds, S.E.M. Villa II Project, | 8/11 at 100.00 | Aaa | 1,385,762 |
| | | Series 1994A, 5.950%, 2/20/30 | | | |
| | | Cuyahoga County, Ohio, GNMA Collateralized Multifamily Housing Mortgage Revenue Bonds, | | | |
| | | Longwood Phase One Associates LP, Series 2001A: | | | |
2,475 | | 5.350%, 1/20/21 (Alternative Minimum Tax) | 7/11 at 102.00 | Aaa | 2,507,546 |
2,250 | | 5.450%, 1/20/31 (Alternative Minimum Tax) | 7/11 at 102.00 | Aaa | 2,222,955 |
800 | | Montgomery County, Ohio, GNMA Guaranteed Multifamily Housing Revenue Bonds, Canterbury Court | 10/18 at 101.00 | Aa1 | 788,136 |
| | | Project, Series 2007, 5.500%, 10/20/42 (Alternative Minimum Tax) | | | |
755 | | Ohio Housing Finance Agency, FHA-Insured Multifamily Housing Mortgage Revenue Bonds, Madonna | 6/16 at 102.00 | AAA | 675,166 |
| | | Homes, Series 2006M, 4.900%, 6/20/48 (Alternative Minimum Tax) | | | |
1,100 | | Summit County Port Authority, Ohio, Multifamily Housing Revenue Bonds, Callis Tower Apartments | 9/17 at 102.00 | AAA | 987,063 |
| | | Project, Series 2007, 5.250%, 9/20/47 (Alternative Minimum Tax) | | | |
8,765 | | Total Housing/Multifamily | | | 8,566,628 |
| | | Housing/Single Family – 0.8% (0.5% of Total Investments) | | | |
1,220 | | Ohio Housing Finance Agency, Single Family Mortgage Revenue Bonds, Series 2006H, 5.000%, | 9/15 at 100.00 | Aaa | 1,152,705 |
| | | 9/01/31 (Alternative Minimum Tax) | | | |
| | | Industrials – 1.2% (0.8% of Total Investments) | | | |
755 | | Cleveland-Cuyahoga County Port Authority, Ohio, Development Revenue Bonds, Bond Fund | 11/15 at 100.00 | BBB– | 658,768 |
| | | Program – Columbia National Group Project, Series 2005D, 5.000%, 5/15/20 (Alternative | | | |
| | | Minimum Tax) | | | |
1,175 | | Cleveland-Cuyahoga County Port Authority, Ohio, Development Revenue Bonds, Jergens Inc., | 5/11 at 100.00 | BBB– | 1,096,498 |
| | | Series 1998A, 5.375%, 5/15/18 (Alternative Minimum Tax) | | | |
1,930 | | Total Industrials | | | 1,755,266 |
| | | Long-Term Care – 1.0% (0.7% of Total Investments) | | | |
490 | | Franklin County, Ohio, Healthcare Facilities Revenue Bonds, Ohio Presbyterian Retirement | 7/21 at 100.00 | BBB | 472,409 |
| | | Services, Improvement Series 2010A, 5.625%, 7/01/26 | | | |
1,165 | | Montgomery County, Ohio, Health Care and Multifamily Housing Revenue Bonds, Saint Leonard, | 4/20 at 100.00 | BBB– | 1,082,413 |
| | | Refunding & improvement Series 2010, 6.625%, 4/01/40 | | | |
1,655 | | Total Long-Term Care | | | 1,554,822 |
| | | Materials – 1.4% (1.0% of Total Investments) | | | |
2,000 | | Toledo-Lucas County Port Authority, Ohio, Port Revenue Bonds, Cargill Inc., Series 2004B, | No Opt. Call | A | 2,128,380 |
| | | 4.500%, 12/01/15 | | | |
| | | Tax Obligation/General – 36.4% (24.8% of Total Investments) | | | |
| | | Butler County, Ohio, General Obligation Bonds, Series 2002: | | | |
1,345 | | 5.000%, 12/01/21 – NPFG Insured | 12/12 at 100.00 | Aa1 | 1,450,004 |
1,200 | | 5.000%, 12/01/22 – NPFG Insured | 12/12 at 101.00 | Aa1 | 1,273,236 |
1,500 | | Centerville City School District, Montgomery County, Ohio, General Obligation Bonds, Series | 6/15 at 100.00 | Aa1 | 1,523,730 |
| | | 2005, 5.000%, 12/01/30 – AGM Insured | | | |
1,000 | | Central Ohio Solid Waste Authority, General Obligation Bonds, Series 2004A, 5.000%, 12/01/15 – | 6/14 at 100.00 | AAA | 1,093,520 |
| | | AMBAC Insured | | | |
1,000 | | Cleveland Municipal School District, Cuyahoga County, Ohio, General Obligation Bonds, Series | 6/14 at 100.00 | AA+ | 1,036,890 |
| | | 2004, 5.000%, 12/01/22 – AGM Insured | | | |
3,000 | | Columbus City School District, Franklin County, Ohio, General Obligation Bonds, Series 2006, | No Opt. Call | AAA | 1,169,460 |
| | | 0.000%, 12/01/28 – AGM Insured | | | |
44 Nuveen Investments
| | | | | | |
Principal | | | Optional Call | | |
Amount (000) | | Description (1) | Provisions (2) | Ratings (3) | Value |
| | | Tax Obligation/General (continued) | | | |
$ 1,200 | | Cuyahoga County, Ohio, General Obligation Bonds, Series 2004, 5.000%, 12/01/21 | 12/14 at 100.00 | AA+ | $ 1,284,732 |
1,000 | | Dayton, Ohio, General Obligation Bonds, Series 2004, 5.250%, 12/01/19 – AMBAC Insured | 6/14 at 100.00 | Aa2 | 1,089,100 |
1,000 | | Dublin City School District, Franklin, Delaware and Union Counties, Ohio, General Obligation | 12/13 at 100.00 | AAA | 1,066,750 |
| | | Bonds, Series 2003, 5.000%, 12/01/22 – AGM Insured | | | |
1,195 | | Fairview Park City School District, Cuyahoga County, Ohio, General Obligation Bonds, Series | 6/15 at 100.00 | Aa3 | 1,232,929 |
| | | 2005, 5.000%, 12/01/24 – NPFG Insured | | | |
1,840 | | Franklin County, Ohio, General Obligation Bonds, Series 2007, 5.000%, 12/01/28 | 12/17 at 100.00 | AAA | 1,938,440 |
1,500 | | Green, Ohio, General Obligation Bonds, Series 2008, 5.500%, 12/01/32 | 12/15 at 100.00 | AA | 1,535,430 |
1,355 | | Grove City, Ohio, General Obligation Bonds, Construction & Improvement Series 2009, | No Opt. Call | Aa1 | 1,388,523 |
| | | 5.125%, 12/01/36 | | | |
7,020 | | Hamilton City School District, Ohio, General Obligation Bonds, Series 2007, 5.000%, 12/01/34 – | 6/17 at 100.00 | AA+ | 6,861,977 |
| | | AGM Insured | | | |
1,850 | | Hilliard School District, Franklin County, Ohio, General Obligation Bonds, School | 12/15 at 100.00 | Aa1 | 1,861,526 |
| | | Construction, Series 2005, 5.000%, 12/01/26 – NPFG Insured | | | |
3,000 | | Hilliard School District, Franklin County, Ohio, General Obligation Bonds, Series 2006A, | 12/16 at 100.00 | Aa1 | 3,122,370 |
| | | 5.000%, 12/01/25 – NPFG Insured | | | |
2,580 | | Indian Lake Local School District, Logan and Auglaize Counties, Ohio, School Facilities | 6/17 at 100.00 | Aa3 | 2,516,738 |
| | | Improvement and Refunding Bonds, Series 2007, 5.000%, 12/01/34 – NPFG Insured | | | |
1,160 | | Kenston Local School District, Geauga County, Ohio, General Obligation Bonds, Series 2003, | 6/13 at 100.00 | Aa2 | 1,224,171 |
| | | 5.000%, 12/01/22 – NPFG Insured | | | |
800 | | Lakewood City School District, Cuyahoga County, Ohio, General Obligation Bonds, Series 2007, | 12/17 at 100.00 | Aa2 | 831,824 |
| | | 5.000%, 12/01/25 – FGIC Insured | | | |
1,585 | | Lucas County, Ohio, General Obligation Bonds, Various Purpose Series 2010, 5.000%, 10/01/40 | 10/18 at 100.00 | Aa2 | 1,557,278 |
505 | | Marysville Exempted School District, Union County, Ohio, General Obligation Bonds, Series | 12/15 at 100.00 | AA+ | 518,413 |
| | | 2006, 5.000%, 12/01/25 – AGM Insured | | | |
500 | | Mason City School District, Counties of Warren and Butler, Ohio, General Obligation Bonds, | 6/17 at 100.00 | Aaa | 511,965 |
| | | Series 2007, 5.000%, 12/01/31 | | | |
1,515 | | Massillon City School District, Ohio, General Obligation Bonds, Series 2003, 5.250%, | 12/12 at 100.00 | Baa1 | 1,549,254 |
| | | 12/01/21 – NPFG Insured | | | |
1,350 | | Milford Exempted Village School District, Ohio, General Obligation Bonds, Series 2008, | 12/18 at 100.00 | Aa3 | 1,315,481 |
| | | 5.250%, 12/01/36 | | | |
640 | | New Albany Plain Local School District, Franklin County, Ohio, General Obligation Bonds, | 6/12 at 100.00 | Aa1 | 669,920 |
| | | Series 2002, 5.500%, 12/01/17 – FGIC Insured | | | |
1,000 | | Newark City School District, Licking County, Ohio, General Obligation Bonds, Series 2005, | 12/15 at 100.00 | A1 | 1,008,340 |
| | | 5.000%, 12/01/28 – FGIC Insured | | | |
1,000 | | Northmor Local School District, Morrow County, Ohio, General Obligation School Facilities | 11/18 at 100.00 | Aa2 | 979,390 |
| | | Construction and Improvement Bonds, Series 2008, 5.000%, 11/01/36 | | | |
3,000 | | Ohio, General Obligation Bonds, Infrastructure Improvements, Series 2003F, 5.000%, 2/01/23 | 2/13 at 100.00 | AA+ | 3,073,470 |
500 | | Olentangy Local School District, Delaware and Franklin Counties, Ohio, General Obligation | 6/18 at 100.00 | AA+ | 501,925 |
| | | Bonds, Series 2008, 5.000%, 12/01/36 | | | |
1,510 | | Painesville City School District, Ohio, General Obligation Bonds, Series 2004, 5.000%, | 12/14 at 100.00 | A1 | 1,601,174 |
| | | 12/01/22 – FGIC Insured | | | |
280 | | Plain Local School District, Franklin and Licking Counties, Ohio, General Obligation Bonds, | 6/11 at 100.00 | Aa1 | 283,615 |
| | | Series 2000, 6.000%, 12/01/20 – FGIC Insured | | | |
2,000 | | Strongsville, Ohio, General Obligation Bonds, Series 2001, 5.000%, 12/01/21 – FGIC Insured | 12/11 at 100.00 | Aaa | 2,058,360 |
70 | | Strongsville, Ohio, Limited Tax General Obligation Various Purpose Improvement Bonds, Series | 6/11 at 100.00 | Aaa | 70,301 |
| | | 1996, 5.950%, 12/01/21 | | | |
100 | | Sylvania City School District, Ohio, General Obligation School Improvement Bonds, Series 1995, | 6/17 at 100.00 | AA+ | 100,547 |
| | | 5.250%, 12/01/36 – AGC Insured | | | |
Nuveen Investments 45
| | | | | | |
Nuveen Ohio Quality Income Municipal Fund, Inc. (continued) | | | |
NUO Portfolio of Investments February 28, 2011 | | | |
| | | | | | |
Principal | | | Optional Call | | |
Amount (000) | | Description (1) | Provisions (2) | Ratings (3) | Value |
| | | Tax Obligation/General (continued) | | | |
$ 650 | | Vandalia Butler City School District, Montgomery County, Ohio, General Obligation Bonds, | No Opt. Call | AA | $ 648,070 |
| | | School Improvment Series 2009, 5.125%, 12/01/37 | | | |
| | | Warren City School District, Trumbull County, Ohio, General Obligation Bonds, Series 2004: | | | |
2,515 | | 5.000%, 12/01/20 – FGIC Insured | 6/14 at 100.00 | AA | 2,661,901 |
1,170 | | 5.000%, 12/01/22 – FGIC Insured | 6/14 at 100.00 | AA | 1,231,647 |
1,000 | | West Chester Township, Butler County, Ohio, General Obligation Bonds, Series 2003, 5.000%, | 12/13 at 100.00 | Aaa | 1,001,710 |
| | | 12/01/28 – NPFG Insured | | | |
55,435 | | Total Tax Obligation/General | | | 54,844,111 |
| | | Tax Obligation/Limited – 17.1% (11.7% of Total Investments) | | | |
1,380 | | Columbus, Ohio, Tax Increment Financing Bonds, Easton Project, Series 2004A, 5.000%, | 6/14 at 100.00 | BBB+ | 1,387,507 |
| | | 12/01/25 – AMBAC Insured | | | |
4,000 | | Cuyhoga County, Ohio, Economic Development Revenue Bonds, Federally Taxable Recovery Zone | 12/20 at 100.00 | AA | 4,080,200 |
| | | Facility Medical Mart- Convention Center Project, Series 2010G, 5.000%, 12/01/27 | | | |
3,000 | | Franklin County Convention Facilities Authority, Ohio, Excise Tax and Lease Revenue | 12/15 at 100.00 | Aaa | 3,075,660 |
| | | Anticipation Bonds, Series 2005, 5.000%, 12/01/27 – AMBAC Insured | | | |
1,085 | | Hamilton County Convention Facilities Authority, Ohio, First Lien Revenue Bonds, Series 2004, | 6/14 at 100.00 | A+ | 1,167,037 |
| | | 5.000%, 12/01/18 – FGIC Insured | | | |
4,600 | | Hamilton County, Ohio, Sales Tax Bonds, Subordinate Lien, Series 2006, 5.000%, 12/01/32 – | 12/16 at 100.00 | A1 | 4,434,170 |
| | | AMBAC Insured | | | |
1,000 | | Hudson City School District, Ohio, Certificates of Participation, Series 2004, 5.000%, | 6/14 at 100.00 | Aa3 | 1,003,500 |
| | | 6/01/26 – NPFG Insured | | | |
| | | New Albany Community Authority, Ohio, Community Facilities Revenue Refunding Bonds, | | | |
| | | Series 2001B: | | | |
1,000 | | 5.500%, 10/01/15 – AMBAC Insured | 4/12 at 100.00 | A1 | 1,023,770 |
1,000 | | 5.500%, 10/01/17 – AMBAC Insured | 4/12 at 100.00 | A1 | 1,017,220 |
800 | | Ohio State Building Authority, State Facilities Bonds, Administrative Building Fund Projects, | 4/15 at 100.00 | AA+ | 823,736 |
| | | Series 2005A, 5.000%, 4/01/25 – AGM Insured | | | |
1,000 | | Ohio, State Appropriation Lease Bonds, Mental Health Capital Facilities, Series 2003B-II, | 6/13 at 100.00 | AA | 1,069,900 |
| | | 5.000%, 6/01/16 | | | |
23,215 | | Puerto Rico Sales Tax Financing Corporation, Sales Tax Revenue Bonds, First Subordinate Series | No Opt. Call | A+ | 5,071,781 |
| | | 2009A, 0.000%, 8/01/34 | | | |
7,875 | | Puerto Rico Sales Tax Financing Corporation, Sales Tax Revenue Bonds, Series 2010A, | No Opt. Call | A+ | 1,593,349 |
| | | 0.000%, 8/01/35 | | | |
49,955 | | Total Tax Obligation/Limited | | | 25,747,830 |
| | | Transportation – 3.5% (2.4% of Total Investments) | | | |
3,050 | | Dayton, Ohio, Airport Revenue Bonds, James M. Cox International Airport, Series 2003C, 5.250%, | 12/13 at 100.00 | A– | 2,966,857 |
| | | 12/01/23 – RAAI Insured (Alternative Minimum Tax) | | | |
2,000 | | Ohio Turnpike Commission, Revenue Refunding Bonds, Series 1998A, 5.500%, 2/15/18 – FGIC Insured | No Opt. Call | AA | 2,326,440 |
5,050 | | Total Transportation | | | 5,293,297 |
| | | U.S. Guaranteed – 22.4% (15.3% of Total Investments) (4) | | | |
2,030 | | Butler County, Ohio, General Obligation Judgment Bonds, Series 2002, 5.250%, 12/01/21 | 12/12 at 101.00 | Aa1 (4) | 2,215,339 |
| | | (Pre-refunded 12/01/12) | | | |
2,600 | | Cincinnati City School District, Hamilton County, Ohio, General Obligation Bonds, Series 2002, | 12/12 at 100.00 | AA+ (4) | 2,811,640 |
| | | 5.250%, 6/01/21 (Pre-refunded 12/01/12) – AGM Insured | | | |
1,000 | | Dayton, Ohio, Airport Revenue Bonds, James M. Cox International Airport, Series 2005B, 5.000%, | No Opt. Call | A– (4) | 1,146,410 |
| | | 12/01/14 – SYNCORA GTY Insured (ETM) | | | |
2,000 | | Garfield Heights City School District, Cuyahoga County, Ohio, General Obligation School | 12/11 at 100.00 | N/R (4) | 2,074,280 |
| | | Improvement Bonds, Series 2001, 5.000%, 12/15/26 (Pre-refunded 12/15/11) – NPFG Insured | | | |
46 Nuveen Investments
| | | | | | |
Principal | | | Optional Call | | |
Amount (000) | | Description (1) | Provisions (2) | Ratings (3) | Value |
| | | U.S. Guaranteed (4) (continued) | | | |
$ 2,000 | | Lakota Local School District, Butler County, Ohio, Unlimited Tax General Obligation School | 6/11 at 100.00 | Aaa | $ 2,024,880 |
| | | Improvement and Refunding Bonds, Series 2001, 5.125%, 12/01/26 (Pre-refunded 6/01/11) – | | | |
| | | FGIC Insured | | | |
2,000 | | Louisville City School District, Ohio, General Obligation Bonds, Series 2001, 5.000%, 12/01/29 | 12/11 at 100.00 | A1 (4) | 2,070,700 |
| | | (Pre-refunded 12/01/11) – FGIC Insured | | | |
760 | | Middletown City School District, Butler County, Ohio, General Obligation Bonds, Series 2004, | 12/13 at 100.00 | N/R (4) | 842,095 |
| | | 5.000%, 12/01/25 (Pre-refunded 12/01/13) – FGIC Insured | | | |
460 | | New Albany Plain Local School District, Franklin County, Ohio, General Obligation Bonds, | 6/12 at 100.00 | Aa1 (4) | 488,920 |
| | | Series 2002, 5.500%, 12/01/17 (Pre-refunded 6/01/12) – FGIC Insured | | | |
2,645 | | Ohio State Building Authority, State Facilities Bonds, Adult Correctional Building Fund | 4/14 at 100.00 | AA (4) | 2,986,364 |
| | | Project, Series 2004A, 5.250%, 4/01/15 (Pre-refunded 4/01/14) – NPFG Insured | | | |
1,200 | | Ohio State University, General Receipts Bonds, Series 2002A, 5.125%, 12/01/31 | 12/12 at 100.00 | Aa1 (4) | 1,295,064 |
| | | (Pre-refunded 12/01/12) | | | |
2,450 | | Ohio State University, General Receipts Bonds, Series 2003B, 5.250%, 6/01/22 | 6/13 at 100.00 | N/R (4) | 2,683,926 |
| | | (Pre-refunded 6/01/13) | | | |
525 | | Ohio Water Development Authority, Revenue Bonds, Drinking Water Assistance Fund, State Match, | 6/18 at 100.00 | AAA | 609,908 |
| | | Series 2008, 5.000%, 6/01/28 (Pre-refunded 6/01/18) – AGM Insured | | | |
1,225 | | Ohio Water Development Authority, Water Pollution Control Loan Fund Revenue Bonds, Water | 6/15 at 100.00 | AAA | 1,407,207 |
| | | Quality Project, Series 2005B, 5.000%, 6/01/25 (Pre-refunded 6/01/15) | | | |
| | | Olentangy Local School District, Delaware and Franklin Counties, Ohio, General Obligation | | | |
| | | Bonds, Series 2004A: | | | |
1,315 | | 5.250%, 12/01/23 (Pre-refunded 6/01/14) – FGIC Insured | 6/14 at 100.00 | AA+ (4) | 1,491,302 |
3,380 | | 5.250%, 12/01/24 (Pre-refunded 6/01/14) – FGIC Insured | 6/14 at 100.00 | AA+ (4) | 3,833,157 |
1,000 | | Princeton City School District, Butler County, Ohio, General Obligation Bonds, Series 2003, | 12/13 at 100.00 | AAA | 1,116,150 |
| | | 5.000%, 12/01/30 (Pre-refunded 12/01/13) – NPFG Insured | | | |
2,830 | | Springfield Township, Hamilton County, Ohio, Various Purpose Limited Tax General Obligation | 12/11 at 100.00 | Aa2 (4) | 2,935,389 |
| | | Bonds, Series 2002, 5.250%, 12/01/27 (Pre-refunded 12/01/11) | | | |
1,705 | | Tuscarawas County, Ohio, Hospital Facilities Revenue Bonds, Union Hospital Project, Series | 10/11 at 101.00 | N/R (4) | 1,771,205 |
| | | 2001, 5.750%, 10/01/21 (Pre-refunded 10/01/11) – RAAI Insured | | | |
31,125 | | Total U.S. Guaranteed | | | 33,803,936 |
| | | Utilities – 7.4% (5.0% of Total Investments) | | | |
2,500 | | American Municipal Power Ohio Inc., General Revenue Bonds, Prairie State Energy Campus Project | 2/18 at 100.00 | A1 | 2,399,100 |
| | | Series 2008A, 5.250%, 2/15/43 | | | |
4,000 | | American Municipal Power Ohio Inc., Wadsworth, Electric System Improvement Revenue Bonds, | 2/12 at 100.00 | A2 | 4,037,880 |
| | | Series 2002, 5.000%, 2/15/22 – NPFG Insured | | | |
| | | Cleveland, Ohio, Public Power System Revenue Bonds, Series 2008B: | | | |
2,105 | | 0.000%, 11/15/32 – NPFG Insured | No Opt. Call | A– | 575,065 |
2,155 | | 0.000%, 11/15/34 – NPFG Insured | No Opt. Call | A– | 515,002 |
1,250 | | Ohio Air Quality Development Authority, Revenue Refunding Bonds, Ohio Power Company Project, | 5/11 at 100.00 | Baa1 | 1,212,150 |
| | | Series 1999C, 5.150%, 5/01/26 – AMBAC Insured | | | |
950 | | Ohio Municipal Electric Generation Agency, Beneficial Interest Certificates, Belleville | No Opt. Call | A1 | 333,678 |
| | | Hydroelectric Project – Joint Venture 5, Series 2001, 0.000%, 2/15/29 – NPFG Insured | | | |
2,000 | | Ohio Municipal Electric Generation Agency, Beneficial Interest Certificates, Belleville | 2/14 at 100.00 | A1 | 2,083,620 |
| | | Hydroelectric Project – Joint Venture 5, Series 2004, 5.000%, 2/15/20 – AMBAC Insured | | | |
14,960 | | Total Utilities | | | 11,156,495 |
| | | Water and Sewer – 2.2% (1.5% of Total Investments) | | | |
430 | | City of Marysville, Ohio, Water System Mortgage Revenue Bonds, Series 2007, 5.000%, 12/01/32 – | 12/17 at 100.00 | A1 | 415,578 |
| | | AMBAC Insured | | | |
1,000 | | Cleveland, Ohio, Waterworks First Mortgage Revenue Refunding and Improvement Bonds, Series | No Opt. Call | Aa1 | 1,143,750 |
| | | 1993G, 5.500%, 1/01/21 – NPFG Insured | | | |
40 | | Cleveland, Ohio, Waterworks First Mortgage Revenue Refunding and Improvement Bonds, Series | 7/11 at 100.00 | Aa1 | 40,110 |
| | | 1996H, 5.750%, 1/01/26 – NPFG Insured | | | |
Nuveen Investments 47
| | |
| | Nuveen Ohio Quality Income Municipal Fund, Inc. (continued) |
NUO | Portfolio of Investments February 28, 2011 |
| | | | | | |
Principal | | | Optional Call | | |
Amount (000) | | Description (1) | Provisions (2) | Ratings (3) | Value |
| | | Water and Sewer (continued) | | | |
$ 1,220 | | Hamilton, Ohio, Wastewater System Revenue Bonds, Series 2005, 5.250%, 10/01/22 – AGM Insured | 10/15 at 100.00 | Aa3 | $ 1,293,273 |
200 | | Marysville, Ohio, Wastewater Treatment System Revenue Bonds, Series 2007, 5.000%, 12/01/37 – | 12/17 at 100.00 | A– | 183,442 |
| | | SYNCORA GTY Insured | | | |
275 | | Ohio Water Development Authority, Water Pollution Control Loan Fund Revenue Bonds, Water | 6/15 at 100.00 | AAA | 289,971 |
| | | Quality Project, Series 2005B, 5.000%, 6/01/25 | | | |
3,165 | | Total Water and Sewer | | | 3,366,124 |
$ 252,430 | | Total Investments (cost $217,987,700) – 146.6% | | | 220,762,745 |
| | | Other Assets Less Liabilities – 1.9% | | | 2,791,777 |
| | | Auction Rate Preferred Shares, at Liquidation Value – (48.5)% (5) | | | (73,000,000) |
| | | Net Assets Applicable to Common Shares – 100% | | | $ 150,554,522 |
| | | |
(1) | | All percentages shown in the Portfolio of Investments are based on net assets applicable to Common shares unless otherwise noted. |
(2) | | Optional Call Provisions (not covered by the report of independent registered public accounting firm): Dates (month and year) and prices of the earliest |
| | | optional call or redemption. There may be other call provisions at varying prices at later dates. Certain mortgage-backed securities may be subject to |
| | | periodic principal paydowns. |
(3) | | Ratings (not covered by the report of independent registered public accounting firm): Using the highest of Standard & Poor’s Group (“Standard & Poor’s”), |
| | | Moody’s Investor Service, Inc. (“Moody’s”) or Fitch, Inc. (“Fitch”) rating. Ratings below BBB by Standard & Poor’s, Baa by Moody’s or BBB by Fitch are |
| | | considered to be below investment grade. Holdings designated N/R are not rated by any of these national rating agencies. |
(4) | | Backed by an escrow or trust containing sufficient U.S. Government or U.S. Government agency securities, which ensure the timely payment of principal |
| | | and interest. Such investments are normally considered to be equivalent to AAA rated securities. |
(5) | | Auction Rate Preferred Shares, at Liquidation Value as a percentage of Total Investments is 33.1%. |
N/R | | Not rated. |
(ETM) | | Escrowed to maturity. |
(IF) | | Inverse floating rate investment. |
See accompanying notes to financial statements.
| | | | | | |
| | | Nuveen Ohio Dividend Advantage Municipal Fund | | |
NXI | | Portfolio of Investments | | |
| | | | February 28, 2011 | |
| | | | | | |
Principal | | | Optional Call | | |
Amount (000) | | Description (1) | Provisions (2) | Ratings (3) | Value |
| | | Consumer Staples – 5.5% (3.7% of Total Investments) | | | |
| | | Buckeye Tobacco Settlement Financing Authority, Ohio, Tobacco Settlement Asset-Backed Revenue | | | |
| | | Bonds, Senior Lien, Series 2007A-2: | | | |
$ 2,050 | | 5.875%, 6/01/30 | 6/17 at 100.00 | Baa3 | $ 1,479,629 |
2,755 | | 5.875%, 6/01/47 | 6/17 at 100.00 | Baa3 | 1,835,216 |
45 | | Puerto Rico, The Children’s Trust Fund, Tobacco Settlement Asset-Backed Refunding Bonds, | 5/12 at 100.00 | BBB | 41,004 |
| | | Series 2002, 5.375%, 5/15/33 | | | |
4,850 | | Total Consumer Staples | | | 3,355,849 |
| | | Education and Civic Organizations – 12.7% (8.5% of Total Investments) | | | |
700 | | Ohio Higher Education Facilities Commission, General Revenue Bonds, Kenyon College, Series | 7/16 at 100.00 | A+ | 654,444 |
| | | 2006, 5.000%, 7/01/41 | | | |
2,650 | | Ohio Higher Education Facilities Commission, Revenue Bonds, Ohio Northern University, Series | 5/12 at 100.00 | A3 | 2,667,463 |
| | | 2002, 5.000%, 5/01/22 | | | |
500 | | Ohio Higher Education Facilities Commission, Revenue Bonds, Wittenberg University, Series | 12/15 at 100.00 | Baa2 | 455,360 |
| | | 2005, 5.000%, 12/01/24 | | | |
1,000 | | Ohio State Higher Educational Facility Commission, Higher Education Facility Revenue Bonds, | 11/18 at 100.00 | A– | 1,051,790 |
| | | Xavier University 2008C, 5.750%, 5/01/28 | | | |
950 | | Ohio State, Higher Educational Facility Revenue Bonds, Otterbein College Project, Series | 12/18 at 100.00 | A3 | 982,319 |
| | | 2008A, 5.500%, 12/01/28 | | | |
1,760 | | Ohio University at Athens, Subordinate Lien General Receipts Bonds, Series 2004, 5.000%, | 6/14 at 100.00 | Aa3 | 1,871,461 |
| | | 12/01/20 – NPFG Insured | | | |
7,560 | | Total Education and Civic Organizations | | | 7,682,837 |
| | | Energy – 1.6% (1.1% of Total Investments) | | | |
1,000 | | Virgin Islands Public Finance Authority, Refinery Facilities Revenue Bonds, Hovensa Coker | 1/13 at 100.00 | Baa3 | 977,860 |
| | | Project, Senior Lien Series 2002, 6.500%, 7/01/21 (Alternative Minimum Tax) | | | |
| | | Health Care – 24.6% (16.5% of Total Investments) | | | |
65 | | Akron, Bath and Copley Joint Township Hospital District, Ohio, Hospital Facilities Revenue | 11/14 at 100.00 | Baa1 | 58,341 |
| | | Bonds, Summa Health System, Series 2004A, 5.500%, 11/15/34 – RAAI Insured | | | |
1,000 | | Butler County, Ohio, Hospital Facilities Revenue Bonds, UC Health, Series 2010, | 11/20 at 100.00 | BBB+ | 842,770 |
| | | 5.500%, 11/01/40 | | | |
1,385 | | Butler County, Ohio, Hospital Facilities Revenue Bonds, Cincinnati Children’s Medical Center | 5/16 at 100.00 | N/R | 1,285,086 |
| | | Project, Series 2006K, 5.000%, 5/15/31 – FGIC Insured | | | |
1,100 | | Cuyahoga County, Ohio, Revenue Refunding Bonds, Cleveland Clinic Health System, Series 2003A, | 7/13 at 100.00 | Aa2 | 1,108,448 |
| | | 6.000%, 1/01/32 | | | |
300 | | Franklin County, Ohio, Hospital Revenue Bonds, Nationwide Children’s Hospital Project, | 11/19 at 100.00 | Aa2 | 284,451 |
| | | Improvement Series 2009, 5.250%, 11/01/40 | | | |
600 | | Franklin County, Ohio, Hospital Revenue Bonds, Nationwide Children’s Hospital Project, Series | 11/18 at 100.00 | Aa2 | 547,344 |
| | | 2005, 5.000%, 11/01/40 | | | |
500 | | Lorain County, Ohio, Hospital Revenue Refunding and Improvement Bonds, Catholic Healthcare | 10/12 at 100.00 | AA– | 484,955 |
| | | Partners, Refunding Series 2002, 5.375%, 10/01/30 | | | |
| | | Lucas County, Ohio, Hospital Revenue Bonds, ProMedica Healthcare Obligated Group, Series 1999: | | | |
2,200 | | 5.375%, 11/15/29 – AMBAC Insured | 5/11 at 100.50 | AA– | 2,115,740 |
660 | | 5.375%, 11/15/39 – AMBAC Insured | 11/11 at 100.00 | AA– | 617,450 |
290 | | Lucas County, Ohio, Hospital Revenue Bonds, ProMedica Healthcare Obligated Group, Series | 11/21 at 100.00 | AA– | 291,789 |
| | | 2011A, 6.000%, 11/15/41 | | | |
330 | | Miami County, Ohio, Hospital Facilities Revenue Refunding Bonds, Upper Valley Medical Center | 5/16 at 100.00 | A– | 335,841 |
| | | Inc., Series 2006, 5.250%, 5/15/21 | | | |
Nuveen Investments 49
| | | | | | |
Nuveen Ohio Dividend Advantage Municipal Fund (continued) | | | |
NXI Portfolio of Investments February 28, 2011 | | | |
| | | | | | |
Principal | | | Optional Call | | |
Amount (000) | | Description (1) | Provisions (2) | Ratings (3) | Value |
| | | Health Care (continued) | | | |
$ 1,000 | | Montgomery County, Ohio, Revenue Bonds, Catholic Health Initiatives, Series 2004A, | 5/14 at 100.00 | AA | $ 973,470 |
| | | 5.000%, 5/01/30 | | | |
375 | | Montgomery County, Ohio, Revenue Bonds, Miami Valley Hospital, Series 2009A, 6.250%, 11/15/39 | 11/14 at 100.00 | Aa3 | 385,305 |
| | | Ohio State Higher Educational Facilities Commission, Hospital Revenue Bonds, Cleveland Clinic | | | |
| | | Health System Obligated Group, Series 2008A: | | | |
1,050 | | 5.000%, 1/01/25 | 1/18 at 100.00 | Aa2 | 1,065,729 |
90 | | 5.250%, 1/01/33 | 1/18 at 100.00 | Aa2 | 87,487 |
| | | Ohio State Higher Educational Facilities Commission, Hospital Revenue Bonds, Summa Health | | | |
| | | System Project, Series 2010: | | | |
1,100 | | 5.750%, 11/15/40 – AGM Insured | 5/20 at 100.00 | AA+ | 1,046,782 |
80 | | 5.250%, 11/15/40 – AGM Insured | 5/20 at 100.00 | AA+ | 74,413 |
250 | | Ohio State Higher Educational Facilities Commission, Hospital Revenue Bonds, University | 1/15 at 100.00 | A | 257,080 |
| | | Hospitals Health System, Series 2009, 6.750%, 1/15/39 | | | |
200 | | Ohio State, Hospital Facility Revenue Refunding Bonds, Cleveland Clinic Health System | 1/19 at 100.00 | Aa2 | 200,488 |
| | | Obligated Group, Series 2009A, 5.500%, 1/01/39 | | | |
| | | Ohio State, Hospital Facility Revenue Refunding Bonds, Cleveland Clinic Health System | | | |
| | | Obligated Group, Tender Option Bond Trust 3551: | | | |
250 | | 19.708%, 1/01/17 (IF) | No Opt. Call | Aa2 | 239,540 |
1,350 | | 64.415%, 1/01/33 (IF) | 1/19 at 100.00 | Aa2 | 1,363,176 |
65 | | Ohio State, Hospital Facility Revenue Refunding Bonds, Cleveland Clinic Health System | 1/19 at 100.00 | Aa2 | 65,634 |
| | | Obligated Group, Tender Option Bond Trust 3591, 64.573%, 1/01/17 (IF) | | | |
335 | | Richland County, Ohio, Hospital Facilities Revenue Improvement Bonds, MedCentral Health System | 11/12 at 100.00 | A– | 338,280 |
| | | Obligated Group, Series 2000B, 6.375%, 11/15/30 | | | |
500 | | Richland County, Ohio, Hospital Revenue Bonds, MidCentral Health System Group, Series 2006, | 11/16 at 100.00 | A– | 451,725 |
| | | 5.250%, 11/15/36 | | | |
375 | | Ross County, Ohio, Hospital Revenue Refunding Bonds, Adena Health System Series 2008, | 12/18 at 100.00 | A | 370,088 |
| | | 5.750%, 12/01/35 | | | |
15,450 | | Total Health Care | | | 14,891,412 |
| | | Housing/Multifamily – 7.2% (4.8% of Total Investments) | | | |
350 | | Montgomery County, Ohio, GNMA Guaranteed Multifamily Housing Revenue Bonds, Canterbury Court | 10/18 at 101.00 | Aa1 | 344,810 |
| | | Project, Series 2007, 5.500%, 10/20/42 (Alternative Minimum Tax) | | | |
2,885 | | Ohio Housing Finance Agency, FHA-Insured Mortgage Revenue Bonds, Asbury Woods Project, Series | 4/11 at 102.00 | Aa2 | 2,907,153 |
| | | 2001A, 5.450%, 4/01/26 | | | |
300 | | Ohio Housing Finance Agency, FHA-Insured Multifamily Housing Mortgage Revenue Bonds, Madonna | 6/16 at 102.00 | AAA | 268,278 |
| | | Homes, Series 2006M, 4.900%, 6/20/48 (Alternative Minimum Tax) | | | |
915 | | Summit County Port Authority, Ohio, Multifamily Housing Revenue Bonds, Callis Tower Apartments | 9/17 at 102.00 | AAA | 821,057 |
| | | Project, Series 2007, 5.250%, 9/20/47 (Alternative Minimum Tax) | | | |
4,450 | | Total Housing/Multifamily | | | 4,341,298 |
| | | Housing/Single Family – 0.5% (0.3% of Total Investments) | | | |
305 | | Ohio Housing Finance Agency, Single Family Mortgage Revenue Bonds, Series 2006H, 5.000%, | 9/15 at 100.00 | Aaa | 288,176 |
| | | 9/01/31 (Alternative Minimum Tax) | | | |
| | | Industrials – 6.9% (4.6% of Total Investments) | | | |
1,500 | | Cleveland-Cuyahoga County Port Authority, Ohio, Common Bond Fund Revenue Bonds, Cleveland | 5/12 at 102.00 | BBB– | 1,403,130 |
| | | Christian Home Project, Series 2002C, 5.950%, 5/15/22 | | | |
320 | | Cleveland-Cuyahoga County Port Authority, Ohio, Development Revenue Bonds, Bond Fund | 11/15 at 100.00 | BBB– | 279,213 |
| | | Program – Columbia National Group Project, Series 2005D, 5.000%, 5/15/20 (Alternative | | | |
| | | Minimum Tax) | | | |
880 | | Ohio State Water Development Authority, Solid Waste Revenue Bonds, Allied Waste Industries, | 7/12 at 100.00 | BBB | 900,830 |
| | | Inc., Series 2007A, 5.150%, 7/15/15 (Alternative Minimum Tax) | | | |
1,300 | | Toledo-Lucas County Port Authority, Ohio, Revenue Refunding Bonds, CSX Transportation Inc., | No Opt. Call | Baa3 | 1,464,944 |
| | | Series 1992, 6.450%, 12/15/21 | | | |
700 | | Western Reserve Port Authority, Ohio, Solid Waste Facility Revenue Bonds, Central Waste Inc., | 7/17 at 102.00 | N/R | 127,750 |
| | | Series 2007A, 6.350%, 7/01/27 (Alternative Minimum Tax) (4), (5) | | | |
4,700 | | Total Industrials | | | 4,175,867 |
50 Nuveen Investments
| | | | | | |
Principal | | | Optional Call | | |
Amount (000) | | Description (1) | Provisions (2) | Ratings (3) | Value |
| | | Long-Term Care – 1.1% (0.7% of Total Investments) | | | |
$ 215 | | Franklin County, Ohio, Healthcare Facilities Revenue Bonds, Ohio Presbyterian Retirement | 7/21 at 100.00 | BBB | $ 207,282 |
| | | Services, Improvement Series 2010A, 5.625%, 7/01/26 | | | |
470 | | Montgomery County, Ohio, Health Care and Multifamily Housing Revenue Bonds, Saint Leonard, | 4/20 at 100.00 | BBB– | 436,682 |
| | | Refunding & improvement Series 2010, 6.625%, 4/01/40 | | | |
685 | | Total Long-Term Care | | | 643,964 |
| | | Tax Obligation/General – 24.3% (16.3% of Total Investments) | | | |
125 | | Barberton City School District, Summit County, Ohio, General Obligation Bonds, School | 6/18 at 100.00 | AA | 127,980 |
| | | Improvement Series 2008, 5.250%, 12/01/31 | | | |
1,500 | | Centerville City School District, Montgomery County, Ohio, General Obligation Bonds, Series | 6/15 at 100.00 | Aa1 | 1,523,730 |
| | | 2005, 5.000%, 12/01/30 – AGM Insured | | | |
| | | Columbus City School District, Franklin County, Ohio, General Obligation Bonds, Series 2006: | | | |
400 | | 0.000%, 12/01/27 – AGM Insured | No Opt. Call | AAA | 167,564 |
1,735 | | 0.000%, 12/01/28 – AGM Insured | No Opt. Call | AAA | 676,338 |
400 | | Cuyahoga County, Ohio, General Obligation Bonds, Series 2004, 5.000%, 12/01/21 | 12/14 at 100.00 | AA+ | 428,244 |
1,355 | | Franklin County, Ohio, General Obligation Bonds, Series 2007, 5.000%, 12/01/27 | 12/17 at 100.00 | AAA | 1,435,704 |
470 | | Green, Ohio, General Obligation Bonds, Series 2008, 5.500%, 12/01/32 | 12/15 at 100.00 | AA | 481,101 |
2,550 | | Hamilton City School District, Ohio, General Obligation Bonds, Series 2007, 5.000%, 12/01/34 – | 6/17 at 100.00 | AA+ | 2,492,599 |
| | | AGM Insured | | | |
2,000 | | Indian Lake Local School District, Logan and Auglaize Counties, Ohio, School Facilities | 6/17 at 100.00 | Aa3 | 1,950,960 |
| | | Improvement and Refunding Bonds, Series 2007, 5.000%, 12/01/34 – NPFG Insured | | | |
430 | | Lakewood City School District, Cuyahoga County, Ohio, General Obligation Bonds, Series 2007, | 12/17 at 100.00 | Aa2 | 434,266 |
| | | 5.000%, 12/01/30 – FGIC Insured | | | |
400 | | Lucas County, Ohio, General Obligation Bonds, Various Purpose Series 2010, 5.000%, 10/01/40 | 10/18 at 100.00 | Aa2 | 393,004 |
1,005 | | Marysville Exempted School District, Union County, Ohio, General Obligation Bonds, Series | 12/15 at 100.00 | AA+ | 1,031,693 |
| | | 2006, 5.000%, 12/01/25 – AGM Insured | | | |
200 | | Mason City School District, Counties of Warren and Butler, Ohio, General Obligation Bonds, | 6/17 at 100.00 | Aaa | 204,786 |
| | | Series 2007, 5.000%, 12/01/31 | | | |
50 | | Milford Exempted Village School District, Ohio, General Obligation Bonds, Series 2008, | 12/18 at 100.00 | Aa3 | 48,722 |
| | | 5.250%, 12/01/36 | | | |
750 | | Northmor Local School District, Morrow County, Ohio, General Obligation School Facilities | 11/18 at 100.00 | Aa2 | 734,543 |
| | | Construction and Improvement Bonds, Series 2008, 5.000%, 11/01/36 | | | |
50 | | Sylvania City School District, Ohio, General Obligation School Improvement Bonds, Series 1995, | 6/17 at 100.00 | AA+ | 50,274 |
| | | 5.250%, 12/01/36 – AGC Insured | | | |
2,415 | | Troy City School District, Miami County, Ohio, General Obligation Bonds, Series 2005, 5.000%, | 12/14 at 100.00 | Aa2 | 2,470,834 |
| | | 12/01/28 – AGM Insured | | | |
50 | | Vandalia Butler City School District, Montgomery County, Ohio, General Obligation Bonds, | No Opt. Call | AA | 49,852 |
| | | School Improvment Series 2009, 5.125%, 12/01/37 | | | |
15,885 | | Total Tax Obligation/General | | | 14,702,194 |
| | | Tax Obligation/Limited – 23.4% (15.7% of Total Investments) | | | |
125 | | Cincinnati City School District, Ohio, Certificates of Participation, Series 2006, 5.000%, | 12/16 at 100.00 | AA+ | 125,396 |
| | | 12/15/32 – AGM Insured | | | |
1,165 | | Cleveland-Cuyahoga County Port Authority, Ohio, Lease Revenue Bonds, Euclid Avenue Housing | 8/15 at 100.00 | N/R | 1,019,328 |
| | | Corporation – Fenn Tower Project, Series 2005, 5.000%, 8/01/23 – AMBAC Insured | | | |
2,000 | | Cuyhoga County, Ohio, Economic Development Revenue Bonds, Federally Taxable Recovery Zone | 12/20 at 100.00 | AA | 2,040,100 |
| | | Facility Medical Mart- Convention Center Project, Series 2010G, 5.000%, 12/01/27 | | | |
50 | | Delaware County District Library, Delaware, Franklin, Marion, Morrow and Union Counties, Ohio, | 12/19 at 100.00 | Aa2 | 49,042 |
| | | Library Fund Library Facilities Special Obligation Notes, Series 2009, 5.000%, 12/01/34 | | | |
2,000 | | Franklin County Convention Facilities Authority, Ohio, Excise Tax and Lease Revenue | 12/15 at 100.00 | Aaa | 2,050,440 |
| | | Anticipation Bonds, Series 2005, 5.000%, 12/01/27 – AMBAC Insured | | | |
Nuveen Investments 51
| | | | | | |
Nuveen Ohio Dividend Advantage Municipal Fund (continued) | | | |
NXI Portfolio of Investments February 28, 2011 | | | |
| | | | | | |
Principal | | | Optional Call | | |
Amount (000) | | Description (1) | Provisions (2) | Ratings (3) | Value |
| | | Tax Obligation/Limited (continued) | | | |
$ 1,415 | | Hamilton County Convention Facilities Authority, Ohio, First Lien Revenue Bonds, Series 2004, | 6/14 at 100.00 | A+ | $ 1,458,964 |
| | | 5.000%, 12/01/21 – FGIC Insured | | | |
2,000 | | Hamilton County, Ohio, Sales Tax Bonds, Subordinate Lien, Series 2006, 5.000%, 12/01/32 – | 12/16 at 100.00 | A1 | 1,927,900 |
| | | AMBAC Insured | | | |
500 | | New Albany Community Authority, Ohio, Community Facilities Revenue Refunding Bonds, Series | 4/12 at 100.00 | A1 | 511,885 |
| | | 2001B, 5.500%, 10/01/15 – AMBAC Insured | | | |
345 | | Ohio State Building Authority, State Facilities Bonds, Administrative Building Fund Projects, | 4/15 at 100.00 | AA+ | 355,236 |
| | | Series 2005A, 5.000%, 4/01/25 – AGM Insured | | | |
1,000 | | Ohio State Building Authority, State Facilities Bonds, Adult Correctional Building Fund | 4/15 at 100.00 | AA+ | 1,032,790 |
| | | Project, Series 2005A, 5.000%, 4/01/23 – AGM Insured | | | |
5,220 | | Puerto Rico Sales Tax Financing Corporation, Sales Tax Revenue Bonds, First Subordinate Series | No Opt. Call | A+ | 1,140,413 |
| | | 2009A, 0.000%, 8/01/34 | | | |
5,250 | | Puerto Rico Sales Tax Financing Corporation, Sales Tax Revenue Bonds, Series 2010A, | No Opt. Call | A+ | 1,062,233 |
| | | 0.000%, 8/01/35 | | | |
1,400 | | Virgin Islands Public Finance Authority, Gross Receipts Taxes Loan Note, Series 1999A, | 4/11 at 101.00 | BBB+ | 1,416,366 |
| | | 6.375%, 10/01/19 | | | |
22,470 | | Total Tax Obligation/Limited | | | 14,190,093 |
| | | Transportation – 0.7% (0.5% of Total Investments) | | | |
425 | | Dayton, Ohio, Airport Revenue Bonds, James M. Cox International Airport, Series 2003C, 5.250%, | 12/13 at 100.00 | A– | 413,415 |
| | | 12/01/23 – RAAI Insured (Alternative Minimum Tax) | | | |
| | | U.S. Guaranteed – 24.6% (16.5% of Total Investments) (6) | | | |
1,000 | | Columbus City School District, Franklin County, Ohio, General Obligation Bonds, Series 2004, | 12/14 at 100.00 | AA+ (6) | 1,157,580 |
| | | 5.500%, 12/01/15 (Pre-refunded 12/01/14) – AGM Insured | | | |
1,000 | | Lakewood City School District, Cuyahoga County, Ohio, General Obligation Bonds, Series 2004, | 12/14 at 100.00 | AA+ (6) | 1,155,600 |
| | | 5.250%, 12/01/16 (Pre-refunded 12/01/14) – AGM Insured | | | |
2,000 | | Lakota Local School District, Butler County, Ohio, Unlimited Tax General Obligation School | 6/11 at 100.00 | Aaa | 2,024,880 |
| | | Improvement and Refunding Bonds, Series 2001, 5.125%, 12/01/26 (Pre-refunded 6/01/11) – | | | |
| | | FGIC Insured | | | |
1,000 | | Middletown City School District, Butler County, Ohio, General Obligation Bonds, Series 2004, | 12/13 at 100.00 | N/R (6) | 1,108,020 |
| | | 5.000%, 12/01/25 (Pre-refunded 12/01/13) – FGIC Insured | | | |
2,000 | | Ohio Higher Educational Facilities Commission, Revenue Bonds, Denison University, Series 2001, | 11/11 at 101.00 | AA (6) | 2,084,460 |
| | | 5.200%, 11/01/26 (Pre-refunded 11/01/11) | | | |
325 | | Ohio Water Development Authority, Revenue Bonds, Drinking Water Assistance Fund, State Match, | 6/18 at 100.00 | AAA | 377,562 |
| | | Series 2008, 5.000%, 6/01/28 (Pre-refunded 6/01/18) – AGM Insured | | | |
1,900 | | Olentangy Local School District, Delaware and Franklin Counties, Ohio, General Obligation | 6/14 at 100.00 | AA+ (6) | 2,154,733 |
| | | Bonds, Series 2004A, 5.250%, 12/01/23 (Pre-refunded 6/01/14) – FGIC Insured | | | |
2,735 | | University of Cincinnati, Ohio, General Receipts Bonds, Series 2002F, 5.375%, 6/01/19 | 6/12 at 100.00 | A+ (6) | 2,902,655 |
| | | (Pre-refunded 6/01/12) | | | |
1,485 | | West Chester Township, Butler County, Ohio, Various Purpose Limited Tax General Obligation | 11/11 at 101.00 | Aaa | 1,551,617 |
| | | Refunding Bonds, Series 2001, 5.500%, 12/01/17 (Pre-refunded 11/01/11) – AMBAC Insured | | | |
400 | | Westerville City School District, Franklin and Delaware Counties, Ohio, Various Purpose | 6/11 at 100.00 | AA– (6) | 404,824 |
| | | General Obligation Bonds, Series 2001, 5.000%, 12/01/27 (Pre-refunded 6/01/11) – NPFG Insured | | | |
13,845 | | Total U.S. Guaranteed | | | 14,921,931 |
52 Nuveen Investments
| | | | | | |
Principal | | | Optional Call | | |
Amount (000) | | Description (1) | Provisions (2) | Ratings (3) | Value |
| | | Utilities – 10.2% (6.9% of Total Investments) | | | |
| | | American Municipal Power Ohio Inc., General Revenue Bonds, Prairie State Energy Campus Project | | | |
| | | Series 2008A: | | | |
$ 50 | | 5.000%, 2/15/38 – AGC Insured | 2/18 at 100.00 | AA+ | $ 48,207 |
1,000 | | 5.250%, 2/15/43 | 2/18 at 100.00 | A1 | 959,640 |
1,440 | | American Municipal Power Ohio Inc., Wadsworth, Electric System Improvement Revenue Bonds, | 2/12 at 100.00 | A2 | 1,473,437 |
| | | Series 2002, 5.250%, 2/15/17 – NPFG Insured | | | |
2,130 | | Cleveland, Ohio, Public Power System Revenue Bonds, Series 2008B-2, 0.000%, 11/15/32 – | No Opt. Call | A– | 581,895 |
| | | NPFG Insured | | | |
2,150 | | Ohio Air Quality Development Authority, Revenue Refunding Bonds, Ohio Power Company Project, | 5/11 at 100.00 | Baa1 | 2,084,898 |
| | | Series 1999C, 5.150%, 5/01/26 – AMBAC Insured | | | |
1,000 | | Ohio Municipal Electric Generation Agency, Beneficial Interest Certificates, Belleville | 2/14 at 100.00 | A1 | 1,036,190 |
| | | Hydroelectric Project – Joint Venture 5, Series 2004, 5.000%, 2/15/21 – AMBAC Insured | | | |
7,770 | | Total Utilities | | | 6,184,267 |
| | | Water and Sewer – 5.9% (3.9% of Total Investments) | | | |
175 | | City of Marysville, Ohio, Water System Mortgage Revenue Bonds, Series 2007, 5.000%, 12/01/32 – | 12/17 at 100.00 | A1 | 169,131 |
| | | AMBAC Insured | | | |
2,375 | | Ohio Water Development Authority, Revenue Bonds, Water Development Community Assistance | 12/13 at 100.00 | Aa1 | 2,449,076 |
| | | Program, Series 2003, 5.000%, 12/01/23 – NPFG Insured | | | |
1,000 | | Puerto Rico Aqueduct and Sewerage Authority, Revenue Bonds, Senior Lien Series 2008A, | 7/18 at 100.00 | Baa1 | 929,530 |
| | | 6.000%, 7/01/44 | | | |
3,550 | | Total Water and Sewer | | | 3,547,737 |
$ 102,945 | | Total Investments (cost $90,453,712) – 149.2% | | | 90,316,900 |
| | | MuniFund Term Preferred Shares, at Liquidation Value – (32.1)% (7) | | | (19,450,000) |
| | | Other Assets Less Liabilities – 3.5% | | | 2,183,062 |
| | | Auction Rate Preferred Shares, at Liquidation Value – (20.6)% (7) | | | (12,500,000) |
| | | Net Assets Applicable to Common Shares – 100% | | | $ 60,549,962 |
| | | |
(1) | | All percentages shown in the Portfolio of Investments are based on net assets applicable to Common shares unless otherwise noted. |
(2) | | Optional Call Provisions (not covered by the report of independent registered public accounting firm): Dates (month and year) and prices of the earliest |
| | | optional call or redemption. There may be other call provisions at varying prices at later dates. Certain mortgage-backed securities may be subject to |
| | | periodic principal paydowns. |
(3) | | Ratings (not covered by the report of independent registered public accounting firm): Using the highest of Standard & Poor’s Group (“Standard & Poor’s”), |
| | | Moody’s Investor Service, Inc. (“Moody’s”) or Fitch, Inc. (“Fitch”) rating. Ratings below BBB by Standard & Poor’s, Baa by Moody’s or BBB by Fitch are |
| | | considered to be below investment grade. Holdings designated N/R are not rated by any of these national rating agencies. |
(4) | | For fair value measurement disclosure purposes, investment categorized as Level 3. See Notes to Financial Statements, Footnote 1 – General Information |
| | | and Significant Accounting Policies, Investment Valuation for more information. |
(5) | | The Fund’s Adviser has concluded this issue is not likely to meet its future interest payment obligations and has directed the Fund’s custodian to cease |
| | | accruing additional income on the Fund’s records. |
(6) | | Backed by an escrow or trust containing sufficient U.S. Government or U.S. Government agency securities, which ensure the timely payment of principal |
| | | and interest. Such investments are normally considered to be equivalent to AAA rated securities. |
(7) | | MuniFund Term Preferred Shares and Auction Rate Preferred Shares, at Liquidation Value as a percentage of Total Investments are 21.5% and 13.8%, |
| | | respectively. |
N/R | | Not rated. |
(IF) | | Inverse floating rate investment. |
See accompanying notes to financial statements.
Nuveen Investments 53
| | | | | | |
| | | Nuveen Ohio Dividend Advantage Municipal Fund 2 | | |
NBJ | | Portfolio of Investments | | |
| | | | February 28, 2011 | |
| | | | | | |
Principal | | | Optional Call | | |
Amount (000) | | Description (1) | Provisions (2) | Ratings (3) | Value |
| | | Consumer Staples – 4.0% (2.7% of Total Investments) | | | |
| | | Buckeye Tobacco Settlement Financing Authority, Ohio, Tobacco Settlement Asset-Backed Revenue | | | |
| | | Bonds, Senior Lien, Series 2007A-2: | | | |
$ 990 | | 5.875%, 6/01/30 | 6/17 at 100.00 | Baa3 | $ 714,552 |
1,510 | | 5.875%, 6/01/47 | 6/17 at 100.00 | Baa3 | 1,005,871 |
45 | | Puerto Rico, The Children’s Trust Fund, Tobacco Settlement Asset-Backed Refunding Bonds, | 5/12 at 100.00 | BBB | 41,004 |
| | | Series 2002, 5.375%, 5/15/33 | | | |
2,545 | | Total Consumer Staples | | | 1,761,427 |
| | | Education and Civic Organizations – 11.9% (8.1% of Total Investments) | | | |
1,345 | | Bowling Green State University, Ohio, General Receipts Bonds, Series 2003, 5.250%, 6/01/18 – | 6/13 at 100.00 | A+ | 1,432,546 |
| | | AMBAC Insured | | | |
450 | | Ohio Higher Education Facilities Commission, General Revenue Bonds, Kenyon College, Series | 7/16 at 100.00 | A+ | 420,714 |
| | | 2006, 5.000%, 7/01/41 | | | |
1,050 | | Ohio Higher Educational Facilities Commission, Revenue Bonds, Wittenberg University, Series | 12/11 at 100.00 | Baa2 | 1,063,860 |
| | | 2001, 5.500%, 12/01/15 | | | |
1,000 | | University of Cincinnati, Ohio, General Receipts Bonds, Series 2003C, 5.000%, 6/01/22 – | 6/13 at 100.00 | A+ | 1,012,800 |
| | | FGIC Insured | | | |
1,245 | | University of Cincinnati, Ohio, General Receipts Bonds, Series 2004D, 5.000%, 6/01/19 – | 6/14 at 100.00 | A+ | 1,322,252 |
| | | AMBAC Insured | | | |
5,090 | | Total Education and Civic Organizations | | | 5,252,172 |
| | | Energy – 1.1% (0.8% of Total Investments) | | | |
500 | | Virgin Islands Public Finance Authority, Refinery Facilities Revenue Bonds, Hovensa Coker | 1/13 at 100.00 | Baa3 | 488,930 |
| | | Project, Senior Lien Series 2002, 6.500%, 7/01/21 (Alternative Minimum Tax) | | | |
| | | Health Care – 22.9% (15.6% of Total Investments) | | | |
750 | | Butler County, Ohio, Hospital Facilities Revenue Bonds, UC Health, Series 2010, | 11/20 at 100.00 | BBB+ | 632,078 |
| | | 5.500%, 11/01/40 | | | |
1,090 | | Butler County, Ohio, Hospital Facilities Revenue Bonds, Cincinnati Children’s Medical Center | 5/16 at 100.00 | N/R | 1,011,367 |
| | | Project, Series 2006K, 5.000%, 5/15/31 – FGIC Insured | | | |
300 | | Franklin County, Ohio, Hospital Revenue Bonds, Nationwide Children’s Hospital Project, | 11/19 at 100.00 | Aa2 | 284,451 |
| | | Improvement Series 2009, 5.250%, 11/01/40 | | | |
250 | | Franklin County, Ohio, Hospital Revenue Bonds, Nationwide Children’s Hospital Project, Series | 11/18 at 100.00 | Aa2 | 228,060 |
| | | 2005, 5.000%, 11/01/40 | | | |
200 | | Lorain County, Ohio, Hospital Revenue Refunding and Improvement Bonds, Catholic Healthcare | 10/12 at 100.00 | AA– | 193,982 |
| | | Partners, Refunding Series 2002, 5.375%, 10/01/30 | | | |
1,850 | | Lorain County, Ohio, Hospital Revenue Refunding and Improvement Bonds, Catholic Healthcare | 10/11 at 101.00 | AA– | 1,890,978 |
| | | Partners, Series 2001A, 5.400%, 10/01/21 | | | |
965 | | Lucas County, Ohio, Hospital Revenue Bonds, ProMedica Healthcare Obligated Group, Series 1999, | 5/11 at 100.50 | AA– | 928,041 |
| | | 5.375%, 11/15/29 – AMBAC Insured | | | |
460 | | Lucas County, Ohio, Hospital Revenue Bonds, ProMedica Healthcare Obligated Group, Series | 11/21 at 100.00 | AA– | 462,838 |
| | | 2011A, 6.000%, 11/15/41 | | | |
225 | | Miami County, Ohio, Hospital Facilities Revenue Refunding Bonds, Upper Valley Medical Center | 5/16 at 100.00 | A– | 228,983 |
| | | Inc., Series 2006, 5.250%, 5/15/21 | | | |
700 | | Montgomery County, Ohio, Revenue Bonds, Catholic Health Initiatives, Series 2004A, | 5/14 at 100.00 | AA | 681,429 |
| | | 5.000%, 5/01/30 | | | |
90 | | Montgomery County, Ohio, Revenue Bonds, Miami Valley Hospital, Series 2009A, 6.250%, 11/15/39 | 11/14 at 100.00 | Aa3 | 92,473 |
35 | | Ohio State Higher Educational Facilities Commission, Hospital Revenue Bonds, Cleveland Clinic | 1/18 at 100.00 | Aa2 | 35,524 |
| | | Health System Obligated Group, Series 2008A, 5.000%, 1/01/25 | | | |
54 Nuveen Investments
| | | | | | |
Principal | | | Optional Call | | |
Amount (000) | | Description (1) | Provisions (2) | Ratings (3) | Value |
| | | Health Care (continued) | | | |
| | | Ohio State Higher Educational Facilities Commission, Hospital Revenue Bonds, Summa Health | | | |
| | | System Project, Series 2010: | | | |
$ 400 | | 5.750%, 11/15/40 – AGM Insured | 5/20 at 100.00 | AA+ | $ 380,648 |
40 | | 5.250%, 11/15/40 – AGM Insured | 5/20 at 100.00 | AA+ | 37,206 |
100 | | Ohio State Higher Educational Facilities Commission, Hospital Revenue Bonds, University | 1/15 at 100.00 | A | 102,832 |
| | | Hospitals Health System, Series 2009, 6.750%, 1/15/39 | | | |
200 | | Ohio State, Hospital Facility Revenue Refunding Bonds, Cleveland Clinic Health System | 1/19 at 100.00 | Aa2 | 200,488 |
| | | Obligated Group, Series 2009A, 5.500%, 1/01/39 | | | |
| | | Ohio State, Hospital Facility Revenue Refunding Bonds, Cleveland Clinic Health System | | | |
| | | Obligated Group, Tender Option Bond Trust 3551: | | | |
125 | | 19.708%, 1/01/17 (IF) | No Opt. Call | Aa2 | 119,770 |
1,000 | | 64.415%, 1/01/33 (IF) | 1/19 at 100.00 | Aa2 | 1,009,760 |
375 | | Ohio State, Hospital Facility Revenue Refunding Bonds, Cleveland Clinic Health System | No Opt. Call | Aa2 | 378,660 |
| | | Obligated Group, Tender Option Bond Trust 3591, 64.573%, 1/01/17 (IF) | | | |
665 | | Richland County, Ohio, Hospital Facilities Revenue Improvement Bonds, MedCentral Health System | 11/12 at 100.00 | A– | 671,510 |
| | | Obligated Group, Series 2000B, 6.375%, 11/15/30 | | | |
350 | | Richland County, Ohio, Hospital Revenue Bonds, MidCentral Health System Group, Series 2006, | 11/16 at 100.00 | A– | 316,208 |
| | | 5.250%, 11/15/36 | | | |
190 | | Ross County, Ohio, Hospital Revenue Refunding Bonds, Adena Health System Series 2008, | 12/18 at 100.00 | A | 187,511 |
| | | 5.750%, 12/01/35 | | | |
10,360 | | Total Health Care | | | 10,074,797 |
| | | Housing/Multifamily – 4.8% (3.2% of Total Investments) | | | |
1,000 | | Franklin County, Ohio, GNMA Collateralized Multifamily Housing Mortgage Revenue Bonds, Agler | 5/12 at 102.00 | Aaa | 1,025,100 |
| | | Project, Series 2002A, 5.550%, 5/20/22 (Alternative Minimum Tax) | | | |
250 | | Montgomery County, Ohio, GNMA Guaranteed Multifamily Housing Revenue Bonds, Canterbury Court | 10/18 at 101.00 | Aa1 | 246,293 |
| | | Project, Series 2007, 5.500%, 10/20/42 (Alternative Minimum Tax) | | | |
225 | | Ohio Housing Finance Agency, FHA-Insured Multifamily Housing Mortgage Revenue Bonds, Madonna | 6/16 at 102.00 | AAA | 201,209 |
| | | Homes, Series 2006M, 4.900%, 6/20/48 (Alternative Minimum Tax) | | | |
690 | | Summit County Port Authority, Ohio, Multifamily Housing Revenue Bonds, Callis Tower Apartments | 9/17 at 102.00 | AAA | 619,158 |
| | | Project, Series 2007, 5.250%, 9/20/47 (Alternative Minimum Tax) | | | |
2,165 | | Total Housing/Multifamily | | | 2,091,760 |
| | | Housing/Single Family – 1.3% (0.9% of Total Investments) | | | |
610 | | Ohio Housing Finance Agency, Single Family Mortgage Revenue Bonds, Series 2006H, 5.000%, | 9/15 at 100.00 | Aaa | 576,352 |
| | | 9/01/31 (Alternative Minimum Tax) | | | |
| | | Industrials – 10.8% (7.3% of Total Investments) | | | |
3,000 | | Ohio State Sewage and Solid Waste Disposal Facilities, Revenue Bonds, Anheuser-Busch Project, | 11/11 at 100.00 | BBB+ | 2,852,250 |
| | | Series 2001, 5.500%, 11/01/35 (Alternative Minimum Tax) | | | |
640 | | Ohio State Water Development Authority, Solid Waste Revenue Bonds, Allied Waste Industries, | 7/12 at 100.00 | BBB | 655,149 |
| | | Inc., Series 2007A, 5.150%, 7/15/15 (Alternative Minimum Tax) | | | |
1,000 | | Toledo-Lucas County Port Authority, Ohio, Revenue Refunding Bonds, CSX Transportation Inc., | No Opt. Call | Baa3 | 1,126,880 |
| | | Series 1992, 6.450%, 12/15/21 | | | |
500 | | Western Reserve Port Authority, Ohio, Solid Waste Facility Revenue Bonds, Central Waste Inc., | 7/17 at 102.00 | N/R | 91,250 |
| | | Series 2007A, 6.350%, 7/01/27 (Alternative Minimum Tax) (4), (5) | | | |
5,140 | | Total Industrials | | | 4,725,529 |
Nuveen Investments 55
| | | | | | |
Nuveen Ohio Dividend Advantage Municipal Fund 2 (continued) | | | |
NBJ Portfolio of Investments February 28, 2011 | | | |
| | | | | | |
Principal | | | Optional Call | | |
Amount (000) | | Description (1) | Provisions (2) | Ratings (3) | Value |
| | | Long-Term Care – 0.9% (0.6% of Total Investments) | | | |
$ 95 | | Franklin County, Ohio, Healthcare Facilities Revenue Bonds, Ohio Presbyterian Retirement | 7/21 at 100.00 | BBB | $ 91,590 |
| | | Services, Improvement Series 2010A, 5.625%, 7/01/26 | | | |
340 | | Montgomery County, Ohio, Health Care and Multifamily Housing Revenue Bonds, Saint Leonard, | 4/20 at 100.00 | BBB– | 315,897 |
| | | Refunding & improvement Series 2010, 6.625%, 4/01/40 | | | |
435 | | Total Long-Term Care | | | 407,487 |
| | | Tax Obligation/General – 34.5% (23.5% of Total Investments) | | | |
1,700 | | Butler County, Hamilton, Ohio, Limited Tax General Obligation Bonds, One Renaissance Center | 11/11 at 101.00 | Aa3 | 1,703,944 |
| | | Acquisition, Series 2001, 5.000%, 11/01/26 – AMBAC Insured | | | |
| | | Cleveland Municipal School District, Cuyahoga County, Ohio, General Obligation Bonds, | | | |
| | | Series 2004: | | | |
1,000 | | 5.000%, 12/01/15 – AGM Insured | 6/14 at 100.00 | AA+ | 1,095,510 |
1,000 | | 5.000%, 12/01/22 – AGM Insured | 6/14 at 100.00 | AA+ | 1,036,890 |
| | | Columbus City School District, Franklin County, Ohio, General Obligation Bonds, Series 2006: | | | |
300 | | 0.000%, 12/01/27 – AGM Insured | No Opt. Call | AAA | 125,673 |
100 | | 0.000%, 12/01/28 – AGM Insured | No Opt. Call | AAA | 38,982 |
400 | | Cuyahoga County, Ohio, General Obligation Bonds, Series 2004, 5.000%, 12/01/21 | 12/14 at 100.00 | AA+ | 428,244 |
1,000 | | Franklin County, Ohio, General Obligation Bonds, Series 2007, 5.000%, 12/01/27 | 12/17 at 100.00 | AAA | 1,059,560 |
400 | | Green, Ohio, General Obligation Bonds, Series 2008, 5.500%, 12/01/32 | 12/15 at 100.00 | AA | 409,448 |
1,905 | | Hamilton City School District, Ohio, General Obligation Bonds, Series 2007, 5.000%, 12/01/34 – | 6/17 at 100.00 | AA+ | 1,862,118 |
| | | AGM Insured | | | |
1,000 | | Indian Lake Local School District, Logan and Auglaize Counties, Ohio, School Facilities | 6/17 at 100.00 | Aa3 | 975,480 |
| | | Improvement and Refunding Bonds, Series 2007, 5.000%, 12/01/34 – NPFG Insured | | | |
345 | | Lakewood City School District, Cuyahoga County, Ohio, General Obligation Bonds, Series 2007, | 12/17 at 100.00 | Aa2 | 348,422 |
| | | 5.000%, 12/01/30 – FGIC Insured | | | |
400 | | Lucas County, Ohio, General Obligation Bonds, Various Purpose Series 2010, 5.000%, 10/01/40 | 10/18 at 100.00 | Aa2 | 393,004 |
1,005 | | Marysville Exempted School District, Union County, Ohio, General Obligation Bonds, Series | 12/15 at 100.00 | AA+ | 1,031,693 |
| | | 2006, 5.000%, 12/01/25 – AGM Insured | | | |
200 | | Mason City School District, Counties of Warren and Butler, Ohio, General Obligation Bonds, | 6/17 at 100.00 | Aaa | 204,786 |
| | | Series 2007, 5.000%, 12/01/31 | | | |
50 | | Milford Exempted Village School District, Ohio, General Obligation Bonds, Series 2008, | 12/18 at 100.00 | Aa3 | 48,722 |
| | | 5.250%, 12/01/36 | | | |
2,665 | | Newark City School District, Licking County, Ohio, General Obligation Bonds, Series 2005, | 12/15 at 100.00 | A1 | 2,687,226 |
| | | 5.000%, 12/01/28 – FGIC Insured | | | |
400 | | Northmor Local School District, Morrow County, Ohio, General Obligation School Facilities | 11/18 at 100.00 | Aa2 | 391,756 |
| | | Construction and Improvement Bonds, Series 2008, 5.000%, 11/01/36 | | | |
1,000 | | Powell, Ohio, General Obligation Bonds, Series 2002, 5.500%, 12/01/25 – FGIC Insured | 12/12 at 100.00 | AA+ | 1,048,530 |
50 | | Sylvania City School District, Ohio, General Obligation School Improvement Bonds, Series 1995, | 6/17 at 100.00 | AA+ | 50,274 |
| | | 5.250%, 12/01/36 – AGC Insured | | | |
200 | | Vandalia Butler City School District, Montgomery County, Ohio, General Obligation Bonds, | No Opt. Call | AA | 199,406 |
| | | School Improvment Series 2009, 5.125%, 12/01/37 | | | |
15,120 | | Total Tax Obligation/General | | | 15,139,668 |
56 Nuveen Investments
| | | | | | |
Principal | | | Optional Call | | |
Amount (000) | | Description (1) | Provisions (2) | Ratings (3) | Value |
| | | Tax Obligation/Limited – 16.1% (11.0% of Total Investments) | | | |
$ 500 | | Cuyhoga County, Ohio, Economic Development Revenue Bonds, Federally Taxable Recovery Zone | 12/20 at 100.00 | AA | $ 510,025 |
| | | Facility Medical Mart- Convention Center Project, Series 2010G, 5.000%, 12/01/27 | | | |
175 | | Delaware County District Library, Delaware, Franklin, Marion, Morrow and Union Counties, Ohio, | 12/19 at 100.00 | Aa2 | 171,647 |
| | | Library Fund Library Facilities Special Obligation Notes, Series 2009, 5.000%, 12/01/34 | | | |
1,400 | | Hamilton County, Ohio, Sales Tax Bonds, Subordinate Lien, Series 2006, 5.000%, 12/01/32 – | 12/16 at 100.00 | A1 | 1,349,530 |
| | | AMBAC Insured | | | |
250 | | Ohio State Building Authority, State Facilities Bonds, Administrative Building Fund Projects, | 4/15 at 100.00 | AA+ | 257,418 |
| | | Series 2005A, 5.000%, 4/01/25 – AGM Insured | | | |
1,000 | | Ohio State Building Authority, State Facilities Bonds, Adult Correctional Building Fund | 4/15 at 100.00 | AA+ | 1,032,790 |
| | | Project, Series 2005A, 5.000%, 4/01/23 – AGM Insured | | | |
1,095 | | Ohio, State Appropriation Lease Bonds, Parks and Recreation Capital Facilities, Series | 12/13 at 100.00 | AA | 1,160,985 |
| | | 2004A-II, 5.000%, 12/01/18 | | | |
4,065 | | Puerto Rico Sales Tax Financing Corporation, Sales Tax Revenue Bonds, First Subordinate Series | No Opt. Call | A+ | 888,081 |
| | | 2009A, 0.000%, 8/01/34 | | | |
3,940 | | Puerto Rico Sales Tax Financing Corporation, Sales Tax Revenue Bonds, Series 2010A, | No Opt. Call | A+ | 797,180 |
| | | 0.000%, 8/01/35 | | | |
1,000 | | Summit County Port Authority, Ohio, Revenue Bonds, Civic Theatre Project, Series 2001, 5.500%, | 12/11 at 100.00 | N/R | 903,100 |
| | | 12/01/26 – AMBAC Insured | | | |
13,425 | | Total Tax Obligation/Limited | | | 7,070,756 |
| | | U.S. Guaranteed – 28.4% (19.3% of Total Investments) (6) | | | |
605 | | Columbus City School District, Franklin County, Ohio, General Obligation Bonds, Series 2004, | 12/14 at 100.00 | AA+ (6) | 700,336 |
| | | 5.500%, 12/01/15 (Pre-refunded 12/01/14) – AGM Insured | | | |
1,000 | | Greater Cleveland Regional Transit Authority, Ohio, General Obligation Capital Improvement | 12/11 at 100.00 | Aa2 (6) | 1,036,300 |
| | | Bonds, Series 2001A, 5.125%, 12/01/21 (Pre-refunded 12/01/11) – NPFG Insured | | | |
1,500 | | Lebanon City School District, Warren County, Ohio, General Obligation Bonds, Series 2001, | 12/11 at 100.00 | AA+ (6) | 1,558,695 |
| | | 5.500%, 12/01/21 (Pre-refunded 12/01/11) – AGM Insured | | | |
2,420 | | Lorain County, Ohio, Limited Tax General Obligation Justice Center Bonds, Series 2002, 5.500%, | 12/12 at 100.00 | Aa2 (6) | 2,625,337 |
| | | 12/01/22 (Pre-refunded 12/01/12) – FGIC Insured | | | |
1,000 | | Marysville Exempted Village School District, Ohio, Certificates of Participation, School | 6/15 at 100.00 | N/R (6) | 1,159,040 |
| | | Facilities Project, Series 2005, 5.250%, 12/01/21 (Pre-refunded 6/01/15) – NPFG Insured | | | |
210 | | Ohio Water Development Authority, Revenue Bonds, Drinking Water Assistance Fund, State Match, | 6/18 at 100.00 | AAA | 243,963 |
| | | Series 2008, 5.000%, 6/01/28 (Pre-refunded 6/01/18) – AGM Insured | | | |
125 | | Ohio Water Development Authority, Revenue Bonds, Fresh Water Development, Series 2001A, | 12/11 at 100.00 | Aaa | 129,419 |
| | | 5.000%, 12/01/21 (Pre-refunded 12/01/11) – AGM Insured | | | |
1,050 | | Olentangy Local School District, Delaware and Franklin Counties, Ohio, General Obligation | 6/14 at 100.00 | AA+ (6) | 1,199,163 |
| | | Bonds, Series 2004A, 5.500%, 12/01/15 (Pre-refunded 6/01/14) – FGIC Insured | | | |
3,670 | | Tuscarawas County, Ohio, Hospital Facilities Revenue Bonds, Union Hospital Project, Series | 10/11 at 101.00 | N/R (6) | 3,812,504 |
| | | 2001, 5.750%, 10/01/26 (Pre-refunded 10/01/11) – RAAI Insured | | | |
11,580 | | Total U.S. Guaranteed | | | 12,464,757 |
| | | Utilities – 9.8% (6.7% of Total Investments) | | | |
1,000 | | American Municipal Power Ohio Inc., General Revenue Bonds, Prairie State Energy Campus Project | 2/18 at 100.00 | A1 | 959,640 |
| | | Series 2008A, 5.250%, 2/15/43 | | | |
1,065 | | Cleveland, Ohio, Public Power System Revenue Bonds, Series 2008B-2, 0.000%, 11/15/32 – | No Opt. Call | A– | 290,947 |
| | | NPFG Insured | | | |
Nuveen Investments 57
| | |
| | Nuveen Ohio Dividend Advantage Municipal Fund 2 (continued) |
NBJ | Portfolio of Investments February 28, 2011 |
| | | | | |
Principal | | Optional Call | | |
Amount (000) | Description (1) | Provisions (2) | Ratings (3) | Value |
| | Utilities (continued) | | | |
$ 2,500 | Ohio Air Quality Development Authority, Revenue Refunding Bonds, Ohio Power Company Project, | 5/11 at 100.00 | Baa1 | $ 2,424,300 |
| | Series 1999C, 5.150%, 5/01/26 – AMBAC Insured | | | |
595 | Ohio Municipal Electric Generation Agency, Beneficial Interest Certificates, Belleville | 2/14 at 100.00 | A1 | 619,877 |
| | Hydroelectric Project – Joint Venture 5, Series 2004, 5.000%, 2/15/20 – AMBAC Insured | | | |
5,160 | Total Utilities | | | 4,294,764 |
| | Water and Sewer – 0.4% (0.3% of Total Investments) | | | |
130 | City of Marysville, Ohio, Water System Mortgage Revenue Bonds, Series 2007, 5.000%, 12/01/32 – | 12/17 at 100.00 | A1 | 125,640 |
| | AMBAC Insured | | | |
45 | Ohio Water Development Authority, Revenue Bonds, Fresh Water Development, Series 2001A, | 12/11 at 100.00 | AAA | 46,313 |
| | 5.000%, 12/01/21 – AGM Insured | | | |
175 | Total Water and Sewer | | | 171,953 |
$ 72,305 | Total Investments (cost $64,640,052) – 146.9% | | | 64,520,352 |
| | Other Assets Less Liabilities – 2.3% | | | 988,856 |
| | Auction Rate Preferred Shares, at Liquidation Value – (49.2)% (7) | | | (21,600,000) |
| | Net Assets Applicable to Common Shares – 100% | | | $ 43,909,208 |
| | | |
(1) | | All percentages shown in the Portfolio of Investments are based on net assets applicable to Common shares unless otherwise noted. |
(2) | | Optional Call Provisions (not covered by the report of independent registered public accounting firm): Dates (month and year) and prices of the earliest |
| | | optional call or redemption. There may be other call provisions at varying prices at later dates. Certain mortgage-backed securities may be subject to |
| | | periodic principal paydowns. |
(3) | | Ratings (not covered by the report of independent registered public accounting firm): Using the highest of Standard & Poor’s Group (“Standard & Poor’s”), |
| | | Moody’s Investor Service, Inc. (“Moody’s”) or Fitch, Inc. (“Fitch”) rating. Ratings below BBB by Standard & Poor’s, Baa by Moody’s or BBB by Fitch are |
| | | considered to be below investment grade. Holdings designated N/R are not rated by any of these national rating agencies. |
(4) | | For fair value measurement disclosure purposes, investment categorized as Level 3. See Notes to Financial Statements, Footnote 1 – General Information |
| | | and Significant Accounting Policies, Investment Valuation for more information. |
(5) | | The Fund’s Adviser has concluded this issue is not likely to meet its future interest payment obligations and has directed the Fund’s custodian to cease |
| | | accruing additional income on the Fund’s records. |
(6) | | Backed by an escrow or trust containing sufficient U.S. Government or U.S. Government agency securities, which ensure the timely payment of principal |
| | | and interest. Such investments are normally considered to be equivalent to AAA rated securities. |
(7) | | Auction Rate Preferred Shares, at Liquidation Value as a percentage of Total Investments is 33.5%. |
N/R | | Not rated. |
(IF) | | Inverse floating rate investment. |
See accompanying notes to financial statements.
| | | | | | |
| | | Nuveen Ohio Dividend Advantage Municipal Fund 3 | | |
NVJ | | Portfolio of Investments | | |
| | | | February 28, 2011 | |
| | | | | | |
Principal | | | Optional Call | | |
Amount (000) | | Description (1) | Provisions (2) | Ratings (3) | Value |
| | | Consumer Staples – 6.4% (4.3% of Total Investments) | | | |
| | | Buckeye Tobacco Settlement Financing Authority, Ohio, Tobacco Settlement Asset-Backed Revenue | | | |
| | | Bonds, Senior Lien, Series 2007A-2: | | | |
$ 1,280 | | 5.875%, 6/01/30 | 6/17 at 100.00 | Baa3 | $ 923,866 |
1,565 | | 5.875%, 6/01/47 | 6/17 at 100.00 | Baa3 | 1,042,509 |
20 | | Puerto Rico, The Children’s Trust Fund, Tobacco Settlement Asset-Backed Refunding Bonds, | 5/12 at 100.00 | BBB | 18,224 |
| | | Series 2002, 5.375%, 5/15/33 | | | |
2,865 | | Total Consumer Staples | | | 1,984,599 |
| | | Education and Civic Organizations – 6.3% (4.3% of Total Investments) | | | |
350 | | Ohio Higher Education Facilities Commission, General Revenue Bonds, Kenyon College, Series | 7/16 at 100.00 | A+ | 327,222 |
| | | 2006, 5.000%, 7/01/41 | | | |
1,125 | | Ohio Higher Education Facilities Commission, Revenue Bonds, Ohio Northern University, Series | 5/12 at 100.00 | A3 | 1,159,481 |
| | | 2002, 5.750%, 5/01/16 | | | |
500 | | Ohio Higher Education Facilities Commission, Revenue Bonds, Wittenberg University, Series | 12/15 at 100.00 | Baa2 | 455,360 |
| | | 2005, 5.000%, 12/01/24 | | | |
1,975 | | Total Education and Civic Organizations | | | 1,942,063 |
| | | Energy – 0.8% (0.5% of Total Investments) | | | |
250 | | Virgin Islands Public Finance Authority, Refinery Facilities Revenue Bonds, Hovensa Coker | 1/13 at 100.00 | Baa3 | 244,465 |
| | | Project, Senior Lien Series 2002, 6.500%, 7/01/21 (Alternative Minimum Tax) | | | |
| | | Health Care – 28.9% (19.5% of Total Investments) | | | |
750 | | Butler County, Ohio, Hospital Facilities Revenue Bonds, UC Health, Series 2010, | 11/20 at 100.00 | BBB+ | 632,078 |
| | | 5.500%, 11/01/40 | | | |
695 | | Butler County, Ohio, Hospital Facilities Revenue Bonds, Cincinnati Children’s Medical Center | 5/16 at 100.00 | N/R | 644,863 |
| | | Project, Series 2006K, 5.000%, 5/15/31 – FGIC Insured | | | |
600 | | Franklin County, Ohio, Hospital Revenue Bonds, Nationwide Children’s Hospital Project, | 11/19 at 100.00 | Aa2 | 568,902 |
| | | Improvement Series 2009, 5.250%, 11/01/40 | | | |
420 | | Franklin County, Ohio, Hospital Revenue Bonds, Nationwide Children’s Hospital Project, Series | 11/18 at 100.00 | Aa2 | 383,141 |
| | | 2005, 5.000%, 11/01/40 | | | |
300 | | Lorain County, Ohio, Hospital Revenue Refunding and Improvement Bonds, Catholic Healthcare | 10/12 at 100.00 | AA– | 290,973 |
| | | Partners, Refunding Series 2002, 5.375%, 10/01/30 | | | |
500 | | Lucas County, Ohio, Hospital Revenue Bonds, ProMedica Healthcare Obligated Group, Series 1999, | 5/11 at 100.50 | AA– | 480,850 |
| | | 5.375%, 11/15/29 – AMBAC Insured | | | |
550 | | Lucas County, Ohio, Hospital Revenue Bonds, ProMedica Healthcare Obligated Group, Series | 11/21 at 100.00 | AA– | 553,394 |
| | | 2011A, 6.000%, 11/15/41 | | | |
160 | | Miami County, Ohio, Hospital Facilities Revenue Refunding Bonds, Upper Valley Medical Center | 5/16 at 100.00 | A– | 162,832 |
| | | Inc., Series 2006, 5.250%, 5/15/21 | | | |
500 | | Montgomery County, Ohio, Revenue Bonds, Catholic Health Initiatives, Series 2004A, | 5/14 at 100.00 | AA | 486,735 |
| | | 5.000%, 5/01/30 | | | |
105 | | Montgomery County, Ohio, Revenue Bonds, Miami Valley Hospital, Series 2009A, 6.250%, 11/15/39 | 11/14 at 100.00 | Aa3 | 107,885 |
| | | Ohio State Higher Educational Facilities Commission, Hospital Revenue Bonds, Cleveland Clinic | | | |
| | | Health System Obligated Group, Series 2008A: | | | |
600 | | 5.000%, 1/01/25 | 1/18 at 100.00 | Aa2 | 608,988 |
100 | | 5.250%, 1/01/33 | 1/18 at 100.00 | Aa2 | 97,208 |
200 | | Ohio State Higher Educational Facilities Commission, Hospital Revenue Bonds, Summa Health | 5/20 at 100.00 | AA+ | 186,032 |
| | | System Project, Series 2010, 5.250%, 11/15/40 – AGM Insured | | | |
2,000 | | Ohio State Higher Educational Facilities Commission, Hospital Revenue Bonds, University | 1/15 at 100.00 | A | 2,056,639 |
| | | Hospitals Health System, Series 2009, 6.750%, 1/15/39 | | | |
100 | | Ohio State, Hospital Facility Revenue Refunding Bonds, Cleveland Clinic Health System | 1/19 at 100.00 | Aa2 | 100,244 |
| | | Obligated Group, Series 2009A, 5.500%, 1/01/39 | | | |
Nuveen Investments 59
| | | | | | |
Nuveen Ohio Dividend Advantage Municipal Fund 3 (continued) | | | |
NVJ Portfolio of Investments February 28, 2011 | | | |
| | | | | | |
Principal | | | Optional Call | | |
Amount (000) | | Description (1) | Provisions (2) | Ratings (3) | Value |
| | | Health Care (continued) | | | |
| | | Ohio State, Hospital Facility Revenue Refunding Bonds, Cleveland Clinic Health System | | | |
| | | Obligated Group, Tender Option Bond Trust 3551: | | | |
$ 125 | | 19.708%, 1/01/17 (IF) | No Opt. Call | Aa2 | $ 119,770 |
675 | | 64.415%, 1/01/33 (IF) | 1/19 at 100.00 | Aa2 | 681,588 |
100 | | Ohio State, Hospital Facility Revenue Refunding Bonds, Cleveland Clinic Health System | No Opt. Call | Aa2 | 100,976 |
| | | Obligated Group, Tender Option Bond Trust 3591, 64.573%, 1/01/17 (IF) | | | |
335 | | Richland County, Ohio, Hospital Facilities Revenue Improvement Bonds, MedCentral Health System | 11/12 at 100.00 | A– | 338,280 |
| | | Obligated Group, Series 2000B, 6.375%, 11/15/30 | | | |
250 | | Richland County, Ohio, Hospital Revenue Bonds, MidCentral Health System Group, Series 2006, | 11/16 at 100.00 | A– | 225,863 |
| | | 5.250%, 11/15/36 | | | |
110 | | Ross County, Ohio, Hospital Revenue Refunding Bonds, Adena Health System Series 2008, | 12/18 at 100.00 | A | 108,559 |
| | | 5.750%, 12/01/35 | | | |
9,175 | | Total Health Care | | | 8,935,800 |
| | | Housing/Multifamily – 3.1% (2.1% of Total Investments) | | | |
200 | | Montgomery County, Ohio, GNMA Guaranteed Multifamily Housing Revenue Bonds, Canterbury Court | 10/18 at 101.00 | Aa1 | 197,034 |
| | | Project, Series 2007, 5.500%, 10/20/42 (Alternative Minimum Tax) | | | |
175 | | Ohio Housing Finance Agency, FHA-Insured Multifamily Housing Mortgage Revenue Bonds, Madonna | 6/16 at 102.00 | AAA | 156,496 |
| | | Homes, Series 2006M, 4.900%, 6/20/48 (Alternative Minimum Tax) | | | |
685 | | Summit County Port Authority, Ohio, Multifamily Housing Revenue Bonds, Callis Tower Apartments | 9/17 at 102.00 | AAA | 614,671 |
| | | Project, Series 2007, 5.250%, 9/20/47 (Alternative Minimum Tax) | | | |
1,060 | | Total Housing/Multifamily | | | 968,201 |
| | | Housing/Single Family – 0.9% (0.6% of Total Investments) | | | |
305 | | Ohio Housing Finance Agency, Single Family Mortgage Revenue Bonds, Series 2006H, 5.000%, | 9/15 at 100.00 | Aaa | 288,176 |
| | | 9/01/31 (Alternative Minimum Tax) | | | |
| | | Industrials – 7.1% (4.8% of Total Investments) | | | |
555 | | Cleveland-Cuyahoga County Port Authority, Ohio, Common Bond Fund Revenue Bonds, Cleveland | 5/12 at 102.00 | BBB– | 519,158 |
| | | Christian Home Project, Series 2002C, 5.950%, 5/15/22 | | | |
480 | | Ohio State Water Development Authority, Solid Waste Revenue Bonds, Allied Waste Industries, | 7/12 at 100.00 | BBB | 491,362 |
| | | Inc., Series 2007A, 5.150%, 7/15/15 (Alternative Minimum Tax) | | | |
1,000 | | Toledo-Lucas County Port Authority, Ohio, Revenue Refunding Bonds, CSX Transportation Inc., | No Opt. Call | Baa3 | 1,126,880 |
| | | Series 1992, 6.450%, 12/15/21 | | | |
400 | | Western Reserve Port Authority, Ohio, Solid Waste Facility Revenue Bonds, Central Waste Inc., | 7/17 at 102.00 | N/R | 73,000 |
| | | Series 2007A, 6.350%, 7/01/27 (Alternative Minimum Tax) (4), (5) | | | |
2,435 | | Total Industrials | | | 2,210,400 |
| | | Long-Term Care – 1.0% (0.7% of Total Investments) | | | |
95 | | Franklin County, Ohio, Healthcare Facilities Revenue Bonds, Ohio Presbyterian Retirement | 7/21 at 100.00 | BBB | 91,590 |
| | | Services, Improvement Series 2010A, 5.625%, 7/01/26 | | | |
245 | | Montgomery County, Ohio, Health Care and Multifamily Housing Revenue Bonds, Saint Leonard, | 4/20 at 100.00 | BBB– | 227,632 |
| | | Refunding & improvement Series 2010, 6.625%, 4/01/40 | | | |
340 | | Total Long-Term Care | | | 319,222 |
| | | Tax Obligation/General – 33.5% (22.6% of Total Investments) | | | |
| | | Columbus City School District, Franklin County, Ohio, General Obligation Bonds, Series 2006: | | | |
1,815 | | 0.000%, 12/01/27 – AGM Insured | No Opt. Call | AAA | 760,322 |
1,000 | | 0.000%, 12/01/28 – AGM Insured | No Opt. Call | AAA | 389,820 |
300 | | Cuyahoga County, Ohio, General Obligation Bonds, Series 2004, 5.000%, 12/01/21 | 12/14 at 100.00 | AA+ | 321,183 |
1,000 | | Franklin County, Ohio, General Obligation Bonds, Series 2007, 5.000%, 12/01/27 | 12/17 at 100.00 | AAA | 1,059,560 |
250 | | Green, Ohio, General Obligation Bonds, Series 2008, 5.500%, 12/01/32 | 12/15 at 100.00 | AA | 255,905 |
1,275 | | Hamilton City School District, Ohio, General Obligation Bonds, Series 2007, 5.000%, 12/01/34 – | 6/17 at 100.00 | AA+ | 1,246,300 |
| | | AGM Insured | | | |
1,000 | | Indian Lake Local School District, Logan and Auglaize Counties, Ohio, School Facilities | 6/17 at 100.00 | Aa3 | 975,480 |
| | | Improvement and Refunding Bonds, Series 2007, 5.000%, 12/01/34 – NPFG Insured | | | |
60 Nuveen Investments
| | | | | | |
Principal | | | Optional Call | | |
Amount (000) | | Description (1) | Provisions (2) | Ratings (3) | Value |
| | | Tax Obligation/General (continued) | | | |
$ 1,000 | | Kenston Local School District, Geauga County, Ohio, General Obligation Bonds, Series 2003, | 6/13 at 100.00 | Aa2 | $ 1,055,320 |
| | | 5.000%, 12/01/22 – NPFG Insured | | | |
210 | | Lakewood City School District, Cuyahoga County, Ohio, General Obligation Bonds, Series 2007, | 12/17 at 100.00 | Aa2 | 218,354 |
| | | 5.000%, 12/01/25 – FGIC Insured | | | |
1,270 | | Lorain, Ohio, General Obligation Bonds, Series 2002, 5.125%, 12/01/26 – AMBAC Insured | 12/12 at 100.00 | A3 | 1,237,742 |
235 | | Lucas County, Ohio, General Obligation Bonds, Various Purpose Series 2010, 5.000%, 10/01/40 | 10/18 at 100.00 | Aa2 | 230,890 |
500 | | Marysville Exempted School District, Union County, Ohio, General Obligation Bonds, Series | 12/15 at 100.00 | AA+ | 513,280 |
| | | 2006, 5.000%, 12/01/25 – AGM Insured | | | |
100 | | Mason City School District, Counties of Warren and Butler, Ohio, General Obligation Bonds, | 6/17 at 100.00 | Aaa | 102,393 |
| | | Series 2007, 5.000%, 12/01/31 | | | |
50 | | Milford Exempted Village School District, Ohio, General Obligation Bonds, Series 2008, | 12/18 at 100.00 | Aa3 | 48,722 |
| | | 5.250%, 12/01/36 | | | |
150 | | Northmor Local School District, Morrow County, Ohio, General Obligation School Facilities | 11/18 at 100.00 | Aa2 | 146,909 |
| | | Construction and Improvement Bonds, Series 2008, 5.000%, 11/01/36 | | | |
1,130 | | Solon, Ohio, General Obligation Refunding and Improvement Bonds, Series 2002, 5.000%, 12/01/18 | 12/12 at 100.00 | AAA | 1,198,003 |
500 | | Sylvania City School District, Ohio, General Obligation School Improvement Bonds, Series 1995, | 6/17 at 100.00 | AA+ | 502,735 |
| | | 5.250%, 12/01/36 – AGC Insured | | | |
100 | | Vandalia Butler City School District, Montgomery County, Ohio, General Obligation Bonds, | No Opt. Call | AA | 99,703 |
| | | School Improvment Series 2009, 5.125%, 12/01/37 | | | |
11,885 | | Total Tax Obligation/General | | | 10,362,621 |
| | | Tax Obligation/Limited – 10.6% (7.2% of Total Investments) | | | |
250 | | Cuyhoga County, Ohio, Economic Development Revenue Bonds, Federally Taxable Recovery Zone | 12/20 at 100.00 | AA | 255,013 |
| | | Facility Medical Mart- Convention Center Project, Series 2010G, 5.000%, 12/01/27 | | | |
75 | | Delaware County District Library, Delaware, Franklin, Marion, Morrow and Union Counties, Ohio, | 12/19 at 100.00 | Aa2 | 73,563 |
| | | Library Fund Library Facilities Special Obligation Notes, Series 2009, 5.000%, 12/01/34 | | | |
1,000 | | Hamilton County, Ohio, Sales Tax Bonds, Subordinate Lien, Series 2006, 5.000%, 12/01/32 – | 12/16 at 100.00 | A1 | 963,950 |
| | | AMBAC Insured | | | |
1,000 | | Midview Local School District, Lorain County, Ohio, Certificates of Participation, Series | 5/13 at 100.00 | A1 | 985,770 |
| | | 2003, 5.000%, 11/01/30 | | | |
200 | | Ohio State Building Authority, State Facilities Bonds, Administrative Building Fund Projects, | 4/15 at 100.00 | AA+ | 205,934 |
| | | Series 2005A, 5.000%, 4/01/25 – AGM Insured | | | |
2,000 | | Puerto Rico Sales Tax Financing Corporation, Sales Tax Revenue Bonds, First Subordinate Series | No Opt. Call | A+ | 436,940 |
| | | 2009A, 0.000%, 8/01/34 | | | |
1,835 | | Puerto Rico Sales Tax Financing Corporation, Sales Tax Revenue Bonds, Series 2010A, | No Opt. Call | A+ | 371,276 |
| | | 0.000%, 8/01/35 | | | |
6,360 | | Total Tax Obligation/Limited | | | 3,292,446 |
| | | Transportation – 5.8% (3.9% of Total Investments) | | | |
1,550 | | Ohio Turnpike Commission, Revenue Refunding Bonds, Series 1998A, 5.500%, 2/15/18 – FGIC Insured | No Opt. Call | AA | 1,802,990 |
| | | U.S. Guaranteed – 35.0% (23.7% of Total Investments) (6) | | | |
725 | | Eaton City School District, Preble County, Ohio, General Obligation Bonds, Series 2002, | 12/12 at 101.00 | Aa2 (6) | 798,203 |
| | | 5.750%, 12/01/21 (Pre-refunded 12/01/12) – FGIC Insured | | | |
1,300 | | Granville Exempt Village School District, Ohio, General Obligation Bonds, Series 2001, 5.500%, | 12/11 at 100.00 | Aa1 (6) | 1,350,673 |
| | | 12/01/28 (Pre-refunded 12/01/11) | | | |
1,000 | | Hilliard, Ohio, General Obligation Bonds, Series 2002, 5.375%, 12/01/22 (Pre-refunded 12/01/12) | 12/12 at 100.00 | Aa1 (6) | 1,084,510 |
500 | | Miami East Local School District, Miami County, Ohio, General Obligation Bonds, Series 2002, | 6/12 at 100.00 | AA+ (6) | 529,215 |
| | | 5.125%, 12/01/29 (Pre-refunded 6/01/12) – AGM Insured | | | |
1,000 | | Montgomery County, Ohio, Revenue Bonds, Catholic Health Initiatives, Series 2001, 5.500%, | 9/11 at 100.00 | Aa2 (6) | 1,025,710 |
| | | 9/01/12 (Pre-refunded 9/01/11) | | | |
2,000 | | Ohio Higher Education Facilities Commission, Revenue Bonds, Case Western Reserve University, | 10/12 at 100.00 | N/R (6) | 2,153,838 |
| | | Series 2002B, 5.500%, 10/01/22 (Pre-refunded 10/01/12) | | | |
Nuveen Investments 61
| | | | | | |
Nuveen Ohio Dividend Advantage Municipal Fund 3 (continued) | | | |
NVJ Portfolio of Investments February 28, 2011 | | | |
| | | | | | |
Principal | | | Optional Call | | |
Amount (000) | | Description (1) | Provisions (2) | Ratings (3) | Value |
| | | U.S. Guaranteed (6) (continued) | | | |
$ 1,250 | | Ohio State Building Authority, State Facilities Bonds, Administrative Building Fund Projects, | 4/12 at 100.00 | AA+ (6) | $ 1,318,875 |
| | | Series 2002A, 5.500%, 4/01/18 (Pre-refunded 4/01/12) – AGM Insured | | | |
160 | | Ohio Water Development Authority, Revenue Bonds, Drinking Water Assistance Fund, State Match, | 6/18 at 100.00 | AAA | 185,877 |
| | | Series 2008, 5.000%, 6/01/28 (Pre-refunded 6/01/18) – AGM Insured | | | |
230 | | Ohio Water Development Authority, Revenue Bonds, Fresh Water Development, Series 2001A, | 12/11 at 100.00 | Aaa | 238,131 |
| | | 5.000%, 12/01/21 (Pre-refunded 12/01/11) – AGM Insured | | | |
1,000 | | Ohio, Common Schools Capital Facilities, General Obligation Bonds, Series 2001B, 5.000%, | 9/11 at 100.00 | AA+ (6) | 1,025,600 |
| | | 9/15/20 (Pre-refunded 9/15/11) | | | |
1,000 | | Olentangy Local School District, Delaware and Franklin Counties, Ohio, General Obligation | 6/14 at 100.00 | AA+ (6) | 1,134,070 |
| | | Bonds, Series 2004A, 5.250%, 12/01/21 (Pre-refunded 6/01/14) – FGIC Insured | | | |
10,165 | | Total U.S. Guaranteed | | | 10,844,702 |
| | | Utilities – 7.9% (5.4% of Total Investments) | | | |
500 | | American Municipal Power Ohio Inc., General Revenue Bonds, Prairie State Energy Campus Project | 2/18 at 100.00 | A1 | 479,820 |
| | | Series 2008A, 5.250%, 2/15/43 | | | |
1,500 | | American Municipal Power Ohio Inc., Wadsworth, Electric System Improvement Revenue Bonds, | 2/12 at 100.00 | A2 | 1,534,829 |
| | | Series 2002, 5.250%, 2/15/17 – NPFG Insured | | | |
1,595 | | Cleveland, Ohio, Public Power System Revenue Bonds, Series 2008B-2, 0.000%, 11/15/32 – | No Opt. Call | A– | 435,738 |
| | | NPFG Insured | | | |
3,595 | | Total Utilities | | | 2,450,387 |
| | | Water and Sewer – 0.6% (0.4% of Total Investments) | | | |
130 | | City of Marysville, Ohio, Water System Mortgage Revenue Bonds, Series 2007, 5.000%, 12/01/32 – | 12/17 at 100.00 | A1 | 125,640 |
| | | AMBAC Insured | | | |
40 | | Ohio Water Development Authority, Revenue Bonds, Fresh Water Development, Series 2001A, | 12/11 at 100.00 | AAA | 41,167 |
| | | 5.000%, 12/01/21 – AGM Insured | | | |
170 | | Total Water and Sewer | | | 166,807 |
$ 52,130 | | Total Investments (cost $45,469,019) – 147.9% | | | 45,812,879 |
| | | Other Assets Less Liabilities – 2.2% | | | 655,096 |
| | | Auction Rate Preferred Shares, at Liquidation Value – (50.1)% (7) | | | (15,500,000) |
| | | Net Assets Applicable to Common Shares – 100% | | | $ 30,967,975 |
| | | |
(1) | | All percentages shown in the Portfolio of Investments are based on net assets applicable to Common shares unless otherwise noted. |
(2) | | Optional Call Provisions (not covered by the report of independent registered public accounting firm): Dates (month and year) and prices of the earliest |
| | | optional call or redemption. There may be other call provisions at varying prices at later dates. Certain mortgage-backed securities may be subject to |
| | | periodic principal paydowns. |
(3) | | Ratings (not covered by the report of independent registered public accounting firm): Using the highest of Standard & Poor’s Group (“Standard & Poor’s”), |
| | | Moody’s Investor Service, Inc. (“Moody’s”) or Fitch, Inc. (“Fitch”) rating. Ratings below BBB by Standard & Poor’s, Baa by Moody’s or BBB by Fitch are |
| | | considered to be below investment grade. Holdings designated N/R are not rated by any of these national rating agencies. |
(4) | | For fair value measurement disclosure purposes, investment categorized as Level 3. See Notes to Financial Statements, Footnote 1 – General Information |
| | | and Significant Accounting Policies, Investment Valuation for more information. |
(5) | | The Fund’s Adviser has concluded this issue is not likely to meet its future interest payment obligations and has directed the Fund’s custodian to cease |
| | | accruing additional income on the Fund’s records. |
(6) | | Backed by an escrow or trust containing sufficient U.S. Government or U.S. Government agency securities, which ensure the timely payment of principal |
| | | and interest. Such investments are normally considered to be equivalent to AAA rated securities. |
(7) | | Auction Rate Preferred Shares, at Liquidation Value as a percentage of Total Investments is 33.8%. |
N/R | | Not rated. |
(IF) | | Inverse floating rate investment. |
See accompanying notes to financial statements.
62 Nuveen Investments
| | | | | | | | | | |
Statement of | | | | | | | | | |
Assets & Liabilities | | | | | | | | | |
| | | February 28, 2011 | | | | |
| | | | | | | | | | |
| | | Michigan | | | Michigan | | | Michigan | |
| | | Quality | | | Premium | | | Dividend | |
| | | Income | | | Income | | | Advantage | |
| | | (NUM) | | | (NMP) | | | (NZW) | |
Assets | | | | | | | | | |
Investments, at value (cost $250,966,685, $161,200,271 | | | | | | | | | |
and $44,477,774, respectively) | | $ | 252,805,857 | | | $ | 160,669,245 | | | $ | 44,027,541 | |
Cash | | | 1,236,776 | | | | 244,205 | | | | 162,977 | |
Receivables: | | | | | | | | | | | | |
Interest | | | 3,823,463 | | | | 2,597,968 | | | | 651,358 | |
Investments sold | | | — | | | | — | | | | — | |
Deferred offering costs | | | — | | | | — | | | | 541,641 | |
Other assets | | | 58,658 | | | | 49,077 | | | | 5,488 | |
Total assets | | | 257,924,754 | | | | 163,560,495 | | | | 45,389,005 | |
Liabilities | | | | | | | | | | | | |
Floating rate obligations | | | 3,630,000 | | | | 2,330,000 | | | | 665,000 | |
Payables: | | | | | | | | | | | | |
Investments purchased | | | 2,132,876 | | | | 839,820 | | | | 324,375 | |
Common share dividends | | | 2,714 | | | | 2,814 | | | | 134,475 | |
Auction Rate Preferred share dividends | | | 731,423 | | | | 466,891 | | | | 1,085 | |
Interest | | | — | | | | — | | | | 31,267 | |
Offering costs | | | — | | | | — | | | | 175,469 | |
MuniFund Term Preferred (MTP) shares, at liquidation value | | | — | | | | — | | | | 16,313,000 | |
Accrued expenses: | | | | | | | | | | | | |
Management fees | | | 120,574 | | | | 77,135 | | | | 19,664 | |
Other | | | 106,524 | | | | 61,194 | | | | 15,031 | |
Total liabilities | | | 6,724,111 | | | | 3,777,854 | | | | 17,679,366 | |
Auction Rate Preferred Shares (ARPS), at liquidation value | | | 87,325,000 | | | | 53,700,000 | | | | — | |
Net assets applicable to Common shares | | $ | 163,875,643 | | | $ | 106,082,641 | | | $ | 27,709,639 | |
Common shares outstanding | | | 11,557,653 | | | | 7,605,648 | | | | 2,053,086 | |
Net asset value per Common share outstanding (net assets | | | | | | | | | | | | |
applicable to Common shares, divided by Common | | | | | | | | | | | | |
shares outstanding) | | $ | 14.18 | | | $ | 13.95 | | | $ | 13.50 | |
Net assets applicable to Common shares consist of: | | | | | | | | | | | | |
Common shares, $.01 par value per share | | $ | 115,577 | | | $ | 76,056 | | | $ | 20,531 | |
Paid-in surplus | | | 162,121,399 | | | | 106,733,261 | | | | 29,075,456 | |
Undistributed (Over-distribution of) net investment income | | | 2,994,016 | | | | 1,865,189 | | | | 409,933 | |
Accumulated net realized gain (loss) | | | (3,194,521 | ) | | | (2,060,839 | ) | | | (1,346,048 | ) |
Net unrealized appreciation (depreciation) | | | 1,839,172 | | | | (531,026 | ) | | | (450,233 | ) |
Net assets applicable to Common shares | | $ | 163,875,643 | | | $ | 106,082,641 | | | $ | 27,709,639 | |
Authorized shares: | | | | | | | | | | | | |
Common | | | 200,000,000 | | | | 200,000,000 | | | Unlimited | |
ARPS | | | 1,000,000 | | | | 1,000,000 | | | Unlimited | |
MTP | | | — | | | | — | | | Unlimited | |
See accompanying notes to financial statements.
Nuveen Investments 63
| | | | | | | | | | | | | |
Statement of | | | | | | | | | | | | |
Assets & Liabilities (continued) | | | | | | | | | | | | |
| | | | | | February 28, 2011 | | | | |
| | | | | | | | | | |
| | | Ohio | | | Ohio | | | Ohio | | | Ohio | |
| | | Quality | | | Dividend | | | Dividend | | | Dividend | |
| | | Income | | | Advantage | | | Advantage 2 | | | Advantage 3 | |
| | | (NUO) | | | (NXI) | | | (NBJ) | | | (NVJ) | |
Assets | | | | | | | | | | | | |
Investments, at value (cost $217,987,700, $90,453,712, | | | | | | | | | | | | |
$64,640,052 and $45,469,019, respectively) | | $ | 220,762,745 | | | $ | 90,316,900 | | | $ | 64,520,352 | | | $ | 45,812,879 | |
Cash | | | 568,662 | | | | 863,753 | | | | 151,833 | | | | 120,673 | |
Receivables: | | | | | | | | | | | | | | | | |
Interest | | | 2,830,979 | | | | 1,281,366 | | | | 978,622 | | | | 646,554 | |
Investments sold | | | 195,000 | | | | 50,000 | | | | 95,000 | | | | 50,000 | |
Deferred offering costs | | | — | | | | 521,999 | | | | — | | | | — | |
Other assets | | | 26,649 | | | | 12,228 | | | | 22,966 | | | | 35,630 | |
Total assets | | | 224,384,035 | | | | 93,046,246 | | | | 65,768,773 | | | | 46,665,736 | |
Liabilities | | | | | | | | | | | | | | | | |
Floating rate obligations | | | — | | | | — | | | | — | | | | — | |
Payables: | | | | | | | | | | | | | | | | |
Investments purchased | | | — | | | | — | | | | — | | | | — | |
Common share dividends | | | 641,567 | | | | 294,788 | | | | 206,320 | | | | 158,806 | |
Auction Rate Preferred share dividends | | | 3,405 | | | | 1,072 | | | | 288 | | | | 1,090 | |
Interest | | | — | | | | 38,090 | | | | — | | | | — | |
Offering costs | | | — | | | | 131,157 | | | | — | | | | — | |
MuniFund Term Preferred (MTP) shares, at liquidation value | | | — | | | | 19,450,000 | | | | — | | | | — | |
Accrued expenses: | | | | | | | | | | | | | | | | |
Management fees | | | 107,900 | | | | 41,627 | | | | 29,507 | | | | 19,122 | |
Other | | | 76,641 | | | | 39,550 | | | | 23,450 | | | | 18,743 | |
Total liabilities | | | 829,513 | | | | 19,996,284 | | | | 259,565 | | | | 197,761 | |
Auction Rate Preferred Shares (ARPS), at liquidation value | | | 73,000,000 | | | | 12,500,000 | | | | 21,600,000 | | | | 15,500,000 | |
Net assets applicable to Common shares | | $ | 150,554,522 | | | $ | 60,549,962 | | | $ | 43,909,208 | | | $ | 30,967,975 | |
Common shares outstanding | | | 9,753,457 | | | | 4,246,124 | | | | 3,122,403 | | | | 2,158,189 | |
Net asset value per Common share outstanding (net assets | | | | | | | | | | | | | | | | |
applicable to Common shares, divided by Common | | | | | | | | | | | | | | | | |
shares outstanding) | | $ | 15.44 | | | $ | 14.26 | | | $ | 14.06 | | | $ | 14.35 | |
Net assets applicable to Common shares consist of: | | | | | | | | | | | | | | | | |
Common shares, $.01 par value per share | | $ | 97,535 | | | $ | 42,461 | | | $ | 31,224 | | | $ | 21,582 | |
Paid-in surplus | | | 147,979,087 | | | | 60,344,997 | | | | 44,290,130 | | | | 30,548,164 | |
Undistributed (Over-distribution of) net investment income | | | 2,761,677 | | | | 1,034,310 | | | | 766,971 | | | | 624,640 | |
Accumulated net realized gain (loss) | | | (3,058,822 | ) | | | (734,994 | ) | | | (1,059,417 | ) | | | (570,271 | ) |
Net unrealized appreciation (depreciation) | | | 2,775,045 | | | | (136,812 | ) | | | (119,700 | ) | | | 343,860 | |
Net assets applicable to Common shares | | $ | 150,554,522 | | | $ | 60,549,962 | | | $ | 43,909,208 | | | $ | 30,967,975 | |
Authorized shares: | | | | | | | | | | | | | | | | |
Common | | | 200,000,000 | | | Unlimited | | | Unlimited | | | Unlimited | |
ARPS | | | 1,000,000 | | | Unlimited | | | Unlimited | | | Unlimited | |
MTP | | | — | | | Unlimited | | | | — | | | | — | |
See accompanying notes to financial statements.
| | | | | | | | | | |
Statement of | | | | | | | | | |
Operations | | | | | | | | | |
| | | Year Ended February 28, 2011 | |
| | | | |
| | | Michigan | | | Michigan | | | Michigan | |
| | | Quality | | | Premium | | | Dividend | |
| | | Income | | | Income | | | Advantage | |
| | | (NUM) | | | (NMP) | | | (NZW) | |
Investment Income | | $ | 12,898,089 | | | $ | 8,334,524 | | | $ | 2,223,123 | |
Expenses | | | | | | | | | | | | |
Management fees | | | 1,638,859 | | | | 1,042,914 | | | | 282,036 | |
Auction fees | | | 130,988 | | | | 80,548 | | | | 12,158 | |
Dividend disbursing agent fees | | | 20,000 | | | | 20,000 | | | | 16,712 | |
Shareholders’ servicing agent fees and expenses | | | 15,927 | | | | 12,357 | | | | 3,257 | |
Interest expense and amortization of offering costs | | | 36,158 | | | | 23,209 | | | | 152,021 | |
Custodian’s fees and expenses | | | 50,320 | | | | 33,771 | | | | 14,347 | |
Directors’/Trustees’ fees and expenses | | | 6,705 | | | | 4,240 | | | | 1,345 | |
Professional fees | | | 26,027 | | | | 20,416 | | | | 10,437 | |
Shareholders’ reports – printing and mailing expenses | | | 57,630 | | | | 44,156 | | | | 15,117 | |
Stock exchange listing fees | | | 9,068 | | | | 9,068 | | | | 288 | |
Investor relations expense | | | — | | | | — | | | | 1,352 | |
Other expenses | | | 28,146 | | | | 19,030 | | | | 17,417 | |
Total expenses before custodian fee credit and expense reimbursement | | | 2,019,828 | | | | 1,309,709 | | | | 526,487 | |
Custodian fee credit | | | (1,482 | ) | | | (556 | ) | | | (711 | ) |
Expense reimbursement | | | — | | | | — | | | | (35,273 | ) |
Net expenses | | | 2,018,346 | | | | 1,309,153 | | | | 490,503 | |
Net investment income | | | 10,879,743 | | | | 7,025,371 | | | | 1,732,620 | |
Realized and Unrealized Gain (Loss) | | | | | | | | | | | | |
Net realized gain (loss) from investments | | | 248,011 | | | | 92,219 | | | | 7,965 | |
Change in net unrealized appreciation (depreciation) of investments | | | (8,256,526 | ) | | | (4,081,282 | ) | | | (1,457,657 | ) |
Net realized and unrealized gain (loss) | | | (8,008,515 | ) | | | (3,989,063 | ) | | | (1,449,692 | ) |
Distributions to Auction Rate Preferred Shareholders | | | | | | | | | | | | |
From net investment income | | | (363,829 | ) | | | (224,505 | ) | | | (46,443 | ) |
Decrease in net assets applicable to Common shares from distributions | | | | | | | | | | | | |
to Auction Rate Preferred shareholders | | | (363,829 | ) | | | (224,505 | ) | | | (46,443 | ) |
Net increase (decrease) in net assets applicable to Common | | | | | | | | | | | | |
shares from operations | | $ | 2,507,399 | | | $ | 2,811,803 | | | $ | 236,485 | |
See accompanying notes to financial statements.
Nuveen Investments 65
| | | | | | | | | | | | | |
Statement of | | | | | | | | | | | | |
Operations (continued) | | | | | | | | | | | | |
| | | | | | Year Ended February 28, 2011 | |
| | | Ohio | | | Ohio | | | Ohio | | | Ohio | |
| | | Quality | | | Dividend | | | Dividend | | | Dividend | |
| | | Income | | | Advantage | | | Advantage 2 | | | Advantage 3 | |
| | | (NUO) | | | (NXI) | | | (NBJ) | | | (NVJ) | |
Investment Income | | $ | 11,683,075 | | | $ | 4,816,262 | | | $ | 3,433,128 | | | $ | 2,534,448 | |
Expenses | | | | | | | | | | | | | | | | |
Management fees | | | 1,465,776 | | | | 603,186 | | | | 435,140 | | | | 310,832 | |
Auction fees | | | 109,500 | | | | 38,279 | | | | 32,401 | | | | 23,251 | |
Dividend disbursing agent fees | | | 30,000 | | | | 10,000 | | | | 10,000 | | | | 10,000 | |
Shareholders’ servicing agent fees and expenses | | | 17,782 | | | | 6,372 | | | | 1,018 | | | | 808 | |
Interest expense and amortization of offering costs | | | — | | | | 152,785 | | | | — | | | | — | |
Custodian’s fees and expenses | | | 46,795 | | | | 24,055 | | | | 18,645 | | | | 15,770 | |
Directors’/Trustees’ fees and expenses | | | 5,968 | | | | 2,421 | | | | 1,741 | | | | 1,247 | |
Professional fees | | | 24,599 | | | | 13,794 | | | | 12,240 | | | | 11,079 | |
Shareholders’ reports – printing and mailing expenses | | | 59,787 | | | | 25,094 | | | | 21,307 | | | | 18,148 | |
Stock exchange listing fees | | | 9,068 | | | | 591 | | | | 435 | | | | 301 | |
Investor relations expense | | | — | | | | — | | | | — | | | | — | |
Other expenses | | | 19,823 | | | | 19,376 | | | | 23,899 | | | | 17,481 | |
Total expenses before custodian fee credit and expense reimbursement | | | 1,789,098 | | | | 895,953 | | | | 556,826 | | | | 408,917 | |
Custodian fee credit | | | (2,445 | ) | | | (837 | ) | | | (271 | ) | | | (331 | ) |
Expense reimbursement | | | — | | | | (51,636 | ) | | | (54,652 | ) | | | (51,152 | ) |
Net expenses | | | 1,786,653 | | | | 843,480 | | | | 501,903 | | | | 357,434 | |
Net investment income | | | 9,896,422 | | | | 3,972,782 | | | | 2,931,225 | | | | 2,177,014 | |
Realized and Unrealized Gain (Loss) | | | | | | | | | | | | | | | | |
Net realized gain (loss) from investments | | | (1,695,269 | ) | | | (759,748 | ) | | | (317,234 | ) | | | (343,731 | ) |
Change in net unrealized appreciation (depreciation) of investments | | | (6,159,347 | ) | | | (3,186,614 | ) | | | (2,015,524 | ) | | | (1,945,414 | ) |
Net realized and unrealized gain (loss) | | | (7,854,616 | ) | | | (3,946,362 | ) | | | (2,332,758 | ) | | | (2,289,145 | ) |
Distributions to Auction Rate Preferred Shareholders | | | | | | | | | | | | | | | | |
From net investment income | | | (304,704 | ) | | | (107,603 | ) | | | (90,237 | ) | | | (65,024 | ) |
Decrease in net assets applicable to Common shares from distributions | | | | | | | | | | | | | | | | |
to Auction Rate Preferred shareholders | | | (304,704 | ) | | | (107,603 | ) | | | (90,237 | ) | | | (65,024 | ) |
Net increase (decrease) in net assets applicable to Common | | | | | | | | | | | | | | | | |
shares from operations | | $ | 1,737,102 | | | $ | (81,183 | ) | | $ | 508,230 | | | $ | (177,155 | ) |
See accompanying notes to financial statements.
66 Nuveen Investments
| | | | | | | | | | | | | | | | | | | |
| Statement of | | | | | | | | | | | | | | | | |
| Changes in Net Assets | | | | | | | |
| | | Michigan | | | Michigan | | | Michigan | |
| | | Quality Income (NUM) | | | Premium Income (NMP) | | | Dividend Advantage (NZW) | |
| | | Year Ended | | | Year Ended | | | Year Ended | | | Year Ended | | | Year Ended | | | Year Ended | |
| | | 2/28/11 | | | 2/28/10 | | | 2/28/11 | | | 2/28/10 | | | 2/28/11 | | | 2/28/10 | |
Operations | | | | | | | | | | | | | | | | | | |
Net investment income | | $ | 10,879,743 | | | $ | 10,772,387 | | | $ | 7,025,371 | | | $ | 6,940,535 | | | $ | 1,732,620 | | | $ | 1,883,250 | |
Net realized gain (loss) from | | | | | | | | | | | | | | | | | | | | | | | | |
investments | | | 248,011 | | | | (1,126,911 | ) | | | 92,219 | | | | (479,222 | ) | | | 7,965 | | | | (758,274 | ) |
Change in net unrealized appreciation | | | | | | | | | | | | | | | | | | | | | | | | |
(depreciation) of investments | | | (8,256,526 | ) | | | 13,314,923 | | | | (4,081,282 | ) | | | 7,688,095 | | | | (1,457,657 | ) | | | 3,453,979 | |
Distributions to Auction Rate | | | | | | | | | | | | | | | | | | | | | | | | |
Preferred Shareholders | | | | | | | | | | | | | | | | | | | | | | | | |
from net investment income | | | (363,829 | ) | | | (440,076 | ) | | | (224,505 | ) | | | (271,823 | ) | | | (46,443 | ) | | | (64,791 | ) |
Net increase (decrease) in net assets | | | | | | | | | | | | | | | | | | | | | | | | |
applicable to Common shares | | | | | | | | | | | | | | | | | | | | | | | | |
from operations | | | 2,507,399 | | | | 22,520,323 | | | | 2,811,803 | | | | 13,877,585 | | | | 236,485 | | | | 4,514,164 | |
Distributions to Common Shareholders | | | | | | | | | | | | | | | | | | | | | | | | |
From net investment income | | | (9,571,838 | ) | | | (8,473,599 | ) | | | (6,243,504 | ) | | | (5,420,952 | ) | | | (1,633,328 | ) | | | (1,474,799 | ) |
Decrease in net assets applicable to | | | | | | | | | | | | | | | | | | | | | | | | |
Common shares from distributions | | | | | | | | | | | | | | | | | | | | | | | | |
to Common shareholders | | | (9,571,838 | ) | | | (8,473,599 | ) | | | (6,243,504 | ) | | | (5,420,952 | ) | | | (1,633,328 | ) | | | (1,474,799 | ) |
Capital Share Transactions | | | | | | | | | | | | | | | | | | | | | | | | |
Common shares: | | | | | | | | | | | | | | | | | | | | | | | | |
Net proceeds from shares issued | | | | | | | | | | | | | | | | | | | | | | | | |
to shareholders due to | | | | | | | | | | | | | | | | | | | | | | | | |
reinvestment of distributions | | | — | | | | — | | | | — | | | | — | | | | — | | | | — | |
Repurchased and retired | | | (43,408 | ) | | | (1,779,734 | ) | | | (105,018 | ) | | | (1,271,720 | ) | | | (20,395 | ) | | | (148,424 | ) |
Net increase (decrease) in net assets | | | | | | | | | | | | | | | | | | | | | | | | |
applicable to Common shares from | | | | | | | | | | | | | | | | | | | | | | | | |
capital share transactions | | | (43,408 | ) | | | (1,779,734 | ) | | | (105,018 | ) | | | (1,271,720 | ) | | | (20,395 | ) | | | (148,424 | ) |
Net increase (decrease) in net assets | | | | | | | | | | | | | | | | | | | | | | | | |
applicable to Common shares | | | (7,107,847 | ) | | | 12,266,990 | | | | (3,536,719 | ) | | | 7,184,913 | | | | (1,417,238 | ) | | | 2,890,941 | |
Net assets applicable to Common | | | | | | | | | | | | | | | | | | | | | | | | |
shares at the beginning of year | | | 170,983,490 | | | | 158,716,500 | | | | 109,619,360 | | | | 102,434,447 | | | | 29,126,877 | | | | 26,235,936 | |
Net assets applicable to Common | | | | | | | | | | | | | | | | | | | | | | | | |
shares at the end of year | | $ | 163,875,643 | | | $ | 170,983,490 | | | $ | 106,082,641 | | | $ | 109,619,360 | | | $ | 27,709,639 | | | $ | 29,126,877 | |
Undistributed (Over-distribution of) | | | | | | | | | | | | | | | | | | | | | | | | |
net investment income at the end | | | | | | | | | | | | | | | | | | | | | | | | |
of year | | $ | 2,994,016 | | | $ | 2,052,752 | | | $ | 1,865,189 | | | $ | 1,308,096 | | | $ | 409,933 | | | $ | 327,171 | |
See accompanying notes to financial statements.
Nuveen Investments 67
| | | | | | | | | | | | | | | | | | | |
Statement of | | | | | | | | | | | | | | | | | | |
Changes in Net Assets (continued) | | | | | | | | | | | | | |
| | | Ohio | | | Ohio | | | Ohio | |
| | | Quality Income (NUO) | | | Dividend Advantage (NXI) | | | Dividend Advantage 2 (NBJ) | |
| | | Year Ended | | | Year Ended | | | Year Ended | | | Year Ended | | | Year Ended | | | Year Ended | |
| | | 2/28/11 | | | 2/28/10 | | | 2/28/11 | | | 2/28/10 | | | 2/28/11 | | | 2/28/10 | |
Operations | | | | | | | | | | | | | | | | | | |
Net investment income | | $ | 9,896,422 | | | $ | 9,796,627 | | | $ | 3,972,782 | | | $ | 4,102,042 | | | $ | 2,931,225 | | | $ | 2,919,272 | |
Net realized gain (loss) from | | | | | | | | | | | | | | | | | | | | | | | | |
investments | | | (1,695,269 | ) | | | 363,546 | | | | (759,748 | ) | | | 222,662 | | | | (317,234 | ) | | | (18,550 | ) |
Change in net unrealized appreciation | | | | | | | | | | | | | | | | | | | | | | | | |
(depreciation) of investments | | | (6,159,347 | ) | | | 13,563,229 | | | | (3,186,614 | ) | | | 4,711,810 | | | | (2,015,524 | ) | | | 4,761,551 | |
Distributions to Auction Rate | | | | | | | | | | | | | | | | | | | | | | | | |
Preferred Shareholders | | | | | | | | | | | | | | | | | | | | | | | | |
from net investment income | | | (304,704 | ) | | | (380,264 | ) | | | (107,603 | ) | | | (156,209 | ) | | | (90,237 | ) | | | (115,975 | ) |
Net increase (decrease) in net assets | | | | | | | | | | | | | | | | | | | | | | | | |
applicable to Common shares | | | | | | | | | | | | | | | | | | | | | | | | |
from operations | | | 1,737,102 | | | | 23,343,138 | | | | (81,183 | ) | | | 8,880,305 | | | | 508,230 | | | | 7,546,298 | |
Distributions to Common Shareholders | | | | | | | | | | | | | | | | | | | | | | | | |
From net investment income | | | (8,744,701 | ) | | | (7,787,080 | ) | | | (3,699,495 | ) | | | (3,281,918 | ) | | | (2,613,100 | ) | | | (2,300,529 | ) |
Decrease in net assets applicable to | | | | | | | | | | | | | | | | | | | | | | | | |
Common shares from distributions | | | | | | | | | | | | | | | | | | | | | | | | |
to Common shareholders | | | (8,744,701 | ) | | | (7,787,080 | ) | | | (3,699,495 | ) | | | (3,281,918 | ) | | | (2,613,100 | ) | | | (2,300,529 | ) |
Capital Share Transactions | | | | | | | | | | | | | | | | | | | | | | | | |
Common shares: | | | | | | | | | | | | | | | | | | | | | | | | |
Net proceeds from shares issued | | | | | | | | | | | | | | | | | | | | | | | | |
to shareholders due to | | | | | | | | | | | | | | | | | | | | | | | | |
reinvestment of distributions | | | 123,278 | | | | — | | | | 40,145 | | | | — | | | | 13,809 | | | | — | |
Repurchased and retired | | | — | | | | — | | | | — | | | | — | | | | — | | | | — | |
Net increase (decrease) in net assets | | | | | | | | | | | | | | | | | | | | | | | | |
applicable to Common shares from | | | | | | | | | | | | | | | | | | | | | | | | |
capital share transactions | | | 123,278 | | | | — | | | | 40,145 | | | | — | | | | 13,809 | | | | — | |
Net increase (decrease) in net assets | | | | | | | | | | | | | | | | | | | | | | | | |
applicable to Common shares | | | (6,884,321 | ) | | | 15,556,058 | | | | (3,740,533 | ) | | | 5,598,387 | | | | (2,091,061 | ) | | | 5,245,769 | |
Net assets applicable to Common | | | | | | | | | | | | | | | | | | | | | | | | |
shares at the beginning of year | | | 157,438,843 | | | | 141,882,785 | | | | 64,290,495 | | | | 58,692,108 | | | | 46,000,269 | | | | 40,754,500 | |
Net assets applicable to Common | | | | | | | | | | | | | | | | | | | | | | | | |
shares at the end of year | | $ | 150,554,522 | | | $ | 157,438,843 | | | $ | 60,549,962 | | | $ | 64,290,495 | | | $ | 43,909,208 | | | $ | 46,000,269 | |
Undistributed (Over-distribution of) | | | | | | | | | | | | | | | | | | | | | | | | |
net investment income at the end | | | | | | | | | | | | | | | | | | | | | | | | |
of year | | $ | 2,761,677 | | | $ | 1,981,139 | | | $ | 1,034,310 | | | $ | 901,121 | | | $ | 766,971 | | | $ | 566,366 | |
See accompanying notes to financial statements.
68 Nuveen Investments
| | | | | | | |
Statement of | | | | | | |
Changes in Net Assets (continued) | | | | | | |
| | | Ohio | |
| | | Dividend Advantage 3 (NVJ) | |
| | | Year Ended | | | Year Ended | |
| | | 2/28/11 | | | 2/28/10 | |
Operations | | | | | | |
Net investment income | | $ | 2,177,014 | | | $ | 2,167,213 | |
Net realized gain (loss) from | | | | | | | | |
investments | | | (343,731 | ) | | | (180,875 | ) |
Change in net unrealized appreciation | | | | | | | | |
(depreciation) of investments | | | (1,945,414 | ) | | | 2,739,661 | |
Distributions to Auction Rate | | | | | | | | |
Preferred Shareholders | | | | | | | | |
from net investment income | | | (65,024 | ) | | | (83,432 | ) |
Net increase (decrease) in net assets | | | | | | | | |
applicable to Common shares | | | | | | | | |
from operations | | | (177,155 | ) | | | 4,642,567 | |
Distributions to Common Shareholders | | | | | | | | |
From net investment income | | | (1,938,643 | ) | | | (1,708,152 | ) |
Decrease in net assets applicable to | | | | | | | | |
Common shares from distributions | | | | | | | | |
to Common shareholders | | | (1,938,643 | ) | | | (1,708,152 | ) |
Capital Share Transactions | | | | | | | | |
Common shares: | | | | | | | | |
Net proceeds from shares issued | | | | | | | | |
to shareholders due to | | | | | | | | |
reinvestment of distributions | | | 22,090 | | | | — | |
Repurchased and retired | | | — | | | | — | |
Net increase (decrease) in net assets | | | | | | | | |
applicable to Common shares from | | | | | | | | |
capital share transactions | | | 22,090 | | | | — | |
Net increase (decrease) in net assets | | | | | | | | |
applicable to Common shares | | | (2,093,708 | ) | | | 2,934,415 | |
Net assets applicable to Common | | | | | | | | |
shares at the beginning of year | | | 33,061,683 | | | | 30,127,268 | |
Net assets applicable to Common | | | | | | | | |
shares at the end of year | | $ | 30,967,975 | | | $ | 33,061,683 | |
Undistributed (Over-distribution of) | | | | | | | | |
net investment income at the end | | | | | | | | |
of year | | $ | 624,640 | | | $ | 459,793 | |
See accompanying notes to financial statements.
Nuveen Investments 69
| | | | |
Statement of | | | |
Cash Flows | | | |
| | | Year Ended February 28, 2011 | |
| | | | |
| | | Michigan | |
| | | Dividend | |
| | | Advantage | |
| | | (NZW) | |
Cash Flows from Operating Activities: | | | |
Net Increase (Decrease) In Net Assets Applicable to Common Shares | | $ | 236,485 | |
from Operations | | | | |
Adjustments to reconcile the net increase (decrease) in net assets applicable | | | | |
to Common shares from operations to net cash provided by (used in) | | | | |
operating activities: | | | | |
Purchases of investments | | | (4,541,397 | ) |
Proceeds from sales and maturities of investments | | | 2,602,288 | |
Amortization (Accretion) of premiums and discounts, net | | | (8,825 | ) |
(Increase) Decrease in: | | | | |
Receivable for interest | | | (15,536 | ) |
Other assets | | | 6,714 | |
Increase (Decrease) in: | | | | |
Payable for investments purchased | | | 324,375 | |
Payable for Auction Rate Preferred share dividends | | | 586 | |
Payable for interest | | | 31,267 | |
Accrued management fees | | | 1,528 | |
Accrued other expenses | | | (14,394 | ) |
Net realized (gain) loss from investments | | | (7,965 | ) |
Change in net unrealized (appreciation) depreciation of investments | | | 1,457,657 | |
Taxes paid on undistributed capital gains | | | (14 | ) |
Net cash provided by (used in) operating activities | | | 72,769 | |
Cash Flows from Financing Activities: | | | | |
(Increase) Decrease in deferred offering costs | | | (541,641 | ) |
Increase (Decrease) in: | | | | |
MTP shares, at liquidation value | | | 16,313,000 | |
ARPS, at liquidation value | | | (14,275,000 | ) |
Payable for offering costs | | | 175,469 | |
Cash distributions paid to Common shareholders | | | (1,626,784 | ) |
Cost of Common shares repurchased and retired | | | (20,395 | ) |
Net cash provided by (used in) financing activities | | | 24,649 | |
Net Increase (Decrease) in Cash | | | 97,418 | |
Cash at the beginning of year | | | 65,559 | |
Cash at the End of year | | | 162,977 | |
Supplemental Disclosure of Cash Flow Information
Cash paid by Michigan Dividend Advantage (NZW) for interest (excluding amortization of offering costs) during the fiscal year ended February 28, 2011, was $113,304.
See accompanying notes to financial statements.
70 Nuveen Investments
Financial
Highlights
Nuveen Investments 71
Financial
Highlights
Selected data for a Common share outstanding throughout each period:
| | | | | | | | | | | | | | | | | | | | | | | | | | | | | | | | | | | | | |
| | | | | | | | | | | | Investment Operations | | | | | | Less Distributions | | | | | | | | | | | | | |
| | | | | | | | | | | | Distributions | | | Distributions | | | | | | | | | | | | | | | Discount | | | | | | | |
| | | | | | | | | | | | from Net | | | from | | | | | | Net | | | Capital | | | | | | from | | | Ending | | | | |
| | | Beginning | | | | | | Net | | | Investment | | | Capital | | | | | | Investment | | | Gains | | | | | | Common | | | | | | | |
| | | Common | | | | | | | | | Income to | | | Gains to | | | | | | Income to | | | to | | | | | | Shares | | | | | | | |
| | | Share | | | Net | | | Unrealized | | | Preferred | | | Preferred | | | | | | Common | Common | | | | | | Repurchased | | | Net | | | Ending | |
| | | Net Asset | | | Investment | | | Gain | | | Share- | | | Share- | | | | | | Share- | | | Share- | | | | | | and | | | Asset | | | Market | |
| | | Value | | | Income | | | (Loss) | | | holders(a) | | | holders(a) | | Total | | | holders | | | holders | | | Total | | | Retired | | | Value | | | Value | |
Michigan Quality Income (NUM) | | | | | | | | | | | | | | | | | | | | | | | | | | | | | | | | | | | | |
Year Ended 2/28: | | | | | | | | | | | | | | | | | | | | | | | | | | | | | | | | | | | | |
2011 | | $ | 14.79 | | | $ | .94 | | | $ | (.69 | ) | | $ | (.03 | ) | | $ | — | | | $ | .22 | | | $ | (.83 | ) | | $ | — | | | $ | (.83 | ) | | $ | — | ** | | $ | 14.18 | | | $ | 12.75 | |
2010 | | | 13.55 | | | | .93 | | | | 1.06 | | | | (.04 | ) | | | — | | | | 1.95 | | | | (.73 | ) | | | — | | | | (.73 | ) | | | .02 | | | | 14.79 | | | | 12.94 | |
2009(f) | | | 14.13 | | | | .54 | | | | (.60 | ) | | | (.13 | ) | | | — | | | | (.19 | ) | | | (.39 | ) | | | — | | | | (.39 | ) | | | — | | | | 13.55 | | | | 10.61 | |
Year Ended 7/31: | | | | | | | | | | | | | | | | | | | | | | | | | | | | | | | | | | | | | | | | | | | | | | | | |
2008 | | | 14.96 | | | | .93 | | | | (.71 | ) | | | (.24 | ) | | | (.04 | ) | | | (.06 | ) | | | (.67 | ) | | | (.10 | ) | | | (.77 | ) | | | — | | | | 14.13 | | | | 12.32 | |
2007 | | | 15.17 | | | | .94 | | | | (.10 | ) | | | (.25 | ) | | | (.02 | ) | | | .57 | | | | (.71 | ) | | | (.07 | ) | | | (.78 | ) | | | — | | | | 14.96 | | | | 14.16 | |
2006 | | | 15.88 | | | | .96 | | | | (.52 | ) | | | (.21 | ) | | | (.02 | ) | | | .21 | | | | (.81 | ) | | | (.11 | ) | | | (.92 | ) | | | — | | | | 15.17 | | | | 14.41 | |
| Michigan Premium Income (NMP) | | | | | | | | | | | | | | | | | | | | | | | | | | | | | | | | | | | | | | | | | | | | | |
Year Ended 2/28: | | | | | | | | | | | | | | | | | | | | | | | | | | | | | | | | | | | | | | | | | | | | | | | | |
2011 | | | 14.40 | | | | .92 | | | | (.52 | ) | | | (.03 | ) | | | — | | | | .37 | | | | (.82 | ) | | | — | | | | (.82 | ) | | | — | ** | | | 13.95 | | | | 12.66 | |
2010 | | | 13.26 | | | | .90 | | | | .97 | | | | (.04 | ) | | | — | | | | 1.83 | | | | (.71 | ) | | | — | | | | (.71 | ) | | | .02 | | | | 14.40 | | | | 12.50 | |
2009(f) | | | 13.87 | | | | .52 | | | | (.63 | ) | | | (.12 | ) | | | — | | | | (.23 | ) | | | (.38 | ) | | | — | | | | (.38 | ) | | | — | ** | | | 13.26 | | | | 10.44 | |
Year Ended 7/31: | | | | | | | | | | | | | | | | | | | | | | | | | | | | | | | | | | | | | | | | | | | | | | | | |
2008 | | | 14.65 | | | | .89 | | | | (.69 | ) | | | (.23 | ) | | | (.02 | ) | | | (.05 | ) | | | (.66 | ) | | | (.07 | ) | | | (.73 | ) | | | — | | | | 13.87 | | | | 12.38 | |
2007 | | | 14.92 | | | | .90 | | | | (.12 | ) | | | (.23 | ) | | | (.02 | ) | | | .53 | | | | (.71 | ) | | | (.09 | ) | | | (.80 | ) | | | — | | | | 14.65 | | | | 13.80 | |
2006 | | | 15.55 | | | | .91 | | | | (.40 | ) | | | (.18 | ) | | | (.02 | ) | | | .31 | | | | (.79 | ) | | | (.15 | ) | | | (.94 | ) | | | — | | | | 14.92 | | | | 14.27 | |
| | | | | | | | | | |
| | | Auction Rate Preferred Shares | |
| | | | | | at End of Period | | | | |
| | | Aggregate | | | | | | | |
| | | Amount | | | Liquidation | | | Asset | |
| | | Outstanding | | | Value | | | Coverage | |
| | | | (000 | ) | | Per Share | | | Per Share | |
| Michigan Quality Income (NUM) | | | | | | | |
Year Ended 2/28: | | | | | | | | | | |
2011 | | $ | 87,325 | | | $ | 25,000 | | | $ | 71,915 | |
2010 | | | 87,325 | | | | 25,000 | | | | 73,950 | |
2009(f) | | | 90,900 | | | | 25,000 | | | | 68,651 | |
Year Ended 7/31: | | | | | | | | | | | | |
2008 | | | 94,000 | | | | 25,000 | | | | 69,023 | |
2007 | | | 94,000 | | | | 25,000 | | | | 71,607 | |
2006 | | | 94,000 | | | | 25,000 | | | | 72,270 | |
| Michigan Premium Income (NMP) | | | | | | | | | |
Year Ended 2/28: | | | | | | | | | | | | |
2011 | | | 53,700 | | | | 25,000 | | | | 74,387 | |
2010 | | | 53,700 | | | | 25,000 | | | | 76,033 | |
2009(f) | | | 56,000 | | | | 25,000 | | | | 70,730 | |
Year Ended 7/31: | | | | | | | | | | | | |
2008 | | | 56,000 | | | | 25,000 | | | | 72,986 | |
2007 | | | 56,000 | | | | 25,000 | | | | 75,695 | |
2006 | | | 56,000 | | | | 25,000 | | | | 76,612 | |
72 Nuveen Investments
| | | | | | | | | | | | | | | | | | | | |
| | | | | | | | | | | | | | | | Ratios/Supplemental Data | | | | |
| | | | | | | | | | | | | Ratios to Average Net Assets | |
| Total Returns | | | | | | | | | | | | Applicable to Common Shares(c)(d) | |
| | | | Based | | | Ending | | | | | | | | | | | | | |
| | | | on | | | Net | | | | | | | | | | | | | |
| Based | | | Common | | | Assets | | | | | | | | | | | | | |
| on | | | Share Net | | | Applicable | | | Expenses | | | Expenses | | | Net | | | Portfolio | |
| Market | | | Asset | | | to Common | | | Including | | | Excluding | | | Investment | | | Turnover | |
Value(b) | | | Value(b) | | | Shares (000) | | | Interest(e) | | | Interest | | | Income | | | Rate | |
| | 4.69 | % | | | 1.39 | % | | $ | 163,876 | | | | 1.18 | % | | | 1.16 | % | | | 6.37 | % | | | 6 | % |
| | 29.40 | | | | 14.83 | | | | 170,983 | | | | 1.24 | | | | 1.22 | | | | 6.50 | | | | 9 | |
| | (10.68 | ) | | | (1.27 | ) | | | 158,717 | | | | 1.33 | * | | | 1.33 | * | | | 6.93 | * | | | 3 | |
| | (7.77 | ) | | | (.43 | ) | | | 165,525 | | | | 1.29 | | | | 1.25 | | | | 6.28 | | | | 18 | |
| | 3.64 | | | | 3.77 | | | | 175,244 | | | | 1.26 | | | | 1.22 | | | | 6.12 | | | | 13 | |
| | (2.28 | ) | | | 1.41 | | | | 177,734 | | | | 1.23 | | | | 1.23 | | | | 6.18 | | | | 18 | |
| | 7.72 | | | | 2.55 | | | | 106,083 | | | | 1.20 | | | | 1.18 | | | | 6.42 | | | | 4 | |
| | 27.06 | | | | 14.22 | | | | 109,619 | | | | 1.25 | | | | 1.23 | | | | 6.51 | | | | 12 | |
| | (12.57 | ) | | | (1.62 | ) | | | 102,434 | | | | 1.32 | * | | | 1.32 | * | | | 6.83 | * | | | 3 | |
| | (5.09 | ) | | | (.36 | ) | | | 107,488 | | | | 1.38 | | | | 1.23 | | | | 6.16 | | | | 20 | |
| | 2.16 | | | | 3.59 | | | | 113,558 | | | | 1.38 | | | | 1.22 | | | | 5.97 | | | | 15 | |
| | (3.12 | ) | | | 2.06 | | | | 115,611 | | | | 1.20 | | | | 1.10 | | | | 6.02 | | | | 6 | |
| (a) | The amounts shown are based on Common share equivalents. |
| (b) | Total Return Based on Market Value is the combination of changes in the market price per share and the effect of reinvested dividend income and reinvested capital gains distributions, if any, at the average price paid per share at the time of reinvestment. The last dividend declared in the period, which is typically paid on the first business day of the following month, is assumed to be reinvested at the ending market price. The actual reinvestment for the last dividend declared in the period may take place over several days, and in some instances may not be based on the market price, so the actual reinvestment price may be different from the price used in the calculation. |
| | Total returns are not annualized. |
| | Total Return Based on Common Share Net Asset Value is the combination of changes in Common share net asset value, reinvested dividend income at net asset value and reinvested capital gains distributions at net asset value, if any. The last dividend declared in the period, which is typically paid on the first business day of the following month, is assumed to be reinvested at the ending net asset value. The actual reinvest price for the last dividend declared in the period may often be based on the Fund’s market price (and not its net asset value), and therefore may be different from the price used in the calculation. Total returns are not annualized. |
| (c) | Ratios do not reflect the effect of dividend payments to Auction Rate Preferred shareholders; Net Investment Income ratios reflect income earned and expenses incurred on assets attributable to Auction Rate Preferred shares. |
| (d) | Ratios do not reflect the effect of custodian fee credits earned on the Fund’s net cash on deposit with the custodian bank, where applicable. |
| (e) | The expense ratios reflect, among other things, the interest expense deemed to have been paid by the Fund on the floating rate certificates issued by the special purpose trusts for the self-deposited inverse floaters held by the Fund, where applicable, as described in Footnote 1 – General Information and Significant Accounting Policies, Inverse Floating Rate Securities. |
| (f) | For the seven months ended February 28, 2009. |
| * | Annualized. |
| ** | Rounds to less than $.01 per share. |
See accompanying notes to financial statements.
Nuveen Investments 73
Financial
Highlights (continued)
Selected data for a Common share outstanding throughout each period:
| | | | | | | | | | | | | | | | | | | | | | | | | | | | | | | | | | | | |
| | | | | | | | | Investment Operations | | | | | | Less Distributions | | | | | | | | | | | | | |
| | | | | | | | | | | Distributions | | | Distributions | | | | | | | | | | | | | | | Discount | | | | | | | |
| | | Beginning | | | | | | | | from Net | | | from | | | | | | Net | | | | | | | | | from | | | Ending | | | | |
| | | Common | | | | | | | | Investment | | | Capital | | | | | | Investment | | | Capital | | | | | | Common | | | Common | | | | |
| | | Share | | | | | | Net | | Income to | | | Gains to | | | | | | Income to | | | Gains to | | | | | | Shares | | | Share | | | | |
| | | Net | | | Net | | | Realized/ | | Preferred | | | Preferred | | | | | | Common | | | Common | | | | | | Repurchased | | | Net | | | Ending | |
| | | Asset | | | Investment | | | Gain | | Share- | | | Share- | | | | | | Share- | | | Share- | | | | | | and | | | Asset | | | Market | |
| | | Value | | | Income | | | (Loss) | | holders(a) | | | holders(a) | | | Total | | | holders | | | holders | | | Total | | | Retired | | | Value | | | Value | |
| Michigan Dividend Advantage (NZW) | | | | | | | | | | | | | | | | | | | | | | | | | | | | | | |
Year Ended 2/28: | | | | | | | | | | | | | | | | | | | | | | | | | | | | | | | | | | | |
2011 | | $ | 14.18 | | | $ | .84 | | | $ | (.70 | ) | $ | (.02 | ) | | $ | — | | | $ | .12 | | | $ | (.80 | ) | | $ | — | | | $ | (.80 | ) | | $ | — | ** | | $ | 13.50 | | | $ | 12.13 | |
2010 | | | 12.69 | | | | .91 | | | | 1.32 | | | (.03 | ) | | | — | | | | 2.20 | | | | (.72 | ) | | | — | | | | (.72 | ) | | | .01 | | | | 14.18 | | | | 12.43 | |
2009(f) | | | 13.68 | | | | .54 | | | | (1.00 | ) | | (.13 | ) | | | — | ** | | | (.59 | ) | | | (.39 | ) | | | (.01 | ) | | | (.40 | ) | | | — | | | | 12.69 | | | | 10.77 | |
Year Ended 7/31: | | | | | | | | | | | | | | | | | | | | | | | | | | | | | | | | | | | | | | | | | | | | | | | |
2008 | | | 14.73 | | | | .94 | | | | (.95 | ) | | (.24 | ) | | | (.02 | ) | | | (.27 | ) | | | (.71 | ) | | | (.07 | ) | | | (.78 | ) | | | — | | | | 13.68 | | | | 13.10 | |
2007 | | | 14.94 | | | | .95 | | | | (.14 | ) | | (.24 | ) | | | — | ** | | | .57 | | | | (.77 | ) | | | (.01 | ) | | | (.78 | ) | | | — | | | | 14.73 | | | | 15.10 | |
2006 | | | 15.44 | | | | .97 | | | | (.40 | ) | | (.20 | ) | | | — | | | | .37 | | | | (.87 | ) | | | — | | | | (.87 | ) | | | — | | | | 14.94 | | | | 15.81 | |
| | | Auction Rate Preferred Shares | | | | | | MuniFund Term Preferred Shares | | |
| | | | | | at End of Period | | | | | | | | | at End of Period | | |
| | | Aggregate | | | Liquidation | | | Asset | | | Aggregate | | | Liquidation | | | Ending | | | | Average | | Asset | | |
| | | Amount | | | Value | | | Coverage | | | Amount | | | Value | | | Market | | | | Market | | Coverage | | |
| | | Outstanding | | | Per | | | Per | | | Outstanding | | | Per | | | Value | | | | Value | | Per | | |
| | | (000 | ) | | Share | | | Share | | | (000 | ) | | Share | | | Per Share | | | | Per Share | | Share | | |
| Michigan Dividend Advantage (NZW) | | | | | | | | | | | | | | | | | | | | | |
Year Ended 2/28: | | | | | | | | | | | | | | | | | | | | | | | | | | | |
2011 | | $ | — | | | $ | — | | | $ | — | | | $ | 16,313 | | | $ | 10 | | | $ | 9.73 | | $ | 9.82 | ^ | $ | | 26.99 | |
2010 | | | 14,275 | | | | 25,000 | | | | 76,010 | | | | — | | | | — | | | | — | | | | — | | | | — | |
2009(f) | | | 14,925 | | | | 25,000 | | | | 68,946 | | | | — | | | | — | | | | — | | | | — | | | | — | |
Year Ended 7/31: | | | | | | | | | | | | | | | | | | | | | | | | | | | | | | | | | |
2008 | | | 16,000 | | | | 25,000 | | | | 69,195 | | | | — | | | | — | | | | — | | | | — | | | | — | |
2007 | | | 16,000 | | | | 25,000 | | | | 72,561 | | | | — | | | | — | | | | — | | | | — | | | | — | |
2006 | | | 16,000 | | | | 25,000 | | | | 73,161 | | | | — | | | | — | | | | — | | | | — | | | | — | |
74 Nuveen Investments
| | | | | | | | | | | | | | | Ratios/Supplemental Data | | | | | | | | | | |
| | | | | | | | | Ratios to Average Net Assets | | | Ratios to Average Net Assets | | | | |
| | | | | | | | | Applicable to Common Shares | | | Applicable to Common Shares | | | | |
| Total Returns | | | | | Before Reimbursement(c) | | | | After Reimbursement(c)(d) | | | | |
| | | | Based | | | Ending | | | | | | | | | | | | | | | | | | | | | |
| | | | on | | | Net | | | | | | | | | | | | | | | | | | | | | |
| Based | | | Common | | | Assets | | | | | | | | | | | | | | | | | | | | | |
| on | | | Share Net | | | Applicable | | Expenses | | | Expenses | | | Net | | | Expenses | | | Expenses | | | Net | | | Portfolio | |
| Market | | | Asset | | | | to Common | | Including | | | Excluding | | | Investment | | | Including | | | Excluding | | | Investment | | | Turnover | |
| Value | (b) | | Value | (b) | | | Shares (000) | | Interest(e) | | | Interest | | | Income | | | Interest(e) | | | Interest | | | Income | | | Rate | |
| | 3.72 | % | | | .70 | % | | $ | 27,710 | | | 1.81 | % | | | 1.40 | % | | | 5.85 | % | | | 1.69 | % | | | 1.28 | % | | | 5.97 | % | | | 6 | % |
| | 22.58 | | | | 17.70 | | | | 29,127 | | | 1.35 | | | | 1.33 | | | | 6.48 | | | | 1.15 | | | | 1.13 | | | | 6.68 | | | | 6 | |
| | (14.48 | ) | | | (4.20 | ) | | | 26,236 | | | 1.48 | * | | | 1.48 | * | | | 7.03 | * | | | 1.22 | * | | | 1.22 | * | | | 7.29 | * | | | 4 | |
| | | | | | | | | | | | | | | | | | | | | | | | | | | | | | | | | | | | | | |
| | (8.10 | ) | | | (1.95 | ) | | | 28,285 | | | 1.39 | | | | 1.34 | | | | 6.23 | | | | 1.07 | | | | 1.03 | | | | 6.55 | | | | 18 | |
| | .46 | | | | 3.79 | | | | 30,439 | | | 1.38 | | | | 1.35 | | | | 5.89 | | | | .99 | | | | .96 | | | | 6.28 | | | | 19 | |
| | (.47 | ) | | | 2.46 | | | | 30,823 | | | 1.31 | | | | 1.31 | | | | 5.92 | | | | .86 | | | | .86 | | | | 6.37 | | | | 8 | |
| (a) | The amounts shown are based on Common share equivalents. |
| (b) | Total Return Based on Market Value is the combination of changes in the market price per share and the effect of reinvested dividend income and reinvested capital gains distributions, if any, at the average price paid per share at the time of reinvestment. The last dividend declared in the period, which is typically paid on the first business day of the following month, is assumed to be reinvested at the ending market price. The actual reinvestment for the last dividend declared in the period may take place over several days, and in some instances may not be based on the market price, so the actual reinvestment price may be different from the price used in the calculation. |
| | Total returns are not annualized. |
| | Total Return Based on Common Share Net Asset Value is the combination of changes in Common share net asset value, reinvested dividend income at net asset value and reinvested capital gains distributions at net asset value, if any. The last dividend declared in the period, which is typically paid on the first business day of the following month, is assumed to be reinvested at the ending net asset value. The actual reinvest price for the last dividend declared in the period may often be based on the Fund’s market price (and not its net asset value), and therefore may be different from the price used in the calculation. Total returns are not annualized. |
| (c) | Ratios do not reflect the effect of dividend payments to Auction Rate Preferred shareholders; Net Investment Income ratios reflect income earned and expenses incurred on assets attributable to Auction Rate Preferred shares and/or MuniFund Term Preferred shares, where applicable. |
| (d) | After expense reimbursement from the Adviser, where applicable. Ratios do not reflect the effect of custodian fee credits earned on the Fund’s net cash on deposit with the custodian bank, where applicable. |
| (e) | The expense ratios reflect, among other things, payments to MuniFund Term Preferred shareholders and/or the interest expense deemed to have been paid by the Fund on the floating rate certificates issued by the special purpose trusts for the self-deposited inverse floaters held by the Fund, where applicable, each as described in Footnote 1 – General Information and Significant Accounting Policies, MuniFund Term Preferred Shares and Inverse Floating Rate Securities, respectively. |
| (f) | For the seven months ended February 28, 2009. |
| * | Annualized. |
| ** | Rounds to less than $.01 per share. |
| ^ | For the period November 15, 2010 (first issuance date of shares) through February 28, 2011. |
See accompanying notes to financial statements.
Nuveen Investments 75
Financial
Highlights (continued)
Selected data for a Common share outstanding throughout each period:
| | | | | | | | | | | | | | | | | | | | | | | | | | | | | | | | | | | | | |
| | | | | | | | | Investment Operations | | | | | | Less Distributions | | | | | | | | | | | | | |
| | | | | | | | | | | | | | | | | | | | | | | | | | | | | | | | | | |
| | | | | | | | | | | | Distributions | | Distributions | | | | | | | | | | | | | | | Discount | | | | | | | |
| | | | | | | | | | | | from Net | | | from | | | | | | Net | | | | | | | | | from | | | Ending | | | | |
| | | Beginning | | | | | | Net | | | Investment | | | Capital | | | | | | Investment | | | Capital | | | | | | Common | | | Common | | | | |
| | | Common | | | | | | Realized/ | | | Income to | | | Gains to | | | | | | Income to | | Gains to | | | | | | Shares | | | Share | | | | |
| | | Share | | | Net | | | Unrealized | | | Preferred | | | Preferred | | | | | | Common | | Common | | | | | | Repurchased | | | Net | | | Ending | |
| | | Net Asset | | | Investment | | | Gain | | | Share- | | | Share- | | | | | | Share- | | | Share- | | | | | | and | | | Asset | | | Market | |
| | | Value | | | Income | | | (Loss) | | | holders(a) | | | holders(a) | | | Total | | | holders | | | holders | | | Total | | | Retired | | | Value | | | Value | |
| Ohio Quality Income (NUO) | | | | | | | | | | | | | | | | | | | | | | | | | | | | | | | | | | |
Year Ended 2/28: | | | | | | | | | | | | | | | | | | | | | | | | | | | | | | | | | | | | |
2011 | | $ | 16.15 | | | $ | 1.01 | | | $ | (.79 | ) | | $ | (.03 | ) | | $ | — | | | $ | .19 | | | $ | (.90 | ) | | $ | — | | | $ | (.90 | ) | | $ | — | | | $ | 15.44 | | | $ | 14.85 | |
2010 | | | 14.56 | | | | 1.01 | | | | 1.42 | | | | (.04 | ) | | | — | | | | 2.39 | | | | (.80 | ) | | | — | | | | (.80 | ) | | | — | | | | 16.15 | | | | 15.58 | |
2009(f) | | | 15.04 | | | | .56 | | | | (.52 | ) | | | (.13 | ) | | | — | | | | (.09 | ) | | | (.39 | ) | | | — | | | | (.39 | ) | | | — | | | | 14.56 | | | | 12.90 | |
Year Ended 7/31: | | | | | | | | | | | | | | | | | | | | | | | | | | | | | | | | | | | | | | | | | | | | | | | | |
2008 | | | 15.81 | | | | .95 | | | | (.71 | ) | | | (.25 | ) | | | (.02 | ) | | | (.03 | ) | | | (.67 | ) | | | (.07 | ) | | | (.74 | ) | | | — | | | | 15.04 | | | | 13.40 | |
2007 | | | 16.01 | | | | .96 | | | | (.12 | ) | | | (.26 | ) | | | (.01 | ) | | | .57 | | | | (.73 | ) | | | (.04 | ) | | | (.77 | ) | | | — | | | | 15.81 | | | | 14.43 | |
2006 | | | 16.58 | | | | .98 | | | | (.42 | ) | | | (.22 | ) | | | (.01 | ) | | | .33 | | | | (.85 | ) | | | (.05 | ) | | | (.90 | ) | | | — | | | | 16.01 | | | | 15.83 | |
| Ohio Dividend Advantage (NXI) | | | | | | | | | | | | | | | | | | | | | | | | | | | | | | | | | | | | | | | | | | | | | |
Year Ended 2/28: | | | | | | | | | | | | | | | | | | | | | | | | | | | | | | | | | | | | | | | | | | | | | | | | |
2011 | | | 15.15 | | | | .94 | | | | (.93 | ) | | | (.03 | ) | | | — | | | | (.02 | ) | | | (.87 | ) | | | — | | | | (.87 | ) | | | — | | | | 14.26 | | | | 13.30 | |
2010 | | | 13.83 | | | | .96 | | | | 1.17 | | | | (.04 | ) | | | — | | | | 2.09 | | | | (.77 | ) | | | — | | | | (.77 | ) | | | — | ** | | | 15.15 | | | | 14.48 | |
2009(f) | | | 14.25 | | | | .54 | | | | (.46 | ) | | | (.12 | ) | | | — | | | | (.04 | ) | | | (.38 | ) | | | — | | | | (.38 | ) | | | — | | | | 13.83 | | | | 12.10 | |
Year Ended 7/31: | | | | | | | | | | | | | | | | | | | | | | | | | | | | | | | | | | | | | | | | | | | | | | | | |
2008 | | | 14.87 | | | | .93 | | | | (.55 | ) | | | (.23 | ) | | | (.03 | ) | | | .12 | | | | (.65 | ) | | | (.09 | ) | | | (.74 | ) | | | — | | | | 14.25 | | | | 12.77 | |
2007 | | | 15.02 | | | | .94 | | | | (.09 | ) | | | (.24 | ) | | | (.01 | ) | | | .60 | | | | (.72 | ) | | | (.03 | ) | | | (.75 | ) | | | — | | | | 14.87 | | | | 14.39 | |
2006 | | | 15.55 | | | | .96 | | | | (.40 | ) | | | (.21 | ) | | | — | | | | .35 | | | | (.85 | ) | | | (.03 | ) | | | (.88 | ) | | | — | | | | 15.02 | | | | 15.05 | |
| | | | | | | | | | | | | | | | | | | | | | | | | Auction Rate Preferred Shares | |
| | | Auction Rate Preferred Shares | | | | MuniFund Term Preferred Shares | | | | | | and MuniFund Term Preferred Shares at End of Period | |
| | | | | | at End of Period | | | | at End of Period | | | | | | | | | | |
| | | | | | | | | | | | | | | | Ending | | Average | | | | | | | | | | |
| | | Aggregate | | | Liquidation | | | Asset | Aggregate | | | Liquidation | | | Market | | Market | | | Asset | | | | | | Asset Coverage | |
| | | Amount | | | Value | | | Coverage | Amount | | Value | | | Value | | | Value | | | Coverage | | | | | | Per $1 | |
| | | Outstanding | | | Per | | | Per | | Outstanding | | | Per | | | Per | | | Per | Per | | | Liquidation | |
| | | | (000 | ) | | Share | | | Share | | (000 | ) | | Share | | | Share | | | Share | | | | Share | | | Preference | |
| Ohio Quality Income (NUO) | | | | | | | | | | | | | | | | | | | | | | | | | | | |
Year Ended 2/28: | | | | | | | | | | | | | | | | | | | | | | | | | | | | | | |
2011 | | $ | 73,000 | | | $ | 25,000 | | | $ | 76,560 | $ | — | | | $ | — | | | $ | — | | | $ | — | | | $ | — | |
2010 | | | 73,000 | | | | 25,000 | | | | 78,917 | | — | | | | — | | | | — | | | | — | | | | — | | | | | | | — | |
2009(f) | | | 77,000 | | | | 25,000 | | | | 71,066 | | — | | | | — | | | | — | | | | — | | | | | | | | | | | — | |
Year Ended 7/31: | | | | | | | | | | | | | | | | | | | | | | | | | | | | | | | | | | | | | |
2008 | | | 77,000 | | | | 25,000 | | | | 72,603 | | — | | | | — | | | | — | | | | — | | | | — | | | | — | |
2007 | | | 77,000 | | | | 25,000 | | | | 75,017 | | — | | | | — | | | | — | | | | — | | | | — | | | | | | | — | |
2006 | | | 77,000 | | | | 25,000 | | | | 75,658 | | — | | | | — | | | | — | | | | — | | | | — | | | | | | | — | |
| Ohio Dividend Advantage (NXI) | | | | | | | | | | | | | | | | | | | | | | | | | | | | | | | | | | |
Year Ended 2/28: | | | | | | | | | | | | | | | | | | | | | | | | | | | | | | | | | | | | | |
2011 | | | 12,500 | | | | 25,000 | | | | 72,379 | | 19,450 | | | | 10 | | | | 9.78 | | | | 9.85 | ^ | | | 28.95 | | | | | | | 2.90 | |
2010 | | | 29,000 | | | | 25,000 | | | | 80,423 | | — | | | | — | | | | — | | | | — | | | | — | | | | | | | — | |
2009(f) | | | 31,000 | | | | 25,000 | | | | 72,332 | | — | | | | — | | | | — | | | | — | | | | — | | | | | | | — | |
Year Ended 7/31: | | | | | | | | | | | | | | | | | | | | | | | | | | | | | | | | | | | | | |
2008 | | | 31,000 | | | | 25,000 | | | | 73,770 | | — | | | | — | | | | — | | | | — | | | | — | | | | | | | — | |
2007 | | | 31,000 | | | | 25,000 | | | | 75,898 | | — | | | | — | | | | — | | | | — | | | | — | | | | | | | — | |
2006 | | | 31,000 | | | | 25,000 | | | | 76,400 | | — | | | | — | | | | — | | | | — | | | | — | | | | | | | — | |
76 Nuveen Investments
| | | | | | | | | | | | | | | | | | | | | | | | | | | | | |
| | | | | | | | | | | | | | | | Ratios/Supplemental Data | | | | | | | | | | |
| | | | | | | | | | Ratios to Average Net Assets | | | Ratios to Average Net Assets | | | | |
| | | | | | | | | | Applicable to Common Shares | | | Applicable to Common Shares | | | | |
| Total Returns | | | | | | Before Reimbursement(c) | | | | | | After Reimbursement(c)(d) | | | | |
| | | | Based | | | Ending | | | | | | | | | | | | | | | | | | | | | | |
| | | | on | | | Net | | | | | | | | | | | | | | | | | | | | | | |
| Based | | | Common | | | Assets | | | | | | | | | | | | | | | | | | | | | | |
| on | | | Share Net | | | Applicable | | | Expenses | | | Expenses | | | Net | | | Expenses | | | Expenses | | | Net | | | Portfolio | |
| Market | | | Asset | | | to Common | | | Including | | | Excluding | | | Investment | | | Including | | | Excluding | | | Investment | | | Turnover | |
| Value(b) | | | | Value(b) | | Shares (000) | | | Interest(e) | | | Interest | | | Income | | | Interest(e) | | | Interest | | | Income | | | Rate | |
| | .91 | % | | | 1.09 | % | | $ | 150,555 | | | | 1.14 | % | | | 1.14 | % | | | 6.32 | % | | | N/A | | | | N/A | | | | N/A | | | | 14 | % |
| | 27.57 | | | | 16.76 | | | | 157,439 | | | | 1.20 | | | | 1.20 | | | | 6.51 | | | | N/A | | | | N/A | | | | N/A | | | | 6 | |
| | (0.71 | ) | | | (0.49 | ) | | | 141,883 | | | | 1.35 | * | | | 1.31 | * | | | 6.77 | * | | | N/A | | | | N/A | | | | N/A | | | | 10 | |
| | (2.18 | ) | | | (.26 | ) | | | 146,617 | | | | 1.42 | | | | 1.26 | | | | 6.08 | | | | N/A | | | | N/A | | | | N/A | | | | 14 | |
| | (4.25 | ) | | | 3.56 | | | | 154,052 | | | | 1.29 | | | | 1.19 | | | | 5.94 | | | | N/A | | | | N/A | | | | N/A | | | | 15 | |
| | (1.36 | ) | | | 2.10 | | | | 156,026 | | | | 1.20 | | | | 1.20 | | | | 6.05 | | | | N/A | | | | N/A | | | | N/A | | | | 9 | |
| | (2.52 | ) | | | (.23 | ) | | | 60,550 | | | | 1.41 | | | | 1.22 | | | | 6.18 | | | | 1.33 | % | | | 1.13 | % | | | 6.26 | % | | | 14 | |
| | 26.70 | | | | 15.46 | | | | 64,290 | | | | 1.21 | | | | 1.21 | | | | 6.47 | | | | 1.06 | | | | 1.06 | | | | 6.62 | | | | 7 | |
| | (2.08 | ) | | | (0.15 | ) | | | 58,692 | | | | 1.35 | * | | | 1.31 | * | | | 6.64 | * | | | 1.12 | * | | | 1.09 | * | | | 6.87 | * | | | 10 | |
| | (6.21 | ) | | | .83 | | | | 60,475 | | | | 1.39 | | | | 1.24 | | | | 6.06 | | | | 1.12 | | | | .97 | | | | 6.33 | | | | 17 | |
| | .52 | | | | 4.02 | | | | 63,114 | | | | 1.32 | | | | 1.22 | | | | 5.85 | | | | .97 | | | | .87 | | | | 6.20 | | | | 14 | |
| | (6.53 | ) | | | 2.32 | | | | 63,735 | | | | 1.21 | | | | 1.21 | | | | 5.85 | | | | .79 | | | | .79 | | | | 6.27 | | | | 6 | |
(a) The amounts shown are based on Common share equivalents.
(b) Total Return Based on Market Value is the combination of changes in the market price per share and the effect of reinvested dividend income and reinvested capital gains distributions, if any, at the average price paid per share at the time of reinvestment. The last dividend declared in the period, which is typically paid on the first business day of the following month, is assumed to be reinvested at the ending market price. The actual reinvestment for the last dividend declared in the period may take place over several days, and in some instances may not be based on the market price, so the actual reinvestment price may be different from the price used in the calculation.
Total returns are not annualized.
Total Return Based on Common Share Net Asset Value is the combination of changes in Common share net asset value, reinvested dividend income at net asset value and reinvested capital gains distributions at net asset value, if any. The last dividend declared in the period, which is typically paid on the first business day of the following month, is assumed to be reinvested at the ending net asset value. The actual reinvest price for the last dividend declared in the period may often be based on the Fund’s market price (and not its net asset value), and therefore may be different from the price used in the calculation. Total returns are not annualized.
(c) Ratios do not reflect the effect of dividend payments to Auction Rate Preferred shareholders; Net Investment Income ratios reflect income earned and expenses incurred on assets attributable to Auction Rate Preferred shares and/or MuniFund Term Preferred shares, where applicable.
(d) After expense reimbursement from the Adviser, where applicable. Ratios do not reflect the effect of custodian fee credits earned on the Fund’s net cash on deposit with the custodian bank, where applicable.
(e) The expense ratios reflect, among other things, payments to MuniFund Term Preferred shareholders and/or the interest expense deemed to have been paid by the Fund on the floating rate certificates issued by the special purpose trusts for the self-deposited inverse floaters held by the Fund, where applicable, each as described in Footnote 1 – General Information and Significant Accounting Policies, MuniFund Term Preferred Shares and Inverse Floating Rate Securities, respectively.
(f) For the seven months ended February 28, 2009.
* Annualized.
** Rounds to less than $.01 per share.
^ For the period November 22, 2010 (first issuance date of shares) through February 28, 2011.
N/A Fund does not have a contractual reimbursement agreement with the Adviser.
See accompanying notes to financial statements.
Nuveen Investments 77
Financial
Highlights (continued)
Selected data for a Common share outstanding throughout each period:
| | | | | | | | | | | | | | | | | | | | | | | | | | | | | | | | | | | | | |
| | | | | | | | | Investment Operations | | | | | | Less Distributions | | | | | | | | | | | | | |
| | | | | | | | | | | | Distributions | | | Distributions | | | | | | | | | | | | | | | Discount | | | | | | | |
| | | | | | | | | | | | from Net | | | from | | | | | | Net | | | | | | | | | from | | | Ending | | | | |
| | | Beginning | | | | | | Net | | | Investment | | | Capital | | | | | | Investment | | | Capital | | | | | | Common | | | | | | | |
| | | Common | | | | | | | | | Income to | | | Gains to | | | | | | Income to | | | Gains to | | | | | | Shares | | | | | | | |
| | | Share | | | Net | | | Unrealized | | | Preferred | | | Preferred | | | | | | Common | | | Common | | | | | | Repurchased | | | Net | | | Ending | |
| | Net Asset | | | Investment | | | Gain | | | Share- | | | Share- | | | | | | Share- | | | Share- | | | | | | and | | | Asset | | | Market | |
| | | Value | | | Income | | | (Loss) | | | holders(a) | | | holders(a) | | | Total | | | holders | | | holders | | | Total | | | Retired | | | Value | | | Value | |
Ohio Dividend Advantage 2 (NBJ) | | | | | | | | | | | | | | | | | | | | | | | | | | | | | | | | | | | | |
Year Ended 2/28: | | | | | | | | | | | | | | | | | | | | | | | | | | | | | | | | | | | | |
2011 | | $ | 14.74 | | | $ | .94 | | | $ | (.75 | ) | | $ | (.03 | ) | | $ | — | | | $ | .16 | | | $ | (.84 | ) | | $ | — | | | $ | (.84 | ) | | $ | — | | | $ | 14.06 | | | $ | 13.01 | |
2010 | | | 13.06 | | | | .93 | | | | 1.53 | | | | (.04 | ) | | | — | | | | 2.42 | | | | (.74 | ) | | | — | | | | (.74 | ) | | | — | | | | 14.74 | | | | 13.85 | |
2009(f) | | | 13.87 | | | | .54 | | | | (.84 | ) | | | (.13 | ) | | | — | | | | (.43 | ) | | | (.38 | ) | | | — | | | | (.38 | ) | | | — | | | | 13.06 | | | | 11.58 | |
Year Ended 7/31: | | | | | | | | | | | | | | | | | | | | | | | | | | | | | | | | | | | | | | | | | | | | | | | | |
2008 | | | 14.64 | | | | .93 | | | | (.73 | ) | | | (.25 | ) | | | (.02 | ) | | | (.07 | ) | | | (.64 | ) | | | (.06 | ) | | | (.70 | ) | | | — | | | | 13.87 | | | | 12.37 | |
2007 | | | 14.81 | | | | .92 | | | | (.10 | ) | | | (.25 | ) | | | (.01 | ) | | | .56 | | | | (.69 | ) | | | (.04 | ) | | | (.73 | ) | | | — | | | | 14.64 | | | | 13.80 | |
2006 | | | 15.37 | | | | .93 | | | | (.41 | ) | | | (.22 | ) | | | (.01 | ) | | | .29 | | | | (.80 | ) | | | (.05 | ) | | | (.85 | ) | | | — | | | | 14.81 | | | | 14.70 | |
Ohio Dividend Advantage 3 (NVJ) | | | | | | | | | | | | | | | | | | | | | | | | | | | | | | | | | | | | | | | | | | | | | | | | |
Year Ended 2/28: | | | | | | | | | | | | | | | | | | | | | | | | | | | | | | | | | | | | | | | | | | | | | | | | |
2011 | | | 15.33 | | | | 1.01 | | | | (1.06 | ) | | | (.03 | ) | | | — | | | | (.08 | ) | | | (.90 | ) | | | — | | | | (.90 | ) | | | — | | | | 14.35 | | | | 13.72 | |
2010 | | | 13.97 | | | | 1.00 | | | | 1.19 | | | | (.04 | ) | | | — | | | | 2.15 | | | | (.79 | ) | | | — | | | | (.79 | ) | | | — | ** | | | 15.33 | | | | 15.20 | |
2009(f) | | | 14.33 | | | | .55 | | | | (.39 | ) | | | (.12 | ) | | | — | | | | .04 | | | | (.40 | ) | | | — | | | | (.40 | ) | | | — | | | | 13.97 | | | | 11.95 | |
Year Ended 7/31: | | | | | | | | | | | | | | | | | | | | | | | | | | | | | | | | | | | | | | | | | | | | | | | | |
2008 | | | 14.92 | | | | .95 | | | | (.56 | ) | | | (.23 | ) | | | (.02 | ) | | | .14 | | | | (.67 | ) | | | (.06 | ) | | | (.73 | ) | | | — | | | | 14.33 | | | | 12.91 | |
2007 | | | 15.06 | | | | .96 | | | | (.08 | ) | | | (.25 | ) | | | (.01 | ) | | | .62 | | | | (.72 | ) | | | (.04 | ) | | | (.76 | ) | | | — | | | | 14.92 | | | | 14.35 | |
2006 | | | 15.57 | | | | .95 | | | | (.45 | ) | | | (.22 | ) | | | — | | | | .28 | | | | (.79 | ) | | | — | | | | (.79 | ) | | | — | | | | 15.06 | | | | 14.75 | |
| | Auction Rate Preferred Shares | | | | | | | | | |
| | | at End of Period | | | | | | | | | | |
| | Aggregate | | | | | | | | | | | | |
| | Amount | | | Asset | | | | | | | | | |
| | Outstanding | Liquidation | | Coverage | | | | | | | | | |
| | (000) | Per Share | | Per Share | | | | | | | | | |
Ohio Dividend Advantage 2 (NBJ) | | | | | | | | | | | | |
Year Ended 2/28: | | | | | | | | | | | | | |
2011 | $21,600 | $25,000 | | $75,821 | | | | | | | | | |
2010 | 21,600 | 25,000 | | 78,241 | | | | | | | | | |
2009(f) | 23,100 | 25,000 | | 69,107 | | | | | | | | | |
Year Ended 7/31: | | | | | | | | | | | | | |
2008 | 24,000 | 25,000 | | 70,090 | | | | | | | | | |
2007 | 24,000 | 25,000 | | 72,598 | | | | | | | | | |
2006 | 24,000 | 25,000 | | 73,169 | | | | | | | | | |
Ohio Dividend Advantage 3 (NVJ) | | | | | | | | | | | | |
Year Ended 2/28: | | | | | | | | | | | | | |
2011 | 15,500 | 25,000 | | 74,948 | | | | | | | | | |
2010 | 15,500 | 25,000 | | 78,325 | | | | | | | | | |
2009(f) | 16,500 | 25,000 | | 70,647 | | | | | | | | | |
Year Ended 7/31: | | | | | | | | | | | | | |
2008 | 16,500 | 25,000 | | 71,881 | | | | | | | | | |
2007 | 16,500 | 25,000 | | 73,778 | | | | | | | | | |
2006 | 16,500 | 25,000 | | 74,252 | | | | | | | | | |
78 Nuveen Investments
| | | | | | | | | | | | | | | | | | | | | | | | | | | | | |
| | | | | | | | | | | | | | | | Ratios/Supplemental Data | | | | | | | | | | |
| | | | | | | | | | Ratios to Average Net Assets | | | Ratios to Average Net Assets | | | | |
| | | | | | | | | | Applicable to Common Shares | | | Applicable to Common Shares | | | | |
| Total Returns | | | | | | Before Reimbursement(c) | | | After Reimbursement(c)(d) | | | | |
| | | | Based | | | Ending | | | | | | | | | | | | | | | | | | | | | | |
| | | | on | | | Net | | | | | | | | | | | | | | | | | | | | | | |
| Based | | | Common | | | Assets | | | | | | | | | | | | | | | | | | | | | | |
| on | | | Share Net | | | Applicable | | | Expenses | | | Expenses | | | Net | | | Expenses | | | Expenses | | | Net | | | Portfolio | |
| Market | | | Asset | | | to Common | | | Including | | | Excluding | | | Investment | | | Including | | | Excluding | | | Investment | | | Turnover | |
| Value(b) | | | | Value(b) | | Shares (000) | | | Interest(e) | | | Interest | | | Income | | | Interest(e) | | | Interest | | | Income | | | Rate | |
| | (.37 | )% | | | 1.00 | % | | $ | 43,909 | | | | 1.22 | % | | | 1.22 | % | | | 6.31 | % | | | 1.10 | % | | | 1.10 | % | | | 6.43 | % | | | 9 | % |
| | 26.62 | | | | 18.91 | | | | 46,000 | | | | 1.27 | | | | 1.27 | | | | 6.49 | | | | 1.07 | | | | 1.07 | | | | 6.69 | | | | 8 | |
| | (3.09 | ) | | | (3.01 | ) | | | 40,755 | | | | 1.46 | * | | | 1.42 | * | | | 6.91 | * | | | 1.20 | * | | | 1.16 | * | | | 7.17 | * | | | 5 | |
| | (5.46 | ) | | | (.51 | ) | | | 43,286 | | | | 1.46 | | | | 1.30 | | | | 6.10 | | | | 1.14 | | | | .98 | | | | 6.41 | | | | 16 | |
| | (1.26 | ) | | | 3.80 | | | | 45,694 | | | | 1.41 | | | | 1.31 | | | | 5.76 | | | | 1.02 | | | | .92 | | | | 6.15 | | | | 14 | |
| | .35 | | | | 1.96 | | | | 46,242 | | | | 1.27 | | | | 1.27 | | | | 5.71 | | | | .81 | | | | .81 | | | | 6.16 | | | | 8 | |
| | (4.13 | ) | | | (.66 | ) | | | 30,968 | | | | 1.26 | | | | 1.26 | | | | 6.53 | | | | 1.10 | | | | 1.10 | | | | 6.69 | | | | 12 | |
| | 34.62 | | | | 15.73 | | | | 33,062 | | | | 1.30 | | | | 1.30 | | | | 6.56 | | | | 1.07 | | | | 1.07 | | | | 6.80 | | | | 14 | |
| | (4.29 | ) | | | .36 | | | | 30,127 | | | | 1.46 | * | | | 1.42 | * | | | 6.63 | * | | | 1.15 | * | | | 1.12 | * | | | 6.93 | * | | | 9 | |
| | (5.13 | ) | | | .95 | | | | 30,941 | | | | 1.47 | | | | 1.32 | | | | 6.05 | | | | 1.12 | | | | .97 | | | | 6.41 | | | | 19 | |
| | 2.32 | | | | 4.06 | | | | 32,194 | | | | 1.41 | | | | 1.31 | | | | 5.85 | | | | .99 | | | | .89 | | | | 6.27 | | | | 19 | |
| | (2.33 | ) | | | 1.87 | | | | 32,506 | | | | 1.28 | | | | 1.28 | | | | 5.76 | | | | .83 | | | | .83 | | | | 6.21 | | | | 2 | |
| (a) | The amounts shown are based on Common share equivalents. |
| (b) | Total Return Based on Market Value is the combination of changes in the market price per share and the effect of reinvested dividend income and reinvested capital gains distributions, if any, at the average price paid per share at the time of reinvestment. The last dividend declared in the period, which is typically paid on the first business day of the following month, is assumed to be reinvested at the ending market price. The actual reinvestment for the last dividend declared in the period may take place over several days, and in some instances may not be based on the market price, so the actual reinvestment price may be different from the price used in the calculation. |
| | Total returns are not annualized. |
| | Total Return Based on Common Share Net Asset Value is the combination of changes in Common share net asset value, reinvested dividend income at net asset value and reinvested capital gains distributions at net asset value, if any. The last dividend declared in the period, which is typically paid on the first business day of the following month, is assumed to be reinvested at the ending net asset value. The actual reinvest price for the last dividend declared in the period may often be based on the Fund’s market price (and not its net asset value), and therefore may be different from the price used in the calculation. Total returns are not annualized. |
| (c) | Ratios do not reflect the effect of dividend payments to Auction Rate Preferred shareholders; Net Investment Income ratios reflect income earned and expenses incurred on assets attributable to Auction Rate Preferred shares. |
| (d) | After expense reimbursement from the Adviser, where applicable. Ratios do not reflect the effect of custodian fee credits earned on the Fund’s net cash on deposit with the custodian bank, where applicable. |
| (e) | The expense ratios reflect, among other things, the interest expense deemed to have been paid by the Fund on the floating rate certificates issued by the special purpose trusts for the self-deposited inverse floaters held by the Fund, where applicable, as described in Footnote 1 – General Information and Significant Accounting Policies, Inverse Floating Rate Securities. |
| (f) | For the seven months ended February 28, 2009. |
| * | Annualized. |
| ** | Rounds to less than $.01 per share. |
See accompanying notes to financial statements.
Nuveen Investments 79
Notes to
Financial Statements
1. General Information and Significant Accounting Policies
General Information
The funds covered in this report and their corresponding Common share stock exchange symbols are Nuveen Michigan Quality Income Municipal Fund, Inc. (NUM), Nuveen Michigan Premium Income Municipal Fund, Inc. (NMP), Nuveen Michigan Dividend Advantage Municipal Fund (NZW), Nuveen Ohio Quality Income Municipal Fund, Inc. (NUO), Nuveen Ohio Dividend Advantage Municipal Fund (NXI), Nuveen Ohio Dividend Advantage Municipal Fund 2 (NBJ) and Nuveen Ohio Dividend Advantage Municipal Fund 3 (NVJ) (collectively, the “Funds”). Common shares of Michigan Quality Income (NUM), Michigan Premium Income (NMP), and Ohio Quality Income (NUO) are traded on the New York Stock Exchange (“NYSE”) while Common shares of Michigan Dividend Advantage (NZW), Ohio Dividend Advantage (NXI), Ohio Dividend Advantage 2 (NBJ) and Ohio Dividend Advantage 3 (NVJ) are traded on the NYSE Amex. The Funds are registered under the Investment Company Act of 1940, as amended, as closed-end management investment companies.
Each Fund seeks to provide current income exempt from both regular federal and designated state income taxes by investing primarily in a portfolio of municipal obligations issued by state and local government authorities within a single state or certain U.S. territories.
Effective January 1, 2011, the Funds’ adviser, Nuveen Asset Management, a wholly-owned subsidiary of Nuveen Investments, Inc. (“Nuveen”), changed its name to Nuveen Fund Advisors, Inc. (the “Adviser”). Concurrently, the Adviser formed a wholly-owned subsidiary, Nuveen Asset Management LLC (the “Sub-Adviser”), to house its portfolio management capabilities and to serve as the Funds’ sub-adviser, and the Funds’ portfolio managers became employees of the Sub-Adviser. This allocation of responsibilities between the Adviser and the Sub-Adviser affects each of the Funds. The Adviser will compensate the Sub-Adviser for the portfolio management services it provides to the Funds from the Funds’ management fee.
Significant Accounting Policies
The following is a summary of significant accounting policies followed by the Funds in the preparation of their financial statements in accordance with U.S. generally accepted accounting principles (“U.S. GAAP”).
Investment Valuation
Prices of municipal bonds are provided by a pricing service approved by the Funds’ Board of Directors/Trustees. These securities are generally classified as Level 2 for fair value measurement purposes. When price quotes are not readily available (which is usually the case for municipal bonds) the pricing service establishes a security’s fair value using methods that may include consideration of the following: yields or prices of investments of comparable quality, type of issue, coupon, maturity and rating, market quotes or indications of value from security dealers, evaluations of anticipated cash flows or collateral, general market conditions and other information and analysis, including the obligor’s credit characteristics considered relevant. In pricing certain securities, particularly less liquid and lower quality securities, the pricing service may consider information about a security, its issuer, or market activity, provided by the Adviser. These securities are generally classified as Level 2 or Level 3 depending on the priority of the significant inputs.
Temporary investments in securities that have variable rate and demand features qualifying them as short-term investments are valued at amortized cost, which approximates market value. These securities are generally classified as Level 2.
Certain securities may not be able to be priced by the pre-established pricing methods as described above. Such securities may be valued by the Funds’ Board of Directors/Trustees or its designee at fair value. These securities generally include, but are not limited to, restricted securities (securities which may not be publicly sold without registration under the Securities Act of 1933, as amended) for which a pricing service is unable to provide a market price; securities whose trading has been formally suspended; debt securities that have gone into default and for which there is no current market quotation; a security whose market price is not available from a pre-established pricing source; a security with respect to which an event has occurred that is likely to materially affect the value of the security after the market has closed but before the calculation of a Fund’s net asset value (as may be the case in non-U.S. markets on which the security is primarily traded) or make it difficult or impossible to obtain a reliable market quotation; and a security whose price, as provided by the pricing service, is not deemed to reflect the security’s fair value. As a general principle, the fair value of an issue of securities would appear to be the amount that the owner might reasonably expect to receive for them in a current sale. A variety of factors may be considered in determining the fair value of these securities, which may include consideration of the following: yields or prices of investments of comparable quality, type of issue, coupon, maturity and rating, market quotes or indications of value from security dealers, evaluations of anticipated cash flows or collateral, general market conditions and other information and analysis, including the obligor’s credit characteristics considered relevant.
80 Nuveen Investments
These securities are generally classified as Level 2 or Level 3 depending on the priority of the significant inputs. Regardless of the method employed to value a particular security, all valuations are subject to review by the Funds’ Board of Directors/Trustees or its designee.
Refer to Footnote 2 – Fair Value Measurements for further details on the leveling of securities held by the Funds as of the end of the reporting period.
Investment Transactions
Investment transactions are recorded on a trade date basis. Realized gains and losses from transactions are determined on the specific identification method, which is the same basis used for federal income tax purposes. Investments purchased on a when-issued/delayed delivery basis may have extended settlement periods. Any investments so purchased are subject to market fluctuation during this period. The Funds have instructed the custodian to segregate assets with a current value at least equal to the amount of the when-issued/delayed delivery purchase commitments. At February 28, 2011, Michigan Quality Income (NUM), Michigan Premium Income (NMP) and Michigan Dividend Advantage (NZW) had outstanding when-issued/delayed delivery purchase commitments of $2,132,876, $839,820 and $324,375, respectively. There were no such outstanding purchase commitments in any of the other Funds.
Investment Income
Interest income, which reflects the amortization of premiums and includes accretion of discounts for financial reporting purposes, is recorded on an accrual basis. Investment income also includes paydown gains and losses, if any.
Income Taxes
Each Fund is a separate taxpayer for federal income tax purposes. Each Fund intends to distribute substantially all of its net investment income and net capital gains to shareholders and to otherwise comply with the requirements of Subchapter M of the Internal Revenue Code applicable to regulated investment companies. Therefore, no federal income tax provision is required. Furthermore, each Fund intends to satisfy conditions that will enable interest from municipal securities, which is exempt from regular federal and designated state income taxes, to retain such tax-exempt status when distributed to shareholders of the Funds. Net realized capital gains and ordinary income distributions paid by the Funds are subject to federal taxation.
For all open tax years and all major taxing jurisdictions, management of the Funds has concluded that there are no significant uncertain tax positions that would require recognition in the financial statements. Open tax years are those that are open for examination by taxing authorities (i.e., generally the last four tax year ends and the interim tax period since then). Furthermore, management of the Funds is also not aware of any tax positions for which it is reasonably possible that the total amounts of unrecognized tax benefits will significantly change in the next twelve months.
Dividends and Distributions to Common Shareholders
Dividends from net investment income are declared monthly. Net realized capital gains and/or market discount from investment transactions, if any, are distributed to shareholders at least annually. Furthermore, capital gains are distributed only to the extent they exceed available capital loss carryforwards.
Distributions to Common shareholders of net investment income, net realized capital gains and/or market discount, if any, are recorded on the ex-dividend date. The amount and timing of distributions are determined in accordance with federal income tax regulations, which may differ from U.S. GAAP.
Auction Rate Preferred Shares
Each Fund is authorized to issue Auction Rate Preferred Shares (“ARPS”). The following Funds have issued and outstanding ARPS, $25,000 stated value per share, which approximates market value, as a means of effecting financial leverage. Each Fund’s ARPS are issued in one or more Series. The dividend rate paid by the Funds on each Series is determined every seven days, pursuant to a dutch auction process overseen by the auction agent, and is payable at the end of each rate period. As of February 28, 2011, the number of ARPS outstanding for each Fund is as follows:
| | | |
| | Michigan | Michigan |
| | Quality | Premium |
| | Income | Income |
| | (NUM) | (NMP) |
Number of shares: | | |
Series M | — | 805 |
Series W | — | — |
Series TH | 2,972 | 1,343 |
Series F | 521 | — |
Total | 3,493 | 2,148 |
Nuveen Investments 81
Notes to
Financial Statements (continued)
| | | | | |
| | Ohio | Ohio | Ohio | Ohio |
| | Quality | Dividend | Dividend | Dividend |
| | Income | Advantage | Advantage 2 | Advantage 3 |
| | (NUO) | (NXI) | (NBJ) | (NVJ) |
Number of shares: | | | | |
Series M | 645 | — | — | — |
Series T | — | — | — | 620 |
Series W | — | 500 | — | — |
Series TH | 1,327 | — | — | — |
Series TH2 | 948 | — | — | — |
Series F | — | — | 864 | — |
Total | 2,920 | 500 | 864 | 620 |
Beginning in February 2008, more shares for sale were submitted in the regularly scheduled auctions for the ARPS issued by the Funds than there were offers to buy. This meant that these auctions “failed to clear,’’ and that many ARPS shareholders who wanted to sell their shares in these auctions were unable to do so. ARPS shareholders unable to sell their shares received distributions at the “maximum rate’’ applicable to failed auctions as calculated in accordance with the pre-established terms of the ARPS. As of February 28, 2011, the aggregate amount of outstanding ARPS redeemed by each Fund is as follows:
| | | | | |
| | | Michigan | Michigan | Michigan |
| | | Quality | Premium | Dividend |
| | | Income | Income | Advantage |
| | | (NUM) | (NMP) | (NZW) |
ARPS redeemed, at liquidation value | | $6,675,000 | $2,300,000 | $16,000,000 |
| | Ohio | Ohio | Ohio | Ohio |
| | Quality | Dividend | Dividend | Dividend |
| | Income | Advantage | Advantage 2 | Advantage 3 |
| | (NUO) | (NXI) | (NBJ) | (NVJ) |
ARPS redeemed, at liquidation value | $4,000,000 | $18,500,000 | $2,400,000 | $1,000,000 |
MuniFund Term Preferred Shares
The following Funds have issued and outstanding MuniFund Term Preferred (“MTP”) Shares, with a $10 stated value per share. Proceeds from the issuance of MTP Shares, net of offering expenses, were used to redeem all or a portion of each Fund’s outstanding ARPS. Each Fund’s MTP Shares are issued in one Series. Dividends, which are recognized as interest expense for financial reporting purposes, are paid monthly at a fixed annual rate, subject to adjustments in certain circumstances. The MTP Shares trade on the NYSE. As of February 28, 2011, the number of MTP Shares outstanding, fixed annual rate and NYSE “ticker” symbol for each Fund are as follows:
| | | | | | | | |
| | Michigan Dividend Advantage (NZW) | | Ohio Dividend Advantage (NXI) |
| | Shares | Annual | NYSE | | Shares | Annual | NYSE |
| | Outstanding | Interest Rate | Ticker | | Outstanding | Interest Rate | Ticker |
Series 2015 | 1,631,300 | 2.30% | NZW Pr C | | 1,945,000 | 2.35% | NXI Pr C |
Each Fund is obligated to redeem its MTP Shares by the date as specified in its offering document (“Term Redemption Date”), unless earlier redeemed or repurchased by the Fund. MTP Shares are subject to optional and mandatory redemption in certain circumstances. MTP Shares will be subject to redemption at the option of each Fund (“Optional Redemption Date”), subject to a payment of premium for one year following the Optional Redemption Date (“Premium Expiration Date”), and at par thereafter. MTP Shares also will be subject to redemption, at the option of each Fund, at par in the event of certain changes in the credit rating of the MTP Shares. Each Fund may be obligated to redeem certain of the MTP Shares if the Fund fails to maintain certain asset coverage and leverage ratio requirements and such failures are not cured by the applicable cure date. The
82 Nuveen Investments
redemption price per share is equal to the sum of the liquidation value per share plus any accumulated but unpaid dividends. The Term Redemption Date, Optional Redemption Date and Premium Expiration Date for each Fund’s MTP Shares are as follows:
| | | | |
| | Michigan | | Ohio |
| | Dividend | | Dividend |
| | Advantage | | Advantage |
| | (NZW) | | (NXI) |
| | Series 2015 | | Series 2015 |
Term Redemption Date | December 1, 2015 | December 1, 2015 |
Optional Redemption Date | December 1, 2011 | December 1, 2011 |
Premium Expiration Date | November 30, 2012 | November 30, 2012 |
The average liquidation value of MTP Shares outstanding for each Fund during the fiscal year ended February 28, 2011, was as follows: | |
| | Michigan | Ohio |
| | Dividend | Dividend |
| | Advantage | Advantage |
| | (NZW)* | (NXI)** |
Average liquidation value of MTP Shares outstanding | $16,257,038 | $19,201,010 |
| * | For the period November 15, 2010 (first issuance date of shares) through February 28, 2011. |
| ** | For the period November 22, 2010 (first issuance date of shares) through February 28, 2011. |
For financial reporting purposes only, the liquidation value of MTP Shares is recorded as a liability on the Statement of Assets and Liabilities. Unpaid dividends on MTP Shares are recognized as a component of “Interest payable” on the Statement of Assets and Liabilities. Dividends paid on MTP Shares are recognized as a component of “Interest expense and amortization of offering costs” on the Statement of Operations.
Net amounts earned by Nuveen as underwriter of each Fund’s MTP Share offering were recorded as reductions of offering costs recognized by the Funds. For the fiscal year ended February 28, 2011, there were no amounts earned by Nuveen.
Inverse Floating Rate Securities
Each Fund is authorized to invest in inverse floating rate securities. An inverse floating rate security is created by depositing a municipal bond, typically with a fixed interest rate, into a special purpose trust created by a broker-dealer. In turn, this trust (a) issues floating rate certificates, in face amounts equal to some fraction of the deposited bond’s par amount or market value, that typically pay short-term tax-exempt interest rates to third parties, and (b) issues to a long-term investor (such as one of the Funds) an inverse floating rate certificate (sometimes referred to as an “inverse floater”) that represents all remaining or residual interest in the trust. The income received by the inverse floater holder varies inversely with the short-term rate paid to the floating rate certificates’ holders, and in most circumstances the inverse floater holder bears substantially all of the underlying bond’s downside investment risk and also benefits disproportionately from any potential appreciation of the underlying bond’s value. The price of an inverse floating rate security will be more volatile than that of the underlying bond because the interest rate is dependent on not only the fixed coupon rate of the underlying bond but also on the short-term interest paid on the floating rate certificates, and because the inverse floating rate security essentially bears the risk of loss of the greater face value of the underlying bond.
A Fund may purchase an inverse floating rate security in a secondary market transaction without first owning the underlying bond (referred to as an “externally-deposited inverse floater”), or instead by first selling a fixed-rate bond to a broker-dealer for deposit into the special purpose trust and receiving in turn the residual interest in the trust (referred to as a “self-deposited inverse floater”). The inverse floater held by a Fund gives the Fund the right (a) to cause the holders of the floating rate certificates to tender their notes at par, and (b) to have the broker transfer the fixed-rate bond held by the trust to the Fund, thereby collapsing the trust. An investment in an externally-deposited inverse floater is identified in the Portfolio of Investments as “(IF) – Inverse floating rate investment.” An investment in a self-deposited inverse floater is accounted for as a financing transaction. In such instances, a fixed-rate bond deposited into a special purpose trust is identified in the Portfolio of Investments as “(UB) – Underlying bond of an inverse floating rate trust reflected as a financing transaction,” with the Fund accounting for the short-term floating rate certificates issued by the trust as “Floating rate obligations” on the Statement of Assets and Liabilities. In addition, the Fund reflects in “Investment Income” the entire earnings of the underlying bond and related interest paid to the holders of the short-term floating rate certificates as a component of “Interest expense and amortization of offering costs” on the Statement of Operations.
During the fiscal year ended February 28, 2011, each Fund invested in externally-deposited inverse floaters and/or self-deposited inverse floaters.
Each Fund may also enter into shortfall and forbearance agreements (sometimes referred to as a “recourse trust” or “credit recovery swap”) (such agreements referred to herein as “Recourse Trusts”) with a broker-dealer by which a Fund agrees to reimburse the broker-dealer, in certain circumstances, for the difference between the liquidation value of the fixed-rate bond held by the trust and the liquidation value of the floating rate certificates issued by the trust plus any shortfalls in interest cash flows. Under these agreements, a Fund’s potential exposure to losses related to or on inverse floaters may increase beyond the value of a Fund’s inverse floater investments as a Fund may potentially be liable to fulfill all amounts owed to holders of the floating rate certificates. At period end, any such shortfall is recognized as “Unrealized depreciation on Recourse Trusts” on the Statement of Assets and Liabilities.
Nuveen Investments 83
| | | | | | | | |
Notes to | | | | | | | |
Financial Statements (continued) | | | | | |
| | | | | | |
At February 28, 2011, the Funds were not invested in externally-deposited Recourse Trusts. | | | | |
| | Michigan | Michigan | Michigan | Ohio | Ohio | Ohio | Ohio |
| | Quality | Premium | Dividend | Quality | Dividend | Dividend | Dividend |
| | Income | Income | Advantage | Income | Advantage | Advantage 2 | Advantage 3 |
| | (NUM) | (NMP) | (NZW) | (NUO) | (NXI) | (NBJ) | (NVJ) |
Maximum exposure to Recourse Trusts | $ — | $ — | $ — | $ — | $ — | $ — | $ — |
The average floating rate obligations outstanding and average annual interest rate and fees related to self-deposited inverse floaters during the fiscal year ended February 28, 2011, were as follows:
| | | | |
| | Michigan | Michigan | Michigan |
| | Quality | Premium | Dividend |
| | Income | Income | Advantage |
| | (NUM) | (NMP) | (NZW) |
Average floating rate obligations outstanding | $3,630,000 | $2,330,000 | $665,000 |
Average annual interest rate and fees | 1.00% | 1.00% | 1.00% |
Derivative Financial Instruments
Each Fund is authorized to invest in futures, options, swaps and other derivative instruments. Although the Funds are authorized to invest in such financial instruments, and may do so in the future, they did not make any such investments during the fiscal year ended February 28, 2011.
Market and Counterparty Credit Risk
In the normal course of business each Fund may invest in financial instruments and enter into financial transactions where risk of potential loss exists due to changes in the market (market risk) or failure of the other party to the transaction to perform (counterparty credit risk). The potential loss could exceed the value of the financial assets recorded on the financial statements. Financial assets, which potentially expose each Fund to counterparty credit risk, consist principally of cash due from counterparties on forward, option and swap transactions, when applicable. The extent of each Fund’s exposure to counterparty credit risk in respect to these financial assets approximates their carrying value as recorded on the Statement of Assets and Liabilities. Futures contracts, when applicable, expose a Fund to minimal counterparty credit risk as they are exchange traded and the exchange’s clearinghouse, which is counterparty to all exchange traded futures, guarantees the futures contracts against default.
Each Fund helps manage counterparty credit risk by entering into agreements only with counterparties the Adviser believes have the financial resources to honor their obligations and by having the Adviser monitor the financial stability of the counterparties. Additionally, counterparties may be required to pledge collateral daily (based on the daily valuation of the financial asset) on behalf of each Fund with a value approximately equal to the amount of any unrealized gain above a pre-determined threshold. Reciprocally, when each Fund has an unrealized loss, the Funds have instructed the custodian to pledge assets of the Funds as collateral with a value approximately equal to the amount of the unrealized loss above a pre-determined threshold. Collateral pledges are monitored and subsequently adjusted if and when the valuations fluctuate, either up or down, by at least the predetermined threshold amount.
Zero Coupon Securities
Each Fund is authorized to invest in zero coupon securities. A zero coupon security does not pay a regular interest coupon to its holders during the life of the security. Tax-exempt income to the holder of the security comes from accretion of the difference between the original purchase price of the security at issuance and the par value of the security at maturity and is effectively paid at maturity. The market prices of zero coupon securities generally are more volatile than the market prices of securities that pay interest periodically.
Offering Costs
Costs incurred by the Funds in connection with their offerings of MTP Shares were recorded as a deferred charge, which will be amortized over the life of the shares. Each Fund’s amortized deferred charges are recognized as a component of “Interest expense and amortization of offering costs” on the Statement of Operations. As of February 28, 2011, each Fund’s offering costs incurred were as follows:
| | | |
| | Michigan | Ohio |
| | Dividend | Dividend |
| | Advantage | Advantage |
| | (NZW) | (NXI) |
MTP Shares offering costs | $574,695 | $551,750 |
Custodian Fee Credit
Each Fund has an arrangement with the custodian bank whereby certain custodian fees and expenses are reduced by net credits earned on each Fund’s cash on deposit with the bank. Such deposit arrangements are an alternative to overnight investments. Credits for cash balances may be offset by charges for any days on which a Fund overdraws its account at the custodian bank.
84 Nuveen Investments
Indemnifications
Under the Funds’ organizational documents, their officers and directors/trustees are indemnified against certain liabilities arising out of the performance of their duties to the Funds. In addition, in the normal course of business, the Funds enter into contracts that provide general indemnifications to other parties. The Funds’ maximum exposure under these arrangements is unknown as this would involve future claims that may be made against the Funds that have not yet occurred. However, the Funds have not had prior claims or losses pursuant to these contracts and expect the risk of loss to be remote.
Use of Estimates
The preparation of financial statements in conformity with U.S. GAAP requires management to make estimates and assumptions that affect the reported amounts of assets and liabilities at the date of the financial statements and the reported amounts of increases and decreases in net assets applicable to Common shares from operations during the reporting period. Actual results may differ from those estimates.
2. Fair Value Measurements
Fair value is defined as the price that the Funds would receive upon selling an investment or transferring a liability in an orderly transaction to an independent buyer in the principal or most advantageous market of the investment. A three-tier hierarchy is used to maximize the use of observable market data and minimize the use of unobservable inputs and to establish classification of fair value measurements for disclosure purposes. Observable inputs reflect the assumptions market participants would use in pricing the asset or liability. Observable inputs are based on market data obtained from sources independent of the reporting entity. Unobservable inputs reflect the reporting entity’s own assumptions about the assumptions market participants would use in pricing the asset or liability. Unobservable inputs are based on the best information available in the circumstances. The three-tier hierarchy of inputs is summarized in the three broad levels listed below:
Level 1 – Quoted prices in active markets for identical securities.
Level 2 – Other significant observable inputs (including quoted prices for similar securities, interest rates, prepayment speeds, credit risk, etc.).
Level 3 – Significant unobservable inputs (including management’s assumptions in determining the fair value of investments).
The inputs or methodologies used for valuing securities are not an indication of the risk associated with investing in those securities. The following is a summary of each Fund’s fair value measurements as of February 28, 2011:
| | | | | | | | | | | | | |
Michigan Quality Income (NUM) | | Level 1 | | | Level 2 | | | Level 3 | | | Total | |
Investments: | | | | | | | | | | | | |
Municipal Bonds | | $ | — | | | $ | 252,805,857 | | | $ | — | | | $ | 252,805,857 | |
Michigan Premium Income (NMP) | | Level 1 | | | Level 2 | | | Level 3 | | | Total | |
Investments: | | | | | | | | | | | | | | | | |
Municipal Bonds | | $ | — | | | $ | 160,669,245 | | | $ | — | | | $ | 160,669,245 | |
Michigan Dividend Advantage (NZW) | | Level 1 | | | Level 2 | | | Level 3 | | | Total | |
Investments: | | | | | | | | | | | | | | | | |
Municipal Bonds | | $ | — | | | $ | 44,027,541 | | | $ | — | | | $ | 44,027,541 | |
Ohio Quality Income (NUO) | | Level 1 | | | Level 2 | | | Level 3 | | | Total | |
Investments: | | | | | | | | | | | | | | | | |
Municipal Bonds | | $ | — | | | $ | 220,762,745 | | | $ | — | | | $ | 220,762,745 | |
Ohio Dividend Advantage (NXI) | | Level 1 | | | Level 2 | | | Level 3 | | | Total | |
Investments: | | | | | | | | | | | | | | | | |
Municipal Bonds | | $ | — | | | $ | 90,189,150 | | | $ | 127,750 | | | $ | 90,316,900 | |
Ohio Dividend Advantage 2 (NBJ) | | Level 1 | | | Level 2 | | | Level 3 | | | Total | |
Investments: | | | | | | | | | | | | | | | | |
Municipal Bonds | | $ | — | | | $ | 64,429,102 | | | $ | 91,250 | | | $ | 64,520,352 | |
Ohio Dividend Advantage 3 (NVJ) | | Level 1 | | | Level 2 | | | Level 3 | | | Total | |
Investments: | | | | | | | | | | | | | | | | |
Municipal Bonds | | $ | — | | | $ | 45,739,879 | | | $ | 73,000 | | | $ | 45,812,879 | |
Nuveen Investments 85
Notes to
Financial Statements (continued)
The following is a reconciliation of each Fund’s Level 3 investments held at the beginning and end of the measurement period:
| | | | | | | | | | |
| | | Ohio Dividend | | | Ohio Dividend | | | Ohio Dividend | |
| | | Advantage | | | Advantage 2 | | | Advantage 3 | |
| | | (NXI) | | | (NBJ) | | | (NVJ) | |
| | | Level 3 | | | Level 3 | | | Level 3 | |
| | | Municipal Bonds | | | Municipal Bonds | | | Municipal Bonds | |
Balance at the beginning of year | | $ | — | | | $ | — | | | $ | — | |
Gains (losses): | | | | | | | | | | | | |
Net realized gains (losses) | | | — | | | | — | | | | — | |
Net change in unrealized appreciation (depreciation) | | | — | | | | — | | | | — | |
Purchases at cost | | | — | | | | — | | | | — | |
Sales at proceeds | | | — | | | | — | | | | — | |
Net discounts (premiums) | | | — | | | | — | | | | — | |
Transfers into | | | 127,750 | | | | 91,250 | | | | 73,000 | |
Transfers out of | | | — | | | | — | | | | — | |
Balance at the end of year | | $ | 127,750 | | | $ | 91,250 | | | $ | 73,000 | |
Net change in unrealized appreciation (depreciation) during the year of Level 3 securities | | | | | | | | | | | | |
held as of February 28, 2011 | | $ | (69,376 | ) | | $ | (49,554 | ) | | $ | (39,643 | ) |
During the fiscal year ended February 28, 2011, the Funds recognized no significant transfers to/from Level 1 or Level 2. Transfers in and/or out of Level 3 are shown using end of period values.
3. Derivative Instruments and Hedging Activities
The Funds record derivative instruments at fair value with changes in fair value recognized on the Statement of Operations, when applicable. Even though the Funds’ investments in derivatives may represent economic hedges, they are not considered to be hedge transactions for financial reporting purposes. The Funds did not invest in derivative instruments during the fiscal year ended February 28, 2011.
| | | | | | | | | | | | | | | | | | | |
4. Fund Shares | | | | | | | | | | | | | | | | | | |
| | | | | | | | | | | | | | | | | | | |
Common Shares | | | | | | | | | | | | | | | | | | |
Transactions in Common shares were as follows: | | | | | | | | | | | | | | | | | | |
| | | Michigan Quality | | | Michigan Premium | | | Michigan Dividend | |
| | | Income (NUM) | | | Income (NMP) | | | Advantage (NZW) | |
| | | Year | | | Year | | | Year | | | Year | | | Year | | | Year | |
| | | Ended | | | Ended | | | Ended | | | Ended | | | Ended | | | Ended | |
| | | 2/28/11 | | | 2/28/10 | | | 2/28/11 | | | 2/28/10 | | | 2/28/11 | | | 2/28/10 | |
Common shares: | | | | | | | | | | | | | | | | | | |
Issued to shareholders due to | | | | | | | | | | | | | | | | | | |
reinvestment of distributions | | | — | | | | — | | | | — | | | | — | | | | — | | | | — | |
Repurchased and retired | | | (3,400 | ) | | | (153,900 | ) | | | (8,300 | ) | | | (110,400 | ) | | | (1,700 | ) | | | (12,200 | ) |
Weighted average Common share: | | | | | | | | | | | | | | | | | | | | | | | | |
Price per share repurchased and retired | | $ | 12.75 | | | $ | 11.54 | | | $ | 12.63 | | | $ | 11.50 | | | $ | 11.98 | | | $ | 12.15 | |
Discount per share repurchased and retired | | | 13.81 | % | | | 18.15 | % | | | 12.55 | % | | | 17.11 | % | | | 11.21 | % | | | 13.24 | % |
86 Nuveen Investments
| | | | | | |
| | Ohio Quality | | Ohio Dividend |
| | Income (NUO) | | Advantage (NXI) |
| | Year | Year | | Year | Year |
| | Ended | Ended | | Ended | Ended |
| | 2/28/11 | 2/28/10 | | 2/28/11 | 2/28/10 |
Common shares: | | | | | |
Issued to shareholders due to | | | | | |
reinvestment of distributions | 7,425 | — | | 2,631 | — |
Repurchased and retired | — | — | | — | — |
Weighted average Common share: | | | | | |
Price per share repurchased and retired | — | — | | — | — |
Discount per share repurchased and retired | — | — | | — | — |
| | Ohio Dividend | | Ohio Dividend |
| | Advantage 2 (NBJ) | | Advantage 3 (NVJ) |
| | Year | Year | | Year | Year |
| | Ended | Ended | | Ended | Ended |
| | 2/28/11 | 2/28/10 | | 2/28/11 | 2/28/10 |
Common shares: | | | | | |
Issued to shareholders due to | | | | | |
reinvestment of distributions | 926 | — | | 1,431 | — |
Repurchased and retired | — | — | | — | — |
Weighted average Common share: | | | | | |
Price per share repurchased and retired | — | — | | — | — |
Discount per share repurchased and retired | — | — | | — | — |
| | | | | | |
Preferred Shares | | | | | |
| | | | | | |
Transactions in ARPS were as follows: | | | | | |
| | | Michigan Quality Income (NUM) | |
| | Year Ended | | Year Ended |
| | 2/28/11 | | 2/28/10 |
| | Shares | Amount | | Shares | Amount |
ARPS redeemed and/or noticed for redemption: | | | | | |
Series TH | — | $ — | | 122 | $3,050,000 |
Series F | — | — | | 21 | 525,000 |
Total | — | $ — | | 143 | $3,575,000 |
| | | Michigan Premium Income (NMP) | |
| | Year Ended | | Year Ended |
| | 2/28/11 | | 2/28/10 |
| | Shares | Amount | | Shares | Amount |
ARPS redeemed and/or noticed for redemption: | | | | | |
Series M | — | $ — | | 35 | $ 875,000 |
Series TH | — | — | | 57 | 1,425,000 |
Total | — | $ — | | 92 | $2,300,000 |
| | Michigan Dividend Advantage (NZW) |
| | Year Ended | | Year Ended |
| | 2/28/11 | | 2/28/10 |
| | Shares | Amount | | Shares | Amount |
ARPS redeemed and/or noticed for redemption: | | | | | |
Series W | 571 | $14,275,000 | | 26 | $650,000 |
Nuveen Investments 87
Notes to
Financial Statements (continued)
| | | | | | |
| | | Ohio Quality Income (NUO) | |
| | Year Ended | | Year Ended |
| | 2/28/11 | | 2/28/10 |
| | Shares | Amount | | Shares | Amount |
ARPS redeemed and/or noticed for redemption: | | | | | |
Series M | — | $ — | | 35 | $ 875,000 |
Series TH | — | — | | 73 | 1,825,000 |
Series TH2 | — | — | | 52 | 1,300,000 |
Total | — | $ — | | 160 | $4,000,000 |
| | | Ohio Dividend Advantage (NXI) | |
| | Year Ended | | Year Ended |
| | 2/28/11 | | 2/28/10 |
| | Shares | Amount | | Shares | Amount |
ARPS redeemed and/or noticed for redemption: | | | | | |
Series W | 660 | 16,500,000 | | 80 | $2,000,000 |
| | Ohio Dividend Advantage 2 (NBJ) |
| | Year Ended | | Year Ended |
| | 2/28/11 | | 2/28/10 |
| | Shares | Amount | | Shares | Amount |
ARPS redeemed and/or noticed for redemption: | | | | | |
Series F | — | $ — | | 60 | $1,500,000 |
| | Ohio Dividend Advantage 3 (NVJ) |
| | Year Ended | | Year Ended |
| | 2/28/11 | | 2/28/10 |
| | Shares | Amount | | Shares | Amount |
ARPS redeemed and/or noticed for redemption: | | | | | |
Series T | — | $ — | | 40 | $1,000,000 |
| | | | | | | | | | |
Transactions in MTP Shares were as follows: | | | | | | | | | |
| | | | | | | | | | |
| | | Michigan Dividend Advantage (NZW) | | | | Ohio Dividend Advantage (NXI) | |
| | Year Ended | Year Ended | | Year Ended | Year Ended |
| | 2/28/11 | 2/28/10 | | 2/28/11 | 2/28/10 |
| | Shares | Amount | Shares | Amount | | Shares | Amount | Shares | Amount |
MTP Shares issued: | | | | | | | | | |
Series 2015 | 1,631,300 | $16,313,000 | — | $ — | | 1,945,000 | $19,450,000 | — | $ — |
5. Investment Transactions
Purchases and sales (including maturities but excluding short-term investments) during the fiscal year ended February 28, 2011, were as follows:
| | | | |
| | Michigan | Michigan | Michigan |
| | Quality | Premium | Dividend |
| | Income | Income | Advantage |
| | (NUM) | (NMP) | (NZW) |
Purchases | $17,614,816 | $8,273,002 | $4,541,397 |
Sales and maturities | 15,756,305 | 6,366,259 | 2,602,288 |
88 Nuveen Investments
| | | | | |
| | Ohio | Ohio | Ohio | Ohio |
| | Quality | Dividend | Dividend | Dividend |
| | Income | Advantage | Advantage 2 | Advantage 3 |
| | (NUO) | (NXI) | (NBJ) | (NVJ) |
Purchases | $32,331,591 | $15,315,115 | $6,185,816 | $5,976,500 |
Sales and maturities | 31,496,404 | 13,108,880 | 5,805,312 | 5,785,744 |
6. Income Tax Information
The following information is presented on an income tax basis. Differences between amounts for financial statement and federal income tax purposes are primarily due to timing differences in recognizing taxable market discount, timing differences in recognizing certain gains and losses on investment transactions and the treatment of investments in inverse floating rate securities reflected as financing transactions, if any. To the extent that differences arise that are permanent in nature, such amounts are reclassified within the capital accounts as detailed below. Temporary differences do not require reclassification. Temporary and permanent differences do not impact the net asset values of the Funds.
At February 28, 2011, the cost and unrealized appreciation (depreciation) of investments, as determined on a federal income tax basis, were as follows:
| | | | | | | | | | |
| | | Michigan | | | Michigan | | | Michigan | |
| | | Quality | | | Premium | | | Dividend | |
| | | Income | | | Income | | | Advantage | |
| | | (NUM) | | | (NMP) | | | (NZW) | |
Cost of investments | | $ | 247,578,492 | | | $ | 159,028,316 | | | $ | 43,847,828 | |
Gross unrealized: | | | | | | | | | | | | |
Appreciation | | $ | 7,973,976 | | | $ | 2,885,526 | | | $ | 1,001,267 | |
Depreciation | | | (6,376,609 | ) | | | (3,574,626 | ) | | | (1,486,538 | ) |
Net unrealized appreciation (depreciation) of investments | | $ | 1,597,367 | | | $ | (689,100 | ) | | $ | (485,271 | ) |
| | | Ohio | | | Ohio | | | Ohio | | | Ohio | |
| | | Quality | | | Dividend | | | Dividend | | | Dividend | |
| | | Income | | | Advantage | | | Advantage 2 | | | Advantage 3 | |
| | | (NUO) | | | (NXI) | | | (NBJ) | | | (NVJ) | |
Cost of investments | | $ | 217,779,075 | | | $ | 90,378,875 | | | $ | 64,620,490 | | | $ | 45,418,378 | |
Gross unrealized: | | | | | | | | | | | | | | | | |
Appreciation | | $ | 6,949,255 | | | $ | 2,316,077 | | | $ | 1,550,399 | | | $ | 1,595,489 | |
Depreciation | | | (3,965,585 | ) | | | (2,378,052 | ) | | | (1,650,537 | ) | | | (1,200,988 | ) |
Net unrealized appreciation (depreciation) of investments | | $ | 2,983,670 | | | $ | (61,975 | ) | | $ | (100,138 | ) | | $ | 394,501 | |
Permanent differences, primarily due to federal taxes paid, taxable market discount, nondeductible offering costs and distribution character reclassifications, resulted in reclassifications among the Funds’ components of Common share net assets at February 28, 2011, the Funds’ tax year end, as follows:
| | | | | | | | | | |
| | | Michigan | | | Michigan | | | Michigan | |
| | | Quality | | | Premium | | | Dividend | |
| | | Income | | | Income | | | Advantage | |
| | | (NUM) | | | (NMP) | | | (NZW) | |
Paid-in surplus | | $ | 814 | | | $ | 150 | | | $ | (32,097 | ) |
Undistributed (Over-distribution of) net investment income | | | (2,812 | ) | | | (269 | ) | | | 29,913 | |
Accumulated net realized gain (loss) | | | 1,998 | | | | 119 | | | | 2,184 | |
| | | Ohio | | | Ohio | | | Ohio | | | Ohio | |
| | | Quality | | | Dividend | | | Dividend | | | Dividend | |
| | | Income | | | Advantage | | | Advantage 2 | | | Advantage 3 | |
| | | (NUO) | | | (NXI) | | | (NBJ) | | | (NVJ) | |
Paid-in surplus | | $ | 42,945 | | | $ | 32,755 | | | $ | 20,625 | | | $ | 4,673 | |
Undistributed (Over-distribution of) net investment income | | | (66,479 | ) | | | (32,495 | ) | | | (27,283 | ) | | | (8,500 | ) |
Accumulated net realized gain (loss) | | | 23,534 | | | | (260 | ) | | | 6,658 | | | | 3,827 | |
Nuveen Investments 89
Notes to
Financial Statements (continued)
The tax components of undistributed net tax-exempt income, net ordinary income and net long-term capital gains at February 28, 2011, the Funds’ tax year end, were as follows:
| | | | | | | | | | |
| | | Michigan | | | Michigan | | | Michigan | |
| | | Quality | | | Premium | | | Dividend | |
| | | Income | | | Income | | | Advantage | |
| | | (NUM) | | | (NMP) | | | (NZW) | |
Undistributed net tax-exempt income* | | $ | 3,631,639 | | | $ | 2,358,797 | | | $ | 557,829 | |
Undistributed net ordinary income** | | | — | | | | — | | | | — | |
Undistributed net long-term capital gains | | | — | | | | — | | | | — | |
| | | Ohio | | | Ohio | | | Ohio | | | Ohio | |
| | | Quality | | | Dividend | | | Dividend | | | Dividend | |
| | | Income | | | Advantage | | | Advantage 2 | | | Advantage 3 | |
| | | (NUO) | | | (NXI) | | | (NBJ) | | | (NVJ) | |
Undistributed net tax-exempt income* | | $ | 3,285,303 | | | $ | 1,310,729 | | | $ | 966,266 | | | $ | 738,029 | |
Undistributed net ordinary income** | | | 2,660 | | | | — | | | | — | | | | — | |
Undistributed net long-term capital gains | | | — | | | | — | | | | — | | | | — | |
| * | Undistributed net tax-exempt income (on a tax basis) has not been reduced for the dividend declared on February 1, 2011, paid on March 1, 2011. |
| ** | Net ordinary income consists of taxable market discount income and net short-term capital gains, if any. |
The tax character of distributions paid during the Funds’ tax years ended February 28, 2011 and February 28, 2010, was designated for purposes of the dividends paid deduction as follows:
| | | | | | | | | | | | | |
| | | | | | Michigan | | | Michigan | | | Michigan | |
| | | | | | Quality | | | Premium | | | Dividend | |
| | | | | | Income | | | Income | | | Advantage | |
2011 | | | | | (NUM) | | | (NMP) | | | (NZW) | |
Distributions from net tax-exempt income*** | | | | | $ | 9,890,005 | | | $ | 6,426,137 | | | $ | 1,756,176 | |
Distributions from net ordinary income** | | | | | | — | | | | — | | | | — | |
Distributions from net long-term capital gains | | | | | | — | | | | — | | | | — | |
| | | Ohio | | | Ohio | | | Ohio | | | Ohio | |
| | | Quality | | | Dividend | | | Dividend | | | Dividend | |
| | | Income | | | Advantage | | | Advantage 2 | | | Advantage 3 | |
2011 | | (NUO) | | | (NXI) | | | (NBJ) | | | (NVJ) | |
Distributions from net tax-exempt income*** | | $ | 9,038,269 | | | $ | 3,877,989 | | | $ | 2,701,429 | | | $ | 1,997,821 | |
Distributions from net ordinary income** | | | — | | | | — | | | | — | | | | — | |
Distributions from net long-term capital gains | | | — | | | | — | | | | — | | | | — | |
| | | | | | | Michigan | | | Michigan | | | Michigan | |
| | | | | | | Quality | | | Premium | | | Dividend | |
| | | | | | | Income | | | Income | | | Advantage | |
2010 | | | | | | (NUM) | | | (NMP) | | | (NZW) | |
Distributions from net tax-exempt income | | | | | | $ | 8,303,611 | | | $ | 5,617,873 | | | $ | 1,531,890 | |
Distributions from net ordinary income** | | | | | | | — | | | | — | | | | — | |
Distributions from net long-term capital gains | | | | | | | — | | | | — | | | | — | |
| | | Ohio | | | Ohio | | | Ohio | | | Ohio | |
| | | Quality | | | Dividend | | | Dividend | | | Dividend | |
| | | Income | | | Advantage | | | Advantage 2 | | | Advantage 3 | |
2010 | | (NUO) | | | (NXI) | | | (NBJ) | | | (NVJ) | |
Distributions from net tax-exempt income | | $ | 7,994,424 | | | $ | 3,335,906 | | | $ | 2,373,144 | | | $ | 1,758,180 | |
Distributions from net ordinary income** | | | — | | | | 39,995 | | | | — | | | | — | |
Distributions from net long-term capital gains | | | — | | | | — | | | | — | | | | — | |
| ** | Net ordinary income consists of taxable market discount income and net short-term capital gains, if any. |
| *** | The Funds hereby designate these amounts paid during the fiscal year ended February 28, 2011, as Exempt Interest Dividends. |
At February 28, 2011, the Funds’ tax year end, the following Funds had unused capital loss carryforwards available for federal income tax purposes to be applied against future capital gains, if any. If not applied, the carryforwards will expire as follows:
| | | | | | | | | | | | | | | | | | | | | | |
| | | Michigan | | | Michigan | | | Michigan | | | Ohio | | | Ohio | | | Ohio | | | Ohio | |
| | | Quality | | | Premium | | | Dividend | | | Quality | | | Dividend | | | Dividend | | | Dividend | |
| | | Income | | | Income | | | Advantage | | | Income | | | Advantage | | | Advantage 2 | | | Advantage 3 | |
| | | (NUM) | | | (NMP) | | | (NZW) | | | (NUO) | | | (NXI) | | | (NBJ) | | | (NVJ) | |
Expiration: | | | | | | | | | | | | | | | | | | | | | |
February 29, 2016 | | $ | — | | | $ | — | | | $ | — | | | $ | — | | | $ | — | | | $ | 14,045 | | | $ | — | |
February 28, 2017 | | | 87,846 | | | | 278,817 | | | | 441,752 | | | | 1,309,059 | | | | — | | | | 522,972 | | | | 52,532 | |
February 28, 2018 | | | 2,690,744 | | | | 1,586,140 | | | | 834,359 | | | | 78,027 | | | | — | | | | 211,828 | | | | 177,836 | |
February 28, 2019 | | | — | | | | — | | | | — | | | | 1,468,286 | | | | 596,403 | | | | 310,576 | | | | 275,067 | |
Total | | $ | 2,778,590 | | | $ | 1,864,957 | | | $ | 1,276,111 | | | $ | 2,855,372 | | | $ | 596,403 | | | $ | 1,059,421 | | | $ | 505,435 | |
During the Funds’ tax year ended February 28, 2011, the following Funds utilized capital loss carryforwards as follows:
| | | | |
| | Michigan | Michigan | Michigan |
| | Quality | Premium | Dividend |
| | Income | Income | Advantage |
| | (NUM) | (NMP) | (NZW) |
Utilized capital loss carryforwards | $250,009 | $92,338 | $15,670 |
The following Funds have elected to defer net realized losses from investments incurred from November 1, 2010 through February 28, 2011, the Funds’ tax year end, (“post-October losses”) in accordance with federal income tax regulations. Post-October losses are treated as having arisen on the first day of the following fiscal year:
| | | | | |
| | Michigan | Ohio | Ohio | Ohio |
| | Dividend | Quality | Dividend | Dividend |
| | Advantage | Income | Advantage | Advantage 3 |
| | (NZW) | (NUO) | (NXI) | (NVJ) |
Post-October capital losses | $13,969 | $203,449 | $138,592 | $64,837 |
7. Management Fees and Other Transactions with Affiliates
Each Fund’s management fee consists of two components – a fund-level fee, based only on the amount of assets within the Fund, and a complex-level fee, based on the aggregate amount of all eligible fund assets managed by the Adviser. This pricing structure enables Fund shareholders to benefit from growth in the assets within their Fund as well as from growth in the amount of complex-wide assets managed by the Adviser.
| | |
The annual fund-level fee for each Fund, payable monthly, is calculated according to the following schedule: | |
| | Michigan Quality Income (NUM) |
| | Michigan Premium Income (NMP) |
| | Ohio Quality Income (NUO) |
Average Daily Managed Assets* | Fund-Level Fee Rate |
For the first $125 million | .4500% |
For the next $125 million | .4375 |
For the next $250 million | .4250 |
For the next $500 million | .4125 |
For the next $1 billion | .4000 |
For the next $3 billion | .3875 |
For managed assets over $5 billion | .3750 |
| | Michigan Dividend Advantage (NZW) |
| | Ohio Dividend Advantage (NXI) |
| | Ohio Dividend Advantage 2 (NBJ) |
| | Ohio Dividend Advantage 3 (NVJ) |
Average Daily Managed Assets* | Fund-Level Fee Rate |
For the first $125 million | .4500% |
For the next $125 million | .4375 |
For the next $250 million | .4250 |
For the next $500 million | .4125 |
For the next $1 billion | .4000 |
For managed assets over $2 billion | .3750 |
Nuveen Investments 91
Notes to
Financial Statements (continued)
The annual complex-level fee for each Fund, payable monthly, is calculated according to the following schedule:
| | |
Complex-Level Managed Asset Breakpoint Level* | Effective Rate at Breakpoint Level |
$55 billion | .2000% |
$56 billion | .1996 |
$57 billion | .1989 |
$60 billion | .1961 |
$63 billion | .1931 |
$66 billion | .1900 |
$71 billion | .1851 |
$76 billion | .1806 |
$80 billion | .1773 |
$91 billion | .1691 |
$125 billion | .1599 |
$200 billion | .1505 |
$250 billion | .1469 |
$300 billion | .1445 |
| * | For the fund-level and complex-level fees, managed assets include closed-end fund assets managed by the Adviser that are attributable to financial leverage. For these purposes, financial leverage includes the funds’ use of preferred stock and borrowings and certain investments in the residual interest certificates (also called inverse floating rate securities) in tender option bond (TOB) trusts, including the portion of assets held by a TOB trust that has been effectively financed by the trust’s issuance of floating rate securities, subject to an agreement by the Adviser as to certain funds to limit the amount of such assets for determining managed assets in certain circumstances. The complex-level fee is calculated based upon the aggregate daily managed assets of all Nuveen funds that constitute “eligible assets.” Eligible assets do not include assets attributable to investments in other Nuveen funds or assets in excess of $2 billion added to the Nuveen fund complex in connection with the Adviser’s assumption of the management of the former First American Funds effective January 1, 2011. As of February 28, 2011, the complex- level fee rate for the Funds was .1799%. |
The management fee compensates the Adviser for overall investment advisory and administrative services and general office facilities. The Adviser has entered into Sub-Advisory Agreements with the Sub-Adviser under which the Sub-Adviser manages the investment portfolios of the Funds. The Sub-Adviser is compensated for its services to the Funds from the management fees paid to the Adviser.
The Funds pay no compensation directly to those of its directors/trustees who are affiliated with the Adviser or to its officers, all of whom receive remuneration for their services to the Funds from the Adviser or its affiliates. The Board of Directors/Trustees has adopted a deferred compensation plan for independent directors/trustees that enables directors/trustees to elect to defer receipt of all or a portion of the annual compensation they are entitled to receive from certain Nuveen-advised funds. Under the plan, deferred amounts are treated as though equal dollar amounts had been invested in shares of select Nuveen-advised funds.
For the first ten years of Ohio Dividend Advantage’s (NXI) operations, the Adviser has agreed to reimburse the Fund, as a percentage of average daily managed assets, for fees and expenses in the amounts and for the time periods set forth below:
| | | | |
Year Ending | | Year Ending | |
March 31, | | March 31, | |
2001* | .30% | 2007 | .25% |
2002 | .30 | 2008 | .20 |
2003 | .30 | 2009 | .15 |
2004 | .30 | 2010 | .10 |
2005 | .30 | 2011 | .05 |
2006 | .30 | | |
* From the commencement of operations.
The Adviser has not agreed to reimburse Ohio Dividend Advantage (NXI) for any portion of its fees and expenses beyond March 31, 2011.
For the first ten years of Michigan Dividend Advantage’s (NZW) and Ohio Dividend Advantage 2’s (NBJ) operations, the Adviser has agreed to reimburse the Funds, as a percentage of average daily managed assets, for fees and expenses in the amounts and for the time periods set forth below:
| | | | |
Year Ending | | Year Ending | |
September 30, | | September 30, | |
2001* | .30% | 2007 | .25% |
2002 | .30 | 2008 | .20 |
2003 | .30 | 2009 | .15 |
2004 | .30 | 2010 | .10 |
2005 | .30 | 2011 | .05 |
2006 | .30 | | |
| * | From the commencement of operations. |
92 Nuveen Investments
The Adviser has not agreed to reimburse Michigan Dividend Advantage (NZW) and Ohio Dividend Advantage 2 (NBJ) for any portion of their fees and expenses beyond September 30, 2011.
For the first ten years of Ohio Dividend Advantage 3’s (NVJ) operations, the Adviser has agreed to reimburse the Fund, as a percentage of average daily managed assets, for fees and expenses in the amounts and for the time periods set forth below:
| | | | |
Year Ending | | Year Ending | |
March 31, | | March 31, | |
2002* | .30% | 2008 | .25% |
2003 | .30 | 2009 | .20 |
2004 | .30 | 2010 | .15 |
2005 | .30 | 2011 | .10 |
2006 | .30 | 2012 | .05 |
2007 | .30 | | |
* From the commencement of operations.
The Adviser has not agreed to reimburse Ohio Dividend Advantage 3 (NVJ) for any portion of its fees and expenses beyond March 31, 2012.
9. Subsequent Events
Preferred Shares
Subsequent to the reporting period, Ohio Dividend Advantage (NXI) successfully completed the issuance of $10,594,000 of 2.95%, Series 2016 MTP shares. The newly issued MTP shares trade on the NYSE under the ticker symbol “NXI Pr D.” Immediately following its MTP shares issuance, Ohio Dividend Advantage (NXI) noticed for redemption at par its remaining $12,500,000 ARPS outstanding using the MTP shares proceeds.
Subsequent to the reporting period, Ohio Dividend Advantage 2 (NBJ) successfully completed the issuance of $24,244,000 of 2.35%, Series 2014 MTP shares. The newly issued MTP shares trade on the NYSE under the ticker symbol “NBJ Pr A.” Immediately following the MTP shares issuance, Ohio Dividend Advantage 2 (NBJ) noticed for redemption at par its remaining $21,600,000 ARPS outstanding using the MTP shares proceeds.
Subsequent to the reporting period, Ohio Dividend Advantage 3 (NVJ) successfully completed the issuance of $16,061,000 of 2.35%, Series 2014 MTP shares. The newly issued MTP shares trade on the NYSE under the ticker symbol “NVJ Pr A.” Immediately following the MTP shares issuance, Ohio Dividend Advantage 3 (NVJ) noticed for redemption at par its remaining $15,500,000 ARPS outstanding using the MTP shares proceeds.
Nuveen Investments 93
Board Members & Officers(Unaudited)
The management of the Funds, including general supervision of the duties performed for the Funds by the Adviser, is the responsibility of the Board Members of the Funds. The number of board members of the Fund is currently set at ten. None of the board members who are not “interested” persons of the Funds (referred to herein as “independent board members”) has ever been a director or employee of, or consultant to, Nuveen or its affiliates. The names and business addresses of the board members and officers of the Funds, their principal occupations and other affiliations during the past five years, the number of portfolios each oversees and other directorships they hold are set forth below.
| | | | | |
| Name, | Position(s) Held | Year First | Principal | Number |
| Birthdate | with the Funds | Elected or | Occupation(s) | of Portfolios |
| & Address | | Appointed | Including other | in Fund Complex |
| | | and Term(1) | Directorships | Overseen by |
| | | | During Past 5 Years | Board Member |
Independent Board Members: | | | |
| | | | |
■ROBERT P. BREMNER(2) | | | Private Investor and Management Consultant; Treasurer and Director, | |
| 8/22/40 | Chairman of | | Humanities Council of Washington, D.C.; Board Member, | |
| 333 W. Wacker Drive | the Board | 1996 | Independent Directors Council affiliated with the Investment | 246 |
| Chicago, IL 60606 | and Board Member | | Company Institute. | |
■JACK B. EVANS | | | President, The Hall-Perrine Foundation, a private philanthropic | |
10/22/48 | | | corporation (since 1996); Director and Chairman, United Fire | |
| 333 W. Wacker Drive | Board Member | 1999 | Group, a publicly held company; President Pro Tem of the Board of | 246 |
| Chicago, IL 60606 | | | Regents for the State of Iowa University System; Director, Source Media | |
| | | | Group; Life Trustee of Coe College and the Iowa College Foundation; | |
| | | | formerly, Director, Alliant Energy; formerly, Director, Federal | |
| | | | Reserve Bank of Chicago; formerly, President and Chief Operating | |
| | | | Officer, SCI Financial Group, Inc., a regional financial services firm. | |
■WILLIAM C. HUNTER | | | Dean, Tippie College of Business, University of Iowa (since | |
| 3/6/48 | | | 2006); Director (since 2004) of Xerox Corporation; Director | |
| 333 W. Wacker Drive | Board Member | 2004 | (since 2005), Beta Gamma Sigma International Honor Society; | 246 |
| Chicago, IL 60606 | | | Director of Wellmark, Inc. (since 2009); formerly, Dean and | |
| | | | Distinguished Professor of Finance, School of Business at the | |
| | | | University of Connecticut (2003-2006); previously, Senior Vice | |
| | | | President and Director of Research at the Federal Reserve Bank | |
| | | | of Chicago (1995-2003); formerly, Director (1997-2007), Credit | |
| | | | Research Center at Georgetown University. | |
■DAVID J. KUNDERT(2) | | | Director, Northwestern Mutual Wealth Management | |
| 10/28/42 | | | Company; retired (since 2004) as Chairman, JPMorgan | |
| 333 W. Wacker Drive | Board Member | 2005 | Fleming Asset Management, President and CEO, Banc One | 246 |
| Chicago, IL 60606 | | | Investment Advisors Corporation, and President, One Group | |
| | | | Mutual Funds; prior thereto, Executive Vice President, Banc One | |
| | | | Corporation and Chairman and CEO, Banc One Investment | |
| | | | Management Group; Member, Board of Regents, Luther College; | |
| | | | member of the Wisconsin Bar Association; member of Board of | |
| | | | Directors, Friends of Boerner Botanical Gardens; member of Board | |
| | | | of Directors and Chair of Investment Committee, Greater | |
| | | | Milwaukee Foundation. | |
■WILLIAM J. SCHNEIDER(2) | | | Chairman of Miller-Valentine Partners Ltd., a real estate investment | |
| 9/24/44 | | | company; formerly, Senior Partner and Chief Operating Officer | |
| 333 W. Wacker Drive | Board Member | 1997 | (retired 2004) of Miller-Valentine Group; member, University of | 246 |
| Chicago, IL 60606 | | | Dayton Business School Advisory Council;member, Mid-America | |
| | | | Health System Board; formerly, member and chair, Dayton Philharmonic | |
| | | | Orchestra Association; formerly, member, Business Advisory Council, | |
| | | | Cleveland Federal Reserve Bank. | |
94 Nuveen Investments
| | | | | |
| Name, | Position(s) Held | Year First | Principal | Number |
| Birthdate | withthe Funds | Elected or | Occupation(s) | of Portfolios |
| & Address | | Appointed | Including other | in Fund Complex |
| | | and Term(1) | Directorships | Overseen by |
| | | | During Past 5 Years | Board Member |
Independent Board Members: | | | |
| | | | |
■JUDITH M. STOCKDALE | | | Executive Director, Gaylord and Dorothy Donnelley | |
| 12/29/47 | | | Foundation (since 1994); prior thereto, Executive Director, | |
| 333 W. Wacker Drive | Board Member | 1997 | Great Lakes Protection Fund (1990-1994). | 246 |
Chicago, IL 60606 | | | | |
■CAROLE E. STONE(2) | | | Director, Chicago Board Options Exchange (since 2006); Director, | |
| 6/28/47 | | | C2 Options Exchange, Incorporated (since 2009); formerly, | |
| 333 W. Wacker Drive | Board Member | 2007 | Commissioner, New York State Commission on Public Authority | 246 |
| Chicago, IL 60606 | | | Reform (2005-2010); formerly, Chair, New York Racing Association | |
| | | | Oversight Board (2005-2007). | |
■ VIRGINIA L. STRINGER | | | Board Member, Mutual Fund Directors Forum; Member, Governing | |
| 8/16/44 | | | Board, Investment Company Institute’s Independent Directors | |
| 333 W. Wacker Drive | Board Member | 2011 | Council; governance consultant and non-profit board member; | 246 |
| Chicago, IL 60606 | | | former Owner and President, Strategic Management Resources, Inc. | |
| | | | a management consulting firm; previously, held several executive | |
| | | | positions in general management, marketing and human resources at | |
| | | | IBM and The Pillsbury Company; Independent Director, First American | |
| | | | Fund Complex (1987-2010) and Chair (1997-2010). | |
■TERENCE J. TOTH(2) | | | | |
| 9/29/59 | | | Director, Legal & General Investment Management America, Inc. | |
| 333 W. Wacker Drive | Board Member | 2008 | (since 2008); Managing Partner, Promus Capital (since 2008); | 246 |
| Chicago, IL 60606 | | | formerly, CEO and President, Northern Trust Global Investments | |
| | | | (2004-2007); Executive Vice President, Quantitative Management | |
| | | | & Securities Lending (2000-2004); prior thereto, various positions | |
| | | | with Northern Trust Company (since 1994); member: Goodman | |
| | | | Theatre Board (since 2004), Chicago Fellowship Board (since | |
| | | | 2005), and Catalyst Schools of Chicago Board (since 2008); formerly, | |
| | | | member: Northern Trust Mutual Funds Board (2005-2007), | |
| | | | Northern Trust Global Investments Board (2004-2007), Northern | |
| | | | Trust Japan Board (2004-2007), Northern Trust Securities Inc. | |
| | | | Board (2003-2007) and Northern Trust Hong Kong Board | |
| | | | (1997-2004). | |
Interested Board Member: | | | |
| | | | |
■JOHN P. AMBOIAN(3) | | | Chief Executive Officer and Chairman (since 2007), and Director (since | |
| 6/14/61 | | | 1999) of Nuveen Investments, Inc., formerly, President (1999-2007); | |
| 333 W. Wacker Drive | Board Member | 2008 | Chief Executive Officer (since 2007) of Nuveen Investments Advisors, | 246 |
| Chicago, IL 60606 | | | Inc.; Director (since 1998) formerly, Chief Executive Officer (2007-2010) | |
| | | | of Nuveen Fund Advisors, Inc. | |
Nuveen Investments 95
Board Members & Officers (Unaudited) (continued)
| | | | | |
| Name, | Position(s) Held | Year First | Principal | Number |
| Birthdate | with the Funds | Elected or | Occupation(s) | of Portfolios |
and Address | | Appointed(4) | During Past 5 Years | in Fund Complex |
| | | | | Overseen |
| | | | | by Officer |
Officers of the Funds: | | | | |
| | | | | |
■GIFFORD R. ZIMMERMAN | | Managing Director (since 2002), Assistant Secretary and Associate | |
| 9/9/56 | Chief Adminisrative | | General Counsel of Nuveen Investments LLC; Managing Director | |
333 W. Wacker Drive | Officer | 1988 | (since 2004) and Assistant Secretary (since 1994) of Nuveen | 246 |
| Chicago, IL 60606 | | | Investments, Inc.; Managing Director (since 2002), Assistant | |
| | | | Secretary (since 1997) and Co-General Counsel (since 2011) of Nuveen | |
| | | | Fund Advisors, Inc.; Managing Director, Assistant Secretary and | |
| | | | Associate General Counsel of Nuveen Asset Management, LLC (since | |
| | | | 2011); Managing Director, Associate General Counsel and Assistant | |
| | | | Secretary of Symphony Asset Management LLC (since 2003); Vice | |
| | | | President and Assistant Secretary of NWQ Investment Management | |
| | | | Company, LLC (since 2002), Nuveen Investments Advisers Inc. (since | |
| | | | 2002), Tradewinds Global Investors LLC, and Santa Barbara Asset | |
| | | | Management, LLC (since 2006), Nuveen HydePark Group LLC and | |
| | | | Nuveen Investment Solutions, Inc. (since 2007) and of Winslow Capital | |
| | | | Management Inc. (since 2010); Chief Administrative Officer and Chief | |
| | | | Compliance Officer (since 2010) of Nuveen Commodities Asset | |
| | | | Management, LLC; Chartered Financial Analyst. | |
■ WILLIAM ADAMS IV | | | Senior Executive Vice President, Global Structured Products (since | |
| 6/9/55 | | | 2010), formerly, Executive Vice President (1999-2010) of Nuveen | |
| 333 W. Wacker Drive | Vice President | 2007 | Investments, LLC; Co-President of Nuveen Fund Advisors, Inc. (since | 132 |
| Chicago, IL 60606 | | | 2011); Managing Director (since 2010) of Nuveen Commodities Asset | |
| | | | Management, LLC. | |
■CEDRIC H. ANTOSIEWICZ | | Managing Director of Nuveen Investments, LLC. | |
| 1/11/62 | | | | |
| 333 W. Wacker Drive | Vice President | 2007 | | 132 |
Chicago, IL 60606 | | | | |
■MARGO L. COOK | | | Executive Vice President (since 2008) of Nuveen Investments, Inc. | |
| 4/11/64 | | | and of Nuveen Fund Advisors, Inc. (since 2011); previously, Head of | |
| 333 W. Wacker Drive | Vice President | 2009 | Institutional Asset Management (2007-2008) of Bear Stearns Asset | 246 |
| Chicago, IL 60606 | | | Management; Head of Institutional Asset Management (1986-2007) of | |
| | | | Bank of NY Mellon; Chartered Financial Analyst. | |
■LORNA C. FERGUSON | | | Managing Director (since 2004) of Nuveen Investments, LLC and | |
| 10/24/45 | | | Managing Director (since 2005) of Nuveen Fund Advisors, Inc. | |
| 333 W. Wacker Drive | Vice President | 1998 | | 246 |
Chicago, IL 60606 | | | | |
■STEPHEN D. FOY | | | Senior Vice President (since 2010), formerly, Vice President (1993- | |
| 5/31/54 | Vice President | | 2010) and Funds Controller (since 1998) of Nuveen Investments, | |
| 333 W. Wacker Drive | andController | 1998 | LLC; Senior Vice President (since 2010), formerly, Vice President | 246 |
| Chicago, IL 60606 | | | (2005-2010) of Nuveen Fund Advisors, Inc.; Certified Fund Advisors, Inc.; | |
| | | | Certified Public Accountant. | |
| | | | | |
| Name, | Position(s) Held | Year First | Principal | Number |
| Birthdate | with the Funds | Elected or | Occupation(s) | of Portfolios |
and Address | | Appointed(4) | During Past 5 Years | in Fund Complex |
| | | | | Overseen |
| | | | | by Officer |
Officers of the Funds: | | | | |
| | | | | |
■ SCOTT S. GRACE | | | Managing Director, Corporate Finance & Development, Treasurer | |
| 8/20/70 | Vice President | | (since 2009) of Nuveen Investments, LLC; Managing Director and | |
| 333 W. Wacker Drive | and Treasurer | 2009 | Treasurer (since 2009) of Nuveen Fund Advisors, Inc., Nuveen Investment | 246 |
| Chicago, IL 60606 | | | Solutions, Inc., Nuveen Investments Advisers, Inc., Nuveen Investments | |
| | | | Holdings Inc. and (since (2011) Nuveen Asset Management, LLC; Vice | |
| | | | President and Treasurer of NWQ Investment Management Company, | |
| | | | LLC, Tradewinds Global Investors, LLC, Symphony Asset Management | |
| | | | LLC and Winslow Capital Management, Inc.; Vice President of Santa | |
| | | | Barbara Asset Management, LLC; formerly, Treasurer (2006-2009), | |
| | | | Senior Vice President (2008-2009), previously, Vice President (2006- | |
| | | | 2008) of Janus Capital Group, Inc.; formerly, Senior Associate in Morgan | |
| | | | Stanley’s Global Financial Services Group (2000-2003); Chartered | |
| | | | Accountant Designation. | |
■WALTER M. KELLY | | | Senior Vice President (since 2008), Vice President (2006-2008) | |
| 2/24/70 | Chief Compliance | | of Nuveen Investments, LLC; Senior Vice President (since 2008) | |
| 333 W. Wacker Drive | Officer and | 2003 | and Assistant Secretary (since 2008) of Nuveen Fund Advisors, Inc. | 246 |
| Chicago, IL 60606 | Vice President | | | |
■TINA M. LAZAR | | | Senior Vice President (since 2009), formerly, Vice President of Nuveen | |
| 8/27/61 | | | Investments, LLC (1999-2009); Senior Vice President (since 2010), | |
| 333 W. Wacker Drive | Vice President | 2002 | formerly, Vice President (2005-2010) of Nuveen Fund Advisors, Inc. | 246 |
| Chicago, IL 60606 | | | | |
■LARRY W. MARTIN | | | Senior Vice President (since 2010), formerly, Vice President | |
| 7/27/51 | Vice President and | | (1993-2010), Assistant Secretary and Assistant General Counsel | |
| 333 W. Wacker Drive | Assistant Secretary | 1997 | of Nuveen Investments, LLC; Senior Vice President (since 2011) of | 246 |
| Chicago, IL 60606 | | | Nuveen Asset Management, LLC: Senior Vice President (since 2010), | |
| | | | formerly, Vice President (2005-2010), and Assistant Secretary of | |
| | | | Nuveen Investments, Inc.; Senior Vice President (since 2010), formerly | |
| | | | Vice President (2005-2010), and Assistant Secretary (since 1997) of | |
| | | | Nuveen Fund Advisors, Vice President and Assistant Secretary of Nuveen | |
| | | | Investments Advisers Inc. (since 2002), NWQ Investment Management | |
| | | | Company, LLC, Symphony Asset Management, LLC (since 2003), | |
| | | | Tradewinds Global Investors, LLC, Santa Barbara Asset Management, | |
| | | | LLC (since 2006), Nuveen HydePark Group, LLC and Nuveen Investment | |
| | | | Solutions, Inc. (since 2007); Vice President and Assistant Secretary of | |
| | | | Nuveen Commodities Asset Management LLC (since 2010). | |
■KEVIN J. MCCARTHY | | | Managing Director (since 2008), formerly, Vice President (2007-2008), | |
| 3/26/66 | Vice President | | Nuveen Investments, LLC; Managing Director (since 2008), Assistant | |
| 333 W. Wacker Drive | and Secretary | 2007 | Secretary (since 2007) and Co-General Counsel (since 2011) | 246 |
| Chicago, IL 60606 | | | of Nuveen Fund Advisors, Inc.; Managing Director, Assistant Secretary | |
| | | | and Associate General Counsel (since 2011) of Nuveen Asset | |
| | | | Management, LLC; Managing Director (since 2008), and Assistant | |
| | | | Secretary, Nuveen Investment Holdings, Inc.; Vice President | |
| | | | (since 2007) and Assistant Secretary, Nuveen Investment Advisers | |
| | | | Inc., NWQ Investment Management Company, LLC, Tradewinds | |
| | | | Global Investors LLC, NWQ Holdings, LLC, Symphony Asset | |
| | | | Management LLC, Santa Barbara Asset Management, LLC, Nuveen | |
| | | | HydePark Group, LLC and Nuveen Investment Solutions, Inc. | |
| | | | (since 2007) and of Winslow Capital Management, Inc. (since 2010); | |
| | | | Vice President and Secretary (since 2010) of Nuveen Commodities | |
| | | | Asset Management, LLC; prior thereto, Partner, Bell, Boyd & Lloyd LLP | |
| | | | (1997-2007). | |
Nuveen Investments 97
Board Members & Officers (Unaudited) (continued)
| | | | | |
| Name, | Position(s) Held | Year First | Principal | Number |
| Birthdate | with the Funds | Elected or | Occupation(s) | of Portfolios |
and Address | | Appointed(4) | During Past 5 Years | in Fund Complex |
| | | | | Overseen |
| | | | | by Officer |
Officers of the Funds: | | | | |
| | | | | |
■KATHLEEN L. PRUDHOMME | | Managing Director, Assistant Secretary and Co-General Counsel (since | |
| 3/30/53 | Vice President and | | 2011) of Nuveen Fund Advisors; Managing Director, Assistant Secretary | |
| 800 Nicollet Mall | Assistant Secretary | 2011 | and Associate General Counsel (since 2011) of Nuveen Asset | 246 |
| Minneapolis, MN 55402 | | | Management, LLC; Managing Director and Assistant Secretary (since | |
| | | | 2011) of Nuveen Investments, LLC; formerly, Secretary of FASF | |
| | | | (2004-2010); Deputy General Counsel, FAF Advisors, Inc. (2004-2010). | |
| (1) | For Michigan Dividend Advantage (NZW), Ohio Dividend Advantage (NXI), Ohio Dividend Advantage 2 (NBJ) and Ohio Dividend Advantage 3 (NVJ) Board Members serve three year terms, except for two board members who are elected by the holders of Preferred Shares. The Board of Trustees for NZW, NXI, NBJ and NVJ is divided into three classes, Class I, Class II, and Class III, with each being elected to serve until the third succeeding annual shareholders’ meeting subsequent to its election or thereafter in each case when its respective successors are duly elected or appointed, except two board members are elected by the holders of Preferred Shares to serve until the next annual shareholders’ meeting subsequent to its election or thereafter in each case when its respective successors are duly elected or appointed. For Michigan Quality Income (NUM), Michigan Premium Income (NMP) and Ohio Quality Income (NUO), the Board Members serve a one year term to serve until the next annual meeting or until their successors shall have been duly elected and qualified. The first year elected or appointed represents the year in which the board member was first elected or appointed to any fund in the Nuveen Complex. |
| (2) | Also serves as a trustee of the Nuveen Diversified Commodity Fund, an exchange-traded commodity pool managed by Nuveen Commodities Asset Management, LLC, an affiliate of the Adviser. |
| (3) | Mr. Amboian is an interested trustee because of his position with Nuveen Investments, Inc. and certain of its subsidiaries, which are affiliates of the Nuveen Funds. |
| (4) | Officers serve one year terms through August of each year. The year first elected or appointed represents the year in which the Officer was first elected or appointed to any fund in the Nuveen Complex. |
98 Nuveen Investments
Annual Investment Management Agreement Approval Process(Unaudited)
The Investment Company Act of 1940, as amended (the “1940 Act”), provides, in substance, that each investment advisory agreement between a fund and its investment adviser will continue in effect from year to year only if its continuance is approved at least annually by the fund’s board members, including by a vote of a majority of the board members who are not parties to the advisory agreement or “interested persons” of any parties (the “Independent Board Members”), cast in person at a meeting called for the purpose of considering such approval. In connection with such approvals, the fund’s board members must request and evaluate, and the investment adviser is required to furnish, such information as may be reasonably necessary to evaluate the terms of the advisory agreement. Accordingly, at a meeting held on May 25-26, 2010 (the “May Meeting”), the Boards of Trustees or Directors (as the case may be) (each a “Board” and each Trustee or Director, a “Board Member”) of the Funds, including a majority of the Independent Board Members, considered and approved the continuation of the advisory agreements (each an “Advisory Agreement”) between each Fund and Nuveen Asset Management (the “Adviser”) for an additional one-year period. In preparation for their considerations at the May Meeting, the Board also held a separate meeting on April 21-22, 2010 (the “April Meeting”). Accordingly, the factors considered and determinations made regarding the renewals by the Independent Board Members include those made at the April Meeting.
In addition, in evaluating the Advisory Agreements, the Independent Board Members reviewed a broad range of information relating to the Funds and the Adviser, including absolute and comparative performance, fee and expense information for the Funds (as described in more detail below), the profitability of Nuveen for its advisory activities (which includes its wholly owned subsidiaries), and other information regarding the organization, personnel, and services provided by the Adviser. The Independent Board Members also met quarterly as well as at other times as the need arose during the year and took into account the information provided at such meetings and the knowledge gained therefrom. Prior to approving the renewal of the Advisory Agreements, the Independent Board Members reviewed the foregoing information with their independent legal counsel and with management, reviewed materials from independent legal counsel describing applicable law and their duties in reviewing advisory contracts, and met with independent legal counsel in private sessions without management present. The Independent Board Members considered the legal advice provided by independent legal counsel and relied upon their knowledge of the Adviser, its services and the Funds resulting from their meetings and other interactions throughout the year and their own business judgment in determining the factors to be considered in evaluating the
Nuveen Investments 99
Annual Investment Management Agreement
Approval Process (Unaudited) (continued)
Advisory Agreements. Each Board Member may have accorded different weight to the various factors in reaching his or her conclusions with respect to a Fund’s Advisory Agreement. The Independent Board Members did not identify any single factor as all-important or controlling. The Independent Board Members’ considerations were instead based on a comprehensive consideration of all the information presented. The principal factors considered by the Board and its conclusions are described below.
A. Nature, Extent and Quality of Services
In considering renewal of the Advisory Agreements, the Independent Board Members considered the nature, extent and quality of the Adviser’s services, including advisory services and administrative services. The Independent Board Members reviewed materials outlining, among other things, the Adviser’s organization and business; the types of services that the Adviser or its affiliates provide and are expected to provide to the Funds; the performance record of the applicable Fund (as described in further detail below); and any initiatives Nuveen had taken for the applicable fund product line, including continued activities to refinance auction rate preferred securities, manage leverage during periods of market turbulence and implement an enhanced leverage management process, modify investment mandates in light of market conditions and seek shareholder approval as necessary, maintain the fund share repurchase program and maintain shareholder communications to keep shareholders apprised of Nuveen’s efforts in refinancing preferred shares. In addition to the foregoing, the Independent Board Members also noted the additional services that the Adviser or its affiliates provide to closed-end funds, including, in particular, Nuveen’s continued commitment to supporting the secondary market for the common shares of its closed-end funds through a variety of programs designed to raise investor and analyst awareness and understanding of closed-end funds. These efforts include maintaining an investor relations program to provide timely information and education to financial advisers and investors; providing marketing for the closed-end funds; maintaining and enhancing a closed-end fund website; participating in conferences and having direct communications with analysts and financial advisors.
As part of their review, the Independent Board Members also evaluated the background, experience and track record of the Adviser’s investment personnel. In this regard, the Independent Board Members considered any changes in the personnel, and the impact on the level of services provided to the Funds, if any. The Independent Board Members also reviewed information regarding portfolio manager compensation arrangements to evaluate the Adviser’s ability to attract and retain high quality investment personnel, preserve stability, and reward performance but not provide an incentive for taking undue risks.
In addition to advisory services, the Independent Board Members considered the quality of administrative services provided by the Adviser and its affiliates including product management, fund administration, oversight of service providers, shareholder services, administration of Board relations, regulatory and portfolio compliance and legal support. Given the importance of compliance, the Independent Board Members also
100 Nuveen Investments
considered the Adviser’s compliance program, including the report of the chief compliance officer regarding the Funds’ compliance policies and procedures.
Based on their review, the Independent Board Members found that, overall, the nature, extent and quality of services provided (and expected to be provided) to the respective Funds under the Advisory Agreements were satisfactory.
B. The Investment Performance of the Funds and the Adviser
The Board considered the performance results of each Fund over various time periods. The Board reviewed, among other things, each Fund’s historic investment performance as well as information comparing the Fund’s performance information with that of other funds (the “Performance Peer Group”) based on data provided by an independent provider of mutual fund data and with recognized and/or customized benchmarks. In this regard, the Board reviewed each Fund’s total return information compared to its Performance Peer Group for the quarter, one-, three- and five-year periods ending December 31, 2009 and for the same periods ending March 31, 2010 (or for the periods available for Funds that did not exist during part of the foregoing time frame). In addition, the Board reviewed each Fund’s total return information compared to recognized and/or customized benchmarks for the quarter, one- and three-year periods ending December 31, 2009 and for the same periods ending March 31, 2010 (or for the periods available for Funds that did not exist during part of the foregoing time frame). Moreover, the Board reviewed the peer ranking of the Nuveen municipal funds advised by the Adviser in the aggregate. The Independent Board Members also reviewed historic premium and discount levels, including actions taken for the Nuveen Michigan Quality Income Municipal Fund, Inc., Nuveen Michigan Dividend Advantage Municipal Fund, and Nuveen Michigan Premium Income Municipal Fund, Inc. This information supplemented the Fund performance information provided to the Board at each of its quarterly meetings.
In reviewing peer comparison information, the Independent Board Members recognized that the Performance Peer Group of certain funds may not adequately represent the objectives and strategies of the funds, thereby limiting the usefulness of comparing a fund’s performance with that of its Performance Peer Group. In this regard, the Independent Board Members considered that the Performance Peer Groups of certain funds (including the Nuveen Ohio Quality Income Municipal Fund, Inc., Nuveen Ohio Dividend Advantage Municipal Fund, Nuveen Ohio Dividend Advantage Municipal Fund 2, and Nuveen Ohio Dividend Advantage Municipal Fund 3) were classified as having significant differences from such funds based on considerations such as special fund objectives, potential investable universe and the composition of the peer set (e.g., the number and size of competing funds and number of competing managers).
Based on their review, the Independent Board Members determined that each Fund’s investment performance over time had been satisfactory. The Independent Board Members noted that the Nuveen Ohio Quality Income Municipal Fund, Inc. Nuveen Ohio Dividend Advantage Municipal Fund, and Nuveen Ohio Dividend Advantage Municipal Fund 3 outperformed or matched the performance of their benchmarks in the
Nuveen Investments 101
Annual Investment Management Agreement
Approval Process (Unaudited) (continued)
one- and three-year periods whereas the Nuveen Ohio Dividend Advantage Municipal Fund 2 underperformed its benchmark in the three-year period but outperformed the performance of its benchmark in the one-year period.
The Independent Board Members noted that the performance of the Nuveen Michigan Premium Income Municipal Fund, Inc. and Nuveen Michigan Dividend Advantage Municipal Fund over time was satisfactory compared to peers, falling within the second or third quartiles over various periods. The Independent Board Members also noted that although the Nuveen Michigan Quality Income Municipal Fund, Inc. lagged its peers somewhat in the short-term one-year period, the Fund demonstrated more favorable performance in the longer three- and five-year periods.
C. Fees, Expenses and Profitability
1. Fees and Expenses
The Board evaluated the management fees and expenses of each Fund reviewing, among other things, such Fund’s gross management fees, net management fees and net expense ratios in absolute terms as well as compared to the fee and expenses of a comparable universe of funds based on data provided by an independent fund data provider (the “Peer Universe”) and in certain cases, to a more focused subset of funds in the Peer Universe (the “Peer Group”) and any expense limitations.
The Independent Board Members further reviewed the methodology regarding the construction of the applicable Peer Universe and/or Peer Group. In reviewing the comparisons of fee and expense information, the Independent Board Members took into account that in certain instances various factors such as: the asset level of a fund relative to peers; the limited size and particular composition of the Peer Universe or Peer Group; the investment objectives of the peers; expense anomalies; changes in the funds comprising the Peer Universe or Peer Group from year to year; levels of reimbursement; the timing of information used; the differences in the type and use of leverage; and differences in the states reflected in the Peer Universe or Peer Group may impact the comparative data, thereby limiting the ability to make a meaningful comparison with peers.
In reviewing the fee schedule for a Fund, the Independent Board Members also considered the fund-level and complex-wide breakpoint schedules (described in further detail below) and any fee waivers and reimbursements provided by Nuveen (applicable, in particular, for certain closed-end funds launched since 1999). Except as set forth in the following sentence, the Independent Board Members noted that the Funds had net management fees and/or net expense ratios below, at or near (within 5 basis points or less) the peer averages of their Peer Group or Peer Universe. The Nuveen Michigan Quality Income Municipal Fund, Inc., Nuveen Michigan Premium Income Municipal Fund, Inc. and Nuveen Ohio Quality Income
102 Nuveen Investments
Municipal Fund, Inc. had net advisory fees above the peer average but net expense ratios below, at or near the peer expense ratio average.
Based on their review of the fee and expense information provided, the Independent Board Members determined that each Fund’s management fees were reasonable in light of the nature, extent and quality of services provided to the Fund.
2. Comparisons with the Fees of Other Clients
The Independent Board Members further reviewed information regarding the nature of services and fee rates offered by the Adviser to other clients, including municipal separately managed accounts and passively managed municipal bond exchange traded funds (ETFs) that are sub-advised by the Adviser. In evaluating the comparisons of fees, the Independent Board Members noted that the fee rates charged to the Funds and other clients vary, among other things, because of the different services involved and the additional regulatory and compliance requirements associated with registered investment companies, such as the Funds. Accordingly, the Independent Board Members considered the differences in the product types, including, but not limited to, the services provided, the structure and operations, product distribution and costs thereof, portfolio investment policies, investor profiles, account sizes and regulatory requirements. The Independent Board Members noted, in particular, that the range of services provided to the Funds (as discussed above) is much more extensive than that provided to separately managed accounts. Given the inherent differences in the products, particularly the extensive services provided to the Funds, the Independent Board Members believe such facts justify the different levels of fees.
3. Profitability of Nuveen
In conjunction with its review of fees, the Independent Board Members also considered the profitability of Nuveen for its advisory activities (which incorporated Nuveen’s wholly-owned affiliated sub-advisers) and its financial condition. The Independent Board Members reviewed the revenues and expenses of Nuveen’s advisory activities for the last two years, the allocation methodology used in preparing the profitability data and an analysis of the key drivers behind the changes in revenues and expenses that impacted profitability in 2009. The Independent Board Members noted this information supplemented the profitability information requested and received during the year to help keep them apprised of developments affecting profitability (such as changes in fee waivers and expense reimbursement commitments). In this regard, the Independent Board Members noted that they had also appointed an Independent Board Member as a point person to review and keep them apprised of changes to the profitability analysis and/or methodologies during the year. The Independent Board Members also considered Nuveen’s revenues for advisory activities, expenses, and profit margin compared to that of various unaffiliated management firms with similar amounts of
Nuveen Investments 103
Annual Investment Management Agreement
Approval Process (Unaudited) (continued)
assets under management and relatively comparable asset composition prepared by Nuveen.
In reviewing profitability, the Independent Board Members recognized the subjective nature of determining profitability which may be affected by numerous factors including the allocation of expenses. Further, the Independent Board Members recognized the difficulties in making comparisons as the profitability of other advisers generally is not publicly available and the profitability information that is available for certain advisers or management firms may not be representative of the industry and may be affected by, among other things, the adviser’s particular business mix, capital costs, types of funds managed and expense allocations. Notwithstanding the foregoing, the Independent Board Members reviewed Nuveen’s methodology and assumptions for allocating expenses across product lines to determine profitability. In reviewing profitability, the Independent Board Members recognized Nuveen’s investment in its fund business. Based on their review, the Independent Board Members concluded that Nuveen’s level of profitability for its advisory activities was reasonable in light of the services provided.
In evaluating the reasonableness of the compensation, the Independent Board Members also considered other amounts paid to the Adviser by the Funds as well as any indirect benefits (such as soft dollar arrangements, if any) the Adviser and its affiliates receive, or are expected to receive, that are directly attributable to the management of the Funds, if any. See Section E below for additional information on indirect benefits the Adviser may receive as a result of its relationship with the Funds. Based on their review of the overall fee arrangements of each Fund, the Independent Board Members determined that the advisory fees and expenses of the respective Fund were reasonable.
D. Economies of Scale and Whether Fee Levels Reflect These Economies
of Scale
With respect to economies of scale, the Independent Board Members have recognized the potential benefits resulting from the costs of a fund being spread over a larger asset base, although economies of scale are difficult to measure and predict with precision, particularly on a fund-by-fund basis. One method to help ensure the shareholders share in these benefits is to include breakpoints in the advisory fee schedule. Generally, management fees for funds in the Nuveen complex are comprised of a fund-level component and a complex-level component, subject to certain exceptions. Accordingly, the Independent Board Members reviewed and considered the applicable fund-level breakpoints in the advisory fee schedules that reduce advisory fees as asset levels increase. Further, the Independent Board Members noted that although closed-end funds may from time-to-time make additional share offerings, the growth of their assets will occur primarily through the appreciation of such funds’ investment portfolio.
In addition to fund-level advisory fee breakpoints, the Board also considered the Funds’ complex-wide fee arrangement. Pursuant to the complex-wide fee arrangement, the
104 Nuveen Investments
fees of the funds in the Nuveen complex are generally reduced as the assets in the fund complex reach certain levels. The complex-wide fee arrangement seeks to provide the benefits of economies of scale to fund shareholders when total fund complex assets increase, even if assets of a particular fund are unchanged or have decreased. The approach reflects the notion that some of Nuveen’s costs are attributable to services provided to all its funds in the complex and therefore all funds benefit if these costs are spread over a larger asset base.
Based on their review, the Independent Board Members concluded that the breakpoint schedules and complex-wide fee arrangement were acceptable and reflect economies of scale to be shared with shareholders when assets under management increase.
E. Indirect Benefits
In evaluating fees, the Independent Board Members received and considered information regarding potential “fall out” or ancillary benefits the Adviser or its affiliates may receive as a result of its relationship with each Fund. In this regard, the Independent Board Members considered any revenues received by affiliates of the Adviser for serving as agent at Nuveen’s trading desk and as co-manager in initial public offerings of new closed-end funds.
In addition to the above, the Independent Board Members considered whether the Adviser received any benefits from soft dollar arrangements whereby a portion of the commissions paid by a Fund for brokerage may be used to acquire research that may be useful to the Adviser in managing the assets of the Funds and other clients. The Independent Board Members noted that the Adviser does not currently have any soft dollar arrangements; however, to the extent certain bona fide agency transactions that occur on markets that traditionally trade on a principal basis and riskless principal transactions are considered as generating “commissions,” the Adviser intends to comply with the applicable safe harbor provisions.
Based on their review, the Independent Board Members concluded that any indirect benefits received by the Adviser as a result of its relationship with the Funds were reasonable and within acceptable parameters.
F. Other Considerations
The Independent Board Members did not identify any single factor discussed previously as all-important or controlling. The Board Members, including the Independent Board Members, unanimously concluded that the terms of the Advisory Agreements are fair and reasonable, that the Adviser’s fees are reasonable in light of the services provided to each Fund and that the Advisory Agreements be renewed.
Nuveen Investments 105
Board Approval of Sub-Advisory Arrangements (Unaudited)
Since the May Meeting, Nuveen has engaged in an internal restructuring (the “Restructuring”) pursuant to which the portfolio management services provided by NAM to the Funds were transferred to Nuveen Asset Management, LLC (“NAM LLC”), a newly-organized wholly-owned subsidiary of the Adviser and the Adviser changed its name to Nuveen Fund Advisors, Inc. (“NFA”). The Adviser, under its new name NFA, continues to serve as investment adviser to the Funds and, in that capacity, will continue to provide various oversight, administrative, compliance and other services. To effectuate the foregoing, NFA entered into sub-advisory agreements with NAM LLC on behalf of the Funds (each a “Sub-Advisory Agreement”). Under each Sub-Advisory Agreement, NAM LLC, subject to the oversight of NFA and the Board, will furnish an investment program, make investment decisions for, and place all orders for the purchase and sale of securities for the portion of the respective Fund’s investment portfolio allocated to it by NFA. There have been no changes to the advisory fees paid by the Funds; rather, NFA will pay a portion of the investment advisory fee it receives to NAM LLC for its sub-advisory services. The Independent Board Members reviewed the allocation of fees between NFA and NAM LLC. NFA and NAM LLC do not anticipate any reduction in the nature or level of services provided to the Funds following the Restructuring. The personnel of NFA who engaged in portfolio management activities prior to the spinoff of NAM LLC are not expected to materially change as a result of the spinoff. In light of the foregoing, at a meeting held on November 16-18, 2010, the Board Members, including a majority of the Independent Board Members, approved the Sub-Advisory Agreements on behalf of the Funds. Given that the Restructuring was not expected to reduce the level or nature of services provided and the advisory fees paid by the Funds were the same, the factors considered and determinations made at the May Meeting in approving the Advisory Agreements were equally applicable to the approval of the Sub-Advisory Agreements.
106 Nuveen Investments
Reinvest Automatically, Easily and Conveniently
Nuveen makes reinvesting easy. A phone call is all it takes to set up your reinvestment account.
Nuveen Closed-End Funds Automatic Reinvestment Plan
Your Nuveen Closed-End Fund allows you to conveniently reinvest distributions in additional Fund shares.
By choosing to reinvest, you’ll be able to invest money regularly and automatically, and watch your investment grow through the power of compounding. Just like distributions in cash, there may be times when income or capital gains taxes may be payable on distributions that are reinvested.
It is important to note that an automatic reinvestment plan does not ensure a profit, nor does it protect you against loss in a declining market.
Easy and convenient
To make recordkeeping easy and convenient, each month you’ll receive a statement showing your total distributions, the date of investment, the shares acquired and the price per share, and the total number of shares you own.
How shares are purchased
The shares you acquire by reinvesting will either be purchased on the open market or newly issued by the Fund. If the shares are trading at or above net asset value at the time of valuation, the Fund will issue new shares at the greater of the net asset value or 95% of the then-current market price. If the shares are trading at less than net asset value, shares for your account will be purchased on the open market. If the Plan Agent begins purchasing Fund shares on the open market while shares are trading below net asset value, but the Fund’s shares subsequently trade at or above their net asset value before the Plan Agent is able to complete its purchases, the Plan Agent may cease open-market purchases and may invest the uninvested portion of the distribution in newly-issued Fund shares at a price equal to the greater of the shares’ net asset value or 95% of the shares’ market value on the last business day immediately prior to the purchase date. Distributions received to purchase shares in the open market will normally be invested shortly after the distribution payment date. No interest will be paid on distributions awaiting reinvestment. Because the market price of the shares may increase before purchases are completed, the average purchase price per share may
Nuveen Investments 107
Reinvest Automatically,
Easily and Conveniently (continued)
exceed the market price at the time of valuation, resulting in the acquisition of fewer shares than if the distribution had been paid in shares issued by the Fund. A pro rata portion of any applicable brokerage commissions on open market purchases will be paid by Plan participants. These commissions usually will be lower than those charged on individual transactions.
Flexible
You may change your distribution option or withdraw from the Plan at any time, should your needs or situation change.
You can reinvest whether your shares are registered in your name, or in the name of a brokerage firm, bank, or other nominee. Ask your investment advisor if his or her firm will participate on your behalf. Participants whose shares are registered in the name of one firm may not be able to transfer the shares to another firm and continue to participate in the Plan.
The Fund reserves the right to amend or terminate the Plan at any time. Although the Fund reserves the right to amend the Plan to include a service charge payable by the participants, there is no direct service charge to participants in the Plan at this time.
Call today to start reinvesting distributions
For more information on the Nuveen Automatic Reinvestment Plan or to enroll in or withdraw from the Plan, speak with your financial advisor or call us at (800) 257-8787.
108 Nuveen Investments
Glossary of Terms
Used in this Report
| · | Auction Rate Bond: An auction rate bond is a security whose interest payments are adjusted periodically through an auction process, which process typically also serves as a means for buying and selling the bond. Auctions that fail to attract enough buyers for all the shares offered for sale are deemed to have “failed,” with current holders receiving a formula-based interest rate until the next scheduled auction. |
| · | Average Annual Total Return: This is a commonly used method to express an investment’s performance over a particular, usually multi-year time period. It expresses the return that would have been necessary each year to equal the invest- ment’s actual cumulative performance (including change in NAV or market price and reinvested dividends and capital gains distributions, if any) over the time period being considered. |
| · | Average Effective Maturity: The market-value-weighted average of the effective maturity dates of the individual securities including cash. In the case of a bond that has been advance-refunded to a call date, the effective maturity is the date on which the bond is scheduled to be redeemed using the proceeds of an escrow account. In most other cases the effective maturity is the stated maturity date of the security. |
| · | Inverse Floaters: Inverse floating rate securities, also known as inverse floaters, are created by depositing a municipal bond, typically with a fixed interest rate, into a special purpose trust created by a broker-dealer. This trust, in turn, (a) issues floating rate certificates typically paying short-term tax-exempt interest rates to third parties in amounts equal to some fraction of the deposited bond’s par amount or market value, and (b) issues an inverse floating rate certificate (sometimes referred to as an “inverse floater”) to an investor (such as a Fund) interested in gaining investment exposure to a long-term municipal bond. The income received by the holder of the inverse floater varies inversely with the short-term rate paid to the floating rate certificates’ holders, and in most circumstances the holder of the inverse floater bears substantially all of the underlying bond’s downside investment risk. The holder of the inverse floater typi- cally also benefits disproportionately from any potential appreciation of the underlying bond’s value. Hence, an inverse floater essentially represents an investment in the underlying bond on a leveraged basis. |
| · | Leverage: Using borrowed money to invest in securities or other assets. |
Nuveen Investments 109
Glossary of Terms
Used in this Report (continued)
| · | Leverage-Adjusted Duration: Duration is a measure of the expected period over which a bond’s principal and interest will be paid, and consequently is a measure of the sensitivity of a bond’s or bond Fund’s value to changes when market interest rates change. Generally, the longer a bond’s or Fund’s duration, the more the price of the bond or Fund will change as interest rates change. Leverage-adjusted duration takes into account the leveraging process for a Fund and therefore is longer than the duration of the Fund’s portfolio of bonds. |
| · | Market Yield (also known as Dividend Yield or Current Yield): An investment’s current annualized dividend divided by its current market price. |
| · | Net Asset Value (NAV): A Fund’s NAV per common share is calculated by subtracting the liabilities of the Fund (including any Preferred shares issued in order to leverage the Fund) from its total assets and then dividing the remainder by the number of common shares outstanding. Fund NAVs are calculated at the end of each business day. |
| · | Pre-refunding: Pre-refunding, also known as advanced refundings or refinancings, is a procedure used by state and local governments to refinance municipal bonds to lower interest expenses. The issuer sells new bonds with a lower yield and uses the proceeds to buy U.S. Treasury securities, the interest from which is used to make payments on the higher-yielding bonds. Because of this collateral, pre-refunding generally raises a bond’s credit rating and thus its value. |
| · | Structural Leverage: Structural Leverage consists of preferred shares or debt issued by the fund. Both of these are part of a fund’s capital structure. Structural leverage is sometimes referred to as “’40 Act Leverage” and is subject to asset coverage limits set in the Investment Company Act of 1940. |
| · | Taxable-Equivalent Yield: The yield necessary from a fully taxable investment to equal, on an after-tax basis, the yield of a municipal bond investment. |
| · | Zero Coupon Bond: A zero coupon bond does not pay a regular interest coupon to its holders during the life of the bond. Tax-exempt income to the holder of the bond comes from accretion of the difference between the original purchase price of the bond at issuance and the par value of the bond at maturity and is effectively paid at maturity. The market prices of zero coupon bonds generally are more volatile than the market prices of bonds that pay interest periodically. |
110 Nuveen Investments
Other Useful Information
Quarterly Portfolio of Investments and Proxy Voting Information
You may obtain (i) each Fund’s quarterly portfolio of investments, (ii) information regarding how the Funds voted proxies relating to portfolio securities held during the most recent twelve-month period ended June 30, and (iii) a description of the policies and procedures that the Funds used to determine how to vote proxies relating to portfolio securities without charge, upon request, by calling Nuveen Investments toll-free at (800) 257-8787 or on Nuveen’s website at www.nuveen.com.
You may also obtain this and other Fund information directly from the Securities and Exchange Commission (SEC). The SEC may charge a copying fee for this information. Visit the SEC on-line at http://www.sec.gov or in person at the SEC’s Public Reference Room in Washington, D.C. Call the SEC at (202) 942-8090 for room hours and operation. You may also request Fund information by sending an e-mail request to publicinfo@sec.gov or by writing to the SEC’s Public References Section at 100 F Street NE, Washington, D.C. 20549.
CEO Certification Disclosure
Each Fund’s Chief Executive Officer has submitted to the New York Stock Exchange (NYSE) the annual CEO certification as required by Section 303A.12(a) of the NYSE Listed Company Manual.
Each Fund has filed with the SEC the certification of its Chief Executive Officer and Chief Financial Officer required by Section 302 of the Sarbanes-Oxley Act.
Common and Preferred Share Information
Each Fund intends to repurchase and/or redeem shares of its own common and/or auction rate preferred stock in the future at such times and in such amounts as is deemed advisable. During the period covered by this report, the Funds repurchased and/or redeemed shares of their common and/or auction rate preferred stock as shown in the accompanying table.
| | | |
| | Common Shares | Preferred Shares |
Fund | Repurchased | Redeemed |
NUM | 3,400 | — |
NMP | 8,300 | — |
NZW | 1,700 | 571 |
NUO | — | — |
NXI | — | 660 |
NBJ | — | — |
NVJ | — | — |
Any future repurchases and/or redemptions will be reported to shareholders in the next annual or semi-annual report.
Board of Directors/Trustees
John P. Amboian
Robert P. Bremner
Jack B. Evans
William C. Hunter
David J. Kundert
William J. Schneider
Judith M. Stockdale
Carole E. Stone
Virginia L. Stringer
Terence J. Toth
Fund Manager
Nuveen Fund Advisors, Inc.
333 West Wacker Drive
Chicago, IL 60606
Custodian
State Street Bank
& Trust Company
Boston, MA
Transfer Agent and Shareholder Services
State Street Bank
& Trust Company
Nuveen Funds
P.O. Box 43071
Providence, RI 02940-3071
(800) 257-8787
Legal Counsel
Chapman and Cutler LLP
Chicago, IL
Independent Registered Public Accounting Firm
Ernst & Young LLP
Chicago, IL
Nuveen Investments 111
Nuveen Investments:
Serving Investors for Generations
Since 1898, financial advisors and their clients have relied on Nuveen Investments to provide dependable investment solutions through continued adherence to proven, long-term investing principles. Today, we offer a range of high quality equity and fixed-income solutions designed to be integral components of a well-diversified core portfolio.
Focused on meeting investor needs.
Nuveen Investments is a global investment management firm that seeks to help secure the long-term goals of institutions and high net worth investors as well as the consultants and financial advisors who serve them. We market our growing range of specialized investment solutions under the high-quality brands of HydePark, NWQ, Nuveen Asset Management, Santa Barbara, Symphony, Tradewinds and Winslow Capital. In total, Nuveen Investments managed approximately $197 billion of assets as of December 31, 2010.
Find out how we can help you.
To learn more about how the products and services of Nuveen Investments may be able to help you meet your financial goals, talk to your financial advisor, or call us at (800) 257-8787. Please read the information provided carefully before you invest. Investors should consider the investment objective and policies, risk considerations, charges and expenses of any investment carefully. Where applicable, be sure to obtain a prospectus, which contains this and other relevant information. To obtain a prospectus, please contact your securities representative or Nuveen Investments, 333 W. Wacker Dr., Chicago, IL 60606. Please read the prospectus carefully before you invest or send money.
Learn more about Nuveen Funds at: www.nuveen.com/cef
Nuveen makes things e-simple.
It only takes a minute to sign up for e-Reports. Once enrolled, you’ll receive an e-mail as soon as your Nuveen Fund information is ready – no more waiting for delivery by regular mail. Just click on the link within the e-mail to see the report and save it on your computer if you wish.
Free e-Reports right to your e-mail!
www.investordelivery.com
If you receive your Nuveen Fund distributions and statements from your financial advisor or brokerage account.
OR
www.nuveen.com/accountaccess
If you receive your Nuveen Fund distributions and statements directly from Nuveen.
Distributed by
Nuveen Investments, LLC
333 West Wacker Drive
Chicago, IL 60606
www.nuveen.com
EAN-C-0211D