UNITED STATES
SECURITIES AND EXCHANGE COMMISSION
Washington, D.C. 20549
FORM N-CSR
CERTIFIED SHAREHOLDER REPORT OF REGISTERED
MANAGEMENT INVESTMENT COMPANIES
Investment Company Act file number 811-09397
The Gabelli Utilities Fund
(Exact name of registrant as specified in charter)
One Corporate Center
Rye, New York 10580-1422
(Address of principal executive offices) (Zip code)
Bruce N. Alpert
Gabelli Funds, LLC
One Corporate Center
Rye, New York 10580-1422
(Name and address of agent for service)
Registrant’s telephone number, including area code: 1-800-422-3554
Date of fiscal year end: December 31
Date of reporting period: December 31, 2011
Form N-CSR is to be used by management investment companies to file reports with the Commission not later than 10 days after the transmission to stockholders of any report that is required to be transmitted to stockholders under Rule 30e-1 under the Investment Company Act of 1940 (17 CFR 270.30e-1). The Commission may use the information provided on Form N-CSR in its regulatory, disclosure review, inspection, and policymaking roles.
A registrant is required to disclose the information specified by Form N-CSR, and the Commission will make this information public. A registrant is not required to respond to the collection of information contained in Form N-CSR unless the Form displays a currently valid Office of Management and Budget (“OMB”) control number. Please direct comments concerning the accuracy of the information collection burden estimate and any suggestions for reducing the burden to Secretary, Securities and Exchange Commission, 100 F Street, NE, Washington, DC 20549. The OMB has reviewed this collection of information under the clearance requirements of 44 U.S.C. § 3507.
| Item 1. | Reports to Stockholders. |
The Report to Shareholders is attached herewith.
The Gabelli Utilities Fund
Annual Report — December 31, 2011

Mario J. Gabelli, CFA
To Our Shareholders,
The Sarbanes-Oxley Act requires a fund’s principal executive and financial officers to certify the entire contents of the semiannual and annual shareholder reports in a filing with the Securities and Exchange Commission (the “SEC”) on Form N-CSR. This certification would cover the portfolio manager’s commentary and subjective opinions if they are attached to or a part of the financial statements. Many of these comments and opinions would be difficult or impossible to certify.
Because we do not want our portfolio managers to eliminate their opinions and/or restrict their commentary to historical facts, we have separated their commentary from the financial statements and investment portfolio and have sent it to you separately. Both the commentary and the financial statements, including the portfolio of investments, will be available on our website at www.gabelli.com.
Performance Discussion (Unaudited)
For the year ended December 31, 2011, the net asset value (“NAV”) per Class AAA Share of The Gabelli Utilities Fund increased 8.0% compared with an increase of 19.9% for the Standard & Poor’s (“S&P”) 500 Utilities Index. See page 2 for additional performance information.
Enclosed are the schedule of investments and financial statements as of December 31, 2011.
In 2011, the S&P 500 Utilities Index outperformed the S&P 500 Index and provided investors with a 19.9% total return compared to a 2.1% total return for the S&P 500 Index. In the midst of significant market volatility, slow economic growth, and low interest rates, investors were attracted to the electric utility sector’s safe 4% plus dividend returns as well as solid earnings and dividend growth potential.
In addition, utility stocks benefited from the year end 2010 Obama/Republican tax compromise, which included a two year extension of the 15% dividend and capital gains tax rate and a “bonus” 100% tax deduction on capital investments made from September 2010 through year end 2011 (the bonus rate is scheduled to be 50% in 2012).
Consistent with our long-term investment thesis, utility stocks continue to benefit from consolidation as several of the stronger 2011 stock performances were due to takeovers at premium prices. Driven by the rapidly growing natural gas shale development, the natural gas infrastructure and gas utility/pipeline business is undergoing significant consolidation.
We highlight some of the more significant or notable consolidation activity over the past twelve months:
| • | | Kinder Morgan, one of the larger energy pipeline and storage companies in North America, agreed to buy El Paso Corporation, a major energy pipeline and exploration and production company. The October 16, 2011 announcement highlights the value of owning pipeline footprints to connect new shale supplies and major consumption markets as well as supporting the long-term viability of shale production. |
| • | | Energy Transfer Equity, a Dallas based diversified energy partnership, emerged as the winning bidder for Southern Union Gas, a Houston based diversified gas pipeline/distribution company. |
| • | | Central Vermont Public Service Corp. (0.5% of net assets as of December 31, 2011) agreed to accept a $35.25 per share cash bid from Montreal based Gaz Metro on July 12, 2011. |
| • | | Exelon Corp. (0.6%), the nation’s largest nuclear owner and Illinois/Pennsylvania electric utility, agreed to acquire Baltimore based Constellation Energy Group Inc. (1.6%), for an enterprise value of $10.5 billion, or $38.59 per share, on April 28, 2011. |
| • | | DPL Inc; the holding company for Dayton Power & Light, was acquired on November 28, 2011 by Virginia based AES Corporation (1.3%), a global power company and owner of Indianapolis Power & Light. |
| • | | FirstEnergy Corp. (1.0%), a multistate electric utility based in Akron, OH, completed its acquisition of Allegheny Energy on February 25, 2011. |
| • | | Progress Energy Inc., (0.8%), based in Raleigh, NC and serving the Carolinas and central Florida, agreed to be acquired by Duke Energy, a multistate utility based in Charlotte, NC, on January 10, 2012. |
| • | | In December 2011, AGL, a multistate gas utility based in Atlanta, completed the acquisition of the northern Illinois gas utility Nicor in a cash and stock transaction. |
We appreciate your confidence and trust.
| | | | | | |
| February 23, 2012 | | | | Sincerely yours, 
Bruce N. Alpert President | | |
2
Comparative Results
| | | | | | | | | | | | | | | | |
Average Annual Returns through December 31, 2011 (a) (Unaudited) | |
| | | 1 Year | | | 5 Year | | | 10 Year | | | Since
Inception
(8/31/99) | |
Class AAA (GABUX) | | | 8.04 | % | | | 3.90 | % | | | 7.46 | % | | | 7.62 | % |
S&P 500 Utilities Index | | | 19.91 | | | | 3.71 | | | | 6.42 | | | | 5.06 | |
S&P 500 Index | | | 2.11 | | | | (0.25 | ) | | | 2.92 | | | | 1.44 | |
Lipper Utility Fund Average | | | 12.43 | | | | 2.89 | | | | 6.96 | | | | 5.13 | |
Class A (GAUAX) | | | 8.16 | | | | 3.93 | | | | 7.50 | | | | 7.65 | |
With sales charge (b) | | | 1.94 | | | | 2.71 | | | | 6.86 | | | | 7.13 | |
Class B (GAUBX) | | | 7.32 | | | | 3.13 | | | | 6.71 | | | | 7.01 | |
With contingent deferred sales charge (c) | | | 2.32 | | | | 2.77 | | | | 6.71 | | | | 7.01 | |
Class C (GAUCX) | | | 7.26 | | | | 3.14 | | | | 6.75 | | | | 7.04 | |
With contingent deferred sales charge (d) | | | 6.26 | | | | 3.14 | | | | 6.75 | | | | 7.04 | |
Class I (GAUIX) | | | 8.31 | | | | 4.08 | | | | 7.55 | | | | 7.69 | |
In the current prospectus dated April 29, 2011, the expense ratios for Class AAA, A, B, C, and I Shares are 1.43%, 1.43%, 2.18%, 2.18%, and 1.18%, respectively. See page 12 for the expense ratios for the year ended December 31, 2011. Class AAA and Class I Shares do not have a sales charge. The maximum sales charge for Class A, B, and C Shares is 5.75%, 5.00%, and 1.00%, respectively.
| | (a) | Returns represent past performance and do not guarantee future results. Total returns and average annual returns reflect changes in share price, reinvestment of distributions, and are net of expenses. Investment returns and the principal value of an investment will fluctuate. When shares are redeemed, they may be worth more or less than their original cost. The Fund imposes a 2% redemption fee on shares sold or exchanged within seven days after the date of purchase. Current performance may be lower or higher than the performance data presented. Visit www.gabelli.com for performance information as of the most recent month end. Investors should carefully consider the investment objectives, risks, charges, and expenses of the Fund before investing. The prospectus contains information about these and other matters and should be read carefully before investing. The values of utility stocks generally changes as long-term interest rates change. Funds investing in a single sector, such as utilities, may be subject to more volatility than funds that invest more broadly. The utilities industry can be significantly affected by government regulation, financing difficulties, supply or demand of services or fuel, and natural resources conservation. The Class AAA Share NAVs are used to calculate performance for the periods prior to the issuance of Class A Shares, Class B Shares, and Class C Shares on December 31, 2002 and Class I Shares on January 11, 2008. The actual performance of the Class B Shares and Class C Shares would have been lower due to the additional expenses associated with these classes of shares. The actual performance of the Class I Shares would have been higher due to lower expenses related to this class of shares. The S&P 500 Utilities Index is an unmanaged market capitalization weighted index of large capitalization stocks that may include facilities generation and transmission or distribution of electricity, gas, or water. The S&P 500 Index is a market capitalization weighted index of 500 large capitalization stocks commonly used to represent the U.S. equity market. The Lipper Utility Fund Average reflects the average performance of mutual funds classified in this particular category. Dividends are considered reinvested. You cannot invest directly in an index. | |
| | (b) | Performance results include the effect of the maximum 5.75% sales charge at the beginning of the period. | |
| | (c) | Assuming payment of the maximum contingent deferred sales charge (CDSC). The maximum CDSC for Class B Shares is 5% which is gradually reduced to 0% after six years. | |
| | (d) | Assuming payment of the 1% maximum CDSC imposed on redemptions made within one year of purchase. | |
COMPARISON OF CHANGE IN VALUE OF A $10,000 INVESTMENT IN THE GABELLI UTILITIES FUND (CLASS AAA SHARES), S&P 500 UTILITIES INDEX, AND LIPPER UTILITY FUND AVERAGE (Unaudited)
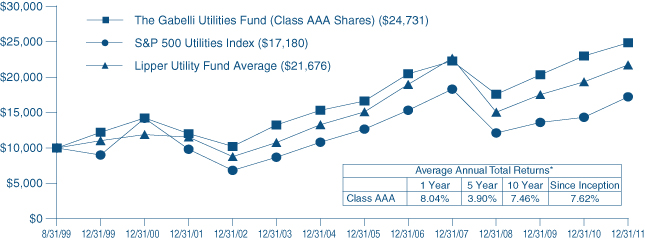
| * | Past performance is not predictive of future results. The performance tables and graph do not reflect the deduction of taxes that a shareholder would pay on Fund distributions or the redemption of Fund shares. |
3
The Gabelli Utilities Fund
Disclosure of Fund Expenses (Unaudited)
For the Six Month Period from July 1, 2011 through December 31, 2011
Expense Table
We believe it is important for you to understand the impact of fees and expenses regarding your investment. All mutual funds have operating expenses. As a shareholder of a fund, you incur ongoing costs, which include costs for portfolio management, administrative services, and shareholder reports (like this one), among others. Operating expenses, which are deducted from a fund’s gross income, directly reduce the investment return of a fund. When a fund’s expenses are expressed as a percentage of its average net assets, this figure is known as the expense ratio. The following examples are intended to help you understand the ongoing costs (in dollars) of investing in your Fund and to compare these costs with those of other mutual funds. The examples are based on an investment of $1,000 made at the beginning of the period shown and held for the entire period.
The Expense Table below illustrates your Fund’s costs in two ways:
Actual Fund Return: This section provides information about actual account values and actual expenses. You may use this section to help you to estimate the actual expenses that you paid over the period after any fee waivers and expense reimbursements. The “Ending Account Value” shown is derived from the Fund’s actual return during the past six months, and the “Expenses Paid During Period” shows the dollar amount that would have been paid by an investor who started with $1,000 in the Fund. You may use this information, together with the amount you invested, to estimate the expenses that you paid over the period.
To do so, simply divide your account value by $1,000 (for example, an $8,600 account value divided by $1,000 = 8.6), then multiply the result by the number given for your Fund under the heading “Expenses Paid During Period” to estimate the expenses you paid during this period.
Hypothetical 5% Return: This section provides information about hypothetical account values and hypothetical expenses based on the Fund’s actual expense ratio. It assumes a hypothetical annualized return of 5% before expenses during the period shown.
In this case – because the hypothetical return used is not the Fund’s actual return – the results do not apply to your investment and you cannot use the hypothetical account value and expense to estimate the actual ending account balance or expenses you paid for the period. This example is useful in making comparisons of the ongoing costs of investing in the Fund and other funds. To do so, compare this 5% hypothetical example with the 5% hypothetical examples that appear in shareholder reports of other funds.
Please note that the expenses shown in the table are meant to highlight your ongoing costs only and do not reflect any transactional costs such as sales charges (loads), redemption fees, or exchange fees, if any, which would be described in the Prospectus. If these costs were applied to your account, your costs would be higher. Therefore, the 5% hypothetical return is useful in comparing ongoing costs only, and will not help you determine the relative total costs of owning different funds. The “Annualized Expense Ratio” represents the actual expenses for the last six months and may be different from the expense ratio in the Financial Highlights which is for the year ended December 31, 2011.
| | | | | | | | | | | | | | | | |
| | | Beginning
Account Value
07/01/11 | | | Ending
Account Value
12/31/11 | | | Annualized
Expense
Ratio | | | Expenses
Paid During
Period* | |
The Gabelli Utilities Fund | | | | | | | | | |
Actual Fund Return | | | | | | | | | | | | | |
| Class AAA | | | $1,000.00 | | | | $ 995.60 | | | | 1.42 | % | | | $ 7.14 | |
| Class A | | | $1,000.00 | | | | $ 995.80 | | | | 1.42 | % | | | $ 7.14 | |
| Class B | | | $1,000.00 | | | | $ 991.60 | | | | 2.18 | % | | | $10.94 | |
| Class C | | | $1,000.00 | | | | $ 991.70 | | | | 2.17 | % | | | $10.89 | |
| Class I | | | $1,000.00 | | | | $ 997.30 | | | | 1.16 | % | | | $ 5.84 | |
Hypothetical 5% Return | | | | | | | | | |
| Class AAA | | | $1,000.00 | | | | $1,018.05 | | | | 1.42 | % | | | $ 7.22 | |
| Class A | | | $1,000.00 | | | | $1,018.05 | | | | 1.42 | % | | | $ 7.22 | |
| Class B | | | $1,000.00 | | | | $1,014.22 | | | | 2.18 | % | | | $11.07 | |
| Class C | | | $1,000.00 | | | | $1,014.27 | | | | 2.17 | % | | | $11.02 | |
| Class I | | | $1,000.00 | | | | $1,019.36 | | | | 1.16 | % | | | $ 5.90 | |
| * | Expenses are equal to the Fund’s annualized expense ratio for the last six months multiplied by the average account value over the period, multiplied by the number of days in the most recent fiscal half year (184 days), then divided by 365. |
4
Summary of Portfolio Holdings (Unaudited)
The following table presents portfolio holdings as a percent of net assets as of December 31, 2011:
The Gabelli Utilities Fund
| | | | |
Energy and Utilities | | | 56.4% | |
U.S. Government Obligations | | | 20.5% | |
Communications | | | 14.4% | |
| | | | |
Other | | | 9.1% | |
Other Assets and Liabilities (Net) | �� | | (0.4)% | |
| | | | |
| | | 100.0% | |
| | | | |
The Fund files a complete schedule of portfolio holdings with the SEC for the first and third quarters of each fiscal year on Form N-Q. Shareholders may obtain this information at www.gabelli.com or by calling the Fund at 800-GABELLI (800-422-3554). The Fund’s Form N-Q is available on the SEC’s website at www.sec.gov and may also be reviewed and copied at the SEC’s Public Reference Room in Washington, DC. Information on the operation of the Public Reference Room may be obtained by calling 800-SEC-0330.
Proxy Voting
The Fund files Form N-PX with its complete proxy voting record for the twelve months ended June 30th, no later than August 31st of each year. A description of the Fund’s proxy voting policies, procedures, and how the Fund voted proxies relating to portfolio securities is available without charge, upon request, by (i) calling 800-GABELLI (800-422-3554); (ii) writing to The Gabelli Funds at One Corporate Center, Rye, NY 10580-1422; or (iii) visiting the SEC’s website at www.sec.gov.
5
The Gabelli Utilities Fund
Schedule of Investments — December 31, 2011
| | | | | | | | | | | | |
Shares | | | | | Cost | | | Market
Value | |
| | | | | | | | | | | | |
| |
| | | | COMMON STOCKS — 79.9% | |
| | | | ENERGY AND UTILITIES — 56.4% | |
| | | | Energy and Utilities: Alternative Energy — 0.2% | |
| | 300,000 | | | Algonquin Power & Utilities Corp. | | $ | 1,465,933 | | | $ | 1,890,552 | |
| | 51,066 | | | Areva SA† | | | 2,110,986 | | | | 1,261,697 | |
| | 26,000 | | | Ormat Industries Ltd. | | | 196,547 | | | | 123,485 | |
| | 63,000 | | | Ormat Technologies Inc. | | | 1,836,899 | | | | 1,135,890 | |
| | | | | | | | | | | | |
| | | | | | | 5,610,365 | | | | 4,411,624 | |
| | | | | | | | | | | | |
| |
| | | | Energy and Utilities: Electric Integrated — 28.4% | |
| | 10,000 | | | AES Tiete SA, Preference | | | 144,154 | | | | 144,109 | |
| | 350,034 | | | ALLETE Inc. | | | 12,749,272 | | | | 14,694,427 | |
| | 105,000 | | | Alliant Energy Corp. | | | 3,437,727 | | | | 4,631,550 | |
| | 560,000 | | | Ameren Corp. | | | 17,675,760 | | | | 18,552,800 | |
| | 20,000 | | | American DG Energy Inc.† | | | 32,051 | | | | 29,000 | |
| | 665,000 | | | American Electric Power Co. Inc. | | | 24,422,047 | | | | 27,471,150 | |
| | 3,497 | | | Atlantic Power Corp.† | | | 63,204 | | | | 49,841 | |
| | 248,000 | | | Avista Corp. | | | 5,687,832 | | | | 6,386,000 | |
| | 734,000 | | | Black Hills Corp. | | | 21,058,544 | | | | 24,647,720 | |
| | 35,000 | | | Cleco Corp. | | | 721,890 | | | | 1,333,500 | |
| | 60,000 | | | CMS Energy Corp. | | | 402,675 | | | | 1,324,800 | |
| | 1,070,000 | | | Constellation Energy Group Inc. | | | 32,885,808 | | | | 42,446,900 | |
| | 250,000 | | | Dominion Resources Inc. | | | 10,534,886 | | | | 13,270,000 | |
| | 5,000 | | | DTE Energy Co. | | | 196,215 | | | | 272,250 | |
| | 410,000 | | | Duke Energy Corp. | | | 6,665,740 | | | | 9,020,000 | |
| | 200,000 | | | Dynegy Inc.† | | | 977,759 | | | | 554,000 | |
| | 1,110,000 | | | Edison International | | | 38,539,650 | | | | 45,954,000 | |
| | 794,080 | | | El Paso Electric Co. | | | 17,222,746 | | | | 27,506,931 | |
| | 4,500 | | | Entergy Corp. | | | 213,681 | | | | 328,725 | |
| | 375,000 | | | Exelon Corp. | | | 16,280,543 | | | | 16,263,750 | |
| | 620,000 | | | FirstEnergy Corp. | | | 20,252,846 | | | | 27,466,000 | |
| | 1,430,000 | | | Great Plains Energy Inc. | | | 30,257,267 | | | | 31,145,400 | |
| | 606,487 | | | Hawaiian Electric Industries Inc. | | | 14,052,632 | | | | 16,059,776 | |
| | 16,500 | | | IDACORP Inc. | �� | | 649,011 | | | | 699,765 | |
| | 298,000 | | | Integrys Energy Group Inc. | | | 14,768,630 | | | | 16,145,640 | |
| | 9,000 | | | ITC Holdings Corp. | | | 649,897 | | | | 682,920 | |
| | 229,000 | | | MGE Energy Inc. | | | 7,448,594 | | | | 10,710,330 | |
| | 1,044,000 | | | NextEra Energy Inc. | | | 52,997,974 | | | | 63,558,720 | |
| | 215,000 | | | NiSource Inc. | | | 4,600,330 | | | | 5,119,150 | |
| | 800,085 | | | NorthWestern Corp. | | | 23,349,387 | | | | 28,635,042 | |
| | 83,000 | | | NV Energy Inc. | | | 1,252,309 | | | | 1,357,050 | |
| | 358,000 | | | OGE Energy Corp. | | | 10,636,541 | | | | 20,302,180 | |
| | 548,000 | | | Otter Tail Corp. | | | 12,693,344 | | | | 12,066,960 | |
| | 140,000 | | | Pepco Holdings Inc. | | | 2,819,343 | | | | 2,842,000 | |
| | 115,000 | | | PG&E Corp. | | | 4,071,199 | | | | 4,740,300 | |
| | 355,000 | | | Pinnacle West Capital Corp. | | | 14,784,308 | | | | 17,103,900 | |
| | 1,610,007 | | | PNM Resources Inc. | | | 19,875,583 | | | | 29,350,428 | |
| | 75,000 | | | PPL Corp. | | | 1,872,001 | | | | 2,206,500 | |
| | 377,000 | | | Progress Energy Inc. | | | 16,802,148 | | | | 21,119,540 | |
| | | | | | | | | | | | |
Shares | | | | | Cost | | | Market
Value | |
| | | | | | | | | | | | |
| | 175,000 | | | Public Service Enterprise Group Inc. | | $ | 5,018,910 | | | $ | 5,776,750 | |
| | 670,000 | | | SCANA Corp. | | | 26,684,660 | | | | 30,190,200 | |
| | 1,355,047 | | | TECO Energy Inc. | | | 24,483,270 | | | | 25,935,600 | |
| | 360,093 | | | The Empire District Electric Co. | | | 7,333,586 | | | | 7,594,361 | |
| | 525,000 | | | The Southern Co. | | | 19,419,663 | | | | 24,302,250 | |
| | 223,075 | | | UniSource Energy Corp. | | | 6,429,058 | | | | 8,235,929 | |
| | 35,000 | | | Unitil Corp. | | | 853,544 | | | | 993,300 | |
| | 488,000 | | | Vectren Corp. | | | 13,582,710 | | | | 14,752,240 | |
| | 968,000 | | | Westar Energy Inc. | | | 22,809,071 | | | | 27,859,040 | |
| | 683,000 | | | Wisconsin Energy Corp. | | | 16,300,358 | | | | 23,877,680 | |
| | 343,000 | | | Xcel Energy Inc. | | | 7,130,740 | | | | 9,480,520 | |
| | | | | | | | | | | | |
| | | | | | | 613,791,098 | | | | 745,190,924 | |
| | | | | | | | | | | | |
| |
| | | | Energy and Utilities: Electric Transmission and Distribution — 4.0% | |
| | 374,967 | | | Central Vermont Public Service Corp. | | | 10,439,632 | | | | 13,161,342 | |
| | 442,094 | | | CH Energy Group Inc. | | | 20,469,425 | | | | 25,809,448 | |
| | 420,000 | | | Consolidated Edison Inc. | | | 20,285,880 | | | | 26,052,600 | |
| | 84,000 | | | GenOn Energy Inc.† | | | 546,834 | | | | 219,240 | |
| | 540,000 | | | Northeast Utilities | | | 13,161,863 | | | | 19,477,800 | |
| | 440,000 | | | NSTAR | | | 13,599,321 | | | | 20,662,400 | |
| | 17,000 | | | UIL Holdings Corp. | | | 508,153 | | | | 601,290 | |
| | | | | | | | | | | | |
| | | | | | | 79,011,108 | | | | 105,984,120 | |
| | | | | | | | | | | | |
| |
| | | | Energy and Utilities: Global Utilities — 2.0% | |
| | 27,000 | | | Chubu Electric Power Co. Inc. | | | 630,066 | | | | 504,079 | |
| | 23,000 | | | E.ON AG | | | 768,708 | | | | 496,227 | |
| | 11,004 | | | EDF SA | | | 394,792 | | | | 267,748 | |
| | 4,000 | | | EDP - Energias de Portugal SA, ADR | | | 112,064 | | | | 124,400 | |
| | 200,000 | | | Electric Power Development Co. Ltd. | | | 4,991,198 | | | | 5,318,955 | |
| | 11,000 | | | Eletropaulo Metropolitana Eletricidade de Sao Paulo SA, Preference | | | 239,476 | | | | 215,253 | |
| | 190,000 | | | Emera Inc. | | | 4,704,398 | | | | 6,162,061 | |
| | 35,000 | | | Enagas SA | | | 916,226 | | | | 647,318 | |
| | 238,000 | | | Endesa SA | | | 7,057,638 | | | | 4,882,288 | |
| | 230,000 | | | Enel SpA | | | 1,285,148 | | | | 935,896 | |
| | 58,800 | | | GDF Suez† | | | 0 | | | | 76 | |
| | 185,000 | | | Hera SpA | | | 358,114 | | | | 264,097 | |
| | 58,000 | | | Hokkaido Electric Power Co. Inc. | | | 1,116,714 | | | | 825,880 | |
| | 30,000 | | | Hokuriku Electric Power Co. | | | 565,995 | | | | 560,088 | |
| | 185,000 | | | Huaneng Power International Inc., ADR | | | 4,990,614 | | | | 3,888,700 | |
| | 73,000 | | | Iberdrola SA, ADR | | | 2,694,019 | | | | 1,759,300 | |
| | 50,192 | | | Iberdrola SA, London† | | | 617,879 | | | | 309,064 | |
| | 44,812 | | | Iberdrola SA, Madrid | | | 330,955 | | | | 280,652 | |
| | 2,000 | | | International Power plc | | | 5,935 | | | | 10,473 | |
| | 400,000 | | | Korea Electric Power Corp., ADR† | | | 5,346,025 | | | | 4,392,000 | |
See accompanying notes to financial statements.
6
The Gabelli Utilities Fund
Schedule of Investments (Continued) — December 31, 2011
| | | | | | | | | | | | |
Shares | | | | | Cost | | | Market
Value | |
| | | | | | | | | | | | |
| |
| | | | COMMON STOCKS (Continued) | |
| | | | ENERGY AND UTILITIES (Continued) | |
| | | | Energy and Utilities: Global Utilities (Continued) | |
| | 78,000 | | | Kyushu Electric Power Co. Inc. | | $ | 1,607,770 | | | $ | 1,116,747 | |
| | 17,000 | | | National Grid plc, ADR | | | 768,389 | | | | 824,160 | |
| | 3,000 | | | Niko Resources Ltd. | | | 207,647 | | | | 142,027 | |
| | 600 | | | Noble Energy Inc. | | | 57,110 | | | | 56,634 | |
| | 93,000 | | | Red Electrica Corporacion SA | | | 4,454,091 | | | | 3,979,868 | |
| | 24,000 | | | Shikoku Electric Power Co. Inc. | | | 473,574 | | | | 687,852 | |
| | 2,000 | | | Snam Rete Gas SpA | | | 8,967 | | | | 8,816 | |
| | 760,000 | | | Talisman Energy Inc. | | | 13,739,414 | | | | 9,690,000 | |
| | 24,000 | | | The Chugoku Electric Power Co. Inc. | | | 457,538 | | | | 420,631 | |
| | 178,000 | | | The Kansai Electric Power Co. Inc. | | | 3,723,446 | | | | 2,731,168 | |
| | 20,000 | | | The Tokyo Electric Power Co. Inc.† | | | 195,791 | | | | 47,551 | |
| | 165,000 | | | Tohoku Electric Power Co. Inc. | | | 2,930,038 | | | | 1,584,189 | |
| | | | | | | | | | | | |
| | | | | | | 65,749,739 | | | | 53,134,198 | |
| | | | | | | | | | | | |
| |
| | | | Energy and Utilities: Merchant Energy — 1.5% | |
| | 40,000 | | | GenOn Energy Inc. - Old, Escrow† (a) | | | 0 | | | | 0 | |
| | 15,000 | | | GenOn Energy Inc., Escrow† (a) | | | 0 | | | | 0 | |
| | 239,000 | | | NRG Energy Inc.† | | | 5,559,251 | | | | 4,330,680 | |
| | 2,890,026 | | | The AES Corp.† | | | 33,716,670 | | | | 34,217,908 | |
| | | | | | | | | | | | |
| | | | | | | 39,275,921 | | | | 38,548,588 | |
| | | | | | | | | | | | |
| |
| | | | Energy and Utilities: Natural Gas Integrated — 11.5% | |
| | 39,000 | | | Apache Corp. | | | 3,938,150 | | | | 3,532,620 | |
| | 80,028 | | | Atlas Energy LP | | | 1,559,812 | | | | 1,944,680 | |
| | 2,265,016 | | | El Paso Corp. | | | 34,116,342 | | | | 60,181,475 | |
| | 21,000 | | | Energen Corp. | | | 271,496 | | | | 1,050,000 | |
| | 155,000 | | | Hess Corp. | | | 11,009,414 | | | | 8,804,000 | |
| | 1,960,000 | | | National Fuel Gas Co. | | | 102,332,729 | | | | 108,936,800 | |
| | 77,000 | | | Nexen Inc. | | | 1,682,850 | | | | 1,225,070 | |
| | 243,011 | | | Northwest Natural Gas Co. | | | 11,135,099 | | | | 11,647,517 | |
| | 298,000 | | | ONEOK Inc. | | | 9,726,913 | | | | 25,833,620 | |
| | 1,275,090 | | | Southern Union Co. | | | 30,254,151 | | | | 53,694,040 | |
| | 600,000 | | | Spectra Energy Corp. | | | 13,136,488 | | | | 18,450,000 | |
| | 200,000 | | | UGI Corp. | | | 6,167,703 | | | | 5,880,000 | |
| | | | | | | | | | | | |
| | | | | | | 225,331,147 | | | | 301,179,822 | |
| | | | | | | | | | | | |
| |
| | | | Energy and Utilities: Natural Gas Utilities — 4.9% | |
| | 122,039 | | | AGL Resources Inc. | | | 4,761,343 | | | | 5,157,368 | |
| | 104,000 | | | Atmos Energy Corp. | | | 2,861,567 | | | | 3,468,400 | |
| | 70,000 | | | CenterPoint Energy Inc. | | | 1,320,716 | | | | 1,406,300 | |
| | 37,000 | | | Chesapeake Utilities Corp. | | | 1,022,882 | | | | 1,603,950 | |
| | 990,000 | | | CONSOL Energy Inc. | | | 40,081,192 | | | | 36,333,000 | |
| | 288,918 | | | Corning Natural Gas Corp. (b) | | | 3,132,853 | | | | 4,801,817 | |
| | 69,007 | | | Delta Natural Gas Co. Inc. | | | 1,985,971 | | | | 2,370,390 | |
| | 69,000 | | | Piedmont Natural Gas Co. Inc. | | | 1,692,845 | | | | 2,344,620 | |
| | | | | | | | | | | | |
Shares | | | | | Cost | | | Market
Value | |
| | | | | | | | | | | | |
| | 48,000 | | | Questar Corp. | | $ | 853,212 | | | $ | 953,280 | |
| | 40,000 | | | RGC Resources Inc. | | | 628,769 | | | | 722,800 | |
| | 70,000 | | | South Jersey Industries Inc. | | | 1,982,945 | | | | 3,976,700 | |
| | 1,205,076 | | | Southwest Gas Corp. | | | 38,698,629 | | | | 51,203,679 | |
| | 246,000 | | | The Laclede Group Inc. | | | 8,362,401 | | | | 9,955,620 | |
| | 90,000 | | | WGL Holdings Inc. | | | 3,605,030 | | | | 3,979,800 | |
| | | | | | | | | | | | |
| | | | | | | 110,990,355 | | | | 128,277,724 | |
| | | | | | | | | | | | |
| |
| | | | Energy and Utilities: Natural Resources — 1.2% | |
| | 14,000 | | | Alliance Holdings GP LP | | | 276,626 | | | | 727,720 | |
| | 50,000 | | | Anadarko Petroleum Corp. | | | 3,390,127 | | | | 3,816,500 | |
| | 95,000 | | | BP plc, ADR | | | 4,198,060 | | | | 4,060,300 | |
| | 226,000 | | | Cameco Corp. | | | 5,100,712 | | | | 4,079,300 | |
| | 18,000 | | | Compania de Minas Buenaventura SA, ADR | | | 205,537 | | | | 690,120 | |
| | 247,000 | | | Mueller Industries Inc. | | | 9,431,517 | | | | 9,489,740 | |
| | 40,000 | | | Occidental Petroleum Corp. | | | 3,184,197 | | | | 3,748,000 | |
| | 46,000 | | | Peabody Energy Corp. | | | 1,668,965 | | | | 1,523,060 | |
| | 25,000 | | | Petroleo Brasileiro SA, ADR | | | 827,867 | | | | 621,250 | |
| | 145,000 | | | Tullow Oil plc | | | 3,075,236 | | | | 3,157,069 | |
| | 20,000 | | | Uranium One Inc.† | | | 58,213 | | | | 42,405 | |
| | | | | | | | | | | | |
| | | | | | | 31,417,057 | | | | 31,955,464 | |
| | | | | | | | | | | | |
| |
| | | | Energy and Utilities: Services — 0.8% | |
| | 255,000 | | | ABB Ltd., ADR† | | | 3,686,640 | | | | 4,801,650 | |
| | 60,000 | | | Halliburton Co. | | | 1,263,908 | | | | 2,070,600 | |
| | 8,000 | | | Lufkin Industries Inc. | | | 371,878 | | | | 538,480 | |
| | 35,000 | | | MDU Resources Group Inc. | | | 760,550 | | | | 751,100 | |
| | 51,000 | | | Patterson-UTI Energy Inc. | | | 760,720 | | | | 1,018,980 | |
| | 91,000 | | | Rowan Companies Inc.† | | | 2,604,218 | | | | 2,760,030 | |
| | 12,000 | | | Tenaris SA, ADR | | | 277,440 | | | | 446,160 | |
| | 575,000 | | | Weatherford International Ltd.† | | | 9,956,551 | | | | 8,418,000 | |
| | | | | | | | | | | | |
| | | | | | | 19,681,905 | | | | 20,805,000 | |
| | | | | | | | | | | | |
| |
| | | | Energy and Utilities: Water — 0.9% | |
| | 4,000 | | | American States Water Co. | | | 110,252 | | | | 139,600 | |
| | 115,000 | | | American Water Works Co. Inc. | | | 2,539,962 | | | | 3,663,900 | |
| | 375,000 | | | Aqua America Inc. | | | 7,661,862 | | | | 8,268,750 | |
| | 4,000 | | | California Water Service Group | | | 70,055 | | | | 73,040 | |
| | 10,000 | | | Connecticut Water Service Inc. | | | 251,353 | | | | 271,300 | |
| | 4,000 | | | Consolidated Water Co. Ltd. | | | 63,846 | | | | 34,320 | |
| | 18,000 | | | Middlesex Water Co. | | | 317,415 | | | | 335,880 | |
| | 120,000 | | | Pennichuck Corp. | | | 2,666,350 | | | | 3,459,600 | |
| | 203,148 | | | SJW Corp. | | | 5,018,091 | | | | 4,802,419 | |
| | 88,000 | | | The York Water Co. | | | 1,222,051 | | | | 1,552,320 | |
| | 13,000 | | | United Utilities Group plc, ADR | | | 298,588 | | | | 245,310 | |
| | | | | | | | | | | | |
| | | | | | | 20,219,825 | | | | 22,846,439 | |
| | | | | | | | | | | | |
See accompanying notes to financial statements.
7
The Gabelli Utilities Fund
Schedule of Investments (Continued) — December 31, 2011
| | | | | | | | | | | | |
Shares | | | | | Cost | | | Market
Value | |
| | | | | | | | | | | | |
| |
| | | | COMMON STOCKS (Continued) | |
| | | | ENERGY AND UTILITIES (Continued) | |
| | | | Diversified Industrial — 0.9% | |
| | 45,000 | | | Cooper Industries plc | | $ | 2,168,185 | | | $ | 2,436,750 | |
| | 1,100,000 | | | General Electric Co. | | | 18,366,919 | | | | 19,701,000 | |
| | 35,000 | | | Mueller Water Products Inc., Cl. A | | | 250,528 | | | | 85,400 | |
| | 33,000 | | | Park-Ohio Holdings Corp.† | | | 533,225 | | | | 588,720 | |
| | 14,000 | | | Tyco International Ltd. | | | 610,821 | | | | 653,940 | |
| | | | | | | | | | | | |
| | | | | | | 21,929,678 | | | | 23,465,810 | |
| | | | | | | | | | | | |
| |
| | | | Environmental Services — 0.0% | |
| | 56,000 | | | Veolia Environnement | | | 978,796 | | | | 613,815 | |
| | | | | | | | | | | | |
| |
| | | | Exchange Traded Funds — 0.1% | |
| | 15,000 | | | Utilities HOLDRS Trust (a) | | | 1,378,870 | | | | 1,693,050 | |
| | | | | | | | | | | | |
| | | | TOTAL ENERGY AND UTILITIES | | | 1,235,365,864 | | | | 1,478,106,578 | |
| | | | | | | | | | | | |
| |
| | | | COMMUNICATIONS — 14.4% | |
| | | | Cable and Satellite — 4.1% | |
| | 90,000 | | | AMC Networks Inc., Cl. A† | | | 2,383,623 | | | | 3,382,200 | |
| | 180,000 | | | British Sky Broadcasting Group plc | | | 1,951,999 | | | | 2,047,615 | |
| | 345,000 | | | Cablevision Systems Corp., Cl. A | | | 5,659,571 | | | | 4,905,900 | |
| | 270,000 | | | Charter Communications Inc., Cl. A† | | | 14,609,496 | | | | 15,373,800 | |
| | 25,000 | | | Cogeco Cable Inc. | | | 684,204 | | | | 1,260,123 | |
| | 70,000 | | | Cogeco Inc. | | | 1,589,491 | | | | 3,324,957 | |
| | 76,000 | | | Comcast Corp., Cl. A | | | 1,633,462 | | | | 1,801,960 | |
| | 840,000 | | | Comcast Corp., Cl. A, Special | | | 18,724,612 | | | | 19,790,400 | |
| | 110,000 | | | DIRECTV, Cl. A† | | | 3,314,327 | | | | 4,703,600 | |
| | 805,000 | | | DISH Network Corp., Cl. A | | | 16,074,601 | | | | 22,926,400 | |
| | 320,000 | | | EchoStar Corp., Cl. A† | | | 6,620,591 | | | | 6,700,800 | |
| | 175,000 | | | Liberty Global Inc., Cl. A† | | | 4,622,933 | | | | 7,180,250 | |
| | 68,000 | | | Rogers Communications Inc., Cl. B | | | 1,571,553 | | | | 2,618,680 | |
| | 12,000 | | | Shaw Communications Inc., Cl. B | | | 148,195 | | | | 238,440 | |
| | 154,000 | | | Time Warner Cable Inc. | | | 8,265,255 | | | | 9,789,780 | |
| | 70,000 | | | Tokyo Broadcasting System Holdings Inc. | | | 1,058,859 | | | | 900,351 | |
| | | | | | | | | | | | |
| | | | | | | 88,912,772 | | | | 106,945,256 | |
| | | | | | | | | | | | |
| |
| | | | Computer Services Software and Systems — 0.1% | |
| | 360,000 | | | EarthLink Inc. | | | 2,678,071 | | | | 2,318,400 | |
| | 240,046 | | | Internap Network Services Corp.† | | | 1,545,475 | | | | 1,425,873 | |
| | | | | | | | | | | | |
| | | | | | | 4,223,546 | | | | 3,744,273 | |
| | | | | | | | | | | | |
| |
| | | | Telecommunications — 7.5% | |
| | 103,000 | | | AboveNet Inc.† | | | 5,931,680 | | | | 6,696,030 | |
| | 800,000 | | | AT&T Inc. | | | 22,966,310 | | | | 24,192,000 | |
| | 90,000 | | | Atlantic Tele-Network Inc. | | | 3,289,315 | | | | 3,514,500 | |
| | | | | | | | | | | | |
Shares | | | | | Cost | | | Market
Value | |
| | | | | | | | | | | | |
| | 577,000 | | | BCE Inc. | | $ | 16,440,418 | | | $ | 24,043,590 | |
| | 90,000 | | | Belgacom SA | | | 2,962,942 | | | | 2,823,529 | |
| | 2,635,066 | | | Cincinnati Bell Inc.† | | | 8,563,173 | | | | 7,984,250 | |
| | 30,000 | | | Deutsche Telekom AG | | | 369,826 | | | | 344,205 | |
| | 735,000 | | | Deutsche Telekom AG, ADR | | | 10,557,954 | | | | 8,415,750 | |
| | 15,000 | | | Koninklijke KPN NV, ADR | | | 222,287 | | | | 178,800 | |
| | 133,000 | | | Loral Space & Communications Inc.† | | | 8,721,304 | | | | 8,629,040 | |
| | 2,200 | | | Mobistar SA | | | 153,775 | | | | 115,289 | |
| | 415,000 | | | NII Holdings Inc.† | | | 12,969,306 | | | | 8,839,500 | |
| | 152,000 | | | Nippon Telegraph & Telephone Corp. | | | 7,519,802 | | | | 7,770,820 | |
| | 330,000 | | | Orascom Telecom Holding SAE, GDR† (c) | | | 1,908,219 | | | | 953,700 | |
| | 64,000 | | | Philippine Long Distance Telephone Co., ADR | | | 3,384,055 | | | | 3,687,680 | |
| | 190,000 | | | Portugal Telecom SGPS SA | | | 1,700,005 | | | | 1,094,286 | |
| | 190,000 | | | Portugal Telecom SGPS SA, ADR | | | 1,688,209 | | | | 1,096,300 | |
| | 2,000 | | | PT Indosat Tbk | | | 1,061 | | | | 1,246 | |
| | 1,790,000 | | | Sprint Nextel Corp.† | | | 7,204,494 | | | | 4,188,600 | |
| | 113,000 | | | Swisscom AG, ADR | | | 4,078,453 | | | | 4,284,960 | |
| | 7,000 | | | Tele2 AB, Cl. B | | | 125,659 | | | | 136,195 | |
| | 155,000 | | | Telecom Italia SpA, ADR | | | 2,301,167 | | | | 1,650,750 | |
| | 232,500 | | | Telefonica Brasil SA, ADR | | | 4,193,042 | | | | 6,354,225 | |
| | 317,000 | | | Telefonica SA, ADR | | | 7,108,194 | | | | 5,449,230 | |
| | 395,000 | | | Telekom Austria AG | | | 5,619,692 | | | | 4,722,721 | |
| | 410,000 | | | Telephone & Data Systems Inc. | | | 12,882,128 | | | | 10,614,900 | |
| | 108,039 | | | Telephone & Data Systems Inc., Special | | | 2,724,380 | | | | 2,572,409 | |
| | 430,000 | | | tw telecom inc.† | | | 7,609,329 | | | | 8,333,400 | �� |
| | 800,000 | | | Verizon Communications Inc. | | | 26,366,625 | | | | 32,096,000 | |
| | 505,000 | | | VimpelCom Ltd., ADR | | | 6,753,746 | | | | 4,782,350 | |
| | 100,000 | | | Windstream Corp. | | | 876,674 | | | | 1,174,000 | |
| | | | | | | | | | | | |
| | | | | | | 197,193,224 | | | | 196,740,255 | |
| | | | | | | | | | | | |
| |
| | | | Wireless Communications — 2.7% | |
| | 38,000 | | | America Movil SAB de CV, Cl. L, ADR | | | 576,215 | | | | 858,800 | |
| | 60,000 | | | China Mobile Ltd., ADR | | | 2,324,791 | | | | 2,909,400 | |
| | 44,000 | | | China Unicom Hong Kong Ltd., ADR | | | 575,919 | | | | 929,720 | |
| | 200 | | | Hutchison Telecommunications Hong Kong Holdings Ltd. | | | 19 | | | | 77 | |
| | 180 | | | M1 Ltd. | | | 210 | | | | 347 | |
| | 17,000 | | | Millicom International Cellular SA | | | 1,751,655 | | | | 1,716,830 | |
| | 164,000 | | | Millicom International Cellular SA, SDR | | | 12,219,029 | | | | 16,430,860 | |
| | 6,500 | | | Mobile TeleSystems OJSC, ADR | | | 86,498 | | | | 95,420 | |
| | 4,600 | | | NTT DoCoMo Inc. | | | 7,206,136 | | | | 8,456,541 | |
| | 115,000 | | | SK Telecom Co. Ltd., ADR | | | 2,149,789 | | | | 1,565,150 | |
See accompanying notes to financial statements.
8
The Gabelli Utilities Fund
Schedule of Investments (Continued) — December 31, 2011
| | | | | | | | | | | | |
Shares | | | | | Cost | | | Market
Value | |
| | | | | | | | | | | | |
| |
| | | | COMMON STOCKS (Continued) | |
| | | | COMMUNICATIONS (Continued) | |
| | | | Wireless Communications (Continued) | |
| | 400 | | | SmarTone Telecommunications Holdings Ltd. | | $ | 207 | | | $ | 692 | |
| | 16,812 | | | Tim Participacoes SA, ADR | | | 277,353 | | | | 433,750 | |
| | 285,000 | | | Turkcell Iletisim Hizmetleri A/S, ADR† | | | 4,042,155 | | | | 3,351,600 | |
| | 295,000 | | | United States Cellular Corp.† | | | 13,502,290 | | | | 12,870,850 | |
| | 712,000 | | | Vodafone Group plc, ADR | | | 17,284,989 | | | | 19,957,360 | |
| | | | | | | | | | | | |
| | | | | | | 61,997,255 | | | | 69,577,397 | |
| | | | | | | | | | | | |
| | | | TOTAL COMMUNICATIONS | | | 352,326,797 | | | | 377,007,181 | |
| | | | | | | | | | | | |
| |
| | | | OTHER — 9.1% | |
| | | | Aerospace — 2.3% | |
| | 250,031 | | | Exelis Inc. | | | 3,253,962 | | | | 2,262,781 | |
| | 215,051 | | | Goodrich Corp. | | | 26,293,117 | | | | 26,601,809 | |
| | 2,100,000 | | | Rolls-Royce Holdings plc | | | 17,487,592 | | | | 24,345,416 | |
| | 144,900,000 | | | Rolls-Royce Holdings plc, Cl. C† (d) | | | 230,571 | | | | 225,028 | |
| | 88,000 | | | The Boeing Co. | | | 5,847,730 | | | | 6,454,800 | |
| | | | | | | | | | | | |
| | | | | | | 53,112,972 | | | | 59,889,834 | |
| | | | | | | | | | | | |
| |
| | | | Aviation: Parts and Services — 0.1% | |
| | 92,000 | | | Curtiss-Wright Corp. | | | 3,047,519 | | | | 3,250,360 | |
| | | | | | | | | | | | |
| |
| | | | Building and Construction — 0.1% | |
| | 16,000 | | | Acciona SA | | | 2,059,030 | | | | 1,381,842 | |
| | | | | | | | | | | | |
| |
| | | | Business Services — 0.8% | |
| | 1,150,065 | | | Clear Channel Outdoor Holdings Inc., Cl. A† | | | 13,245,261 | | | | 14,433,316 | |
| | 75,000 | | | Equinix Inc.† | | | 6,458,668 | | | | 7,605,000 | |
| | | | | | | | | | | | |
| | | | | | | 19,703,929 | | | | 22,038,316 | |
| | | | | | | | | | | | |
| |
| | | | Commercial Services — 0.1% | |
| | 71,000 | | | Macquarie Infrastructure Co. LLC | | | 1,590,890 | | | | 1,984,450 | |
| | 7,000 | | | McGrath Rentcorp | | | 192,710 | | | | 202,930 | |
| | | | | | | | | | | | |
| | | | | | | 1,783,600 | | | | 2,187,380 | |
| | | | | | | | | | | | |
| |
| | | | Computer Software and Services — 0.8% | |
| | 120,000 | | | RightNow Technologies Inc.† | | | 5,138,204 | | | | 5,127,600 | |
| | 400,000 | | | SuccessFactors Inc.† | | | 15,923,970 | | | | 15,948,000 | |
| | | | | | | | | | | | |
| | | | | | | 21,062,174 | | | | 21,075,600 | |
| | | | | | | | | | | | |
| |
| | | | Diversified Industrial — 1.0% | |
| | 11,000 | | | Bouygues SA | | | 365,609 | | | | 346,593 | |
| | 135,015 | | | ITT Corp. | | | 2,910,976 | | | | 2,609,840 | |
| | 24,000 | | | Raven Industries Inc. | | | 1,222,078 | | | | 1,485,600 | |
| | | | | | | | | | | | |
Shares | | | | | Cost | | | Market
Value | |
| | | | | | | | | | | | |
| | 360,000 | | | Temple-Inland Inc. | | $ | 11,457,735 | | | $ | 11,415,600 | |
| | 180,000 | | | Trinity Industries Inc. | | | 5,510,291 | | | | 5,410,800 | |
| | 103,000 | | | Twin Disc Inc. | | | 3,154,004 | | | | 3,740,960 | |
| | | | | | | | | | | | |
| | | | | | | 24,620,693 | | | | 25,009,393 | |
| | | | | | | | | | | | |
| |
| | | | Electronics — 1.0% | |
| | 225,000 | | | LSI Corp.† | | | 2,024,531 | | | | 1,338,750 | |
| | 280,000 | | | Netlogic Microsystems Inc.† | | | 13,461,699 | | | | 13,879,600 | |
| | 120,000 | | | Texas Instruments Inc. | | | 3,967,729 | | | | 3,493,200 | |
| | 142,000 | | | Thomas & Betts Corp.† | | | 6,693,223 | | | | 7,753,200 | |
| | | | | | | | | | | | |
| | | | | | | 26,147,182 | | | | 26,464,750 | |
| | | | | | | | | | | | |
| |
| | | | Entertainment — 1.0% | |
| | 340,000 | | | Grupo Televisa SA, ADR | | | 7,972,888 | | | | 7,160,400 | |
| | 835,000 | | | Vivendi SA | | | 21,970,043 | | | | 18,285,381 | |
| | | | | | | | | | | | |
| | | | | | | 29,942,931 | | | | 25,445,781 | |
| | | | | | | | | | | | |
| |
| | | | Financial Services — 0.1% | |
| | 90,000 | | | Kinnevik Investment AB, Cl. A | | | 1,773,919 | | | | 1,744,538 | |
| | 12,000 | | | Kinnevik Investment AB, Cl. B | | | 170,855 | | | | 233,826 | |
| | | | | | | | | | | | |
| | | | | | | 1,944,774 | | | | 1,978,364 | |
| | | | | | | | | | | | |
| |
| | | | Health Care — 0.2% | |
| | 12,000 | | | Tsumura & Co. | | | 261,956 | | | | 353,904 | |
| | 100,000 | | | Healthspring Inc.† | | | 5,426,534 | | | | 5,454,000 | |
| | | | | | | | | | | | |
| | | | | | | 5,688,490 | | | | 5,807,904 | |
| | | | | | | | | | | | |
| |
| | | | Machinery — 0.3% | |
| | 325,073 | | | Xylem Inc. | | | 9,440,611 | | | | 8,351,125 | |
| | | | | | | | | | | | |
| |
| | | | Specialty Chemicals — 0.0% | |
| | 40,000 | | | The Dow Chemical Co. | | | 1,096,643 | | | | 1,150,400 | |
| | | | | | | | | | | | |
| |
| | | | Transportation — 1.3% | |
| | 487,000 | | | GATX Corp. | | | 15,466,147 | | | | 21,262,420 | |
| | 161,000 | | | Kirby Corp.† | | | 8,923,543 | | | | 10,600,240 | |
| | 74,000 | | | RailAmerica Inc.† | | | 1,069,772 | | | | 1,101,860 | |
| | | | | | | | | | | | |
| | | | | | | 25,459,462 | | | | 32,964,520 | |
| | | | | | | | | | | | |
| | | | TOTAL OTHER | | | 225,110,010 | | | | 236,995,569 | |
| | | | | | | | | | | | |
| | | | TOTAL COMMON STOCKS | | | 1,812,802,671 | | | | 2,092,109,328 | |
| | | | | | | | | | | | |
| |
| | | | CONVERTIBLE PREFERRED STOCKS — 0.0% | |
| | | | COMMUNICATIONS — 0.0% | |
| | | | Telecommunications — 0.0% | |
| | 18,000 | | | Cincinnati Bell Inc., 6.750% Cv. Pfd., Ser. B | | | 588,832 | | | | 699,480 | |
| | | | | | | | | | | | |
| |
| | | | WARRANTS — 0.0% | |
| | | | COMMUNICATIONS — 0.0% | |
| | | | Telecommunications — 0.0% | |
| | 86,000 | | | Bharti Airtel Ltd., expire 09/19/13† (a)(e) | | | 581,549 | | | | 556,695 | |
| | | | | | | | | | | | |
See accompanying notes to financial statements.
9
The Gabelli Utilities Fund
Schedule of Investments (Continued) — December 31, 2011
| | | | | | | | | | | | |
Principal
Amount | | | | | Cost | | | Market
Value | |
| | | | | | | | | | | | |
| |
| | | | U.S. GOVERNMENT OBLIGATIONS — 20.5% | |
| | $537,358,000 | | | U.S. Treasury Bills, 0.000% to 0.070%††, 01/05/12 to 06/21/12 (f) | | $ | 537,300,255 | | | $ | 537,314,091 | |
| | | | | | | | | | | | |
| | | | TOTAL INVESTMENTS — 100.4% | | $ | 2,351,273,307 | | | | 2,630,679,594 | |
| | | | | | | | | | | | |
| | | |
Notional
Amount | | | | | Termination
Date | | | Unrealized
Appreciation | |
| |
| | | | EQUITY CONTRACT FOR DIFFERENCE SWAP AGREEMENT — 0.0% | |
| $111,421
(22,000 Shares) |
| | International Power plc | | | 06/27/12 | | | | 3,561 | |
| | | | | | | | | | | | |
| | | | Other Assets and Liabilities (Net) — (0.4)% | | | | (9,260,403 | ) |
| | | | | | | | | | | | |
| | | | NET ASSETS — 100.0% | | | $ | 2,621,422,752 | |
| | | | | | | | | | | | |
| (a) | Security fair valued under procedures established by the Board of Trustees. The procedures may include reviewing available financial information about the company and reviewing the valuation of comparable securities and other factors on a regular basis. At December 31, 2011, the market value of fair valued securities amounted to $2,249,745 or 0.09% of net assets. |
| (b) | Security considered an affiliated holding because the Fund owns at least 5% of its outstanding shares. |
| (c) | Security purchased pursuant to Regulation S under the Securities Act of 1933, which exempts from registration securities offered and sold outside of the United States. Such a security cannot be sold in the United States without either an effective registration statement filed pursuant to the Securities Act of 1933, or pursuant to an exemption from registration. At December 31, 2011, the market value of the Regulation S security amounted to $953,700 or 0.04% of net assets, which was valued under methods approved by the Board of Trustees as follows: |
| | | | | | | | | | | | | | | | |
Acquisition
Shares | | | Issuer | | Acquisition
Date | | | Acquisition
Cost | | | 12/31/11
Carrying
Value
Per Unit | |
| | 330,000 | | | Orascom Telecom Holding SAE, GDR | | | 05/05/09 | | | $ | 1,908,219 | | | $ | 2.8900 | |
| (d) | At December 31, 2011, the Fund held an investment in a restricted and illiquid security amounting to $225,028 or 0.01% of net assets, which was valued under methods approved by the Board as follows: |
| | | | | | | | | | | | | | | | |
Acquisition
Shares | | | Issuer | | Acquisition
Date | | | Acquisition
Cost | | | 12/31/11
Carrying
Value
Per Unit | |
| | 144,900,000 | | | Rolls-Royce Holdings plc, Cl. C | | | 10/26/11 | | | $ | 230,571 | | | $ | 0.0016 | |
| (e) | Security exempt from registration under Rule 144A of the Securities Act of 1933, as amended. This security may be resold in transactions exempt from registration, normally to qualified institutional buyers. At December 31, 2011, the market value of the Rule 144A security amounted to $556,695 or 0.02% of net assets. |
| (f) | At December 31, 2011, $200,000 of the principal amount was pledged as collateral for the equity contract for difference swap agreement. |
| † | Non-income producing security. |
| †† | Represents annualized yield at date of purchase. |
| ADR | American Depositary Receipt |
| GDR | Global Depositary Receipt |
| OJSC | Open Joint Stock Company |
| SDR | Swedish Depositary Receipt |
| Strips | Regular income payment portion of the security traded separately from the principal portion of the security. |
See accompanying notes to financial statements.
10
The Gabelli Utilities Fund
Statement of Assets and Liabilities
December 31, 2011
| | | | |
Assets: | | | | |
Investments, at value (cost $2,348,140,454) | | $ | 2,625,877,777 | |
Investments in affiliates, at value (cost $3,132,853) | | | 4,801,817 | |
Foreign currency, at value (cost $3) | | | 3 | |
Receivable for Fund shares sold | | | 15,281,346 | |
Receivable for investments sold | | | 2,191,936 | |
Unrealized appreciation on swap contracts | | | 3,561 | |
Dividends receivable | | | 5,157,292 | |
Prepaid expense | | | 100,899 | |
| | | | |
Total Assets | | | 2,653,414,631 | |
| | | | |
Liabilities: | | | | |
Payable to custodian | | | 17,219 | |
Payable for investments purchased | | | 22,832,560 | |
Payable for Fund shares redeemed | | | 4,843,700 | |
Distributions payable | | | 10,775 | |
Payable for investment advisory fees | | | 2,176,222 | |
Payable for distribution fees | | | 1,087,663 | |
Payable for accounting fees | | | 3,750 | |
Other accrued expenses | | | 1,019,990 | |
| | | | |
Total Liabilities | | | 31,991,879 | |
| | | | |
Net Assets (applicable to 452,405,892 shares outstanding) | | $ | 2,621,422,752 | |
| | | | |
Net Assets Consist of: | | | | |
Paid-in capital | | $ | 2,349,187,731 | |
Undistributed net investment income | | | 137,742 | |
Accumulated net realized loss on investments, swap contracts, and foreign currency transactions | | | (7,307,333 | ) |
Net unrealized appreciation on investments | | | 279,406,287 | |
Unrealized appreciation on swap contracts | | | 3,561 | |
Net unrealized depreciation on foreign currency translations | | | (5,236 | ) |
| | | | |
Net Assets | | $ | 2,621,422,752 | |
| | | | |
Shares of Beneficial Interest, each at $0.001 par value; unlimited number of shares authorized: | |
Class AAA: | | | | |
Net Asset Value, offering, and redemption price per share ($686,608,423 ÷ 113,880,624 shares outstanding) | | | $6.03 | |
| | | | |
Class A: | | | | |
Net Asset Value and redemption price per share ($936,899,176 ÷ 154,206,130 shares outstanding) | | | $6.08 | |
| | | | |
Maximum offering price per share (NAV ÷ 0.9425, based on maximum sales charge of 5.75% of the offering price) | | | $6.45 | |
| | | | |
Class B: | | | | |
Net Asset Value and offering price per share ($131,315 ÷ 24,786 shares outstanding) | | | $5.30 | (a) |
| | | | |
Class C: | | | | |
Net Asset Value and offering price per share ($901,840,087 ÷ 168,564,011 shares outstanding) | | | $5.35 | (a) |
| | | | |
Class I: | | | | |
Net Asset Value, offering, and redemption price per share ($95,943,751 ÷ 15,730,341 shares outstanding) | | | $6.10 | |
| | | | |
| (a) | Redemption price varies based on the length of time held. |
Statement of Operations
For the Year Ended December 31, 2011
| | | | |
Investment Income: | | | | |
Dividends – Unaffiliated (net of foreign withholding taxes of $1,273,490) | | $ | 56,393,107 | |
Dividends – Affiliated | | | 132,902 | |
Interest | | | 321,960 | |
| | | | |
Total Investment Income | | | 56,847,969 | |
| | | | |
Expenses: | | | | |
Investment advisory fees | | | 20,881,231 | |
Distribution fees – Class AAA | | | 1,395,278 | |
Distribution fees – Class A | | | 1,824,784 | |
Distribution fees – Class B | | | 1,854 | |
Distribution fees – Class C | | | 7,322,586 | |
Shareholder services fees | | | 1,777,375 | |
Shareholder communications expenses | | | 441,622 | |
Registration expenses | | | 378,176 | |
Custodian fees | | | 250,039 | |
Trustees’ fees | | | 116,604 | |
Accounting fees | | | 45,000 | |
Legal and audit fees | | | 23,902 | |
Miscellaneous expenses | | | 116,059 | |
| | | | |
Total Expenses | | | 34,574,510 | |
| | | | |
Less: | | | | |
Custodian fee credits | | | (432 | ) |
| | | | |
Net Expenses | | | 34,574,078 | |
| | | | |
Net Investment Income | | | 22,273,891 | |
| | | | |
Net Realized and Unrealized Gain/(Loss) on Investments, Swap Contracts, and Foreign Currency: | | | | |
Net realized gain on investments | | | 288,608 | |
Net realized gain on swap contracts | | | 436 | |
Net realized loss on foreign currency transactions | | | (430,203 | ) |
| | | | |
Net realized loss on investments, swap contracts, and foreign currency transactions | | | (141,159 | ) |
| | | | |
Net change in unrealized appreciation/depreciation: | |
on investments | | | 126,769,387 | |
on swap contracts | | | (1,522 | ) |
on foreign currency translations | | | (6,568 | ) |
| | | | |
Net change in unrealized appreciation/depreciation on investments, swap contracts, and foreign currency translations | | | 126,761,297 | |
| | | | |
Net Realized and Unrealized Gain/(Loss) on Investments, Swap Contracts, and Foreign Currency | | | 126,620,138 | |
| | | | |
Net Increase in Net Assets Resulting from Operations | | $ | 148,894,029 | |
| | | | |
See accompanying notes to financial statements.
11
The Gabelli Utilities Fund
Statement of Changes in Net Assets
| | | | | | | | |
| | | Year Ended
December 31, 2011 | | | Year Ended
December 31, 2010 | |
Operations: | | | | | | | | |
Net investment income | | $ | 22,273,891 | | | $ | 16,010,311 | |
Net realized gain/(loss) on investments, swap contracts, and foreign currency transactions | | | (141,159 | ) | | | 3,207,754 | |
Net change in unrealized appreciation on investments, swap contracts, and foreign currency translations | | | 126,761,297 | | | | 128,907,242 | |
| | | | | | | | |
Net Increase in Net Assets Resulting from Operations | | | 148,894,029 | | | | 148,125,307 | |
| | | | | | | | |
Distributions to Shareholders: | | | | | | | | |
Net investment income | | | | | | | | |
Class AAA | | | (5,620,486 | ) | | | (4,878,419 | ) |
Class A | | | (7,302,389 | ) | | | (6,573,433 | ) |
Class B | | | (1,978 | ) | | | (4,518 | ) |
Class C | | | (8,188,987 | ) | | | (7,809,625 | ) |
Class I | | | (678,227 | ) | | | (484,115 | ) |
| | | | | | | | |
| | | (21,792,067 | ) | | | (19,750,110 | ) |
| | | | | | | | |
Net realized gain | | | | | | | | |
Class AAA | | | (928,904 | ) | | | — | |
Class A | | | (1,206,874 | ) | | | — | |
Class B | | | (327 | ) | | | — | |
Class C | | | (1,353,403 | ) | | | — | |
Class I | | | (112,092 | ) | | | — | |
| | | | | | | | |
| | | (3,601,600 | ) | | | — | |
| | | | | | | | |
Return of capital | | | | | | | | |
Class AAA | | | (70,161,223 | ) | | | (33,499,311 | ) |
Class A | | | (91,156,616 | ) | | | (45,138,692 | ) |
Class B | | | (24,690 | ) | | | (31,021 | ) |
Class C | | | (102,224,131 | ) | | | (53,627,421 | ) |
Class I | | | (8,466,394 | ) | | | (3,324,343 | ) |
| | | | | | | | |
| | | (272,033,054 | ) | | | (135,620,788 | ) |
| | | | | | | | |
Total Distributions to Shareholders | | | (297,426,721 | ) | | | (155,370,898 | ) |
| | | | | | | | |
Shares of Beneficial Interest Transactions: | | | | | | | | |
Class AAA | | | 326,485,860 | | | | 206,119,025 | |
Class A | | | 454,942,033 | | | | 248,262,740 | |
Class B | | | (97,528 | ) | | | 7,422 | |
Class C | | | 420,369,134 | | | | 233,125,776 | |
Class I | | | 58,405,682 | | | | 24,817,901 | |
| | | | | | | | |
Net Increase in Net Assets from Shares of Beneficial Interest Transactions | | | 1,260,105,181 | | | | 712,332,864 | |
| | | | | | | | |
Redemption Fees | | | 9,890 | | | | 25,161 | |
| | | | | | | | |
Net Increase in Net Assets | | | 1,111,582,379 | | | | 705,112,434 | |
Net Assets: | | | | | | | | |
Beginning of period | | | 1,509,840,373 | | | | 804,727,939 | |
| | | | | | | | |
End of period (including undistributed net investment income of $137,742 and $71,862, respectively) | | $ | 2,621,422,752 | | | $ | 1,509,840,373 | |
| | | | | | | | |
See accompanying notes to financial statements.
12
The Gabelli Utilities Fund
Financial Highlights
Selected data for a share of beneficial interest outstanding throughout each period:
| | | | | | | | | | | | | | | | | | | | | | | | | | | | | | | | | | | | | | | | | | | | | | | | | | | | | | | | | | | | |
| | | | | | Income (Loss)
from Investment Operations | | | Distributions | | | | | | | | | | | | | | | Ratios to Average Net Assets/
Supplemental Data | |
Period
Ended
December
31 | | Net Asset
Value,
Beginning
of Period | | | Net
Investment
Income(a) | | | Net
Realized
and
Unrealized
Gain
(Loss)
on
Investments | | | Total from
Invest
ment
Operations | | | Net
Invest
ment
Income | | | Net
Realized
Gain on
Invest
ments | | | Return of
Capital | | | Total
Distri
butions | | | Redemption
Fees(a)(b) | | | Net Asset
Value,
End of
Period | | | Total
Return† | | | Net
Assets,
End of
Period
(in 000’s) | | | Net
Investment
Income | | | Operating
Expenses†† | | | Portfolio
Turnover
Rate††† | |
Class AAA | |
2011 | | $ | 6.38 | | | $ | 0.08 | | | $ | 0.41 | | | $ | 0.49 | | | $ | (0.06 | ) | | $ | (0.01 | ) | | $ | (0.77 | ) | | $ | (0.84 | ) | | $ | 0.00 | | | $ | 6.03 | | | | 8.0 | % | | $ | 686,609 | | | | 1.32 | % | | | 1.40 | % | | | 22 | % |
2010 | | | 6.46 | | | | 0.11 | | | | 0.65 | | | | 0.76 | | | | (0.11 | ) | | | — | | | | (0.73 | ) | | | (0.84 | ) | | | 0.00 | | | | 6.38 | | | | 13.0 | | | | 396,063 | | | | 1.73 | | | | 1.43 | | | | 19 | |
2009 | | | 6.43 | | | | 0.16 | | | | 0.71 | | | | 0.87 | | | | (0.13 | ) | | | — | | | | (0.71 | ) | | | (0.84 | ) | | | 0.00 | | | | 6.46 | | | | 15.5 | | | | 189,534 | | | | 2.57 | | | | 1.47 | | | | 12 | |
2008 | | | 9.08 | | | | 0.15 | | | | (1.96 | ) | | | (1.81 | ) | | | (0.12 | ) | | | (0.02 | ) | | | (0.70 | ) | | | (0.84 | ) | | | 0.00 | | | | 6.43 | | | | (20.9 | ) | | | 123,864 | | | | 1.92 | | | | 1.43 | | | | 19 | |
2007 | | | 9.16 | | | | 0.16 | | | | 0.60 | | | | 0.76 | | | | (0.13 | ) | | | (0.27 | ) | | | (0.44 | ) | | | (0.84 | ) | | | (0.00 | ) | | | 9.08 | | | | 8.6 | | | | 161,930 | | | | 1.78 | | | | 1.42 | | | | 19 | |
Class A | |
2011 | | $ | 6.42 | | | $ | 0.08 | | | $ | 0.42 | | | $ | 0.50 | | | $ | (0.06 | ) | | $ | (0.01 | ) | | $ | (0.77 | ) | | $ | (0.84 | ) | | $ | 0.00 | | | $ | 6.08 | | | | 8.2 | % | | $ | 936,899 | | | | 1.32 | % | | | 1.40 | % | | | 22 | % |
2010 | | | 6.50 | | | | 0.11 | | | | 0.65 | | | | 0.76 | | | | (0.11 | ) | | | — | | | | (0.73 | ) | | | (0.84 | ) | | | 0.00 | | | | 6.42 | | | | 12.9 | | | | 527,981 | | | | 1.73 | | | | 1.43 | | | | 19 | |
2009 | | | 6.46 | | | | 0.16 | | | | 0.72 | | | | 0.88 | | | | (0.13 | ) | | | — | | | | (0.71 | ) | | | (0.84 | ) | | | 0.00 | | | | 6.50 | | | | 15.6 | | | | 278,607 | | | | 2.58 | | | | 1.47 | | | | 12 | |
2008 | | | 9.12 | | | | 0.15 | | | | (1.97 | ) | | | (1.82 | ) | | | (0.12 | ) | | | (0.02 | ) | | | (0.70 | ) | | | (0.84 | ) | | | 0.00 | | | | 6.46 | | | | (20.9 | ) | | | 202,112 | | | | 1.92 | | | | 1.43 | | | | 19 | |
2007 | | | 9.19 | | | | 0.16 | | | | 0.61 | | | | 0.77 | | | | (0.13 | ) | | | (0.27 | ) | | | (0.44 | ) | | | (0.84 | ) | | | (0.00 | ) | | | 9.12 | | | | 8.7 | | | | 261,468 | | | | 1.78 | | | | 1.42 | | | | 19 | |
Class B | |
2011 | | $ | 5.74 | | | $ | 0.03 | | | $ | 0.37 | | | $ | 0.40 | | | $ | (0.06 | ) | | $ | (0.01 | ) | | $ | (0.77 | ) | | $ | (0.84 | ) | | $ | 0.00 | | | $ | 5.30 | | | | 7.3 | % | | $ | 131 | | | | 0.54 | % | | | 2.15 | % | | | 22 | % |
2010 | | | 5.94 | | | | 0.06 | | | | 0.58 | | | | 0.64 | | | | (0.11 | ) | | | — | | | | (0.73 | ) | | | (0.84 | ) | | | 0.00 | | | | 5.74 | | | | 12.0 | | | | 246 | | | | 0.99 | | | | 2.18 | | | | 19 | |
2009 | | | 6.02 | | | | 0.10 | | | | 0.66 | | | | 0.76 | | | | (0.13 | ) | | | — | | | | (0.71 | ) | | | (0.84 | ) | | | 0.00 | | | | 5.94 | | | | 14.7 | | | | 246 | | | | 1.86 | | | | 2.22 | | | | 12 | |
2008 | | | 8.63 | | | | 0.09 | | | | (1.86 | ) | | | (1.77 | ) | | | (0.12 | ) | | | (0.02 | ) | | | (0.70 | ) | | | (0.84 | ) | | | 0.00 | | | | 6.02 | | | | (21.6 | ) | | | 243 | | | | 1.16 | | | | 2.18 | | | | 19 | |
2007 | | | 8.80 | | | | 0.09 | | | | 0.58 | | | | 0.67 | | | | (0.13 | ) | | | (0.27 | ) | | | (0.44 | ) | | | (0.84 | ) | | | (0.00 | ) | | | 8.63 | | | | 7.9 | | | | 343 | | | | 1.02 | | | | 2.17 | | | | 19 | |
Class C | |
2011 | | $ | 5.79 | | | $ | 0.03 | | | $ | 0.37 | | | $ | 0.40 | | | $ | (0.06 | ) | | $ | (0.01 | ) | | $ | (0.77 | ) | | $ | (0.84 | ) | | $ | 0.00 | | | $ | 5.35 | | | | 7.3 | % | | $ | 901,840 | | | | 0.57 | % | | | 2.15 | % | | | 22 | % |
2010 | | | 5.98 | | | | 0.06 | | | | 0.59 | | | | 0.65 | | | | (0.11 | ) | | | — | | | | (0.73 | ) | | | (0.84 | ) | | | 0.00 | | | | 5.79 | | | | 12.1 | | | | 544,110 | | | | 0.98 | | | | 2.18 | | | | 19 | |
2009 | | | 6.06 | | | | 0.10 | | | | 0.66 | | | | 0.76 | | | | (0.13 | ) | | | — | | | | (0.71 | ) | | | (0.84 | ) | | | 0.00 | | | | 5.98 | | | | 14.6 | | | | 319,960 | | | | 1.84 | | | | 2.22 | | | | 12 | |
2008 | | | 8.67 | | | | 0.09 | | | | (1.86 | ) | | | (1.77 | ) | | | (0.12 | ) | | | (0.02 | ) | | | (0.70 | ) | | | (0.84 | ) | | | 0.00 | | | | 6.06 | | | | (21.5 | ) | | | 256,517 | | | | 1.17 | | | | 2.18 | | | | 19 | |
2007 | | | 8.84 | | | | 0.09 | | | | 0.58 | | | | 0.67 | | | | (0.13 | ) | | | (0.27 | ) | | | (0.44 | ) | | | (0.84 | ) | | | (0.00 | ) | | | 8.67 | | | | 7.8 | | | | 316,009 | | | | 1.04 | | | | 2.17 | | | | 19 | |
Class I | |
2011 | | $ | 6.43 | | | $ | 0.10 | | | $ | 0.41 | | | $ | 0.51 | | | $ | (0.06 | ) | | $ | (0.01 | ) | | $ | (0.77 | ) | | $ | (0.84 | ) | | $ | 0.00 | | | $ | 6.10 | | | | 8.3 | % | | $ | 95,944 | | | | 1.58 | % | | | 1.15 | % | | | 22 | % |
2010 | | | 6.49 | | | | 0.12 | | | | 0.66 | | | | 0.78 | | | | (0.11 | ) | | | — | | | | (0.73 | ) | | | (0.84 | ) | | | 0.00 | | | | 6.43 | | | | 13.3 | | | | 41,440 | | | | 1.97 | | | | 1.18 | | | | 19 | |
2009 | | | 6.44 | | | | 0.17 | | | | 0.72 | | | | 0.89 | | | | (0.13 | ) | | | — | | | | (0.71 | ) | | | (0.84 | ) | | | 0.00 | | | | 6.49 | | | | 15.8 | | | | 16,381 | | | | 2.82 | | | | 1.22 | | | | 12 | |
2008(c) | | | 8.94 | | | | 0.16 | | | | (1.82 | ) | | | (1.66 | ) | | | (0.12 | ) | | | (0.02 | ) | | | (0.70 | ) | | | (0.84 | ) | | | 0.00 | | | | 6.44 | | | | (19.6 | ) | | | 7,416 | | | | 2.34 | (d) | | | 1.18 | (d) | | | 19 | |
| † | | Total return represents aggregate total return of a hypothetical $1,000 investment at the beginning of the period and sold at the end of the period including reinvestment of distributions and does not reflect applicable sales charges. Total return for a period of less than a year is not annualized. |
| †† | | The ratios do not include a reduction for custodian fee credits on cash balances maintained with the custodian (“Custodian Fee Credits”). Including such Custodian Fee Credits, the ratios for the year ended December 31, 2007 would have been 1.41% (Class AAA and Class A) and 2.16% (Class B and Class C). For the years ended December 31, 2011, 2010, 2009, and 2008, the effect of Custodian Fee Credits was minimal. |
| ††† | | Effective in 2008, a change in accounting policy was adopted with regard to the calculation of the portfolio turnover rate to include cash proceeds due to mergers. Had this policy been adopted retroactively, the portfolio turnover rate for the year ended December 31, 2007 would have been 47%. |
| (a) | | Per share amounts have been calculated using the average shares outstanding method. |
| (b) | | Amount represents less than $0.005 per share. |
| (c) | | From the commencement of offering Class I Shares on January 11, 2008 through December 31, 2008. |
See accompanying notes to financial statements.
13
The Gabelli Utilities Fund
Notes to Financial Statements
1. Organization. The Gabelli Utilities Fund was organized on May 18, 1999 as a Delaware statutory trust. The Fund is a diversified open-end management investment company registered under the Investment Company Act of 1940, as amended (the “1940 Act”). The Fund commenced operations on August 31, 1999. The Fund’s primary objective is to provide a high level of total return through a combination of capital appreciation and current income.
The Fund invests a high percentage of its assets in the utilities sector. As a result, the Fund may be more susceptible to economic, political, and regulatory developments, positive or negative, and may experience increased volatility to the Fund’s NAV and a magnified effect in its total return.
2. Significant Accounting Policies. The Fund’s financial statements are prepared in accordance with U.S. Generally Accepted Accounting Principles (“GAAP”), which may require the use of management estimates and assumptions. Actual results could differ from those estimates. The following is a summary of significant accounting policies followed by the Fund in the preparation of its financial statements.
Security Valuation. Portfolio securities listed or traded on a nationally recognized securities exchange or traded in the U.S. over-the-counter market for which market quotations are readily available are valued at the last quoted sale price or a market’s official closing price as of the close of business on the day the securities are being valued. If there were no sales that day, the security is valued at the average of the closing bid and asked prices or, if there were no asked prices quoted on that day, then the security is valued at the closing bid price on that day. If no bid or asked prices are quoted on such day, the security is valued at the most recently available price or, if the Board of Trustees (the “Board”) so determines, by such other method as the Board shall determine in good faith to reflect its fair market value. Portfolio securities traded on more than one national securities exchange or market are valued according to the broadest and most representative market, as determined by Gabelli Funds, LLC (the “Adviser”).
Portfolio securities primarily traded on a foreign market are generally valued at the preceding closing values of such securities on the relevant market, but may be fair valued pursuant to procedures established by the Board if market conditions change significantly after the close of the foreign market, but prior to the close of business on the day the securities are being valued. Debt instruments with remaining maturities of sixty days or less that are not credit impaired are valued at amortized cost, unless the Board determines such amount does not reflect the securities’ fair value, in which case these securities will be fair valued as determined by the Board. Debt instruments having a maturity greater than sixty days for which market quotations are readily available are valued at the average of the latest bid and asked prices. If there were no asked prices quoted on such day, the security is valued using the closing bid price. U.S. government obligations with maturities greater than sixty days are normally valued using a model that incorporates market observable data such as reported sales of similar securities, broker quotes, yields, bids, offers, and reference data. Certain securities are valued principally using dealer quotations.
Securities and assets for which market quotations are not readily available are fair valued as determined by the Board. Fair valuation methodologies and procedures may include, but are not limited to: analysis and review of available financial and non-financial information about the company; comparisons with the valuation and changes in valuation of similar securities, including a comparison of foreign securities with the equivalent
14
The Gabelli Utilities Fund
Notes to Financial Statements (Continued)
U.S. dollar value ADR securities at the close of the U.S. exchange; and evaluation of any other information that could be indicative of the value of the security.
The inputs and valuation techniques used to measure fair value of the Fund’s investments are summarized into three levels as described in the hierarchy below:
| | • | | Level 1 — quoted prices in active markets for identical securities; |
| | • | | Level 2 — other significant observable inputs (including quoted prices for similar securities, interest rates, prepayment speeds, credit risk, etc.); and |
| | • | | Level 3 — significant unobservable inputs (including the Fund’s determinations as to the fair value of investments). |
A financial instrument’s level within the fair value hierarchy is based on the lowest level of any input both individually and in the aggregate that is significant to the fair value measurement. The inputs or methodology used for valuing securities are not necessarily an indication of the risk associated with investing in those securities. The summary of the Fund’s investments in securities and other financial instruments by inputs used to value the Fund’s investments as of December 31, 2011 is as follows:
| | | | | | | | | | | | | | | | |
| | | Valuation Inputs | | | | |
| | | Level 1
Quoted Prices | | | Level 2 Other Significant
Observable Inputs | | | Level 3 Significant
Unobservable Inputs | | | Total Market Value
at 12/31/11 | |
INVESTMENTS IN SECURITIES: | | | | | | | | | | | | | | | | |
ASSETS (Market Value): | | | | | | | | | | | | | | | | |
Common Stocks: | | | | | | | | | | | | | | | | |
ENERGY AND UTILITIES | | | | | | | | | | | | | | | | |
Energy and Utilities: Merchant Energy | | $ | 38,548,588 | | | | — | | | $ | 0 | | | $ | 38,548,588 | |
Energy and Utilities: Natural Gas Utilities | | | 123,475,907 | | | $ | 4,801,817 | | | | — | | | | 128,277,724 | |
Exchange Traded Funds | | | — | | | | — | | | | 1,693,050 | | | | 1,693,050 | |
Other Industries (a) | | | 1,309,587,216 | | | | — | | | | — | | | | 1,309,587,216 | |
COMMUNICATIONS (a) | | | 377,007,181 | | | | — | | | | — | | | | 377,007,181 | |
OTHER | | | | | | | | | | | | | | | | |
Aerospace | | | 59,664,806 | | | | 225,028 | | | | — | | | | 59,889,834 | |
Other Industries (a) | | | 177,105,735 | | | | — | | | | — | | | | 177,105,735 | |
Total Common Stocks | | | 2,085,389,433 | | | | 5,026,845 | | | | 1,693,050 | | | | 2,092,109,328 | |
Convertible Preferred Stocks (a) | | | 699,480 | | | | — | | | | — | | | | 699,480 | |
Warrants (a) | | | — | | | | 556,695 | | | | — | | | | 556,695 | |
U.S. Government Obligations | | | — | | | | 537,314,091 | | | | — | | | | 537,314,091 | |
TOTAL INVESTMENTS IN SECURITIES – ASSETS | | $ | 2,086,088,913 | | | $ | 542,897,631 | | | $ | 1,693,050 | | | $ | 2,630,679,594 | |
OTHER FINANCIAL INSTRUMENTS: | | | | | | | | | | | | | | | | |
ASSETS (Unrealized Appreciation):* | | | | | | | | | | | | | | | | |
EQUITY CONTRACT | | | | | | | | | | | | | | | | |
Contract for Difference Swap Agreement | | $ | — | | | $ | 3,561 | | | $ | — | | | $ | 3,561 | |
| (a) | Please refer to the Schedule of Investments for the industry classifications of these portfolio holdings. |
| * | Other financial instruments are derivatives reflected in the Schedule of Investments, such as swaps, which are valued at the unrealized appreciation/depreciation of the instrument. |
15
The Gabelli Utilities Fund
Notes to Financial Statements (Continued)
The Fund did not have significant transfers between Level 1 and Level 2 during the year ended December 31, 2011. The Fund’s policy is to recognize transfers among Levels as of the beginning of the reporting period.
The following table reconciles Level 3 investments for which significant unobservable inputs were used to determine fair value:
| | | | | | | | | | | | | | | | | | | | | | | | | | | | | | | | | | | | | | | | |
| | | Balance
as of
12/31/10 | | | Accrued
discounts/
(premiums) | | | Realized
gain/
(loss) | | | Change in
unrealized
appreciation/
depreciation† | | | Purchases | | | Sales | | | Transfers
into
Level 3 | | | Transfers
out of
Level 3 | | | Balance
as of
12/31/11 | | | Net change
in unrealized
appreciation/
depreciation
during the
period on
Level 3
investments
still held at
12/31/11† | |
INVESTMENTS IN SECURITIES: | | | | | | | | | | | | | | | | | | | | | | | | | | | | | | | | | | | | | | | | |
ASSETS (Market Value): | | | | | | | | | | | | | | | | | | | | | | | | | | | | | | | | | | | | | | | | |
Common Stocks: | | | | | | | | | | | | | | | | | | | | | | | | | | | | | | | | | | | | | | | | |
ENERGY AND UTILITIES | | | | | | | | | | | | | | | | | | | | | | | | | | | | | | | | | | | | | | | | |
Energy and Utilities: Merchant Energy | | $ | 0 | | | $ | — | | | $ | — | | | $ | — | | | $ | — | | | $ | — | | | $ | — | | | $ | — | | | $ | 0 | | | $ | — | |
ENERGY AND UTILITIES | | | | | | | | | | | | | | | | | | | | | | | | | | | | | | | | | | | | | | | | |
Exchanged Traded Funds | | | — | | | | — | | | | (118,702 | ) | | | 353,025 | | | | — | | | | (522,273 | ) | | | 1,981,000 | | | | — | | | | 1,693,050 | | | | 353,025 | |
Total Common Stocks | | | 0 | | | | — | | | | (118,702 | ) | | | 353,025 | | | | — | | | | (522,273 | ) | | | 1,981,000 | | | | — | | | | 1,693,050 | | | | 353,025 | |
Warrants: | | | | | | | | | | | | | | | | | | | | | | | | | | | | | | | | | | | | | | | | |
ENERGY AND UTILITIES | | | | | | | | | | | | | | | | | | | | | | | | | | | | | | | | | | | | | | | | |
Energy and Utilities: Merchant Energy | | $ | 0 | | | $ | — | | | $ | (190,367 | ) | | $ | 190,367 | | | $ | — | | | $ | (0 | ) | | $ | — | | | $ | — | | | $ | — | | | $ | — | |
TOTAL INVESTMENTS IN SECURITIES | | $ | 0 | | | $ | — | | | $ | (309,069 | ) | | $ | 543,392 | | | $ | — | | | $ | (522,273 | ) | | $ | 1,981,000 | | | $ | — | | | $ | 1,693,050 | | | $ | 353,025 | |
| † | Net change in unrealized appreciation/depreciation on investments is included in the related amounts in the Statement of Operations. |
In May 2011, the Financial Accounting Standards Board issued Accounting Standards Update (“ASU”) No. 2011-04 “Amendments to Achieve Common Fair Value Measurement and Disclosure Requirements in U.S. GAAP and International Financial Reporting Standards (“IFRS”).” ASU 2011-04 includes common requirements for measurement of and disclosure about fair value between U.S. GAAP and IFRS. ASU 2011-04 will require reporting entities to disclose the following information for fair value measurements categorized within Level 3 of the fair value hierarchy: quantitative information about the unobservable inputs used in the fair value measurement, the valuation processes used by the reporting entity, and a narrative description of the sensitivity of the fair value measurement to changes in unobservable inputs and the interrelationships between those unobservable inputs. In addition, ASU 2011-04 will require reporting entities to make disclosures about amounts and reasons for all transfers into and out of Level 1 and Level 2 fair value measurements. The new and revised disclosures are effective for interim and annual reporting periods beginning after December 15, 2011. At this time, management is evaluating the implications of ASU 2011-04 and its impact on the financial statements.
16
The Gabelli Utilities Fund
Notes to Financial Statements (Continued)
Derivative Financial Instruments.
The Fund may engage in various portfolio investment strategies by investing in a number of derivative financial instruments for the purposes of increasing the income of the Fund or hedging against a specific transaction with respect to either the currency in which the transaction is denominated or another currency. Investing in certain derivative financial instruments, including participation in the options, futures, or swap markets, entails certain execution, liquidity, hedging, tax, and securities, interest, credit, or currency market risks. Losses may arise if the Adviser’s prediction of movements in the direction of the securities, foreign currency, and interest rate markets is inaccurate. Losses may also arise if the counterparty does not perform its duties under a contract, or that, in the event of default, the Fund may be delayed in or prevented from obtaining payments or other contractual remedies owed to it under derivative contracts. The creditworthiness of the counterparties is closely monitored in order to minimize these risks. Participation in derivative transactions involves investment risks, transaction costs, and potential losses to which the Fund would not be subject absent the use of these strategies. The consequences of these risks, transaction costs, and losses may have a negative impact on the Fund’s ability to pay distributions.
The Fund’s derivative contracts held at December 31, 2011, if any, are not accounted for as hedging instruments under GAAP and are disclosed in the Schedule of Investments together with the related counterparty.
Swap Agreements. The Fund may enter into equity contract for difference swap transactions for the purpose of increasing the income of the Fund. The use of swaps is a highly specialized activity that involves investment techniques and risks different from those associated with ordinary portfolio security transactions. In an equity contract for difference swap, a set of future cash flows is exchanged between two counterparties. One of these cash flow streams will typically be based on a reference interest rate combined with the performance of a notional value of shares of a stock. The other will be based on the performance of the shares of a stock. Depending on the general state of short-term interest rates and the returns on the Fund’s portfolio securities at the time an equity contract for difference swap transaction reaches its scheduled termination date, there is a risk that the Fund will not be able to obtain a replacement transaction or that the terms of the replacement will not be as favorable as on the expiring transaction.
Unrealized gains related to swaps are reported as an asset and unrealized losses are reported as a liability in the Statement of Assets and Liabilities. The change in value of swaps, including the accrual of periodic amounts of interest to be received or paid on swaps, is reported as unrealized gain or loss in the Statement of Operations. A realized gain or loss is recorded upon receipt or payment of a periodic payment or termination of swap agreements.
The Fund has entered into an equity contract for difference swap agreement with The Goldman Sachs Group, Inc. Details of the swap at December 31, 2011 are reflected within the Schedule of Investments and further details are as follows:
| | | | | | | | | | |
Notional
Amount | | | | Equity Security
Received | | Interest Rate/
Equity Security Paid | | Termination
Date | | Net Unrealized
Appreciation |
| | | | Market Value Appreciation on: | | One month LIBOR plus 90 bps plus Market Value Depreciation on: | | | | |
$111,421
| | (22,000 Shares) | | International Power plc | | International Power plc | | 6/27/12 | | $3,561 |
17
The Gabelli Utilities Fund
Notes to Financial Statements (Continued)
The Fund’s volume of activity in equity contract for difference swap agreements during the year ended December 31, 2011 had an average monthly notional amount of approximately $118,472.
As of December 31, 2011, the value of equity contract for difference swap agreements can be found in the Statement of Assets and Liabilities under Assets, Unrealized appreciation on swap contracts. For the year ended December 31, 2011, the effect of equity contract for difference swap agreements can be found in the Statement of Operations under Net Realized and Unrealized Gain/(Loss) on Investments, Swap Contracts, and Foreign Currency, Net realized gain on swap contracts and Net change in unrealized appreciation/depreciation on swap contracts.
Foreign Currency Translations. The books and records of the Fund are maintained in U.S. dollars. Foreign currencies, investments, and other assets and liabilities are translated into U.S. dollars at current exchange rates. Purchases and sales of investment securities, income, and expenses are translated at the exchange rate prevailing on the respective dates of such transactions. Unrealized gains and losses that result from changes in foreign exchange rates and/or changes in market prices of securities have been included in unrealized appreciation/depreciation on investments and foreign currency translations. Net realized foreign currency gains and losses resulting from changes in exchange rates include foreign currency gains and losses between trade date and settlement date on investment securities transactions, foreign currency transactions, and the difference between the amounts of interest and dividends recorded on the books of the Fund and the amounts actually received. The portion of foreign currency gains and losses related to fluctuation in exchange rates between the initial purchase trade date and subsequent sale trade date is included in realized gain/(loss) on investments.
Foreign Securities. The Fund may directly purchase securities of foreign issuers. Investing in securities of foreign issuers involves special risks not typically associated with investing in securities of U.S. issuers. The risks include possible revaluation of currencies, the inability to repatriate funds, less complete financial information about companies, and possible future adverse political and economic developments. Moreover, securities of many foreign issuers and their markets may be less liquid and their prices more volatile than securities of comparable U.S. issuers.
Foreign Taxes. The Fund may be subject to foreign taxes on income, gains on investments, or currency repatriation, a portion of which may be recoverable. The Fund will accrue such taxes and recoveries as applicable, based upon its current interpretation of tax rules and regulations that exist in the markets in which it invests.
Restricted and Illiquid Securities. The Fund may invest up to 15% of its net assets in securities for which the markets are illiquid. Illiquid securities include securities the disposition of which is subject to substantial legal or contractual restrictions. The sale of illiquid securities often requires more time and results in higher brokerage charges or dealer discounts and other selling expenses than does the sale of securities eligible for trading on national securities exchanges or in the over-the-counter markets. Restricted securities may sell at a price lower than similar securities that are not subject to restrictions on resale. Securities freely saleable among qualified institutional investors under special rules adopted by the SEC may be treated as liquid if they satisfy liquidity
18
The Gabelli Utilities Fund
Notes to Financial Statements (Continued)
standards established by the Board. The continued liquidity of such securities is not as well assured as that of publicly traded securities, and accordingly the Board will monitor their liquidity. For the restricted and illiquid securities the Fund held as of December 31, 2011, refer to the Schedule of Investments.
Securities Transactions and Investment Income. Securities transactions are accounted for on the trade date with realized gain or loss on investments determined by using the identified cost method. Interest income (including amortization of premium and accretion of discount) is recorded on the accrual basis. Premiums and discounts on debt securities are amortized using the effective yield to maturity method. Dividend income is recorded on the ex-dividend date, except for certain dividends from foreign securities that are recorded as soon after the ex-dividend date as the Fund becomes aware of such dividends.
Determination of Net Asset Value and Calculation of Expenses. Certain administrative expenses are common to, and allocated among, various affiliated funds. Such allocations are made on the basis of each fund’s average net assets or other criteria directly affecting the expenses as determined by the Adviser pursuant to procedures established by the Board.
In calculating the NAV per share of each class, investment income, realized and unrealized gains and losses, redemption fees, and expenses other than class specific expenses are allocated daily to each class of shares based upon the proportion of net assets of each class at the beginning of each day. Distribution expenses are borne solely by the class incurring the expense.
Custodian Fee Credits and Interest Expense. When cash balances are maintained in the custody account, the Fund receives credits which are used to offset custodian fees. The gross expenses paid under the custody arrangement are included in custodian fees in the Statement of Operations with the corresponding expense offset, if any, shown as “Custodian fee credits.” When cash balances are overdrawn, the Fund is charged an overdraft fee equal to 2.00% above the federal funds rate on outstanding balances. This amount, if any, would be included in the Statement of Operations.
Distributions to Shareholders. Distributions to shareholders are recorded on the ex-dividend date. Distributions to shareholders are based on income and capital gains as determined in accordance with federal income tax regulations, which may differ from income and capital gains as determined under GAAP. These differences are primarily due to differing treatments of income and gains on various investment securities and foreign currency transactions held by the Fund, timing differences, and differing characterizations of distributions made by the Fund. Distributions made in excess of current earnings and profits on a tax basis are treated as a non-taxable return of capital. Distributions from net investment income for federal income tax purposes include net realized gains on foreign currency transactions. These book/tax differences are either temporary or permanent in nature. To the extent these differences are permanent, adjustments are made to the appropriate capital accounts in the period when the differences arise. Permanent differences were primarily due to the tax treatment of currency gains and losses, recharacterization of distributions, and the tax treatment of swap gains/losses. These reclassifications have no impact on the NAV of the Fund. For the year ended December 31, 2011, reclassifications were made to increase undistributed net investment income by $415,944 and increase accumulated net realized loss on investments, swap contracts, and foreign currency transactions by $414,879, with an offsetting adjustment to paid-in capital.
19
The Gabelli Utilities Fund
Notes to Financial Statements (Continued)
The tax character of distributions paid during the years ended December 31, 2011 and December 31, 2010 was as follows:
| | | | | | | | |
| | | Year Ended
December 31, 2011 | | | Year Ended
December 31, 2010 | |
Distributions paid from: | | | | | | | | |
Ordinary income (inclusive of short-term capital gains) | | $ | 25,393,667 | | | $ | 19,750,110 | |
Return of capital | | | 272,033,054 | | | | 135,620,788 | |
| | | | | | | | |
Total distributions paid | | $ | 297,426,721 | | | $ | 155,370,898 | |
| | | | | | | | |
Since January 2000, the Fund has had a fixed distribution policy. Under the policy, the Fund declares and pays monthly distributions from net investment income, capital gains, and paid-in capital. The actual source of the distribution is determined after the end of the year. Pursuant to this policy, distributions during the year are made in excess of required distributions. To the extent such distributions are made from current earnings and profits, they are considered ordinary income or long-term capital gains. The Fund’s current distribution policy may restrict the Fund’s ability to pass through to shareholders all of its net realized long-term capital gains as a Capital Gain Dividend, subject to the maximum federal income tax rate of 15%, and may cause such gains to be treated as ordinary income subject to a maximum federal income tax rate of 35%. Distributions sourced from paid-in capital should not be considered as dividend yield or the total return from an investment in the Fund. The Board continues to evaluate the distribution policy in light of ongoing economic and market conditions and may change the amount of the monthly distributions in the future. The current annualized rate is $0.84 per share.
Provision for Income Taxes. The Fund intends to continue to qualify as a regulated investment company under Subchapter M of the Internal Revenue Code of 1986, as amended (the “Code”). It is the policy of the Fund to comply with the requirements of the Code applicable to regulated investment companies and to distribute substantially all of its net investment company taxable income and net capital gains. Therefore, no provision for federal income taxes is required.
As of December 31, 2011, the components of accumulated earnings/losses on a tax basis were as follows:
| | | | |
Net unrealized appreciation on investments, swap contracts, and foreign currency translations | | $ | 272,252,223 | |
Other temporary differences* | | | (17,202 | ) |
| | | | |
Total | | $ | 272,235,021 | |
| | | | |
*Other temporary differences are primarily due to income from investments in hybrid securities, and mark-to-market and accrual adjustments on investments in swap contracts.
Under the Regulated Investment Company Modernization Act of 2010, the Fund will be permitted to carry forward for an unlimited period capital losses incurred in years beginning after December 22, 2010. As a result of the rule, post-enactment capital losses that are carried forward will retain their character as either short-term or long-term capital losses rather than being considered all short-term as under previous law.
20
The Gabelli Utilities Fund
Notes to Financial Statements (Continued)
During the year ended December 31, 2011, the Fund utilized capital loss carryforwards of $2,006,573.
At December 31, 2011, the temporary difference between book basis and tax basis net unrealized appreciation on investments was primarily due to deferral of losses from wash sales for tax purposes and basis adjustments on investments in partnerships.
The following summarizes the tax cost of investments and the related net unrealized appreciation at December 31, 2011:
| | | | | | | | | | | | | | | | |
| | | Cost | | | Gross
Unrealized
Appreciation | | | Gross
Unrealized
Depreciation | | | Net
Unrealized
Appreciation | |
Investments | | $ | 2,358,425,695 | | | $ | 341,758,212 | | | $ | (69,504,313 | ) | | $ | 272,253,899 | |
The Fund is required to evaluate tax positions taken or expected to be taken in the course of preparing the Fund’s tax returns to determine whether the tax positions are “more-likely-than-not” of being sustained by the applicable tax authority. Income tax and related interest and penalties would be recognized by the Fund as tax expense in the Statement of Operations if the tax positions were deemed not to meet the more-likely-than-not threshold. For the year ended December 31, 2011, the Fund did not incur any income tax, interest, or penalties. As of December 31, 2011, the Adviser has reviewed all open tax years and concluded that there was no impact to the Fund’s net assets or results of operations. Tax years ended December 31, 2008 through December 31, 2011 remain subject to examination by the Internal Revenue Service and state taxing authorities. On an ongoing basis, the Adviser will monitor the Fund’s tax positions to determine if adjustments to this conclusion are necessary.
3. Investment Advisory Agreement and Other Transactions. The Fund has entered into an investment advisory agreement (the “Advisory Agreement”) with the Adviser which provides that the Fund will pay the Adviser a fee, computed daily and paid monthly, at the annual rate of 1.00% of the value of its average daily net assets. In accordance with the Advisory Agreement, the Adviser provides a continuous investment program for the Fund’s portfolio, oversees the administration of all aspects of the Fund’s business and affairs, and pays the compensation of all Officers and Trustees of the Fund who are affiliated persons of the Adviser.
The Fund pays each Trustee who is not considered an affiliated person an annual retainer of $18,000 plus $2,000 for each Board meeting attended and they are reimbursed for any out of pocket expenses incurred in attending meetings. All Board committee members receive $500 per meeting attended and the Chairman of the Audit Committee and the Lead Trustee each receive an annual fee of $2,000. A Trustee may receive a single meeting fee, allocated among the participating funds, for participation in certain meetings held on behalf of multiple funds. Trustees who are directors or employees of the Adviser or an affiliated company receive no compensation or expense reimbursement from the Fund.
4. Distribution Plan. The Fund’s Board has adopted a distribution plan (the “Plan”) for each class of shares, except for Class I Shares, pursuant to Rule 12b-1 under the 1940 Act. G.distributors, LLC serves as successor “Distributor” to Gabelli & Company, Inc. (“Gabelli & Co.”) effective August 1, 2011, both affiliates of the Fund. Under the Class AAA, Class A, Class B, and Class C Share Plans, payments are authorized to the Distributor at annual rates of 0.25%, 0.25%, 1.00%, and 1.00%, respectively, of the average daily net assets of those classes, the annual limitations under each Plan. Such payments are accrued daily and paid monthly.
21
The Gabelli Utilities Fund
Notes to Financial Statements (Continued)
5. Portfolio Securities. Purchases and sales of securities during the year ended December 31, 2011, other than short-term securities and U.S. Government obligations, aggregated $1,055,445,504 and $382,441,176, respectively.
6. Transactions with Affiliates. During the year ended December 31, 2011, the Fund paid brokerage commissions on security trades of $944,516 to Gabelli & Co. Additionally, the current and former Distributors informed the Fund that they retained a total of $2,923,987 from investors representing commissions (sales charges and underwriting fees) on sales and redemptions of Fund shares.
The cost of calculating the Fund’s NAV per share is a Fund expense pursuant to the Advisory Agreement. During the year ended December 31, 2011, the Fund paid or accrued $45,000 to the Adviser in connection with the cost of computing the Fund’s NAV.
7. Line of Credit. The Fund participates in an unsecured line of credit of up to $75,000,000 under which it may borrow up to 10% of its net assets from the custodian for temporary borrowing purposes. Borrowings under this arrangement bear interest at the higher of the sum of the LIBOR plus 125 basis points or the sum of the federal funds rate plus 125 basis points at the time of borrowing. This amount, if any, would be included in “interest expense” in the Statement of Operations. During the year ended December 31, 2011, there were no borrowings under the line of credit.
8. Shares of Beneficial Interest. The Fund offers five classes of shares – Class AAA Shares, Class A Shares, Class B Shares, Class C Shares, and Class I Shares. Class AAA Shares are offered without a sales charge only to investors who acquire them directly from the Distributor, through selected broker/dealers, or the transfer agent. Class I Shares are offered without a sales charge, solely to certain institutions, directly through the Distributor, or brokers that have entered into selling agreements specifically with respect to Class I Shares. Class A Shares are subject to a maximum front-end sales charge of 5.75%. Class B Shares are subject to a contingent deferred sales charge (“CDSC”) upon redemption within six years of purchase and automatically convert to Class A Shares approximately eight years after the original purchase. The applicable Class B CDSC is equal to a percentage declining from 5% of the lesser of the NAV per share at the date of the original purchase or at the date of redemption, based on the length of time held. Class C Shares are subject to a 1.00% CDSC for one year after purchase. Class B Shares are available only through exchange of Class B Shares of other funds distributed by the Distributor.
The Fund imposes a redemption fee of 2.00% on all classes of shares that are redeemed or exchanged on or before the seventh day after the date of a purchase. The redemption fee is deducted from the proceeds otherwise payable to the redeeming shareholders and is retained by the Fund as an increase in paid-in capital. The redemption fees retained by the Fund during the years ended December 31, 2011 and December 31, 2010 amounted to $9,890 and $25,161, respectively. The redemption fee does not apply to redemptions of shares where (i) the shares were purchased through automatic reinvestment of distributions, (ii) the redemption was initiated by the Fund, (iii) the shares were purchased through programs that collect the redemption fee at the program level and remit them to the Fund, or (iv) the shares were purchased through programs that the Adviser determines to have appropriate anti-short-term trading policies in place or as to which the Adviser has received assurances that look-through redemption fee procedures or effective anti-short-term trading policies and procedures are in place.
22
The Gabelli Utilities Fund
Notes to Financial Statements (Continued)
Transactions in shares of beneficial interest were as follows:
| | | | | | | | | | | | | | | | |
| | | Year Ended
December 31, 2011 | | | Year Ended
December 31, 2010 | |
| | | Shares | | | Amount | | | Shares | | | Amount | |
Class AAA | | | | | | | | | | | | | | | | |
Shares sold | | | 77,106,721 | | | $ | 482,045,189 | | | | 40,276,054 | | | $ | 252,896,069 | |
Shares issued upon reinvestment of distributions | | | 9,885,925 | | | | 61,351,171 | | | | 4,834,770 | | | | 30,037,198 | |
Shares redeemed | | | (35,216,129 | ) | | | (216,910,500 | ) | | | (12,337,611 | ) | | | (76,814,242 | ) |
| | | | | | | | | | | | | | | | |
Net increase | | | 51,776,517 | | | $ | 326,485,860 | | | | 32,773,213 | | | $ | 206,119,025 | |
| | | | | | | | | | | | | | | | |
Class A | | | | | | | | | | | | | | | | |
Shares sold | | | 87,441,475 | | | $ | 551,769,401 | | | | 45,841,387 | | | $ | 289,325,641 | |
Shares issued upon reinvestment of distributions | | | 9,609,809 | | | | 59,868,588 | | | | 4,123,540 | | | | 25,773,894 | |
Shares redeemed | | | (25,077,988 | ) | | | (156,695,956 | ) | | | (10,600,928 | ) | | | (66,836,795 | ) |
| | | | | | | | | | | | | | | | |
Net increase | | | 71,973,296 | | | $ | 454,942,033 | | | | 39,363,999 | | | $ | 248,262,740 | |
| | | | | | | | | | | | | | | | |
Class B | | | | | | | | | | | | | | | | |
Shares sold | | | — | | | $ | 1 | | | | 3,520 | | | $ | 19,677 | |
Shares issued upon reinvestment of distributions | | | 1,358 | | | | 7,461 | | | | 875 | | | | 4,945 | |
Shares redeemed | | | (19,332 | ) | | | (104,990 | ) | | | (3,013 | ) | | | (17,200 | ) |
| | | | | | | | | | | | | | | | |
Net increase/(decrease) | | | (17,974 | ) | | $ | (97,528 | ) | | | 1,382 | | | $ | 7,422 | |
| | | | | | | | | | | | | | | | |
Class C | | | | | | | | | | | | | | | | |
Shares sold | | | 81,277,550 | | | $ | 457,882,802 | | | | 44,598,635 | | | $ | 256,833,929 | |
Shares issued upon reinvestment of distributions | | | 12,948,729 | | | | 71,720,764 | | | | 6,403,678 | | | | 36,394,740 | |
Shares redeemed | | | (19,656,558 | ) | | | (109,234,432 | ) | | | (10,494,083 | ) | | | (60,102,893 | ) |
| | | | | | | | | | | | | | | | |
Net increase | | | 74,569,721 | | | $ | 420,369,134 | | | | 40,508,230 | | | $ | 233,125,776 | |
| | | | | | | | | | | | | | | | |
Class I | | | | | | | | | | | | | | | | |
Shares sold | | | 12,060,835 | | | $ | 75,830,097 | | | | 4,805,208 | | | $ | 30,397,336 | |
Shares issued upon reinvestment of distributions | | | 1,335,248 | | | | 8,326,961 | | | | 571,980 | | | | 3,577,076 | |
Shares redeemed | | | (4,112,759 | ) | | | (25,751,376 | ) | | | (1,453,970 | ) | | | (9,156,511 | ) |
| | | | | | | | | | | | | | | | |
Net increase | | | 9,283,324 | | | $ | 58,405,682 | | | | 3,923,218 | | | $ | 24,817,901 | |
| | | | | | | | | | | | | | | | |
9. Transactions in Securities of Affiliated Issuers. The 1940 Act defines affiliated issuers as those in which the Fund’s holdings of an issuer represent 5% or more of the outstanding voting securities of the issuer. A summary of the Fund’s transactions in the securities of these issuers during the year ended December 31, 2011 is set forth below:
| | | | | | | | | | | | | | | | | | | | | | | | | | | | |
| | | Beginning
Shares | | | Shares
Purchased | | | Ending
Shares | | | Net Change In
Unrealized
Appreciation | | | Dividend
Income | | | Value at
December 31, 2011 | | | Percent
Owned of
Shares
Outstanding | |
Corning Natural Gas Corp. | | | 192,612 | | | | 96,306 | | | | 288,918 | | | $ | 660,659 | | | $ | 132,902 | | | $ | 4,801,817 | | | | 15.84 | % |
10. Indemnifications. The Fund enters into contracts that contain a variety of indemnifications. The Fund’s maximum exposure under these arrangements is unknown. However, the Fund has not had prior claims or
23
The Gabelli Utilities Fund
Notes to Financial Statements (Continued)
losses pursuant to these contracts. Management has reviewed the Fund’s existing contracts and expects the risk of loss to be remote.
11. Other Matters. On April 24, 2008, the Adviser entered into a settlement with the SEC to resolve an inquiry regarding prior frequent trading in shares of the GAMCO Global Growth Fund (the “Global Growth Fund”) by one investor who was banned from the Global Growth Fund in August 2002. Under the terms of the settlement, the Adviser, without admitting or denying the SEC’s findings and allegations, paid $16 million (which included a $5 million civil monetary penalty). On the same day, the SEC filed a civil action in the U.S. District Court for the Southern District of New York against the Executive Vice President and Chief Operating Officer of the Adviser, alleging violations of certain federal securities laws arising from the same matter. The officer, who also is an officer of the Global Growth Fund and other funds in the Gabelli/GAMCO complex, including this Fund, denies the allegations and is continuing in his positions with the Adviser and the funds. The settlement by the Adviser did not have, and the resolution of the action against the officer is not expected to have, a material adverse impact on the Adviser or its ability to fulfill its obligations under the Advisory Agreement.
12. Subsequent Events. Management has evaluated the impact on the Fund of all subsequent events occurring through the date the financial statements were issued and has determined that there were no subsequent events requiring recognition or disclosure in the financial statements.
24
The Gabelli Utilities Fund
Report of Independent Registered Public Accounting Firm
To the Shareholders and Board of Trustees of
The Gabelli Utilities Fund
We have audited the accompanying statement of assets and liabilities, including the schedule of investments, of The Gabelli Utilities Fund (the “Fund”), as of December 31, 2011, and the related statement of operations for the year then ended, the statements of changes in net assets for each of the two years in the period then ended, and the financial highlights for each of the five years in the period then ended. These financial statements and financial highlights are the responsibility of the Fund’s management. Our responsibility is to express an opinion on these financial statements and financial highlights based on our audits.
We conducted our audits in accordance with the standards of the Public Company Accounting Oversight Board (United States). Those standards require that we plan and perform the audit to obtain reasonable assurance about whether the financial statements and financial highlights are free of material misstatement. We were not engaged to perform an audit of the Fund’s internal control over financial reporting. Our audits included consideration of internal control over financial reporting as a basis for designing audit procedures that are appropriate in the circumstances, but not for the purpose of expressing an opinion on the effectiveness of the Fund’s internal control over financial reporting. Accordingly, we express no such opinion. An audit also includes examining, on a test basis, evidence supporting the amounts and disclosures in the financial statements and financial highlights, assessing the accounting principles used and significant estimates made by management, and evaluating the overall financial statement presentation. Our procedures included confirmation of securities owned as of December 31, 2011, by correspondence with the Fund’s custodian and brokers, or by other appropriate auditing procedures where replies from brokers were not received. We believe that our audits provide a reasonable basis for our opinion.
In our opinion, the financial statements and financial highlights referred to above present fairly, in all material respects, the financial position of The Gabelli Utilities Fund at December 31, 2011, the results of its operations for the year then ended, the changes in its net assets for each of the two years in the period then ended, and its financial highlights for each of the five years in the periods then ended, in conformity with U.S. generally accepted accounting principles.

Philadelphia, Pennsylvania
February 28, 2012
25
The Gabelli Utilities Fund
Additional Fund Information (Unaudited)
The business and affairs of the Fund are managed under the direction of the Fund’s Board of Trustees. Information pertaining to the Trustees and officers of the Fund is set forth below. The Fund’s Statement of Additional Information includes additional information about the Fund’s Trustees and is available without charge, upon request, by calling 800-GABELLI (800-422-3554) or by writing to The Gabelli Utilities Fund at One Corporate Center, Rye, NY 10580-1422.
| | | | | | | | |
Name, Position(s)
Address1
and Age | | Term of Office
and Length of
Time Served2 | | Number of Funds
in Fund Complex
Overseen by Trustee | | Principal Occupation(s)
During Past Five Years | | Other Directorships
Held by Trustee4 |
|
INTERESTED TRUSTEES3: |
Mario J. Gabelli, CFA Trustee Age: 69 | | Since 1999 | | 27 | | Chairman, Chief Executive Officer, and Chief Investment Officer–Value Portfolios of GAMCO Investors, Inc. and Chief Investment Officer–Value Portfolios of Gabelli Funds, LLC, and GAMCO Asset Management Inc.; Director/ Trustee or Chief Investment Officer of other registered investment companies in the Gabelli/GAMCO Funds Complex; Chief Executive Officer of GGCP, Inc. | | Director of Morgan Group Holdings, Inc. (holding company); Chairman of the Board and Chief Executive Officer of LICT Corp. (multimedia and communication services company); Director of CIBL, Inc. (broadcasting and wireless communications); Director of RLJ Acquisition Inc. (blank check company) |
|
INDEPENDENT TRUSTEES5: |
Anthony J. Colavita Trustee Age: 76 | | Since 1999 | | 35 | | President of the law firm of Anthony J. Colavita, P.C. | | — |
Vincent D. Enright Trustee Age: 68 | | Since 1999 | | 17 | | Former Senior Vice President and Chief Financial Officer of KeySpan Corporation (public utility) (1994-1998) | | Director of Echo Therapeutics, Inc. (therapeutics and diagnostics); Director of LGL Group, Inc.; and until September 2006, Director of Aphton Corporation (pharmaceuticals) |
Mary E. Hauck Trustee Age: 69 | | Since 2000 | | 3 | | Retired Senior Manager of the Gabelli O’Connor Fixed Income Mutual Funds Management Company | | — |
Kuni Nakamura Trustee Age: 43 | | Since 2009 | | 10 | | President of Advanced Polymer, Inc. (chemical wholesale company) | | — |
Werner J. Roeder, MD Trustee Age: 71 | | Since 1999 | | 22 | | Medical Director of Lawrence Hospital and practicing private physician | | — |
26
The Gabelli Utilities Fund
Additional Fund Information (Continued) (Unaudited)
| | | | |
Name, Position(s) Address1
and Age | | Term of Office
and Length of
Time Served2 | | Principal Occupation(s)
During Past Five Years |
|
OFFICERS: |
Bruce N. Alpert President and Acting Chief Compliance Officer Age: 60 | | Since 2003 Since November 2011 | | Executive Vice President and Chief Operating Officer of Gabelli Funds, LLC since 1988; Officer of all of the registered investment companies in the Gabelli/GAMCO Funds complex; Director of Teton Advisors, Inc. since 1998; Chairman of Teton Advisors, Inc. 2008 to 2010; President of Teton Advisors, Inc. 1998 through 2008; Senior Vice President of GAMCO Investors, Inc. since 2008 |
Agnes Mullady Treasurer and Secretary Age: 53 | | Since 2006 | | President and Chief Operating Officer of the Open-End Fund Division of Gabelli Funds, LLC since September 2010; Senior Vice President of GAMCO Investors, Inc. since 2009; Vice President of Gabelli Funds, LLC since 2007; Officer of all of the registered investment companies in the Gabelli/GAMCO Funds Complex |
| | 1 | Address: One Corporate Center, Rye, NY 10580-1422, unless otherwise noted. |
| | 2 | Each Trustee will hold office for an indefinite term until the earliest of (i) the next meeting of shareholders, if any, called for the purpose of considering the election or re-election of such Trustee and until the election and qualification of his or her successor, if any, elected at such meeting, or (ii) the date a Trustee resigns or retires, or a Trustee is removed by the Board of Trustees or shareholders, in accordance with the Fund’s By-Laws and Agreement and Declaration of Trust. Each officer will hold office for an indefinite term until the date he or she resigns or retires or until his or her successor is elected and qualified. |
| | 3 | “Interested person” of the Fund as defined in the 1940 Act. Mr. Gabelli is considered an “interested person” because of his affiliation with Gabelli Funds, LLC which acts as the Fund’s investment adviser. |
| | 4 | This column includes only directorships of companies required to report to the SEC under the Securities Exchange Act of 1934, as amended, i.e., public companies, or other investment companies registered under the 1940 Act. |
| | 5 | Trustees who are not interested persons are considered “Independent” Trustees. |
2011 TAX NOTICE TO SHAREHOLDERS (Unaudited)
For the year ended December 31, 2011, the Fund paid to shareholders ordinary income distributions (comprised of net investment income and short-term capital gains) totaling $0.086, $0.086, $0.043, $0.046, and $0.101 per share for Class AAA, Class A, Class B, Class C, and Class I, respectively, and long-term capital gains totaling $1,106,108 or the maximum allowable. The distributions of long-term capital gains have been designated as a capital gain dividend by the Fund’s Board of Directors. For the year ended December 31, 2011, 100% of the ordinary income distribution qualifies for the dividends received deduction available to corporations. The Fund designates 100% of the ordinary income distribution as qualified dividend income pursuant to the Jobs and Growth Tax Relief Reconciliation Act of 2003. The Fund designates 0.58% of the ordinary income distribution as qualified interest income pursuant to the Tax Relief, Unemployment Recharacterization, and Job Creation Act of 2010. The Fund designates 6.28% of the ordinary income distribution as qualified short-term gain pursuant to the American Jobs Creation Act of 2004.
U.S. Government Income
The percentage of the ordinary income distribution paid by the Fund during 2011 which was derived from U.S. Treasury securities was 0.58%. Such income is exempt from state and local tax in all states. However, many states, including New York and California, allow a tax exemption for a portion of the income earned only if a mutual fund has invested at least 50% of its assets at the end of each quarter of the Fund’s fiscal year in U.S. Government securities. The Fund did not meet this strict requirement in 2011. The percentage of U.S. Government securities held as of December 31, 2011 was 20.50%. Due to the diversity in state and local tax law, it is recommended that you consult your personal tax adviser as to the applicability of the information provided to your specific situation.
All designations are based on financial information available as of the date of this annual report and, accordingly, are subject to change. For each item, it is the intention of the Fund to designate the maximum amount permitted under the Internal Revenue Code and the regulations thereunder.
27
The Gabelli Utilities Fund
One Corporate Center
Rye, New York 10580-1422
800-GABELLI
800-422-3554
fax: 914-921-5118
website: www.gabelli.com
e-mail: info@gabelli.com
Net Asset Value per share available daily by calling
800-GABELLI after 7:00 P.M.
| | |
| Board of Trustees |
Mario J. Gabelli, CFA Chairman and Chief Executive Officer GAMCO Investors, Inc. Anthony J. Colavita President Anthony J. Colavita, P.C. Vincent D. Enright Former Senior Vice President and Chief Financial Officer KeySpan Corp. | | Mary E. Hauck Former Senior Portfolio Manager Gabelli-O’Connor Fixed Income Mutual Fund Management Co. Kuni Nakamura President Advanced Polymer, Inc. Werner J. Roeder, MD Medical Director Lawrence Hospital |
|
| Officers |
Bruce N. Alpert President and Acting Chief Compliance Officer | | Agnes Mullady Secretary and Treasurer |
|
Custodian, Transfer Agent,
and Dividend Disbursing Agent |
| State Street Bank and Trust Company |
|
| Distributor |
| G.distributors, LLC |
|
| Legal Counsel |
| Skadden, Arps, Slate, Meagher & Flom LLP |
This report is submitted for the general information of the shareholders of The Gabelli Utilities Fund. It is not authorized for distribution to prospective investors unless preceded or accompanied by an effective prospectus.
GAB470Q411AR

The
Gabelli
Utilities
Fund
ANNUAL REPORT
DECEMBER 31, 2011
| | (a) | The registrant, as of the end of the period covered by this report, has adopted a code of ethics that applies to the registrant’s principal executive officer, principal financial officer, principal accounting officer or controller, or persons performing similar functions, regardless of whether these individuals are employed by the registrant or a third party. |
| | (c) | There have been no amendments, during the period covered by this report, to a provision of the code of ethics that applies to the registrant’s principal executive officer, principal financial officer, principal accounting officer or controller, or persons performing similar functions, regardless of whether these individuals are employed by the registrant or a third party, and that relates to any element of the code of ethics description. |
| | (d) | The registrant has not granted any waivers, including an implicit waiver, from a provision of the code of ethics that applies to the registrant’s principal executive officer, principal financial officer, principal accounting officer or controller, or persons performing similar functions, regardless of whether these individuals are employed by the registrant or a third party, that relates to one or more of the items set forth in paragraph (b) of this item’s instructions. |
| Item 3. | Audit Committee Financial Expert. |
As of the end of the period covered by the report, the registrant’s Board of Trustees has determined that Vincent D. Enright is qualified to serve as an audit committee financial expert serving on its audit committee and that he is “independent,” as defined by Item 3 of Form N-CSR.
| Item 4. | Principal Accountant Fees and Services. |
Audit Fees
| | (a) | The aggregate fees billed for each of the last two fiscal years for professional services rendered by the principal accountant for the audit of the registrant’s annual financial statements or services that are normally provided by the accountant in connection with statutory and regulatory filings or engagements for those fiscal years are $26,000 for 2010 and $26,000 for 2011. |
Audit-Related Fees
| | (b) | The aggregate fees billed in each of the last two fiscal years for assurance and related services by the principal accountant that are reasonably related to the performance of the audit of the registrant’s financial statements and are not reported under paragraph (a) of this Item are $0 for 2010 and $0 for 2011. |
Tax Fees
| | (c) | The aggregate fees billed in each of the last two fiscal years for professional services rendered by the principal accountant for tax compliance, tax advice, and tax planning are $3,100 for 2010 and $3,200 for 2011. Tax fees represent tax compliance services provided in connection with the review of the Registrant’s tax returns. |
All Other Fees
| | (d) | The aggregate fees billed in each of the last two fiscal years for products and services provided by the principal accountant, other than the services reported in paragraphs (a) through (c) of this Item are $0 for 2010 and $0 for 2011. |
| | (e)(1) | Disclose the audit committee’s pre-approval policies and procedures described in paragraph (c)(7) of Rule 2-01 of Regulation S-X. |
Pre-Approval Policies and Procedures. The Audit Committee (“Committee”) of the registrant is responsible for pre-approving (i) all audit and permissible non-audit services to be provided by the independent registered public accounting firm to the registrant and (ii) all permissible non-audit services to be provided by the independent registered public accounting firm to the Adviser, Gabelli Funds, LLC, and any affiliate of Gabelli Funds, LLC (“Gabelli”) that provides services to the registrant (a “Covered Services Provider”) if the independent registered public accounting firm’s engagement related directly to the operations and financial reporting of the registrant. The Committee may delegate its responsibility to pre-approve any such audit and permissible non-audit services to the Chairperson of the Committee, and the Chairperson must report to the Committee, at its next regularly scheduled meeting after the Chairperson’s pre-approval of such services, his or her decision(s). The Committee may also establish detailed pre-approval policies and procedures for pre-approval of such services in accordance with applicable laws, including the delegation of some or all of the Committee’s pre-approval responsibilities to the other persons (other than Gabelli or the registrant’s officers). Pre-approval by the Committee of any permissible non-audit services is not required so long as: (i) the permissible non-audit services were not recognized by the registrant at the time of the engagement to be non-audit services; and (ii) such services are promptly brought to the attention of the Committee and approved by the Committee or Chairperson prior to the completion of the audit.
| | (e)(2) | The percentage of services described in each of paragraphs (b) through (d) of this Item that were approved by the audit committee pursuant to paragraph (c)(7)(i)(C) of Rule 2-01 of Regulation S-X are as follows: |
| | (f) | The percentage of hours expended on the principal accountant’s engagement to audit the registrant’s financial statements for the most recent fiscal year that were attributed to work performed by persons other than the principal accountant’s full-time, permanent employees was 0%. |
| | (g) | The aggregate non-audit fees billed by the registrant’s accountant for services rendered to the registrant, and rendered to the registrant’s investment adviser (not including any sub-adviser whose role is primarily portfolio management and is subcontracted with or overseen by another investment adviser), and any entity controlling, controlled by, or under common control with the adviser that provides ongoing services to the registrant for each of the last two fiscal years of the registrant was $8,100 for 2010 and $49,500 for 2011. |
| | (h) | The registrant’s audit committee of the board of directors has considered whether the provision of non-audit services that were rendered to the registrant’s investment adviser (not including any sub-adviser whose role is primarily portfolio management and is subcontracted with or overseen by another investment adviser), and any entity controlling, controlled by, or under common control with the investment adviser that provides ongoing services to the registrant that were not pre-approved pursuant to paragraph (c)(7)(ii) of Rule 2-01 of Regulation S-X is compatible with maintaining the principal accountant’s independence. |
| Item 5. | Audit Committee of Listed registrants. |
Not applicable.
| (a) | Schedule of Investments in securities of unaffiliated issuers as of the close of the reporting period is included as part of the report to shareholders filed under Item 1 of this form. |
| Item 7. | Disclosure of Proxy Voting Policies and Procedures for Closed-End Management Investment Companies. |
Not applicable.
| Item 8. | Portfolio Managers of Closed-End Management Investment Companies. |
Not applicable.
| Item 9. | Purchases of Equity Securities by Closed-End Management Investment Company and Affiliated Purchasers. |
Not applicable.
| Item 10. | Submission of Matters to a Vote of Security Holders. |
There have been no material changes to the procedures by which the shareholders may recommend nominees to the registrant’s Board of Trustees, where those changes were implemented after the registrant last provided disclosure in response to the requirements of Item 407(c)(2)(iv) of Regulation S-K (17 CFR 229.407) (as required by Item 22(b)(15) of Schedule 14A (17 CFR 240.14a-101)), or this Item.
| Item 11. | Controls and Procedures. |
| | (a) | The registrant’s principal executive and principal financial officers, or persons performing similar functions, have concluded that the registrant’s disclosure controls and procedures (as defined in Rule 30a-3(c) under the Investment Company Act of 1940, as amended (the “1940 Act”) (17 CFR 270.30a-3(c))) are effective, as of a date within 90 days of the filing date of the report that includes the disclosure required by this paragraph, based on their evaluation of these controls and procedures required by Rule 30a-3(b) under the 1940 Act (17 CFR 270.30a-3(b)) and Rules 13a-15(b) or 15d-15(b) under the Securities Exchange Act of 1934, as amended (17 CFR 240.13a-15(b) or 240.15d-15(b)). |
| | (b) | There were no changes in the registrant’s internal control over financial reporting (as defined in Rule 30a-3(d) under the 1940 Act (17 CFR 270.30a-3(d)) that occurred during the registrant’s second fiscal quarter of the period covered by this report that has materially affected, or is reasonably likely to materially affect, the registrant’s internal control over financial reporting. |
| | (a)(1) | Code of ethics, or any amendment thereto, that is the subject of disclosure required by Item 2 is attached hereto. |
| | (a)(2) | Certifications pursuant to Rule 30a-2(a) under the 1940 Act and Section 302 of the Sarbanes-Oxley Act of 2002 are attached hereto. |
| | (b) | Certifications pursuant to Rule 30a-2(b) under the 1940 Act and Section 906 of the Sarbanes- Oxley Act of 2002 are attached hereto. |
SIGNATURES
Pursuant to the requirements of the Securities Exchange Act of 1934 and the Investment Company Act of 1940, the registrant has duly caused this report to be signed on its behalf by the undersigned, thereunto duly authorized.
| | | | |
| (registrant) The Gabelli Utilities Fund |
| | |
| By (Signature and Title)* | | | | /s/ Bruce N. Alpert |
| | | | Bruce N. Alpert, Principal Executive Officer |
| |
| Date 3/9/12 | | |
Pursuant to the requirements of the Securities Exchange Act of 1934 and the Investment Company Act of 1940, this report has been signed below by the following persons on behalf of the registrant and in the capacities and on the dates indicated.
| | |
| |
| By (Signature and Title)* | | /s/ Bruce N. Alpert |
| | Bruce N. Alpert, Principal Executive Officer |
| |
| Date 3/9/12 | | |
| | |
| |
| By (Signature and Title)* | | /s/ Agnes Mullady |
| | Agnes Mullady, Principal Financial Officer and Treasurer |
| |
| Date 3/9/12 | | |
| * | Print the name and title of each signing officer under his or her signature. |