UNITED STATES
SECURITIES AND EXCHANGE COMMISSION
Washington, D.C. 20549
FORM N-CSR
CERTIFIED SHAREHOLDER REPORT OF REGISTERED MANAGEMENT
INVESTMENT COMPANIES
Investment Company Act file number 811-09397
The Gabelli Utilities Fund
(Exact name of registrant as specified in charter)
One Corporate Center
Rye, New York 10580-1422
(Address of principal executive offices) (Zip code)
Bruce N. Alpert
Gabelli Funds, LLC
One Corporate Center
Rye, New York 10580-1422
(Name and address of agent for service)
registrant’s telephone number, including area code: 1-800-422-3554
Date of fiscal year end: December 31
Date of reporting period: December 31, 2017
Form N-CSR is to be used by management investment companies to file reports with the Commission not later than 10 days after the transmission to stockholders of any report that is required to be transmitted to stockholders under Rule 30e-1 under the Investment Company Act of 1940 (17 CFR 270.30e-1). The Commission may use the information provided on Form N-CSR in its regulatory, disclosure review, inspection, and policymaking roles.
A registrant is required to disclose the information specified by Form N-CSR, and the Commission will make this information public. A registrant is not required to respond to the collection of information contained in Form N-CSR unless the Form displays a currently valid Office of Management and Budget (“OMB”) control number. Please direct comments concerning the accuracy of the information collection burden estimate and any suggestions for reducing the burden to Secretary, Securities and Exchange Commission, 450 Fifth Street, NW, Washington, DC 20549-0609. The OMB has reviewed this collection of information under the clearance requirements of 44 U.S.C. § 3507.
Item 1. Reports to Stockholders.
The Report to Shareholders is attached herewith.
The Gabelli Utilities Fund
Annual Report — December 31, 2017
To Our Shareholders,
For the year ended December 31, 2017, the net asset value (“NAV”) per Class AAA Share of The Gabelli Utilities Fund increased 8.9% compared with an increase of 12.1% for the Standard & Poor’s (“S&P”) 500 Utilities Index (SPU). Other classes of shares are available. See page 2 for performance information for all classes of shares.
Enclosed are the financial statements, including the schedule of investments, as of December 31, 2017.
Performance Discussion (Unaudited)
The objective of the Fund is to provide a high level of total return through a combination of capital appreciation and current income.
The investment strategy of the Fund is to invest at least 80% of its net assets in securities of domestic or foreign companies that are involved to a substantial extent in providing products, services, or equipment for the generation or distribution of electricity, gas, and water and the provision of infrastructure operations or telecommunications services, such as telephone, telegraph, satellite, cable, microwave, radiotelephone, mobile communication and cellular, paging, electronic mail, videotext, voice communications, data communications, and internet and that derive at least 50% of their revenue or earnings from, or devote at least 50% of their assets to, utilities that the Fund’s investment adviser, Gabelli Funds, LLC (the “Adviser”), believes have the potential to provide either capital appreciation or current income. The Fund may invest up to 40% of its total assets in securities of non-U.S. issuers.
In selecting investments, the Adviser will consider factors such as: (i) the market price of the issuer’s common stock, earnings expectations, earnings and price histories, balance sheet characteristics, perceived management skills, and the conditions affecting the industry in which the issuer practices; (ii) the level of interest rates, local and national government regulations, the price and availability of materials used in the particular utility, environmental protection or energy conservation regulations, the level of demand for services, and the risks associated with constructing and operating certain kinds of facilities such as nuclear power facilities; (iii) the potential for capital appreciation of the stock; (iv) the dividend income generated by the stock; (v) the prices of the stock relative to other comparable stocks; and (vi) the diversification of the portfolio of the Fund as to issuers. The Adviser will also consider changes in economic and political outlooks as well as individual corporate developments.
In 2017, most electric, gas, and water utility stocks returned high single digits with top performances coming from renewable developers. The utility sector also had seven announced mergers. Despite a more lenient Environmental Protection Agency, withdrawal from the Paris Agreement on climate change, an end to the Clean Power Plan, and federal and state efforts to subsidize older baseload coal and nuclear generation, the nation’s power sector is experiencing an accelerated “greening” including the rapid development of wind and solar generation and the retirement of older coal and nuclear units. In December, the Federal Reserve raised rates 0.25% for the fifth time in two years, ending the year in the 1.25%-1.50% range.
Among the better performing stocks for the fiscal year were Nextera Energy Inc. (4.4% net assets as of December 31, 2017), the world’s largest utility company with a market capitalization of more than $62 billion. NextEra’s electric utility subsidiary, Florida Power & Light Company, assembled and pre-positioned the largest restoration workforce in U.S. history in order to restore service to 4.4 million customers after Hurricane Irma. Other contributors to the Fund include PNM Resources Inc. (2.9%), which serves electricity to over 761,000 homes and businesses in Texas and New Mexico, and outperformed the industry in the second half of 2017, and Sony Corp (1.2%), whose stock advanced in 2017 due to its diversified product range and gaming and networking services.
Some of our weaker performers were Scana Corp. (0.8%), a South Carolina energy based holding company which lost $210 million associated with an abandoned nuclear project, Dish Network Corp. (0.9%) an American based direct-broadcast satellite service provider who cut 145,000 subscribers after Hurricane Maria took out power in Puerto Rico and the U.S. Virgin Islands, and Windstream Holdings Inc. (0.05%) a provider of advanced network communications and technology solutions which cut its very attractive dividend payout to zero in early August.
Thank you for your investment in the Gabelli Utilities Fund.
We appreciate your confidence and trust.
Comparative Results
| | | | | | | | | | | | | | | | | | | | |
| Average Annual Returns through December 31, 2017 (a) (Unaudited) | | | Since | |
| | | 1 Year | | | 5 Year | | | 10 Year | | | 15 Year | | | Inception
(8/31/99) | |
Class AAA (GABUX) | | | 8.93% | | | | 8.87% | | | | 5.93% | | | | 9.41% | | | | 7.77% | |
S&P 500 Utilities Index | | | 12.11 | | | | 12.62 | | | | 6.31 | | | | 11.15 | | | | 6.86 | |
S&P 500 Index | | | 21.83 | | | | 15.79 | | | | 8.50 | | | | 9.92 | | | | 5.94 | |
Lipper Utility Fund Average | | | 11.46 | | | | 10.12 | | | | 5.58 | | | | 10.44 | | | | 6.63 | |
Class A (GAUAX) | | | 8.79 | | | | 8.85 | | | | 5.93 | | | | 9.43 | | | | 7.78 | |
With sales charge (b) | | | 2.53 | | | | 7.57 | | | | 5.30 | | | | 9.00 | | | | 7.44 | |
Class C (GAUCX) | | | 8.04 | | | | 8.07 | | | | 5.14 | | | | 8.61 | | | | 7.12 | |
With contingent deferred sales charge (c) | | | 7.04 | | | | 8.07 | | | | 5.14 | | | | 8.61 | | | | 7.12 | |
Class I (GAUIX) | | | 9.11 | | | | 9.13 | | | | 6.18 | | | | 9.58 | | | | 7.91 | |
Class T (GAUTX) | | | 8.81 | | | | 8.85 | | | | 5.92 | | | | 9.41 | | | | 7.77 | |
With sales charge (d) | | | 6.09 | | | | 8.30 | | | | 5.65 | | | | 9.22 | | | | 7.76 | |
In the current prospectuses dated April 28, 2017, as amended, the expense ratios for Class AAA, A, C, I, and T Shares are 1.38%, 1.38%, 2.13%, 1.13%, and 1.38%, respectively. See page 13 for the expense ratios for the year ended December 31, 2017. Class AAA and Class I Shares do not have a sales charge. The maximum sales charge for Class A, Class C, and Class T Shares is 5.75%, 1.00%, and 2.50%, respectively.
| | (a) | Returns represent past performance and do not guarantee future results. Total returns and average annual returns reflect changes in share price, reinvestment of distributions, and are net of expenses. Investment returns and the principal value of an investment will fluctuate. When shares are redeemed, they may be worth more or less than their original cost. Current performance may be lower or higher than the performance data presented. Visit www.gabelli.com for performance information as of the most recent month end. Returns would have been lower had Gabelli Funds, LLC, the Adviser, not reimbursed certain expenses of the Fund for periods prior to December 31, 2002. The Fund imposes a 2% redemption fee on shares sold or exchanged within seven days of purchase. Investors should carefully consider the investment objectives, risks, charges, and expenses of the Fund before investing. The prospectuses contain information about these and other matters and should be read carefully before investing. To obtain a prospectus, please visit our website at www.gabelli.com. The value of utility stocks generally changes as long term interest rates change. Funds investing in a single sector, such as utilities, may be subject to more volatility than funds that invest more broadly. The utilities industry can be significantly affected by government regulation, financing difficulties, supply or demand of services or fuel, and natural resources conservation. The Class AAA Share NAVs are used to calculate performance for the periods prior to the issuance of Class A Shares and Class C Shares on December 31, 2002, Class I Shares on January 11, 2008, and Class T Shares on July 5, 2017. The actual performance of the Class A Shares, Class C Shares, and Class T Shares would have been lower due to the additional fees and expenses associated with these classes of shares. The actual performance of the Class I Shares would have been higher due to lower expenses related to this class of shares. The S&P 500 Utilities Index is an unmanaged market capitalization weighted index of large capitalization stocks that may include facilities generation and transmission or distribution of electricity, gas, or water. The S&P 500 Index is a market capitalization weighted index of 500 large capitalization stocks commonly used to represent the U.S. equity market. The Lipper Utility Fund Average reflects the average performance of mutual funds classified in this particular category. Dividends are considered reinvested. You cannot invest directly in an index. | |
| | (b) | Performance results include the effect of the maximum 5.75% sales charge at the beginning of the period. | |
| | (c) | Assuming payment of the 1% maximum contingent deferred sales charge imposed on redemptions made within one year of purchase. | |
| | (d) | Performance results include the effect of the maximum 2.50% sales charge at the beginning of the period. | |
2
COMPARISON OF CHANGE IN VALUE OF A $10,000 INVESTMENT IN THE GABELLI UTILITIES FUND
(CLASS AAA SHARES), S&P 500 UTILITIES INDEX, AND LIPPER UTILITY FUND AVERAGE (Unaudited)
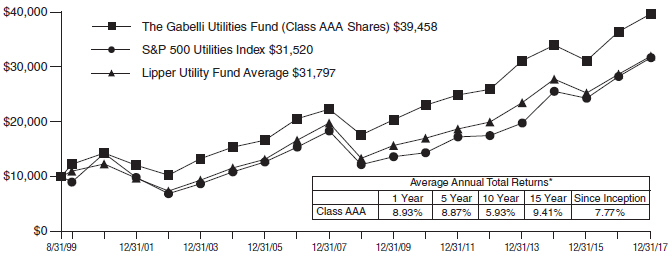
| * | Past performance is not predictive of future results. The performance tables and graph do not reflect the deduction of taxes that a shareholder would pay on fund distributions or the redemption of fund shares. |
3
The Gabelli Utilities Fund
Disclosure of Fund Expenses (Unaudited)
| | |
| For the Six Month Period from July 1, 2017 through December 31, 2017 | | Expense Table |
We believe it is important for you to understand the impact of fees and expenses regarding your investment. All mutual funds have operating expenses. As a shareholder of a fund, you incur ongoing costs, which include costs for portfolio management, administrative services, and shareholder reports (like this one), among others. Operating expenses, which are deducted from a fund’s gross income, directly reduce the investment return of a fund. When a fund’s expenses are expressed as a percentage of its average net assets, this figure is known as the expense ratio. The following examples are intended to help you understand the ongoing costs (in dollars) of investing in your Fund and to compare these costs with those of other mutual funds. The examples are based on an investment of $1,000 made at the beginning of the period shown and held for the entire period.
The Expense Table below illustrates your Fund’s costs in two ways:
Actual Fund Return: This section provides information about actual account values and actual expenses. You may use this section to help you to estimate the actual expenses that you paid over the period after any fee waivers and expense reimbursements. The “Ending Account Value” shown is derived from the Fund’s actual return during the past six months, and the “Expenses Paid During Period” shows the dollar amount that would have been paid by an investor who started with $1,000 in the Fund. You may use this information, together with the amount you invested, to estimate the expenses that you paid over the period.
To do so, simply divide your account value by $1,000 (for example, an $8,600 account value divided by $1,000 = 8.6), then multiply the result by the number given for your Fund under the heading “Expenses Paid During Period” to estimate the expenses you paid during this period.
Hypothetical 5% Return: This section provides information about hypothetical account values and hypothetical expenses based on the Fund’s actual expense ratio. It assumes a hypothetical annualized return of 5% before expenses during the period shown. In this case – because the hypothetical return used is not
the Fund’s actual return – the results do not apply to your investment and you cannot use the hypothetical account value and expense to estimate the actual ending account balance or expenses you paid for the period. This example is useful in making comparisons of the ongoing costs of investing in the Fund and other funds. To do so, compare this 5% hypothetical example with the 5% hypothetical examples that appear in shareholder reports of other funds.
Please note that the expenses shown in the table are meant to highlight your ongoing costs only and do not reflect any transactional costs such as sales charges (loads), redemption fees, or exchange fees, if any, which are described in the Prospectus. If these costs were applied to your account, your costs would be higher. Therefore, the 5% hypothetical return is useful in comparing ongoing costs only, and will not help you determine the relative total costs of owning different funds. The “Annualized Expense Ratio” represents the actual expenses for the last six months and may be different from the expense ratio in the Financial Highlights which is for the year ended December 31, 2017.
| | | | | | | | | | | | | | | | |
| | | Beginning
Account Value
07/01/17 | | | Ending
Account Value
12/31/17 | | | Annualized
Expense
Ratio | | | Expenses Paid During
Period* | |
The Gabelli Utilities Fund | |
Actual Fund Return | | | | | | | | | | | | | |
Class AAA | | | $1,000.00 | | | | $1,034.20 | | | | 1.36 | % | | | $ 6.97 | |
Class A | | | $1,000.00 | | | | $1,032.60 | | | | 1.36 | % | | | $ 6.97 | |
Class C | | | $1,000.00 | | | | $1,029.20 | | | | 2.11 | % | | | $10.79 | |
Class I | | | $1,000.00 | | | | $1,034.90 | | | | 1.11 | % | | | $ 5.69 | |
Class T** | | | $1,000.00 | | | | $1,033.10 | | | | 1.37 | % | | | $ 6.87 | |
Hypothetical 5% Return | | | | | | | | | | | | | |
Class AAA | | | $1,000.00 | | | | $1,018.35 | | | | 1.36 | % | | | $ 6.92 | |
Class A | | | $1,000.00 | | | | $1,018.35 | | | | 1.36 | % | | | $ 6.92 | |
Class C | | | $1,000.00 | | | | $1,014.57 | | | | 2.11 | % | | | $10.71 | |
Class I | | | $1,000.00 | | | | $1,019.61 | | | | 1.11 | % | | | $ 5.65 | |
Class T | | | $1,000.00 | | | | $1,018.30 | | | | 1.37 | % | | | $ 6.97 | |
| * | Expenses are equal to the Fund’s annualized expense ratio for the last six months multiplied by the average account value over the period, multiplied by the number of days in the most recent fiscal half year (184 days), then divided by 365. |
| ** | Class T Shares use a beginning account value date of 07/05/17, and Class T Share expenses are equal to the Funds’ annualized expense ratio for the period since inception multiplied by the number of days since inception (180 days), then divided by 365. |
4
Summary of Portfolio Holdings (Unaudited)
The following table presents portfolio holdings as a percent of net assets as of December 31, 2017:
The Gabelli Utilities Fund
| | | | |
Energy and Utilities | | | 69.0 | % |
Communications | | | 19.4 | % |
Other | | | 7.3 | % |
U.S. Government Obligations | | | 4.3 | % |
Other Assets and Liabilities (Net) | | | 0.0 | % |
| | | | |
| | | 100.0 | % |
| | | | |
The Fund files a complete schedule of portfolio holdings with the Securities and Exchange Commission (the “SEC”) for the first and third quarters of each fiscal year on Form N-Q. Shareholders may obtain this information at www.gabelli.com or by calling the Fund at 800-GABELLI (800-422-3554). The Fund’s Form N-Q is available on the SEC’s website at www.sec.gov and may also be reviewed and copied at the SEC’s Public Reference Room in Washington, DC. Information on the operation of the Public Reference Room may be obtained by calling 800-SEC-0330.
Proxy Voting
The Fund files Form N-PX with its complete proxy voting record for the twelve months ended June 30, no later than August 31 of each year. A description of the Fund’s proxy voting policies, procedures, and how the Fund voted proxies relating to portfolio securities is available without charge, upon request, by (i) calling 800-GABELLI (800-422-3554); (ii) writing to The Gabelli Funds at One Corporate Center, Rye, NY 10580-1422; or (iii) visiting the SEC’s website at www.sec.gov.
5
The Gabelli Utilities Fund
Schedule of Investments — December 31, 2017
| | | | | | | | | | | | |
| Shares | | | | | Cost | | | Market Value | |
| |
| | | | COMMON STOCKS — 95.5% | |
| | | | ENERGY AND UTILITIES — 68.8% | |
| | | | Alternative Energy — 0.5% | |
| | 370,000 | | | Algonquin Power & Utilities Corp. | | $ | 2,068,158 | | | $ | 4,138,584 | |
| | 36,000 | | | NextEra Energy Partners LP | | | 831,843 | | | | 1,551,960 | |
| | 63,261 | | | Ormat Technologies Inc., New York | | | 1,599,251 | | | | 4,046,174 | |
| | 6,739 | | | Ormat Technologies Inc., Tel Aviv | | | 196,537 | | | | 431,882 | |
| | | | | | | | | | | | |
| | | | | | | 4,695,789 | | | | 10,168,600 | |
| | | | | | | | | | | | |
| | | | Electric Integrated — 42.5% | |
| | 304,000 | | | ALLETE Inc. | | | 10,925,762 | | | | 22,605,440 | |
| | 174,000 | | | Alliant Energy Corp. | | | 3,065,132 | | | | 7,414,140 | |
| | 550,000 | | | Ameren Corp. | | | 16,055,895 | | | | 32,444,500 | |
| | 700,000 | | | American Electric Power Co. Inc. | | | 28,398,312 | | | | 51,499,000 | |
| | 6,000 | | | Atlantic Power Corp.† | | | 36,882 | | | | 14,272 | |
| | 180,000 | | | Avangrid Inc. | | | 6,737,133 | | | | 9,104,400 | |
| | 290,000 | | | Avista Corp. | | | 7,089,367 | | | | 14,932,100 | |
| | 474,000 | | | Black Hills Corp. | | | 12,124,989 | | | | 28,492,140 | |
| | 50,000 | | | Calpine Corp.† | | | 769,990 | | | | 756,500 | |
| | 60,000 | | | CMS Energy Corp. | | | 402,675 | | | | 2,838,000 | |
| | 165,000 | | | Dominion Energy Inc. | | | 7,995,789 | | | | 13,374,900 | |
| | 4,000 | | | DTE Energy Co. | | | 151,595 | | | | 437,840 | |
| | 298,000 | | | Duke Energy Corp. | | | 16,331,147 | | | | 25,064,780 | |
| | 620,000 | | | Edison International | | | 22,591,991 | | | | 39,208,800 | |
| | 814,000 | | | El Paso Electric Co. | | | 18,108,780 | | | | 45,054,900 | |
| | 1,400 | | | Entergy Corp. | | | 96,612 | | | | 113,946 | |
| | 800,000 | | | Eversource Energy | | | 18,567,363 | | | | 50,544,000 | |
| | 355,000 | | | Exelon Corp. | | | 11,212,577 | | | | 13,990,550 | |
| | 380,000 | | | FirstEnergy Corp. | | | 11,038,618 | | | | 11,635,600 | |
| | 78,960 | | | Fortis Inc. | | | 2,450,129 | | | | 2,895,463 | |
| | 111,040 | | | Fortis Inc., Toronto | | | 3,472,604 | | | | 4,073,233 | |
| | 900,000 | | | Great Plains Energy Inc. | | | 19,787,986 | | | | 29,016,000 | |
| | 915,000 | | | Hawaiian Electric Industries Inc. | | | 21,821,324 | | | | 33,077,250 | |
| | 42,000 | | | IDACORP Inc. | | | 1,703,782 | | | | 3,837,120 | |
| | 311,000 | | | MGE Energy Inc. | | | 9,537,543 | | | | 19,624,100 | |
| | 630,500 | | | NextEra Energy Inc. | | | 40,112,079 | | | | 98,477,795 | |
| | 260,000 | | | NiSource Inc. | | | 2,319,251 | | | | 6,674,200 | |
| | 434,000 | | | NorthWestern Corp. | | | 11,726,586 | | | | 25,909,800 | |
| | 785,000 | | | OGE Energy Corp. | | | 13,193,046 | | | | 25,834,350 | |
| | 740,000 | | | Otter Tail Corp. | | | 17,917,539 | | | | 32,893,000 | |
| | 137,000 | | | PG&E Corp. | | | 5,207,891 | | | | 6,141,710 | |
| | 320,000 | | | Pinnacle West Capital Corp. | | | 13,092,833 | | | | 27,257,600 | |
| | 1,610,000 | | | PNM Resources Inc. | | | 20,018,302 | | | | 65,124,500 | |
| | 572,000 | | | PPL Corp. | | | 17,657,112 | | | | 17,703,400 | |
| | 190,000 | | | Public Service Enterprise Group Inc. | | | 5,490,935 | | | | 9,785,000 | |
| | 439,112 | | | SCANA Corp. | | | 17,341,443 | | | | 17,467,875 | |
| | 430,000 | | | The Southern Co. | | | 15,474,375 | | | | 20,678,700 | |
| | | | | | | | | | | | |
| Shares | | | | | Cost | | | Market Value | |
| | | |
| | 51,125 | | | Unitil Corp. | | $ | 1,483,755 | | | $ | 2,332,323 | |
| | 440,000 | | | Vectren Corp. | | | 12,163,963 | | | | 28,608,800 | |
| | 597,000 | | | WEC Energy Group Inc. | | | 16,121,112 | | | | 39,658,710 | |
| | 920,000 | | | Westar Energy Inc. | | | 22,248,661 | | | | 48,576,000 | |
| | 310,000 | | | Xcel Energy Inc. | | | 6,350,159 | | | | 14,914,100 | |
| | | | | | | | | | | | |
| | | | | | | 488,393,019 | | | | 950,086,837 | |
| | | | | | | | | | | | |
| | | | Electric Transmission and Distribution — 0.6% | |
| | 67,000 | | | Consolidated Edison Inc. | | | 2,745,224 | | | | 5,691,650 | |
| | 360,000 | | | Red Electrica Corp. SA | | | 4,191,840 | | | | 8,081,686 | |
| | 3,400 | | | Uniper SE | | | 38,231 | | | | 106,066 | |
| | | | | | | | | | | | |
| | | | | | | 6,975,295 | | | | 13,879,402 | |
| | | | | | | | | | | | |
| | | | Global Utilities — 2.0% | | | | | | | | |
| | 11,352 | | | AES Tiete Energia SA | | | 155,996 | | | | 43,634 | |
| | 40,000 | | | Chubu Electric Power Co. Inc. | | | 671,887 | | | | 497,182 | |
| | 28,000 | | | E.ON SE | | | 524,216 | | | | 304,411 | |
| | 20,800 | | | EDF SA | | | 308,177 | | | | 260,050 | |
| | 5,000 | | | EDP-Energias de Portugal SA, ADR | | | 134,159 | | | | 173,300 | |
| | 200,000 | | | Electric Power Development Co. Ltd. | | | 4,991,198 | | | | 5,387,175 | |
| | 10,000 | | | Eletropaulo Metropolitana Eletricidade de Sao Paulo SA | | | 32,332 | | | | 49,290 | |
| | 185,000 | | | Emera Inc. | | | 4,545,769 | | | | 6,914,320 | |
| | 35,000 | | | Enagas SA | | | 916,226 | | | | 1,002,412 | |
| | 100,000 | | | Endesa SA | | | 2,186,478 | | | | 2,142,326 | |
| | 265,000 | | | Enel SpA | | | 1,382,306 | | | | 1,631,131 | |
| | 4,000 | | | EuroSite Power Inc.† | | | 1,670 | | | | 660 | |
| | 550,000 | | | Hera SpA | | | 1,195,166 | | | | 1,920,354 | |
| | 66,000 | | | Hokkaido Electric Power Co. Inc. | | | 1,054,241 | | | | 434,631 | |
| | 40,000 | | | Hokuriku Electric Power Co. | | | 661,406 | | | | 321,988 | |
| | 180,000 | | | Huaneng Power International Inc., ADR | | | 4,762,737 | | | | 4,500,000 | |
| | 45,000 | | | Iberdrola SA, ADR | | | 1,344,640 | | | | 1,392,075 | |
| | 289,300 | | | Iberdrola SA, Aquis | | | 2,262,874 | | | | 2,242,367 | |
| | 405,000 | | | Korea Electric Power Corp.,, ADR† | | | 5,392,840 | | | | 7,172,550 | |
| | 110,000 | | | Kyushu Electric Power Co. Inc. | | | 1,563,462 | | | | 1,152,962 | |
| | 32,000 | | | Shikoku Electric Power Co. Inc. | | | 578,871 | | | | 348,755 | |
| | 2,000 | | | Snam SpA | | | 8,967 | | | | 9,791 | |
| | 75,000 | | | Statoil ASA | | | 1,693,070 | | | | 1,600,370 | |
| | 28,000 | | | The Chugoku Electric Power Co. Inc. | | | 509,466 | | | | 300,936 | |
| | 305,000 | | | The Kansai Electric Power Co. Inc. | | | 4,106,512 | | | | 3,735,523 | |
| | 55,000 | | | The Tokyo Electric Power Co. Holdings Inc.† | | | 208,402 | | | | 217,706 | |
See accompanying notes to financial statements.
6
The Gabelli Utilities Fund
Schedule of Investments (Continued) — December 31, 2017
| | | | | | | | | | | | |
| Shares | | | | | Cost | | | Market Value | |
| |
| | | | COMMON STOCKS (Continued) | |
| | | | ENERGY AND UTILITIES (Continued) | |
| | | | Global Utilities (Continued) | |
| | 170,000 | | | Tohoku Electric Power Co. Inc. | | $ | 2,793,879 | | | $ | 2,174,129 | |
| | | | | | | | | | | | |
| | | | | | | 43,986,947 | | | | 45,930,028 | |
| | | | | | | | | | | | |
| | | | Merchant Energy — 1.6% | |
| | 40,000 | | | GenOn Energy Inc.-Old, Escrow†(a) | | | 0 | | | | 0 | |
| | 15,000 | | | GenOn Energy Inc., Escrow†(a) | | | 0 | | | | 0 | |
| | 120,000 | | | NRG Energy Inc. | | | 2,704,601 | | | | 3,417,600 | |
| | 3,022,700 | | | The AES Corp. | | | 31,141,169 | | | | 32,735,841 | |
| | | | | | | | | | | | |
| | | | | | | 33,845,770 | | | | 36,153,441 | |
| | | | | | | | | | | | |
| | | | Natural Gas Integrated — 9.1% | |
| | 14,500 | | | Apache Corp. | | | 761,285 | | | | 612,190 | |
| | 25,000 | | | Atlas Energy Group LLC† | | | 58,278 | | | | 1,215 | |
| | 65,000 | | | Devon Energy Corp. | | | 2,877,051 | | | | 2,691,000 | |
| | 6,000 | | | Dominion Energy Midstream Partners LP | | | 175,466 | | | | 182,700 | |
| | 20,000 | | | Energen Corp.† | | | 239,277 | | | | 1,151,400 | |
| | 610,000 | | | Energy Transfer Equity LP | | | 375,317 | | | | 10,528,600 | |
| | 150,000 | | | Hess Corp. | | | 8,794,064 | | | | 7,120,500 | |
| | 300,000 | | | Kinder Morgan Inc. | | | 6,840,332 | | | | 5,421,000 | |
| | 1,927,000 | | | National Fuel Gas Co. | | | 93,303,501 | | | | 105,811,570 | |
| | 436,000 | | | Northwest Natural Gas Co. | | | 19,423,271 | | | | 26,007,400 | |
| | 520,000 | | | ONEOK Inc. | | | 6,975,466 | | | | 27,794,000 | |
| | 362,000 | | | UGI Corp. | | | 7,671,655 | | | | 16,995,900 | |
| | | | | | | | | | | | |
| | | | | | | 147,494,963 | | | | 204,317,475 | |
| | | | | | | | | | | | |
| | | | Natural Gas Utilities — 6.0% | |
| | 80,000 | | | Atmos Energy Corp. | | | 2,188,623 | | | | 6,871,200 | |
| | 94,000 | | | CenterPoint Energy Inc. | | | 1,812,563 | | | | 2,665,840 | |
| | 43,500 | | | Chesapeake Utilities Corp. | | | 786,141 | | | | 3,416,925 | |
| | 6,250 | | | CONSOL Energy Inc.† | | | 113,792 | | | | 246,937 | |
| | 388,800 | | | Corning Natural Gas Holding Corp.(b) | | | 3,685,398 | | | | 7,581,600 | |
| | 100,000 | | | Gulf Coast Ultra Deep Royalty Trust | | | 8,000 | | | | 3,107 | |
| | 5,000 | | | Italgas SpA | | | 21,959 | | | | 30,536 | |
| | 110,000 | | | National Grid plc | | | 1,583,477 | | | | 1,299,665 | |
| | 44,500 | | | National Grid plc, ADR | | | 2,931,043 | | | | 2,617,045 | |
| | 14,000 | | | New Jersey Resources Corp. | | | 328,068 | | | | 562,800 | |
| | 143,000 | | | ONE Gas Inc. | | | 1,132,190 | | | | 10,476,180 | |
| | 66,000 | | | RGC Resources Inc. | | | 701,712 | | | | 1,787,280 | |
| | 140,000 | | | South Jersey Industries Inc. | | | 1,982,945 | | | | 4,372,200 | |
| | 929,000 | | | Southwest Gas Holdings Inc. | | | 34,252,040 | | | | 74,765,920 | |
| | 119,500 | | | Spire Inc. | | | 3,777,981 | | | | 8,980,425 | |
| | 95,000 | | | WGL Holdings Inc. | | | 3,813,901 | | | | 8,154,800 | |
| | | | | | | | | | | | |
| | | | | | | 59,119,833 | | | | 133,832,460 | |
| | | | | | | | | | | | |
| | | | | | | | | | | | |
| Shares | | | | | Cost | | | Market Value | |
| |
| | | | Natural Resources — 1.9% | |
| | 14,000 | | | Alliance Holdings GP LP | | $ | 151,361 | | | $ | 375,060 | |
| | 75,300 | | | Anadarko Petroleum Corp. | | | 4,070,538 | | | | 4,039,092 | |
| | 168,000 | | | BP plc, ADR | | | 6,752,185 | | | | 7,061,040 | |
| | 14,058 | | | California Resources Corp.† | | | 143,825 | | | | 273,288 | |
| | 10,000 | | | Callon Petroleum Co.† | | | 124,400 | | | | 121,500 | |
| | 500,000 | | | Cameco Corp. | | | 6,595,868 | | | | 4,615,000 | |
| | 50,000 | | | CNX Resources Corp.† | | | 597,406 | | | | 731,500 | |
| | 8,000 | | | Compania de Minas Buenaventura SAA, ADR | | | 87,836 | | | | 112,640 | |
| | 710,000 | | | Mueller Industries Inc. | | | 15,410,694 | | | | 25,155,300 | |
| | 50,006 | | | Tullow Oil plc† | | | 247,281 | | | | 139,487 | |
| | 75,000 | | | Ultra Petroleum Corp.† | | | 657,533 | | | | 679,500 | |
| | | | | | | | | | | | |
| | | | | | | 34,838,927 | | | | 43,303,407 | |
| | | | | | | | | | | | |
| | | | Services — 1.4% | |
| | 22,000 | | | Baker Hughes, a GE Company | | | 980,838 | | | | 696,080 | |
| | 570,000 | | | Enbridge Inc. | | | 12,541,788 | | | | 22,292,700 | |
| | 20,000 | | | Halliburton Co. | | | 660,081 | | | | 977,400 | |
| | 34,000 | | | MDU Resources Group Inc. | | | 738,008 | | | | 913,920 | |
| | 50,000 | | | Patterson-UTI Energy Inc. | | | 737,566 | | | | 1,150,500 | |
| | 20,000 | | | Rowan Companies plc, Cl. A† . | | | 251,815 | | | | 313,200 | |
| | 1,000,000 | | | Weatherford International plc†. | | | 7,912,956 | | | | 4,170,000 | |
| | | | | | | | | | | | |
| | | | | | | 23,823,052 | | | | 30,513,800 | |
| | | | | | | | | | | | |
| | | | Water — 2.5% | |
| | 8,000 | | | American States Water Co. | | | 110,252 | | | | 463,280 | |
| | 115,000 | | | American Water Works Co. Inc. | | | 2,627,509 | | | | 10,521,350 | |
| | 528,000 | | | Aqua America Inc. | | | 9,146,026 | | | | 20,713,440 | |
| | 5,000 | | | California Water Service Group | | | 90,622 | | | | 226,750 | |
| | 10,000 | | | Connecticut Water Service Inc. | | | 251,353 | | | | 574,100 | |
| | 16,000 | | | Consolidated Water Co. Ltd. | | | 193,044 | | | | 201,600 | |
| | 20,000 | | | Middlesex Water Co. | | | 356,954 | | | | 798,200 | |
| | 276,700 | | | Severn Trent plc | | | 7,394,052 | | | | 8,076,923 | |
| | 145,000 | | | SJW Group | | | 3,336,319 | | | | 9,255,350 | |
| | 87,000 | | | The York Water Co. | | | 1,205,281 | | | | 2,949,300 | |
| | 52,000 | | | United Utilities Group plc, ADR | | | 1,399,310 | | | | 1,166,360 | |
| | | | | | | | | | | | |
| | | | | | | 26,110,722 | | | | 54,946,653 | |
| | | | | | | | | | | | |
| | | | Diversified Industrial — 0.6% | |
| | 30,000 | | | AZZ Inc. | | | 1,212,304 | | | | 1,533,000 | |
| | 62,000 | | | General Electric Co. | | | 1,212,502 | | | | 1,081,900 | |
| | 100,000 | | | ITT Inc. | | | 2,056,300 | | | | 5,337,000 | |
| | 375,975 | | | Mueller Water Products Inc., Cl. A | | | 2,154,278 | | | | 4,710,967 | |
| | 20,000 | | | Park-Ohio Holdings Corp. | | | 381,857 | | | | 919,000 | |
| | | | | | | | | | | | |
| | | | | | | 7,017,241 | | | | 13,581,867 | |
| | | | | | | | | | | | |
See accompanying notes to financial statements.
7
The Gabelli Utilities Fund
Schedule of Investments (Continued) — December 31, 2017
| | | | | | | | | | |
| Shares | | | | Cost | | | Market Value | |
| |
| | COMMON STOCKS (Continued) | |
| | ENERGY AND UTILITIES (Continued) | |
| | Environmental Services — 0.1% | |
| 26,000 | | Covanta Holding Corp. | | $ | 414,429 | | | $ | 439,400 | |
| 80,000 | | Veolia Environnement SA | | | 1,097,512 | | | | 2,042,139 | |
| | | | | | | | | | |
| | | | | 1,511,941 | | | | 2,481,539 | |
| | | | | | | | | | |
| | | |
| | TOTAL ENERGY AND UTILITIES | | | 877,813,499 | | | | 1,539,195,509 | |
| | | | | | | | | | |
| | COMMUNICATIONS — 19.4% | |
| | Cable and Satellite — 5.7% | |
| 42,000 | | Charter Communications Inc., Cl. A† | | | 4,216,493 | | | | 14,110,320 | |
| 25,000 | | Cogeco Communications Inc. | | | 684,204 | | | | 1,719,968 | |
| 70,000 | | Cogeco Inc. | | | 1,589,491 | | | | 5,040,334 | |
| 40,000 | | Comcast Corp., Cl. A | | | 402,189 | | | | 1,602,000 | |
| 430,000 | | DISH Network Corp., Cl. A† | | | 12,903,460 | | | | 20,532,500 | |
| 308,000 | | EchoStar Corp., Cl. A† | | | 10,215,374 | | | | 18,449,200 | |
| 344,366 | | Liberty Global plc, Cl. A† | | | 5,402,825 | | | | 12,342,077 | |
| 600,000 | | Liberty Global plc, Cl. C† | | | 10,353,788 | | | | 20,304,000 | |
| 80,000 | | Liberty Global plc LiLAC, Cl. A† | | | 1,566,814 | | | | 1,612,000 | |
| 150,000 | | Liberty Global plc LiLAC, Cl. C† | | | 3,323,789 | | | | 2,983,500 | |
| 90,000 | | Rogers Communications Inc., Cl. B | | | 2,426,676 | | | | 4,583,700 | |
| 12,000 | | Shaw Communications Inc., Cl. B | | | 148,195 | | | | 273,960 | |
| 1,650,000 | | Sky plc† | | | 18,135,231 | | | | 22,544,757 | |
| 50,000 | | Tokyo Broadcasting System Holdings Inc. | | | 683,652 | | | | 1,248,724 | |
| | | | | | | | | | |
| | | | | 72,052,181 | | | | 127,347,040 | |
| | | | | | | | | | |
| | Computer Services Software and Systems — 0.0% | |
| 102,500 | | Internap Corp.† | | | 2,116,716 | | | | 1,610,275 | |
| | | | | | | | | | |
| | Telecommunications — 10.0% | |
| 35,000 | | AT&T Inc. | | | 1,197,700 | | | | 1,360,800 | |
| 560,000 | | BCE Inc. | | | 15,759,354 | | | | 26,885,600 | |
| 886,442 | | CenturyLink Inc. | | | 18,600,909 | | | | 14,785,853 | |
| 790,000 | | Cincinnati Bell Inc.† | | | 13,106,597 | | | | 16,471,500 | |
| 35,000 | | Deutsche Telekom AG | | | 428,748 | | | | 621,310 | |
| 515,000 | | Deutsche Telekom AG, ADR | | | 6,311,945 | | | | 9,095,415 | |
| 1,750,000 | | Global Telecom Holding SAE, GDR† | | | 1,357,829 | | | | 730,315 | |
| 28,000 | | Harris Corp. | | | 2,161,989 | | | | 3,966,200 | |
| 1,440,000 | | Koninklijke KPN NV | | | 4,192,069 | | | | 5,024,381 | |
| 18,000 | | Koninklijke KPN NV, ADR | | | 80,480 | | | | 63,000 | |
| 134,470 | | Loral Space & Communications Inc.† | | | 5,551,093 | | | | 5,923,403 | |
| 35,200 | | NextGenTel Holding ASA | | | 257,885 | | | | 76,311 | |
| 290,000 | | Nippon Telegraph & Telephone Corp. | | | 7,159,565 | | | | 13,643,577 | |
| | | | | | | | | | |
| Shares | | | | Cost | | | Market Value | |
| | | |
| 2,200 | | Orange Belgium SA | | $ | 33,392 | | | $ | 46,194 | |
| 330,000 | | Orascom Telecom Media and Technology Holding SAE, GDR | | | 534,301 | | | | 53,130 | |
| 60,000 | | Pharol SGPS SA† | | | 28,418 | | | | 17,998 | |
| 220,000 | | Pharol SGPS SA, ADR† | | | 182,432 | | | | 54,450 | |
| 68,000 | | PLDT Inc., ADR | | | 3,226,928 | | | | 2,045,440 | |
| 150,000 | | Proximus SA | | | 4,775,028 | | | | 4,922,370 | |
| 2,000 | | PT Indosat Tbk | | | 1,061 | | | | 708 | |
| 2,300,000 | | Singapore Telecommunications Ltd. | | | 5,695,042 | | | | 6,139,295 | |
| 800,000 | | Sprint Corp.† | | | 4,794,592 | | | | 4,712,000 | |
| 121,000 | | Swisscom AG, ADR | | | 4,440,719 | | | | 6,452,930 | |
| 10,000 | | Tele2 AB, Cl. B | | | 158,627 | | | | 122,880 | |
| 170,000 | | Telecom Italia SpA, ADR† | | | 2,206,728 | | | | 1,467,100 | |
| 235,000 | | Telefonica Brasil SA, ADR | | | 4,137,121 | | | | 3,485,050 | |
| 53,000 | | Telefonica Deutschland Holding AG | | | 280,618 | | | | 266,196 | |
| 525,000 | | Telefonica SA, ADR | | | 8,961,856 | | | | 5,082,000 | |
| 1,000,000 | | Telekom Austria AG | | | 7,767,364 | | | | 9,273,613 | |
| 340,000 | | Telenet Group Holding NV† | | | 15,333,232 | | | | 23,697,687 | |
| 546,000 | | Telephone & Data Systems Inc. | | | 14,762,101 | | | | 15,178,800 | |
| 60,000 | | Telesites SAB de CV† | | | 45,551 | | | | 45,528 | |
| 700,000 | | VEON Ltd., ADR | | | 3,208,119 | | | | 2,688,000 | |
| 715,000 | | Verizon Communications Inc. | | | 22,935,173 | | | | 37,844,950 | |
| 580,000 | | Windstream Holdings Inc. | | | 2,749,496 | | | | 1,073,000 | |
| | | | | | | | | | |
| | | | | 182,424,062 | | | | 223,316,984 | |
| | | | | | | | | | |
| | Wireless Communications — 3.7% | |
| 65,000 | | America Movil SAB de CV, Cl. L, ADR | | | 1,049,728 | | | | 1,114,750 | |
| 27,000 | | ATN International Inc. | | | 883,543 | | | | 1,492,020 | |
| 69,000 | | China Mobile Ltd., ADR | | | 2,765,327 | | | | 3,487,260 | |
| 53,000 | | China Unicom Hong Kong Ltd., ADR† | | | 665,499 | | | | 717,090 | |
| 200 | | Hutchison Telecommunications Hong Kong Holdings Ltd. | | | 19 | | | | 80 | |
| 86,000 | | Millicom International Cellular SA | | | 6,232,178 | | | | 5,797,260 | |
| 252,000 | | Millicom International Cellular SA, SDR | | | 17,797,413 | | | | 17,018,932 | |
| 6,500 | | Mobile TeleSystems PJSC, ADR | | | 86,498 | | | | 66,235 | |
| 465,000 | | NTT DoCoMo Inc. | | | 7,286,947 | | | | 10,981,717 | |
| 135,000 | | SK Telecom Co. Ltd., ADR | | | 2,383,798 | | | | 3,767,850 | |
| 400 | | SmarTone Telecommunications Holdings Ltd. | | | 207 | | | | 482 | |
| 35,000 | | Tim Participacoes SA, ADR | | | 684,957 | | | | 675,850 | |
| 400,000 | | Turkcell Iletisim Hizmetleri A/S, ADR | | | 5,592,425 | | | | 4,080,000 | |
See accompanying notes to financial statements.
8
The Gabelli Utilities Fund
Schedule of Investments (Continued) — December 31, 2017
| | | | | | | | | | | | |
| Shares | | | | | Cost | | | Market Value | |
| |
| | | | COMMON STOCKS (Continued) | |
| | | | COMMUNICATIONS (Continued) | |
| | | | Wireless Communications (Continued) | |
| | 367,000 | | | United States Cellular Corp.† | | $ | 16,064,751 | | | $ | 13,810,210 | |
| | 600,000 | | | Vodafone Group plc, ADR | | | 22,651,401 | | | | 19,140,000 | |
| | | | | | | | | | | | |
| | | | | | | 84,144,691 | | | | 82,149,736 | |
| | | | | | | | | | | | |
| | | | TOTAL COMMUNICATIONS | | | 340,737,650 | | | | 434,424,035 | |
| | | | | | | | | | | | |
| | | | OTHER — 7.3% | |
| | | | Aerospace — 1.0% | |
| | 2,000,000 | | | Rolls-Royce Holdings plc | | | 16,373,302 | | | | 22,871,493 | |
| | 92,000,000 | | | Rolls-Royce Holdings plc, Cl. C†(a) | | | 121,904 | | | | 124,214 | |
| | | | | | | | | | | | |
| | | | | | | 16,495,206 | | | | 22,995,707 | |
| | | | | | | | | | | | |
| | | | Building and Construction — 0.4% | |
| | 12,000 | | | Acciona SA | | | 1,140,701 | | | | 979,651 | |
| | 170,000 | | | Johnson Controls International plc | | | 4,577,647 | | | | 6,478,700 | |
| | | | | | | | | | | | |
| | | | | | | 5,718,348 | | | | 7,458,351 | |
| | | | | | | | | | | | |
| | | | Business Services — 0.4% | |
| | 1,420,000 | | | Clear Channel Outdoor Holdings Inc., Cl. A | | | 5,708,815 | | | | 6,532,000 | |
| | 40,000 | | | Macquarie Infrastructure Corp. | | | 737,100 | | | | 2,568,000 | |
| | 17,500 | | | Vectrus Inc.† | | | 316,783 | | | | 539,875 | |
| | | | | | | | | | | | |
| | | | | | | 6,762,698 | | | | 9,639,875 | |
| | | | | | | | | | | | |
| | | | Consumer Products — 0.0% | |
| | 10,000 | | | Essity AB, Cl. A† | | | 130,732 | | | | 282,454 | |
| | | | | | | | | | | | |
| | | | Diversified Industrial — 0.3% | |
| | 1,000 | | | Alstom SA | | | 31,457 | | | | 41,521 | |
| | 40,000 | | | Bouygues SA | | | 1,406,190 | | | | 2,078,614 | |
| | 4,000 | | | Donaldson Co. Inc. | | | 133,040 | | | | 195,800 | |
| | 10,000 | | | Raven Industries Inc. | | | 219,638 | | | | 343,500 | |
| | 10,000 | | | Svenska Cellulosa AB, Cl. A | | | 34,751 | | | | 115,810 | |
| | 105,600 | | | Twin Disc Inc.† | | | 1,959,602 | | | | 2,805,792 | |
| | | | | | | | | | | | |
| | | | | | | 3,784,678 | | | | 5,581,037 | |
| | | | | | | | | | | | |
| | | | Electronics — 1.3% | |
| | 90,000 | | | Corning Inc. | | | 1,005,890 | | | | 2,879,100 | |
| | 595,000 | | | Sony Corp., ADR | | | 10,687,692 | | | | 26,745,250 | |
| | | | | | | | | | | | |
| | | | | | | 11,693,582 | | | | 29,624,350 | |
| | | | | | | | | | | | |
| | | | Entertainment — 0.5% | |
| | 633,332 | | | Grupo Televisa SAB, ADR | | | 15,594,360 | | | | 11,824,308 | |
| | | | | | | | | | | | |
| | | | Financial Services — 0.4% | | | | | | | | |
| | 168,000 | | | Kinnevik AB, Cl. A | | | 3,583,754 | | | | 5,859,346 | |
| | 80,000 | | | Kinnevik AB, Cl. B | | | 2,519,622 | | | | 2,704,343 | |
| | | | | | | | | | | | |
| | | | | | | 6,103,376 | | | | 8,563,689 | |
| | | | | | | | | | | | |
| | | | | | | | | | | | |
| Shares | | | | | Cost | | | Market Value | |
| |
| | | | Health Care — 0.0% | |
| | 12,000 | | | Tsumura & Co. | | $ | 261,956 | | | $ | 398,846 | |
| | | | | | | | | | | | |
| | | | Machinery — 1.7% | |
| | 92,500 | | | Astec Industries Inc. | | | 3,264,589 | | | | 5,411,250 | |
| | 34,000 | | | Flowserve Corp. | | | 1,366,581 | | | | 1,432,420 | |
| | 79,000 | | | The Gorman-Rupp Co. | | | 1,815,066 | | | | 2,465,590 | |
| | 428,000 | | | Xylem Inc. | | | 11,593,897 | | | | 29,189,600 | |
| | | | | | | | | | | | |
| | | | | | | 18,040,133 | | | | 38,498,860 | |
| | | | | | | | | | | | |
| | | | Metals and Mining — 0.4% | |
| | 215,000 | | | Freeport-McMoRan Inc.† | | | 3,045,141 | | | | 4,076,400 | |
| | 48,000 | | | Haynes International Inc. | | | 2,243,063 | | | | 1,538,400 | |
| | 17,000 | | | Vulcan Materials Co. | | | 797,880 | | | | 2,182,290 | |
| | | | | | | | | | | | |
| | | | | | | 6,086,084 | | | | 7,797,090 | |
| | | | | | | | | | | | |
| | | | Transportation — 0.9% | |
| | 311,000 | | | GATX Corp. | | | 8,998,435 | | | | 19,331,760 | |
| | | | | | | | | | | | |
| | | | TOTAL OTHER | | | 99,669,588 | | | | 161,996,327 | |
| | | | | | | | | | | | |
| | | | TOTAL COMMON STOCKS | | | 1,318,220,737 | | | | 2,135,615,871 | |
| | | | | | | | | | | | |
| | | | CONVERTIBLE PREFERRED STOCKS — 0.1% | |
| | | | ENERGY AND UTILITIES — 0.1% | |
| | | | Natural Gas Utilities — 0.1% | |
| | 54,000 | | | Corning Natural Gas Holding Corp.,
4.800%, Ser. B (b) | | | 1,120,500 | | | | 1,080,000 | |
| | | | | | | | | | | | |
| | | | COMMUNICATIONS — 0.0% | |
| | | | Telecommunications — 0.0% | |
| | 21,000 | | | Cincinnati Bell Inc.,
6.750%, Ser. B | | | 695,010 | | | | 1,071,000 | |
| | | | | | | | | | | | |
| | | | TOTAL CONVERTIBLE PREFERRED STOCKS | | | 1,815,510 | | | | 2,151,000 | |
| | | | | | | | | | | | |
| | | | WARRANTS — 0.0% | |
| | | | COMMUNICATIONS — 0.0% | |
| | | | Telecommunications — 0.0% | |
| | 80,000 | | | Bharti Airtel Ltd., expire 11/30/20†(c) | | | 438,064 | | | | 664,000 | |
| | | | | | | | | | | | |
| | | |
Principal
Amount | | | | | | | | | |
| |
| | | | CORPORATE BONDS — 0.1% | |
| | | | Energy and Utilities — 0.1% | |
| $ | 1,500,000 | | | Mueller Industries Inc.,
6.000%, 03/01/27 | | | 1,500,000 | | | | 1,541,250 | |
| | | | | | | | | | | | |
See accompanying notes to financial statements.
9
The Gabelli Utilities Fund
Schedule of Investments (Continued) — December 31, 2017
| | | | | | | | | | | | |
Principal
Amount | | | | | Cost | | | Market Value | |
| | | | U.S. GOVERNMENT OBLIGATIONS — 4.3% | |
| $ | 97,520,000 | | | U.S. Treasury Bills,
1.065% to 1.542%††,
01/25/18 to 06/28/18 | | $ | 97,235,208 | | | $ | 97,221,304 | |
| | | | | | | | | | | | |
| | | | TOTAL
INVESTMENTS — 100.0% | | $ | 1,419,209,519 | | | | 2,237,193,425 | |
| | | | | | | | | | | | |
| | |
| | | | Other Assets and Liabilities (Net) — 0.0% | | | | (53,448 | ) |
| | | | | | | | | | | | |
| | | | NET ASSETS — 100.0% | | | | | | $ | 2,237,139,977 | |
| | | | | | | | | | | | |
| (a) | Security is valued using significant unobservable inputs and is classified as Level 3 in the fair value hierarchy. |
| (b) | Security considered an affiliated holding because the Fund owns at least 5% of its outstanding shares. |
| (c) | Security exempt from registration under Rule 144A of the Securities Act of 1933, as amended. This security may be resold in transactions exempt from registration, normally to qualified institutional buyers. At December 31, 2017, the market value of the Rule 144A security amounted to $664,000 or 0.03% of net assets. |
| † | Non-income producing security. |
| †† | Represents annualized yield at date of purchase. |
| ADR | American Depositary Receipt |
| GDR | Global Depositary Receipt |
| SDR | Swedish Depositary Receipt |
See accompanying notes to financial statements.
10
The Gabelli Utilities Fund
Statement of Assets and Liabilities
December 31, 2017
| | | | |
Assets: | | | | |
Investments, at value (cost $1,414,403,621) | | $ | 2,228,531,825 | |
Investments in affiliates, at value
(cost $4,805,898) | | | 8,661,600 | |
Cash | | | 2,319 | |
Receivable for Fund shares sold | | | 3,101,568 | |
Dividends receivable | | | 4,193,501 | |
Prepaid expenses | | | 80,243 | |
| | | | |
Total Assets | | | 2,244,571,056 | |
| | | | |
Liabilities: | | | | |
Payable for Fund shares redeemed | | | 4,093,791 | |
Payable for investment advisory fees | | | 1,930,604 | |
Payable for distribution fees | | | 928,108 | |
Payable for accounting fees | | | 3,750 | |
Other accrued expenses | | | 474,826 | |
| | | | |
Total Liabilities | | | 7,431,079 | |
| | | | |
Net Assets | | | | |
(applicable to 273,608,814 shares outstanding) | | $ | 2,237,139,977 | |
| | | | |
Net Assets Consist of: | | | | |
Paid-in capital | | $ | 1,434,283,780 | |
Distribution in excess of net investment income | | | (1,019,191 | ) |
Distributions in excess of net realized gains on investments and foreign currency transactions | | | (14,116,420 | ) |
Net unrealized appreciation on investments | | | 817,983,906 | |
Net unrealized appreciation on foreign currency translations | | | 7,902 | |
| | | | |
Net Assets | | $ | 2,237,139,977 | |
| | | | |
Shares of Beneficial Interest, each at $0.001 par value; unlimited number of shares authorized: | | | | |
Class AAA: | | | | |
Net Asset Value, offering, and redemption price per share ($350,708,716 ÷ 38,007,368 shares outstanding) | | | $9.23 | |
Class A: | | | | |
Net Asset Value and redemption price per share ($837,684,252 ÷ 89,368,197 shares outstanding) | | | $9.37 | |
Maximum offering price per share (NAV ÷ 0.9425, based on maximum sales charge of 5.75% of the offering price) | | | $9.94 | |
Class C: | | | | |
Net Asset Value and offering price per share ($776,369,587 ÷ 118,008,211 shares outstanding) | | | $6.58 | (a) |
Class I: | | | | |
Net Asset Value, offering, and redemption price per share ($272,376,389 ÷ 28,224,926 shares outstanding) | | | $9.65 | |
Class T: | | | | |
Net Asset Value and redemption price per share ($1,033 ÷ 112 shares outstanding) | | | $9.22 | |
Maximum offering price per share (NAV ÷ 0.975, based on maximum sales charge of 2.50% of the offering price) | | | $9.46 | |
| (a) | Redemption price varies based on the length of time held. |
Statement of Operations
For the Year Ended December 31, 2017
| | | | |
Investment Income: | | | | |
Dividends - Unaffiliated (net of foreign withholding taxes of $1,408,709) | | $ | 64,226,189 | |
Dividends - Affiliated | | | 263,250 | |
Interest | | | 790,293 | |
Other income* | | | 235 | |
| | | | |
Total Income | | | 65,279,967 | |
| | | | |
Expenses: | | | | |
Investment advisory fees | | | 22,195,032 | |
Distribution fees - Class AAA | | | 909,780 | |
Distribution fees - Class A | | | 2,054,701 | |
Distribution fees - Class C | | | 7,963,130 | |
Distribution fees - Class T | | | 1 | |
Shareholder services fees | | | 1,630,497 | |
Shareholder communications expenses | | | 304,911 | |
Custodian fees | | | 225,255 | |
Trustees’ fees | | | 137,000 | |
Registration expenses | | | 126,820 | |
Accounting fees | | | 45,000 | |
Legal and audit fees | | | 28,778 | |
Interest expense | | | 210 | |
Miscellaneous expenses | | | 131,525 | |
| | | | |
Total Expenses | | | 35,752,640 | |
| | | | |
Less: | | | | |
Expenses paid indirectly by broker | | | | |
(See Note 6) | | | (15,703 | ) |
| | | | |
Net Expenses | | | 35,736,937 | |
| | | | |
Net Investment Income | | | 29,543,030 | |
| | | | |
Net Realized and Unrealized Gain/(Loss) on Investments and Foreign Currency: | | | | |
Net realized gain on investments | | | 18,926,765 | |
Net realized loss on foreign currency transactions | | | (34,159 | ) |
| | | | |
Net realized gain on investments and foreign currency transactions | | | 18,892,606 | |
| | | | |
Net change in unrealized appreciation: | | | | |
on investments | | | 131,864,424 | |
on foreign currency translations | | | 32,758 | |
| | | | |
Net change in unrealized appreciation on investments and foreign currency translations | | | 131,897,182 | |
| | | | |
Net Realized and Unrealized Gain/(Loss) on Investments and Foreign Currency | | | 150,789,788 | |
| | | | |
Net Increase in Net Assets Resulting from Operations | | $ | 180,332,818 | |
| | | | |
| * | The Fund received a reimbursement of custody expenses paid in prior years. |
See accompanying notes to financial statements.
11
The Gabelli Utilities Fund
Statement of Changes in Net Assets
| | | | | | | | |
| | | Year Ended
December 31, 2017 | | | Year Ended
December 31, 2016 | |
Operations: | | | | | | | | |
Net investment income | | | $ 29,543,030 | | | | $ 29,079,713 | |
Net realized gain on investments and foreign currency transactions | | | 18,892,606 | | | | 33,246,905 | |
Net change in unrealized appreciation on investments and foreign currency translations | | | 131,897,182 | | | | 252,754,372 | |
| | | | | | | | |
Net Increase in Net Assets Resulting from Operations | | | 180,332,818 | | | | 315,080,990 | |
| | | | | | | | |
Distributions to Shareholders: | | | | | | | | |
Net investment income | | | | | | | | |
Class AAA | | | (5,020,519 | ) | | | (5,471,301 | ) |
Class A | | | (11,262,972 | ) | | | (11,112,907 | ) |
Class C | | | (9,795,159 | ) | | | (9,783,665 | ) |
Class I | | | (3,875,959 | ) | | | (2,542,331 | ) |
Class T | | | (17 | ) | | | — | |
| | | | | | | | |
| | | (29,954,626 | ) | | | (28,910,204 | ) |
| | | | | | | | |
Net realized gain | | | | | | | | |
Class AAA | | | (2,839,155 | ) | | | (5,335,408 | ) |
Class A | | | (6,375,891 | ) | | | (10,854,504 | ) |
Class C | | | (8,501,854 | ) | | | (14,643,900 | ) |
Class I | | | (1,855,631 | ) | | | (2,115,401 | ) |
Class T | | | (8 | ) | | | — | |
| | | | | | | | |
| | | (19,572,539 | ) | | | (32,949,213 | ) |
| | | | | | | | |
Return of capital | | | | | | | | |
Class AAA | | | (24,415,223 | ) | | | (24,739,141 | ) |
Class A | | | (54,425,845 | ) | | | (50,581,784 | ) |
Class C | | | (78,809,061 | ) | | | (73,313,008 | ) |
Class I | | | (14,720,187 | ) | | | (9,476,054 | ) |
Class T | | | (21 | ) | | | — | |
| | | | | | | | |
| | | (172,370,337 | ) | | | (158,109,987 | ) |
| | | | | | | | |
Total Distributions to Shareholders | | | (221,897,502 | ) | | | (219,969,404 | ) |
| | | | | | | | |
| | |
Shares of Beneficial Interest Transactions: | | | | | | | | |
Class AAA | | | (12,582,880 | ) | | | (30,345,592 | ) |
Class A | | | 32,227,780 | | | | 49,728,141 | |
Class C | | | 35,021,113 | | | | 23,406,890 | |
Class I | | | 114,337,169 | | | | 9,333,224 | |
Class T | | | 1,046 | | | | — | |
| | | | | | | | |
Net Increase in Net Assets from Shares of Beneficial Interest Transactions | | | 169,004,228 | | | | 52,122,663 | |
| | | | | | | | |
| | |
Redemption Fees | | | 13,123 | | | | 7,011 | |
| | | | | | | | |
Net Increase in Net Assets | | | 127,452,667 | | | | 147,241,260 | |
Net Assets: | | | | | | | | |
Beginning of year | | | 2,109,687,310 | | | | 1,962,446,050 | |
| | | | | | | | |
End of year (including undistributed net investment income of $0 and $0, respectively) | | $ | 2,237,139,977 | | | $ | 2,109,687,310 | |
| | | | | | | | |
See accompanying notes to financial statements.
12
The Gabelli Utilities Fund
Financial Highlights
Selected data for a share of beneficial interest outstanding throughout each period:
| | | | | | | | | | | | | | | | | | | | | | | | | | | | | | | | | | | | | | | | | | | | | | | | | | | | | | | | | | |
| | | | | | Income (Loss)
from Investment Operations | | | Distributions | | | | | | | | | | | | Ratios to Average Net Assets/
Supplemental Data | |
Year Ended
December 31 | | Net Asset
Value,
Beginning of Period | | | Net
Investment
Income(a) | | | Net
Realized
and
Unrealized
Gain (Loss)
on Investments | | | Total from
Investment Operations | | | Net Investment
Income | | | Net
Realized
Gain on
Investments | | | Return of
Capital | | | Total
Distributions | | | Redemption Fees(a)(b) | | | Net Asset
Value,
End of
Period | | | Total
Return† | | | Net Assets End of Period (in 000’s) | | | Net
Investment
Income | | | Operating
Expenses | | Portfolio
Turnover
Rate | |
Class AAA | |
2017 | | $ | 9.26 | | | $ | 0.15 | | | $ | 0.66 | | | $ | 0.81 | | | $ | (0.13 | ) | | $ | (0.07 | ) | | $ | (0.64 | ) | | $ | (0.84 | ) | | $ | 0.00 | | | $ | 9.23 | | | | 8.9 | % | | $ | 350,709 | | | | 1.58% | | | 1.37%(c) | | | 2% | |
2016 | | | 8.70 | | | | 0.15 | | | | 1.28 | | | | 1.43 | | | | (0.14 | ) | | | (0.13 | ) | | | (0.60 | ) | | | (0.87 | ) | | | 0.00 | | | | 9.26 | | | | 17.0 | | | | 364,411 | | | | 1.65 | | | 1.38(c) | | | 4 | |
2015†† | | | 10.50 | | | | 0.11 | | | | (1.07 | ) | | | (0.96 | ) | | | (0.09 | ) | | | (0.70 | ) | | | (0.05 | ) | | | (0.84 | ) | | | 0.00 | | | | 8.70 | | | | (8.3 | ) | | | 371,419 | | | | 1.42 | | | 1.39(c) | | | 8 | |
2014†† | | | 11.24 | | | | 0.18 | | | | 0.76 | | | | 0.94 | | | | (0.14 | ) | | | (0.10 | ) | | | (1.44 | ) | | | (1.68 | ) | | | 0.00 | | | | 10.50 | | | | 8.9 | | | | 820,328 | | | | 1.64 | | | 1.36 | | | 9 | |
2013†† | | | 10.86 | | | | 0.18 | | | | 1.88 | | | | 2.06 | | | | (0.14 | ) | | | (0.20 | ) | | | (1.34 | ) | | | (1.68 | ) | | | 0.00 | | | | 11.24 | | | | 20.2 | | | | 738,742 | | | | 1.60 | | | 1.37 | | | 11 | |
Class A | |
2017 | | $ | 9.40 | | | $ | 0.15 | | | $ | 0.66 | | | $ | 0.81 | | | $ | (0.13 | ) | | $ | (0.07 | ) | | $ | (0.64 | ) | | $ | (0.84 | ) | | $ | 0.00 | | | $ | 9.37 | | | | 8.8 | % | | $ | 837,684 | | | | 1.57% | | | 1.37%(c) | | | 2% | |
2016 | | | 8.82 | | | | 0.15 | | | | 1.30 | | | | 1.45 | | | | (0.13 | ) | | | (0.13 | ) | | | (0.61 | ) | | | (0.87 | ) | | | 0.00 | | | | 9.40 | | | | 17.0 | | | | 808,349 | | | | 1.64 | | | 1.38(c) | | | 4 | |
2015†† | | | 10.64 | | | | 0.12 | | | | (1.10 | ) | | | (0.98 | ) | | | (0.09 | ) | | | (0.70 | ) | | | (0.05 | ) | | | (0.84 | ) | | | 0.00 | | | | 8.82 | | | | (8.3 | ) | | | 713,208 | | | | 1.45 | | | 1.39(c) | | | 8 | |
2014†† | | | 11.36 | | | | 0.18 | | | | 0.78 | | | | 0.96 | | | | (0.14 | ) | | | (0.10 | ) | | | (1.44 | ) | | | (1.68 | ) | | | 0.00 | | | | 10.64 | | | | 9.0 | | | | 1,231,349 | | | | 1.64 | | | 1.36 | | | 9 | |
2013†† | | | 10.96 | | | | 0.18 | | | | 1.90 | | | | 2.08 | | | | (0.14 | ) | | | (0.20 | ) | | | (1.34 | ) | | | (1.68 | ) | | | 0.00 | | | | 11.36 | | | | 20.2 | | | | 1,109,532 | | | | 1.60 | | | 1.37 | | | 11 | |
Class C | |
2017 | | $ | 6.88 | | | $ | 0.06 | | | $ | 0.48 | | | $ | 0.54 | | | $ | (0.09 | ) | | $ | (0.07 | ) | | $ | (0.68 | ) | | $ | (0.84 | ) | | $ | 0.00 | | | $ | 6.58 | | | | 8.0 | % | | $ | 776,370 | | | | 0.83% | | | 2.12%(c) | | | 2% | |
2016 | | | 6.71 | | | | 0.06 | | | | 0.98 | | | | 1.04 | | | | (0.09 | ) | | | (0.13 | ) | | | (0.65 | ) | | | (0.87 | ) | | | 0.00 | | | | 6.88 | | | | 16.2 | | | | 776,780 | | | | 0.89 | | | 2.13(c) | | | 4 | |
2015†† | | | 8.40 | | | | 0.05 | | | | (0.90 | ) | | | (0.85 | ) | | | (0.09 | ) | | | (0.70 | ) | | | (0.05 | ) | | | (0.84 | ) | | | 0.00 | | | | 6.71 | | | | (9.1 | ) | | | 736,494 | | | | 0.73 | | | 2.14(c) | | | 8 | |
2014†† | | | 9.38 | | | | 0.08 | | | | 0.62 | | | | 0.70 | | | | (0.14 | ) | | | (0.10 | ) | | | (1.44 | ) | | | (1.68 | ) | | | 0.00 | | | | 8.40 | | | | 8.1 | | | | 1,111,695 | | | | 0.89 | | | 2.11 | | | 9 | |
2013†† | | | 9.36 | | | | 0.08 | | | | 1.62 | | | | 1.70 | | | | (0.14 | ) | | | (0.20 | ) | | | (1.34 | ) | | | (1.68 | ) | | | 0.00 | | | | 9.38 | | | | 19.5 | | | | 1,037,073 | | | | 0.85 | | | 2.12 | | | 11 | |
Class I | |
2017 | | $ | 9.63 | | | $ | 0.18 | | | $ | 0.68 | | | $ | 0.86 | | | $ | (0.15 | ) | | $ | (0.07 | ) | | $ | (0.62 | ) | | $ | (0.84 | ) | | $ | 0.00 | | | $ | 9.65 | | | | 9.1 | % | | $ | 272,376 | | | | 1.81% | | | 1.12%(c) | | | 2% | |
2016 | | | 8.99 | | | | 0.18 | | | | 1.33 | | | | 1.51 | | | | (0.16 | ) | | | (0.13 | ) | | | (0.58 | ) | | | (0.87 | ) | | | 0.00 | | | | 9.63 | | | | 17.4 | | | | 160,147 | | | | 1.89 | | | 1.13(c) | | | 4 | |
2015†† | | | 10.80 | | | | 0.14 | | | | (1.11 | ) | | | (0.97 | ) | | | (0.09 | ) | | | (0.70 | ) | | | (0.05 | ) | | | (0.84 | ) | | | 0.00 | | | | 8.99 | | | | (8.1 | ) | | | 141,325 | | | | 1.70 | | | 1.14(c) | | | 8 | |
2014†† | | | 11.48 | | | | 0.20 | | | | 0.80 | | | | 1.00 | | | | (0.14 | ) | | | (0.10 | ) | | | (1.44 | ) | | | (1.68 | ) | | | 0.00 | | | | 10.80 | | | | 9.3 | | | | 255,651 | | | | 1.86 | | | 1.11 | | | 9 | |
2013†† | | | 11.04 | | | | 0.22 | | | | 1.90 | | | | 2.12 | | | | (0.14 | ) | | | (0.20 | ) | | | (1.34 | ) | | | (1.68 | ) | | | 0.00 | | | | 11.48 | | | | 20.4 | | | | 179,913 | | | | 1.85 | | | 1.12 | | | 11 | |
Class T(d) | |
2017 | | $ | 9.33 | | | $ | 0.05 | | | $ | 0.26 | | | $ | 0.31 | | | $ | (0.16 | ) | | $ | (0.07 | ) | | $ | (0.19 | ) | | $ | (0.42 | ) | | $ | 0.00 | | | $ | 9.22 | | | | 3.3 | % | | $ | 1 | | | | 0.98% | (e) | | 1.37%(e) | | | 2% | |
| † | Total return represents aggregate total return of a hypothetical $1,000 investment at the beginning of the period and sold at the end of the period including reinvestment of distributions and does not reflect applicable sales charges. Total return for a period of less than one year is not annualized. |
| †† | All per share amounts and net asset values have been adjusted as a result of the 1 for 2 reverse stock split on March 6, 2015. |
| (a) | Per share amounts have been calculated using the average shares outstanding method. |
| (b) | Amount represents less than $0.005 per share. |
| (c) | The Fund received credits from a designated broker who agreed to pay certain Fund operating expenses. For the years ended December 31, 2017, 2016, and 2015, there was no impact on the expense ratios. |
| (d) | Class T Shares were initially offered on July 5, 2017. |
See accompanying notes to financial statements.
13
The Gabelli Utilities Fund
Notes to Financial Statements
1. Organization. The Gabelli Utilities Fund was organized on May 18, 1999 as a Delaware statutory trust. On July 5, 2017, the Fund began to offer for sale Class T Shares. The Fund is a diversified open-end management investment company registered under the Investment Company Act of 1940, as amended (the “1940 Act”). The Fund commenced operations on August 31, 1999. The Fund’s primary objective is to provide a high level of total return through a combination of capital appreciation and current income.
The Fund invests a high percentage of its assets in the utilities sector. As a result, the Fund may be more susceptible to economic, political, and regulatory developments, positive or negative, and may experience increased volatility to the Fund’s NAV and a magnified effect in its total return.
2. Significant Accounting Policies. As an investment company, the Fund follows the investment company accounting and reporting guidance, which is part of U.S. generally accepted accounting principles (“GAAP”) that may require the use of management estimates and assumptions in the preparation of its financial statements. Actual results could differ from those estimates. The following is a summary of significant accounting policies followed by the Fund in the preparation of its financial statements.
Security Valuation. Portfolio securities listed or traded on a nationally recognized securities exchange or traded in the U.S. over-the-counter market for which market quotations are readily available are valued at the last quoted sale price or a market’s official closing price as of the close of business on the day the securities are being valued. If there were no sales that day, the security is valued at the average of the closing bid and asked prices or, if there were no asked prices quoted on that day, then the security is valued at the closing bid price on that day. If no bid or asked prices are quoted on such day, the security is valued at the most recently available price or, if the Board of Trustees (the “Board”) so determines, by such other method as the Board shall determine in good faith to reflect its fair market value. Portfolio securities traded on more than one national securities exchange or market are valued according to the broadest and most representative market, as determined by Gabelli Funds, LLC (the “Adviser”).
Portfolio securities primarily traded on a foreign market are generally valued at the preceding closing values of such securities on the relevant market, but may be fair valued pursuant to procedures established by the Board if market conditions change significantly after the close of the foreign market, but prior to the close of business on the day the securities are being valued. Debt obligations for which market quotations are readily available are valued at the average of the latest bid and asked prices. If there were no asked prices quoted on such day, the security is valued using the closing bid price, unless the Board determines such amount does not reflect the securities’ fair vale, in which case these securities will be fair valued as determined by the Board. Certain securities are valued principally using dealer quotations. Futures contracts are valued at the closing settlement price of the exchange or board of trade on which the applicable contract is traded. OTC futures and options on futures for which market quotations are readily available will be valued by quotations received from a pricing service or, if no quotations are available from a pricing service, by quotations obtained from one or more dealers in the instrument in question by the Adviser.
Securities and assets for which market quotations are not readily available are fair valued as determined by the Board. Fair valuation methodologies and procedures may include, but are not limited to: analysis and review of available financial and non-financial information about the company; comparisons with the valuation and changes in valuation of similar securities, including a comparison of foreign securities with the equivalent U.S. dollar value American Depositary Receipt securities at the close of the U.S. exchange; and evaluation of any other information that could be indicative of the value of the security.
14
The Gabelli Utilities Fund
Notes to Financial Statements (Continued)
The inputs and valuation techniques used to measure fair value of the Fund’s investments are summarized into three levels as described in the hierarchy below:
| | ● | | Level 1 — quoted prices in active markets for identical securities; |
| | ● | | Level 2 — other significant observable inputs (including quoted prices for similar securities, interest rates, prepayment speeds, credit risk, etc.); and |
| | ● | | Level 3 — significant unobservable inputs (including the Board’s determinations as to the fair value of investments). |
A financial instrument’s level within the fair value hierarchy is based on the lowest level of any input both individually and in the aggregate that is significant to the fair value measurement. The inputs or methodology used for valuing securities are not necessarily an indication of the risk associated with investing in those securities. The summary of the Fund’s investments in securities by inputs used to value the Fund’s investments as of December 31, 2017 is as follows:
| | | | | | | | | | | | | | | | |
| | | Valuation Inputs | | | | |
| | | Level 1
Quoted Prices | | | Level 2 Other Significant
Observable Inputs | | | Level 3 Significant
Unobservable Inputs | | | Total Market Value
at 12/31/17 | |
INVESTMENTS IN SECURITIES: | | | | | | | | | | | | | | | | |
ASSETS (Market Value): | | | | | | | | | | | | | | | | |
Common Stocks: | | | | | | | | | | | | | | | | |
ENERGY AND UTILITIES | | | | | | | | | | | | | | | | |
Global Utilities | | | $ 45,929,368 | | | | $ 660 | | | | — | | | $ | 45,930,028 | |
Merchant Energy | | | 36,153,441 | | | | — | | | $ | 0 | | | | 36,153,441 | |
Other Industries (a) | | | 1,457,112,040 | | | | — | | | | — | | | | 1,457,112,040 | |
COMMUNICATIONS (a) | | | 434,424,035 | | | | — | | | | — | | | | 434,424,035 | |
OTHER | | | — | | | | — | | | | — | | | | — | |
Aerospace | | | 22,871,493 | | | | — | | | | 124,214 | | | | 22,995,707 | |
Other Industries (a) | | | 139,000,620 | | | | — | | | | — | | | | 139,000,620 | |
| |
Total Common Stocks | | | 2,135,490,997 | | | | 660 | | | | 124,214 | | | | 2,135,615,871 | |
| |
Convertible Preferred Stocks (a) | | | 1,071,000 | | | | 1,080,000 | | | | — | | | | 2,151,000 | |
Warrants (a) | | | | | | | 664,000 | | | | — | | | | 664,000 | |
Corporate Bonds(a) | | | — | | | | 1,541,250 | | | | — | | | | 1,541,250 | |
U.S. Government Obligations | | | — | | | | 97,221,304 | | | | — | | | | 97,221,304 | |
| |
TOTAL INVESTMENTS IN SECURITIES – ASSETS | | $ | 2,136,561,997 | | | $ | 100,507,214 | | | $ | 124,214 | | | $ | 2,237,193,425 | |
| |
(a) Please refer to the Schedule of Investments for the industry classifications of these portfolio holdings.
The Fund did not have material transfers among Level 1, Level 2, and Level 3 during the year ended December 31, 2017. The Fund’s policy is to recognize transfers among Levels as of the beginning of the reporting period.
Additional Information to Evaluate Qualitative Information.
General. The Fund uses recognized industry pricing services – approved by the Board and unaffiliated with the Adviser – to value most of its securities, and uses broker quotes provided by market makers of securities not valued by these and other recognized pricing sources. Several different pricing feeds are received to value domestic equity securities, international equity securities, preferred equity securities, and fixed income securities. The data within these feeds are ultimately sourced from major stock exchanges and trading systems where
15
The Gabelli Utilities Fund
Notes to Financial Statements (Continued)
these securities trade. The prices supplied by external sources are checked by obtaining quotations or actual transaction prices from market participants. If a price obtained from the pricing source is deemed unreliable, prices will be sought from another pricing service or from a broker/dealer that trades that security or similar securities.
Fair Valuation. Fair valued securities may be common or preferred equities, warrants, options, rights, or fixed income obligations. Where appropriate, Level 3 securities are those for which market quotations are not available, such as securities not traded for several days, or for which current bids are not available, or which are restricted as to transfer. Among the factors to be considered to fair value a security are recent prices of comparable securities that are publicly traded, reliable prices of securities not publicly traded, the use of valuation models, current analyst reports, valuing the income or cash flow of the issuer, or cost if the preceding factors do not apply. A significant change in the unobservable inputs could result in a lower or higher value in Level 3 securities. The circumstances of Level 3 securities are frequently monitored to determine if fair valuation measures continue to apply.
The Adviser reports quarterly to the Board the results of the application of fair valuation policies and procedures. These include back testing the prices realized in subsequent trades of these fair valued securities to fair values previously recognized.
Foreign Currency Translations. The books and records of the Fund are maintained in U.S. dollars. Foreign currencies, investments, and other assets and liabilities are translated into U.S. dollars at current exchange rates. Purchases and sales of investment securities, income, and expenses are translated at the exchange rate prevailing on the respective dates of such transactions. Unrealized gains and losses that result from changes in foreign exchange rates and/or changes in market prices of securities have been included in unrealized appreciation/depreciation on investments and foreign currency translations. Net realized foreign currency gains and losses resulting from changes in exchange rates include foreign currency gains and losses between trade date and settlement date on investment securities transactions, foreign currency transactions, and the difference between the amounts of interest and dividends recorded on the books of the Fund and the amounts actually received. The portion of foreign currency gains and losses related to fluctuation in exchange rates between the initial purchase trade date and subsequent sale trade date is included in realized gain/(loss) on investments.
Foreign Securities. The Fund may directly purchase securities of foreign issuers. Investing in securities of foreign issuers involves special risks not typically associated with investing in securities of U.S. issuers. The risks include possible revaluation of currencies, the inability to repatriate funds, less complete financial information about companies, and possible future adverse political and economic developments. Moreover, securities of many foreign issuers and their markets may be less liquid and their prices more volatile than securities of comparable U.S. issuers.
Foreign Taxes. The Fund may be subject to foreign taxes on income, gains on investments, or currency repatriation, a portion of which may be recoverable. The Fund will accrue such taxes and recoveries as applicable, based upon its current interpretation of tax rules and regulations that exist in the markets in which it invests.
16
The Gabelli Utilities Fund
Notes to Financial Statements (Continued)
Restricted Securities. The Fund may invest up to 15% of its net assets in securities for which the markets are restricted. Restricted securities include securities whose disposition is subject to substantial legal or contractual restrictions. The sale of restricted securities often requires more time and results in higher brokerage charges or dealer discounts and other selling expenses than does the sale of securities eligible for trading on national securities exchanges or in the over-the-counter markets. Restricted securities may sell at a price lower than similar securities that are not subject to restrictions on resale. Securities freely saleable among qualified institutional investors under special rules adopted by the SEC may be treated as liquid if they satisfy liquidity standards established by the Board. The continued liquidity of such securities is not as well assured as that of publicly traded securities, and accordingly the Board will monitor their liquidity. For the restricted securities the Fund held at December 31, 2017, refer to the Schedule of Investments.
Securities Transactions and Investment Income. Securities transactions are accounted for on the trade date with realized gain/(loss) on investments determined by using the identified cost method. Interest income (including amortization of premium and accretion of discount) is recorded on an accrual basis. Premiums and discounts on debt securities are amortized using the effective yield to maturity method. Dividend income is recorded on the ex-dividend date, except for certain dividends from foreign securities that are recorded as soon after the ex-dividend date as the Fund becomes aware of such dividends.
Determination of Net Asset Value and Calculation of Expenses. Certain administrative expenses are common to, and allocated among, various affiliated funds. Such allocations are made on the basis of each fund’s average net assets or other criteria directly affecting the expenses as determined by the Adviser pursuant to procedures established by the Board.
In calculating the NAV per share of each class, investment income, realized and unrealized gains and losses, redemption fees, and expenses other than class specific expenses are allocated daily to each class of shares based upon the proportion of net assets of each class at the beginning of each day. Distribution expenses are borne solely by the class incurring the expense.
Distributions to Shareholders. Distributions to shareholders are recorded on the ex-dividend date. Distributions to shareholders are based on income and capital gains as determined in accordance with federal income tax regulations, which may differ from income and capital gains as determined under GAAP. These differences are primarily due to differing treatments of income and gains on various investment securities and foreign currency transactions held by the Fund, timing differences, and differing characterizations of distributions made by the Fund. Distributions made in excess of current earnings and profits on a tax basis are treated as a non-taxable return of capital. Distributions from net investment income for federal income tax purposes include net realized gains on foreign currency transactions. These book/tax differences are either temporary or permanent in nature. To the extent these differences are permanent, adjustments are made to the appropriate capital accounts in the period when the differences arise. Permanent differences were primarily due to foreign currency gains and losses and prior period adjustments. These reclassifications have no impact on the NAV of the Fund. For the year ended December 31, 2017, reclassifications were made to decrease distributions in excess of net investment income by $379,617 and decrease distributions in excess of net realized gains on investments and foreign currency transactions by $66,469, with an offsetting adjustment to paid-in capital.
17
The Gabelli Utilities Fund
Notes to Financial Statements (Continued)
The tax character of distributions paid during the years ended December 31, 2017 and 2016 was as follows:
| | | | | | | | |
| | | Year Ended
December 31, 2017 | | | Year Ended
December 31, 2016 | |
Distributions paid from: | | | | | | | | |
Ordinary income (inclusive of short term capital gains) | | | $ 30,251,265 | | | | $ 33,987,237 | |
Long term capital gains | | | 19,275,900 | | | | 27,872,180 | |
Return of capital | | | 172,370,337 | | | | 158,109,987 | |
Total distributions paid | | | $221,897,502 | | | | $219,969,404 | |
Since January 2000, the Fund has had a fixed distribution policy. Under the policy, the Fund declares and pays monthly distributions from net investment income, capital gains, and paid-in capital. The actual source of the distribution is determined after the end of the year. Pursuant to this policy, distributions during the year may be made in excess of required distributions. To the extent such distributions are made from current earnings and profits, they are considered ordinary income or long term capital gains. The Fund’s current distribution policy may restrict the Fund’s ability to pass through to shareholders all of its net realized long term capital gains as a Capital Gain Dividend, and may cause such gains to be treated as ordinary income. Distributions sourced from paid-in capital should not be considered as dividend yield or the total return from an investment in the Fund. The Board continues to evaluate the distribution policy in light of ongoing economic and market conditions and may change the amount of the monthly distributions in the future.
Provision for Income Taxes. The Fund intends to continue to qualify as a regulated investment company under Subchapter M of the Internal Revenue Code of 1986, as amended (the “Code”). It is the policy of the Fund to comply with the requirements of the Code applicable to regulated investment companies and to distribute substantially all of its net investment company taxable income and net capital gains. Therefore, no provision for federal income taxes is required.
As of December 31, 2017, the components of accumulated earnings/losses on a tax basis were as follows:
| | | | |
Net unrealized appreciation on investments and foreign currency translations | | $ | 802,856,197 | |
At December 31, 2017, the temporary differences between book basis and tax basis net unrealized appreciation on investments were primarily due to deferral of losses from wash sales for tax purposes, tax basis adjustments on investments in partnerships, and mark-to-market adjustments on investments in passive foreign investment companies.
The Fund is permitted to carry capital losses forward for an unlimited period. Capital losses that are carried forward will retain their character as either short term or long term capital losses.
The following summarizes the tax cost of investments and the related net unrealized appreciation at December 31, 2017:
| | | | | | | | | | | | | | | | |
| | | Cost | | | Gross
Unrealized
Appreciation | | | Gross
Unrealized
Depreciation | | | Net Unrealized
Appreciation | |
Investments | | $ | 1,434,345,128 | | | $ | 883,622,626 | | | $ | (80,774,329 | ) | | $ | 802,848,297 | |
The Fund is required to evaluate tax positions taken or expected to be taken in the course of preparing the Fund’s tax returns to determine whether the tax positions are “more-likely-than-not” of being sustained by the applicable tax authority. Income tax and related interest and penalties would be recognized by the Fund as
18
The Gabelli Utilities Fund
Notes to Financial Statements (Continued)
tax expense in the Statement of Operations if the tax positions were deemed not to meet the more-likely-than-not threshold. For the year ended December 31, 2017, the Fund did not incur any income tax, interest, or penalties. As of December 31, 2017, the Adviser has reviewed all open tax years and concluded that there was no impact to the Fund’s net assets or results of operations. The Fund’s federal and state tax returns for the prior three fiscal years remain open, subject to examination. On an ongoing basis, the Adviser will monitor the Fund’s tax positions to determine if adjustments to this conclusion are necessary.
3. Investment Advisory Agreement and Other Transactions. The Fund has entered into an investment advisory agreement (the “Advisory Agreement”) with the Adviser which provides that the Fund will pay the Adviser a fee, computed daily and paid monthly, at the annual rate of 1.00% of the value of its average daily net assets. In accordance with the Advisory Agreement, the Adviser provides a continuous investment program for the Fund’s portfolio, oversees the administration of all aspects of the Fund’s business and affairs, and pays the compensation of all Officers and Trustees of the Fund who are affiliated persons of the Adviser.
The Fund pays each Trustee who is not considered an affiliated person an annual retainer of $18,000 plus $2,000 for each Board meeting attended and they are reimbursed for any out of pocket expenses incurred in attending meetings. All Board committee members receive $500 per meeting attended and the Chairman of the Audit Committee and the Lead Trustee each receives an annual fee of $2,000. A Trustee may receive a single meeting fee, allocated among the participating funds, for participation in certain meetings held on behalf of multiple funds. Trustees who are directors or employees of the Adviser or an affiliated company receive no compensation or expense reimbursement from the Fund.
4. Distribution Plan. The Fund’s Board has adopted a distribution plan (the “Plan”) for each class of shares, except for Class I Shares, pursuant to Rule 12b-1 under the 1940 Act. Under the Class AAA, Class A, Class C, and Class T Share Plans, payments are authorized to G.distributors, LLC (the “Distributor”), an affiliate of the Adviser, at annual rates of 0.25%, 0.25%, 1.00%, and 0.25%, respectively, of the average daily net assets of those classes, the annual limitations under each Plan. Such payments are accrued daily and paid monthly.
5. Portfolio Securities. Purchases and sales of securities during the year ended December 31, 2017, other than short term securities and U.S. Government obligations, aggregated $43,366,598 and $113,042,742, respectively.
6. Transactions with Affiliates and Other Arrangements. During the year ended December 31, 2017, the Fund paid $85,154 in brokerage commissions on security trades to G.research, LLC, an affiliate of the Adviser. Additionally the Distributor retained a total of $1,336,561 from investors representing commissions (sales charges and underwriting fees) on sales and redemptions of Fund shares.
During the year ended December 31, 2017, the Fund received credits from a designated broker who agreed to pay certain Fund operating expenses. The amount of such expenses paid through this directed brokerage arrangement during this period was $15,703.
The cost of calculating the Fund’s NAV per share is a Fund expense pursuant to the Advisory Agreement. During the year ended December 31, 2017, the Fund paid or accrued $45,000 to the Adviser in connection with the cost of computing the Fund’s NAV.
19
The Gabelli Utilities Fund
Notes to Financial Statements (Continued)
7. Line of Credit. The Fund participates in an unsecured line of credit, which expires March 8, 2018 and may be renewed annually, of up to $75,000,000 under which it may borrow up to 10% of its net assets from the custodian for temporary borrowing purposes. Borrowings under this arrangement bear interest at a floating rate equal to the higher of the overnight Federal Funds rate plus 125 basis points or the 30-day LIBOR plus 125 basis points in effect on that day. This amount, if any, would be included in “Interest expense” in the Statement of Operations. During the year ended December 31, 2017, there were no borrowings outstanding under the line of credit.
8. Shares of Beneficial Interest. The Fund offers five classes of shares – Class AAA Shares, Class A Shares, Class C Shares, Class I Shares and Class T Shares. Class AAA Shares and Class I Shares are offered without a sales charge. Class A Shares and Class T Shares are subject to a maximum front-end sales charge of 5.75% and 2.50%, respectively. Class C Shares are subject to a 1.00% contingent deferred sales charge for one year after purchase.
The Fund imposes a redemption fee of 2.00% on all classes of shares that are redeemed or exchanged on or before the seventh day after the date of a purchase. The redemption fee is deducted from the proceeds otherwise payable to the redeeming shareholders and is retained by the Fund as an increase in paid-in capital. The redemption fees retained by the Fund during the years ended December 31, 2017 and 2016, if any, can be found in the Statement of Changes in Net Assets under Redemption Fees.
20
The Gabelli Utilities Fund
Notes to Financial Statements (Continued)
Transactions in shares of beneficial interest were as follows:
| | | | | | | | | | | | | | | | |
| | | Year Ended
December 31, 2017 | | | Year Ended
December 31, 2016 | |
| | | Shares | | | Amount | | | Shares | | | Amount | |
Class AAA | | | | | | | | | | | | | | | | |
Shares sold | | | 4,891,720 | | | $ | 46,210,450 | | | | 4,639,468 | | | $ | 43,018,104 | |
Shares issued upon reinvestment of distributions | | | 3,072,628 | | | | 28,996,855 | | | | 3,454,038 | | | | 31,946,668 | |
Shares redeemed | | | (9,291,649 | ) | | | (87,790,185 | ) | | | (11,440,214 | ) | | | (105,310,364 | ) |
| | | | | | | | | | | | | | | | |
Net decrease | | | (1,327,301 | ) | | $ | (12,582,880 | ) | | | (3,346,708 | ) | | $ | (30,345,592 | ) |
| | | | | | | | | | | | | | | | |
Class A | | | | | | | | | | | | | | | | |
Shares sold | | | 20,115,610 | | | $ | 193,210,651 | | | | 16,726,963 | | | $ | 158,562,726 | |
Shares issued upon reinvestment of distributions | | | 6,308,397 | | | | 60,419,407 | | | | 6,431,994 | | | | 60,335,587 | |
Shares redeemed | | | (23,064,626 | ) | | | (221,402,278 | ) | | | (18,041,906 | ) | | | (169,170,172 | ) |
| | | | | | | | | | | | | | | | |
Net increase | | | 3,359,381 | | | $ | 32,227,780 | | | | 5,117,051 | | | $ | 49,728,141 | |
| | | | | | | | | | | | | | | | |
Class C | | | | | | | | | | | | | | | | |
Shares sold | | | 17,834,104 | | | $ | 122,991,759 | | | | 14,746,021 | | | $ | 103,855,094 | |
Shares issued upon reinvestment of distributions | | | 11,946,577 | | | | 81,896,943 | | | | 11,607,259 | | | | 81,152,204 | |
Shares redeemed | | | (24,679,977 | ) | | | (169,867,589 | ) | | | (23,171,261 | ) | | | (161,600,408 | ) |
| | | | | | | | | | | | | | | | |
Net increase | | | 5,100,704 | | | $ | 35,021,113 | | | | 3,182,019 | | | $ | 23,406,890 | |
| | | | | | | | | | | | | | | | |
Class I | | | | | | | | | | | | | | | | |
Shares sold | | | 15,609,938 | | | $ | 153,940,468 | | | | 5,401,511 | | | $ | 52,129,624 | |
Shares issued upon reinvestment of distributions | | | 1,495,658 | | | | 14,720,067 | | | | 1,186,059 | | | | 11,379,762 | |
Shares redeemed | | | (5,511,547 | ) | | | (54,323,366 | ) | | | (5,672,219 | ) | | | (54,176,162 | ) |
| | | | | | | | | | | | | | | | |
Net increase | | | 11,594,049 | | | $ | 114,337,169 | | | | 915,351 | | | $ | 9,333,224 | |
| | | | | | | | | | | | | | | | |
Class T(a) | | | | | | | | | | | | | | | | |
Shares sold | | | 107 | | | $ | 1,000 | | | | — | | | | — | |
Shares issued upon reinvestment of distributions | | | 5 | | | | 46 | | | | — | | | | — | |
| | | | | | | | | | | | | | | | |
Net increase | | | 112 | | | $ | 1,046 | | | | — | | | | — | |
| | | | | | | | | | | | | | | | |
(a) Class T Shares were initially offered on July 5, 2017.
9. Transactions in Securities of Affiliated Issuers. The 1940 Act defines affiliated issuers as those in which the Fund’s holdings of an issuer represent 5% or more of the outstanding voting securities of the issuer. A summary of the Fund’s transactions in the securities of these issuers during the year ended December 31, 2017 is set forth below:
| | | | | | | | | | | | | | | | | | | | | | | | | | | | |
| | | Beginning
Shares | | | Stock
Dividend | | | Ending
Shares | | | Dividend
Income | | | Realized
Gain | | | Value at
December 31, 2017 | | Change in
Unrealized
Appreciation | | | Percent
Owned of
Shares
Outstanding |
Corning Natural Gas Holding Corp. | | | 324,000 | | | | 64,800 | | | | 388,800 | | | | $209,304 | | | | — | | | $7,581,600 | | | $1,425,600 | | | 12.99% |
Corning Natural Gas Holding Corp., 4.800%, Ser. B | | | 54,000 | | | | — | | | | 54,000 | | | | 53,946 | | | | — | | | 1,080,000 | | | 54,428 | | | 22.11% |
Total | | | | | | | | | | | | | | | $263,250 | | | | — | | | $8,661,600 | | | $1,480,028 | | | |
21
The Gabelli Utilities Fund
Notes to Financial Statements (Continued)
10. Indemnifications. The Fund enters into contracts that contain a variety of indemnifications. The Fund’s maximum exposure under these arrangements is unknown. However, the Fund has not had prior claims or losses pursuant to these contracts. Management has reviewed the Fund’s existing contracts and expects the risk of loss to be remote.
11. Subsequent Events. Management has evaluated the impact on the Fund of all other subsequent events occurring through the date the financial statements were issued and has determined that there were no subsequent events requiring recognition or disclosure in the financial statements.
22
The Gabelli Utilities Fund
Report of Independent Registered Public Accounting Firm
To the Shareholders and Board of Trustees of
The Gabelli Utilities Fund
Opinion on the Financial Statements
We have audited the accompanying statement of assets and liabilities of The Gabelli Utilities Fund (the “Fund”), including the schedule of investments, as of December 31, 2017, and the related statement of operations for the year then ended, the statements of changes in net assets for each of the two years in the period then ended, the financial highlights for each of the five years in the period then ended and the related notes (collectively referred to as the “financial statements”). In our opinion, the financial statements present fairly, in all material respects, the financial position of the Fund at December 31, 2017, the results of its operations for the year then ended, the changes in its net assets for each of the two years in the period then ended and its financial highlights for each of the five years in the period then ended, in conformity with U.S. generally accepted accounting principles.
Basis for Opinion
These financial statements are the responsibility of the Fund’s management. Our responsibility is to express an opinion on the Fund’s financial statements based on our audits. We are a public accounting firm registered with the Public Company Accounting Oversight Board (United States) (“PCAOB”) and are required to be independent with respect to the Fund in accordance with the U.S. federal securities laws and the applicable rules and regulations of the Securities and Exchange Commission and the PCAOB.
We conducted our audits in accordance with the standards of the PCAOB. Those standards require that we plan and perform the audit to obtain reasonable assurance about whether the financial statements and financial highlights are free of material misstatement, whether due to error or fraud. The Fund is not required to have, nor were we engaged to perform, an audit of the Fund’s internal control over financial reporting. As part of our audits, we are required to obtain an understanding of internal control over financial reporting, but not for the purpose of expressing an opinion on the effectiveness of the Fund’s internal control over financial reporting. Accordingly, we express no such opinion.
Our audits included performing procedures to assess the risks of material misstatement of the financial statements, whether due to error or fraud, and performing procedures that respond to those risks. Such procedures included examining, on a test basis, evidence regarding the amounts and disclosures in the financial statements. Our procedures included confirmation of securities owned as of December 31, 2017, by correspondence with the custodian. Our audits also included evaluating the accounting principles used and significant estimates made by management, as well as evaluating the overall presentation of the financial statements. We believe that our audits provide a reasonable basis for our opinion.

We have served as the auditor of one or more Gabelli/GAMCO Funds investment companies since 1992.
Philadelphia, Pennsylvania
February 28, 2018
23
The Gabelli Utilities Fund
Additional Fund Information (Unaudited)
The business and affairs of the Fund are managed under the direction of the Fund’s Board of Trustees. Information pertaining to the Trustees and officers of the Fund is set forth below. The Fund’s Statement of Additional Information includes additional information about the Fund’s Trustees and is available without charge, upon request, by calling 800-GABELLI (800-422-3554) or by writing to The Gabelli Utilities Fund at One Corporate Center, Rye, NY 10580-1422.
| | | | | | | | |
Name, Position(s) Address1 and Age | | Term of Office
and Length of
Time Served2 | | Number of Funds in Fund Complex
Overseen by Trustee | | Principal Occupation(s) During Past Five Years | | Other Directorships Held by Trustee3 |
| | | | |
| INTERESTED TRUSTEES4: | | | | | | | | |
| | | | |
Mario J. Gabelli, CFA Trustee Age: 75 | | Since 1999 | | 32 | | Chairman, Chief Executive Officer, and Chief Investment Officer– Value Portfolios of GAMCO Investors, Inc. and Chief Investment Officer– Value Portfolios of Gabelli Funds, LLC and GAMCO Asset Management Inc.; Director/ Trustee or Chief Investment Officer of other registered investment companies within the Gabelli/GAMCO Fund Complex; Chief Executive Officer of GGCP, Inc.; Executive Chairman of Associated Capital Group, Inc. | | Director of Morgan Group Holdings, Inc. (holding company); Chairman of the Board and Chief Executive Officer of LICT Corp. (multimedia and communication services company); Director of CIBL, Inc. (broadcasting and wireless communications); Director of ICTC Group Inc. (communications) |
|
| INDEPENDENT TRUSTEES5: |
| | | | |
Anthony J. Colavita Trustee Age: 82 | | Since 1999 | | 28 | | President of the law firm of Anthony J. Colavita, P.C. | | — |
| | | | |
Vincent D. Enright Trustee Age: 74 | | Since 1999 | | 17 | | Former Senior Vice President and Chief Financial Officer of KeySpan Corp. (public utility) (1994-1998) | | Director of Echo Therapeutics, Inc. (therapeutics and diagnostics) (2008-2014); Director of the LGL Group, Inc. (diversified manufacturing) (2011-2014) |
| | | | |
Mary E. Hauck Trustee Age: 75 | | Since 2000 | | 11 | | Retired Senior Manager of the Gabelli-O’Connor Fixed Income Mutual Funds Management Company | | — |
| | | | |
Kuni Nakamura Trustee Age: 49 | | Since 2009 | | 33 | | President of Advanced Polymer, Inc. (chemical manufacturing company); President of KEN Enterprises, Inc. (real estate) | | — |
| | | | |
Werner J. Roeder Trustee Age: 77 | | Since 1999 | | 23 | | Retired physician; Former Vice President of Medical Affairs (Medical Director) of New York Presbyterian/Lawrence Hospital (1999-2014) | | — |
24
The Gabelli Utilities Fund
Additional Fund Information (Continued) (Unaudited)
| | | | |
Name, Position(s) Address1 and Age | | Term of Office and Length of Time Served2 | | Principal Occupation(s) During Past Five Years |
| | |
| OFFICERS: | | | | |
| | |
Bruce N. Alpert President Age: 66 | | Since 2003 | | Executive Vice President and Chief Operating Officer of Gabelli Funds, LLC since 1988; Officer of registered investment companies within the Gabelli/GAMCO Fund Complex; Senior Vice President of GAMCO Investors, Inc. since 2008 |
| | |
John C. Ball Treasurer Age: 41 | | Since 2017 | | Treasurer of all the registered investment companies within the Gabelli/GAMCO Fund Complex since 2017; Vice President and Assistant Treasurer of AMG Funds, 2014-2017; Vice President of State Street Corporation, 2007-2014 |
| | |
| | |
| | |
Agnes Mullady Vice President Age: 59 | | Since 2006 | | Officer of all of the registered investment companies within the Gabelli/GAMCO Fund Complex since 2006; President and Chief Operating Officer of the Fund Division of Gabelli Funds, LLC since 2015; Chief Executive Officer of G.distributors, LLC since 2010; Senior Vice President of GAMCO Investors, Inc. since 2009; Vice President of Gabelli Funds, LLC since 2007; Executive Vice President of Associated Capital Group, Inc. since 2016 |
| | |
| | |
| | | |
| | | |
| | |
Andrea R. Mango Secretary Age: 45 | | Since 2013 | | Vice President of GAMCO Investors, Inc. since 2016; Counsel of Gabelli Funds, LLC since 2013; Secretary of all registered investment companies within the Gabelli/GAMCO Fund Complex since 2013; Vice President of all closed-end funds within the Gabelli/GAMCO Fund Complex since 2014; Corporate Vice President within the Corporate Compliance Department of New York Life Insurance Company, 2011-2013 |
| | |
| | |
| | | |
| | |
Richard J. Walz Chief Compliance Officer Age: 58 | | Since 2013 | | Chief Compliance Officer of all of the registered investment companies within the Gabelli/ GAMCO Fund Complex since 2013; Chief Compliance Officer of AEGON USA Investment Management, 2011-2013 |
| | |
| | |
| 1 | Address: One Corporate Center, Rye, NY 10580-1422, unless otherwise noted. |
| 2 | Each Trustee will hold office for an indefinite term until the earliest of (i) the next meeting of shareholders, if any, called for the purpose of considering the election or re-election of such Trustee and until the election and qualification of his or her successor, if any, elected at such meeting, or (ii) the date a Trustee resigns or retires, or a Trustee is removed by the Board of Trustees or shareholders, in accordance with the Fund’s By-Laws and Agreement and Declaration of Trust. Each officer will hold office for an indefinite term until the date he or she resigns or retires or until his or her successor is elected and qualified. |
| 3 | This column includes only directorships of companies required to report to the SEC under the Securities Exchange Act of 1934, as amended, i.e., public companies, or other investment companies registered under the 1940 Act. |
| 4 | “Interested person” of the Fund as defined in the 1940 Act. Mr. Gabelli is considered an “interested person” because of his affiliation with Gabelli Funds, LLC which acts as the Fund’s investment adviser. |
| 5 | Trustees who are not interested persons are considered “Independent” Trustees. |
25
| | | | | | |
| | | Gabelli/GAMCO Funds and Your Personal Privacy | | |
| | | Who are we? The Gabelli/GAMCO Funds are investment companies registered with the Securities and Exchange Commission under the Investment Company Act of 1940. We are managed by Gabelli Funds, LLC and GAMCO Asset Management Inc., which are affiliated with GAMCO Investors, Inc. that is a publicly held company with subsidiaries and affiliates that provide investment advisory services for a variety of clients. What kind of non-public information do we collect about you if you become a fund shareholder? If you apply to open an account directly with us, you will be giving us some non-public information about yourself. The non-public information we collect about you is: | | |
| | | ● | | Information you give us on your application form. This could include your name, address, telephone number, social security number, bank account number, and other information. | | |
| | | ● | | Information about your transactions with us, any transactions with our affiliates, and transactions with the entities we hire to provide services to you. This would include information about the shares that you buy or redeem. If we hire someone else to provide services — like a transfer agent — we will also have information about the transactions that you conduct through them. | | |
| | | What information do we disclose and to whom do we disclose it? We do not disclose any non-public personal information about our customers or former customers to anyone other than our affiliates, our service providers who need to know such information, and as otherwise permitted by law. If you want to find out what the law permits, you can read the privacy rules adopted by the Securities and Exchange Commission. They are in volume 17 of the Code of Federal Regulations, Part 248. The Commission often posts information about its regulations on its website, www.sec.gov. What do we do to protect your personal information? We restrict access to non-public personal information about you to the people who need to know that information in order to provide services to you or the fund and to ensure that we are complying with the laws governing the securities business. We maintain physical, electronic, and procedural safeguards to keep your personal information confidential. | | |
THE GABELLI UTILITIES FUND
One Corporate Center
Rye, NY 10580-1422
Portfolio Manager Biography
Mario J. Gabelli, CFA, is Chairman, Chief Executive Officer, and Chief Investment Officer—Value Portfolios of GAMCO Investors, Inc. that he founded in 1977, and Chief Investment Officer—Value Portfolios of Gabelli Funds, LLC and GAMCO Asset Management Inc. He is also Executive Chairman of Associated Capital Group, Inc. Mr. Gabelli is a summa cum laude graduate of Fordham University and holds an MBA degree from Columbia Business School and Honorary Doctorates from Fordham University and Roger Williams University.
2017 TAX NOTICE TO SHAREHOLDERS (Unaudited)
For the year ended December 31, 2017, the Fund paid to shareholders ordinary income distributions (comprised of net investment income and short term capital gains) totaling $0.120, $0.119, $0.104, $0.141, and $0.222 per share for Class AAA, Class A, Class C, Class I, and Class T Shares, respectively, and long term capital gains totaling $19,275,900 or the maximum allowable. The distributions of long term capital gains have been designated as a capital gain dividend by the Fund’s Board of Trustees. For the year ended December 31, 2017, 100% of the ordinary income distribution qualifies for the dividends received deduction available to corporations. The Fund designates 100% of the ordinary income distribution as qualified dividend income pursuant to the Jobs and Growth Tax Relief Reconciliation Act of 2003. The Fund designates 1.21% of the ordinary income distribution as qualified interest income pursuant to the Tax Relief, Unemployment Recharacterization, and Job Creation Act of 2010. The Fund designates 100% of the ordinary income distribution as qualified short term gain pursuant to the American Jobs Creation Act of 2004.
U.S. Government Income
The percentage of the ordinary income distribution paid by the Fund during 2017 which was derived from U.S. Treasury securities was 1.04%. Such income is exempt from state and local tax in all states. However, many states, including New York and California, allow a tax exemption for a portion of the income earned only if a mutual fund has invested at least 50% of its assets at the end of each quarter of the Fund’s fiscal year in U.S. Government securities. The Fund did not meet this strict requirement in 2017. Due to the diversity in state and local tax law, it is recommended that you consult your personal tax adviser as to the applicability of the information provided to your specific situation.
All designations are based on financial information available as of the date of this annual report and, accordingly, are subject to change. For each item, it is the intention of the Fund to designate the maximum amount permitted under the Internal Revenue Code and the regulations thereunder.
We have separated the portfolio manager’s commentary from the financial statements and investment portfolio due to corporate governance regulations stipulated by the Sarbanes-Oxley Act of 2002. We have done this to ensure that the content of the portfolio manager’s commentary is unrestricted. Both the commentary and the financial statements, including the portfolio of investments, will be available on our website at www.gabelli.com.
THE GABELLI UTILITIES FUND
One Corporate Center
Rye, New York 10580-1422
t 800-GABELLI (800-422-3554)
f 914-921-5118
e info@gabelli.com
GABELLI.COM
Net Asset Value per share available daily
by calling 800-GABELLI after 7:00 P.M.
| | |
| | | |
| |
| BOARD OF TRUSTEES | | OFFICERS |
Mario J. Gabelli, CFA Chairman and Chief Executive Officer, GAMCO Investors, Inc. Executive Chairman, Associated Capital Group, Inc. Anthony J. Colavita President, Anthony J. Colavita, P.C. Vincent D. Enright Former Senior Vice President and Chief Financial Officer, KeySpan Corp. Mary E. Hauck Former Senior Portfolio Manager, Gabelli-O’Connor Fixed Income Mutual Fund Management Co. Kuni Nakamura President, Advanced Polymer, Inc. Werner J. Roeder Former Medical Director, Lawrence Hospital | | Bruce N. Alpert President John C. Ball Treasurer Agnes Mullady Vice President Andrea R. Mango Secretary Richard J. Walz Chief Compliance Officer DISTRIBUTOR G.distributors, LLC CUSTODIAN State Street Bank and Trust Company TRANSFER AGENT AND DIVIDEND DISBURSING AGENT DST Asset Manager Solutions Inc. LEGAL COUNSEL Skadden, Arps, Slate, Meagher & Flom LLP |
This report is submitted for the general information of the shareholders of The Gabelli Utilities Fund. It is not authorized for distribution to prospective investors unless preceded or accompanied by an effective prospectus.
GAB470Q417AR

Item 2. Code of Ethics.
| | (a) | The registrant, as of the end of the period covered by this report, has adopted a code of ethics that applies to the registrant’s principal executive officer, principal financial officer, principal accounting officer or controller, or persons performing similar functions, regardless of whether these individuals are employed by the registrant or a third party. |
| | (c) | There have been no amendments, during the period covered by this report, to a provision of the code of ethics that applies to the registrant’s principal executive officer, principal financial officer, principal accounting officer or controller, or persons performing similar functions, regardless of whether these individuals are employed by the registrant or a third party, and that relates to any element of the code of ethics description. |
| | (d) | The registrant has not granted any waivers, including an implicit waiver, from a provision of the code of ethics that applies to the registrant’s principal executive officer, principal financial officer, principal accounting officer or controller, or persons performing similar functions, regardless of whether these individuals are employed by the registrant or a third party, that relates to one or more of the items set forth in paragraph (b) of this item’s instructions. |
Item 3. Audit Committee Financial Expert.
As of the end of the period covered by the report, the registrant’s Board of Trustees has determined that Vincent D. Enright is qualified to serve as an audit committee financial expert serving on its audit committee and that he is “independent,” as defined by Item 3 of Form N-CSR.
Item 4. Principal Accountant Fees and Services.
Audit Fees
| | (a) | The aggregate fees billed for each of the last two fiscal years for professional services rendered by the principal accountant for the audit of the registrant’s annual financial statements or services that are normally provided by the accountant in connection with statutory and regulatory filings or engagements for those fiscal years are $31,300 for 2016 and $31,300 for 2017. |
Audit-Related Fees
| | (b) | The aggregate fees billed in each of the last two fiscal years for assurance and related services by the principal accountant that are reasonably related to the performance of the audit of the registrant’s financial statements and are not reported under paragraph (a) of this Item are $0 for 2016 and $0 for 2017. |
Tax Fees
| | (c) | The aggregate fees billed in each of the last two fiscal years for professional services rendered by the principal accountant for tax compliance, tax advice, and tax planning are $3,700 for 2016 and $3,700 for 2017. Tax fees represent tax compliance services provided in connection with the review of the Registrant’s tax returns. |
All Other Fees
| | (d) | The aggregate fees billed in each of the last two fiscal years for products and services provided by the principal accountant, other than the services reported in paragraphs (a) through (c) of this Item are $485 for 2016 and $1,237 for 2017. The fees relate to Passive Foreign Investment Company identification database subscription fees billed on an annual basis. |
| | (e)(1) | Disclose the audit committee’s pre-approval policies and procedures described in paragraph (c)(7) of Rule 2-01 of Regulation S-X. |
Pre-Approval Policies and Procedures. The Audit Committee (“Committee”) of the registrant is responsible for pre-approving (i) all audit and permissible non-audit services to be provided by the independent registered public accounting firm to the registrant and (ii) all permissible non-audit services to be provided by the independent registered public accounting firm to the Adviser, Gabelli Funds, LLC, and any affiliate of Gabelli Funds, LLC (“Gabelli”) that provides services to the registrant (a “Covered Services Provider”) if the independent registered public accounting firm’s engagement related directly to the operations and financial reporting of the registrant. The Committee may delegate its responsibility to pre-approve any such audit and permissible non-audit services to the Chairperson of the Committee, and the Chairperson must report to the Committee, at its next regularly scheduled meeting after the Chairperson’s pre-approval of such services, his or her decision(s). The Committee may also establish detailed pre-approval policies and procedures for pre-approval of such services in accordance with applicable laws, including the delegation of some or all of the Committee’s pre-approval responsibilities to the other persons (other than Gabelli or the registrant’s officers). Pre-approval by the Committee of any permissible non-audit services is not required so long as: (i) the permissible non-audit services were not recognized by the registrant at the time of the engagement to be non-audit services; and (ii) such services are promptly brought to the attention of the Committee and approved by the Committee or Chairperson prior to the completion of the audit.
| | (e)(2) | The percentage of services described in each of paragraphs (b) through (d) of this Item that were approved by the audit committee pursuant to paragraph (c)(7)(i)(C) of Rule 2-01 of Regulation S-X are as follows: |
(b) N/A
(c) 100%
(d) 100%
| | (f) | The percentage of hours expended on the principal accountant’s engagement to audit the registrant’s financial statements for the most recent fiscal year that were attributed to work performed by persons other than the principal accountant’s full-time, permanent employees was 0%. |
| | (g) | The aggregate non-audit fees billed by the registrant’s accountant for services rendered to the registrant, and rendered to the registrant’s investment adviser (not including any sub-adviser whose role is primarily portfolio management and is subcontracted with or overseen by another investment adviser), and any entity controlling, controlled by, or under common control with the adviser that provides ongoing services to the registrant for each of the last two fiscal years of the registrant was $35,321 for 2016 and $36,986 for 2017. |
| | (h) | The registrant’s audit committee of the board of directors has considered whether the provision of non-audit services that were rendered to the registrant’s investment adviser (not including any sub-adviser whose role is primarily portfolio management and is subcontracted with or overseen by another investment adviser), and any entity controlling, controlled by, or under common control with the investment adviser that provides ongoing services to the registrant that were not pre-approved pursuant to paragraph (c)(7)(ii) of Rule 2-01 of Regulation S-X is compatible with maintaining the principal accountant’s independence. |
Item 5. Audit Committee of Listed Registrants.
Not applicable.
Item 6. Investments.
| (a) | Schedule of Investments in securities of unaffiliated issuers as of the close of the reporting period is included as part of the report to shareholders filed under Item 1 of this form. |
(b) Not applicable.
| Item 7. | Disclosure of Proxy Voting Policies and Procedures for Closed-End Management Investment Companies. |
Not applicable.
Item 8. Portfolio Managers of Closed-End Management Investment Companies.
Not applicable.
| Item 9. | Purchases of Equity Securities by Closed-End Management Investment Company and Affiliated Purchasers. |
Not applicable.
Item 10. Submission of Matters to a Vote of Security Holders.
There have been no material changes to the procedures by which the shareholders may recommend nominees to the registrant’s Board of Trustees, where those changes were implemented after the
registrant last provided disclosure in response to the requirements of Item 407(c)(2)(iv) of Regulation S-K (17 CFR 229.407) (as required by Item 22(b)(15) of Schedule 14A (17 CFR 240.14a-101)), or this Item.
Item 11. Controls and Procedures.
| | (a) | The registrant’s principal executive and principal financial officers, or persons performing similar functions, have concluded that the registrant’s disclosure controls and procedures (as defined in Rule 30a-3(c) under the Investment Company Act of 1940, as amended (the “1940 Act”) (17 CFR 270.30a-3(c))) are effective, as of a date within 90 days of the filing date of the report that includes the disclosure required by this paragraph, based on their evaluation of these controls and procedures required by Rule 30a-3(b) under the 1940 Act (17 CFR 270.30a-3(b)) and Rules 13a-15(b) or 15d-15(b) under the Securities Exchange Act of 1934, as amended (17 CFR 240.13a-15(b) or 240.15d-15(b)). |
| | (b) | There were no changes in the registrant’s internal control over financial reporting (as defined in Rule 30a-3(d) under the 1940 Act (17 CFR 270.30a-3(d))) that occurred during the registrant’s last fiscal quarter that has materially affected, or is reasonably likely to materially affect, the registrant’s internal control over financial reporting. |
Item 12. Disclosure of Securities Lending Activities for Closed-End Management Investment Companies.
Not applicable.
Item 13. Exhibits.
| | (a)(1) | Code of ethics, or any amendment thereto, that is the subject of disclosure required by Item 2 is attached hereto. |
| | (a)(2) | Certifications pursuant to Rule 30a-2(a) under the 1940 Act and Section 302 of the Sarbanes-Oxley Act of 2002 are attached hereto. |
| | (b) | Certifications pursuant to Rule 30a-2(b) under the 1940 Act and Section 906 of the Sarbanes- Oxley Act of 2002 are attached hereto. |
SIGNATURES
Pursuant to the requirements of the Securities Exchange Act of 1934 and the Investment Company Act of 1940, the registrant has duly caused this report to be signed on its behalf by the undersigned, thereunto duly authorized.
|
| (Registrant) The Gabelli Utilities Fund |
|
| By (Signature and Title)* /s/ Bruce N. Alpert |
| Bruce N. Alpert, Principal Executive Officer |
|
| Date 3/09/2018 |
Pursuant to the requirements of the Securities Exchange Act of 1934 and the Investment Company Act of 1940, this report has been signed below by the following persons on behalf of the registrant and in the capacities and on the dates indicated.
|
| By (Signature and Title)* /s/ Bruce N. Alpert |
| Bruce N. Alpert, Principal Executive Officer |
|
| Date 3/09/2018 |
|
| By (Signature and Title)* /s/ John C. Ball |
| John C. Ball, Principal Financial Officer and Treasurer |
|
| Date 3/09/2018 |
| * | Print the name and title of each signing officer under his or her signature. |