FORM 6-K
SECURITIES AND EXCHANGE COMMISSION
Washington, D.C. 20549
Report of Foreign Private Issuer
Pursuant to Rule 13a - 16 or 15d - 16 of
the Securities Exchange Act of 1934
For the month of August 2020
Commission File Number: 001-14930
HSBC Holdings plc
42nd Floor, 8 Canada Square, London E14 5HQ, England
(Indicate by check mark whether the registrant files or will file annual reports under cover of Form 20-F or Form 40-F).
Form 20-F X Form 40-F ......
Indicate by check mark if the registrant is submitting the Form 6-K in paper as permitted by Regulation S-T Rule 101(b)(1): ______
Indicate by check mark if the registrant is submitting the Form 6-K in paper as permitted by Regulation S-T Rule 101(b)(7): ______
(Indicate by check mark whether the registrant by furnishing the information contained in this Form is also thereby furnishing the information to the Commission pursuant to Rule 12g3-2(b) under the Securities Exchange Act of 1934).
Yes....... No X
This Report on Form 6-K with respect to our interim results for the first half of 2020 is hereby incorporated by reference in the following HSBC Holdings plc registration statements: Registration Statements on Form F-3 (Nos. 333-92024, 333-135007, 333-158065, 333-180288, 333-202420, 333-223191) and Registration Statement on Form F-4 (No. 333-126531) and Registration Statements on Form S-8 (Nos. 333-103887, 333-104203, 333-109288, 333-113427, 333-127327, 333-143639, 333-145859, 333-155338, 333-162565, 333-170525, 333-176732, 333-183806, 333-197839, 333-220458).
Neither our website referred to herein, nor any of the information contained on our website, is incorporated by reference in the Form 6-K.
Contents
Overview
1a Cautionary statement regarding forward-looking statements
1b Certain defined terms
1 At a glance
2 Highlights
4 Group Chief Executive’s review
8 How we do business
10 Financial overview
14 Global businesses
21 Risk overview
Interim management report
25 Financial summary
32 Global businesses
40 Geographical regions
50 Reconciliations of return on equity and return on tangible equity
52 Risk
52 – Key developments in the first half of 2020
52 – Areas of special interest
56 – Credit risk
81 – Capital and liquidity risk
88 – Market risk
91 – Insurance manufacturing operations risk
Interim condensed financial statements
94 Interim condensed financial statements
100 Notes on the interim condensed financial statements
Additional information
123 Shareholder information
129 Abbreviations
A reminder
The currency we report in is US dollars.
Adjusted measures
We supplement our IFRS figures with alternative performance measures used by management internally. These measures are highlighted with the following symbol: <>
Further explanation may be found on page 12.
In this document we use the following abbreviations to refer to reporting periods:
1H20 First half of 2020 2Q20 Second quarter of 2020
2H19 Second half of 2019 1Q20 First quarter of 2020
1H19 First half of 2019 2Q19 Second quarter of 2019
1Q19 First quarter of 2019
For a full list of abbreviations see page 129.
None of the websites referred to in this Interim Report on Form 6-K for the half-year ended June 30, 2020 (the ‘Form 6-K’), including where a link is provided, nor any of the information contained on such websites is incorporated by reference in the Form 6-K.
Cover image: Connecting our customers through blockchain
For centuries, international trade has been reliant on paper documents – from letters of credit to bills of lading. Today, HSBC is leading the way towards paperless trade finance. We are working with our clients, financial institutions and fintech partners to pioneer digitisation of trade, which has made doing business simpler and faster, improving the working capital efficiency for our customers. Paperless trade is becoming a reality. We have used a blockchain-based letter of credit platform, built on R3 Corda blockchain technology, to complete digital trade transactions for shipments of iron ore from Australia to mainland China, and soybeans from Argentina to Malaysia. By investing in digital solutions such as blockchain technology, we can help to increase the velocity of trade globally.
Our global businesses
We serve customers through three global businesses. On pages 14 to 20 we provide an overview of our performance in the first half of 2020 for each of the global businesses, as well as our Corporate Centre.
In the second quarter, we simplified our organisational structure by combining Global Private Banking and Retail Banking and Wealth Management to form Wealth and Personal Banking. This followed realignments within our internal reporting and includes the reallocation of Balance Sheet Management, hyperinflation accounting in Argentina and HSBC Holdings net interest expense from Corporate Centre to the global businesses.
Wealth and Personal Banking (’WPB’)
We help millions of our customers look after their day-to-day finances and manage, protect and grow their wealth.
Commercial Banking (‘CMB’)
Our global reach and expertise help domestic and international businesses around the world unlock their potential.
Global Banking and Markets (’GBM’)
We provide a comprehensive range of financial services and products to corporates, governments and institutions.
| Cautionary statement regarding forward-looking statements |
This Form 6-K contains certain forward-looking statements with respect to HSBC’s: financial condition; results of operations and business, including the strategic priorities; 2020 financial, investment and capital targets; and ESG targets/commitments described herein.
Statements that are not historical facts, including statements about HSBC’s beliefs and expectations, are forward-looking statements. Words such as ‘expects’, ‘targets’, ‘anticipates’, ‘intends’, ‘plans’, ‘believes’, ‘seeks’, ‘estimates’, ‘potential’ and ‘reasonably possible’, variations of these words and similar expressions are intended to identify forward-looking statements. These statements are based on current plans, information, data, estimates and projections, and therefore undue reliance should not be placed on them. Forward-looking statements speak only as of the date they are made. HSBC makes no commitment to revise or update any forward-looking statements to reflect events or circumstances occurring or existing after the date of any forward-looking statements.
Written and/or oral forward-looking statements may also be made in the periodic reports to the US Securities and Exchange Commission, summary financial statements to shareholders, proxy statements, offering circulars and prospectuses, press releases and other written materials, and in oral statements made by HSBC’s Directors, officers or employees to third parties, including financial analysts.
Forward-looking statements involve inherent risks and uncertainties. Readers are cautioned that a number of factors could cause actual results to differ, in some instances materially, from those anticipated or implied in any forward-looking statement. These include, but are not limited to:
| • | changes in general economic conditions in the markets in which we operate, such as continuing or deepening recessions and fluctuations in employment and creditworthy customers beyond those factored into consensus forecasts (including, without limitation, as a result of the Covid-19 outbreak); the Covid-19 outbreak, which will have adverse impacts on our income due to lower lending and transaction volumes, lower wealth and insurance manufacturing revenue, and lower or negative interest rates in markets where we operate, as well as, more generally, the potential for material adverse impacts on our financial condition, results of operations, prospects, liquidity, capital position and |
credit ratings; deviations from the market and economic assumptions that form the basis for our ECL measurements (including, without limitation, as a result of the Covid-19 outbreak); potential changes in future dividend policy; changes in foreign exchange rates and interest rates, including the accounting impact resulting from financial reporting in respect of hyperinflationary economies; volatility in equity markets; lack of liquidity in wholesale funding or capital markets, which may affect our ability to meet our obligations under financing facilities or to fund new loans, investments and businesses; geopolitical tensions or diplomatic developments producing social instability or legal uncertainty, such as the unrest in Hong Kong, the existing US-China tensions and the emerging challenges in UK-China relations, which in turn may affect demand for our products and services and could result in (among other things) regulatory, reputational and market risks for HSBC; climate change, which may cause both idiosyncratic and systemic risks resulting in potential financial impacts; illiquidity and downward price pressure in national real estate markets; adverse changes in central banks’ policies with respect to the provision of liquidity support to financial markets; heightened market concerns over sovereign creditworthiness in over-indebted countries; adverse changes in the funding status of public or private defined benefit pensions; consumer perception as to the continuing availability of credit; exposure to counterparty risk, including third parties using us as a conduit for illegal activities without our knowledge; the expected discontinuation of certain key Ibors and the development of alternative risk-free benchmark rates, which may require us to enhance our capital position and/or position additional capital in specific subsidiaries; and price competition in the market segments we serve;
| • | changes in government policy and regulation, including the monetary, interest rate and other policies of central banks and other regulatory authorities in the principal markets in which we operate and the consequences thereof (including, without limitation, actions taken as a result of the Covid-19 outbreak); initiatives to change the size, scope of activities and interconnectedness of financial institutions in connection with the implementation of stricter regulation of financial institutions in key markets worldwide; revised capital and liquidity benchmarks, which could serve to deleverage bank balance sheets and lower returns available from the current business model and portfolio mix; imposition of levies or taxes designed to change business mix and risk appetite; the practices, pricing or responsibilities of financial institutions serving their consumer markets; expropriation, nationalisation, confiscation of assets and changes in legislation relating to foreign ownership; the UK’s exit from the EU, which may result in a prolonged period of uncertainty, unstable economic conditions and market volatility, including currency fluctuations; passage of the Hong Kong national security law and restrictions on telecommunications, as well as the US Hong Kong Autonomy Act, which have caused tensions between China, the US and the UK; general changes in government policy that may significantly influence investor decisions; the costs, effects and outcomes of regulatory reviews, actions or litigation, including any additional compliance requirements; and the effects of competition in the markets where we operate including increased competition from non-bank financial services companies; and |
| • | factors specific to HSBC, including our success in adequately identifying the risks we face, such as the incidence of loan losses or delinquency, and managing those risks (through account management, hedging and other techniques); our ability to achieve our targets, which may result in our failure to achieve any of the expected benefits of our strategic initiatives; model limitations or failure, including, without limitation, the impact that the consequences of the Covid-19 outbreak have had on the performance and usage of financial models, which may require us to hold additional capital, incur losses and/or use compensating controls, such as overlays and overrides, to address model limitations; changes to the judgements, estimates and assumptions we base our financial statements on; changes in our ability to meet the requirements of regulatory stress tests; a reduction in the credit rating assigned to us or any of our subsidiaries, which could increase the cost or decrease the availability of our funding and affect our liquidity position and net interest margin; changes to the reliability and security of our data management, data privacy, information and technology infrastructure, including threats from cyber-attacks, which may impact our ability to service clients and may result in financial loss, business disruption and/ or loss of customer services and data; changes in insurance customer behaviour and insurance claim rates; our dependence on loan payments and dividends from subsidiaries to meet our obligations; changes in accounting standards, which may have a material impact on the way we prepare our financial statements; changes in our ability to manage third-party, fraud and reputational risks inherent in our operations; employee misconduct, which may result in regulatory sanctions and/or reputational or financial harm; and changes in skill requirements, ways of working and talent shortages, which may affect our ability to recruit and retain senior management and diverse and skilled personnel. Effective risk management depends on, among other things, our ability through stress testing and other techniques to prepare for events that cannot be captured by the statistical models it uses; and our success in addressing operational, legal and regulatory, and litigation challenges; and other risks and uncertainties we identify in ‘Top and emerging risks’ on pages 76 to 81 of the Annual Report and Accounts 2019. |
| 1a | HSBC Holdings plc |
| Certain defined terms |
Unless the context requires otherwise, ‘HSBC Holdings’ means HSBC Holdings plc and ‘HSBC’, the ‘Group’, ‘we’, ‘us’ and ‘our’ refer to HSBC Holdings together with its subsidiaries. Within this document the Hong Kong Special Administrative Region of the People’s Republic of China is referred to as ‘Hong Kong’. When used in the terms ‘shareholders’ equity’ and ‘total shareholders’ equity’, ‘shareholders’ means holders of HSBC Holdings ordinary shares and those preference shares and capital securities issued by HSBC Holdings classified as equity. The abbreviations ‘$m’, ‘$bn’ and ‘$tn’ represent millions, billions (thousands of millions) and trillions of US dollars, respectively.
| HSBC Holdings plc | 1b |
At a glance
Covid-19: The nature, scale and pervasiveness of the coronavirus pandemic dramatically impacted the global macroeconomic environment. The economic disruption caused by Covid-19, together with the worsened economic outlook, resulted in a material increase in expected credit losses and other credit impairment charges (‘ECL’), as well as a reduction in revenue due to lower transaction volumes and reduced client activity.
Read more on page 22.
Geopolitical risk: Levels of geopolitical risk increased in particular markets and are expected to have economic impacts for the Group. US-China relations continue to be under pressure, heightened by the passing of the Hong Kong national security law and the US Hong Kong Autonomy Act. The future relationship between the UK and the EU remains uncertain, while there are also emerging challenges in UK-China relations.
Read more on pages 22 and 23.
Market factors: Interest rates fell in the majority of our key markets and are expected to remain at lower levels for the foreseeable future, which will adversely impact our net interest income. In addition, heightened levels of uncertainty have led to a significant increase in market volatility globally. While this benefited some Global Markets businesses, it also led to large adverse mark-to-market movements in the first quarter of 2020, which reversed to some extent in the second quarter, notably in life insurance manufacturing.
Read more on pages 88 to 93.
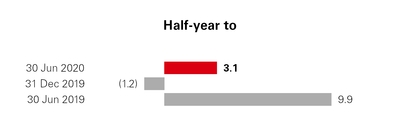
Financial performance in 1H20:
Reported profit after tax
$3.1bn
(1H19: $9.9bn)
Return on average tangible equity (annualised) <>
3.8%
(1H19: 11.2%)
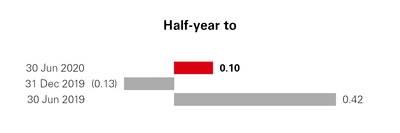
Basic earnings per share
$0.10
(1H19: $0.42)
Read more on page 10.
Supporting customers: We have remained operationally resilient throughout the Covid-19 outbreak and continued to keep our customers at the forefront of our operations. During 1H20, we introduced several measures and initiatives to support our customers and are also working with governments supporting national schemes, granting more than $27bn in payment holidays on loans, credit cards and mortgages for our personal lending customers around the world. For our wholesale lending customers, we have provided more than $52bn in lending to more than 172,000 customers.
Read more on page 9.
Business highlights: We helped our clients raise over $1.15tn in capital markets financing in 1H20, and we remained number one globally in sustainable finance bonds, according to Dealogic’s 1H20 rankings. In Hong Kong, we launched a fully remote, digital account opening solution for business customers, while in the UK, we launched HSBC Kinetic, our new app-only digital banking offering for small and medium-sized business customers. In WPB, we launched Pinnacle in mainland China, our new digital platform for wealth planning and insurance services.
Read more on pages 14 to 20.
Business update: We have restarted most areas of the transformation programme we announced in February 2020, having temporarily paused elements, and we have already made progress in other areas. In the US, we completed the consolidation of our branch network, impacting 80 branches, and we closed a further 31 branches in other locations as we seek to optimise our global footprint. In GBM, we have formed a risk-weighted assets (‘RWAs’) optimisation unit and delivered a gross reduction in RWAs of $21bn in 1H20.
Read more on page 4.
HSBC Holdings plc Interim Report 2020 | 1 |
Highlights
Performance in the first half of 2020 was heavily impacted by the Covid-19 outbreak, geopolitical risk and market factors. The outlook is highly uncertain and dependent on the path and speed of economic recovery.
Financial performance (vs 1H19)
| • | Reported profit after tax down 69% to $3.1bn and reported profit before tax down 65% to $4.3bn from higher ECL and lower revenue. Reported profit in 1H20 also included a $1.2bn impairment of software intangibles, mainly in Europe. |
| • | In Asia, we reported profit before tax of $7.4bn in 1H20, despite higher ECL, demonstrating the strength and continued resilience of our operations in the region and underlining the importance of Asia to the Group. Higher ECL charges materially impacted profitability in our markets across the rest of the world, notably in our operations throughout Europe. |
| • | Reported revenue down 9% to $26.7bn, reflecting the impact of interest rate reductions, as well as adverse market impacts in life insurance manufacturing and adverse valuation adjustments in GBM, notably in 1Q20. These factors more than offset higher revenue in Global Markets. |
| • | Net interest margin (‘NIM’) of 1.43% in 1H20, down 18 basis points (‘bps’) from 1H19. NIM in 2Q20 was 1.33%, down 21bps from 1Q20, primarily reflecting the initial impact of the reduction in interest rates due to the Covid-19 outbreak. |
| • | Reported ECL increased by $5.7bn to $6.9bn due to the impact of the Covid-19 outbreak and the forward economic outlook, and due to an increase in charges related to specific wholesale customers. ECL (annualised) as a percentage of average gross loans and advances to customers was 1.33% in 1H20, while allowance for ECL against loans and advances to customers increased from $8.7bn at 31 December 2019 to $13.2bn at 30 June 2020. |
| • | Reported operating expenses down 4%, despite a $1.2bn impairment of software intangibles. Adjusted operating expenses fell 5%, despite continued investment, due to lower performance-related pay and reduced discretionary costs. |
| • | In 1H20, lending decreased by $18bn on a reported basis. On a constant currency basis, lending increased by $12bn, reflecting corporate customers drawing on existing and new credit lines and re-depositing these to increase cash balances in 1Q20, which was partly offset by paydowns in 2Q20. Deposits grew by $93bn on a reported basis and $133bn on a constant currency basis, with growth in all global businesses, including through the depositing of loans from government-backed schemes. |
| • | Common equity tier 1 capital (‘CET1’) ratio of 15.0%, up 30bps from 4Q19, as higher CET1 capital, which included an increase from the cancellation of the 4Q19 dividend and the current suspension of dividends on ordinary shares, more than offset the impact of RWA growth. |
Financial performance (vs 2Q19)
| • | Reported profit after tax down 88% to $0.6bn and reported profit before tax down 82% to $1.1bn due to higher ECL and lower revenue, which included the non-recurrence of a 2Q19 dilution gain of $0.8bn. This was partly offset by a reduction in operating expenses, despite a $1.2bn impairment of software intangibles. |
Financial performance (vs 1Q20)
| • | Reported profit after tax down 75% to $0.6bn and reported profit before tax down 66% to $1.1bn, reflecting higher ECL, primarily in CMB, which reported a loss before tax in 2Q20. Lower revenue reflected the impact of interest rate reductions, with net interest margin falling by 21bps to 1.33%. This was partly offset by the partial reversal of the adverse market impacts in life insurance manufacturing and valuation adjustments in GBM recorded in 1Q20. Results in 2Q20 were also adversely impacted by a $1.2bn impairment of software intangibles. |
Outlook for 2020
| • | We continue to face a wide range of potential economic outcomes for the second half of 2020 and into 2021, partly dependent on the extent of any potential impacts from new waves of Covid-19, the path to the development of a possible vaccine and market and consumer confidence levels. Heightened geopolitical risk could also impact a number of our markets, including Hong Kong and the UK. |
| • | Applying a range of weightings to our ECL sensitivity analysis, as disclosed on pages 60 to 66, could result in an ECL charge in the range of $8bn to $13bn for 2020. This range, which continues to be subject to a high degree of uncertainty due to Covid-19 and geopolitical tensions, is higher than at 1Q20 given the deterioration in consensus economic forecasts and actual loss experience during 2Q20. |
| • | Lower global interest rates and reduced customer activity have put increasing pressure on revenue, and are expected to continue to do so. |
| • | We intend to accelerate our transformation programme and execute additional cost actions to help mitigate pressures on revenue and create capacity for further investments in technology. |
| • | We expect mid-to-high single-digit percentage growth in RWAs in 2020, primarily from credit rating migration movements, which is expected to have an adverse impact on our CET1 ratio. We will continue to aim to reduce RWAs in low-returning areas, and improve efficiency to allow resources to be further and faster allocated to areas of competitive advantage, higher returns and growth. |
| • | Given the current high degree of uncertainty, we are continuing to monitor closely the implications on our business plan and medium-term financial targets, while also undertaking a review of our future dividend policy. We intend to provide an update on our medium-term financial targets and dividend policy at our year-end results for 2020. |
| 2 | HSBC Holdings plc |
Key financial metrics
| Half-year to | ||||||
| Reported results | 30 Jun 2020 | 30 Jun 2019 | 31 Dec 2019 | |||
| Reported revenue ($m) | 26,745 | 29,372 | 26,726 | |||
| Reported profit before tax ($m) | 4,318 | 12,407 | 940 | |||
| Reported profit after tax ($m) | 3,125 | 9,937 | (1,229 | ) | ||
| Profit attributable to the ordinary shareholders of the parent company ($m) | 1,977 | 8,507 | (2,538 | ) | ||
| Cost efficiency ratio (%) | 61.8 | 58.4 | 94.3 | |||
| Basic earnings per share ($) | 0.10 | 0.42 | (0.13 | ) | ||
| Diluted earnings per share ($) | 0.10 | 0.42 | (0.13 | ) | ||
| Return on average ordinary shareholders’ equity (annualised) (%) | 2.4 | 10.4 | (3.0 | ) | ||
Net interest margin (%)1 | 1.43 | 1.61 | 1.58 | |||
Alternative performance measures <> | ||||||
| Adjusted revenue ($m) | 26,477 | 27,815 | 26,632 | |||
| Adjusted profit before tax ($m) | 5,635 | 12,273 | 9,660 | |||
| Adjusted cost efficiency ratio (%) | 56.4 | 56.6 | 61.8 | |||
| Annualised expected credit losses and other credit impairment charges (‘ECL’) as a % of average gross loans and advances to customers (%) | 1.33 | 0.22 | 0.30 | |||
Return on average tangible equity (annualised) (%)1,2 | 3.8 | 11.2 | 8.4 | |||
| At | ||||||
| Balance sheet | 30 Jun 2020 | 30 Jun 2019 | 31 Dec 2019 | |||
| Total assets ($m) | 2,922,798 | 2,751,273 | 2,715,152 | |||
| Net loans and advances to customers ($m) | 1,018,681 | 1,021,632 | 1,036,743 | |||
| Customer accounts ($m) | 1,532,380 | 1,380,124 | 1,439,115 | |||
Average interest-earning assets ($m)1 | 2,034,939 | 1,912,708 | 1,922,822 | |||
| Loans and advances to customers as % of customer accounts (%) | 66.5 | 74.0 | 72.0 | |||
| Total shareholders’ equity ($m) | 187,036 | 192,676 | 183,955 | |||
| Tangible ordinary shareholders’ equity ($m) | 147,879 | 145,441 | 144,144 | |||
Net asset value per ordinary share at period end ($)3,4 | 8.17 | 8.35 | 8.00 | |||
Tangible net asset value per ordinary share at period end ($)4 | 7.34 | 7.19 | 7.13 | |||
| Capital, leverage and liquidity | ||||||
Common equity tier 1 capital ratio (%)5 | 15.0 | 14.3 | 14.7 | |||
Risk-weighted assets ($m)5 | 854,552 | 885,971 | 843,395 | |||
Total capital ratio (%)5 | 20.7 | 20.1 | 20.4 | |||
Leverage ratio (%)5 | 5.3 | 5.4 | 5.3 | |||
| High-quality liquid assets (liquidity value) ($bn) | 654 | 533 | 601 | |||
| Liquidity coverage ratio (%) | 148 | 136 | 150 | |||
| Share count | ||||||
| Period end basic number of $0.50 ordinary shares outstanding (millions) | 20,162 | 20,221 | 20,206 | |||
| Period end basic number of $0.50 ordinary shares outstanding and dilutive potential ordinary shares (millions) | 20,198 | 20,286 | 20,280 | |||
| Average basic number of $0.50 ordinary shares outstanding (millions) | 20,162 | 20,124 | 20,191 | |||
Dividend per ordinary share (in respect of the period) ($)1 | — | 0.20 | 0.30 | |||
| 1 | For these metrics, half-year to 31 December 2019 is calculated on a full-year basis and not a 2H19 basis. |
| 2 | Annualised profit attributable to ordinary shareholders, excluding impairment of goodwill and other intangible assets and changes in present value of in-force insurance contracts (‘PVIF’) (net of tax), divided by average ordinary shareholders’ equity excluding goodwill, PVIF and other intangible assets (net of deferred tax). |
| 3 | The definition of net asset value per ordinary share is total shareholders’ equity less non-cumulative preference shares and capital securities, divided by the number of ordinary shares in issue excluding shares the company has purchased and are held in treasury. |
| 4 | Excludes impact of $0.10 per share dividend in 1Q19, following a June 2019 change in accounting practice on the recognition of interim dividends, from the date of declaration to the date of payment. |
| 5 | Unless otherwise stated, regulatory capital ratios and requirements are calculated in accordance with the transitional arrangements of the Capital Requirements Regulation in force in the EU at the time, including the regulatory transitional arrangements for IFRS 9 ‘Financial Instruments’ in article 473a. The capital ratios and requirements at 31 December 2019 and 30 June 2020 are reported in accordance with the revised Capital Requirements Regulation and Directive (‘CRR II’), as |
implemented, whereas the Capital Requirements Regulation and Directive (‘CRD IV’) applied at 30 June 2019. Leverage ratios are calculated using the end point definition of capital.
HSBC Holdings plc Interim Report 2020 | 3 |
Group Chief Executive’s review
We are helping our customers navigate their own path through uncertainty and acting with pace and decisiveness to adapt HSBC to an environment in which no business can afford to stand still.
The first six months of 2020 have been some of the most challenging in living memory. Due to the Covid-19 pandemic, much of the global economy slowed significantly and some sectors drew to a near total halt.
This meant two things for HSBC. First, that the financial performance of the bank inevitably suffered in line with the rest of the global economy. But second, that the real measure of our performance became our success in supporting our customers, colleagues and communities during the pandemic, and in laying the groundwork for the recovery to come.
Covid-19
In difficult times, HSBC’s job has always been to support our communities, provide stability and help build economic growth. I have been immensely proud of the way our people have delivered this purpose as the Covid-19 outbreak has unfolded.
Our approach has hinged on three themes – securing a continuous service for all who rely on us; providing a financial bridge for our personal and business customers beyond the crisis; and ensuring that HSBC retains the strength to help our customers thrive once restrictions begin to ease.
We maintained a high level of business continuity with 85% of colleagues equipped to work from home, all of our customer contact centres fully operational, and between 70% and 90% of our branches open for business in the first half. We enhanced our digital capabilities to serve more customers remotely, with faster access and improved security. We also engaged with our regulators to better enable customers to access a broad range of banking products and services from their homes, including through remote consultations and sales.
This underpinned our ability to get our customers the support they need. For our personal lending customers, we granted more than 700,000 payment holidays on loans, credit cards and mortgages, providing more than $27bn in customer relief in the first half of the year. For our wholesale lending customers, we provided more than $52bn of facilities to more than 172,000 customers globally over the same period, both through government schemes and our own relief initiatives.
As a global bank, HSBC played a vital role in keeping capital flowing for our clients, arranging more than $1.1tn of loan, debt and equity financing for our wholesale customers in the first six months of 2020. Global Banking and Markets made a direct contribution to the Covid-19 relief effort, helping to arrange more than $48bn of financing for our clients through social and Covid-19 relief bonds.
We also took an early decision not to apply for government support packages for employees across the countries in which we operate.
Throughout all of this, the well-being of our people has been our paramount concern. We have taken steps to enable our front-line colleagues to do their jobs safely and effectively. For all our colleagues, we have maintained a regular flow of communication and listened closely to their needs, providing the support and flexibility to help them manage their lives during the pandemic.
| 4 | HSBC Holdings plc |
“The real measure of our performance became our success in supporting our customers, colleagues and communities.“
This has been one of the most demanding periods that I can remember for all of our people across HSBC. Many have had to juggle personal and professional priorities, while adapting to new and unfamiliar ways of working. I have been humbled by the dedication and commitment that they have shown in incredibly tough circumstances, and thank them deeply for all they have done – and are doing – for our customers, communities and each other.
Transformation
On 18 February, we announced a substantial transformation programme to ensure that HSBC is fit for the future. We published plans to reshape underperforming businesses, simplify our complex organisation and reduce our costs.
We are moving forward with these plans wherever we can. We have already begun combining our wholesale back office operations, and brought our retail, wealth and private banking businesses together into a single global business – Wealth and Personal Banking. Our US business has reduced its branch footprint, and Global Banking and Markets has made good early progress in reducing its risk-weighted assets. The
lessons of the past six months are also being applied more broadly, particularly from parts of the business that have responded to a fast-moving situation with exceptional pace and agility.
The operational risks posed by the Covid-19 outbreak meant that we had to move more slowly in some areas than others. In March, I paused the redundancy programme intended to deliver the reduction in headcount we promised in February. It would have been wrong to proceed with job losses at a time of significant stress for our people and communities, and at a point when we needed to protect our capacity to serve our customers. Now, many countries have slowed the spread of the virus and are emerging from lockdown, and we have adapted to new ways of working. I therefore decided in June to lift the pause on redundancies, proceeding thoughtfully but purposefully, while taking local considerations into account.
Now that many governments have become better accustomed to managing the ebb and flow of the pandemic, we intend to accelerate implementation of the plans we announced in February. At the same time, our operating environment has changed significantly since the start of the year. We will also therefore look at what additional actions we need to take in light of the new economic environment to make HSBC a stronger and more sustainable business.
Financial performance
A good start to the year in January and February was overshadowed from March onwards by the Covid-19 outbreak and the impact of falling interest rates.
The sharp increase in expected credit losses that followed impacted all markets, but particularly those outside Asia. ECL grew further from the first to the second quarter as the economic outlook deteriorated, with increases in both stage 1 and 2 allowances. Stage 3 ECL were up overall but broadly stable during the first half, although the first quarter included a charge in Singapore unrelated to the Covid-19 crisis.
First half reported revenue was 9% lower than last year’s first half, due mainly to the effects of interest rate cuts made at the start of the year across our deposit franchises. By contrast, our Asia businesses showed good resilience and Global Markets grew revenue on the back of higher client activity.
HSBC Holdings plc Interim Report 2020 | 5 |
Response to Covid-19
Operational response
Our operations have stayed highly resilient:
Approximately
90%
of our branch network remained open for business globally, as at 30 June 2020.
Approximately
85%
of our employees are now equipped to work from home.
“We have taken steps to enable our front-line colleagues to do their jobs safely and effectively.”
We took further action on costs in response to the weaker revenue environment, reducing both performance-related pay and discretionary spending. Together with our ongoing cost-saving initiatives, this helped reduce reported operating expenses by 4%.
While these cost measures mitigated some of the adverse effects of the radically changed economic environment, reported first half profit before tax was 65% lower than the same period last year, and adjusted profit before tax fell by 54%.
Lending decreased by $18bn in the first half. Customers initially drew on new and existing credit lines in the first quarter in response to the Covid-19 outbreak, but began to pay these down in the second quarter as circumstances changed. Deposits rose by $93bn in the first half, as customers increased their cash reserves and reduced their spending during lockdown.
We continued to invest in the future of the business while managing costs down, spending $2.8bn on technology in the first six months of the year.
Our balance sheet remains robust with a CET1 ratio of 15.0% and strong liquidity and funding.
Facing the future
Our performance in the second half of the year will continue to be influenced by the path and economic impact of the Covid-19 outbreak. Geopolitical uncertainty could also weigh heavily on our clients, particularly those impacted by heightened US-China and UK-China tensions, and the future of UK-EU trade relations.
Amid the current uncertainty, we remain focused on the things we can control – helping our customers navigate their own path to a complex future, and acting with pace and decisiveness to adapt HSBC to an environment in which no business can afford to stand still.
HSBC has always helped our clients manage complexity. There have been many times in the last 155 years when geopolitics has altered the nature of trade, or disruptive forces have changed entire industries. On each occasion, HSBC has adapted and innovated to help our customers when they need us most, and we will do so again.
We start from a strong position. As the world’s leading trade bank1, we have the knowledge and network to help customers reorder their supply chains securely and sustainably. As the world’s number one bank for green, social and sustainable bonds2, we have the experience and expertise to help customers finance their transition to a cleaner, more resilient future. These are important strengths, but we have to keep investing to maintain them and to provide the agile, responsive and entrepreneurial service that our clients require.
Like our clients, HSBC has to operate in a difficult geopolitical environment. Current tensions between China and the US inevitably create challenging situations for an organisation with HSBC’s footprint. However, the need for a bank capable of bridging the economies of east and west is acute, and we are well placed to fulfil this role. We will face any political challenges that arise with a focus on the long-term needs of our customers and the best interests of our investors.
| 6 | HSBC Holdings plc |
Response to Covid-19
Customer response
We are participating in several Covid-19 relief programmes to deploy a range of support measures for our customers at pace.
We arranged more than
$48bn
of financing through social and Covid-19 relief bonds in 1H20.
We granted more than
700,000
payment holidays for personal lending customers in 1H20.
We provided more than
$52bn
of lending facilities for our wholesale customers in 1H20.
“HSBC has always helped our clients manage complexity.“
As we seek to accelerate our transformation in the second half of the year, I am mindful of the impact it will have for some of our people, particularly those leaving us. As necessary as these changes are, the human impact is a matter of deep personal regret to me. We will make sure that all those leaving HSBC as part of our transformation will be treated with fairness and consideration, and will receive support in finding new employment.
Finally, HSBC is a global bank serving customers from many different backgrounds. We therefore need to resemble the communities we serve. In May, we launched a new global ethnicity inclusion programme to better enable careers and career progression for colleagues from ethnic minorities, and in July, we made a series of commitments to address feedback from Black colleagues in particular. However, I want us to be
judged by our actions, not our words. We will therefore provide more information about the ethnicity of our workforce in our annual reporting in February, so that our stakeholders can hold us accountable.
Noel Quinn
Group Chief Executive
3 August 2020
1 Euromoney, Trade Finance Survey, January 2020
2 Dealogic, Sustainable Finance Bond league table, 1H20
HSBC Holdings plc Interim Report 2020 | 7 |
How we do business
We conduct our business intent on supporting the sustained success of our customers, people and other stakeholders.
Our approach
Our purpose is to connect customers to opportunities. To achieve our purpose, we need to build strong relationships with all of our stakeholders, including customers, employees and the communities in which we operate. This will help us deliver our strategy and operate our business in a way that is sustainable.
Our Covid-19 actions
Our ability to help our stakeholders is more important than ever during these challenging and unprecedented times. In the first half of 2020, we continued to promote and encourage good conduct through our people's behaviour and decision making to deliver fair outcomes for customers and preserve market integrity. This included our continuing focus on the needs of vulnerable customers in our product and process design.
We developed a number of digital enhancements to support the ongoing delivery of fair outcomes for our customers in different markets. This included the development of video conferencing guidance to ensure we continue to provide services and products to our customers securely when there is limited access to branches.
We have also played a lead role in issuing social and Covid-19 relief bonds to help raise funds for communities affected by Covid-19, and provided innovative supply chain solutions to help our business customers, as set out in the examples on this page.
On the following page, we have set out further ways that we have supported our stakeholders, including our communities, customers, employees, investors, regulators and governments, and suppliers.
Our approach to diversity
Our actions are focused on ensuring our people are valued, respected and supported to fulfil their potential and thrive. Our global ethnicity inclusion programme, which launched in May, is designed to improve the data and reporting of our people’s ethnic backgrounds. It will help us take specific actions to enable the careers and career progression of all our colleagues in a supportive and inclusive way.
We are listening to what our colleagues are telling us in response to the Black Lives Matter movement. We are implementing further plans to develop senior Black talent and help diversify the ethnicity profile of HSBC’s senior leadership through targeted development interventions. We aim to build a pipeline of future Black talent by strengthening our recruitment processes and partnering with a specialist search firm.
Further details on our plans and progress will be included in our Annual Report and Accounts 2020.
Social bonds fund Covid-19 response
We played a lead role in the issuance of the Bank of China Macau branch’s HK$4bn social bond, with proceeds earmarked to help small firms hit by the Covid-19 crisis. The funds will be used to provide loans to micro, small and medium-sized enterprises in Macau to help generate employment in industries that have struggled due to the sharp drop in tourism.
We helped to arrange $66bn-worth of social and Covid-19 relief bonds in the first half of 2020, with proceeds supporting responses to the pandemic and projects that aim to deliver a positive societal impact.
Easing supply chain strains with trade finance solutions
We are working closely with our customers and governments to help ensure that the flow of critical goods and documents continues during Covid-19 lockdown restrictions. We are helping governments secure personal protective equipment and other critical medical goods, for example, by using our automated utility for sanctions and anti-money laundering controls to navigate risk. We are also supporting clients to deliver critical medical items through fast-track credit approvals. We provided more than 50,000 repayment extensions to our trade finance customers in the first half of 2020, and are helping them to manage liquidity in their end-to-end supply chains.
| 8 | HSBC Holdings plc |
Supporting our stakeholders through Covid-19
The Covid-19 outbreak has created a great deal of uncertainty and disruption for the people, businesses and communities we serve around the world. It is affecting everyone in different ways, with markets at different stages of the crisis. We are tailoring our response to the different circumstances and situations in which our stakeholders find themselves.
| Our stakeholders | How we have engaged | |
| Customers | The Covid-19 outbreak has posed significant challenges for our customers worldwide. Our immediate priority is to do what we can to provide them with support and flexibility. This has included offering payment holidays and restructuring mortgage payments, as well as extending relief loans or temporary credit limit increases for borrowers. We are working across many markets to offer relief through market-wide and HSBC-led schemes. In the UK, we granted relief to our personal lending customers on 65,000 mortgage accounts and 153,000 personal loan and credit card accounts during the first half of the year. In Hong Kong, we initiated a simple digital and branch registration process to help customers gain access to government funds, following the launch of a government cash payout scheme. On the first day of the scheme, we received one million registrations. For our wholesale lending customers, we provided approximately $33bn of facilities through market-wide schemes and $19bn via HSBC-led schemes in the first half of the year, and helped them to navigate the current environment. For further details on our customer relief programmes, see page 70. We have taken steps to keep many of our branches open while protecting customers and employees. However, with customers doing more of their banking online, we have also deployed new technology to help enable them to engage with us in new ways, including video calls with personal and business relationship managers, and, in some markets, online capabilities for payment relief programmes. | |
| Employees | We moved quickly to protect our people. More than 230,000, or 85%, of our total workforce are now enabled to work from their homes if needed. We provided new and enhanced well-being support to employees during this challenging time. Our dedicated Covid-19 resources are accessible to everyone and include expert medical guidance, education on mental health awareness, training on how to lead remote teams, and advice on managing stress and working remotely. Our employee assistance programmes, which provide confidential counselling to employees, continue to provide clinical support. We have encouraged a culture of looking out for each other, and our employee networks have held regular support calls for those experiencing mental health challenges, and for those with caring responsibilities. Listening to employees is vital to ensure we provide the right support. More than 118,000 employees responded to our employee survey, helping us understand how Covid-19 is impacting them and their thoughts about the future. Overall, 89% of people said they were getting the information they needed and 86% reported they were getting the support they needed from their line manager. We continue to use this data and insight to shape our work. | |
| Communities | In the first half of the year, we committed more than $20m of donations for programmes and partners that support the medical response, relieve food insecurity and provide access to help for vulnerable people. | |
| Regulators and governments | We have engaged proactively with regulators and governments globally regarding the policy changes issued in response to Covid-19 to help our customers, to contribute to normalisation and recovery, and to manage the operational capacity at both banks and regulators. | |
| Suppliers | We made early payments to thousands of our suppliers during the first half of the year to support them through the pandemic. | |
| Investors | At this year’s Annual General Meeting (‘AGM’), it was unfortunately not possible for shareholders to attend due to the introduction of social distancing measures. Shareholders were instead encouraged to vote by proxy and submit questions in advance. After the AGM, responses to the most frequent questions across key themes were published on our website. HSBC, in line with all other large UK-based banks and at the direct request of the Group’s lead regulator (the UK Prudential Regulation Authority), cancelled the fourth interim dividend of 2019. We have also suspended dividend payments until the end of 2020. We profoundly regret the impact this will have on shareholders, their families and their businesses. The Board will review the position at the 2020 year-end results. | |
HSBC Holdings plc Interim Report 2020 | 9 |
Financial overview
In assessing the Group’s financial performance, management uses a range of financial measures that focus on the delivery of sustainable returns for our shareholders and maintaining our financial strength.
Executive summary
Performance in the first half of 2020 was heavily impacted by the Covid-19 outbreak, geopolitical risk and market factors. Reported profit before tax of $4.3bn fell by 65% compared with 1H19, while adjusted profit before tax of $5.6bn decreased by 54%, mainly from higher ECL and lower revenue. The annualised return on average tangible equity (‘RoTE’) for 1H20 was 3.8%, compared with 11.2% in 1H19.
Revenue declined compared with 1H19, reflecting the impact of interest rate reductions, as well as adverse market impacts in life insurance manufacturing in WPB and adverse valuation adjustments in GBM, notably in 1Q20. Notwithstanding these factors, certain parts of the Group have remained resilient, notably our Asian franchises including Hong Kong, while our Global Markets business delivered growth compared with 1H19. The increase in ECL and lower revenue were in part mitigated by lower operating expenses due to reductions in the performance-related pay accrual and lower discretionary expenditure. The 1H20 period also included a $1.2bn impairment of capitalised software related principally to businesses within HSBC Bank plc, our non-ring-fenced bank in Europe. This reflected underperformance and a deterioration in the future forecasts of these businesses, substantially relating to prior periods.
The outlook remains highly uncertain. We will continue to monitor closely the implications on our business plan, while also undertaking a review of our future dividend policy. We intend to provide an update on our medium-term financial targets and dividend policy at our year-end results for 2020.
Reported results
| Half-year to | Quarter ended | |||||||||||
| Reported results | 30 Jun 2020 $m | 30 Jun 2019 $m | 31 Dec 2019 $m | 30 Jun 2020 $m | 30 Jun 2019 $m | 31 Mar 2020 $m | ||||||
| Net operating income before change in expected credit losses and other credit impairment charges (‘revenue’) | 26,745 | 29,372 | 26,726 | 13,059 | 14,944 | 13,686 | ||||||
| ECL | (6,858 | ) | (1,140 | ) | (1,616 | ) | (3,832 | ) | (555 | ) | (3,026 | ) |
| Net operating income | 19,887 | 28,232 | 25,110 | 9,227 | 14,389 | 10,660 | ||||||
| Total operating expenses | (16,527 | ) | (17,149 | ) | (25,200 | ) | (8,675 | ) | (8,927 | ) | (7,852 | ) |
| Operating profit/(loss) | 3,360 | 11,083 | (90 | ) | 552 | 5,462 | 2,808 | |||||
| Share of profit in associates and joint ventures | 958 | 1,324 | 1,030 | 537 | 732 | 421 | ||||||
| Profit before tax | 4,318 | 12,407 | 940 | 1,089 | 6,194 | 3,229 | ||||||
| Tax expense | (1,193 | ) | (2,470 | ) | (2,169 | ) | (472 | ) | (1,167 | ) | (721 | ) |
| Profit/(loss) after tax | 3,125 | 9,937 | (1,229 | ) | 617 | 5,027 | 2,508 | |||||
Reported performance - 1H20 vs 1H19
Reported profit
Reported profit after tax of $3.1bn in 1H20 was $6.8bn or 69% lower than in 1H19.
Reported profit before tax of $4.3bn was $8.1bn or 65% lower than in 1H19, primarily due to a rise in reported ECL, reflecting the impact of the Covid-19 outbreak on the economic outlook. The reduction also reflected lower reported revenue, reflecting the impact of interest rate reductions, as well as adverse market impacts in life insurance manufacturing in WPB and adverse valuation adjustments in GBM, notably in 1Q20. Lower revenue also reflected the non-recurrence of an $828m dilution gain in 1H19 recognised on the completion of the merger of our associate The Saudi British Bank (‘SABB’) with Alawwal bank in Saudi Arabia. These reductions were in part mitigated by lower reported operating expenses as we reduced the performance-related pay accrual and lowered discretionary expenditure. The 1H20 period also included a $1.2bn impairment of capitalised software related principally to businesses within HSBC Bank plc. This reflected underperformance and a deterioration in the future forecasts of these businesses, substantially relating to prior periods. This impairment has been recognised as a significant item, with $1.0bn included within ‘impairment of goodwill and other intangibles’ and $0.2bn included within ‘restructuring and other related costs’.
Results in 1H20 included certain volatile items, which impacted revenue. These included adverse market impacts in life insurance manufacturing in WPB of $334m (1H19: $152m favourable), while GBM included an adverse movement in credit and funding valuation adjustments of $355m (1H19: $14m favourable) and losses in Principal Investments of $12m (1H19: $122m favourable). Results also included favourable movements on our long-term debt and associated swaps in Corporate Centre of $195m (1H19: $143m favourable). In 1H19, results included disposal gains in WPB and CMB of $157m.
| 10 | HSBC Holdings plc |
Our operations across Asia delivered resilient performances during 1H20, despite interest rate headwinds, adverse market impacts in life insurance manufacturing and a rise in ECL. In 1H20, reported profit before tax in Asia represented more than 170% of Group profits, underlining the importance of the region to the Group. Outside of Asia, the increase in ECL and interest rate reductions adversely affected the profitability of our operations, most notably across Europe, including HSBC UK plc, our ring-fenced bank in Europe, while HSBC Bank plc was also impacted by an impairment of software intangibles.
Reported revenue
Reported revenue of $26.7bn was $2.6bn or 9% lower than in 1H19, reflecting the impact of interest rate reductions across our global businesses, most notably in Retail Banking and Global Liquidity and Cash Management (‘GLCM’). In addition, the reduction reflected adverse market impacts in life insurance manufacturing in WPB and adverse valuation adjustments in GBM, both notably in the first quarter. These factors more than offset higher revenue in Global Markets as increased volatility resulted in higher client activity.
The reduction in reported revenue included net adverse movements in significant items of $0.6bn, primarily from the non-recurrence of a $0.8bn dilution gain in 1H19, as mentioned above.
Reported ECL
Reported ECL of $6.9bn were $5.7bn higher than in 1H19, with increases across all global businesses, mainly from charges relating to the global impact of the Covid-19 outbreak on the forward economic outlook. The increase also reflected higher charges related to specific wholesale exposures, including a significant charge related to a corporate exposure in Singapore in CMB.
The estimated impact of the Covid-19 outbreak was incorporated in the ECL through additional scenario analysis, which considered differing severity and duration assumptions relating to the global pandemic. These included probability-weighted shocks to annual GDP and consequential impacts on unemployment and other economic variables, with differing economic recovery assumptions.Given the severity of the macroeconomic projections, and the complexities of the government measures, which have never been modelled, additional judgemental adjustments have been made to our provisions.
For further details on the calculation of ECL, including the measurement uncertainties and significant judgements applied to such calculations, the impact of alternative/additional scenarios and post model-adjustments, see pages 60 to 66.
Reported operating expenses
Reported operating expenses of $16.5bn were $0.6bn or 4% lower than in 1H19 and included favourable foreign currency translation differences of $0.5bn and net adverse movements in significant items of $0.6bn, which included:
| • | a $1.0bn impairment of capitalised software related principally to businesses within HSBC Bank plc. This reflected underperformance and a deterioration in the future forecasts of these businesses, substantially relating to prior periods (for more information, see Note 11 on the interim condensed financial statements); and |
| • | higher restructuring and other related costs of $0.5bn, of which $116m related to severance and $0.2bn related to an impairment of software intangibles, compared with $0.3bn in 1H19. |
This was partly offset by:
| • | customer redress programme costs in respect of payment protection insurance (‘PPI’) of $0.1bn in 1H20, compared with $0.6bn in 1H19. |
The remaining reduction reflected lower performance-related pay and discretionary expenditure, while we continued to invest in technology.
Reported share of profit in associates and joint ventures
Reported share of profit in associates of $1.0bn fell $366m or 28%, primarily reflecting the impact of the Covid-19 outbreak and the lower interest rate environment on the share of profit we recognise from our associates.
Tax expense
The effective tax rate for 1H20 of 27.6% was higher than the 19.9% for 1H19, primarily reflecting the non-recognition of deferred tax on losses in the UK in 1H20. The effective tax rate for 1H19 was reduced by the non-taxable dilution gain arising on the merger of SABB with Alawwal bank in Saudi Arabia.
Reported 1H20 profit after tax ($bn)
$3.1bn
Basic earnings per share for 1H20 ($)
$0.10
Reported performance - 2Q20 vs 2Q19
Reported profit
Reported profit after tax of $0.6bn in 2Q20 was $4.4bn or 88% lower than in 2Q19.
Reported profit before tax of $1.1bn was $5.1bn or 82% lower. This decrease reflected a significant rise in reported ECL and lower reported revenue, primarily in our CMB business, which reported a loss before tax in 2Q20, as well as in WPB. These factors were partly offset by reported revenue growth in GBM, as well as a reduction in reported operating expenses.
The reduction in profit before tax included the impact of the non-recurrence of a 2Q19 dilution gain of $0.8bn in Saudi Arabia, and a $1.2bn impairment of software intangibles in Europe. However, results were favourably affected by lower charges in respect of PPI.
Reported revenue of $13.1bn was $1.9bn or 13% lower, which included the non-recurrence of the dilution gain mentioned above. The impact of interest rate reductions adversely affected deposit revenue in Retail Banking and GLCM, which resulted in lower revenue in both WPB and CMB. Wealth management revenue in WPB was broadly unchanged. This reflected the partial reversal in 2Q20 of the significant adverse movement in market impacts in life insurance manufacturing recorded in 1Q20, offset by the lower demand for investment products due to market uncertainty. The reductions in WPB and CMB were partly offset by higher revenue in our Global Markets business in GBM as increased market volatility resulted in higher client activity.
ECL increased by $3.3bn to $3.8bn, largely from charges relating to the ongoing global impact of the Covid-19 outbreak and the forward economic outlook, and from charges relating to a small number of wholesale exposures in 2Q20.
Reported operating expenses of $8.7bn were $0.3bn or 3% lower, reflecting a reduction in discretionary expenditure and lower performance-related pay, partly offset by the impact of a $1.2bn impairment of software intangibles.
Reported share of profit in associates and joint ventures fell by $0.2bn, primarily reflecting the impact of the Covid-19 outbreak and the lower interest rate environment on the share of profit we recognise from our associates.
Reported 2Q20 profit after tax ($bn)
$0.6bn
(2Q19: $5.0bn)
HSBC Holdings plc Interim Report 2020 | 11 |
Adjusted results
Our reported results are prepared in accordance with International Financial Reporting Standards (‘IFRSs’) as detailed in the financial statements on page 240 of the Annual Report and Accounts 2019.
We also present alternative performance measures. Adjusted performance is an alternative performance measure used to align internal and external reporting, identify and quantify items management believes to be significant, and provide insight into how management assesses period-on-period performance. Alternative performance measures are highlighted with the following symbol: <>
To derive adjusted performance, we adjust for:
- the period-on-period effects of foreign currency translation differences; and
- the effect of significant items that distort period-on-period comparisons, which are excluded in order to improve understanding of the underlying trends in the business.
The results of our global businesses are presented on an adjusted basis, which is consistent with how we manage and assess global business performance.
For reconciliations of our reported results to an adjusted basis, including lists of significant items, see page 33.
Adjusted results <> | Half-year to | 1H20 vs 1H19 | |||||||||
| 30 Jun 2020 $m | 30 Jun 2019 $m | 31 Dec 2019 $m | $m | % | |||||||
| Revenue | 26,477 | 27,815 | 26,632 | (1,338 | ) | (5 | ) | ||||
| ECL | (6,858 | ) | (1,088 | ) | (1,554 | ) | (5,770 | ) | >(100) | ||
| Total operating expenses | (14,942 | ) | (15,739 | ) | (16,448 | ) | 797 | 5 | |||
| Operating profit | 4,677 | 10,988 | 8,630 | (6,311 | ) | (57 | ) | ||||
| Share of profit in associates and joint ventures | 958 | 1,285 | 1,030 | (327 | ) | (25 | ) | ||||
| Profit before tax | 5,635 | 12,273 | 9,660 | (6,638 | ) | (54 | ) | ||||
Adjusted performance - 1H20 vs 1H19
Adjusted profit before tax <>
Adjusted profit before tax of $5.6bn was $6.6bn or 54% lower than in 1H19, primarily from higher adjusted ECL and lower adjusted revenue. Adjusted ECL increased by $5.8bn, mainly from charges relating to the global impact of the Covid-19 outbreak on the forward economic outlook. Adjusted revenue decreased by $1.3bn, primarily from interest rate reductions across our deposit franchises, as well as the effects of a sharp fall in equity markets and widening of credit spreads towards the end of the first quarter of 2020, although there was a partial recovery in equity markets and a tightening of credit spreads during the second quarter. This was partly offset by higher revenue from Global Markets. Adjusted operating expenses decreased by $0.8bn as we lowered the performance-related pay accrual and reduced discretionary expenditure while continuing to invest in our businesses.
Reconciliation of reported to adjusted profit before tax
| Half-year to | ||||||
| 30 Jun 2020 $m | 30 Jun 2019 $m | 31 Dec 2019 $m | ||||
| Reported profit before tax | 4,318 | 12,407 | 940 | |||
| Currency translation | (215 | ) | 9 | |||
| Significant items: | 1,317 | 81 | 8,711 | |||
| – costs of structural reform | — | 91 | 67 | |||
| – customer redress programmes | 24 | 610 | 834 | |||
| – disposals, acquisitions and investment in new businesses | 8 | (827 | ) | 59 | ||
| – fair value movements on financial instruments | (299 | ) | (50 | ) | (34 | ) |
| – impairment of goodwill and other intangibles | 1,025 | — | 7,349 | |||
| – restructuring and other related costs | 554 | 287 | 540 | |||
| – settlements and provisions in connection with legal and regulatory matters | 5 | (2 | ) | (59 | ) | |
| – currency translation on significant items | — | (28 | ) | (45 | ) | |
| Adjusted profit before tax | 5,635 | 12,273 | 9,660 | |||
| 12 | HSBC Holdings plc Interim Report 2020 |
Adjusted revenue <>
Adjusted revenue of $26.5bn was $1.3bn or 5% lower than in 1H19, reflecting falls in WPB (down $1.6bn) and CMB (down $0.6bn), partly offset by higher revenue in GBM (up $0.6bn) and Corporate Centre (up $0.3bn).
The reduction in adjusted revenue reflected lower interest rates in many of the key markets in which we operate. This had an adverse impact on revenue from Retail Banking within WPB, and from GLCM within CMB and GBM, although we continued to grow average balances across these businesses. In addition, lower revenue included adverse movements in market impacts of $482m in life insurance manufacturing within WPB, following a weakening of global equity prices and lower interest rates. It also included an adverse movement in credit and funding valuation adjustments (down $0.4bn) and losses in Principal Investments of $12m, compared with gains in 1H19 of $120m in GBM. In 1H19, adjusted revenue included disposal gains in WPB and CMB of $157m.
These reductions were partly offset by higher revenue in Global Markets as increased market volatility resulted in higher client activity. Revenue also rose in Corporate Centre, which included favourable fair value movements of $0.1bn relating to the economic hedging of interest rate and exchange rate risk on our long-term debt with associated swaps, notably in 1Q20.
Revenue relating to Balance Sheet Management (‘BSM’), Holdings net interest expense and Argentina hyperinflation was $0.4bn higher, primarily due to disposal gains in BSM. This revenue is allocated to our global businesses.
Adjusted ECL <>
Adjusted ECL, which removes the period-on-period effects of foreign currency translation differences, were $6.9bn, an increase of $5.8bn from 1H19. This increase occurred in WPB (up $1.7bn), CMB (up $3.0bn) and GBM (up $1.0bn) and mainly reflected charges related to the global impact of the Covid-19 outbreak and the forward economic outlook in all of our global businesses. In addition to these charges, ECL in 1H20 included a significant charge related to a corporate exposure in Singapore in CMB, and charges against a small number of corporate exposures in GBM.
Adjusted ECL (annualised) as a percentage of average gross loans and advances to customers was 1.33%, compared with 0.22% in 1H19.
Adjusted operating expenses <>
Adjusted operating expenses of $14.9bn were $0.8bn or 5% lower than in 1H19, as we continue to review and reprioritise costs and investments to help mitigate revenue headwinds. The decrease primarily reflected a $0.6bn reduction in the performance-related pay accrual and lower discretionary expenditure, including marketing (down $0.2bn) and travel costs (down $0.1bn). In addition, our cost-saving initiatives resulted in a reduction of $0.3bn. These decreases were partly offset by an increase of $0.2bn on investments in technology to enhance our digital capabilities and increase automation to improve how we serve our customers.
The number of employees expressed in full-time equivalent staff (‘FTE’) at 30 June 2020 was 232,764, a decrease of 2,587 compared with 31 December 2019. The number of contractors at 30 June 2020 was 6,221, a decrease of 1,190 from 31 December 2019.
Adjusted share of profit in associates and joint ventures<>
Adjusted share of profit from associates of $1.0bn was $0.3bn or 25% lower than in 1H19, primarily reflecting the impact of the Covid-19 outbreak and the lower interest rate environment on the share of profit we recognise from our associates.
Balance sheet and capital
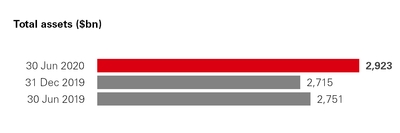
$2,923bn
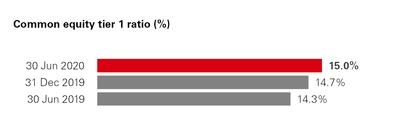
15.0%
Balance sheet strength
Total assets of $2.9tn were $208bn or 8% higher than at 31 December 2019 on a reported basis, and 11% higher on a constant currency basis. The increase in total assets included growth in cash balances and in financial investments, as well as from an increase in derivative assets, mainly reflecting gains on interest rate derivatives. The increase in derivative assets was consistent with the increase in derivative liabilities as the underlying risk is broadly matched. On a constant currency basis, loans and advances to customers grew by $12bn during 1H20.
Customer accounts of $1.5tn increased by $93bn, or $133bn on a constant currency basis, as corporate and personal customers consolidated their funds and redeployed them into cash, with growth in all global businesses. The growth reflected customers spending less during lockdown restrictions and the depositing of loans from government-backed schemes.
Distributable reserves
The distributable reserves of HSBC Holdings at 30 June 2020 were $33.1bn, compared with $31.7bn at 31 December 2019. The increase was primarily driven by profits generated during the year.
Capital position
We actively manage the Group’s capital position to support our business strategy and meet our regulatory requirements at all times, including under stress, while optimising our capital efficiency. To do this, we monitor our capital position using a number of measures. These include: our capital ratios, the impact on our capital ratios as a result of stress, and the degree of double leverage being run by HSBC Holdings. Double leverage is a constraint on managing our capital position, given the complexity of the Group’s subsidiary structure and the multiple regulatory regimes under which we operate. For further details, see page 81.
Our CET1 ratio at 30 June 2020 was 15.0%, up from 14.7% at 31 December 2019. This increase included the impact of the cancellation of the 4Q19 dividend and the current suspension of dividends on ordinary shares. These increases were partly offset by an increase in RWAs.
Liquidity position
We actively manage the Group’s liquidity and funding to support our business strategy and meet regulatory requirements at all times, including under stress. To do this, we monitor our position using a number of risk appetite measures, including the liquidity coverage ratio and the net stable funding ratio. At 30 June 2020, we held high-quality liquid assets of $654bn.
HSBC Holdings plc Interim Report 2020 | 13 |
Wealth and Personal Banking
Contribution to Group 1H20 adjusted profit before tax<>
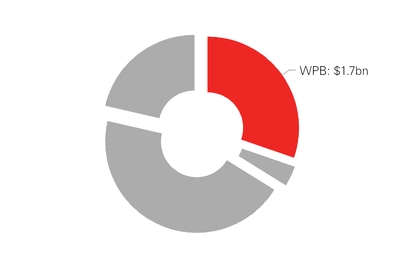
| % contribution to Group | |
| 30 | % |
WPB was formed in the second quarter by combining our Retail Banking and Wealth Management and Global Private Banking businesses. We supported our customers during the Covid-19 crisis through payment holidays, short-term credit facilities and access to cash. We continue to invest in digital capabilities to make it easier for customers to bank with us. Performance in 1H20 reflected a rise in adjusted ECL charges and a decline in adjusted revenue from the fall in global equity prices and lower interest rates.
We provide a full range of retail banking and wealth services to more than 39 million customers from personal banking to ultra high net worth individuals and their families.
We offer locally-tailored products and services across multiple channels for our customers’ everyday banking needs, as well as insurance, investment management and Private Wealth Solutions for those with more sophisticated requirements. Our global presence provides for customers with international needs.
| Adjusted results<> | Half-year to | 1H20 vs 1H19 | |||||||||
| 30 Jun 2020 $m | 30 Jun 2019 $m | 31 Dec 2019 $m | $m | % | |||||||
| Net operating income | 11,251 | 12,861 | 12,492 | (1,610 | ) | (13 | ) | ||||
| ECL | (2,202 | ) | (527 | ) | (829 | ) | (1,675 | ) | >(100) | ||
| Operating expenses | (7,346 | ) | (7,551 | ) | (7,685 | ) | 205 | 3 | |||
| Share of profit in associates and JVs | (8 | ) | 41 | 11 | (49 | ) | >(100) | ||||
| Profit before tax | 1,695 | 4,824 | 3,989 | (3,129 | ) | (65 | ) | ||||
| RoTE excluding significant items and UK bank levy (annualised, YTD) (%) | 6.0 | 22.1 | 19.7 | ||||||||
| Management view of adjusted revenue <> | Half-year to | 1H20 vs 1H19 | |||||||||
| 30 Jun 2020 $m | 30 Jun 2019 $m | 31 Dec 2019 $m | $m | % | |||||||
| Retail Banking | 6,896 | 7,649 | 7,879 | (753 | ) | (10 | ) | ||||
| – net interest income | 6,301 | 6,810 | 7,067 | (509 | ) | (7 | ) | ||||
| – non-interest income | 595 | 839 | 812 | (244 | ) | (29 | ) | ||||
| Wealth Management | 3,606 | 4,506 | 4,056 | (900 | ) | (20 | ) | ||||
| – investment distribution | 1,602 | 1,696 | 1,554 | (94 | ) | (6 | ) | ||||
| – life insurance manufacturing | 587 | 1,371 | 1,078 | (784 | ) | (57 | ) | ||||
| – Global Private Banking | 921 | 925 | 927 | (4 | ) | — | |||||
| net interest income | 372 | 441 | 439 | (69 | ) | (16 | ) | ||||
| non-interest income | 549 | 484 | 488 | 65 | 13 | ||||||
| – asset management | 496 | 514 | 497 | (18 | ) | (4 | ) | ||||
Other1 | 262 | 404 | 366 | (142 | ) | (35 | ) | ||||
| Balance Sheet Management, Holdings interest expense and Argentina hyperinflation | 487 | 302 | 191 | 185 | 61 | ||||||
Net operating income2 | 11,251 | 12,861 | 12,492 | (1,610 | ) | (13 | ) | ||||
1 ‘Other’ mainly includes interest on capital and the distribution and manufacturing (where applicable) of non-wealth insurance products.
2 ‘Net operating income’ means net operating income before change in expected credit losses and other credit impairment charges (also referred to as ‘Revenue’).
| 14 | HSBC Holdings plc Interim Report 2020 |
Financial performance
Adjusted profit before tax of $1.7bn in 1H20 was $3.1bn or 65% lower than in 1H19. This reflected an increase in adjusted ECL, as well as lower adjusted revenue. Lower revenue was driven by a reduction in life insurance manufacturing revenue largely from negative market impacts following a fall in equity markets in 1Q20, although these losses were partially reversed in 2Q20 as equity markets recovered. Retail Banking revenue was also lower from the reduction in interest rates.
Adjusted revenue of $11.3bn was $1.6bn or 13% lower, and included the non-recurrence of 1H19 disposal gains in Argentina and Mexico of $133m.
In Retail Banking, revenue of $6.9bn was down $0.8bn or 10%.
| • | Net interest income was $0.5bn lower due to narrower margins, notably in the second quarter, as global interest rates fell as a result of the Covid-19 outbreak. This reduction was partly offset by deposit balance growth of $57bn or 9%, particularly in Hong Kong and the UK, and lending balance growth of $14bn or 4% compared with 1H19. |
| • | Non-interest income declined by $0.2bn from lower fee income earned on unsecured lending products. |
In Wealth Management, revenue of $3.6bn was down $0.9bn or 20%.
| • | Life insurance manufacturing revenue reduced by $0.8bn or 57%, primarily from an adverse movement in market impacts of $482m (an adverse movement of $334m in 1H20, compared with a favourable movement of $148m in 1H19). The value of new business written fell by $0.3bn or 37% as the reduction in volumes resulting from the Covid-19 outbreak was in part mitigated by actions to support remote engagement with customers, including digital enhancements to sales processes. |
| • | Investment distribution revenue was $0.1bn or 6% lower reflecting adverse market conditions in Hong Kong, which resulted in lower mutual fund sales, partly offset by higher brokerage fees from increased transaction volumes. |
| • | Global Private Banking revenue was stable, as higher investment revenue from increased market volatility and a rise in fees from advisory and discretionary mandates was broadly offset by the impact of lower interest rates on deposit revenue. |
Adjusted ECL of $2.2bn were $1.7bn higher than in 1H19, reflecting the global impact of the Covid-19 outbreak on the forward economic outlook of $1.2bn and from higher charges, notably in the UK, Asia and the US against unsecured lending driven by moderate credit deterioration.
Adjusted operating expenses of $7.3bn were $0.2bn or 3% lower, as a lower performance-related pay accrual and reduced discretionary expenditure more than offset the impact of inflation and our continued investment in digital and wealth initiatives.
Divisional highlights
$1.4tn
WPB wealth balances at 30 June 2020. This was a 3% year-on-year increase, and broadly unchanged from 31 December 2019.
$17bn
Growth in mortgage book in the UK (up 6%) and Hong Kong (up 5%) since 30 June 2019.
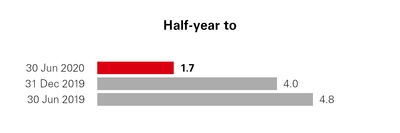
Adjusted profit before tax <>
($bn)
$1.7bn
Adjusted net operating income <>
($bn)
$11.3bn

HSBC Holdings plc Interim Report 2020 | 15 |
Commercial Banking
Contribution to Group 1H20 adjusted profit before tax<>
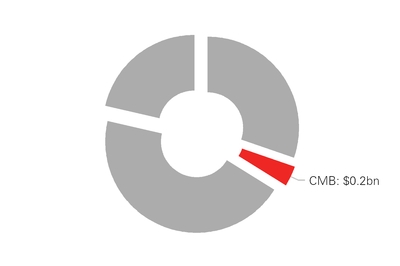
| % contribution to Group | |
| 3 | % |
CMB continued to support our customers’ liquidity and working capital needs, growing lending and deposit balances, while our ongoing investment in technology has enabled us to support customers under exceptionally challenging conditions. Performance in 1H20 was adversely impacted by an increase in adjusted ECL charges and the fall in interest rates globally.
We support approximately 1.3 million business customers in 53 countries and territories, ranging from small enterprises focused primarily on their domestic markets to large companies operating globally.
We help entrepreneurial businesses grow by supporting their financial needs, facilitating cross-border trade and payment services, and providing access to products and services offered by other global businesses.
| Adjusted results<> | Half-year to | 1H20 vs 1H19 | |||||||||
| 30 Jun 2020 $m | 30 Jun 2019 $m | 31 Dec 2019 $m | $m | % | |||||||
| Net operating income | 7,000 | 7,647 | 7,379 | (647 | ) | (8 | ) | ||||
| ECL | (3,526 | ) | (478 | ) | (684 | ) | (3,048 | ) | >(100) | ||
| Operating expenses | (3,290 | ) | (3,258 | ) | (3,498 | ) | (32 | ) | (1 | ) | |
| Share of profit in associates and JVs | — | — | — | — | — | ||||||
| Profit before tax | 184 | 3,911 | 3,197 | (3,727 | ) | (95 | ) | ||||
| RoTE excluding significant items and UK bank levy (annualised, YTD) (%) | (1.6 | ) | 15.3 | 13.0 | |||||||
| Management view of adjusted revenue <> | Half-year to | 1H20 vs 1H19 | |||||||||
| 30 Jun 2020 $m | 30 Jun 2019 $m | 31 Dec 2019 $m | $m | % | |||||||
Global Trade and Receivables Finance | 892 | 920 | 890 | (28 | ) | (3 | ) | ||||
| Credit and Lending | 2,741 | 2,685 | 2,674 | 56 | 2 | ||||||
| Global Liquidity and Cash Management | 2,347 | 2,986 | 2,909 | (639 | ) | (21 | ) | ||||
Markets products, Insurance and Investments, and Other1 | 890 | 1,058 | 940 | (168 | ) | (16 | ) | ||||
| Balance Sheet Management, Holdings interest expense and Argentina hyperinflation | 130 | (2 | ) | (34 | ) | 132 | >100 | ||||
Net operating income2 | 7,000 | 7,647 | 7,379 | (647 | ) | (8 | ) | ||||
1 ‘Markets products, Insurance and Investments and Other’ includes revenue from Foreign Exchange, insurance manufacturing and distribution, interest rate management and global banking products.
2 ‘Net operating income’ means net operating income before change in expected credit losses and other credit impairment charges (also referred to as ‘Revenue’).
| 16 | HSBC Holdings plc Interim Report 2020 |
Financial performance
Adjusted profit before tax of $0.2bn was $3.7bn or 95% lower than in 1H19. The reduction reflected higher adjusted ECL and lower adjusted revenue, primarily due to lower interest rates. The impact of these factors on financial performance increased in the second quarter, resulting in a loss before tax of $0.5bn for 2Q20.
Adjusted revenue of $7.0bn was $0.6bn or 8% lower.
| • | In GLCM, revenue decreased by $0.6bn or 21% due to the impact of the lower interest rate environment, mainly in Hong Kong and the UK. This was partly offset by an 11% increase in average deposit balances, which was across all regions, but mainly concentrated in the UK and the US. |
| • | In Global Trade and Receivables Finance, revenue decreased by $28m or 3% from lower fees and balances, notably in Hong Kong and the UK, reflecting a reduction in global trade volumes as a result of the Covid-19 crisis. This was partly offset by wider margins in Latin America and Asia. |
| • | In ‘Other’ products, revenue was $168m lower, reflecting a reduction in Insurance and Investments (down $29m), lower revaluation gains on shares (down $27m) and lower revenue from Global Markets products (down $19m). In addition, 1H19 included a disposal gain of $24m in Latin America. |
This was partly offset by:
| • | In Credit and Lending, revenue increased by $56m or 2%, reflecting balance growth in all regions from increased customer drawdowns and government-backed lending schemes, partly offset by lower margins. |
Adjusted ECL of $3.5bn were $3.0bn higher than in 1H19. The increase reflected the global impact of the Covid-19 outbreak on the forward economic outlook, mainly in the UK and Asia. There were also higher charges against specific customers in 1H20 across all regions, particularly in the oil and gas and wholesale trade sectors, including a significant charge related to a corporate exposure in Singapore.
Adjusted operating expenses of $3.3bn were marginally higher, reflecting investment in digital capabilities to improve the client experience, partly offset by a lower performance-related pay accrual and a reduction in other discretionary expenditure.
Divisional highlights
$41bn
Growth in customer accounts in 1H20.
12%
Increase in international account openings, compared with 1H19.
Adjusted profit before tax <>
($bn)
$0.2bn
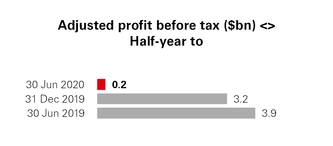
Adjusted net operating income <>
($bn)
$7.0bn
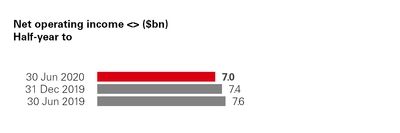
HSBC Holdings plc Interim Report 2020 | 17 |
Global Banking and Markets
Contribution to Group 1H20 adjusted profit before tax<>
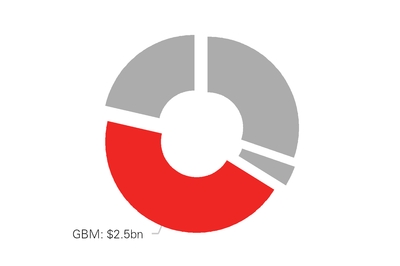
| % contribution to Group | |
| 45 | % |
GBM increased adjusted revenue as a strong Global Markets performance more than offset the impact of falling interest rates and adverse movements in credit and funding valuation adjustments. In 1H20, management actions delivered gross RWA reductions of $21bn globally, while over 50% of our revenue was generated in Asia.
We continue to invest in digital capabilities to provide value to our clients and support them in the current environment. This was recognised in a client survey by Greenwich Associates where we were voted the leading FX dealer in supporting corporate clients during the Covid-19 outbreak.
We support major government, corporate and institutional clients worldwide. Our product specialists deliver a comprehensive range of transaction banking, financing, advisory, capital markets and risk management services.
| Adjusted results<> | Half-year to | 1H20 vs 1H19 | |||||||||
| 30 Jun 2020 $m | 30 Jun 2019 $m | 31 Dec 2019 $m | $m | % | |||||||
| Net operating income | 8,178 | 7,590 | 7,113 | 588 | 8 | ||||||
| ECL | (1,118 | ) | (97 | ) | (61 | ) | (1,021 | ) | >(100) | ||
| Operating expenses | (4,512 | ) | (4,758 | ) | (4,656 | ) | 246 | 5 | |||
| Share of profit in associates and JVs | — | — | — | — | — | ||||||
| Profit before tax | 2,548 | 2,735 | 2,396 | (187 | ) | (7 | ) | ||||
| RoTE excluding significant items and UK bank levy (annualised, YTD) (%) | 7.7 | 10.2 | 9.8 | ||||||||
| Management view of adjusted revenue <> | Half-year to | 1H20 vs 1H19 | |||||||||
| 30 Jun 2020 $m | 30 Jun 2019 $m | 31 Dec 2019 $m | $m | % | |||||||
| Global Markets | 4,272 | 3,096 | 2,584 | 1,176 | 38 | ||||||
| – FICC | 3,913 | 2,493 | 2,204 | 1,420 | 57 | ||||||
| Foreign Exchange | 1,917 | 1,275 | 1,370 | 642 | 50 | ||||||
| Rates | 1,351 | 865 | 575 | 486 | 56 | ||||||
| Credit | 645 | 353 | 259 | 292 | 83 | ||||||
| – Equities | 359 | 603 | 380 | (244 | ) | (40 | ) | ||||
Securities Services1 | 944 | 985 | 1,020 | (41 | ) | (4 | ) | ||||
Global Banking1 | 1,944 | 1,887 | 1,953 | 57 | 3 | ||||||
| Global Liquidity and Cash Management | 1,094 | 1,357 | 1,349 | (263 | ) | (19 | ) | ||||
| Global Trade and Receivables Finance | 393 | 398 | 394 | (5 | ) | (1 | ) | ||||
| Principal Investments | (12 | ) | 120 | 138 | (132 | ) | >(100) | ||||
| Credit and funding valuation adjustments | (355 | ) | 14 | 18 | (369 | ) | >(100) | ||||
Other2 | (300 | ) | (328 | ) | (333 | ) | 28 | 9 | |||
| Balance Sheet Management, Holdings interest expense and Argentina hyperinflation | 198 | 61 | (10 | ) | 137 | >100% | |||||
Net operating income3 | 8,178 | 7,590 | 7,113 | 588 | 8 | ||||||
1 From 1 June 2020, revenue from Issuer Services, previously reported in Securities Services, was reported within Global Banking. This resulted in $14m additional revenue being recorded in Global Banking. Comparatives have not been re-presented.
2 Includes allocated funding costs. Additionally, within the management view of total operating income, notional tax credits are allocated to the businesses to reflect the economic benefit generated by certain activities not reflected within operating income, such as notional credits on income earned from tax-exempt investments where the economic benefit of the activity is reflected in tax expense. The offset to these tax credits is included within ‘Other’.
3 ‘Net operating income’ means net operating income before change in expected credit losses and other credit impairment charges (also referred to as ‘Revenue’).
| 18 | HSBC Holdings plc Interim Report 2020 |
Financial performance
Adjusted profit before tax of $2.5bn was $0.2bn lower than in 1H19, mainly due to higher adjusted ECL, which reflected the global impact of Covid-19 and included charges relating to specific exposures. The rise in adjusted ECL was partly offset by higher adjusted revenue and from lower adjusted operating expenses, driven by a reduced performance-related pay accrual.
Adjusted revenue of $8.2bn increased by $0.6bn compared with 1H19, which included adverse movements in credit and funding valuation adjustments of $0.4bn.
| • | In Global Markets, revenue increased by $1.2bn or 38%, as client activity increased due to higher volatility levels supporting an improved FICC performance across Foreign Exchange, Rates and Credit. By contrast, lower Equities revenue reflected a weaker performance in prime financing, which included the effect of dividend cancellation and reduced client activity, as well as the release of a historical provision in 1H19. |
| • | Global Banking revenue increased by $57m or 3% from higher capital markets revenue, increased corporate lending balances and the impact of widening credit spreads on portfolio hedges, partly offset by losses on legacy corporate restructuring positions. |
This was partly offset by:
| • | In GLCM, revenue decreased $0.3bn or 19% due to the lower interest rate environment across most regions, although we grew average balances, notably in the UK and the US. |
| • | In Principal Investments, revenue fell by $132m, reflecting revaluation losses incurred in 1Q20 as a result of the Covid-19 outbreak, mainly in Europe, which were substantially reversed during 2Q20. |
Adjusted ECL were $1.1bn, up $1.0bn compared with 1H19 from charges relating to the global impact of Covid-19 on the forward economic outlook, and as charges against a small number of clients in 1H20 were higher than those recorded in 1H19.
Adjusted operating expenses of $4.5bn were $0.2bn or 5% lower, primarily from a lower performance-related pay accrual, which more than offset investment in regulatory programmes, and higher amortisation relating to technology investments.
Divisional highlights
50%
Percentage of adjusted revenue generated in Asia in 1H20.
38%
Growth in Global Markets revenue, compared with 1H19.
Adjusted profit before tax <>
($bn)
$2.5bn
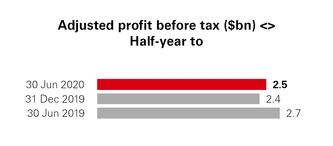
Adjusted net operating income <>
($bn)
$8.2bn
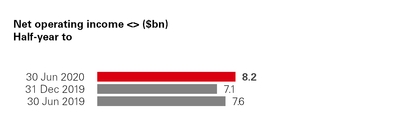
HSBC Holdings plc Interim Report 2020 | 19 |
Corporate Centre
Contribution to Group 1H20 adjusted profit before tax<>
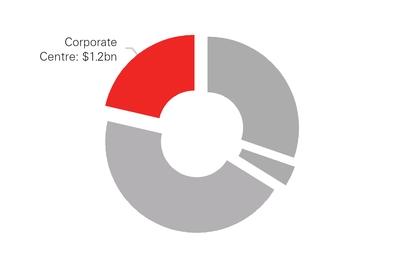
| % contribution to Group | |
| 21 | % |
During the period, we began allocating the revenue and expenses relating to Balance Sheet Management (‘BSM’), the funding costs of HSBC Holdings debt and the impacts of hyperinflation in Argentina, to the global businesses to improve how we reflect revenue and expense related to the global businesses generating or utilising these activities. All comparatives have been restated accordingly.
The results of Corporate Centre now primarily comprise the share of profit from our interests in our associates and joint ventures, Central Treasury, stewardship costs and consolidation adjustments.
| Adjusted results<> | Half-year to | 1H20 vs 1H19 | |||||||||
| 30 Jun 2020 $m | 30 Jun 2019 $m | 31 Dec 2019 $m | $m | % | |||||||
| Net operating income | 48 | (283 | ) | (352 | ) | 331 | >100 | ||||
| ECL | (12 | ) | 14 | 20 | (26 | ) | >(100) | ||||
| Operating expenses | 206 | (172 | ) | (609 | ) | 378 | >100 | ||||
| Share of profit in associates and JVs | 966 | 1,244 | 1,019 | (278 | ) | (22 | ) | ||||
| Profit before tax | 1,208 | 803 | 78 | 405 | 50 | ||||||
| RoTE excluding significant items and UK bank levy (annualised, YTD) (%) | 4.7 | 0.6 | 0.8 | ||||||||
Financial performance
Adjusted profit before tax of $1.2bn primarily comprised our share of profit in associates and joint ventures of $1.0bn, which decreased by $0.3bn or 22%, primarily reflecting the impact of the Covid-19 outbreak and the lower interest rate environment. Adjusted profit before tax was $0.4bn higher than in 1H19, mainly due to favourable movements in operating expenses and revenue.
Adjusted revenue of $48m compared with net negative adjusted revenue of $0.3bn in 1H19. This included Central Treasury revenue of $0.2bn, an increase of $0.1bn compared with 1H19 due to favourable fair value movements relating to the economic hedging of interest rate and exchange rate risk on our long-term debt with associated swaps. In addition, ‘Other’ income increased by $0.2bn, which included an adjustment related to holdings of our own shares.
Adjusted operating expenses, which are stated after recovery of costs from our global businesses, were a net credit of $0.2bn. This compared with a net charge of $0.2bn in 1H19.
| Management view of adjusted revenue <> | Half-year to | 1H20 vs 1H19 | ||||||||
| 30 Jun 2020 $m | 30 Jun 2019 $m | 31 Dec 2019 $m | $m | % | ||||||
Central Treasury1, 2 | 201 | 138 | 41 | 63 | 46 | |||||
| Legacy portfolios | (48 | ) | (83 | ) | (28 | ) | 35 | 42 | ||
| Other | (105 | ) | (338 | ) | (365 | ) | 233 | 69 | ||
Net operating income3 | 48 | (283 | ) | (352 | ) | 331 | >100 | |||
1 Central Treasury includes favourable valuation differences on issued long-term debt and associated swaps of $195m (1H19: gains of $143m; 2H19: gains of $3m).
2 During the period we began allocating the revenue from BSM, Holdings net interest expense and Argentina hyperinflation out to the global businesses, to align them better with their revenue and expense. The total BSM revenue component of this allocation for 1H20 was $1,535m (1H19: $1,109m, 2H19: $920m).
3 ‘Net operating income’ means net operating income before change in expected credit losses and other credit impairment charges (also referred to as ‘Revenue’).
| 20 | HSBC Holdings plc Interim Report 2020 |
Risk overview
Active risk management helps us to achieve our strategy, serve our customers and communities and grow our business safely.
Managing risk
The first half of 2020 has been marked by unprecedented global economic events, leading to banks playing an expanded role to support society and customers. The Covid-19 outbreak and its impact on the global economy have impacted many of our customers’ business models and income, requiring significant levels of support from both governments and banks. In response, we have enhanced our approach to the management of risk in this rapidly changing environment.
Throughout the Covid-19 outbreak, we have supported our customers and adapted our operational processes. Our people, processes and systems have responded to the changes needed and increased the workload in serving our customers through this time. Operational resilience has been particularly evident in Hong Kong, where we have maintained high levels of service throughout the Covid-19 outbreak and the continuing domestic social unrest.
The performance of our operations has varied in different geographies, but overall the balance sheet and liquidity of the Group remain strong. This has helped enable us to respond to the economic recovery as government lockdowns ease.
Key geopolitical risks also heightened during the first half of 2020. These included rising tensions between the US and China, strains in relations between the UK and China following the passing of the new national security law in Hong Kong and the UK’s imposition of restrictions on telecommunications, and the uncertain relationship between the UK and the EU following the UK's departure from the EU.
To meet the additional challenges, we supplemented our existing approach to risk management with additional tools and practices. We increased our focus on the quality and timeliness of the data used to inform management decisions, through measures such as early warning indicators, prudent active risk management of our risk appetite, and ensuring regular communication with our Board and other key stakeholders.
Our risk appetite
Our risk appetite defines our desired forward-looking risk profile, and informs the strategic and financial planning process. It provides an objective baseline to guide strategic decision making, helping to ensure that planned business activities provide an appropriate balance of return for the risk assumed, while remaining within acceptable risk levels.
Our risk appetite also provides an anchor between our global businesses and the Global Risk and Global Finance functions, helping to enable our senior management to allocate capital, funding and liquidity optimally to finance growth, while monitoring exposure and the cost impacts of managing non-financial risks. It also helps to develop aligned people and system capabilities.
Our risk appetite is articulated in our risk appetite statement, which is approved by the Board. Key elements include:
| • | risks that we accept as part of doing business, such as credit risk, market risk, and capital and liquidity risk, which are controlled through both active risk management and our risk appetite; |
| • | risks that we incur as part of doing business, such as non-financial risks, which are actively managed to remain within an acceptable appetite; and |
| • | risks for which we have zero tolerance, such as knowingly engaging in activities where foreseeable reputational risk has not been appropriately considered. |
In the first half of 2020, we continued to evolve our risk appetite by reallocating both financial and non-financial resources and adapting aspects of our risk appetite statement to ensure we remained able to support our customers and strategic goals against the backdrop of the Covid-19 outbreak. A specific emphasis was placed on capital risk to ensure the Group could withstand extreme but plausible stress, and had adequate capacity to provide increasing levels of financial support to customers. Associated non-financial risks were reviewed and, where applicable, processes and controls were enhanced to accommodate material increases in lending volumes and help our people manage the lending process from a home environment. Additional reporting is under development to provide a more holistic view of the Group’s resilience capabilities. Significant work is also underway to align to the revised business segmentation and to further develop our risk appetite framework, with forward-looking statements informed by stress testing. The financial impact of Covid-19 is becoming apparent in our risk appetite where RoTE and ECL charges are outside of appetite. These are subject to close monitoring and management actions.
Key risk appetite metrics
| Component | Measure | Risk appetite | 1H20 | |
| Returns | Return on average tangible equity (‘RoTE’) | ≥6.5% | 3.8 | % |
| Capital | CET1 ratio – end point basis | ≥13.10% | 15.0 | % |
| Change in expected credit losses and other credit impairment charges | Change in expected credit losses and other credit impairment charges as a % of advances: retail | ≤0.50% | 1.08% | |
Change in expected credit losses and other credit impairment charges as a % of advances: wholesale | ≤0.45% | 0.79% | ||
Stress tests
We regularly conduct stress tests to assess the resilience of our balance sheet and our capital adequacy, as well as to provide actionable insights into how key elements of our portfolios may behave during crises. Stress tests are used to calibrate our risk appetite and to review the robustness of our strategic and financial plans, helping to improve the quality of management’s decision making. Stress testing analysis assists
management in understanding the nature and extent of vulnerabilities to which the Group is exposed. The results from the stress tests also drive recovery and resolution planning to enhance the Group’s financial stability under various macroeconomic scenarios.
Risk assessment through internal stress tests is used to assess the impacts of macroeconomic, geopolitical and other HSBC-specific risks. The selection of stress scenarios is based upon the identification and assessment of our top and emerging risks identified and our risk appetite.
In 2020, the Bank of England (‘BoE’) and European Banking Authority (‘EBA’) cancelled the requirement for all participating banks to conduct their respective 2020 stress test exercises in light of the emerging impacts of the Covid-19 outbreak.
HSBC Holdings plc Interim Report 2020 | 21 |
Notwithstanding this, we conducted a range of internal stress tests during the first half of 2020. These included stress tests to assess the potential future impacts of the Covid-19 crisis and assess the resilience of key balance sheet metrics including our capital adequacy. To date, we have conducted stress tests covering several potential Covid-19-related outcomes, incorporating assessments from credit experts. We are regularly reviewing the economic impacts for key economies and markets to understand potential vulnerabilities in our balance sheet and to identify appropriate mitigating actions. We continue to monitor emerging geopolitical, economic and environmental risks impacting the Group’s capital adequacy and liquidity. Our balance sheet and capital adequacy remain resilient based on regulatory and internal stress test outcomes.
Our operations
We remain committed to investing in the reliability and resilience of our IT systems and critical services that support all parts of our business. We do so to protect our customers, affiliates and counterparties, and to help ensure that we minimise any disruption to services that could result in reputational and regulatory consequences. We continue to operate in a challenging environment in which cyber threats are prevalent. We continue to invest in business and technical controls to defend against these threats.
We paused elements of the transformation programme announced in February to help ensure our safe operation during a period of significant change in the external environment due to the Covid-19 outbreak, and to support our people and communities during a difficult period. With many countries and territories beginning to relax lockdown rules, we are now starting to move forward with the implementation of our business transformation plans. We are ensuring that we are able to manage safely the risks of the restructuring, which include execution, operational, governance, reputational, conduct and financial risks. We are also putting support in place to help our people, particularly when we are unable to find alternative roles for them.
For further details on our risk management framework and risks associated with our banking and insurance manufacturing operations, see pages 74 and 83 of the Annual Report and Accounts 2019, respectively.
Geopolitical and macroeconomic risks
The Covid-19 outbreak has dominated the political and economic landscape for the first six months of 2020.
The passage of the Hong Kong national security law and the US Hong Kong Autonomy Act has heightened existing US-China tensions. There are also rising tensions in the context of UK-China and EU-China relations.
In addition, the UK and EU continue to negotiate on the shape of their future relationship following the UK's departure from the EU, although the outcome remains uncertain. Failure to reach a negotiated agreement by the end of the transition period would result in the application of World Trade Organization (‘WTO’) rules and the absence of formal arrangements could set back further the expected gradual recovery of the UK and EU economies.
For further details on our approach to geopolitical and macroeconomic risks, see ‘Areas of special interest’ on page 52.
Risks related to Covid-19
We have needed to build up our operational capacity rapidly as governments and central banks globally introduced measures to combat the impacts of the Covid-19 outbreak, and as we have dealt with complex conduct considerations and heightened risk of fraud. At a time when most of our people have been working remotely, we have remained operationally resilient and have continued to keep our customers at the forefront of our operations. We have maintained close to normal levels of operations across our branches.
Levels of Covid-19 infections have declined significantly in many regions from their respective peaks. However, there are other locations where infection rates are still increasing. Governments in some countries and territories that have recorded declines have begun to lift certain restrictions that they had placed on the movements of their respective populations. Nevertheless, social distancing and tight border restrictions remain commonplace, which is limiting the extent and pace of economic recovery. The situation remains uncertain as Covid-19 has proved to be highly contagious and there is some recent evidence of further waves of infection emerging. Where further waves of Covid-19 are evident, governments may choose to extend or reinstate lockdowns, leading to a more prolonged recovery.
In many of our markets we have initiated region-specific measures to support our personal and business customers through these challenging times. These measures include mortgage assistance, payment holidays, the waiving of certain fees and charges, and liquidity relief for businesses facing difficulties such as supply chain disruption. We endeavour to remain responsive to our customers' changing needs and are working closely with governments and supporting national schemes that focus on the parts of the economy most impacted by Covid-19.
The Covid-19 outbreak has led to a significant weakening in GDP in many of our markets with impacts varying by sectors and regions. The longer-term effects of the outbreak on businesses are uncertain and may lead to significant ECL charges in the worst affected sectors. However, our financial position remains strong, allowing us to continue to support our customers. At 30 June 2020, our CET1 ratio was 15.0%, compared with 14.7% at 31 December 2019, and our liquidity coverage ratio was 148%. The management of capital and liquidity was a key focus in the first half of the year to ensure the Group responded to unprecedented customer and market activity. Continual monitoring of capital and liquidity was in place at both Group and entity levels. This included some redeployment of funding within the Group to ensure customers and the economy could be supported across geographies and sectors. Additionally, the risk appetite for the Group CET1 ratio was revised to reflect the reduction in the UK countercyclical buffer in response to the Covid-19 outbreak.
The nature and scale of the Covid-19 crisis have necessitated very strong responses from governments, central banks and regulators, and has resulted in changes in the behaviours of our retail and wholesale customers. These factors have impacted the performance of our financial models, requiring more monitoring of model outputs and use of model adjustments. Compensating controls have been implemented as needed.
For further details on our approach to the risks related to Covid-19, see ‘Areas of special interest’ on page 53.
Risks to our operations and portfolios in Asia-Pacific
In the first half of 2020, US-China tensions continued to escalate including in relation to Hong Kong. In June 2020, the National People's Congress of China enacted the Hong Kong national security law. In response, the US took steps to terminate the preferential treatment afforded Hong Kong under the 1992 Hong Kong Policy Act. Additionally, the US President signed into law the Hong Kong Autonomy Act, and issued an Executive Order, providing authority to impose primary sanctions against entities and individuals determined to have undermined Hong Kong’s autonomy. The Hong Kong Autonomy Act also provides authority to impose secondary sanctions against non-US financial institutions determined to have conducted a significant transaction for any individual or entity subject to primary sanctions under the Act. There are other steps that have been taken by the US as tensions with China rise.
| 22 | HSBC Holdings plc Interim Report 2020 |
Domestic social unrest in Hong Kong remains a risk, with investor and business sentiment in some sectors remaining dampened. There are concerns that ongoing tensions could result in an increasingly fragmented trade and regulatory environment, with the retail and leisure sectors being particularly affected by the lack of tourists. However, the financial services sector in Hong Kong has remained strong and has benefited from stable liquidity conditions.
The plans to roll out 5G telecommunications technology in several countries and its importance to future standard setting and economic growth are likely to lead to heightened corporate and national competition over ownership of the relevant technologies.
The financial impact to the Group of geopolitical risks in Asia is heightened due to the importance and profitability of the region, and Hong Kong in particular. We continue to manage carefully our exposures and conduct regular stress tests to assess the resilience of our balance sheet and our capital adequacy. These are used to consider our risk appetite and provide insights into our financial stability.
Our operational resilience has been strongly tested during the Covid-19 outbreak and we have continued to maintain a high level of service to clients during this period in markets that remain at different levels of recovery. Our Hong Kong operations in particular have shown resilience in continuing to operate in times of domestic social unrest, the Covid-19 outbreak and heightened geopolitical risks, although this will continue to be closely monitored.
We continue to believe in the core elements of our strategy, such as targeting growth on China’s Greater Bay Area and the ASEAN region, and that we are well placed to be able to support opportunities as the economy recovers from the Covid-19 outbreak.
For further details on our approach to the risks to our operations and portfolios in Asia-Pacific, see ‘Areas of special interest’ on page 54.
UK withdrawal from the European Union
The UK left the EU on 31 January 2020 and entered a transition period until 31 December 2020. During the transition period, the UK continues to be bound by EU laws and regulations. Beyond that date, there is no certainty on what the future relationship between the UK and the EU will be. The prospect of exiting the transition period without a trade agreement is likely to drive increasing market volatility and economic risk, particularly in the UK. Our global presence and diversified customer base is expected to help mitigate the direct impacts on our financial position in a scenario where the transition period ends without a UK-EU trade agreement being in place. Our existing footprint in the EU, and in particular our subsidiary in France, provides a strong foundation for us to build upon. As part of our stress testing programme, a number of internal macroeconomic and event-driven scenarios were assessed to support our planning for, and evaluation of, the impact of the UK’s withdrawal from the EU without a trade agreement. The results confirmed that we are well positioned to withstand potential shocks.
For further details on our approach to the UK’s withdrawal from the EU, see ‘Areas of special interest’ on page 54.
Interest rate environment
Central banks have reduced interest rates in most financial markets due to the adverse impact on the timelines and the path for economic recovery from the Covid-19 outbreak, which in turn increased the likelihood of negative interest rates. This raises a number of risks and concerns, such as the readiness of our systems and processes to accommodate zero or negative rates, the resulting impacts on customers, regulatory constraints and the financial implications given the significant impact that prolonged low interest rates are likely to have on our net interest income.
For some products, we have floored deposit rates at zero or made decisions to not charge negative rates. This, alongside loans repriced at lower rates, results in our commercial margins being compressed, which is expected to be reflected in our profitability. The pricing of this risk will need to be carefully considered. If there is a rebalancing of portfolios towards fee-generating business and trading activities to offset reduced profits, we may become exposed once rates start rising again. These factors may challenge the long-term profitability of the banking sector, including HSBC, and will be considered as part of the Group’s transformation programme.
For further details on interest rate sensitivity, see page 90.
Top and emerging risks
Our top and emerging risks report identifies forward-looking risks so that they can be considered in determining whether any incremental action is needed to either prevent them from materialising or to limit their effect.
Top risks are those that may have a material impact on the financial results, reputation or business model of the Group in the year ahead. Emerging risks are those that have large unknown components and may form beyond a one-year horizon. If any of these risks were to occur, they could have a material effect on HSBC.
Our suite of top and emerging risks are subject to regular review by senior governance forums. In January 2020, our top and emerging risk themes were streamlined to interconnect appropriate thematic risk issues that impact our portfolios and business. The themes ‘geopolitical risk’, ‘the credit cycle’ and ‘economic outlook and capital flows’ were merged into a single theme under ‘geopolitical and macroeconomic risks’. We continue to monitor closely the identified risks and ensure robust management actions are in place, as required.
Update on Ibor transition
As a result of the likely cessation of the London interbank offered rate (‘Libor’) and the Euro Overnight Index Average (‘Eonia’) in 2021, we established an interbank offered rate (‘Ibor’) transition programme in early 2019 with the objective of facilitating an orderly transition from Libor and Eonia to new alternative benchmark rates (near risk free rates or ‘RFRs’) for our businesses and our customers.
In addition to conduct and execution risks, the process of adopting RFRs may expose the Group to an increased level of operational and financial risks, driven by large volumes of product, system and associated process changes and potential earnings volatility resulting from contract modifications. Furthermore, the transition to RFRs could adversely impact our businesses through legal proceedings or other actions relating to the interpretation and/or enforceability of provisions in existing Ibor-based contracts. The overall level of risks – including operational, conduct and legal risk – has potentially increased as a result of delays in our customers’ transition plans and in our interim milestones relating to client outreach resulting from the Covid-19 outbreak.
For further details on our approach to Ibor transition, see ‘Areas of special interest’ on page 54.
Our current top and emerging risks are summarised on the next page and discussed in more detail on page 76 of the Annual Report and Accounts 2019.
HSBC Holdings plc Interim Report 2020 | 23 |
| Risk | Trend | Mitigants |
| Externally driven | ||
Geopolitical and macroeconomic risks | ^ | We monitor developments in geopolitical risk and assess what impacts these may have on our portfolios. The Covid-19 outbreak has resulted in an unprecedented global economic slowdown, with a significant increase in credit stress in the portfolio. Across the Group, we increased the frequency and depth of the monitoring activities on the portfolios. We performed stress tests and other sectoral reviews to identify portfolios or customers who were experiencing, or were likely to experience, financial difficulty as a result of the Covid-19 outbreak. We are increasing resources to help address the increased level of credit defaults in the current environment and are monitoring the impact of prolonged low interest rates. |
| Cyber threat and unauthorised access to systems | > | We endeavour to protect HSBC and our customers by strengthening our cyber defences, helping us to execute our business priorities safely and keep our customers’ information secure. Our data-driven approach, grounded in strong controls that mitigate advanced cyber threats, enhances our capability in threat detection, access controls and resiliency. |
| Regulatory developments including conduct, with adverse impact on business model and profitability | ^ | We monitor closely for regulatory developments and engage with regulators, as appropriate, to help ensure that new regulatory requirements, such as those in response to the Covid-19 outbreak, are implemented effectively and in a timely way. |
| Financial crime risk environment | > | During the first half of 2020, we continued to improve the effectiveness of our financial crime controls in accordance with our specific regulatory obligations. The application of both advanced analytics and artificial intelligence remain key elements of our next generation of tools to fight financial crime, and our investment in these areas is ongoing. As fraudulent activity is often more prevalent in times of crisis, we have put in place additional measures to help minimise and detect fraud. |
| Ibor transition | ^ | We are focused on developing RFRs alongside the supporting processes and systems to make them available to our customers. Our programme is concurrently developing the capability to transition, through repapering, outstanding Libor and Eonia contracts. We continue to engage with industry participants and the official sector to support an orderly transition. |
Climate-related risks | ^ | We continue to improve how we identify, oversee and manage climate-related risk, both physical and transition. Our Board-approved risk appetite statement contains a qualitative statement, which will be further enhanced in 2020. Our risk management priorities are focusing on: assessing the physical and transition risk in our wholesale credit portfolio; reviewing retail mortgage exposures in respect of natural hazard risk; and developing scenarios internally for risk management, planning and stress testing. We continue to engage with our stakeholders, in particular with regard to how we compile related data and disclosures. |
| Internally driven | ||
| IT systems infrastructure and resilience | > | We actively monitor and improve service resilience across our technology infrastructure. We are enhancing our service management disciplines and change execution capabilities to minimise service disruption to our customers. Our IT systems have been resilient and we have further improved them to support both our customers and our people in new ways of operating during the Covid-19 outbreak. |
| Risks associated with workforce capability, capacity and environmental factors with potential impact on growth | ^ | We continue to monitor workforce capacity and capability requirements in line with our published growth strategy and any emerging issues in the markets in which we operate. We have also put in place measures to ensure that our people are properly supported and able to work safely during the Covid-19 outbreak. We are monitoring people risks that may arise due to business transformation to help ensure that we sensitively manage any redundancies and support impacted employees. |
| Risks arising from the receipt of services from third parties | > | We have set up a third-party risk management programme so we can better identify, understand, mitigate and manage the risks that arise from the outsourcing of services. The programme, due to conclude in the second half of 2020, aims to ensure adherence to our internal third-party risk policy and framework. We have worked closely with our third-party providers, which have faced constraints and enhanced oversight on their operations during the Covid-19 outbreak. There has been no major impact to our services during the period. |
| Enhanced model risk management expectations | ^ | We continue to strengthen our oversight of models and the second line of defence Model Risk Management function. We are embedding a new model risk policy across the Group, which includes updated controls around the monitoring and use of models. The impact of Covid-19 on model performance has highlighted the importance of the new policy, with several credit and risk models potentially requiring revisions to reflect the current extreme economic shocks and the various government support measures that are now in place. |
| Data management | > | We continue to enhance and advance our insights, data aggregation, reporting and decisions through ongoing improvement and investments in data governance, data quality, data privacy, data architecture, machine learning and artificial intelligence capabilities. We are continuing to work to modernise our data infrastructure, leveraging cloud technologies to increase flexibility and scalability and improve our fit-for-purpose data. |
^ Risk heightened during first half 2020
> Risk remained at the same level as 2019
| 24 | HSBC Holdings plc Interim Report 2020 |
| Financial summary | |
| Page | |
| Use of non-GAAP financial measures | |
| Adjusted performance | |
| Significant items | |
| Foreign currency translation differences | |
| Summary consolidated income statement | |
Income statement commentary | |
| Net interest income | |
| Summary consolidated balance sheet | |
Balance sheet commentary compared with 31 December 2019 | |
| Use of non-GAAP financial measures |
To measure our performance we also use non-GAAP financial measures, including those derived from our reported results that eliminate factors that distort period-on-period comparisons. The ‘adjusted performance’ measure used throughout this report is described below, and where others are used they are described. All non-GAAP financial measures are reconciled to the closest reported financial measure.
A change in reportable segments was made in 2Q20 by combining Global Private Banking and Retail Banking and Wealth Management to form Wealth and Personal Banking. Comparative data have been re-presented accordingly. The global business segmental results are presented on an adjusted basis in accordance with IFRS 8 ‘Operating Segments’ with the change in reportable segments explained in more detail in Note 5: ‘Segmental analysis’ on page 102.
Adjusted performance
Adjusted performance is computed by adjusting reported results for the effects of foreign currency translation differences and significant items, which both distort period-on-period comparisons.
We consider adjusted performance provides useful information for investors by aligning internal and external reporting, identifying and quantifying items management believes to be significant, and providing insight into how management assesses period-on-period performance.
Significant items
‘Significant items’ refers collectively to the items that management and investors would ordinarily identify and consider separately to improve the understanding of the underlying trends in the business.
The tables on pages 33 to 35 and pages 42 to 49 detail the effects of significant items on each of our global business segments, geographical regions and selected countries/territories in 1H20, 1H19 and 2H19.
Foreign currency translation differences
Foreign currency translation differences reflect the movements of the US dollar against most major currencies during 2020.
We exclude them to derive constant currency data, allowing us to assess balance sheet and income statement performance on a like-for-like basis and to better understand the underlying trends in the business.
Foreign currency translation differences Foreign currency translation differences for the half-year to 30 June 2020 are computed by retranslating into US dollars for non-US dollar branches, subsidiaries, joint ventures and associates: • the income statements for the half-years to 30 June 2019 and 31 December 2019 at the average rates of exchange for the half-year to 30 June 2020; and• the balance sheets at 30 June 2019 and 31 December 2019 at the prevailing rates of exchange on 30 June 2020.No adjustment has been made to the exchange rates used to translate foreign currency-denominated assets and liabilities into the functional currencies of any HSBC branches, subsidiaries, joint ventures or associates. The constant currency data of HSBC’s Argentina subsidiaries have not been adjusted further for the impacts of hyperinflation. When reference is made to foreign currency translation differences in tables or commentaries, comparative data reported in the functional currencies of HSBC’s operations have been translated at the appropriate exchange rates applied in the current period on the basis described above. |
HSBC Holdings plc Interim Report 2020 | 25 |
Financial summary
| Summary consolidated income statement |
| Half-year to | |||||||
| 30 Jun | 30 Jun | 31 Dec | |||||
| 2020 | 2019 | 2019 | |||||
| Footnotes | $m | $m | $m | ||||
| Net interest income | 14,509 | 15,240 | 15,222 | ||||
| Net fee income | 5,926 | 6,124 | 5,899 | ||||
| Net income from financial instruments held for trading or managed on a fair value basis | 5,768 | 5,331 | 4,900 | ||||
| Net income/(expense) from assets and liabilities of insurance businesses, including related derivatives, measured at fair value through profit or loss | (1,290 | ) | 2,196 | 1,282 | |||
| Change in fair value of designated debt and related derivatives | 1 | 197 | 88 | 2 | |||
| Changes in fair value of other financial instruments mandatorily measured at fair value through profit or loss | 80 | 457 | 355 | ||||
| Gains less losses from financial investments | 466 | 201 | 134 | ||||
| Net insurance premium income | 5,020 | 6,323 | 4,313 | ||||
| Other operating income | 471 | 2,072 | 885 | ||||
| Total operating income | 31,147 | 38,032 | 32,992 | ||||
| Net insurance claims and benefits paid and movement in liabilities to policyholders | (4,402 | ) | (8,660 | ) | (6,266 | ) | |
| Net operating income before change in expected credit losses and other credit impairment charges | 2 | 26,745 | 29,372 | 26,726 | |||
| Change in expected credit losses and other credit impairment charges | (6,858 | ) | (1,140 | ) | (1,616 | ) | |
| Net operating income | 19,887 | 28,232 | 25,110 | ||||
| Total operating expenses excluding impairment of goodwill and other intangible assets | (15,239 | ) | (17,125 | ) | (17,830 | ) | |
| Impairment of goodwill and other intangible assets | (1,288 | ) | (24 | ) | (7,370 | ) | |
| Operating profit/(loss) | 3,360 | 11,083 | (90 | ) | |||
| Share of profit in associates and joint ventures | 958 | 1,324 | 1,030 | ||||
| Profit before tax | 4,318 | 12,407 | 940 | ||||
| Tax expense | (1,193 | ) | (2,470 | ) | (2,169 | ) | |
| Profit/(loss) for the period | 3,125 | 9,937 | (1,229 | ) | |||
| Attributable to: | |||||||
| – ordinary shareholders of the parent company | 1,977 | 8,507 | (2,538 | ) | |||
| – preference shareholders of the parent company | 45 | 45 | 45 | ||||
| – other equity holders | 617 | 664 | 660 | ||||
| – non-controlling interests | 486 | 721 | 604 | ||||
| Profit/(loss) for the period | 3,125 | 9,937 | (1,229 | ) | |||
| $ | $ | $ | |||||
| Basic earnings per share | 0.10 | 0.42 | (0.13 | ) | |||
| Diluted earnings per share | 0.10 | 0.42 | (0.13 | ) | |||
| Dividend per ordinary share | 3 | — | 0.31 | 0.20 | |||
| % | % | % | |||||
| Post-tax return on average total assets (annualised) | 0.2 | 0.7 | (0.1 | ) | |||
| Return on average ordinary shareholders’ equity (annualised) | 2.4 | 10.4 | (3.0 | ) | |||
| Return on average tangible equity (annualised) | 4 | 3.8 | 11.2 | 8.4 | |||
| 1 | The debt instruments, issued for funding purposes, are designated under the fair value option to reduce an accounting mismatch. |
| 2 | Net operating income before change in expected credit losses and other credit impairment charges, also referred to as revenue. |
| 3 | Dividends recorded in the financial statements are dividends per ordinary share declared in a year and are not dividends in respect of, or for, that year. |
| 4 | Half-year to 31 December 2019 is calculated on a full-year basis and not a 2H19 basis. |
| Income statement commentary |
| 26 | HSBC Holdings plc Interim Report 2020 |
Net interest income
| Half-year to | Quarter to | ||||||||||
| 30 Jun | 30 Jun | 30 Jun | 31 March | 30 Jun | |||||||
| 2020 | 2019 | 2020 | 2020 | 2019 | |||||||
| Footnotes | $m | $m | $m | $m | $m | ||||||
| Interest income | 23,000 | 27,750 | 10,372 | 12,628 | 14,207 | ||||||
| Interest expense | (8,491 | ) | (12,510 | ) | (3,475 | ) | (5,016 | ) | (6,435 | ) | |
| Net interest income | 14,509 | 15,240 | 6,897 | 7,612 | 7,772 | ||||||
| Average interest-earning assets | 2,034,939 | 1,912,708 | 2,078,178.362 | 1,991,702 | 1,922,392 | ||||||
| % | % | % | % | % | |||||||
| Gross interest yield | 1 | 2.27 | 2.93 | 2.01 | 2.55 | 2.96 | |||||
| Less: cost of funds | 1 | (1.00 | ) | (1.55 | ) | (0.81 | ) | (1.19 | ) | (1.57 | ) |
| Net interest spread | 2 | 1.27 | 1.38 | 1.20 | 1.36 | 1.39 | |||||
| Net interest margin | 3 | 1.43 | 1.61 | 1.33 | 1.54 | 1.62 | |||||
| 1 | Gross interest yield is the average annualised interest rate earned on average interest-earning assets (‘AIEA’). Cost of funds is the average annualised interest cost as a percentage on average interest-bearing liabilities. |
| 2 | Net interest spread is the difference between the average annualised interest rate earned on AIEA, net of amortised premiums and loan fees, and the average annualised interest rate payable on average interest-bearing funds. |
| 3 | Net interest margin is net interest income expressed as an annualised percentage of AIEA. |
| Summary of interest income by type of asset | |||||||||||||||
| Half-year to | Full-year to | ||||||||||||||
| 30 Jun 2020 | 30 Jun 2019 | 31 Dec 2019 | |||||||||||||
| Average balance | Interest income | Yield | Average balance | Interest income | Yield | Average balance | Interest income | Yield | |||||||
| $m | $m | % | $m | $m | % | $m | $m | % | |||||||
| Short-term funds and loans and advances to banks | 255,559 | 760 | 0.60 | 217,474 | 1,285 | 1.19 | 212,920 | 2,411 | 1.13 | ||||||
| Loans and advances to customers | 1,041,931 | 15,978 | 3.08 | 1,011,928 | 17,833 | 3.55 | 1,021,554 | 35,578 | 3.48 | ||||||
| Reverse repurchase agreements – non-trading | 222,151 | 1,292 | 1.17 | 231,308 | 2,635 | 2.30 | 224,942 | 4,690 | 2.08 | ||||||
| Financial investments | 451,344 | 4,451 | 1.98 | 408,673 | 5,380 | 2.65 | 417,939 | 10,705 | 2.56 | ||||||
| Other interest-earning assets | 63,954 | 519 | 1.63 | 43,325 | 617 | 2.87 | 45,467 | 1,311 | 2.88 | ||||||
| Total interest-earning assets | 2,034,939 | 23,000 | 2.27 | 1,912,708 | 27,750 | 2.93 | 1,922,822 | 54,695 | 2.84 | ||||||
| Summary of interest expense by type of liability | ||||||||||||||||
| Half-year to | Full-year to | |||||||||||||||
| 30 Jun 2020 | 30 Jun 2019 | 31 Dec 2019 | ||||||||||||||
| Average balance | Interest expense | Cost | Average balance | Interest expense | Cost | Average balance | Interest expense | Cost | ||||||||
| Footnotes | $m | $m | % | $m | $m | % | $m | $m | % | |||||||
| Deposits by banks | 1 | 61,765 | 226 | 0.74 | 51,199 | 370 | 1.46 | 52,515 | 702 | 1.34 | ||||||
| Customer accounts | 2 | 1,203,640 | 4,069 | 0.68 | 1,138,196 | 5,637 | 1.00 | 1,149,483 | 11,238 | 0.98 | ||||||
| Repurchase agreements – non-trading | 139,498 | 754 | 1.09 | 170,342 | 2,320 | 2.75 | 160,850 | 4,023 | 2.50 | |||||||
| Debt securities in issue – non-trading | 223,255 | 2,720 | 2.45 | 205,192 | 3,361 | 3.30 | 211,229 | 6,522 | 3.09 | |||||||
| Other interest-bearing liabilities | 77,256 | 722 | 1.88 | 59,266 | 822 | 2.80 | 59,980 | 1,748 | 2.91 | |||||||
| Total interest-bearing liabilities | 1,705,414 | 8,491 | 1.00 | 1,624,195 | 12,510 | 1.55 | 1,634,057 | 24,233 | 1.48 | |||||||
| 1 | Including interest-bearing bank deposits only. |
| 2 | Including interest-bearing customer accounts only. |
Net interest income (‘NII’) for 1H20 was $14.5bn, a decrease of $0.7bn or 5% compared with 1H19. This reflected the lower average interest rates compared with 1H19, partly offset by interest income associated with the increase in average interest-earning assets (‘AIEA’) of $122bn or 6%.
Excluding the effects of foreign currency translation differences, NII decreased by $0.4bn or 3%.
NII for 2Q20 was $6.9bn, down 11% compared with the previous year, and 9% compared with the previous quarter. This was driven by the impact of lower rates, partly offset by higher NII from growth in liquid assets and term lending balances.
Net interest margin (‘NIM’) of 1.43% was 18 basis points (‘bps’) lower compared with 1H19 as the reduction in the yield on AIEA of 66bps was partly offset by the fall in funding cost of average interest-bearing liabilities of 55bps. The decrease in NIM in 1H20 included the adverse effects of foreign currency translation differences. Excluding this, NIM fell by 16bps.
NIM for 2Q20 was 1.33%, down 29bps compared with the previous year, and down 21bps from the previous quarter, predominantly driven by the impact of lower rates.
Interest income of $23bn in 1H20 decreased by $4.8bn or 17%, primarily due to the lower average interest rates compared with 1H19 as the yield on AIEA fell 66bps. This was partly offset by increased income from growth in loans and advances to customers of $30bn, as well as a rise in income from short-term funds and loans and advances to banks and financial investments of $81bn. The decrease in interest income included $0.8bn in relation to the adverse effects of foreign currency translation. Excluding this, interest income decreased by $4.0bn.
Interest income of $10.4bn in 2Q20 was down $3.8bn compared with the previous year, and down $2.3bn from the previous quarter. This was predominantly driven by the impact of lower rates, although partly offset by growth in short-term funds and loans and advances to banks, financial investments and term lending.
Interest expense of $8.5bn in 1H20 decreased by $4.0bn or 32% compared with 1H19. This mainly reflected the decrease in funding cost of 55bps, offset by higher interest expense from growth in interest-bearing customer accounts of $65bn.
HSBC Holdings plc Interim Report 2020 | 27 |
Financial summary
The decrease in interest expense included the favourable effects of foreign currency translation differences of $0.4bn. Excluding this, interest expense was $3.6bn lower.
Interest expense of $3.5bn in 2Q20 was down $2.9bn compared with the previous year, and down $1.5bn from the previous quarter. This was predominantly driven by the impact of lower rates, partly offset by growth in customer accounts.
Net fee income of $5.9bn was $0.2bn lower than in 1H19, and included adverse foreign currency translation differences of $0.1bn. The remaining reduction primarily reflected lower net fee income in WPB and CMB, partly offset by an increase in GBM.
In WPB, lower fee income reflected a reduction in income from credit cards, as customer spending activity fell across most markets, mainly in Hong Kong, Europe and MENA. Fee income from account services fell by $0.1bn due to lower customer activity and the change from fee-based to interest-based overdraft charges. These reductions were partly offset by higher fees from broking (up $0.1bn), primarily in Hong Kong as volatility resulted in increased customer activity, and by lower fee expenses as a result of reduced customer activity levels.
In CMB, trade-related fee income fell, reflecting the reduction in global trade activity, notably in Hong Kong and the UK. Income also fell in remittances, clearing fees and cards due to lower client activity.
In GBM, net fee income was higher, mainly from growth in underwriting fees in the US and the UK, as we helped clients raise finance during the Covid-19 outbreak. Global custody and broking fees also rose as client activity increased due to market volatility. These increases were partly offset by a reduction in fee income from credit facilities.
Net income from financial instruments held for trading or managed on a fair value basis of $5.8bn was $0.4bn higher and included a favourable fair value movement on non-qualifying hedges of $0.1bn.
The increase was in the US, mainly in our Rates business. Income also rose in Asia, notably in Hong Kong, reflecting increased market volatility and higher client activity in our Fixed Income and Foreign Exchange businesses.
Net income/(expense) from assets and liabilities of insurance businesses, including related derivatives, measured at fair value through profit or loss was a net expense of $1.3bn, compared with a net income of $2.2bn in 1H19. This decrease primarily reflected adverse equity market performance in Hong Kong and France due to the impact of the Covid-19 outbreak, resulting in revaluation losses on the equity and unit trust assets supporting insurance and investment contracts.
This adverse movement resulted in a corresponding movement in liabilities to policyholders and the present value of in-force long-term insurance business (‘PVIF’) (see ‘Other operating income’ below). This reflected the extent to which the policyholders and shareholders respectively participate in the investment performance of the associated assets.
Change in fair value of designated debt and related derivatives of $0.2bn was $0.1bn favourable compared with 1H19. The movements were driven by the fall in interest rates between the periods, notably in US dollars and pounds sterling.
The majority of our financial liabilities designated at fair value are fixed-rate, long-term debt issuances and are managed in conjunction with interest rate swaps as part of our interest rate management strategy. These liabilities are discussed further on page 31.
Changes in fair value of other financial instruments mandatorily measured at fair value through profit or loss of $0.1bn was $0.4bn lower compared with 1H19. This primarily reflected adverse movements in equity markets due to the impact of the Covid-19 outbreak.
Gains less losses from financial investments of $0.5bn increased by $0.3bn, reflecting higher gains from the disposal of debt securities in Balance Sheet Management.
Net insurance premium income of $5.0bn was $1.3bn lower than in 1H19. The decrease reflected lower new business volumes, particularly in Hong Kong and France.
Other operating income of $0.5bn decreased by $1.6bn compared with 1H19, primarily reflecting the non-recurrence of an $0.8bn dilution gain in 1H19 following the merger of The Saudi British Bank (‘SABB’) with Alawwal bank in Saudi Arabia.
The change in PVIF was $0.5bn lower due to a decrease of $0.3bn in the value of new business written, primarily in Hong Kong in line with the adverse operating conditions. Assumption changes and experience variances decreased by $0.1bn, primarily in France.
The reduction also reflected the non-recurrence of 1H19 gains recognised in both Argentina, following the sale of a stake in the payment processing company Prisma Medios de Pago S.A., and in Mexico, associated with the launch of a merchant acquiring services joint venture with Global Payments Inc. In addition, we recognised revaluation losses on investment properties in Hong Kong in 1H20, compared with gains in 1H19.
Net insurance claims and benefits paid and movement in liabilities to policyholders was $4.3bn lower, primarily due to lower returns on financial assets supporting contracts where the policyholder is subject to part or all of the investment risk. New business volumes were also lower, particularly in Hong Kong and France, leading to lower amounts of policyholder liabilities being established at the point of sale.
Change in expected credit losses and other credit impairment charges (‘ECL’) of $6.9bn was $5.7bn higher compared with 1H19. ECL increased in all global businesses, mainly from charges relating to the global impact of the Covid-19 outbreak on the forward economic outlook.
The increase in ECL also reflected higher charges related to specific wholesale exposures, including a significant charge related to a corporate exposure in Singapore in CMB.
The estimated impact of the Covid-19 outbreak was incorporated in the ECL through additional scenario analysis, which considered differing severity and duration assumptions relating to the global pandemic. These included probability-weighted shocks to annual GDP and consequential impacts on unemployment and other economic variables, with differing economic recovery assumptions. Given the severity of the macroeconomic projections, and the complexities of the government measures, which have never been modelled, additional judgemental adjustments have been made to our provisions.
Applying a range of weightings to our ECL sensitivity analysis, as disclosed on pages 60 to 66, could result in an ECL charge in the range of $8bn to $13bn for 2020. This range is higher than at 1Q20, given the deterioration in consensus economic forecasts and actual loss experience during 2Q20, and reflects the current run-rate of stage 3 losses and our economic forecasts remaining broadly within the bounds of our Central and Downside consensus scenarios.
For further details on the calculation of ECL, including the measurement uncertainties and significant judgements applied to such calculations, the impact of alternative/additional scenarios and post model-adjustments, see pages 60 to 66.
There remains significant uncertainty over the ECL charge for the year given the ongoing impact of the Covid-19 outbreak, including further waves, the unwinding of government support schemes, geopolitical risks across a number of our markets including Hong Kong and the UK, and other factors discussed in ‘Areas of special interest’ on pages 50 to 54. As disclosed on page 62, under our alternative Downside scenario, the ECL charge would be higher than the stated range for the year.
| 28 | HSBC Holdings plc Interim Report 2020 |
| Significant items and currency translation | |||||||
| Half-year to | |||||||
| 30 Jun | 30 Jun | 31 Dec | |||||
| 2020 | 2019 | 2019 | |||||
| Footnotes | $m | $m | $m | ||||
| Significant items | 1,585 | 957 | 8,524 | ||||
| – costs of structural reform | — | 91 | 67 | ||||
| – customer redress programmes | 50 | 610 | 671 | ||||
| – impairment of goodwill and other intangibles | 1,025 | — | 7,349 | ||||
| – restructuring and other related costs | 1 | 505 | 287 | 540 | |||
| – settlements and provisions in connection with legal and regulatory matters | 5 | (2 | ) | (59 | ) | ||
– currency translation on significant items | (29 | ) | (44 | ) | |||
| Currency translation | 453 | 228 | |||||
| Total | 1,585 | 1,410 | 8,752 | ||||
| 1 | Includes impairment of software intangible assets of $173m. |
| Staff numbers (full-time equivalents) | ||||||
| At | ||||||
| 30 Jun | 30 Jun1 | 31 Dec1 | ||||
| 2020 | 2019 | 2019 | ||||
| Global businesses | ||||||
| Wealth and Personal Banking | 140,040 | 142,951 | 141,341 | |||
| Commercial Banking | 44,506 | 45,203 | 44,706 | |||
| Global Banking and Markets | 47,811 | 49,052 | 48,859 | |||
| Corporate Centre | 407 | 479 | 445 | |||
| Total staff numbers | 232,764 | 237,685 | 235,351 | |||
| 1 | A change in reportable segments was made in 2Q20. Comparative data have been re-presented accordingly. For further guidance, refer to Note 5 on page 102. |
Operating expenses
Reported operating expenses of $16.5bn were $0.6bn or 4% lower than in 1H19. These included favourable foreign currency translation differences of $0.5bn and a net adverse movement in significant items of $0.6bn, which included:
| • | a $1.0bn impairment of capitalised software related principally to businesses within HSBC Bank plc, our non-ring-fenced bank in Europe. This reflected underperformance and a deterioration in the future forecasts of these businesses, substantially relating to prior periods (for more information see Note 11 on the interim condensed financial statements); and |
| • | restructuring and other related costs of $0.5bn compared with $0.3bn in 1H19. In 1H20, $116m related to severance, while $0.2bn related to an impairment of software intangibles. |
These were partly offset by:
| • | customer redress programme costs in respect of payment protection insurance (‘PPI’) of $0.1bn in 1H20, compared with $0.6bn in 1H19. |
The remaining reduction in operating expenses reflected a lower performance-related pay accrual (down $0.6bn), as well as a reduction in discretionary expenditure, including marketing (down $0.2bn) and travel costs (down $0.1bn). In addition, our cost-saving initiatives resulted in a reduction of $0.3bn.
These decreases were partly offset by an increase of $0.2bn in technology investments to enhance our digital capabilities and automate how we serve our customers.
The number of employees expressed in full-time equivalent staff (‘FTEs’) at 30 June 2020 was 232,764, a decrease of 2,587 from
31 December 2019. Additionally, the number of contractors at 30 June 2020 was 6,221, a decrease of 1,190 from
31 December 2019.
31 December 2019. Additionally, the number of contractors at 30 June 2020 was 6,221, a decrease of 1,190 from
31 December 2019.
Share of profit in associates and joint ventures
Share of profit in associates and joint ventures of $1.0bn was $0.4bn or 28% lower, primarily reflecting the impact of the Covid-19 outbreak and the lower interest rate environment on the share of profit we recognise from our associates.
At 30 June 2020, we performed impairment reviews of our investments in Bank of Communications Co., Limited (‘BoCom’) and SABB and concluded that they were not impaired, based on our value-in-use (‘VIU’) calculations. For more information on the key assumptions in our VIU calculations, including the sensitivity of the VIU to each key assumption, see Note 10 on the interim condensed financial statements.
Tax expense
The effective tax rate for 1H20 of 27.6% was higher than the 19.9% for 1H19, primarily reflecting the non-recognition of deferred tax on losses in the UK in 1H20. The effective tax rate for 1H19 was reduced by the non-taxable dilution gain arising on the merger of SABB with Alawwal Bank.
HSBC Holdings plc Interim Report 2020 | 29 |
Financial summary
| Summary consolidated balance sheet | |||||
| At | |||||
| 30 Jun | 31 Dec | ||||
| 2020 | 2019 | ||||
| Footnotes | $m | $m | |||
| Assets | |||||
| Cash and balances at central banks | 249,673 | 154,099 | |||
| Trading assets | 208,964 | 254,271 | |||
| Financial assets designated and otherwise mandatorily measured at fair value through profit or loss | 41,785 | 43,627 | |||
| Derivatives | 313,781 | 242,995 | |||
| Loans and advances to banks | 77,015 | 69,203 | |||
| Loans and advances to customers | 1 | 1,018,681 | 1,036,743 | ||
| Reverse repurchase agreements – non-trading | 226,345 | 240,862 | |||
| Financial investments | 494,109 | 443,312 | |||
| Other assets | 292,445 | 230,040 | |||
| Total assets | 2,922,798 | 2,715,152 | |||
| Liabilities and equity | |||||
| Liabilities | |||||
| Deposits by banks | 82,715 | 59,022 | |||
| Customer accounts | 1,532,380 | 1,439,115 | |||
| Repurchase agreements – non-trading | 112,799 | 140,344 | |||
| Trading liabilities | 79,612 | 83,170 | |||
| Financial liabilities designated at fair value | 156,608 | 164,466 | |||
| Derivatives | 303,059 | 239,497 | |||
| Debt securities in issue | 110,114 | 104,555 | |||
| Liabilities under insurance contracts | 98,832 | 97,439 | |||
| Other liabilities | 251,458 | 194,876 | |||
| Total liabilities | 2,727,577 | 2,522,484 | |||
| Equity | |||||
| Total shareholders’ equity | 187,036 | 183,955 | |||
| Non-controlling interests | 8,185 | 8,713 | |||
| Total equity | 195,221 | 192,668 | |||
| Total liabilities and equity | 2,922,798 | 2,715,152 | |||
| 1 | Net of impairment allowances. |
| Selected financial information | ||||
| At | ||||
| 30 Jun | 31 Dec | |||
| 2020 | 2019 | |||
| Footnotes | $m | $m | ||
| Called up share capital | 10,346 | 10,319 | ||
| Capital resources | 1 | 177,242 | 172,150 | |
| Undated subordinated loan capital | 1,968 | 1,968 | ||
| Preferred securities and dated subordinated loan capital | 2 | 31,706 | 33,063 | |
| Risk-weighted assets | 854,552 | 843,395 | ||
| Total shareholders' equity | 187,036 | 183,955 | ||
| Less: preference shares and other equity instruments | (22,319) | (22,276) | ||
| Total ordinary shareholders’ equity | 164,717 | 161,679 | ||
| Less: goodwill and intangible assets (net of tax) | (16,838) | (17,535) | ||
| Tangible ordinary shareholders' equity | 147,879 | 144,144 | ||
| Financial statistics | ||||
| Loans and advances to customers as a percentage of customer accounts | 66.5% | 72.0% | ||
| Average total shareholders’ equity to average total assets | 6.51% | 6.97% | ||
Net asset value per ordinary share at period end ($) | 3 | 8.17 | 8.00 | |
| Tangible net asset value per ordinary share at period end ($) | 7.34 | 7.13 | ||
| Tangible net asset value per fully diluted ordinary share at period end ($) | 7.32 | 7.11 | ||
| Number of $0.50 ordinary shares in issue (millions) | 20,691 | 20,639 | ||
| Basic number of $0.50 ordinary shares outstanding (millions) | 20,162 | 20,206 | ||
| Basic number of $0.50 ordinary shares outstanding and dilutive potential ordinary shares (millions) | 20,198 | 20,280 | ||
| Closing foreign exchange translation rates to $: | ||||
| $1: £ | 0.811 | 0.756 | ||
| $1: € | 0.891 | 0.890 | ||
| 1 | Capital resources are regulatory capital, the calculation of which is set out on page 82. |
| 2 | Including perpetual preferred securities. |
| 3 | The definition of net asset value per ordinary share is total shareholders' equity, less non-cumulative preference shares and capital securities, divided by the number of ordinary shares in issue, excluding own shares held by the company, including those purchased and held in treasury. |
A more detailed consolidated balance sheet is contained in the interim condensed financial statements on page 96.
| 30 | HSBC Holdings plc Interim Report 2020 |
Balance sheet commentary compared with 31 December 2019
At 30 June 2020, our total assets were $2.9tn, an increase of $208bn or 8% on a reported basis, and $284bn or 11% on a constant currency basis.
The increase in total assets included growth in cash balances, financial investments and derivative assets, as well as higher settlement accounts and cash collateral due to the seasonal reduction at 31 December 2019 as clients settled trades prior to the year-end.
Our ratio of customer advances to customer accounts was 66%, down from 72% at 31 December 2019.
Assets
Cash and balances at central banks increased by $96bn or 62%, mainly in the UK, France and the US as a result of deposit inflows and as we redeployed our commercial surplus to cash to increase liquidity for our clients during the Covid-19 outbreak.
Trading assets decreased by $45bn or 18%, notably from a reduction in equity securities held, mainly in the UK and Hong Kong, and adverse mark-to-market movements as a result of unfavourable market conditions.
Derivative assets increased by $71bn or 29%, primarily in the UK, France and Hong Kong, reflecting favourable revaluation movements on interest rate contracts as interest rates fell in most major markets. Foreign exchange contracts also increased, amid a rise in currency volatility. The growth in derivative assets was consistent with the increase in derivative liabilities, as the underlying risk is broadly matched.
Loans and advances to customers decreased by $18bn on a reported basis compared with 31 December 2019. This included adverse foreign currency translation differences of $30bn. Excluding the effects of foreign currency translation differences, loans and advances to customers increased by $12bn or 1%.
The commentary below is on a constant currency basis.
In CMB, customer lending was $8bn higher, primarily in Europe (up $5bn) and North America (up $3bn). In GBM, lending was $3bn higher, mainly in Europe, North America and MENA, partly offset by Asia. The growth in both of these businesses occurred in the first quarter of 2020 and included the effect of clients drawing down on credit facilities and partially redeploying these funds into their customer accounts to increase cash balances during the initial stages of the Covid-19 outbreak. These balances subsequently reduced in the second quarter as a portion of these facilities were repaid.
In WPB, lending was broadly stable (up $1bn). Mortgages grew, notably in the UK (up $3bn) and Hong Kong (up $2bn), but this was mostly offset by a reduction in credit card balances, overdrafts and other personal lending as customer activity fell as a result of government measures to restrict the movement of populations following the outbreak of Covid-19.
Financial investments increased by $51bn or 11%, mainly as we increased our holdings of debt securities, mortgage-backed securities and treasury bills, as well as from valuation gains resulting from interest rate reductions in the UK, France and the US. Financial investments rose in Hong Kong as we increased our holdings of government-issued bonds and bills.
Other assets grew by $62bn or 27%, primarily due to an increase in settlement accounts and cash collateral in the US, the UK and Hong Kong from higher trading activity and derivative balances, compared with the seasonal reduction in December 2019.
Liabilities
Customer accounts increased by $93bn on a reported basis, and included adverse foreign currency translation differences of $39bn. Excluding this, customer accounts increased by $133bn or 9%.
The commentary below is on a constant currency basis.
Customer accounts increased in all our global businesses and regions, as corporate and personal customers consolidated their funds and redeployed them into cash. In WPB, customer account balances increased by $41bn with notable growth in the UK, Hong Kong and the US.
In GBM, customer accounts increased by $52bn, and in CMB, balances grew by $41bn. These increases included the impact of corporate clients drawing down on credit facilities, primarily in the first quarter, then partially redeploying the funds into their customer accounts to maintain liquidity, notably in the UK and US. In CMB, the increase was partly offset by a reduction in Hong Kong of $2.5bn due to a managed reduction in short-term time deposits in the first quarter, although balances increased in the second quarter.
Repurchase agreements – non-trading decreased by $28bn or 20%, primarily in Europe and the US due to higher balances eligible for netting, resulting in an overall balance reduction.
Derivative liabilities increased by $64bn or 27%, which is consistent with the increase in derivative assets, since the underlying risk is broadly matched.
Other liabilities increased by $57bn or 29%, mainly from an increase in settlement accounts and cash collateral in the US, the UK and Hong Kong due to higher seasonal trading activity compared with December 2019.
Equity
Total shareholders’ equity increased by $3.1bn or 2% compared with 31 December 2019, reflecting the effects of profits generated of $3.1bn combined with other comprehensive income (‘OCI’) of $1.0bn. OCI included fair value gains on liabilities related to changes in own credit risk of $2.4bn, fair value gains of debt instruments of $1.7bn and favourable remeasurement of defined benefit pension obligations of $1.2bn. These were partly offset by adverse foreign exchange differences of $4.6bn. In addition, coupon distributions on securities classified as equity and dividends paid by non-controlling interests were $1.2bn.
HSBC Holdings plc Interim Report 2020 | 31 |
Financial summary | Global businesses
| Customer accounts by country/territory | ||||
| At | ||||
| 30 Jun | 31 Dec | |||
| 2020 | 2019 | |||
| $m | $m | |||
| Europe | 562,505 | 528,718 | ||
| – UK | 437,735 | 419,642 | ||
| – France | 57,229 | 47,699 | ||
| – Germany | 23,757 | 19,361 | ||
| – Switzerland | 9,146 | 6,558 | ||
| – other | 34,638 | 35,458 | ||
| Asia | 723,072 | 697,358 | ||
| – Hong Kong | 514,381 | 499,955 | ||
| – Singapore | 53,417 | 48,569 | ||
| – mainland China | 47,557 | 48,323 | ||
| – Australia | 25,448 | 23,191 | ||
| – India | 18,047 | 14,935 | ||
| – Malaysia | 14,688 | 14,624 | ||
| – Taiwan | 14,720 | 14,668 | ||
| – Indonesia | 4,467 | 4,732 | ||
| – other | 30,347 | 28,361 | ||
| Middle East and North Africa (excluding Saudi Arabia) | 41,197 | 38,126 | ||
| – United Arab Emirates | 20,906 | 17,949 | ||
| – Egypt | 5,465 | 5,186 | ||
| – Turkey | 3,787 | 3,870 | ||
| – other | 11,039 | 11,121 | ||
| North America | 180,489 | 146,676 | ||
| – US | 120,236 | 90,834 | ||
| – Canada | 52,458 | 48,425 | ||
| – other | 7,795 | 7,417 | ||
| Latin America | 25,117 | 28,237 | ||
| – Mexico | 19,759 | 23,051 | ||
| – other | 5,358 | 5,186 | ||
| At end of period | 1,532,380 | 1,439,115 | ||
Risk-weighted assets
Risk-weighted assets (‘RWAs’) rose by $11.2bn during the first half of the year, including a reduction of $22.0bn due to foreign currency translation differences.The increase of $33.2bn in RWAs (excluding foreign currency translation differences) included the following movements:
| • | a $23.3bn asset size increase, of which $15.2bn arose from changes in credit and counterparty credit risk. This reflected a rise of $31.2bn in 1Q20, largely due to lending growth in GBM, CMB and WPB. During 2Q20, RWAs fell by $16.0bn as a result of repayments, maturities and management initiatives. The remaining $8.1bn increase stemmed from rises in market risk RWAs, mainly as a result of increased market volatility; |
| • | a $16.8bn increase in RWAs due to changes in asset quality, mainly in CMB and GBM. This included the impact of credit migration of $18.3bn, mostly in North America, Europe and Asia. The impact of credit migration was more pronounced during 2Q20, rising from $4.7bn in 1Q20 to $13.6bn; and |
| • | a $6.4bn fall in RWAs due to changes in methodology and policy. This included $11.1bn related to refined calculations by GBM and CMB, partly offset by RWA increases mainly as a result of changes in approach for our wholesale credit risk exposures. |
From a global business perspective, GBM increases from lending growth, credit migration and market risk volatility were broadly mitigated by reductions of $21.2bn as a result of management actions during 1H20. Increases in CMB were mainly from lending growth and credit migration, partly offset by management actions. The WPB increase primarily reflected lending growth.
In response to the Covid-19 outbreak, governments and regulators around the world have introduced a number of support measures. We are participating in market-wide schemes with $33.5bn of financing raised for wholesale clients in our major markets. We had $12.0bn of exposure (including undrawn commitments)
through government-guaranteed loan schemes attracting $2.7bn RWAs at 30 June 2020.
| Summary |
Basis of preparation The Group Chief Executive, supported by the rest of the GEC, is considered the Chief Operating Decision Maker (‘CODM’) for the purposes of identifying the Group’s reportable segments. Global business results are assessed by the CODM on the basis of adjusted performance, which removes the effects of significant items and currency translation from reported results. Therefore, we present these results on an adjusted basis. Adjusted performance information for 1H19 and 2H19 is presented on a constant basis as described on page 25. As required by IFRS 8, reconciliations of the total adjusted global business results to the Group’s reported results are presented on page 103. Effective from 2Q20, we made the following realignments within our internal reporting to the GEC and CODM: • We simplified our matrix organisational structure by combining Global Private Banking and Retail Banking and Wealth Management to form Wealth and Personal Banking (‘WPB’).• We reallocated our reporting of Balance Sheet Management, hyperinflation accounting in Argentina and Holdings net interest expense from Corporate Centre to the global businesses.Comparative data have been re-presented accordingly. Supplementary reconciliations from reported to adjusted results by global business are presented on pages 33 to 35 for information purposes. Global business performance is also assessed using return on tangible equity (‘RoTE’), excluding significant items and the UK bank levy. A reconciliation of global business RoTE, excluding significant items and the UK bank levy, to the Group’s RoTE is provided in the Reconciliations of Non-GAAP Financial Measures 30 June 2020. Our operations are closely integrated and, accordingly, the presentation of data includes internal allocations of certain items of income and expense. These allocations include the costs of certain support services and global functions to the extent that they can be meaningfully attributed to global businesses and geographical regions. While such allocations have been made on a systematic and consistent basis, they necessarily involve a degree of subjectivity. Costs that are not allocated to global businesses are included in Corporate Centre. Where relevant, income and expense amounts presented include the results of inter-segment funding along with inter-company and inter-business line transactions. All such transactions are undertaken on arm’s length terms. The intra-Group elimination items for the global businesses are presented in Corporate Centre. The expense of the UK bank levy is included in the Europe geographical region as HSBC regards the levy as a cost of being headquartered in the UK. For the purposes of the presentation by global business, the cost of the levy is included in Corporate Centre. The results of geographical regions are presented on a reported basis. Geographical information is classified by the location of the principal operations of the subsidiary or, for The Hongkong and Shanghai Banking Corporation Limited, HSBC Bank plc, HSBC UK Bank plc, HSBC Bank Middle East Limited and HSBC Bank USA, by the location of the branch responsible for reporting the results or providing funding. |
A description of the global businesses is provided in the Overview section, pages 14 to 20.
| 32 | HSBC Holdings plc Interim Report 2020 |
| Reconciliation of reported and adjusted items – global businesses |
| Half-year to 30 Jun 2020 | |||||||||||
| Wealth and Personal Banking | Commercial Banking | Global Banking and Markets | Corporate Centre | Total | |||||||
| Footnotes | $m | $m | $m | $m | $m | ||||||
| Revenue | 1 | ||||||||||
| Reported | 11,270 | 7,000 | 8,185 | 290 | 26,745 | ||||||
| Significant items | (19 | ) | — | (7 | ) | (242 | ) | (268 | ) | ||
| – customer redress programmes | (26 | ) | — | — | — | (26 | ) | ||||
| – disposals, acquisitions and investment in new businesses | 7 | — | — | 1 | 8 | ||||||
| – fair value movements on financial instruments | 2 | — | — | (65 | ) | (234 | ) | (299 | ) | ||
| – restructuring and other related costs | — | — | 58 | (9 | ) | 49 | |||||
| Adjusted | 11,251 | 7,000 | 8,178 | 48 | 26,477 | ||||||
| ECL | |||||||||||
| Reported | (2,202 | ) | (3,526 | ) | (1,118 | ) | (12 | ) | (6,858 | ) | |
| Adjusted | (2,202 | ) | (3,526 | ) | (1,118 | ) | (12 | ) | (6,858 | ) | |
| Operating expenses | |||||||||||
| Reported | (7,569 | ) | (3,397 | ) | (5,153 | ) | (408 | ) | (16,527 | ) | |
| Significant items | 223 | 107 | 641 | 614 | 1,585 | ||||||
| – customer redress programmes | 49 | 1 | — | — | 50 | ||||||
| – impairment of goodwill and other intangibles | 85 | 41 | 567 | 332 | 1,025 | ||||||
| – restructuring and other related costs | 3 | 89 | 65 | 72 | 279 | 505 | |||||
| – settlements and provisions in connection with legal and regulatory matters | — | — | 2 | 3 | 5 | ||||||
| Adjusted | (7,346 | ) | (3,290 | ) | (4,512 | ) | 206 | (14,942 | ) | ||
| Share of profit in associates and joint ventures | |||||||||||
| Reported | (8 | ) | — | — | 966 | 958 | |||||
| Adjusted | (8 | ) | — | — | 966 | 958 | |||||
| Profit before tax | |||||||||||
| Reported | 1,491 | 77 | 1,914 | 836 | 4,318 | ||||||
| Significant items | 204 | 107 | 634 | 372 | 1,317 | ||||||
| – revenue | (19 | ) | — | (7 | ) | (242 | ) | (268 | ) | ||
| – operating expenses | 223 | 107 | 641 | 614 | 1,585 | ||||||
| Adjusted | 1,695 | 184 | 2,548 | 1,208 | 5,635 | ||||||
| Loans and advances to customers (net) | |||||||||||
| Reported | 429,487 | 344,567 | 243,355 | 1,272 | 1,018,681 | ||||||
| Adjusted | 429,487 | 344,567 | 243,355 | 1,272 | 1,018,681 | ||||||
| Customer accounts | |||||||||||
| Reported | 775,870 | 418,263 | 337,573 | 674 | 1,532,380 | ||||||
| Adjusted | 775,870 | 418,263 | 337,573 | 674 | 1,532,380 | ||||||
| 1 | Net operating income before change in expected credit losses and other credit impairment charges, also referred to as revenue. |
| 2 | Includes fair value movements on non-qualifying hedges and debt valuation adjustments on derivatives. |
| 3 | Includes impairment of software intangible assets of $173m. |
HSBC Holdings plc Interim Report 2020 | 33 |
Global businesses
| Reconciliation of reported results to adjusted results – global businesses (continued) | |||||||||||
Half-year to 30 Jun 20194 | |||||||||||
| Wealth and Personal Banking | Commercial Banking | Global Banking and Markets | Corporate Centre | Total | |||||||
| Footnotes | $m | $m | $m | $m | $m | ||||||
| Revenue | 1 | ||||||||||
| Reported | 13,154 | 7,812 | 7,696 | 710 | 29,372 | ||||||
| Currency translation | (301 | ) | (169 | ) | (181 | ) | (30 | ) | (681 | ) | |
| Significant items | 8 | 4 | 75 | (963 | ) | (876 | ) | ||||
| – disposals, acquisitions and investment in new businesses | — | — | — | (827 | ) | (827 | ) | ||||
| – fair value movements on financial instruments | 2 | 7 | 4 | 77 | (138 | ) | (50 | ) | |||
| – currency translation on significant items | 1 | — | (2 | ) | 2 | 1 | |||||
| Adjusted | 12,861 | 7,647 | 7,590 | (283 | ) | 27,815 | |||||
| ECL | |||||||||||
| Reported | (561 | ) | (496 | ) | (98 | ) | 15 | (1,140 | ) | ||
| Currency translation | 34 | 18 | 1 | (1 | ) | 52 | |||||
| Adjusted | (527 | ) | (478 | ) | (97 | ) | 14 | (1,088 | ) | ||
| Operating expenses | |||||||||||
| Reported | (8,428 | ) | (3,368 | ) | (4,988 | ) | (365 | ) | (17,149 | ) | |
| Currency translation | 228 | 84 | 112 | 29 | 453 | ||||||
| Significant items | 649 | 26 | 118 | 164 | 957 | ||||||
– costs of structural reform | 3 | — | 3 | 29 | 59 | 91 | |||||
| – customer redress programmes | 615 | (1 | ) | (4 | ) | — | 610 | ||||
| – restructuring and other related costs | 57 | 24 | 96 | 110 | 287 | ||||||
| – settlements and provisions in connection with legal and regulatory matters | (1 | ) | — | — | (1 | ) | (2 | ) | |||
– currency translation on significant items | (22 | ) | — | (3 | ) | (4 | ) | (29 | ) | ||
| Adjusted | (7,551 | ) | (3,258 | ) | (4,758 | ) | (172 | ) | (15,739 | ) | |
| Share of profit in associates and joint ventures | |||||||||||
| Reported | 43 | — | — | 1,281 | 1,324 | ||||||
| Currency translation | (2 | ) | — | — | (37 | ) | (39 | ) | |||
| Adjusted | 41 | — | — | 1,244 | 1,285 | ||||||
| Profit before tax | |||||||||||
| Reported | 4,208 | 3,948 | 2,610 | 1,641 | 12,407 | ||||||
| Currency translation | (41 | ) | (67 | ) | (68 | ) | (39 | ) | (215 | ) | |
| Significant items | 657 | 30 | 193 | (799 | ) | 81 | |||||
| – revenue | 8 | 4 | 75 | (963 | ) | (876 | ) | ||||
| – operating expenses | 649 | 26 | 118 | 164 | 957 | ||||||
| Adjusted | 4,824 | 3,911 | 2,735 | 803 | 12,273 | ||||||
| Loans and advances to customers (net) | |||||||||||
| Reported | 421,987 | 347,437 | 250,999 | 1,209 | 1,021,632 | ||||||
| Currency translation | (7,376 | ) | (6,461 | ) | (4,790 | ) | (25 | ) | (18,652 | ) | |
| Adjusted | 414,611 | 340,976 | 246,209 | 1,184 | 1,002,980 | ||||||
| Customer accounts | |||||||||||
| Reported | 724,955 | 361,286 | 293,367 | 516 | 1,380,124 | ||||||
| Currency translation | (9,986 | ) | (6,480 | ) | (6,500 | ) | (11 | ) | (22,977 | ) | |
| Adjusted | 714,969 | 354,806 | 286,867 | 505 | 1,357,147 | ||||||
| 1 | Net operating income before change in expected credit losses and other credit impairment charges, also referred to as revenue. |
| 2 | Includes fair value movements on non-qualifying hedges and debt valuation adjustments on derivatives. |
| 3 | Comprises costs associated with preparations for the UK’s exit from the European Union. |
| 4 | A change in reportable segments was made in 2Q20. Comparative data have been re-presented accordingly. For further guidance, refer to Note 5 on page 102. |
| 34 | HSBC Holdings plc Interim Report 2020 |
| Reconciliation of reported results to adjusted results – global businesses (continued) | |||||||||||
Half-year to 31 Dec 20194 | |||||||||||
| Wealth and Personal Banking | Commercial Banking | Global Banking and Markets | Corporate Centre | Total | |||||||
| Footnotes | $m | $m | $m | $m | $m | ||||||
| Revenue | 1 | ||||||||||
| Reported | 12,398 | 7,444 | 7,198 | (314 | ) | 26,726 | |||||
| Currency translation | (116 | ) | (72 | ) | (90 | ) | (3 | ) | (281 | ) | |
| Significant items | 210 | 7 | 5 | (35 | ) | 187 | |||||
| – customer redress programmes | 155 | 7 | — | 1 | 163 | ||||||
| – disposals, acquisitions and investment in new businesses | 52 | — | — | 7 | 59 | ||||||
| – fair value movements on financial instruments | 2 | — | — | 7 | (41 | ) | (34 | ) | |||
| – currency translation on significant items | 3 | — | (2 | ) | (2 | ) | (1 | ) | |||
| Adjusted | 12,492 | 7,379 | 7,113 | (352 | ) | 26,632 | |||||
| ECL | |||||||||||
| Reported | (876 | ) | (696 | ) | (64 | ) | 20 | (1,616 | ) | ||
| Currency translation | 47 | 12 | 3 | — | 62 | ||||||
| Adjusted | (829 | ) | (684 | ) | (61 | ) | 20 | (1,554 | ) | ||
| Operating expenses | |||||||||||
| Reported | (8,923 | ) | (6,537 | ) | (8,802 | ) | (938 | ) | (25,200 | ) | |
| Currency translation | 127 | 55 | 45 | 1 | 228 | ||||||
| Significant items | 1,111 | 2,984 | 4,101 | 328 | 8,524 | ||||||
| – costs of structural reform | 3 | — | 1 | 13 | 53 | 67 | |||||
| – customer redress programmes | 649 | 18 | 4 | — | 671 | ||||||
| – impairment of goodwill and other intangibles | 431 | 2,956 | 3,962 | — | 7,349 | ||||||
| – restructuring and other related costs | 123 | 27 | 121 | 269 | 540 | ||||||
| – settlements and provisions in connection with legal and regulatory matters | (68 | ) | — | 2 | 7 | (59 | ) | ||||
| – currency translation on significant items | (24 | ) | (18 | ) | (1 | ) | (1 | ) | (44 | ) | |
| Adjusted | (7,685 | ) | (3,498 | ) | (4,656 | ) | (609 | ) | (16,448 | ) | |
| Share of profit in associates and joint ventures | |||||||||||
| Reported | 12 | — | — | 1,018 | 1,030 | ||||||
| Currency translation | (1 | ) | — | — | 1 | — | |||||
| Adjusted | 11 | — | — | 1,019 | 1,030 | ||||||
| Profit/(loss) before tax | |||||||||||
| Reported | 2,611 | 211 | (1,668 | ) | (214 | ) | 940 | ||||
| Currency translation | 57 | (5 | ) | (42 | ) | (1 | ) | 9 | |||
| Significant items | 1,321 | 2,991 | 4,106 | 293 | 8,711 | ||||||
| – revenue | 210 | 7 | 5 | (35 | ) | 187 | |||||
| – operating expenses | 1,111 | 2,984 | 4,101 | 328 | 8,524 | ||||||
| Adjusted | 3,989 | 3,197 | 2,396 | 78 | 9,660 | ||||||
| Loans and advances to customers (net) | |||||||||||
| Reported | 443,025 | 346,105 | 246,492 | 1,121 | 1,036,743 | ||||||
| Currency translation | (14,191 | ) | (9,760 | ) | (6,081 | ) | (50 | ) | (30,082 | ) | |
| Adjusted | 428,834 | 336,345 | 240,411 | 1,071 | 1,006,661 | ||||||
| Customer accounts | |||||||||||
| Reported | 753,769 | 388,723 | 295,880 | 743 | 1,439,115 | ||||||
| Currency translation | (18,468 | ) | (11,032 | ) | (9,926 | ) | (33 | ) | (39,459 | ) | |
| Adjusted | 735,301 | 377,691 | 285,954 | 710 | 1,399,656 | ||||||
| 1 | Net operating income before change in expected credit losses and other credit impairment charges, also referred to as revenue. |
| 2 | Includes fair value movements on non-qualifying hedges and debt valuation adjustments on derivatives. |
| 3 | Comprises costs associated with preparations for the UK’s exit from the European Union. |
| 4 | A change in reportable segments was made in 2Q20. Comparative data have been presented accordingly. For further guidance, refer to Note 5 on page 102. |
HSBC Holdings plc Interim Report 2020 | 35 |
Global businesses
| Reconciliation of reported and adjusted risk-weighted assets |
| At 30 Jun 2020 | ||||||||||
| Wealth and Personal Banking | Commercial Banking | Global Banking and Markets | Corporate Centre | Total | ||||||
| $bn | $bn | $bn | $bn | $bn | ||||||
| Risk-weighted assets | ||||||||||
| Reported | 161.8 | 330.9 | 277.6 | 84.3 | 854.6 | |||||
| Adjusted | 161.8 | 330.9 | 277.6 | 84.3 | 854.6 | |||||
| At 30 Jun 2019 | ||||||||||
| Risk-weighted assets | ||||||||||
| Reported | 164.2 | 339.2 | 304.0 | 78.6 | 886.0 | |||||
| Currency translation | (3.2 | ) | (7.3 | ) | (5.2 | ) | (0.5 | ) | (16.2 | ) |
| Disposals | — | — | — | (0.8 | ) | (0.8 | ) | |||
| – operations in Brazil | — | — | — | (0.8 | ) | (0.8 | ) | |||
| Adjusted | 161.0 | 331.9 | 298.8 | 77.3 | 869.0 | |||||
| At 31 Dec 2019 | ||||||||||
| Risk-weighted assets | ||||||||||
| Reported | 162.6 | 325.9 | 273.4 | 81.5 | 843.4 | |||||
| Currency translation | (4.8 | ) | (10.3 | ) | (6.3 | ) | (0.7 | ) | (22.1 | ) |
| Adjusted | 157.8 | 315.6 | 267.1 | 80.8 | 821.3 | |||||
| Supplementary tables for WPB |
WPB adjusted performance by business unit
A breakdown of WPB by business unit is presented below to reflect the basis of how the revenue performance of the business units is assessed and managed.
| WPB – summary (adjusted basis) | |||||||||||
Total WPB | Consists of | ||||||||||
Banking operations | Insurance manufacturing | Global Private Banking | Asset management | ||||||||
| Footnotes | $m | $m | $m | $m | $m | ||||||
| Half-year to 30 Jun 2020 | |||||||||||
| Net operating income before change in expected credit losses and other credit impairment charges | 1 | 11,251 | 9,211 | 623 | 921 | 496 | |||||
| – net interest income | 8,032 | 6,562 | 1,100 | 372 | (2 | ) | |||||
| – net fee income/(expense) | 2,691 | 2,065 | (277 | ) | 416 | 487 | |||||
| – other income | 528 | 584 | (200 | ) | 133 | 11 | |||||
| ECL | (2,202 | ) | (2,027 | ) | (122 | ) | (53 | ) | — | ||
| Net operating income | 9,049 | 7,184 | 501 | 868 | 496 | ||||||
| Total operating expenses | (7,346 | ) | (6,132 | ) | (197 | ) | (669 | ) | (348 | ) | |
| Operating profit | 1,703 | 1,052 | 304 | 199 | 148 | ||||||
| Share of profit in associates and joint ventures | (8 | ) | 3 | (11 | ) | — | — | ||||
| Profit before tax | 1,695 | 1,055 | 293 | 199 | 148 | ||||||
| Half-year to 30 Jun 2019 | |||||||||||
| Net operating income before change in expected credit losses and other credit impairment charges | 1 | 12,861 | 9,923 | 1,500 | 924 | 514 | |||||
| – net interest income | 8,525 | 7,039 | 1,049 | 441 | (4 | ) | |||||
| – net fee income/(expense) | 2,826 | 2,366 | (392 | ) | 375 | 477 | |||||
| – other income | 1,510 | 518 | 843 | 108 | 41 | ||||||
| ECL | (527 | ) | (507 | ) | (2 | ) | (18 | ) | — | ||
| Net operating income | 12,334 | 9,416 | 1,498 | 906 | 514 | ||||||
| Total operating expenses | (7,551 | ) | (6,249 | ) | (220 | ) | (709 | ) | (373 | ) | |
| Operating profit | 4,783 | 3,167 | 1,278 | 197 | 141 | ||||||
| Share of profit in associates and joint ventures | 41 | 6 | 35 | — | — | ||||||
| Profit before tax | 4,824 | 3,173 | 1,313 | 197 | 141 | ||||||
| 36 | HSBC Holdings plc Interim Report 2020 |
| WPB – summary (adjusted basis) (continued) | |||||||||||
Total WPB | Consists of | ||||||||||
Banking operations | Insurance manufacturing | Global Private Banking | Asset management | ||||||||
| Footnotes | $m | $m | $m | $m | $m | ||||||
| Half-year to 31 Dec 2019 | |||||||||||
| Net operating income before change in expected credit losses and other credit impairment charges | 1 | 12,492 | 9,945 | 1,123 | 927 | 497 | |||||
| – net interest income | 8,768 | 7,226 | 1,105 | 439 | (2 | ) | |||||
| – net fee income/(expense) | 2,750 | 2,188 | (319 | ) | 398 | 483 | |||||
| – other income | 974 | 531 | 337 | 90 | 16 | ||||||
| ECL | (829 | ) | (736 | ) | (90 | ) | (3 | ) | — | ||
| Net operating income | 11,663 | 9,209 | 1,033 | 924 | 497 | ||||||
| Total operating expenses | (7,685 | ) | (6,357 | ) | (247 | ) | (717 | ) | (364 | ) | |
| Operating profit | 3,978 | 2,852 | 786 | 207 | 133 | ||||||
| Share of profit in associates and joint ventures | 11 | 3 | 8 | — | — | ||||||
| Profit before tax | 3,989 | 2,855 | 794 | 207 | 133 | ||||||
| 1 | Net operating income before change in expected credit losses and other credit impairment charges, also referred to as revenue. WPB insurance manufacturing adjusted revenue of $623m (1H19: $1,500m, 2H19: $1,123m) was disclosed within the management view of adjusted revenue on page 14, as follows: Wealth Management $587m (1H19: $1,371m, 2H19: $1,078m) and Other $36m (1H19: $129m, 2H19: $45m). |
WPB insurance manufacturing adjusted results
The following table shows the results of our insurance manufacturing operations by income statement line item. It shows
the results of insurance manufacturing operations for WPB and for all global business segments in aggregate, and separately the insurance distribution income earned by HSBC bank channels.
Adjusted results1 of insurance manufacturing operations and insurance distribution income earned by HSBC bank channels2 | |||||||||||||
| Half-year to | |||||||||||||
| 30 Jun | 30 Jun | 31 Dec | |||||||||||
| 2020 | 2019 | 2019 | |||||||||||
| WPB | All global businesses | WPB | All global businesses | WPB | All global businesses | ||||||||
| Footnotes | $m | $m | $m | $m | $m | $m | |||||||
| Net interest income | 1,100 | 1,173 | 1,049 | 1,122 | 1,105 | 1,173 | |||||||
| Net fee income | (277 | ) | (301 | ) | (392 | ) | (413 | ) | (319 | ) | (323 | ) | |
| – fee income | 60 | 69 | 51 | 62 | 56 | 67 | |||||||
| – fee expense | (337 | ) | (370 | ) | (443 | ) | (475 | ) | (375 | ) | (390 | ) | |
| Net income from financial instruments held for trading or managed on a fair value basis | 22 | 22 | (80 | ) | (79 | ) | 10 | 15 | |||||
| Net income/(expense) from assets and liabilities of insurance businesses, including related derivatives, measured at fair value through profit or loss | (1,268 | ) | (1,286 | ) | 2,208 | 2,205 | 1,330 | 1,315 | |||||
| Gains less losses from financial investments | 4 | 4 | 3 | 3 | 2 | 2 | |||||||
| Net insurance premium income | 4,821 | 5,077 | 6,052 | 6,321 | 4,260 | 4,358 | |||||||
| Other operating income | 400 | 415 | 961 | 963 | 824 | 840 | |||||||
| Of which: PVIF | 434 | 449 | 889 | 916 | 828 | 846 | |||||||
| Total operating income | 4,802 | 5,104 | 9,801 | 10,122 | 7,212 | 7,380 | |||||||
| Net insurance claims and benefits paid and movement in liabilities to policyholders | (4,179 | ) | (4,426 | ) | (8,301 | ) | (8,578 | ) | (6,089 | ) | (6,218 | ) | |
| Net operating income before change in expected credit losses and other credit impairment charges | 3 | 623 | 678 | 1,500 | 1,544 | 1,123 | 1,162 | ||||||
| Change in expected credit losses and other credit impairment charges | (122 | ) | (135 | ) | (2 | ) | (2 | ) | (90 | ) | (98 | ) | |
| Net operating income | 501 | 543 | 1,498 | 1,542 | 1,033 | 1,064 | |||||||
| Total operating expenses | (197 | ) | (224 | ) | (220 | ) | (233 | ) | (247 | ) | (260 | ) | |
| Operating profit | 304 | 319 | 1,278 | 1,309 | 786 | 804 | |||||||
| Share of profit in associates and joint ventures | (11 | ) | (11 | ) | 35 | 35 | 8 | 8 | |||||
| Profit before tax of insurance manufacturing operations | 4 | 293 | 308 | 1,313 | 1,344 | 794 | 812 | ||||||
| Annualised new business premiums of insurance manufacturing operations | 1,199 | 1,241 | 1,943 | 2,006 | 1,372 | 1,388 | |||||||
| Insurance distribution income earned by HSBC bank channels | 394 | 445 | 513 | 576 | 425 | 457 | |||||||
| 1 | Adjusted results are derived by adjusting for period-on-period effects of foreign currency translation differences, and the effect of significant items that distort period-on-period comparisons. There are no significant items included within insurance manufacturing, and the impact of foreign currency translation on all global businesses profit before tax is 1H19: $3m adverse (reported: $1,347), 2H19: $24m favourable (reported: $788). |
| 2 | The results presented for insurance manufacturing operations are shown before elimination of inter-company transactions with HSBC non-insurance operations. |
| 3 | Net operating income before change in expected credit losses and other credit impairment charges, also referred to as revenue. |
| 4 | The effect on the insurance manufacturing operations of applying hyperinflation accounting in Argentina resulted in a reduction in adjusted revenue in 1H20 of $1m (1H19: reduction of $8m, 2H19: increase of $5m) and a reduction in profit before tax (‘PBT’) in 1H20 of $3m (1H19: reduction of $9m, 2H19: increase of $6m). These effects are recorded within ‘All global businesses’. |
HSBC Holdings plc Interim Report 2020 | 37 |
Global businesses
Insurance manufacturing
The following commentary, unless otherwise specified, relates to the ‘All global businesses’ results.
HSBC recognises the present value of long-term in-force insurance contracts and investment contracts with discretionary participation features (‘PVIF’) as an asset on the balance sheet. The overall balance sheet equity, including PVIF, is therefore a measure of the embedded value in the insurance manufacturing entities, and the movement in this embedded value in the period drives the overall income statement result.
Adjusted profit before tax of $0.3bn decreased by $1.0bn or 77% compared with 1H19.
Net operating income before change in expected credit losses and other credit impairment changes was $0.9bn or 56% lower than in 1H19. This reflected the following:
| • | ‘Net expense from assets and liabilities of insurance businesses, including related derivatives, measured at fair value through profit or loss’ of $1.3bn in 1H20 compared with a net income of $2.2bn in 1H19. This was primarily due to adverse equity market performances in Hong Kong, France and Singapore. This adverse movement resulted in a corresponding movement in liabilities to policyholders and PVIF (see ‘Other operating income’ below), reflecting the extent to which policyholders and shareholders respectively participate in the investment performance of the associated asset portfolios. |
| • | Net insurance premium income of $5.1bn was $1.2bn lower compared with 1H19. This was driven by lower new business volumes, particularly in Hong Kong and France. |
| • | Other operating income of $0.4bn decreased by $0.5bn compared with 1H19, mainly from adverse movements in PVIF. This reflected a decrease of $0.3bn in the value of new business written, primarily from Hong Kong in line with the lower business volumes. In addition, assumption changes and experience variances decreased by $0.1bn, primarily in France due to the effect of interest rate changes on the valuation of the liabilities under insurance contracts. |
| • | Net insurance claims and benefits paid and movement in liabilities to policyholders of $4.4bn were $4.2bn lower than 1H19. This was primarily due to lower returns on financial assets supporting contracts where the policyholder is subject to part or all of the investment risk and lower new business volumes in Hong Kong and France. |
| • | Change in expected credit losses and other credit impairment charges (‘ECL’) of $0.1bn was $0.1bn higher compared with 1H19, mainly from charges relating to the global impact of the Covid-19 outbreak on the forward economic outlook. The increase in ECL also reflected higher charges related to specific exposures, including a significant charge related to sovereign exposure in Argentina. |
Adjusted operating expenses of $0.2bn decreased by 2% compared with 1H19, reflecting cost-saving initiatives during the period.
Annualised new business premiums (‘ANP’) is used to assess new insurance premium generation by the business. It is calculated as 100% of annualised first year regular premiums and 10% of single premiums, before reinsurance ceded. Lower ANP during the period reflected a reduction in new business volumes, mainly in Hong Kong and France.
Insurance distribution income from HSBC channels included $271m (1H19: $376m; 2H19: $278m) on HSBC manufactured products, for which a corresponding fee expense is recognised within insurance manufacturing, and $174m (1H19: $200m; 2H19: $179m) on products manufactured by third-party providers. The WPB component of this distribution income was $228m (1H19: $323m; 2H19: $256m) from HSBC manufactured products and $166m (1H19: $190m; 2H19: $169m) from third-party products.
WPB: Client assets and funds under management
The following table shows the client assets and funds under management, including self-directed client investments and execution-only trades, across our WPB global business. Funds under management represents assets managed, either actively or passively, on behalf of our customers.
WPB – reported client assets and funds under management1 | ||||||
| Half-year to | ||||||
| 30 Jun | 30 Jun | 31 Dec | ||||
| 2020 | 2019 | 2019 | ||||
| $bn | $bn | $bn | ||||
| Global Private Banking client assets | 353 | 341 | 361 | |||
| – managed by Global Asset Management | 62 | 57 | 61 | |||
| – external managers, direct securities and other | 291 | 284 | 300 | |||
| Retail Wealth balances | 357 | 370 | 380 | |||
| – managed by Global Asset Management | 196 | 189 | 199 | |||
| – external managers, direct securities and other | 161 | 181 | 181 | |||
| Asset Management third-party distribution | 263 | 249 | 247 | |||
| Closing balance | 973 | 960 | 988 | |||
| 1 | Client funds distributed and under management are not reported on the Group’s balance sheet, except where it is deemed that we are acting as principal rather than agent in our role as investment manager. |
WPB wealth balances
The following table shows the consolidated areas of focus across all WPB wealth balances.
| WPB wealth balances | ||||||
| Half-year to | ||||||
| 30 Jun | 30 Jun | 31 Dec | ||||
| 2020 | 2019 | 2019 | ||||
| $bn | $bn | $bn | ||||
Client assets and funds under management | 973 | 960 | 988 | |||
Premier and Jade deposits1 | 445 | 412 | 433 | |||
| Total | 1,418 | 1,372 | 1,421 | |||
| 1 | Premier and Jade deposits, which include Prestige deposits in Hang Seng Bank, form part of the total WPB customer accounts balance of $776bn on page 33 (30 June 2019: $725bn, 31 December 2019: $754bn). |
| 38 | HSBC Holdings plc Interim Report 2020 |
Asset Management: Funds under management
The following table shows the funds under management of our Asset Management business. Funds under management represents assets managed, either actively or passively, on behalf of our customers.
Asset Management – reported funds under management1 | ||||||
| Half-year to | ||||||
| 30 Jun | 30 Jun | 31 Dec | ||||
| 2020 | 2019 | 2019 | ||||
| $bn | $bn | $bn | ||||
| Opening balance | 506 | 444 | 495 | |||
| Net new money | 33 | 31 | (1 | ) | ||
| Value change | (9 | ) | 20 | 10 | ||
| Exchange and other | (9 | ) | – | 2 | ||
| Closing balance | 521 | 495 | 506 | |||
| Asset Management – reported funds under management by geography | ||||||
| At | ||||||
| 30 Jun | 30 Jun | 31 Dec | ||||
| 2020 | 2019 | 2019 | ||||
| $bn | $bn | $bn | ||||
| Europe | 292 | 271 | 287 | |||
| Asia | 160 | 178 | 161 | |||
| MENA | 5 | 2 | 6 | |||
| North America | 57 | 37 | 44 | |||
| Latin America | 7 | 7 | 8 | |||
| Closing balance | 521 | 495 | 506 | |||
| 1 | Funds under management are not reported on the Group’s balance sheet, except where it is deemed that we are acting as principal rather than agent in our role as investment manager. |
Global Private Banking client assets1
The following table shows the client assets of our Global Private Banking business.
| Global Private Banking – reported client assets | ||||||
| Half-year to | ||||||
| 30 Jun | 30 Jun | 31 Dec | ||||
| 2020 | 2019 | 2019 | ||||
| $bn | $bn | $bn | ||||
| Opening balance | 361 | 309 | 341 | |||
| Net new money | 5 | 14 | 9 | |||
| Value change | (16 | ) | 15 | 8 | ||
| Exchange and other | 3 | 3 | 3 | |||
| Closing balance | 353 | 341 | 361 | |||
| Global Private Banking – reported client assets by geography | ||||||
| At | ||||||
| 30 Jun | 30 Jun | 31 Dec | ||||
| 2020 | 2019 | 2019 | ||||
| $bn | $bn | $bn | ||||
| Europe | 161 | 160 | 171 | |||
| Asia | 154 | 143 | 151 | |||
| North America | 38 | 38 | 39 | |||
| Closing balance | 353 | 341 | 361 | |||
| 1 | ‘Client assets’ are translated at the rates of exchange applicable for their respective period-ends, with the effects of currency translation reported separately. |
HSBC Holdings plc Interim Report 2020 | 39 |
Geographical regions
| Geographical regions | |
| Page | |
| Analysis of reported results by geographical regions | |
| Reconciliation of reported and adjusted items – geographical regions | |
| Analysis by country/territory | |
| Analysis of reported results by geographical regions |
| HSBC reported profit/(loss) before tax and balance sheet data | |||||||||||||||
| Half-year to 30 Jun 2020 | |||||||||||||||
| Europe | Asia | MENA | North America | Latin America | Intra-HSBC items | Total | |||||||||
| Footnotes | $m | $m | $m | $m | $m | $m | $m | ||||||||
| Net interest income | 2,782 | 7,820 | 777 | 1,483 | 963 | 684 | 14,509 | ||||||||
| Net fee income | 1,747 | 2,692 | 347 | 910 | 230 | — | 5,926 | ||||||||
Net income from financial instruments held for trading or managed on a fair value basis | 2,090 | 2,630 | 211 | 630 | 370 | (163 | ) | 5,768 | |||||||
Net income from assets and liabilities of insurance businesses, including related derivatives, measured at fair value through profit and loss | (809 | ) | (512 | ) | — | — | 31 | — | (1,290 | ) | |||||
Changes in fair value of other financial instruments mandatorily measured at fair value through profit or loss | 563 | 22 | (5 | ) | (2 | ) | 21 | (519 | ) | 80 | |||||
| Other income/(expense) | 1 | 2,603 | 1,928 | 49 | 384 | (38 | ) | (3,174 | ) | 1,752 | |||||
| Net operating income before change in expected credit losses and other credit impairment charges | 2 | 8,976 | 14,580 | 1,379 | 3,405 | 1,577 | (3,172 | ) | 26,745 | ||||||
Change in expected credit losses and other credit impairment charges | (2,885 | ) | (1,818 | ) | (611 | ) | (887 | ) | (657 | ) | — | (6,858 | ) | ||
| Net operating income | 6,091 | 12,762 | 768 | 2,518 | 920 | (3,172 | ) | 19,887 | |||||||
| Total operating expenses excluding impairment of goodwill and other intangible assets | (7,933 | ) | (6,356 | ) | (722 | ) | (2,491 | ) | (909 | ) | 3,172 | (15,239 | ) | ||
| Impairment of goodwill and other intangible assets | (1,168 | ) | (74 | ) | (41 | ) | (4 | ) | (1 | ) | — | (1,288 | ) | ||
| Operating profit/(loss) | (3,010 | ) | 6,332 | 5 | 23 | 10 | — | 3,360 | |||||||
| Share of profit/(loss) in associates and joint ventures | (50 | ) | 1,037 | (31 | ) | — | 2 | — | 958 | ||||||
| Profit/(loss) before tax | (3,060 | ) | 7,369 | (26 | ) | 23 | 12 | — | 4,318 | ||||||
| % | % | % | % | % | % | ||||||||||
| Share of HSBC’s profit before tax | (70.9 | ) | 170.7 | (0.6 | ) | 0.5 | 0.3 | 100.0 | |||||||
| Cost efficiency ratio | 101.4 | 44.1 | 55.3 | 73.3 | 57.7 | 61.8 | |||||||||
| Balance sheet data | $m | $m | $m | $m | $m | $m | $m | ||||||||
| Loans and advances to customers (net) | 378,729 | 474,739 | 29,615 | 115,813 | 19,785 | — | 1,018,681 | ||||||||
| Total assets | 1,357,087 | 1,164,850 | 68,418 | 449,393 | 48,933 | (165,883 | ) | 2,922,798 | |||||||
| Customer accounts | 562,505 | 723,072 | 41,197 | 180,489 | 25,117 | — | 1,532,380 | ||||||||
| Risk-weighted assets | 3 | 278,500 | 374,684 | 58,585 | 130,580 | 33,278 | — | 854,552 | |||||||
| Half-year to 30 Jun 2019 | |||||||||||||||
| Net interest income | 3,309 | 8,182 | 897 | 1,685 | 1,076 | 91 | 15,240 | ||||||||
| Net fee income | 1,869 | 2,765 | 326 | 903 | 261 | — | 6,124 | ||||||||
Net income from financial instruments held for trading or managed on a fair value basis | 1,837 | 2,352 | 175 | 412 | 403 | 152 | 5,331 | ||||||||
Net expense from assets and liabilities of insurance businesses, including related derivatives, measured at fair value through profit and loss | 1,056 | 1,117 | — | — | 23 | — | 2,196 | ||||||||
Changes in fair value of other financial instruments mandatorily measured at fair value through profit or loss | 596 | 14 | 1 | 15 | 75 | (244 | ) | 457 | |||||||
| Other income | 1 | 585 | 1,029 | 844 | 350 | 62 | (2,846 | ) | 24 | ||||||
| Net operating income before change in expected credit losses and other credit impairment charges | 2 | 9,252 | 15,459 | 2,243 | 3,365 | 1,900 | (2,847 | ) | 29,372 | ||||||
| Change in expected credit losses and other credit impairment charges/(recoveries) | (536 | ) | (260 | ) | (49 | ) | (60 | ) | (235 | ) | — | (1,140 | ) | ||
| Net operating income | 8,716 | 15,199 | 2,194 | 3,305 | 1,665 | (2,847 | ) | 28,232 | |||||||
| Total operating expenses excluding impairment of goodwill and other intangible assets | (9,234 | ) | (6,480 | ) | (694 | ) | (2,557 | ) | (1,008 | ) | 2,847 | (17,126 | ) | ||
| Impairment of goodwill and other intangible assets | (10 | ) | (10 | ) | — | (2 | ) | (1 | ) | — | (23 | ) | |||
| Operating profit/(loss) | (528 | ) | 8,709 | 1,500 | 746 | 656 | — | 11,083 | |||||||
| Share of profit in associates and joint ventures | 8 | 1,071 | 236 | — | 9 | — | 1,324 | ||||||||
| Profit/(loss) before tax | (520 | ) | 9,780 | 1,736 | 746 | 665 | — | 12,407 | |||||||
| % | % | % | % | % | % | ||||||||||
| Share of HSBC’s profit before tax | (4.2 | ) | 78.8 | 14.0 | 6.0 | 5.4 | 100.0 | ||||||||
| Cost efficiency ratio | 99.9 | 42.0 | 30.9 | 76.0 | 53.1 | 58.4 | |||||||||
| Balance sheet data | $m | $m | $m | $m | $m | $m | $m | ||||||||
| Loans and advances to customers (net) | 383,363 | 473,627 | 28,509 | 112,693 | 23,440 | — | 1,021,632 | ||||||||
| Total assets | 1,235,615 | 1,101,387 | 61,771 | 436,742 | 53,919 | (138,161 | ) | 2,751,273 | |||||||
| Customer accounts | 504,386 | 677,289 | 36,593 | 135,400 | 26,456 | — | 1,380,124 | ||||||||
| Risk-weighted assets | 3 | 309,378 | 371,747 | 57,530 | 133,448 | 40,254 | — | 885,971 | |||||||
| 40 | HSBC Holdings plc Interim Report 2020 |
| HSBC reported profit/(loss) before tax and balance sheet data (continued) | |||||||||||||||
| Half-year to 31 Dec 2019 | |||||||||||||||
| Europe | Asia | MENA | North America | Latin America | Intra-HSBC/Global impairment | Total | |||||||||
| Footnotes | $m | $m | $m | $m | $m | $m | $m | ||||||||
| Net interest income | 2,292 | 8,425 | 884 | 1,556 | 985 | 1,080 | 15,222 | ||||||||
| Net fee income | 1,799 | 2,560 | 359 | 901 | 279 | 1 | 5,899 | ||||||||
Net income from financial instruments held for trading or managed on a fair value basis | 1,948 | 2,383 | 152 | 461 | 480 | (524 | ) | 4,900 | |||||||
Net income/(expense) from assets and liabilities of insurance businesses, including related derivatives, measured at fair value through profit and loss | 600 | 686 | — | — | (9 | ) | 5 | 1,282 | |||||||
Changes in fair value of other financial instruments mandatorily measured at fair value through profit or loss | 920 | 14 | — | 16 | (34 | ) | (561 | ) | 355 | ||||||
| Other income/(expense) | 1 | 1,245 | 892 | 72 | 288 | (85 | ) | (3,344 | ) | (932 | ) | ||||
| Net operating income before change in the expected credit losses and other credit impairment charges | 2 | 8,804 | 14,960 | 1,467 | 3,222 | 1,616 | (3,343 | ) | 26,726 | ||||||
| Change in expected credit losses and other credit impairment charges | (402 | ) | (464 | ) | (68 | ) | (177 | ) | (505 | ) | — | (1,616 | ) | ||
| Net operating income | 8,402 | 14,496 | 1,399 | 3,045 | 1,111 | (3,343 | ) | 25,110 | |||||||
| Total operating expenses excluding impairment of goodwill and other intangible assets | (9,976 | ) | (6,804 | ) | (758 | ) | (2,593 | ) | (1,042 | ) | 3,343 | (17,830 | ) | ||
| Impairment of goodwill and other intangible assets | (2,539 | ) | (3 | ) | (97 | ) | (431 | ) | (338 | ) | (3,962 | ) | (7,370 | ) | |
| Operating profit/(loss) | (4,113 | ) | 7,689 | 544 | 21 | (269 | ) | (3,962 | ) | (90 | ) | ||||
| Share of profit/(loss) in associates and joint ventures | (20 | ) | 999 | 47 | — | 4 | — | 1,030 | |||||||
| Profit/(loss) before tax | (4,133 | ) | 8,688 | 591 | 21 | (265 | ) | (3,962 | ) | 940 | |||||
| % | % | % | % | % | % | ||||||||||
| Share of HSBC’s profit before tax | (439.7 | ) | 924.3 | 62.9 | 2.2 | (28.2 | ) | 100.0 | |||||||
| Cost efficiency ratio | 142.2 | 45.5 | 58.3 | 93.9 | 85.4 | 94.3 | |||||||||
| Balance sheet data | $m | $m | $m | $m | $m | $m | $m | ||||||||
| Loans and advances to customers (net) | 393,850 | 477,727 | 28,556 | 113,474 | 23,136 | — | 1,036,743 | ||||||||
| Total assets | 1,248,205 | 1,102,805 | 65,369 | 377,095 | 52,879 | (131,201 | ) | 2,715,152 | |||||||
| Customer accounts | 528,718 | 697,358 | 38,126 | 146,676 | 28,237 | — | 1,439,115 | ||||||||
| Risk-weighted assets | 3 | 280,983 | 366,375 | 57,492 | 121,953 | 38,460 | — | 843,395 | |||||||
| 1 | Other income in this context comprises, where applicable, net income/expense from other financial instruments designated at fair value, gains less losses from financial investments, dividend income, net insurance premium income and other operating income less net insurance claims and benefits paid and movement in liabilities to policyholders. |
| 2 | Net operating income before change in expected credit losses and other credit impairment charges, also referred to as revenue. |
| 3 | Risk-weighted assets are non-additive across geographical regions due to market risk diversification effects within the Group. |
HSBC Holdings plc Interim Report 2020 | 41 |
Geographical regions
| Reconciliation of reported and adjusted items – geographical regions |
| Reconciliation of reported results to adjusted results – geographical regions and selected countries/territories | |||||||||||||
| Half-year to 30 Jun 2020 | |||||||||||||
| Europe | Asia | MENA | North America | Latin America | Total | ||||||||
| Footnotes | $m | $m | $m | $m | $m | $m | |||||||
| Revenue | 1 | ||||||||||||
| Reported | 2 | 8,976 | 14,580 | 1,379 | 3,405 | 1,577 | 26,745 | ||||||
| Significant items | (230 | ) | (34 | ) | (1 | ) | 6 | (9 | ) | (268 | ) | ||
| – customer redress programmes | (26 | ) | — | — | — | — | (26 | ) | |||||
| – disposals, acquisitions and investment in new businesses | — | — | — | 8 | — | 8 | |||||||
| – fair value movements on financial instruments | 3 | (252 | ) | (34 | ) | (1 | ) | (3 | ) | (9 | ) | (299 | ) |
| – restructuring and other related costs | 48 | — | — | 1 | — | 49 | |||||||
| Adjusted | 2 | 8,746 | 14,546 | 1,378 | 3,411 | 1,568 | 26,477 | ||||||
| ECL | |||||||||||||
| Reported | (2,885 | ) | (1,818 | ) | (611 | ) | (887 | ) | (657 | ) | (6,858 | ) | |
| Adjusted | (2,885 | ) | (1,818 | ) | (611 | ) | (887 | ) | (657 | ) | (6,858 | ) | |
| Operating expenses | |||||||||||||
| Reported | 2 | (9,101 | ) | (6,430 | ) | (763 | ) | (2,495 | ) | (910 | ) | (16,527 | ) |
| Significant items | 1,331 | 18 | 41 | 184 | 11 | 1,585 | |||||||
| – customer redress programmes | 50 | — | — | — | — | 50 | |||||||
| – impairment of goodwill and other intangibles | 984 | — | 41 | — | — | 1,025 | |||||||
| – restructuring and other related costs | 4 | 292 | 18 | — | 184 | 11 | 505 | ||||||
| – settlements and provisions in connection with legal and regulatory matters | 5 | — | — | — | — | 5 | |||||||
| Adjusted | 2 | (7,770 | ) | (6,412 | ) | (722 | ) | (2,311 | ) | (899 | ) | (14,942 | ) |
| Share of profit in associates and joint ventures | |||||||||||||
| Reported | (50 | ) | 1,037 | (31 | ) | — | 2 | 958 | |||||
| Adjusted | (50 | ) | 1,037 | (31 | ) | — | 2 | 958 | |||||
| Profit/(loss) before tax | |||||||||||||
| Reported | (3,060 | ) | 7,369 | (26 | ) | 23 | 12 | 4,318 | |||||
| Significant items | 1,101 | (16 | ) | 40 | 190 | 2 | 1,317 | ||||||
| – revenue | (230 | ) | (34 | ) | (1 | ) | 6 | (9 | ) | (268 | ) | ||
| – operating expenses | 1,331 | 18 | 41 | 184 | 11 | 1,585 | |||||||
| Adjusted | (1,959 | ) | 7,353 | 14 | 213 | 14 | 5,635 | ||||||
| Loans and advances to customers (net) | |||||||||||||
| Reported | 378,729 | 474,739 | 29,615 | 115,813 | 19,785 | 1,018,681 | |||||||
| Adjusted | 378,729 | 474,739 | 29,615 | 115,813 | 19,785 | 1,018,681 | |||||||
| Customer accounts | |||||||||||||
| Reported | 562,505 | 723,072 | 41,197 | 180,489 | 25,117 | 1,532,380 | |||||||
| Adjusted | 562,505 | 723,072 | 41,197 | 180,489 | 25,117 | 1,532,380 | |||||||
| 1 | Net operating income before change in expected credit losses and other credit impairment charges, also referred to as revenue. |
| 2 | Amounts are non-additive across geographical regions due to inter-company transactions within the Group. |
| 3 | Includes fair value movements on non-qualifying hedges and debt valuation adjustments on derivatives. |
| 4 | Includes impairment of software intangible assets of $173m. |
| 42 | HSBC Holdings plc Interim Report 2020 |
| Reconciliation of reported results to adjusted results – geographical regions and selected countries/territories (continued) | |||||||||||
| Half-year to 30 Jun 2020 | |||||||||||
| UK | Hong Kong | Mainland China | US | Mexico | |||||||
| Footnotes | $m | $m | $m | $m | $m | ||||||
| Revenue | 1 | ||||||||||
| Reported | 6,329 | 9,075 | 1,576 | 2,492 | 1,139 | ||||||
| Significant items | (222 | ) | (16 | ) | — | 6 | (6 | ) | |||
| – customer redress programmes | (26 | ) | — | — | — | — | |||||
| – disposals, acquisitions and investment in new businesses | — | — | — | 8 | — | ||||||
| – fair value movement on financial instruments | 2 | (243 | ) | (16 | ) | — | (3 | ) | (6 | ) | |
| – restructuring and other related costs | 47 | — | — | 1 | — | ||||||
| Adjusted | 6,107 | 9,059 | 1,576 | 2,498 | 1,133 | ||||||
| ECL | |||||||||||
| Reported | (2,492 | ) | (516 | ) | (107 | ) | (615 | ) | (574 | ) | |
| Adjusted | (2,492 | ) | (516 | ) | (107 | ) | (615 | ) | (574 | ) | |
| Operating expenses | |||||||||||
| Reported | (7,210 | ) | (3,460 | ) | (1,016 | ) | (1,957 | ) | (647 | ) | |
| Significant items | 995 | 10 | 1 | 177 | 2 | ||||||
| – customer redress programmes | 50 | — | — | — | — | ||||||
| – impairment of goodwill and other intangibles | 842 | — | — | — | — | ||||||
| – restructuring and other related costs | 98 | 10 | 1 | 177 | 2 | ||||||
| – settlements and provisions in connection with legal and regulatory matters | 5 | — | — | — | — | ||||||
| Adjusted | (6,215 | ) | (3,450 | ) | (1,015 | ) | (1,780 | ) | (645 | ) | |
| Share of profit in associates and joint ventures | |||||||||||
| Reported | (49 | ) | (7 | ) | 1,044 | — | 2 | ||||
| Adjusted | (49 | ) | (7 | ) | 1,044 | — | 2 | ||||
| Profit/(loss) before tax | |||||||||||
| Reported | (3,422 | ) | 5,092 | 1,497 | (80 | ) | (80 | ) | |||
| Significant items | 773 | (6 | ) | 1 | 183 | (4 | ) | ||||
| – revenue | (222 | ) | (16 | ) | — | 6 | (6 | ) | |||
| – operating expenses | 995 | 10 | 1 | 177 | 2 | ||||||
| Adjusted | (2,649 | ) | 5,086 | 1,498 | 103 | (84 | ) | ||||
| Loans and advances to customers (net) | |||||||||||
| Reported | 285,335 | 308,798 | 43,338 | 68,036 | 17,220 | ||||||
| Adjusted | 285,335 | 308,798 | 43,338 | 68,036 | 17,220 | ||||||
| Customer accounts | |||||||||||
| Reported | 437,735 | 514,381 | 47,557 | 120,236 | 19,759 | ||||||
| Adjusted | 437,735 | 514,381 | 47,557 | 120,236 | 19,759 | ||||||
| 1 | Net operating income before change in expected credit losses and other credit impairment charges, also referred to as revenue. |
| 2 | Includes fair value movements on non-qualifying hedges and debt valuation adjustments on derivatives. |
HSBC Holdings plc Interim Report 2020 | 43 |
Geographical regions
| Reconciliation of reported results to adjusted results – geographical regions and selected countries/territories (continued) | |||||||||||||
| Half-year to 30 Jun 2019 | |||||||||||||
| Europe | Asia | MENA | North America | Latin America | Total | ||||||||
| Footnotes | $m | $m | $m | $m | $m | $m | |||||||
| Revenue | 1 | ||||||||||||
| Reported | 2 | 9,252 | 15,459 | 2,243 | 3,365 | 1,900 | 29,372 | ||||||
| Currency translation | 2 | (246 | ) | (98 | ) | 3 | (19 | ) | (355 | ) | (681 | ) | |
| Significant items | (107 | ) | 40 | (827 | ) | 8 | 10 | (876 | ) | ||||
| – disposals, acquisitions and investment in new businesses | — | — | (828 | ) | — | 1 | (827 | ) | |||||
| – fair value movements on financial instruments | 3 | (107 | ) | 40 | — | 8 | 9 | (50 | ) | ||||
| – currency translation on significant items | — | — | 1 | — | — | 1 | |||||||
| Adjusted | 2 | 8,899 | 15,401 | 1,419 | 3,354 | 1,555 | 27,815 | ||||||
| ECL | |||||||||||||
| Reported | (536 | ) | (260 | ) | (49 | ) | (60 | ) | (235 | ) | (1,140 | ) | |
| Currency translation | 14 | 3 | (1 | ) | 1 | 35 | 52 | ||||||
| Adjusted | (522 | ) | (257 | ) | (50 | ) | (59 | ) | (200 | ) | (1,088 | ) | |
| Operating expenses | |||||||||||||
| Reported | 2 | (9,244 | ) | (6,490 | ) | (694 | ) | (2,559 | ) | (1,009 | ) | (17,149 | ) |
| Currency translation | 2 | 205 | 81 | 7 | 12 | 182 | 453 | ||||||
| Significant items | 861 | 46 | 5 | 35 | 10 | 957 | |||||||
| – costs of structural reform | 4 | 90 | 1 | — | — | — | 91 | ||||||
| – customer redress programmes | 610 | — | — | — | — | 610 | |||||||
| – restructuring and other related costs | 189 | 47 | 5 | 34 | 12 | 287 | |||||||
| – settlement and provisions in connection with legal and regulatory matters | (1 | ) | (1 | ) | — | — | — | (2 | ) | ||||
| – currency translation on significant items | (27 | ) | (1 | ) | — | 1 | (2 | ) | (29 | ) | |||
| Adjusted | 2 | (8,178 | ) | (6,363 | ) | (682 | ) | (2,512 | ) | (817 | ) | (15,739 | ) |
| Share of profit in associates and joint ventures | |||||||||||||
| Reported | 8 | 1,071 | 236 | — | 9 | 1,324 | |||||||
| Currency translation | — | (36 | ) | (1 | ) | — | (2 | ) | (39 | ) | |||
| Adjusted | 8 | 1,035 | 235 | — | 7 | 1,285 | |||||||
| Profit/(loss) before tax | |||||||||||||
| Reported | (520 | ) | 9,780 | 1,736 | 746 | 665 | 12,407 | ||||||
| Currency translation | (27 | ) | (50 | ) | 8 | (6 | ) | (140 | ) | (215 | ) | ||
| Significant items | 754 | 86 | (822 | ) | 43 | 20 | 81 | ||||||
| – revenue | (107 | ) | 40 | (827 | ) | 8 | 10 | (876 | ) | ||||
| – operating expenses | 861 | 46 | 5 | 35 | 10 | 957 | |||||||
| Adjusted | 207 | 9,816 | 922 | 783 | 545 | 12,273 | |||||||
| Loans and advances to customers (net) | |||||||||||||
| Reported | 383,363 | 473,627 | 28,509 | 112,693 | 23,440 | 1,021,632 | |||||||
| Currency translation | (10,207 | ) | (1,732 | ) | (376 | ) | (1,796 | ) | (4,541 | ) | (18,652 | ) | |
| Adjusted | 373,156 | 471,895 | 28,133 | 110,897 | 18,899 | 1,002,980 | |||||||
| Customer accounts | |||||||||||||
| Reported | 504,386 | 677,289 | 36,593 | 135,400 | 26,456 | 1,380,124 | |||||||
| Currency translation | (14,050 | ) | (1,028 | ) | (445 | ) | (1,912 | ) | (5,542 | ) | (22,977 | ) | |
| Adjusted | 490,336 | 676,261 | 36,148 | 133,488 | 20,914 | 1,357,147 | |||||||
| 1 | Net operating income before change in expected credit losses and other credit impairment charges, also referred to as revenue. |
| 2 | Amounts are non-additive across geographical regions due to inter-company transactions within the Group. |
| 3 | Includes fair value movements on non-qualifying hedges and debt valuation adjustments on derivatives. |
| 4 | Comprises costs associated with preparations for the UK’s exit from the European Union. |
| 44 | HSBC Holdings plc Interim Report 2020 |
| Reconciliation of reported results to adjusted results – geographical regions and selected countries/territories (continued) | |||||||||||
| Half-year to 30 Jun 2019 | |||||||||||
| UK | Hong Kong | Mainland China | US | Mexico | |||||||
| Footnotes | $m | $m | $m | $m | $m | ||||||
| Revenue | 1 | ||||||||||
| Reported | 6,758 | 9,935 | 1,598 | 2,398 | 1,271 | ||||||
| Currency translation | (195 | ) | 101 | (56 | ) | — | (137 | ) | |||
| Significant items | (110 | ) | 30 | 1 | 7 | 7 | |||||
| – fair value movements on financial instruments | 2 | (110 | ) | 29 | 1 | 7 | 7 | ||||
| – currency translation on significant items | — | 1 | — | — | — | ||||||
| Adjusted | 6,453 | 10,066 | 1,543 | 2,405 | 1,141 | ||||||
| ECL | |||||||||||
| Reported | (429 | ) | (134 | ) | (67 | ) | (36 | ) | (198 | ) | |
| Currency translation | 10 | (1 | ) | 2 | — | 22 | |||||
| Adjusted | (419 | ) | (135 | ) | (65 | ) | (36 | ) | (176 | ) | |
| Operating expenses | |||||||||||
| Reported | (7,590 | ) | (3,405 | ) | (1,038 | ) | (1,989 | ) | (686 | ) | |
| Currency translation | 170 | (33 | ) | 37 | — | 77 | |||||
| Significant items | 787 | 21 | 2 | 26 | 4 | ||||||
| – costs of structural reform | 3 | 59 | 1 | — | — | — | |||||
| – customer redress programmes | 610 | — | — | — | — | ||||||
| – restructuring and other related costs | 142 | 21 | 2 | 26 | 5 | ||||||
| – settlements and provisions in connection with legal and regulatory matters | (1 | ) | (1 | ) | — | — | — | ||||
| – currency translation on significant items | (23 | ) | — | — | — | (1 | ) | ||||
| Adjusted | (6,633 | ) | (3,417 | ) | (999 | ) | (1,963 | ) | (605 | ) | |
| Share of profit in associates and joint ventures | |||||||||||
| Reported | 8 | 23 | 1,031 | — | 9 | ||||||
| Currency translation | (1 | ) | 1 | (36 | ) | — | (2 | ) | |||
| Adjusted | 7 | 24 | 995 | — | 7 | ||||||
| Profit/(loss) before tax | |||||||||||
| Reported | (1,253 | ) | 6,419 | 1,524 | 373 | 396 | |||||
| Currency translation | (16 | ) | 68 | (53 | ) | — | (40 | ) | |||
| Significant items | 677 | 51 | 3 | 33 | 11 | ||||||
| – revenue | (110 | ) | 30 | 1 | 7 | 7 | |||||
| – operating expenses | 787 | 21 | 2 | 26 | 4 | ||||||
| Adjusted | (592 | ) | 6,538 | 1,474 | 406 | 367 | |||||
| Loans and advances to customers (net) | |||||||||||
| Reported | 291,955 | 304,431 | 42,657 | 67,039 | 20,135 | ||||||
| Currency translation | (8,952 | ) | 2,299 | (1,232 | ) | — | (3,455 | ) | |||
| Adjusted | 283,003 | 306,730 | 41,425 | 67,039 | 16,680 | ||||||
| Customer accounts | |||||||||||
| Reported | 398,857 | 487,948 | 45,409 | 82,260 | 20,437 | ||||||
| Currency translation | (12,228 | ) | 3,690 | (1,311 | ) | — | (3,501 | ) | |||
| Adjusted | 386,629 | 491,638 | 44,098 | 82,260 | 16,936 | ||||||
| 1 | Net operating income before change in expected credit losses and other credit impairment charges, also referred to as revenue. |
| 2 | Includes fair value movements on non-qualifying hedges and debt valuation adjustments on derivatives. |
| 3 | Comprises costs associated with preparations for the UK’s exit from the European Union. |
HSBC Holdings plc Interim Report 2020 | 45 |
Geographical regions
| Reconciliation of reported results to adjusted results – geographical regions and selected countries/territories (continued) | |||||||||||||
| Half-year to 31 Dec 2019 | |||||||||||||
| Europe | Asia | MENA | North America | Latin America | Total | ||||||||
| Footnotes | $m | $m | $m | $m | $m | $m | |||||||
| Revenue | 1 | ||||||||||||
| Reported | 2 | 8,804 | 14,960 | 1,467 | 3,222 | 1,616 | 26,726 | ||||||
| Currency translation | 2 | (31 | ) | (27 | ) | (11 | ) | (27 | ) | (206 | ) | (281 | ) |
| Significant items | 131 | (5 | ) | — | 60 | 1 | 187 | ||||||
| – customer redress programmes | 163 | — | — | — | — | 163 | |||||||
| – disposals, acquisitions and investment in new businesses | — | — | — | 59 | — | 59 | |||||||
| – fair value movements on financial instruments | 3 | (30 | ) | (5 | ) | — | 1 | — | (34 | ) | |||
| – currency translation on significant items | (2 | ) | — | — | — | 1 | (1 | ) | |||||
| Adjusted | 2 | 8,904 | 14,928 | 1,456 | 3,255 | 1,411 | 26,632 | ||||||
| ECL | |||||||||||||
| Reported | (402 | ) | (464 | ) | (68 | ) | (177 | ) | (505 | ) | (1,616 | ) | |
| Currency translation | (5 | ) | (1 | ) | 2 | 1 | 65 | 62 | |||||
| Adjusted | (407 | ) | (465 | ) | (66 | ) | (176 | ) | (440 | ) | (1,554 | ) | |
| Operating expenses | |||||||||||||
| Reported | 2, 5 | (12,515 | ) | (6,807 | ) | (855 | ) | (3,024 | ) | (1,380 | ) | (25,200 | ) |
| Currency translation | 2 | 56 | 36 | 10 | 15 | 132 | 228 | ||||||
| Significant items | 5 | 3,504 | 80 | 108 | 508 | 362 | 8,524 | ||||||
| – costs of structural reform | 4 | 64 | 3 | — | — | — | 67 | ||||||
| – customer redress programmes | 671 | — | — | — | — | 671 | |||||||
| – impairment of goodwill and other intangibles | 5 | 2,522 | — | 97 | 431 | 337 | 7,349 | ||||||
| – restructuring and other related costs | 349 | 76 | 10 | 79 | 26 | 540 | |||||||
| – settlements and provisions in connection with legal and regulatory matters | (59 | ) | — | — | — | — | (59 | ) | |||||
| – currency translation on significant items | (43 | ) | 1 | 1 | (2 | ) | (1 | ) | (44 | ) | |||
| Adjusted | 5 | (8,955 | ) | (6,691 | ) | (737 | ) | (2,501 | ) | (886 | ) | (16,448 | ) |
| Share of profit in associates and joint ventures | |||||||||||||
| Reported | (20 | ) | 999 | 47 | — | 4 | 1,030 | ||||||
| Currency translation | 2 | (1 | ) | — | — | (1 | ) | — | |||||
| Adjusted | (18 | ) | 998 | 47 | — | 3 | 1,030 | ||||||
| Profit/(loss) before tax | |||||||||||||
| Reported | 5 | (4,133 | ) | 8,688 | 591 | 21 | (265 | ) | 940 | ||||
| Currency translation | 22 | 7 | 1 | (11 | ) | (10 | ) | 9 | |||||
| Significant items | 5 | 3,635 | 75 | 108 | 568 | 363 | 8,711 | ||||||
| – revenue | 131 | (5 | ) | — | 60 | 1 | 187 | ||||||
| – operating expenses | 5 | 3,504 | 80 | 108 | 508 | 362 | 8,524 | ||||||
| Adjusted | (476 | ) | 8,770 | 700 | 578 | 88 | 9,660 | ||||||
| Loans and advances to customers (net) | |||||||||||||
| Reported | 393,850 | 477,727 | 28,556 | 113,474 | 23,136 | 1,036,743 | |||||||
| Currency translation | (20,562 | ) | (2,574 | ) | (398 | ) | (2,382 | ) | (4,166 | ) | (30,082 | ) | |
| Adjusted | 373,288 | 475,153 | 28,158 | 111,092 | 18,970 | 1,006,661 | |||||||
| Customer accounts | |||||||||||||
| Reported | 528,718 | 697,358 | 38,126 | 146,676 | 28,237 | 1,439,115 | |||||||
| Currency translation | (28,957 | ) | (2,505 | ) | (586 | ) | (2,417 | ) | (4,994 | ) | (39,459 | ) | |
| Adjusted | 499,761 | 694,853 | 37,540 | 144,259 | 23,243 | 1,399,656 | |||||||
| 1 | Net operating income before change in expected credit losses and other credit impairment charges, also referred to as revenue. |
| 2 | Amounts are non-additive across geographical regions due to inter-company transactions within the Group. |
| 3 | Includes fair value movements on non-qualifying hedges and debt valuation adjustments on derivatives. |
| 4 | Comprises costs associated with preparations for the UK’s exit from the European Union. |
| 5 | Amounts are non-additive across geographical regions due to goodwill impairment recognised on the Global Banking and Markets cash-generating unit, which is monitored on a global basis. |
| 46 | HSBC Holdings plc Interim Report 2020 |
| Reconciliation of reported results to adjusted results – geographical regions and selected countries/territories (continued) | |||||||||||
| Half-year to 31 Dec 2019 | |||||||||||
| UK | Hong Kong | Mainland China | US | Mexico | |||||||
| Footnotes | $m | $m | $m | $m | $m | ||||||
| Revenue | 1 | ||||||||||
| Reported | 6,780 | 9,477 | 1,503 | 2,240 | 1,284 | ||||||
| Currency translation | (16 | ) | 79 | (1 | ) | — | (130 | ) | |||
| Significant items | 134 | (3 | ) | — | 59 | — | |||||
| – customer redress programmes | 162 | — | — | — | — | ||||||
| – disposals, acquisitions and investment in new businesses | — | — | — | 59 | — | ||||||
| – fair value movements on financial instruments | 2 | (29 | ) | (3 | ) | — | — | 1 | |||
| – currency translation on significant items | 1 | — | — | — | (1 | ) | |||||
| Adjusted | 6,898 | 9,553 | 1,502 | 2,299 | 1,154 | ||||||
| ECL | |||||||||||
| Reported | (285 | ) | (325 | ) | (62 | ) | (134 | ) | (293 | ) | |
| Currency translation | (5 | ) | (3 | ) | — | — | 30 | ||||
| Adjusted | (290 | ) | (328 | ) | (62 | ) | (134 | ) | (263 | ) | |
| Operating expenses | |||||||||||
| Reported | (8,567 | ) | (3,530 | ) | (1,073 | ) | (2,044 | ) | (704 | ) | |
| Currency translation | (4 | ) | (28 | ) | 1 | — | 74 | ||||
| Significant items | 993 | 44 | 4 | 67 | 13 | ||||||
| – costs of structural reform | 3 | 42 | 3 | — | — | — | |||||
| – customer redress programmes | 671 | — | — | — | — | ||||||
| – restructuring and other related costs | 263 | 40 | 4 | 67 | 15 | ||||||
| – settlements and provisions in connection with legal and regulatory matters | 9 | — | — | — | — | ||||||
| – currency translation on significant items | 8 | 1 | — | — | (2 | ) | |||||
| Adjusted | (7,578 | ) | (3,514 | ) | (1,068 | ) | (1,977 | ) | (617 | ) | |
| Share of profit/(loss) in associates and joint ventures | |||||||||||
| Reported | (20 | ) | 8 | 985 | — | 4 | |||||
| Currency translation | 2 | — | — | — | (1 | ) | |||||
| Adjusted | (18 | ) | 8 | 985 | — | 3 | |||||
| Profit/(loss) before tax | |||||||||||
| Reported | (2,092 | ) | 5,630 | 1,353 | 62 | 291 | |||||
| Currency translation | (23 | ) | 48 | — | — | (27 | ) | ||||
| Significant items | 1,127 | 41 | 4 | 126 | 13 | ||||||
| – revenue | 134 | (3 | ) | — | 59 | — | |||||
| – operating expenses | 993 | 44 | 4 | 67 | 13 | ||||||
| Adjusted | (988 | ) | 5,719 | 1,357 | 188 | 277 | |||||
| Loans and advances to customers (net) | |||||||||||
| Reported | 303,041 | 306,964 | 42,380 | 63,588 | 20,426 | ||||||
| Currency translation | (20,400 | ) | 1,532 | (655 | ) | — | (3,795 | ) | |||
| Adjusted | 282,641 | 308,496 | 41,725 | 63,588 | 16,631 | ||||||
| Customer accounts | |||||||||||
| Reported | 419,642 | 499,955 | 48,323 | 90,834 | 23,051 | ||||||
| Currency translation | (28,249 | ) | 2,496 | (747 | ) | — | (4,282 | ) | |||
| Adjusted | 391,393 | 502,451 | 47,576 | 90,834 | 18,769 | ||||||
| 1 | Net operating income before change in expected credit losses and other credit impairment charges, also referred to as revenue. |
| 2 | Includes fair value movements on non-qualifying hedges and debt valuation adjustments on derivatives. |
| 3 | Comprises costs associated with preparations for the UK’s exit from the European Union. |
HSBC Holdings plc Interim Report 2020 | 47 |
Geographical regions
| Analysis by country/territory |
| Profit/(loss) before tax by priority growth market within global businesses | |||||||||||
| Wealth and Personal Banking | Commercial Banking | Global Banking and Markets | Corporate Centre | Total | |||||||
| Footnotes | $m | $m | $m | $m | $m | ||||||
| Europe | (898 | ) | (678 | ) | (1,298 | ) | (186 | ) | (3,060 | ) | |
| – UK | 1 | (536 | ) | (638 | ) | (1,243 | ) | (1,005 | ) | (3,422 | ) |
| of which: HSBC UK Bank plc (RFB) | (275 | ) | (242 | ) | 39 | (10 | ) | (488 | ) | ||
| of which: HSBC Bank plc (NRFB) | 44 | 1 | (858 | ) | (279 | ) | (1,092 | ) | |||
| of which: Holdings and other | (305 | ) | (397 | ) | (424 | ) | (716 | ) | (1,842 | ) | |
| – France | (343 | ) | (127 | ) | (207 | ) | (64 | ) | (741 | ) | |
| – Germany | 12 | (4 | ) | 109 | (9 | ) | 108 | ||||
| – Switzerland | (15 | ) | 3 | 1 | (1 | ) | (12 | ) | |||
| – other | (16 | ) | 88 | 42 | 893 | 1,007 | |||||
| Asia | 2,799 | 921 | 2,393 | 1,256 | 7,369 | ||||||
| – Hong Kong | 2,790 | 1,173 | 1,119 | 10 | 5,092 | ||||||
| – Australia | 32 | 35 | 78 | 1 | 146 | ||||||
| – India | 5 | 83 | 313 | 160 | 561 | ||||||
| – Indonesia | (11 | ) | (1 | ) | 81 | (8 | ) | 61 | |||
| – mainland China | (26 | ) | 190 | 232 | 1,101 | 1,497 | |||||
| – Malaysia | 1 | 12 | 82 | (6 | ) | 89 | |||||
| – Singapore | 3 | (682 | ) | 140 | (9 | ) | (548 | ) | |||
| – Taiwan | 12 | 12 | 58 | (1 | ) | 81 | |||||
| – other | (7 | ) | 99 | 290 | 8 | 390 | |||||
| Middle East and North Africa | (63 | ) | (122 | ) | 208 | (49 | ) | (26 | ) | ||
| – Egypt | 34 | 19 | 101 | 1 | 155 | ||||||
| – UAE | (40 | ) | (158 | ) | 23 | (23 | ) | (198 | ) | ||
| – Saudi Arabia | 5 | — | 14 | (32 | ) | (13 | ) | ||||
| – other | (62 | ) | 17 | 70 | 5 | 30 | |||||
| North America | (224 | ) | (62 | ) | 509 | (200 | ) | 23 | |||
| – US | (274 | ) | (89 | ) | 463 | (180 | ) | (80 | ) | ||
| – Canada | 32 | 25 | 34 | (22 | ) | 69 | |||||
| – other | 18 | 2 | 12 | 2 | 34 | ||||||
| Latin America | (123 | ) | 18 | 102 | 15 | 12 | |||||
| – Mexico | (67 | ) | (31 | ) | (5 | ) | 23 | (80 | ) | ||
| – other | (56 | ) | 49 | 107 | (8 | ) | 92 | ||||
| Half-year to 30 Jun 2020 | 1,491 | 77 | 1,914 | 836 | 4,318 | ||||||
Wealth and Personal Banking3 | Commercial Banking3 | Global Banking and Markets3 | Corporate Centre3 | Total | |||||||
| Europe | (339 | ) | 688 | (436 | ) | (433 | ) | (520 | ) | ||
| – UK | 1 | (401 | ) | 510 | (504 | ) | (858 | ) | (1,253 | ) | |
| of which: HSBC UK Bank plc (RFB) | (74 | ) | 845 | 35 | (6 | ) | 800 | ||||
| of which: HSBC Bank plc (NRFB) | 113 | 146 | (8 | ) | (281 | ) | (30 | ) | |||
| of which: Holdings and other | (440 | ) | (481 | ) | (531 | ) | (571 | ) | (2,023 | ) | |
| – France | 12 | 88 | (68 | ) | (27 | ) | 5 | ||||
| – Germany | 10 | 13 | 42 | (12 | ) | 53 | |||||
| – Switzerland | 5 | 2 | (2 | ) | 6 | 11 | |||||
| – other | 35 | 75 | 96 | 458 | 664 | ||||||
| Asia | 4,076 | 2,467 | 2,068 | 1,169 | 9,780 | ||||||
| – Hong Kong | 3,790 | 1,771 | 886 | (28 | ) | 6,419 | |||||
| – Australia | 58 | 60 | 99 | (14 | ) | 203 | |||||
| – India | 39 | 108 | 264 | 101 | 512 | ||||||
| – Indonesia | 6 | 31 | 67 | 25 | 129 | ||||||
| – mainland China | 3 | 181 | 235 | 1,105 | 1,524 | ||||||
| – Malaysia | 49 | 41 | 98 | (7 | ) | 181 | |||||
| – Singapore | 82 | 70 | 133 | (17 | ) | 268 | |||||
| – Taiwan | 27 | 15 | 51 | (3 | ) | 90 | |||||
| – other | 22 | 190 | 235 | 7 | 454 | ||||||
| Middle East and North Africa | 146 | 185 | 393 | 1,012 | 1,736 | ||||||
| – Egypt | 33 | 40 | 131 | 1 | 205 | ||||||
| – UAE | 86 | 46 | 120 | (48 | ) | 204 | |||||
| – Saudi Arabia | — | — | — | 1,063 | 1,063 | ||||||
| – other | 27 | 99 | 142 | (4 | ) | 264 | |||||
| North America | (10 | ) | 447 | 393 | (84 | ) | 746 | ||||
| – US | (73 | ) | 208 | 307 | (69 | ) | 373 | ||||
| – Canada | 29 | 219 | 66 | (14 | ) | 300 | |||||
| – other | 34 | 20 | 20 | (1 | ) | 73 | |||||
| Latin America | 335 | 161 | 192 | (23 | ) | 665 | |||||
| – Mexico | 190 | 113 | 104 | (11 | ) | 396 | |||||
| – other | 145 | 48 | 88 | (12 | ) | 269 | |||||
| Half-year to 30 Jun 2019 | 4,208 | 3,948 | 2,610 | 1,641 | 12,407 | ||||||
| 48 | HSBC Holdings plc Interim Report 2020 |
| Profit/(loss) before tax by priority growth market within global businesses (continued) | |||||||||||
Wealth and Personal Banking3 | Commercial Banking3 | Global Banking and Markets3 | Corporate Centre3 | Total | |||||||
| Footnotes | $m | $m | $m | $m | $m | ||||||
| Europe | (502 | ) | (2,012 | ) | (561 | ) | (1,058 | ) | (4,133 | ) | |
| – UK | 1 | (652 | ) | 394 | (713 | ) | (1,121 | ) | (2,092 | ) | |
| of which: HSBC UK Bank plc (RFB) | (257 | ) | 710 | 35 | 15 | 503 | |||||
| of which: HSBC Bank plc (NRFB) | 132 | 132 | (178 | ) | (186 | ) | (100 | ) | |||
| of which: Holdings and other | (527 | ) | (448 | ) | (570 | ) | (950 | ) | (2,495 | ) | |
| – France | 43 | 32 | 3 | (47 | ) | 31 | |||||
| – Germany | 8 | 33 | 53 | 14 | 108 | ||||||
| – Switzerland | 88 | 5 | (1 | ) | (12 | ) | 80 | ||||
| – other | 2 | 11 | (2,476 | ) | 97 | 108 | (2,260 | ) | |||
| Asia | 3,639 | 2,052 | 2,015 | 982 | 8,688 | ||||||
| – Hong Kong | 3,430 | 1,471 | 843 | (114 | ) | 5,630 | |||||
| – Australia | 72 | 67 | 100 | 2 | 241 | ||||||
| – India | 28 | 93 | 269 | 104 | 494 | ||||||
| – Indonesia | 14 | 24 | 60 | (11 | ) | 87 | |||||
| – mainland China | (76 | ) | 136 | 277 | 1,016 | 1,353 | |||||
| – Malaysia | 53 | 32 | 91 | (15 | ) | 161 | |||||
| – Singapore | 72 | 35 | 117 | (14 | ) | 210 | |||||
| – Taiwan | 16 | 10 | 46 | (1 | ) | 71 | |||||
| – other | 30 | 184 | 212 | 15 | 441 | ||||||
| Middle East and North Africa | 108 | 27 | 368 | 88 | 591 | ||||||
| – Egypt | 40 | 41 | 114 | 10 | 205 | ||||||
| – UAE | 53 | 48 | 126 | (6 | ) | 221 | |||||
| – Saudi Arabia | (3 | ) | — | 13 | 82 | 92 | |||||
| – other | 2 | 18 | (62 | ) | 115 | 2 | 73 | ||||
| North America | (563 | ) | 408 | 336 | (160 | ) | 21 | ||||
| – US | (204 | ) | 178 | 240 | (152 | ) | 62 | ||||
| – Canada | 41 | 208 | 77 | (8 | ) | 318 | |||||
| – other | 2 | (400 | ) | 22 | 19 | (359 | ) | ||||
| Latin America | (71 | ) | (264 | ) | 136 | (66 | ) | (265 | ) | ||
| – Mexico | 121 | 63 | 125 | (18 | ) | 291 | |||||
| – other | 2 | (192 | ) | (327 | ) | 11 | (48 | ) | (556 | ) | |
| GBM goodwill impairment | 2 | — | — | (3,962 | ) | — | (3,962 | ) | |||
| Half-year to 31 Dec 2019 | 2,611 | 211 | (1,668 | ) | (214 | ) | 940 | ||||
| 1 | UK includes results from the ultimate holding company, HSBC Holdings plc, and the separately incorporated group of service companies (‘ServCo Group’). |
| 2 | Includes the impact of goodwill impairment. As per Group accounting policy, HSBC’s cash-generating units are based on geographical regions subdivided by global business, except for Global Banking and Markets, for which goodwill is monitored on a global basis. |
| 3 | A change in reportable segments was made in 2Q20. Comparative data have been presented accordingly. For further guidance, refer to Note 5 on page 102. |
HSBC Holdings plc Interim Report 2020 | 49 |
Reconciliations of return on equity and return on tangible equity
| Reconciliations of return on equity and return on tangible equity |
| Return on Equity and Return on Tangible Equity | ||||||
| Half-year ended 30 Jun | Year ended 31 Dec | |||||
| 2020 | 2019 | 2019 | ||||
| $m | $m | $m | ||||
| Profit | ||||||
| Profit attributable to the ordinary shareholders of the parent company | 1,977 | 8,507 | 5,969 | |||
| Impairment of goodwill and other intangible assets (net of tax) | 1,154 | — | 7,349 | |||
| Increase in PVIF (net of tax) | (310 | ) | (638 | ) | (1,248 | ) |
| Profit attributable to the ordinary shareholders, excluding goodwill, other intangible assets impairment and PVIF | 2,821 | 7,869 | 12,070 | |||
| Significant items (net of tax), bank levy and other adjustments | 227 | (48 | ) | 2,251 | ||
Profit attributable to the ordinary shareholders, excluding goodwill impairment, PVIF, significant items and UK bank levy | 3,048 | 7,821 | 14,321 | |||
| Equity | ||||||
| Average ordinary shareholders’ equity | 165,325 | 165,258 | 165,421 | |||
| Effect of goodwill, PVIF and other intangibles (net of deferred tax) | (17,310 | ) | (22,943 | ) | (22,574 | ) |
| Average tangible equity | 148,015 | 142,315 | 142,847 | |||
| Fair value of own debt, DVA and other adjustments | (852 | ) | 1,140 | 1,032 | ||
Average tangible equity excluding fair value of own debt, DVA and other adjustments | 147,163 | 143,455 | 143,879 | |||
| % | % | % | ||||
| Ratio | ||||||
| Return on average ordinary shareholders’ equity (annualised) | 2.4 | 10.4 | 3.6 | |||
| Return on average tangible equity (annualised) | 3.8 | 11.2 | 8.4 | |||
| Return on average tangible equity excluding significant items and UK bank levy (annualised) | 4.2 | 11.0 | 10.0 | |||
| 50 | HSBC Holdings plc Interim Report 2020 |
| Return on tangible equity by global business | ||||||||||
| Half-year ended 30 Jun 2020 | ||||||||||
| Wealth and Personal Banking | Commercial Banking | Global Banking and Markets | Corporate Centre | Total | ||||||
| $m | $m | $m | $m | $m | ||||||
| Profit before tax | 1,491 | 77 | 1,914 | 836 | 4,318 | |||||
| Tax expense | (269 | ) | (147 | ) | (650 | ) | (127 | ) | (1,193 | ) |
| Profit after tax | 1,222 | (70 | ) | 1,264 | 709 | 3,125 | ||||
| Less attributable to: preference shareholders, other equity holders, non-controlling interests | (353 | ) | (330 | ) | (322 | ) | (143 | ) | (1,148 | ) |
| Profit attributable to ordinary shareholders of the parent company | 869 | (400 | ) | 942 | 566 | 1,977 | ||||
| Increase in PVIF (net of tax) | (299 | ) | (9 | ) | — | (2 | ) | (310 | ) | |
| Significant items (net of tax) and UK bank levy | 195 | 109 | 624 | 272 | 1,200 | |||||
| Other adjustments | 8 | (3 | ) | (4 | ) | 180 | 181 | |||
| Profit attributable to ordinary shareholders, excluding PVIF, significant items and UK bank levy | 773 | (303 | ) | 1,562 | 1,016 | 3,048 | ||||
| Average tangible shareholders’ equity excluding fair value of own debt, DVA and other adjustments | 25,865 | 37,233 | 40,865 | 43,200 | 147,163 | |||||
| RoTE excluding significant items and UK bank levy (annualised) (%) | 6.0 | (1.6) | 7.7 | 4.7 | 4.2 | |||||
| Half-year ended 30 Jun 2019 | ||||||||||
| Profit before tax | 4,208 | 3,948 | 2,610 | 1,641 | 12,407 | |||||
| Tax expense | (572 | ) | (723 | ) | (284 | ) | (891 | ) | (2,470 | ) |
| Profit after tax | 3,636 | 3,225 | 2,326 | 750 | 9,937 | |||||
| Less attributable to: preference shareholders, other equity holders, non-controlling interests | (620 | ) | (456 | ) | (445 | ) | 91 | (1,430 | ) | |
| Profit attributable to ordinary shareholders of the parent company | 3,016 | 2,769 | 1,881 | 841 | 8,507 | |||||
| Increase in PVIF (net of tax) | (610 | ) | (27 | ) | — | (1 | ) | (638 | ) | |
| Significant items (net of tax) and UK bank levy | 512 | 24 | 156 | (685 | ) | 7 | ||||
| Other adjustments | (8 | ) | 1 | (3 | ) | (45 | ) | (55 | ) | |
| Profit attributable to ordinary shareholders, excluding PVIF, significant items and bank levy | 2,910 | 2,767 | 2,034 | 110 | 7,821 | |||||
| Average tangible shareholders’ equity excluding fair value of own debt, DVA and other adjustments | 26,593 | 36,411 | 40,358 | 40,059 | 143,455 | |||||
| RoTE excluding significant items and UK bank levy (annualised) (%) | 22.1 | 15.3 | 10.2 | 0.6 | 11.0 | |||||
| Year ended 31 Dec 2019 | ||||||||||
| Profit before tax | 6,819 | 4,159 | 942 | 1,427 | 13,347 | |||||
| Tax expense | (720 | ) | (1,502 | ) | (460 | ) | (1,957 | ) | (4,639 | ) |
| Profit after tax | 6,099 | 2,657 | 482 | (530 | ) | 8,708 | ||||
| Less attributable to: preference shareholders, other equity holders, non-controlling interests | (1,279 | ) | (846 | ) | (784 | ) | 170 | (2,739 | ) | |
| Profit attributable to ordinary shareholders of the parent company | 4,820 | 1,811 | (302 | ) | (360 | ) | 5,969 | |||
| Increase in PVIF (net of tax) | (1,207 | ) | (40 | ) | — | (1 | ) | (1,248 | ) | |
| Significant items (net of tax) and UK bank levy | 1,641 | 3,036 | 4,218 | 702 | 9,597 | |||||
| Other adjustments | 1 | — | — | 2 | 3 | |||||
| Profit attributable to ordinary shareholders, excluding PVIF, significant items and bank levy | 5,255 | 4,807 | 3,916 | 343 | 14,321 | |||||
| Average tangible shareholders’ equity excluding fair value of own debt, DVA and other adjustments | 26,627 | 36,856 | 39,999 | 40,397 | 143,879 | |||||
| RoTE excluding significant items and UK bank levy (%) | 19.7 | 13.0 | 9.8 | 0.8 | 10.0 | |||||
HSBC Holdings plc Interim Report 2020 | 51 |
Risk
We recognise that the primary role of risk management is to protect our customers, business, colleagues, shareholders and the communities that we serve, while ensuring we are able to support our strategy and provide sustainable growth. As we move forward with the transformation programme announced in February, it will be critical that we actively manage the execution risks arising from our transformation plans.
We use a comprehensive and newly updated risk management framework across the organisation and all risk types, underpinned by the Group’s culture and values. This outlines the key principles, policies and practices that we employ in managing material risks, both financial and non-financial.
All our people are responsible for the management of risk, with the ultimate accountability residing with the Board. Our Global Risk function, led by the Group Chief Risk Officer, plays an important role in reinforcing the Group’s culture and values. It focuses on creating an environment that encourages our people to speak up and do the right thing.
Global Risk is independent from the global businesses, including our sales and trading functions, to provide challenge, oversight and appropriate balance in risk/reward decisions.
A summary of our current policies and practices regarding the management of risk is set out in the ‘Risk management’ section on pages 73 to 76 of the Annual Report and Accounts 2019.
| Key developments in the first half of 2020 |
We have actively managed the risks resulting from the Covid-19 outbreak and its impacts on our customers and operations during the first half of 2020, as well as other key risks described in this section.
We supplemented our existing approach to risk management with additional tools and practices to mitigate and manage risks. We increased our focus on the quality and timeliness of the data used to inform management decisions, such as through increased frequency of governance touch points informed by early warning indicators and prudent active risk management of our risk appetite.
In addition, we enhanced our risk management in the following areas:
| • | In January 2020, we simplified our approach and articulation of risk management through the combination of our enterprise risk management framework and our operational risk management framework. |
| • | Capital risk management practices continued to be enhanced across the Group through the Capital Risk Management function, focusing on both adequacy of capital and sufficiency of returns. |
| • | The global model risk policy and associated standards were revised to improve how we manage model risk and meet enhanced external expectations. The new policy will be implemented over a six-month period commencing 1 May 2020. |
| • | We continued to focus on simplifying our approach to non-financial risk management. We are driving more effective oversight and better end-to-end identification and management of non-financial risks. |
| • | We combined the second line of defence Operational Risk and second line of defence Resilience Risk sub-functions. By |
bringing the two teams together, we expect to benefit from improved stewardship, better risk management capabilities and better outcomes for our customers.
| • | We continued to improve the effectiveness of our financial crime controls in accordance with our specific regulatory obligations. We continued to invest in both advanced analytics and artificial intelligence, which remain key components of our next generation of tools to fight financial crime. |
| Areas of special interest |
Geopolitical and macroeconomic risk
The Covid-19 outbreak dominated the political and economic landscape for the first six months of 2020. The twin shocks of a public health emergency and the resultant economic fallout have been felt around the world, and hit both advanced and emerging markets. The closure of borders threatened medical and food supplies for many markets, and there is the potential for countries and territories to focus efforts on building resilient supply chains closer to home to be less vulnerable to global shocks.
The Covid-19 outbreak has heightened existing US-China tensions. US executive branch and congressional action has put pressure on the initial ‘phase one’ provisions under the trade agreement signed in January. Frictions span an increasing range of issues, including trade, technology and human rights. The Covid-19 outbreak has accelerated US efforts to reduce reliance on China in strategic industries such as sensitive technology, pharmaceuticals and precursor chemicals.
Hong Kong also emerged as an additional source of tension in US-China relations, with potential ramifications for the Group, including the impact of sanctions, as well as regulatory, reputational and market risks for the Group. While Hong Kong has experienced lower levels of social unrest in 2020, disagreements over the interpretation of the ‘one country, two systems’ model may continue to drive protest activity in the lead up to Hong Kong’s legislative council elections. For further details see ‘Risks to our operations in Asia-Pacific’.
While UK-China relations have historically been shaped by strong trade and investment, there are also emerging challenges. Following the passage of the Hong Kong national security law, the UK has offered residency rights and a path to citizenship to eligible British National (Overseas) passport holders in Hong Kong. In addition, both the UK and Hong Kong have suspended their extradition treaties with each other. The rollout of the UK 5G telecommunications network has also complicated relations. On 14 July, new restrictions on Chinese company Huawei were announced under the Telecoms Security Bill. These issues have the potential to impact bilateral commercial relationships adversely.
Emerging and frontier markets are suffering particularly heavily from the Covid-19 outbreak, in light of healthcare shortcomings, widespread labour informality, exposure to commodities production and often weak policy frameworks and buffers. Multilateral institutions have mobilised support for the weaker frontier markets, with the World Bank and G-20 marshalling efforts to implement a standstill on debt to public sector institutions. The International Monetary Fund has also, to date, lent $25bn in emergency funds to over 70 countries. However, negotiations on debt to the private sector will prove more difficult, and may result in sovereign debt restructuring and defaults for several countries. Most developed markets are expected to recover from the crisis, albeit after some permanent business closures and job losses. The majority of developed markets are also expected to not achieve pre-crisis growth rates or activity levels for the foreseeable future. These countries and territories should be able to shoulder the higher public deficits and debts necessary to offset private sector
| 52 | HSBC Holdings plc Interim Report 2020 |
weaknesses, given the continuing low cost of servicing public debt. However, a group of weaker developed markets, including some members of the EU, entered the Covid-19 crisis on weak economic and fiscal footing and suffered high healthcare and economic costs. Although eurozone progress in mutualisation of the debt should help support recoveries and keep debt servicing costs down in the near term, there are concerns that permanently higher debt burdens will eventually lead to economies questioning their sustainability.
Following the UK’s departure from the EU, an end to the transition period on 31 December 2020 without a free-trade agreement or an extension of the negotiating period would likely lead to a reversion of UK-EU trade to WTO rules from 2021. The absence of formal arrangements could further set back the expected gradual recovery of the UK and EU economies from recessions caused by the Covid-19 outbreak.
The contraction in the global economy has had varying effects on our customers, with many of them experiencing financial difficulties. This has resulted in an increase in expected credit losses (‘ECL’) and risk-weighted assets (‘RWAs’). For further details on customer relief programmes, see page 70. For further details on RWAs, see page 83.
Risks related to Covid-19
The Covid-19 pandemic and its effect on the global economy have impacted our customers and our performance, and the future effects of the pandemic are uncertain. The outbreak necessitated governments to respond at unprecedented levels to protect public health, local economies and livelihoods. It has affected regions at different times and varying degrees as it has developed. The varying government measures in response have added challenges, given the rapid pace of change and significant operational demands. The speed at which countries and territories will be able to unwind their lockdown measures and return to pre-Covid-19 economic levels will vary based on the levels of infection and local political decisions. There remains a risk of subsequent waves of infection.
Government restrictions imposed around the world to limit the spread of Covid-19 resulted in a sharp contraction in global economic activity in the first half of 2020. At the same time governments also took steps designed to soften the extent of the damage to investment, trade and labour markets. Economic activity is expected to gradually recover in the second half of the year but there is significant uncertainty associated with the pace and scale of recovery. In our Central scenario, GDP contracts sharply in 2020 in all our major markets, except China, reflective of the widespread nature of government restrictions. GDP growth in China is expected to be positive in 2020, although the growth rate is expected to be significantly lower compared with previous years. Strong recovery in economic activity in our major markets is expected in 2021, but this is contingent on the successful containment of the virus and the evolution of other top risks, including the UK’s relationship with the EU following the transition period, political unrest in Hong Kong and tensions between the US and China. It also relies on the willingness and ability of households and businesses to return towards pre-crisis spending levels. While GDP is expected to grow strongly in our major markets in 2021, the Central scenario projects a more gradual decline in the unemployment rate in these key markets. For further details on our central scenario see ‘Measurement uncertainty and sensitivity analysis’ on page 60.
There is a material risk of a renewed drop in economic activity. The economic fallout from Covid-19 risks increasing inequality across markets that have already suffered from social unrest. This will leave the burden on governments and central banks to maintain or increase fiscal and monetary stimulus. After financial markets suffered a sharp fall in the early phases of the spread of Covid-19, they rebounded but still remain volatile. Depending on the degree to which global economic growth suffers permanent losses, financial asset prices may suffer a further sharp fall.
Governments and central banks in major economies have deployed extensive measures to support their local populations.
Measures implemented by governments included income support to households and funding support to businesses. Central bank measures included cuts to policy rates, support to funding markets and asset purchases. These measures are expected to be unwound gradually as government restrictions ease and as economic activity increases. Central banks are expected to maintain record-low interest rates for a considerable period of time and the debt burden of governments is expected to rise significantly.
We initiated market-specific measures to support our personal and business customers through these challenging times. These included mortgage assistance, payment holidays, the waiving of certain fees and charges, and liquidity relief for businesses facing market uncertainty and supply chain disruption. We are also working closely with governments, and supporting national schemes that focus on the parts of the economy most impacted by Covid-19. In the UK, this included providing access to the various government support schemes from the beginning. In Hong Kong, we provided prompt liquidity relief to businesses facing market uncertainty and supply chain pressures. For further details of our customer relief programmes, see page 70.
Central bank and government actions and support measures taken in response to the Covid-19 outbreak, and our responses to those, have created, and may in the future create restrictions in relation to capital. This has limited and may in the future limit management's flexibility in managing the business and taking action in relation to capital distribution and capital allocation. For example, in response to a written request from the Prudential Regulation Authority (‘PRA’), we cancelled the fourth interim dividend for 2019 of $0.21 per ordinary share. Similar requests were also made to other UK incorporated banking groups. We also announced that until the end of 2020, we will make no quarterly or interim dividend payments or accruals in respect of ordinary shares. We also plan to suspend share buy-backs in respect of ordinary shares in 2020 and 2021.
It is recognised that all of the above measures and actions, and our responses to those, expose the Group to heightened risks. The rapid introduction and varying nature of the government support schemes, as well as customer expectations, can lead to risks as the Group implements large-scale changes in a short period of time. This has led to increased operational risks, including complex conduct considerations, increased reputational risk and increased risk of fraud. These risks are likely to be heightened further as and when those government support schemes are unwound. Central bank and government actions and support measures, and our responses to those, have also led to increased litigation risk, including lawsuits that have been and may continue to be brought in connection with our cancellation of the fourth interim dividend for 2019.
At 30 June 2020, our CET1 ratio was 15.0%, compared with 14.7% at 31 December 2019, and our liquidity coverage ratio (‘LCR’) was 148%. Our capital, funding and liquidity position is expected to help us to continue supporting our customers throughout the Covid-19 outbreak.
In many of our markets, the Covid-19 outbreak has led to a weakening in GDP, a key input used for calculating ECL, and there remains the risk of more adverse economic scenarios given its ongoing impact. Furthermore, ECL will also increase from other parts of our business impacted by the disruption to supply chains. The impact will vary by sectors of the economy, with heightened risk to the oil and gas, transport and discretionary consumer sectors being observed in the first stages of the outbreak. The impact of the outbreak on the long-term prospects of businesses in these sectors is uncertain and may lead to significant ECL charges on specific exposures, which may not be fully captured in ECL estimates. In addition, in times of crisis, fraudulent activity is often more prevalent, leading to potentially significant ECL charges.
The significant changes in economic and market drivers, customer behaviours and government actions caused by Covid-19 have also impacted the performance of financial models. These include retail and wholesale credit models such as IFRS loss models, as well as
HSBC Holdings plc Interim Report 2020 | 53 |
Risk
capital models, traded risk models and models used in the asset/liability management process. This has required more ongoing monitoring and more frequent testing across the Group, particularly for credit models. It also has resulted in the use of compensating controls, specifically as underlays on top of model outputs to provide a more appropriate assessment. By their nature, such compensating controls require a significant degree of management judgement and assumptions to be applied, and there is a risk that future actual results/performance may differ from such judgements and assumptions.
The performance and usage of models over the next 12 to 18 months will continue to be impacted by the consequences of the Covid-19 outbreak. It is too early in the current situation to be certain of the magnitude of change required for models at HSBC. However, it is likely that capital, credit risk and IFRS 9 models will need to be recalibrated, or in some cases may need to be replaced with the development of alternative models. The effectiveness of the existing models will depend in large part on the depth and length of the economic downturn faced by the world’s economies.
As a result of the Covid-19 outbreak, business continuity plans have been implemented. Despite high levels of working from home, the majority of our service level agreements, both internal and external, are being maintained. We have experienced no major impacts to the supply chain from our third-party service providers. The risk of damage or theft to our physical assets or criminal injury to our employees remains unchanged. No significant incidents have impacted our buildings or staff. Expedited decisions to ensure the continuity of critical customer services are being documented through governance.
There remain significant uncertainties in assessing the duration of the Covid-19 outbreak and its impact, and how this will evolve through 2020 and beyond. The actions taken by the various governments and central banks, in particular in the UK, mainland China, Hong Kong and the US, provide an indication of the potential severity of the downturn and post-recovery environment, which from a commercial, regulatory and risk perspective could be significantly different to past crises and persist for a prolonged period. A prolonged period of significantly reduced economic activity as a result of the impact of the outbreak would have a materially adverse effect on our financial condition, results of operations, prospects, liquidity, capital position and credit ratings. This would, in turn, have an impact on our ability to meet our financial targets as set out in our business update in February 2020 and also adversely affect our future dividend policy. We continue to monitor the situation closely, and given the novel or prolonged nature of the outbreak, additional mitigating actions may be required.
Risks to our operations and portfolios in Asia-Pacific
The global Covid-19 outbreak has fuelled existing tensions within the US-China bilateral relationship. Disagreements over trade, technology, human rights and the status of Hong Kong could result in people, sanctions, regulatory, reputational and market risks for the Group. The extent to which both countries can overcome these tensions and coordinate their responses to the outbreak is likely to have an important bearing on the post-Covid-19 global economy and geopolitical order.
The rapid rollout of 5G in 2020 and its importance to future standard setting and economic growth is likely to lead to heightened corporate and national competition over ownership of the relevant technologies.
Hong Kong has also emerged as an additional source of tension in US-China relations, with potential ramifications for the Group. In June, China passed the Hong Kong national security law, which is now in force in Hong Kong. In response, the US took steps to terminate the preferential treatment afforded to Hong Kong under the 1992 Hong Kong Policy Act. Additionally, the US President signed into law the Hong Kong Autonomy Act and issued an Executive Order, providing authority to impose primary sanctions against entities and individuals determined to have undermined Hong Kong’s autonomy. The Act also provides authority to impose
secondary sanctions against non-US financial institutions determined to have conducted a significant transaction for any individual or entity subject to primary sanctions under the Act. Disagreements over the interpretation of the ‘one country, two systems’ model is likely to affect protest activity in Hong Kong, and may prompt further US executive branch or congressional action. Tensions in the UK-China relationship have been heightened over disagreements about future UK 5G networks and Hong Kong. In response to the introduction of the Hong Kong national security law, the UK has offered residency rights and a path to citizenship to eligible British National (Overseas) passport holders in Hong Kong. The UK and Hong Kong extradition treaties have also recently been suspended.
As geopolitical tensions rise, the compliance by multinational corporations with their legal or regulatory obligations in one jurisdiction may be seen as supporting the law or policy objectives of that jurisdiction over another jurisdiction, creating additional risks for the Group. Geopolitical tensions will continue to present challenges for HSBC.
Process of UK withdrawal from the EU
The UK left the EU on 31 January 2020 and entered a transition period until 31 December 2020, during which negotiations have been taking place on the future relationship. At this stage it remains unclear what that relationship will look like, potentially leaving firms with little time to adapt to changes, which may enter into force on 1 January 2021.
Our programme to manage the impact of the UK leaving the EU has now been largely completed. The programme base case scenario assumes the UK exits the transition period without the existing passporting or regulatory equivalence framework that supports cross-border business. Priority has been given to ensuring we can continue to service our European Economic Area (‘EEA’)-based customers once this framework falls away, with three main areas of activity:
| • | extension of our product and balance sheet capabilities in continental Europe, mainly in HSBC France and its branches in the Netherlands and Ireland; |
| • | migration of HSBC Bank plc’s EEA clients to HSBC France and other affiliates within the EU; and |
| • | the transfer of HSBC Bank plc’s EEA branch businesses to HSBC France. |
These objectives were largely completed by the end of 2019. The current priority is to complete the migration of remaining customers to one of our entities in the EU.
Product offering and client migration
To accommodate customer migrations and new business after the UK’s departure from the EU, we expanded and enhanced our existing product offering in France, the Netherlands and Ireland.
The UK’s departure from the EU’s financial services regulatory framework at the end of the transition period without alternative equivalence-type arrangements, or a trade deal being in place, is likely to have an impact on our clients’ operating models, including their working capital requirements, investment decisions and access to financial markets infrastructure. Our priority is to provide continuity of service, while minimising the level of change for our customers.
Due to our base case scenario we are required to migrate some EEA-incorporated clients from the UK to HSBC France, or another EEA entity. This has now mostly been completed for clients we expect can no longer be serviced from the UK. We are working in close collaboration with any remaining clients to make the transition as smooth as possible before the end of December 2020. We have been in close contact with these clients since the beginning of the transition period and will support them in the final phase of their migration to one of our entities in the EU. We are also considering the application of regulatory regimes in certain EU member states that allow cross-border business with third-country firms and the extent to which those may permit
| 54 | HSBC Holdings plc Interim Report 2020 |
continued servicing of some EEA clients from the UK following the transition period.
Employees
The migration of EEA-incorporated clients requires us to strengthen our local teams in the EU, and France in particular. Given the scale and capabilities of our existing business in France, we are well prepared to take on additional roles and activities. Looking beyond the transfer of roles to the EU, we are also providing support to our employees who are UK citizens resident in EEA countries, and employees who are citizens of an EU member state resident in the UK.
Across the programme, we have made good progress in terms of ensuring we are prepared for the UK leaving the transition period under the terms described above. However, there remain execution risks, many of them linked to the uncertain outcome of negotiations.
Model risk
The economic consequences of the Covid-19 outbreak on macroeconomic variables that are used in models are outside of the bounds for which IFRS 9 models have been built and calibrated to operate. Moreover, the complexities of current governmental support programmes and regulatory guidance on the treatment of customer impacts, such as forbearance, payment holidays and the unpredictable pathways of the Covid-19 outbreak, have not previously been factored into the modelling. Consequently, IFRS 9 models under the current economic conditions are generating outputs that do not accurately assess the actual level of credit quality. Therefore, overlays based on expert analysis are necessary to reflect ECL.
In the short term, the focus is on refining model inputs and outputs in a consistent and explainable manner, including the use of model overlays. Wider ranging model changes for risk and loss models will take time to develop and need more real data on which models can be trained to be meaningful. Given the remaining significant uncertainties of Covid-19 and its impacts, it is too early to determine if model recalibration or redevelopment will be required.
Ibor transition
The Financial Stability Board has observed that the decline in interbank short-term unsecured funding poses structural risks for interest rate benchmarks that reference these markets. In response, regulators and central banks in various jurisdictions have convened national working groups to identify alternative benchmark rates (near risk-free rates or RFRs) for these Ibors and, where appropriate, to facilitate an orderly transition to these rates.
Following the announcement by the UK’s Financial Conduct Authority (‘FCA’) in July 2017 that it will no longer persuade or require banks to submit rates for London interbank offered rate (’Libor’) after 2021, the national working groups for the affected currencies were tasked with facilitating an orderly transition of the relevant Libors to their chosen RFRs. The euro working group is also responsible for facilitating an orderly transition of the Euro Overnight Index Average (‘Eonia’) to the euro short-term rate (‘€STER’) as a result of Eonia not being made compliant with the EU Benchmark Regulation.
Regulators have reiterated that firms cannot rely on Libor being published after the end of 2021 but acknowledge that Covid-19 may impact on transition plans.
National working groups, regulators and governments have also recognised that certain Libor contracts genuinely have no, or inappropriate, alternatives and no realistic ability to be renegotiated or amended prior to Libor’s cessation. In response, the US government and the European Commission intend to implement legislation that gives market participants the confidence to transition these ‘tough legacy’ contracts to the recommended benchmark replacement without the fear of legal repercussions. Similarly, in June 2020, the UK government announced that it would grant powers to the FCA to enable continued publication of a Libor number using a different and
more robust methodology and inputs, and therefore reduce disruption to any holders of these tough legacy contracts. However, there is no certainty as to whether the FCA will exercise these powers or what form the revised methodology would take, and the FCA has consequently encouraged users of Libor to renegotiate or amend as many contracts as possible before Libor’s cessation.
HSBC established the Ibor transition programme with the objective of facilitating an orderly transition from Libor and Eonia for HSBC and its clients. During the first half of 2020, our Libor transition has continued to develop, as detailed below.
Develop RFR product capabilities
Our global businesses continue to develop their capabilities to offer RFR-based products and the supporting processes and systems. The Covid-19 outbreak has impacted the speed with which we are able to develop these capabilities and many of our customers’ readiness to adopt RFR-based products. Consequently, the sale of Libor and Eonia contracts with maturities beyond 2021, known as legacy contracts, will continue for longer than initially anticipated. This is likely to increase the volume of legacy contracts that will need to be transitioned.
Transition legacy contracts
The programme is also continuing to develop the capability to transition legacy Libor and Eonia contracts on a larger scale. The Covid-19 outbreak has also affected the pace with which many of our customers will have been preparing to adopt RFR-based products. Therefore, it has likely affected the pace at which they will transition their legacy contracts to RFRs. Consequently, we expect legacy contract transition to occur over a shortened time period. In combination with the greater number of legacy contracts requiring transition, this increases the overall level of execution risk on the transition process, which could potentially increase the level of conduct and operational risks.
In addition to the heightened conduct and operational risks, the process of adopting new reference rates may expose the Group to an increased level of financial risk, such as potential earnings volatility resulting from contract modifications and changes in hedge accounting relationships. Furthermore, the transition to RFRs could have a range of adverse impacts on our business, including legal proceedings or other actions regarding the interpretation and enforceability of provisions in Ibor-based contracts and regulatory investigations or reviews in respect of our preparation and readiness for the replacement of Ibor with RFRs. We continue to engage with industry participants, the official sector and our clients to support an orderly transition and the mitigation of the risks resulting from the transition.
HSBC Holdings plc Interim Report 2020 | 55 |
Risk
| Credit risk |
| Page | |
| Overview | |
| Risk elements in the loan portfolio | |
| Credit risk in the first half of 2020 | |
| Summary of credit risk | |
| Measurement uncertainty and sensitivity analysis of ECL estimates | |
| Reconciliation of changes in gross carrying/nominal amount and allowances for loans and advances to banks and customers | |
| Credit quality of financial instruments | |
| Customer relief programmes | |
| Personal lending | |
| Wholesale lending | |
| Supplementary information | |
Change in reportable segments | |
Overview
Credit risk is the risk of financial loss if a customer or counterparty fails to meet an obligation under a contract. Credit risk arises principally from direct lending, trade finance and leasing business, but also from certain other products, such as guarantees and derivatives.
Risk elements in the loan portfolio
Unless otherwise stated, the disclosure of credit risk elements in this section reflects US accounting practice and classifications. The purpose of the disclosure is to present within the US disclosure framework those elements of the loan portfolios with a greater risk of loss. The three main classifications of credit risk elements presented are:
| • | impaired loans; |
| • | unimpaired loans contractually more than 90 days past due as to interest or principal; and |
| • | troubled debt restructurings not included in the above. |
Impaired loans
In the following tables, we present information on our impaired loans and advances in accordance with the classification approach described in the Annual Report and Accounts 2019.
A loan is impaired, and an impairment allowance is recognised, when there is objective evidence of a loss event that has an effect on the cash flows of the loan which can be reliably estimated. In accordance with IFRSs, we recognise interest income on assets after they have been written down as a result of an impairment loss.
The balance of impaired loans at 30 June 2020 has increased by $3.7bn when compared with 31 December 2019. This is primarily driven by customers in the wholesale and retail trade, repair of motor vehicles and motor cycles industry and the mining and quarrying industry.
Unimpaired loans more than 90 days past due
Under IFRS 9 the Group determines that a financial instrument is credit-impaired and in stage 3 by considering relevant objective evidence, primarily whether:
| • | contractual payments of either principal or interest are past due for more than 90 days; |
| • | there are other indications that the borrower is unlikely to pay such as that a concession has been granted to the borrower for economic or legal reasons relating to the borrower’s financial condition; and |
| • | the loan is otherwise considered to be in default. |
If such unlikeliness to pay is not identified at an earlier stage, it is deemed to occur when an exposure is 90 days past due, even where regulatory rules permit default to be defined based on 180 days past due. Therefore the definitions of credit-impaired and default are aligned as far as possible so that stage 3 represents all loans which are considered defaulted or otherwise credit-impaired. Interest income is recognised by applying the effective interest
rate to the amortised cost amount (i.e. gross carrying amount less ECL allowance).
As a financial instrument is considered impaired if contractual payments of either principal or interest are past due for more than 90 days, these amounts will be reported under impaired loans with no balance reported under unimpaired loans more than 90 days past due.
Troubled debt restructurings
Under US GAAP, a troubled debt restructuring (‘TDR’) is a loan, the terms of which have been modified for economic or legal reasons related to the borrower’s financial difficulties to grant a concession to the borrower that the lender would not otherwise consider. A modification which results in a delay in payment that is considered insignificant is not regarded as a concession for the purposes of this disclosure. The SEC requires separate disclosure of any loans which meet the definition of a TDR that are not included in the previous two loan categories. Loans that have been identified as TDRs under the US guidance retain this designation until maturity or derecognition. This treatment differs from the Group’s impaired loans disclosure convention under IFRSs under which a loan may return to unimpaired status after demonstrating a significant reduction in the risk of non-payment of future cash flows. As a result, reported TDRs include those loans that have returned to unimpaired status under the Group’s disclosure convention for renegotiated loans.
The balance of TDRs not included as impaired loans at 30 June 2020 was $1.6bn, $0.8bn lower than at 31 December 2019. Under the Group’s IFRS 9 methodology financial instruments (except for renegotiated loans) are transferred out of stage 3 when they no longer exhibit any evidence of credit impairment. Wholesale renegotiated loans will continue to be in stage 3 until there is sufficient evidence to demonstrate a significant reduction in the risk of non-payment of future cash flows, observed over a minimum one-year period and there are no other indicators of impairment. For loans that are assessed for impairment on a portfolio basis, the evidence typically comprises a history of payment performance against the original or revised terms, as appropriate to the circumstances. For loans that are assessed for impairment on an individual basis, all available evidence is assessed on a case-by-case basis. Retail renegotiated loans are deemed to remain credit impaired until repayment or derecognition.
Potential problem loans
Potential problem loans are loans where information on possible credit problems among borrowers causes management to seriously doubt their ability to comply with the loan repayment terms.
Under IFRS 9, an assessment of whether credit risk has increased significantly since initial recognition is performed at each reporting period by considering the change in the risk of default occurring over the remaining life of the financial instrument. Any financial instrument deemed to have suffered a significant increase in credit risk is transferred from stage 1 to stage 2.
The assessment explicitly or implicitly compares the risk of default occurring at the reporting date with that at initial recognition, taking into account reasonable and supportable information, including information about past events, current conditions and future economic conditions. The assessment is unbiased, probability weighted and, to the extent relevant, uses forward-looking information consistent with that used in the measurement of ECL.
The analysis of credit risk is multifactor. The determination of whether a specific factor is relevant and its weight compared with other factors depends on the type of product, the characteristics of the financial instrument and the borrower, and the geographical region. Therefore, it is not possible to provide a single set of criteria that will determine what is considered to be a significant increase in credit risk and these criteria will differ for different types of lending, particularly between retail and wholesale. However, unless identified at an earlier stage, all financial assets are deemed to have suffered a significant increase in credit risk
| 56 | HSBC Holdings plc Interim Report 2020 |
when 30 days past due. Financial instruments classified as stage 2 and greater than 30 days past due are considered to have a higher risk of containing potential problem loans.
Analysis of risk elements in the loan portfolio by geographical region
The analysis below sets out the amount of risk elements in loan portfolios included within loans and advances to customers and
banks in the consolidated balance sheet, trading loans classified as in default and assets obtained by taking possession of security.
The table excludes the amount of risk elements in loan portfolios classified as ‘assets held for sale’ in the consolidated balance sheet.
| Risk elements in the loan portfolio by geographical region | ||||
| At | ||||
| 30 Jun 2020 | 31 Dec 2019 | |||
| $m | $m | |||
| Impaired loans | 17,444 | 13,710 | ||
| – Europe | 8,777 | 7,135 | ||
| – Asia | 3,511 | 2,284 | ||
| – Middle East and North Africa | 2,174 | 2,003 | ||
| – North America | 2,342 | 1,696 | ||
| – Latin America | 640 | 592 | ||
| Unimpaired loans contractually more than 90 days past due as to principal or interest | — | — | ||
| – Europe | — | — | ||
| – Asia | — | — | ||
| – Middle East and North Africa | — | — | ||
| – North America | — | — | ||
| – Latin America | — | — | ||
| Troubled debt restructurings (not included in the classifications above) | 1,560 | 2,351 | ||
| – Europe | 1,262 | 1,665 | ||
| – Asia | — | 68 | ||
| – Middle East and North Africa | 144 | 452 | ||
| – North America | 134 | 136 | ||
| – Latin America | 20 | 30 | ||
| Trading loans classified as in default | — | — | ||
| – Europe | — | — | ||
| – Asia | — | — | ||
| – Middle East and North Africa | — | — | ||
| – North America | — | — | ||
| – Latin America | — | — | ||
| Risk elements on loans | 19,004 | 16,061 | ||
| – Europe | 10,039 | 8,800 | ||
| – Asia | 3,511 | 2,352 | ||
| – Middle East and North Africa | 2,318 | 2,455 | ||
| – North America | 2,476 | 1,832 | ||
| – Latin America | 660 | 622 | ||
| Assets held for resale | 44 | 58 | ||
| – Europe | 14 | 18 | ||
| – Asia | 26 | 27 | ||
| – Middle East and North Africa | — | — | ||
| – North America | 4 | 10 | ||
| – Latin America | — | 3 | ||
| Total risk elements | 19,048 | 16,119 | ||
| – Europe | 10,053 | 8,818 | ||
| – Asia | 3,537 | 2,379 | ||
| – Middle East and North Africa | 2,318 | 2,455 | ||
| – North America | 2,480 | 1,842 | ||
| – Latin America | 660 | 625 | ||
| % | % | |||
| Loan impairment allowances as a percentage of risk elements on loans | 69.9 | 54.5 | ||
HSBC Holdings plc Interim Report 2020 | 57 |
Risk
Credit risk in the first half of 2020
During 1H20, due to the unique market conditions in the Covid-19 outbreak, we expanded operational practices to provide short-term support to customers under the current policy framework. For further details of market-specific measures to support our personal
and business customers, see page 70. There have been no material changes to credit risk policy.
A summary of our current policies and practices for the management of credit risk is set out in ‘Credit risk management’ on page 84 of the Annual Report and Accounts 2019.
Gross loans and advances to customers of $1,032bn decreased from $1,045bn at 31 December 2019. This decrease included adverse foreign exchange movements of $31bn. Loans and advances to banks of $77bn increased from $69bn at
31 December 2019. This included adverse foreign exchange movements of $2bn.
31 December 2019. This included adverse foreign exchange movements of $2bn.
The change in expected credit losses and other credit impairment charges (‘ECL’) in the income statement for the period was $6.9bn. For further details, see the financial summary on page 25.
Summary of credit risk
The following disclosure presents the gross carrying/nominal amount of financial instruments to which the impairment requirements in IFRS 9 are applied and the associated allowance for ECL. The following tables analyse loans by industry sector and represent the concentration of exposures on which credit risk is managed.
The allowance for ECL increased from $9.4bn at 31 December 2019 to $14.5bn at 30 June 2020.
The allowance for ECL at 30 June 2020 comprised $13.5bn in respect of assets held at amortised cost, $0.7bn in respect of loan commitments and financial guarantees, and $0.2bn in respect of debt instruments measured at fair value through other comprehensive income (‘FVOCI’).
| Summary of financial instruments to which the impairment requirements in IFRS 9 are applied | |||||||||
| At 30 Jun 2020 | At 31 Dec 2019 | ||||||||
| Gross carrying/nominal amount | Allowance for ECL1 | Gross carrying/nominal amount | Allowance for ECL1 | ||||||
| Footnotes | $m | $m | $m | $m | |||||
| Loans and advances to customers at amortised cost | 1,031,908 | (13,227 | ) | 1,045,475 | (8,732 | ) | |||
| – personal | 422,184 | (4,401 | ) | 434,271 | (3,134 | ) | |||
| – corporate and commercial | 540,308 | (8,537 | ) | 540,499 | (5,438 | ) | |||
| – non-bank financial institutions | 69,416 | (289 | ) | 70,705 | (160 | ) | |||
| Loans and advances to banks at amortised cost | 77,069 | (54 | ) | 69,219 | (16 | ) | |||
| Other financial assets measured at amortised cost | 751,872 | (243 | ) | 615,179 | (118 | ) | |||
| – cash and balances at central banks | 249,683 | (10 | ) | 154,101 | (2 | ) | |||
| – items in the course of collection from other banks | 6,289 | — | 4,956 | — | |||||
| – Hong Kong Government certificates of indebtedness | 39,519 | — | 38,380 | — | |||||
| – reverse repurchase agreements – non-trading | 226,345 | — | 240,862 | — | |||||
| – financial investments | 89,923 | (142 | ) | 85,788 | (53 | ) | |||
– prepayments, accrued income and other assets | 2 | 140,113 | (91 | ) | 91,092 | (63 | ) | ||
| Total gross carrying amount on-balance sheet | 1,860,849 | (13,524 | ) | 1,729,873 | (8,866 | ) | |||
| Loans and other credit-related commitments | 648,156 | (622 | ) | 600,029 | (329 | ) | |||
| – personal | 231,336 | (28 | ) | 223,314 | (15 | ) | |||
| – corporate and commercial | 278,350 | (562 | ) | 278,524 | (307 | ) | |||
| – financial | 138,470 | (32 | ) | 98,191 | (7 | ) | |||
| Financial guarantees | 18,328 | (119 | ) | 20,214 | (48 | ) | |||
| – personal | 750 | (1 | ) | 804 | (1 | ) | |||
| – corporate and commercial | 13,484 | (110 | ) | 14,804 | (44 | ) | |||
| – financial | 4,094 | (8 | ) | 4,606 | (3 | ) | |||
| Total nominal amount off-balance sheet | 3 | 666,484 | (741 | ) | 620,243 | (377 | ) | ||
| 2,527,333 | (14,265 | ) | 2,350,116 | (9,243 | ) | ||||
| Fair value | Memorandum allowance for ECL4 | Fair value | Memorandum allowance for ECL4 | ||||||
| $m | $m | $m | $m | ||||||
Debt instruments measured at fair value through other comprehensive income | 402,331 | (242 | ) | 355,664 | (166 | ) | |||
| 1 | Total ECL is recognised in the loss allowance for the financial asset unless total ECL exceeds the gross carrying amount of the financial asset, in which case the ECL is recognised as a provision. |
| 2 | Includes only those financial instruments that are subject to the impairment requirements of IFRS 9. ‘Prepayments, accrued income and other assets’, as presented within the consolidated balance sheet on page 96, includes both financial and non-financial assets. |
| 3 | Represents the maximum amount at risk should the contracts be fully drawn upon and clients default. |
| 4 | Debt instruments measured at FVOCI continue to be measured at fair value with the allowance for ECL as a memorandum item. Change in ECL is recognised in ‘Change for expected credit losses and other credit impairment charges’ in the income statement. |
| 58 | HSBC Holdings plc Interim Report 2020 |
The following table provides an overview of the Group’s credit risk by stage and industry, and the associated ECL coverage. The financial assets recorded in each stage have the following characteristics:
| • | Stage 1: These financial assets are unimpaired and without a significant increase in credit risk for which a 12-month allowance for ECL is recognised. |
| • | Stage 2: A significant increase in credit risk has been experienced on these financial assets since initial recognition |
for which a lifetime ECL is recognised.
| • | Stage 3: There is objective evidence of impairment and the financial assets are therefore considered to be in default or otherwise credit impaired for which a lifetime ECL is recognised. |
| • | POCI: Financial assets that are purchased or originated at a deep discount are seen to reflect the incurred credit losses on which a lifetime ECL is recognised. |
| Summary of credit risk (excluding debt instruments measured at FVOCI) by stage distribution and ECL coverage by industry sector at 30 June 2020 | |||||||||||||||||||||||||
Gross carrying/nominal amount1 | Allowance for ECL | ECL coverage % | |||||||||||||||||||||||
| Stage 1 | Stage 2 | Stage 3 | POCI2 | Total | Stage 1 | Stage 2 | Stage 3 | POCI2 | Total | Stage 1 | Stage 2 | Stage 3 | POCI2 | Total | |||||||||||
| $m | $m | $m | $m | $m | $m | $m | $m | $m | $m | % | % | % | % | % | |||||||||||
| Loans and advances to customers at amortised cost | 852,678 | 161,795 | 17,139 | 296 | 1,031,908 | (1,906 | ) | (4,553 | ) | (6,669 | ) | (99 | ) | (13,227 | ) | 0.2 | 2.8 | 38.9 | 33.4 | 1.3 | |||||
| – personal | 390,032 | 27,031 | 5,121 | — | 422,184 | (897 | ) | (2,115 | ) | (1,389 | ) | — | (4,401 | ) | 0.2 | 7.8 | 27.1 | — | 1.0 | ||||||
| – corporate and commercial | 406,194 | 122,319 | 11,499 | 296 | 540,308 | (966 | ) | (2,306 | ) | (5,166 | ) | (99 | ) | (8,537 | ) | 0.2 | 1.9 | 44.9 | 33.4 | 1.6 | |||||
| – non-bank financial institutions | 56,452 | 12,445 | 519 | — | 69,416 | (43 | ) | (132 | ) | (114 | ) | — | (289 | ) | 0.1 | 1.1 | 22.0 | — | 0.4 | ||||||
| Loans and advances to banks at amortised cost | 71,693 | 5,367 | 9 | — | 77,069 | (26 | ) | (23 | ) | (5 | ) | — | (54 | ) | — | 0.4 | 55.6 | — | 0.1 | ||||||
| Other financial assets measured at amortised cost | 744,724 | 6,915 | 232 | 1 | 751,872 | (96 | ) | (63 | ) | (84 | ) | — | (243 | ) | — | 0.9 | 36.2 | — | — | ||||||
| Loans and other credit-related commitments | 594,400 | 52,698 | 1,055 | 3 | 648,156 | (193 | ) | (339 | ) | (90 | ) | — | (622 | ) | — | 0.6 | 8.5 | — | 0.1 | ||||||
| – personal | 228,688 | 2,430 | 218 | — | 231,336 | (26 | ) | (2 | ) | — | — | (28 | ) | — | 0.1 | — | — | — | |||||||
| – corporate and commercial | 232,598 | 44,942 | 807 | 3 | 278,350 | (159 | ) | (316 | ) | (87 | ) | — | (562 | ) | 0.1 | 0.7 | 10.8 | — | 0.2 | ||||||
| – financial | 133,114 | 5,326 | 30 | — | 138,470 | (8 | ) | (21 | ) | (3 | ) | — | (32 | ) | — | 0.4 | 10.0 | — | — | ||||||
| Financial guarantees | 13,129 | 4,903 | 295 | 1 | 18,328 | (28 | ) | (73 | ) | (18 | ) | — | (119 | ) | 0.2 | 1.5 | 6.1 | — | 0.6 | ||||||
| – personal | 743 | 5 | 2 | — | 750 | — | (1 | ) | — | — | (1 | ) | — | 20.0 | — | — | 0.1 | ||||||||
| – corporate and commercial | 8,976 | 4,222 | 285 | 1 | 13,484 | (27 | ) | (66 | ) | (17 | ) | — | (110 | ) | 0.3 | 1.6 | 6.0 | — | 0.8 | ||||||
| – financial | 3,410 | 676 | 8 | — | 4,094 | (1 | ) | (6 | ) | (1 | ) | — | (8 | ) | — | 0.9 | 12.5 | — | 0.2 | ||||||
| At 30 Jun 2020 | 2,276,624 | 231,678 | 18,730 | 301 | 2,527,333 | (2,249 | ) | (5,051 | ) | (6,866 | ) | (99 | ) | (14,265 | ) | 0.1 | 2.2 | 36.7 | 32.9 | 0.6 | |||||
| 1 | Represents the maximum amount at risk should the contracts be fully drawn upon and clients default. |
| 2 | Purchased or originated credit impaired ('POCI'). |
Unless identified at an earlier stage, all financial assets are deemed to have suffered a significant increase in credit risk when they are 30 days past due (‘DPD’) and are transferred from stage 1 to stage 2. The following disclosure presents the ageing of stage 2
financial assets by those less than 30 and greater than 30 DPD and therefore presents those financial assets classified as stage 2 due to ageing (30 DPD) and those identified at an earlier stage (less than 30 DPD).
| Stage 2 days past due analysis at 30 June 2020 | |||||||||||||||
| Gross carrying amount | Allowance for ECL | ECL coverage % | |||||||||||||
| Of which: | Of which: | Of which: | Of which: | Of which: | Of which: | ||||||||||
| Stage 2 | 1 to 29 DPD1,2 | 30 and > DPD1,2 | Stage 2 | 1 to 29 DPD1,2 | 30 and > DPD1,2 | Stage 2 | 1 to 29 DPD1,2 | 30 and > DPD1,2 | |||||||
| $m | $m | $m | $m | $m | $m | % | % | % | |||||||
| Loans and advances to customers at amortised cost | 161,795 | 3,068 | 2,152 | (4,553 | ) | (271 | ) | (422 | ) | 2.8 | 8.8 | 19.6 | |||
| – personal | 27,031 | 1,556 | 1,650 | (2,115 | ) | (210 | ) | (340 | ) | 7.8 | 13.5 | 20.6 | |||
| – corporate and commercial | 122,319 | 1,402 | 477 | (2,306 | ) | (60 | ) | (82 | ) | 1.9 | 4.3 | 17.2 | |||
| – non-bank financial institutions | 12,445 | 110 | 25 | (132 | ) | (1 | ) | — | 1.1 | 0.9 | — | ||||
| Loans and advances to banks at amortised cost | 5,367 | — | — | (23 | ) | — | — | 0.4 | — | — | |||||
| Other financial assets measured at amortised cost | 6,915 | 6 | (2 | ) | (63 | ) | — | — | 0.9 | — | — | ||||
| 1 | Days past due ('DPD'). Up-to-date accounts in stage 2 are not shown in amounts. |
| 2 | The days past due amounts presented above are on a contractual basis and include the benefit of any customer relief payment holidays granted. |
HSBC Holdings plc Interim Report 2020 | 59 |
Risk
Summary of credit risk (excluding debt instruments measured at FVOCI) by stage distribution and ECL coverage by industry sector at 31 December 2019 | |||||||||||||||||||||||||
Gross carrying/nominal amount1 | Allowance for ECL | ECL coverage % | |||||||||||||||||||||||
| Stage 1 | Stage 2 | Stage 3 | POCI2 | Total | Stage 1 | Stage 2 | Stage 3 | POCI2 | Total | Stage 1 | Stage 2 | Stage 3 | POCI2 | Total | |||||||||||
| $m | $m | $m | $m | $m | $m | $m | $m | $m | $m | % | % | % | % | % | |||||||||||
| Loans and advances to customers at amortised cost | 951,583 | 80,182 | 13,378 | 332 | 1,045,475 | (1,297 | ) | (2,284 | ) | (5,052 | ) | (99 | ) | (8,732 | ) | 0.1 | 2.8 | 37.8 | 29.8 | 0.8 | |||||
| – personal | 413,669 | 15,751 | 4,851 | — | 434,271 | (583 | ) | (1,336 | ) | (1,215 | ) | — | (3,134 | ) | 0.1 | 8.5 | 25.0 | — | 0.7 | ||||||
| – corporate and commercial | 472,253 | 59,599 | 8,315 | 332 | 540,499 | (672 | ) | (920 | ) | (3,747 | ) | (99 | ) | (5,438 | ) | 0.1 | 1.5 | 45.1 | 29.8 | 1.0 | |||||
| – non-bank financial institutions | 65,661 | 4,832 | 212 | — | 70,705 | (42 | ) | (28 | ) | (90 | ) | — | (160 | ) | 0.1 | 0.6 | 42.5 | — | 0.2 | ||||||
| Loans and advances to banks at amortised cost | 67,769 | 1,450 | — | — | 69,219 | (14 | ) | (2 | ) | — | — | (16 | ) | — | 0.1 | — | — | — | |||||||
Other financial assets measured at amortised cost | 613,200 | 1,827 | 151 | 1 | 615,179 | (38 | ) | (38 | ) | (42 | ) | — | (118 | ) | — | 2.1 | 27.8 | — | — | ||||||
| Loans and other credit-related commitments | 577,631 | 21,618 | 771 | 9 | 600,029 | (137 | ) | (133 | ) | (59 | ) | — | (329 | ) | — | 0.6 | 7.7 | — | 0.1 | ||||||
| – personal | 221,490 | 1,630 | 194 | — | 223,314 | (13 | ) | (2 | ) | — | — | (15 | ) | — | 0.1 | — | — | — | |||||||
| – corporate and commercial | 259,138 | 18,804 | 573 | 9 | 278,524 | (118 | ) | (130 | ) | (59 | ) | — | (307 | ) | — | 0.7 | 10.3 | — | 0.1 | ||||||
| – financial | 97,003 | 1,184 | 4 | — | 98,191 | (6 | ) | (1 | ) | — | — | (7 | ) | — | 0.1 | — | — | — | |||||||
| Financial guarantees | 17,684 | 2,340 | 186 | 4 | 20,214 | (16 | ) | (22 | ) | (10 | ) | — | (48 | ) | 0.1 | 0.9 | 5.4 | — | 0.2 | ||||||
| – personal | 802 | 1 | 1 | — | 804 | (1 | ) | — | — | — | (1 | ) | 0.1 | — | — | — | 0.1 | ||||||||
| – corporate and commercial | 12,540 | 2,076 | 184 | 4 | 14,804 | (14 | ) | (21 | ) | (9 | ) | — | (44 | ) | 0.1 | 1.0 | 4.9 | — | 0.3 | ||||||
| – financial | 4,342 | 263 | 1 | — | 4,606 | (1 | ) | (1 | ) | (1 | ) | — | (3 | ) | — | 0.4 | 100.0 | — | 0.1 | ||||||
| At 31 Dec 2019 | 2,227,867 | 107,417 | 14,486 | 346 | 2,350,116 | (1,502 | ) | (2,479 | ) | (5,163 | ) | (99 | ) | (9,243 | ) | 0.1 | 2.3 | 35.6 | 28.6 | 0.4 | |||||
| 1 | Represents the maximum amount at risk should the contracts be fully drawn upon and clients default. |
| 2 | Purchased or originated credit impaired ('POCI'). |
| Stage 2 days past due analysis at 31 December 2019 | ||||||||||||||||||
Gross carrying amount | Allowance for ECL | ECL coverage % | ||||||||||||||||
| Stage 2 | Of which: | Of which: | Stage 2 | Of which: | Of which: | Stage 2 | Of which: | Of which: | ||||||||||
1 to 29 DPD1 | 30 and > DPD1 | 1 to 29 DPD1 | 30 and > DPD1 | 1 to 29 DPD1 | 30 and > DPD1 | |||||||||||||
| $m | $m | $m | $m | $m | $m | % | % | % | ||||||||||
| Loans and advances to customers at amortised cost | 80,182 | 2,471 | 1,676 | (2,284 | ) | (208 | ) | (247 | ) | 2.8 | 8.4 | 14.7 | ||||||
| – personal | 15,751 | 1,804 | 1,289 | (1,336 | ) | (178 | ) | (217 | ) | 8.5 | 9.9 | 16.8 | ||||||
| – corporate and commercial | 59,599 | 657 | 385 | (920 | ) | (30 | ) | (30 | ) | 1.5 | 4.6 | 7.8 | ||||||
| – non-bank financial institutions | 4,832 | 10 | 2 | (28 | ) | — | — | 0.6 | — | — | ||||||||
| Loans and advances to banks at amortised cost | 1,450 | — | — | (2 | ) | — | — | 0.1 | — | — | ||||||||
| Other financial assets measured at amortised cost | 1,827 | 14 | 30 | (38 | ) | — | — | 2.1 | — | — | ||||||||
| 1 | Days past due ('DPD'). Up-to-date accounts in stage 2 are not shown in amounts. |
Measurement uncertainty and sensitivity analysis of ECL estimates
The recognition and measurement of ECL involves the use of significant judgement and estimation. We form multiple economic scenarios based on economic forecasts, apply these assumptions to credit risk models to estimate future credit losses, and probability-weight the results to determine an unbiased ECL estimate.
Methodology
Our methodology in relation to the adoption and generation of economic scenarios is described on page 92 of the Annual Report and Accounts 2019. There have been no significant changes during the 1H20 period. While in keeping with HSBC’s methodology, the exceptional nature of the current economic environment has led to extensive application of management’s judgement in determining the range of possible outcomes, the number and severity of scenarios selected and the probability weights assigned.
Description of consensus economic scenarios
The economic assumptions presented in this section have been formed by HSBC, with reference to external forecasts specifically for the purpose of calculating ECL. The emergent nature of the Covid-19 outbreak at the end of 2019 meant that, consistent with other banks, HSBC’s view of the distribution of risks, as disclosed in the Annual Report and Accounts 2019, did not, on a forward-looking basis, consider the impact of the virus. Our consensus Central scenario at the 2019 year-end projected moderate growth over a five-year horizon, with strong prospects for employment and a gradual increase in policy interest rates by central banks in the major economies of Europe and North America. The onset of the virus has led to a fundamental reassessment of our central forecast and the distribution of risks.
Economic forecasts are subject to a high degree of uncertainty in the current environment. Limitations of forecasts and economic models require a greater reliance on management judgement in addressing both the error inherent in economic forecasts and in assessing associated ECL outcomes.
| 60 | HSBC Holdings plc Interim Report 2020 |
The main factors that affect uncertainty across our key markets are:
| • | epidemiological concerns, including a possible resurgence of Covid-19 later in 2020 and in 2021; |
| • | the ability of new or continued restrictions in individual markets to affect global growth due to deep cross-border trade and financial linkages; |
| • | the ability of governments and central banks to continue to limit the economic damage through support measures; |
| • | the potential for other geopolitical and macroeconomic risks to affect growth and economic stability as the world recovers from Covid-19-related restrictions; and |
| • | market-specific differences in the progression of Covid-19 and the associated responses by public authorities that imply differentiation in the degree of uncertainty across our key markets. Earlier progression of Covid-19 in Hong Kong and in mainland China meant that economic forecasts for these markets demonstrated greater stability over the course of 2Q20 compared with the UK, where a rapidly evolving situation has led to a higher degree of uncertainty. |
Economic forecasts and data released since the creation of scenarios in May confirmed the view of elevated uncertainty in some markets such as in the UK, where monthly GDP and unemployment data suggested a larger degree of estimation error than usual in short-term forecasts. The volatility in economic data and forecasts received since the generation of scenarios has been considered by management and is reflected in management’s choice of scenarios, in probability weights and in its assessment of ECL outcomes.
The scenarios used to calculate ECL in the Interim Report 2020 are described below.
The consensus Central scenario
HSBC’s Central scenario features a ‘V-shaped’ shock to economic activity, as characterised by a deep, initial contraction in GDP, followed by a sharp recovery. This V-shape in activity reflects the unique nature of this downturn and is driven by restrictions on mobility and activity imposed by governments to reduce the spread of Covid-19. The Central scenario further assumes that the stringent restrictions on activity, employed across several countries and territories in the first half of 2020, will not be repeated, allowing economic activity to rebound. Minimal long-term damage to economic prospects is expected, allowing economic growth across our key markets to return to forecast trend rates. Cross-region differences in the depth of the contraction, and the speed and scale of subsequent recovery, reflect timing differences in the progression of the Covid-19 outbreak, national level differences in restrictions imposed and the scale of support measures.
Global GDP is expected to contract by 3.9% in 2020 and grow by 4.8% in 2021 in the Central scenario. The average rate of global GDP growth is expected to be 2.7% over the forecast period 2020–2025, which is slightly lower than the average growth rate over the 2015–2019 period.
The unique circumstances surrounding the current fall in economic activity make it difficult to compare current prospects for global economic activity with previous recessions. However, we note that the depth of the contraction in economic activity and the subsequent recovery are both expected to be sharper than experienced during the last global economic downturn of 2008–2009 across our key markets (see chart below).
Across the key markets, we note:
| • | Economic activity has fallen significantly in 1H20 across our major markets. The earlier outbreak of the virus in China and Hong Kong suggests that the trough in economic activity in these markets occurred in 1Q20, while in other major markets, the lowest point in activity is expected to have occurred in 2Q20. The Central scenario projects an annual contraction in GDP across almost all our major markets in 2020, the only exception being China, where annual GDP growth is expected to be positive, despite the strong fall in activity experienced in the first quarter of the year. GDP is expected to be positive across all our major markets in 2021. |
| • | The unemployment rate is expected to rise sharply in most of our major markets, before reverting gradually to pre-crisis levels over the forecast horizon. |
| • | Inflation is expected to fall sharply in 2020 in line with the slowdown in economic activity, before increasing to gradually converge to central bank targets in our key markets over the forecast period. |
| • | Governments have provided extensive support to households and corporates in our key markets. Fiscal deficits are expected to increase sharply in 2020 before reducing in the later years of the projection period. Sovereign indebtedness is expected to increase sharply as a result. |
| • | Major central banks have lowered their main policy interest rates, implemented emergency support measures for funding markets, and either restarted or increased quantitative easing programmes, in order to support economies and the financial system. Interest rate policy is expected to be highly accommodative over the projection horizon. |
| • | The West Texas Intermediate oil price is forecast to average $37 per barrel over the projection period. |
The Central scenario was first created with forecasts available in May, and subsequently updated in June to reflect significant changes to forecasts. The UK unemployment rate was the only variable to have been amended as a result of this update. Probability weights assigned to the Central scenario reflect both the higher level of uncertainty in the current global economic environment and relative differences across markets. Weights assigned to the Central scenario vary from 55% to 70%.
HSBC Holdings plc Interim Report 2020 | 61 |
Risk
The following table describes key macroeconomic variables and the probabilities assigned in the consensus Central scenario.
| Central scenario (3Q20–2Q25) | ||||||||||||||||
| UK | US | Hong Kong | Mainland China | Canada | France | UAE | Mexico | |||||||||
| % | % | % | % | % | % | % | % | |||||||||
| GDP growth | ||||||||||||||||
| Annual average growth rate: 2020 | (7.8 | ) | (5.2 | ) | (4.8 | ) | 1.4 | (7.1 | ) | (8.7 | ) | (2.7 | ) | (7.4 | ) | |
| Annual average growth rate: 2021 | 5.9 | 4.1 | 4.2 | 8.1 | 5.5 | 7.2 | 3.1 | 2.5 | ||||||||
| 1Q22–2Q25: average growth | 1.9 | 2.4 | 2.3 | 5.3 | 2.1 | 1.7 | 3.0 | 2.3 | ||||||||
| 3Q20–2Q22: worst quarter | (8.6) (3Q20) | (6.6) (3Q20) | (2.6) (3Q20) | 3.3 (4Q21) | (8.2) (3Q20) | (8.9) (3Q20) | (2.9) (3Q20) | (8.8) (3Q20) | ||||||||
| Unemployment rate | ||||||||||||||||
| Annual average: 2020 | 6.8 | 9.5 | 4.6 | 4.5 | 10 | 9.8 | N/A | 5.3 | ||||||||
| Annual average: 2021 | 6.3 | 7.3 | 4.1 | 4.2 | 8.1 | 10.0 | N/A | 5.1 | ||||||||
| 1Q22–2Q25: average | 4.7 | 5.6 | 3.7 | 3.9 | 6.5 | 8.9 | N/A | 4.5 | ||||||||
| 3Q20–2Q22: worst quarter | 8.1 (3Q20) | 11.0 (3Q20) | 4.8 (3Q20) | 4.6 (3Q20) | 11.1 (3Q20) | 10.6 (3Q20) | N/A | 6.1 (3Q20) | ||||||||
| House price index | ||||||||||||||||
| Annual average growth rate: 2020 | (2.2 | ) | 1.7 | (7.9 | ) | 1.8 | 0.2 | (0.5 | ) | (13.0 | ) | 4.8 | ||||
| Annual average growth rate: 2021 | 0.9 | (2.6 | ) | 0.4 | 2.6 | 2.1 | (0.3 | ) | (10.2 | ) | 2.9 | |||||
| 1Q22–2Q25: average growth | 3.7 | 2.3 | 3.4 | 5.4 | 3.4 | 3.4 | 2.1 | 5.3 | ||||||||
| 3Q20–2Q22: worst quarter | (3.4) (4Q20) | (3.6) (2Q21) | (11.5) (3Q20) | 1.3 (1Q21) | (4.0) (1Q21) | (3.9) (4Q20) | (18.2) (4Q20) | 2.5 (1Q21) | ||||||||
| 10-year bond yield | ||||||||||||||||
| Annual average: 2020 | 0.5 | 0.9 | 1.2 | N/A | 0.8 | 0.0 | N/A | 7.1 | ||||||||
| Annual average: 2021 | 0.8 | 1.2 | 1.7 | N/A | 1.1 | 0.2 | N/A | 6.8 | ||||||||
| 1Q22–2Q25: average | 1.6 | 2.2 | 2.2 | N/A | 1.9 | 0.9 | N/A | 7.4 | ||||||||
| 3Q20–2Q22: worst quarter | 0.4 (3Q20) | 0.8 (3Q20) | 1.2 (3Q20) | N/A | 0.7 (3Q20) | 0.0 (3Q20) | N/A | 6.6 (4Q21) | ||||||||
| Probability | 60 | 70 | 70 | 70 | 70 | 70 | 60 | 55 | ||||||||
Note: N/A – not required in credit models.
| GDP growth: Historical comparison |
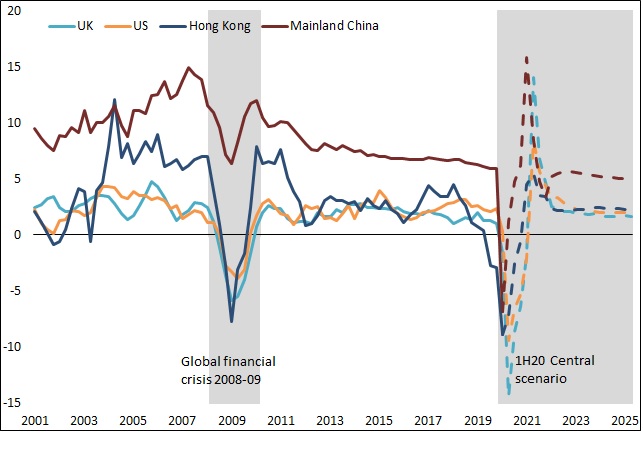
Note: Real GDP shown as year-on-year percentage change.
The consensus Upside scenario
Compared with the consensus Central scenario, the consensus Upside scenario features a faster recovery in economic activity during the first two years, before converging to long-run trends. Despite this feature, the scenario forecasts 2020 as a year in which global GDP growth contracts and several quarters elapse before economic activity reaches the level attained at the end of 2019, prior to the onset of the Covid-19 outbreak.
The scenario is consistent with a number of key upside risk themes. These include orderly global abatement of Covid-19 via successful containment and/or the development of a vaccine, deescalation of tensions between the US and China, continued support from fiscal and monetary policy, positive resolution of economic uncertainty in the UK, stronger oil prices and deescalation of geopolitical tensions in Hong Kong.
Probability weights assigned to the Upside scenario range from 0% to 10%. These weights reflect management’s view of the
potential for more positive outcomes relative to the Central scenario in our key markets.
The consensus Downside scenario
Global real GDP growth contracts significantly in 2020 in the Downside scenario, accompanied by a sharp increase in unemployment, and falls in asset and consumer prices, before gradually recovering towards its long-run trend. Compared with the Central scenario, the recovery in economic activity is considerably weaker.
The scenario is consistent with our key downside risks. These include renewed outbreaks of Covid-19 and/or slower easing of restriction of travel and activity, an intensification of tensions between the US and China, a worsening of economic uncertainty in the UK, further risks to economic growth in Hong Kong and weaker commodity prices.
A broad range of weights has been assigned to the consensus Downside scenario. These range from 0% to 35% and reflect management’s view of the dispersion of risks and severity across key markets.
UK management Downside scenario
The consensus Downside scenario was replaced with a management Downside scenario for the UK only, to reflect management’s view of the dispersion of risks. Management took the view that this scenario provided a better representation of risks that lie in between the Central and the alternative Downside scenario. In this scenario, UK GDP falls 9.6% in 2020 and UK unemployment peaks at 8.5% in 2021. This scenario has been assigned a 20% probability.
Alternative Downside scenario
An alternative Downside scenario has been created to reflect management’s view of extreme risks. This ‘U-shaped’ scenario assumes that a number of HSBC’s top risks crystallise simultaneously and results in an extremely severe and prolonged recession. This scenario has been assigned a 5% probability across all markets except the UK where it has been assigned a 10% weighting.
| 62 | HSBC Holdings plc Interim Report 2020 |
The range of macroeconomic projections across the various scenarios are shown in the table below:
| Outer scenario ranges (3Q20–2Q25) | ||||||||
| UK | US | Hong Kong | Mainland China | Canada | France | UAE | Mexico | |
| % | % | % | % | % | % | % | % | |
| GDP growth | (8.3) to (16.7) (3Q20) (1Q21) | (6.0) to (12.8) (3Q20) (3Q20) | (1.5) to (15.8) (3Q20) (3Q20) | 3.9 to (7.2) (4Q21) (3Q20) | (8.1) to (14.3) (3Q20) (2Q21) | (8.7) to (22.0) (3Q20) (3Q20) | (2.3) to (13.3) (3Q20) (2Q21) | (7.9) to (14.8) (3Q20) (1Q21) |
| Unemployment rate | 8.0 to 10.5 (3Q20) (2Q21) | 10.5 to 18.2 (3Q20) (3Q20) | 4.5 to 8.0 (3Q20) (1Q21) | 4.5 to 6.1 (3Q20) (1Q22) | 11 to 19.5 (3Q20) (3Q20) | 10 to 11.5 (3Q20) (1Q21) | N/A | 5.8 to 7.3 (3Q20) (4Q21) |
| House price index | (2.8) to (24.7) (3Q20) (2Q21) | (1.7) to (15.6) (1Q21) (2Q21) | (10.3) to (26.3) (3Q20) (1Q21) | 3.3 to (25.8) (3Q20) (3Q21) | (1.3) to (27.6) (3Q20) (2Q21) | (2.4) to (13.4) (4Q20) (3Q21) | (13.9) to (25.7) (3Q20) (2Q21) | 3.2 to (16.0) (4Q20) (2Q21) |
| 10-year bond yield | 0.5 to (1.7) (3Q20) (3Q21) | 0.8 to (0.2) (3Q20) (2Q21) | 1.2 to (0.8) (3Q20) (1Q21) | N/A | 0.7 to (0.2) (3Q20) (2Q21) | 0.1 to (0.5) (3Q20) (2Q22) | N/A | 7.2 to 10.2 (4Q20) (4Q20) |
| Consensus Upside scenario: Probability | 10 | 5 | 5 | 10 | 10 | 10 | 0 | 5 |
| Consensus Downside scenario: Probability | 0 | 20 | 20 | 15 | 15 | 15 | 35 | 35 |
| UK management Downside scenario: Probability | 20 | |||||||
| Alternative Downside scenario: Probability | 10 | 5 | 5 | 5 | 5 | 5 | 5 | 5 |
Note: The worst point refers to the quarter that is either the trough or peak in the respective variable. The figures provided represent the worst point across all four outer scenarios: the consensus Upside, the consensus Downside, the UK management Downside and the alternative Downside. These figures should not be directly compared with the annual averages presented in the previous table for the Central scenario. N/A – not required in credit models.
| US GDP growth |
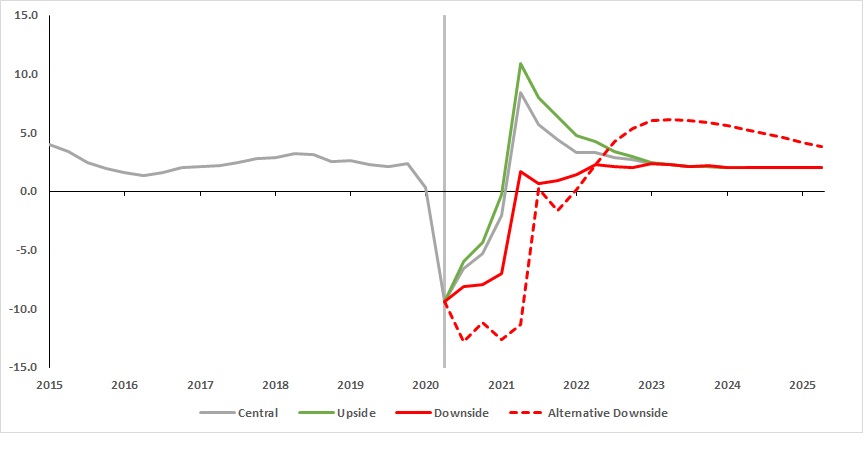
| UK GDP growth |
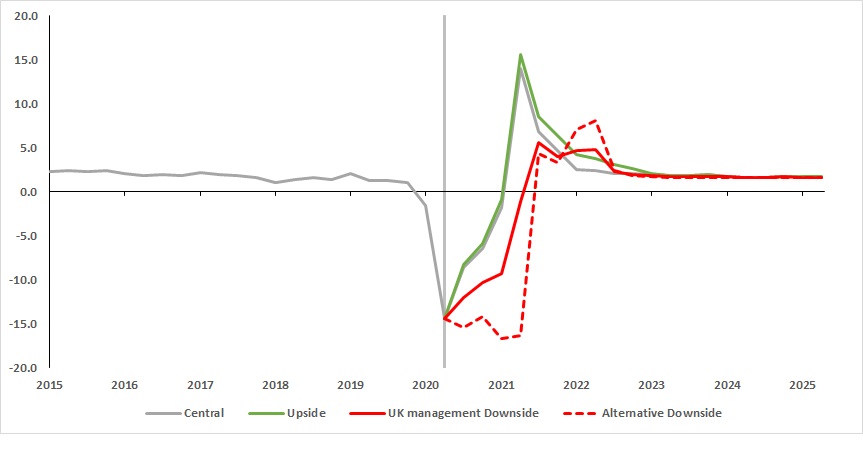 Note: Real GDP shown as year-on-year percentage change.
| Hong Kong GDP growth |
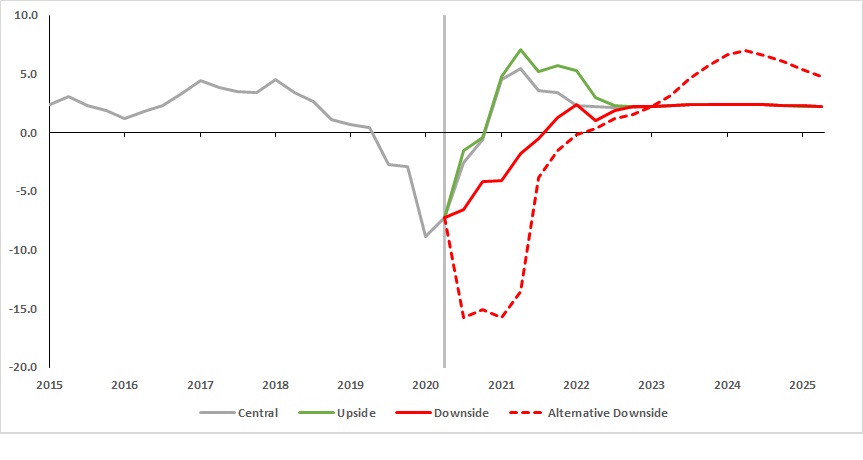
| Mainland China GDP growth |
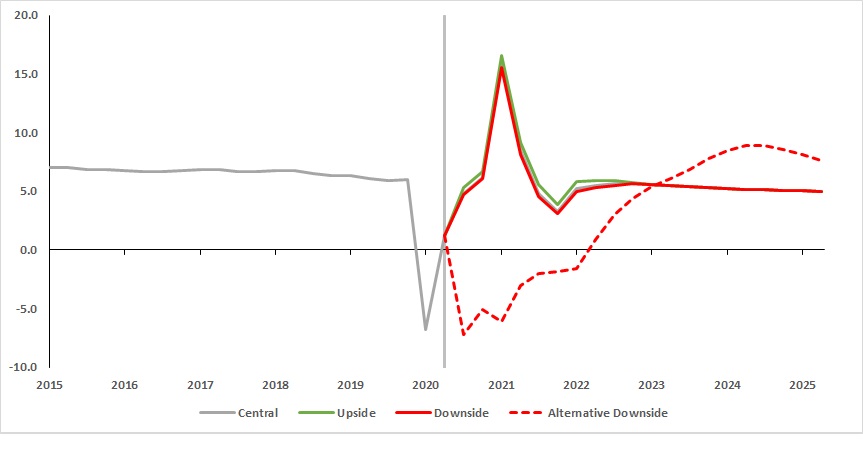
HSBC Holdings plc Interim Report 2020 | 63 |
Risk
Critical accounting estimates and judgements
The calculation of ECL under IFRS 9 involves significant judgements, assumptions and estimates, as set out in the Annual Report and Accounts 2019 under ‘Critical accounting estimates and judgements’. The level of estimation uncertainty and judgement has increased since 31 December 2019 as a result of the economic effects of the Covid-19 outbreak, including significant judgements relating to:
| • | the selection and weighting of economic scenarios, given rapidly changing economic conditions in an unprecedented manner, uncertainty as to the effect of government and central bank support measures designed to alleviate adverse economic impacts, and a widening in the distribution of economic forecasts. The key judgement is whether the economic effects of the pandemic are more likely to be temporary or prolonged, and the shape of recovery; |
| • | estimating the economic effects of those scenarios on ECL, where there is no observable historical trend that can be reflected in the models that will accurately represent the effects of the economic changes of the severity and speed brought about by the Covid-19 outbreak. Modelled assumptions and linkages between economic factors and credit losses may underestimate or overestimate ECL in these conditions, and there is significant uncertainty in the estimation of parameters such as collateral values and loss severity; and |
| • | the identification of customers experiencing significant increases in credit risk and credit impairment, particularly where those customers have accepted payment deferrals and other reliefs designed to address short-term liquidity issues, or have extended those deferrals, given limitations in the available credit information on these customers. The use of segmentation techniques for indicators of significant increases in credit risk involves significant estimation uncertainty. |
How economic scenarios are reflected in ECL
The methodologies for the application of forward economic guidance into the calculation of ECL for wholesale and retail loans and portfolios are set out on page 95 of the Annual Report and Accounts 2019. These models are based largely on historical observations and correlations with default rates.
The severe projections at 30 June 2020 of macroeconomic variables are outside the historical observations on which IFRS 9 models have been built and calibrated to operate. Moreover, the complexities of governmental support programmes and regulatory guidance on treatment of customer impacts (such as forbearance and payment holidays) and the unpredictable pathways of the pandemic have never been modelled. Consequently, HSBC’s IFRS 9 models, in some cases, generate outputs that appear overly conservative when compared with other economic and credit metrics. Post-model adjustments are required to ensure that an appropriate amount of ECL impairment is recognised.
These data and model limitations have been addressed in the short term using in-model and post-model adjustments. This includes refining model inputs and outputs and using post-model adjustments based on management judgement and higher level quantitative analysis for impacts that are difficult to model. To ensure a consistent framework, we identified the model segments where results were overly conservative based on historical benchmarks and defined the worst economic inputs where the model output is considered reliable. For example, in the case of probability of default (‘PD’) models for bank and sovereign exposures, based on the historical calibration data, the model was defined as producing meaningful results when the GDP growth input is not worse than five standard deviations below the long-term average. Re-running the models with these capped economic limits established boundary conditions used by credit experts as a starting point for further adjustments based on their own structured judgement and granular analysis. For the wholesale portfolio, this analysis produced a ‘credit experts best estimate’ to act as a benchmark against the modelled outcomes, and inform post-model adjustments. In the short term, the focus is on refining model inputs and outputs in a consistent and explainable manner,
using post-model adjustments. Wider-ranging model changes will take time to develop and need more real data on which models can be trained.
Models will be recalibrated over time once the full impacts of Covid-19 are observed, but that will not occur in 2020. Therefore, we anticipate significant in-model and post-model adjustments for the foreseeable future.
Post-model adjustments
In the context of IFRS 9, post-model adjustments are short-term increases or decreases to the ECL at either a customer or portfolio level to account for late breaking events, model deficiencies and expert credit judgement applied following management review and challenge. We have internal governance in place to regularly monitor post-model adjustments and, where possible, to reduce the reliance on these through model recalibration or redevelopment, as appropriate. Depending on the path of the Covid-19 outbreak and the shape of the economic recovery, we anticipate the composition of modelled ECL and post-model adjustments may be revised significantly over 2020, particularly when the economy resumes positive GDP growth and the uncertainty over long-term unemployment abates.
Post-model adjustments made in estimating the reported ECL at 30 June 2020 are set out in the following table. The table includes adjustments in relation to data and model limitations resulting from Covid-19 economic conditions, and as a result of the regular process of model development and implementation. It shows the adjustments applicable to the scenario-weighted ECL numbers. Adjustments in relation to Downside scenarios are more significant, as results are subject to greater uncertainty.
| Net post-model reductions in ECL ($bn) | Retail | Wholesale | Total | |||
| Low-risk counterparties and economies (banks, sovereigns and government entities) | 0.4 | 1.1 | 1.5 | |||
| Corporate lending adjustments | — | 2.8 | 2.8 | |||
| Retail lending adjustments | 0.2 | — | 0.2 | |||
| Total | 0.6 | 3.9 | 4.5 | |||
Post-model adjustments at 31 December 2019 were an increase of $75m for the wholesale portfolio and $131m for the retail portfolio.
The adjustments relating to low-credit-risk exposures are mainly to highly rated banks, sovereigns and US government-sponsored entities, where modelled credit factors do not fully reflect the underlying fundamentals of these entities or the effect of government support and economic programmes in the Covid-19 environment.
Adjustments to corporate exposures principally reflect the outcome of the ‘credit experts best estimate’ review on wholesale corporate exposures. Post-model adjustments, both positive and negative, have been made where modelled rating migration, and ECL outputs based on historical relationships, produced results that were overly sensitive. This can be the case when using economic inputs that are well outside the range of historical experience. For retail lending, the net impact of model adjustments was much less significant. The adjustment, under low-risk counterparties and economies, was to reduce ECL on insurance portfolios due to model over-prediction of downgrades in the bank and sovereign portfolios.
The main retail lending post-model adjustment was in relation to the UK where modelled PD outputs for the Downside scenarios were adjusted to address model limitations, so as to be consistent with longer-term relationships between unemployment and defaults.
Economic scenarios sensitivity analysis of ECL estimates
Management considered the sensitivity of the ECL outcome against the economic forecasts as part of the ECL governance process by recalculating the ECL under each scenario described above for selected portfolios, applying a 100% weighting to each scenario in turn. The weighting is reflected in both the
| 64 | HSBC Holdings plc Interim Report 2020 |
determination of a significant increase in credit risk and the measurement of the resulting ECL.
The ECL calculated for the Upside and Downside scenarios should not be taken to represent the upper and lower limits of possible ECL outcomes. The impact of defaults that might occur in future under different economic scenarios is captured by recalculating ECL for loans in stages 1 and 2 at the balance sheet date. The population of stage 3 loans (in default) at the balance sheet date is unchanged in these sensitivity calculations. Stage 3 ECL would only be sensitive to changes in forecasts of future economic conditions if the loss-given default (‘LGD’) of a particular portfolio was sensitive to these changes.
There is a particularly high degree of estimation uncertainty in numbers representing tail risk scenarios when assigned a 100% weighting.
For wholesale credit risk exposures, the sensitivity analysis excludes ECL and financial instruments related to defaulted obligors because the measurement of ECL is relatively more sensitive to credit factors specific to the obligor than future
economic scenarios. Therefore, it is impracticable to separate the effect of macroeconomic factors in individual assessments.
For retail credit risk exposures, the sensitivity analysis includes ECL for loans and advances to customers related to defaulted obligors. This is because the retail ECL for secured mortgage portfolios including loans in all stages is sensitive to macroeconomic variables.
Wholesale and retail sensitivity
The wholesale and retail sensitivity analysis is stated inclusive of post-model adjustments, as appropriate to each scenario. The results tables exclude portfolios held by insurance business and small portfolios
In both the wholesale and retail analysis, the comparative period results for alternative Downside scenarios are not directly comparable to the current period, because they reflect different risk profiles relative with the Consensus scenarios for the period end.
Wholesale analysis
IFRS 9 ECL sensitivity to future economic conditions1 | ||||||||||||||||
| UK | US | Hong Kong | Mainland China | Canada | Mexico | UAE | France | |||||||||
ECL coverage of financial instruments subject to significant measurement uncertainty at 30 June 20202 | $m | $m | $m | $m | $m | $m | $m | $m | ||||||||
| Reported ECL | 1,729 | 407 | 537 | 157 | 239 | 218 | 227 | 121 | ||||||||
| Consensus scenarios | ||||||||||||||||
| Central scenario | 1,538 | 336 | 449 | 122 | 208 | 171 | 186 | 104 | ||||||||
| Upside scenario | 1,350 | 226 | 348 | 76 | 151 | 137 | 126 | 98 | ||||||||
Downside scenario3 | 2,027 | 570 | 687 | 211 | 294 | 255 | 262 | 187 | ||||||||
| Alternative scenarios | ||||||||||||||||
| Alternative Downside scenario | 2,933 | 1,059 | 1,706 | 1,273 | 647 | 574 | 711 | 304 | ||||||||
Gross carrying amount/nominal amount4 | 406,516 | 213,202 | 433,950 | 108,954 | 81,583 | 27,860 | 45,614 | 136,810 | ||||||||
ECL coverage of financial instruments subject to significant measurement uncertainty at 31 December 20192 | ||||||||||||||||
| Reported ECL | 725 | 148 | 328 | 124 | 80 | 69 | 97 | 55 | ||||||||
| Consensus scenarios | ||||||||||||||||
| Central scenario | 536 | 149 | 243 | 118 | 79 | 68 | 97 | 53 | ||||||||
| Upside scenario | 480 | 132 | 241 | 95 | 63 | 48 | 89 | 50 | ||||||||
| Downside scenario | 635 | 161 | 244 | 106 | 108 | 99 | 108 | 79 | ||||||||
| Alternative scenarios | ||||||||||||||||
| UK alternative Downside scenario 1 | 1,050 | |||||||||||||||
| Tail risk scenarios (UK alternative Downside scenarios 2 and 3) | 1,900 - 2,100 | |||||||||||||||
| Asia-Pacific alternative Downside scenario | 550 | 150 | ||||||||||||||
| Hong Kong alternative Downside scenario | 700 | |||||||||||||||
Gross carrying amount/nominal amount4 | 346,035 | 203,610 | 418,102 | 104,004 | 74,620 | 32,632 | 42,304 | 124,618 | ||||||||
| 1 | ECL sensitivities exclude portfolios utilising less complex modelling approaches. |
| 2 | ECL sensitivity includes off-balance sheet financial instruments that are subject to significant measurement uncertainty. |
| 3 | For the UK, this is the UK management Downside scenario. |
| 4 | Includes low credit-risk financial instruments, such as debt instruments at FVOCI, which have high carrying values but low ECL under all the scenarios. |
In the wholesale portfolio, at 30 June 2020, the alternative Downside scenario reflected the most significant levels of ECL sensitivity, in absolute terms, in the UK, Hong Kong and mainland China due to potential for deterioration of the credit quality on those markets and levels of exposure.
ECL sensitivities demonstrated an increase from the 2019 year-end across all countries and territories, primarily due to the deterioration of economic forecasts under all scenarios.
The UK observed the highest sensitivity when compared with 4Q19, mainly due to the deterioration of economic forecasts, with
an emphasis on the unemployment rate in the June 2020 economic forecasts.
The higher ECL sensitivities can all be observed for the alternative Downside scenario, which represents a prolonged recovery period and sharper impact relative to other scenarios.
HSBC Holdings plc Interim Report 2020 | 65 |
Risk
Retail analysis
IFRS 9 ECL sensitivity to future economic conditions1 | ||||||||||||||||||||
| UK | Mexico | Hong Kong | UAE | France | US | Malaysia | Singapore | Australia | Canada | |||||||||||
ECL of loans and advances to customers at 30 June 20202 | $m | $m | $m | $m | $m | $m | $m | $m | $m | $m | ||||||||||
| Reported ECL | 1,704 | 631 | 385 | 250 | 138 | 129 | 122 | 70 | 61 | 46 | ||||||||||
| Consensus scenarios | ||||||||||||||||||||
| Central scenario | 1,592 | 595 | 349 | 237 | 137 | 118 | 120 | 70 | 48 | 42 | ||||||||||
| Upside scenario | 1,364 | 540 | 319 | 210 | 135 | 107 | 114 | 67 | 32 | 38 | ||||||||||
Downside scenario3 | 1,912 | 683 | 418 | 265 | 146 | 163 | 126 | 80 | 83 | 49 | ||||||||||
| Alternative scenarios | ||||||||||||||||||||
| Alternative Downside scenario | 2,253 | 814 | 772 | 310 | 144 | 236 | 160 | 119 | 216 | 124 | ||||||||||
| Gross carrying amount | 139,599 | 6,293 | 100,916 | 3,188 | 23,453 | 15,849 | 5,360 | 7,701 | 18,115 | 21,746 | ||||||||||
ECL of loans and advances to customers at 31 December 20192 | ||||||||||||||||||||
| Reported ECL | 936 | 584 | 349 | 174 | 133 | 90 | 94 | 60 | 38 | 39 | ||||||||||
| Consensus scenarios | ||||||||||||||||||||
| Central scenario | 773 | 583 | 296 | 173 | 133 | 90 | 94 | 58 | 37 | 39 | ||||||||||
| Upside scenario | 686 | 526 | 282 | 158 | 132 | 84 | 85 | 57 | 32 | 36 | ||||||||||
| Downside scenario | 918 | 652 | 306 | 193 | 133 | 98 | 106 | 58 | 45 | 41 | ||||||||||
| Alternative scenarios | ||||||||||||||||||||
| UK alternative Downside scenario 1 | 1,200 | |||||||||||||||||||
| Tail risk scenarios (UK alternative Downside scenarios 2 and 3) | 1,500–1,700 | |||||||||||||||||||
| Asia-Pacific alternative Downside scenario | 530 | 110 | 80 | 50 | ||||||||||||||||
| Hong Kong alternative Downside scenario | 540 | |||||||||||||||||||
| Gross carrying amount | 149,576 | 7,681 | 101,689 | 3,391 | 23,017 | 15,470 | 5,839 | 8,164 | 17,258 | 22,344 | ||||||||||
| 1 | ECL sensitivities exclude portfolios utilising less complex modelling approaches. |
| 2 | ECL sensitivity includes only on-balance sheet financial instruments to which IFRS 9 impairment requirements are applied. |
| 3 | For the UK, this is the UK management Downside scenario. |
In the retail portfolio at 30 June 2020, the alternative Downside scenario reflected the most significant level of ECL sensitivity, in absolute terms, in the UK, Mexico and Hong Kong due to the levels of exposure and credit quality of those markets.
Across all countries and territories, primarily due to the worsening of the economic forecasts, ECL sensitivities demonstrated an increase from the 2019 year-end. In the UK, there was an increase in ECL sensitivity observed in all scenarios compared with 4Q19. This was primarily due to the worsening of the unemployment rates in the June 2020 economic forecasts. The alternative Downside scenario ECL sensitivity is reflective of a significantly more pessimistic view of the economy and external environment.
Group ECL sensitivity results
The ECL income statement charge for the first half of 2020 was $6.9bn, of which $3.0bn related to stage 3 financial instruments. The ECL impact of the scenarios and judgemental management adjustments are highly sensitive to movements in economic forecasts, including the efficacy of government support measures. Based upon the sensitivity tables presented above, if the Group ECL balance (excluding wholesale stage 3, which is assessed individually) was estimated solely on the basis of the Central scenario, Downside scenario or the alternative Downside scenario at 30 June 2020, it would increase/(decrease) as presented in the below table.
Retail 2 | Wholesale 2 | |||
| Total Group ECL | $bn | $bn | ||
| Reported ECL | 4.0 | 4.3 | ||
| Scenarios | ||||
| 100% consensus Central scenario | (0.2 | ) | (0.5 | ) |
100% consensus Downside scenario1 | 0.4 | 1.0 | ||
| 100% alternative Downside scenario | 1.9 | 6.8 | ||
| 1 | For the UK, this is the UK management Downside scenario. |
| 2 | On same basis as wholesale and retail sensitivity analysis. |
Reconciliation of changes in gross carrying/nominal amount and allowances for loans and advances to banks and customers
The following disclosure provides a reconciliation by stage of the Group’s gross carrying/nominal amount and allowances for loans and advances to banks and customers, including loan commitments and financial guarantees. Movements are calculated on a quarterly basis and therefore fully capture stage movements between quarters. If movements were calculated on a year-to-date basis they would only reflect the opening and closing position of the financial instrument.
The transfers of financial instruments represent the impact of stage transfers upon the gross carrying/nominal amount and associated allowance for ECL.
The net remeasurement of ECL arising from stage transfers represents the increase or decrease due to these transfers, for example, moving from a 12-month (stage 1) to a lifetime (stage 2) ECL measurement basis. Net remeasurement excludes the underlying customer risk rating (‘CRR’)/probability of default (‘PD’) movements of the financial instruments transferring stage. This is captured, along with other credit quality movements in the ‘changes in risk parameters – credit quality’ line item.
Changes in ‘New financial assets originated or purchased’, ‘assets derecognised (including final repayments)’ and ‘changes to risk parameters – further lending/repayments’ represent the impact from volume movements within the Group’s lending portfolio.
| 66 | HSBC Holdings plc Interim Report 2020 |
| Reconciliation of changes in gross carrying/nominal amount and allowances for loans and advances to banks and customers including loan commitments and financial guarantees | ||||||||||||||||||||
| Non-credit impaired | Credit impaired | |||||||||||||||||||
| Stage 1 | Stage 2 | Stage 3 | POCI | Total | ||||||||||||||||
| Gross carrying/ nominal amount | Allowance for ECL | Gross carrying/ nominal amount | Allowance for ECL | Gross carrying/ nominal amount | Allowance for ECL | Gross carrying/ nominal amount | Allowance for ECL | Gross carrying/ nominal amount | Allowance for ECL | |||||||||||
| $m | $m | $m | $m | $m | $m | $m | $m | $m | $m | |||||||||||
| At 1 Jan 2020 | 1,561,613 | (1,464 | ) | 105,551 | (2,441 | ) | 14,335 | (5,121 | ) | 345 | (99 | ) | 1,681,844 | (9,125 | ) | |||||
| Transfers of financial instruments: | (138,661 | ) | (148 | ) | 131,316 | 498 | 7,345 | (350 | ) | — | — | — | — | |||||||
| – transfers from stage 1 to stage 2 | (175,849 | ) | 489 | 175,849 | (489 | ) | — | — | — | — | — | — | ||||||||
| – transfers from stage 2 to stage 1 | 39,559 | (638 | ) | (39,559 | ) | 638 | — | — | — | — | — | — | ||||||||
| – transfers to stage 3 | (2,724 | ) | 11 | (5,434 | ) | 392 | 8,158 | (403 | ) | — | — | — | — | |||||||
| – transfers from stage 3 | 353 | (10 | ) | 460 | (43 | ) | (813 | ) | 53 | — | — | — | — | |||||||
| Net remeasurement of ECL arising from transfer of stage | — | 355 | — | (558 | ) | — | (712 | ) | — | — | — | (915 | ) | |||||||
| Changes due to modifications not derecognised | — | — | — | — | — | — | — | — | — | — | ||||||||||
| New financial assets originated or purchased | 215,501 | (291 | ) | — | — | — | — | 12 | — | 215,513 | (291 | ) | ||||||||
| Asset derecognised (including final repayments) | (163,342 | ) | 52 | (12,522 | ) | 203 | (1,064 | ) | 176 | (20 | ) | 1 | (176,948 | ) | 432 | |||||
| Changes to risk parameters – further lending/repayments | 13,119 | (169 | ) | 2,831 | (221 | ) | (300 | ) | 63 | (31 | ) | (1 | ) | 15,619 | (328 | ) | ||||
| Change in risk parameters – credit quality | — | (620 | ) | — | (2,561 | ) | — | (2,266 | ) | — | (3 | ) | — | (5,450 | ) | |||||
| Changes to models used for ECL calculation | — | 30 | — | (63 | ) | — | (9 | ) | — | — | — | (42 | ) | |||||||
| Assets written off | — | — | — | — | (1,249 | ) | 1,249 | — | — | (1,249 | ) | 1,249 | ||||||||
| Credit-related modifications that resulted in derecognition | — | — | — | — | (1 | ) | — | — | — | (1 | ) | — | ||||||||
| Foreign exchange | (43,145 | ) | 90 | (2,672 | ) | 162 | (588 | ) | 196 | (13 | ) | 4 | (46,418 | ) | 452 | |||||
| Other | 36 | 12 | 93 | (7 | ) | 16 | (8 | ) | 7 | (1 | ) | 152 | (4 | ) | ||||||
| At 30 Jun 2020 | 1,445,121 | (2,153 | ) | 224,597 | (4,988 | ) | 18,494 | (6,782 | ) | 300 | (99 | ) | 1,688,512 | (14,022 | ) | |||||
ECL income statement change for the period1 | (643 | ) | (3,200 | ) | (2,748 | ) | (3 | ) | (6,594 | ) | ||||||||||
| Recoveries | 127 | |||||||||||||||||||
| Other | 3 | |||||||||||||||||||
| Total ECL income statement change for the period | (6,464 | ) | ||||||||||||||||||
| 1 | In addition to the $2.8bn stage 3 (personal: $0.6bn, wholesale: $2.2bn) and POCI ECL income statement charge for the period presented above, the Group also recognised a stage 3 and POCI ECL income statement charge of $0.2bn in respect of other financial assets measured at amortised cost, performance and other guarantees and debt instruments measured at FVOCI. |
| At 30 Jun 2020 | 6 months ended 30 Jun 2020 | |||||
| Gross carrying/nominal amount | Allowance for ECL | ECL charge | ||||
| $m | $m | $m | ||||
| As above | 1,688,512 | (14,022 | ) | (6,464 | ) | |
| Other financial assets measured at amortised cost | 751,872 | (243 | ) | (127 | ) | |
| Non-trading reverse purchase agreement commitments | 86,949 | — | — | |||
| Performance and other guarantees | — | — | (157 | ) | ||
| Summary of financial instruments to which the impairment requirements in IFRS 9 are applied/Summary consolidated income statement | 2,527,333 | (14,265 | ) | (6,748 | ) | |
| Debt instruments measured at FVOCI | 402,331 | (242 | ) | (110 | ) | |
| Total allowance for ECL/total income statement ECL charge for the period | n/a | (14,507 | ) | (6,858 | ) | |
As shown in the previous table, the allowance for ECL for loans and advances to customers and banks and relevant loan commitments and financial guarantees increased $4,897m during the period, from $9,125m at 31 December 2019 to $14,022m at
30 June 2020.
30 June 2020.
This increase was primarily driven by:
| • | $5,450m relating to underlying credit quality changes, including the credit quality impact of financial instruments transferring between stages; |
| • | $915m relating to the net remeasurement impact of stage transfers; |
| • | $187m relating to volume movements, which included the ECL allowance associated with new originations, assets derecognised and further pending repayment; and |
| • | $42m relating to changes to models used for ECL calculation. |
These increases were partly offset by:
| • | $1,249m of assets written off; and |
| • | foreign exchange and other movements of $448m. |
The ECL charge for the period of $6,594m presented in the previous table consisted of $5,450m relating to underlying credit quality changes, including the credit quality impact of financial
HSBC Holdings plc Interim Report 2020 | 67 |
Risk
instruments transferring between stage; $915m relating to the net remeasurement impact of stage transfers; $187m relating to
underlying net book volume; and $42m relating to changes to models used for ECL calculation.
| Reconciliation of changes in gross carrying/nominal amount and allowances for loans and advances to banks and customers including loan commitments and financial guarantees | ||||||||||||||||||||
| Non-credit impaired | Credit impaired | |||||||||||||||||||
| Stage 1 | Stage 2 | Stage 3 | POCI | Total | ||||||||||||||||
| Gross carrying/ nominal amount | Allowance for ECL | Gross carrying/ nominal amount | Allowance for ECL | Gross carrying/ nominal amount | Allowance for ECL | Gross carrying/ nominal amount | Allowance for ECL | Gross carrying/ nominal amount | Allowance for ECL | |||||||||||
| $m | $m | $m | $m | $m | $m | $m | $m | $m | $m | |||||||||||
| At 1 Jan 2019 | 1,502,976 | (1,449 | ) | 95,104 | (2,278 | ) | 14,232 | (5,135 | ) | 334 | (194 | ) | 1,612,646 | (9,056 | ) | |||||
| Transfers of financial instruments: | (36,244 | ) | (543 | ) | 31,063 | 1,134 | 5,181 | (591 | ) | — | — | — | — | |||||||
| – transfers from stage 1 to stage 2 | (108,434 | ) | 487 | 108,434 | (487 | ) | — | — | — | — | — | — | ||||||||
| – transfers from stage 2 to stage 1 | 73,086 | (1,044 | ) | (73,086 | ) | 1,044 | — | — | — | — | — | — | ||||||||
| – transfers to stage 3 | (1,284 | ) | 59 | (5,022 | ) | 665 | 6,306 | (724 | ) | — | — | — | — | |||||||
| – transfers from stage 3 | 388 | (45 | ) | 737 | (88 | ) | (1,125 | ) | 133 | — | — | — | — | |||||||
| Net remeasurement of ECL arising from transfer of stage | — | 669 | — | (676 | ) | — | (114 | ) | — | — | — | (121 | ) | |||||||
| New financial assets originated or purchased | 504,064 | (534 | ) | — | — | — | — | 135 | (21 | ) | 504,199 | (555 | ) | |||||||
| Assets derecognised (including final repayments) | (352,961 | ) | 112 | (19,909 | ) | 553 | (2,712 | ) | 656 | (26 | ) | 8 | (375,608 | ) | 1,329 | |||||
| Changes to risk parameters – further lending/repayment | (72,239 | ) | 291 | (2,560 | ) | 67 | 402 | (6 | ) | 28 | 12 | (74,369 | ) | 364 | ||||||
| Changes in risk parameters – credit quality | — | 2 | — | (1,208 | ) | — | (2,704 | ) | — | (51 | ) | — | (3,961 | ) | ||||||
| Changes to models used for ECL calculation | — | (6 | ) | — | 4 | — | 14 | — | — | — | 12 | |||||||||
| Assets written off | — | — | — | — | (2,657 | ) | 2,657 | (140 | ) | 140 | (2,797 | ) | 2,797 | |||||||
| Credit-related modifications that resulted in derecognition | — | — | — | — | (268 | ) | 125 | — | — | (268 | ) | 125 | ||||||||
| Foreign exchange | 16,838 | (9 | ) | 1,201 | (40 | ) | 160 | (31 | ) | 1 | 1 | 18,200 | (79 | ) | ||||||
| Other | (821 | ) | 3 | 652 | 3 | (3 | ) | 8 | 13 | 6 | (159 | ) | 20 | |||||||
| At 31 Dec 2019 | 1,561,613 | (1,464 | ) | 105,551 | (2,441 | ) | 14,335 | (5,121 | ) | 345 | (99 | ) | 1,681,844 | (9,125 | ) | |||||
| ECL income statement change for the period | 534 | (1,260 | ) | (2,154 | ) | (52 | ) | (2,932 | ) | |||||||||||
| Recoveries | 361 | |||||||||||||||||||
| Others | (20 | ) | ||||||||||||||||||
Total ECL income statement change for the period1 | (2,591 | ) | ||||||||||||||||||
| At 31 Dec 2019 | 12 months ended 31 Dec 2019 | |||||
| Gross carrying/nominal amount | Allowance for ECL | ECL charge | ||||
| $m | $m | $m | ||||
| As above | 1,681,844 | (9,125 | ) | (2,591 | ) | |
| Other financial assets measured at amortised cost | 615,179 | (118 | ) | (26 | ) | |
| Non-trading reverse purchase agreement commitments | 53,093 | — | — | |||
| Performance and other guarantees | — | — | (34 | ) | ||
| Summary of financial instruments to which the impairment requirements in IFRS 9 are applied/Summary consolidated income statement | 2,350,116 | (9,243 | ) | (2,651 | ) | |
| Debt instruments measured at FVOCI | 355,664 | (166 | ) | (105 | ) | |
| Total allowance for ECL/total income statement ECL charge for the period | n/a | (9,409 | ) | (2,756 | ) | |
| 1 | The 31 December 2019 total ECL income statement change of $2,591m is attributable to $1,136m for the six months ended 30 June 2019 and $1,455m to the six months ended 31 December 2019. |
Credit quality of financial instruments
We assess the credit quality of all financial instruments that are subject to credit risk. The credit quality of financial instruments is a point-in-time assessment of PD, whereas stages 1 and 2 are determined based on relative deterioration of credit quality since initial recognition. Accordingly, for non-credit-impaired financial instruments, there is no direct relationship between the credit quality assessment and stages 1 and 2, though typically the lower credit quality bands exhibit a higher proportion in stage 2.
The five credit quality classifications each encompass a range of granular internal credit rating grades assigned to wholesale and personal lending businesses and the external ratings attributed by external agencies to debt securities, as shown in the following table. Personal lending credit quality is disclosed based on a
12-month point-in-time PD adjusted for multiple economic scenarios. The credit quality classifications for wholesale lending are unchanged and are based on internal credit risk ratings.
12-month point-in-time PD adjusted for multiple economic scenarios. The credit quality classifications for wholesale lending are unchanged and are based on internal credit risk ratings.
| 68 | HSBC Holdings plc Interim Report 2020 |
| Credit quality classification | |||||||
Sovereign debt securities and bills | Other debt securities and bills | Wholesale lending and derivatives | Retail lending | ||||
| Footnotes | External credit rating | External credit rating | Internal credit rating | 12-month Basel probability of default % | Internal credit rating | 12 month probability- weighted PD % | |
| Quality classification | 1, 2 | ||||||
| Strong | BBB and above | A- and above | CRR 1 to CRR 2 | 0 – 0.169 | Band 1 and 2 | 0.000 – 0.500 | |
| Good | BBB- to BB | BBB+ to BBB- | CRR 3 | 0.170 – 0.740 | Band 3 | 0.501 – 1.500 | |
| Satisfactory | BB- to B and unrated | BB+ to B and unrated | CRR 4 to CRR 5 | 0.741 – 4.914 | Band 4 and 5 | 1.501 – 20.000 | |
| Sub-standard | B- to C | B- to C | CRR 6 to CRR 8 | 4.915 – 99.999 | Band 6 | 20.001 – 99.999 | |
| Credit impaired | Default | Default | CRR 9 to CRR 10 | 100 | Band 7 | 100 | |
| 1 | Customer risk rating (‘CRR’). |
| 2 | 12-month point-in-time probability-weighted probability of default (‘PD’). |
| Distribution of financial instruments to which the impairment requirements in IFRS 9 are applied, by credit quality and stage allocation | |||||||||||||||||
| Gross carrying/nominal amount | Allowance for ECL | Net | |||||||||||||||
| Strong | Good | Satisfactory | Sub- standard | Credit impaired | Total | ||||||||||||
| Footnotes | $m | $m | $m | $m | $m | $m | $m | $m | |||||||||
| Loans and advances to customers at amortised cost | 493,586 | 243,340 | 248,791 | 28,756 | 17,435 | 1,031,908 | (13,227 | ) | 1,018,681 | ||||||||
| – stage 1 | 480,945 | 203,612 | 160,839 | 7,282 | — | 852,678 | (1,906 | ) | 850,772 | ||||||||
| – stage 2 | 12,641 | 39,728 | 87,952 | 21,474 | — | 161,795 | (4,553 | ) | 157,242 | ||||||||
| – stage 3 | — | — | — | — | 17,139 | 17,139 | (6,669 | ) | 10,470 | ||||||||
| – POCI | — | — | — | — | 296 | 296 | (99 | ) | 197 | ||||||||
| Loans and advances to banks at amortised cost | 69,599 | 4,039 | 2,382 | 1,040 | 9 | 77,069 | (54 | ) | 77,015 | ||||||||
| – stage 1 | 66,544 | 2,919 | 2,142 | 88 | — | 71,693 | (26 | ) | 71,667 | ||||||||
| – stage 2 | 3,055 | 1,120 | 240 | 952 | — | 5,367 | (23 | ) | 5,344 | ||||||||
| – stage 3 | — | — | — | — | 9 | 9 | (5 | ) | 4 | ||||||||
| – POCI | — | — | — | — | — | — | — | — | |||||||||
| Other financial assets measured at amortised cost | 665,256 | 60,821 | 24,788 | 774 | 233 | 751,872 | (243 | ) | 751,629 | ||||||||
| – stage 1 | 664,153 | 58,654 | 21,716 | 201 | — | 744,724 | (96 | ) | 744,628 | ||||||||
| – stage 2 | 1,103 | 2,167 | 3,072 | 573 | — | 6,915 | (63 | ) | 6,852 | ||||||||
| – stage 3 | — | — | — | — | 232 | 232 | (84 | ) | 148 | ||||||||
| – POCI | — | — | — | — | 1 | 1 | — | 1 | |||||||||
| Loan and other credit-related commitments | 407,827 | 149,477 | 81,707 | 8,087 | 1,058 | 648,156 | (622 | ) | 647,534 | ||||||||
| – stage 1 | 400,182 | 131,509 | 60,334 | 2,375 | — | 594,400 | (193 | ) | 594,207 | ||||||||
| – stage 2 | 7,645 | 17,968 | 21,373 | 5,712 | — | 52,698 | (339 | ) | 52,359 | ||||||||
| – stage 3 | — | — | — | — | 1,055 | 1,055 | (90 | ) | 965 | ||||||||
| – POCI | — | — | — | — | 3 | 3 | — | 3 | |||||||||
| Financial guarantees | 6,348 | 5,393 | 5,068 | 1,223 | 296 | 18,328 | (119 | ) | 18,209 | ||||||||
| – stage 1 | 5,918 | 4,290 | 2,590 | 331 | — | 13,129 | (28 | ) | 13,101 | ||||||||
| – stage 2 | 430 | 1,103 | 2,478 | 892 | — | 4,903 | (73 | ) | 4,830 | ||||||||
| – stage 3 | — | — | — | — | 295 | 295 | (18 | ) | 277 | ||||||||
| – POCI | — | — | — | — | 1 | 1 | — | 1 | |||||||||
| At 30 Jun 2020 | 1,642,616 | 463,070 | 362,736 | 39,880 | 19,031 | 2,527,333 | (14,265 | ) | 2,513,068 | ||||||||
| Debt instruments at FVOCI | 1 | ||||||||||||||||
| – stage 1 | 369,864 | 9,395 | 9,533 | — | — | 388,792 | (124 | ) | 388,668 | ||||||||
| – stage 2 | 2,812 | 616 | 387 | 962 | — | 4,777 | (18 | ) | 4,759 | ||||||||
| – stage 3 | — | — | — | — | 280 | 280 | (100 | ) | 180 | ||||||||
| – POCI | — | — | — | — | — | — | — | — | |||||||||
| At 30 Jun 2020 | 372,676 | 10,011 | 9,920 | 962 | 280 | 393,849 | (242 | ) | 393,607 | ||||||||
HSBC Holdings plc Interim Report 2020 | 69 |
Risk
Distribution of financial instruments to which the impairment requirements in IFRS 9 are applied, by credit quality and stage allocation (continued) | |||||||||||||||||
| Gross carrying/notional amount | |||||||||||||||||
| Strong | Good | Satisfactory | Sub-standard | Credit impaired | Total | Allowance for ECL | Net | ||||||||||
| Footnotes | $m | $m | $m | $m | $m | $m | $m | $m | |||||||||
| Loans and advances to customers at amortised cost | 524,889 | 258,402 | 228,485 | 20,007 | 13,692 | 1,045,475 | (8,732 | ) | 1,036,743 | ||||||||
| – stage 1 | 523,092 | 242,631 | 181,056 | 4,804 | — | 951,583 | (1,297 | ) | 950,286 | ||||||||
| – stage 2 | 1,797 | 15,771 | 47,429 | 15,185 | — | 80,182 | (2,284 | ) | 77,898 | ||||||||
| – stage 3 | — | — | — | — | 13,378 | 13,378 | (5,052 | ) | 8,326 | ||||||||
| – POCI | — | — | — | 18 | 314 | 332 | (99 | ) | 233 | ||||||||
| Loans and advances to banks at amortised cost | 60,636 | 5,329 | 1,859 | 1,395 | — | 69,219 | (16 | ) | 69,203 | ||||||||
| – stage 1 | 60,548 | 5,312 | 1,797 | 112 | — | 67,769 | (14 | ) | 67,755 | ||||||||
| – stage 2 | 88 | 17 | 62 | 1,283 | — | 1,450 | (2 | ) | 1,448 | ||||||||
| – stage 3 | — | — | — | — | — | — | — | — | |||||||||
| – POCI | — | — | — | — | — | — | — | — | |||||||||
| Other financial assets measured at amortised cost | 537,253 | 54,505 | 22,766 | 503 | 152 | 615,179 | (118 | ) | 615,061 | ||||||||
| – stage 1 | 536,942 | 54,058 | 21,921 | 279 | — | 613,200 | (38 | ) | 613,162 | ||||||||
| – stage 2 | 311 | 447 | 845 | 224 | — | 1,827 | (38 | ) | 1,789 | ||||||||
| – stage 3 | — | — | — | — | 151 | 151 | (42 | ) | 109 | ||||||||
| – POCI | — | — | — | — | 1 | 1 | — | 1 | |||||||||
| Loan and other credit-related commitments | 369,424 | 146,988 | 77,499 | 5,338 | 780 | 600,029 | (329 | ) | 599,700 | ||||||||
| – stage 1 | 368,711 | 141,322 | 66,283 | 1,315 | — | 577,631 | (137 | ) | 577,494 | ||||||||
| – stage 2 | 713 | 5,666 | 11,216 | 4,023 | — | 21,618 | (133 | ) | 21,485 | ||||||||
| – stage 3 | — | — | — | — | 771 | 771 | (59 | ) | 712 | ||||||||
| – POCI | — | — | — | — | 9 | 9 | — | 9 | |||||||||
| Financial guarantees | 7,441 | 6,033 | 5,539 | 1,011 | 190 | 20,214 | (48 | ) | 20,166 | ||||||||
| – stage 1 | 7,400 | 5,746 | 4,200 | 338 | — | 17,684 | (16 | ) | 17,668 | ||||||||
| – stage 2 | 41 | 287 | 1,339 | 673 | — | 2,340 | (22 | ) | 2,318 | ||||||||
| – stage 3 | — | — | — | — | 186 | 186 | (10 | ) | 176 | ||||||||
| – POCI | — | — | — | — | 4 | 4 | — | 4 | |||||||||
| At 31 Dec 2019 | 1,499,643 | 471,257 | 336,148 | 28,254 | 14,814 | 2,350,116 | (9,243 | ) | 2,340,873 | ||||||||
| Debt instruments at FVOCI | 1 | ||||||||||||||||
| – stage 1 | 333,072 | 10,941 | 6,902 | — | — | 350,915 | (39 | ) | 350,876 | ||||||||
| – stage 2 | 86 | 25 | 320 | 544 | — | 975 | (127 | ) | 848 | ||||||||
| – stage 3 | — | — | — | — | — | — | — | — | |||||||||
| – POCI | — | — | — | — | 1 | 1 | — | 1 | |||||||||
| At 31 Dec 2019 | 333,158 | 10,966 | 7,222 | 544 | 1 | 351,891 | (166 | ) | 351,725 | ||||||||
| 1 | For the purposes of this disclosure, gross carrying value is defined as the amortised cost of a financial asset, before adjusting for any loss allowance. As such, the gross carrying value of debt instruments at FVOCI will not reconcile to the balance sheet as it excludes fair value gains and losses. |
Customer relief programmes
In response to the Covid-19 outbreak, governments and regulators around the world have introduced a number of support measures for both personal and wholesale customers in market-wide schemes. The following table presents the number of personal accounts/wholesale customers and the associated drawn loan
values of customers under these schemes and HSBC-specific measures for major markets at 30 June 2020. In relation to personal lending, the majority of relief measures, including payment holidays, relate to existing lending, while in wholesale lending the relief measures comprise of payment holidays, refinancing of existing facilities and new lending under government-backed schemes.
| 70 | HSBC Holdings plc Interim Report 2020 |
| Personal lending | |||||||||||
| UK | Hong Kong | US | Other major markets1,2,3 | Total | |||||||
| Market-wide schemes | |||||||||||
| Number of accounts granted mortgage customer relief | 000s | 65 | — | — | 45 | 110 | |||||
| Drawn loan value of accounts granted mortgage customer relief | $m | 13,550 | — | — | 3,759 | 17,309 | |||||
| Number of accounts granted other personal lending customer relief | 000s | 153 | — | — | 219 | 372 | |||||
| Drawn loan value of accounts granted other personal lending customer relief | $m | 1,594 | — | — | 2,180 | 3,774 | |||||
| HSBC-specific measures | |||||||||||
| Number of accounts granted mortgage customer relief | 000s | — | 3 | 3 | 18 | 24 | |||||
| Drawn loan value of accounts granted mortgage customer relief | $m | — | 1,231 | 1,322 | 2,655 | 5,208 | |||||
| Number of accounts granted other personal lending customer relief | 000s | — | 1 | 19 | 200 | 220 | |||||
| Drawn loan value of accounts granted other personal lending customer relief | $m | — | 95 | 150 | 1,184 | 1,429 | |||||
| Total personal lending to major markets under market-wide schemes and HSBC-specific measures | |||||||||||
| Number of accounts granted mortgage customer relief | 000s | 65 | 3 | 3 | 63 | 134 | |||||
| Drawn loan value of accounts granted mortgage customer relief | $m | 13,550 | 1,231 | 1,322 | 6,414 | 22,517 | |||||
| Number of accounts granted other personal lending customer relief | 000s | 153 | 1 | 19 | 419 | 592 | |||||
| Drawn loan value of accounts granted other personal lending customer relief | $m | 1,594 | 95 | 150 | 3,364 | 5,203 | |||||
| Market-wide schemes and HSBC-specific measures – mortgage relief as a proportion of total mortgages | % | 10.3% | 1.4% | 7.2% | 9.0% | 7.2% | |||||
| Market-wide schemes and HSBC-specific measures – other personal lending relief as a proportion of total other personal lending loans and advances | % | 8.7% | 0.3% | 6.5% | 7.1% | 5.2% | |||||
| Wholesale lending | |||||||||||
| UK | Hong Kong | US | Other major markets1 | Total | |||||||
| Market-wide schemes | |||||||||||
| Number of customers under market-wide measures | 000s | 130 | 7 | 4 | 6 | 147 | |||||
| Drawn loan value of customers under market-wide schemes | $m | 6,696 | 18,711 | 1,197 | 6,736 | 33,340 | |||||
| HSBC-specific schemes | |||||||||||
| Number of customers under HSBC-specific measures | 000s | 5 | 4 | — | 16 | 25 | |||||
| Drawn loan value of customers under HSBC-specific measures | $m | 3,998 | 6,216 | 1,229 | 7,873 | 19,316 | |||||
| Total wholesale lending to major markets under market-wide schemes and HSBC-specific measures | |||||||||||
Number of customers4 | 000s | 135 | 11 | 4 | 22 | 172 | |||||
| Drawn loan value | $m | 10,694 | 24,927 | 2,426 | 14,609 | 52,656 | |||||
| Market-wide schemes and HSBC-specific measures as a proportion of total wholesale lending loans and advances | % | 7.7% | 13.2% | 5.0% | 7.5% | 9.2% | |||||
| 1 | Other major markets include Australia, Canada, mainland China, Egypt, France, Germany, India, Indonesia, Malaysia, Mexico, Singapore, Switzerland, Taiwan and UAE. |
| 2 | In Malaysia, personal lending customers are granted an automatic moratorium programme for all eligible retail customers. At 30 June 2020, the number of accounts under this moratorium was 133,000 with an associated drawn balance of $4,023m. |
| 3 | In Mexico, there were 115,000 personal lending accounts under customer relief with an associated drawn balance of $954m. |
| 4 | Within total wholesale customers, there are 2,000 customers under both market-wide and HSBC-specific schemes. |
The initial granting of customer relief does not automatically trigger a migration to stage 2 or 3. However, information provided by payment deferrals is considered in the context of other reasonable and supportable information. This forms part of the overall assessment for significant increase in credit risk and credit impairment to identify loans for which lifetime ECL is appropriate. An extension in payment deferral does not automatically result in stage 2 or stage 3. The key accounting and credit risk judgement to ascertain whether a significant increase in credit risk has occurred is whether the economic effects of the Covid-19 outbreak on the customer are likely to be temporary over the lifetime of the loan, and whether they indicate that a concession is being made in respect of financial difficulty that would be consistent with stage 3.
Market-wide schemes
The following narrative provides further details on the major government and regulatory schemes offered in the UK, Hong Kong and the US.
UK personal lending
Mortgages
Customer relief granted on UK mortgages primarily consists of payment holidays or partial payment deferrals.
Relief is offered for an initial period of three months and may be extended for a further three months in certain circumstances. No payment is required from the customer during this period (though with a partial payment deferral the customer has expressed a desire to make a contribution) and interest continues to be charged as usual. The customers’ arrears status is not worsened from utilisation of these schemes.
Other personal lending payment holidays
Customer relief is granted for an initial period of three months and may be extended for a further three months. The maximum relief value is up to the due payment amount during the period.
UK wholesale lending
The primary relief granted under government schemes consists of the Bounce Back Loan Scheme, Coronavirus Business Interruption Loan Scheme and Coronavirus Large Business Interruption Loan Scheme. The key features of these schemes are as follows:
| • | The Bounce Back Loan Scheme provides small and medium-sized enterprises (‘SME’) with loans of up to £50,000 for a maximum period of six years. Interest is charged at 2.5% and the government pays the fees and interest for the first 12 months. No capital repayment is required by the customer for the first 12 months of the scheme. A government guarantee of 100% is provided under the scheme. |
HSBC Holdings plc Interim Report 2020 | 71 |
Risk
| • | The Coronavirus Business Interruption Loan Scheme provides SMEs that have a turnover of less than £45m with loans of up to £5m for a maximum period of six years. Interest is charged between 3.49% and 3.99% above the UK base rate and no capital repayment is required by the customer for the first 12 months of the scheme. A government guarantee of up to 80% is provided under the scheme. |
| • | The Coronavirus Large Business Interruption Loan Scheme provides medium and large-sized enterprises that have a turnover in excess of £45m with loans of up to £200m. The interest rate and tenor of the loan are negotiated on commercial terms. A government guarantee of 80% is provided under the scheme. |
Hong Kong wholesale lending
Pre-approved Principal Payment Holiday Scheme for Corporate Customers
The above scheme enables eligible customers to apply for a payment holiday of six months (or 90 days for trade finance) with no change to the existing interest rate charge.
US wholesale lending
Paycheck Protection Program
The CARES Act created the Paycheck Protection Program (‘PPP’) loan guarantee programme to provide small businesses with support to cover payroll and certain other expenses. Loans made under the PPP are fully guaranteed by the Small Business Administration, whose guarantee is backed by the full faith and credit of the US. PPP-covered loans also afford customers forgiveness up to the principal amount of the PPP-covered loan, plus accrued interest, if the loan proceeds are used to retain workers and maintain payroll or to make certain mortgage interest, lease and utility payments, and certain other criteria are satisfied. The Small Business Administration will reimburse PPP lenders for any amount of a PPP-covered loan that is forgiven, and PPP lenders will not be liable for any representations made by PPP borrowers in connection with their requests for loan forgiveness. Lenders receive pre-determined fees for processing and servicing PPP loans.
HSBC-specific measures
UK personal lending
Overdrafts
HSBC has offered all customers a £500 interest-free overdraft for a duration of three months.
UK wholesale lending
HSBC is offering capital repayment holidays to CMB customers. Relief is offered on a preferred term of six months. However, some are granted for three months with the option of an extension. Interest continues to be paid as usual.
Hong Kong personal lending
Mortgages
Customer relief granted on Hong Kong mortgages consists of deferred principal repayment of up to 12 months. This relief programme is available to existing HSBC mortgage loan customers who have a good repayment record during the past six months.
Hong Kong wholesale lending
Temporary relief measures for CMB customers
The above scheme enables eligible customers to apply for a payment holiday of up to six months with no change to the existing interest rate charge.
US total personal lending
Customer relief granted on US mortgages and other personal lending consists of deferrals of up to 12 months and up to six months respectively.
Personal lending
This section provides further details on the regions, countries and products driving the decrease in personal loans and advances to customers. Additionally, Hong Kong and UK mortgage book
loan-to-value (‘LTV’) data is provided.
loan-to-value (‘LTV’) data is provided.
Further product granularity is also provided by stage, with geographical data presented for loans and advances to customers, loan and other credit-related commitments, and financial guarantee and similar contracts.
At 30 June 2020, total personal lending for loans and advances to customers of $422.2bn decreased by $12.1bn compared with
31 December 2019. This decrease included adverse exchange movements of $14.3bn. Excluding foreign exchange movements, there was growth of $2.2bn, primarily driven by $1.2bn in Europe, $0.7bn in North America and $0.6bn in Asia.
31 December 2019. This decrease included adverse exchange movements of $14.3bn. Excluding foreign exchange movements, there was growth of $2.2bn, primarily driven by $1.2bn in Europe, $0.7bn in North America and $0.6bn in Asia.
The allowance for ECL attributable to personal lending, excluding off-balance sheet loan commitments and guarantees, increased by $1.3bn to $4.4bn at 30 June 2020. This included favourable foreign exchange movements of $0.2bn.
Excluding foreign exchange movements, total personal lending was primarily driven by mortgage growth, which grew by $7.4bn. Mortgages grew in the UK by $3.3bn, driven by stronger acquisition performance, including the expanded use of broker relationships. In Asia, mortgages grew $2.7bn, notably $2.0bn in Hong Kong and $1.1bn in Australia, as a result of business growth initiatives. The allowance for ECL attributable to mortgages increased by $0.3bn to $0.8bn at 30 June 2020.
The quality of both our Hong Kong and UK mortgage books remained high, with negligible defaults and impairment allowances. The average LTV ratio on new mortgage lending in Hong Kong was 59%, compared with an estimated 43% for the overall mortgage portfolio. The average LTV ratio on new lending in the UK was 68%, compared with an estimated 51% for the overall mortgage portfolio.
Excluding foreign exchange movements, other personal lending balances at 30 June 2020 decreased by $5.2bn compared with
31 December 2019. The decrease was attributable to a $4.1bn decrease in credit card balances and to a lesser extent loans and overdrafts, which decreased by $1.0bn. The decrease in credit card balances was driven by $2.1bn in the UK and $1.4bn in Asia, notably $0.8bn in Hong Kong. These decreases in drawn credit cards partially contributed to an increase in total off-balance sheet loan commitments and guarantees, which grew by $8.0bn to $232.1bn at 30 June 2020. This increase included $4.9bn of adverse foreign exchange movements.
31 December 2019. The decrease was attributable to a $4.1bn decrease in credit card balances and to a lesser extent loans and overdrafts, which decreased by $1.0bn. The decrease in credit card balances was driven by $2.1bn in the UK and $1.4bn in Asia, notably $0.8bn in Hong Kong. These decreases in drawn credit cards partially contributed to an increase in total off-balance sheet loan commitments and guarantees, which grew by $8.0bn to $232.1bn at 30 June 2020. This increase included $4.9bn of adverse foreign exchange movements.
Excluding foreign exchange movements, the allowance for ECL attributable to other personal lending, excluding loan commitments and guarantees, increased by $1.2bn to $3.6bn at 30 June 2020. The main drivers of this increase was loans and overdrafts and credit cards in the UK with increases of $0.4bn and $0.2bn respectively. There was also an increase in Asia of $0.2bn, notably $0.1bn in loans and overdrafts and $0.1bn in credit cards.
| 72 | HSBC Holdings plc Interim Report 2020 |
| Total personal lending for loans and advances to customers by stage distribution | ||||||||||||||||
| Gross carrying amount | Allowance for ECL | |||||||||||||||
| Stage 1 | Stage 2 | Stage 3 | Total | Stage 1 | Stage 2 | Stage 3 | Total | |||||||||
| $m | $m | $m | $m | $m | $m | $m | $m | |||||||||
| By portfolio | ||||||||||||||||
| First lien residential mortgages | 299,392 | 15,648 | 3,045 | 318,085 | (102 | ) | (298 | ) | (406 | ) | (806 | ) | ||||
| – of which: | ||||||||||||||||
| interest only (including offset) | 28,428 | 1,383 | 348 | 30,159 | (8 | ) | (17 | ) | (81 | ) | (106 | ) | ||||
| affordability (including US adjustable rate mortgages) | 12,667 | 2,590 | 534 | 15,791 | (6 | ) | (6 | ) | (5 | ) | (17 | ) | ||||
| Other personal lending | 90,640 | 11,383 | 2,076 | 104,099 | (795 | ) | (1,817 | ) | (983 | ) | (3,595 | ) | ||||
| – other | 72,069 | 6,794 | 1,287 | 80,150 | (358 | ) | (735 | ) | (599 | ) | (1,692 | ) | ||||
| – credit cards | 16,449 | 4,441 | 726 | 21,616 | (428 | ) | (1,063 | ) | (366 | ) | (1,857 | ) | ||||
| – second lien residential mortgages | 673 | 84 | 53 | 810 | (2 | ) | (10 | ) | (11 | ) | (23 | ) | ||||
| – motor vehicle finance | 1,449 | 64 | 10 | 1,523 | (7 | ) | (9 | ) | (7 | ) | (23 | ) | ||||
| At 30 Jun 2020 | 390,032 | 27,031 | 5,121 | 422,184 | (897 | ) | (2,115 | ) | (1,389 | ) | (4,401 | ) | ||||
| By geography | ||||||||||||||||
| Europe | 174,021 | 9,683 | 2,416 | 186,120 | (245 | ) | (1,081 | ) | (733 | ) | (2,059 | ) | ||||
– of which: UK | 140,171 | 8,421 | 1,640 | 150,232 | (230 | ) | (1,048 | ) | (469 | ) | (1,747 | ) | ||||
| Asia | 167,690 | 11,313 | 853 | 179,856 | (284 | ) | (412 | ) | (210 | ) | (906 | ) | ||||
– of which: Hong Kong | 116,657 | 4,504 | 224 | 121,385 | (101 | ) | (234 | ) | (59 | ) | (394 | ) | ||||
| MENA | 5,005 | 480 | 278 | 5,763 | (63 | ) | (148 | ) | (182 | ) | (393 | ) | ||||
| North America | 37,788 | 4,749 | 1,337 | 43,874 | (138 | ) | (171 | ) | (145 | ) | (454 | ) | ||||
| Latin America | 5,528 | 806 | 237 | 6,571 | (167 | ) | (303 | ) | (119 | ) | (589 | ) | ||||
| At 30 Jun 2020 | 390,032 | 27,031 | 5,121 | 422,184 | (897 | ) | (2,115 | ) | (1,389 | ) | (4,401 | ) | ||||
| Total personal lending for loans and other credit-related commitments and financial guarantees by stage distribution | ||||||||||||||||
| Nominal amount | Allowance for ECL | |||||||||||||||
| Stage 1 | Stage 2 | Stage 3 | Total | Stage 1 | Stage 2 | Stage 3 | Total | |||||||||
| $m | $m | $m | $m | $m | $m | $m | $m | |||||||||
| Europe | 50,714 | 1,050 | 138 | 51,902 | (20 | ) | (2 | ) | — | (22 | ) | |||||
| of which: UK | 48,112 | 921 | 121 | 49,154 | (19 | ) | (1 | ) | — | (20 | ) | |||||
| Asia | 157,180 | 1,047 | 11 | 158,238 | — | (1 | ) | — | (1 | ) | ||||||
| of which: Hong Kong | 120,624 | 27 | 10 | 120,661 | — | — | — | — | ||||||||
| MENA | 3,175 | 55 | 50 | 3,280 | (1 | ) | — | — | (1 | ) | ||||||
| North America | 14,980 | 243 | 20 | 15,243 | (2 | ) | — | — | (2 | ) | ||||||
| Latin America | 3,382 | 40 | 1 | 3,423 | (3 | ) | — | — | (3 | ) | ||||||
| At 30 Jun 2020 | 229,431 | 2,435 | 220 | 232,086 | (26 | ) | (3 | ) | — | (29 | ) | |||||
| Total personal lending for loans and advances to customers by stage distribution | ||||||||||||||||
| Gross carrying amount | Allowance for ECL | |||||||||||||||
| Stage 1 | Stage 2 | Stage 3 | Total | Stage 1 | Stage 2 | Stage 3 | Total | |||||||||
| $m | $m | $m | $m | $m | $m | $m | $m | |||||||||
| By portfolio | ||||||||||||||||
| First lien residential mortgages | 312,031 | 7,077 | 3,070 | 322,178 | (39 | ) | (68 | ) | (422 | ) | (529 | ) | ||||
| – of which: | ||||||||||||||||
| interest only (including offset) | 31,201 | 1,602 | 376 | 33,179 | (6 | ) | (15 | ) | (91 | ) | (112 | ) | ||||
| affordability (including US adjustable rate mortgages) | 14,222 | 796 | 514 | 15,532 | (3 | ) | (3 | ) | (3 | ) | (9 | ) | ||||
| Other personal lending | 101,638 | 8,674 | 1,781 | 112,093 | (544 | ) | (1,268 | ) | (793 | ) | (2,605 | ) | ||||
| – other | 77,031 | 4,575 | 1,193 | 82,799 | (229 | ) | (451 | ) | (491 | ) | (1,171 | ) | ||||
| – credit cards | 22,285 | 3,959 | 524 | 26,768 | (310 | ) | (801 | ) | (284 | ) | (1,395 | ) | ||||
| – second lien residential mortgages | 750 | 84 | 55 | 889 | (1 | ) | (6 | ) | (10 | ) | (17 | ) | ||||
| – motor vehicle finance | 1,572 | 56 | 9 | 1,637 | (4 | ) | (10 | ) | (8 | ) | (22 | ) | ||||
| At 31 Dec 2019 | 413,669 | 15,751 | 4,851 | 434,271 | (583 | ) | (1,336 | ) | (1,215 | ) | (3,134 | ) | ||||
| By geography | ||||||||||||||||
| Europe | 186,561 | 6,854 | 2,335 | 195,750 | (112 | ) | (538 | ) | (578 | ) | (1,228 | ) | ||||
| – of which: UK | 153,313 | 5,455 | 1,612 | 160,380 | (104 | ) | (513 | ) | (370 | ) | (987 | ) | ||||
| Asia | 173,523 | 5,855 | 717 | 180,095 | (223 | ) | (339 | ) | (170 | ) | (732 | ) | ||||
| – of which: Hong Kong | 117,013 | 2,751 | 189 | 119,953 | (90 | ) | (220 | ) | (44 | ) | (354 | ) | ||||
| MENA | 5,671 | 247 | 299 | 6,217 | (50 | ) | (58 | ) | (189 | ) | (297 | ) | ||||
| North America | 41,148 | 1,930 | 1,238 | 44,316 | (56 | ) | (119 | ) | (141 | ) | (316 | ) | ||||
| Latin America | 6,766 | 865 | 262 | 7,893 | (142 | ) | (282 | ) | (137 | ) | (561 | ) | ||||
At 31 Dec 2019 | 413,669 | 15,751 | 4,851 | 434,271 | (583 | ) | (1,336 | ) | (1,215 | ) | (3,134 | ) | ||||
HSBC Holdings plc Interim Report 2020 | 73 |
Risk
| Total personal lending for loans and other credit-related commitments and financial guarantees by stage distribution | ||||||||||||||||
| Nominal amount | Allowance for ECL | |||||||||||||||
| Stage 1 | Stage 2 | Stage 3 | Total | Stage 1 | Stage 2 | Stage 3 | Total | |||||||||
| $m | $m | $m | $m | $m | $m | $m | $m | |||||||||
| Europe | 51,575 | 604 | 110 | 52,289 | (10 | ) | (2 | ) | — | (12 | ) | |||||
| – of which: UK | 49,322 | 493 | 105 | 49,920 | (8 | ) | (1 | ) | — | (9 | ) | |||||
| Asia | 149,336 | 682 | 9 | 150,027 | — | — | — | — | ||||||||
| – of which: Hong Kong | 115,025 | 27 | 3 | 115,055 | — | — | — | — | ||||||||
| MENA | 3,150 | 46 | 53 | 3,249 | — | — | — | — | ||||||||
| North America | 13,919 | 256 | 20 | 14,195 | (1 | ) | — | — | (1 | ) | ||||||
| Latin America | 4,312 | 43 | 3 | 4,358 | (3 | ) | — | — | (3 | ) | ||||||
| At 31 Dec 2019 | 222,292 | 1,631 | 195 | 224,118 | (14 | ) | (2 | ) | — | (16 | ) | |||||
Wholesale lending
This section provides further details on the regions, countries and industries driving the increase in wholesale loans and advances to customers and banks, with the impact of foreign exchange separately identified. Industry granularity is also provided by stage, with geographical data presented for loans and advances to customers, banks, other credit commitments, financial guarantees and similar contracts.
At 30 June 2020, wholesale lending for loans and advances to banks and customers of $686.8bn increased by $6.4bn since
31 December 2019. This included adverse foreign exchange movements of $18.1bn.
31 December 2019. This included adverse foreign exchange movements of $18.1bn.
Excluding foreign exchange movements, the total wholesale lending growth was driven by a $14.3bn increase in corporate and commercial balances and $9.6bn increase in loans and advances to banks.
The primary driver of the increase in corporate and commercial balances was $7.2bn in Europe, notably $3.5bn in the UK and $2.7bn in France. Additionally, corporate and commercial balances in North America and MENA grew $4.8bn and $2.2bn respectively.
Loan commitments and financial guarantees grew $38.3bn since 31 December 2019 to $434.4bn at 30 June 2020, including a $33.9bn increase related to unsettled reverse repurchase agreements. This also included adverse foreign exchange movements of $8.5bn.
The allowance for ECL attributable to loans and advances to banks and customers of $8.9bn at 30 June 2020 increased from $5.6bn at 31 December 2019. This included favourable foreign exchange movements of $0.2bn.
Excluding foreign exchange movements, the total increase in the wholesale ECL allowance for loans and advances to customers and banks was driven by $3.3bn in corporate and commercial balances. The primary driver of this increase in corporate and commercial allowance for ECL was $1.2bn in Europe, notably $1.1bn in the UK. There was an increase of $1.1bn in Asia, notably $0.7bn in Singapore and $0.2bn in Hong Kong. Additionally, there were increases of $0.5bn and $0.3bn in North America and MENA, respectively.
| 74 | HSBC Holdings plc Interim Report 2020 |
| Total wholesale lending for loans and advances to banks and customers by stage distribution | ||||||||||||||||||||
| Gross carrying amount | Allowance for ECL | |||||||||||||||||||
| Stage 1 | Stage 2 | Stage 3 | POCI | Total | Stage 1 | Stage 2 | Stage 3 | POCI | Total | |||||||||||
| $m | $m | $m | $m | $m | $m | $m | $m | $m | $m | |||||||||||
| Corporate and commercial | 406,194 | 122,319 | 11,499 | 296 | 540,308 | (966 | ) | (2,306 | ) | (5,166 | ) | (99 | ) | (8,537 | ) | |||||
– agriculture, forestry and fishing | 5,620 | 782 | 293 | 2 | 6,697 | (13 | ) | (31 | ) | (142 | ) | (1 | ) | (187 | ) | |||||
– mining and quarrying | 10,811 | 2,719 | 1,308 | 12 | 14,850 | (52 | ) | (134 | ) | (371 | ) | (11 | ) | (568 | ) | |||||
| – manufacturing | 72,719 | 27,694 | 1,589 | 123 | 102,125 | (153 | ) | (435 | ) | (869 | ) | (46 | ) | (1,503 | ) | |||||
| – electricity, gas, steam and air-conditioning supply | 11,987 | 3,144 | 175 | 1 | 15,307 | (30 | ) | (40 | ) | (24 | ) | — | (94 | ) | ||||||
| – water supply, sewerage, waste management and remediation | 2,291 | 966 | 29 | — | 3,286 | (7 | ) | (15 | ) | (17 | ) | — | (39 | ) | ||||||
| – construction | 8,982 | 5,136 | 723 | 31 | 14,872 | (40 | ) | (142 | ) | (396 | ) | (30 | ) | (608 | ) | |||||
| – wholesale and retail trade, repair of motor vehicles and motorcycles | 64,461 | 25,558 | 2,972 | 10 | 93,001 | (150 | ) | (311 | ) | (1,749 | ) | (2 | ) | (2,212 | ) | |||||
– transportation and storage | 18,293 | 7,733 | 664 | 12 | 26,702 | (77 | ) | (145 | ) | (235 | ) | — | (457 | ) | ||||||
– accommodation and food | 14,723 | 10,109 | 330 | 1 | 25,163 | (59 | ) | (196 | ) | (82 | ) | (1 | ) | (338 | ) | |||||
| – publishing, audiovisual and broadcasting | 16,635 | 3,860 | 66 | 29 | 20,590 | (41 | ) | (98 | ) | (16 | ) | (5 | ) | (160 | ) | |||||
| – real estate | 110,646 | 14,737 | 1,426 | 1 | 126,810 | (150 | ) | (302 | ) | (525 | ) | — | (977 | ) | ||||||
| – professional, scientific and technical activities | 18,842 | 6,786 | 517 | — | 26,145 | (48 | ) | (100 | ) | (170 | ) | — | (318 | ) | ||||||
– administrative and support services | 19,959 | 7,312 | 682 | 74 | 28,027 | (50 | ) | (163 | ) | (260 | ) | (3 | ) | (476 | ) | |||||
| – public administration and defence, compulsory social security | 2,405 | 565 | 3 | — | 2,973 | (3 | ) | (8 | ) | (1 | ) | — | (12 | ) | ||||||
| – education | 1,781 | 661 | 13 | — | 2,455 | (8 | ) | (25 | ) | (6 | ) | — | (39 | ) | ||||||
| – health and care | 4,064 | 1,497 | 244 | — | 5,805 | (13 | ) | (42 | ) | (118 | ) | — | (173 | ) | ||||||
– arts, entertainment and recreation | 1,692 | 980 | 42 | — | 2,714 | (8 | ) | (38 | ) | (10 | ) | — | (56 | ) | ||||||
| – other services | 11,445 | 1,134 | 422 | — | 13,001 | (53 | ) | (60 | ) | (174 | ) | — | (287 | ) | ||||||
– activities of households | 707 | 244 | — | — | 951 | — | (1 | ) | — | — | (1 | ) | ||||||||
| – extra-territorial organisations and bodies activities | 9 | — | — | — | 9 | — | — | — | — | — | ||||||||||
| – government | 7,484 | 689 | 1 | — | 8,174 | (11 | ) | (8 | ) | (1 | ) | — | (20 | ) | ||||||
| – asset-backed securities | 638 | 13 | — | — | 651 | — | (12 | ) | — | — | (12 | ) | ||||||||
| Non-bank financial institutions | 56,452 | 12,445 | 519 | — | 69,416 | (43 | ) | (132 | ) | (114 | ) | — | (289 | ) | ||||||
| Loans and advances to banks | 71,693 | 5,367 | 9 | — | 77,069 | (26 | ) | (23 | ) | (5 | ) | — | (54 | ) | ||||||
| At 30 Jun 2020 | 534,339 | 140,131 | 12,027 | 296 | 686,793 | (1,035 | ) | (2,461 | ) | (5,285 | ) | (99 | ) | (8,880 | ) | |||||
| By geography | ||||||||||||||||||||
| Europe | 165,295 | 38,744 | 6,229 | 132 | 210,400 | (444 | ) | (1,188 | ) | (1,980 | ) | (48 | ) | (3,660 | ) | |||||
– of which: UK | 110,296 | 28,906 | 4,262 | 74 | 143,538 | (376 | ) | (1,042 | ) | (1,267 | ) | (35 | ) | (2,720 | ) | |||||
| Asia | 276,436 | 71,147 | 2,541 | 117 | 350,241 | (273 | ) | (578 | ) | (1,695 | ) | (34 | ) | (2,580 | ) | |||||
– of which: Hong Kong | 165,429 | 43,919 | 874 | 47 | 210,269 | (153 | ) | (314 | ) | (496 | ) | (24 | ) | (987 | ) | |||||
| MENA | 22,959 | 7,450 | 1,879 | 17 | 32,305 | (83 | ) | (195 | ) | (1,093 | ) | (12 | ) | (1,383 | ) | |||||
| North America | 57,321 | 18,484 | 1,005 | — | 76,810 | (119 | ) | (342 | ) | (306 | ) | — | (767 | ) | ||||||
| Latin America | 12,328 | 4,306 | 373 | 30 | 17,037 | (116 | ) | (158 | ) | (211 | ) | (5 | ) | (490 | ) | |||||
| At 30 Jun 2020 | 534,339 | 140,131 | 12,027 | 296 | 686,793 | (1,035 | ) | (2,461 | ) | (5,285 | ) | (99 | ) | (8,880 | ) | |||||
Total wholesale lending for loans and other credit-related commitments and financial guarantees by stage distribution1 | ||||||||||||||||||||
| Nominal amount | Allowance for ECL | |||||||||||||||||||
| Stage 1 | Stage 2 | Stage 3 | POCI | Total | Stage 1 | Stage 2 | Stage 3 | POCI | Total | |||||||||||
| $m | $m | $m | $m | $m | $m | $m | $m | $m | $m | |||||||||||
| Corporate and commercial | 241,574 | 49,164 | 1,092 | 4 | 291,834 | (186 | ) | (382 | ) | (104 | ) | — | (672 | ) | ||||||
| Financial | 136,524 | 6,002 | 38 | — | 142,564 | (9 | ) | (27 | ) | (4 | ) | — | (40 | ) | ||||||
| At 30 Jun 2020 | 378,098 | 55,166 | 1,130 | 4 | 434,398 | (195 | ) | (409 | ) | (108 | ) | — | (712 | ) | ||||||
| By geography | ||||||||||||||||||||
| Europe | 205,781 | 27,797 | 913 | 4 | 234,495 | (89 | ) | (166 | ) | (83 | ) | — | (338 | ) | ||||||
| – of which: UK | 74,777 | 16,431 | 541 | 3 | 91,752 | (77 | ) | (132 | ) | (41 | ) | — | (250 | ) | ||||||
| Asia | 58,773 | 11,181 | 63 | — | 70,017 | (36 | ) | (99 | ) | (14 | ) | — | (149 | ) | ||||||
| – of which: Hong Kong | 30,271 | 3,100 | 3 | — | 33,374 | (16 | ) | (43 | ) | (3 | ) | — | (62 | ) | ||||||
| MENA | 5,219 | 1,306 | 25 | — | 6,550 | (11 | ) | (33 | ) | (5 | ) | — | (49 | ) | ||||||
| North America | 106,302 | 14,592 | 96 | — | 120,990 | (45 | ) | (108 | ) | (3 | ) | — | (156 | ) | ||||||
| Latin America | 2,023 | 290 | 33 | — | 2,346 | (14 | ) | (3 | ) | (3 | ) | — | (20 | ) | ||||||
| At 30 Jun 2020 | 378,098 | 55,166 | 1,130 | 4 | 434,398 | (195 | ) | (409 | ) | (108 | ) | — | (712 | ) | ||||||
| 1 | Included in loans and other credit-related commitments and financial guarantees is $87bn relating to unsettled reverse repurchase agreements, which once drawn are classified as ‘Reverse repurchase agreements – non-trading’. |
HSBC Holdings plc Interim Report 2020 | 75 |
Risk
| Total wholesale lending for loans and advances to banks and customers by stage distribution | ||||||||||||||||||||
| Gross carrying amount | Allowance for ECL | |||||||||||||||||||
| Stage 1 | Stage 2 | Stage 3 | POCI | Total | Stage 1 | Stage 2 | Stage 3 | POCI | Total | |||||||||||
| $m | $m | $m | $m | $m | $m | $m | $m | $m | $m | |||||||||||
| Corporate and commercial | 472,253 | 59,599 | 8,315 | 332 | 540,499 | (672 | ) | (920 | ) | (3,747 | ) | (99 | ) | (5,438 | ) | |||||
– agriculture, forestry and fishing | 5,416 | 1,000 | 278 | 2 | 6,696 | (13 | ) | (29 | ) | (139 | ) | (1 | ) | (182 | ) | |||||
– mining and quarrying | 9,923 | 4,189 | 311 | 12 | 14,435 | (22 | ) | (70 | ) | (122 | ) | (12 | ) | (226 | ) | |||||
| – manufacturing | 88,138 | 14,525 | 1,581 | 136 | 104,380 | (143 | ) | (211 | ) | (806 | ) | (50 | ) | (1,210 | ) | |||||
| – electricity, gas, steam and air-conditioning supply | 13,479 | 1,386 | 175 | — | 15,040 | (14 | ) | (41 | ) | (25 | ) | — | (80 | ) | ||||||
| – water supply, sewerage, waste management and remediation | 2,963 | 508 | 30 | — | 3,501 | (6 | ) | (4 | ) | (18 | ) | — | (28 | ) | ||||||
| – construction | 10,520 | 3,883 | 852 | 32 | 15,287 | (16 | ) | (49 | ) | (467 | ) | (32 | ) | (564 | ) | |||||
| – wholesale and retail trade, repair of motor vehicles and motorcycles | 83,151 | 9,897 | 1,625 | 8 | 94,681 | (111 | ) | (137 | ) | (934 | ) | (2 | ) | (1,184 | ) | |||||
– transportation and storage | 22,604 | 2,359 | 588 | 29 | 25,580 | (42 | ) | (37 | ) | (158 | ) | — | (237 | ) | ||||||
– accommodation and food | 20,109 | 4,284 | 262 | 1 | 24,656 | (37 | ) | (46 | ) | (62 | ) | (1 | ) | (146 | ) | |||||
| – publishing, audiovisual and broadcasting | 18,103 | 1,706 | 141 | 21 | 19,971 | (30 | ) | (23 | ) | (33 | ) | (1 | ) | (87 | ) | |||||
| – real estate | 122,972 | 6,450 | 1,329 | 1 | 130,752 | (108 | ) | (97 | ) | (475 | ) | — | (680 | ) | ||||||
| – professional, scientific and technical activities | 21,085 | 2,687 | 350 | — | 24,122 | (31 | ) | (33 | ) | (145 | ) | — | (209 | ) | ||||||
– administrative and support services | 21,370 | 3,817 | 438 | 89 | 25,714 | (33 | ) | (58 | ) | (179 | ) | — | (270 | ) | ||||||
| – public administration and defence, compulsory social security | 1,889 | 488 | — | — | 2,377 | (1 | ) | (7 | ) | — | — | (8 | ) | |||||||
| – education | 1,700 | 184 | 16 | — | 1,900 | (7 | ) | (5 | ) | (6 | ) | — | (18 | ) | ||||||
| – health and care | 3,543 | 811 | 111 | — | 4,465 | (9 | ) | (20 | ) | (28 | ) | — | (57 | ) | ||||||
– arts, entertainment and recreation | 2,537 | 257 | 30 | — | 2,824 | (6 | ) | (8 | ) | (11 | ) | — | (25 | ) | ||||||
| – other services | 13,143 | 941 | 191 | 1 | 14,276 | (35 | ) | (31 | ) | (133 | ) | — | (199 | ) | ||||||
– activities of households | 725 | 66 | — | — | 791 | — | — | — | — | — | ||||||||||
| – extra-territorial organisations and bodies activities | 2 | — | — | — | 2 | — | — | — | — | — | ||||||||||
| – government | 8,159 | 147 | 7 | — | 8,313 | (6 | ) | (2 | ) | (6 | ) | — | (14 | ) | ||||||
| – asset-backed securities | 722 | 14 | — | — | 736 | (2 | ) | (12 | ) | — | — | (14 | ) | |||||||
| Non-bank financial institutions | 65,661 | 4,832 | 212 | — | 70,705 | (42 | ) | (28 | ) | (90 | ) | — | (160 | ) | ||||||
| Loans and advances to banks | 67,769 | 1,450 | — | — | 69,219 | (14 | ) | (2 | ) | — | — | (16 | ) | |||||||
At 31 Dec 2019 | 605,683 | 65,881 | 8,527 | 332 | 680,423 | (728 | ) | (950 | ) | (3,837 | ) | (99 | ) | (5,614 | ) | |||||
| By geography | ||||||||||||||||||||
| Europe | 190,528 | 20,276 | 4,671 | 129 | 215,604 | (318 | ) | (458 | ) | (1,578 | ) | (45 | ) | (2,399 | ) | |||||
| – of which: UK | 131,007 | 16,253 | 3,343 | 79 | 150,682 | (252 | ) | (385 | ) | (989 | ) | (32 | ) | (1,658 | ) | |||||
| Asia | 308,305 | 32,287 | 1,419 | 148 | 342,159 | (228 | ) | (253 | ) | (986 | ) | (38 | ) | (1,505 | ) | |||||
| – of which: Hong Kong | 182,501 | 23,735 | 673 | 48 | 206,957 | (118 | ) | (172 | ) | (475 | ) | (28 | ) | (793 | ) | |||||
| MENA | 25,470 | 3,314 | 1,686 | 18 | 30,488 | (55 | ) | (85 | ) | (946 | ) | (12 | ) | (1,098 | ) | |||||
| North America | 64,501 | 7,495 | 458 | — | 72,454 | (45 | ) | (96 | ) | (141 | ) | — | (282 | ) | ||||||
| Latin America | 16,879 | 2,509 | 293 | 37 | 19,718 | (82 | ) | (58 | ) | (186 | ) | (4 | ) | (330 | ) | |||||
At 31 Dec 2019 | 605,683 | 65,881 | 8,527 | 332 | 680,423 | (728 | ) | (950 | ) | (3,837 | ) | (99 | ) | (5,614 | ) | |||||
Total wholesale lending for loans and other credit-related commitments and financial guarantees by stage distribution1 | ||||||||||||||||||||
| Nominal amount | Allowance for ECL | |||||||||||||||||||
| Stage 1 | Stage 2 | Stage 3 | POCI | Total | Stage 1 | Stage 2 | Stage 3 | POCI | Total | |||||||||||
| $m | $m | $m | $m | $m | $m | $m | $m | $m | $m | |||||||||||
| Corporate and commercial | 271,678 | 20,880 | 757 | 13 | 293,328 | (132 | ) | (151 | ) | (68 | ) | — | (351 | ) | ||||||
| Financial | 101,345 | 1,447 | 5 | — | 102,797 | (7 | ) | (2 | ) | (1 | ) | — | (10 | ) | ||||||
At 31 Dec 2019 | 373,023 | 22,327 | 762 | 13 | 396,125 | (139 | ) | (153 | ) | (69 | ) | — | (361 | ) | ||||||
| By geography | ||||||||||||||||||||
| Europe | 190,604 | 7,852 | 645 | 13 | 199,114 | (60 | ) | (43 | ) | (56 | ) | — | (159 | ) | ||||||
| – of which: UK | 76,013 | 4,193 | 494 | 9 | 80,709 | (48 | ) | (32 | ) | (31 | ) | — | (111 | ) | ||||||
| Asia | 60,759 | 3,762 | 8 | — | 64,529 | (43 | ) | (33 | ) | (4 | ) | — | (80 | ) | ||||||
| – of which: Hong Kong | 27,047 | 2,114 | 5 | — | 29,166 | (14 | ) | (23 | ) | (2 | ) | — | (39 | ) | ||||||
| MENA | 5,690 | 621 | 31 | — | 6,342 | (12 | ) | (13 | ) | (4 | ) | — | (29 | ) | ||||||
| North America | 112,812 | 9,933 | 77 | — | 122,822 | (22 | ) | (62 | ) | (5 | ) | — | (89 | ) | ||||||
| Latin America | 3,158 | 159 | 1 | — | 3,318 | (2 | ) | (2 | ) | — | — | (4 | ) | |||||||
At 31 Dec 2019 | 373,023 | 22,327 | 762 | 13 | 396,125 | (139 | ) | (153 | ) | (69 | ) | — | (361 | ) | ||||||
| 1 | Included in loans and other credit-related commitments and financial guarantees is $53bn relating to unsettled reverse repurchase agreements, which once drawn are classified as ‘Reverse repurchase agreements – non-trading’. |
| 76 | HSBC Holdings plc Interim Report 2020 |
Supplementary information
The following disclosure presents the gross carrying/nominal amount of financial instruments to which the impairment requirements in IFRS 9 are applied by global business and the associated allowance for ECL.
Change in reportable segments
Effective from 30 June 2020, we made the following realignments within our internal reporting:
| • | We simplified our matrix organisational structure by merging Global Private Banking and Retail Banking and Wealth Management to form Wealth and Personal Banking (‘WPB’). |
The impact of this change is to merge the Global Private Banking’s and Retail Banking and Wealth Management’s gross carrying/nominal values and the associated allowance for ECL into WPB.
| • | We reallocated Balance Sheet Management from Corporate Centre to the global businesses. The impact of this change is to transfer the Balance Sheet Management’s gross carrying/nominal values and the associated allowance for ECL from Corporate Centre into the other global businesses. |
Comparative data have been re-presented accordingly. There is no impact upon total gross carrying/nominal values, total allowance for ECL or the staging of financial instruments.
| Summary of financial instruments to which the impairment requirements in IFRS 9 are applied – by global business | ||||||||||||||||||||
| Gross carrying/nominal amount | Allowance for ECL | |||||||||||||||||||
| Stage 1 | Stage 2 | Stage 3 | POCI | Total | Stage 1 | Stage 2 | Stage 3 | POCI | Total | |||||||||||
| $m | $m | $m | $m | $m | $m | $m | $m | $m | $m | |||||||||||
| Loans and advances to customers at amortised cost | 852,678 | 161,795 | 17,139 | 296 | 1,031,908 | (1,906 | ) | (4,553 | ) | (6,669 | ) | (99 | ) | (13,227 | ) | |||||
| – WPB | 399,922 | 28,625 | 5,452 | — | 433,999 | (924 | ) | (2,123 | ) | (1,467 | ) | — | (4,514 | ) | ||||||
| – CMB | 246,831 | 95,965 | 8,682 | 209 | 351,687 | (768 | ) | (1,938 | ) | (4,343 | ) | (70 | ) | (7,119 | ) | |||||
| – GBM | 204,704 | 37,141 | 3,005 | 87 | 244,937 | (214 | ) | (480 | ) | (859 | ) | (29 | ) | (1,582 | ) | |||||
| – Corporate Centre | 1,221 | 64 | — | — | 1,285 | — | (12 | ) | — | — | (12 | ) | ||||||||
| Loans and advances to banks at amortised cost | 71,693 | 5,367 | 9 | — | 77,069 | (26 | ) | (23 | ) | (5 | ) | — | (54 | ) | ||||||
| – WPB | 14,888 | 589 | — | — | 15,477 | (4 | ) | (2 | ) | — | — | (6 | ) | |||||||
| – CMB | 10,302 | 345 | — | — | 10,647 | (2 | ) | (3 | ) | — | — | (5 | ) | |||||||
| – GBM | 31,367 | 4,140 | 9 | — | 35,516 | (13 | ) | (17 | ) | (5 | ) | — | (35 | ) | ||||||
| – Corporate Centre | 15,136 | 293 | — | — | 15,429 | (7 | ) | (1 | ) | — | — | (8 | ) | |||||||
| Other financial assets measured at amortised cost | 744,724 | 6,915 | 232 | 1 | 751,872 | (96 | ) | (63 | ) | (84 | ) | — | (243 | ) | ||||||
| – WPB | 147,136 | 1,804 | 110 | — | 149,050 | (62 | ) | (32 | ) | (46 | ) | — | (140 | ) | ||||||
| – CMB | 86,603 | 3,290 | 62 | 1 | 89,956 | (15 | ) | (25 | ) | (27 | ) | — | (67 | ) | ||||||
| – GBM | 426,407 | 1,692 | 43 | — | 428,142 | (19 | ) | (6 | ) | (11 | ) | — | (36 | ) | ||||||
| – Corporate Centre | 84,578 | 129 | 17 | — | 84,724 | — | — | — | — | — | ||||||||||
| Total gross carrying amount on-balance sheet at 30 Jun 2020 | 1,669,095 | 174,077 | 17,380 | 297 | 1,860,849 | (2,028 | ) | (4,639 | ) | (6,758 | ) | (99 | ) | (13,524 | ) | |||||
| Loans and other credit-related commitments | 594,400 | 52,698 | 1,055 | 3 | 648,156 | (193 | ) | (339 | ) | (90 | ) | — | (622 | ) | ||||||
| – WPB | 218,348 | 3,627 | 208 | — | 222,183 | (27 | ) | (5 | ) | — | — | (32 | ) | |||||||
| – CMB | 96,980 | 30,578 | 747 | 3 | 128,308 | (101 | ) | (204 | ) | (50 | ) | — | (355 | ) | ||||||
| – GBM | 278,848 | 18,493 | 100 | — | 297,441 | (65 | ) | (130 | ) | (40 | ) | — | (235 | ) | ||||||
| – Corporate Centre | 224 | — | — | — | 224 | — | — | — | — | — | ||||||||||
| Financial guarantees | 13,129 | 4,903 | 295 | 1 | 18,328 | (28 | ) | (73 | ) | (18 | ) | — | (119 | ) | ||||||
| – WPB | 896 | 46 | 2 | — | 944 | — | — | — | — | — | ||||||||||
| – CMB | 4,971 | 3,014 | 164 | 1 | 8,150 | (11 | ) | (47 | ) | (16 | ) | — | (74 | ) | ||||||
| – GBM | 7,261 | 1,843 | 129 | — | 9,233 | (17 | ) | (26 | ) | (2 | ) | — | (45 | ) | ||||||
| – Corporate Centre | 1 | — | — | — | 1 | — | — | — | — | — | ||||||||||
| Total nominal amount off-balance sheet at 30 Jun 2020 | 607,529 | 57,601 | 1,350 | 4 | 666,484 | (221 | ) | (412 | ) | (108 | ) | — | (741 | ) | ||||||
| WPB | 160,143 | 3,476 | 176 | — | 163,795 | (41 | ) | (6 | ) | (81 | ) | — | (128 | ) | ||||||
| CMB | 98,425 | 497 | 55 | — | 98,977 | (25 | ) | (2 | ) | (14 | ) | — | (41 | ) | ||||||
| GBM | 133,565 | 275 | 49 | — | 133,889 | (35 | ) | (1 | ) | (4 | ) | — | (40 | ) | ||||||
| Corporate Centre | 4,821 | 849 | — | — | 5,670 | (23 | ) | (9 | ) | (1 | ) | — | (33 | ) | ||||||
| Debt instruments measured at FVOCI at 30 Jun 2020 | 396,954 | 5,097 | 280 | — | 402,331 | (124 | ) | (18 | ) | (100 | ) | — | (242 | ) | ||||||
HSBC Holdings plc Interim Report 2020 | 77 |
Risk
Summary of financial instruments to which the impairment requirements in IFRS 9 are applied – by global business (continued)1 | ||||||||||||||||||||
| Gross carrying/nominal amount | Allowance for ECL | |||||||||||||||||||
| Stage 1 | Stage 2 | Stage 3 | POCI | Total | Stage 1 | Stage 2 | Stage 3 | POCI | Total | |||||||||||
| $m | $m | $m | $m | $m | $m | $m | $m | $m | $m | |||||||||||
| Loans and advances to customers at amortised cost | 951,583 | 80,182 | 13,378 | 332 | 1,045,475 | (1,297 | ) | (2,284 | ) | (5,052 | ) | (99 | ) | (8,732 | ) | |||||
| – WPB | 424,342 | 16,797 | 5,131 | — | 446,270 | (602 | ) | (1,330 | ) | (1,312 | ) | — | (3,244 | ) | ||||||
| – CMB | 297,364 | 46,423 | 6,649 | 212 | 350,648 | (520 | ) | (765 | ) | (3,190 | ) | (68 | ) | (4,543 | ) | |||||
| – GBM | 228,770 | 16,934 | 1,598 | 120 | 247,422 | (173 | ) | (177 | ) | (550 | ) | (31 | ) | (931 | ) | |||||
| – Corporate Centre | 1,107 | 28 | — | — | 1,135 | (2 | ) | (12 | ) | — | — | (14 | ) | |||||||
| Loans and advances to banks at amortised cost | 67,769 | 1,450 | — | — | 69,219 | (14 | ) | (2 | ) | — | — | (16 | ) | |||||||
| – WPB | 14,636 | 393 | — | — | 15,029 | (1 | ) | (1 | ) | — | — | (2 | ) | |||||||
| – CMB | 8,842 | 219 | — | — | 9,061 | (2 | ) | — | — | — | (2 | ) | ||||||||
| – GBM | 30,391 | 818 | — | — | 31,209 | (9 | ) | (1 | ) | — | — | (10 | ) | |||||||
| – Corporate Centre | 13,900 | 20 | — | — | 13,920 | (2 | ) | — | — | — | (2 | ) | ||||||||
| Other financial assets measured at amortised cost | 613,200 | 1,827 | 151 | 1 | 615,179 | (38 | ) | (38 | ) | (42 | ) | — | (118 | ) | ||||||
| – WPB | 109,423 | 548 | 41 | — | 110,012 | (21 | ) | (30 | ) | (5 | ) | — | (56 | ) | ||||||
| – CMB | 64,586 | 904 | 51 | 1 | 65,542 | (10 | ) | (7 | ) | (26 | ) | — | (43 | ) | ||||||
| – GBM | 361,541 | 374 | 37 | — | 361,952 | (7 | ) | (1 | ) | (11 | ) | — | (19 | ) | ||||||
| – Corporate Centre | 77,650 | 1 | 22 | — | 77,673 | — | — | — | — | — | ||||||||||
| Total gross carrying amount on-balance sheet at 31 Dec 2019 | 1,632,552 | 83,459 | 13,529 | 333 | 1,729,873 | (1,349 | ) | (2,324 | ) | (5,094 | ) | (99 | ) | (8,866 | ) | |||||
| Loans and other credit-related commitments | 577,631 | 21,618 | 771 | 9 | 600,029 | (137 | ) | (133 | ) | (59 | ) | — | (329 | ) | ||||||
| – WPB | 213,093 | 1,945 | 185 | — | 215,223 | (15 | ) | (1 | ) | — | — | (16 | ) | |||||||
| – CMB | 117,703 | 11,403 | 558 | 9 | 129,673 | (69 | ) | (65 | ) | (56 | ) | — | (190 | ) | ||||||
| – GBM | 246,805 | 8,270 | 28 | — | 255,103 | (53 | ) | (67 | ) | (3 | ) | — | (123 | ) | ||||||
| – Corporate Centre | 30 | — | — | — | 30 | — | — | — | — | — | ||||||||||
| Financial guarantees | 17,684 | 2,340 | 186 | 4 | 20,214 | (16 | ) | (22 | ) | (10 | ) | — | (48 | ) | ||||||
| – WPB | 972 | 4 | 1 | — | 977 | — | — | — | — | — | ||||||||||
| – CMB | 7,446 | 1,442 | 105 | 4 | 8,997 | (9 | ) | (12 | ) | (6 | ) | — | (27 | ) | ||||||
| – GBM | 9,263 | 894 | 80 | — | 10,237 | (7 | ) | (10 | ) | (4 | ) | — | (21 | ) | ||||||
| – Corporate Centre | 3 | — | — | — | 3 | — | — | — | — | — | ||||||||||
| Total nominal amount off-balance sheet at 31 Dec 2019 | 595,315 | 23,958 | 957 | 13 | 620,243 | (153 | ) | (155 | ) | (69 | ) | — | (377 | ) | ||||||
| WPB | 144,632 | 378 | — | — | 145,010 | (13 | ) | (81 | ) | — | — | (94 | ) | |||||||
| CMB | 85,353 | 62 | — | 1 | 85,416 | (5 | ) | (19 | ) | — | — | (24 | ) | |||||||
| GBM | 118,571 | 68 | — | — | 118,639 | (9 | ) | (16 | ) | — | — | (25 | ) | |||||||
| Corporate Centre | 6,093 | 506 | — | — | 6,599 | (12 | ) | (11 | ) | — | — | (23 | ) | |||||||
| Debt instruments measured at FVOCI at 31 Dec 2019 | 354,649 | 1,014 | — | 1 | 355,664 | (39 | ) | (127 | ) | — | — | (166 | ) | |||||||
| 1 | 2019 figures are restated for the change in reportable segments. |
| 78 | HSBC Holdings plc Interim Report 2020 |
| Wholesale lending – loans and advances to customers at amortised cost by country/territory | ||||||||||||||||
| Gross carrying amount | Allowance for ECL | |||||||||||||||
| Corporate and commercial | Of which: real estate1 | Non-bank financial institutions | Total | Corporate and commercial | Of which: real estate1 | Non-bank financial institutions | Total | |||||||||
| $m | $m | $m | $m | $m | $m | $m | $m | |||||||||
| Europe | 173,614 | 24,803 | 24,680 | 198,294 | (3,429 | ) | (497 | ) | (196 | ) | (3,625 | ) | ||||
– UK | 121,692 | 17,703 | 17,856 | 139,548 | (2,570 | ) | (444 | ) | (130 | ) | (2,700 | ) | ||||
| – France | 30,550 | 5,292 | 4,204 | 34,754 | (541 | ) | (30 | ) | (59 | ) | (600 | ) | ||||
| – Germany | 10,608 | 405 | 1,436 | 12,044 | (121 | ) | — | (3 | ) | (124 | ) | |||||
| – Switzerland | 1,396 | 336 | 340 | 1,736 | (2 | ) | — | — | (2 | ) | ||||||
| – other | 9,368 | 1,067 | 844 | 10,212 | (195 | ) | (23 | ) | (4 | ) | (199 | ) | ||||
| Asia | 265,105 | 83,623 | 33,259 | 298,364 | (2,520 | ) | (152 | ) | (57 | ) | (2,577 | ) | ||||
| – Hong Kong | 167,960 | 66,928 | 20,833 | 188,793 | (956 | ) | (56 | ) | (28 | ) | (984 | ) | ||||
| – Australia | 10,931 | 1,951 | 1,554 | 12,485 | (82 | ) | (11 | ) | — | (82 | ) | |||||
| – India | 7,076 | 1,761 | 3,043 | 10,119 | (82 | ) | (23 | ) | (7 | ) | (89 | ) | ||||
| – Indonesia | 3,974 | 58 | 196 | 4,170 | (254 | ) | (1 | ) | (1 | ) | (255 | ) | ||||
| – mainland China | 27,838 | 5,528 | 5,832 | 33,670 | (217 | ) | (44 | ) | (19 | ) | (236 | ) | ||||
| – Malaysia | 7,347 | 1,749 | 256 | 7,603 | (65 | ) | (6 | ) | — | (65 | ) | |||||
| – Singapore | 18,347 | 4,123 | 671 | 19,018 | (754 | ) | (6 | ) | (1 | ) | (755 | ) | ||||
| – Taiwan | 5,374 | 14 | 36 | 5,410 | 0 | — | — | 0 | ||||||||
| – other | 16,258 | 1,511 | 838 | 17,096 | (110 | ) | (5 | ) | (1 | ) | (111 | ) | ||||
| Middle East and North Africa (excluding Saudi Arabia) | 25,311 | 1,996 | 311 | 25,622 | (1,364 | ) | (191 | ) | (16 | ) | (1,380 | ) | ||||
| – Egypt | 2,214 | 36 | 14 | 2,228 | (147 | ) | (4 | ) | (3 | ) | (150 | ) | ||||
| – UAE | 14,820 | 1,837 | 190 | 15,010 | (893 | ) | (183 | ) | (10 | ) | (903 | ) | ||||
| – other | 8,277 | 123 | 107 | 8,384 | (324 | ) | (4 | ) | (3 | ) | (327 | ) | ||||
| North America | 63,296 | 14,618 | 9,863 | 73,159 | (751 | ) | (95 | ) | (13 | ) | (764 | ) | ||||
| – US | 39,828 | 8,376 | 8,286 | 48,114 | (418 | ) | (45 | ) | (3 | ) | (421 | ) | ||||
| – Canada | 22,597 | 5,982 | 1,450 | 24,047 | (299 | ) | (26 | ) | (5 | ) | (304 | ) | ||||
| – other | 871 | 260 | 127 | 998 | (34 | ) | (24 | ) | (5 | ) | (39 | ) | ||||
| Latin America | 12,982 | 1,770 | 1,303 | 14,285 | (473 | ) | (42 | ) | (7 | ) | (480 | ) | ||||
| – Mexico | 10,910 | 1,768 | 1,270 | 12,180 | (353 | ) | (42 | ) | (7 | ) | (360 | ) | ||||
| – other | 2,072 | 2 | 33 | 2,105 | (120 | ) | — | — | (120 | ) | ||||||
| At 30 Jun 2020 | 540,308 | 126,810 | 69,416 | 609,724 | (8,537 | ) | (977 | ) | (289 | ) | (8,826 | ) | ||||
| Europe | 175,215 | 26,587 | 26,497 | 201,712 | (2,304 | ) | (354 | ) | (81 | ) | (2,385 | ) | ||||
– UK | 126,760 | 18,941 | 18,545 | 145,305 | (1,629 | ) | (303 | ) | (26 | ) | (1,655 | ) | ||||
| – France | 27,885 | 5,643 | 4,899 | 32,784 | (423 | ) | (28 | ) | (52 | ) | (475 | ) | ||||
| – Germany | 9,771 | 390 | 1,743 | 11,514 | (60 | ) | — | — | (60 | ) | ||||||
| – Switzerland | 1,535 | 554 | 406 | 1,941 | (1 | ) | — | — | (1 | ) | ||||||
| – other | 9,264 | 1,059 | 904 | 10,168 | (191 | ) | (23 | ) | (3 | ) | (194 | ) | ||||
| Asia | 267,709 | 85,556 | 32,157 | 299,866 | (1,449 | ) | (94 | ) | (52 | ) | (1,501 | ) | ||||
| – Hong Kong | 168,380 | 67,856 | 19,776 | 188,156 | (750 | ) | (51 | ) | (40 | ) | (790 | ) | ||||
| – Australia | 11,428 | 1,993 | 1,743 | 13,171 | (70 | ) | (3 | ) | — | (70 | ) | |||||
| – India | 6,657 | 1,565 | 2,622 | 9,279 | (49 | ) | (3 | ) | (1 | ) | (50 | ) | ||||
| – Indonesia | 4,346 | 63 | 353 | 4,699 | (222 | ) | (1 | ) | (2 | ) | (224 | ) | ||||
| – mainland China | 26,594 | 5,304 | 5,911 | 32,505 | (198 | ) | (29 | ) | (8 | ) | (206 | ) | ||||
| – Malaysia | 6,914 | 1,597 | 230 | 7,144 | (40 | ) | (2 | ) | — | (40 | ) | |||||
| – Singapore | 19,986 | 5,235 | 618 | 20,604 | (60 | ) | (2 | ) | — | (60 | ) | |||||
| – Taiwan | 6,384 | 28 | 82 | 6,466 | (2 | ) | — | — | (2 | ) | ||||||
| – other | 17,020 | 1,915 | 822 | 17,842 | (58 | ) | (3 | ) | (1 | ) | (59 | ) | ||||
| Middle East and North Africa (excluding Saudi Arabia) | 23,447 | 1,816 | 288 | 23,735 | (1,087 | ) | (181 | ) | (13 | ) | (1,100 | ) | ||||
| – Egypt | 1,889 | 35 | 16 | 1,905 | (132 | ) | — | (3 | ) | (135 | ) | |||||
| – UAE | 13,697 | 1,695 | 122 | 13,819 | (683 | ) | (179 | ) | (7 | ) | (690 | ) | ||||
| – other | 7,861 | 86 | 150 | 8,011 | (272 | ) | (2 | ) | (3 | ) | (275 | ) | ||||
| North America | 59,680 | 15,128 | 10,078 | 69,758 | (274 | ) | (43 | ) | (11 | ) | (285 | ) | ||||
| – US | 34,477 | 8,282 | 8,975 | 43,452 | (116 | ) | (14 | ) | (2 | ) | (118 | ) | ||||
| – Canada | 24,427 | 6,556 | 979 | 25,406 | (136 | ) | (10 | ) | (4 | ) | (140 | ) | ||||
| – other | 776 | 290 | 124 | 900 | (22 | ) | (19 | ) | (5 | ) | (27 | ) | ||||
| Latin America | 14,448 | 1,665 | 1,685 | 16,133 | (324 | ) | (8 | ) | (3 | ) | (327 | ) | ||||
| – Mexico | 12,352 | 1,664 | 1,625 | 13,977 | (221 | ) | (8 | ) | (3 | ) | (224 | ) | ||||
| – other | 2,096 | 1 | 60 | 2,156 | (103 | ) | — | — | (103 | ) | ||||||
| At 31 Dec 2019 | 540,499 | 130,752 | 70,705 | 611,204 | (5,438 | ) | (680 | ) | (160 | ) | (5,598 | ) | ||||
| 1 | Real estate lending within this disclosure corresponds solely to the industry of the borrower. |
HSBC Holdings plc Interim Report 2020 | 79 |
Risk
| Personal lending – loans and advances to customers at amortised cost by country/territory | ||||||||||||||||
| Gross carrying amount | Allowance for ECL | |||||||||||||||
| First lien residential mortgages | Other personal | Of which: credit cards | Total | First lien residential mortgages | Other personal | Of which: credit cards | Total | |||||||||
| $m | $m | $m | $m | $m | $m | $m | $m | |||||||||
| Europe | 139,270 | 46,850 | 7,395 | 186,120 | (434 | ) | (1,625 | ) | (649 | ) | (2,059 | ) | ||||
– UK | 132,005 | 18,227 | 7,046 | 150,232 | (318 | ) | (1,429 | ) | (644 | ) | (1,747 | ) | ||||
– France1 | 3,434 | 21,733 | 303 | 25,167 | (40 | ) | (107 | ) | (3 | ) | (147 | ) | ||||
| – Germany | — | 308 | — | 308 | — | — | — | — | ||||||||
| – Switzerland | 1,127 | 6,247 | — | 7,374 | (3 | ) | (70 | ) | — | (73 | ) | |||||
| – other | 2,704 | 335 | 46 | 3,039 | (73 | ) | (19 | ) | (2 | ) | (92 | ) | ||||
| Asia | 134,104 | 45,752 | 10,719 | 179,856 | (63 | ) | (843 | ) | (566 | ) | (906 | ) | ||||
| – Hong Kong | 89,284 | 32,101 | 7,276 | 121,385 | (1 | ) | (393 | ) | (262 | ) | (394 | ) | ||||
| – Australia | 17,727 | 577 | 498 | 18,304 | (12 | ) | (51 | ) | (49 | ) | (63 | ) | ||||
| – India | 919 | 590 | 206 | 1,509 | (8 | ) | (28 | ) | (20 | ) | (36 | ) | ||||
| – Indonesia | 66 | 277 | 156 | 343 | — | (38 | ) | (27 | ) | (38 | ) | |||||
| – mainland China | 8,892 | 1,114 | 615 | 10,006 | (4 | ) | (97 | ) | (85 | ) | (101 | ) | ||||
| – Malaysia | 2,646 | 2,859 | 801 | 5,505 | (28 | ) | (96 | ) | (49 | ) | (124 | ) | ||||
| – Singapore | 6,473 | 6,208 | 330 | 12,681 | — | (70 | ) | (23 | ) | (70 | ) | |||||
| – Taiwan | 5,232 | 1,004 | 241 | 6,236 | — | (15 | ) | (5 | ) | (15 | ) | |||||
| – other | 2,865 | 1,022 | 596 | 3,887 | (10 | ) | (55 | ) | (46 | ) | (65 | ) | ||||
| Middle East and North Africa (excluding Saudi Arabia) | 2,263 | 3,500 | 819 | 5,763 | (71 | ) | (322 | ) | (161 | ) | (393 | ) | ||||
| – Egypt | — | 336 | 80 | 336 | — | (7 | ) | (3 | ) | (7 | ) | |||||
| – UAE | 1,900 | 1,282 | 408 | 3,182 | (66 | ) | (189 | ) | (104 | ) | (255 | ) | ||||
| – other | 363 | 1,882 | 331 | 2,245 | (5 | ) | (126 | ) | (54 | ) | (131 | ) | ||||
| North America | 39,323 | 4,551 | 1,446 | 43,874 | (144 | ) | (310 | ) | (242 | ) | (454 | ) | ||||
| – US | 18,341 | 2,295 | 1,199 | 20,636 | (16 | ) | (276 | ) | (235 | ) | (292 | ) | ||||
| – Canada | 19,814 | 2,073 | 212 | 21,887 | (26 | ) | (26 | ) | (6 | ) | (52 | ) | ||||
| – other | 1,168 | 183 | 35 | 1,351 | (102 | ) | (8 | ) | (1 | ) | (110 | ) | ||||
| Latin America | 3,125 | 3,446 | 1,237 | 6,571 | (94 | ) | (495 | ) | (239 | ) | (589 | ) | ||||
| – Mexico | 2,982 | 2,968 | 990 | 5,950 | (93 | ) | (455 | ) | (218 | ) | (548 | ) | ||||
| – other | 143 | 478 | 247 | 621 | (1 | ) | (40 | ) | (21 | ) | (41 | ) | ||||
| At 30 Jun 2020 | 318,085 | 104,099 | 21,616 | 422,184 | (806 | ) | (3,595 | ) | (1,857 | ) | (4,401 | ) | ||||
| Europe | 145,382 | 50,368 | 10,246 | 195,750 | (266 | ) | (962 | ) | (438 | ) | (1,228 | ) | ||||
– UK | 137,985 | 22,395 | 9,816 | 160,380 | (159 | ) | (828 | ) | (434 | ) | (987 | ) | ||||
– France1 | 3,520 | 21,120 | 376 | 24,640 | (39 | ) | (101 | ) | (3 | ) | (140 | ) | ||||
| – Germany | — | 325 | — | 325 | — | — | — | — | ||||||||
| – Switzerland | 1,183 | 6,165 | — | 7,348 | (6 | ) | (17 | ) | — | (23 | ) | |||||
| – other | 2,694 | 363 | 54 | 3,057 | (62 | ) | (16 | ) | (1 | ) | (78 | ) | ||||
| Asia | 131,864 | 48,231 | 12,144 | 180,095 | (42 | ) | (690 | ) | (463 | ) | (732 | ) | ||||
| – Hong Kong | 86,892 | 33,061 | 8,043 | 119,953 | (1 | ) | (353 | ) | (242 | ) | (354 | ) | ||||
| – Australia | 16,997 | 693 | 603 | 17,690 | (5 | ) | (34 | ) | (33 | ) | (39 | ) | ||||
| – India | 1,047 | 528 | 219 | 1,575 | (5 | ) | (21 | ) | (15 | ) | (26 | ) | ||||
| – Indonesia | 67 | 329 | 204 | 396 | — | (24 | ) | (18 | ) | (24 | ) | |||||
| – mainland China | 8,966 | 1,190 | 656 | 10,156 | (2 | ) | (74 | ) | (68 | ) | (76 | ) | ||||
| – Malaysia | 2,840 | 3,200 | 980 | 6,040 | (22 | ) | (73 | ) | (33 | ) | (95 | ) | ||||
| – Singapore | 6,687 | 7,033 | 452 | 13,720 | (1 | ) | (60 | ) | (19 | ) | (61 | ) | ||||
| – Taiwan | 5,286 | 1,004 | 297 | 6,290 | 0 | (14 | ) | (4 | ) | (14 | ) | |||||
| – other | 3,082 | 1,193 | 690 | 4,275 | (6 | ) | (37 | ) | (31 | ) | (43 | ) | ||||
| Middle East and North Africa (excluding Saudi Arabia) | 2,303 | 3,914 | 1,042 | 6,217 | (62 | ) | (235 | ) | (111 | ) | (297 | ) | ||||
| – Egypt | — | 346 | 88 | 346 | — | (3 | ) | (1 | ) | (3 | ) | |||||
| – UAE | 1,920 | 1,462 | 517 | 3,382 | (59 | ) | (121 | ) | (54 | ) | (180 | ) | ||||
| – other | 383 | 2,106 | 437 | 2,489 | (3 | ) | (111 | ) | (56 | ) | (114 | ) | ||||
| North America | 39,065 | 5,251 | 1,742 | 44,316 | (122 | ) | (194 | ) | (142 | ) | (316 | ) | ||||
| – US | 17,870 | 2,551 | 1,424 | 20,421 | (8 | ) | (160 | ) | (134 | ) | (168 | ) | ||||
| – Canada | 19,997 | 2,495 | 271 | 22,492 | (21 | ) | (25 | ) | (7 | ) | (46 | ) | ||||
| – other | 1,198 | 205 | 47 | 1,403 | (93 | ) | (9 | ) | (1 | ) | (102 | ) | ||||
| Latin America | 3,564 | 4,329 | 1,594 | 7,893 | (37 | ) | (524 | ) | (241 | ) | (561 | ) | ||||
| – Mexico | 3,419 | 3,780 | 1,308 | 7,199 | (31 | ) | (488 | ) | (224 | ) | (519 | ) | ||||
| – other | 145 | 549 | 286 | 694 | (6 | ) | (36 | ) | (17 | ) | (42 | ) | ||||
| At 31 Dec 2019 | 322,178 | 112,093 | 26,768 | 434,271 | (529 | ) | (2,605 | ) | (1,395 | ) | (3,134 | ) | ||||
| 1 | Included in other personal lending as at 30 June 2020 is $18,406m (31 December 2019: $17,585m) guaranteed by Crédit Logement. |
| 80 | HSBC Holdings plc Interim Report 2020 |
| Capital and liquidity risk |
| Page | |
| Overview | |
| Capital risk management | |
| Capital risk in the first half of 2020 | |
| Capital overview | |
Regulatory transitional arrangements for IFRS 9 ‘Financial Instruments’ | |
| Own funds | |
| Risk-weighted assets | |
| Leverage ratio | |
| Regulatory disclosures | |
| Liquidity and funding risk management | |
| Liquidity and funding risk in the first half of 2020 | |
| Operating entities liquidity | |
| Sources of funding | |
Overview
Capital and liquidity risk is the risk of having insufficient capital, liquidity or funding resources to meet financial obligations and satisfy regulatory requirements, including pension risk.
Capital and liquidity risk arises from changes to the respective resources and risk profiles driven by customer behaviour, management decisions or the external environment.
A summary of our current policies and practices regarding the management of capital and liquidity risk is set out on pages 130 and 131 of the Annual Report and Accounts 2019.
Capital risk management
Overview
Capital risk is the risk that we fail to meet our regulatory capital requirements either at Group, subsidiary or branch level.
Key developments in the first half of 2020
The management of capital was a key focus in the first half of 2020 to ensure the Group responded to unprecedented customer and capital demands arising from the Covid-19 outbreak.
In response to a written request from the PRA, we cancelled the fourth interim dividend for 2019 of $0.21 per ordinary share. Similar requests were also made to other UK incorporated banking groups. We also announced that until the end of 2020 we will make no quarterly or interim dividend payments or accruals in respect of ordinary shares. We also plan to suspend share buy-backs in respect of ordinary shares in 2020 and 2021.
Governments, central banks and regulatory authorities globally have responded to the Covid-19 outbreak to ensure continued support and provision of financial services to the real economy. The Financial Policy Committee announced a reduction of the UK countercyclical buffer rate to 0% effective from March 2020. This change was reflected in the Group’s risk appetite statement, and together with other regulatory relief, resulted in a reduction to Group CET1 and leverage ratio requirements.
In the EU, the relief measures include an acceleration of some of the beneficial elements of the amendments to the Capital Requirements Regulation (‘CRR II’) that were originally scheduled for June 2021. The relevant changes impacting 1H20 positions included a resetting of the transitional provisions in relation to recognising IFRS 9 provisions and netting the leverage ratio exposure measure of regular-way purchases and sales. Additionally, there were beneficial changes to prudent valuation adjustments and market risk back-testing exemptions.
In 1H20, all entities remained within the CET1 risk appetite and the Group continues to maintain the appropriate resources required to adequately support risks to which it is exposed. This has been further informed by additional internal stress tests carried out in response to the Covid-19 outbreak. Capital risk management practices continued to be enhanced across the Group through the capital risk management function, focusing on both adequacy of capital and sufficiency of returns.
Approach and policy
The objectives of our capital management policy are to maintain a strong capital base to support the risks inherent in our business and invest in accordance with our strategy, meeting both consolidated and local regulatory capital requirements at all times.
Our capital management policy is underpinned by a capital management framework and our internal capital adequacy assessment process (‘ICAAP’). The framework incorporates key capital risk appetites for CET1, total capital, minimum required eligible liabilities (‘MREL’) and double leverage. The ICAAP is an assessment of the Group’s capital position, outlining both regulatory and internal capital resources and requirements resulting from HSBC’s business model, strategy, risk profile and management, performance and planning, risks to capital, and the implications of stress testing. Our assessment of capital adequacy is driven by an assessment of risks. These risks include credit, market, operational, pensions, insurance, structural foreign exchange and interest rate risk in the banking book. The Group ICAAP supports the determination of the consolidated risk appetite and target ratios as well as enables the assessment and determination of capital requirements by regulators. Subsidiaries prepare ICAAPs based on their local regulatory regimes in order to determine their own risk appetites and ratios.
The holding company has a portfolio of high-quality liquid assets (‘HQLA’). This mitigates holding company cash flow risk arising from double leverage and underpins the strength of support it can offer to its subsidiaries in times of stress.
Planning and performance
Capital and risk-weighted asset (‘RWA’) plans form part of the annual operating plan that is approved by the Board. Capital and RWA forecasts are submitted to the Group Executive Committee on a monthly basis, and capital and RWAs are monitored and managed against the plan. The responsibility for global capital allocation principles rests with the Group Chief Financial Officer, supported by the Group Capital Management Meeting. This is a specialist forum addressing capital management, reporting into the Holdings Asset and Liability Management Committee. Through our internal governance processes, we strengthen discipline over our investment and capital allocation decisions, and aim to ensure that returns on investment meet the Group’s management objectives. Our strategy is to allocate capital to businesses and entities to support growth objectives and local economies where returns above internal hurdle levels have been identified and in order to meet their regulatory and economic capital needs. We evaluate and manage business returns by using a return on average tangible equity measure.
Risks to capital
Outside the stress testing framework, other risks may be identified that have the potential to affect our RWAs and/or capital position. Downside and Upside scenarios are assessed against our capital management objectives and mitigating actions are assigned as necessary. We closely monitor and consider future regulatory change. We continue to evaluate the impact upon our capital requirements of regulatory developments, including the CRR II amendments, the Basel III reforms package and the UK’s withdrawal from the EU.
As part of the CRR II amendments in response to the Covid-19 outbreak, the EU accelerated the application of the revised small and medium-sized enterprises (‘SME’) supporting factor and the new infrastructure supporting factor. The accelerated application of the revised SME and infrastructure supporting factors will be implemented by the Group in the second half of 2020. Finalisation of the changes to the treatment of software intangible assets are also expected in the second half of 2020.
The Basel Committee has recommended a one-year delay in effective date, which means Basel III reforms are now expected to impact from 1 January 2023.
HSBC Holdings plc Interim Report 2020 | 81 |
Risk
Stress testing and recovery planning
In addition to a range of internal stress tests, we are subject to supervisory stress testing in many jurisdictions. Supervisory stress testing requirements are increasing in the granularity with which the results are required. These exercises include the programmes of the UK PRA, the US Federal Reserve Board, the European Banking Authority (‘EBA’), the European Central Bank (‘ECB’) and the Hong Kong Monetary Authority, as well as stress tests undertaken in other jurisdictions. We take into account the results of regulatory stress testing and our internal stress tests when assessing our internal capital requirements. The outcome of stress testing exercises carried out by the PRA also feeds into a PRA buffer under Pillar 2 requirements.
The Group and its subsidiaries have recovery plans that set out potential options that management could take in a range of stress scenarios that could result in a breach of our internal capital buffers. This is to help ensure that our capital position can be recovered even in an extreme stress.
During 1H20, in light of the Covid-19 outbreak, we carried out additional internal testing on a baseline and stressed scenario. The results of these stress tests were considered in determining capital actions to manage the Group’s position.
Capital risk in the first half of 2020
Capital overview
| Capital adequacy metrics | ||||
| At | ||||
| 30 Jun | 31 Dec | |||
| 2020 | 2019 | |||
| Risk-weighted assets (‘RWAs’) ($bn) | ||||
| Credit risk | 686.7 | 676.6 | ||
| Counterparty credit risk | 43.1 | 44.1 | ||
| Market risk | 35.2 | 29.9 | ||
| Operational risk | 89.6 | 92.8 | ||
| Total RWAs | 854.6 | 843.4 | ||
| Capital on a transitional basis ($bn) | ||||
| Common equity tier 1 (‘CET1’) capital | 128.4 | 124.0 | ||
| Tier 1 capital | 152.5 | 148.4 | ||
| Total capital | 177.2 | 172.2 | ||
| Capital ratios on a transitional basis (%) | ||||
| Common equity tier 1 ratio | 15.0 | 14.7 | ||
| Tier 1 ratio | 17.8 | 17.6 | ||
| Total capital ratio | 20.7 | 20.4 | ||
| Capital on an end point basis ($bn) | ||||
| Common equity tier 1 (‘CET1’) capital | 128.4 | 124.0 | ||
| Tier 1 capital | 149.4 | 144.8 | ||
| Total capital | 164.4 | 159.3 | ||
| Capital ratios on an end point basis (%) | ||||
| Common equity tier 1 ratio | 15.0 | 14.7 | ||
| Tier 1 ratio | 17.5 | 17.2 | ||
| Total capital ratio | 19.2 | 18.9 | ||
| Liquidity coverage ratio (‘LCR’) | ||||
Total high-quality liquid assets ($bn) | 654.4 | 601.4 | ||
Total net cash outflow ($bn) | 442.9 | 400.5 | ||
LCR ratio (%) | 147.8 | 150.2 | ||
Capital figures and ratios in the table above are calculated in accordance with the revisions to the Capital Requirements Regulation and Directive, as implemented (‘CRR II’). The table presents them under the transitional arrangements in CRR II for capital instruments and after their expiry, known as the end point. The end point figures in the table above include the benefit of the regulatory transitional arrangements in CRR II for IFRS 9, which are more fully described below.
Where applicable, they also reflect government relief schemes intended to mitigate the impact of the Covid-19 outbreak.
Regulatory transitional arrangements for IFRS 9 ‘Financial Instruments’
We have adopted the regulatory transitional arrangements in CRR II for IFRS 9, including paragraph four of article 473a. Our capital and ratios are presented under these arrangements throughout the table above, including in the end point figures. Without their application, our CET1 ratio would be 14.9%.
The IFRS 9 regulatory transitional arrangements allow banks to add back to their capital base a proportion of the impact that IFRS 9 has upon their loan loss allowances during the first five years of use. The impact is defined as:
| • | the increase in loan loss allowances on day one of IFRS 9 adoption; and |
| • | any subsequent increase in ECL in the non-credit-impaired book thereafter. |
Any add-back must be tax affected and accompanied by a recalculation of capital deduction thresholds, exposure and RWAs. The impact is calculated separately for portfolios using the standardised (‘STD’) and internal ratings based (‘IRB’) approaches. For IRB portfolios, there is no add-back to capital unless loan loss allowances exceed regulatory 12-month expected losses.
The EU’s CRR ‘Quick Fix’ relief package enacted in June 2020 increased from 70% to 100% the relief that banks may take for loan loss allowances recognised since 1 January 2020 on the
non-credit-impaired book.
non-credit-impaired book.
In the current period, the add-back to CET1 capital amounted to $1.4bn under the STD approach with a tax impact of $0.3bn. At
31 December 2019, the add-back to the capital base under the STD approach was $1.0bn with a tax impact of $0.2bn.
31 December 2019, the add-back to the capital base under the STD approach was $1.0bn with a tax impact of $0.2bn.
| 82 | HSBC Holdings plc Interim Report 2020 |
Own funds
| Own funds disclosure | |||||
| At | |||||
| 30 Jun | 31 Dec | ||||
| 2020 | 2019 | ||||
Ref* | $m | $m | |||
| 6 | Common equity tier 1 capital before regulatory adjustments | 159,557 | 153,280 | ||
| 28 | Total regulatory adjustments to common equity tier 1 | (31,111 | ) | (29,314 | ) |
| 29 | Common equity tier 1 capital | 128,446 | 123,966 | ||
| 36 | Additional tier 1 capital before regulatory adjustments | 24,091 | 24,453 | ||
| 43 | Total regulatory adjustments to additional tier 1 capital | (60 | ) | (60 | ) |
| 44 | Additional tier 1 capital | 24,031 | 24,393 | ||
| 45 | Tier 1 capital | 152,477 | 148,359 | ||
| 51 | Tier 2 capital before regulatory adjustments | 26,181 | 25,192 | ||
| 57 | Total regulatory adjustments to tier 2 capital | (1,416 | ) | (1,401 | ) |
| 58 | Tier 2 capital | 24,765 | 23,791 | ||
| 59 | Total capital | 177,242 | 172,150 | ||
| 60 | Total risk-weighted assets | 854,552 | 843,395 | ||
| Capital ratios | % | % | |||
| 61 | Common equity tier 1 ratio | 15.0 | 14.7 | ||
| 62 | Tier 1 ratio | 17.8 | 17.6 | ||
| 63 | Total capital ratio | 20.7 | 20.4 | ||
| * | The references identify the lines prescribed in the EBA template. |
At 30 June 2020, our common equity tier 1 (‘CET1’) capital ratio increased to 15.0% from 14.7% at 31 December 2019. CET1 capital increased in 1H20 by $4.5bn, mainly as a result of:
| • | the cancellation of the 4Q19 unpaid dividend of $3.4bn at the PRA’s request; |
| • | a $1.8bn increase as a result of lower deductions for excess expected loss. ECL against IRB exposures rose by $4.3bn compared with 31 December 2019, while regulatory expected losses rose by $2.5bn; |
| • | capital generation of $1.7bn through profits, net of dividends relating to other equity instruments; and |
| • | a $1.5bn increase in the fair value through other comprehensive income reserve. |
These increases were partly offset by:
| • | foreign currency translation differences of $3.7bn; and |
| • | a $0.8bn fall in the allowable non-controlling interest in the CET1. This partly reflected the acquisition in May 2020 of additional shares representing 18.66% of the capital of HSBC Trinkaus & Burkhardt AG from Landesbank Baden-Württemberg, the principal minority shareholder. |
At 30 June 2020, our Pillar 2A requirement was 3.1% of RWAs, of which 1.7% was met by CET1. This is based on a point-in-time view as per the PRA’s Individual Capital Requirement assessment, and set as a nominal amount based on RWAs at 31 December 2019.
Throughout the first half of 2020, we complied with the PRA’s regulatory capital adequacy requirements.
Risk-weighted assets
| RWAs by global business | ||||||||||
| WPB | CMB | GBM | Corporate Centre | Total | ||||||
| $bn | $bn | $bn | $bn | $bn | ||||||
| Credit risk | 127.1 | 304.6 | 176.4 | 78.6 | 686.7 | |||||
| Counterparty credit risk | 0.6 | 0.2 | 41.1 | 1.2 | 43.1 | |||||
| Market risk | 1.2 | 0.7 | 29.7 | 3.6 | 35.2 | |||||
| Operational risk | 32.9 | 25.4 | 30.4 | 0.9 | 89.6 | |||||
| At 30 Jun 2020 | 161.8 | 330.9 | 277.6 | 84.3 | 854.6 | |||||
| RWAs by geographical region | |||||||||||||
| Europe | Asia | MENA | North America | Latin America | Total | ||||||||
| Footnotes | $bn | $bn | $bn | $bn | $bn | $bn | |||||||
| Credit risk | 206.6 | 299.2 | 49.5 | 105.0 | 26.4 | 686.7 | |||||||
| Counterparty credit risk | 22.7 | 9.8 | 1.3 | 7.6 | 1.7 | 43.1 | |||||||
| Market risk | 1 | 26.4 | 20.8 | 1.7 | 6.3 | 1.1 | 35.2 | ||||||
| Operational risk | 22.8 | 44.9 | 6.1 | 11.7 | 4.1 | 89.6 | |||||||
| At 30 Jun 2020 | 278.5 | 374.7 | 58.6 | 130.6 | 33.3 | 854.6 | |||||||
| 1 | Market risk RWAs are non-additive across geographical regions due to diversification effects within the Group. |
HSBC Holdings plc Interim Report 2020 | 83 |
Risk
| RWA movement by global businesses by key driver | ||||||||||||
| Credit risk, counterparty credit risk and operational risk | ||||||||||||
| WPB | CMB | GBM | Corporate Centre | Market risk | Total RWAs | |||||||
| $bn | $bn | $bn | $bn | $bn | $bn | |||||||
| RWAs at 1 Jan 2020 | 161.4 | 325.1 | 248.7 | 78.3 | 29.9 | 843.4 | ||||||
| Asset size | 2.4 | 3.1 | 8.7 | 1.0 | 8.1 | 23.3 | ||||||
| Asset quality | 0.5 | 11.1 | 4.7 | 0.5 | — | 16.8 | ||||||
| Model updates | 0.7 | 0.6 | (0.8 | ) | — | (1.0 | ) | (0.5 | ) | |||
| Methodology and policy | 0.6 | 0.4 | (7.1 | ) | 1.5 | (1.8 | ) | (6.4 | ) | |||
| Foreign exchange movements | (5.0 | ) | (10.1 | ) | (6.3 | ) | (0.6 | ) | — | (22.0 | ) | |
| Total RWA movement | (0.8 | ) | 5.1 | (0.8 | ) | 2.4 | 5.3 | 11.2 | ||||
| RWAs at 30 Jun 2020 | 160.6 | 330.2 | 247.9 | 80.7 | 35.2 | 854.6 | ||||||
| RWA movement by geographical region by key driver | ||||||||||||||
| Credit risk, counterparty credit risk and operational risk | ||||||||||||||
| Europe | Asia | MENA | North America | Latin America | Market risk | Total RWAs | ||||||||
| $bn | $bn | $bn | $bn | $bn | $bn | $bn | ||||||||
| RWAs at 1 Jan 2020 | 257.9 | 345.9 | 55.5 | 117.6 | 36.6 | 29.9 | 843.4 | |||||||
| Asset size | 0.8 | 7.4 | 1.9 | 3.2 | 1.9 | 8.1 | 23.3 | |||||||
| Asset quality | 3.9 | 5.9 | 0.6 | 6.1 | 0.3 | — | 16.8 | |||||||
| Model updates | (0.3 | ) | 0.6 | — | 0.2 | — | (1.0 | ) | (0.5 | ) | ||||
| Methodology and policy | 1.3 | (3.6 | ) | (0.4 | ) | (1.4 | ) | (0.5 | ) | (1.8 | ) | (6.4 | ) | |
| Foreign exchange movements | (11.5 | ) | (2.3 | ) | (0.7 | ) | (1.4 | ) | (6.1 | ) | — | (22.0 | ) | |
| Total RWA movement | (5.8 | ) | 8.0 | 1.4 | 6.7 | (4.4 | ) | 5.3 | 11.2 | |||||
| RWAs at 30 Jun 2020 | 252.1 | 353.9 | 56.9 | 124.3 | 32.2 | 35.2 | 854.6 | |||||||
Risk-weighted assets (‘RWAs’) rose by $11.2bn during the first half of the year, including a reduction of $22.0bn due to foreign currency translation differences. The $33.2bn increase (excluding foreign currency translation differences) comprised the movements described by the following comments.
Asset size
The $23.3bn increase in RWAs was predominantly due to lending growth in GBM, CMB and WPB during 1Q20, and an $8.1bn increase in market risk RWAs. Increases in GBM credit risk and market risk RWAs were partly offset by reductions under management initiatives.
GBM RWAs rose by $8.7bn, with $12.2bn coming from lending growth – mostly in Europe, Asia and MENA. This was partly offset by active portfolio management measures of $4.6bn in the same regions. GBM counterparty credit risk RWAs rose by $1.2bn, largely as a result of mark-to-market movements. This was after the effect of management initiatives.
In CMB, the RWA increase of $3.1bn mainly resulted from lending growth in all regions, partly offset by a $3.3bn reduction of RWAs through management actions in Europe and Asia.
WPB’s RWA increase of $2.4bn was mainly driven by continued growth in the property market in Asia, coupled with movements in other asset classes.
The $1.0bn increase in Corporate Centre RWAs was mostly due to an increase in the value of significant holdings in Asia.
Market risk RWAs increased by $8.1bn. Most of this was due to market conditions, partly offset by management initiatives of $3.6bn.
Asset quality
Changes in asset quality led to an RWA increase of $16.8bn, mainly in CMB and GBM.
In CMB, a $11.1bn RWA increase included credit migration impacts of $4.6bn in Europe, $5.0bn in North America, and $2.8bn in Asia. These were partly offset by decreases totalling $1.5bn due to portfolio mix changes.
In GBM, a $4.7bn rise in RWAs was mainly due to credit migration impacts of $2.6bn in North America and $2.6bn in Asia, partly offset by portfolio mix changes.
Model updates
The $0.5bn decrease due to model updates was largely due to a fall of $1.0bn in GBM market risk RWAs, as a result of a temporary adjustment to the calculation of risks not in VaR, and a $0.8bn decrease in GBM credit risk RWAs, mostly due to global corporate model updates. These were partly offset by increases of $1.3bn in WPB and CMB, mainly due to updates to Hong Kong and North American credit models.
Methodology and policy
The $6.4bn fall in RWAs included reductions due to management initiatives and increases caused by changes in approach to wholesale credit risk exposures.
With effect from 1 January 2020, we implemented two changes in approach that led to a $6.4bn increase in our wholesale credit risk exposures. Application of the new securitisation framework to the pre-existing book caused RWAs to rise by $3.4bn, mainly in Corporate Centre and GBM. Following the conclusion of discussions with the PRA, we also transferred several UK corporate portfolios onto a Foundation IRB approach, causing a $3bn rise in RWAs in CMB and GBM.
Within GBM and CMB, management initiatives reduced credit risk RWAs by $11.1bn. These included risk parameter refinements, improved collateral linkage and a change in the treatment of undrawn private equity fund commitments.
The $1.8bn fall in market risk RWAs mostly related to changes in the calculation of foreign exchange risk.
| 84 | HSBC Holdings plc Interim Report 2020 |
| Credit risk summary by approach | ||||||||||||
| At 30 Jun 2020 | At 31 Dec 2019 | |||||||||||
| Exposure value | RWAs | RWA density | Exposure value | RWAs | RWA density | |||||||
| $bn | $bn | % | $bn | $bn | % | |||||||
| IRB advanced approach | 1,467.5 | 398.3 | 27 | 1,537.6 | 452.6 | 29 | ||||||
| – central governments and central banks | 404.4 | 41.3 | 10 | 343.5 | 36.3 | 11 | ||||||
| – institutions | 75.4 | 12.3 | 16 | 66.2 | 10.8 | 16 | ||||||
| – corporates | 524.2 | 268.1 | 51 | 654.3 | 327.7 | 50 | ||||||
| – total retail | 463.5 | 76.6 | 17 | 473.6 | 77.8 | 16 | ||||||
| – of which: | — | — | — | |||||||||
| secured by mortgages on immovable property SME | 1.4 | 0.5 | 34 | 3.4 | 1.5 | 45 | ||||||
| secured by mortgages on immovable property non-SME | 331.4 | 43.4 | 13 | 315.7 | 40.4 | 13 | ||||||
| qualifying revolving retail | 77.3 | 17.5 | 23 | 80.2 | 18.8 | 23 | ||||||
| other SME | 5.4 | 3.9 | 73 | 6.2 | 4.7 | 76 | ||||||
| other non-SME | 48.0 | 11.3 | 24 | 68.1 | 12.4 | 18 | ||||||
| IRB securitisation positions | 6.1 | 1.8 | 29 | 20.2 | 3.7 | 19 | ||||||
| IRB non-credit obligation assets | 62.7 | 13.6 | 22 | 62.4 | 13.3 | 21 | ||||||
| IRB foundation approach | 184.1 | 103.9 | 56 | 54.9 | 32.3 | 59 | ||||||
| – central governments and central banks | 0.3 | 0.1 | 24 | 0.1 | — | 20 | ||||||
| – institutions | 0.7 | 0.2 | 24 | 0.6 | 0.2 | 26 | ||||||
| – corporates | 183.1 | 103.6 | 57 | 54.2 | 32.1 | 59 | ||||||
| Standardised approach | 489.1 | 169.1 | 35 | 397.9 | 174.7 | 45 | ||||||
| – central governments and central banks | 274.1 | 10.0 | 4 | 185.5 | 11.2 | 6 | ||||||
| – regional governments or local authorities | 9.4 | 1.6 | 17 | 8.9 | 1.6 | 18 | ||||||
| – public sector entities | 15.7 | — | — | 16.4 | — | — | ||||||
| – multilateral development banks | — | — | — | 0.1 | — | — | ||||||
| – international organisations | 1.4 | — | — | 1.6 | — | — | ||||||
| – institutions | 0.9 | 0.6 | 64 | 1.6 | 0.9 | 58 | ||||||
| – corporates | 70.0 | 65.9 | 94 | 76.8 | 72.5 | 94 | ||||||
| – retail | 18.7 | 13.6 | 73 | 19.5 | 14.4 | 74 | ||||||
| – secured by mortgages on immovable property | 31.1 | 11.6 | 37 | 32.5 | 12.0 | 37 | ||||||
| – exposures in default | 3.0 | 3.5 | 114 | 3.6 | 4.1 | 114 | ||||||
| – items associated with particularly high risk | 4.4 | 6.5 | 150 | 5.3 | 7.9 | 150 | ||||||
| – securitisation positions | 28.1 | 8.6 | 31 | 16.3 | 4.6 | 28 | ||||||
| – collective investment undertakings | 0.4 | 0.4 | 100 | 0.4 | 0.4 | 100 | ||||||
| – equity | 17.0 | 37.3 | 220 | 16.5 | 36.3 | 220 | ||||||
| – other items | 14.9 | 9.5 | 64 | 12.9 | 8.8 | 68 | ||||||
| Total | 2,209.5 | 686.7 | 31 | 2,073.0 | 676.6 | 33 | ||||||
Leverage ratio
| 30 Jun | 31 Dec | ||||
| 2020 | 2019 | ||||
| Ref* | $bn | $bn | |||
| 20 | Tier 1 capital | 149.4 | 144.8 | ||
| 21 | Total leverage ratio exposure | 2,801.4 | 2,726.5 | ||
| % | % | ||||
| 22 | Leverage ratio | 5.3 | 5.3 | ||
| EU-23 | Choice of transitional arrangements for the definition of the capital measure | Fully phased-in | Fully phased-in | ||
UK leverage ratio exposure – quarterly average1 | 2,565.8 | 2,535.4 | |||
| % | % | ||||
| UK leverage ratio – quarterly average | 5.7 | 5.8 | |||
| UK leverage ratio – quarter end | 5.9 | 5.7 | |||
| * | The references identify the lines prescribed in the EBA template. |
| 1 | UK leverage ratio denotes the Group’s leverage ratio calculated under the PRA’s UK leverage framework and excludes qualifying central bank balances from the calculation of exposure. |
Our leverage ratio calculated in accordance with the Capital Requirements Regulation was 5.3% at 30 June 2020, unchanged from 5.3% at 31 December 2019. The impact of the $4.6bn increase in tier 1 capital was offset by a $74.9bn rise in leverage exposure comprising:
| • | balance sheet growth of $122.8bn, mainly in cash and balances at central banks and financial investments. |
This was partly offset by:
| • | the $33.0bn impact of the CRR ‘Quick Fix’ relief permitting the netting in leverage exposure of regular-way purchases and sales awaiting settlement under certain conditions; and |
| • | the $14.9bn decrease in off-balance sheet exposure. |
The Group’s UK leverage ratio at 30 June 2020 was 5.9%. This measure excludes qualifying central bank balances and loans under the UK Bounce Back Loan scheme from the calculation of exposure.
At 30 June 2020, our UK minimum leverage ratio requirement of 3.25% was supplemented by an additional leverage ratio buffer of 0.7% and a countercyclical leverage ratio buffer of 0.1%. These additional buffers translated into capital values of $17.9bn and $1.8bn, respectively. We exceeded these leverage requirements.
HSBC Holdings plc Interim Report 2020 | 85 |
Risk
Regulatory disclosures
Pillar 3 disclosure requirements
Pillar 3 of the Basel regulatory framework is related to market discipline and aims to make financial services firms more
transparent by requiring publication of wide-ranging information on their risks, capital and management. Our Pillar 3 Disclosures at 30 June 2020 is expected to be published on or around 10 August 2020 at www.hsbc.com/investors.
transparent by requiring publication of wide-ranging information on their risks, capital and management. Our Pillar 3 Disclosures at 30 June 2020 is expected to be published on or around 10 August 2020 at www.hsbc.com/investors.
Liquidity and funding risk management
Overview
Liquidity risk is the risk that we do not have sufficient financial resources to meet our obligations as they fall due. Liquidity risk arises from mismatches in the timing of cash flows. Funding risk is the risk that we cannot raise funding or can only do so at excessive cost.
Key developments in the first half of 2020
The management of liquidity risk was enhanced during the first half of 2020 in response to the Covid-19 outbreak to ensure the Group anticipated, monitored and responded to the impacts both at Group and entity level. Liquidity levels were impacted by the drawdown of committed facilities and buy-backs of short-term debt. However, this was offset by increases in deposits, use of
central bank facilities where appropriate and the ability to issue in the short-term markets as they stabilised. As a result of these liability enhancing actions, the Group and all entities had significant surplus liquidity, resulting in heightened liquidity coverage ratios (‘LCR’) ratios in the first half of 2020.
Liquidity and funding risk in the first half of 2020
Liquidity metrics
At 30 June 2020, all of the Group’s material operating entities were above regulatory minimum levels.
Each entity maintains sufficient unencumbered liquid assets to comply with local and regulatory requirements. The liquidity value of these liquidity assets for each entity is shown in the following table along with the individual LCR levels on a European Commission (‘EC’) basis. This basis may differ from local LCR measures due to differences in the way non-EU regulators have implemented the Basel III standards.
Each entity maintains a sufficient stable funding profile and it is assessed by using the net stable funding ratio (‘NSFR’) or other appropriate metrics.
The Group liquidity and funding position at 30 June 2020 is analysed in the following sections.
| Operating entities’ liquidity | |||||||||
| At 30 June 2020 | |||||||||
| LCR | HQLA | Net outflows | NSFR | ||||||
| Footnotes | % | $bn | $bn | % | |||||
| HSBC UK Bank plc (ring-fenced bank) | 1 | 187 | 95 | 51 | 158 | ||||
| HSBC Bank plc (non-ring-fenced bank) | 2 | 141 | 123 | 87 | 118 | ||||
| The Hongkong and Shanghai Banking Corporation – Hong Kong branch | 3 | 192 | 128 | 67 | 138 | ||||
| The Hongkong and Shanghai Banking Corporation – Singapore branch | 3 | 210 | 12 | 6 | 136 | ||||
| Hang Seng Bank | 181 | 46 | 26 | 151 | |||||
| HSBC Bank China | 169 | 22 | 13 | 149 | |||||
| HSBC Bank USA | 145 | 105 | 72 | 127 | |||||
| HSBC France | 4 | 167 | 56 | 33 | 122 | ||||
| HSBC Middle East – UAE branch | 177 | 12 | 7 | 148 | |||||
| HSBC Canada | 4 | 173 | 29 | 17 | 135 | ||||
| HSBC Mexico | 206 | 9 | 4 | 134 | |||||
| At 31 December 2019 | |||||||||
| HSBC UK Bank plc (ring-fenced bank) | 1 | 165 | 75 | 45 | 150 | ||||
| HSBC Bank plc (non-ring-fenced bank) | 2 | 142 | 103 | 72 | 106 | ||||
| The Hongkong and Shanghai Banking Corporation – Hong Kong branch | 3 | 163 | 109 | 67 | 128 | ||||
| The Hongkong and Shanghai Banking Corporation – Singapore branch | 3 | 147 | 14 | 10 | 120 | ||||
| Hang Seng Bank | 185 | 42 | 23 | 148 | |||||
| HSBC Bank China | 180 | 21 | 11 | 151 | |||||
| HSBC Bank USA | 125 | 73 | 59 | 122 | |||||
| HSBC France | 4 | 152 | 44 | 29 | 117 | ||||
| HSBC Middle East – UAE branch | 202 | 11 | 5 | 159 | |||||
| HSBC Canada | 4 | 124 | 18 | 14 | 124 | ||||
| HSBC Mexico | 208 | 9 | 4 | 136 | |||||
| 1 | HSBC UK Bank plc refers to the HSBC UK liquidity group, which comprises four legal entities: HSBC UK Bank plc (including the Dublin branch), Marks and Spencer Financial Services plc, HSBC Private Bank (UK) Ltd and HSBC Trust Company (UK) Limited, managed as a single operating entity, in line with the application of UK liquidity regulation as agreed with the PRA. |
| 2 | HSBC Bank plc includes overseas branches and SPEs consolidated by HSBC for financial statements purposes. |
| 3 | The Hongkong and Shanghai Banking Corporation – Hong Kong branch and The Hongkong and Shanghai Banking Corporation – Singapore branch represent the material activities of The Hongkong and Shanghai Banking Corporation. Each branch is monitored and controlled for liquidity and funding risk purposes as a stand-alone operating entity. |
| 4 | HSBC France and HSBC Canada represent the consolidated banking operations of the Group in France and Canada, respectively. HSBC France and HSBC Canada are each managed as single distinct operating entities for liquidity purposes. |
At 30 June 2020, all of the Group’s principal operating entities were well above regulatory minimum levels.
The most significant movements in 2020 are explained below:
| • | HSBC UK Bank plc improved its liquidity ratio to 187%, mainly driven by increased commercial and retail current and savings accounts. |
| • | HSBC Bank plc’s liquidity ratio remained largely unchanged. |
| • | The Hongkong and Shanghai Banking Corporation – Hong Kong branch liquidity position remained strong, mainly reflecting strong retail and corporate deposits. |
| 86 | HSBC Holdings plc Interim Report 2020 |
| • | Hang Seng Bank’s liquidity position remained largely unchanged, mainly supported by its strong customer deposit base. |
| • | The Hongkong and Shanghai Banking Corporation – Singapore branch improved its liquidity ratio to 210%, mainly due to a higher commercial surplus following increased deposits across all lines of businesses. |
| • | HSBC Bank China’s liquidity ratio dropped by 11%, mainly due to growth in loans to corporate customers, partly offset by long-term debt issuances. |
| • | HSBC Bank USA improved its liquidity ratio to 145%, mainly driven by increased customer deposits. |
| • | HSBC France increased its liquidity position, reflecting successful subscription to the ECB targeted longer-term refinancing operations programme. |
| • | HSBC Bank Middle East – UAE Branch retained a strong liquidity position, with a liquidity ratio of 177%. |
| • | HSBC Canada improved its liquidity ratio to 173%, mainly driven by increased customer deposits, covered bond issuance and secured funding. |
Consolidated liquidity metrics
Liquidity coverage ratio
At 30 June 2020, HQLA at entity level amounted to $784bn
(31 December 2019: $646bn), an increase of $138bn, reflecting the increases in entity liquidity positions described above. Consistent with prior periods, the application of requirements under the EC Delegated Act results in an adjustment of $130bn (31 December 2019: $45bn) to reflect the limitations in the fungibility of entity liquidity around the Group. As a consequence, the Group consolidated LCR was 148% at 30 June 2020 (31 December 2019: 150%). The $130bn of HQLA remains available to cover liquidity risk in the relevant entities.
(31 December 2019: $646bn), an increase of $138bn, reflecting the increases in entity liquidity positions described above. Consistent with prior periods, the application of requirements under the EC Delegated Act results in an adjustment of $130bn (31 December 2019: $45bn) to reflect the limitations in the fungibility of entity liquidity around the Group. As a consequence, the Group consolidated LCR was 148% at 30 June 2020 (31 December 2019: 150%). The $130bn of HQLA remains available to cover liquidity risk in the relevant entities.
The methodology used in the Group consolidated LCR in relation to the treatment of part of our HQLA is currently under review with our regulators.
| At | ||||||
| 30 Jun | 30 Jun | 31 Dec | ||||
| 2020 | 2019 | 2019 | ||||
| $bn | $bn | $bn | ||||
| High-quality liquid assets (in entities) | 784 | 606 | 646 | |||
| EC Delegated Act adjustment | (130) | (73) | (45) | |||
| Group LCR HQLA | 654 | 533 | 601 | |||
| Net outflows | 443 | 391 | 400 | |||
| Liquidity coverage ratio | 148 | % | 136 | % | 150 | % |
Liquid assets
After the $130bn adjustment, the Group LCR HQLA of $654bn
(31 December 2019: $601bn) was held in a range of asset classes and currencies. Of these, 88% were eligible as level 1 (31 December 2019: 90%).
(31 December 2019: $601bn) was held in a range of asset classes and currencies. Of these, 88% were eligible as level 1 (31 December 2019: 90%).
The following tables reflect the composition of the liquidity pool by asset type and currency at 30 June 2020:
| Liquidity pool by asset type | ||||||||
| Liquidity pool | Cash | Level 11 | Level 21 | |||||
| $bn | $bn | $bn | $bn | |||||
| Cash and balance at central bank | 251 | 251 | — | — | ||||
| Central and local government bonds | 339 | — | 282 | 57 | ||||
| Regional government PSE | 14 | — | 13 | 1 | ||||
| International organisation and MDBs | 16 | — | 16 | — | ||||
| Covered bonds | 12 | — | 3 | 9 | ||||
| Other | 22 | — | 13 | 9 | ||||
| Total at 30 June 2020 | 654 | 251 | 327 | 76 | ||||
| Total at 31 Dec 2019 | 601 | 158 | 383 | 60 | ||||
| 1 | As defined in EU regulation, level 1 assets means ‘assets of extremely high liquidity and credit quality’, and level 2 assets means ‘assets of high liquidity and credit quality’. |
| Liquidity pool by currency | ||||||||||||
| $ | £ | € | HK$ | Other | Total | |||||||
| $bn | $bn | $bn | $bn | $bn | $bn | |||||||
| Liquidity pool at 30 June 2020 | 215 | 151 | 118 | 56 | 114 | 654 | ||||||
| Liquidity pool at 31 Dec 2019 | 179 | 117 | 93 | 47 | 165 | 601 | ||||||
Sources of funding
Our primary sources of funding are customer current accounts and savings deposits payable on demand or at short notice. We issue secured and unsecured wholesale securities to supplement customer deposits, meet regulatory obligations and to change the currency mix, maturity profile or location of our liabilities.
The following ‘Funding sources’ and ‘Funding uses’ tables provide a view of how our consolidated balance sheet is funded. In practice, all the principal operating entities are required to manage liquidity and funding risk on a stand-alone basis.
The tables analyse our consolidated balance sheet according to the assets that primarily arise from operating activities and the sources of funding primarily supporting these activities. Assets and liabilities that do not arise from operating activities are presented as a net balancing source or deployment of funds.
In 1H20, the level of customer accounts continued to exceed the level of loans and advances to customers. The positive funding gap was predominantly deployed in liquid assets.
HSBC Holdings plc Interim Report 2020 | 87 |
Risk
| Funding sources | ||||
| At | ||||
| 30 Jun | 31 Dec | |||
| 2020 | 2019 | |||
| $m | $m | |||
| Customer accounts | 1,532,380 | 1,439,115 | ||
| Deposits by banks | 82,715 | 59,022 | ||
| Repurchase agreements – non-trading | 112,799 | 140,344 | ||
| Debt securities in issue | 110,114 | 104,555 | ||
| Cash collateral, margin and settlement accounts | 127,342 | 71,002 | ||
| Subordinated liabilities | 23,621 | 24,600 | ||
| Financial liabilities designated at fair value | 156,608 | 164,466 | ||
| Liabilities under insurance contracts | 98,832 | 97,439 | ||
| Trading liabilities | 79,612 | 83,170 | ||
| – repos | 8,325 | 558 | ||
| – stock lending | 2,795 | 9,702 | ||
| – other trading liabilities | 68,492 | 72,910 | ||
| Total equity | 195,221 | 192,668 | ||
| Other balance sheet liabilities | 403,554 | 338,771 | ||
| 2,922,798 | 2,715,152 | |||
| Funding uses | |||||
| At | |||||
| 30 Jun | 31 Dec | ||||
| 2020 | 2019 | ||||
| Footnotes | $m | $m | |||
| Loans and advances to customers | 1,018,681 | 1,036,743 | |||
| Loans and advances to banks | 77,015 | 69,203 | |||
| Reverse repurchase agreements – non-trading | 226,345 | 240,862 | |||
| Prepayments, accrued income and other assets | 1 | 113,867 | 63,891 | ||
| – cash collateral, margin and settlement accounts | 113,867 | 63,891 | |||
| Assets held for sale | 139 | 123 | |||
| Trading assets | 208,964 | 254,271 | |||
| – reverse repos | 16,116 | 13,659 | |||
| – stock borrowing | 8,161 | 7,691 | |||
| – other trading assets | 184,687 | 232,921 | |||
| Financial investments | 494,109 | 443,312 | |||
| Cash and balances with central banks | 249,673 | 154,099 | |||
| Other balance sheet assets | 534,005 | 452,648 | |||
| 2,922,798 | 2,715,152 | ||||
| 1 | Includes only those financial instruments that are subject to the impairment requirements of IFRS 9. ‘Prepayments, accrued income and other assets’ as presented within the consolidated balance sheet on page 96 includes both financial and non-financial assets. |
| Market risk |
Overview
Market risk is the risk that movements in market factors, such as foreign exchange rates, interest rates, credit spreads, equity prices and commodity prices, will reduce our income or the value of our portfolios.
A summary of our current policies and practices for the management of market risk is set out in ‘Market risk management’ on page 135 of the Annual Report and Accounts 2019.
Market risk in the first half of 2020
There were no material changes to the policies and practices for the management of market risk in the first half of 2020.
Global financial conditions worsened rapidly with the onset of the Covid-19 outbreak from mid-February. Market volatility reached extreme levels across most asset classes and equity prices fell sharply from the previous historical peak levels. In credit markets, spreads and yields reached multi-year highs. The gold market experienced Covid-19-related disruption in refining and transportation, affecting the relative pricing of gold futures contracts. Oil prices collapsed due to rising oversupply as demand reduced materially from the economic slowdown. Financial markets tended to stabilise from April onwards, as governments in mainly developed countries announced economic recovery programmes and key central banks intervened to provide liquidity and support asset prices.
We managed market risk prudently in the first half of 2020. Sensitivity exposures remained within appetite as the business pursued its core market-making activity in support of our customers during the outbreak. We also undertook hedging activities to protect the business from potential future deterioration in credit conditions. Market risk continued to be managed using a complementary set of exposure measures and limits, including stress and scenario analysis.
The overall risk profile remained relatively stable in the first half of 2020 as the Fixed Income business continued to be the main driver of trading VaR. Interest rate risks from market-making activities were the key contributors to trading VaR, with partially offsetting gains from credit spread risks. The Equity and Foreign Exchange businesses provided a further offset to overall market risks in the trading book.
Trading portfolios
Value at risk of the trading portfolios
Trading VaR was predominantly generated by Global Markets. The VaR for trading activity at 30 June 2020 was higher than at 31 December 2019. The moderate increase in trading VaR was due mainly to higher levels of market volatility reached in March and April 2020 as a result of the economic impact of the Covid-19 outbreak. The increase was spread across all asset classes, while interest rate risk was the main contributor to this uplift in VaR. An additional driver was the increase of risks captured in the risks not in VaR (‘RNIV’) framework, including mainly equity correlation and dividend risks. The risk was actively managed during 1H20 and it was in line with the normal range observed in 2019, except for a spike observed in 2Q20, which was driven by higher levels of market volatility in the first half of the year. The Group trading VaR for the half-year is shown in the table below.
| 88 | HSBC Holdings plc Interim Report 2020 |
| Trading VaR, 99% 1 day | ||||||||||||
Foreign exchange and commodity | Interest rate | Equity | Credit spread | Portfolio diversification1 | Total | |||||||
| $m | $m | $m | $m | $m | $m | |||||||
| Half-year to 30 Jun 2020 | 10.4 | 36.8 | 26.3 | 18.7 | (47.8 | ) | 44.4 | |||||
| Average | 10.6 | 27.6 | 25.0 | 23.1 | (36.2 | ) | 50.1 | |||||
| Maximum | 19.9 | 43.5 | 41.3 | 44.1 | 69.3 | |||||||
| Minimum | 5.6 | 19.1 | 13.6 | 13.7 | 33.6 | |||||||
| Half-year to 30 Jun 2019 | 6.6 | 29.9 | 17.4 | 31.2 | (34.8 | ) | 50.3 | |||||
| Average | 7.1 | 30.9 | 16.6 | 24.8 | (29.3 | ) | 50.1 | |||||
| Maximum | 13.5 | 36.5 | 22.2 | 33.2 | 59.3 | |||||||
| Minimum | 4.1 | 26.1 | 12.4 | 18.4 | 42.8 | |||||||
| Half-year to 31 Dec 2019 | 7.7 | 28.2 | 15.7 | 15.2 | (26.4 | ) | 40.3 | |||||
| Average | 6.9 | 29.9 | 16.2 | 23.7 | (29.0 | ) | 47.8 | |||||
| Maximum | 13.5 | 36.5 | 24.9 | 33.2 | 59.3 | |||||||
| Minimum | 4.1 | 22.9 | 12.4 | 11.7 | 33.3 | |||||||
| 1 | When VaR is calculated at a portfolio level, natural offsets in risk can occur when compared with aggregating VaR at the asset class level. This difference is called portfolio diversification. The asset class VaR maxima and minima reported in the table occurred on different dates within the reporting period. For this reason, we do not report an implied portfolio diversification measure between the maximum (minimum) asset class VaR measures and the maximum (minimum) total VaR measures in this table. |
The RNIV framework covers risks from exposures in our trading book that are not fully captured by the VaR model. The VaR-based RNIVs are included within the metrics for each asset class.
Back-testing
In 1H20, the Group experienced three loss back-testing exceptions against actual profit and losses. The Group also experienced eight loss back-testing exceptions against hypothetical profit and losses. The high number of hypothetical back-testing exceptions that occurred in March 2020 was primarily due to the extreme market volatility resulting from the economic impact of the Covid-19 outbreak, which was significantly greater than the volatility used in the model calibration.
In recognition of the exceptional market environment, the PRA has granted temporary relief, valid for six months, that permits UK firms, including HSBC, to offset the impact of the higher VaR multiplier resulting from exceptions that occurred after the onset of the Covid-19 outbreak. This offset is against incremental RNIV market risk capital requirements.
The hypothetical profit and loss reflects the profit and loss that would be realised if positions were held constant from the end of one trading day to the end of the next. This measure of profit and loss does not align with how risk is dynamically hedged, and is not therefore necessarily indicative of the actual performance of the business. Accordingly, of the eight loss back-testing exceptions against hypothetical profit and losses, only the largest exception in March and one exception in April corresponded to a loss exception against actual profit and loss. The two loss exceptions against actual profit and loss that occurred in the second half of March and the loss exception against actual profit and loss that occurred in April comprised:
| • | a loss exception in March, which was partly due to unprecedented widening of the gold exchange-for-physical basis, reflecting Covid-19-related challenges in gold refining and transportation, which affected HSBC’s gold leasing and financing business and other gold hedging activity leading to mark-to-market losses. Additional loss drivers on this trading day included a significant reduction in foreign exchange and equity volatilities, and a material tightening of credit spreads; |
| • | a loss exception at the end of March, mainly driven by increases to month-end valuation adjustments, which were recalibrated to reflect changes in liquidity and bid-offer market conditions over the course of the month relative to February month-end; and |
| • | a loss exception in April, which was partly due to the renewed widening of the gold exchange-for-physical basis. Additional loss drivers included lower equity implied volatilities and a reduction in dividend projections. |
Despite the high number of loss exceptions, performance of the VaR model was in line with expectations when considered in the context of the extraordinary market movements observed in March and April 2020. During this period, market risk continued to be managed using a complementary set of exposure measures and limits, including stress and scenario analysis. This ensured that the business was prudently managed and performed well across the period.
Non-trading portfolios
Value at risk of the non-trading portfolios
Non-trading VaR of the Group includes contributions from all global businesses. There is no commodity risk in the non-trading portfolios. The VaR for non-trading activity at 30 June 2020 was higher than at 31 December 2019. The increase arose primarily from the effect of higher levels of market volatility reached in March and April 2020 due to the economic impact of the Covid-19 outbreak. Although interest rate gap risk fell during the period and credit sensitivity was relatively stable, extreme volatility in the yields of sovereign debt and interest rate swaps, coupled with volatility in the spreads of agency and mortgage-backed securities, led to an uplift in contributions to total non-trading VaR from both interest rate and credit spread risks.
Non-trading VaR includes non-trading financial instruments held in portfolios managed by Balance Sheet Management (‘BSM’). The management of interest rate risk in the banking book is described further in ‘Net interest income sensitivity’ on page 140 of the Annual Report and Accounts 2019.
The Group non-trading VaR for the half-year is shown in the following table.
HSBC Holdings plc Interim Report 2020 | 89 |
Risk
| Non-trading VaR, 99% 1 day | ||||||||
Interest rate | Credit spread | Portfolio diversification1 | Total | |||||
| $m | $m | $m | $m | |||||
| Half-year to 30 Jun 2020 | 184.3 | 83.2 | (61.6 | ) | 205.9 | |||
| Average | 122.8 | 80.9 | (60.7 | ) | 143.0 | |||
| Maximum | 190.1 | 133.4 | 219.7 | |||||
| Minimum | 59.0 | 44.2 | 79.7 | |||||
| Half-year to 30 Jun 2019 | 68.5 | 36.6 | (22.0 | ) | 83.1 | |||
| Average | 57.1 | 30.5 | (16.6 | ) | 71.0 | |||
| Maximum | 74.3 | 36.6 | 85.2 | |||||
| Minimum | 49.2 | 26.6 | 60.9 | |||||
| Half-year to 31 Dec 2019 | 96.2 | 62.5 | (28.2 | ) | 130.5 | |||
| Average | 65.9 | 44.2 | (25.6 | ) | 84.5 | |||
| Maximum | 100.1 | 81.2 | 132.8 | |||||
| Minimum | 49.2 | 26.6 | 60.9 | |||||
| 1 | When VaR is calculated at a portfolio level, natural offsets in risk can occur when compared with aggregating VaR at the asset class level. This difference is called portfolio diversification. The asset class VaR maxima and minima reported in the table occurred on different dates within the reporting period. For this reason, we do not report an implied portfolio diversification measure between the maximum (minimum) asset class VaR measures and the maximum (minimum) total VaR measures in this table. |
Non-trading VaR excludes equity risk on securities held at fair value, structural foreign exchange risk and interest rate risk on fixed-rate securities issued by HSBC Holdings. The following sections describe the scope of HSBC’s management of market risks in non-trading books.
Third-party assets in Balance Sheet Management
Third-party assets in BSM increased by 30% during the first half of 2020.
Commercial surplus increased in this period due to an increase in client deposits and lower credit growth. This was partly reflected in the increase of $94bn in ‘Cash and balances at central banks’.
The increase of $23bn across ‘Loans and advances to banks’ and ‘Reverse repurchase agreements’ was driven by the short-term investment of part of this surplus with the remainder invested in high-quality liquid assets contributing to the increase of $45bn in ‘Financial investments’.
| Third-party assets in Balance Sheet Management | ||||
| At | ||||
| 30 Jun | 31 Dec | |||
| 2020 | 2019 | |||
| $m | $m | |||
| Cash and balances at central banks | 222,991 | 129,114 | ||
| Trading assets | 200 | 268 | ||
| Loans and advances: | ||||
| – to banks | 29,143 | 24,466 | ||
| – to customers | 579 | 310 | ||
| Reverse repurchase agreements | 48,309 | 29,868 | ||
| Financial investments | 396,918 | 351,842 | ||
| Other | 9,273 | 7,655 | ||
| 707,413 | 543,523 | |||
Interest rate risk in the banking book
Interest rate risk in the banking book is the risk of capital or earnings volatility due to changes in market interest rates.
Our policies regarding the funds transfer pricing process and the management of interest rate risk in the banking book are described on pages 136 and 137, respectively, of the Annual Report and Accounts 2019.
The Group utilises sensitivity of net interest income to assess the overall level of interest rate risk in the banking book. This measure reflects all interest rate risk in the banking book, including that transferred to BSM.
Sensitivity of net interest income
The following tables set out the assessed impact to a hypothetical base case projection of our net interest income (‘NII’), excluding insurance, under the following scenarios:
| • | an immediate shock of 25 basis points (‘bps’) to the current market-implied path of interest rates across all currencies on 1 July 2020 (effects over one year and five years); and |
| • | an immediate shock of 100bps to the current market-implied path of interest rates across all currencies on 1 July 2020 (effects over one year and five years). |
The sensitivities shown represent our assessment of the change to a hypothetical base case NII, assuming a static balance sheet and no management actions from BSM. They incorporate the effect of interest rate behaviouralisation, managed rate product pricing assumptions and customer behaviour, including the prepayment of mortgages or customer migration from non-interest-bearing to interest-bearing deposit accounts. The scenarios represent interest rate shocks to the current market implied path of rates.
The NII sensitivity results in the down-shock scenarios reflect no floors to the shocked market rates. This is a change from the NII sensitivity approach published in the Annual Report and Accounts 2019, where market rates were floored to zero, unless the central bank rate was already negative, as in the case of the euro, Swiss franc and Japanese yen. This reflects the increased risk of negative market interest rates going forward. Customer product specific interest rate floors remain to be recognised where applicable.
As such, the one-year and five-year NII sensitivities in the down-shock scenarios have increased in June 2020 at Group level when compared with December 2019. This was driven by the change in approach, changes in the forecasted yield curves and changes in balance sheet composition. The NII sensitivities are forecasted for the whole period of one and five years each quarter.
| 90 | HSBC Holdings plc Interim Report 2020 |
The NII sensitivities shown are indicative and based on simplified scenarios. Immediate interest rate rises of 25bps and 100bps would increase projected NII for the 12 months to 30 June 2021 by $1,409m and $4,736m, respectively. Conversely, falls of 25bps and 100bps would decrease projected NII for the 12 months to
30 June 2021 by $1,552m and $4,515m, respectively.
30 June 2021 by $1,552m and $4,515m, respectively.
The sensitivity of NII for 12 months has increased by $1,938m in the plus 100bps parallel shock comparing June 2020 with December 2019.
The increase in the sensitivity of NII for 12 months in the plus 100bps parallel shock was mainly driven by the general build-up of liquidity throughout the Group, which has been deployed in short-term investments (predominantly cash, held to collect and sell, and reverse repos), shortening of BSM positioning and reduction
in the average cost of funds in view of the significant drop in interest rates, as well as changes in portfolio composition.
The change in NII sensitivity for five years is also driven by the factors above.
The structural sensitivity of NII arising within the three global businesses, excluding Global Markets, is positive in a rising rate environment and negative in a falling rate environment. Both BSM and Global Markets have NII sensitivity profiles that offset this to some degree. The tables do not include potential BSM management actions or changes in Global Markets’s net trading income that may further limit the offset.
| NII sensitivity to an instantaneous change in yield curves (12 months) | ||||||||||||
| US dollar | HK dollar | Sterling | Euro | Other | Total | |||||||
| $m | $m | $m | $m | $m | $m | |||||||
Change in Jul 2020 to Jun 2021 (based on balance sheet at 30 Jun 2020) | ||||||||||||
| +25bps | 229 | 375 | 394 | 138 | 273 | 1,409 | ||||||
| -25bps | (233 | ) | (464 | ) | (506 | ) | (94 | ) | (255 | ) | (1,552 | ) |
| +100bps | 560 | 1,140 | 1,475 | 565 | 996 | 4,736 | ||||||
| -100bps | (276 | ) | (955 | ) | (1,908 | ) | (337 | ) | (1,039 | ) | (4,515 | ) |
| Change in Jan 2020 to Dec 2020 (based on balance sheet at 31 Dec 2019) | ||||||||||||
| +25bps | 59 | 198 | 278 | 116 | 202 | 853 | ||||||
| -25bps | (91 | ) | (255 | ) | (332 | ) | 11 | (182 | ) | (849 | ) | |
| +100bps | (16 | ) | 504 | 1,123 | 441 | 746 | 2,798 | |||||
| -100bps | (490 | ) | (1,023 | ) | (1,049 | ) | (23 | ) | (726 | ) | (3,311 | ) |
| NII sensitivity to an instantaneous change in yield curves (5 years) | ||||||||||||
| Year 1 | Year 2 | Year 3 | Year 4 | Year 5 | Total | |||||||
| $m | $m | $m | $m | $m | $m | |||||||
Change in Jul 2020 to Jun 2025 (based on balance sheet at 30 Jun 2020) | ||||||||||||
| +25bps | 1,409 | 1,772 | 1,967 | 1,857 | 1,921 | 8,926 | ||||||
| -25bps | (1,552 | ) | (1,865 | ) | (2,104 | ) | (2,279 | ) | (2,219 | ) | (10,019 | ) |
| +100bps | 4,736 | 5,965 | 6,655 | 6,819 | 7,014 | 31,189 | ||||||
| -100bps | (4,515 | ) | (5,627 | ) | (6,487 | ) | (7,290 | ) | (7,984 | ) | (31,903 | ) |
| Change in Jan 2020 to Dec 2024 (based on balance sheet at 31 Dec 2019) | ||||||||||||
| +25bps | 853 | 1,158 | 1,348 | 1,449 | 1,523 | 6,331 | ||||||
| -25bps | (849 | ) | (1,205 | ) | (1,402 | ) | (1,562 | ) | (1,649 | ) | (6,667 | ) |
| +100bps | 2,798 | 4,255 | 4,915 | 5,155 | 5,454 | 22,577 | ||||||
| -100bps | (3,311 | ) | (4,621 | ) | (5,289 | ) | (5,766 | ) | (6,164 | ) | (25,151 | ) |
| Insurance manufacturing operations risk |
The majority of the risk in our insurance business derives from manufacturing activities and can be categorised as financial risk and insurance risk. Financial risks include market risk, credit risk and liquidity risk. Insurance risk is the risk, other than financial risk, of loss transferred from the holder of the insurance contract to HSBC, the issuer. The cost of claims and benefits can be influenced by many factors, including mortality and morbidity experience, as well as lapse and surrender rates.
A summary of our policies and practices regarding the risk management of insurance operations, our insurance model and the main contracts we manufacture is provided on page 146 of the Annual Report and Accounts 2019.
There have been no material changes to the policies and practices for the management of risks arising in our insurance operations described in the Annual Report and Accounts 2019.
Insurance manufacturing operations risk in the first half of 2020
The risk profile of our insurance manufacturing businesses is measured using an economic capital approach. Assets and liabilities are measured on a market value basis, and a capital requirement is defined to ensure that there is a less than one in
200 chance of insolvency over a one-year time horizon, given the risks to which the businesses are exposed. The methodology for the economic capital calculation is largely aligned to the pan-European Solvency II insurance capital regulations. A key risk appetite metric is the economic coverage ratio, which is calculated by dividing the economic net asset value by the economic capital requirement. The business has a current appetite to remain globally above 140% with a tolerance to 110%. In addition to economic capital, the regulatory solvency ratio is also a metric used to manage risk appetite on an entity basis.
The impact from the Covid-19 outbreak on financial markets has affected the profitability of manufactured insurance products and caused overall capital levels to fall in several of the insurance entities. At 30 June 2020, regulatory capital levels were above risk appetite and the global economic capital level was above risk tolerance. A variety of management actions were taken during the period to actively manage the risk profile of the insurance entities. Enhanced monitoring of risks and pricing conditions will continue, as the low level of interest rates results in a higher cost of guarantees to be paid to policyholders, increasing the reinvestment risk for interest rate sensitive products. This will have an impact on their profitability and increase the solvency requirements for the entities that are most exposed to these products. The following table shows the composition of assets and liabilities by contract type.
HSBC Holdings plc Interim Report 2020 | 91 |
Risk
| Balance sheet of insurance manufacturing subsidiaries by type of contract | |||||||||||
With DPF | Unit- linked | Other contracts1 | Shareholder assets and liabilities | Total | |||||||
| Footnotes | $m | $m | $m | $m | $m | ||||||
| Financial assets | 76,665 | 7,680 | 18,055 | 8,142 | 110,542 | ||||||
| – trading assets | — | — | — | — | — | ||||||
| – financial assets designated and otherwise mandatorily measured at fair value through profit or loss | 19,872 | 7,429 | 3,288 | 1,306 | 31,895 | ||||||
| – derivatives | 400 | 5 | 15 | 5 | 425 | ||||||
| – financial investments – at amortised cost | 39,684 | 27 | 13,428 | 4,035 | 57,174 | ||||||
| – financial investments – at fair value through other comprehensive income | 11,818 | — | 425 | 1,640 | 13,883 | ||||||
| – other financial assets | 2 | 4,891 | 219 | 899 | 1,156 | 7,165 | |||||
| Reinsurance assets | 2,257 | 67 | 1,617 | 2 | 3,943 | ||||||
| PVIF | 3 | — | — | — | 9,379 | 9,379 | |||||
| Other assets and investment properties | 2,448 | 3 | 221 | 711 | 3,383 | ||||||
| Total assets at June 2020 | 81,370 | 7,750 | 19,893 | 18,234 | 127,247 | ||||||
| Liabilities under investment contracts designated at fair value | — | 1,954 | 4,024 | — | 5,978 | ||||||
| Liabilities under insurance contracts | 78,296 | 5,719 | 14,865 | — | 98,880 | ||||||
| Deferred tax | 4 | 152 | 17 | 56 | 1,406 | 1,631 | |||||
| Other liabilities | — | — | — | 6,665 | 6,665 | ||||||
| Total liabilities | 78,448 | 7,690 | 18,945 | 8,071 | 113,154 | ||||||
| Total equity | — | — | — | 14,093 | 14,093 | ||||||
| Total equity and liabilities at June 2020 | 78,448 | 7,690 | 18,945 | 22,164 | 127,247 | ||||||
| Financial assets | 73,929 | 7,333 | 17,514 | 8,269 | 107,045 | ||||||
| – trading assets | — | — | — | — | — | ||||||
| – financial assets designated at fair value | 21,652 | 7,119 | 3,081 | 2,426 | 34,278 | ||||||
| – derivatives | 202 | (6 | ) | 9 | 3 | 208 | |||||
| – financial investments at amortised cost | 35,299 | 18 | 13,436 | 4,076 | 52,829 | ||||||
| – financial investments at fair value through other comprehensive income | 12,447 | — | 445 | 1,136 | 14,028 | ||||||
| – other financial assets | 2 | 4,329 | 202 | 543 | 628 | 5,702 | |||||
| Reinsurance assets | 2,208 | 72 | 1,563 | 1 | 3,844 | ||||||
| PVIF | 3 | — | — | — | 8,945 | 8,945 | |||||
| Other assets and investment properties | 2,495 | 2 | 211 | 602 | 3,310 | ||||||
| Total assets at December 2019 | 78,632 | 7,407 | 19,288 | 17,817 | 123,144 | ||||||
| Liabilities under investment contracts designated at fair value | — | 2,011 | 3,881 | — | 5,892 | ||||||
| Liabilities under insurance contracts | 77,147 | 6,151 | 14,141 | — | 97,439 | ||||||
| Deferred tax | 4 | 197 | 23 | 6 | 1,297 | 1,523 | |||||
| Other liabilities | — | — | — | 4,410 | 4,410 | ||||||
| Total liabilities | 77,344 | 8,185 | 18,028 | 5,707 | 109,264 | ||||||
| Total equity | — | — | — | 13,879 | 13,879 | ||||||
| Total equity and liabilities at December 2019 | 77,344 | 8,185 | 18,028 | 19,586 | 123,143 | ||||||
| 1 | Other contracts includes term assurance, credit life insurance, universal life insurance and certain investment contracts not included in the ‘Unit-linked’ or ‘With DPF’ columns. |
| 2 | Comprise mainly loans and advances to banks, cash and inter-company balances with other non-insurance legal entities. |
| 3 | Present value of in-force long-term insurance business. |
| 4 | Deferred tax includes the deferred tax liabilities arising on recognition of PVIF. |
Market risk
Description and exposure
Market risk is the risk of changes in market factors affecting HSBC’s capital or profit. Market factors include interest rates, equity and growth assets and foreign exchange rates.
Our exposure varies depending on the type of contract issued. Our most significant life insurance products are contracts with discretionary participating features (‘DPF’) issued in France and Hong Kong. These products typically include some form of capital guarantee or guaranteed return on the sums invested by the policyholders, to which discretionary bonuses are added if allowed by the overall performance of the funds. These funds are primarily invested in bonds, with a proportion allocated to other asset classes to provide customers with the potential for enhanced returns.
DPF products expose HSBC to the risk of variation in asset returns, which will impact our participation in the investment performance.
In addition, in some scenarios the asset returns can become insufficient to cover the policyholders’ financial guarantees, in which case the shortfall has to be met by HSBC. Amounts are held against the cost of such guarantees, calculated by stochastic modelling.
Where local rules require, these reserves are held as part of liabilities under insurance contracts. Any remainder is accounted for as a deduction from the present value of in-force (‘PVIF’)
long-term insurance business on the relevant product.
long-term insurance business on the relevant product.
For unit-linked contracts, market risk is substantially borne by the policyholder, but some market risk exposure typically remains, as fees earned are related to the market value of the linked assets.
| 92 | HSBC Holdings plc Interim Report 2020 |
Sensitivities
Changes in financial market factors, from the economic assumptions in place at the start of the year, had a negative impact on reported profit before tax of $320m (1H19: $163m positive). The following table illustrates the effects of selected interest rate, equity price and foreign exchange rate scenarios on our profit for the period and the total equity of our insurance manufacturing subsidiaries.
Where appropriate, the effects of the sensitivity tests on profit after tax and equity incorporate the impact of the stress on the PVIF. In Europe, where observable long-tenor interest rates are at or close to zero, the -100bps stress sensitivity allows for the impact of negative rates. In other regions, the downside interest rate sensitivity does not take into account negative interest rates as the calculation rates are floored at zero. Due in part to the
impact of the cost of guarantees and hedging strategies, which may be in place, the relationship between the profit and total equity and the risk factors is non-linear, particularly in a low interest rate environment. Therefore, the results disclosed should not be extrapolated to measure sensitivities to different levels of stress. For the same reason, the impact of the stress is not necessarily symmetrical on the upside and downside. The sensitivities are stated before allowance for management actions, which may mitigate the effect of changes in the market environment. The sensitivities presented allow for adverse changes in policyholder behaviour that may arise in response to changes in market rates. The differences between the impacts on profit after tax and equity are driven by the changes in value of the bonds measured at fair value through other comprehensive income, which are only accounted for in equity.
| Sensitivity of HSBC’s insurance manufacturing subsidiaries to market risk factors | ||||||||
| At 30 Jun 2020 | At 31 Dec 2019 | |||||||
Effect on profit after tax | Effect on total equity | Effect on profit after tax | Effect on total equity | |||||
| $m | $m | $m | $m | |||||
| +100 basis point parallel shift in yield curves | (97 | ) | (196 | ) | 43 | (37 | ) | |
| -100 basis point parallel shift in yield curves | (126 | ) | (23 | ) | (221 | ) | (138 | ) |
| 10% increase in equity prices | 242 | 242 | 270 | 270 | ||||
| 10% decrease in equity prices | (243 | ) | (243 | ) | (276 | ) | (276 | ) |
| 10% increase in US dollar exchange rate compared with all currencies | 3 | 3 | 41 | 41 | ||||
| 10% decrease in US dollar exchange rate compared with all currencies | (3 | ) | (3 | ) | (41 | ) | (41 | ) |
HSBC Holdings plc Interim Report 2020 | 93 |
Interim condensed financial statements (unaudited)
| Consolidated income statement | |||||||
| Half-year to | |||||||
| 30 Jun | 30 Jun | 31 Dec | |||||
| 2020 | 2019 | 2019 | |||||
| Notes* | $m | $m | $m | ||||
| Net interest income | 14,509 | 15,240 | 15,222 | ||||
| – interest income | 23,000 | 27,750 | 26,945 | ||||
| – interest expense | (8,491 | ) | (12,510 | ) | (11,723 | ) | |
| Net fee income | 2 | 5,926 | 6,124 | 5,899 | |||
| – fee income | 7,480 | 7,804 | 7,635 | ||||
| – fee expense | (1,554 | ) | (1,680 | ) | (1,736 | ) | |
| Net income from financial instruments held for trading or managed on a fair value basis | 5,768 | 5,331 | 4,900 | ||||
| Net income/(expense) from assets and liabilities of insurance businesses, including related derivatives, measured at fair value through profit or loss | (1,290 | ) | 2,196 | 1,282 | |||
| Change in fair value of designated debt and related derivatives | 197 | 88 | 2 | ||||
| Changes in fair value of other financial instruments mandatorily measured at fair value through profit or loss | 80 | 457 | 355 | ||||
| Gains less losses from financial investments | 466 | 201 | 134 | ||||
| Net insurance premium income | 5,020 | 6,323 | 4,313 | ||||
| Other operating income | 471 | 2,072 | 885 | ||||
| Total operating income | 31,147 | 38,032 | 32,992 | ||||
| Net insurance claims and benefits paid and movement in liabilities to policyholders | (4,402 | ) | (8,660 | ) | (6,266 | ) | |
| Net operating income before change in expected credit losses and other credit impairment charges | 26,745 | 29,372 | 26,726 | ||||
| Change in expected credit losses and other credit impairment charges | (6,858 | ) | (1,140 | ) | (1,616 | ) | |
| Net operating income | 19,887 | 28,232 | 25,110 | ||||
| Employee compensation and benefits | (8,514 | ) | (9,255 | ) | (8,747 | ) | |
| General and administrative expenses | (4,918 | ) | (6,372 | ) | (7,456 | ) | |
| Depreciation and impairment of property, plant and equipment and right-of-use assets | (1,209 | ) | (1,010 | ) | (1,090 | ) | |
| Amortisation and impairment of intangible assets | (1,845 | ) | (512 | ) | (558 | ) | |
| Goodwill impairment | (41 | ) | — | (7,349 | ) | ||
| Total operating expenses | (16,527 | ) | (17,149 | ) | (25,200 | ) | |
| Operating profit/(loss) | 3,360 | 11,083 | (90 | ) | |||
| Share of profit in associates and joint ventures | 958 | 1,324 | 1,030 | ||||
| Profit before tax | 4,318 | 12,407 | 940 | ||||
| Tax expense | (1,193 | ) | (2,470 | ) | (2,169 | ) | |
| Profit/(loss) for the period | 3,125 | 9,937 | (1,229 | ) | |||
| Attributable to: | |||||||
| – ordinary shareholders of the parent company | 1,977 | 8,507 | (2,538 | ) | |||
| – preference shareholders of the parent company | 45 | 45 | 45 | ||||
| – other equity holders | 617 | 664 | 660 | ||||
| – non-controlling interests | 486 | 721 | 604 | ||||
| Profit/(loss) for the period | 3,125 | 9,937 | (1,229 | ) | |||
| $ | $ | $ | |||||
| Basic earnings per ordinary share | 4 | 0.10 | 0.42 | (0.13 | ) | ||
| Diluted earnings per ordinary share | 4 | 0.10 | 0.42 | (0.13 | ) | ||
| * | For Notes on the interim condensed financial statements, see page 100. |
| 94 | HSBC Holdings plc Interim Report 2020 |
| Consolidated statement of comprehensive income | ||||||
| Half-year to | ||||||
| 30 Jun | 30 Jun | 31 Dec | ||||
| 2020 | 2019 | 2019 | ||||
| $m | $m | $m | ||||
| Profit/(loss) for the period | 3,125 | 9,937 | (1,229 | ) | ||
| Other comprehensive income/(expense) | ||||||
| Items that will be reclassified subsequently to profit or loss when specific conditions are met: | ||||||
| Debt instruments at fair value through other comprehensive income | 1,747 | 1,015 | 137 | |||
| – fair value gains/(losses) | 2,654 | 2,141 | (348 | ) | ||
| – fair value (gains)/losses transferred to the income statement on disposal | (454 | ) | (794 | ) | 429 | |
| – expected credit recoveries/(losses) recognised in the income statement | 109 | (5 | ) | 114 | ||
| – income taxes | (562 | ) | (327 | ) | (58 | ) |
| Cash flow hedges | 476 | 239 | (33 | ) | ||
| – fair value gains | 255 | 241 | 310 | |||
| – fair value losses/(gains) reclassified to the income statement | 364 | 68 | (354 | ) | ||
| – income taxes and other movements | (143 | ) | (70 | ) | 11 | |
| Share of other comprehensive income/(expense) of associates and joint ventures | (115 | ) | 73 | (52 | ) | |
| – share for the period | (115 | ) | 85 | (64 | ) | |
| – fair value (gains)/losses transferred to the income statement on disposal | — | (12 | ) | 12 | ||
| Exchange differences | (4,552 | ) | 109 | 935 | ||
| Items that will not be reclassified subsequently to profit or loss: | ||||||
| Remeasurement of defined benefit asset/liability | 1,182 | (45 | ) | 58 | ||
| – before income taxes | 1,703 | (50 | ) | 33 | ||
| – income taxes | (521 | ) | 5 | 25 | ||
| Changes in fair value of financial liabilities designated at fair value upon initial recognition arising from changes in own credit risk | 2,354 | (1,445 | ) | (557 | ) | |
| – before income taxes | 2,936 | (1,816 | ) | (823 | ) | |
| – income taxes | (582 | ) | 371 | 266 | ||
| Equity instruments designated at fair value through other comprehensive income | (123 | ) | 268 | 98 | ||
| – fair value gains/(losses) | (122 | ) | 265 | 99 | ||
| – income taxes | (1 | ) | 3 | (1 | ) | |
| Effects of hyperinflation | 72 | 113 | 104 | |||
| Other comprehensive expense for the period, net of tax | 1,041 | 327 | 690 | |||
| Total comprehensive income/(expense) for the period | 4,166 | 10,264 | (539 | ) | ||
| Attributable to: | ||||||
| – ordinary shareholders of the parent company | 3,043 | 8,741 | (1,903 | ) | ||
| – preference shareholders of the parent company | 45 | 45 | 45 | |||
| – other equity holders | 617 | 664 | 660 | |||
| – non-controlling interests | 461 | 814 | 659 | |||
| Total comprehensive income/(expense) for the period | 4,166 | 10,264 | (539 | ) | ||
HSBC Holdings plc Interim Report 2020 | 95 |
Interim condensed financial statements (unaudited)
| Consolidated balance sheet | |||||
| At | |||||
| 30 Jun | 31 Dec | ||||
| 2020 | 2019 | ||||
| Notes* | $m | $m | |||
| Assets | |||||
| Cash and balances at central banks | 249,673 | 154,099 | |||
| Items in the course of collection from other banks | 6,289 | 4,956 | |||
| Hong Kong Government certificates of indebtedness | 39,519 | 38,380 | |||
| Trading assets | 208,964 | 254,271 | |||
| Financial assets designated and otherwise mandatorily measured at fair value through profit and loss | 41,785 | 43,627 | |||
| Derivatives | 8 | 313,781 | 242,995 | ||
| Loans and advances to banks | 77,015 | 69,203 | |||
| Loans and advances to customers | 1,018,681 | 1,036,743 | |||
| Reverse repurchase agreements – non-trading | 226,345 | 240,862 | |||
| Financial investments | 9 | 494,109 | 443,312 | ||
| Prepayments, accrued income and other assets | 197,425 | 136,680 | |||
| Current tax assets | 821 | 755 | |||
| Interests in associates and joint ventures | 10 | 24,800 | 24,474 | ||
| Goodwill and intangible assets | 19,438 | 20,163 | |||
| Deferred tax assets | 4,153 | 4,632 | |||
| Total assets | 2,922,798 | 2,715,152 | |||
| Liabilities and equity | |||||
| Liabilities | |||||
| Hong Kong currency notes in circulation | 39,519 | 38,380 | |||
| Deposits by banks | 82,715 | 59,022 | |||
| Customer accounts | 1,532,380 | 1,439,115 | |||
| Repurchase agreements – non-trading | 112,799 | 140,344 | |||
| Items in the course of transmission to other banks | 6,296 | 4,817 | |||
| Trading liabilities | 79,612 | 83,170 | |||
| Financial liabilities designated at fair value | 156,608 | 164,466 | |||
| Derivatives | 8 | 303,059 | 239,497 | ||
| Debt securities in issue | 110,114 | 104,555 | |||
| Accruals, deferred income and other liabilities | 173,181 | 118,156 | |||
| Current tax liabilities | 1,141 | 2,150 | |||
| Liabilities under insurance contracts | 98,832 | 97,439 | |||
| Provisions | 12 | 3,209 | 3,398 | ||
| Deferred tax liabilities | 4,491 | 3,375 | |||
| Subordinated liabilities | 23,621 | 24,600 | |||
| Total liabilities | 2,727,577 | 2,522,484 | |||
| Equity | |||||
| Called up share capital | 10,346 | 10,319 | |||
| Share premium account | 14,268 | 13,959 | |||
| Other equity instruments | 20,914 | 20,871 | |||
| Other reserves | (301 | ) | 2,127 | ||
| Retained earnings | 141,809 | 136,679 | |||
| Total shareholders’ equity | 187,036 | 183,955 | |||
| Non-controlling interests | 8,185 | 8,713 | |||
| Total equity | 195,221 | 192,668 | |||
| Total liabilities and equity | 2,922,798 | 2,715,152 | |||
| * | For Notes on the interim condensed financial statements, see page 100. |
| 96 | HSBC Holdings plc Interim Report 2020 |
| Consolidated statement of cash flows | ||||||
| Half-year to | ||||||
| 30 Jun | 30 Jun | 31 Dec | ||||
| 2020 | 2019 | 2019 | ||||
| $m | $m | $m | ||||
| Profit before tax | 4,318 | 12,407 | 940 | |||
| Adjustments for non-cash items: | ||||||
| Depreciation, amortisation and impairment | 3,095 | 1,522 | 8,997 | |||
| Net gain from investing activities | (405 | ) | (352 | ) | (47 | ) |
| Share of profits in associates and joint ventures | (958 | ) | (1,324 | ) | (1,030 | ) |
| Gain on disposal of subsidiaries, businesses, associates and joint ventures | — | (828 | ) | (101 | ) | |
| Change in expected credit losses gross of recoveries and other credit impairment charges | 6,875 | 1,347 | 1,665 | |||
| Provisions including pensions | 277 | 1,012 | 1,411 | |||
| Share-based payment expense | 195 | 288 | 190 | |||
| Other non-cash items included in profit before tax | (718 | ) | (1,401 | ) | (896 | ) |
Change in operating assets | 11,185 | (114,049 | ) | 9,818 | ||
Change in operating liabilities | 134,734 | 136,627 | (20,544 | ) | ||
Elimination of exchange differences1 | 3,775 | (10,266 | ) | 6,524 | ||
| Dividends received from associates | 120 | 170 | 463 | |||
| Contributions paid to defined benefit plans | (335 | ) | (153 | ) | (380 | ) |
| Tax paid | (2,373 | ) | (1,347 | ) | (920 | ) |
| Net cash from operating activities | 159,785 | 23,653 | 6,090 | |||
| Purchase of financial investments | (271,830 | ) | (234,762 | ) | (211,145 | ) |
| Proceeds from the sale and maturity of financial investments | 225,733 | 204,600 | 208,586 | |||
| Net cash flows from the purchase and sale of property, plant and equipment | (447 | ) | (532 | ) | (811 | ) |
| Net cash flows from purchase of customer and loan portfolios | 244 | 435 | 683 | |||
| Net investment in intangible assets | (957 | ) | (951 | ) | (1,338 | ) |
| Net cash flow on (purchase)/disposal of subsidiaries, businesses, associates and joint ventures | (409 | ) | (75 | ) | (8 | ) |
| Net cash from investing activities | (47,666 | ) | (31,285 | ) | (4,033 | ) |
| Cancellation of shares | — | — | (1,000 | ) | ||
| Net sales/(purchases) of own shares for market-making and investment purposes | (48 | ) | 27 | 114 | ||
| Redemption of preference shares and other equity instruments | (398 | ) | — | — | ||
| Subordinated loan capital repaid | (1,538 | ) | (4,138 | ) | (72 | ) |
| Dividends paid to shareholders of the parent company and non-controlling interests | (1,204 | ) | (4,271 | ) | (5,502 | ) |
| Net cash from financing activities | (3,188 | ) | (8,382 | ) | (6,460 | ) |
| Net increase/(decrease) in cash and cash equivalents | 108,931 | (16,014 | ) | (4,403 | ) | |
Cash and cash equivalents at the beginning of the period2 | 293,742 | 312,911 | 296,723 | |||
| Exchange differences in respect of cash and cash equivalents | (7,455 | ) | (174 | ) | 1,422 | |
Cash and cash equivalents at the end of the period2 | 395,218 | 296,723 | 293,742 | |||
| 1 | Adjustments to bring changes between opening and closing balance sheet amounts to average rates. This is not done on a line-by-line basis, as details cannot be determined without unreasonable expense. |
| 2 | At 31 December 2019, HSBC re-presented cash and cash equivalents to reflect a consistent global approach to these amounts. The net effect of these changes decreased cash and cash equivalents by $15.3bn at 30 June 2019. |
HSBC Holdings plc Interim Report 2020 | 97 |
Interim condensed financial statements (unaudited)
| Consolidated statement of changes in equity | ||||||||||||||||||||
| Other reserves | ||||||||||||||||||||
| Called up share capital and share premium | Other equity instru-ments | Retained earnings | Financial assets at FVOCI reserve | Cash flow hedging reserve | Foreign exchange reserve | Merger and other reserves | Total share-holders’ equity | Non- controlling interests | Total equity | |||||||||||
| $m | $m | $m | $m | $m | $m | $m | $m | $m | $m | |||||||||||
| At 1 Jan 2020 | 24,278 | 20,871 | 136,679 | (108 | ) | (2 | ) | (25,133 | ) | 27,370 | 183,955 | 8,713 | 192,668 | |||||||
| Profit for the period | — | — | 2,639 | — | — | — | — | 2,639 | 486 | 3,125 | ||||||||||
| Other comprehensive income (net of tax) | — | — | 3,506 | 1,654 | 465 | (4,559 | ) | — | 1,066 | (25 | ) | 1,041 | ||||||||
| – debt instruments at fair value through other comprehensive income | — | — | — | 1,735 | — | — | — | 1,735 | 12 | 1,747 | ||||||||||
| – equity instruments designated at fair value through other comprehensive income | — | — | — | (81 | ) | — | — | — | (81 | ) | (42 | ) | (123 | ) | ||||||
| – cash flow hedges | — | — | — | — | 465 | — | — | 465 | 11 | 476 | ||||||||||
| – changes in fair value of financial liabilities designated at fair value upon initial recognition arising from changes in own credit risk | — | — | 2,354 | — | — | — | — | 2,354 | — | 2,354 | ||||||||||
| – remeasurement of defined benefit asset/liability | — | — | 1,195 | — | — | — | — | 1,195 | (13 | ) | 1,182 | |||||||||
| – share of other comprehensive income of associates and joint ventures | — | — | (115 | ) | — | — | — | — | (115 | ) | — | (115 | ) | |||||||
| – effects of hyperinflation | — | — | 72 | — | — | — | — | 72 | — | 72 | ||||||||||
| – exchange differences | — | — | — | — | — | (4,559 | ) | — | (4,559 | ) | 7 | (4,552 | ) | |||||||
| Total comprehensive income for the period | — | — | 6,145 | 1,654 | 465 | (4,559 | ) | — | 3,705 | 461 | 4,166 | |||||||||
| Shares issued under employee remuneration and share plans | 336 | — | (329 | ) | — | — | — | — | 7 | — | 7 | |||||||||
| Dividends to shareholders | — | — | (662 | ) | — | — | — | — | (662 | ) | (542 | ) | (1,204 | ) | ||||||
| Cost of share-based payment arrangements | — | — | 195 | — | — | — | — | 195 | — | 195 | ||||||||||
| Other movements | — | 43 | (219 | ) | 12 | — | — | — | (164 | ) | (447 | ) | (611 | ) | ||||||
| At 30 Jun 2020 | 24,614 | 20,914 | 141,809 | 1,558 | 463 | (29,692 | ) | 27,370 | 187,036 | 8,185 | 195,221 | |||||||||
| At 1 Jan 2019 | 23,789 | 22,367 | 138,191 | (1,532 | ) | (206 | ) | (26,133 | ) | 29,777 | 186,253 | 7,996 | 194,249 | |||||||
| Profit for the period | — | — | 9,216 | — | — | — | — | 9,216 | 721 | 9,937 | ||||||||||
| Other comprehensive income (net of tax) | — | — | (1,297 | ) | 1,202 | 237 | 92 | — | 234 | 93 | 327 | |||||||||
| – debt instruments at fair value through other comprehensive income | — | — | — | 1,001 | — | — | — | 1,001 | 14 | 1,015 | ||||||||||
| – equity instruments designated at fair value through other comprehensive income | — | — | — | 201 | — | — | — | 201 | 67 | 268 | ||||||||||
| – cash flow hedges | — | — | — | — | 237 | — | — | 237 | 2 | 239 | ||||||||||
| – changes in fair value of financial liabilities designated at fair value upon initial recognition arising from changes in own credit risk | — | — | (1,445 | ) | — | — | — | — | (1,445 | ) | — | (1,445 | ) | |||||||
| – remeasurement of defined benefit asset/liability | — | — | (38 | ) | — | — | — | — | (38 | ) | (7 | ) | (45 | ) | ||||||
| – share of other comprehensive income of associates and joint ventures | — | — | 73 | — | — | — | — | 73 | — | 73 | ||||||||||
| – effects of hyperinflation | — | — | 113 | — | — | — | — | 113 | — | 113 | ||||||||||
| – exchange differences | — | — | — | — | — | 92 | — | 92 | 17 | 109 | ||||||||||
| Total comprehensive income for the period | — | — | 7,919 | 1,202 | 237 | 92 | — | 9,450 | 814 | 10,264 | ||||||||||
| Shares issued under employee remuneration and share plans | 490 | — | (475 | ) | — | — | — | — | 15 | — | 15 | |||||||||
| Shares issued in lieu of dividends and amounts arising thereon | — | — | 1,160 | — | — | — | — | 1,160 | — | 1,160 | ||||||||||
| Dividends to shareholders | — | — | (4,915 | ) | — | — | — | — | (4,915 | ) | (516 | ) | (5,431 | ) | ||||||
| Cost of share-based payment arrangements | — | — | 255 | — | — | — | — | 255 | — | 255 | ||||||||||
| Other movements | — | — | 458 | — | — | — | — | 458 | (96 | ) | 362 | |||||||||
| At 30 Jun 2019 | 24,279 | 22,367 | 142,593 | (330 | ) | 31 | (26,041 | ) | 29,777 | 192,676 | 8,198 | 200,874 | ||||||||
| 98 | HSBC Holdings plc Interim Report 2020 |
| Consolidated statement of changes in equity (continued) | ||||||||||||||||||||
| Other reserves | ||||||||||||||||||||
| Called up share capital and share premium | Other equity instru- ments | Retained earnings | Financial assets at FVOCI reserve | Cash flow hedging reserve | Foreign exchange reserve | Merger and other reserves | Total share- holders’ equity | Non- controlling interests | Total equity | |||||||||||
| $m | $m | $m | $m | $m | $m | $m | $m | $m | $m | |||||||||||
| At 1 Jul 2019 | 24,279 | 22,367 | 142,593 | (330 | ) | 31 | (26,041 | ) | 29,777 | 192,676 | 8,198 | 200,874 | ||||||||
| Profit for the period | — | — | (1,833 | ) | — | — | — | — | (1,833 | ) | 604 | (1,229 | ) | |||||||
| Other comprehensive income (net of tax) | — | — | (462 | ) | 222 | (33 | ) | 908 | — | 635 | 55 | 690 | ||||||||
| – debt instruments at fair value through other comprehensive income | — | — | — | 145 | — | — | — | 145 | (8 | ) | 137 | |||||||||
| – equity instruments designated at fair value through other comprehensive income | — | — | — | 77 | — | — | — | 77 | 21 | 98 | ||||||||||
| – cash flow hedges | — | — | — | — | (33 | ) | — | — | (33 | ) | — | (33 | ) | |||||||
| – changes in fair value of financial liabilities designated at fair value upon initial recognition arising from changes in own credit risk | — | — | (557 | ) | — | — | — | — | (557 | ) | — | (557 | ) | |||||||
| – remeasurement of defined benefit asset/liability | — | — | 43 | — | — | — | — | 43 | 15 | 58 | ||||||||||
| – share of other comprehensive income of associates and joint ventures | — | — | (52 | ) | — | — | — | — | (52 | ) | — | (52 | ) | |||||||
| – effects of hyperinflation | — | — | 104 | — | — | — | — | 104 | — | 104 | ||||||||||
| – exchange differences | — | — | — | — | — | 908 | — | 908 | 27 | 935 | ||||||||||
| Total comprehensive income for the period | — | — | (2,295 | ) | 222 | (33 | ) | 908 | — | (1,198 | ) | 659 | (539 | ) | ||||||
| Shares issued under employee remuneration and share plans | 67 | — | (20 | ) | — | — | — | — | 47 | — | 47 | |||||||||
| Shares issued in lieu of dividends and amounts arising thereon | — | — | 1,527 | — | — | — | — | 1,527 | — | 1,527 | ||||||||||
| Dividends to shareholders | — | — | (6,768 | ) | — | — | — | — | (6,768 | ) | (261 | ) | (7,029 | ) | ||||||
Redemption of securities1 | — | (1,496 | ) | (12 | ) | — | — | — | — | (1,508 | ) | — | (1,508 | ) | ||||||
Transfers2 | — | — | 2,475 | — | — | — | (2,475 | ) | — | — | — | |||||||||
| Cost of share-based payment arrangements | — | — | 223 | — | — | — | — | 223 | — | 223 | ||||||||||
Cancellation of shares3 | (68 | ) | — | (1,000 | ) | — | — | — | 68 | (1,000 | ) | — | (1,000 | ) | ||||||
| Other movements | — | — | (44 | ) | — | — | — | — | (44 | ) | 117 | 73 | ||||||||
| At 31 Dec 2019 | 24,278 | 20,871 | 136,679 | (108 | ) | (2 | ) | (25,133 | ) | 27,370 | 183,955 | 8,713 | 192,668 | |||||||
| 1 | In 2019, HSBC Holdings called and later redeemed $1,500m 5.625% perpetual subordinated capital securities on which there were $12m of external issuance costs. |
| 2 | Permitted transfers from the merger reserve to retained earnings were made when the investment in HSBC Overseas Holdings (UK) Limited was previously impaired. In 2019, an additional impairment of $2,475m was recognised and a permitted transfer of this amount was made from the merger reserve to retained earnings. |
| 3 | In August 2019, HSBC announced a share buy-back of up to $1.0bn, which was completed in September 2019. |
HSBC Holdings plc Interim Report 2020 | 99 |
Notes on the interim condensed financial statements (unaudited)
| Notes on the interim condensed financial statements | ||||||
| Page | Page | |||||
| 1 | Basis of preparation and significant accounting policies | 10 | Interests in associates and joint ventures | |||
| 2 | Net fee income | 11 | Goodwill and intangible assets | |||
| 3 | Dividends | 12 | Provisions | |||
| 4 | Earnings per share | 13 | Contingent liabilities, contractual commitments and guarantees | |||
| 5 | Segmental analysis | 14 | Legal proceedings and regulatory matters | |||
| 6 | Fair values of financial instruments carried at fair value | 15 | Transactions with related parties | |||
| 7 | Fair values of financial instruments not carried at fair value | 16 | Events after the balance sheet date | |||
| 8 | Derivatives | 17 | Interim Report 2020 and statutory accounts | |||
| 9 | Financial investments | |||||
| 1 | Basis of preparation and significant accounting policies |
| (a) | Compliance with International Financial Reporting Standards |
Our interim condensed consolidated financial statements have been prepared in accordance with the Disclosure Guidance and Transparency Rules of the Financial Conduct Authority and IAS 34 ‘Interim Financial Reporting’, as issued by the International Accounting Standards Board (‘IASB’) and as endorsed by the EU. Therefore, they include an explanation of events and transactions that are significant to an understanding of the changes in HSBC’s financial position and performance since the end of 2019. These financial statements should be read in conjunction with the Annual Report and Accounts 2019.
At 30 June 2020, there were no unendorsed standards effective for the half-year to 30 June 2020 affecting these financial statements, and there was no difference between IFRSs endorsed by the EU and IFRSs issued by the IASB in terms of their application to HSBC.
Standards applied during the half-year to 30 June 2020
There were no new standards or amendments to standards that had an effect on these interim condensed consolidated financial statements.
| (b) | Use of estimates and judgements |
Management believes that our critical accounting estimates and judgements are those that relate to impairment of amortised cost and FVOCI debt financial assets, goodwill impairment, the valuation of financial instruments, deferred tax assets, provisions for liabilities, defined benefit obligations and interests in associates. There were no changes in the current period to the critical accounting estimates and judgements applied in 2019, which are stated on pages 47 and 242 of the Annual Report and Accounts 2019. However, the level of estimation uncertainty and judgement for the calculation of expected credit losses (‘ECL’) has increased since 31 December 2019 as a result of the economic effects of the Covid-19 outbreak as set out in ‘Measurement uncertainty and sensitivity analysis’ on page 60. In addition, as a result of the heightened economic uncertainty together with the plans announced in the 2020 business update and historical underperformance of certain businesses, the estimates and judgements with regard to the expected cash flows of cash generating units, which are applied to the impairment of non-financial assets other than goodwill, particularly intangible assets, have become more sensitive and resulted in significant impairment charges in the interim reporting period. See Note 11 ‘Goodwill and intangible assets’.
| (c) | Composition of Group |
There were no material changes in the composition of the Group in the half-year to 30 June 2020.
| (d) | Future accounting developments |
IFRS 17 ‘Insurance Contracts’ was issued in May 2017, with amendments to the standard issued in June 2020. It has not been endorsed for use in the EU. The standard sets out the requirements that an entity should apply in accounting for insurance contracts it issues and reinsurance contracts it holds. Following the amendments, IFRS 17 is effective from 1 January 2023. The Group is in the process of implementing IFRS 17. Industry practice and interpretation of the standard are still developing. Therefore, the likely impact of its implementation remains uncertain.
| (e) | Going concern |
The financial statements are prepared on a going concern basis, as the Directors are satisfied that the Group and parent company have the resources to continue in business for the foreseeable future. In making this assessment, the Directors have considered a wide range of information relating to present and future conditions, including future projections of profitability, cash flows, capital requirements and capital resources. These considerations include stressed scenarios that reflect the increasing uncertainty that the global Covid-19 pandemic has had on HSBC’s operations, as well as considering potential impacts from other top and emerging risks, and the related impact on profitability, capital and liquidity.
| (f) | Accounting policies |
Except as described above, the accounting policies that we applied for these interim condensed consolidated financial statements are consistent with those described on pages 240 to 251 of the Annual Report and Accounts 2019, as are the methods of computation.
| 100 | HSBC Holdings plc Interim Report 2020 |
| 2 | Net fee income |
| Half-year to | |||||||
| 30 Jun | 30 Jun | 31 Dec | |||||
| 2020 | 2019 | 2019 | |||||
| Total | Total | Total | |||||
| Footnotes | $m | $m | $m | ||||
Net fee income by product | |||||||
Funds under management | 1,113 | 1,067 | 1,110 | ||||
| Cards | 954 | 968 | 1,007 | ||||
| Broking income | 743 | 544 | 513 | ||||
| Credit facilities | 726 | 805 | 813 | ||||
Account services | 649 | 1,034 | 969 | ||||
| Underwriting | 552 | 446 | 383 | ||||
| Unit trusts | 455 | 546 | 489 | ||||
| Global custody | 446 | 342 | 375 | ||||
| Remittances | 325 | 373 | 374 | ||||
| Imports/exports | 288 | 338 | 324 | ||||
| Insurance agency commission | 171 | 200 | 177 | ||||
| Other | 1,058 | 1,141 | 1,101 | ||||
| Fee income | 7,480 | 7,804 | 7,635 | ||||
| Less: fee expense | (1,554 | ) | (1,680 | ) | (1,736 | ) | |
| Net fee income | 5,926 | 6,124 | 5,899 | ||||
| Net fee income by global business | 1 | ||||||
| Wealth and Personal Banking | 2,691 | 2,870 | 2,765 | ||||
| Commercial Banking | 1,630 | 1,773 | 1,617 | ||||
| Global Banking and Markets | 1,608 | 1,489 | 1,550 | ||||
| Corporate Centre | (3 | ) | (8 | ) | (33 | ) | |
| 1 | A change in reportable segments was made in 2Q20. Comparative data have been re-presented accordingly. For further guidance, refer to Note 5 on page 102. |
| 3 | Dividends |
On 31 March 2020, HSBC announced that, in response to a request from the Bank of England through the UK’s Prudential Regulation Authority, the Board had cancelled the fourth interim dividend for 2019 of $0.21 per ordinary share, which was scheduled to be paid on 14 April 2020. The Board also announced that until the end of 2020, HSBC will make no quarterly or interim dividend payments or accruals in respect of ordinary shares.
The Board intends to provide an update on the dividend policy at the year-end results for 2020, when the economic impact of the Covid-19 outbreak is better understood. We will also take into account the views of our shareholders, the interests of our other stakeholders and other factors, including our financial performance and capital position.
| Dividends paid to shareholders of HSBC Holdings plc | ||||||||||||||||||
| Half-year to | ||||||||||||||||||
| 30 Jun 2020 | 30 Jun 2019 | 31 Dec 2019 | ||||||||||||||||
| Per share | Total | Settled in scrip | Per share | Total | Settled in scrip | Per share | Total | Settled in scrip | ||||||||||
| $ | $m | $m | $ | $m | $m | $ | $m | $m | ||||||||||
| Dividends paid on ordinary shares | ||||||||||||||||||
| In respect of previous year: | ||||||||||||||||||
| – fourth interim dividend | — | — | — | 0.21 | 4,206 | 1,160 | — | — | — | |||||||||
| In respect of current year: | ||||||||||||||||||
– first interim dividend1 | — | — | — | — | — | — | 0.10 | 2,013 | 375 | |||||||||
| – second interim dividend | — | — | — | — | — | — | 0.10 | 2,021 | 795 | |||||||||
| – third interim dividend | — | — | — | — | — | — | 0.10 | 2,029 | 357 | |||||||||
| Total | — | — | — | 0.21 | 4,206 | 1,160 | 0.30 | 6,063 | 1,527 | |||||||||
| Total dividends on preference shares classified as equity (paid quarterly) | 31.00 | 45 | 31.00 | 45 | 31.00 | 45 | ||||||||||||
| Total coupons on capital securities classified as equity | 617 | 664 | 660 | |||||||||||||||
| Dividends to shareholders | 662 | 4,915 | 6,768 | |||||||||||||||
| 1 | At 30 June 2019, HSBC changed its accounting practice on the recognition of interim dividends to recognise them on the date of payment rather than the date of declaration, in line with generally accepted accounting practice. |
HSBC Holdings plc Interim Report 2020 | 101 |
Notes on the interim condensed financial statements (unaudited)
| Total coupons on capital securities classified as equity | |||||||||
| Half-year to | |||||||||
| 30 Jun | 30 Jun | 31 Dec | |||||||
| 2020 | 2019 | 2019 | |||||||
| Total | Total | Total | |||||||
| Footnotes | First call date | Per security | $m | $m | $m | ||||
| Perpetual subordinated contingent convertible securities | 1 | ||||||||
| – $1,500m issued at 5.625% | 2 | Nov 2019 | $56.250 | — | 42 | 42 | |||
| – $2,000m issued at 6.875% | Jun 2021 | $68.750 | 69 | 69 | 69 | ||||
| – $2,250m issued at 6.375% | Sep 2024 | $63.750 | 72 | 72 | 71 | ||||
| – $2,450m issued at 6.375% | Mar 2025 | $63.750 | 78 | 78 | 78 | ||||
| – $3,000m issued at 6.000% | May 2027 | $60.000 | 90 | 90 | 90 | ||||
| – $2,350m issued at 6.250% | Mar 2023 | $62.500 | 73 | 73 | 74 | ||||
– $1,800m issued at 6.500% | Mar 2028 | $65.000 | 59 | 58 | 59 | ||||
| – €1,500m issued at 5.250% | Sep 2022 | €52.500 | 44 | 45 | 43 | ||||
| – €1,000m issued at 6.000% | Sep 2023 | €60.000 | 33 | 34 | 32 | ||||
| – €1,250m issued at 4.750% | July 2029 | €47.500 | 33 | 34 | 34 | ||||
| – SGD1,000m issued at 4.700% | Jun 2022 | SGD47.000 | 17 | 17 | 17 | ||||
| – SGD750m issued at 5.000% | Sep 2023 | SGD50.000 | 13 | 14 | 14 | ||||
| – £1,000m issued at 5.875% | Sep 2026 | £58.750 | 36 | 38 | 37 | ||||
| Total | 617 | 664 | 660 | ||||||
| 1 | Discretionary coupons are paid twice a year on the perpetual subordinated contingent convertible securities, in denominations of 1,000 per security in each security’s issuance currency. |
| 2 | This security was called by HSBC Holdings on 22 November 2019 and was redeemed and cancelled on 17 January 2020. |
| 4 | Earnings per share |
Basic earnings per ordinary share is calculated by dividing the profit attributable to ordinary shareholders of the parent company by the weighted average number of ordinary shares outstanding, excluding own shares held. Diluted earnings per ordinary share is calculated by dividing the basic earnings, which require no adjustment for the effects of dilutive potential ordinary shares, by the weighted average number of ordinary shares outstanding, excluding own shares held, plus the weighted average number of ordinary shares that would be issued on conversion of dilutive potential ordinary shares.
| Profit/(loss) attributable to ordinary shareholders of the parent company | ||||||
| Half-year to | ||||||
| 30 Jun | 30 Jun | 31 Dec | ||||
| 2020 | 2019 | 2019 | ||||
| $m | $m | $m | ||||
| Profit attributable to shareholders of the parent company | 2,639 | 9,216 | (1,833 | ) | ||
| Dividend payable on preference shares classified as equity | (45 | ) | (45 | ) | (45 | ) |
| Coupon payable on capital securities classified as equity | (617 | ) | (664 | ) | (660 | ) |
| Profit/(loss) attributable to ordinary shareholders of the parent company | 1,977 | 8,507 | (2,538 | ) | ||
| Basic and diluted earnings per share | |||||||||||||||||||
| Half-year to | |||||||||||||||||||
| 30 Jun 2020 | 30 Jun 2019 | 31 Dec 2019 | |||||||||||||||||
| Profit | Number of shares | Amount per share | Profit | Number of shares | Amount per share | Profit/(loss) | Number of shares | Amount per share | |||||||||||
| Footnotes | $m | (millions) | $ | $m | (millions) | $ | $m | (millions) | $ | ||||||||||
| Basic | 1 | 1,977 | 20,162 | 0.10 | 8,507 | 20,124 | 0.42 | (2,538 | ) | 20,191 | (0.13 | ) | |||||||
| Effect of dilutive potential ordinary shares | 58 | 65 | — | ||||||||||||||||
| Diluted | 1 | 1,977 | 20,220 | 0.10 | 8,507 | 20,189 | 0.42 | (2,538 | ) | 20,191 | (0.13 | ) | |||||||
| 1 | Weighted average number of ordinary shares outstanding (basic) or assuming dilution (diluted). |
| 5 | Segmental analysis |
The Group Chief Executive, supported by the rest of the Group Executive Committee (‘GEC’), is considered the Chief Operating Decision Maker (‘CODM’) for the purposes of identifying the Group’s reportable segments. Global business results are assessed by the CODM on the basis of adjusted performance that removes the effects of significant items and currency translation from reported results. Therefore, we present these results on an adjusted basis as required by IFRSs. The 2019 adjusted performance information is presented on a constant currency basis. The income statements for the half-years to 30 June 2019 and 31 December 2019 are converted at the average rates of exchange for 2020, and the balance sheets at 30 June 2019 and 31 December 2019 at the prevailing rates of exchange on
30 June 2020.
30 June 2020.
| 102 | HSBC Holdings plc Interim Report 2020 |
Our operations are closely integrated and, accordingly, the presentation of data includes internal allocations of certain items of income and expense. These allocations include the costs of certain support services and global functions to the extent that they can be meaningfully attributed to global businesses. While such allocations have been made on a systematic and consistent basis, they necessarily involve a degree of subjectivity. Costs that are not allocated to global businesses are included in Corporate Centre.
Where relevant, income and expense amounts presented include the results of inter-segment funding along with inter-company and inter-business line transactions. All such transactions are undertaken on arm’s length terms. The intra-Group elimination items for the global businesses are presented in Corporate Centre.
Change in reportable segments
Effective from 2Q20, we made the following realignments within our internal reporting to the GEC and CODM:
| • | We simplified our matrix organisational structure by combining Global Private Banking and Retail Banking and Wealth Management to form Wealth and Personal Banking. |
| • | We reallocated our reporting of Balance Sheet Management, hyperinflation accounting in Argentina and Holdings net interest expense from Corporate Centre to the global businesses. |
Comparative data have been re-presented accordingly.
Our global businesses
We provide a comprehensive range of banking and related financial services to our customers in our three global businesses. The products and services offered to customers are organised by these global businesses:
| • | Wealth and Personal Banking (‘WPB’) provides a full range of retail banking and wealth products to our customers from personal banking to ultra high net worth individuals. Typically, customer offerings include retail banking products, such as current and savings accounts, mortgages and personal loans, credit cards, debit cards and local and international payment services. We also provide wealth management services, including insurance and investment products, global asset management services, investment management and Private Wealth Solutions for customers with more sophisticated and international requirements. |
| • | Commercial Banking (‘CMB’) offers a broad range of products and services to serve the needs of our commercial customers, including small and medium-sized enterprises, mid-market enterprises and corporates. These include credit and lending, international trade and receivables finance, treasury management and liquidity solutions (payments and cash management and commercial cards), commercial insurance and investments. CMB also offers customers access to products and services offered by other global businesses, such as Global Banking and Markets, which include foreign exchange products, raising capital on debt and equity markets and advisory services. |
| • | Global Banking and Markets (‘GBM’) provides tailored financial solutions to major government, corporate and institutional clients and private investors worldwide. The client-focused business lines deliver a full range of banking capabilities, including financing, advisory and transaction services, a markets business that provides services in credit, rates, foreign exchange, equities, money markets and securities services, and principal investment activities. |
| HSBC adjusted profit before tax and balance sheet data | |||||||||||
| Half-year to 30 Jun 2020 | |||||||||||
| Wealth and Personal Banking | Commercial Banking | Global Banking and Markets | Corporate Centre | Total | |||||||
| Footnotes | $m | $m | $m | $m | $m | ||||||
| Net operating income before change in expected credit losses and other credit impairment charges | 1 | 11,251 | 7,000 | 8,178 | 48 | 26,477 | |||||
| – external | 9,684 | 7,431 | 10,105 | (743 | ) | 26,477 | |||||
| – inter-segment | 1,567 | (431 | ) | (1,927 | ) | 791 | — | ||||
| of which: net interest income/(expense) | 8,032 | 4,883 | 2,372 | (804 | ) | 14,483 | |||||
| Change in expected credit losses and other credit impairment charges | (2,202 | ) | (3,526 | ) | (1,118 | ) | (12 | ) | (6,858 | ) | |
| Net operating income | 9,049 | 3,474 | 7,060 | 36 | 19,619 | ||||||
| Total operating expenses | (7,346 | ) | (3,290 | ) | (4,512 | ) | 206 | (14,942 | ) | ||
| Operating profit | 1,703 | 184 | 2,548 | 242 | 4,677 | ||||||
| Share of profit in associates and joint ventures | (8 | ) | — | — | 966 | 958 | |||||
| Adjusted profit before tax | 1,695 | 184 | 2,548 | 1,208 | 5,635 | ||||||
| % | % | % | % | % | |||||||
| Share of HSBC’s adjusted profit before tax | 30.1 | 3.3 | 45.2 | 21.4 | 100.0 | ||||||
| Adjusted cost efficiency ratio | 65.3 | 47.0 | 55.2 | (429.2 | ) | 56.4 | |||||
| Adjusted balance sheet data | $m | $m | $m | $m | $m | ||||||
| Loans and advances to customers (net) | 429,487 | 344,567 | 243,355 | 1,272 | 1,018,681 | ||||||
| Interests in associates and joint ventures | 425 | 13 | 136 | 24,226 | 24,800 | ||||||
| Total external assets | 814,719 | 549,530 | 1,390,006 | 168,543 | 2,922,798 | ||||||
| Customer accounts | 775,870 | 418,263 | 337,573 | 674 | 1,532,380 | ||||||
HSBC Holdings plc Interim Report 2020 | 103 |
Notes on the interim condensed financial statements (unaudited)
| HSBC adjusted profit before tax and balance sheet data (continued) | |||||||||||
Half-year to 30 Jun 20192 | |||||||||||
| Wealth and Personal Banking | Commercial Banking | Global Banking and Markets | Corporate Centre | Total | |||||||
| Footnotes | $m | $m | $m | $m | $m | ||||||
| Net operating income/(expense) before change in expected credit losses and other credit impairment charges | 1 | 12,861 | 7,647 | 7,590 | (283 | ) | 27,815 | ||||
| – external | 10,747 | 8,087 | 10,258 | (1,277 | ) | 27,815 | |||||
| – inter-segment | 2,114 | (440 | ) | (2,668 | ) | 994 | — | ||||
| of which: net interest income/(expense) | 8,525 | 5,466 | 2,667 | (1,761 | ) | 14,897 | |||||
| Change in expected credit losses and other credit impairment (charges)/recoveries | (527 | ) | (478 | ) | (97 | ) | 14 | (1,088 | ) | ||
| Net operating income/(expense) | 12,334 | 7,169 | 7,493 | (269 | ) | 26,727 | |||||
| Total operating expenses | (7,551 | ) | (3,258 | ) | (4,758 | ) | (172 | ) | (15,739 | ) | |
| Operating profit/(loss) | 4,783 | 3,911 | 2,735 | (441 | ) | 10,988 | |||||
| Share of profit in associates and joint ventures | 41 | — | — | 1,244 | 1,285 | ||||||
| Adjusted profit before tax | 4,824 | 3,911 | 2,735 | 803 | 12,273 | ||||||
| % | % | % | % | % | |||||||
| Share of HSBC’s adjusted profit before tax | 39.3 | 31.9 | 22.3 | 6.5 | 100.0 | ||||||
| Adjusted cost efficiency ratio | 58.7 | 42.6 | 62.7 | (60.8 | ) | 56.6 | |||||
| Adjusted balance sheet data | $m | $m | $m | $m | $m | ||||||
| Loans and advances to customers (net) | 414,611 | 340,976 | 246,209 | 1,184 | 1,002,980 | ||||||
| Interests in associates and joint ventures | 451 | 12 | 14 | 23,046 | 23,523 | ||||||
| Total external assets | 729,032 | 506,223 | 1,319,642 | 148,668 | 2,703,565 | ||||||
| Customer accounts | 714,969 | 354,806 | 286,867 | 505 | 1,357,147 | ||||||
| 1 | Net operating income before change in expected credit losses and other credit impairment charges, also referred to as revenue. |
| 2 | A change in reportable segments was made in 2Q20. Comparative data have been re-presented accordingly. |
Half-year to 31 Dec 20192 | |||||||||||
| Net operating income/(expense) before change in expected credit losses and other credit impairment charges | 1 | 12,492 | 7,379 | 7,113 | (352 | ) | 26,632 | ||||
| – external | 10,320 | 7,871 | 9,886 | (1,445 | ) | 26,632 | |||||
| – inter-segment | 2,172 | (492 | ) | (2,773 | ) | 1,093 | — | ||||
| of which: net interest income/(expense) | 8,769 | 5,409 | 2,533 | (1,495 | ) | 15,216 | |||||
| Change in expected credit losses and other credit impairment charges | (829 | ) | (684 | ) | (61 | ) | 20 | (1,554 | ) | ||
| Net operating income/(expense) | 11,663 | 6,695 | 7,052 | (332 | ) | 25,078 | |||||
| Total operating expenses | (7,685 | ) | (3,498 | ) | (4,656 | ) | (609 | ) | (16,448 | ) | |
| Operating profit/(loss) | 3,978 | 3,197 | 2,396 | (941 | ) | 8,630 | |||||
| Share of profit in associates and joint ventures | 11 | — | — | 1,019 | 1,030 | ||||||
| Adjusted profit before tax | 3,989 | 3,197 | 2,396 | 78 | 9,660 | ||||||
| % | % | % | % | % | |||||||
| Share of HSBC’s adjusted profit before tax | 41.3 | 33.1 | 24.8 | 0.8 | 100.0 | ||||||
| Adjusted cost efficiency ratio | 61.5 | 47.4 | 65.5 | (173.0 | ) | 61.8 | |||||
| Adjusted balance sheet data | $m | $m | $m | $m | $m | ||||||
| Loans and advances to customers (net) | 428,834 | 336,345 | 240,411 | 1,071 | 1,006,661 | ||||||
| Interests in associates and joint ventures | 445 | 13 | 13 | 23,760 | 24,231 | ||||||
| Total external assets | 754,369 | 496,757 | 1,233,829 | 153,539 | 2,638,494 | ||||||
| Customer accounts | 735,301 | 377,691 | 285,954 | 710 | 1,399,656 | ||||||
| 1 | Net operating income before change in expected credit losses and other credit impairment charges, also referred to as revenue. |
| 2 | A change in reportable segments was made in 2Q20. Comparative data have been presented accordingly. |
Reported external net operating income is attributed to countries and territories on the basis of the location of the branch responsible for reporting the results or advancing the funds:
| Half-year to | |||||||
| 30 Jun 2020 | 30 Jun 2019 | 31 Dec 2019 | |||||
| Footnotes | $m | $m | $m | ||||
| Reported external net operating income by country/territory | 1 | 26,745 | 29,372 | 26,726 | |||
| – UK | 4,166 | 4,577 | 4,434 | ||||
| – Hong Kong | 8,703 | 9,461 | 8,988 | ||||
| – US | 2,435 | 2,293 | 2,178 | ||||
| – France | 697 | 979 | 963 | ||||
| – other countries | 10,744 | 12,062 | 10,163 | ||||
| 1 | Net operating income before change in expected credit losses and other credit impairment charges, also referred to as revenue. |
| 104 | HSBC Holdings plc Interim Report 2020 |
| Adjusted results reconciliation | |||||||||||||||||||||||
| Half-year to | |||||||||||||||||||||||
| 30 Jun 2020 | 30 Jun 2019 | 31 Dec 2019 | |||||||||||||||||||||
| Adjusted | Significant items | Reported | Adjusted | Currency translation | Significant items | Reported | Adjusted | Currency translation | Significant items | Reported | |||||||||||||
| Footnotes | $m | $m | $m | $m | $m | $m | $m | $m | $m | $m | $m | ||||||||||||
| Revenue | 1 | 26,477 | 268 | 26,745 | 27,815 | 681 | 876 | 29,372 | 26,632 | 281 | (187 | ) | 26,726 | ||||||||||
| ECL | (6,858 | ) | — | (6,858 | ) | (1,088 | ) | (52 | ) | — | (1,140 | ) | (1,554 | ) | (62 | ) | — | (1,616 | ) | ||||
| Operating expenses | (14,942 | ) | (1,585 | ) | (16,527 | ) | (15,739 | ) | (453 | ) | (957 | ) | (17,149 | ) | (16,448 | ) | (228 | ) | (8,524 | ) | (25,200 | ) | |
| Share of profit in associates and joint ventures | 958 | — | 958 | 1,285 | 39 | — | 1,324 | 1,030 | — | — | 1,030 | ||||||||||||
| Profit before tax | 5,635 | (1,317 | ) | 4,318 | 12,273 | 215 | (81 | ) | 12,407 | 9,660 | (9 | ) | (8,711 | ) | 940 | ||||||||
| 1 | Net operating income before change in expected credit losses and other credit impairment charges, also referred to as revenue. |
| Adjusted balance sheet reconciliation | ||||||||
| At | ||||||||
| 30 Jun 2020 | 31 Dec 2019 | |||||||
| Reported and adjusted | Adjusted | Currency translation | Reported | |||||
| $m | $m | $m | $m | |||||
| Loans and advances to customers (net) | 1,018,681 | 1,006,661 | 30,082 | 1,036,743 | ||||
| Interests in associates and joint ventures | 24,800 | 24,231 | 243 | 24,474 | ||||
| Total external assets | 2,922,798 | 2,638,494 | 76,658 | 2,715,152 | ||||
| Customer accounts | 1,532,380 | 1,399,656 | 39,459 | 1,439,115 | ||||
| Adjusted profit reconciliation | |||||||
| Half-year to | |||||||
| 30 Jun 2020 | 30 Jun 2019 | 31 Dec 2019 | |||||
| Footnotes | $m | $m | $m | ||||
| Adjusted profit before tax | 5,635 | 12,273 | 9,660 | ||||
| Significant items | (1,317 | ) | (81 | ) | (8,711 | ) | |
| – customer redress programmes (revenue) | 26 | — | (163 | ) | |||
| – disposals, acquisitions and investment in new businesses (revenue) | (8 | ) | 827 | (59 | ) | ||
| – fair value movements on financial instruments | 1 | 299 | 50 | 34 | |||
| – restructuring and other related costs (revenue) | (49 | ) | — | — | |||
| – costs of structural reform | 2 | — | (91 | ) | (67 | ) | |
| – customer redress programmes (operating expenses) | (50 | ) | (610 | ) | (671 | ) | |
| – impairment of goodwill and other intangible assets | (1,025 | ) | — | (7,349 | ) | ||
| – restructuring and other related costs (operating expenses) | 3 | (505 | ) | (287 | ) | (540 | ) |
| – settlements and provisions in connection with legal and other regulatory matters | (5 | ) | 2 | 59 | |||
| – currency translation on significant items | 28 | 45 | |||||
| Currency translation | 215 | (9 | ) | ||||
| Reported profit before tax | 4,318 | 12,407 | 940 | ||||
| 1 | Includes fair value movements on non-qualifying hedges and debt valuation adjustments on derivatives. |
| 2 | Comprises costs associated with preparations for the UK’s exit from the European Union. |
| 3 | Includes impairment of software intangible assets of $173m. |
HSBC Holdings plc Interim Report 2020 | 105 |
Notes on the interim condensed financial statements (unaudited)
| 6 | Fair values of financial instruments carried at fair value |
The accounting policies, control framework and hierarchy used to determine fair values at 30 June 2020 are consistent with those applied for the Annual Report and Accounts 2019.
| Financial instruments carried at fair value and bases of valuation | ||||||||
| Valuation techniques | ||||||||
Quoted market price Level 1 | Using observable inputs Level 2 | With significant unobservable inputs Level 3 | Total | |||||
| $m | $m | $m | $m | |||||
| Recurring fair value measurements | ||||||||
| At 30 Jun 2020 | ||||||||
| Assets | ||||||||
| Trading assets | 141,930 | 63,169 | 3,865 | 208,964 | ||||
| Financial assets designated and otherwise mandatorily measured at fair value through profit or loss | 16,054 | 15,327 | 10,404 | 41,785 | ||||
| Derivatives | 2,126 | 307,800 | 3,855 | 313,781 | ||||
| Financial investments | 311,685 | 89,304 | 3,339 | 404,328 | ||||
| Liabilities | ||||||||
| Trading liabilities | 63,204 | 16,303 | 105 | 79,612 | ||||
| Financial liabilities designated at fair value | 1,059 | 150,541 | 5,008 | 156,608 | ||||
| Derivatives | 2,002 | 297,332 | 3,725 | 303,059 | ||||
| At 31 Dec 2019 | ||||||||
| Assets | ||||||||
| Trading assets | 186,653 | 62,639 | 4,979 | 254,271 | ||||
| Financial assets designated and otherwise mandatorily measured at fair value through profit or loss | 18,626 | 15,525 | 9,476 | 43,627 | ||||
| Derivatives | 1,728 | 239,131 | 2,136 | 242,995 | ||||
| Financial investments | 261,341 | 93,018 | 3,218 | 357,577 | ||||
| Liabilities | ||||||||
| Trading liabilities | 66,925 | 16,192 | 53 | 83,170 | ||||
| Financial liabilities designated at fair value | 9,549 | 149,901 | 5,016 | 164,466 | ||||
| Derivatives | 1,331 | 235,864 | 2,302 | 239,497 | ||||
Balances from 2019 have been re-presented to disclose a consistent application of the levelling methodology, primarily for private debt and equity and real estate investments during the period. This resulted in $15.1bn and $2.9bn moving into Levels 2 and 3, respectively, from Level 1. The change has impacted the disclosure for ‘Financial investments’ and ‘Financial assets designated and otherwise mandatorily measured at fair value’.
| Transfers between Level 1 and Level 2 fair values | ||||||||||||||
| Assets | Liabilities | |||||||||||||
| Financial investments | Trading assets | Designated and otherwise mandatorily measured at fair value | Derivatives | Trading liabilities | Designated at fair value | Derivatives | ||||||||
| $m | $m | $m | $m | $m | $m | $m | ||||||||
| At 30 Jun 2020 | ||||||||||||||
| Transfers from Level 1 to Level 2 | 1,342 | 2,132 | 217 | — | 98 | 7,414 | — | |||||||
| Transfers from Level 2 to Level 1 | 4,353 | 3,025 | 154 | 1 | 355 | — | — | |||||||
| At 31 Dec 2019 | ||||||||||||||
| Transfers from Level 1 to Level 2 | 7,965 | 3,304 | — | 24 | 278 | — | — | |||||||
| Transfers from Level 2 to Level 1 | 4,184 | 2,726 | 673 | 111 | 220 | — | 117 | |||||||
Balances from 2019 have been re-presented to disclose a consistent application of the levelling methodology.
Transfers between levels of the fair value hierarchy are deemed to occur at the end of each quarterly reporting period. Transfers into and out of levels of the fair value hierarchy are primarily attributable to observability of valuation inputs and price transparency.
Fair value adjustments
We adopt the use of fair value adjustments when we take into consideration additional factors not incorporated within the valuation model that would otherwise be considered by a market participant. We classify fair value adjustments as either ‘risk-related’ or ‘model-related’. The majority of these adjustments relate to GBM. Movements in the level of fair value adjustments do not necessarily result in the recognition of profits or losses within the income statement. For example, as models are enhanced, fair value adjustments may no longer be required. Similarly, fair value adjustments will decrease when the related positions are unwound, but this may not result in profit or loss.
| 106 | HSBC Holdings plc Interim Report 2020 |
| Global Banking and Markets fair value adjustments | |||||||||
| At | |||||||||
| 30 Jun 2020 | 31 Dec 2019 | ||||||||
| GBM | Corporate Centre | GBM | Corporate Centre | ||||||
| Footnotes | $m | $m | $m | $m | |||||
| Type of adjustment | |||||||||
| Risk-related | 1,230 | 149 | 1,040 | 125 | |||||
| – bid-offer | 486 | 92 | 428 | 79 | |||||
| – uncertainty | 101 | 1 | 115 | 1 | |||||
| – credit valuation adjustment | 558 | 48 | 355 | 38 | |||||
| – debt valuation adjustment | (184 | ) | — | (126 | ) | — | |||
| – funding fair value adjustment | 239 | 8 | 241 | 7 | |||||
| – other | 30 | — | 27 | — | |||||
| Model-related | 99 | 5 | 71 | 3 | |||||
| – model limitation | 96 | 5 | 68 | 3 | |||||
| – other | 3 | — | 3 | — | |||||
| Inception profit (Day 1 P&L reserves) | 1 | 89 | — | 72 | — | ||||
| 1,418 | 154 | 1,183 | 128 | ||||||
| 1 | See Note 8 on the interim condensed financial statements on page 112. |
Fair value adjustment changes were driven mainly by an increase in credit valuation adjustment (‘CVA’) due to widening credit spreads and changes to derivative exposures caused by interest rates moves.
For further details of our risk-related and model-related adjustments, see pages 267 and 268 of the Annual Report and Accounts 2019.
Fair value valuation bases
| Financial instruments measured at fair value using a valuation technique with significant unobservable inputs – Level 3 | ||||||||||||||||||
| Assets | Liabilities | |||||||||||||||||
| Financial investments | Trading assets | Designated and otherwise mandatorily measured at fair value through profit or loss | Derivatives | Total | Trading liabilities | Designated at fair value | Derivatives | Total | ||||||||||
| $m | $m | $m | $m | $m | $m | $m | $m | $m | ||||||||||
| Private equity including strategic investments | 689 | 3 | 9,756 | — | 10,448 | 3 | — | — | 3 | |||||||||
| Asset-backed securities | 1,095 | 674 | 98 | — | 1,867 | — | — | — | — | |||||||||
| Loans held for securitisation | — | 1 | — | — | 1 | — | — | — | — | |||||||||
| Structured notes | — | 3 | — | — | 3 | 36 | 5,003 | — | 5,039 | |||||||||
| Derivatives with monolines | — | — | — | 75 | 75 | — | — | — | — | |||||||||
| Other derivatives | — | — | — | 3,771 | 3,771 | — | — | 3,717 | 3,717 | |||||||||
| Other portfolios | 1,555 | 3,184 | 550 | 9 | 5,298 | 66 | 5 | 8 | 79 | |||||||||
| At 30 Jun 2020 | 3,339 | 3,865 | 10,404 | 3,855 | 21,463 | 105 | 5,008 | 3,725 | 8,838 | |||||||||
| Private equity including strategic investments | 716 | 4 | 8,831 | — | 9,551 | 4 | — | — | 4 | |||||||||
| Asset-backed securities | 874 | 934 | 28 | — | 1,836 | — | — | — | — | |||||||||
| Loans held for securitisation | — | 1 | 39 | — | 40 | — | — | — | — | |||||||||
| Structured notes | — | 3 | — | — | 3 | 47 | 5,016 | — | 5,063 | |||||||||
| Derivatives with monolines | — | — | — | 66 | 66 | — | — | — | — | |||||||||
| Other derivatives | — | — | — | 2,070 | 2,070 | — | — | 2,302 | 2,302 | |||||||||
| Other portfolios | 1,628 | 4,037 | 578 | — | 6,243 | 2 | — | — | 2 | |||||||||
| At 31 Dec 2019 | 3,218 | 4,979 | 9,476 | 2,136 | 19,809 | 53 | 5,016 | 2,302 | 7,371 | |||||||||
Balances from 2019 have been re-presented to disclose a consistent application of the levelling methodology. This resulted in an increase of $2.9bn of assets in Level 3. ‘Other portfolios’ increased by $1.4bn and ‘Private equity including strategic investments’ increased by $1.5bn.
The basis for determining the fair value of the financial instruments in the table above is explained on pages 268 and 269 of the Annual Report and Accounts 2019.
HSBC Holdings plc Interim Report 2020 | 107 |
Notes on the interim condensed financial statements (unaudited)
Reconciliation of fair value measurements in Level 3 of the fair value hierarchy
| Movement in Level 3 financial instruments | |||||||||||||||
| Assets | Liabilities | ||||||||||||||
| Financial investments | Trading assets | Designated and otherwise mandatorily measured at fair value through profit or loss | Derivatives | Trading liabilities | Designated at fair value | Derivatives | |||||||||
| Footnotes | $m | $m | $m | $m | $m | $m | $m | ||||||||
| At 1 Jan 2020 | 3,218 | 4,979 | 9,476 | 2,136 | 53 | 5,016 | 2,302 | ||||||||
| Total gains/(losses) recognised in profit or loss | (13 | ) | (541 | ) | (106 | ) | 2,237 | — | (117 | ) | 2,105 | ||||
| – net income from financial instruments held for trading or managed on a fair value basis | — | (541 | ) | — | 2,237 | — | — | 2,105 | |||||||
| – changes in fair value of other financial instruments mandatorily measured at fair value through profit or loss | — | — | (106 | ) | — | — | (117 | ) | — | ||||||
| – gains less losses from financial investments at fair value through other comprehensive income | (13 | ) | — | — | — | — | — | — | |||||||
| Total gains/(losses) recognised in other comprehensive income | 1 | (29 | ) | (171 | ) | (4 | ) | (147 | ) | (2 | ) | (78 | ) | (162 | ) |
| – financial investments: fair value gains/(losses) | (19 | ) | — | — | — | — | — | — | |||||||
| – exchange differences | (10 | ) | (171 | ) | (4 | ) | (147 | ) | (2 | ) | (78 | ) | (162 | ) | |
| Purchases | 610 | 199 | 1,594 | — | 63 | — | — | ||||||||
| New issuances | — | — | — | — | 2 | 1,091 | — | ||||||||
| Sales | (271 | ) | (577 | ) | (424 | ) | — | (1 | ) | — | — | ||||
| Settlements | (401 | ) | (22 | ) | (170 | ) | (262 | ) | (12 | ) | (853 | ) | (307 | ) | |
| Transfers out | (22 | ) | (797 | ) | (63 | ) | (139 | ) | (5 | ) | (275 | ) | (270 | ) | |
| Transfers in | 247 | 795 | 101 | 30 | 7 | 224 | 57 | ||||||||
| At 30 Jun 2020 | 3,339 | 3,865 | 10,404 | 3,855 | 105 | 5,008 | 3,725 | ||||||||
| Unrealised gains/(losses) recognised in profit or loss relating to assets and liabilities held at 30 Jun 2020 | — | (7 | ) | (140 | ) | 529 | (3 | ) | 100 | 1,104 | |||||
– net income from financial instruments held for trading or managed on a fair value basis | — | (7 | ) | — | 529 | (3 | ) | — | 1,104 | ||||||
– changes in fair value of other financial instruments mandatorily measured at fair value through profit or loss | — | — | (140 | ) | — | — | 100 | — | |||||||
| At 1 Jan 2019 | 2,796 | 6,759 | 7,080 | 2,423 | 58 | 5,328 | 1,756 | ||||||||
| Total gains/(losses) recognised in profit or loss | — | (2 | ) | 196 | (9 | ) | (4 | ) | 246 | 591 | |||||
– net income from financial instruments held for trading or managed on a fair value basis | — | (2 | ) | — | (9 | ) | (4 | ) | — | 591 | |||||
| – changes in fair value of other financial instruments mandatorily measured at fair value through profit or loss | — | — | 196 | — | — | 246 | — | ||||||||
| Total gains/(losses) recognised in other comprehensive income (‘OCI’) | 1 | 236 | (18 | ) | 6 | (6 | ) | (1 | ) | (6 | ) | (10 | ) | ||
| – financial investments: fair value gains/(losses) | 238 | — | — | — | — | — | — | ||||||||
| – exchange differences | (2 | ) | (18 | ) | 6 | (6 | ) | (1 | ) | (6 | ) | (10 | ) | ||
| Purchases | 336 | 1,145 | 1,214 | — | 5 | 118 | — | ||||||||
| New issuances | — | 154 | — | — | — | 818 | — | ||||||||
| Sales | (7 | ) | (487 | ) | (87 | ) | — | (9 | ) | (180 | ) | — | |||
| Settlements | (240 | ) | (1,691 | ) | (184 | ) | 94 | — | (396 | ) | (136 | ) | |||
| Transfers out | (4 | ) | (409 | ) | (20 | ) | (622 | ) | (9 | ) | (550 | ) | (189 | ) | |
| Transfers in | 179 | 222 | 40 | 50 | 9 | 18 | 21 | ||||||||
| At 30 Jun 2019 | 3,296 | 5,673 | 8,245 | 1,930 | 49 | 5,396 | 2,033 | ||||||||
| Unrealised gains/(losses) recognised in profit or loss relating to assets and liabilities held at 30 Jun 2019 | — | 2 | 67 | 257 | (23 | ) | (7 | ) | (320 | ) | |||||
– net income from financial instruments held for trading or managed on a fair value basis | — | 2 | — | 257 | (23 | ) | — | (320 | ) | ||||||
| – changes in fair value of other financial instruments mandatorily measured at fair value through profit or loss | — | — | 67 | — | — | (7 | ) | — | |||||||
| 108 | HSBC Holdings plc Interim Report 2020 |
| Movement in Level 3 financial instruments (continued) | |||||||||||||||
| Assets | Liabilities | ||||||||||||||
| Financial investments | Trading assets | Designated at fair value through profit or loss | Derivatives | Trading liabilities | Designated at fair value | Derivatives | |||||||||
| Footnotes | $m | $m | $m | $m | $m | $m | $m | ||||||||
| At 1 Jul 2019 | 3,296 | 5,673 | 8,245 | 1,930 | 49 | 5,396 | 2,033 | ||||||||
| Total gains/(losses) recognised in profit or loss | 6 | (110 | ) | 391 | 287 | — | (51 | ) | 339 | ||||||
– net income from financial instruments held for trading or managed on a fair value basis | — | (110 | ) | — | 287 | — | — | 339 | |||||||
| – changes in fair value of other financial instruments mandatorily measured at fair value through profit or loss | — | — | 391 | — | — | (51 | ) | — | |||||||
| – gains less losses from financial investments at fair value through other comprehensive income | 10 | — | — | — | — | — | — | ||||||||
| – expected credit loss charges and other credit risk charges | (4 | ) | — | — | — | — | — | — | |||||||
| Total gains/(losses) recognised in other comprehensive income (‘OCI’) | 1 | 73 | 94 | (10 | ) | 55 | 2 | 24 | 62 | ||||||
| – financial investments: fair value gains/(losses) | 63 | — | — | — | — | — | — | ||||||||
| – exchange differences | 10 | 94 | (10 | ) | 55 | 2 | 24 | 62 | |||||||
| Purchases | 357 | 1,061 | 1,292 | — | 3 | 39 | — | ||||||||
| New issuances | — | — | — | — | 6 | 783 | — | ||||||||
| Sales | (49 | ) | (408 | ) | (189 | ) | — | — | (13 | ) | — | ||||
| Settlements | (89 | ) | (416 | ) | (250 | ) | (194 | ) | (7 | ) | (652 | ) | (26 | ) | |
| Transfers out | (484 | ) | (1,149 | ) | (3 | ) | (88 | ) | — | (529 | ) | (284 | ) | ||
| Transfers in | 108 | 234 | — | 146 | — | 19 | 178 | ||||||||
| At 31 Dec 2019 | 3,218 | 4,979 | 9,476 | 2,136 | 53 | 5,016 | 2,302 | ||||||||
| Unrealised gains/(losses) recognised in profit or loss relating to assets and liabilities held at 31 Dec 2019 | (4 | ) | (22 | ) | 465 | 279 | — | 57 | (407 | ) | |||||
– net income from financial instruments held for trading or managed on a fair value basis | — | (22 | ) | — | 279 | — | — | (407 | ) | ||||||
– changes in fair value of other financial instruments mandatorily measured at fair value through profit or loss | — | — | 465 | — | — | 57 | — | ||||||||
– loan impairment recoveries and other credit risk provisions | (4 | ) | — | — | — | — | — | — | |||||||
| 1 | Included in ‘Financial investments: fair value gains/(losses)’ in the current year and ‘Exchange differences’ in the consolidated statement of comprehensive income. |
Balances from 2019 have been re-presented to disclose a consistent application of the levelling methodology. The result of this is an increase of $2.9bn of assets in Level 3. ‘Financial investments’ increased by $1.2bn and ‘Private equity including strategic investments financial assets designated and otherwise mandatorily measured at fair value’ increased by $1.7bn.
Transfers between levels of the fair value hierarchy are deemed to occur at the end of each quarterly reporting period. Transfers into and out of levels of the fair value hierarchy are primarily attributable to observability of valuation inputs and price transparency.
Effect of changes in significant unobservable assumptions to reasonably possible alternatives
The following table shows the sensitivity of Level 3 fair values to reasonably possible alternative assumptions:
| Sensitivity of fair values to reasonably possible alternative assumptions | |||||||||
Reflected in profit or loss | Reflected in other comprehensive income | ||||||||
Favourable changes | Unfavourable changes | Favourable changes | Unfavourable changes | ||||||
| Footnotes | $m | $m | $m | $m | |||||
| Derivatives, trading assets and trading liabilities | 1 | 271 | (268 | ) | — | — | |||
| Financial assets and liabilities designated and otherwise mandatorily measured at fair value | 625 | (625 | ) | — | — | ||||
| Financial investments | 28 | (28 | ) | 101 | (104 | ) | |||
| At 30 Jun 2020 | 924 | (921 | ) | 101 | (104 | ) | |||
| Derivatives, trading assets and trading liabilities | 1 | 298 | (303 | ) | — | — | |||
| Financial assets and liabilities designated and otherwise mandatorily measured at fair value | 545 | (439 | ) | — | — | ||||
| Financial investments | 43 | (46 | ) | 74 | (74 | ) | |||
| At 30 Jun 2019 | 886 | (788 | ) | 74 | (74 | ) | |||
| Derivatives, trading assets and trading liabilities | 1 | 255 | (230 | ) | — | — | |||
| Financial assets and liabilities designated and otherwise mandatorily measured at fair value through profit or loss | 618 | (503 | ) | — | — | ||||
| Financial investments | 48 | (53 | ) | 81 | (81 | ) | |||
| At 31 Dec 2019 | 921 | (786 | ) | 81 | (81 | ) | |||
| 1 | ‘Derivatives, trading assets and trading liabilities’ is presented as one category to reflect the manner in which these financial instruments are risk-managed. |
HSBC Holdings plc Interim Report 2020 | 109 |
Notes on the interim condensed financial statements (unaudited)
Balances from 2019 have been re-presented to disclose a consistent application of the levelling methodology. The result of this is an increase in ‘Financial investments reflected through OCI’ and ‘Financial asset designated and mandatorily measured at fair value reflected in profit or loss’ of $59m and $86m respectively.
The sensitivity analysis aims to measure a range of fair values consistent with the application of a 95% confidence interval. Methodologies take account of the nature of the valuation technique employed, as well as the availability and reliability of observable proxy and historical data.
When the fair value of a financial instrument is affected by more than one unobservable assumption, the table above reflects the most favourable or the most unfavourable change from varying the assumptions individually.
Key unobservable inputs to Level 3 financial instruments
The following table lists key unobservable inputs to Level 3 financial instruments and provides the range of those inputs at 30 June 2020. There has been no change to the key unobservable inputs to Level 3 financial instruments and inter-relationships therein, which are detailed on pages 271 and 272 of the Annual Report and Accounts 2019.
| Quantitative information about significant unobservable inputs in Level 3 valuations | ||||||||||
| Fair value | Valuation technique | Key unobservable inputs | ||||||||
| Assets | Liabilities | Full range of inputs | ||||||||
| Footnotes | $m | $m | Lower | Higher | ||||||
| Private equity including strategic investments | 10,448 | 3 | See footnote 1 | See footnote 1 | ||||||
| Asset-backed securities | 1,867 | — | ||||||||
| – CLO/CDO | 2 | 113 | — | Market proxy | Prepayment rate | 0% | 9% | |||
| — | Market proxy | Bid quotes | 0 | 99 | ||||||
| – other ABSs | 1,754 | — | Market proxy | Bid quotes | 0 | 100 | ||||
| Loans held for securitisation | 1 | — | ||||||||
| Structured notes | 3 | 5,039 | ||||||||
| – equity-linked notes | — | 3,988 | Model – option model | Equity volatility | 6% | 161% | ||||
| Model – option model | Equity correlation | 22% | 92% | |||||||
| – FX-linked notes | — | 579 | Model – option model | FX volatility | 1% | 34% | ||||
| – other | 3 | 472 | ||||||||
| Derivatives with monolines | 75 | — | Model – discounted cash flow | Credit spread | 1.6% | 2.1% | ||||
| Other derivatives | 3,771 | 3,717 | ||||||||
| – interest rate derivatives | ||||||||||
| securitisation swaps | 283 | 869 | Model – discounted cash flow | Prepayment rate | 6% | 7% | ||||
| long-dated swaptions | 1,778 | 735 | Model – option model | IR volatility | 7% | 33% | ||||
| other | 412 | 335 | ||||||||
| – FX derivatives | ||||||||||
| FX options | 109 | 191 | Model – option model | FX volatility | 1% | 49% | ||||
| other | 142 | 139 | ||||||||
| – equity derivatives | ||||||||||
| long-dated single stock options | 750 | 821 | Model – option model | Equity volatility | 0% | 131% | ||||
| other | 192 | 551 | ||||||||
| – credit derivatives | ||||||||||
| other | 105 | 76 | ||||||||
| Other portfolios | 5,298 | 79 | ||||||||
| – structured certificates | 1,488 | — | Model – discounted cash flow | Credit volatility | 11% | 11% | ||||
| – repurchase agreements | 778 | 63 | ||||||||
| – other | 3 | 3,032 | 16 | |||||||
| At 30 Jun 2020 | 21,463 | 8,838 | ||||||||
| 110 | HSBC Holdings plc Interim Report 2020 |
| Quantitative information about significant unobservable inputs in Level 3 valuations (continued) | |||||||||
| Fair value | Valuation technique | ||||||||
| Assets | Liabilities | Key unobservable inputs | Full range of inputs | ||||||
| Footnotes | $m | $m | Lower | Higher | |||||
| Private equity including strategic investments | 9,551 | 4 | See footnote 1 | See footnote 1 | n/a | n/a | |||
| Asset-backed securities | 1,836 | — | |||||||
| – CLO/CDO | 2 | 373 | — | Market proxy | Prepayment rate | 0% | 9% | ||
| Market proxy | Bid quotes | 0 | 100 | ||||||
| – other ABSs | 1,463 | — | Market proxy | Bid quotes | 0 | 101 | |||
| Loans held for securitisation | 40 | — | |||||||
| Structured notes | 3 | 5,063 | |||||||
| – equity-linked notes | — | 3,768 | Model – option model | Equity volatility | 5% | 90% | |||
| Model – option model | Equity correlation | 9% | 93% | ||||||
| – FX-linked notes | — | 1,046 | Model – option model | FX volatility | 1% | 23% | |||
| – other | 3 | 249 | |||||||
| Derivatives with monolines | 66 | — | Model – discounted cash flow | Credit spread | 0.4% | 2% | |||
| Other derivatives | 2,070 | 2,302 | |||||||
| – interest rate derivatives | |||||||||
| securitisation swaps | 314 | 640 | Model – discounted cash flow | Prepayment rate | 6% | 7% | |||
| long-dated swaptions | 838 | 51 | Model – option model | IR volatility | 8% | 22% | |||
| other | 255 | 155 | |||||||
| – FX derivatives | |||||||||
| FX options | 93 | 218 | Model – option model | FX volatility | 1% | 25% | |||
| other | 119 | 104 | |||||||
| – equity derivatives | |||||||||
| long-dated single stock options | 230 | 293 | Model – option model | Equity volatility | 0% | 89% | |||
| other | 78 | 712 | |||||||
| – Credit derivatives | |||||||||
| Other | 143 | 129 | |||||||
| Other portfolios | 6,243 | 2 | |||||||
| – structured certificates | 1,515 | — | Model – discounted cash flow | Credit volatility | 4% | 4% | |||
| – repurchase agreements | 1,604 | — | |||||||
| – other | 3 | 3,124 | 2 | ||||||
| At 31 Dec 2019 | 19,809 | 7,371 | |||||||
| 1 | See notes on page 271 of the Annual Report and Accounts 2019. |
| 2 | Collateralised loan obligation/collateralised debt obligation. |
| 3 | ’Other’ includes a range of smaller asset holdings. |
Balances from 2019 have been re-presented to disclose a consistent application of the levelling methodology. The result of this is an increase of $2.9bn of assets in Level 3. ‘Other portfolios’ increased by $1.4bn and ‘Private equity including strategic investments’ increased by $1.5bn.
| 7 | Fair values of financial instruments not carried at fair value |
The bases for measuring the fair values of loans and advances to banks and customers, financial investments, deposits by banks, customer accounts, debt securities in issue, subordinated liabilities and non-trading repurchase and reverse repurchase agreements are explained on pages 273 and 274 of the Annual Report and Accounts 2019.
| Fair values of financial instruments not carried at fair value on the balance sheet | ||||||||
| At 30 Jun 2020 | At 31 Dec 2019 | |||||||
| Carrying amount | Fair value | Carrying amount | Fair value | |||||
| $m | $m | $m | $m | |||||
| Assets | ||||||||
| Loans and advances to banks | 77,015 | 77,122 | 69,203 | 69,247 | ||||
| Loans and advances to customers | 1,018,681 | 1,018,036 | 1,036,743 | 1,037,543 | ||||
| Reverse repurchase agreements – non-trading | 226,345 | 226,402 | 240,862 | 240,906 | ||||
| Financial investments – at amortised cost | 89,781 | 96,434 | 85,735 | 89,061 | ||||
| Liabilities | ||||||||
| Deposits by banks | 82,715 | 82,718 | 59,022 | 58,951 | ||||
| Customer accounts | 1,532,380 | 1,533,284 | 1,439,115 | 1,439,512 | ||||
| Repurchase agreements – non-trading | 112,799 | 112,803 | 140,344 | 140,344 | ||||
| Debt securities in issue | 110,114 | 110,474 | 104,555 | 104,936 | ||||
| Subordinated liabilities | 23,621 | 26,599 | 24,600 | 29,246 | ||||
Other financial instruments not carried at fair value are typically short term in nature and reprice to current market rates frequently. Accordingly, their carrying amount is a reasonable approximation of fair value.
HSBC Holdings plc Interim Report 2020 | 111 |
Notes on the interim condensed financial statements (unaudited)
| 8 | Derivatives |
| Notional contract amounts and fair values of derivatives by product contract type held by HSBC | ||||||||||||||||
| Notional contract amount | Fair value amount | |||||||||||||||
| Assets and liabilities | Assets | Liabilities | ||||||||||||||
| Trading | Hedging | Trading | Hedging | Total | Trading | Hedging | Total | |||||||||
| $m | $m | $m | $m | $m | $m | $m | $m | |||||||||
| Foreign exchange | 7,383,599 | 36,888 | 83,704 | 366 | 84,070 | 84,600 | 729 | 85,329 | ||||||||
| Interest rate | 17,590,866 | 165,107 | 291,177 | 2,522 | 293,699 | 274,938 | 3,550 | 278,488 | ||||||||
| Equities | 648,250 | — | 10,697 | — | 10,697 | 11,836 | — | 11,836 | ||||||||
| Credit | 329,551 | — | 3,661 | — | 3,661 | 5,000 | — | 5,000 | ||||||||
| Commodity and other | 134,410 | — | 2,764 | — | 2,764 | 3,516 | — | 3,516 | ||||||||
| Gross total fair values | 26,086,676 | 201,995 | 392,003 | 2,888 | 394,891 | 379,890 | 4,279 | 384,169 | ||||||||
| Offset | (81,110 | ) | (81,110 | ) | ||||||||||||
| At 30 Jun 2020 | 26,086,676 | 201,995 | 392,003 | 2,888 | 313,781 | 379,890 | 4,279 | 303,059 | ||||||||
| Foreign exchange | 8,207,629 | 31,899 | 84,083 | 455 | 84,538 | 84,498 | 740 | 85,238 | ||||||||
| Interest rate | 17,895,349 | 177,006 | 183,668 | 1,208 | 184,876 | 175,095 | 2,031 | 177,126 | ||||||||
| Equities | 1,077,347 | — | 9,053 | — | 9,053 | 11,237 | — | 11,237 | ||||||||
| Credit | 345,644 | — | 4,744 | — | 4,744 | 5,597 | — | 5,597 | ||||||||
| Commodity and other | 93,245 | — | 1,523 | — | 1,523 | 2,038 | — | 2,038 | ||||||||
| Gross total fair values | 27,619,214 | 208,905 | 283,071 | 1,663 | 284,734 | 278,465 | 2,771 | 281,236 | ||||||||
| Offset | (41,739 | ) | (41,739 | ) | ||||||||||||
| At 31 Dec 2019 | 27,619,214 | 208,905 | 283,071 | 1,663 | 242,995 | 278,465 | 2,771 | 239,497 | ||||||||
The notional contract amounts of derivatives held for trading purposes and derivatives designated in qualifying hedge accounting relationships indicate the nominal value of transactions outstanding at the balance sheet date, not amounts at risk. Derivative assets and liabilities increased during 1H20, reflecting changes in yield curves and the market environment.
Derivatives valued using models with unobservable inputs
The following table shows the difference between the fair value at initial recognition, which is the transaction price, and the value that would have been derived had valuation techniques used for subsequent measurement been applied at initial recognition, less subsequent releases.
| Unamortised balance of derivatives valued using models with significant unobservable inputs | |||||||
| Half-year to | |||||||
| 30 Jun | 30 Jun | 31 Dec | |||||
| 2020 | 2019 | 2019 | |||||
| Footnotes | $m | $m | $m | ||||
| Unamortised balance at beginning of period | 73 | 86 | 99 | ||||
| Deferral on new transactions | 106 | 90 | 55 | ||||
| Recognised in the income statement during the period | (87 | ) | (78 | ) | (76 | ) | |
| – amortisation | (51 | ) | (36 | ) | (44 | ) | |
| – subsequent to unobservable inputs becoming observable | (1 | ) | (6 | ) | 3 | ||
| – maturity, termination or offsetting derivative | (35 | ) | (36 | ) | (35 | ) | |
| Exchange differences | (3 | ) | — | 1 | |||
| Other | — | 1 | (6 | ) | |||
| Unamortised balance at end of period | 1 | 89 | 99 | 73 | |||
| 1 | This amount is yet to be recognised in the consolidated income statement. |
Hedge accounting derivatives
The notional contract amounts of derivatives held for hedge accounting purposes indicate the nominal value of transactions outstanding at the balance sheet date, not amounts at risk.
| Notional contract amounts of derivatives held for hedging purposes by product type | ||||||||
| At 30 Jun 2020 | At 31 Dec 2019 | |||||||
Cash flow hedges | Fair value hedges | Cash flow hedges | Fair value hedges | |||||
| $m | $m | $m | $m | |||||
| Foreign exchange | 26,374 | 14 | 21,385 | 14 | ||||
| Interest rate | 39,590 | 125,517 | 54,253 | 122,753 | ||||
| Total | 65,964 | 125,531 | 75,638 | 122,767 | ||||
The Group applies hedge accounting in respect of certain consolidated net investments. Hedging is undertaken using forward foreign exchange contracts or by financing with foreign currency borrowings. At 30 June 2020, the notional contract values of outstanding financial instruments designated as hedges of net investments in foreign operations were $10,500m (31 December 2019: $10,500m).
| 112 | HSBC Holdings plc Interim Report 2020 |
| 9 | Financial investments |
| Carrying amounts of financial investments | |||||
| 30 Jun | 31 Dec | ||||
| 2020 | 2019 | ||||
| Footnotes | $m | $m | |||
| Financial investments measured at fair value through other comprehensive income | 404,328 | 357,577 | |||
| – treasury and other eligible bills | 130,389 | 95,043 | |||
| – debt securities | 271,859 | 260,536 | |||
| – equity securities | 1,997 | 1,913 | |||
| – other instruments | 1 | 83 | 85 | ||
| Debt instruments measured at amortised cost | 89,781 | 85,735 | |||
| – treasury and other eligible bills | 12,192 | 10,476 | |||
| – debt securities | 77,589 | 75,259 | |||
| At the end of the period | 494,109 | 443,312 | |||
| 1 | ‘Other instruments’ are comprised of loans and advances. |
| 10 | Interests in associates and joint ventures |
At 30 June 2020, the carrying amount of HSBC’s interests in associates and joint ventures was $24,800m (31 December 2019: $24,474m).
| Principal associates of HSBC | ||||||||
| At | ||||||||
| 30 Jun 2020 | 31 Dec 2019 | |||||||
Carrying amount | Fair value1 | Carrying amount | Fair value1 | |||||
| $m | $m | $m | $m | |||||
| Bank of Communications Co., Limited | 19,630 | 8,718 | 18,982 | 10,054 | ||||
| The Saudi British Bank | 4,139 | 3,644 | 4,370 | 5,550 | ||||
| 1 | Principal associates are listed on recognised stock exchanges. The fair values are based on the quoted market prices of the shares held (Level 1 in the fair value hierarchy). |
Bank of Communications Co., Limited
The Group’s investment in Bank of Communications Co. Limited (‘BoCom’) is classified as an associate. Significant influence in BoCom was established via representation on BoCom’s Board of Directors and participation in a Resource and Experience Sharing agreement (‘RES’). Under the RES, HSBC staff have been seconded to assist in the maintenance of BoCom’s financial and operating policies. Investments in associates are recognised using the equity method of accounting in accordance with IAS 28 whereby the investment is initially recognised at cost and adjusted thereafter for the post-acquisition change in the Group’s share of BoCom’s net assets. An impairment test is required if there is any indication of impairment.
Impairment testing
At 30 June 2020, the fair value of the Group’s investment in BoCom had been below the carrying amount for approximately eight years. As a result, the Group performed an impairment test on the carrying amount, which confirmed that there was no impairment at 30 June 2020 as the recoverable amount, as determined by a value-in-use (‘VIU’) calculation, was higher than the carrying value.
| At | ||||||||||||
| 30 Jun 2020 | 31 Dec 2019 | |||||||||||
| VIU | Carrying value | Fair value | VIU | Carrying value | Fair value | |||||||
| $bn | $bn | $bn | $bn | $bn | $bn | |||||||
| BoCom | 20.5 | 19.6 | 8.7 | 21.5 | 19.0 | 10.1 | ||||||
The decrease in VIU for the first half of 2020 was principally driven by BoCom's actual performance, which was lower than earlier forecasts due to the impact of the Covid-19 outbreak and the disruption to global economic activity, and downward revisions to management's best estimates of BoCom's future earnings.
In future periods, the VIU may increase or decrease depending on the effect of changes to model inputs. The main model inputs are described below and are based on factors observed at the period-end. The factors that could result in a change in the VIU and an impairment include a short-term underperformance by BoCom, a change in regulatory capital requirements, or an increase in uncertainty regarding the future performance of BoCom resulting in a downgrade of the future asset growth or profitability. An increase in the discount rate as a result of an increase in the risk premium or risk-free rates could also result in a reduction of VIU and an impairment. At the point where the carrying value exceeds the VIU, impairment would be recognised.
If the Group did not have significant influence in BoCom, the investment would be carried at fair value rather than the current carrying value.
HSBC Holdings plc Interim Report 2020 | 113 |
Notes on the interim condensed financial statements (unaudited)
Basis of recoverable amount
The impairment test was performed by comparing the recoverable amount of BoCom, determined by a VIU calculation, with its carrying amount. The VIU calculation uses discounted cash flow projections based on management’s best estimates of future earnings available to ordinary shareholders prepared in accordance with IAS 36. Significant management judgement is required in arriving at the best estimate. There are two main components to the VIU calculation. The first component is management’s best estimate of BoCom’s earnings, which is based on explicit forecasts over the short to medium term. This results in forecast earnings growth that is lower than recent historical actual growth and also reflects the uncertainty arising from the current economic outlook. Earnings beyond the short to medium term are then extrapolated in perpetuity using a long-term growth rate to derive a terminal value, which comprises the majority of the VIU. The second component is the capital maintenance charge (‘CMC’), which is management’s forecast of the earnings that need to be withheld in order for BoCom to meet regulatory capital requirements over the forecast period (i.e. CMC is deducted when arriving at management’s estimate of future earnings available to ordinary shareholders). The principal inputs to the CMC calculation include estimates of asset growth, the ratio of risk-weighted assets to total assets and the expected minimum regulatory capital requirements. An increase in the CMC as a result of a change to these principal inputs would reduce VIU. Additionally, management considers other factors (including qualitative factors) to ensure that the inputs to the VIU calculation remain appropriate.
Key assumptions in value-in-use calculation
We used a number of assumptions in our VIU calculation, in accordance with the requirements of IAS 36:
| • | Long-term profit growth rate: 3% (31 December 2019: 3%) for periods after 2023, which does not exceed forecast GDP growth in mainland China and is consistent with forecasts by external analysts. |
| • | Long-term asset growth rate: 3% (31 December 2019: 3%) for periods after 2023, which is the rate that assets are expected to grow to achieve long-term profit growth of 3%. |
| • | Discount rate: 11.24% (31 December 2019: 11.24%), which is based on a capital asset pricing model (‘CAPM’) calculation for BoCom, using market data. Management also compares the rate derived from the CAPM with discount rates from external sources. The discount rate used is within the range of 10.3% to 15.0% (31 December 2019: 10.0% to 15.0%) indicated by external sources. |
| • | Expected credit losses as a percentage of customer advances: ranges from 0.95% to 1.10% (31 December 2019: 0.95%) in the short to medium term, reflecting increases due to the Covid-19 outbreak and BoCom's actual results. For periods after 2023, the ratio is 0.76% (31 December 2019: 0.76%), which is slightly higher than the historical average. |
| • | Risk-weighted assets as a percentage of total assets: ranges from 61% to 62% (31 December 2019: 61%) in the short to medium term, reflecting increases that may arise from higher expected credit losses as a percentage of customer advances. For periods after 2023, the ratio is 61% (31 December 2019: 61%). These rates are similar to BoCom’s actual results in recent years and forecasts disclosed by external analysts. |
| • | Operating income: ranges from 1.3% to 6.2% (31 December 2019: 4.9% to 9.4%) in the short to medium term, and are lower than BoCom’s actual results in recent years and the forecasts disclosed by external analysts, reflecting pressures from the Covid-19 outbreak and industry developments in mainland China. |
| • | Cost-income ratio: ranges from 36.2% to 36.6% (31 December 2019: 37.1% to 38.8%) in the short to medium term. These rates are similar to BoCom's actual results and slightly higher than the forecasts disclosed by external analysts. |
| • | Effective tax rate: ranges from 11.0% to 17.9% (31 December 2019:12.0% to 17.0%) in the short to medium term, reflecting BoCom's actual results and an expected increase towards the long-term assumption. For periods after 2023, the rate is 22.5% (31 December 2019: 22.5%), which is slightly higher than the historical average. |
| • | Capital requirements: Capital adequacy ratio: 11.5% (31 December 2019: 11.5%) and tier 1 capital adequacy ratio: 9.5% (31 December 2019: 9.5%), based on the minimum regulatory requirements. |
The following table shows the change to each key assumption in the VIU calculation that on its own would reduce the headroom to nil:
| Key assumption | Changes to key assumption to reduce headroom to nil |
• Long-term profit growth rate | Decrease by 36 basis points |
• Long-term asset growth rate | Increase by 32 basis points |
• Discount rate | Increase by 41 basis points |
• Expected credit losses as a percentage of customer advances | Increase by 6 basis points |
• Risk-weighted assets as a percentage of total assets | Increase by 234 basis points |
• Operating income | Decrease by 62 basis points |
• Cost-income ratio | Increase by 139 basis points |
• Long-term effective tax rate | Increase by 320 basis points |
• Capital requirements – capital adequacy ratio | Increase by 44 basis points |
• Capital requirements – tier 1 capital adequacy ratio | Increase by 137 basis points |
The following table further illustrates the impact on VIU of reasonably possible changes to key assumptions. This reflects the sensitivity of the VIU to each key assumption on its own and it is possible that more than one favourable and/or unfavourable change may occur at the same time. The selected rates of reasonably possible changes to key assumptions are largely based on external analysts’ forecasts, which can change period to period.
| 114 | HSBC Holdings plc Interim Report 2020 |
| Sensitivity of VIU to reasonably possible changes in key assumptions | |||||||||||||
| Favourable change | Unfavourable change | ||||||||||||
| Increase in VIU | VIU | Decrease in VIU | VIU | ||||||||||
| bps | $bn | $bn | bps | $bn | $bn | ||||||||
| At 30 Jun 2020 | |||||||||||||
| Long-term profit growth rate | — | — | 20.5 | (50 | ) | (1.2 | ) | 19.3 | |||||
| Long-term asset growth rate | (50 | ) | 1.3 | 21.8 | — | — | 20.5 | ||||||
| Discount rate | (24 | ) | 0.6 | 21.1 | 86 | (1.8 | ) | 18.7 | |||||
| Expected credit losses as a percentage of customer advances | 2020 to 2023: 93 2024 onwards: 75 | 0.5 | 21.0 | 2020 to 2023: 108 2024 onwards: 92 | (2.2 | ) | 18.3 | ||||||
| Risk-weighted assets as a percentage of total assets | (190 | ) | 0.5 | 21.0 | 93 | (0.5 | ) | 20.0 | |||||
| Operating income | 64 | 1.0 | 21.5 | (69 | ) | (0.9 | ) | 19.6 | |||||
| Cost-income ratio | (205 | ) | 1.5 | 22.0 | 179 | (1.3 | ) | 19.2 | |||||
| Long-term effective tax rate | (433 | ) | 1.2 | 21.7 | 250 | (0.7 | ) | 19.8 | |||||
| Capital requirements – capital adequacy ratio | — | — | 20.5 | 266 | (6.0 | ) | 14.5 | ||||||
| Capital requirements – tier 1 capital adequacy ratio | — | — | 20.5 | 289 | (4.5 | ) | 16.0 | ||||||
| At 31 Dec 2019 | |||||||||||||
| Long-term profit growth rate | — | — | 21.5 | (50 | ) | (1.3 | ) | 20.2 | |||||
| Long-term asset growth rate | (50 | ) | 1.4 | 22.9 | — | — | 21.5 | ||||||
| Discount rate | (54 | ) | 1.4 | 22.9 | 56 | (1.2 | ) | 20.3 | |||||
| Expected credit losses as a percentage of customer advances | 2019 to 2023: 90 2024 onwards: 70 | 1.0 | 22.5 | 2019 to 2023: 108 2024 onwards: 81 | (1.2 | ) | 20.3 | ||||||
| Risk-weighted assets as a percentage of total assets | (96 | ) | 0.4 | 21.9 | 12 | — | 21.5 | ||||||
| Operating income | 14 | 0.3 | 21.8 | (102 | ) | (1.8 | ) | 19.7 | |||||
| Cost-income ratio | (175 | ) | 1.0 | 22.5 | 95 | (1.2 | ) | 20.3 | |||||
| Long-term effective tax rate | (352 | ) | 1.0 | 22.5 | 250 | (0.7 | ) | 20.8 | |||||
| Capital requirements – capital adequacy ratio | — | — | 21.5 | 337 | (8.2 | ) | 13.3 | ||||||
| Capital requirements – tier 1 capital adequacy ratio | — | — | 21.5 | 322 | (6.0 | ) | 15.5 | ||||||
Considering the interrelationship of the changes set out in the table above, management estimates that the reasonably possible range of VIU is $17.3bn to $21.9bn (31 December 2019: $18.5bn to $22.8bn). The range is based on the favourable/unfavourable change in the earnings in the short to medium term and long-term expected credit losses as a percentage of customer advances, as set out in the table above. All other long-term assumptions, the discount rate and the basis of the CMC have been kept unchanged when determining the reasonably possible range of the VIU.
The Saudi British Bank
The Group’s investment in The Saudi British Bank (‘SABB’) is classified as an associate. In June 2019, the merger between SABB and Alawwal bank (‘Alawwal’) became effective, which reduced HSBC’s 40% interest in SABB to 29.2%. HSBC remained the largest shareholder in SABB. Significant influence in SABB is established via representation on the Board of Directors. Investments in associates are recognised using the equity method of accounting in accordance with IAS 28, as described previously for BoCom.
Impairment testing
SABB’s share price has declined during the period due to oil price volatility and global economic uncertainty arising from the Covid-19 outbreak. At 30 June 2020, the fair value of the Group’s investment in SABB ($3.6bn) was below the carrying amount ($4.1bn). As a result, the Group performed an impairment test on the carrying amount, which confirmed no impairment. However, the recoverable amount as determined by a VIU calculation indicated no remaining headroom.
If SABB generates lower profitability (relative to historical trends) over the medium term, there is a risk that our investment in SABB could become impaired.
The basis of recoverable amount
The impairment test was performed by comparing the recoverable amount of SABB, determined by a VIU calculation, with its carrying amount. The VIU calculation uses discounted cash flow projections based on management’s best estimates of future earnings available to ordinary shareholders prepared in accordance with IAS 36, which requires significant management judgement. A key component to the VIU calculation is management’s best estimate of SABB’s earnings, which is based on explicit forecasts over the short to medium term. This reflects the uncertainty arising from the current economic outlook. Earnings beyond the short to medium term are then extrapolated in perpetuity using a long-term growth rate to derive a terminal value, which comprises the majority of the VIU. Additionally, management considers other factors (including qualitative factors) to ensure that the inputs to the VIU calculation remain appropriate.
Key assumptions in value-in-use calculation
We used a number of assumptions in our VIU calculation, in accordance with the requirements of IAS 36:
| • | Long-term profit growth rate: 2.55% for periods after 2023. This does not exceed forecast GDP growth in Saudi Arabia. |
| • | Long-term asset growth rate: 2.55% for periods after 2023. This is the rate that assets are expected to grow to achieve long-term profit growth of 2.55%. |
| • | Discount rate: 10.2%. This is based on a CAPM calculation for Saudi Arabia using market data. Management also compares the rate derived from the CAPM with cost of capital rates from external sources. |
| • | Management’s judgement in estimating the cash flows of SABB: Cash flow projections have considered the scale of the entity following the merger with Alawwal, current market conditions and our macroeconomic outlook. |
HSBC Holdings plc Interim Report 2020 | 115 |
Notes on the interim condensed financial statements (unaudited)
Sensitivity of VIU to reasonably possible changes in key assumptions
At 30 June 2020, the Group’s investment in SABB was sensitive to reasonably possible adverse changes in key assumptions supporting the recoverable amount. The most sensitive inputs to the impairment test are set out in the following table.
| Input | Reasonably possible change |
• Cash flow projections | Cash flow projections decrease by 5%. This could result in an impairment of $0.1bn. |
• Discount rate | Discount rate increases by 50bps. This could result in an impairment of $0.1bn. |
| 11 | Goodwill and intangible assets |
| 30 Jun | 31 Dec | ||||
| 2020 | 2019 | ||||
| Footnotes | $m | $m | |||
| Goodwill | 5,482 | 5,590 | |||
| Present value of in-force long-term insurance business | 9,379 | 8,945 | |||
| Other intangible assets | 1 | 4,577 | 5,628 | ||
| At the end of the period | 19,438 | 20,163 | |||
| 1 | Included within other intangible assets is capitalised software with a net carrying amount of $3,861m (31 December 2019: $4,829m). |
We considered the pervasive macroeconomic deterioration caused by the outbreak of Covid-19, along with the impact on forecast profitability in some businesses, to be an indicator of goodwill and capitalised software impairment. As a result, interim impairment tests were performed at 30 June 2020.
Goodwill
Impairment test at 30 June 2020
An interim impairment test was performed by comparing the estimated recoverable amount of a cash generating unit (‘CGU’) carrying goodwill, determined by a VIU calculation, with its carrying amount. At 30 June 2020, the goodwill allocated to Middle East and North Africa – WPB ($41m) was fully impaired.
As disclosed on page 290 of our Annual Report and Accounts 2019, a reasonable change in a single key assumption would not result in impairment of goodwill in our former Europe – RBWM CGU. Though taken together, a combination of reasonable changes in forecast cash flows (30% decrease) and an increase in the discount rate (by 100bps) could result in a recoverable amount that is lower than the CGU’s carrying amount. The sensitivity profile of our new Europe – WPB CGU at 30 June 2020 is the same. Details regarding our change in global businesses are set out in Note 5.
No other CGUs are sensitive to changes in key assumptions that would result in impairment.
Other intangible assets
Impairment test at 30 June 2020
An impairment test was performed at 30 June 2020 by comparing the net carrying amount of capitalised software assets with their recoverable amounts. Recoverable amounts were determined by calculating an estimated VIU or fair value, as appropriate, for each underlying business that carries software assets. Our cash flow forecasts have been updated for changes in the external outlook, although current economic and geopolitical risks increase the inherent estimation uncertainty.
We recognised $1.2bn of capitalised software impairment related principally to businesses within HSBC Bank plc, our non-ring-fenced bank in Europe. This impairment reflected underperformance and deterioration in the future forecasts of these businesses, substantially relating to prior periods.
Key assumptions in VIU calculation
We used a number of assumptions in our VIU calculation, in accordance with the requirements of IAS 36:
| • | Management’s judgement in estimating future cash flows: We considered past business performance, the scale of the current impact from the Covid-19 outbreak on our operations, current market conditions and our macroeconomic outlook to estimate future earnings. As required by IFRSs, estimates of future cash flows exclude estimated cash inflows or outflows that are expected to arise from restructuring initiatives before an entity has a constructive obligation to carry out the plan, and would therefore have recognised a provision for restructuring costs. For some businesses, this means that the benefit of certain strategic actions are not included in this impairment assessment, including capital releases. |
| • | Long-term growth rates: The long-term growth rate is used to extrapolate the cash flows in perpetuity because of the long-term perspective of the businesses within the Group. Rates do not exceed forecast inflation for the countries and territories within which the Group operates. |
| • | Discount rates: Rates are based on a CAPM calculation considering market data for the businesses and geographies in which the Group operates. Discount rates ranged from 8.5% to 9.7% for HSBC Bank plc's businesses. |
Future software capitalisation
We will continue to invest in digital capabilities to meet our strategic objectives. However, software capitalisation within businesses where impairment was identified will not resume until the performance outlook for each business indicates future profits are sufficient to support capitalisation. The cost of additional software investment in these businesses will be recognised as an operating expense until such time.
| 116 | HSBC Holdings plc Interim Report 2020 |
| 12 | Provisions |
| Restructuring costs | Legal proceedings and regulatory matters | Customer remediation | Other provisions | Total | |||||||
| Footnotes | $m | $m | $m | $m | $m | ||||||
| Provisions (excluding contractual commitments) | |||||||||||
| At 31 Dec 2019 | 356 | 605 | 1,646 | 280 | 2,887 | ||||||
| Additions | 103 | 20 | 75 | 109 | 307 | ||||||
| Amounts utilised | (128 | ) | (70 | ) | (436 | ) | (91 | ) | (725 | ) | |
| Unused amounts reversed | (38 | ) | (29 | ) | (38 | ) | (44 | ) | (149 | ) | |
| Exchange and other movements | (58 | ) | (8 | ) | (99 | ) | 25 | (140 | ) | ||
| At 30 Jun 2020 | 235 | 518 | 1,148 | 279 | 2,180 | ||||||
| Contractual commitments | 1 | ||||||||||
| At 31 Dec 2019 | 511 | ||||||||||
| Net change in expected credit loss provision and other movements | 518 | ||||||||||
| At 30 Jun 2020 | 1,029 | ||||||||||
| Total provisions | |||||||||||
| At 31 Dec 2019 | 3,398 | ||||||||||
| At 30 Jun 2020 | 3,209 | ||||||||||
| 1 | The contractual commitments provision includes off-balance sheet loan commitments and guarantees, for which expected credit losses are provided under IFRS 9. |
Further details of ‘Legal proceedings and regulatory matters’ are set out in Note 14. Legal proceedings include civil court, arbitration or tribunal proceedings brought against HSBC companies (whether by way of claim or counterclaim); or civil disputes that may, if not settled, result in court, arbitration or tribunal proceedings. ‘Regulatory matters’ refers to investigations, reviews and other actions carried out by, or in response to, the actions of regulators or law enforcement agencies in connection with alleged wrongdoing by HSBC.
Customer remediation refers to HSBC’s activities to compensate customers for losses or damages associated with a failure to comply with regulations or to treat customers fairly. Customer remediation is often initiated by HSBC in response to customer complaints and/or industry developments in sales practices, and is not necessarily initiated by regulatory action. Further details of customer remediation are set out in this note.
Further disclosure on ‘ECL on undrawn loan commitments and financial guarantees’ can be found in the ‘Credit risk’ section of the ‘Interim management report’ on page 56.
Payment protection insurance
At 30 June 2020, $613m (31 December 2019: $1.1bn) of the customer remediation provision relates to the estimated liability for redress in respect of the possible mis-selling of PPI policies in previous years. Payments totalling $376m were made during the first six months of 2020.
At 30 June 2020, contact was made with customers who collectively held 3.0 million policies, representing 56% of total policies sold. A total of 5.4 million PPI policies have been sold since 2000, generating estimated revenue of $3.2bn at 30 June 2020. The gross written premiums on these policies were approximately $4.2bn.
As at 30 June 2020, there were an estimated 42,700 complaints still requiring assessment. Historical claim handling processes are monitored on a regular basis, and there remains potential for this review process to lead to additional rework costs in the future. Although the deadline for bringing complaints has passed, customers can still commence litigation for PPI mis-selling. Provision has been made for the best estimate of any obligation to pay compensation in respect of an estimated 43,000 future claims. However, the volume and quality of future claims through legal channels, and the amount of any compensation to be paid, remain uncertain. The provision also includes claims made by the Official Receiver to pursue redress amounts in respect of bankrupt and insolvent customers.
The estimated liability for redress for both single and regular premium policies is calculated on the basis of a refund of the total premiums paid by the customer plus simple interest of 8% per annum (or the rate inherent to the related loan product where higher). Further estimated redress levels are based on historical redress paid to customers per policy.
The PPI provision is based upon assumptions and estimates taken from historical experience. The profile of cases yet to be assessed, whether those submitted prior to the complaints deadline or subsequently via the legal channels, could therefore vary, leading to different uphold rates or average redress levels being used to arrive at the provision.
We continued to monitor available information up until the date of the approval of the financial statements to ensure that the provision estimate was appropriate.
Sensitivity to key assumptions
An increase/decrease in customer redress volumes of 10,000 received through legal channels would increase/decrease the redress provision by approximately $16m, based on observed settlement rates and average redress during the first half of 2020.
HSBC Holdings plc Interim Report 2020 | 117 |
Notes on the interim condensed financial statements (unaudited)
| 13 | Contingent liabilities, contractual commitments and guarantees |
| At | |||||
| 30 Jun | 31 Dec | ||||
| 2020 | 2019 | ||||
| Footnotes | $m | $m | |||
| Guarantees and contingent liabilities: | |||||
| – financial guarantees | 18,328 | 20,214 | |||
| – performance and other guarantees | 73,078 | 75,933 | |||
| – other contingent liabilities | 1,094 | 1,576 | |||
| At the end of the period | 92,500 | 97,723 | |||
| Commitments: | 1 | ||||
| – documentary credits and short-term trade-related transactions | 6,201 | 6,316 | |||
| – forward asset purchases and forward deposits placed | 91,849 | 56,326 | |||
| – standby facilities, credit lines and other commitments to lend | 740,023 | 734,966 | |||
At the end of the period | 838,073 | 797,608 | |||
| 1 | Includes $648,156m of commitments at 30 June 2020 (31 December 2019: $600,029m), to which the impairment requirements in IFRS 9 are applied where HSBC has become party to an irrevocable commitment. |
The preceding table discloses the nominal principal amounts of off-balance sheet liabilities and commitments for the Group, which represent the maximum amounts at risk should the contracts be fully drawn upon and the clients default. As a significant portion of guarantees and commitments are expected to expire without being drawn upon, the total of the nominal principal amounts is not indicative of future liquidity requirements. The expected credit loss provision relating to guarantees and commitments under IFRS 9 is disclosed in Note 12.
The majority of the guarantees have a term of less than one year, while guarantees with terms of more than one year are subject to HSBC’s annual credit review process.
Contingent liabilities arising from legal proceedings, regulatory and other matters against Group companies are disclosed in Notes 12
and 14.
and 14.
| 14 | Legal proceedings and regulatory matters |
HSBC is party to legal proceedings and regulatory matters in a number of jurisdictions arising out of its normal business operations. Apart from the matters described below, HSBC considers that none of these matters are material. The recognition of provisions is determined in accordance with the accounting policies set out in Note 1 of the Annual Report and Accounts 2019. While the outcomes of legal proceedings and regulatory matters are inherently uncertain, management believes that, based on the information available to it, appropriate provisions have been made in respect of these matters as at 30 June 2020 (see Note 12). Where an individual provision is material, the fact that a provision has been made is stated and quantified, except to the extent that doing so would be seriously prejudicial. Any provision recognised does not constitute an admission of wrongdoing or legal liability. It is not practicable to provide an aggregate estimate of potential liability for our legal proceedings and regulatory matters as a class of contingent liabilities.
Bernard L. Madoff Investment Securities LLC
Bernard L. Madoff (‘Madoff’) was arrested in December 2008 and later pleaded guilty to running a Ponzi scheme. His firm, Bernard L. Madoff Investment Securities LLC (‘Madoff Securities’), is being liquidated in the US by a trustee (the ‘Trustee’).
Various non-US HSBC companies provided custodial, administration and similar services to a number of funds incorporated outside the US whose assets were invested with Madoff Securities. Based on information provided by Madoff Securities as at 30 November 2008, the purported aggregate value of these funds was $8.4bn, including fictitious profits reported by Madoff.
Based on information available to HSBC, the funds’ actual transfers to Madoff Securities minus their actual withdrawals from Madoff Securities during the time HSBC serviced the funds are estimated to have totalled approximately $4bn. Various HSBC companies have been named as defendants in lawsuits arising out of Madoff Securities’ fraud.
US litigation: The Trustee has brought lawsuits against various HSBC companies and others in the US Bankruptcy Court for the Southern District of New York (the ‘US Bankruptcy Court’), seeking recovery of transfers from Madoff Securities to HSBC in an amount not yet pleaded or determined. HSBC and other parties to the actions have moved to dismiss the Trustee’s claims. The US Bankruptcy Court granted HSBC’s motion to dismiss with respect to certain of the Trustee’s claims in November 2016. In February 2019, the US Court of Appeals for the Second Circuit (the ‘Second Circuit Court of Appeals’) reversed that dismissal. Following the US Supreme Court’s denial of certiorari in June 2020, the cases were remanded to the US Bankruptcy Court, where they are now pending.
Fairfield Sentry Limited, Fairfield Sigma Limited and Fairfield Lambda Limited (together, ‘Fairfield’) (in liquidation since July 2009) have brought a lawsuit in the US against fund shareholders, including HSBC companies that acted as nominees for clients, seeking restitution of redemption payments. In December 2018, the US Bankruptcy Court issued an opinion, which ruled in favour of the defendants’ motion to dismiss in respect of certain claims by the liquidators for Fairfield and granted a motion by the liquidators to file amended complaints. As a result of that opinion, all claims against one of the HSBC companies were dismissed, and certain claims against the remaining HSBC defendants were also dismissed. In May 2019, the liquidators appealed certain issues from the US Bankruptcy Court to the US District Court for the Southern District of New York (the ’New York District Court’) and, in January 2020, the liquidators filed amended complaints on the claims remaining in the US Bankruptcy Court. In March 2020, HSBC and other parties to the action moved to dismiss the amended complaints in the US Bankruptcy Court.
UK litigation: The Trustee has filed a claim against various HSBC companies in the High Court of England and Wales, seeking recovery of transfers from Madoff Securities to HSBC in an amount not yet pleaded or determined. The deadline for service of the claim has been extended to September 2020 for UK-based defendants and November 2020 for all other defendants.
| 118 | HSBC Holdings plc Interim Report 2020 |
Cayman Islands litigation: In February 2013, Primeo Fund (‘Primeo’) (in liquidation since April 2009) brought an action against HSBC Securities Services Luxembourg (‘HSSL’) and Bank of Bermuda (Cayman) Limited (now known as HSBC Cayman Limited), alleging breach of contract and breach of fiduciary duty and claiming damages and equitable compensation. The trial concluded in February 2017 and, in August 2017, the court dismissed all claims against the defendants. In September 2017, Primeo appealed to the Court of Appeal of the Cayman Islands and, in June 2019, the Court of Appeal of the Cayman Islands dismissed Primeo’s appeal. In August 2019, Primeo filed a notice of appeal to the UK Privy Council, which has listed the hearing for April 2021.
Luxembourg litigation: In April 2009, Herald Fund SPC (‘Herald’) (in liquidation since July 2013) brought an action against HSSL before the Luxembourg District Court, seeking restitution of cash and securities that Herald purportedly lost because of Madoff Securities’ fraud, or money damages. The Luxembourg District Court dismissed Herald’s securities restitution claim, but reserved Herald’s cash restitution claim and its claim for money damages. Herald has appealed this judgment to the Luxembourg Court of Appeal, where the matter is pending. In late 2018, Herald brought additional claims against HSSL and HSBC Bank plc before the Luxembourg District Court, seeking further restitution and damages.
In October 2009, Alpha Prime Fund Limited (‘Alpha Prime’) brought an action against HSSL before the Luxembourg District Court, seeking the restitution of securities, or the cash equivalent, or money damages. In December 2018, Alpha Prime brought additional claims before the Luxembourg District Court seeking damages against various HSBC companies. These matters are currently pending before the Luxembourg District Court.
In December 2014, Senator Fund SPC (‘Senator’) brought an action against HSSL before the Luxembourg District Court, seeking restitution of securities, or the cash equivalent, or money damages. In April 2015, Senator commenced a separate action against the Luxembourg branch of HSBC Bank plc asserting identical claims before the Luxembourg District Court. In December 2018, Senator brought additional claims against HSSL and HSBC Bank plc Luxembourg branch before the Luxembourg District Court, seeking restitution of Senator’s securities or money damages. These matters are currently pending before the Luxembourg District Court.
Ireland litigation: In November 2013, Defender Limited brought an action against HSBC Institutional Trust Services (Ireland) Limited (‘HTIE’) and others, based on allegations of breach of contract and claiming damages and indemnification for fund losses. The trial commenced in October 2018. In December 2018, the Irish High Court issued a judgment in HTIE’s favour on a preliminary issue, holding that Defender Limited had no effective claim against HTIE. This judgment concluded the trial without further issues in dispute being heard. In February 2019, Defender Limited appealed the decision. In July 2020, the Irish Supreme Court ruled in part in favour of Defender Limited and returned the case to the High Court for further proceedings.
There are many factors that may affect the range of possible outcomes, and any resulting financial impact, of the various Madoff-related proceedings described above, including but not limited to the multiple jurisdictions in which the proceedings have been brought. Based upon the information currently available, management’s estimate of the possible aggregate damages that might arise as a result of all claims in the various Madoff-related proceedings is up to or exceeding $500m, excluding costs and interest. Due to uncertainties and limitations of this estimate, any possible damages that might ultimately arise could differ significantly from this amount.
Anti-money laundering and sanctions-related matters
In December 2012, among other agreements, HSBC Holdings agreed to an undertaking with the UK Financial Services Authority, which was replaced by a Direction issued by the UK Financial Conduct Authority (‘FCA’) in 2013, and again in July 2020, and consented to a cease-and-desist order with the US Federal Reserve Board (‘FRB’), both of which contained certain forward-looking anti-money laundering (‘AML’) and sanctions-related obligations. HSBC also agreed to retain an independent compliance monitor (who is, for FCA purposes, a ‘Skilled Person’ under section 166 of the Financial Services and Markets Act and, for FRB purposes, an ‘Independent Consultant’) to produce periodic assessments of the Group’s AML and sanctions compliance programme (the ‘Skilled Person/Independent Consultant’). In December 2012, HSBC Holdings also entered into an agreement with the Office of Foreign Assets Control (‘OFAC’) regarding historical transactions involving parties subject to OFAC sanctions. HSBC’s engagement with the Skilled Person appointed pursuant to the 2013 Direction was terminated in February 2020 and a new Skilled Person with a narrower mandate has been appointed to assess the remaining areas that require further work in order for HSBC to transition fully to business-as-usual financial crime risk management. The Independent Consultant will continue to carry out an annual OFAC compliance review at the FRB’s discretion. The role of the Skilled Person/Independent Consultant is discussed on page 145 of the Annual Report and Accounts 2019.
Through the Skilled Person/Independent Consultant’s prior reviews, as well as internal reviews conducted by HSBC, certain potential AML and sanctions compliance issues have been identified that HSBC is reviewing further with the FRB, FCA and/or OFAC. The Financial Crimes Enforcement Network of the US Treasury Department, as well as the Civil Division of the US Attorney’s Office for the Southern District of New York, are investigating the collection and transmittal of third-party originator information in certain payments instructed over HSBC’s proprietary payment systems. The FCA is also conducting an investigation into HSBC Bank plc’s and HSBC UK Bank plc’s compliance with UK money laundering regulations and financial crime systems and controls requirements. HSBC is cooperating with all of these investigations.
In May 2014, a shareholder derivative action was filed by a shareholder of HSBC Holdings purportedly on behalf of HSBC Holdings, HSBC Bank USA N.A. (‘HSBC Bank USA’), HSBC North America Holdings Inc. and HSBC USA Inc. (the ‘Nominal Corporate Defendants’) in New York state court against certain current and former directors and officers of the Nominal Corporate Defendants (the ‘Individual Defendants’). The complaint alleges that the Individual Defendants breached their fiduciary duties to the Nominal Corporate Defendants and caused a waste of corporate assets by allegedly permitting and/or causing the conduct underlying the five-year deferred prosecution agreement with the US Department of Justice (‘DoJ’), entered into in December 2012. In November 2015, the New York state court granted the Nominal Corporate Defendants’ motion to dismiss, but the appellate court reversed the decision in November 2018 and reinstated the action. In June 2020, the parties reached an agreement to resolve this derivative action. In July 2020, the court granted preliminary approval of the settlement, under which HSBC will receive a payment from directors and officers liability insurance carriers and will continue for a period of time certain corporate governance practices. The final settlement approval hearing has been scheduled for October 2020.
Since November 2014, a number of lawsuits have been filed in federal courts in the US against various HSBC companies and others on behalf of plaintiffs who are, or are related to, victims of terrorist attacks in the Middle East or of cartel violence in Mexico. In each case, it is alleged that the defendants aided and abetted the unlawful conduct of various sanctioned parties in violation of the US Anti-Terrorism Act. Currently, 10 actions remain pending in federal courts in New York or the District of Columbia. In March, September and October 2019, the courts granted HSBC’s motions to dismiss in three of these cases. The plaintiffs have appealed the decisions in two of these cases and are seeking certification to appeal in the third case. HSBC has filed motions to dismiss in three further cases, two of which were granted in June 2020, while the third remains pending. The four remaining actions are at a very early stage.
HSBC Holdings plc Interim Report 2020 | 119 |
Notes on the interim condensed financial statements (unaudited)
Based on the facts currently known, it is not practicable at this time for HSBC to predict the resolution of these matters, including the timing or any possible impact on HSBC, which could be significant.
London interbank offered rates, European interbank offered rates and other benchmark interest rate investigations and litigation
Euro interest rate derivatives: In December 2016, the European Commission (the ‘EC’) issued a decision finding that HSBC, among other banks, engaged in anti-competitive practices in connection with the pricing of euro interest rate derivatives in early 2007. The EC imposed a fine on HSBC based on a one-month infringement. HSBC appealed the decision and, in September 2019, the General Court of the European Union (the ‘General Court’) issued a decision largely upholding the EC’s findings on liability but annulling the fine. HSBC and the EC have both appealed the General Court’s decision to the European Court of Justice.
US dollar Libor: Beginning in 2011, HSBC and other panel banks have been named as defendants in a number of private lawsuits filed in the US with respect to the setting of US dollar Libor. The complaints assert claims under various US laws, including US antitrust and racketeering laws, the US Commodity Exchange Act (‘US CEA’) and state law. The lawsuits include individual and putative class actions, most of which have been transferred and/or consolidated for pre-trial purposes before the New York District Court.
In 2017 and 2018, HSBC reached agreements with plaintiffs to resolve putative class actions brought on behalf of the following five groups of plaintiffs: persons who purchased US dollar Libor-indexed bonds; persons who purchased US dollar Libor-indexed exchange-traded instruments; US-based lending institutions that made or purchased US dollar Libor-indexed loans (the ‘Lender class’); persons who purchased US dollar Libor-indexed interest rate swaps and other instruments directly from the defendant banks and their affiliates (the ‘OTC class’); and persons who purchased US dollar Libor-indexed interest rate swaps and other instruments from certain financial institutions that are not the defendant banks or their affiliates. During 2018, the New York District Court granted final approval of the settlements with the OTC and Lender classes. The remaining settlements are subject to final court approval. Additionally, a number of other US dollar Libor-related actions remain pending against HSBC in the New York District Court and the Second Circuit Court of Appeals.
Intercontinental Exchange (‘ICE’) Libor: Between January and March 2019, HSBC and other panel banks were named as defendants in three putative class actions filed in the New York District Court on behalf of persons and entities who purchased instruments paying interest indexed to US dollar ICE Libor from a panel bank. The complaints allege, among other things, misconduct related to the suppression of this benchmark rate in violation of US antitrust and state law. In July 2019, the three putative class actions were consolidated, and the plaintiffs filed a consolidated amended complaint. In March 2020, the court granted the defendants’ joint motion to dismiss in its entirety. The plaintiffs have appealed.
Singapore interbank offered rate (‘Sibor’), Singapore swap offer rate (‘SOR’) and Australia bank bill swap rate (‘BBSW’):
In July and August 2016, HSBC and other panel banks were named as defendants in two putative class actions filed in the New York District Court on behalf of persons who transacted in products related to the Sibor, SOR and BBSW benchmark rates. The complaints allege, among other things, misconduct related to these benchmark rates in violation of US antitrust, commodities and racketeering laws, and state law.
In July and August 2016, HSBC and other panel banks were named as defendants in two putative class actions filed in the New York District Court on behalf of persons who transacted in products related to the Sibor, SOR and BBSW benchmark rates. The complaints allege, among other things, misconduct related to these benchmark rates in violation of US antitrust, commodities and racketeering laws, and state law.
In the Sibor/SOR litigation, following a decision on the defendants’ motion to dismiss in October 2018, the claims against a number of HSBC entities were dismissed, and The Hongkong and Shanghai Banking Corporation Limited (‘HBAP’) remained as the only HSBC defendant in this action. In October 2018, HBAP filed a motion for reconsideration of the decision based on the issue of personal jurisdiction. This motion was denied in April 2019. Also in October 2018, the plaintiffs filed a third amended complaint naming only the Sibor panel members, including HBAP, as defendants. The court dismissed the third amended complaint in its entirety in July 2019 against all defendants. In August 2019, the plaintiffs filed an appeal to the Second Circuit Court of Appeals, which remains pending.
In the BBSW litigation, in November 2018, the court dismissed all foreign defendants, including all the HSBC entities, on personal jurisdiction grounds. In April 2019, the plaintiffs filed an amended complaint, which the defendants moved to dismiss. In February 2020, the court again dismissed the plaintiffs’ amended complaint against all the HSBC entities.
There are many factors that may affect the range of outcomes, and the resulting financial impact, of these matters, which could be significant.
Foreign exchange-related investigations and litigation
Various regulators and competition authorities around the world, including in the EU, Brazil and South Africa, are conducting investigations and reviews into trading by HSBC and others on the foreign exchange markets. HSBC is cooperating with these investigations and reviews.
In January 2018, HSBC Holdings entered into a three-year deferred prosecution agreement with the Criminal Division of the DoJ (the ‘FX DPA’), regarding fraudulent conduct in connection with two particular transactions in 2010 and 2011. This concluded the DoJ’s investigation into HSBC’s historical foreign exchange activities. Under the terms of the FX DPA, HSBC has a number of ongoing obligations, including implementing enhancements to its internal controls and procedures in its Global Markets business, which will be the subject of annual reports to the DoJ. In addition, HSBC agreed to pay a financial penalty and restitution.
In December 2016, Brazil’s Administrative Council of Economic Defense initiated an investigation into the onshore foreign exchange market and identified a number of banks, including HSBC, as subjects of its investigation.
In June 2020, the Competition Commission of South Africa, having initially referred a complaint for proceedings before the South African Competition Tribunal in February 2017, filed a revised complaint against 28 financial institutions, including HSBC Bank plc and HSBC Bank USA, for alleged anti-competitive behaviour in the South African foreign exchange market.
In October 2018, HSBC Holdings and HSBC Bank plc received an information request from the EC concerning potential coordination in foreign exchange options trading. In May 2020, HSBC was informed that the EC had discontinued its investigation and does not intend to take further action.
In late 2013 and early 2014, various HSBC companies and other banks were named as defendants in various putative class actions consolidated in the New York District Court. The consolidated complaint alleged, among other things, that the defendants conspired to manipulate the WM/Reuters foreign exchange benchmark rates. In September 2015, HSBC reached an agreement with the plaintiffs to resolve the consolidated action, and the court granted final approval of the settlement in August 2018.
| 120 | HSBC Holdings plc Interim Report 2020 |
A putative class action complaint making similar allegations on behalf of retail customers of foreign exchange products was filed in the US District Court for the Northern District of California in 2015, and was subsequently transferred to the New York District Court where it remains pending. In 2017, putative class action complaints making similar allegations on behalf of purported indirect purchasers of foreign exchange products were filed in New York and were subsequently consolidated in the New York District Court. In April 2020, HSBC reached an agreement with the plaintiffs to resolve the indirect purchaser action. The settlement remains subject to final court approval.
In September 2018, various HSBC companies and other banks were named as defendants in two motions for certification of class actions filed in Israel alleging foreign exchange-related misconduct. In July 2019, the Tel Aviv Court allowed the plaintiffs to consolidate their claims and, in September 2019, the plaintiffs filed a motion for certification of the consolidated class action.
In November and December 2018, complaints alleging foreign exchange-related misconduct were filed in the New York District Court and the High Court of England and Wales against HSBC and other defendants by certain plaintiffs that opted out of the US class action settlement. In May 2020, the court granted in part and denied in part the defendants’ motion to dismiss the US opt-out actions. These matters remain at an early stage. It is possible that additional civil actions will be initiated against HSBC in relation to its historical foreign exchange activities.
There are many factors that may affect the range of outcomes, and the resulting financial impact, of these matters, which could be significant.
Precious metals fix-related litigation
Gold: Beginning in March 2014, numerous putative class actions were filed in the New York District Court and the US District Courts for the District of New Jersey and the Northern District of California, naming HSBC and other members of The London Gold Market Fixing Limited as defendants. The complaints allege that, from January 2004 to June 2013, the defendants conspired to manipulate the price of gold and gold derivatives for their collective benefit in violation of US antitrust laws, the US CEA and New York state law. The actions were consolidated in the New York District Court. The defendants’ motion to dismiss the consolidated action was granted in part and denied in part in October 2016. In June 2017, the court granted the plaintiffs leave to file a third amended complaint, naming a new defendant. The court has denied the pre-existing defendants’ request for leave to file a joint motion to dismiss, and discovery is proceeding.
Beginning in December 2015, numerous putative class actions under Canadian law were filed in the Ontario and Quebec Superior Courts of Justice against various HSBC companies and other financial institutions. The plaintiffs allege that, among other things, from January 2004 to March 2014, the defendants conspired to manipulate the price of gold and gold derivatives in violation of the Canadian Competition Act and common law. These actions are at an early stage.
Silver: Beginning in July 2014, numerous putative class actions were filed in federal district courts in New York, naming HSBC and other members of The London Silver Market Fixing Limited as defendants. The complaints allege that, from January 2007 to December 2013, the defendants conspired to manipulate the price of silver and silver derivatives for their collective benefit in violation of US antitrust laws, the US CEA and New York state law. The actions were consolidated in the New York District Court. The defendants’ motion to dismiss the consolidated action was granted in part and denied in part in October 2016. In June 2017, the court granted the plaintiffs leave to file a third amended complaint, which names several new defendants. The court has denied the pre-existing defendants’ request for leave to file a joint motion to dismiss, and discovery is proceeding.
In April 2016, two putative class actions under Canadian law were filed in the Ontario and Quebec Superior Courts of Justice against various HSBC companies and other financial institutions. The plaintiffs in both actions allege that, from January 1999 to August 2014, the defendants conspired to manipulate the price of silver and silver derivatives in violation of the Canadian Competition Act and common law. The Ontario action is at an early stage. The Quebec action has been temporarily stayed.
Platinum and palladium: Between late 2014 and early 2015, numerous putative class actions were filed in the New York District Court, naming HSBC and other members of The London Platinum and Palladium Fixing Company Limited as defendants. The complaints allege that, from January 2008 to November 2014, the defendants conspired to manipulate the price of platinum group metals (‘PGM’) and PGM-based financial products for their collective benefit in violation of US antitrust laws and the US CEA. In March 2017, the defendants’ motion to dismiss the second amended consolidated complaint was granted in part and denied in part. In June 2017, the plaintiffs filed a third amended complaint. In March 2020, the court granted the defendants' motion to dismiss the third amended complaint but granted the plaintiffs leave to re-plead certain claims. The plaintiffs have filed an appeal.
Based on the facts currently known, it is not practicable at this time for HSBC to predict the resolution of these matters, including the timing or any possible impact on HSBC, which could be significant.
Film finance litigation
In July and November 2015, two actions were brought by individuals against HSBC Private Bank (UK) Limited (‘PBGB’) in the High Court of England and Wales seeking damages on various alleged grounds, including breach of duty to the claimants, in connection with their participation in certain Ingenious film finance schemes. These actions are ongoing.
In December 2018, a separate action was brought against PBGB in the High Court of England and Wales by multiple claimants seeking damages for alleged unlawful means conspiracy and dishonest assistance in connection with lending provided by PBGB to third parties in respect of certain Ingenious film finance schemes in which the claimants participated. In June 2019, a similar claim was issued against PBGB in the High Court of England and Wales by additional claimants. These actions are ongoing.
In June 2020, two separate claims were issued against HSBC UK Bank plc (as successor to PBGB’s business) by two separate groups of investors in Eclipse film finance schemes in connection with PBGB’s role in facilitating the design, promotion and operation of such schemes. Only one of these claims has been served to date. These matters are at an early stage.
In February 2020, a claim was issued against HSBC UK Bank plc (as successor to PBGB’s business) by two individuals in relation to the Zeus film finance schemes. Separately, in June 2020, HSBC UK Bank plc received an application for disclosure of documents by a law firm acting on behalf of a number of investors in the Zeus schemes. These matters are at an early stage.
It is possible that additional actions or investigations will be initiated against HSBC UK Bank plc as a result of PBGB’s historical involvement in the provision of certain film finance-related services.
Based on the facts currently known, it is not practicable to predict the resolution of these matters, including the timing or any possible impact on HSBC, which could be significant.
HSBC Holdings plc Interim Report 2020 | 121 |
Notes on the interim condensed financial statements (unaudited)
Other regulatory investigations, reviews and litigation
HSBC Holdings and/or certain of its affiliates are subject to a number of other investigations and reviews by various regulators and competition and law enforcement authorities, as well as litigation, in connection with various matters relating to the firm’s businesses and operations, including:
| • | investigations by tax administration, regulatory and law enforcement authorities in Argentina, India and elsewhere in connection with allegations of tax evasion or tax fraud, money laundering and unlawful cross-border banking solicitation; |
| • | an investigation by the US Commodity Futures Trading Commission regarding interest rate swap transactions related to bond issuances; |
| • | an investigation by the Swiss Competition Commission in connection with the setting of Euribor and Japanese yen Libor; |
| • | an investigation by the FCA in connection with collections and recoveries operations in the UK; |
| • | an information request from the UK Competition and Markets Authority concerning the financial services sector; |
| • | putative class actions brought in the New York District Court relating to the Mexican government bond market, the US government-sponsored enterprise bond market, and the market for US dollar-denominated supranational sovereign and agency bonds; |
| • | two group actions pending in the US courts and a claim issued in the High Court of England and Wales in connection with HSBC Bank plc’s role as a correspondent bank to Stanford International Bank Ltd from 2003 to 2009; and |
| • | litigation brought against various HSBC companies in the US courts relating to residential mortgage-backed securities, based primarily on (a) claims brought against HSBC Bank USA in connection with its role as trustee on behalf of various securitisation trusts; and (b) claims against several HSBC companies seeking that the defendants repurchase various mortgage loans. |
There are many factors that may affect the range of outcomes, and the resulting financial impact, of these matters, which could be significant.
| 15 | Transactions with related parties |
There were no changes in the related party transactions described in the Annual Report and Accounts 2019 that have had a material effect on the financial position or performance of HSBC in the half-year to 30 June 2020. All related party transactions that took place in the half-year to 30 June 2020 were similar in nature to those disclosed in the Annual Report and Accounts 2019.
| 16 | Events after the balance sheet date |
In its assessment of events after the balance sheet date, HSBC has considered and concluded that no material events have occurred resulting in adjustments to the financial statements.
| 17 | Interim Report 2020 and statutory accounts |
The information in this Interim Report 2020 is unaudited and does not constitute statutory accounts within the meaning of section 434 of the Companies Act 2006. This Interim Report 2020 was approved by the Board of Directors on 3 August 2020. The statutory accounts of HSBC Holdings plc for the year ended 31 December 2019 have been delivered to the Registrar of Companies in England and Wales in accordance with section 447 of the Companies Act 2006.
| 122 | HSBC Holdings plc Interim Report 2020 |
| Shareholder information | ||||||
| Page | Page | |||||
| 1 | Directors’ interests | 9 | Corporate governance | |||
| 2 | Employee share plans | 10 | Changes in Directors’ details | |||
| 3 | Other equity instruments | 11 | Going concern basis | |||
| 4 | Notifiable interests in share capital | 12 | Telephone and online share dealing service | |||
| 5 | Dealings in HSBC Holdings listed securities | 13 | Stock symbols | |||
| 6 | Dividend on preference shares | 14 | Copies of the Interim Report 2020 and shareholder enquiries and communications | |||
| 7 | Earnings release | |||||
| 8 | Final results | |||||
| 1 | Directors’ interests |
According to the register of Directors’ interests maintained by HSBC Holdings pursuant to section 352 of the Securities and Futures Ordinance of Hong Kong, at 30 June 2020 (or date of retirement from the Board, if earlier) the Directors of HSBC Holdings had the following interests, all beneficial unless otherwise stated, in the shares or debentures of HSBC and its associates:
| Directors’ interests – shares and debentures | |||||||||||||
| At 30 Jun 2020 | |||||||||||||
| Footnotes | At 1 Jan 2020 | Beneficial owner | Child under 18 or spouse | Jointly with another person | Trustee | Total interests | |||||||
| HSBC Holdings ordinary shares | |||||||||||||
| Kathleen Casey | 1,2 | 15,125 | 15,125 | — | — | — | 15,125 | ||||||
| Laura Cha | 16,200 | 16,200 | — | — | — | 16,200 | |||||||
| Henri de Castries | 19,251 | 19,251 | — | — | — | 19,251 | |||||||
| James Forese | 3 | — | — | — | — | — | — | ||||||
| Steven Guggenheimer | 1,3, 4 | — | — | — | 10,000 | — | 10,000 | ||||||
| Irene Lee | 11,904 | 11,904 | — | — | — | 11,904 | |||||||
| José Antonio Meade Kuribreña | — | — | — | — | — | — | |||||||
| Heidi Miller | 1 | 15,700 | 15,700 | — | — | — | 15,700 | ||||||
| David Nish | 50,000 | — | 50,000 | — | — | 50,000 | |||||||
| Noel Quinn | 5 | 441,925 | 598,527 | — | — | — | 598,527 | ||||||
| Ewen Stevenson | 5 | 233,972 | 407,903 | — | — | — | 407,903 | ||||||
| Sir Jonathan Symonds | 6 | 43,821 | 38,823 | 4,998 | — | — | 43,821 | ||||||
| Jackson Tai | 1,7 | 66,515 | 32,800 | 11,965 | 21,750 | — | 66,515 | ||||||
| Mark Tucker | 307,352 | 307,352 | — | — | — | 307,352 | |||||||
| Pauline van der Meer Mohr | 15,000 | 15,000 | — | — | — | 15,000 | |||||||
| 1 | Kathleen Casey has an interest in 3,025, Steven Guggenheimer has an interest in 2,000, Heidi Miller has an interest in 3,140 and Jackson Tai has an interest in 13,303 listed American Depositary Shares (‘ADSs’), which are categorised as equity derivatives under Part XV of the Securities and Futures Ordinance of Hong Kong. Each ADS represents five HSBC Holdings ordinary shares. |
| 2 | Kathleen Casey retired from the Board on 24 April 2020. |
| 3 | James Forese and Steven Guggenheimer joined the Board on 1 May 2020. |
| 4 | On 19 May 2020, Steven Guggenheimer reported to HSBC Holdings that he had acquired 1,000 ADSs, representing 5,000 HSBC Holdings ordinary shares, on 1 May 2020. The ADSs were acquired jointly with his spouse, Nichola Guggenheimer. Prior clearance was not obtained as required pursuant to the standards set out in the Hong Kong Model Code for Securities Transactions by Directors of Listed Issuers. The Directors’ onboarding process has been reviewed and certain improvements have been made. Prior clearance was obtained for Steven Guggenheimer’s sole subsequent transaction. |
| 5 | Executive Directors’ other interests in HSBC Holdings ordinary shares arising from the HSBC Holdings Savings-Related Share Option Plan and the HSBC Share Plan 2011 are set out on the following pages. At 30 June 2020, the aggregate interests under the Securities and Futures Ordinance of Hong Kong in HSBC Holdings ordinary shares, including interests arising through employee share plans, were: Noel Quinn – 1,153,083; and Ewen Stevenson – 1,613,450. Each Director’s total interests represents less than 0.01% of the shares in issue and 0.01% of the shares in issue excluding treasury shares. |
| 6 | Sir Jonathan Symonds retired from the Board on 18 February 2020. |
| 7 | Jackson Tai’s holding includes a non-beneficial interest in 11,965 shares of which he is custodian. |
Savings-Related Share Option Plan
Currently no executive Directors participate in a Savings-Related Share Option Plan. For further details on the Savings-Related Share Option Plan, see page 125.
HSBC Share Plan 2011
Conditional awards of deferred shares
Vesting of deferred share awards is normally subject to the Director remaining an employee on the vesting date. The awards may vest at an earlier date in certain circumstances. Under the Securities and Futures Ordinance of Hong Kong, interests in conditional share awards are categorised as the interests of the beneficial owner.
HSBC Holdings plc Interim Report 2020 | 123 |
Additional information
| Deferred share awards | |||||||||||||||
| HSBC Holdings ordinary shares | |||||||||||||||
| Date of award | Year in which awards may vest | Awards held at | Awards made during the period to 30 Jun 2020 | Awards vested during the period to 30 Jun 20201 | Awards held at | ||||||||||
| Footnotes | 1 Jan 2020 | Number | Monetary value | Number | Monetary value | 30 Jun 2020 | |||||||||
| £000 | £000 | ||||||||||||||
| Noel Quinn † | 2 Mar 2015 | 2 | 2020 | 20,199 | – | – | 20,838 | 100 | – | ||||||
| 29 Feb 2016 | 3 | 2021 | 39,549 | – | – | – | – | 38,9104 | |||||||
| 27 Feb 2017 | 5 | 2020–2024 | 82,950 | – | – | 17,114 | 77 | 65,836 | |||||||
| 26 Feb 2018 | 6 | 2021–2025 | 107,523 | – | – | – | – | 107,523 | |||||||
| 25 Feb 2019 | 7 | 2022–2026 | 140,585 | – | – | – | – | 140,585 | |||||||
| 24 Feb 2020 | 8 | 2020 | – | 105,072 | 591 | 105,072 | 591 | – | |||||||
| 24 Feb 2020 | 9 | 2023–2027 | – | 201,702 | 1,134 | – | – | 201,702 | |||||||
| Ewen Stevenson | 28 May 2019 | 10 | 2020–2025 | 703,933 | – | – | 148,419 | 672 | 486,80211 | ||||||
| 28 May 2019 | 12 | 2022–2026 | 241,988 | – | – | 241,988 | |||||||||
| 24 Feb 2020 | 8 | 2020 | – | 96,202 | 541 | 96,202 | 541 | – | |||||||
| † | Noel Quinn became a Director of HSBC Holdings on 5 August 2019. He served as Interim Group Chief Executive of HSBC Holdings between 5 August 2019 and 16 March 2020. On 17 March 2020, he was appointed as Group Chief Executive of HSBC Holdings. |
| 1 | Includes any additional shares arising from dividend equivalents (see Notes 2 and 4 for further information). |
| 2 | At the date of the award (2 March 2015), the market value per share was £5.8300. The award vested in full on 10 March 2020 at a market value of £4.8187. The vesting included dividend equivalents applied in anticipation of the fourth interim dividend for 2019 that were later recovered (see Note 4). |
| 3 | At the date of the award (29 February 2016), the market value per share was £4.6735. The award will vest in full in March 2021. |
| 4 | Following cancellation of the fourth interim dividend for 2019, shares were deducted from this award to reflect the dividend equivalents that vested on 10 March 2020 in respect of the 2015 award. |
| 5 | At the date of the award (27 February 2017), the market value per share was £6.5030. The award will vest in five equal annual tranches. The first tranche vested on 12 March 2020 and was based on a market value of £4.5246. Shares equivalent in number to those that vest under the award (net of tax liabilities) must be retained for six months from the vesting date. |
| 6 | At the date of the award (26 February 2018), the market value per share was £7.2340. Shares equivalent in number to those that vest under the award (net of tax liabilities) must be retained for one year from the vesting date. The award will vest in five equal annual tranches commencing in March 2021. |
| 7 | At the date of the award (25 February 2019), the market value per share was £6.2350. Shares equivalent in number to those that vest under the award (net of tax liabilities) must be retained for one year from the vesting date. The award will vest in five equal annual tranches commencing in March 2022. |
| 8 | The non-deferred award vested immediately on 24 February 2020 and was based on the market value of £5.6220. Shares equivalent in number to those that vest under the award (net of tax liabilities) must be retained for one year from the vesting date. |
| 9 | At the date of the award (24 February 2020), the market value per share was £5.6220. Shares equivalent in number to those that vest under the award (net of tax liabilities) must be retained for one year from the vesting date. The award will vest in five equal annual tranches commencing in March 2023. |
| 10 | The award was granted on 28 May 2019 using a market value per share of £6.6430 as at 30 November 2018. Shares equivalent in number to those that vest under the award (net of tax liabilities) must be retained for up to one year from the vesting date. The first tranche vested on 12 March 2020 and was based on a market value of £4.5246. The award replaces the 2015 to 2018 long-term incentive (‘LTI’) plans forfeited by the Royal Bank of Scotland Group plc (‘RBS’) and is subject to any performance adjustments assessed and disclosed in the relevant annual report and accounts of RBS. |
| 11 | The award has been adjusted following the performance outcome applied and disclosed in RBS’s Annual Report and Accounts 2019. The RBS performance outcome was 78.09%, which resulted in a reduction of 68,712 shares in respect of the 2016 LTI plan. |
| 12 | The award was granted on 28 May 2019 using a market value per share of £6.2350 as at 22 February 2019. Shares equivalent in number to those that vest under the award (net of tax liabilities) must be retained for up to one year from the vesting date. The award will vest in five annual tranches commencing in March 2022. The award is in respect of the 2018 performance year granted based on Ewen Stevenson’s maximum opportunity under RBS’s policy and the outcome of the 2018 scorecard as disclosed in RBS's Annual Report and Accounts 2018. The number of shares that vest may be adjusted based on any ‘pre-vest performance test’ assessed and disclosed in RBS’s Annual Report and Accounts. |
Long-term incentive awards
The long-term incentive award is an award of shares with a three-year performance period. At the end of this performance period and subject to the award terms, the number of shares that vest will be determined based on an assessment against financial and non-financial measures. Subject to that assessment, the shares will vest in five equal annual instalments. On vesting, awards are subject to a retention period of up to one year. Under the Securities and Futures Ordinance of Hong Kong, interests in awards are categorised as beneficial.
| Long-term incentive awards | |||||||||||||||
| HSBC Holdings ordinary shares | |||||||||||||||
| Date of award | Footnotes | Year in which awards may vest | Awards held at | Awards made during the period to 30 Jun 2020 | Awards vested during the period to 30 Jun 2020 | Awards held at | |||||||||
| 1 Jan 2020 | Number | Monetary value | Number | Monetary value | 30 Jun 2020 | ||||||||||
| £000 | £000 | ||||||||||||||
| Ewen Stevenson | 24 Feb 2020 | 1 | 2023 - 2027 | — | 476,757 | 2,680 | — | — | 476,757 | ||||||
| 1 | Awards were made on 24 February 2020 and were based on the market value of £5.6220. |
No Directors held any short position (as defined in the Securities and Futures Ordinance of Hong Kong) in the shares or debentures of HSBC Holdings and its associated corporations. Save as stated in the tables above, none of the Directors had an interest in any shares or debentures of HSBC Holdings or any associates at the beginning or at the end of the period, and none of the Directors or members of their immediate families were awarded or exercised any right to subscribe for any shares or debentures in any HSBC corporation during the period.
| 124 | HSBC Holdings plc Interim Report 2020 |
There have been no changes in the shares or debentures of the Directors from 30 June 2020 to the date of this report.
| 2 | Employee share plans |
Share options and discretionary awards of shares are granted under HSBC share plans to help align the interests of employees with those of shareholders. The following are particulars of outstanding share options, including those held by employees working under employment contracts that are regarded as ‘continuous contracts’ for the purposes of the Hong Kong Employment Ordinance. The options were granted at nil consideration. No options have been granted to substantial shareholders, suppliers of goods or services, or in excess of the individual limit for each share plan. No options were cancelled by HSBC during the period to 30 June 2020.
A summary of the total number of options granted, exercised or lapsed during the period is shown in the following table. Particulars of options held by Directors of HSBC Holdings are set out on page 123. Further details required to be disclosed pursuant to Chapter 17 of the Rules Governing the Listing of Securities on The Stock Exchange of Hong Kong Limited are available on our website at www.hsbc.com, and on the website of The Stock Exchange of Hong Kong Limited at www.hkex.com.hk. Copies may be obtained upon request from the Group Company Secretary and Chief Governance Officer, 8 Canada Square, London E14 5HQ.
All-employee share plans
The HSBC Holdings Savings-Related Share Option Plan is an all-employee share plan under which eligible employees have been granted options to acquire HSBC Holdings ordinary shares. The HSBC International Employee Share Purchase Plan was introduced in 2013 and now includes employees based in 27 jurisdictions, although no options are granted under this plan. During 2019, approximately 178,000 employees were offered participation in these plans.
For options granted under the HSBC Holdings Savings-Related Share Option Plan, employees may make contributions of up to £500 each month over a period of three or five years. The contributions may be used within six months following the third or fifth anniversary of the commencement of the relevant savings contract, at the employee’s election, to exercise the options. Alternatively, the employee may elect to have the savings, plus (where applicable) any interest or bonus, repaid in cash. In the case of redundancy, ceasing employment on grounds of injury or disability, retirement, death, the transfer of the employing business to another party, or a change of control of the employing company, options may be exercised before completion of the relevant savings contract. In certain limited circumstances, the exercise period of options granted under the all-employee share option plans may be extended.
Under the HSBC Holdings Savings-Related Share Option Plan, the option exercise price is determined by reference to the average market value of the HSBC Holdings ordinary shares on the five business days immediately preceding the invitation date, then applying a discount of 20%. The HSBC Holdings Savings-Related Share Option Plan has an expiry date of 24 April 2030 (by which time the plan may be extended with approval from shareholders) unless the Directors resolve to terminate the plan at an earlier date.
| HSBC Holdings all-employee share option plan | ||||||||||||||||
| HSBC Holdings ordinary shares | ||||||||||||||||
| Dates of award | Exercise price | Usually exercisable | 1 Jan 2020 | Granted in period | Exercised in period | Lapsed in period | 30 Jun 2020 | |||||||||
| from | to | from | to | from | to | Footnotes | ||||||||||
| Savings-Related Share Option Plan | 1 | |||||||||||||||
| 20 Sep 2013 | 20 Sep 2019 | (£) 4.0472 | (£) 5.9640 | 1 Nov 2018 | 30 April 2025 | 65,060,681 | — | 1,256,031 | 8,154,549 | 55,650,101 | ||||||
| 1 | The weighted average closing price of the shares immediately before the dates on which options were exercised was £5.3412. |
| 3 | Other equity instruments |
Additional tier 1 capital – contingent convertible securities
Our intention is to continue to issue contingent convertible securities in accordance with our issuance plans. These securities are included in our capital base as fully CRR II-compliant additional tier 1 capital securities. These securities are marketed principally and subsequently allotted to institutional investors. The net proceeds of the issuances are typically used for our general corporate purposes and to further strengthen our capital base to meet requirements under CRR II. These securities typically bear a fixed rate of interest until their initial call dates. After the initial call dates, if they are not redeemed, the securities typically bear interest at a rate which is reset every five years based on credit spreads, fixed at issuance, above prevailing market benchmark/reference security rates. Interest on the contingent convertible securities will be due and payable only at our sole discretion, and we have sole and absolute discretion at all times to cancel for any reason (in whole or part) any interest payment that would otherwise be payable on any payment date. Interest payments will not be made if they are prohibited under UK banking regulations or if we have insufficient reserves or fail to meet the solvency conditions defined in the securities’ terms.
The contingent convertible securities are undated and are repayable at our option in whole at the initial call date or typically on any fifth anniversary after this date. In addition, the securities are repayable at our option in whole for certain regulatory or tax reasons. Any repayments require the prior consent of the PRA. These securities rank pari passu with our dollar and sterling preference shares and therefore rank ahead of ordinary shares. The contingent convertible securities will be converted into fully paid ordinary shares at a predetermined price, should our consolidated CET1 ratio on a non-transitional basis (i.e. on a consolidated basis and without applying the transitional provisions set out in Part Ten under CRR II) fall below 7.0%. Therefore, in accordance with the terms of the securities, if the non-transitional CET1 ratio falls below the 7.0% trigger, the securities will convert into ordinary shares at the fixed contractual conversion price specified in the securities’ terms, subject to anti-dilution adjustments. During the first half of 2020, HSBC did not issue any contingent convertible securities.
HSBC Holdings plc Interim Report 2020 | 125 |
Additional information
| 4 | Notifiable interests in share capital |
At 30 June 2020, HSBC Holdings had received the following notification of major holdings of voting rights pursuant to the requirements of Rule 5 of the UK Disclosure Guidance and Transparency Rules:
| • | BlackRock, Inc. gave notice on 3 March 2020 that on 2 March 2020 it had an indirect interest in HSBC Holdings of 1,235,558,490 ordinary shares, qualifying financial instruments with 7,294,459 voting rights that may be acquired if the instruments are exercised or converted, and financial instruments with similar economic effect to qualifying financial instruments that refer to 2,441,397 voting rights. These represented 6.07%, 0.03% and 0.01%, respectively, of the total voting rights at 2 March 2020. |
At 30 June 2020, as recorded in the register maintained by HSBC Holdings pursuant to section 336 of the Securities and Futures Ordinance of Hong Kong:
| • | BlackRock, Inc. gave notice on 12 May 2020 that on 7 May 2020 it had the following interests in HSBC Holdings ordinary shares: a long position of 1,480,094,020 shares and a short position of 38,033,956, representing 7.15% and 0.18%, respectively, of the ordinary shares in issue at 7 May 2020. |
| • | Ping An Asset Management Co., Ltd. gave notice on 2 November 2018 that on 1 November 2018 it had a long position of 1,418,925,452 in HSBC Holdings ordinary shares, representing 7.01% of the ordinary shares in issue at that date. |
| 5 | Dealings in HSBC Holdings listed securities |
HSBC has policies and procedures that, except where permitted by statute and regulation, prohibit it undertaking specified transactions in respect of its securities listed on The Stock Exchange of Hong Kong Limited (‘HKEx’). Except for dealings as intermediaries or as trustees by subsidiaries of HSBC Holdings, neither HSBC Holdings nor any of its subsidiaries has purchased, sold or redeemed any of its securities listed on HKEx during the half-year ended 30 June 2020.
| 6 | Dividend on preference shares |
A quarterly dividend of $15.50 per 6.20% non-cumulative US dollar preference share, Series A (‘Series A dollar preference share’) (equivalent to a dividend of $0.3875 per Series A American Depositary Share (‘ADS’), each of which represents one-fortieth of a Series A dollar preference share), and £0.01 per Series A sterling preference share is payable on 15 March, 15 June, 15 September and 15 December 2020 for the quarter then ended at the sole and absolute discretion of the Board of HSBC Holdings plc. Accordingly, the Board of HSBC Holdings plc has approved a quarterly dividend to be payable on 15 September 2020 to holders of record on 31 August 2020.
The Series A dollar preference share quarterly dividend, announced on 28 April 2020 to be payable on 15 June 2020, was paid on 16 June 2020 due to an administrative error and may not have been received by a limited number of ADS holders who were on the record on 29 May 2020. ADS holders who have not received their expected dividend should contact HSBC Investor Relations at investorrelations@hsbc.com to discuss this further.
| 7 | Earnings release |
An earnings release for the three-month period ending 30 September 2020 is expected to be issued on 27 October 2020.
| 8 | Final results |
The results for the year to 31 December 2020 are expected to be announced on 23 February 2021.
| 9 | Corporate governance |
We are subject to corporate governance requirements in both the UK and Hong Kong. Throughout the six months ended 30 June 2020, we complied with the applicable provisions of the UK Corporate Governance Code and also the requirements of the Hong Kong Corporate Governance Code, save to the extent referred to in the next paragraph. The UK Corporate Governance Code is available at www.frc.org.uk and the Hong Kong Corporate Governance Code is available at www.hkex.com.hk
Following the UK Government’s introduction of social distancing measures and prohibition on non-essential travel and public gatherings, it was not possible for shareholders to attend this year’s Annual General Meeting (‘AGM’) in person. The Board was fully informed of all relevant AGM and shareholder matters but only a limited number of Directors and essential personnel attended the AGM to ensure the meeting was quorate and to enable the business of the meeting to be conducted. Shareholders were advised to vote by submitting a proxy in advance of the AGM and that they should only appoint the Chairman of the AGM to act as their proxy. To ensure that shareholders did not lose the opportunity to raise questions, shareholders were encouraged to submit questions for the Board via email in advance of the AGM. Responses to the most frequent questions across key themes were published on the HSBC website after due consideration by the Board. None of the questions submitted covered a topic that required consideration by the auditor. Given these measures, not all of the persons set out in paragraphs A.6.7 and E.1.2 of the Hong Kong Corporate Governance Code were able to attend the AGM.
Under the Hong Kong Code, the Group Audit Committee should be responsible for the oversight of all risk management and internal control systems, unless expressly addressed by a separate risk committee. Our Group Risk Committee is responsible for oversight of internal control, other than internal financial controls, and risk management systems.
The Board has codified obligations for transactions in Group securities in accordance with the requirements of the Market Abuse Regulation and the rules governing the listing of securities on the HKEx, save that the HKEx has granted waivers from strict compliance with the rules that take into account accepted practices in the UK, particularly in respect of employee share plans.
Following specific enquiries and except as disclosed on page 123 of the Interim Report 2020, all Directors have confirmed that they have complied with their obligations in respect of transacting in Group securities throughout the period.
| 126 | HSBC Holdings plc Interim Report 2020 |
There have been no material changes to the information disclosed in the Annual Report and Accounts 2019 in respect of the remuneration of employees, remuneration policies, bonus and share option plans and training schemes. Details of the number of employees are provided on page 29.
| 10 | Changes in Directors’ details |
Changes in current Directors’ details since the date of the Annual Report and Accounts 2019, which are required to be disclosed pursuant to Rule 13.51(2) and Rule 13.51B(1) of the Hong Kong Listing Rules, are set out below.
Kathleen Casey
Retired from the Board and Group Audit Committee, Group Risk Committee and Nomination & Corporate Governance Committee on
24 April 2020.
24 April 2020.
James Forese
Appointed to the Board and as a member of the Group Audit Committee, Group Remuneration Committee and Nomination & Corporate Governance Committee on 1 May 2020.
Steven Guggenheimer
Appointed to the Board and as a member of the Group Risk Committee and Nomination & Corporate Governance Committee on 1 May 2020.
Heidi Miller
Appointed Chair of the Audit Committee of Fiserv, Inc. on 15 May 2020.
Eileen Murray
Appointed to the Board and as a member of the Group Audit Committee, Group Risk Committee and Nomination & Corporate Governance Committee on 1 July 2020.
David Nish
Appointed as Senior Independent Director, Chair of the Group Audit Committee and as a member of the Group Risk Committee on
18 February 2020.
18 February 2020.
Sir Jonathan Symonds
Retired from the Board, Group Audit Committee, Group Risk Committee and Nomination & Corporate Governance Committee on
18 February 2020.
18 February 2020.
Pauline van der Meer Mohr
Appointed as a member of the Group Audit Committee on 19 February 2020.
| 11 | Going concern basis |
As mentioned in Note 1 ‘Basis of preparation and significant accounting policies’ on page 100, the financial statements are prepared on a going concern basis as the Directors are satisfied that the Group and parent company have the resources to continue in business for the foreseeable future. In making this assessment, the Directors considered a wide range of information relating to present and future conditions, including future projections of profitability, cash flows, capital requirements and capital resources. These considerations include stressed scenarios that reflect the increasing uncertainty that the global Covid-19 pandemic has had on HSBC’s operations, as well as considering potential impacts from other top and emerging risks, and the related impact on profitability, capital and liquidity.
In particular, HSBC’s principal activities, business and operating models, strategic direction and top and emerging risks are addressed in the Overview section. A financial summary, including a review of the consolidated income statement and consolidated balance sheet, is provided in the ‘Interim management report’ section. HSBC’s objectives, policies and processes for managing credit, liquidity and market risk are described in the Risk section of the Annual Report and Accounts 2019. HSBC’s approach to capital management and allocation is described in the Capital section of the Annual Report and Accounts 2019.
| 12 | Telephone and online share dealing service |
For shareholders on the Principal Register who are resident in the UK, with a UK postal address, and who hold an HSBC Bank plc personal current account, the HSBC InvestDirect share dealing service is available for buying and selling HSBC Holdings plc ordinary shares. Details are available from: HSBC InvestDirect, Forum 1, Parkway, Whiteley PO15 7PA; or UK telephone: +44 (0) 3456 080848, or from an overseas telephone: +44 (0) 1226 261090; or website: www.hsbc.co.uk/investments/products-and-services/invest-direct.
| 13 | Stock symbols |
HSBC Holdings plc ordinary shares trade under the following stock symbols:
| London Stock Exchange | HSBA* |
| Hong Kong Stock Exchange | 5 |
| New York Stock Exchange (ADS) | HSBC |
| Euronext Paris | HSB |
| Bermuda Stock Exchange | HSBC.BH |
| *HSBC’s primary market | |
HSBC Holdings plc Interim Report 2020 | 127 |
Additional information
| 14 | Copies of the Interim Report 2020 and shareholder enquiries and communications |
Further copies of the Interim Report 2020 may be obtained from Global Communications, HSBC Holdings plc, 8 Canada Square, London E14 5HQ, United Kingdom; from Communications (Asia), The Hongkong and Shanghai Banking Corporation Limited, 1 Queen’s Road Central, Hong Kong; or from US Communications, HSBC Bank USA, N.A., 1 West 39th Street, 9th Floor, New York, NY 10018, USA. The Interim Report 2020 may also be downloaded from the HSBC website, www.hsbc.com.
Shareholders may at any time choose to receive corporate communications in printed form or to receive notifications of their availability on HSBC’s website. To receive notifications of the availability of a corporate communication on HSBC’s website by email, or to revoke or amend an instruction to receive such notifications by email, go to www.hsbc.com/ecomms. If you provide an email address to receive electronic communications from HSBC, we will also send notifications of any future dividend entitlements by email. If you received a notification of the availability of this document on HSBC’s website and would like to receive a printed copy or, if you would like to receive future corporate communications in printed form, please write or send an email (quoting your shareholder reference number) to the appropriate Registrar at the address given below. Printed copies will be provided without charge.
Any enquiries relating to your shareholdings on the share register (for example transfers of shares, change of name or address, lost share certificates or dividend cheques) should be sent to the Registrar at the address given below. The Registrars offer an online facility, Investor Centre, which enables shareholders to manage their shareholding electronically.
| Principal Register | Hong Kong Overseas Branch Register | Bermuda Overseas Branch Register |
Computershare Investor Services PLC The Pavilions Bridgwater Road Bristol BS99 6ZZ United Kingdom | Computershare Hong Kong Investor Services Limited Rooms 1712-1716, 17th Floor Hopewell Centre 183 Queen’s Road East Hong Kong | Investor Relations Team HSBC Bank Bermuda Limited 37 Front Street Hamilton HM 11 Bermuda |
Telephone: +44 (0) 370 702 0137 Email: via website Web: www.investorcentre.co.uk/contactus | Telephone: +852 2862 8555 Email: hsbc.ecom@computershare.com.hk Web: www.investorcentre.com/hk | Telephone: +1 441 299 6737 Email: hbbm.shareholder.services@hsbc.bm Web: www.investorcentre.com/bm |
Any enquiries relating to ADSs should be sent to the depositary at:
The Bank of New York Mellon Shareowner Services PO Box 505000 Louisville, KY 40233-5000 USA | Telephone (US): +1 877 283 5786 Telephone (international): +1 201 680 6825 Email: shrrelations@cpushareownerservices.com Web: www.mybnymdr.com |
Any enquiries relating to shares held through Euroclear France, the settlement and central depositary system for NYSE Euronext Paris, should be sent to the paying agent:
CACEIS Corporate Trust 14, rue Rouget de Lisle 92130 Issy-les-Moulineaux France | Telephone: +33 1 57 78 34 28 Email: ct-service-ost@caceis.com Website: www.caceis.com |
A Chinese translation of this and future documents may be obtained on request from the Registrar. Please also contact the Registrar if you have received a Chinese translation of this document and do not wish to receive such translations in future.
Persons whose shares are held on their behalf by another person may have been nominated to receive communications from HSBC pursuant to section 146 of the UK Companies Act 2006 (‘nominated person’). The main point of contact for a nominated person remains the registered shareholder (for example your stockbroker, investment manager, custodian or other person who manages the investment on your behalf). Any changes or queries relating to a nominated person’s personal details and holding (including any administration thereof) must continue to be directed to the registered shareholder and not HSBC’s Registrar. The only exception is where HSBC, in exercising one of its powers under the UK Companies Act 2006, writes to nominated persons directly for a response.

| 128 | HSBC Holdings plc Interim Report 2020 |
| Abbreviations |
| Currencies | |
| £ | British pound sterling |
| CA$ | Canadian dollar |
| € | Euro |
| HK$ | Hong Kong dollar |
| RMB | Chinese renminbi |
| SGD | Singapore dollar |
| $ | United States dollar |
| Abbreviation | |
| 1H19 | First half of 2019 |
| 1H20 | First half of 2020 |
| 1Q19 | First quarter of 2019 |
| 1Q20 | First quarter of 2020 |
| 2H19 | Second half of 2019 |
| 2Q19 | Second quarter of 2019 |
| 2Q20 | Second quarter of 2020 |
| 4Q19 | Fourth quarter of 2019 |
| A | |
| ABS | Asset-backed security |
| ADS | American Depositary Share |
| AIEA | Average interest-earning assets |
| AML | Anti-money laundering |
| ANP | Annualised new business premiums |
| ASEAN | Association of Southeast Asian Nations |
| B | |
| Basel | Basel Committee on Banking Supervision |
| Basel III | Basel Committee’s reforms to strengthen global capital and liquidity rules |
| BoCom | Bank of Communications Co., Limited, one of China’s largest banks |
| BoE | Bank of England |
| Bps | Basis points. One basis point is equal to one hundredth of a percentage point |
| BSM | Balance Sheet Management |
| C | |
| C&L | Credit and Lending |
| CAPM | Capital asset pricing model |
| CDO | Collateralised debt obligation |
| CEA | Commodity Exchange Act (US) |
| CET1 | Common equity tier 1 |
| CGU | Cash generating unit |
| CLO | Collateralised loan obligation |
| CMB | Commercial Banking, a global business |
| CMC | Capital maintenance charge |
| CODM | Chief Operating Decision Maker |
| CRR | Customer risk rating |
| CRR II | Revised Capital Requirements Regulation and Directive, as implemented |
| CRD IV | Capital Requirements Regulation and Directive |
| CVA | Credit valuation adjustment |
| D | |
| DoJ | Department of Justice (US) |
| DPA | Deferred prosecution agreement (US) |
| DPD | Days past due |
| DPF | Discretionary participation feature of insurance and investment contracts |
| E | |
| EBA | European Banking Authority |
| EC | European Commission |
| ECL | Expected credit losses. In the income statement, ECL is recorded as a change in expected credit losses and other credit impairment charges. In the balance sheet, ECL is recorded as an allowance for financial instruments to which only the impairment requirements in IFRS 9 are applied. |
| Eonia | Euro Overnight Index Average |
| ESG | Environmental, social and governance |
€STER | Euro short-term rate |
| EU | European Union |
| Euribor | Euro interbank offered rate |
| F | |
| FCA | Financial Conduct Authority (UK) |
| FICC | Fixed Income, Currencies and Commodities |
| FRB | Federal Reserve Board (US) |
| FTE | Full-time equivalent staff |
| FVOCI | Fair value through other comprehensive income |
| FX | Foreign exchange |
| FX DPA | Three-year deferred prosecution agreement with the US Department of Justice, entered into in January 2018 |
| G | |
| GAAP | Generally accepted accounting principles |
| GBM | Global Banking and Markets, a global business |
| GDP | Gross domestic product |
| GEC | Group Executive Committee |
| GLCM | Global Liquidity and Cash Management |
| Global Markets | HSBC’s capital markets services in Global Banking and Markets |
| GPB | Global Private Banking, a former global business now part of Wealth and Personal Banking |
| Group | HSBC Holdings together with its subsidiary undertakings |
| GTRF | Global Trade and Receivables Finance |
| H | |
| HKEx | The Stock Exchange of Hong Kong Limited |
| HNAH | HSBC North America Holdings Inc. |
| Hong Kong | Hong Kong Special Administrative Region of the People’s Republic of China |
| HSBC | HSBC Holdings together with its subsidiary undertakings |
| HSBC Bank | HSBC Bank plc, also known as the non-ring-fenced bank |
| HSBC Bank Middle East | HSBC Bank Middle East Limited |
| HSBC Bank USA | HSBC Bank USA, N.A., HSBC’s retail bank in the US |
| HSBC Canada | The sub-group, HSBC Bank Canada, HSBC Trust Company Canada, HSBC Mortgage Corporation Canada and HSBC Securities Canada, consolidated for liquidity purposes |
| HSBC Finance | HSBC Finance Corporation, the US consumer finance company (formerly Household International, Inc.) |
| HSBC France | HSBC’s French banking subsidiary, formerly CCF S.A. |
| HSBC Holdings | HSBC Holdings plc, the parent company of HSBC |
| HSBC Private Bank Suisse | HSBC Private Bank (Suisse) SA, HSBC’s private bank in Switzerland |
| HSBC UK | HSBC UK Bank plc, also known as the ring-fenced bank |
| HSBC USA | The sub-group, HSBC USA Inc and HSBC Bank USA, consolidated for liquidity purposes |
| HSI | HSBC Securities (USA) Inc. |
| HSSL | HSBC Securities Services (Luxembourg) |
| HTIE | HSBC Institutional Trust Services (Ireland) Limited |
| I | |
| IAS | International Accounting Standards |
| IASB | International Accounting Standards Board |
| Ibor | Interbank offered rate |
| ICAAP | Internal capital adequacy assessment process |
| IFRSs | International Financial Reporting Standards |
| IRB | Internal ratings-based |
| L | |
| LCR | Liquidity coverage ratio |
| LGD | Loss given default |
| Libor | London interbank offered rate |
| LTV | Loan to value |
| M | |
| Madoff Securities | Bernard L Madoff Investment Securities LLC |
| Mainland China | People’s Republic of China excluding Hong Kong and Macau |
| MENA | Middle East and North Africa |
HSBC Holdings plc Interim Report 2020 | 129 |
Additional information
| MREL | EU minimum requirements for own funds and eligible liabilities |
| N | |
| NII | Net interest income |
| NIM | Net interest margin |
| NSFR | Net stable funding ratio |
| O | |
| OCI | Other comprehensive income |
| OFAC | Office of Foreign Assets Control |
| ORMF | Operational risk management framework |
| P | |
| PBT | Profit before tax |
| PD | Probability of default |
| POCI | Purchased or originated credit impaired |
| PPI | Payment protection insurance |
| PRA | Prudential Regulation Authority (UK) |
| Premier | HSBC Premier, HSBC’s premium personal global banking service |
| PVIF | Present value of in-force long-term insurance business |
| PwC | PricewaterhouseCoopers LLP and its network of firms |
| R | |
| RBWM | Retail Banking and Wealth Management, a former global business now part of Wealth and Personal Banking |
| RFR | Risk-free rate |
| RNIV | Risk not in VaR |
| RoE | Return on equity |
| RoTE | Return on average tangible equity |
| RWA | Risk-weighted asset |
| S | |
| SABB | The Saudi British Bank |
| SEC | Securities and Exchange Commission (US) |
| ServCo group | Separately incorporated group of service companies planned in response to UK ringfencing proposals |
| Sibor | Singapore interbank offered rate |
| T | |
| The Hongkong and Shanghai Banking Corporation | The Hongkong and Shanghai Banking Corporation Limited, the founding member of HSBC |
| U | |
| UAE | United Arab Emirates |
| UK | United Kingdom |
| US | United States of America |
| V | |
| VaR | Value at risk |
| VIU | Value in use |
| W | |
| WPB | Wealth and Personal Banking, a global business |
| 130 | HSBC Holdings plc Interim Report 2020 |
This document comprises the Interim Report 2020 and information herein has been filed on Form 6-K with the US Securities and Exchange Commission for HSBC Holdings plc and its subsidiary and associated undertakings.
HSBC Holdings plc
Incorporated in England with limited liability. Registered in England: number 617987
Registered Office and Group Head Office
8 Canada Square, London E14 5HQ, United Kingdom
Web: www.hsbc.com
© Copyright HSBC Holdings plc 2020
All rights reserved
No part of this publication may be reproduced, stored in a retrieval system, or transmitted, in any form or by any means, electronic, mechanical, photocopying, recording, or otherwise, without the prior written permission of HSBC Holdings plc.
Published by Global Finance, HSBC Holdings plc, London
Designed by Superunion, London (cover and ‘Overview’ section) and by Global Finance, HSBC Holdings plc, London (rest of the Interim Report 2020)
HSBC Holdings plc Interim Report 2020 | 131 |
SIGNATURES
Pursuant to the requirements of the Securities Exchange Act of 1934, the registrant has duly caused this report to be signed on its behalf by the undersigned, thereunto duly authorized.
HSBC Holdings plc | |
| By: | /s/ Ewen Stevenson |
| Name: Ewen Stevenson | |
| Title: Group Chief Financial Officer | |
Dated: 3 August 2020