Table of Contents
As confidentially submitted to the Securities and Exchange Commission on April 26, 2013
This draft registration statement has not been publicly filed with the Securities and Exchange Commission
and all information herein remains strictly confidential.
Registration No. 333-
SECURITIES AND EXCHANGE COMMISSION
Washington, D.C. 20549
FORM S-1
REGISTRATION STATEMENT
Under
The Securities Act of 1933
GOOD TECHNOLOGY CORPORATION
(Exact name of Registrant as specified in its charter)
| Delaware | 7372 | 94-3248938 | ||
(State or other jurisdiction of incorporation or organization) | (Primary Standard Industrial Classification Code Number) | (I.R.S. Employer Identification Number) |
430 N. Mary Avenue, Suite 200
Sunnyvale, California 94085
(408) 212-7500
(Address, including zip code, and telephone number, including area code, of Registrant’s principal executive offices)
Christy Wyatt
President and Chief Executive Officer
Good Technology Corporation
430 N. Mary Avenue, Suite 200
Sunnyvale, California 94085
(408) 212-7500
(Name, address, including zip code, and telephone number, including area code, of agent for service)
Copies to:
Steven E. Bochner Jon C. Avina Wilson Sonsini Goodrich & Rosati Professional Corporation 650 Page Mill Road Palo Alto, California 94304 (650) 493-9300 | Ronald S. Vaisbort Vice President and General Counsel Good Technology Corporation 430 N. Mary Avenue, Suite 200 Sunnyvale, California 94085 (408) 212-7500 | Theodore G. Wang Jeffrey R. Vetter Fenwick & West LLP 801 California Street Mountain View, California 94041 (650) 988-8500 |
Approximate date of commencement of proposed sale to the public: As soon as practicable after this registration statement becomes effective.
If any of the securities being registered on this Form are to be offered on a delayed or continuous basis pursuant to Rule 415 under the Securities Act of 1933 (the “Securities Act”), check the following box. ¨
If this Form is filed to register additional securities for an offering pursuant to Rule 462(b) under the Securities Act, check the following box and list the Securities Act registration statement number of the earlier effective registration statement for the same offering. ¨
If this Form is a post effective amendment filed pursuant to Rule 462(c) under the Securities Act, check the following box and list the Securities Act registration statement number of the earlier effective registration statement for the same offering. ¨
If this Form is a post effective amendment filed pursuant to Rule 462(d) under the Securities Act, check the following box and list the Securities Act registration statement number of the earlier effective registration statement for the same offering. ¨
Indicate by check mark whether the registrant is a large accelerated filer, an accelerated filer, a non-accelerated filer, or a smaller reporting company. See definitions of “large accelerated filer,” “accelerated filer” and “smaller reporting company” in Rule 12b-2 of the Securities Exchange Act of 1934. (Check one). ¨
| Large accelerated filer ¨ | Accelerated filer ¨ | Non-accelerated filer x | Smaller reporting company ¨ | |||
(Do not check if a smaller reporting company) |
CALCULATION OF REGISTRATION FEE
| ||||
| Title of Each Class of Securities to be Registered | Proposed Maximum Aggregate Offering Price(1)(2) | Amount of Registration Fee | ||
Common Stock, $0.0001 par value | $ | $ | ||
| ||||
| ||||
| (1) | Includes the aggregate offering price of additional shares that the underwriters have the option to purchase to cover over-allotments, if any. |
| (2) | Estimated solely for the purpose of computing the amount of the registration fee pursuant to Rule 457 under the Securities Act of 1933. |
The Registrant hereby amends this Registration Statement on such date or dates as may be necessary to delay its effective date until the Registrant shall file a further amendment which specifically states that this Registration Statement shall thereafter become effective in accordance with Section 8(a) of the Securities Act of 1933 or until the Registration Statement shall become effective on such date as the Commission acting pursuant to said Section 8(a) may determine.
Table of Contents
The information in this preliminary prospectus is not complete and may be changed. We and the selling stockholders may not sell these securities until the registration statement filed with the Securities and Exchange Commission is effective. This prospectus is not an offer to sell these securities, and we and the selling stockholders are not soliciting offers to buy these securities in any jurisdiction where the offer or sale is not permitted.
PROSPECTUS (Subject to Completion)
Issued , 2013
Shares

COMMON STOCK
Good Technology Corporation is offering shares of its common stock and the selling stockholders are offering shares of common stock. We will not receive any proceeds from the sale of shares by the selling stockholders. This is our initial public offering and no public market currently exists for our shares. We anticipate that the initial public offering price will be between $ and $ per share.
We intend to apply to list our common stock on the under the symbol “ .”
We are an “emerging growth company” as defined under the federal securities laws. Investing in our common stock involves risks. See “Risk Factors” beginning on page 14.
PRICE $ A SHARE
Price to | Underwriting and | Proceeds to | Proceeds to | |||||
Per share | $ | $ | $ | $ | ||||
Total | $ | $ | $ | $ |
We and the selling stockholders have granted the underwriters the right to purchase up to an additional shares of common stock to cover over-allotments.
The Securities and Exchange Commission and state securities regulators have not approved or disapproved these securities or determined if this prospectus is truthful or complete. Any representation to the contrary is a criminal offense.
The underwriters expect to deliver the shares of common stock to purchasers on , 2013.
| MORGAN STANLEY | BARCLAYS | BofA MERRILL LYNCH | CITIGROUP |
OPPENHEIMER & CO.
, 2013
Table of Contents

Table of Contents
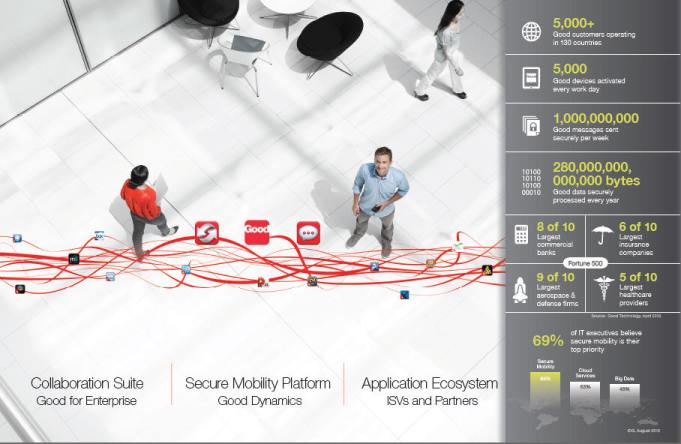
Table of Contents
| Page | ||||
| 1 | ||||
| 11 | ||||
| 14 | ||||
| 39 | ||||
| 41 | ||||
| 42 | ||||
| 42 | ||||
| 43 | ||||
| 45 | ||||
| 47 | ||||
Management’s Discussion and Analysis of Financial Condition and Results of Operations | 50 | |||
| 80 | ||||
| Page | ||||
| 102 | ||||
| 110 | ||||
| 120 | ||||
| 123 | ||||
| 125 | ||||
| 129 | ||||
Material United States Federal Income Tax Consequences to Non-U.S. Holders | 131 | |||
| 135 | ||||
| 142 | ||||
| 142 | ||||
| 142 | ||||
| F-1 | ||||
You should rely only on the information contained in this prospectus or in any free writing prospectus prepared by or on behalf of us or to which we have referred you. Neither we, the selling stockholders nor any of the underwriters have authorized anyone to provide you with information different from, or in addition to, that contained in this prospectus or any related free writing prospectus. We and the selling stockholders are offering to sell, and seeking offers to buy, shares of our common stock only in jurisdictions where offers and sales are permitted. The information contained in this prospectus is accurate only as of its date, regardless of its time of delivery or of any sale of our common stock. Our business, financial condition, results of operations and prospects may have changed since that date.
Through and including , 2013 (25 days after the date of this prospectus), all dealers effecting transactions in these securities, whether or not participating in this offering, may be required to deliver a prospectus. This is in addition to a dealer’s obligation to deliver a prospectus when acting as an underwriter and with respect to an unsold allotment or subscription.
For investors outside the United States: Neither we, the selling stockholders nor any of the underwriters have done anything that would permit this offering or possession or distribution of this prospectus in any jurisdiction where action for that purpose is required, other than in the United States. You are required to inform yourselves about and to observe any restrictions relating to this offering and the distribution of this prospectus outside of the United States.
i
Table of Contents
This summary highlights information contained in greater detail elsewhere in this prospectus. This summary is not complete and does not contain all of the information you should consider in making your investment decision. You should read the entire prospectus carefully before making an investment in our common stock. You should carefully consider, among other things, our consolidated financial statements and the related notes and the sections entitled “Risk Factors” and “Management’s Discussion and Analysis of Financial Condition and Results of Operations” included elsewhere in this prospectus.
GOOD TECHNOLOGY CORPORATION
Overview
Good Technology’s mission is to enable enterprises and governments worldwide to embrace the full power of mobility by ensuring secure access to applications and data from any device, anywhere, anytime. We empower businesses to create and manage secure interactions across a heterogeneous mix of data and applications, whether deployed in the cloud or on premise. This allows organizations to adapt existing business processes and create new workflows to uniquely exploit the mobile environment in a secure and trusted manner. We alone provide a comprehensive and integrated solution consisting of a secure mobile computing platform, a suite of collaboration applications, and a third-party application and partner ecosystem that enables enterprises to increase productivity and transform business processes.
The proliferation of mobile devices and applications is generating some of the greatest opportunities and challenges in software today. Mobile computing has reshaped the way people connect, communicate and create. The number of connected mobile devices will exceed the world’s population this year, according to Cisco’s Visual Networking Index. IDC estimates that the number of mobile applications downloaded will exceed 100 billion this year. Today’s users demand to be as productive on their mobile devices as they are on their desktop and laptop computers. They also demand a streamlined and intuitive user experience and want to perform business and personal tasks on the same device without sharing personal information with their employers. Users will find a way to accomplish their work on their device by leveraging the growing application universe, whether or not these applications and related services satisfy the security and compliance protocols of their employers’ IT departments. The challenge for both line of business leaders and IT is balancing the need for enterprise-class security and compliance while offering users the flexibility and personalization that they already enjoy on their personal mobile devices. This challenge is complicated further by the multitude of mobility strategies being utilized by businesses, including those enabling corporate-owned, employee-owned (also known as “Bring Your Own Device” or BYOD) and fixed-function devices such as retail kiosks. Line of business leaders are also putting pressure on IT as they demand optimized mobile applications for business processes and workflows to improve productivity and transform the way they do business. As a result of these pressures, IT is forced to assemble a set of independent solutions in silos that can result in higher costs and decrease system integrity. A successful solution must provide enterprise-class security and compliance, a rich user experience, centralized management with high scalability and availability, and rapid application development and deployment across all mobility strategies.
We address this challenge by providing a unique, platform-based solution that can accommodate the heterogeneous landscape and behavior of mobile users in a scalable, manageable and flexible manner, all while enabling government-grade security. We believe the industry needs a secure mobile computing platform that solves for a mix of legacy and mobile optimized applications, cloud and on-premise deployment models, a variety of devices and operating systems, and multiple mobility strategies across employees, partners and customers.
1
Table of Contents
The Good secure mobile computing solution enables increased productivity and can transform business processes by delivering a secure mobile computing platform, a suite of collaboration applications, and a third-party application and partner ecosystem. Our secure mobile computing platform, Good Dynamics, provides both security and application services to enable independent software vendors, or ISVs, system integrators, or SIs, and internal enterprise development organizations to build applications that include our security functionality and simplify application development across devices and operating systems. Our platform allows developers to speed the delivery of their application development projects to include government-grade levels of security and compliance without having to design their own security architecture. Developers can reduce time to deployment and are able to stay focused on designing rich, complex and collaborative workflows on mobile devices. The Good Collaboration Suite enables increased employee productivity without compromising security. The suite includes Good for Enterprise, which provides secure mobile email, calendar, contacts, attachments, notes and browsing, along with Good Share and Good Connect for file sharing and instant messaging, respectively. Our partner ecosystem consists of a broad set of third-party ISVs and SIs that incorporate our security architecture and management framework into the run-time environment of many existing, popular applications. This capability allows businesses to accelerate their ability to address many vertical-specific and horizontal use cases that are common across all industries without additional development. These applications can be managed and published in “app stores” to streamline their distribution and policy management. Good-certified applications are available in the Apple App Store and Google Play, and in addition we enable IT to create their own private, branded app stores.
Together, our secure mobile computing platform, suite of collaboration applications and third-party application and partner ecosystem allow businesses to develop, secure, deploy and manage a family of rich, interoperable and high-value mobile business applications and services to enable employees, customers and partners to collaborate and be productive anytime, anywhere. We believe this leads to improvements in productivity, efficiency, responsiveness to customers and partners, significant cost savings and the development of new applications that can enhance an organization’s competitive advantage and transform the way it does business.
We were incorporated in 1996 and have been an innovator in providing secure mobile computing solutions, maintaining a singular focus on developing world-class technology and solving our customers’ critical mobility challenges. As of March 31, 2013, our secure mobile computing platform has been successfully deployed in complex environments with tens of thousands of employees. We have over 5,000 customers with commercial deployments on more than 1.2 million active devices in more than 130 countries. Our customers include 49 of the Fortune 100, and our ecosystem includes leading ISVs, SIs, device makers, and mobile operating system, or OS, platform providers. We define a customer as a company, government entity or a distinct buying unit within a company or government entity, any of which has purchased products or services from us within the prior 36 months. We exclude channel partners and resellers, unless purchasing for their own use, and customers who have purchased our legacy consumer products. We provide our platform as a private cloud solution that integrates with application services from the public cloud. We sell our secure mobile computing solution and related services primarily to large organizations through a combination of our direct sales force and our channel partnerships. Gartner, Inc., or Gartner, has recognized us as a market leader in the “Magic Quadrant for Mobile Device Management,” published in May 2012.
In 2010, 2011 and 2012, our enterprise software and services billings, a non-GAAP financial measure, were $37.9 million, $101.7 million and $155.4 million, respectively, representing year-over-year growth of 169% for 2011 and 53% for 2012. In 2010, 2011 and 2012, we generated software and services revenue of $40.0 million, $58.1 million and $93.5 million, respectively, representing year-over-year growth of 45% for 2011 and 61% for 2012. Our free cash flow, a non-GAAP financial measure, was $(25.2) million, $75,000 and $(19.5) million in 2010, 2011 and 2012, respectively. Our net losses were $39.9 million, $41.2 million and $90.5 million in 2010, 2011 and 2012, respectively. See “Management’s Discussion and Analysis of Financial Condition and Results of
2
Table of Contents
Operations—Key Financial Metrics” for a description of how these non-GAAP financial measures are calculated, a description of the limitations of these non-GAAP financial measures and a reconciliation of the non-GAAP financial measures to their most directly comparable financial measure calculated in accordance with GAAP.
Industry Background
Proliferation of Mobile Devices and Applications is One of the Most Significant Technological Shifts Since the Internet
Rapid proliferation of mobile devices and applications is transforming how we live. This shift has been fueled by the rapid growth of, and innovation in, mobile applications. We believe this growth in applications is driving mobile users to expect that there should be “an app for that,” not just in their personal lives, but also in their professional lives.
Enterprises Are Adopting Diverse Strategies to Benefit from Mobility
Mobile computing devices enable “real-time” business activity and collaboration, increasing productivity and value for the enterprise. By broadly embracing mobility, enterprises can establish new communication channels with and among employees, business partners and customers, and can introduce innovative services and products that create opportunities for new revenue streams and enhance organizational agility and responsiveness.
Enterprises are generally adopting multiple mobility strategies:
Deploying Corporate-Liable Mobile Devices to Employees. Many organizations are proactively deploying smartphones and tablets. A homogenous set of Blackberries once deployed to a limited number of individuals is now being replaced by a wide variety of mobile devices from multiple device manufacturers, deployed to a larger number of users across the organization.
Enabling Employee-Liable Mobile Devices. Increasingly, employees are using their personally-owned smartphones, tablets and laptops for work. Organizations, recognizing the opportunities of mobile computing, are adopting BYOD programs.
Proliferating Company-Owned Fixed-Function Devices among Employees and End Customers. Some workflows have traditionally been performed on fixed-function devices, such as custom-designed kiosks. Enterprises are realizing cost efficiencies and enhanced user experience by utilizing tablets and smartphones to deliver workflows in a familiar form factor and with user-friendly, intuitive navigation.
Transforming Businesses by Creating Mobile-First Enabled Business Processes and Workflows. Enterprises are discovering that mobility allows them to optimize processes and workflows through in-house application development. Using “mobile-first” or “mobile-only” design philosophies, businesses can design new applications specifically for mobile devices, creating more efficient business processes that deliver benefits throughout the enterprise and beyond to partners and customers, regardless of the various types of devices in use.
While the employee-liable or BYOD trend has garnered significant media attention, many of our customers are deploying a combination of these strategies in various stages of maturity. We believe it is critical for enterprises to be able to easily and rapidly develop, deploy, manage and secure mobile applications across a range of mobility strategies.
Our Opportunity
IDC recently defined the mobile enterprise software market as the convergence of several emerging markets that in aggregate are estimated to be approximately $3.3 billion in 2012, growing to approximately $7.6 billion
3
Table of Contents
by 2016, representing a compounded annual growth rate of 22.6%. These markets include the mobile security, mobile enterprise management software and mobile application platform markets.
We believe that upgrades in mobile infrastructure, increases in computing power and subsequent decreases in technology costs, combined with the proliferation of applications, are unlocking new opportunities for enterprises to deploy secure mobile computing to a larger portion of the workforce. Additionally, we believe the extension of mobility to formerly stationary or manual processes will further increase the market for secure mobile computing solutions.
As enterprises increasingly adopt a “mobile-first” philosophy, we believe that the market for secure mobile computing solutions will take an increasing share of IT spend from commercial, non-mobile, software markets. These markets include the security, application development, collaboration, quality and lifecycle tools and system and network management markets, which totaled $59.2 billion in 2012, according to IDC. An August 2012 IDG research study indicated that 69% of IT executives believe secure mobile computing solutions are a critical or high priority during the next 12 months, ahead of cloud services at 53% and big data solutions at 48%.
The Rise of Mobility Presents Several Key Challenges for Major Constituents
Enterprises are faced with a number of critical challenges as they enable broad mobility for their workforces and beyond to their external partners and customers. These challenges originate from the needs of three major constituents within the organization: the user, IT and the line of business leader.
Today’s workers demand to be as productive on their mobile devices as they are on their desktop and laptop computers. Users expect to be able to perform any task from any connected device, at any time, with a streamlined and intuitive user experience. They also want to be able to perform business and personal tasks on the same devices, without sacrificing their privacy or user experience. In the absence of an IT-supported solution, users will circumvent employer security requirements altogether in order to be productive on their mobile devices.
Recent technology innovations in consumer mobile devices and applications are spreading into businesses, driving users to expect the same capability from those devices and applications in the workplace. This consumerization trend puts enormous pressure on IT to keep pace with user demand, while maintaining the highest levels of security and compliance for their business.
Concurrently, line of business leaders are also putting pressure on IT, as they insist on new mobile applications for business processes and workflows to improve productivity and transform the way they do business.
In order to satisfy the needs of all three of these constituents, successful mobile deployments must address a number of key challenges, including:
Inherent Security, Compliance and Data Protection Risks. Smartphones and tablets present particular challenges to IT administrators responsible for safeguarding enterprise infrastructure, applications and data. Security, compliance and data protection risks originate from device features that enable simplified, and in many cases automatic, sharing and replication of data across devices, security vulnerabilities in the devices’ built-in, operating system-level security measures, lost or stolen devices and mobile malware.
Delivering Uncompromised User Experience and Privacy. Today’s employees expect to have access to dynamic, collaborative and efficient business applications on their existing personal mobile devices. IT must satisfy the need for security and compliance without sacrificing the employee’s need for privacy or compromising the user experience.
4
Table of Contents
Maintaining Service Quality While Managing a Large Number of Devices and Applications. To maintain service quality as they scale deployments, enterprises need an integrated solution that manages both mobile devices and mobile applications, such as the capability to precisely manage, secure, and distribute applications and enable provisioning and management of device capabilities.
Addressing Increased Diversity in Mobile Deployment Strategies. Enterprises need a flexible platform to enable multiple deployment strategies and an integrated, end-to-end secure mobile computing solution that allows them to develop, deploy, manage and secure a heterogeneous population of mobile devices and applications.
Rapidly Developing and Deploying Secure Mobile Applications. Deploying appropriate security and compliance for a large number of diverse enterprise mobile applications built for multiple lines of business across multiple mobility strategies and on multiple development frameworks requires a considerable amount of enterprise time, effort and resources.
Key Benefits of Our Solution
We provide the leading secure mobile computing solution for enterprises and governments worldwide. Our solution consists of our secure mobile computing platform, a suite of collaboration applications and a third-party application and partner ecosystem.
Key benefits of our solution include:
Government-Grade Security and Compliance. Our security approach addresses the key aspects of secure mobile computing, including the ability to deploy security on devices or in applications using enterprise data. Our products are architected to enable our customers to comply with the most stringent security and data protection standards and regulations. Our government customers include military and civilian agencies in the United States, the United Kingdom, France, Germany, Netherlands, Sweden, Canada and Australia.
Rich User Experience and Privacy on a Single Device.Our solution provides a cohesive, integrated user experience allowing secure exchange of information through seamless multi-application workflows, without compromising employees’ privacy and experience. We accomplish this by separating enterprise data from personal data, enabling IT to deploy security policies on business applications and data rather than on the device.
Flexible, Comprehensive End-to-End Solution. We provide businesses with the capability to deploy and manage mobile applications across all of their mobility strategies, meeting the needs of IT, users and line of business leaders across a mix of legacy and mobile optimized applications, cloud and on-premise deployment models, a variety of devices and operating systems, and multiple mobility strategies across employees, partners and customers.
Centralized Management with High Scalability and Availability. Our secure mobile computing solution has been architected to scale to hundreds of thousands of devices by providing mobile application management and mobile device management capabilities that allow IT to manage large-scale deployments running numerous business applications across multiple mobility strategies.
Rapid Application Development and Deployment. Our Good Dynamics platform provides ISVs and internal enterprise development organizations with the necessary security and application services to enable them to rapidly develop applications with robust business functionality that meet the highest standards of security across a variety of devices and operating systems.
5
Table of Contents
Our Growth Strategy
Our strategy is to continue to be the leading provider of secure mobile computing solutions for enterprises and governments worldwide. Key elements of our strategy include:
Grow the Depth and Breadth of Deployments within Our Existing Customer Base. We intend to increase the penetration of deployments in our existing customer base by cross-selling our products, delivering new applications through our Good Dynamics platform and bundling our applications, platform and services into new value-added offerings. We will also invest in our ecosystem of ISVs and SIs to build more applications on Good Dynamics, increasing the value of our platform to our existing customers.
Extend Our Leadership through Continued Innovation. We will continue to invest in our applications, platform and services to increase functionality and further simplify secure mobile application development, deployment and management.
Continue to Expand Our Sales Organization to Acquire New Customers. We will deploy additional sales resources and increase our channel partner and value-added reseller footprint to broaden our customer base across geographies and industries.
Expand the Good Dynamics Platform Ecosystem. We will continue to expand our partner ecosystem by developing additional relationships with ISVs, SIs and internal enterprise development organizations.
Deliver World-Class Customer Service. To deliver world-class customer service, we are investing in new services to help our customers configure and deploy our solution rapidly and to help our partners build and deploy applications on the Good Dynamics platform.
Amplify Global Awareness of Our Brand. As a leader in secure mobile computing solutions, we will continue to market our platform to inform potential customers of the advantages of secure mobile computing solutions and how our solution can address their problems.
Competitive Strengths
We pioneered the category of secure mobile computing solutions by being the first to combine applications with end-to-end security, device management and mobile application development in a single solution.
We believe we have a number of unique competitive advantages that position us for continued leadership and growth within the market. Our competitive strengths include:
Strong Brand in Secure Mobile Computing. We believe the Good Technology brand name is widely recognized as representing the highest standards of security in mobile communication applications.
Comprehensive End-to-End Secure Mobility Architecture.We provide a comprehensive, integrated solution that protects and manages applications, data and devices while enabling business productivity, collaboration and workflow transformation. We do this by uniquely combining application containerization, transport security, internal security and perimeter security.
Proven and Trusted Security Approach. The strength of our secure mobile computing solution has been validated by the many successful deployments we have with the most discerning enterprises and governments around the world that impose the strictest security and compliance requirements.
Large and Diverse Customer Base.We have developed a large customer base across a diverse array of industries and geographies, including 49 of the Fortune 100, eight of the ten largest Fortune 500 commercial
6
Table of Contents
banks, six of the ten largest Fortune 500 insurance companies, five of the ten largest Fortune 500 healthcare providers, and nine of the ten largest Fortune 500 aerospace and defense contractors.
Rich Customer and Partner Ecosystem.The strength of our ecosystem is our broad network of customers, ISVs, SIs and our customers’ internal development organizations. As of March 31, 2013, we had over 4,000 developers registered on the Good Dynamics Network, our online developer community. As our ecosystem grows and offers more robust applications with richer functionality, we believe we are creating a virtuous cycle that will attract more customers and encourage purchases of additional solutions by our current customers.
Sticky Secure Mobile Computing Solution. We believe our solution creates pull-through demand as our software is deployed to an increasing number of users within an enterprise and as IT deploys more custom applications on our platform. This two-pronged expansion deeply embeds our solution in the enterprise and increases the disruption associated with switching to a different provider.
Significant Intellectual Property and Technology Portfolio.We have been innovating secure mobile computing solutions since our inception and have built a broad set of technologies spanning areas such as application, data and device management, authentication and security, messaging, platform services and data synchronization. As of March 31, 2013, we had 56 issued U.S. patents, 117 issued non-U.S. patents and 93 patent applications for examination globally.
Selected Risks Associated With Our Business
Our business is subject to numerous risks described in the section entitled “Risk Factors” and elsewhere in this prospectus. You should carefully consider these risks before making an investment. Some of these risks include:
| • | We have a history of losses, and we are unable to predict the extent of any future losses or when, if ever, we will achieve profitability in the future. |
| • | If the market for secure mobile computing shrinks or develops at a slower pace than we expect, our business could be adversely affected. |
| • | We expect our operating results to fluctuate on a quarterly and annual basis. |
| • | Because we recognize software and services revenues over a specified period of time, decreases or increases in sales are not immediately reflected in full in our operating results. |
| • | If we do not accurately predict, prepare for, and respond promptly to rapidly evolving technological and market developments and changing customer needs, our competitive position and prospects will be harmed. |
| • | A significant amount of our billings and revenues is generated from sales of our Good for Enterprise application; any decline in sales of this application could seriously harm our business. |
| • | If we fail to manage future growth effectively, our business would be harmed. |
| • | If we are unable to hire, retain and integrate our senior management and other qualified personnel, our business would suffer. |
| • | Sales of our software and services are concentrated at the end of each quarter, and in particular, the last two weeks of the quarter, which makes it difficult to accurately forecast our expected billings. |
| • | Our customers require us to maintain specified levels of service commitments, and network disruptions or other business interruptions could cause us to fail to meet these commitments and adversely impact our customer relationships as well as our overall business. |
7
Table of Contents
| • | Our strategy depends on our ability to enable application developers using our Good Dynamics secure mobile computing platform to distribute their applications through third-party channels; if these third parties deny application developers or us access or cause significant delays in the release of new and enhanced applications from application developers and us, our business and operating results could suffer. |
Corporate Information
We were incorporated in July 1996 as RoamPage, Inc., a Delaware corporation, and subsequently changed our name to Visto Corporation in August 1997. In February 2009, Visto Corporation acquired Good Technology, Inc. from Motorola, Inc. and began doing business as Good Technology. In September 2012, Visto Corporation changed its name to Good Technology Corporation. Unless expressly indicated or the context requires otherwise, the terms “Good,” “Good Technology,” the “Company,” “we,” “us,” and “our” in this prospectus refer to Good Technology Corporation, and, where appropriate, our wholly-owned subsidiaries. Our principal executive offices are located at 430 N. Mary Avenue, Suite 200, Sunnyvale, California 94085, and our telephone number is (408) 212-7500. Our website address is www.good.com. The information on, or that can be accessed through, our website is not part of this prospectus.
Good, the Good logo, Good Technology, Good Dynamics, Good for Enterprise, Good Connect, Good Share and other trademarks or service marks of Good appearing in this prospectus are the property of Good Technology Corporation. Trade names, trademarks and service marks of other companies appearing in this prospectus are the property of their respective holders. We have omitted the® and ™ designations, as applicable, for the trademarks used in this prospectus.
We are an emerging growth company as defined in the Jumpstart Our Business Startups Act of 2012, or JOBS Act. We will remain an emerging growth company until the earliest to occur of: the last day of the fiscal year in which we have more than $1.0 billion in annual revenues; the date we qualify as a “large accelerated filer,” with at least $700 million of equity securities held by non-affiliates; the issuance, in any three-year period, by us of more than $1.0 billion in non-convertible debt securities; and the last day of the fiscal year ending after the fifth anniversary of our initial public offering.
8
Table of Contents
THE OFFERING
Common stock offered by us | shares | |
Common stock offered by the selling stockholders | shares | |
Total common stock offered | shares | |
Over-allotment option | shares (with shares being offered by us and shares being offered by the selling stockholders) | |
Common stock to be outstanding after this offering | shares | |
Use of proceeds | The principal purposes of this offering are to increase our capitalization and financial flexibility, create a public market for our stock and thereby enable access to the public equity markets by our employees and stockholders, obtain additional capital, facilitate an orderly distribution of shares for the selling stockholders and increase our visibility in the marketplace. As of the date of this prospectus, we have no specific plans for the use of the net proceeds we receive from this offering. However, we currently intend to use the net proceeds we receive from this offering primarily for general corporate purposes, including working capital, sales and marketing activities, product development, general and administrative matters, and capital expenditures. We may also use a portion of the net proceeds for the acquisition of, or investment in, technologies, solutions or businesses that complement our business, although we have no present commitments or agreements to enter into any acquisitions or investments. See “Use of Proceeds.” | |
Proposed symbol | “ ” | |
The number of shares of our common stock to be outstanding after this offering is based on 159,142,812 shares of our common stock outstanding as of December 31, 2012, which includes 114,371,043 shares of common stock resulting from the automatic conversion, upon the closing of this offering, of all shares of our redeemable convertible preferred stock which were outstanding as of December 31, 2012 and excludes:
| • | 55,859,579 shares of our common stock issuable upon the exercise of options outstanding as of December 31, 2012, with a weighted-average exercise price of $1.21 per share; |
| • | 10,239,817 shares of our common stock issuable upon the exercise of outstanding options granted after December 31, 2012 through April 15, 2013, with a weighted-average exercise price of $4.13 per share; |
| • | 4,470,009 shares of our common stock issuable upon the exercise of warrants outstanding as of December 31, 2012, with a weighted-average exercise price of $1.835 per share; |
| • | 12,180,269 shares of our Series C redeemable convertible preferred stock issued in April 2013 at a purchase price of $4.105 per share; and |
| • | shares of our common stock reserved for future issuance under our stock-based compensation plans, consisting of 5,123,493 shares of common stock reserved for future issuance under our 2006 |
9
Table of Contents
Stock Plan as of April 15, 2013, which shares will be added to the shares to be reserved under our 2013 Employee Stock Incentive Plan, and shares of our common stock reserved for future issuance under our 2013 Employee Stock Incentive Plan, which will become effective in connection with this offering, and shares that become available under our 2013 Equity Stock Incentive Plan, pursuant to provisions thereof that automatically increase the share reserves under the plan each year, as more fully described in “Executive Compensation—Employee Benefit Plans.” |
Except as otherwise indicated, all information in this prospectus assumes:
| • | the automatic conversion of all outstanding shares of our redeemable convertible preferred stock as of December 31, 2012 into an aggregate of 114,371,043 shares of common stock immediately prior to the completion of this offering; |
| • | all outstanding shares of our Series C redeemable convertible preferred stock will automatically convert into an aggregate of 12,180,269 shares of common stock immediately prior to the completion of this offering, based on an assumed initial public offering price of $ per share, which is the midpoint of the price range set forth on the cover of this prospectus; |
| • | the effectiveness of our amended and restated certificate of incorporation in connection with the completion of this offering; |
| • | no exercise of options or warrants outstanding as of December 31, 2012; and |
| • | no exercise of the underwriters’ over-allotment option. |
10
Table of Contents
SUMMARY CONSOLIDATED FINANCIAL DATA
You should read the following summary consolidated financial data in conjunction with “Management’s Discussion and Analysis of Financial Condition and Results of Operations” and our consolidated financial statements and related notes, all included elsewhere in this prospectus. We derived the consolidated statements of operations data for the years ended December 31, 2010, 2011 and 2012, and the consolidated balance sheet data as of December 31, 2012, from our audited consolidated financial statements included elsewhere in this prospectus. Our historical results are not necessarily indicative of the results that may be expected in the future.
| Years Ended December 31, | ||||||||||||
| 2010 | 2011 | 2012 | ||||||||||
| (in thousands, except per share data) | ||||||||||||
Consolidated Statements of Operations Data: | ||||||||||||
Revenues: | ||||||||||||
Software and services | $ | 40,002 | $ | 58,125 | $ | 93,528 | ||||||
Intellectual property licensing | 25,600 | 27,221 | 23,077 | |||||||||
|
|
|
|
|
| |||||||
Total revenues | 65,602 | 85,346 | 116,605 | |||||||||
Cost of revenues(1) | 15,318 | 19,853 | 32,016 | |||||||||
|
|
|
|
|
| |||||||
Gross profit | 50,284 | 65,493 | 84,589 | |||||||||
|
|
|
|
|
| |||||||
Operating expenses: | ||||||||||||
Research and development(1) | 27,079 | 28,854 | 45,601 | |||||||||
Sales and marketing(1) | 37,308 | 47,440 | 93,980 | |||||||||
General and administrative(1) | 19,713 | 24,485 | 34,374 | |||||||||
|
|
|
|
|
| |||||||
Total operating expenses | 84,100 | 100,779 | 173,955 | |||||||||
|
|
|
|
|
| |||||||
Loss from operations | (33,816 | ) | (35,286 | ) | (89,366 | ) | ||||||
Other income (expense), net | 51 | (752 | ) | (602 | ) | |||||||
Interest expense | (441 | ) | (574 | ) | (926 | ) | ||||||
|
|
|
|
|
| |||||||
Loss before benefit from (provision for) income taxes | (34,206 | ) | (36,612 | ) | (90,894 | ) | ||||||
Benefit from (provision for) income taxes | (6,223 | ) | (4,379 | ) | 457 | |||||||
|
|
|
|
|
| |||||||
Net loss | (40,429 | ) | (40,991 | ) | (90,437 | ) | ||||||
(Income) loss attributable to noncontrolling interest | 572 | (214 | ) | (26 | ) | |||||||
|
|
|
|
|
| |||||||
Net loss attributable to Good Technology Corporation common stockholders | $ | (39,857 | ) | $ | (41,205 | ) | $ | (90,463 | ) | |||
|
|
|
|
|
| |||||||
Net loss per share attributable to Good Technology Corporation common stockholders, basic and diluted | $ | (5.90 | ) | $ | (2.11 | ) | $ | (2.75 | ) | |||
|
|
|
|
|
| |||||||
Weighted-average shares used in computing net loss per share attributable to Good Technology Corporation common stockholders, basic and diluted | 6,761 | 19,518 | 32,915 | |||||||||
|
|
|
|
|
| |||||||
Pro forma net loss per share attributable to Good Technology Corporation common stockholders, basic and diluted (unaudited) | $ | (0.63 | ) | |||||||||
|
| |||||||||||
Weighted-average shares used in computing pro forma net loss per share attributable to Good Technology Corporation common stockholders, basic and diluted (unaudited) | 142,521 | |||||||||||
|
| |||||||||||
11
Table of Contents
| (1) | Includes stock-based compensation expense as follows: |
| Years Ended December 31, | ||||||||||||
| 2010 | 2011 | 2012 | ||||||||||
| (in thousands) | ||||||||||||
Cost of revenues | $ | 131 | $ | 369 | $ | 774 | ||||||
Research and development | 656 | 1,032 | 2,529 | |||||||||
Sales and marketing | 850 | 1,457 | 3,263 | |||||||||
General and administrative | 943 | 1,613 | 2,635 | |||||||||
|
|
|
|
|
| |||||||
Total stock-based compensation expense | $ | 2,580 | $ | 4,471 | $ | 9,201 | ||||||
|
|
|
|
|
| |||||||
| As of December 31, 2012 | ||||||||||||
| Actual | Pro Forma(1) | Pro Forma As Adjusted(2) | ||||||||||
| (in thousands) | ||||||||||||
Consolidated Balance Sheet Data: | ||||||||||||
Cash and cash equivalents | $ | 29,466 | $ | 29,466 | $ | |||||||
Working capital (deficit) | (43,408 | ) | (43,408 | ) | ||||||||
Total assets | 214,732 | 214,732 | ||||||||||
Deferred revenues—current and long-term | 376,591 | 376,591 | ||||||||||
Notes payable, current and non-current | 15,167 | 15,167 | ||||||||||
Redeemable convertible preferred stock | 121,228 | — | ||||||||||
Additional paid-in capital | 142,946 | 264,162 | ||||||||||
Total Good Technology Corporation stockholders’ deficit | (347,389 | ) | (226,161 | ) | ||||||||
| (1) | The pro forma column reflects the automatic conversion of all shares of our redeemable convertible preferred stock, which are outstanding as of December 31, 2012 into 114,371,043 shares of our common stock immediately prior to the closing of this offering. |
| (2) | The pro forma as adjusted column reflects (i) the pro forma items described immediately above plus (ii) the sale of shares of our common stock in this offering at the assumed initial public offering price of $ per share, the midpoint of the price range on the cover of this prospectus, after deducting the estimated underwriting discounts and commissions and estimated offering expenses payable by us. A $1.00 increase (decrease) in the assumed initial public offering price of $ per share would increase (decrease) each of cash and cash equivalents, working capital (deficit), total assets, additional paid-in capital and total Good Technology Corporation stockholders’ deficit by $ , assuming that the number of shares offered by us, as set forth on the cover page of this prospectus, remains the same, and after deducting the estimated underwriting discounts and commissions. |
12
Table of Contents
Key Financial Metrics
We monitor the following key financial metrics to help us evaluate growth trends in our core business, establish related budgets, measure the effectiveness of our sales and marketing efforts to enterprise customers, and assess operational efficiencies. In addition to our results determined under GAAP, we believe these non-GAAP financial measures are useful in evaluating our operating performance.
| Years ended December 31, | ||||||||||||
| 2010 | 2011 | 2012 | ||||||||||
| (dollars in thousands) | ||||||||||||
Non-GAAP Financial Metrics: | ||||||||||||
Enterprise software and services billings | $ | 37,860 | $ | 101,749 | $ | 155,361 | ||||||
Total billings | $ | 84,318 | $ | 147,386 | $ | 196,788 | ||||||
Billings gross margin | 82 | % | 87 | % | 84 | % | ||||||
Free cash flow | $ | (25,177 | ) | $ | 75 | $ | (19,494 | ) | ||||
Because our revenues are recognized over an extended period of time, we focus on billings, a non-GAAP financial measure that we define as revenues plus the change in deferred revenues from the beginning to the end of the period, to analyze the performance of the business and to allocate resources. In particular, we focus on billings that are associated with sales of our secure mobile computing solution, which includes our suite of collaboration applications, in particular our Good for Enterprise application, and our Good Dynamics secure mobile computing platform, as well as associated maintenance and support services, which we refer to collectively as enterprise software and services billings. Billings from sales of our software and services to telecommunication carriers and OEM handset manufacturers are not included in this financial metric. We also focus on free cash flow as a non-GAAP liquidity measure that provides us with useful information about the amount of cash generated by our business that, after our capital expenditures, can be used for strategic opportunities, including investing in our business, making strategic acquisitions, and strengthening the balance sheet.
These non-GAAP financial measures should not be considered in isolation from, or as a substitute for, financial information prepared in accordance with GAAP. There are a number of limitations related to the use of these non-GAAP financial measures versus their nearest GAAP equivalent. First, enterprise software and services billings, total billings, billings gross margin and free cash flow are not substitutes for GAAP enterprise software and services revenues, total revenues, gross margin, and cash provided by (used in) operating activities, respectively. Our GAAP revenues do not closely match the timing of the related costs and expenses associated with generating our billings, such as the cost of customer support, our Good Secure Cloud infrastructure, engineering, professional services and royalties, as well as expenses related to research and development, sales and marketing, and general and administrative activities. In addition, for some of our customers, sales of our software and services include undelivered elements, such as professional services, and acceptance criteria for which revenues associated with such sales are deferred until these conditions are satisfied. Second, our peer companies may calculate non-GAAP financial measures differently or may use other financial measures to evaluate their performance, all of which could reduce the usefulness of our non-GAAP financial measures as tools for comparison. See “Management’s Discussion and Analysis of Financial Condition and Results of Operations—Key Financial Metrics” for a description of how these non-GAAP financial measures are calculated, a description of the limitations of these non-GAAP financial measures and a reconciliation of the non-GAAP financial measures to their most directly comparable financial measure calculated in accordance with GAAP.
13
Table of Contents
Investing in our common stock involves a high degree of risk. You should consider carefully the risks and uncertainties described below, together with all of the other information in this prospectus, including our consolidated financial statements and related notes, before deciding whether to purchase shares of our common stock. If any of the following risks is realized, our business, financial condition, operating results and prospects could be materially and adversely affected. In that event, the price of our common stock could decline, and you could lose part or all of your investment.
Risks Related to Our Business and Industry
We have a history of losses, and we are unable to predict the extent of any future losses or when, if ever, we will achieve profitability in the future.
We have incurred net losses in recent years, including $39.9 million, $41.2 million and $90.5 million in 2010, 2011 and 2012, respectively. We had an accumulated deficit of $490.3 million as of December 31, 2012. We may not be able to achieve or sustain profitability in future periods. Achieving profitability will require us to increase revenues, manage our cost structure, and not experience unanticipated liabilities. Revenue growth may slow or revenues may decline for a number of possible reasons, including slowing demand for our secure mobile computing solution, increasing competition, changes to our pricing model, a decrease in the size or growth of our overall market, or any failure to continue to capitalize on growth opportunities.
Our historical revenue growth has been inconsistent and, for a number of reasons, should not be considered indicative of our future performance. First, from 2009 through 2011, our consumer-oriented Good for You application generated the largest portion of our revenues but will represent an increasingly smaller portion of our revenues in the future as we focus on marketing and selling our secure mobile computing solution to enterprises and governments. Second, a significant component of our revenues to date is attributable to licensing our intellectual property, which will represent a smaller portion of our revenues in the future. Third, we only recently began marketing and selling our Good Dynamics secure mobile computing platform, and therefore, we are not able to accurately forecast future revenues from sales of this platform and associated applications.
Because we recognize a substantial portion of our software and services revenues over the expected life of the customer, we incur upfront costs related to acquiring such customers. Therefore, as we add customers in a particular year, our immediate costs to acquire customers may increase significantly relative to revenues recognized in that same year. In addition, we expect to incur increased research and development and sales and marketing costs as we invest for long-term growth. This, combined with the significant legal, accounting and other expenses that we will incur as a public company, will result in continued net losses in future periods. If our revenues do not increase to offset these increases in our operating expenses, we will not be profitable. Any failure by us to achieve, sustain or increase profitability on a consistent basis could cause the value of our common stock to decline.
If the market for secure mobile computing shrinks or develops at a slower pace than we expect, our business could be adversely affected.
Our future growth depends on the increased adoption of our secure mobile collaboration applications and our secure mobile computing platform, which we refer to as our secure mobile computing solution. The rate of customer adoption and deployment of secure mobile computing depends on many factors, including perceived security risks, privacy, cost and the perceived value and productivity gains of adopting such technology. Many businesses, particularly large enterprises in regulated industries, may be reluctant to broadly adopt mobile computing. If we, or other providers of secure mobile computing, suffer from real or perceived security breaches, disruptions in service, poor performance or other problems, the rate of growth in the market for secure mobile computing may decrease significantly, which would adversely affect our future growth.
14
Table of Contents
We expect our operating results to fluctuate on a quarterly and annual basis.
Our operating results have fluctuated significantly in the past and may continue to fluctuate significantly in the future as a result of a variety of factors, many of which are outside of our control. Factors that may contribute to the variability of our operating results include:
| • | fluctuations in demand for our secure mobile computing solution, in particular Good for Enterprise and Good Dynamics; |
| • | variability in the renewal rates for our software and services; |
| • | fluctuations in sales cycles and prices for our software and services; |
| • | reductions in customers’ budgets for information technology purchases and delays in their purchasing cycles; |
| • | general economic conditions in our domestic and international markets; |
| • | consolidation within our existing and potential customers; |
| • | channel partner concentration or consolidation; |
| • | mix of products sold; |
| • | the timing of recognizing revenues in any given quarter and the extent to which sales of our suite of collaboration applications, in particular our Good for Enterprise application and our Good Dynamics secure mobile computing platform, have to be recognized over a significant period of time; |
| • | timing with respect to sales of our software and services, including the number and size of orders in each quarter; |
| • | the timing of sales during the quarter, particularly given that a majority of our sales occur during the last two weeks of the quarter; |
| • | the rate of expansion and productivity of our sales force; |
| • | the timing of the development, introduction and shipment of new applications and enhancements by us or our competitors; |
| • | level of customer acceptance of new product introductions, such as our Good Dynamics secure mobile computing platform; |
| • | any significant changes in the competitive dynamics of our markets, including new entrants or substantial discounting of our software and services; |
| • | our ability to control the timing and amount of costs, including product support, IT and systems implementations and upgrades costs; |
| • | our ability to establish and maintain successful relationships with channel partners and resellers and the effectiveness of any changes we make to our distribution model; |
| • | any decision to increase or decrease operating expenses in response to changes in the marketplace or perceived marketplace opportunities; |
| • | our ability to derive benefits from our investments in sales, marketing, engineering, support or other activities; |
| • | our ability to successfully work with independent software vendors, or ISVs, systems integrators, or SIs, and third-party application developers to develop our ecosystem and enterprise applications that strengthen the platform; |
| • | higher compensation-related expenses, including stock-based compensation expenses and employee benefits; |
| • | royalty payments that we are required to make to third parties; |
15
Table of Contents
| • | accounting charges due to impairments of goodwill or intangible assets; |
| • | changes in foreign currency exchange rates; and |
| • | unpredictable fluctuations in our effective tax rate due to disqualifying dispositions of stock from stock options, changes in the value of our deferred tax assets or liabilities, changes in actual results versus our estimates, our ability to use our net operating loss carryforwards, the applicability of withholding taxes related to transactions with non-U.S. customers or changes in tax laws, regulations, accounting principles, or interpretations thereof. |
Because we recognize software and services revenues over a specified period of time, decreases or increases in sales are not immediately reflected in full in our operating results.
Software and services revenues generate a substantial majority of our revenues. The timing of sales of our software and services can be difficult to predict and can result in significant fluctuations in our billings from period to period. Because a substantial portion of our software and services revenues is recognized over the expected life of the customer, which is determined to be approximately five years, or over 18 months for licenses that do not permit transferability of the perpetual license, downturns or upturns in new business may not be immediately reflected in our operating results. As a result, most of the revenues we report each quarter is the result of sales we made to customers in prior quarters. Consequently, a decline in sales or renewals in any one quarter may not be reflected in our revenue results for that quarter. Any such decline, however, will negatively affect our revenues in future quarters. Additionally, while we recognize a substantial portion of our software and services revenues over the expected life of the customer, we incur upfront costs related to acquiring such customers. Therefore, as we add customers in a particular year, our immediate costs to acquire customers may increase significantly relative to revenues recognized in that same year.
If we do not accurately predict, prepare for, and respond promptly to rapidly evolving technological and market developments and changing customer needs, our competitive position and prospects will be harmed.
The market for secure mobile computing is expected to continue to evolve rapidly. Although this market expects rapid introduction of new products or enhancements that enable government-grade security and compliance, high scalability and availability, and rapid application development and deployment across all mobility strategies, the development of these products is difficult and the timetable for commercial release and availability is uncertain as there can be long time periods between releases and availability of new products. We may experience unanticipated delays in the availability of new products and services and fail to meet customer expectations for such availability. If we do not quickly respond to the rapidly changing and rigorous needs of our customers by developing, releasing and making available on a timely basis new software and services or enhancements that can respond adequately to new challenges in the market for secure mobile computing, our competitive position and business prospects will be harmed.
Additionally, the process of developing new technology is complex and uncertain, and if we fail to accurately predict the market’s changing needs and emerging technological trends, our business could be harmed. We must commit significant resources to developing new software and services before knowing whether our investments will result in solutions that the market will accept. For example, we recently introduced Good Dynamics, our secure mobile computing platform, to the market. This platform may not achieve any significant degree of market acceptance or be accepted into our sales channel by our channel partners. In addition, many of our target customers may continue allocating their IT budgets for legacy products and services and may not adopt our new products. If our target customers do not adopt our secure mobile computing platform and recognize the value of our platform compared to legacy products and services, or if we are otherwise unable to sell our products to organizations, then our revenues may not grow or may decline, which would adversely affect our operating results and financial condition. We have limited experience marketing and selling this platform, and we do not expect to generate significant revenues from sales of Good Dynamics in 2013.
16
Table of Contents
The success of new products depends on several factors, including appropriate new product definition, component costs, timely completion and introduction of these products, differentiation of new products from those of our competitors, and market acceptance of these products. There can be no assurance that we will successfully market and sell our Good Dynamics platform, identify new product opportunities, develop and bring new products to market in a timely manner, or achieve market acceptance of our products, or that products and technologies developed by others will not render our products or technologies obsolete or noncompetitive.
A significant amount of our billings and revenues is generated from sales of our Good for Enterprise application. Any decline in sales of this application could seriously harm our business.
In 2011 and 2012, we began to generate a significant amount of our billings and an increasing amount of our revenues from sales of our Good for Enterprise application. Prior to 2011, a substantial majority of our revenues and billings were derived from sales of Good for You and intellectual property licensing. We continue to focus our marketing and sales efforts on our secure mobile computing solution, which include Good for Enterprise and Good Dynamics, which we expect will continue to represent an increasing portion of our billings and revenues. If we are not able to successfully market and sell our solution, in particular our Good for Enterprise application, our revenues and operating results would be materially and adversely impacted.
If we fail to manage future growth effectively, our business would be harmed.
We continue to invest heavily for future growth and have significantly expanded our operations through recent technology acquisitions, increased hiring throughout the organization and in our sales and marketing and research and development organizations in particular, and international expansion of our operations. This growth has placed and will continue to place a strain on our management, IT infrastructure and other resources. Managing this growth will continue to require significant expenditures and allocation of valuable management resources. Further international expansion may be required for our continued business growth, and managing any international expansion would require additional resources and controls. If we fail to achieve the necessary level of efficiency in our organization as it grows, our business, operating results and financial condition would be harmed.
If we are unable to hire, retain and integrate our senior management and other qualified personnel, our business would suffer.
Our future success depends, in part, on our ability to attract and retain our senior management and other highly skilled personnel. The loss of the services of any of our key personnel, the inability to attract and retain additional skilled personnel or delays in hiring required personnel, particularly in engineering and sales, could seriously harm our ability to grow our business. In addition, any of our employees may terminate their employment at any time. Competition for highly skilled personnel is frequently intense, especially in the San Francisco Bay Area, where we have a substantial presence and need for highly skilled personnel. In addition, a large portion of our employee base is substantially vested in significant stock options, and the ability to exercise those options and sell their stock in a public market after the closing of this offering may result in a higher than normal turn-over rate. Furthermore, our senior management team has had a limited history of working together as many members are relatively new to our company, including our Chief Executive Officer, Chief Revenue Officer and Chief Marketing Officer. If we are not able to retain the services of our senior management team or integrate new members into the team effectively, our business may suffer.
Sales of our software and services are concentrated at the end of each quarter, and in particular, the last two weeks of the quarter, which makes it difficult to accurately forecast our expected billings.
We do not have a long history upon which to base forecasts of future billings and revenues resulting from sales of our secure mobile computing solution. In addition, sales in any given quarter tend to be concentrated at the end of such quarter, and in particular, the last two weeks of the quarter. Accordingly, we may be unable to
17
Table of Contents
prepare accurate internal financial forecasts, replace anticipated billings that we do not ultimately recognize or actually bill all such orders which have been received in such a short period. As a result, operating results in future reporting periods may be significantly below the expectations of the public market, equity research analysts or investors, which could depress the price of our common stock.
Our customers require us to maintain specified levels of service commitments, and network disruptions or other business interruptions could cause us to fail to meet these commitments and adversely impact our customer relationships as well as our overall business.
We provide our customers with access to the Good Secure Cloud, our network operating centers. Our operations rely on the efficient and uninterrupted operation of complex technology systems and networks. Some of our customers require us to contractually commit to maintain specified levels of customer service under service level agreements. In particular, because of the importance that users of mobile computing in general attach to the reliability of a mobile network, mobile operators are especially known for their rigorous service level requirements. Our service obligations with our customers often require us to maintain uptime of at least 99.5% for our Good Secure Cloud. Good Secure Cloud is vulnerable to damage or interruption from a variety of sources, including fire, earthquake, power loss, telecommunications or computer systems failure, cyber attack, human error, terrorist acts and war. There may also be system or network interruptions if new or upgraded systems are defective or not installed properly. In addition, poor performance in, or any additional interruptions of, the services that we deliver to our customers could delay market acceptance of our products and services and expose us to costs or potential liabilities. We have in the past had service level events necessitating issuance of credits to customers as a result of our inability to fulfill our obligations under service level agreements. If we are unable to meet our contractually committed service level obligations, we could be subject to fees, penalties and civil liabilities, as well as adverse reputational consequences. Failure to operate our Good Secure Cloud in a manner that meets the high service level expectations of our customers could result in harm to our brand and reputation, which could have a material adverse effect on our sales efforts and operating results.
We face intense competition that could reduce our billings and revenues and adversely affect our financial results.
The market for our products is highly competitive, and we expect competition to intensify in the future. This competition could result, and has resulted in the past, in reduced profit margins, increased sales and marketing expenses, and failure to increase, or the loss of, market share, any of which would seriously harm our business, operating results or financial condition. Competitive products and services may in the future have better performance, better features, lower prices and broader acceptance than our software and services, or embody new technologies, which could render our existing software and services obsolete or less attractive to customers.
Many of our current or potential competitors have longer operating histories, greater name recognition, larger customer bases and significantly greater financial, technical, sales, marketing and other resources than we do. Potential customers may prefer to purchase from their existing providers regardless of product performance or features. Our main competitors fall into four categories:
| • | large diversified software vendors that have some product capability in mobile security and management and large existing customer bases, such as IBM and SAP; |
| • | IT security, management and virtualization vendors that have begun to extend their capabilities beyond the desktop to encompass mobile devices such as Symantec and Citrix; |
| • | mobile device management and mobile application management vendors that offer a subset of the features of our overall solution; and |
| • | traditional providers of secure mobile email services and devices to enterprises, such as Blackberry. |
18
Table of Contents
In addition, our customers and target customers may develop their own solutions for secure mobile computing, rendering our solution less valuable or obsolete. Such competition could have a material adverse effect on our operating results and financial condition.
We expect increased competition from our current competitors as well as other established and emerging companies as the market for secure mobile computing solutions continues to develop and expand. Furthermore, our channel partners could market products and services that compete with our products and services. In addition, some of our competitors have made acquisitions or entered into strategic relationships with one another to offer a more comprehensive product than they had offered individually. We expect this trend to continue as companies attempt to strengthen or maintain their market positions in a rapidly evolving industry and as companies enter into strategic relationships or are acquired. Many of the companies driving this consolidation trend have significantly greater financial, technical and other resources than we do and are better positioned to acquire and offer complementary products and technologies. The companies resulting from these consolidations may create more compelling product offerings and be able to offer greater pricing flexibility, making it more difficult for us to compete effectively, including on the basis of price, technology or product functionality. Continued industry consolidation may adversely impact customers’ perceptions of the viability of smaller technology companies and consequently customers’ willingness to purchase products and services from such companies. These pressures could materially adversely affect our business, operating results and financial condition.
Additionally, platforms for which we develop or on which we offer our applications, in particular our suite of collaboration applications, such as the iOS, Android and Windows Phone platforms, are owned by companies with significant resources that could decide to expand their feature sets with products or features comparable to what we currently offer, which could make our software and services less valuable or obsolete. For example, these companies could develop features and functionality that they integrate into their platforms natively and which could provide comparable features and functionality as our solution.
We may not be able to successfully anticipate or adapt to competition, changing technology or customer requirements on a timely basis, or at all. If we fail to keep up with technological changes or to convince our customers and potential customers of the value of our products, our business, operating results and financial condition could be materially and adversely affected.
Our strategy depends on our ability to enable application developers using our Good Dynamics secure mobile computing platform to distribute their applications through third-party channels, including the Apple, Google and Microsoft mobile application stores. If these companies deny application developers or us access or cause significant delays in the release of new and enhanced applications from application developers and us, our business and operating results could suffer.
Our business strategy depends on our ability to enable ISV application developers using our Good Dynamics platform to distribute their applications through third-party channels, including the Apple, Google and Microsoft mobile application stores. Application store owners have control over the products and services made available through their channels and may choose to remove our applications or our partners’ applications from their stores, restrict functionality or delay application releases. Although we dedicate significant resources to ensure approval of our application releases, we cannot be assured of obtaining such approval in the future, or that providers of mobile operating systems will allow us to offer new products and features through their application stores. If we or our ISV partners fail to maintain access to these mobile application stores, are required to restrict the functionality of our or their applications, have significant delays in releasing updated applications, or are otherwise unable to distribute applications through these channels, our ability to operate our business would be materially and adversely impacted.
Additionally, as new mobile devices are released and third-party mobile operating systems and mobile application download stores are developed, it is difficult to predict the problems that may be encountered in customizing applications for these alternative devices and channels, and we may need to devote significant
19
Table of Contents
resources to the creation, support and maintenance of such applications. In addition, if we or our ISV partners experience difficulties in the future in integrating our applications into mobile devices or if problems arise with our relationships with providers of mobile operating systems or mobile application download stores, or if we face increased costs to distribute our applications, our future growth, business and operating results could suffer. Furthermore, changes in these providers’ platforms could require us to make changes in our applications to ensure compatibility. If our applications or our ISV partners’ applications cannot be made available through these third-party platforms, or the costs to make such applications available are increased substantially, our operating results and financial condition may be harmed.
If we are unable to attract new customers or to sell additional software and services to our existing customers, our revenue growth will be adversely affected, and our revenues could decline.
To increase our revenues, we must continually grow our customer base and increase the depth and breadth of the deployments of our software and services with our existing customers. In recent periods, we have been adding personnel and other resources to our sales organization as we focus on growing our business, entering new geographic markets and increasing our market share. We expect to incur significant additional costs in expanding our sales and marketing, product development, professional services and customer support organizations, as well as costs associated with our international expansion, as we invest for future growth. The return on these and future investments may be lower, or may be realized more slowly, than we expect. If we do not achieve the benefits anticipated from these investments, or if the realization of any benefits related to these investments is delayed, our growth rates will decline and our operating results could be adversely affected.
Our business depends substantially on our customers renewing their maintenance and support service agreements, and a decline in renewal rates could result in a material adverse effect on our operating results.
Today, most of our billings and revenues are derived from sales of our secure mobile computing solution, in particular our Good for Enterprise application. We generally sell our Good for Enterprise application pursuant to a perpetual license, such that renewals primarily relate to sales of our maintenance and support services. Our customers have no obligation to renew their service agreements after the expiration of the service period. Our renewal rates may decline or fluctuate as a result of a number of factors, including customer usage, pricing changes, customer satisfaction and general economic conditions. The loss of a substantial amount of renewals or a decline in our overall renewal rate could have a material adverse effect on our results of operations.
Failure to adequately expand our sales organization and maintain its effectiveness will impede our growth.
We plan to continue to expand our sales organization, both domestically and internationally, in order to more effectively market and sell our secure mobile computing solution. Identifying and recruiting qualified personnel and training them in the use of our software and service offerings requires significant time, expense and attention. Our business may be adversely affected if our efforts to expand and train our sales organization do not generate a corresponding increase in revenues. In particular, if we are unable to hire, develop and retain talented sales personnel or if new sales personnel are unable to achieve desired productivity levels according to our forecast, we may not be able to realize the expected benefits of this investment or increase our revenues.
If we are unable to grow and maintain our relationships with certain third parties, including operating system vendors, original equipment manufacturers, platform providers and cellular network carriers, our business will suffer.
In order for our products to interoperate with leading mobile devices and networks, we are required to work closely with certain operating system vendors, original equipment manufacturers, platform providers and cellular network carriers in product validation, marketing, selling and support. If we are not able to work successfully with these third parties, or grow and maintain our relationships with them, our business and operating results will
20
Table of Contents
suffer. In addition, we have benefited from these third parties’ brand recognition, reputation and customer bases. Any losses or shifts in the market position of these third parties in general could disrupt these relationships, result in customer losses, or require us to identify or transition to other manufacturers, vendors, platform providers or carriers, any of which would negatively impact our ability to sell our solution to our existing customers and reach potential customers, which would harm our business.
If our customers experience security breaches related to their data, our reputation and business could be harmed.
While we believe that the proliferation of mobile devices and applications is generating a significant opportunity in mobile computing, enterprises and governments will not employ a mobility strategy within their organizations if it means compromising the security and compliance of their IT systems and infrastructure. Security breaches could expose our customers and us to a risk of data loss, which could result in potential liability and litigation. If we fail to identify and respond to new and increasingly complex methods of attack and update our solution to detect or prevent such threats and protect our customers’ data, our business and reputation will suffer.
In addition, an actual or perceived security breach or theft of our customers’ data, regardless of whether the breach is attributable to the failure of our software or services, could adversely affect the market’s perception of us and secure mobile computing in general. We cannot assure you that our software and services will be free of defects or vulnerabilities, and even if we discover these weaknesses, we may not be able to immediately correct them, if at all. Our customers may also misuse our software and services, or third-party devices or applications (including those of ISVs in our ecosystem), which could result in a breach or theft of business data.
Our customers, reputation and business may be harmed by security breaches of our network systems.
Unauthorized individuals, or attackers, may attempt to penetrate our network. We could be required to expend significant capital and resources to protect against, or to alleviate, problems caused by attackers. We also may not have a timely remedy against an attacker that is able to compromise our network security, resulting in disruptions and delays in providing our software and services to our customers. Any compromise of our systems or security as a result of purposeful security breaches or the inadvertent transmission of computer viruses could adversely affect our business, customers and reputation.
Our secure mobile computing solution can be used to transmit personal information and other data that our customers may provide to us in the ordinary course of business, which may subject us to governmental regulation and other legal obligations related to confidentiality and privacy. Our actual or perceived failure to comply with such obligations could harm our business.
Customers oftentimes use our secure mobile computing solution to transmit personal information and other sensitive data. There are numerous federal, state and local laws and policies around the world (such as the EU Data Protection Directive 95/46/EC via the U.S.-EU Safe Harbor program) regarding privacy and the storing, sharing, use, processing, disclosure and protection of personal information and other data, the scope of which are continuously evolving and developing, subject to differing interpretations, and may be inconsistent between countries or conflict with other rules. We are subject to terms of confidentiality with our customers and users. It is possible that these obligations may be interpreted and applied in a manner that is inconsistent from one jurisdiction to another and may conflict with other rules or our practices. It is likely that as our business grows and evolves and our software and services are used in a greater number of countries, we may become subject to laws and regulations in additional jurisdictions, which could increase our compliance costs, particularly as such laws, regulations and policies tend to change over time.
It is difficult to predict how existing laws and the new laws to which we may become subject will be applied to our business. If we are not able to comply with these laws or regulations or if we become liable under these
21
Table of Contents
laws or regulations, we could be required to implement new measures to remediate these issues. Any failure or perceived failure by us to comply with our confidentiality obligations to customers or users, or any unauthorized release of personal information, may result in civil or government enforcement actions or litigation and could cause our customers and users to lose trust in us, which could have an adverse effect on our business.
Real or perceived errors, failures or bugs in our software and services could impact our reputation, and as a result, adversely affect our operating results and growth prospects.
Because the technology that we develop for our software and services is complex, undetected errors, failures or bugs may occur, especially when new versions or updates of our software are released. Deployment of our software and services into complicated environments may also expose any previously undetected errors, failures or bugs in our solution despite testing by us. Any downtime in our service, for example disruptions in our Good Secure Cloud, due to correcting such errors, failures or bugs, may also cause customer dissatisfaction. Real or perceived errors, failures or bugs, including installation errors or policies established by our customers, could result in negative publicity, loss of or delay in market acceptance, loss of competitive position or claims by customers for damages. In such an event, we may be required, or may choose for customer relations or other reasons, to expend additional resources in order to correct the problem. In addition, if an actual or perceived failure of our software or services occurs in a customer’s deployment, regardless of whether the failure is attributable to our software or services, the market perception of the effectiveness of our solution could be adversely affected. Alleviating any of these problems could require significant expenditures of our capital and other resources and could cause interruptions, delays or cessation of sales, which could cause us to lose existing or potential customers and could adversely affect our operating results and growth prospects.
Sales to and support of large customers may require longer lead times and greater customer support, which can strain our resources.
The lead time for sales to large customers is generally longer than that for smaller customers, which requires that our sales team devote more time and effort to make such sales. Supporting large customers could also require us to devote significant development services and support personnel and strain our personnel resources and infrastructure, particularly if such customers require rapid deployment. If we are not able to devote adequate resources to make these sales and support these customers, our revenue may not grow or may decline, adversely impacting our operating results and financial condition.
Many of our large customers, as well as some of our smaller customers, have very complex IT systems, mobile environments, data privacy and security requirements that may require specific features or functions unique to that particular business, which increase our upfront investment in sales and marketing efforts, as well as professional services and customer care. If we are not able to meet our customers’ requirements or demonstrate the scalability of our solution, these efforts may not result in an actual sale. Even if these sales efforts are successful, the revenues we receive from these customers may not be sufficient to offset these upfront investments. If prospective customers require specific features or functions that we do not offer, then the market for our solutions will be more limited and our business could suffer. If we are unable to support the needs of our customers on their schedules or demonstrate the scalability of our solution, these customers may not further expand their usage of our solution in their organization, may seek to terminate their relationship with us, or may renew on less favorable terms. If any of these were to occur, our revenue may decline and our operating results could be adversely affected. Further, the implementation and continuing maintenance of our solution require our customers’ cooperation. If our customers do not allocate sufficient internal resources to these efforts, our software may not be implemented successfully, resulting in dissatisfied customers and harm to our reputation.
22
Table of Contents
Our ability to sell our solution is highly dependent on the quality of our support and services offerings, and our failure to offer high-quality support and services could have a material adverse effect on our business and operating results.
Once our solution is deployed within our customers’ networks, our customers depend on our support organization to resolve any issues relating to our software and services. As a result, high-quality support is critical for the successful marketing and sale of our software and services. If we do not assist our customers in deploying our software products effectively, succeed in helping our customers resolve post-deployment issues quickly, or provide ongoing support, it could adversely affect our ability to sell additional software and services to existing customers and could harm our reputation with potential customers. Given our rapid expansion, our service organization has recently expanded substantially to address the concerns of our customers. If we fail to manage these resources correctly, our business will suffer. In addition, as we expand our operations internationally, our support organization will face additional challenges, including those associated with delivering support, training and documentation in languages other than English. Our failure to maintain high-quality support and services could have a material adverse effect on our business and operating results.
Our future performance depends in part on support from our partner ecosystem of ISVs, SIs and other third-party software developers.
We depend on our partner ecosystem of ISVs and SIs and other third-party software vendors to create applications that will integrate with our Good Dynamics secure mobile computing platform. This presents certain risks to our business, including:
| • | we cannot provide any assurance that these applications meet the same quality standards that we apply to our own development efforts, and to the extent they contain bugs or defects, they may create disruptions in our customers’ use of our software or negatively affect our brand; |
| • | we do not currently provide support for software applications developed by our partner ecosystem, and users may be left without support and potentially cease using our Good Dynamics platform if these ISVs, SIs and other third-party software developers do not provide adequate support for these applications; |
| • | these ISVs, SIs and third-party software developers may not possess the appropriate intellectual property rights to develop and share their applications; and |
| • | some of these ISVs, SIs and third-party software developers may use the insight they gain from using our software and from documentation publicly available to develop competing products or product features. |
Many of these risks are not within our control to prevent, and our brand may be damaged if these applications do not perform to our customers’ satisfaction and that dissatisfaction is attributed to us.
If poor advice or misinformation is spread through our online communities, our customers who implement such advice may experience unsatisfactory results from using our solution, which could adversely affect our reputation and our ability to grow our business.
Our online communities provide us with a network of active users and developers who promote the usage of our solution and provide technical support to one another. We do not review or test the information that these users and developers, who are not our employees, provide in these online communities to ensure its accuracy or efficacy in resolving technical issues. Therefore, we cannot guarantee that all information provided in our online communities is accurate or that it will not adversely affect the performance of our solution. Furthermore, users who post such information may not have adequate rights to the information to share it publicly, and we could be the subject of intellectual property claims based on our hosting of such information. If poor advice or misinformation is spread among members of our online communities, our customers may experience
23
Table of Contents
unsatisfactory results from using our solution, which could adversely affect our reputation and our ability to grow our business.
Adverse economic conditions may adversely impact our business.
Our business depends on the overall demand for IT and on the economic health of our current and prospective customers. In addition, the purchase of our products is often discretionary and may involve a significant commitment of capital and other resources. The global financial recession resulted in a significant weakening of the economy in the United States and Europe, in particular, more limited availability of credit, a reduction in business confidence and activity, deficit-driven austerity measures, and budgetary challenges that continue to impact enterprises and governments. In particular, our business in Europe continues to be adversely affected by weakness in current economic conditions. If economic conditions in the United States, Europe and other key markets for our products continue to remain uncertain or deteriorate further, many customers may delay or reduce their IT spending. This could result in reductions in sales of our solution, longer sales cycles, slower adoption of new technologies and increased price competition. Any of these events would likely harm our business, operating results and financial condition. In addition, there can be no assurance that IT spending levels will increase following any sustained recovery.
If we are not able to maintain and enhance our brand, our business and operating results may be adversely affected.
We believe that maintaining and enhancing the “Good” brand identity is critical to our relationships with our customers and ISVs and to our ability to attract new customers. The successful promotion of our brand will depend largely upon our marketing efforts, our ability to continue to offer a high-quality solution and our ability to successfully differentiate our solution from those of our competitors. While we intend to increase our investment in marketing our brand, our brand promotion activities may not be successful or yield increased revenues. In addition, independent industry analysts often provide reviews of our product, as well as those of our competitors, and perception of our products in the marketplace may be significantly influenced by these reviews. If these reviews are negative, or less positive as compared to those of our competitors’ products and services, our brand may be adversely affected. In addition, competitors may disseminate misinformation about us or our products, and we will need to expend resources to defend against such misinformation to protect our brand.
Failure to protect our intellectual property rights could adversely affect our business.
Our success depends, in part, on our ability to protect proprietary methods and technologies that we develop under patent and other intellectual property laws of the United States and other countries, so that we can prevent others from using our inventions and proprietary information. If we fail to protect our intellectual property rights adequately, our competitors might gain access to our technology, and our business might be adversely affected. However, defending our intellectual property rights might entail significant expenses. Any of our patent rights, copyrights, trademarks or other intellectual property rights may be challenged by others or invalidated through administrative process or litigation. Our patents, and any patents issued in the future, may not provide us with any competitive advantages or may be challenged by third parties, and our patent applications may never be granted at all. Additionally, the process of obtaining patent protection is expensive and time-consuming, and we may not be able to prosecute all necessary or desirable patent applications at a reasonable cost or in a timely manner. Even if issued, there can be no assurance that these patents will adequately protect our intellectual property, as the legal standards relating to the validity, enforceability and scope of protection of patent and other intellectual property rights are uncertain.
Any patents that are issued may subsequently be invalidated or otherwise limited, allowing other companies to develop offerings that compete with ours, which could adversely affect our competitive position, business prospects and financial condition. In addition, issuance of a patent does not guarantee that our patents will later be enforceable. We cannot be certain that third parties do not have blocking patents that could be used to prevent
24
Table of Contents
us from marketing or practicing our software or technology. Effective patent, trademark, copyright and trade secret protection may not be available to us in every country in which our products are available. The laws of some foreign countries may not be as protective of intellectual property rights as those in the United States (in particular, some foreign jurisdictions do not permit patent protection for software), and mechanisms for enforcement of intellectual property rights may be inadequate. Additional uncertainty may result from changes to intellectual property legislation enacted in the United States (including the recent America Invents Act) and other national governments and from interpretations of the intellectual property laws of the United States and other countries by applicable courts and agencies. Accordingly, despite our efforts, we may be unable to prevent third parties from infringing upon or misappropriating our intellectual property.
We also rely in part on trade secrets, proprietary know-how and other confidential information to maintain our competitive position. Although we endeavor to enter into non-disclosure agreements with our employees, licensees and others who may have access to this information, we cannot assure you that these agreements or other steps we have taken will prevent unauthorized use, disclosure or reverse engineering of our technology. Moreover, third parties may independently develop technologies or products that compete with ours, and we may be unable to prevent this competition.
We might be required to spend significant resources to monitor and protect our intellectual property rights. We have in the past initiated and may in the future continue to initiate claims and litigation against third parties for infringement of our proprietary rights or to establish the validity of our proprietary rights. For example, we recently filed complaints against two of our competitors alleging patent infringement and settled similar litigation with a third competitor. We are also litigating patent infringement claims with other third parties. Litigation puts our patents at risk of being invalidated or interpreted narrowly and our patent applications at risk of not issuing. We incur significant expenses in pursuing this litigation. Additionally, we may provoke third parties to assert counterclaims against us. We may not prevail in any lawsuits that we initiate, and the damages or other remedies awarded, if any, may not be commercially viable. Any litigation, whether or not it is resolved in our favor, could result in significant additional expense to us and divert the efforts of our technical and management personnel, which may adversely affect our business, operating results, financial condition and cash flows.
We may in the future be subject to intellectual property rights claims by third parties, which are extremely costly to defend, could require us to pay significant damages and could limit our ability to use certain technologies.
Companies in the software and technology industries, including some of our current and potential competitors, own large numbers of patents, copyrights, trademarks and trade secrets and frequently enter into litigation based on allegations of infringement or other violations of intellectual property rights. In addition, many of these companies have the capability to dedicate substantially greater resources to enforce their intellectual property rights and to defend claims that may be brought against them. The litigation may involve patent holding companies or other adverse patent owners that have no relevant product revenues and against which our patents may therefore provide little or no deterrence. We may receive notices that claim we have misappropriated, misused, or infringed other parties’ intellectual property rights, and, to the extent we gain greater market visibility, we face a higher risk of being the subject of intellectual property infringement claims, which is not uncommon with respect to our market. Any intellectual property claims, with or without merit, could be very time-consuming, could be expensive to settle or litigate and could divert our management’s attention and other resources. These claims could also subject us to significant liability for damages, potentially including treble damages if we are found to have willfully infringed patents or copyrights. These claims could also result in our having to stop using technology found to be in violation of a third party’s rights. We might be required to seek a license for the intellectual property, which may not be available on reasonable terms or at all. Even if a license were available, we could be required to pay significant royalties, which would increase our operating expenses. As a result, we may be required to develop alternative non-infringing technology, which could require significant effort and expense. If we cannot license or develop technology for any infringing aspect of our business, we would be forced to limit or stop sales of our products and may be unable to compete
25
Table of Contents
effectively. Any of these results would adversely affect our business, operating results, financial condition and cash flows.
We rely on the availability of third-party licenses.
Certain aspects of our solution include or are developed using software or other intellectual property licensed from third parties. As such, we are dependent on the availability of developer licenses from third parties such as operating system vendors to develop our solution. It may be necessary in the future to renew existing licenses or seek new licenses for various aspects of our solution. There can be no assurance that the necessary licenses would be available on acceptable terms, if at all. The inability to obtain certain licenses or other rights or to obtain such licenses or rights on favorable terms, or the need to engage in litigation regarding these matters, could result in delays in product releases until equivalent technology can be identified, licensed or developed, and integrated into our solution and may have a material adverse effect on our business, operating results and financial condition. Moreover, the inclusion in our solution of software or other intellectual property licensed from third parties on a nonexclusive basis could limit our ability to differentiate our solution from those of our competitors.
Some aspects of our solution incorporate “open source” software, and any failure to comply with the terms of one or more of these open source licenses could negatively affect our business.
Some aspects of our solution incorporate open source software, and we expect to continue to incorporate open source software in the future. Few of the licenses applicable to open source software have been interpreted by courts, and their application to the open source software integrated into our solution may be uncertain. If we fail to comply with these licenses, we may be subject to certain requirements, including requirements that we offer those components of our solution that incorporate the open source software for no cost, that we make available source code for modifications or derivative works we create based upon, incorporating or using the open source software, and that we license such modifications or derivative works under the terms of applicable open source licenses. If an author or other third party that distributes such open source software were to allege that we had not complied with the conditions of one or more of these licenses, we could be required to incur significant legal expenses defending against such allegations and could be subject to significant damages, enjoined from the sale of those components of our solution that contained the open source software and required to comply with the foregoing conditions, which could disrupt the distribution and sale of these components. In addition, there have been claims challenging the ownership of open source software against companies that incorporate open source software into their products. As a result, we could be subject to suits by parties claiming infringement due to the inclusion of certain open source software in various components of our solution. Litigation could be costly for us to defend, have a negative effect on our operating results and financial condition or require us to devote additional research and development resources to change our solution.
Our international sales and operations subject us to additional risks that may materially and adversely affect our business and operating results.
We market and sell our products throughout the world and have personnel in many parts of the world. In addition, we conduct, and expect to continue to conduct, a significant amount of our business with companies that are located outside the United States. Our international operations subject us to a variety of risks and challenges, including:
| • | increased management, travel, infrastructure and legal compliance costs associated with having multiple international operations; |
| • | longer payment cycles and difficulties in collecting accounts receivable or satisfying revenue recognition criteria, especially in emerging markets; |
| • | increased financial accounting and reporting burdens and complexities; |
| • | general economic conditions in each country or region; |
26
Table of Contents
| • | credit risk of our channel partners and customers; |
| • | compliance with foreign laws and regulations, in particular, laws and regulations relating to privacy, and the risks and costs of non-compliance with such laws and regulations; |
| • | compliance with laws and regulations for foreign operations, including the U.S. Foreign Corrupt Practices Act, the U.K. Bribery Act, import and export control laws, tariffs, trade barriers, economic sanctions and other regulatory or contractual limitations on our ability to sell our products in certain foreign markets, and the risks and costs of non-compliance; |
| • | fluctuations in currency exchange rates and related effect on our operating results; |
| • | reduced protection for intellectual property rights in some countries and practical difficulties of enforcing rights abroad; and |
| • | compliance with the laws of numerous foreign taxing jurisdictions and overlapping of different tax regimes. |
Any of these risks could adversely affect our international operations, reduce our international revenues, or increase our operating costs, any of which would adversely affect our business, operating results and financial condition and growth prospects.
If we fail to further develop and manage our distribution channels, our revenues could decline and our growth prospects could suffer.
We increasingly derive a significant portion of our revenues from sales of our software and services through channel partners, including value-added distributors, value-added resellers and managed-service providers. We also work with carrier partners that resell our secure mobile computing solution to their enterprise customers. Finally, we utilize partners as our primary channel to serve enterprises that have less than approximately $500 million in annual revenues and to augment our direct sales force in international markets. Resellers are also an important source of sales for us to customers in the U.S. public sector, such as government agencies.
We anticipate that we will continue to derive a substantial portion of our sales through channel partners and resellers, including parties with which we have not yet developed relationships. We expect that channel sales will represent most of our U.S. government and a substantial portion of our international sales for the foreseeable future and a growing portion of our U.S. sales, especially with respect to sales to small- and medium-sized businesses. We may be unable to recruit additional channel partners and successfully expand our channel strategy. If we do not successfully execute our strategy to increase channel sales, particularly to further penetrate the mid-market, our growth prospects may be materially and adversely affected.
Our agreements with our channel partners are generally non-exclusive, and many of our channel partners may also have relationships with our competitors. If we do not invest an appropriate amount of resources to train and develop our channel partners or if our channel partners do not effectively market and sell our solution, or if they choose to place greater emphasis on products of their own or those offered by our competitors, or if they fail to meet the needs of our customers, our ability to grow our business and sell our solution may be adversely affected, particularly in the public sector, the mid-market and internationally. Similarly, the loss of a substantial number of our channel partners, which may cease marketing our software and services with limited or no notice and with little or no penalty, and any inability to timely replace them or recruit additional channel partners, or any reduction or delay in channel sales of our software and services or conflicts between channel sales and our direct sales strategy could materially and adversely affect our operating results. In addition, changes in the proportion of our revenues attributable to sales by channel partners, which involve different costs and risks than our direct sales, may cause our operating results to fluctuate from period to period.
27
Table of Contents
A portion of our revenues is generated by sales to government entities, which are subject to a number of challenges and risks.
Historically, a portion of our revenues have been attributed to the sale of our software and services to government entities, and we expect to continue to pursue such sales in the future. Selling to government entities can be highly competitive, expensive and time consuming, and often requires significant upfront time and expense without any assurance that such investment will result in a sale. Certain government entities, such as the intelligence and law enforcement agencies, may have more stringent and lengthy product evaluation and security requirements than customers in the commercial sector. Government demand and payment for our software and services may be impacted by public sector budgetary cycles and funding authorizations, particularly in light of U.S. budgetary challenges and concerns regarding the federal government budget sequestration, with funding reductions or delays adversely affecting public sector demand for our software and services.
Most of our sales to government entities have been indirect through our resellers. Government entities may have contractual or other legal rights to terminate contracts with our resellers for convenience or due to a default, and any such termination may adversely impact our future operating results.
Factors that could also impede our ability to maintain or increase the amount of revenues derived from government customers include:
| • | changes in fiscal or contracting policies; |
| • | changes in government programs or applicable requirements; |
| • | the adoption of new laws or regulations or changes to existing laws or regulations; |
| • | failure to comply with laws and regulations relating to the formation, administration and performance of contracts with government entities; |
| • | potential delays or changes in the government appropriations or other funding authorization processes; |
| • | delays in payment by government payment offices; and |
| • | need to comply with pricing requirements for government sales. |
The occurrence of any of the foregoing could cause governments and governmental agencies to delay or refrain from purchasing our software and services in the future or otherwise have an adverse effect on our business, operating results, financial condition and cash flows.
We have made and expect to continue to make acquisitions that could disrupt our operations and harm our operating results.
We intend to continue to address the need to develop new products and enhance our existing software and services through acquisitions of other companies, product lines, technologies and personnel. Acquisitions involve numerous risks, including the following:
| • | difficulties in integrating the operations, systems, technologies, products and personnel of the acquired companies; |
| • | diversion of management’s attention from normal daily operations of the business and the challenges of managing larger and more widespread operations resulting from acquisitions; |
| • | potential difficulties in completing projects associated with research and development of the acquired business; |
| • | difficulties in entering markets in which we have no or limited direct prior experience and where competitors in such markets have stronger market positions; |
| • | in the case of foreign acquisitions, the need to integrate operations across different cultures and languages and to address the particular economic, currency, political and regulatory risks associated with specific countries; |
28
Table of Contents
| • | insufficient revenues to offset increased expenses associated with acquisitions; and |
| • | the potential loss of key employees, customers, distributors, vendors and other business partners of the companies we acquire following and continuing after the announcement of our acquisition plans. |
Acquisitions may also cause us to:
| • | issue capital stock that would dilute our current stockholders’ percentage ownership; |
| • | use significant portions of our cash; |
| • | assume liabilities or incur debt; |
| • | record goodwill and nonamortizable intangible assets that are subject to impairment testing on a regular basis and potential periodic impairment charges; |
| • | incur amortization expenses related to certain intangible assets; |
| • | incur tax expenses related to the effect of acquisitions; |
| • | incur large restructuring and other related expenses; and |
| • | become subject to intellectual property or other litigation. |
Mergers and acquisitions of high-technology companies are inherently risky and subject to many factors outside of our control, and no assurance can be given that our previous or future acquisitions will be successful. Failure to manage and successfully integrate acquisitions could materially harm our business and operating results. Even when an acquired company has already developed and marketed products, there can be no assurance that product enhancements will be made in a timely fashion or that pre-acquisition due diligence will identify all possible issues that might arise.
From time to time, we have made acquisitions that resulted in accounting charges in an individual quarter. These charges may occur in any particular quarter, resulting in variability in our quarterly operating results.
Governmental regulations affecting the import or export of products or affecting products containing encryption capabilities could negatively affect our revenues.
U.S. and various foreign governments have or may impose controls, export license requirements and restrictions on the import or export of some technologies, including encryption technology. In addition, from time to time, governmental agencies have proposed varying additional regulation of encryption technology, such as requiring certification, notifications, review of source code, or the escrow and governmental recovery of private encryption keys. Governmental regulation of encryption technology and regulation of imports or exports, or our failure to obtain required import or export approval for sales of our solution or make required filings, could harm our international and domestic sales and adversely affect our revenues. Complying with such regulations could also require us to devote additional research and development resources to change our software or services or alter the methods by which we make them available, which could be costly. In addition, failure to comply with such regulations could result in penalties, costs and restrictions on import or export privileges or adversely affect sales to government agencies or government funded projects.
Our business is subject to the risks of earthquakes, fire, floods, other natural catastrophic events and man-made problems such as power disruptions or terrorism.
A significant natural disaster, such as an earthquake, tsunami, fire or a flood, or a significant power outage could have a material adverse impact on our business, operating results and financial condition. Our corporate headquarters and our Good Secure Cloud network operations centers are located in Santa Clara, California and Seattle, Washington. These regions are known for seismic or volcanic activity. Further, if a natural disaster
29
Table of Contents
occurs in a region from which we derive a significant portion of our revenues, customers in that region may delay or forego purchases of our software and services, which may materially and adversely impact our operating results for a particular period. In addition, acts of terrorism could cause disruptions in our business or the business of our partners, customers or the economy as a whole. All of the aforementioned risks may be augmented if our disaster recovery plans prove to be inadequate. To the extent that any of the above results in delays or cancellations of customer orders, our business, financial condition and operating results would be adversely affected.
The enactment of legislation implementing changes in the U.S. taxation of international business activities or the adoption of other tax reform policies could materially impact our financial position and results of operations.
Recent changes to U.S. tax laws, including limitations on the ability of taxpayers to claim and utilize foreign tax credits and the deferral of certain tax deductions until earnings outside of the United States are repatriated to the United States, as well as changes to U.S. tax laws that may be enacted in the future, could impact the tax treatment of our foreign earnings. Due to expansion of our international business activities, any changes in the U.S. taxation of such activities may increase our worldwide effective tax rate and adversely affect our financial condition and operating results.
Our international operations subject us to potentially adverse tax consequences.
We generally conduct our international operations through wholly-owned subsidiaries and report our taxable income in various jurisdictions worldwide based upon our business operations in those jurisdictions. Our intercompany relationships are subject to complex transfer pricing regulations administered by taxing authorities in various jurisdictions. The relevant taxing authorities may disagree with our determinations as to the income and expenses attributable to specific jurisdictions. If such a disagreement were to occur, and our position were not sustained, we could be required to pay additional taxes, interest and penalties, which could result in one-time tax charges, higher effective tax rates, reduced cash flows and lower overall profitability of our operations. We believe that our financial statements reflect adequate reserves to cover such a contingency, but there can be no assurances in that regard.
We could be subject to additional tax liabilities.
We are subject to federal, state, local and sales taxes in the United States and foreign taxes and value-added taxes in numerous foreign jurisdictions. Significant judgment is required in evaluating our tax positions and our worldwide provision for taxes. During the ordinary course of business, there are many activities and transactions for which the ultimate tax determination is uncertain. In addition, our tax obligations and effective tax rates could be adversely affected by changes in the relevant tax, accounting and other laws, regulations, principles and interpretations, including those relating to income tax nexus, by our earnings being lower than anticipated in jurisdictions where we have lower statutory rates and higher than anticipated in jurisdictions where we have higher statutory rates, by changes in foreign currency exchange rates, or by changes in the valuation of our deferred tax assets and liabilities. We may be audited in various jurisdictions, and such jurisdictions may assess additional taxes, sales taxes and value-added taxes against us. Although we believe our tax estimates are reasonable, the final determination of any tax audits or litigation could be materially different from our historical tax provisions and accruals, which could have a material adverse effect on our operating results or cash flows in the period or periods for which a determination is made.
Our ability to use our net operating losses to offset future taxable income may be subject to certain limitations.
In general, under Section 382 of the Internal Revenue Code of 1986, as amended, or the Code, a corporation that undergoes an “ownership change” is subject to limitations on its ability to utilize its pre-change net operating
30
Table of Contents
losses, or NOLs, to offset future taxable income. Our existing NOLs may be subject to limitations arising from previous ownership changes, and if we undergo an ownership change in connection with or after this offering, our ability to utilize NOLs could be further limited by Section 382 of the Code. Future changes in our stock ownership, some of which are outside of our control, could result in an ownership change under Section 382 of the Code. Furthermore, our ability to utilize NOLs of companies that we may acquire in the future may be subject to limitations. There is also a risk that due to regulatory changes, such as suspensions on the use of NOLs, or other unforeseen reasons, our existing NOLs could expire or otherwise be unavailable to offset future income tax liabilities. For these reasons, we may not be able to utilize a material portion of the NOLs reflected on our balance sheet, even if we attain profitability.
Our reported financial results may be adversely affected by changes in accounting principles applicable to us.
Generally, accepted accounting principles in the United States are subject to interpretation by the Financial Accounting Standards Board, or FASB, the Securities Exchange Commission, or SEC, and other bodies formed to promulgate and interpret appropriate accounting principles. A change in these principles or interpretations could have a significant effect on our reported financial results and could affect the reporting of transactions completed before the announcement of a change. Any such change could have a significant effect on our reported financial results.
If our estimates relating to our critical accounting policies are based on assumptions or judgments that change or prove to be incorrect, our operating results could change materially.
The preparation of financial statements in conformity with generally accepted accounting principles requires our management to make estimates, assumptions and judgments that affect the amounts reported in our consolidated financial statements and accompanying notes. We base our estimates on historical experience and on various other assumptions, the results of which form the basis for making judgments about the carrying values of assets and liabilities that are not readily apparent from other sources. If our assumptions change or if actual circumstances differ from those in our assumptions, our operating results may be adversely affected. Significant estimates, assumptions and judgments used in preparing our consolidated financial statements include those related to revenue recognition, including the term over which we recognize revenues, fair value of assets acquired and liabilities assumed in business combinations, implied fair value of goodwill, provision for income taxes and the fair value of stock options issued.
The requirements of being a public company may strain our systems and resources, divert management’s attention and be costly.
As a public company, we will be subject to the reporting requirements of the Securities Exchange Act of 1934, or the Exchange Act, the Sarbanes-Oxley Act of 2002, or Sarbanes-Oxley Act, the recently enacted Dodd-Frank Wall Street Reform and Consumer Protection Act, or Dodd-Frank Act, and the rules and regulations of the . Compliance with the requirements of these rules and regulations will increase our legal, accounting and finance costs, will make some activities more difficult, time-consuming and costly, and may also place undue strain on our personnel, systems and resources.
The Exchange Act requires, among other things, that we file annual, quarterly and current reports with respect to our business and operating results. The Sarbanes-Oxley Act requires, among other things, that we maintain internal control over financial reporting and disclosure controls and procedures. We are continuing the costly process of implementing and testing our systems to report our results as a public company, to continue to manage our growth and to implement internal control over financial reporting. We will be required to implement and maintain various other control and business systems related to our equity, finance, treasury, information technology, other recordkeeping systems and other operations. As a result of this implementation and maintenance, management’s attention may be diverted from other business concerns, which could adversely
31
Table of Contents
affect our business. Furthermore, we rely on third-party software and system providers for ensuring our reporting obligations and the effectiveness of certain of our internal controls, and to the extent these third parties fail to provide adequate service, including as a result of any inability to scale to handle our growth and the imposition of these increased reporting and internal controls and procedures, we could incur material costs for upgrading or switching systems, and our business could be materially affected.
In addition, changing laws, regulations and standards relating to corporate governance and public disclosure are creating uncertainty for public companies, increasing legal and financial compliance costs and making some activities more time consuming. These laws, regulations and standards are subject to varying interpretations, in many cases due to their lack of specificity, and as a result, their application in practice may evolve over time as new guidance is provided by regulatory and governing bodies. This could result in continuing uncertainty regarding compliance matters and higher costs necessitated by ongoing revisions to disclosure and governance practices. We intend to invest resources to comply with evolving laws, regulations and standards, and this investment may result in increased general and administrative expenses and a diversion of management’s time and attention from revenue-generating activities to compliance activities. If our efforts to comply with new laws, regulations and standards differ from the activities intended by regulatory or governing bodies due to ambiguities related to their application and practice, regulatory authorities may initiate legal proceedings against us and our business may be adversely affected.
In addition, we expect these laws, rules and regulations to make it more difficult and more expensive for us to obtain director and officer liability insurance, and we may be required to incur substantial costs to maintain appropriate levels of coverage. These factors could also make it more difficult for us to attract and retain qualified members of our board of directors, particularly to serve on our audit committee, and qualified executive officers.
As a result of disclosure of information in this prospectus and in filings required of a public company, our business and financial condition will become more visible, which we believe may result in threatened or actual litigation, including by competitors and other third parties. If such claims are successful, our business and operating results could be adversely affected, and even if the claims do not result in litigation or are resolved in our favor, these claims, and the time and resources necessary to resolve them, could divert the time and resources of our management and adversely affect our business and operating results.
Failure to comply with laws and regulations could harm our business.
Our business is subject to regulation by various federal, state, local and foreign governmental agencies, including agencies responsible for monitoring and enforcing employment and labor laws, workplace safety, environmental laws, anti-bribery laws, privacy laws, import/export controls, federal securities laws and tax laws and regulations. In certain jurisdictions, these regulatory requirements may be more stringent than those in the United States, and may continue to evolve, resulting in higher compliance costs for us. Noncompliance with applicable regulations or requirements could subject us to investigations, sanctions, mandatory recalls, enforcement actions, disgorgement of profits, fines, damages, civil and criminal penalties or injunctions. If any governmental sanctions are imposed, or if we do not prevail in any possible civil or criminal litigation, our business, operating results and financial condition could be harmed. In addition, responding to any action will likely result in a significant diversion of management’s attention and resources and an increase in professional fees. Enforcement actions and sanctions could further harm our business, operating results and financial condition.
32
Table of Contents
Risks Related to this Offering and Ownership of Our Common Stock
There has been no prior market for our common stock and an active market may not develop or be sustained, and you may not be able to resell your shares at or above the initial public offering price, if at all.
There has been no public market for our common stock prior to this offering. The initial public offering price for our common stock will be determined through negotiations between the underwriters and us and may vary from the market price of our common stock following this offering. If you purchase shares of our common stock in this offering, you may not be able to resell those shares at or above the initial public offering price. An active or liquid market in our common stock may not develop upon closing of this offering or, if it does develop, it may not be sustainable, which could adversely affect your ability to sell your shares and could depress the market price of our common stock.
Our stock price may be volatile and may decline regardless of our operating performance resulting in substantial losses for investors purchasing shares in this offering.
The trading prices of the securities of technology companies have been highly volatile. The market price of our common stock may fluctuate significantly in response to numerous factors, many of which are beyond our control, including:
| • | announcements by us or our competitors of significant technical innovations, acquisitions, customer wins, strategic partnerships, joint ventures or capital commitments; |
| • | the financial projections we may provide to the public, any changes in these projections or our failure to meet these projections; |
| • | failure of securities analysts to initiate or maintain coverage of us, changes in ratings and financial estimates by any securities analysts who follow our company, or our failure to meet these estimates or the expectations of investors; |
| • | changes in operating performance and stock market valuations of software or other technology companies, or those in our industry, including mobile device and operating system manufacturers, in particular; |
| • | price and volume fluctuations in the trading of our common stock and in the overall stock market, including as a result of trends in the economy as a whole; |
| • | announcements by us with regard to the effectiveness of our internal controls and our ability to accurately report financial results; |
| • | new laws or regulations or new interpretations of existing laws or regulations applicable to our business our industry; |
| • | lawsuits threatened or filed by or against us; |
| • | changes in key personnel; and |
| • | other events or factors, including those resulting from war, incidents of terrorism or responses to these events. |
In addition, the stock markets have experienced extreme price and volume fluctuations that have affected and continue to affect the market prices of equity securities of many technology companies. Stock prices of many technology companies have fluctuated in a manner unrelated or disproportionate to the operating performance of those companies.
33
Table of Contents
In the past, stockholders have instituted securities class action litigation following periods of market volatility. If we were to become involved in securities litigation, it could subject us to substantial costs, divert resources and the attention of management from our business and adversely affect our business.
If securities or industry analysts do not publish research or publish inaccurate or unfavorable research about our business, our stock price and trading volume could decline.
The trading market for our common stock will depend in part on the research and reports that securities or industry analysts publish about us or our business. If we do not establish and maintain adequate research coverage or if one or more of the analysts who covers us downgrades our stock or publishes inaccurate or unfavorable research about our business or industry, our stock price would likely decline. If one or more of these analysts ceases coverage of our company or fails to publish reports on us regularly, demand for our stock could decrease, which could cause our stock price and trading volume to decline.
As a public company, we will be obligated to develop and maintain proper and effective internal control over financial reporting. We may not complete our analysis of our internal control over financial reporting in a timely manner, or these internal controls may not be determined to be effective, which may adversely affect investor confidence in our company and, as a result, the value of our common stock.
We will be required, pursuant to Section 404 of the Sarbanes-Oxley Act, to furnish a report by management on, among other things, the effectiveness of our internal control over financial reporting commencing as soon as our annual report covering the year ending December 31, 2014. This assessment will need to include disclosure of any material weaknesses identified by our management in our internal control over financial reporting. Prior to this offering, we have never been required to test our internal controls within a specified period, and, as a result, we may experience difficulty in meeting these reporting requirements in a timely manner, particularly if material weaknesses persist.
In the past a material weakness was identified in our internal financial and accounting controls and procedures. During our fiscal year 2012, we did not have a sufficient number of qualified personnel with the appropriate experience to review certain cash reconciliations and the deferred commissions reconciliation to ensure that they were completed accurately and timely. Specifically the lack of review by qualified personnel resulted in audit adjustments in cash and cash equivalents, accounts payable, deferred commissions and sales and marketing expense. Additionally, it is possible that this control deficiency could result in further misstatements to the aforementioned accounts that would result in a material misstatement to the annual or interim consolidated financial statements that would not be prevented or detected. Accordingly, we have determined that this control deficiency constitutes a material weakness as of December 31, 2012. We may be unable to remediate this material weakness in a timely manner.
In addition, our independent registered public accounting firm will not be required to formally attest to the effectiveness of our internal control over financial reporting pursuant to Section 404 until the later of the year following our first annual report required to be filed with the SEC, or the date we are no longer an ‘‘emerging growth company’’ as defined in the Jumpstart Our Business Startups Act of 2012, or the JOBS Act. If we are unable to comply with the requirements of Section 404 in a timely manner, the market price of our common stock could decline, and we could be subject to sanctions or investigations by the stock exchange on which our common stock is listed, the SEC or other regulatory authorities, which would require additional financial and management resources. Any failure to develop or maintain effective controls, or any difficulties encountered in their implementation or improvement, could harm our operating results or cause us to fail to meet our reporting obligations. Any failure to implement and maintain effective internal controls also could adversely affect the results of periodic management evaluations regarding the effectiveness of our internal control over financial reporting. Ineffective disclosure controls and procedures or internal control over financial reporting could also cause investors to lose confidence in our reported financial and other information, which would likely have a negative effect on the trading price of our common stock.
34
Table of Contents
Implementing any appropriate changes to our internal control over financial reporting may require specific compliance training of our directors, officers and employees, entail substantial costs in order to modify our existing accounting systems, and take a significant period of time to complete. Such changes may not, however, be effective in maintaining the adequacy of our internal controls, and any failure to maintain that adequacy, or consequent inability to produce accurate financial statements on a timely basis, could increase our operating costs and could materially impair our ability to operate our business. In the event that we are not able to demonstrate compliance with Section 404 of the Sarbanes-Oxley Act in a timely manner, that our internal controls are perceived as inadequate or that we are unable to produce timely or accurate financial statements, investors may lose confidence in our operating results and our stock price could decline.
We do not expect to pay any cash dividends for the foreseeable future.
We do not anticipate that we will pay any cash dividends on shares of our common stock for the foreseeable future. Any determination to pay dividends in the future will be at the discretion of our board of directors and will depend upon operating results, financial condition, contractual restrictions, restrictions imposed by applicable law and other factors our board of directors deems relevant. Accordingly, if you purchase shares in this offering, realization of a gain on your investment will depend on the appreciation of the price of our common stock, which may never occur. Investors seeking cash dividends in the foreseeable future should not purchase our common stock.
Our failure to raise additional capital or generate the significant capital necessary to expand our operations and invest in new products could reduce our ability to compete and could harm our business.
We expect that our existing cash and cash equivalents will be sufficient to meet our anticipated cash needs for at least the next 12 months. After that, we may need to raise additional funds, and we may not be able to obtain additional debt or equity financing on favorable terms, if at all. If we raise additional equity financing, our stockholders may experience significant dilution of their ownership interests and the per share value of our common stock could decline. Furthermore, if we engage in debt financing, the holders of debt would have priority over the holders of common stock and we may be required to accept terms that restrict our ability to incur additional indebtedness, and take other actions that would otherwise be in the interests of the stockholders and force us to maintain specified liquidity or other ratios, any of which could harm our business, operating results and financial condition. If we need additional capital and cannot raise it on acceptable terms, we may not be able to, among other things:
| • | develop or enhance our products and services; |
| • | continue to expand our sales and marketing and research and development organizations; |
| • | acquire complementary technologies, products or businesses; |
| • | expand operations, in the United States or internationally; |
| • | hire, train and retain employees; or |
| • | respond to competitive pressures or unanticipated working capital requirements. |
Our failure to do any of these things could seriously harm our business, financial condition and operating results.
Concentration of ownership among our existing executive officers, directors and their affiliates may prevent new investors from influencing significant corporate decisions.
Upon completion of this offering, our executive officers, directors and their affiliates will beneficially own a substantial amount of our outstanding common stock. As a result, these stockholders will be able to exercise a significant level of control over all matters requiring stockholder approval, including the election of directors, amendment of our certificate of incorporation and approval of significant corporate transactions. This control
35
Table of Contents
could have the effect of delaying or preventing a change of control of our company or changes in management and will make the approval of certain transactions difficult or impossible without the support of these stockholders.
Substantial future sales of shares of our common stock by existing stockholders could depress the market price of our common stock.
The market price for our common stock could decline as a result of the sale of substantial amounts of our common stock, particularly sales by our directors, executive officers and significant stockholders, a large number of shares of our common stock becoming available for sale or the perception in the market that holders of a large number of shares intend to sell their shares. Based on 159,142,812 shares outstanding as of December 31, 2012, upon completion of this offering, we will have outstanding approximately shares of common stock, approximately of which are subject to the 180-day contractual lock-up more fully described in ‘‘Underwriters.’’ Morgan Stanley & Co. LLC and Barclays Capital Inc. may permit our officers, directors, employees and current stockholders to sell shares prior to the expiration of the lock-up agreements.
After this offering, holders of an aggregate of shares of our common stock as of December 31, 2012, will have rights, subject to some conditions, to require us to file registration statements covering their shares or to include their shares in registration statements that we may file for ourselves or our stockholders. Substantially all of these shares are subject to the 180-day contractual lock-up referred to above.
In addition, the shares of common stock subject to outstanding options under our equity incentive plans and the shares reserved for future issuance under our equity incentive plans will become eligible for sale in the public market in the future, subject to certain legal and contractual limitations. See ‘‘Shares Eligible for Future Sale’’ for a more detailed description of sales that may occur in the future.
If a substantial number of shares are sold, or if it is perceived that they will be sold, in the public market, before or after the expiration of the 180-day contractual lock-up period, the trading price of our common stock could decline substantially.
Anti-takeover provisions in our charter documents and Delaware law may delay or prevent an acquisition of our company.
Our amended and restated certificate of incorporation, amended and restated bylaws and Delaware law contain provisions that may have the effect of delaying or preventing a change in control of us or changes in our management. Our amended and restated certificate of incorporation and bylaws, which will become effective upon the closing of this offering, include provisions that:
| • | authorize “blank check” preferred stock, which could be issued by the board without stockholder approval and may contain voting, liquidation, dividend and other rights superior to our common stock; |
| • | create a classified board of directors whose members serve staggered three-year terms; |
| • | specify that special meetings of our stockholders can be called only by our board of directors, the chairperson of the board, the chief executive officer or the president; |
| • | prohibit stockholder action by written consent; |
| • | establish an advance notice procedure for stockholder approvals to be brought before an annual meeting of our stockholders, including proposed nominations of persons for election to our board of directors; |
| • | provide that our directors may be removed only for cause; |
| • | provide that vacancies on our board of directors may be filled only by a majority of directors then in office, even though less than a quorum; |
36
Table of Contents
| • | specify that no stockholder is permitted to cumulate votes at any election of directors; |
| • | authorize our board of directors to modify, alter or repeal our amended and restated bylaws; and |
| • | require supermajority votes of the holders of our common stock to amend specified provisions of our charter documents. |
These provisions, alone or together, could delay or prevent hostile takeovers and changes in control or changes in our management.
In addition, because we are incorporated in Delaware, we are governed by the provisions of Section 203 of the Delaware General Corporation Law, which limits the ability of stockholders owning in excess of 15% of our outstanding voting stock to merge or combine with us in certain circumstances.
Any provision of our amended and restated certificate of incorporation or amended and restated bylaws or Delaware law that has the effect of delaying or deterring a change in control could limit the opportunity for our stockholders to receive a premium for their shares of our common stock, and could also affect the price that some investors are willing to pay for our common stock.
If you purchase shares of our common stock in this offering, you will experience substantial and immediate dilution.
If you purchase shares of our common stock in this offering, you will experience substantial and immediate dilution in the pro forma net tangible book value per share after giving effect to this offering of $ per share as of December 31, 2012, based on an assumed initial public offering price of $ �� per share, the midpoint of the range set forth on the cover page of this prospectus, because the price that you pay will be substantially greater than the pro forma net tangible book value per share of the common stock that you acquire. This dilution is due in large part to the fact that our earlier investors paid substantially less than the initial public offering price when they purchased their shares of our capital stock. You will experience additional dilution upon exercise of any warrant, upon exercise of options to purchase common stock under our equity incentive plans, if we issue restricted stock to our employees under our equity incentive plans or if we otherwise issue additional shares of our common stock. For a further description of the dilution that you will experience immediately after this offering, see ‘‘Dilution.’’
Our management will have broad discretion over the use of the proceeds we receive in this offering and might not apply the proceeds in ways that increase the value of your investment.
Our management will have broad discretion to use the net proceeds from this offering, and you will be relying on the judgment of our management regarding the application of these proceeds. Our management might not apply the net proceeds of this offering in ways that increase the value of your investment. We intend to use the net proceeds from this offering for working capital and other general corporate purposes. We may use a portion of the net proceeds to us to expand our current business through acquisitions of other businesses, products and technologies. Until we use the net proceeds from this offering, we plan to invest them, and these investments may not yield a favorable rate of return. If we do not invest or apply the net proceeds from this offering in ways that enhance stockholder value, we may fail to achieve expected financial results, which could cause our stock price to decline.
We are an ‘‘emerging growth company’’ and the reduced disclosure requirements applicable to emerging growth companies may make our common stock less attractive to investors.
We are an “emerging growth company,” as defined in the JOBS Act, and we may take advantage of certain exemptions from various reporting requirements that are applicable to other public companies that are not ‘‘emerging growth companies’’ including, but not limited to, not being required to comply with the auditor
37
Table of Contents
attestation requirements of Section 404 of the Sarbanes-Oxley Act, reduced financial disclosure obligations, reduced disclosure obligations regarding executive compensation in our periodic reports and proxy statements, and exemptions from the requirements of holding a nonbinding advisory vote on executive compensation and any golden parachute payments not previously approved. We may take advantage of these provisions for up to five years or such earlier time that we are no longer an “emerging growth company.” We would cease to be an “emerging growth company” upon the earliest to occur of: the last day of the fiscal year in which we have more than $1.0 billion in annual revenue; the date we qualify as a ‘‘large accelerated filer,’’ with at least $700 million of equity securities held by non-affiliates; the issuance, in any three-year period, by us of more than $1.0 billion in non-convertible debt securities; and the last day of the fiscal year ending after the fifth anniversary of our initial public offering. We may choose to take advantage of some but not all of these reduced reporting burdens. If we take advantage of any of these reduced reporting burdens in future filings, the information that we provide our security holders may be different than you might receive from other public companies in which you hold equity interests. We cannot predict if investors will find our common stock less attractive because we may rely on these exemptions. If some investors find our common stock less attractive as a result, there may be a less active trading market for our common stock and our stock price may be more volatile.
In addition, Section 107 of the JOBS Act provides that an ‘‘emerging growth company’’ can take advantage of the extended transition period provided in Section 7(a)(2)(B) of the Securities Act for complying with new or revised accounting standards. In other words, an ‘‘emerging growth company’’ can delay the adoption of certain accounting standards until those standards would otherwise apply to private companies. However, we have chosen to ‘‘opt out’’ of such extended transition period, and as a result, we will comply with new or revised accounting standards on the relevant dates on which adoption of such standards is required for non-emerging growth companies. Section 107 of the JOBS Act provides that our decision to opt out of the extended transition period for complying with new or revised accounting standards is irrevocable.
38
Table of Contents
SPECIAL NOTE REGARDING FORWARD-LOOKING STATEMENTS
This prospectus includes forward-looking statements. All statements other than statements of historical facts contained in this prospectus, including statements regarding our future results of operations and financial position, business strategy and plans, and our objectives for future operations, are forward-looking statements. The words “believe,” “may,” “will,” “potentially,” “estimate,” “continue,” “anticipate,” “intend,” “could,” “would,” “project,” “plan,” “expect” and similar expressions that convey uncertainty of future events or outcomes are intended to identify forward looking statements. Forward-looking statements include information concerning:
| • | our financial performance, including our revenues, cost of revenues, operating expenses, ability to generate positive cash flow and ability to attain and sustain profitability; |
| • | our business plan and our ability to effectively manage our growth; |
| • | our ability to attract and retain customers; |
| • | our ability to drive increased use cases for our software with new and existing customers; |
| • | our ability to extend our leadership position in secure mobile computing and mobile applications; |
| • | our ability to increase the development by customers, partners and third-party developers of applications for our Good Dynamics platform; |
| • | our ability to timely and effectively scale and adapt our existing technology; |
| • | our ability to adapt to changing market conditions; |
| • | our expectations regarding the expansion and use of mobile computing in businesses and by their employees, suppliers and customers; |
| • | our ability to develop new products and services and bring them to market in a timely manner; |
| • | our ability to manage our international operations and to enter new markets internationally; |
| • | the effects of increased competition in our markets and our ability to compete effectively; |
| • | the effects of seasonal trends on our results of operations; |
| • | our expectations concerning relationships with third parties, including channel partners, resellers, and logistics providers; |
| • | our ability to attract and retain qualified employees and key personnel; |
| • | our ability to maintain, protect, and enhance our brand and intellectual property; and |
| • | future acquisitions of, or investments in, complementary companies, products, services, or technologies. |
We have based these forward-looking statements largely on our current expectations and projections about future events and financial trends that we believe may affect our financial condition, results of operations, business strategy, short-term and long-term business operations and objectives, and financial needs. These forward-looking statements are subject to a number of risks, uncertainties and assumptions, including those described in “Risk Factors.” Moreover, we operate in a very competitive and rapidly changing market. New risks emerge from time-to-time. It is not possible for our management to predict all risks, nor can we assess the impact of all factors on our business or the extent to which any factor, or combination of factors, may cause actual results to differ materially from those contained in any forward looking statements we may make. In light of these risks, uncertainties and assumptions, the forward-looking events and circumstances discussed in this prospectus may not occur and actual results could differ materially and adversely from those anticipated or implied in the forward looking statements.
You should not rely upon forward-looking statements as predictions of future events. Although we believe that the expectations reflected in the forward looking statements are reasonable, we cannot guarantee that the
39
Table of Contents
future results, levels of activity, performance or events and circumstances reflected in the forward looking statements will be achieved or occur. Moreover, neither we nor any other person assumes responsibility for the accuracy and completeness of the forward looking statements. We undertake no obligation to update publicly any forward looking statements for any reason after the date of this prospectus to conform these statements to actual results or to changes in our expectations. You should read this prospectus and the documents that we reference in this prospectus and have filed with the SEC as exhibits to the registration statement of which this prospectus is a part with the understanding that our actual future results, levels of activity and performance, as well as other events and circumstances may be materially different from what we expect.
40
Table of Contents
Unless otherwise indicated, information contained in this prospectus concerning our industry and the markets in which we operate, including our general expectations and market position, market opportunity, and market size, is based on information from various sources, including Cisco’s Visual Networking Index, Gartner, Inc., or Gartner, International Data Corporation, or IDC, and IDG Research Services, or IDG, on assumptions that we have made that are based on those data and other similar sources and on our knowledge of the markets for our products and services. This information involves a number of assumptions and limitations, and you are cautioned not to give undue weight to such estimates. In addition, projections, assumptions and estimates of our future performance and the future performance of the industry in which we operate is necessarily subject to a high degree of uncertainty and risk due to a variety of factors, including those described in “Risk Factors” and elsewhere in this prospectus. These and other factors could cause results to differ materially from those expressed in the estimates made by the independent parties and by us.
Gartner does not endorse any vendor, product or service depicted in its research publications, and does not advise technology users to select only those vendors with the highest ratings. Gartner research publications consist of the opinions of Gartner’s research organization and should not be construed as statements of fact. Gartner disclaims all warranties, expressed or implied, with respect to this research, including any warranties of merchantability or fitness for a particular purpose.
The sources of industry and market data contained in this prospectus are listed below:
| (1) | Cisco Visual Networking Index: Global Mobile Data Traffic Forecast Update, 2012-2017 |
| (2) | Gartner’s “Magic Quadrant for Mobile Device Management” (Authors: Phillip Redman, John Girard, Monica Basso, Publication date: 17 May 2012) |
| (3) | IDC Worldwide and U.S. Mobile Applications Download and Revenue 2012-2016 Forecast: The Appification of Everything Goes Global, Doc #234684, May 2012 |
| (4) | IDC Worldwide Smartphone 2013-2017 Forecast and Analysis, Doc #239847, March 2013 |
| (5) | IDC Worldwide and U.S. Tablet 2013-2017 Forecast, Doc #240362, April 2013 |
| (6) | IDC Worldwide Business Use Smartphone 2012-2016 Forecast Update, Doc #237835, November 2012 |
| (7) | Good Technology State of BYOD Report 2012 |
| (8) | IDC Directions 2013: Assessing the Mobile Enterprise Ecosystem: The Criticality of the $5 Billion Mobile Enterprise Software Markets in 2013 |
| (9) | IDC: Worldwide Mobile Enterprise Security Software 2013-2017 Forecast and Analysis, Doc #240014, March 2013 |
| (10) | IDC Worldwide Semi Annual Software Tracker, 2H 2012, April 2013 |
| (11) | IDG Quick Poll: Enterprise Mobility Trend—August 2012 |
41
Table of Contents
We estimate that the net proceeds from our sale of shares of common stock in this offering at an assumed initial public offering price of $ per share, the midpoint of the price range reflected on the cover page of this prospectus, after deducting estimated underwriting discounts and commissions and estimated offering expenses payable by us, will be approximately $ million or $ million if the underwriters’ over-allotment option is exercised in full. A $1.00 increase (decrease) in the assumed initial public offering price would increase (decrease) the net proceeds to us from this offering by approximately $ million, assuming that the number of shares offered by us, as reflected on the cover page of this prospectus, remains the same and after deducting the estimated underwriting discounts and commissions payable by us. Similarly, each increase (decrease) of one million in the number of shares of common stock offered by us would increase (decrease) the net proceeds that we receive from this offering by approximately $ million, assuming the initial public offering price, as reflected on the cover page of this prospectus, remains the same and after deducting the estimated underwriting discounts and commissions payable by us. We will not receive any proceeds from the sale of shares of our common stock by the selling stockholders.
The principal purposes of this offering are to increase our capitalization and financial flexibility, create a public market for our common stock and thereby enable access to the public equity markets by our employees and stockholders, obtain additional capital, facilitate an orderly distribution of shares for the selling stockholders and increase our visibility in the marketplace. As of the date of this prospectus, we have no specific plans for the use of the net proceeds we receive from this offering. However, we currently intend to use the net proceeds we receive from this offering primarily for working capital and other general corporate purposes. We may also use a portion of the net proceeds for the acquisition of, or investment in, technologies, solutions or businesses that complement our business, although we have no present commitments or agreements to enter into any acquisitions or investments. We will have broad discretion over the uses of the net proceeds of this offering. Pending these uses, we intend to invest the net proceeds from this offering in short-term, investment-grade interest-bearing securities such as money market accounts, certificates of deposit, commercial paper, and guaranteed obligations of the U.S. government.
We have never declared or paid any cash dividends on our capital stock. We currently intend to retain all available funds and any future earnings and do not expect to pay any cash dividends on our common stock for the foreseeable future. Any future determination to declare dividends will be made at the discretion of our board of directors and will depend on our financial conditions. In addition, the terms of our loan and security agreement with Silicon Valley Bank restrict our ability to pay dividends.
42
Table of Contents
The following table sets forth our cash and cash equivalents and capitalization as of December 31, 2012 on:
| • | an actual basis; |
| • | a pro forma basis to give effect to the automatic conversion of all shares of our redeemable convertible preferred stock which were outstanding as of December 31, 2012 into 114,371,043 shares of our common stock immediately prior to the completion of this offering; and |
| • | a pro forma as adjusted basis to give further effect to (i) the sale of shares of our common stock offered by us in this offering at an assumed initial public offering price of $ per share, the midpoint of the estimated offering price range, as reflected on the cover page of this prospectus, after deducting the estimated underwriting discounts and commissions and estimated offering expenses; and (ii) the effectiveness of our amended and restated certificate of incorporation in connection with this offering. |
The information below is illustrative only, and our capitalization following the completion of this offering will be adjusted based on the actual initial public offering price and other terms of the offering determined at the pricing of this offering. You should read this table together with our audited consolidated financial statements and related notes, “Selected Consolidated Financial Data” and “Management’s Discussion and Analysis of Financial Condition and Results of Operations,” each included elsewhere in this prospectus.
| As of December 31, 2012 | ||||||||||||
| Actual | Pro Forma | Pro Forma As Adjusted(1) | ||||||||||
| (in thousands, except per share data) | ||||||||||||
| (unaudited) | ||||||||||||
Cash and cash equivalents | $ | 29,466 | $ | 29,466 | $ | |||||||
|
|
|
|
|
| |||||||
Long-term debt: | ||||||||||||
Term loan, current and non-current | $ | 15,167 | $ | 15,167 | ||||||||
Capital lease obligations, current and non-current | 827 | 827 | ||||||||||
Redeemable convertible preferred stock, $0.0001 par value per share: 179,750 shares authorized, 114,371 shares issued and outstanding, actual; no shares authorized, issued or outstanding, pro forma or pro forma as adjusted | 121,228 | — | ||||||||||
Good Technology Corporation stockholders’ deficit: | ||||||||||||
Preferred stock, $0.0001 par value per share: no shares authorized, issued or outstanding, actual or pro forma; shares authorized, no shares issued or outstanding, pro forma as adjusted | — | — | ||||||||||
Common stock, $0.0001 par value per share: 328,500 shares authorized, 44,772 shares issued and outstanding, actual; 328,500 shares authorized, 159,143 shares issued and outstanding, pro forma; shares authorized, shares issued and outstanding, pro forma as adjusted | 4 | 16 | ||||||||||
Additional paid in capital | 142,946 | 264,162 | ||||||||||
Accumulated deficit | (490,339 | ) | (490,339 | ) | ||||||||
|
|
|
|
|
| |||||||
Total Good Technology Corporation stockholders’ deficit | (347,389 | ) | (226,161 | ) | ||||||||
|
|
|
|
|
| |||||||
Total capitalization | $ | (210,167 | ) | $ | (210,167 | ) | $ | |||||
|
|
|
|
|
| |||||||
| (1) | A $1.00 increase (decrease) in the assumed initial public offering price of $ per share, the midpoint of the estimated offering price range reflected on the cover page of this prospectus, would increase (decrease) our pro forma as adjusted cash and cash equivalents, |
43
Table of Contents
| additional paid-in capital, total Good Technology Corporation stockholders’ deficit and total capitalization by approximately $ million, assuming that the number of shares offered by us, as reflected on the cover page of this prospectus, remains the same, and after deducting estimated underwriting discounts and commissions. Similarly, each increase (decrease) of one million in the number of shares of common stock offered by us would increase (decrease) our pro forma as adjusted cash and cash equivalents, additional paid-in capital, total Good Technology Corporation stockholders’ deficit and total capitalization by approximately $ million, assuming the assumed initial public offering price, as reflected on the cover page of this prospectus, remains the same and after deducting estimated underwriting discounts and commissions. |
The number of shares of common stock issued and outstanding actual, pro forma and pro forma as adjusted in the table above does not include the following shares:
| • | 55,859,579 shares of our common stock issuable upon the exercise of options outstanding as of December 31, 2012, with a weighted-average exercise price of $1.21 per share; |
| • | 10,239,817 shares of our common stock issuable upon the exercise of outstanding options granted after December 31, 2012 through April 15, 2013, with a weighted-average exercise price of $4.13 per share; |
| • | 4,470,009 shares of our common stock issuable upon the exercise of warrants outstanding as of December 31, 2012, with a weighted-average exercise price of $1.835 per share; |
| • | 12,180,269 shares of our Series C redeemable convertible preferred stock issued in April 2013 at a purchase price of $4.105 per share; and |
| • | shares of our common stock reserved for future issuance under our stock-based compensation plans, consisting of 5,123,493 shares of common stock reserved for future issuance under our 2006 Stock Plan as of April 15, 2013, which shares will be added to the shares to be reserved under our 2013 Employee Stock Incentive Plan, and shares of our common stock reserved for future issuance under our 2013 Employee Stock Incentive Plan, which will become effective in connection with this offering, and shares that become available under our 2013 Equity Stock Incentive Plan, pursuant to provisions thereof that automatically increase the share reserves under the plan each year, as more fully described in “Executive Compensation—Employee Benefit Plans and Stock Plans.” |
44
Table of Contents
If you invest in our common stock in this offering, your interest will be diluted to the extent of the difference between the amount per share paid by purchasers of shares of common stock in this initial public offering and the pro forma as adjusted net tangible book value per share of common stock immediately after this offering. At December 31, 2012, we had net tangible book value of $(316.3) million. Net tangible book value represents the amount of our total assets, less our goodwill and other intangible assets, less our total liabilities. Our pro forma net tangible book value as of December 31, 2012, was $ million, or $ per share of common stock. Pro forma net tangible book value per share represents the amount of our total tangible assets less our total liabilities, divided by the number of shares of common stock outstanding as of December 31, 2012, after giving effect to the conversion of all outstanding shares of our redeemable convertible preferred stock into shares of our common stock immediately upon the closing of this offering.
After giving effect to our sale of shares of common stock in this offering at an assumed initial public offering price of $ per share, the midpoint of the price range reflected on the cover page of this prospectus, after deducting estimated underwriting discounts and commissions and estimated offering expenses payable by us, our pro forma as adjusted net tangible book value as of December 31, 2012, would have been approximately $ million, or approximately $ per share of our common stock. This represents an immediate increase in pro forma net tangible book value of $ per share to our existing stockholders and an immediate dilution of $ per share to investors purchasing shares of common stock in this offering.
The following table illustrates this dilution:
Assumed initial public offering price per share | $ | |||||||
Pro forma net tangible book value per share as of December 31, 2012 | $ | |||||||
Increase in pro forma net tangible book value per share attributable to new investors | ||||||||
|
| |||||||
Pro forma as adjusted net tangible book value per share after this offering | ||||||||
|
| |||||||
Dilution per share to investors in this offering | $ | |||||||
|
|
A $1.00 increase (decrease) in the assumed initial public offering price of $ per share, the midpoint of the price range set forth on the cover page of this prospectus, would increase (decrease) our pro forma as adjusted net tangible book value per share to new investors by $ and would increase (decrease) dilution per share to new investors by $ , assuming that the number of shares offered by us, as reflected on the cover page of this prospectus, remains the same, and after deducting estimated underwriting discounts and commissions. In addition, to the extent any outstanding options or warrants are exercised, you will experience further dilution.
The table below summarizes, as of December 31, 2012, on a pro forma as adjusted basis described above, the number of shares of our common stock we issued and sold, the total consideration we received and the average price per share from existing stockholders and the total consideration to be paid by new investors purchasing our common stock in this offering at the assumed initial public offering price of $ per share, the mid-point of the price range set forth on the cover page of this prospectus, before deducting estimated underwriting discounts and commissions and estimated offering expenses payable by us (in thousands, except share and per share data):
| Shares Purchased | Total Consideration | Average Price Per Share | ||||||||||||||||
| Number | Percent | Amount | Percent | |||||||||||||||
Existing stockholders | % | $ | % | $ | ||||||||||||||
New public investors | ||||||||||||||||||
|
|
|
|
|
|
| ||||||||||||
Total | 100.0 | % | $ | 100.0 | % | |||||||||||||
|
|
|
|
|
|
| ||||||||||||
45
Table of Contents
A $1.00 increase (decrease) in the assumed initial public offering price of $ per share would increase (decrease) the total consideration paid by new investors by $ million and increase (decrease) the percent of total consideration paid by new investors by %, assuming that the number of shares offered by us, as reflected on the cover page of this prospectus, remains the same and after deducting estimated underwriting discounts and commissions.
Assuming the underwriters’ over-allotment option is exercised in full, sales by us in this offering will reduce the percentage of shares held by existing stockholders to % and will increase the number of shares held by our new investors to , or %.
The foregoing tables exclude:
| • | 55,859,579 shares of our common stock issuable upon the exercise of options outstanding as of December 31, 2012, with a weighted-average exercise price of $1.21 per share; |
| • | 10,239,817 shares of our common stock issuable upon the exercise of outstanding options granted after December 31, 2012 through April 15, 2013, with a weighted-average exercise price of $4.13 per share; |
| • | 4,470,009 shares of our common stock issuable upon the exercise of warrants outstanding as of December 31, 2012, with a weighted-average exercise price of $1.835 per share; |
| • | 12,180,269 shares of our Series C redeemable convertible preferred stock issued in April 2013 at a purchase price of $4.105 per share; and |
| • | shares of our common stock reserved for future issuance under our stock-based compensation plans, consisting of 5,123,493 shares of common stock reserved for future issuance under our 2006 Stock Plan as of April 15, 2013, which will be added to the shares to be reserved under our 2013 Employee Stock Incentive Plan, and shares of our common stock reserved for future issuance under our 2013 Employee Stock Incentive Plan, which will become effective in connection with this offering, and shares that become available under our 2013 Equity Stock Incentive Plan, pursuant to provisions thereof that automatically increase the share reserves under the plan each year, as more fully described in “Executive Compensation-Employee Benefit Plans and Stock Plans.” |
46
Table of Contents
SELECTED CONSOLIDATED FINANCIAL DATA
The following selected consolidated financial data should be read together with our consolidated financial statements and accompanying notes and “Management’s Discussion and Analysis of Financial Condition and Results of Operations” appearing elsewhere in this prospectus. The selected consolidated financial data in this section is not intended to replace our consolidated financial statements and the related notes. Our historical results are not necessarily indicative of our future results.
We derived the consolidated statements of operations data for the years ended December 31, 2010, 2011 and 2012 and the consolidated balance sheet data as of December 31, 2011 and 2012 from our audited consolidated financial statements appearing elsewhere in this prospectus. The consolidated statements of operations data for the year ended December 31, 2009 and the consolidated balance sheet data as of December 31, 2009 and 2010 are derived from our audited consolidated financial statements that are not included in this prospectus.
| Years Ended December 31, | ||||||||||||||||
| 2009 | 2010 | 2011 | 2012 | |||||||||||||
| (in thousands, except per share data) | ||||||||||||||||
Consolidated Statements of Operations Data: | ||||||||||||||||
Revenues: | ||||||||||||||||
Software and services | $ | 42,426 | $ | 40,002 | $ | 58,125 | $ | 93,528 | ||||||||
Intellectual property licensing | 87,096 | 25,600 | 27,221 | 23,077 | ||||||||||||
|
|
|
|
|
|
|
| |||||||||
Total revenues | 129,522 | 65,602 | 85,346 | 116,605 | ||||||||||||
Cost of revenues(1) | 14,348 | 15,318 | 19,853 | 32,016 | ||||||||||||
|
|
|
|
|
|
|
| |||||||||
Gross profit | 115,174 | 50,284 | 65,493 | 84,589 | ||||||||||||
|
|
|
|
|
|
|
| |||||||||
Operating expenses: | ||||||||||||||||
Research and development(1) | 28,422 | 27,079 | 28,854 | 45,601 | ||||||||||||
Sales and marketing(1) | 22,233 | 37,308 | 47,440 | 93,980 | ||||||||||||
General and administrative(1) | 88,416 | 19,713 | 24,485 | 34,374 | ||||||||||||
|
|
|
|
|
|
|
| |||||||||
Total operating expenses | 139,071 | 84,100 | 100,779 | 173,955 | ||||||||||||
|
|
|
|
|
|
|
| |||||||||
Loss from operations | (23,897 | ) | (33,816 | ) | (35,286 | ) | (89,366 | ) | ||||||||
Other income (expense), net | 272 | 51 | (752 | ) | (602 | ) | ||||||||||
Legal settlement gain | 26,950 | — | — | — | ||||||||||||
Interest expense | — | (441 | ) | (574 | ) | (926 | ) | |||||||||
|
|
|
|
|
|
|
| |||||||||
Loss before benefit from (provision for) income taxes | 3,325 | (34,206 | ) | (36,612 | ) | (90,894 | ) | |||||||||
Benefit from (provision for) income taxes | (2,454 | ) | (6,223 | ) | (4,379 | ) | 457 | |||||||||
|
|
|
|
|
|
|
| |||||||||
Net income (loss) | 871 | (40,429 | ) | (40,991 | ) | (90,437 | ) | |||||||||
(Income) loss attributable to noncontrolling interest | 218 | 572 | (214 | ) | (26 | ) | ||||||||||
Dividend accretion on Series C-1 redeemable convertible preferred stock(2) | (1,430 | ) | — | — | — | |||||||||||
Deemed dividends on redeemable convertible preferred stock redemptions(3) | (14,061 | ) | — | — | — | |||||||||||
|
|
|
|
|
|
|
| |||||||||
Net loss attributable to Good Technology Corporation common stockholders | $ | (14,402 | ) | $ | (39,857 | ) | $ | (41,205 | ) | $ | (90,463 | ) | ||||
|
|
|
|
|
|
|
| |||||||||
Net loss per share attributable to Good Technology Corporation common stockholders, basic and diluted | $ | (2.89 | ) | $ | (5.90 | ) | $ | (2.11 | ) | $ | (2.75 | ) | ||||
|
|
|
|
|
|
|
| |||||||||
Weighted-average shares used in computing net loss per share attributable to Good Technology Corporation common stockholders, basic and diluted | 4,975 | 6,761 | 19,518 | 32,915 | ||||||||||||
|
|
|
|
|
|
|
| |||||||||
Pro forma net loss per share attributable to Good Technology Corporation common stockholders, basic and diluted (unaudited) | $ | (0.63 | ) | |||||||||||||
|
| |||||||||||||||
Weighted-average shares used in computing pro forma net loss per share attributable to Good Technology Corporation common stockholders, basic and diluted (unaudited) | 142,521 | |||||||||||||||
|
| |||||||||||||||
47
Table of Contents
| (1) | Includes stock-based compensation expense as follows: |
| Years Ended December 31, | ||||||||||||||||
| 2009 | 2010 | 2011 | 2012 | |||||||||||||
| (in thousands) | ||||||||||||||||
Cost of revenues | $ | 65 | $ | 131 | $ | 369 | $ | 774 | ||||||||
Research and development | 278 | 656 | 1,032 | 2,529 | ||||||||||||
Sales and marketing | 661 | 850 | 1,457 | 3,263 | ||||||||||||
General and administrative | 711 | 943 | 1,613 | 2,635 | ||||||||||||
|
|
|
|
|
|
|
| |||||||||
Total stock-based compensation expense | $ | 1,715 | $ | 2,580 | $ | 4,471 | $ | 9,201 | ||||||||
|
|
|
|
|
|
|
| |||||||||
| (2) | Certain prior series of redeemable convertible preferred stockholders were entitled to receive annual dividends, whether or not declared by our board of directors. These shares were repurchased in 2009. |
| (3) | We entered into repurchase agreements with former stockholders to repurchase shares of a prior series of redeemable convertible preferred stock for $155.1 million. At the dates of repurchase, the carrying amounts of the repurchased shares was approximately $141.0 million, thereby resulting in a reduction of additional paid-in capital of $14.1 million for the deemed dividends. |
| As of December 31, | ||||||||||||||||
| 2009 | 2010 | 2011 | 2012 | |||||||||||||
| (in thousands) | ||||||||||||||||
Consolidated Balance Sheet Data: | ||||||||||||||||
Cash and cash equivalents | $ | 50,324 | $ | 24,085 | $ | 40,544 | $ | 29,466 | ||||||||
Property and equipment, net | 3,983 | 4,535 | 12,197 | 17,718 | ||||||||||||
Working capital (deficit) | 9,953 | (24,735 | ) | (13,909 | ) | (43,408 | ) | |||||||||
Total assets | 117,191 | 104,125 | 149,864 | 214,732 | ||||||||||||
Deferred revenues—current and long-term | 217,259 | 235,975 | 296,408 | 376,591 | ||||||||||||
Term loan, current and non-current | — | 2,255 | 12,101 | 15,167 | ||||||||||||
Capital lease obligations, current and non-current | 3,695 | 3,309 | 2,017 | 827 | ||||||||||||
Redeemable convertible preferred stock | 88,522 | 88,522 | 88,522 | 121,228 | ||||||||||||
Additional paid-in capital | 104,765 | 108,345 | 117,125 | 142,946 | ||||||||||||
Total Good Technology Corporation stockholders’ deficit | (214,266 | ) | (251,115 | ) | (282,749 | ) | (347,389 | ) | ||||||||
Key Financial Metrics
We monitor the following key financial metrics to help us evaluate growth trends in our core business, establish related budgets, measure the effectiveness of our sales and marketing efforts to enterprise customers, and assess operational efficiencies. In addition to our results determined under GAAP, we believe these non-GAAP financial measures are useful in evaluating our operating performance.
| Years ended December 31, | ||||||||||||
| 2010 | 2011 | 2012 | ||||||||||
| (dollars in thousands) | ||||||||||||
| Non-GAAP Financial Metrics: | ||||||||||||
Enterprise software and services billings | $ | 37,860 | $ | 101,749 | $ | 155,361 | ||||||
Total billings | $ | 84,318 | $ | 147,386 | $ | 196,788 | ||||||
Billings gross margin | 82 | % | 87 | % | 84 | % | ||||||
Free cash flow | $ | (25,177 | ) | $ | 75 | $ | (19,494 | ) | ||||
Because our revenues are recognized over an extended period of time, we focus on billings, a non-GAAP financial measure that we define as revenues plus the change in deferred revenues from the beginning to the end of the period, to analyze the performance of the business and to allocate resources. In particular, we focus on billings that are associated with sales of our secure mobile computing solution, which includes our suite of
48
Table of Contents
collaboration applications, in particular our Good for Enterprise application, and our Good Dynamics secure mobile computing platform, as well as associated maintenance and support services, which we refer to collectively as enterprise software and services billings. Billings from sales of our software and services to telecommunication carriers and OEM handset manufacturers are not included in this financial metric. We also focus on free cash flow as a non-GAAP liquidity measure that provides us with useful information about the amount of cash generated by our business that, after our capital expenditures, can be used for strategic opportunities, including investing in our business, making strategic acquisitions, and strengthening the balance sheet.
These non-GAAP financial measures should not be considered in isolation from, or as a substitute for, financial information prepared in accordance with GAAP. There are a number of limitations related to the use of these non-GAAP financial measures versus their nearest GAAP equivalent. First, enterprise software and services billings, total billings, billings gross margin and free cash flow are not substitutes for GAAP enterprise and services revenues, total revenues, gross margins and cash provided by (used in) operating activities, respectively. Our GAAP revenues do not closely match the timing of the related costs and expenses associated with generating our billings, such as the cost of customer support, our Good Secure Cloud infrastructure, engineering, professional services and royalties, as well as expenses related to research and development, sales and marketing, and general and administrative activities. In addition, for some of our customers, sales of our software and services include undelivered elements, such as professional services, and acceptance criteria for which revenues associated with such sales are deferred until these conditions are satisfied. Second, our peer companies may calculate non-GAAP financial measures differently or may use other financial measures to evaluate their performance, all of which could reduce the usefulness of our non-GAAP financial measures as tools for comparison. See “Management’s Discussion and Analysis of Financial Condition and Results of Operations—Key Financial Metrics” for a description of how these non-GAAP financial measures are calculated, a description of the limitations of these non-GAAP financial measures and a reconciliation of the non-GAAP financial measures to their most directly comparable financial measure calculated in accordance with GAAP.
49
Table of Contents
MANAGEMENT’S DISCUSSION AND ANALYSIS OF FINANCIAL CONDITION
AND RESULTS OF OPERATIONS
You should read the following discussion and analysis of our financial condition and results of operations in conjunction with the consolidated financial statements and notes thereto included elsewhere in this prospectus. This discussion contains forward looking statements based upon current expectations that involve risks and uncertainties. Our actual results may differ materially from those anticipated in these forward looking statements as a result of various factors, including those set forth under “Risk Factors” or in other parts of this prospectus.
Overview
We provide a secure mobile computing solution that enables enterprises to increase productivity and transform business processes, by delivering a secure mobile computing platform, a suite of collaboration applications and a third-party application and partner ecosystem. Our secure mobile computing platform, Good Dynamics, provides both security and application services to enable independent software vendors, or ISVs, systems integrators, or SIs, and internal enterprise development organizations to build applications that include our security functionality and simplify application development across devices and operating systems. The Good Collaboration Suite includes Good for Enterprise, which provides secure mobile email, calendar, contacts, attachments, notes and browsing, along with Good Share and Good Connect for file sharing and instant messaging, respectively. We work with a broad set of third-party ISVs and SIs to incorporate our security architecture and management framework into the run-time environment of many existing, popular applications. These applications can be managed and published in “app stores” to streamline their distribution and policy management.
We were founded in 1996 and launched our first commercial product, a cloud-based suite of applications, including email, to-do list, calendar, contacts, remote file storage and browser bookmarks, in 1997. Since then, we have invested a substantial amount of resources developing our solution and technology, especially with respect to providing security for business data on mobile devices. We have also acquired a number of complementary businesses that have enhanced our technologies. We have a portfolio of 56 issued U.S. patents, 117 issued non-U.S. patents and 93 patent applications globally as of March 31, 2013. In 2003, we began successfully protecting our intellectual property rights through legal action and private negotiations. Under the terms of litigation settlements and past license agreements, licensees have obtained nonexclusive, perpetual licenses to certain of our patents for certain of their products and services in exchange for over $330.0 million in royalties.
In February 2009, we purchased Good Technology, Inc., the provider of the GoodLink wireless corporate messaging system, from Motorola and began doing business as Good Technology. Shortly thereafter, we launched Good for Enterprise and branded our historical consumer product as Good for You. Since then, we have continued to offer new products and services, including the Good Dynamics platform in October 2011, which we continue to expand. In September 2012, we acquired Copiun, Inc., or Copiun, a provider of secure mobile collaboration capabilities, for approximately $25.0 million, which we purchased using our equity. In October 2012, we acquired AppCentral, Inc., or AppCentral, a provider of mobile application management and application security wrapping technology, for approximately $19.0 million, which we purchased using our equity.
In 2011, we began to focus our business primarily on marketing and selling Good for Enterprise to enterprises and governments. As a result, sales of Good for Enterprise have become an increasing percentage of our overall billings and revenues compared to sales of Good for You and the licensing of our intellectual property. We expect sales of Good for Enterprise, Good Connect and Good Share, in addition to sales of our Good Dynamics platform, to be the primary driver of growth in our business and an increasing percentage of our total billings and revenues for the foreseeable future. Going forward, we will focus less on sales of Good for You, including sales to telecommunication carriers and OEM customers pursuant to royalty and licensing arrangements.
50
Table of Contents
A substantial majority of our revenues from sales of Good for Enterprise consist of revenues from perpetual licenses. We also offer Good for Enterprise under term licenses. All revenues from sales of our Good Dynamics platform consist of revenues from term licenses.
Currently, revenues from perpetual licenses of Good for Enterprise are generally recognized over a five year period, as explained in “—Critical Accounting Policies and Estimates.” Revenues from term licenses for our software and services are recognized over the term of the agreement, which to date has generally been one to three years. Revenues from renewals of maintenance and support contracts are recognized ratably over the contract term, generally one year. When an arrangement includes both term and perpetual software licenses, revenues are recognized over the longer of the applicable periods to term and perpetual licenses. In certain arrangements with telecommunication carriers, we bill customers and recognize revenues monthly. Revenues from licensing our intellectual property are recognized ratably over periods ranging from immediate to 13.8 years. Based on our current intellectual property licensing agreements, we expect that revenues from licensing our intellectual property will continue to be recognized ratably over their terms until 2019.
Because most of our revenues are recognized over an extended period of time, we focus on billings, which is revenues plus the change in deferred revenues from the beginning to the end of the period, to analyze the performance of the business and to allocate resources. In particular, we focus on billings that are associated with sales of our Good for Enterprise and Good Dynamics products and services, which we describe as enterprise software and services billings. See “Key Financial Metrics” below for more information regarding this non-GAAP financial measure.
We sell our solution through our direct sales force, channel partners and resellers. We focus our direct sales efforts on the Forbes Global 2000 and augment our direct coverage with extensive channel partnerships that focus on companies with approximately $500 million or more in annual revenues. Our direct field sales force is complemented by an inside sales force to enhance our coverage and both are supported by telesales representatives who are primarily responsible for qualified lead generation. Our channel partners include leading value-added distributors, value-added resellers, and managed service providers such as Atea ASA, Integralis AG, Specialist Distribution Group (SDG) Limited, and SHI International Corp. We also work with carriers, such as AT&T, Vodafone and others, that resell our secure mobility solution to their enterprise customers. In addition to augmenting our direct sales coverage for large accounts, we utilize partners as our primary channel to serve accounts below approximately $500 million in annual revenues. This allows us to better leverage our internal resources while broadening our geographic footprint and extending our sales reach into the middle market.
In 2012, 67% of our total revenues were generated from customers in North America and Latin America, 18% from customers in Europe, Middle East and Africa, and 15% from customers in Asia Pacific. As of March 31, 2013, we had over 5,000 customers in more than 130 countries. We define a customer as a company, governmental entity or a distinct buying unit within a company or governmental entity, any of which has purchased products or services from us within the prior 36 months. We exclude channel partners and resellers, unless purchasing for their own use, and customers who have only purchased our legacy consumer products.
We intend to continue investing for long-term growth. We have invested and continue to invest heavily in our product development efforts to create new products that are complementary to our existing products, enhance our existing products, further develop security and management technologies, and expand our application development platform. We believe that our ability to enhance our product and service offerings is critical to expanding our leadership in enterprise mobility. As of December 31, 2012, we had 280 employees and 121 third-party contractors focused on research and development. In addition, we expect to continue to aggressively expand our sales and marketing organizations to market our software and brand in both the United States and internationally. We continue to increase the size of our sales force, which has grown from 127 employees as of December 31, 2011 to 203 employees as of December 31, 2012. We also continue to increase our investment in our customer support organization, which has grown from 82 as of December 31, 2011 to 101 as of December 31, 2012. As a result of these continued investments and the five-year revenue recognition period
51
Table of Contents
policy for a large portion of our sales of enterprise software and services arrangements, we do not expect to be profitable on a U.S. generally accepted accounting principles, or GAAP, basis in the near future.
In 2010, 2011 and 2012, our enterprise software and services billings, a non-GAAP financial measure, were $37.9 million, $101.7 million and $155.4 million, respectively, representing year-over-year growth of 169% for 2011 and 53% for 2012. In 2010, 2011 and 2012, we generated enterprise software and services revenues of $6.8 million, $16.1 million and $45.1 million, respectively, representing year-over-year growth of 138% for 2011 and 180% for 2012. Our free cash flow, a non-GAAP measure, was $(25.2) million, $75,000 and $(19.5) million in 2010, 2011 and 2012, respectively. Our net losses were $39.9 million, $41.2 million and $90.5 million in 2010, 2011 and 2012, respectively. See “Key Financial Metrics” below for more information and a reconciliation of enterprise software and services billings and total billings to revenues and free cash flow to cash flow provided by (used in) operating activities, the most directly comparable financial measures calculated and presented in accordance with GAAP.
Key Financial Metrics
We monitor the following key financial metrics to help us evaluate growth trends in our core business, establish related budgets, measure the effectiveness of our sales and marketing efforts to enterprise customers, and assess operational efficiencies. In addition to our results determined under GAAP, we believe these non-GAAP financial measures are useful in evaluating our operating performance.
| Years ended December 31, | 2010 to 2011 % Change | 2011 to 2012 % Change | ||||||||||||||||||
| 2010 | 2011 | 2012 | ||||||||||||||||||
| (dollars in thousands) | ||||||||||||||||||||
Non-GAAP Financial Metrics: | ||||||||||||||||||||
Enterprise software and services billings | $ | 37,860 | $ | 101,749 | $ | 155,361 | 169 | % | 53 | % | ||||||||||
Total billings | $ | 84,318 | $ | 147,386 | $ | 196,788 | 75 | % | 34 | % | ||||||||||
Billings gross margin | 82 | % | 87 | % | 84 | % | ||||||||||||||
Free cash flow | $ | (25,177 | ) | $ | 75 | $ | (19,494 | ) | ||||||||||||
Enterprise Software and Services Billings
Because our revenues are recognized over an extended period of time, we focus on billings, which we define as revenues plus the change in deferred revenues from the beginning to the end of the period, to analyze the performance of the business and to allocate resources. In particular, we focus on billings that are associated with sales of our secure mobile computing solution, which includes our suite of collaboration applications, in particular our Good for Enterprise application, and our Good Dynamics secure mobile computing platform, as well as associated maintenance and support services, which we refer to collectively as enterprise software and services billings. Billings from sales of our software and services to telecommunication carriers and OEM handset manufacturers are not included in this financial metric.
Our enterprise software and services billings provides investors with an important indicator of the scale and rate of growth of our core business. The enterprise software and services billings we record in any particular period represent amounts recognized for licenses of our secure mobile computing solution, as well as related services and support agreements with respect to our enterprise products. Enterprise software and services billings are a leading indicator of future revenues that we expect to recognize once we satisfy all of the revenue recognition criteria described under “Critical Accounting Policies and Estimates—Revenues.” Enterprise software and services billings have increased over the last several years due to increased demand and as a result of our increased investment in sales and marketing.
Total Billings
Total billings include both our enterprise software and services billings, including sales of our software and services to telecommunication carriers and OEM handset manufacturers, and intellectual property licensing. We
52
Table of Contents
consider total billings to be a key financial metric because it provides us with a tool to forecast and manage cash flows, assess our overall financial condition, identify trends affecting our business, allocate capital and make strategic decisions. The total billings we record in any particular period represent total revenues plus the change in total deferred revenues from the beginning to the end of the period. Billings are a leading indicator of future revenues that we recognize once we satisfy all of the revenue recognition criteria described under “Critical Accounting Policies and Estimates—Revenues.” Total billings have increased over the last several years primarily due to growth in sales of our Good for Enterprise application.
Billings Gross Margin
For the same reason that we focus on total billings to assess our overall financial condition and identify trends affecting our business, we use billings gross margin as a tool for analyzing the manner in which we are expending resources to support the amount of business activity that is driving our total billings. We define billings gross margin as billings gross profit, which is total billings minus GAAP cost of revenues, divided by total billings. Our billings gross margin increased five percentage points in 2011 compared to 2010, primarily from the increase in our enterprise software and services billings. Our billings gross margin decreased by three percentage points in 2012 compared to 2011, primarily due to our increased investment in customer support and higher amortization expenses from developed technology purchased as part of acquisitions completed in 2012.
Free Cash Flow
We define free cash flow as cash provided by (used in) operating activities less purchases of property and equipment. We consider free cash flow to be a liquidity measure that provides useful information to management and investors about the amount of cash generated by our business that, after our capital expenditures, can be used for strategic opportunities, including investing in our business, making acquisitions, and strengthening the balance sheet. In the near term we plan to continue to incur increased operating expenses and capital expenditures as we grow our sales, marketing, and research and development teams, as well as invest in our Good Secure Cloud infrastructure to support our expected growth. After achieving positive free cash flow for the year ended December 31, 2011, we made the strategic decision to invest for future growth in our business, resulting in the subsequent decline in our free cash flow for the year ended December 31, 2012, as reflected in the table below.
Reconciliation of Non-GAAP Financial Measures
These non-GAAP financial measures should not be considered in isolation from, or as a substitute for, financial information prepared in accordance with GAAP. There are a number of limitations related to the use of these non-GAAP financial measures versus their nearest GAAP equivalents. First, enterprise software and services billings, total billings, billings gross margin and free cash flow are not substitutes for GAAP enterprise software and services revenues, total revenues, gross margin, and cash provided by (used in) operating activities, respectively. Our GAAP revenues do not closely match the timing of the related costs and expenses associated with generating our billings and revenues, such as the cost of customer support, our Good Secure Cloud infrastructure, engineering, professional services and royalties, as well as expenses related to research and development, sales and marketing, and general and administrative activities. In addition, for some of our customers, sales of our software and services include undelivered elements, such as professional services, and acceptance criteria for which revenues associated with such sales are deferred until these conditions are satisfied. Second, our peer companies may calculate non-GAAP financial measures differently or may use other financial measures to evaluate their performance, all of which could reduce the usefulness of our non-GAAP financial measures as tools for comparison.
53
Table of Contents
We provide the nearest GAAP measures of these non-GAAP financial measures and a reconciliation to the GAAP equivalents below.
| Years Ended December 31, | 2010 to 2011 % Change | 2011 to 2012 % Change | ||||||||||||||||||
| 2010 | 2011 | 2012 | ||||||||||||||||||
| (in thousands) | ||||||||||||||||||||
Enterprise Software and Services Billings: | ||||||||||||||||||||
Enterprise software and services revenues | $ | 6,774 | $ | 16,138 | $ | 45,123 | ||||||||||||||
Enterprise deferred revenues, end of period | 41,048 | 126,659 | 236,897 | |||||||||||||||||
Less: enterprise deferred revenues, beginning of period | (9,962 | ) | (41,048 | ) | (126,659 | ) | ||||||||||||||
|
|
|
|
|
| |||||||||||||||
Enterprise software and services billings (non-GAAP) | $ | 37,860 | $ | 101,749 | $ | 155,361 | 169 | % | 53 | % | ||||||||||
|
|
|
|
|
| |||||||||||||||
| Years Ended December 31, | 2010 to 2011 % Change | 2011 to 2012 % Change | ||||||||||||||||||
| 2010 | 2011 | 2012 | ||||||||||||||||||
| (in thousands) | ||||||||||||||||||||
Total Billings: | ||||||||||||||||||||
Total revenues | $ | 65,602 | $ | 85,346 | $ | 116,605 | ||||||||||||||
Deferred revenues, end of period | 235,975 | 296,408 | 376,591 | |||||||||||||||||
Less: deferred revenues, beginning of period | (217,259 | ) | (235,975 | ) | (296,408 | ) | ||||||||||||||
Add back: Common stock warrant issuance(1) | — | 1,607 | — | |||||||||||||||||
|
|
|
|
|
| |||||||||||||||
Total billings (non-GAAP) | $ | 84,318 | $ | 147,386 | $ | 196,788 | 75 | % | 34 | % | ||||||||||
|
|
|
|
|
| |||||||||||||||
| (1) | In May 2011, we issued warrants to purchase up to 4,432,961 shares of our common stock at an exercise price of $1.83 per share to a customer that had reached a cumulative sales performance milestone, the fair value of which was recognized as an offset to revenues. |
| Years Ended December 31, | 2010 to 2011 % Change | 2011 to 2012 % Change | ||||||||||||||||||
| 2010 | 2011 | 2012 | ||||||||||||||||||
| (dollars in thousands) | ||||||||||||||||||||
Billings Gross Margin: | ||||||||||||||||||||
Total billings (non-GAAP) | $ | 84,318 | $ | 147,386 | $ | 196,788 | ||||||||||||||
Cost of revenues | 15,318 | 19,853 | 32,016 | |||||||||||||||||
|
|
|
|
|
| |||||||||||||||
Billings gross profit (non-GAAP) | $ | 69,000 | $ | 127,533 | $ | 164,772 | 85 | % | 29 | % | ||||||||||
Billings gross margin (non-GAAP) | 82 | % | 87 | % | 84 | % | 5 | % | (3 | )% | ||||||||||
| Years Ended December 31, | ||||||||||||
| 2010 | 2011 | 2012 | ||||||||||
| (in thousands) | ||||||||||||
Free Cash Flow: | ||||||||||||
Cash flow provided by (used in) operating activities | $ | (22,333 | ) | $ | 9,029 | $ | (9,059 | ) | ||||
Purchase of property and equipment | (2,844 | ) | (8,954 | ) | (10,435 | ) | ||||||
|
|
|
|
|
| |||||||
Free cash flow (non-GAAP) | $ | (25,177 | ) | $ | 75 | $ | (19,494 | ) | ||||
|
|
|
|
|
| |||||||
Net cash used in investing activities | $ | (3,527 | ) | $ | (4,129 | ) | $ | (7,942 | ) | |||
|
|
|
|
|
| |||||||
Net cash provided by financing activities | $ | 86 | $ | 11,391 | $ | 5,898 | ||||||
|
|
|
|
|
| |||||||
Factors Affecting our Performance
Investment in Growth. We have aggressively invested, and intend to continue to invest, in expanding our sales and marketing efforts, technology development, and customer care and operations to support our growth.
54
Table of Contents
We are also making capital investments in expanding our Good Secure Cloud and technology acquisitions to support our Good Dynamics platform. As a result, we have incurred net losses and negative free cash flows in most of our recent quarters. While we expect our total operating expenses and capital expenditures to increase for the foreseeable future, we expect that, beginning in 2014, such expenditures will increase at a slower rate relative to the rate of our billings growth. However, our billings and revenue growth are largely driven by the pace of adoption and penetration of mobile computing solutions in the enterprise, as well as our ability to timely develop and introduce new software and services and enhancements to our existing software and services to keep up with the rapid technological changes that continue to characterize our industry.
Good Dynamics Opportunity. We have recently introduced our secure mobile computing platform, Good Dynamics, which provides both security and application services to enable ISVs, SIs and our customers’ internal development organizations to build applications that include our security functionality and simplify application development across devices and operating systems. Our future financial performance will be materially impacted by our ability to market and sell licenses for Good Dynamics, as we expect such sales to drive our ability to acquire new customers and increase renewal rates and cross selling opportunities with our current customers.
Upsell and Cross-Sell Opportunity. In order for us to achieve our expected billings and revenue growth, we must sell additional software and services to our existing customers as they expand their mobile deployments. We believe that enterprises are in the early stages of embracing secure mobility solutions within their IT infrastructures. To date, many of our existing customers have provided our secure mobility solution to only a limited number of employees within their organizations. This creates a significant opportunity for us to increase the penetration of deployments in our existing customer base by upselling and cross-selling our products, delivering new applications through our Good Dynamics platform and “bundling” our applications, platform and services into new value-added offerings. Furthermore, because customer acquisition and implementation costs are generally incurred up front, our ability to capture these opportunities will increase the profitability of the customer relationship over time.
Components of Operating Results
Revenues
We derive our revenues from sales of software licenses, associated maintenance and support services, and intellectual property licensing.
Our revenues are comprised of the following:
Software and Services. Software and services revenues consist of sales of our secure mobile computing solution, associated maintenance and support services. To a lesser extent, software and services revenues also include sales of our Good for You consumer product and sales of software and services to telecommunications carriers and OEM handset manufacturers through royalty and software licensing agreements. Our secure mobile computing solution consists of our suite of collaboration applications, including our Good for Enterprise application, and our Good Dynamics secure mobile computing platform.
We primarily sell our software and services to enterprises and governments. A substantial portion of our revenues is from sales of perpetual licenses to our Good for Enterprise application and associated maintenance and support and secure connectivity services, which we recognize over the estimated customer life, generally five years. Customers can also purchase term license agreements for Good for Enterprise, under which we recognize revenues ratably over the term of the agreement. Our Good Dynamics platform is sold under term license agreements. When an arrangement includes both term and perpetual software licenses, all revenues are recognized ratably over the longer of the periods applicable to term and perpetual software licenses. Maintenance and support consists of software maintenance and customer support which are delivered for a single fee and can be renewed upon contract expiration at the customer’s option. Software maintenance includes unspecified product upgrades, interim service releases and bug fixes. Customer support consists of access to live technical support technicians, online knowledge resources and on-site or dedicated remote support for premium-level customers. Most of our customers renew their maintenance and support services annually.
55
Table of Contents
We also sell and provide software and services to telecommunication carriers and OEM handset manufacturers through royalty and software licensing agreements. We receive a monthly payment from certain telecommunication carriers related to their customers’ use of our applications on their networks. Certain European carriers offer an OEM version of our email application and other software on mobile handsets sold and used on their networks for which we receive a monthly royalty. Additionally, we license our software to OEM handset manufacturers and receive a payment based on each handset sold that includes our software. The revenues from these payments are recognized over the expected useful life of the handset, estimated to be 18 months.
Intellectual Property Licensing. Intellectual property licensing revenues represent cash settlements with various companies for infringement of our patents, or direct licenses of intellectual property. Revenues from these agreements are recognized over periods ranging from immediate to 13.8 years based on the terms of the agreements with licensees. These licensing arrangements are infrequent in nature, and such revenues are expected to decline in the future when our existing agreements expire, which we expect to occur through 2019.
Cost of Revenues
Our cost of revenues is comprised of the cost of customer support, operating our Good Secure Cloud, engineering and professional services, amortization of intangibles and royalties.
Cost of customer support is primarily comprised of personnel costs and third-party contracted services to provide our customers with technical support. Personnel costs includes salary, bonus and benefits costs, as well as stock-based compensation costs. In addition, cost of customer support includes supplies and allocated IT and facility-related costs. Cost of revenues also consists of costs to run our Good Secure Cloud in Seattle, Washington and Santa Clara, California, including personnel, equipment and associated depreciation, and utilities expenses. Engineering and professional services costs consist of personnel costs to perform client-specific services and resolve higher-level technical support issues. Amortization of intangibles includes the amortization of developed technology associated with our acquisitions and the amortization of our capitalized Good Secure Cloud software costs. We also pay certain third-parties software royalties to the extent that we incorporate their technologies within our products. Our cost of revenues are largely fixed, such as depreciation and amortization, or semi-fixed, such as our compensation related expenses. Our royalty costs are variable depending on the number of software sales we make that include third-party software.
Operating Expenses
Research and Development. Research and development expenses primarily consist of salaries, benefits and stock-based compensation for our engineers, product managers and developers. In addition, product development expenses include outside services and consulting, as well as allocated facilities and other supporting overhead costs. We expect that research and development expenses will increase as we continue to invest in our products and technology.
Sales and Marketing. Sales and marketing expenses primarily consist of salaries, benefits, stock-based compensation, amortization of deferred commissions, travel expenses, and incentive compensation for our sales and marketing employees. In addition, sales and marketing expenses include customer acquisition activities, branding, advertising, customer events and public relations costs, as well as allocated facilities and other supporting overhead costs. Amortization of certain acquisition-related costs, such as customer relationships, are also included in sales and marketing expense. We plan to continue to invest heavily in sales and marketing to expand our global operations, increase revenues from current customers, continue building brand awareness and expand both our direct and indirect sales channels.
General and Administrative. General and administrative expenses primarily consist of salaries, benefits and stock-based compensation for our executive, finance, legal, human resources and other administrative employees. In addition, general and administrative expenses include outside consulting, legal and accounting services, including at times substantial litigation costs, as well as allocated facilities and other supporting overhead costs.
56
Table of Contents
We expect general and administrative expenses to increase in the future as we continue to grow our business and incur additional costs associated with being a public company.
Interest and Other Income (Expense), Net
Interest and other income (expense), net consists primarily of the interest income earned on our cash and cash equivalents, foreign exchange gains and losses, interest expense, loan fees paid on our outstanding notes payable and, prior to 2012, changes in the fair value of warrants to purchase Series B-1 redeemable convertible preferred stock issued in connection with an acquisition in 2009. These warrants were exercised in the first quarter of 2012. We do not expect to incur expenses related to these warrants in future periods.
Tax Benefit from (Provision for) Income Taxes
We operate in a number of tax jurisdictions and are subject to taxes in each country or jurisdiction in which we conduct business. Earnings from our non-U.S. activities are subject to local country income and withholding taxes and may be subject to U.S. income tax. Our effective tax rates differ from the statutory rate primarily due to the valuation allowance on our U.S. deferred tax assets, state taxes, foreign taxes, research and development tax credits and withholding taxes on certain non-U.S. sales.
Results of Operations
The following tables set forth our results of operations for the periods presented. The period-to-period comparison of financial results is not necessarily indicative of financial results to be achieved in future periods.
| Years Ended December 31, | ||||||||||||
| 2010 | 2011 | 2012 | ||||||||||
| (in thousands) | ||||||||||||
Revenues: | ||||||||||||
Software and services | $ | 40,002 | $ | 58,125 | $ | 93,528 | ||||||
Intellectual property licensing | 25,600 | 27,221 | 23,077 | |||||||||
|
|
|
|
|
| |||||||
Total revenues | 65,602 | 85,346 | 116,605 | |||||||||
Cost of revenues(1) | 15,318 | 19,853 | 32,016 | |||||||||
|
|
|
|
|
| |||||||
Gross profit | 50,284 | 65,493 | 84,589 | |||||||||
|
|
|
|
|
| |||||||
Operating expenses: | ||||||||||||
Research and development(1) | 27,079 | 28,854 | 45,601 | |||||||||
Sales and marketing(1) | 37,308 | 47,440 | 93,980 | |||||||||
General and administrative(1) | 19,713 | 24,485 | 34,374 | |||||||||
|
|
|
|
|
| |||||||
Total operating expenses | 84,100 | 100,779 | 173,955 | |||||||||
|
|
|
|
|
| |||||||
Loss from operations | (33,816 | ) | (35,286 | ) | (89,366 | ) | ||||||
Other income (expense), net | 51 | (752 | ) | (602 | ) | |||||||
Interest expense | (441 | ) | (574 | ) | (926 | ) | ||||||
|
|
|
|
|
| |||||||
Loss before benefit from (provision for) income taxes | (34,206 | ) | (36,612 | ) | (90,894 | ) | ||||||
Benefit from (provision for) income taxes | (6,223 | ) | (4,379 | ) | 457 | |||||||
|
|
|
|
|
| |||||||
Net loss | (40,429 | ) | (40,991 | ) | (90,437 | ) | ||||||
(Income) loss attributable to noncontrolling interest | 572 | (214 | ) | (26 | ) | |||||||
|
|
|
|
|
| |||||||
Net loss attributable to Good Technology Corporation common stockholders | $ | (39,857 | ) | $ | (41,205 | ) | $ | (90,463 | ) | |||
|
|
|
|
|
| |||||||
57
Table of Contents
| (1) | Includes stock-based compensation expense as follows: |
| Years Ended December 31, | ||||||||||||
| 2010 | 2011 | 2012 | ||||||||||
| (in thousands) | ||||||||||||
Cost of revenues | $ | 131 | $ | 369 | $ | 774 | ||||||
Research and development | 656 | 1,032 | 2,529 | |||||||||
Sales and marketing | 850 | 1,457 | 3,263 | |||||||||
General and administrative | 943 | 1,613 | 2,635 | |||||||||
|
|
|
|
|
| |||||||
Total stock-based compensation expense | $ | 2,580 | $ | 4,471 | $ | 9,201 | ||||||
|
|
|
|
|
| |||||||
Revenues
| Years Ended December 31, | 2010 to 2011 % Change | 2011 to 2012 % Change | ||||||||||||||||||
| 2010 | 2011 | 2012 | ||||||||||||||||||
| (in thousands) | ||||||||||||||||||||
Software and services revenues | $ | 40,002 | $ | 58,125 | $ | 93,528 | 45 | % | 61 | % | ||||||||||
Intellectual property licensing | 25,600 | 27,221 | 23,077 | 6 | % | (15 | )% | |||||||||||||
|
|
|
|
|
| |||||||||||||||
Total revenues | $ | 65,602 | $ | 85,346 | $ | 116,605 | 30 | % | 37 | % | ||||||||||
|
|
|
|
|
| |||||||||||||||
2012 Compared to 2011. Software and services revenues increased $35.4 million, or 61%, primarily due to the growth in sales of our enterprise software and services. Sales of enterprise software and services increased $29.0 million, or 180%, primarily driven by a significant increase in demand for our Good for Enterprise application and related maintenance and support services to both new and existing customers. At the end of 2011, we had approximately 4,200 customers, while at the end of 2012 we had over 5,000 customers. Revenues from payments from certain telecommunications carriers increased $4.8 million, primarily due to an increase in the number of devices utilizing our applications on their networks. The majority of our growth in revenues occurred in the United States. The decrease in intellectual property licensing revenues reflects the declining amortization of revenues associated with certain licensing arrangements during 2012.
2011 Compared to 2010. Software and services revenues increased $18.1 million, or 45%, primarily due to our license arrangements with OEM handset manufacturers and the growth in our sales of enterprise software and services. At the end of 2010, we had approximately 2,800 customers, while at the end of 2011 we had approximately 4,200 customers. Revenues related to our arrangements with OEM handset manufacturers increased $12.2 million, primarily due to revenues from an OEM manufacturer in South Korea that incorporated our software into a significant number of its handsets. Our sales of enterprise software and services increased $9.4 million, or 138%, primarily driven by an increase in demand for our Good for Enterprise application and related maintenance and support services to both new and existing customers. Revenues from arrangements with mobile carriers decreased $3.5 million, primarily due to a decrease in European mobile carriers utilizing our Good For You software in their handsets. The majority of our growth in revenues occurred in South Korea and the United States.
Cost of Revenues and Gross Margin
| Years Ended December 31, | 2010 to 2011 % Change | 2011 to 2012 % Change | ||||||||||||||||||
| 2010 | 2011 | 2012 | ||||||||||||||||||
| (dollars in thousands) | ||||||||||||||||||||
Cost of revenues | $ | 15,318 | $ | 19,853 | $ | 32,016 | 30 | % | 61 | % | ||||||||||
Gross margin | 77 | % | 77 | % | 73 | % | 0 | % | (4 | )% | ||||||||||
2012 Compared to 2011. Cost of revenues increased $12.2 million, or 61%, primarily due to higher third-party technical support costs of approximately $4.2 million, as well as a $3.2 million increase in compensation-
58
Table of Contents
related costs. This increase reflects higher headcount and compensation as we relocated support centers in 2011 from the Philippines, which had lower operating costs, to the United States in an effort to improve our customer satisfaction. This increase was also the result of an increase in the number of customers served. Depreciation and amortization expenses increased $1.9 million, primarily due to the amortization of developed/core technology from our acquisitions of Copiun and AppCentral, as well as higher depreciation related to capital expenditures for our Good Secure Cloud. Royalties paid to third parties also increased $1.3 million. In addition, allocated facility and IT costs increased approximately $0.9 million, in line with the growth in headcount. These additional costs reduced our gross margin for 2012.
2011 Compared to 2010. Cost of revenues increased $4.5 million, or 30%, primarily as a result of the relocation of our primary support center in 2011. As a result of this relocation, we incurred additional costs in moving these operations as well as incurring redundant personnel costs during this period. Additionally, we launched a professional service organization in late December 2010. These activities increased our headcount-related costs by $1.5 million and consulting-related costs by $1.3 million. Royalties paid to third parties increased $0.9 million. These additional costs were offset by the increase in software and services revenues during the period allowing us to maintain a stable gross margin.
Operating Expenses
Research and Development
| Years Ended December 31, | 2010 to 2011 % Change | 2011 to 2012 % Change | ||||||||||||||||||
| 2010 | 2011 | 2012 | ||||||||||||||||||
| (dollars in thousands) | ||||||||||||||||||||
Research and development | $ | 27,079 | $ | 28,854 | $ | 45,601 | 7 | % | 58 | % | ||||||||||
Percentage of revenues | 41 | % | 34 | % | 39 | % | ||||||||||||||
2012 Compared to 2011. Research and development expenses increased $16.7 million, or 58%, primarily due to an increase of $11.9 million in personnel costs due to an increase in the number of employees, annual salary increases, incentive bonuses and an increase in stock-based compensation. These increased personnel costs reflect our substantial investment in the further development of our secure mobile computing solution, particularly our Good for Enterprise application and Good Dynamics platform. We increased our research and development headcount by over 40% during this period. In addition, consulting costs increased $3.3 million to support an increase in the number of development projects. Finally, allocated facility and IT costs increased $0.6 million, in line with the growth in headcount.
2011 Compared to 2010. Research and development expenses increased $1.8 million, or 7%, primarily due to an increase of $2.0 million in consulting expenses and increased compensation expenses as we dedicated resources toward product development of the Good Dynamics platform, which we made commercially available in October 2011.
Sales and Marketing
| Years Ended December 31, | 2010 to 2011 % Change | 2011 to 2012 % Change | ||||||||||||||||||
| 2010 | 2011 | 2012 | ||||||||||||||||||
| (dollars in thousands) | ||||||||||||||||||||
Sales and marketing | $ | 37,308 | $ | 47,440 | $ | 93,980 | 27 | % | 98 | % | ||||||||||
Percentage of revenues | 57 | % | 56 | % | 81 | % | ||||||||||||||
2012 Compared to 2011. Sales and marketing expenses increased $46.5 million, or 98%, primarily due to an increase of approximately $25.0 million in compensation, bonuses, commissions and stock-based compensation, as we increased our direct sales force and marketing team in 2012. In addition, we increased the number of employees 60% at various levels within the sales and marketing organization. Finally, our marketing expenses increased $5.1 million as a result of expenses associated with marketing trade shows and events as well as other
59
Table of Contents
demand generation activities. We have agreements with third-party providers that assist us in renewing our support agreements as well as help us generate growth in small to medium size businesses and costs for these services increased by approximately $4.6 million. Allocated facility and IT costs increased approximately $5.3 million in line with the growth in headcount.
2011 Compared to 2010. Sales and marketing expenses increased $10.1 million, or 27%, primarily due to an increase of $6.9 million in headcount-related expenses as a result of the expansion of our direct sales organization. With the growth of the sales organization, we also incurred increased travel expenses of $0.8 million. Additionally, we had an increase of $1.9 million in consulting expenses.
General and Administrative
| Years Ended December 31, | 2010 to 2011 % Change | 2011 to 2012 % Change | ||||||||||||||||||
| 2010 | 2011 | 2012 | ||||||||||||||||||
| (dollars in thousands) | ||||||||||||||||||||
General and administrative | $ | 19,713 | $ | 24,485 | $ | 34,374 | 24 | % | 40 | % | ||||||||||
Percentage of revenues | 30 | % | 29 | % | 29 | % | ||||||||||||||
2012 Compared to 2011. General and administrative expenses increased $9.9 million, or 40%, primarily due to an increase of approximately $5.8 million in compensation-related costs, as the result of a 24% increase in the number of employees. In addition, we experienced an increase of $2.8 million in professional services fees, primarily for higher legal expenses related to our ongoing litigation and acquisitions. Allocated facility and IT costs increased approximately $1.0 million in line with the growth in headcount.
2011 Compared to 2010. General and administrative expenses increased $4.8 million, or 24%, primarily due to an increase of $5.6 million in outside consulting costs that included non-capital costs to implement a new enterprise reporting and planning system and temporary personnel to implement various associated processes. These costs were partially offset by lower relocation and travel expenses.
Interest and Other Income (Expense), Net
2012 Compared to 2011. Other income (expense), net was $(0.8) million for 2011 compared to $(0.6) million for 2012. The lower net expense was primarily due to a release of certain accrued use taxes related to the acquisition of Good Technology, Inc. for which we have passed the statute of limitations for collection, partially offset by an increase in the mark to market loss related to the remeasurement of our Series B-1 redeemable convertible preferred stock warrants and foreign exchange losses. These Series B-1 redeemable convertible preferred stock warrants were exercised in 2012. Our interest expense increased $0.4 million due to higher levels of borrowings in 2012.
2011 Compared to 2010. Other income (expense), net was $51,000 for 2010 compared to $(0.8) million for 2011. The change was largely driven by a mark to market loss related to the remeasurement of our Series B-1 redeemable convertible preferred stock warrants. Our interest expense increased $0.1 million due to higher levels of borrowings in 2011.
Benefit From (Provision for) Income Taxes
2012 Compared to 2011. Provision for income taxes for 2011 was $(4.4) million compared to a benefit of $0.5 million for 2012. The change of $4.8 million between the periods is due to a $3.4 million tax benefit from the release of valuation allowances in connection with the Copiun acquisition, $2.1 million lower withholding taxes from lower revenues subject to withholding taxes and an increase of $0.5 million from an adjustment to non-U.S. deferred tax assets.
60
Table of Contents
2011 Compared to 2010. Provision for income taxes for 2010 was $(6.2) million compared to $(4.4) million for 2011. The decreased in provision of $1.8 million was primarily due to lower foreign income taxes and foreign tax withholdings due to lower foreign sales.
Quarterly Results of Operations Data
The following tables set forth our unaudited quarterly consolidated statements of operations data and our unaudited statements of operations data as a percentage of total revenues for each of the eight quarters in the two year period ended December 31, 2012. We have prepared the quarterly data on a consistent basis with the audited consolidated financial statements included in this prospectus. In the opinion of management, the financial information reflects all necessary adjustments, consisting only of normal recurring adjustments, necessary for a fair presentation of this data. This information should be read in conjunction with the audited consolidated financial statements and related notes included elsewhere in this prospectus. The results of historical periods are not necessarily indicative of the results of operations for a full year or any future period.
| Three Months Ended, | ||||||||||||||||||||||||||||||||
| Mar 31, 2011 | Jun 30, 2011 | Sep 30, 2011 | Dec 31, 2011 | Mar 31, 2012 | Jun 30, 2012 | Sep 30, 2012 | Dec 31, 2012 | |||||||||||||||||||||||||
| (in thousands) | ||||||||||||||||||||||||||||||||
Revenues: | ||||||||||||||||||||||||||||||||
Software and services | $ | 10,078 | $ | 13,835 | $ | 16,848 | $ | 17,364 | $ | 20,681 | $ | 22,459 | $ | 23,693 | $ | 26,695 | ||||||||||||||||
Intellectual property licensing | 7,239 | 7,239 | 7,005 | 5,738 | 5,739 | 5,737 | 5,800 | 5,801 | ||||||||||||||||||||||||
|
|
|
|
|
|
|
|
|
|
|
|
|
|
|
| |||||||||||||||||
Total revenues | 17,317 | 21,074 | 23,853 | 23,102 | 26,420 | 28,196 | 29,493 | 32,496 | ||||||||||||||||||||||||
Cost of revenues(1) | 4,000 | 4,471 | 5,337 | 6,045 | 6,574 | 6,958 | 8,137 | 10,347 | ||||||||||||||||||||||||
|
|
|
|
|
|
|
|
|
|
|
|
|
|
|
| |||||||||||||||||
Gross profit | 13,317 | 16,603 | 18,516 | 17,057 | 19,846 | 21,238 | 21,356 | 22,149 | ||||||||||||||||||||||||
|
|
|
|
|
|
|
|
|
|
|
|
|
|
|
| |||||||||||||||||
Operating expenses: | ||||||||||||||||||||||||||||||||
Research and development(1) | 5,551 | 6,302 | 8,040 | 8,961 | 9,354 | 10,376 | 12,616 | 13,255 | ||||||||||||||||||||||||
Sales and marketing(1) | 9,917 | 10,045 | 11,769 | 15,709 | 19,499 | 21,925 | 25,681 | 26,875 | ||||||||||||||||||||||||
General and administrative(1) | 4,588 | 5,989 | 6,591 | 7,317 | 6,809 | 8,258 | 9,896 | 9,411 | ||||||||||||||||||||||||
|
|
|
|
|
|
|
|
|
|
|
|
|
|
|
| |||||||||||||||||
Total operating expenses | 20,056 | 22,336 | 26,400 | 31,987 | 35,662 | 40,559 | 48,193 | 49,541 | ||||||||||||||||||||||||
|
|
|
|
|
|
|
|
|
|
|
|
|
|
|
| |||||||||||||||||
Loss from operations | (6,739 | ) | (5,733 | ) | (7,884 | ) | (14,930 | ) | (15,816 | ) | (19,321 | ) | (26,837 | ) | (27,392 | ) | ||||||||||||||||
Interest and other expense, net | (731 | ) | (177 | ) | (263 | ) | (155 | ) | (630 | ) | (144 | ) | (253 | ) | (501 | ) | ||||||||||||||||
|
|
|
|
|
|
|
|
|
|
|
|
|
|
|
| |||||||||||||||||
Loss before benefit from (provision for) income taxes | (7,470 | ) | (5,910 | ) | (8,147 | ) | (15,085 | ) | (16,446 | ) | (19,465 | ) | (27,090 | ) | (27,893 | ) | ||||||||||||||||
Benefit from (provision for) income taxes | (253 | ) | (1,062 | ) | (1,499 | ) | (1,565 | ) | (646 | ) | (472 | ) | 2,670 | (1,095 | ) | |||||||||||||||||
|
|
|
|
|
|
|
|
|
|
|
|
|
|
|
| |||||||||||||||||
Net loss | (7,723 | ) | (6,972 | ) | (9,646 | ) | (16,650 | ) | (17,092 | ) | (19,937 | ) | (24,420 | ) | (28,988 | ) | ||||||||||||||||
(Income) loss attributable to noncontrolling interest | (39 | ) | (87 | ) | (92 | ) | 4 | (6 | ) | (26 | ) | 4 | 2 | |||||||||||||||||||
|
|
|
|
|
|
|
|
|
|
|
|
|
|
|
| |||||||||||||||||
Net loss attributable to Good Technology Corporation common stockholders | $ | (7,762 | ) | $ | (7,059 | ) | $ | (9,738 | ) | $ | (16,646 | ) | $ | (17,098 | ) | $ | (19,963 | ) | $ | (24,416 | ) | $ | (28,986 | ) | ||||||||
|
|
|
|
|
|
|
|
|
|
|
|
|
|
|
| |||||||||||||||||
61
Table of Contents
| (1) | Includes stock-based compensation expenses as follows: |
| Three Months Ended, | ||||||||||||||||||||||||||||||||
| Mar 31, 2011 | Jun 30, 2011 | Sep 30, 2011 | Dec 31, 2011 | Mar 31, 2012 | Jun 30, 2012 | Sep 30, 2012 | Dec 31, 2012 | |||||||||||||||||||||||||
| (in thousands) | ||||||||||||||||||||||||||||||||
Cost of revenues | $ | 63 | $ | 84 | $ | 103 | $ | 119 | $ | 122 | $ | 135 | $ | 216 | $ | 301 | ||||||||||||||||
Research and development | 165 | 180 | 327 | 360 | 374 | 401 | 678 | 1,076 | ||||||||||||||||||||||||
Sales and marketing | 304 | 327 | 395 | 431 | 533 | 641 | 1,064 | 1,025 | ||||||||||||||||||||||||
General and administrative | 356 | 386 | 422 | 449 | 606 | 585 | 815 | 629 | ||||||||||||||||||||||||
|
|
|
|
|
|
|
|
|
|
|
|
|
|
|
| |||||||||||||||||
Total stock-based compensation expense | $ | 888 | $ | 977 | $ | 1,247 | $ | 1,359 | $ | 1,635 | $ | 1,762 | $ | 2,773 | $ | 3,031 | ||||||||||||||||
|
|
|
|
|
|
|
|
|
|
|
|
|
|
|
| |||||||||||||||||
| Three Months Ended, | ||||||||||||||||||||||||||||||||
| Mar 31, 2011 | Jun 30, 2011 | Sep 30, 2011 | Dec 31, 2011 | Mar 31, 2012 | Jun 30, 2012 | Sep 30, 2012 | Dec 31, 2012 | |||||||||||||||||||||||||
Revenues: | ||||||||||||||||||||||||||||||||
Software and services | 58 | % | 66 | % | 71 | % | 75 | % | 78 | % | 80 | % | 80 | % | 82 | % | ||||||||||||||||
Intellectual property licensing | 42 | 34 | 29 | 25 | 22 | 20 | 20 | 18 | ||||||||||||||||||||||||
|
|
|
|
|
|
|
|
|
|
|
|
|
|
|
| |||||||||||||||||
Total revenues | 100 | 100 | 100 | 100 | 100 | 100 | 100 | 100 | ||||||||||||||||||||||||
Cost of revenues | 23 | 21 | 22 | 26 | 25 | 25 | 28 | 32 | ||||||||||||||||||||||||
|
|
|
|
|
|
|
|
|
|
|
|
|
|
|
| |||||||||||||||||
Gross profit | 77 | 79 | 78 | 74 | 75 | 75 | 72 | 68 | ||||||||||||||||||||||||
|
|
|
|
|
|
|
|
|
|
|
|
|
|
|
| |||||||||||||||||
Operating expenses: | ||||||||||||||||||||||||||||||||
Research and development | 32 | 30 | 34 | 39 | 35 | 37 | 43 | 40 | ||||||||||||||||||||||||
Sales and marketing | 57 | 48 | 49 | 68 | 74 | 78 | 87 | 83 | ||||||||||||||||||||||||
General and administrative | 27 | 28 | 28 | 31 | 26 | 29 | 33 | 29 | ||||||||||||||||||||||||
|
|
|
|
|
|
|
|
|
|
|
|
|
|
|
| |||||||||||||||||
Total operating expenses | 116 | 106 | 111 | 138 | 135 | 144 | 163 | 152 | ||||||||||||||||||||||||
|
|
|
|
|
|
|
|
|
|
|
|
|
|
|
| |||||||||||||||||
Loss from operations | (39 | ) | (27 | ) | (33 | ) | (64 | ) | (60 | ) | (69 | ) | (91 | ) | (84 | ) | ||||||||||||||||
Interest and other expense, net | (4 | ) | (1 | ) | (1 | ) | (1 | ) | (2 | ) | — | (1 | ) | (2 | ) | |||||||||||||||||
|
|
|
|
|
|
|
|
|
|
|
|
|
|
|
| |||||||||||||||||
Loss before benefit from (provision for) income taxes | (43 | ) | (28 | ) | (34 | ) | (65 | ) | (62 | ) | (69 | ) | (92 | ) | (86 | ) | ||||||||||||||||
Benefit from (provision for) income taxes | (2 | ) | (5 | ) | (6 | ) | (7 | ) | (3 | ) | (2 | ) | 9 | (3 | ) | |||||||||||||||||
|
|
|
|
|
|
|
|
|
|
|
|
|
|
|
| |||||||||||||||||
Net loss | (45 | )% | (33 | )% | (40 | )% | (72 | )% | (65 | )% | (71 | )% | (83 | )% | (89 | )% | ||||||||||||||||
|
|
|
|
|
|
|
|
|
|
|
|
|
|
|
| |||||||||||||||||
62
Table of Contents
The tables below set forth the reconciliation of enterprise software and services revenues to total enterprise software and services billings, and total revenues to billings, both of which are non-GAAP measures, for the periods shown (in thousands). For more details on the limitations of using non-GAAP financial measures, please see “Management’s Discussion and Analysis of Financial Condition and Results of Operations—Key Financial Metrics.”
| Three Months Ended, | ||||||||||||||||||||||||||||||||
| Mar 31, 2011 | Jun 30, 2011 | Sep 30, 2011 | Dec 31, 2011 | Mar 31, 2012 | Jun 30, 2012 | Sep 30, 2012 | Dec 31, 2012 | |||||||||||||||||||||||||
Enterprise Software and Services Billings: | ||||||||||||||||||||||||||||||||
Enterprise software and services revenue | $ | 2,430 | $ | 3,239 | $ | 4,321 | $ | 6,148 | $ | 8,437 | $ | 9,912 | $ | 11,938 | $ | 14,836 | ||||||||||||||||
Enterprise software and services deferred revenue, end of period | 54,907 | 74,051 | 93,930 | 126,659 | 149,668 | 179,082 | 200,405 | 236,897 | ||||||||||||||||||||||||
Less: enterprise software and services deferred revenue, beginning of period | (41,048 | ) | (54,907 | ) | (74,051 | ) | (93,930 | ) | (126,659 | ) | (149,668 | ) | (179,082 | ) | (200,405 | ) | ||||||||||||||||
|
|
|
|
|
|
|
|
|
|
|
|
|
|
|
| |||||||||||||||||
Enterprise software and services billings (non-GAAP) | $ | 16,289 | $ | 22,383 | $ | 24,200 | $ | 38,877 | $ | 31,446 | $ | 39,326 | $ | 33,261 | $ | 51,328 | ||||||||||||||||
|
|
|
|
|
|
|
|
|
|
|
|
|
|
|
| |||||||||||||||||
| Three Months Ended, | ||||||||||||||||||||||||||||||||
| Mar 31, 2011 | Jun 30, 2011 | Sep 30, 2011 | Dec 31, 2011 | Mar 31, 2012 | Jun 30, 2012 | Sep 30, 2012 | Dec 31, 2012 | |||||||||||||||||||||||||
Total Billings: | ||||||||||||||||||||||||||||||||
Total revenues | $ | 17,317 | $ | 21,074 | $ | 23,853 | $ | 23,102 | $ | 26,420 | $ | 28,196 | $ | 29,493 | $ | 32,496 | ||||||||||||||||
Deferred revenues, end of period | 239,731 | 252,456 | 267,796 | 296,408 | 311,859 | 332,840 | 347,209 | 376,591 | ||||||||||||||||||||||||
Less: deferred revenues, beginning of period | (235,975 | ) | (239,731 | ) | (252,456 | ) | (267,796 | ) | (296,408 | ) | (311,859 | ) | (332,840 | ) | (347,209 | ) | ||||||||||||||||
Add back: common stock warrant issuance | — | 1,607 | — | — | — | — | — | — | ||||||||||||||||||||||||
|
|
|
|
|
|
|
|
|
|
|
|
|
|
|
| |||||||||||||||||
Total billings (non-GAAP) | $ | 21,073 | $ | 35,406 | $ | 39,193 | $ | 51,714 | $ | 41,871 | $ | 49,177 | $ | 43,862 | $ | 61,878 | ||||||||||||||||
|
|
|
|
|
|
|
|
|
|
|
|
|
|
|
| |||||||||||||||||
With the exception of the third quarter of 2012, we tend to experience higher billings in the second half of the year, primarily due to government-related purchases that typically occur in the third quarter, in line with the governmental fiscal year end, and in the fourth quarter primarily due to enterprise purchases that take place prior to the next budget cycle. The higher sales in the third and fourth quarters tend to result in lower sequential billings in the first quarter. We expect this seasonality to continue in 2013 and for the foreseeable future.
As is typical in the enterprise software industry, we expect a significant portion of our quarterly sales of software and services to occur at the end of each quarter, and in particular, the last two weeks of the quarter, which makes it difficult to accurately forecast our expected billings and revenues.
Research and development expenses increased sequentially in every quarter primarily due to increases in headcount-related expenses. In addition, we increased our consulting expenses each quarter as we outsourced certain development projects.
63
Table of Contents
Sales and marketing expenses increased sequentially in every quarter primarily due to increases in headcount-related expenses. Increases in the third and fourth quarter of each year tend to be higher consistent with higher billings and the associated increased commissions earned that are not deferred.
General and administrative expenses have generally trended higher primarily due to headcount-related expenses, as well as increased consulting and professional services fees related to legal and accounting activities to support growth in our business and additional costs related to litigation.
Liquidity and Capital Resources
As of December 31, 2012, we had cash and cash equivalents totaling $29.5 million. Our accumulated deficit as of December 31, 2012 was $490.3 million. We have funded this deficit primarily through the net proceeds raised from the sale of our capital stock, proceeds from intellectual property licensing and securing a term loan and a line of credit described below which, as of December 31, 2012, had an outstanding principal balance of $15.2 million. In April 2013, we issued 12.2 million shares of Series C redeemable convertible preferred stock for gross proceeds of $50.0 million.
In January 2011, we entered into a loan and security agreement with Silicon Valley Bank, or Lender, to fund our working capital and other general corporate needs. This agreement provided for a term loan and an asset-based revolving line of credit. This agreement was amended throughout 2011 and 2012, most recently in April 2013.
Term Loan
The amendments allowed for us to borrow up to an aggregate $22.5 million under the term loan facility. Advances may be repaid over a period of 36 months or 48 months and carry an interest rate, fixed as of the funding date, equal to the Wall Street Journal prime rate plus 2.0%. In January 2011 and September 2011, we borrowed $6.0 million and $2.5 million, respectively, repayable in 36 monthly installments from the date of each borrowing. In December 2011, we borrowed $5.5 million repayable in 48 monthly installments. Each of these 2011 borrowings had an interest rate of 5.25%. In July 2012 and September 2012, we borrowed $6.0 million and $2.5 million, respectively, repayable in 36 monthly installments from the date of borrowing. Each of these 2012 borrowings have an interest rate of 5.0%. Each of these borrowings also have end of term payments and as a result the effective interest rate for the combined loans is approximately 7.0%. As part of the June 2012 amendment, we renegotiated the annual interest rate on a prospective basis on our 2011 borrowings with SVB from 5.25% to 5.0%. The aggregate principal amounts outstanding on the term loans as of December 31, 2012 were $15.2 million. No additional amounts were available for borrowing at December 31, 2012.
Credit Facility
As of December 31, 2012, the agreement also provided for an asset-based revolving line of credit of up to $10.0 million which was subsequently increased to $15.0 million as described below. The amount available on the revolving line of credit at any point in time is based on 80% of eligible receivables and is subject to a borrowing base calculation. Principal amounts outstanding under the revolving line accrue interest at a floating per annum rate equal to the Wall Street Journal prime rate plus 1.5% and are repayable monthly. No borrowings have been made against the revolving line of credit, but as of December 31, 2012, the available borrowing base was reduced by $4.3 million for outstanding letters of credit; bringing down the available revolving line of credit to $5.7 million. The revolving credit line has a nonrefundable annual commitment fee of 0.5% on the maximum revolving line as well as an unused line charge to be paid quarterly, between 0.3%—0.5% per annum depending on the average unused portion of the revolving line. Further, a letter of credit fee of 1.25% per annum of the face amount is charged to us for each letter of credit issued during the term of such issuance and upon the renewal of such letter of credit.
64
Table of Contents
Collateralization and Loan Covenants
The term loans and the revolving line of credit under the agreement are collateralized by all our assets with the exception of intellectual property; however, the collateral does include all proceeds of all intellectual property. In addition, we have provided a negative pledge regarding our intellectual property and cannot encumber it without the lender’s consent. The agreement contains financial covenants which require us (1) to maintain liquidity of unused amounts on the borrowings or the revolving line, whichever is less, plus unrestricted cash and cash equivalents, or unrestricted cash, of at least $10.0 million; (2) to achieve cash flow performance metrics as defined in the amended agreement; (3) to limit capital expenditures to no greater than $12.0 million annually; and (4) to maintain defined ratio levels for maximum senior leverage, minimum fixed charge coverage and current assets-to-current liabilities. Immediately upon the occurrence, and during the continuance of, an event of default, including the non-compliance with the above financial covenants, the lender may increase the interest rate per annum 3.0% above the rate that is otherwise applicable. Both the term loan and the revolving credit facility contain a material adverse change clause in an event of default of any financial covenants.
For the quarter ended September 30, 2012, we were not in compliance with the fixed charge coverage ratio and for October 2012, we were not in compliance with the current assets-to-current liabilities ratio. In November 2012, we obtained a waiver from the lender for a fee of $0.2 million. As a condition of the waiver, we agreed to reduce our undrawn revolving credit line from $15.0 million to $10.0 million, decrease the required unrestricted cash requirement, excluding unused amounts on the borrowings or the revolving line, from $10.0 million to $7.5 million, added financial covenants that require us to maintain a certain ratio of cash and accounts receivable balances to outstanding loan and revolving credit line balances, and to secure at least $50.0 million in capital financing. In April 2013, we issued Series C redeemable convertible preferred stock for gross proceeds of $50.0 million and as a result, we were in compliance with all these covenants. Following the financing, we and the lender negotiated an additional loan covenant to maintain a defined minimum adjusted gross profit amount measured on a trailing six month basis. In addition, we are required to maintain unrestricted cash and cash equivalents and unused amounts on the borrowings of at least $17.5 million. The maximum revolving credit line amount was reestablished to $15.0 million. Finally, the annual limit on capital expenditures was removed from the covenants.
Cash Position
As we continue to grow the business we expect that in any given quarter, we may experience fluctuations in our cash flows from operations. Despite the possibility of such fluctuations in operating cash outflows, management believes our current cash, cash equivalents, borrowings, funds from the issuance of Series C redeemable convertible preferred stock and line of credit are sufficient to meet our operating and capital expenditure cash flow needs for the next 12 months. However, we may elect to raise additional capital through the sale of additional equity or debt securities, obtain an additional credit facility, license our intellectual property or sell certain assets. If additional funds are raised through the issuance of additional debt or equity securities, holders of any such securities could have rights, preferences and privileges senior to holders of common stock, and the terms of any debt could impose restrictions on our operations. The sale of additional equity or convertible debt securities could result in additional dilution to our stockholders and additional financing may not be available in amounts or on terms acceptable to us. If additional financing becomes necessary and we are unable to obtain the additional funds, we may be required to reduce the scope of our planned product development and marketing efforts, potentially harming our business, financial condition and operating results. In the meantime, we intend to continue to manage our cash in a manner designed to ensure that we have adequate cash and cash equivalents to fund our operations. There can be no assurance that we will be successful in executing our business plan, maintaining our existing customer base or achieving profitability. Failure to generate sufficient revenues, achieve planned gross margins, control operating costs or raise sufficient additional funds may require us to modify, delay or abandon some of our planned future expansion or expenditures, which could have a material adverse effect on our business, operating results, financial condition and ability to achieve our intended business objectives.
65
Table of Contents
U.S. income taxes and foreign withholding taxes associated with the repatriation of earnings of foreign subsidiaries were not provided for on a cumulative total of $6.5 million of undistributed earnings for certain foreign subsidiaries as of December 31, 2012. We intend to reinvest these earnings indefinitely in our foreign subsidiaries. If these earnings were distributed to the United States in the form of dividends or otherwise, or if the shares of the relevant foreign subsidiaries were sold or otherwise transferred, we would be subject to additional U.S. income taxes (subject to an adjustment for foreign tax credits) and foreign withholding taxes. Determination of the amount of unrecognized deferred income tax liability related to these earnings is not practicable.
Restricted cash consisting primarily of a marketing development fund with one of our customers and a security deposit relating to certain litigation costs totaled $1.4 million and $0.6 million as of December 31, 2011 and 2012, respectively.
A summary of our cash flow activities were as follows for the periods presented (in thousands):
| Years Ended December 31, | ||||||||||||
| 2010 | 2011 | 2012 | ||||||||||
Net cash provided by (used in) operating activities | $ | (22,333 | ) | $ | 9,029 | $ | (9,059 | ) | ||||
Net cash used in investing activities | (3,527 | ) | (4,129 | ) | (7,942 | ) | ||||||
Net cash provided by financing activities | 86 | 11,391 | 5,898 | |||||||||
Effect of exchange rate changes on cash and cash equivalents | (465 | ) | 168 | 25 | ||||||||
|
|
|
|
|
| |||||||
Net increase (decrease) in cash and cash equivalents | $ | (26,239 | ) | $ | 16,459 | $ | (11,078 | ) | ||||
|
|
|
|
|
| |||||||
Operating Activities
We had net cash out-flows from operations of $9.1 million for the year ended December 31, 2012 as compared to net cash in-flows from operations of $9.0 million for year ended December 31, 2011. The change in use of cash flows from operations was primarily from a higher net loss, partially offset by substantially higher deferred revenue balances. The deferred revenue balances increased primarily due to the 53% increase in billings from sales of our enterprise software and services. In addition, there was a payment of $3.7 million in state taxes in the first quarter of 2011 and a subsequent refund of $3.0 million in the first quarter of 2012 after the filing of our tax returns. Finally we had higher stock-based compensation expenses from increased headcount and a higher common stock price, higher depreciation and amortization expenses from capital additions and intangibles from acquisitions and lower payments on accounts payable and other liabilities.
We had net cash in-flows from operations of $9.0 million for the year ended December 31, 2011 as compared to net cash out-flows from operations of $22.3 million for the year ended December 31, 2010. The improved cash flows was largely due to a substantial increase in billings, partially offset by higher payments for income taxes and an increase in deferred commissions as we paid higher commissions for the related higher sales.
Investing Activities
We had net cash out-flows from investing activities of $7.9 million for the year ended December 31, 2012, compared to net cash out-flows from investing activities of $4.1 million for the year ended December 31, 2011. In 2012 we incurred significant costs related to computer software and systems implementations to enhance the productivity of our back office sales, IT and accounting functions. In addition, during 2012, our restricted cash decreased primarily due to the lapse of certain marketing development funds with a customer, as well as the release of certain cash balances related to a legal settlement. These balances were partially offset by proceeds from the sale of our land and building in Bordeaux, France as well as net cash received from our acquisitions of Copiun and AppCentral.
We had net cash out-flows from investing activities of $4.1 million for the year ended December 31, 2011, compared to net cash out-flows of $3.5 million for the year ended December 31, 2010. In 2011, we moved into
66
Table of Contents
our new facility as well as incurred significant costs related to computer software and systems implementations to enhance the productivity of our back office sales, IT and accounting functions. These capital purchases were partially offset by lower restricted cash balances.
Financing Activities
We had net cash in-flows from financing activities of $5.9 million for the year ended December 31, 2012, compared to net cash in-flows from financing activities of $11.4 million for the year ended December 31, 2011. We received proceeds from the issuance of redeemable convertible preferred stock of $1.1 million in 2012. In addition we paid higher principal payments on our notes payable in 2012 as compared to 2011. We received $14.0 million in 2011 and $8.3 million in 2012 from borrowings.
We had net cash in-flows from financing activities of $11.4 million for the year ended December 31, 2011, compared to net cash in-flows from financing activities of $86,000 for the year ended December 31, 2010. In 2011, we borrowed $14.0 million and received $2.7 million in proceeds from the issuance of our common stock. These increases were partially offset by $4.1 million in payments on our borrowings.
Off Balance Sheet Arrangements
During the periods presented, we did not have any relationships with unconsolidated entities or financial partnerships, such as entities often referred to as structured finance or special purpose entities, which would have been established for the purpose of facilitating off-balance sheet arrangements or other contractually narrow or limited purpose.
Contractual Obligations
The following table summarizes our contractual obligations and commitments as of December 31, 2012 (in thousands):
| Payments due by period | ||||||||||||||||||||
| Total | Less than 1 Year | 1 to 3 Years | 3 to 5 Years | More than 5 Years | ||||||||||||||||
Principal debt payments | $ | 15,139 | $ | 7,042 | $ | 8,097 | $ | — | $ | — | ||||||||||
Contractual interest payments on debt | 1,494 | 604 | 890 | — | — | |||||||||||||||
Operating lease obligations | 20,046 | 3,818 | 6,506 | 9,722 | — | |||||||||||||||
Capital lease obligations | 842 | 842 | — | — | — | |||||||||||||||
Non-recourse purchase commitments | 12,000 | 12,000 | — | — | — | |||||||||||||||
|
|
|
|
|
|
|
|
|
| |||||||||||
Total | $ | 49,521 | $ | 24,306 | $ | 15,493 | $ | 9,722 | — | |||||||||||
|
|
|
|
|
|
|
|
|
| |||||||||||
At December 31, 2012, we had a liability for unrecognized tax benefits of $9.4 million. Due to uncertainties with respect to the timing of future cash flows associated with our unrecognized tax benefits, we are unable to make reasonably reliable estimates of the period of cash settlement with the applicable taxing authority. Therefore, the $9.4 million has been excluded from the contractual obligations table above. Also excluded in the table above is a royalty accrual of approximately $2.4 million for use of a third-party’s technology.
Our operating lease obligations primarily relate to the lease of our corporate headquarters in Sunnyvale, California and our office in London, England. Our capital lease obligations consist of equipment financing arrangements with vendors.
In December 2012, we entered into a non-recourse purchase commitment with BoxTone, Inc., or BoxTone, under which we will resell certain of BoxTone’s software to our customers. The arrangement provides our customers with access to BoxTone’s advanced mobile device management, mobile application management and
67
Table of Contents
mobile service management capabilities. Under the terms of the arrangement, we are obligated to purchase a minimum of $12.0 million of BoxTone’s software licenses through 2013.
Critical Accounting Policies and Estimates
Our consolidated financial statements have been prepared in accordance with U.S. generally accepted accounting principles. The preparation of these financial statements requires us to make estimates and assumptions that affect the reported amounts of assets, liabilities, revenues, operating expenses and related disclosures. We base our estimates and assumptions on our historical experience and various other assumptions that we believe are reasonable under the circumstances. Our actual results may differ from the estimates we make. To the extent that there are material differences between these estimates and actual results, our future financial statement presentation, financial condition, results of operations and cash flows will be affected.
While our significant accounting policies are more fully described in Note 2 to our consolidated financial statements, we believe that the following accounting policies involve a greater degree of judgment. Accordingly, these are the policies we believe are the most critical to the process of making significant judgments and estimates in the preparation of our consolidated financial statements.
Revenues
We generate revenues from the sale of software solutions which are composed of secure mobile collaboration applications and mobile application platforms, andessential software-related connectivity services delivered through our network operating center, also referred to as our Good Secure Cloud. We also generate revenues from licensing of our intellectual property. Our customers include enterprises, governments, companies operating corporate communication networks, OEMs, and telecommunications carriers.
We recognize revenues when all of the following conditions are met:
| • | We enter into a legally binding arrangement with a customer; |
| • | Products or services are delivered; |
| • | The fees are fixed or determinable and free of contingencies or significant uncertainties; and |
| • | The collection of fees is probable. |
Primarily all of our software licensing arrangements are considered to be multiple element arrangements as they include licenses to use our software on the customers’ servers and mobile devices, software maintenance and support and secure connectivity services. The majority of our software is sold under perpetual licenses and includes an initial software maintenance and support period of one to three years. Maintenance and support consists of software maintenance and customer support, which are delivered for a single fee and can be renewed upon contract expiration at the customer’s option. Software maintenance includes unspecified product upgrades, updates and bug fixes. Customer support consists of access to live technical support technicians, online knowledge resources and on-site or dedicated remote support for premium-level customers. For time-based software license sales, license, maintenance and support fees are bundled into a single selling unit with a defined period of use. Both perpetual and time-based licenses also include access to our network operating center secure connectivity service, which enables the secure connection between the customers’ servers and their mobile devices.The delivered software elements are considered to be essential to the functionality and utility of the secure connectivity service. We provide customers with access to our secure connectivity service, for the entire term of the time-based licenses, and perpetually with perpetual software licenses.
All of the deliverables are deemed to be in the scope of the software revenue recognition rules. The secure connectivity service element is essential to the functionality of the delivered software and, as such, these services do not qualify for separate accounting as a service, and accordingly, contract accounting is applied to both the
68
Table of Contents
software and service elements included in the arrangement. Following the units-of-delivery method, we recognize the entire arrangement fee ratably over the service performance period, as the integrated solution is delivered in the same pattern. As the customer is purchasing an integrated solution, for which the elements are inseparable due to the essential nature of the software and service elements to one another, the associated revenues are presented in a single line item, Software and services, in our consolidated statements of operations.
Since the secure connectivity service obligation is perpetual, we must estimate our service delivery period. When the customer’s software licenses can be transferred to new users, mobile devices or operating systems, our service delivery period is deemed to be the estimated average length of the customer’s relationship with us. We compute the estimated length of the customer relationship at least once each year, and more frequently if qualitative evidence exists that would indicate a possible change in estimated life. We have estimated the average length of the customer relationship to be five years based on historical trends, technological obsolescence and industry perspectives. In arrangements that do not allow for transferability of the perpetual license, such as sales to OEM handset manufacturers, we use the estimated life of the consumer’s mobile device, or 18 months. We estimate the life of the consumer’s mobile device based on industry reports and device refresh eligibility periods by mobile carriers. All elements bundled with the perpetual license are amortized over the same service delivery period.
While we believe our estimates of the average length of the customer relationship period and the life of the consumer’s device to be reasonable based on available information, we may revise such estimates in the future as the profile and behaviors of our customers and the replacement patterns of consumer devices change. Any adjustments arising from changes in the estimates would be applied prospectively on the basis that such changes are caused by new information. Any changes in our estimates of useful lives of these customer relationships or replacement patterns of consumer devices may result in revenues being recognized on a basis different from prior periods’ and may cause our operating results to fluctuate.
We recognize revenues for time-based software licenses and any bundled elements over the contractual term of the arrangement, which is generally one to three years. When an arrangement includes both time-based and perpetual software licenses, all revenues are recognized ratably over the longer of the service delivery periods applicable to time-based and perpetual software licenses.
In certain arrangements with telecommunication carriers, license, maintenance and support and secure connectivity services are billed monthly in arrears based on actual usage. We estimate and recognize revenues from carriers in the current period for those carriers who provide reliable sales data within a reasonable time frame following the end of each month, which allows us to make reasonable estimates of revenues. Determination of the appropriate amount of revenues recognized involves judgments and estimates that we believe are reasonable, but it is possible that actual results may differ from our estimates. Revenues from other carriers are recognized when billed.
We also provide professional services such as deployment, consulting and training. These services can be part of software license arrangements or sold separately. When professional services are sold as part of software license arrangements, amortization of revenue for the entire transaction does not commence until completion and acceptance of these professional services, as delivery is not considered to have occurred. Revenues from professional services sold separately from software licenses are recognized upon completion of the services and have not been material to date.
Revenues from renewals of support and maintenance contracts are recognized ratably over the contract term.
Intellectual property licensing revenues represent cash settlements with various companies for infringement of our patents or direct licenses of our intellectual property. As part of these settlements, we have granted such companies licenses and a release from all prior damages associated with our patent assets and, in certain circumstances, rights to future intellectual property developed by us. Revenues from these agreements are recognized, based on the terms of the agreements with licensees, immediately, when we have no remaining
69
Table of Contents
obligations to the licensee, or amortized over performance periods of up to 13.8 years, when we have granted to licensees rights to receive future intellectual property we may develop.
Deferred revenues consist of both intellectual property licensing revenues and payments received in advance of revenue recognition from software licensing and service arrangements. Such revenues are recognized as revenue recognition criteria are met. Deferred revenues that are expected to be recognized during the succeeding 12-month period are recorded as current deferred revenues, and the remaining portion is recorded as noncurrent.
Deferred Commissions
We capitalize incremental and directly-related commission costs upon the execution of the sales contract by the customer. Payments to sales personnel are made shortly after the receipt of the related customer payment. The deferred commission amounts are recoverable through the future revenue streams under the related customer contracts. We believe this is preferable to expensing the commissions as incurred because the commission costs are closely related to revenues. Amortization of deferred commissions is included in sales and marketing expense in the consolidated statements of operations over the period that the revenues from the related customer contract is recognized.
Business Combinations
When we acquire businesses, we allocate the purchase price to tangible assets and liabilities and identifiable intangible assets acquired. Any residual purchase price is recorded as goodwill. The allocation of the purchase price requires management to make significant estimates in determining the fair values of assets acquired and liabilities assumed, especially with respect to intangible assets. These estimates are based on information obtained from management of the acquired companies and historical experience. These estimates can include, but are not limited to, the cash flows that an asset is expected to generate in the future and the cost savings expected to be derived from acquiring an asset. These estimates are inherently uncertain and unpredictable and, if different estimates were used, the purchase price for the acquisition could be allocated to the acquired assets and liabilities differently from the allocation that we have made. Furthermore, a change in the estimated fair value of an asset or liability often has a direct impact on the amount we recognize as goodwill, an asset that is not amortized. In addition, unanticipated events and circumstances may occur which may affect the accuracy or validity of such estimates and, if such events occur, we may be required to record a charge against the value ascribed to an acquired asset or an increase in the amounts recorded for assumed liabilities.
During 2012, we acquired two companies, Copiun and AppCentral, with our equity as the consideration. We utilized multiple approaches and methodologies to determine the value of our redeemable convertible preferred stock, common stock and stock options issued for these companies. The two primary approaches were the fundamental analysis approach, which uses generally accepted valuation methodologies to derive an indication of value and the stock transaction approach, which utilizes the indicated values from actual transactions in our common stock. The fundamental analysis and the stock transaction approach were weighted based on the facts and circumstances of each valuation. The weight assigned to the stock transaction approach was estimated based on the volume, comparability and proximity of the transactions to the valuation date. Throughout the year, the volume and size of third-party transactions increased. Accordingly, we increased our reliance and valuation weighting toward the stock transaction approach. The value difference between preferred and common stock was due to the different rights and preferences of the securities including liquidation preference.
For the fundamental analysis, we estimated the fair value of common stock using the probability-weighted expected return method, or PWERM, where we focused on two exit scenarios: an IPO scenario and a sale or merger, or M&A, scenario. Given our current stage of development and the exit strategy of our investors, we made the determination that the probabilities of a dissolution or a stay-private scenario were nominal and no indication of common stock value under these two scenarios was explicitly considered. The IPO scenario considers ranges of future equity values based on pricing multiples of comparable public companies and allocates value to our equity securities at the time of that future liquidity event, then discounts those future common stock
70
Table of Contents
values at an appropriate discount rate to the valuation date. To complete this analysis, we applied the guideline public company method of the market approach to value our common stock. For the M&A scenario, the valuation involved a two-step process. First, a current enterprise value was determined based on the discounted cash flow analysis and the comparable public company analysis. Second, the equity value was allocated to the securities comprising our capital structure using the Option Pricing Method, as described in “—Stock-Based Compensation.” The IPO and M&A scenarios were weighted based on our estimation of a future liquidity event. Our considerations of the form, timing and probability of a particular future liquidity event or outcome were based on the business outlook at the time of the valuation date.
We used the Black-Scholes valuation model to value the assumed Copiun and AppCentral options. As the Copiun assumed options were deep in-the-money, the value was essentially equal to their intrinsic value. For the assumed AppCentral options, the Black-Scholes assumptions were expected term ranging from 0.53 to 5.36 years, volatility of 57.6%, 0% dividend rate, and a 0.47% risk-free interest rate.
Copiun Acquisition in September 2012. The fair value of our redeemable convertible preferred stock per share and common stock per share issued in connection with the acquisition of Copiun was $4.84 and $4.61, respectively. We placed a 75% weighting on recent stock transactions of 6.7 million shares of our common stock at a weighted-average price of $5.05 per share, and the remaining 25% weighting to the fundamental analysis. Within the fundamental analysis, we assigned a 70% weighting toward an IPO outcome scenario occurring by June 2013, and the remaining 30% weighting toward a M&A outcome scenario. The IPO outcome scenario had a higher price per common share than the M&A outcome scenario.
AppCentral Acquisition in October 2012. The fair value of our redeemable convertible preferred stock per share and common stock per share issued in connection with the acquisition of AppCentral was $4.81 and $4.52, respectively. We continued to utilize the fundamental analysis and the stock transaction valuation approaches, and maintained the weighting of 75% on recent stock transactions of 7.2 million shares of our common stock at a weighted-average price of $5.05 per share, and weighting the remaining 25% on the fundamental analysis. For the fundamental analysis, we changed our weighting to 60% toward an IPO outcome scenario and the remaining 40% toward the M&A outcome scenario. During this time, management lowered its financial outlook for 2012 due to lower demand for the second half of 2012. Management lowered the weighting toward an IPO due to the lower demand and indications of a challenging economic environment particularly in Europe. In addition, we delayed our assumed IPO timing. Our lower demand was consistent with the lower price per share we estimated from our IPO outcome scenario due to the fact that our comparable company multiples during this timeframe were lower as well. The lower price per common share under the fundamental analysis was due to our lowered forecast, the lower weighting applied toward the IPO outcome scenario and the push out of the IPO timeframe.
The amortization period and method of acquired intangibles related to Copiun and AppCentral were estimated based on the following information:
Developed Technology. Our experience with technology refreshment cycles in the mobile security sector suggested that five years is a reasonable estimate of the period of amortization. In addition, based on data we monitor for estimating our customer’s life for revenue recognition purposes, we observed that five years was a reasonable estimate for our relationship with a customer; which, based on this five year technology refresh cycle, could be a reason for why a customer may decide to move to a competing or new mobile solution. In terms of estimating the amortization method, we determined that the straight-line method was appropriate. We considered whether it was possible that the asset would be consumed in a manner that was not straight-line. The associated cash flows for which the developed technology relates are more heavily weighted in the later years; however, we believe that the timing of these cash flows do not meet as high a level of confidence to determine them to be “reliably determinable” and therefore we assumed a straight-line method of amortization.
Customer Relationships. We determined a four year estimated life to be reasonable and this is consistent with what we have used in the past for customer relationships. Further, in determining the useful life, we considered the period of expected cash flows used to measure the fair value of the customer relationships. We
71
Table of Contents
analyzed the population and timing of the cash flows and determined that 80% of the cash flows are estimated to be realized in the next four years. If the range was expanded to 90%, the cash flows were as long as five years. We determined, however, that it would be more appropriate to amortize the relationship over the threshold for which it begins to exceed a significant majority (i.e., more than 75%) of what would be realized. This estimate, coupled with our historical experience, allowed us to determine that four years was reasonable. Absent a more reasonable method, we selected the straight-line method of amortization.
Impairment of Goodwill and Intangible Assets and Other Long-lived Assets
We record goodwill when the purchase price paid for an acquisition exceeds the estimated fair value of the net identified tangible and intangible assets acquired. We perform our annual review during the third quarter of each year, or more frequently if indicators of potential impairment exist, to determine if the carrying value of the recorded goodwill is impaired. Goodwill is not amortized. Triggering events that may indicate impairment include, but are not limited to, a significant adverse change in customer demand or business climate that could affect the value of goodwill or cause a significant decrease in expected cash flows. The impairment test is a two-step process. The first step is a comparison of the fair value of the reporting unit with its carrying amount, including goodwill. If this step indicates impairment, then the loss is measured as the excess of the recorded goodwill over its implied fair value, or the excess of the fair value of the reporting unit over the fair value of all identified assets and liabilities. We have concluded that we have one reporting unit. We identified no impairment of goodwill during 2010, 2011 or 2012.
We assess impairment of long-lived assets, such as intangible assets and property and equipment, on at least an annual basis and when events or changes in circumstances indicate that their carrying amount may not be recoverable. Circumstances which could trigger a review include, but are not limited to, significant decreases in the market price of the asset; significant adverse changes in the business climate or legal factors; accumulation of costs significantly in excess of the amount originally expected for the acquisition; current period cash flow or operating losses combined with a history of losses or a forecast of continuing losses associated with the use of the asset; or changes in the planned use of assets.
Recoverability is assessed based on the fair value of the asset, which is calculated as the sum of the undiscounted cash flows expected to result from the use and the eventual disposal of the asset. An impairment loss is recognized in the consolidated statements of operations when the carrying amount is determined to be not recoverable and exceeds fair value, which is determined on a discounted cash flow basis.
We make estimates and judgments about future undiscounted cash flows and fair value. Although our cash flow forecasts are based on assumptions that are consistent with our plans, there is significant exercise of judgment involved in determining the cash flows attributable to a long-lived asset over its estimated remaining useful life. Our estimates of anticipated future cash flows could be reduced significantly in the future. As a result, the carrying amount of our long-lived assets could be reduced through impairment charges in the future.
Income Taxes
We use the asset and liability method to account for income taxes, which requires the recognition of deferred tax assets and liabilities for the expected future income tax consequences of events that have been recognized in our consolidated financial statements or tax returns. Deferred tax assets and liabilities are recognized based on temporary differences between the financial statement carrying amounts and the tax bases of assets and liabilities using enacted tax rates in effect in the years in which the temporary differences are expected to reverse.
A valuation allowance is recorded to reduce the recognized net deferred tax assets to an amount that will more likely than not be realized. In order for us to realize our deferred tax assets, we must be able to generate sufficient future taxable income in the jurisdiction in which the tax asset is located. We consider forecasted
earnings, identified future taxable income and prudent and reasonable tax planning strategies in assessing the need for a valuation allowance.
72
Table of Contents
We also provide reserves as necessary for uncertain tax positions taken on our tax filings. First, we determine if a tax position is more likely than not to be sustained upon audit solely based on technical merits, including resolution of related appeals or litigation processes, if any. Second, based on the largest amount of benefit which is more likely than not to be realized on ultimate settlement, we recognize any such differences as a liability. We include in income tax expense any interest and penalties related to uncertain tax positions.
Significant judgment is required in evaluating our uncertain tax positions and determining our provision for income taxes. Although we believe our reserves are reasonable, no assurance can be given that the final tax outcome of these matters will not be different from that which is reflected in our historical income tax provisions and accruals. We adjust these reserves in light of changing facts and circumstances, such as the closing of a tax audit or refinement of an estimate. To the extent that the final tax outcome of these matters is different than the amounts recorded, such differences may impact the provision for income taxes in the period in which such determination is made.
Stock-Based Compensation
We measure stock-based compensation expense at the grant date based on the estimated fair value of the award using the Black-Scholes option pricing model. The estimated fair value, net of forfeitures, is recognized as an expense on a straight-line basis over the requisite service period, which is generally the vesting period. We estimate a forfeiture rate to calculate the stock-based compensation for our equity awards. Our forfeiture rate is based on an analysis of our actual historical forfeitures.
Our option-pricing model requires the input of highly-subjective assumptions, including the fair value of the underlying common stock, the expected term of the option, the expected volatility of the price of our common stock, risk-free rates, and the expected dividend yield of our common stock. The assumptions used in our option-pricing model represent management’s best estimates, and are as follows:
Fair Value of Our Common Stock. Because our common stock is not publicly traded, we must estimate the fair value of our common stock, as discussed in “Common Stock Valuations” below.
Expected Term. The expected term represents the period that our stock-based awards are expected to be outstanding. As we do not have sufficient historical experience for determining the expected term of the stock option awards granted, we have based our expected term on the simplified method available under U.S. GAAP.
Expected Volatility. As there is no public market for our common stock prior to this offering, we have limited information on the volatility of our common stock. The expected volatility is determined based on historical volatility of the common stock of a peer group of publicly traded companies. When making the selections of our industry peer companies to be used in the volatility calculation, we considered the size, operational and economic similarities to our principal business operations.
Risk-free Rate. The risk-free interest rate is based on the U.S. Treasury yield in effect at the time of grant for zero coupon U.S. Treasury notes with maturities approximately equal to the expected term of the awards.
Dividend Yield. We have not paid and do not expect to pay dividends.
The following assumptions were used for each respective period to calculate our stock-based compensation:
| Years Ended December 31, | ||||||||||||
| 2010 | 2011 | 2012 | ||||||||||
Risk-free rate | 1.83 | % | 1.35 | % | 0.82 | % | ||||||
Expected dividend yield | 0.00 | % | 0.00 | % | 0.00 | % | ||||||
Expected volatility | 68.10 | % | 67.04 | % | 58.85 | % | ||||||
Expected term (years) | 6.03 | 6.03 | 6.05 | |||||||||
73
Table of Contents
The following table summarizes options granted from January 1, 2012 to April 15, 2013:
Grant Date(1) | Number of Shares Subject to Options Granted | Exercise Price Per Share | Fair Value Per Share of Common Stock | |||||||||
January 17, 2012 | 4,159,000 | $ | 1.68 | $ | 1.97 | |||||||
March 27, 2012 | 1,714,750 | 2.35 | 2.35 | |||||||||
May 25, 2012 | 1,139,000 | 3.54 | 3.54 | |||||||||
July 26, 2012 | 2,195,250 | 3.89 | 3.89 | |||||||||
December 13, 2012 | 4,481,671 | 4.50 | 4.50 | |||||||||
February 6, 2013 | 10,296,817 | 4.13 | 4.13 | |||||||||
| (1) | The table above does not include options assumed in acquisitions since these options are not part of our recurring granting process. For a discussion of the fair value of our common stock at the acquisition dates, see Critical Accounting Policies and Estimates —Business Combinations. |
Based upon the assumed initial public offering price of $ per share, which is the midpoint of the price range set forth on the cover of this prospectus, the aggregate intrinsic value of options outstanding as of December 31, 2012 was $ million, of which $ million related to vested options and $ million related to unvested options.
Common Stock Valuations
The fair value of the common stock underlying our stock options was determined by our board of directors. To assist our board of directors with the determination of the exercise price of our stock options and the fair value of the common stock underlying the options, we obtained contemporaneous third-party valuations of our common stock. The independent valuations performed by unrelated third-party specialists were utilized by our board of directors to assist with the valuation of the common stock. However, management and our board of directors have assumed full responsibility for the estimates. The board of directors utilized the fair values of the common stock derived in the third-party valuations as a factor to set the exercise prices for options granted. The valuations of our common stock were determined in accordance with the guidelines in the American Institute of Certified Public Accountants Practice Aid,Valuation of Privately-Held-Company Equity Securities Issued as Compensation. The assumptions we use in the valuation models are based on future expectations combined with management judgment. In the absence of a public trading market, our board of directors, with input from management, exercised significant judgment and considered numerous objective and subjective factors to determine the estimated fair value of our common stock as of the date of each option grant, including:
| • | contemporaneous valuations performed by unrelated third-party specialists; |
| • | third-party sales of our common and redeemable convertible preferred stock; |
| • | the prices, rights, preferences and privileges of our redeemable convertible preferred stock relative to the common stock; |
| • | our operating results and financial condition; |
| • | current business conditions and projections; |
| • | revenue and billings growth; |
| • | material risks related to our business; |
| • | equity market conditions affecting comparable public companies; |
| • | the likelihood of achieving a liquidity event for our common stock, such as an initial public offering or sale of our company, given prevailing market and mobility sector conditions; |
| • | hiring of key personnel and the experience of our management; |
74
Table of Contents
| • | the status of our product development efforts; |
| • | industry information such as market size, sector growth and volume; |
| • | that the grants involved illiquid securities in a private company; and |
| • | the U.S. and global capital market conditions. |
Prior to May 2012, our board of directors determined the equity value of our business using various methodologies. We first established the enterprise value of our company using generally accepted valuation methodologies including discounted cash flow analysis and comparable public company analysis. Using the discounted cash flow analysis, we estimated the value based on the expectation of future cash flows we would generate. These future cash flows were discounted to their present values using a discount rate commensurate with the risks associated with the cash flows. An appropriate discount rate was derived from an analysis of the cost of capital of comparable publicly traded companies in our industry and required rates of return observed in venture capital-backed companies. Using the comparable public company analysis, we utilized market multiples of companies that are publicly traded to derive an indication of value. Given our significant focus on investing in and growing our business, we primarily utilized the revenue multiple when performing our valuation assessment under the market approach which we believe is the most useful metric to use when estimating our value as compared to other companies. Comparable companies were selected based on a number of criteria including the comparability of their operations, size and growth prospects to ours. We selected two comparable company groups based on our products and industry and business model. The first comparable company group was comprised of companies that develop enterprise and mobility products. The second comparable company group was comprised of software-as-a-service, or SaaS, companies with a large recurring revenue base. The discounted cash flow analysis and comparable company analysis were weighted equally in deriving an enterprise value. The composition of comparable companies did not change between the periods.
We then allocated the enterprise value to the securities comprising our capital structure using the Option Pricing Method, or OPM, as described in the AICPA Practice Aid titled Valuation of Privately-Held-Company Equity Securities Issued as Compensation. The concluded common stock value also reflected a discount for lack of marketability, or DLOM. In all valuation periods, the DLOM ranged between 10% and 15% and was not a major contributor to the change in the enterprise value between the periods.
In May 2012, our board of directors revised our valuation methodology. The two primary reasons for the change were the contemplation of a potential liquidity event and the completion of third-party transactions in our common stock. Commencing with the May 2012 grants, we utilized multiple approaches and methodologies to value our common stock. The two primary approaches were the fundamental analysis, which uses generally accepted valuation methodologies to derive an indication of value, and the stock transaction approach, which utilizes the indicated values from actual transactions in our common stock. The fundamental analysis and the stock transaction approach were weighted based on the facts and circumstances of each valuation. The weight assigned to the stock transaction approach was estimated based on the volume, comparability and proximity of the transactions to the valuation date. Throughout the year, the volume and size of third-party transactions increased. Accordingly, we increased our reliance and valuation weighting toward the stock transaction approach. We used secondary sales to third parties of our common and redeemable convertible preferred stock as a significant input into our common stock valuations, although these were not the only inputs considered, given the inherent limitations in these transaction prices due to the lack of information that the buying and selling stockholdershad of our historical results of operations and forecast.
For the fundamental analysis, we estimated the fair value of common stock using the probability-weighted expected return method, or PWERM, where we focused on two exit scenarios: an IPO scenario and a sale or merger, or M&A, scenario. Given our current stage of development and the exit strategy of our investors, we made the determination that the probabilities of a dissolution or a stay-private scenario were nominal, and no indication of common stock value under these two scenarios was explicitly considered. The IPO scenario
75
Table of Contents
considers ranges of future equity values based on pricing multiples of comparable public companies and allocates value to our equity securities at the time of that future liquidity event, then discounts those future common stock values at an appropriate discount rate to the valuation date. To complete this analysis, we applied the guideline public company method of the market approach to value our common stock. For the M&A scenario, the valuation involved a two-step process. First, a current enterprise value was determined based on the discounted cash flow analysis and the comparable public company analysis. Second, the equity value was allocated to the securities comprising our capital structure using the OPM, as described above. The IPO and M&A scenarios were weighted based on our estimation of a future liquidity event. Our considerations of the form, timing and probability of a particular future liquidity event or outcome were based on the business outlook at the time of the valuation date.
January to March 2012. The fair value of our common stock per share increased from $1.68 to $2.35 over this period. At this point, we had not considered the possibility of a liquidity event and therefore maintained the use of OPM to derive our enterprise value. The higher common stock value for the March 2012 grants compared to the January 2012 grants was primarily due to the incorporation of a higher financial forecast due to an improved outlook for our business. We usually experience a sequential decrease in billings and revenues in the first quarter compared to the fourth quarter. However, during this period, we only experienced a 19% decrease, which was a smaller percentage decrease than the prior year’s first quarter decrease of 34%. In addition, overall billings in the first quarter of 2012 nearly doubled compared to the first quarter of 2011, driven by increased sales of our Good for Enterprise application. Finally, our comparable company analysis indicated a higher enterprise value in March 2012 compared to January 2012.
Prior to the issuance of our consolidated financial statements for the year ended December 31, 2012 in connection with the initial submission of our registration statement on Form S-1, we decided to revise our estimate of the fair value of our common stock as of January 17, 2012 based on the length of time between the prior valuation and the grant date and the significant increase in fair value between valuation dates. The revised estimate of fair value as of the January 17, 2012 grant date was derived based on a linear increase in the estimated fair value of our common stock between the immediately previous valuation and the subsequent valuation. We used a linear increase method because we determined, based on a review of events during the period, that no single factor changed or single event occurred that would lead to a different change in the fair value of our common stock.
March to May 2012. The fair value of our common stock per share increased from $2.35 to $3.54 over this period. Our financial forecast in May 2012 remained unchanged from March 2012. In May 2012, we began to consider the possibility of a liquidation event and therefore adopted the equity valuation models utilizing the fundamental analysis and the stock transaction approaches described above to estimate our enterprise value. The higher common stock value for the May 2012 grants compared to the March 2012 grants was primarily due to placing a 50% weighting on recent stock transactions of 2.5 million shares of our common stock at a weighted-average price of $3.84 per share and the remaining 50% weighting to the fundamental analysis equity values. Both of these prices per share were higher than the March 2012 derived value. Within the fundamental analysis, we assigned a 60% weighting toward an IPO outcome scenario occurring by December 2013, and the remaining 40% weighting toward a M&A outcome scenario. The IPO outcome scenario had a higher common price per share value than the M&A outcome scenario. By introducing the 50% weighting for recent stock transactions and increasing the weighting toward the higher IPO outcome scenario price per share, the price per common share in May 2012 was higher than the price per common share in March 2012.
May to July 2012. The fair value of our common stock per share increased from $3.54 to $3.89 over this period. We continued to utilize the fundamental analysis and the stock transaction valuation approaches. However, we placed a heavier weighting of 75% on recent stock transactions of 2.6 million shares of our common stock at a weighted-average price of $4.00 per share and weighted the remaining 25% on the fundamental analysis. For the fundamental analysis, we maintained our weighting of 60% toward an IPO outcome scenario. The IPO outcome scenario price per common share was higher than the value in May 2012. This higher price per common share was partially discounted as a result of our decision to delay the expected
76
Table of Contents
timing of our IPO. The remaining 40% weighting was assigned to the M&A outcome scenario. During this time, management lowered its financial forecast for 2012 due to some indicators of lower demand for the second half of 2012. During this time period there were indications of a challenging economic environment, particularly in Europe. This resulted in a slight discount to the M&A outcome that was more than offset by an increase in comparable company values. The July 2012 common stock price was higher compared to the May 2012 common stock price primarily due to the increased weighting we assigned to recent stock transactions and a higher derived IPO outcome scenario price per common share.
July to December 2012. The fair value of our common stock per share increased from $3.89 to $4.50 over this period. We continued to utilize the fundamental analysis and the stock transaction valuation approaches, and maintained the weighting of 75% on recent stock transactions of 7.4 million shares of our common stock at a weighted-average price of $5.02 per share and weighted the remaining 25% on the fundamental analysis. The price per common share of recent stock transactions was higher in December 2012 than in July 2012, and this increased price was the primary driver for the increase in value of our price per common share. For the fundamental analysis, we maintained our weighting of 60% toward an IPO outcome scenario and the remaining 40% toward the M&A outcome scenario. During this time, management continued to lower its financial forecast due to an anticipated challenging second half of 2012. This lower demand was consistent with the lower price per share we estimated from our IPO outcome scenario due to the fact that our comparable company multiples during this timeframe also were lower. In addition, we further delayed the expected timing of our IPO. Despite the lower price per common share under the fundamental analysis approach due to our lowered forecast and the delay in the expected IPO timeframe, our price per common share increased as a result of the higher price in recent transactions of our common stock.
December 2012 to February 2013. The fair value of our common stock per share decreased from $4.50 to $4.13 over this period. We continued to utilize the fundamental analysis and the stock transaction valuation approaches, and maintained the weighting of 75% on recent stock transactions of 7.1 million shares of our common stock at a weighted-average price of $4.16 per share and weighted the remaining 25% on the fundamental analysis. The price per common share of recent stock transactions was lower in January 2013 than in December 2012, and this increased price was the primary driver for the decrease in value of our price per common share. For the fundamental analysis, we increased our weighting to 75% toward an IPO outcome scenario and the remaining 25% toward the M&A outcome scenario. The IPO outcome scenario price per common share was higher than the value in December 2012. During this time, management increased its financial forecast from December 2012 as part of its annual budget process. In addition, we hired a new Chief Executive Officer and made other management changes, which we believe will allow us to continue on a growth strategy. Finally, in February 2013, we began to negotiate the terms and conditions of our Series C redeemable convertible preferred stock financing, pursuant to which we issued shares of Series C redeemable convertible preferred stock to new investors, at a purchase price of $4.105 per share. These assumptions had the impact of increasing the derived value of our price per common share under the fundamental analysis. Despite the higher value derived under the fundamental analysis approach, we maintained our weighting more toward recent stock transactions which effectively lowered our common price per share compared to December 2012.
Quantitative and Qualitative Disclosure About Market Risk
We have operations both within the United States and internationally, and we are exposed to market risks in the ordinary course of our business. These risks primarily include interest rate, foreign exchange risks and inflation.
Interest Rate Fluctuation Risk
We had cash and cash equivalents of $40.5 million and $29.5 million as of December 31, 2011 and December 31, 2012, respectively. Our cash and cash equivalents are held primarily in cash deposits and money market funds. We hold our cash and cash equivalents for working capital purposes. Due to the short-term nature
77
Table of Contents
of these instruments, we believe that we do not have any material exposure to changes in the fair value of our investment portfolio as a result of changes in interest rates. Declines in interest rates, however, will reduce future interest income. During 2011 and 2012, a 10% appreciation or depreciation in overall interest rates would not have had a material impact on our interest income.
As of December 31, 2012, we had an outstanding term loan totaling $15.2 million. The loan has a fixed annual interest rate of 5.0%, and therefore, we do not have economic interest rate exposure on the loan. However, the fair value of the loan is exposed to interest rate risk. Generally, the fair market value of our fixed interest rate loan will increase as interest rates fall and decrease as interest rates rise.
Foreign Currency Exchange Risk
A substantial portion of our sales are currently denominated in U.S. dollars. We have foreign currency risks related to our revenues and operating expenses denominated in currencies other than the U.S. dollar, principally the British pound, the Euro, the Australian dollar, the Canadian dollar, the South Korean won and the Chinese yuan. The volatility of exchange rates depends on many factors that we cannot forecast with reliable accuracy. We have experienced and will continue to experience fluctuations in our net losses as a result of transaction gains (losses) related to revaluing certain cash balances, trade accounts receivable balances and accounts payable balances that are denominated in currencies other than the U.S. dollar. In the event our foreign currency denominated cash, accounts receivable, accounts payable, sales or expenses increase relative to our domestic sales and operations, our operating results may be more greatly affected by fluctuations in the exchange rates of the currencies in which we do business. To date, we have occasionally used foreign currency forward contracts to manage a portion of our currency exposure to the Euro. It is difficult to predict the impact hedging activities would have on our results of operations.
Inflation Risk
We do not believe that inflation has had a material effect on our business, financial condition or results of operations. If our costs were to become subject to significant inflationary pressures, we may not be able to fully offset such higher costs through price increases. Our inability or failure to do so could harm our business, financial condition and results of operations.
Recent Accounting Pronouncements
In June 2011, the Financial Accounting Standards Board, or FASB, issued amendments to the FASB Accounting Standard Codification relating to presentation of comprehensive income. The amendments require that all non-owner changes in stockholders’ equity be presented either in a single continuous statement of comprehensive income or in two separate but consecutive statements. The amendments should be applied retrospectively, and are effective for fiscal years, and interim periods with those years, beginning after December 15, 2011. The amendment had no impact on our financial statements as we do not have comprehensive income.
In September 2011, the FASB issued Accounting Standards Update, Testing Goodwill for Impairment (the revised standard). The revised standard is intended to reduce the cost and complexity of the annual goodwill impairment test by providing entities an option to perform a “qualitative” assessment to determine whether further impairment testing is necessary. The revised standard is effective for annual and interim goodwill impairment tests performed for fiscal years beginning after December 15, 2011. An entity has the option to first assess qualitative factors to determine whether it is necessary to perform the current two-step test. If an entity believes, as a result of its qualitative assessment, that it is more-likely-than-not that the fair value of a reporting unit is less than its carrying amount, the quantitative impairment test is required. The adoption of this update did not have an impact on our consolidated results of operations and financial condition.
In July 2012, the FASB issued amended standards to simplify how entities test indefinite-lived intangible assets for impairment which improve consistency in impairment testing requirements among long-lived asset
78
Table of Contents
categories. These amended standards permit an assessment of qualitative factors to determine whether it is more likely than not that the fair value of an indefinite-lived intangible asset is less than its carrying value. For assets in which this assessment concludes it is more likely than not that the fair value is more than its carrying value, these amended standards eliminate the requirement to perform quantitative impairment testing as outlined in the previously issued standards. These amended standards were effective for us beginning in the fourth quarter of 2012.
Internal Control Over Financial Reporting
Prior to completion of this offering, we have been a private company with limited accounting personnel to adequately execute our accounting processes and other supervisory resources with which to address our internal control over financial reporting. This lack of adequate accounting resources contributed to audit adjustments to our consolidated financial statements in the past.
In connection with the audit of our consolidated financial statements as of and for the year ended December 31, 2012, we identified a material weakness related to maintaining a sufficient number of qualified personnel with an appropriate level of experience to review certain cash reconciliations and the deferred commissions reconciliation, which are more complex in nature, to ensure they were completed accurately and timely. A material weakness is a control deficiency, or a combination of control deficiencies, in internal control over financial reporting, such that there is a reasonable possibility that a material misstatement of our annual or interim financial statements will not be prevented or detected on a timely basis. This material weakness contributed to audit adjustments in cash, accounts payable, deferred commissions and sales and marketing expense.
We are in the process of implementing measures designed to improve our internal control over financial reporting to remediate this material weakness. We have plans to add more accounting personnel with appropriate qualifications. We believe that these additional resources would enable us to broaden the scope and quality of our internal review of underlying information related to financial reporting and to further enhance our financial review of reconciliations, including the accounting processes for cash and deferred commissions.
We cannot assure you that any measures we may take in the future, will be sufficient to remediate the material weakness in our internal control over financial reporting or to avoid potential future material weaknesses.
79
Table of Contents
Overview
Good Technology’s mission is to enable enterprises and governments worldwide to embrace the full power of mobility by ensuring secure access to applications and data from any device, anywhere, anytime. We empower businesses to create and manage secure interactions across a heterogeneous mix of data and applications, whether deployed in the cloud or on premise. This allows organizations to adapt existing business processes and create new workflows to uniquely exploit the mobile environment in a secure and trusted manner. We alone provide a comprehensive and integrated solution consisting of a secure mobile computing platform, a suite of collaboration applications, and a third-party application and partner ecosystem that enables enterprises to increase productivity and transform business processes.
The proliferation of mobile devices and applications is generating some of the greatest opportunities and challenges in software today. Mobile computing has reshaped the way people connect, communicate and create. The number of connected mobile devices will exceed the world’s population this year, according to Cisco’s Visual Networking Index. IDC estimates that the number of mobile applications downloaded will exceed 100 billion this year. Today’s users demand to be as productive on their mobile devices as they are on their desktop and laptop computers. They also demand a streamlined and intuitive user experience and want to perform business and personal tasks on the same device without sharing personal information with their employers. Users will find a way to accomplish their work on their device by leveraging the growing application universe, whether or not these applications and related services satisfy the security and compliance protocols of their employers’ IT departments. The challenge for both line of business leaders and IT is balancing the need for enterprise-class security and compliance while offering users the flexibility and personalization that they already enjoy on their personal mobile devices. This challenge is complicated further by the multitude of mobility strategies being utilized by businesses, including those enabling corporate-owned, employee-owned (also known as “Bring Your Own Device” or BYOD) and fixed-function devices such as retail kiosks. Line of business leaders are also putting pressure on IT as they demand optimized mobile applications for business processes and workflows to improve productivity and transform the way they do business. As a result of these pressures, IT is forced to assemble a set of independent solutions in silos that can result in higher costs and decrease system integrity. A successful solution must provide enterprise-class security and compliance, a rich user experience, centralized management with high scalability and availability, and rapid application development and deployment across all mobility strategies.
We address this challenge by providing a unique, platform-based solution that can accommodate the heterogeneous landscape and behavior of mobile users in a scalable, manageable and flexible manner, all while enabling government-grade security. We believe the industry needs a secure mobile computing platform that solves for a mix of legacy and mobile optimized applications, cloud and on-premise deployment models, a variety of devices and operating systems, and multiple mobility strategies across employees, partners and customers.
The Good secure mobile computing solution enables increased productivity and can transform business processes by delivering a secure mobile computing platform, a suite of collaboration applications, and a third-party application and partner ecosystem. Our secure mobile computing platform, Good Dynamics, provides both security and application services to enable ISVs, SIs, and internal enterprise development organizations to build applications that include our security functionality and simplify application development across devices and operating systems. Our platform allows developers to speed the delivery of their application development projects to include government-grade levels of security and compliance without having to design their own security architecture. Developers can reduce time to deployment and are able to stay focused on designing rich, complex and collaborative workflows on mobile devices. The Good Collaboration Suite enables increased employee productivity without compromising security. The suite includes Good for Enterprise, which provides secure mobile email, calendar, contacts, attachments, notes and browsing, along with Good Share and Good Connect for file sharing and instant messaging, respectively. Our partner ecosystem consists of a broad set of
80
Table of Contents
third-party ISVs and SIs that incorporate our security architecture and management framework into the run-time environment of many existing, popular applications. This capability allows businesses to accelerate their ability to address many vertical-specific and horizontal use cases that are common across all industries without additional development. These applications can be managed and published in “app stores” to streamline their distribution and policy management. Good-certified applications are available in the Apple App Store and Google Play, and in addition we enable IT to create their own private, branded app stores.
Together, our secure mobile computing platform, suite of collaboration applications and third-party application and partner ecosystem allow businesses to develop, secure, deploy and manage a family of rich, interoperable and high-value mobile business applications and services to enable employees, customers and partners to collaborate and be productive anytime, anywhere. We believe this leads to improvements in productivity, efficiency, responsiveness to customers and partners, significant cost savings and the development of new applications that can enhance an organization’s competitive advantage and transform the way it does business.
We were incorporated in 1996 and have been an innovator in providing secure mobile computing solutions, maintaining a singular focus on developing world-class technology and solving our customers’ critical mobility challenges. As of March 31, 2013, our secure mobile computing platform has been successfully deployed in complex environments with tens of thousands of employees. We have over 5,000 customers with commercial deployments on more than 1.2 million active devices in more than 130 countries. Our customers include 49 of the Fortune 100, and our ecosystem includes leading ISVs, SIs, device makers, and mobile operating system, or OS, platform providers. We define a customer as a company, government entity or a distinct buying unit within a company or government entity, any of which has purchased products or services from us within the prior 36 months. We exclude channel partners and resellers, unless purchasing for their own use, and customers who have purchased our legacy consumer products. We provide our platform as a private cloud solution that integrates with application services from the public cloud. We sell our secure mobile computing solution and related services primarily to large organizations through a combination of our direct sales force and our channel partnerships. Gartner, Inc., or Gartner, has recognized us as a market leader in the “Magic Quadrant for Mobile Device Management,” published in May 2012.
In 2010, 2011 and 2012, our enterprise software and services billings, a non-GAAP financial measure, were $37.9 million, $101.7 million and $155.4 million, respectively, representing year-over-year growth of 169% for 2011 and 53% for 2012. In 2010, 2011 and 2012, we generated software and services revenue of $40.0 million, $58.1 million and $93.5 million, respectively, representing year-over-year growth of 45% for 2011 and 61% for 2012. Our free cash flow, a non-GAAP financial measure, was $(25.2) million, $75,000 and $(19.5) million in 2010, 2011 and 2012, respectively. Our net losses were $39.9 million, $41.2 million and $90.5 million in 2010, 2011 and 2012, respectively. See “Management’s Discussion and Analysis of Financial Condition and Results of Operations—Key Financial Metrics” for a description of how these non-GAAP financial measures are calculated, a description of the limitations of these non-GAAP financial measures and a reconciliation of the non-GAAP financial measures to their most directly comparable financial measure calculated in accordance with GAAP.
Industry Background
Proliferation of Mobile Devices and Applications is One of the Most Significant Technological Shifts Since the Internet
Rapid proliferation of mobile devices and applications is transforming how we live. Pervasive wireless infrastructure and the proliferation of smartphones and tablets are enabling real-time access to eCommerce, payments, communications and information services across carriers, devices and operating systems, changing the way people communicate, shop, access information and conduct business. This shift has been fueled by the rapid growth of, and innovation in, mobile applications. We believe this growth in applications is driving mobile users to expect that there should be “an app for that,” not just in their personal lives, but also in their professional lives.
81
Table of Contents
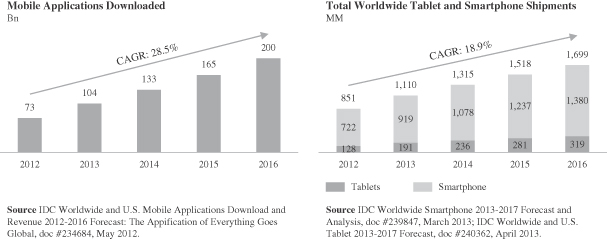
Enterprises Are Adopting Diverse Strategies to Benefit from Mobility
Mobile computing devices enable “real-time” business activity and collaboration, increasing productivity and value for the enterprise. Increasingly, employees work and collaborate on mobile phones and tablets in addition to, or instead of, their desktop and laptop computers. By broadly embracing mobility, enterprises can establish new communication channels with and among employees, business partners and customers, and can introduce innovative services and products that create opportunities for new revenue streams and enhance organizational agility and responsiveness. Organizations rely on mobile devices to connect employees and partners, enabling them to securely access Intranets and web-enabled enterprise applications, share documents, utilize corporate instant messaging services, and access a broader range of collaboration tools.
Enterprises are generally adopting multiple mobility strategies:
Deploying Corporate-Liable Mobile Devices to Employees. Many organizations are proactively deploying smartphones and tablets. Historically, due to high device costs and data plan rates, enterprises provisioned mobile productivity tools to a limited number of employees with a proven business need, such as executives and sales people. As the capabilities and diversity of devices and applications grow, the spectrum of devices supported has expanded. A homogenous set of Blackberries once deployed to a limited number of individuals is being replaced by a wide variety of mobile devices from multiple device manufacturers, deployed to a larger number of users across the organization.
Enabling Employee-Liable Mobile Devices. Increasingly, employees are using their personally-owned smartphones, tablets and laptops for work. Organizations, recognizing the opportunities of mobile computing, are rapidly adopting BYOD programs. According to IDC, in 2016, over 300 million or 66% of business smartphones worldwide will be employee-liable. Among respondents in our 2012 Good Technology State of BYOD report, 72% of our largest customers were already formally supporting BYOD programs. We believe that employees’ motivation and productivity are increased when they are able to use the devices and applications of their choice in the workplace. In addition, many enterprises are adopting BYOD programs to reduce IT personnel, software license, mobile voice and data and device costs.
Proliferating Company-Owned Fixed-Function Devices among Employees and End Customers. Some workflows have traditionally been performed on fixed-function devices, such as custom-designed kiosks. Enterprises are realizing cost efficiencies and enhanced user experience by utilizing tablets and smartphones to deliver these workflows in a familiar form factor and with user-friendly, intuitive navigation. For example, hospitals are deploying tablets to enable doctors, nurses, and technicians to remain connected to vital information as they move throughout a hospital. The data and applications on these devices must be secured in order for the hospital to comply with the Health Insurance Portability and Accountability Act of 1996, or HIPAA, and privacy
82
Table of Contents
regulations. Retail organizations are employing tablets as retail kiosks to provide customers with mobile points-of-sale as well as targeted shopping experiences integrating audio, video, and social networking. These devices and their applications must be secured to ensure protection of consumer and business information.
Transforming Businesses by Creating Mobile-First Enabled Business Processes and Workflows. Enterprises are discovering that mobility allows them to optimize processes and workflows through in-house application development. These applications are often extended to partners and customers, enabling productivity gains and cost reductions. For example, through mobile applications, insurance companies can interact in real-time with a distributed group of independent agents, collaborating on customer data entry and quotes. As another example, aircraft engineers can easily access voluminous blueprints on mobile devices within the small confines of airplane compartments. Using “mobile-first” or “mobile-only” design philosophies, businesses can design new applications specifically for mobile devices, creating more efficient business processes that deliver benefits throughout the enterprise, regardless of the various types of devices in use.
While the employee-liable, or BYOD, trend has garnered significant media attention, many of our customers are deploying a combination of these strategies in various stages of maturity. We believe it is critical for enterprises to be able to easily and rapidly develop, deploy, manage and secure mobile applications across a range of mobility strategies.
Our Opportunity
IDC recently defined the mobile enterprise software market as the convergence of several emerging markets that in aggregate are estimated to be approximately $3.3 billion in 2012, growing to approximately $7.6 billion by 2016, representing a compounded annual growth rate of 22.6%. These markets include the mobile security, mobile enterprise management software and mobile application platform markets.
We believe that upgrades in mobile infrastructure, increases in computing power and subsequent decreases in technology costs, combined with the proliferation of applications, are unlocking new opportunities for enterprises to deploy secure mobile computing to a larger portion of the workforce. Additionally, we believe the extension of mobility to formerly stationary or manual processes will further increase the market for secure mobile computing solutions.
As enterprises increasingly adopt a mobile-first philosophy, we believe that the market for secure mobile computing solutions will take an increasing share of IT spend from commercial, non-mobile, software markets. These markets include the security, application development, collaboration, quality and lifecycle tools and system and network management markets, which totaled $59.2 billion in 2012, according to IDC. An August 2012 IDG research study indicated that 69% of IT executives believe secure mobile computing solutions are a critical or high priority during the next 12 months, ahead of cloud services at 53% and big data solutions at 48%.
The Rise of Mobility Presents Several Key Challenges for Major Constituents
Enterprises are faced with a number of critical challenges as they enable broad mobility for their workforces and beyond to their external partners and customers. These challenges originate from the needs of three major constituents within the organization: the user, IT and the line of business leader.
Today’s workers demand to be as productive on their mobile devices as they are on their desktop and laptop computers. Users expect to be able to perform any task from any connected device, at any time, with a streamlined and intuitive user experience. They also want to be able to perform business and personal tasks on the same devices, without sacrificing their privacy or user experience. In the absence of an IT-supported solution, users will circumvent employer security requirements altogether in order to be productive on their mobile devices, for example, by forwarding documents to personal e-mail accounts, file-sharing services or other unapproved cloud-based applications.
83
Table of Contents
Recent technology innovations in consumer mobile devices and applications are spreading into businesses, driving users to expect the same capability from those devices and applications in the workplace. This consumerization trend puts enormous pressure on IT to keep pace with user demand, while maintaining the highest levels of security and compliance for their business.
Concurrently, line of business leaders are also putting pressure on IT, as they insist on new mobile applications for business processes and workflows to improve productivity and transform the way they do business.
In order to satisfy the needs of all three of these constituents, the user, IT and the line of business leader, successful mobile deployments must address a number of key challenges, including:
Inherent Security, Compliance and Data Protection Risks. Smartphones and tablets present particular challenges to IT administrators responsible for safeguarding enterprise infrastructure, applications and data. Modern mobile operating systems are designed to support the simplified, and in many cases automatic, sharing and replication of data across devices. They can also be “rooted” or “jailbroken,” which compromises their built-in, operating system-level security measures. This exposure threatens the security of sensitive corporate data. Lost or stolen devices can also result in material security breaches if the data on the devices cannot be remotely secured by IT administrators. In addition, criminals and nation states are increasingly targeting mobile devices and leveraging personal applications as a conduit for malware designed to steal corporate data. Many enterprises need to demonstrate compliance with industry security regulations on corporate and employee-liable devices in order for their communications to be auditable and compliant with company policies and industry security regulations.
Delivering Uncompromised User Experience and Privacy. Today’s employees expect to have access to dynamic, collaborative and efficient business applications on their existing personal mobile devices. IT must satisfy the need for security and compliance without sacrificing the employee’s need for privacy or compromising the user experience.
Maintaining Service Quality While Managing a Large Number of Devices and Applications. To maintain service quality as they scale deployments, enterprises need an integrated solution that manages both mobile devices and mobile applications. Solutions should include the capability to manage, secure, and distribute applications across distinct user populations with varying policy requirements. Solutions must also enable provisioning and management of device capabilities such as configuration settings, inventory/asset management, policy/compliance management, authentication and certificate management, real-time device monitoring and device-level reporting and analytics.
Addressing Increased Diversity in Mobile Deployment Strategies. Mobile computing environments are increasingly complex and rapidly changing, with a diverse mix of employee-liable and corporate-liable smartphones and tablets, as well as fixed-function type devices, with multiple mobile operating systems, and an ever-increasing number of applications. Enterprises need a flexible platform to enable multiple deployment strategies and an integrated, end-to-end secure mobile computing solution that allows them to develop, deploy, manage and secure a heterogeneous population of mobile devices and applications.
Rapidly Developing and Deploying Secure Mobile Applications. Deploying appropriate security and compliance for a large number of diverse enterprise mobile applications built for multiple lines of business across multiple mobility strategies and on multiple development frameworks requires a considerable amount of enterprise time, effort and resources. In order for enterprises to take advantage of the benefits and opportunities offered by mobile computing, internal enterprise development organizations need to be able to create applications using any mobile development framework and rapidly deploy them with the same level of trusted security.
84
Table of Contents
Key Benefits of Our Solution
We provide the leading secure mobile computing solution for enterprises and governments worldwide. Our solution consists of a secure mobile computing platform, a suite of collaboration applications and a third-party application and partner ecosystem.
Key benefits of our solution include:
Government-Grade Security and Compliance. Our security approach addresses the key aspects of secure mobile computing, including the ability to deploy security on devices or in applications using enterprise data. Our security capabilities include strong two factor authentication, access control, single sign-on, identity federation, and on-demand policy deployment and enforcement. Our flagship product, Good for Enterprise, uses Federal Information Processing Standard, or FIPS, 140-2 and FIPS 201 certified cryptographic modules and is architected to enable our customers to comply with the most stringent security and data protection standards and regulations. Our government customers include military and civilian agencies in the United States, the United Kingdom, France, Germany, Netherlands, Sweden, Canada and Australia.
Rich User Experience and Privacy on a Single Device.Our solution provides a cohesive, integrated user experience allowing secure exchange of information through seamless multi-application workflows, without compromising employees’ privacy and experience. We accomplish this by separating enterprise data from personal data, enabling IT to deploy security policies on business applications and data rather than on the device. This approach enables IT to enforce their policies for passwords, timeouts, and other security controls without impacting the employee’s access to personal applications, privacy, device choice and overall experience.
Flexible, Comprehensive End-to-End Solution. We provide businesses with the capability to deploy and manage mobile applications across all of their mobility strategies, meeting the needs of IT, users and line of business leaders. Our solution provides a secure mobile computing platform that solves for a mix of legacy and mobile optimized applications, cloud and on-premise deployment models, a variety of devices and operating systems, and multiple mobility strategies across employees, partners and customers.
Centralized Management with High Scalability and Availability. Our secure mobile computing solution provides mobile device management and mobile application management capabilities that allow IT to manage large-scale, multi-device usage model deployments within corporate networks. Our solution can scale to hundreds of thousands of devices running numerous business applications on corporate-liable, employee-liable and fixed-function devices.
Rapid Application Development and Deployment. Our solution allows enterprises to securely deploy applications to their users, business partners and customers. Our Good Dynamics platform provides ISVs and internal enterprise development organizations with the necessary security and application services to enable them to rapidly develop applications with robust business functionality that meet the highest standards of security across a variety of devices and operating systems. These services simplify secure mobile application development and enable developers to design applications to enable rich, complex, and collaborative workflows on mobile devices across varied mobility strategies. Additionally, line of business leaders are able to work with internal enterprise development organizations to deliver new applications that enable new business processes and workflows, creating strategic business value both within the enterprise and beyond to external partners and customers. Our platform can be used by internal development teams to create applications specific to their enterprise, or can be used by ISVs to build applications that complement our productivity suite and provide functionality for new workflows.
Our Growth Strategy
Our strategy is to continue to be the leading provider of secure mobile computing solutions for enterprises and governments worldwide. Key elements of our strategy include:
Grow the Depth and Breadth of Deployments within Our Existing Customer Base. We intend to increase the penetration of deployments in our existing customer base by cross-selling our products, delivering new
85
Table of Contents
applications through our Good Dynamics platform and bundling our applications, platform and services into new value-added offerings. We will also invest in our ecosystem of ISVs and SIs to build more applications on Good Dynamics, increasing the value of our platform to our existing customers. We believe that enterprises are in the early stages of embracing secure mobile computing solutions within their IT infrastructures. We believe that at many of our customers, fewer than 10% of total employees have access to our solution. As our penetration increases among users within our existing customer base, we believe more lines of business will want to use our Good Dynamics platform to deploy secure mobile applications to enable new business processes and workflows. Many of these business processes and workflows will extend not only to employees, but also to partners and customers, further expanding our growth opportunities.
Extend Our Leadership through Continued Innovation. We will continue to invest in our applications, platform and services to increase functionality and further simplify secure mobile application development, deployment and management. We have been singularly focused on mobility for almost two decades and have a strong culture and track record of innovation, as evidenced by our market leadership and strong patent portfolio. We intend to expand the breadth and depth of our Good Dynamics platform, continue to build collaborative applications that are broadly demanded by our customers, increase our suite of management capabilities and collaborate with our partners to develop a deeper portfolio of integrated capabilities. We intend to accomplish this through organic development, strategic technology partnerships and selective acquisitions.
Continue to Expand Our Sales Organization to Acquire New Customers. We will deploy additional sales resources and increase our channel partner and value-added reseller footprint to broaden our customer base across geographies and industries. For example, we have increased the number of sales representatives from 127 as of December 31, 2011 to over 230 as of March 31, 2013 and have grown our global value-added reseller network to over 110 as of March 31, 2013. We will continue to invest in our direct sales efforts and SI relationships to address large Global 2000 enterprise and government customers, while expanding our value-added-reseller network to address mobility requirements in new geographies and in middle-market organizations.
Expand the Good Dynamics Platform Ecosystem. We will continue to expand our partner ecosystem by developing additional relationships with ISVs, SIs and internal enterprise development organizations. For example, we provide all of our ISV partners and SIs with access to the Good Dynamics SDK, developer licenses, and membership in the Good Dynamics Network, an online developer community providing technical resources, support and advice. By supporting these strategic relationships, we expect that ISVs and SIs will invest in developing and deploying new applications on our platform. We believe our Good Dynamics platform ecosystem will deliver applications that extend our software platform’s functionality to new workflows and use cases. We also believe that as more developers join the ecosystem, we will attract more customers, further strengthening our ecosystem, making it more attractive to new developers. Ultimately, we believe this will provide more value to our Good Dynamics customers, driving increased sales.
Deliver World-Class Customer Service. We have a demanding and discerning global customer base including 49 of the Fortune 100. To deliver the world-class customer service that our customers expect, we are investing in new services to help our customers configure and deploy our solution rapidly and to help our partners build and deploy applications on the Good Dynamics platform. We believe our customer satisfaction initiatives will promote additional loyalty among our customers, furthering our ability to sell additional products and services to our existing customers and enabling us to continue to build strong references that can help us drive new customer sales.
Amplify Global Awareness of Our Brand. As a leader in secure mobile computing solutions, we will continue to market our platform to inform potential customers of the advantages of secure mobile computing solutions and how our solution can address their problems. We will continue to invest in and amplify our brand presence with strategic marketing campaigns and multi-channel marketing activities that span major geographies. These campaigns will be designed to increase brand awareness, engage the customer and prospect base, energize our ecosystem and drive sales.
86
Table of Contents
Competitive Strengths
We pioneered the category of secure mobile computing solutions by being the first to combine applications with end-to-end security, device management and mobile application development in a single solution. Since our founding in 1996, we have been singularly focused on enabling secure mobile solutions. Today, our applications support more than 1.2 million active devices being used in more than 130 countries among over 5,000 customers.
We believe we have a number of unique competitive advantages that position us for continued leadership and growth within the market. Our competitive strengths include:
Strong Brand in Secure Mobile Computing. We believe the Good Technology brand name is widely recognized as representing the highest standards of security in mobile communication applications. We have built a solid foundation for continued long-term brand appreciation as our name is reinforced by strong references from our existing customers and the depth of our ecosystem relationships.
Comprehensive End-to-End Secure Mobility Architecture. We provide a comprehensive, integrated solution that protects and manages applications, data and devices while enabling business productivity, collaboration and workflow transformation. We do this by uniquely combining application containerization, transport security, internal security and perimeter security. Our architecture is able to meet the needs of today’s complex IT environments and evolving threat models.
Proven and Trusted Security Approach. The strength of our secure mobile computing solution has been validated by the many successful deployments we have with the most discerning enterprises and governments around the world that impose the strictest security and compliance requirements. Our solution uses FIPS 140-2 and FIPS 201 certified cryptographic modules and is architected to enable our customers to comply with the most stringent security and data protection standards and regulations, such as the Homeland Security Presidential Directive-1, or HSPD-1, Federal Financial Institutions Council, or FFIEC, HIPAA, and Health Information Technology Evaluation Collaborative, or HITEC.
Large and Diverse Customer Base. We have developed a large customer base across a diverse array of industries and geographies, including 49 of the Fortune 100, eight of the ten largest Fortune 500 commercial banks, six of the ten largest Fortune 500 insurance companies, five of the ten largest Fortune 500 healthcare providers, and nine of the ten largest Fortune 500 aerospace and defense contractors. We work closely with our customers to ensure that users can intuitively leverage our solution and that IT can efficiently manage and secure the mobile extension of their network. Our close relationship with our customers allows us to develop insights and knowledge into use cases, enabling us to continuously improve our products to meet our customers’ needs. Our customer footprint provides a competitive advantage through strong customer references and validation.
Rich Customer and Partner Ecosystem. The strength of our ecosystem is our broad network of customers, ISVs, SIs and our customers’ internal development organizations. As of March 31, 2013, we had over 4,000 developers registered on the Good Dynamics Network. The strategic dialogues and relationships we have with these partners allow us to better anticipate and deliver solutions for future mobile computing problems, further strengthening our growing ecosystem. As our ecosystem grows and offers more robust applications with richer functionality, we believe we are creating a virtuous cycle that will attract more customers and encourage purchases of additional solutions by our current customers.
Sticky Secure Mobile Computing Solution. Our software serves as a critical element of our customers’ security and mobility strategy. As a result, we believe our solution creates pull-through demand as our software is deployed to an increasing number of users within an enterprise and as IT deploys more custom applications on our platform. This two-pronged expansion deeply embeds our solution in the enterprise and increases the disruption associated with switching to a different provider. This “stickiness” is enhanced by the increasing number of applications built on the Good Dynamics platform.
87
Table of Contents
Significant Intellectual Property and Technology Portfolio. We have been innovating secure mobile computing solutions since our inception and have built a broad set of technologies spanning areas such as application, data and device management, authentication and security, messaging, platform services and data synchronization. As of March 31, 2013, we had 56 issued U.S. patents, 117 issued non-U.S. patents and 93 patent applications for examination globally. We are actively involved in the setting of standards by working with governments, chip vendors and others. We have been successful at defending our intellectual property rights in the past through legal action and private negotiations. We have licensed rights to our intellectual property to Microsoft, Blackberry, Motorola, Nokia and others. We continue to build on our strong foundation of intellectual property assets and have filed ten new U.S. patent applications and received six issued U.S. patents, from the beginning of 2012 to March 31, 2013.
Our Solution
We provide the leading secure mobile computing solution for enterprises and governments worldwide. Our solution consists of our secure mobile computing platform, collaboration suite and third-party application and partner ecosystem. Together, our secure mobile computing platform, collaboration suite and third-party application and partner ecosystem allow enterprises to develop, secure, deploy and manage a family of rich, interoperable and high-value mobile business applications and services to enable employees, customers and partners to collaborate and be productive anytime, anywhere.
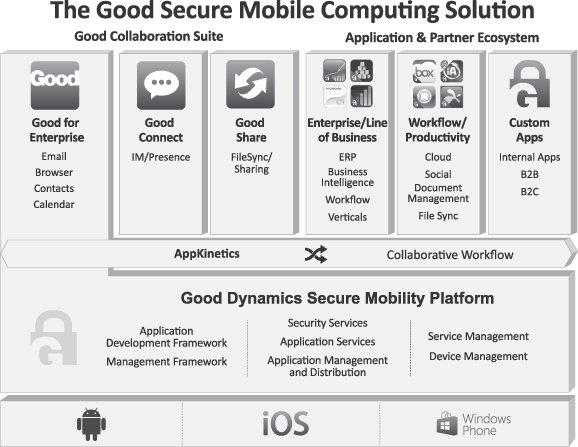
88
Table of Contents
A Secure Mobile Computing Platform
Good Dynamics provides both security services and application services to enable ISVs, SIs and internal enterprise development organizations to build applications that include our security functionality and simplify application development across devices and operating systems. The Good Dynamics secure mobile computing platform includes security and application services, critical identity and access management capabilities, device and application management, and the ability for IT to create a private, custom-branded application store.
| • | Application and Security Services. Our platform allows developers to speed their application development projects to include industry-leading levels of protection and compliance without having to each design their own security architecture. Developers can reduce time to deployment and stay focused solely on designing rich, complex and collaborative workflows on mobile devices. Security services include encryption, authentication, policy management, compliance, network access and access control. Application services include application interoperability, application “services” framework, secure data exchange, push and storage. |
Our platform extends critical identity and access management capabilities, such as strong authentication, single sign-on and identity federation, to our Good for Enterprise application. Leveraging our platform, organizations such as governments and highly regulated enterprises in industries such as healthcare and financial services can deploy mobile computing solutions while complying with stringent security and regulatory requirements.
| • | Application Management and Distribution. Our platform includes the ability to distribute and manage applications and content using AppCentral. AppCentral enables IT administrators to create their own “app stores” to streamline the distribution and policy management of their internal catalog of mobile applications or content. Applications could include a mix of public applications from application stores such as the Apple App Store or Google Play, or privately published applications that are specific to the enterprise. AppCentral integrates with Active Directory or directories that support the Lightweight Directory Access Protocol, or LDAP, to make it easy for administrators to manage users, groups, and their associated policies. Our platform also supports the ability to provision and manage external users and import user data in bulk in support of business-to-business deployment models. AppCentral delivers dashboards and supporting reporting and analytics to enable administrators and line of business stakeholders to monitor and measure the return on investment of individual applications and how they are being used by individual users or groups of users. |
| • | Service Management. Our platform integrates with third-party service management platforms to enable IT to manage large-scale deployments of mobile applications and devices by providing IT with the ability to continuously monitor mobile application transactions, network availability and performance, and support backend server infrastructure. This allows IT to better support mission-critical applications, improve overall service quality levels and reduce end user support costs by proactively managing incidents that can adversely impact end-to-end service quality. |
| • | Device Management. We provide primary mobile device management capabilities to allow IT to configure, update and extract data from devices under management. We offer device management as a standalone offering or in conjunction with other Good solutions. This allows our customers to flexibly support multiple deployment strategies and use cases that span company-liable, employee-liable, fixed-function devices. |
A Suite of Collaboration Applications
Our collaboration suite consists of three mobile productivity applications, Good for Enterprise, Good Connect and Good Share.
| • | Good for Enterprise. Good for Enterprise provides secure enterprise-class email, calendar, contacts, attachments, notes and web browsing. Good for Enterprise has an intuitive user interface that enables |
89
Table of Contents
users to be up and running quickly, while allowing them to personalize the way they view, prioritize and find information in the corporate inbox. |
We provide a secure browser from which users can access the corporate Intranet, management dashboards, IT monitoring portals, wikis and document repositories that reside behind the corporate firewall from their mobile devices. The browser is intuitive and operates like any native browser but is built on the Good security infrastructure, which protects against firewall holes leading into the enterprise. Good for Enterprise works with existing customer investments in Microsoft and IBM software infrastructure.
| • | Good Connect. Good Connect provides robust instant messaging and presence services that boost communication and collaboration while protecting corporate data and respecting employee privacy. Good Connect extends corporate instant messaging platforms to mobile devices, including full access to multiple chats, conversation history, corporate directory lookup and colleagues’ real-time presence and availability from an easy-to-use interface. |
| • | Good Share. Good Share enables workers to access, sync and share corporate documents quickly without the need for a VPN, firewall re-configuration or additional file stores. Using Good Share, employees have access to the files they need, and IT has the assurance that critical data is fully secured, protected and compliant with regulatory requirements. |
A Broad Third-Party Application Ecosystem
We have a broad third-party ecosystem to provide off-the-shelf applications to address many different business needs. We continue to pursue new ISV and SI partnerships across vertical-specific and horizontal use cases that are common across all industries. All applications are built on the Good Dynamics mobile application security platform. Customers can browse the Apple App Store, Google Play or Good Dynamics Marketplace to procure applications that meet their mobile business requirements.
| • | Horizontal Productivity Applications. Good-enabled productivity applications include cloud storage, social business, business intelligence, e-printing, document editing, document management and file sync applications to extend collaborative workflows. These applications can be used with Good for Enterprise or other collaborative applications, such as Microsoft SharePoint to improve productivity across almost any industry. Examples of companies that have enabled their applications with Good Dynamics include Box, Colligo (a provider of mobile access to Microsoft SharePoint), iSec7 (a provider of mobile access to SAP), Microstrategy, NewsGator, Picsel and Roambi. |
| • | Vertical-Specific Applications. Companies with industry-specific applications designed for their business processes also are using Good Dynamics to secure their workflow. Financial services and healthcare organizations are leaders in recognizing the value of securing the interactions across applications, devices and data. For example, Pitchboard is a new mobile solution from Thomson Reuters. Pitchboard increases workflow efficiency among bankers, while maintaining confidentiality of highly sensitive material. |
| • | Custom Business-Specific Applications. Many businesses create applications specific to their business. Internal developers can use the Good Dynamics platform to secure these applications. They can be offered to employees through the public Apple App Store or Google Play, or offered through the business’ private application store via AppCentral. |
90
Table of Contents
Our Architecture
Our technology architecture is based on our software and supporting cloud-based infrastructure. Our software is deployed in three distinct computing environments: on servers behind the enterprise firewall or in managed service environments, in Good Secure Cloud and as secure mobile application software on devices.
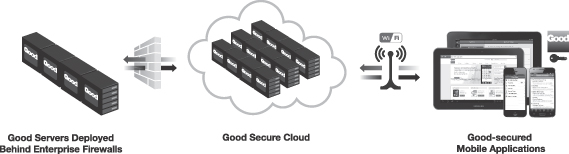
We provide a number of distinct functions in each environment:
| • | Good Servers Deployed at the Enterprise. Servers deployed in the enterprise provide control, application interface and secure transport functions. Management servers provide interfaces for management and control, monitoring and analysis, tools for policy and compliance management, network and application access control and the mapping of mobile device identity into the enterprise identity model. Application interface servers bridge between mobile service APIs and servers within the enterprise that supply information to the mobile application. Secure transport servers proxy traffic transparently between mobile devices and back-end applications, deliver push data services and encrypt and secure data transportation between mobile devices and the enterprise servers. |
| • | Good Secure Cloud. Good Secure Cloud provides provisioning and enrollment services, entitlement and reporting, network threat detection, the secure establishment of connections between registered mobile applications and their enterprise hosts and the relaying of encrypted data between mobile devices and enterprise services when both parties are behind firewalls. Our servers also offer both user-facing and API level access to our AppCentral and Good Dynamics Marketplace application distribution capabilities. Good’s Secure Cloud services run on hardware owned and operated by us, located in a redundant pair of leased secure facilities each served by multiple Internet backbone providers in order to deliver the highest level of service availability. |
| • | Mobile Application Software. Mobile applications secured by us cryptographically authenticate themselves first to our cloud services and then their host enterprise before forming an end-to-end encrypted connection to the enterprise servers. Our technology also provides at-rest encryption for data stored on the device, the enforcement of data movement policies and the secure movement of encrypted data from one Good-protected application to another. Each Good-protected application also includes our unique threat detection technology to identify if the mobile device has been “rooted” or “jailbroken.” Our technology also exposes application level services, push services, policy and compliance management and monitoring and analytics capabilities. |
Our Technology
Our technology provides the infrastructure and many of the services that are essential to the development, deployment and management of mission-critical mobile applications. These services are delivered as a series of frameworks offering capabilities in three key areas: security, developer support and management capabilities.
91
Table of Contents
Security Framework
At the core of our solution is a robust security model that protects sensitive data and enables compliance by providing security at every point in the end-to-end flow of data between the enterprise’s applications and infrastructure and the end user’s mobile device.
Application Containerization. Each application protected by our technology keeps its enterprise data encrypted whenever writing that data to the device’s storage. This encryption uses a layered key management architecture so that the keys used to encrypt and authenticate data at rest and data in transit, and to authenticate the user to the servers, are in turn encrypted. In most deployments the master key is derived from the user’s password and random data stored in the mobile device’s own key storage capability, but in some deployments smartcards or other multi-factor authentication technology may be used. Furthermore, each containerized application uses our proprietary policy engine to check user actions against policies delivered from the enterprise regarding where and how the enterprise data can move out of the application. When data is moved from one containerized application to another the transferred data is encrypted before sending and decrypted on receipt, using an ephemeral key agreed upon by the two applications, so that no data written to temporary files can be used by an attacker. Our unique “jailbreak” and “root” detection technology also checks for indications that the device security might have been compromised using a set of signatures that can be updated whenever the device is on line. The policy engine combines information from our threat detection technology with current configuration and version information from the device to determine if a device is in compliance with policy. It then determines what action should be taken if it is found to be out of compliance.
Transport Security. When each instance of each application is provisioned by an enterprise, the application and the secure transport proxy exchange unique cryptographic keys that will be used to encrypt and authenticate future communications. These keys are updated each time the application reconnects to the server, thereby preventing “cloned” devices from passing undetected. When a mobile application needs to connect to the enterprise, it first establishes a secure connection to the Good Secure Cloud, which in turn connects the client to the secure transport proxy at the enterprise. Inside this secure link, our architecture tunnels a protocol that provides end-to-end encryption and authentication so that no parties other than the legitimate end points can access customer data. This way, although the data flowing from mobile device to enterprise may pass through the Good Secure Cloud, no data can be exposed. We use the Advanced Encryption Standard, or AES, for encryption, implemented using libraries that have FIPS 140-2 certification.
Internal Security. Access control for administrative functions and user provisioning are role-based, with integration into the enterprise’s existing Identity and Access Management, or IAM, functionality, typically through Active Directory or LDAP. Existing IAM roles and groups can also be used to determine which security and compliance policies are set for each mobile user. User roles can also be used to determine which applications are made available to end users and which enterprise services are accessible by a user of a given application.
Perimeter Security. Our technology enables customers to extend mobile access to their internal, behind-the-firewall applications and infrastructure, without having to open “inbound” holes in their corporate firewalls. Each secure transport proxy makes only “outbound” connections to the Good Secure Cloud from within the enterprise firewall while applications on mobile devices also only make outbound connections to the Good Secure Cloud from behind the mobile carrier or wireless local area network, or WLAN, firewalls. The Good Secure Cloud authenticates these connections and then “splices” the connections together, multiplexing multiple client connections back onto the inbound connection from the proxy server. Within these spliced connections an end-to-end encrypted and authenticated channel is established between the mobile application and the proxy server. By authenticating both client and server before the connections are completed, the Good Secure Cloud protects the enterprise from rogue applications or unauthorized users.
Development Framework
We expose our security framework to mobile application developers through the Good Dynamics development framework. This is typically supplied to developers in the form of Software Development Kits, or
92
Table of Contents
SDKs, that include libraries of binary code to be linked with the application, header files to be used by the compiler and documentation for the developer. The Good Dynamics SDKs are currently available on the iOS and Android platforms. The technology is designed to be portable, and we may bring these capabilities to other platforms in the future based on market demand.
The Good Dynamics SDKs serve a number of functions that facilitate the rapid and easy development of secure, enterprise-ready applications. These functions include:
Secure User and Device Identification and Authentication. Good Dynamics provides APIs to allow the user to be challenged for credentials to authenticate to the application and these are used in conjunction with data securely stored by the application to authenticate the user and application to the Good Secure Cloud and the secure transport proxy at the enterprise. All authentication is performed using cryptographically secured protocols rather than sending credentials directly.
Data-in-flight Protection. Once the user and application have been authenticated to the secure transport proxy, the client can communicate with the secure transport proxy itself, the management server and enterprise application servers via encrypted and authenticated connections. The SDK code can receive policy updates and configuration information from the management server while the application code can securely communicate with the backend services it needs.
Data-at-rest Protection. Good Dynamics provides APIs for accessing file systems and databases that mirror the native APIs but provide transparent data encryption for all data stored in non-volatile memory on the device.
Mobile Threat Detection. Applications based on the Good Dynamics SDK automatically include mobile threat detection capabilities that are designed to determine when the user’s device has been compromised and alert both the user and IT so that the user’s device can be brought back into compliance with corporate policies. This includes the ability to detect when devices have been “jailbroken” or “rooted” and to determine when the device is running an OS version that has not been upgraded to the latest available security updates and patches. Actions that can be taken when devices are out of compliance include the secure removal of the encrypted keys necessary for the application to decrypt data at rest and to authenticate to the secure transport proxy, effectively stopping all access to local or remote data sources.
Secure Data Exchange and Interoperability. Good Dynamics-based applications can securely exchange data and interoperate with one another to enable integrated business process and workflows without exposing sensitive business data to other personal applications or services running on the user’s mobile device. This capability uses an Elliptic Curved Diffie-Hellman key exchange algorithm to allow the two applications to agree on a cryptographic key which is then used to encrypt any data moving between the pair of applications. By doing so we ensure that even when the mobile operating system writes the transferred data to flash memory, no trace is left that can result in sensitive information leaks.
Application Policy Enforcement. The Good Dynamics SDK dynamically fetches policies from the management server. These policies cover not only the storage and movement of data and the authentication and access control of the application as a whole, but also application-specific functions defined by the developer. Used in conjunction with the role based policy control at the management server that are tied to the enterprise’s IAM infrastructure, this allows different application capabilities to be exposed to different users based on their identity, user group or business role.
Analytics. Applications based on the Good Dynamics SDK incorporate built-in application analytics that allow enterprises to remotely monitor and report on business applications usage. This allows enterprises to better support large-scale, mission-critical application deployments, measure the return on investment, or ROI, of their application investments, and to optimize their applications to increase usage and value to end users.
Extensibility. Developers using the Good Dynamics SDK can define their own application policies and application services and then expose those policies and services in a secure, policy-controlled way to other Good
93
Table of Contents
Dynamics-based applications. This makes it easier for developers to expose new capabilities across multiple applications without having to build them into each individual application. For example, a Good Dynamics application might expose a secure printing service that can be used by other Good Dynamics applications without the need to modify every application.
Management Framework
Good’s solution includes a robust management framework that allows enterprises to manage mobile applications, data, devices and end-to-end mobile service quality over their entire life cycle. All our management systems are designed first to provide a set of APIs, typically in the form of Web Services, that are then also wrapped in user interfaces, typically HTML-based. This ensures that any action that can be performed manually can also be automated in a workflow or business system.
Functions that can be controlled by our management framework include:
Mobile Security and Compliance Management. Businesses can set policies regarding device settings, mobile threat detection tests, application container authentication settings, including password strength, and controls regarding the onward movement of data from applications. Actions can be specified when policy clauses are triggered and these may include locking or wiping of the applications, forced re-authentication and user or administrator notification. Policies can be set on a per-user or per-role basis.
Mobile Application Management. Businesses can deploy their own “app store,” control and manage the distribution of required or recommended applications and deploy updates to those applications in accordance with centrally managed policies. This includes the ability to define groups of users and/or devices and application policies for those groups and dynamically update groups and policies.
Mobile Service Management. Businesses can use APIs to share data with service management systems that allow businesses to monitor end-to-end mobile service quality and proactively identify issues in individual service elements that can impact end-to-end service availability or performance.
Mobile Device Management. Businesses can perform device management actions such as “wipe,” and “lock” devices, configure device settings, apply device passwords and other security and compliance policies, query device and network attributes, and provide reporting in support of corporate-liable device and asset management activities.
Customers
We provide products and services to a variety of customers worldwide, including some of the world’s largest banks, accounting and law firms, healthcare organizations, pharmaceutical manufacturers, retailers, insurers, technology and telecom companies, as well as national, state and local government agencies in the United States and a number of other countries. As of March 31, 2013, we had over 5,000 customers and end users in more than 130 countries. Our customers include 49 of the Fortune 100, 140 of the Fortune 500 companies and 423 of the Forbes Global 2000 companies. Our customers include eight of the ten largest Fortune 500 commercial banks, six of the ten largest Fortune 500 insurance companies, five of the ten largest Fortune 500 healthcare providers, and nine of the ten largest Fortune 500 aerospace and defense contractors. Some of our government customers include the U.S. Department of Defense, U.S. Transportation Security Administration and the U.S. Coast Guard. We define a customer as a company, government entity or a distinct buying unit within a company or government entity, any of which has purchased products or services from us within the prior 36 months. We exclude channel partners and resellers, unless purchasing for their own use, and customers who have purchased our legacy consumer products.
In 2012, 67% of our total revenues were generated from customers in North America and Latin America, 18% from customers in Europe, Middle East and Africa, or EMEA, and 15% from customers in Asia Pacific.
94
Table of Contents
Customer Case Studies
Deloitte
The Challenge: Deloitte’s IT team has seen increased demand from its workforce for a broader choice in mobile devices, such as iPhones, Android smartphones and tablets. Secure mobility is essential for Deloitte’s employees, as many of them spend more time at client locations than at Deloitte’s offices. As a result, Deloitte’s business depends on a mobile infrastructure to deliver against its business plan. In addition to supporting a mobile workforce, Deloitte places a premium on security as it must protect its own confidential documents and satisfy a client base that takes the security of sensitive mobile data very seriously. The potential loss of confidential client documents and data would be extremely embarrassing and harmful to Deloitte’s brand.
The Solution: Deloitte deployed Good for Enterprise to empower employees with “mobile freedom” and flexibility to use the devices and platforms of their choice. Deloitte is keen to continue the mobile journey and is now discussing with Good the deployment of Good Dynamics to develop and deploy line-of-business applications to its mobile workforce. The Good solution has also allowed Deloitte to keep the integrity of the employee’s device itself through the ability to wipe the corporate data while leaving the rest of the device intact.
The Benefits:
| • | Has improved employee morale and delivered a solid ROI; |
| • | Has allowed employees to make a choice about where and when they work to meet their needs and the needs of the clients; |
| • | Users can enjoy the full functionality of their devices knowing that Deloitte cannot touch any personal data outside of the Good app; |
| • | Deloitte’s IT department has benefitted through some reduced IT admin costs and general efficiencies; and |
| • | Deloitte has received significant external PR and recognition following the Good for Enterprise deployment. |
Mitsubishi Electric Cooling & Heating
The Challenge: Mitsubishi Electric relies on a vast ecosystem of distributors, contractors, engineers and architects to sell its systems. Mitsubishi was challenged to keep the ecosystem knowledgeable about and trained on selling, installing and servicing its latest systems. Prior to the implementation of our solution, product, technical and pricing information was often inaccurate as contractors were hauling around large physical product catalogs that contained outdated product and technical specifications. The confusion was compounded by multiple and overlapping communications mechanisms, from email blasts to mailed printed material. Mitsubishi was also incurring significant costs for the ongoing printing and distribution of the physical catalogues. Mitsubishi decided to pull all of these materials into the form of custom mobile applications. Mitsubishi’s initial attempt at user adoption failed as users had to go through a very cumbersome and manual installation process to get access to the custom applications that were not available through publicly accessible app stores.
The Solution: Mitsubishi Electric used our cloud-based solution to implement a custom-branded app store through which both custom and third-party applications and data could be easily distributed and managed. The solution provided Mitsubishi with granular control over access to its applications without having to take on the management of devices it did not own. This allowed them to accelerate user adoption of multiple custom applications, simplifying their employees’ and partners’ jobs. Mitsubishi’s recent application of this solution was an augmented reality selling tool for its contractors that enabled customers to select products and immediately visualize, on the contractor’s tablets, how those products would look, prior to physical installation.
95
Table of Contents
The Benefits:
| • | Increased customer satisfaction greatly by allowing customers to specify their product choice and immediately visualize the end product; |
| • | Increased projected revenue and decreased annual catalog printing and distribution costs; |
| • | Allowed contractors to stay productive by accessing the latest information about Mitsubishi’s systems, even where a network connection is not available or is of poor quality; |
| • | Doubled the number of installations by providing contractors direct access to the latest technical literature on-site and in one device; and |
| • | Supported release of 11 custom applications in 2013 through the custom app store, all immediately available for Mitsubishi Electric’s contractor network to use. |
Partner Ecosystem
We have developed a partner ecosystem of ISVs and SIs, who work with us to deliver horizontal and vertical business applications and enable our customers to transform business processes with mobile solutions.
Independent Software Vendors
We work with ISVs to extend and enhance our ecosystem of horizontal and vertical business applications. We provide ISVs with tools to build secure mobile applications on the Good Dynamics platform, including access to the SDK, a developer license and membership in the Good Dynamics Network. This allows our partners to combine their application development expertise with Good’s mobility and security framework. Our strategy is to work closely with vendors of leading business applications in order to create new value for our collective customers. These applications, including those from vendors such as Box, Colligo (a provider of mobile access to Microsoft SharePoint), iSec7 (a provider of mobile access to SAP), Microstrategy, NewsGator, Picsel and Roambi, are available in the Apple App Store, Google Play as well as Good Dynamics Marketplace.
Systems Integrators
We work with leading global and boutique SIs to enable our customers to transform their businesses with mobile technology. Our strategy is to enable a large portion of our projects to be initiated by SIs with additional support from us. To do this, we provide SIs with access to training programs and other resources to help them develop mobile-specific competencies based on the Good Dynamics platform and the overall Good solution. SIs participating in our programs learn how to build and deploy the latest generation of mobile applications and collaborate with us on customer engagements.
Device Manufacturer and Platform Relationships
Good has established relationships with leading device manufacturers and platform providers to make certain that our mobile security solutions maintain the highest level of usability and interoperability across devices and operating systems. Our relationships range from chip IP developers such as ARM and manufactures such as Qualcomm to mobile OS platform providers such as Microsoft, helping to add enterprise mobility use cases into the actual mobile device design, resulting in an enterprise-ready finished product. Specific examples include our relationship with Microsoft to bring our encrypted email application to Windows Phone devices. We also work with ARM’s Trustonic joint venture, utilizing a secure area within mobile devices separate from any built-in operating system, thus enabling more secure eCommerce on smartphones and tablets. We are also a member of Apple’s Mobile Device Management vendor program, which gives us access to Apple’s mobile device management specifications for iOS devices and access to the mobile device management gateway that it hosts. This allows us to manage Apple iOS devices as a feature of our overall application and device management capabilities.
96
Table of Contents
Good Community
Our online communities provide us with a network of active users and developers who promote the use of our solution and provide technical support to one another. Our online communities include the beGood forum users, the Good Dynamics Network for developers, and our online Good Dynamics Marketplace.
beGood Forum. Users can ask questions in an online community forum and share best practices about how to configure, deploy, manage and use our solution.
Good Dynamics Network. The Good Dynamics Network, or GDN, allows developers to register and download the Good Dynamics SDK and documentation, participate in forums with other developers, and learn best practices. As of March 31, 2013, GDN had 4,200 registered users and IT administrators and was hosting the testing and production of over 600 unique, registered applications.
Good Dynamics Marketplace. Good’s ISV partners can register their applications in the Good Dynamics Marketplace. All Good Dynamics ISVs must submit their applications for security certification before they can be published in the Good Dynamics Marketplace. Good works with an independent third party to provide this certification service.
Sales and Marketing
Sales
We sell our solution through our direct sales force, channel partners and resellers. We focus our direct sales efforts on the Forbes Global 2000 and augment our direct coverage with extensive channel partnershipsthat focus on companies with approximately $500 million or more in annual revenues. Our direct sales force is comprised of field sales personnel located in targeted geographic markets, including the United States, Europe and Asia. Our direct field sales force is complemented by an inside sales force to enhance our coverage and both are supported by telesales representatives who are primarily responsible for qualified lead generation.
Our channel partnerships include leading distributors, value-added resellers, and managed service providers such as Atea ASA, Integralis AG, Specialist Distribution Group (SDG) Limited, and SHI International Corp. We also work with carriers, such as AT&T, Vodafone and others, that resell our secure mobility solution to their enterprise customers. In addition to augmenting our direct sales coverage for large accounts, we utilize partners as our primary channel to serve accounts below $500 million in annual revenues and in geographies such as United States, Europe and Asia. This allows us to extend our reach into the middle market and overall global reach while lowering the cost of acquiring new customers.
Marketing
We use a variety of global marketing programs to target our prospective and current customers, partners and developers. Our marketing activities include a worldwide corporate communications program such as press and industry analyst relations, social media; advertising; conferences and events; website development, search engine optimization and search engine marketing, and use of social networking platforms. We also use our marketing team to enhance our selling efforts through email, direct mail and phone campaigns; training and cooperative marketing programs with our resellers; developer marketing; use of customer testimonials, case studies and sales tools; and field marketing events.
As a leader in the emerging category of secure mobile computing solutions, we invest in the education of industry participants. To support this, we speak with various research organizations and standards bodies and appear at mobile conferences to discuss the market for secure mobile computing solutions broadly. We believe this also benefits our marketing efforts by enhancing the visibility of our brand with prospective customers while also exposing us to a wide range of potential ecosystem partners.
97
Table of Contents
Our Customer Care and Professional Services
Customer Care
We have been entrusted with enabling mission critical applications for a demanding and discerning global customer base. Our customer care organization strives to deliver consistent world-class customer service maintenance and support. We adhere to strict service quality levels and provide service level agreement-based support.
Our maintenance and support programs are typically sold to customers for one to three-year periods. Our software updates are included with maintenance and support contracts.
Good maintenance and support ensures rapid answers to product and service questions, as well as prompt delivery of product upgrades via access to Good’s download site. We offer multiple tiers of customer service based on customer needs and budgets. All of these tiers provide access to live phone and email support. Our highest levels of support provide 24/7 live phone and email support, proactive 24/7 server monitoring and priority queuing of calls and emails. We have a single-minded focus on delighting our customers. We utilize transactional surveys and programmatic quality measurements to drive continued improvements in customer experience.
Our customer care efforts have been focused on faster resolution, solution quality, and proactive communications. We believe that maintaining customer support, high service levels and achieving customer satisfaction are essential to maintaining and improving our competitive position. We plan to continue to invest in our enterprise-grade global customer care programs.
Professional Services and Training
Our professional services consultants assist our customers in the deployment and configuration of our solution. These fee-based services include advice on deployment planning, network design, product configuration and implementation, automating and customizing reports and tuning policies and configuration of our products for the particular characteristics of the customer’s environment. We provide our customers and partners with fee-based, hands-on training classes for our solution that are offered regularly and in different parts of the world. Additionally, we provide our customers and partners with a self-service portal that enables our customers and partners to manage self-provisioning and other service capabilities and tools such as sample code for use in deployments. We also offer professional services through external partners that have been trained for our solution.
Research and Development
We invest substantial resources in research and development efforts to create new products that are complementary to our existing products, enhance our existing products, further develop security and management technologies and expand our application development platform. We believe that our ability to enhance our product offerings is critical to expanding our leadership in secure mobile computing solutions. Our product development team is comprised of a mix of Good employees and third-party contractors. We primarily conduct our research and development activities in eleven global development locations in Seattle, Washington; Marlborough, Massachusetts; Sunnyvale, California; San Diego, California; Dallas, Texas; London, United Kingdom; Cambridge, United Kingdom; Poland; Slovakia; India and China. The attractive qualities of our secure mobile computing solution have made our efforts in attracting and retaining qualified personnel successful. As of March 31, 2013, we had 295 employees and 121 third-party contractors dedicated to research and development. Our research and development expenses were $27.1 million, $28.9 million and $45.6 million for 2010, 2011 and 2012, respectively.
Competition
We operate in the intensely competitive mobile market that is characterized by constant change and innovation. New product introductions and changes to mobile devices, operating systems, applications, security
98
Table of Contents
threats, industry standards and the overall technology landscape result in evolving customer requirements for mobile solutions. Our main competitors fall into four categories:
| • | large, diversified software vendors that have some product capability in mobile security and management and large existing customer bases such as IBM and SAP; |
| • | IT security, management and/or virtualization vendors that have begun to extend their capabilities beyond the desktop to encompass mobile devices such as Symantec and Citrix; |
| • | mobile device management and/or mobile application management vendors that offer a subset of the features of our overall solution; and |
| • | traditional providers of secure mobile email services and devices to enterprises, such as Blackberry. |
The principal competitive factors in our markets include the following:
| • | robust security model that allows enterprises to safely support both corporate-liable and employee-liable devices; |
| • | strength of innovation and intellectual property; |
| • | degree of security certification; |
| • | quality, ease of use, reliability, scalability and availability of services; |
| • | customer service and support; |
| • | cost of services; |
| • | speed of activation, implementation and ease of deployment; |
| • | availability of comprehensive, easy to use application development platform; |
| • | established ecosystem of ISVs, SIs and enterprise developers; |
| • | capability to address the full spectrum of mobility strategies within an enterprise; and |
| • | ability to be platform and device agnostic. |
We believe that we compete favorably on the basis of these factors.
Companies licensing our intellectual property rights or others offering partial or different solutions could in the future choose to compete with us. Some of these companies are larger and have significantly greater brand recognition, longer operating histories, larger installed customer bases, larger sales and marketing budgets, and greater financial and other resources than we do. These companies could choose to extend their current solutions to serve the customers we serve. This expansion could substantially have a negative impact on our business and revenue prospects. Our ability to compete effectively could also be adversely affected by consolidation among our customers, entrance of new competitors, rapid change in technology and market demands for new services, all of which are factors largely outside of our control.
Intellectual Property
Our success as a company depends upon our ability to protect our core technology and intellectual property. To accomplish this, we rely on a combination of intellectual property rights, including patents, trade secrets, copyrights and trademarks, as well as customary contractual protections. As our various products and technologies were conceived and developed, we protected our technology through the filing of numerous intellectual property patents. As of March 31, 2013, we had 56 issued U.S. patents, 117 issued non-U.S. patents and 93 patent applications for examination globally. The term of these issued patents will expire at various times between 2016 and 2028. We have been successful at defending our intellectual property rights in the past through legal action and private negotiations. Under terms of litigation settlements and past license agreements, licensees have obtained nonexclusive, perpetual licenses to certain of our patents for certain of their products and services in exchange for over $330 million in royalties in the aggregate.
99
Table of Contents
Even though we try to protect our proprietary information, unauthorized parties may copy certain aspects of our products. We generally enter into confidentiality agreements with our employees, consultants, vendors and customers, and generally limit access to and distribution of our proprietary information. We also license software from third parties for integration into our products, including open source software and other software available on commercially reasonable terms. However, we cannot guarantee that these steps will prevent misappropriation of our technology. In addition, the laws of some foreign countries do not protect our proprietary rights to as great an extent as the laws of the U.S., and many foreign countries do not enforce these laws as diligently as government agencies and private parties in the U.S.
Our industry is characterized by the existence of a large number of patents and frequent claims and related litigation regarding patent and other intellectual property rights. Certain of our competitors have large patent portfolios, and there may be claims and litigation against us regarding patent and intellectual property rights. Successful claims of infringement by parties could adversely affect our business and our ability to sell certain products, or require us to pay substantial settlement, damages, costs or other fees.
Employees
As of March 31, 2013, we employed 774 people, including 105 in professional services, operations and support, 295 in research and development, 284 in sales and marketing, and 90 in general and administrative functions. None of our employees are covered by collective bargaining agreements. We have not experienced any work stoppages, and we consider our relations with our employees and other personnel to be good.
Facilities
We lease approximately 80,000 square feet of space for our corporate headquarters in Sunnyvale, California under a lease that expires in June 2019. We operate network operating centers in third-party facilities located in Seattle, Washington and Santa Clara, California. As of March, 2013, we also leased smaller regional offices for sales, support and some research and development in: Red Bank, New Jersey; New York, New York; Farmers Branch, Texas; Seattle, Washington; San Diego, California; Sydney, Australia; Tianjin, China; Beijing, China; Paris, France; Frankfurt, Germany; Milan, Italy; Seoul, South Korea; Madrid, Spain; Cambridge, United Kingdom and London, United Kingdom. We believe that our existing facilities are adequate to meet our current needs, and we intend to add or change facilities as needs require and as we expand into additional markets. We believe that, if required, suitable additional or substitute space would be available to accommodate expansion of our operations.
Legal Proceedings
From time to time, we are a party to litigation and subject to claims incident to the ordinary course of business. Although the results of litigation and claims cannot be predicted with certainty, we currently believe that the final outcome of these matters will not have a material adverse effect on our business. Regardless of the outcome, litigation can have a material impact on us because of defense and settlement costs, diversion of management resources and other factors.
Certain recent legal proceedings include the following:
MobileIron / AirWatch Litigation. On November 14, 2012 we filed separate patent infringement lawsuits against MobileIron and AirWatch in the U.S. District Court for the Northern District of California. The lawsuits assert that MobileIron and AirWatch have infringed upon four of our patents. We are seeking permanent injunction against infringement, monetary damages and attorney’s fees and costs against MobileIron and AirWatch. In addition, we claim that MobileIron has violated the Lanham Act and related law by engaging in a marketing campaign based on falsehoods and misleading claims about Good Technology and its product offerings. In its response to our lawsuit against it, in March 2013, MobileIron asserted a claim that we are infringing one of MobileIron’s U.S. patents. We are currently in the very early stages of the litigation and will be
100
Table of Contents
vigorously pursuing the lawsuits against MobileIron and AirWatch and defending any claims against us. Our analysis of the asserted MobileIron patent is in the early stages and we are unable to predict the likelihood of success of MobileIron’s infringement claim.
LRW / Fixmo Litigation. On May 27, 2011, we filed a patent infringement lawsuit against Little Red Wagon Technologies, et al., or LRW, in U.S. District Court for the Northern District of Texas. In the connection with this litigation, we subsequently filed suit against Fixmo, Inc., or Fixmo, on the basis that Fixmo was serving as a distributor and reseller of LRW’s technology products and or that Fixmo’s products also infringe certain of our patents. We are seeking permanent injunction against infringement, monetary damages and attorney’s fees and costs against LRW and Fixmo. In January 2013, a claims construction hearing, also known as a Markman hearing, was conducted in the Northern District of Texas.
Employee Matter. On October 29, 2012, a claim was filed by a former employee in Santa Clara Superior Court in the State of California alleging wrongful termination and employment discrimination by us and certain of our employees. The plaintiff is seeking compensatory and exemplary damages as well as other fees. We are vigorously defending this matter and believe we have meritorious defenses and, in accordance with generally accepted accounting principles, have recorded a reserve in our financial statements.
101
Table of Contents
Executive Officers and Directors
The following table sets forth the names, ages and positions of our executive officers, key employees and directors as of April 15, 2013:
Name | Age | Position | ||
Executive Officers | ||||
Christy Wyatt | 41 | President, Chief Executive Officer and Director | ||
David H. Russian | 60 | Senior Vice President, Secretary and Chief Financial Officer | ||
Peter Barker | 41 | Senior Vice President, Engineering | ||
Daniel Stoks | 51 | Senior Vice President and Chief Revenue Officer | ||
Ronald S. Vaisbort | 47 | Vice President, General Counsel and Assistant Secretary | ||
Key Employees | ||||
Cheryln Chin | 50 | Senior Vice President, Operations | ||
John R. Herrema, III | 44 | Senior Vice President, Product Management | ||
Lynn Lucas | 45 | Senior Vice President and Chief Marketing Officer | ||
Debbie Shotwell | 51 | Vice President, Human Resources | ||
Dr. Nicholas van Someren | 46 | Senior Vice President and Chief Technical Officer | ||
Non-Employee Directors | ||||
King R. Lee, III | 72 | Executive Chairman | ||
Bandel L. Carano(2) | 51 | Director | ||
John H.N. Fisher(2) | 54 | Director | ||
Marc D. Gordon | 52 | Director | ||
Scot B. Jarvis(1) | 52 | Director | ||
Barry M. Schuler | 59 | Director | ||
Thomas E. Unterman(1) | 68 | Director | ||
Christopher P. Varelas | 49 | Director | ||
| (1) | Member of the Audit Committee |
| (2) | Member of the Compensation Committee |
| (3) | Member of the Nominating and Corporate Governance Committee |
Executive Officers
Christy Wyatt has served as our President and Chief Executive Officer and as a member of our board of directors since January 2013. Prior to joining us, Ms. Wyatt served as Global Head of Consumer eBusiness and Mobile Technology at Citigroup, Inc., a multinational financial services firm, from August 2012 to January 2013. Previously, Ms. Wyatt was with Motorola Mobility Holdings, Inc., a telecommunications equipment company acquired by Google Inc., from August 2005 to June 2012, where she served in various executive roles, most recently as Senior Vice President, General Manager, Enterprise from September 2011 to June 2012. Ms. Wyatt studied scientific computer programming and graduated from the College of Geographic Sciences in 1994.
Our board of directors believes that Ms. Wyatt possesses specific attributes that qualify her to serve as a director, including the perspective and experience she brings as our Chief Executive Officer and her experience as an executive with other technology companies.
102
Table of Contents
David H. Russian has served as our Senior Vice President and Chief Financial Officer since September 2010. Prior to joining us, Mr. Russian served as Chief Financial Officer of General LED, Inc., a manufacturer of LED lighting systems, from May 2007 to March 2009. From November 2004 to August 2005, he served as Vice President—Finance, Chief Financial Officer, Treasurer and Secretary at Maxwell Technologies, Inc., a developer and manufacturer of innovative, cost-effective energy storage and power delivery solutions. Mr. Russian holds a B.S. in Accounting from San Diego State University.
Peter Barker has served as our Senior Vice President, Engineering since September 2010. He also served as our Executive Vice President, Operations, from April 2010 to August 2010. He also served as our Senior Vice President, Sales and Operations from August 2009 to March 2010. He also served as Senior Vice President, Operations, from March 2009 to July 2009. He also served as Vice President, Business Process Engineering, from January 2006 to May 2006 and Vice President, Operations from June 2006 to December 2006. From January 2007 to February 2009, Mr. Barker served as Vice President, Operations at Motorola, Inc. (now Motorola Solutions, Inc.), a provider of communication infrastructure, devices, software and services. Mr. Barker holds a B.A. in Business Administration from Washington State University.
Daniel Stoks has served as our Chief Revenue Officer since April 2013. Prior to joining us, Mr. Stoks was with Hewlett-Packard Company, a multinational information technology company, from February 2008 to January 2013, where he served in various executive roles, most recently as Vice President, General Manager HP Software, Americas from September 2011 to January 2013. Mr. Stoks holds a B.S. in Finance from St. Cloud State University.
Ronald S. Vaisbort has served as our Vice President and General Counsel since January 2011. Prior to joining us, Mr. Vaisbort co-founded and was head of licensing, business and legal affairs for startup companies including Mañana Media, Inc., a film rights and media distribution company, from July 2009 to September 2010 and Layer Dynamics, Inc., an Internet video advertising company, from May 2008 to April 2009. From August 2006 to April 2008, he served as Vice President, Corporate Alliances & Business Affairs at Ripple Networks, Inc., a digital lifestyle media company acquired by TargetCast Networks, Inc. in September 2009. Previously, he served as Content Alliances Director & Strategy at Intel Corporation from January 2004 to August 2006. Mr. Vaisbort holds an A.B. in Legal Studies from the University of California, Berkeley and a J.D. from Loyola Law School, Loyola Marymount University. In connection with his involvement with, and the subsequent wind down of, Mañana Media, Inc., Mr. Vaisbort filed a personal bankruptcy petition in 2010, which was discharged in January 2011.
Key Employees
Cheryln Chin has served as our Senior Vice President, Operations since February 2013. Prior to joining us, Ms. Chin served as Vice President, Marketing and Business Development at Cloud Telecomputers, a provider of business applications and IP telephony, from July 2010 to March 2012. Previously, she was Interim Chief Executive Officer at eHuman, a digital anatomy software company, from April 2010 to June 2010. Ms. Chin was with Motorola Mobility Holdings, Inc., a telecommunications equipment company acquired by Google Inc., from July 2004 to August 2009, where she served in various executive roles, most recently as Corporate Vice President, Product Management, Smartphones. Ms. Chin holds a B.S. in Business Administration from St. Mary’s College of California.
John R. Herrema, III has served as our Senior Vice President, Product Management since February 2013 and was our Senior Vice President, Corporate Strategy from October 2010 to February 2013. He also served as our Vice President and Chief Marketing Officer from February 2009 to October 2010 and as Vice President of Business Development from June 2003 to February 2009. Mr. Herrema holds degrees in Electrical Engineering and Philosophy from the University of Virginia.
Lynn Lucas has served as our Chief Marketing Officer since April 2013. Prior to joining us, Ms. Lucas was with Cisco Systems, Inc., a computer networking devices company, from September 2006 to April 2013, where
103
Table of Contents
she served in various executive roles, most recently as Vice President, Global Collaboration Marketing from July 2011 toApril 2013 and Senior Director of Global Collaboration Marketing from July 2008 to July 2011. Ms. Lucas holds a B.S. in Electrical Engineering and Computer Science from the University of California, Berkeley.
Debbie Shotwell has served as our Chief People Officer and Vice President of Human Resources since November 2011. Prior to joining us, Ms. Shotwell served as Vice President, Human Resources at Pacific Pulmonary Services, a provider of services and equipment for home oxygen, from October 2008 to December 2011. Previously, she served as Group Vice President, People/Talent at Taleo Corporation, a cloud-based talent management solutions company acquired by Oracle Corporation, from September 2005 to May 2008. Ms. Shotwell holds a B.S. in Business Administration/HR from California State University, Sacramento.
Dr. Nicholas van Someren has served as our Chief Technology Officer since July 2011. Prior to joining us, Dr. van Someren served as Chief Security Architect at Juniper Networks, Inc., a network innovation service provider, from January 2010 to July 2011. Prior to his retirement in January 2008, Dr. van Someren served as the Chief Technology Officer of nCipher Plc, a provider of encryption and key management solutions, from October 1996 to December 2007. Dr. van Someren holds an M.A. and Ph.D. in Computer Science from Cambridge University and is a fellow of the Royal Academy of Engineering.
Non-Employee Directors
King R. Lee, III has served as a member of our board of directors since December 2003 and was appointed Executive Chairman in January 2013 after having served as our President and CEO from August 2010 until January 2013. Mr. Lee co-founded Wynd Communications Corporation, a provider of wireless telecommunications services for the hearing-impaired, which became a wholly-owned subsidiary of GoAmerica, Inc. (now Purple Communications, Inc.) in June 2000. He also served as the Chief Executive Officer of The XTree Company from 1987 to 1993 and as the Chief Executive Officer of Quarterdeck, Inc. from 1994 to 1998. He served as a member of the GoAmerica board of directors from January 2003 until his resignation in March 2008.
Our board of directors believes that Mr. Lee possesses specific attributes that qualify him to serve as a director, including the perspective and substantial experience he brings as an executive in the telecommunications industry. Mr. Lee also brings historical knowledge and continuity to the board of directors.
Bandel L. Carano has served as a member of our board of directors since March 2003. Mr. Carano has been a managing partner at Oak Investment Partners, a venture capital firm, since 1987. He is a member of the board of directors of Airspan Networks, Inc., Kratos Defense & Security Solutions, Inc., and NeoPhotonics Corporation, and serves on the Investment Advisory Board of the Stanford Engineering Venture Fund. Mr. Carano holds B.S. and M.S. degrees in Electrical Engineering from Stanford University.
Our board of directors believes that Mr. Carano possesses specific attributes that qualify him to serve as a director, including his substantial experience as an investment professional and as a director of technology companies. Our board of directors also believes that Mr. Carano brings historical knowledge and continuity to the board of directors.
John H.N. Fisher has served as a member of our board of directors since March 2003. Mr. Fisher has served as a managing director of Draper Fisher Jurvetson, a venture capital firm, since 1991. Mr. Fisher serves on the board of directors of SolarCity Corporation. Mr. Fisher previously held positions at ABS Ventures, Alex Brown & Sons, Inc. and Bank of America Corporation. He serves as a Trustee of the California Academy of Sciences and serves on the board of directors of Common Sense Media. Mr. Fisher holds a B.A. in History of Science from Harvard College and an M.B.A. from Harvard Business School.
Our board of directors believes that Mr. Fisher possesses specific attributes that qualify him to serve as a director, including his substantial experience as an investment professional and as a director of private
104
Table of Contents
technology companies and as a member of the board of directors of other public companies. Our board of directors also believes that Mr. Fisher brings historical knowledge and continuity to the board of directors.
Marc D. Gordon has served as a member of our board of directors since February 2013. Since September 2012, Mr. Gordon has served as Executive Vice President and Chief Information Officer at American Express Corporation, a multinational financial services corporation. Previously, Mr. Gordon was with Bank of America Corporation, a multinational banking and financial services corporation, from September 2004 to April 2012, where he served in various executive roles, most recently as Enterprise Chief Information Officer from December 2011 until April 2012. Mr. Gordon holds a B.A. in Economics from Colby College and an S.M. from the MIT Sloan School of Management.
Our board of directors believes that Mr. Gordon possesses specific attributes that qualify him to serve as a director, including his professional experience as an executive of other public technology companies.
Scot B. Jarvis has served as a member of our board of directors since May 2003. Mr. Jarvis co-founded Cedar Grove Partners, LLC, an investment and consulting/advisory partnership in January 1997 and currently serves as its managing member. He has been a venture partner with Oak Investment Partners, a venture capital firm, since 1998. Mr. Jarvis is a member of the board of directors of Airspan Networks, Inc., Kratos Defense & Security Solutions, Inc., and Vitesse Semiconductor Corporation. Mr. Jarvis holds a B.A. in Business Administration from the University of Washington.
Our board of directors believes that Mr. Jarvis possesses specific attributes that qualify him to serve as a director, including his substantial experience as an investment professional, an executive in the telecommunications industry and as a director of private technology companies. Our board of directors also believes that Mr. Jarvis brings historical knowledge and continuity to the board of directors.
Barry M. Schuler has served as a member of our board of directors since November 2006. Mr. Schuler has served as a managing director of Draper Fisher Jurvetson, a venture capital firm, since August 2006 and as Chairman of Raydiance, Inc., a provider of software-controlled ultrashort pulse (USP) lasers, since January 2004. Mr. Schuler served in various senior management roles at America Online, Inc., or AOL, beginning in 1995 and was named Chairman and CEO of AOL, a subsidiary of Time Warner, Inc., from 2000 until 2003. He served on the board of directors of EDGAR Online, Inc., from November 2010 until August 2012 when it was acquired by R.R. Donnelley & Sons Company, a provider of print and related services. Mr. Schuler holds a B.A. in Liberal Arts from Rutgers University and is a member of the Rutgers Hall of Distinguished Alumni.
Our board of directors believes that Mr. Schuler possesses specific attributes that qualify him to serve as a director, including his substantial experience as an investment professional and as an executive and director of private software companies. Our board of directors also believes that Mr. Schuler brings historical knowledge and continuity to the board of directors.
Thomas E. Unterman has served as a member of our board of directors since September 2001. Mr. Unterman founded Rustic Canyon Partners, a sponsor of venture capital funds, in 1999 and currently serves as Founding Partner. Mr. Unterman serves on the board of directors of a number of private companies, including Fulcrum Bioenergy, Inc., Intrepid Systems, Inc., Media Span Group, Inc., Foodlink Online, Black Line Systems and Praedicat, Inc. Previously, Mr. Unterman served in several executive positions at The Times Mirror Company, a newspaper and magazine publisher, most recently as Executive Vice President and Chief Financial Officer. He served as a director of LoopNet, Inc. from January 2001 until April 2012 when it was acquired by CoStar Group, Inc., a provider of information/marketing services to commercial real estate professionals. Previously, he served on the board of directors of Loopnet, The Tribune Company, Ticketmaster Online—CitySearch Inc. and VeloBind, Incorporated. Mr. Unterman received a degree from the Woodrow Wilson School of Public Affairs at Princeton University and a J.D. from the University of Chicago.
105
Table of Contents
Our board of directors believes that Mr. Unterman possesses specific attributes that qualify him to serve as a director, including his substantial experience as the chief executive officer of a public company, as an investment professional and as a director of private technology companies. Our board of directors also believes that Mr. Unterman brings historical knowledge and continuity to the board of directors.
Christopher P. Varelas has served as a member of our board of directors since April 2013. Mr. Varelas has served as a partner of Riverwood Capital, a private equity firm he founded, since December 2008. Previously, he was with Citigroup Global Markets, Inc., an affiliate of Citigroup Inc., a multinational financial services corporation, from July 1990 to December 2008, where he served in various executive roles, most recently as Global Head of Technology, Media & Telecom Investment Banking and the Head of the National Investment Bank. Mr. Varelas holds a B.A. in Economics from Occidental College, for which he serves as a Trustee, and an M.B.A. from the Wharton School of Business.
Our board of directors believes that Mr. Varelas possesses specific attributes that qualify him to serve as a director, including his substantial experience as an investment professional and as an executive of public companies.
Codes of Business Conduct and Ethics
Our board of directors has adopted a code of business conduct and ethics that applies to all of our employees, officers and directors, including our Chief Executive Officer, Chief Financial Officer, and other executive and senior financial officers.
Board Composition
Our business affairs are managed under the direction of our board of directors, which is currently composed of nine members. Seven of our directors are independent within the meaning of the independent director guidelines of the . Ms. Wyatt and Mr. Lee are not considered independent. Immediately prior to this offering, our board of directors will be divided into three staggered classes of directors. At each annual meeting of stockholders, a class of directors will be elected for a three-year term to succeed the same class whose term is then expiring, as follows:
| • | the Class I directors will be , and , and their terms will expire at the annual meeting of stockholders to be held in 2014; |
| • | the Class II directors will be , and , and their terms will expire at the annual meeting of stockholders to be held in 2015; and |
| • | the Class III directors will be , and , and their terms will expire at the annual meeting of stockholders to be held in 2016. |
Our amended and restated certificate of incorporation and bylaws will provide that the number of directors, which is currently fixed at nine members, may be increased or decreased from time to time by a resolution of our board of directors. Each director’s term continues until the election and qualification of his successor, or his earlier death, resignation, or removal. Any increase or decrease in the number of directors will be distributed among the three classes so that, as nearly as possible, each class will consist of one-third of the total number of directors. This classification of our board of directors may have the effect of delaying or preventing changes in control of our company. See “Description of Capital Stock—Anti-Takeover Effects of Delaware Law and Our Certificate of Incorporation and Bylaws” for a discussion of other anti-takeover provisions found in our certificate of incorporation and bylaws.
Each of our executive officers serves at the discretion of our board of directors and holds office until his or her successor is duly appointed and qualified or until his or her earlier resignation or removal. There are no family relationships among any of our directors or executive officers.
106
Table of Contents
Director Independence
In connection with this offering, we intend to list our common stock on the . Under the rules of the , independent directors must comprise a majority of a listed company’s board of directors within a specified period of the completion of this offering. In addition, the rules of the require that, subject to specified exceptions, each member of a listed company’s audit, compensation, and nominating and corporate governance committees be independent. Audit committee members must also satisfy the independence criteria set forth in Rule 10A-3 under the Securities Exchange Act of 1934, as amended, or the Exchange act. Compensation committee members must also satisfy the independence criteria set forth in Rule 10C-1 under the Exchange Act.
In order to be considered independent for purposes of Rule 10A-3 and Rule 10C-1, a member of an audit committee or compensation committee of a listed company may not, other than in his or her capacity as a member of the committee, the board of directors, or any other board committee: (1) accept, directly or indirectly, any consulting, advisory, or other compensatory fee from the listed company or any of its subsidiaries; or (2) be an affiliated person of the listed company or any of its subsidiaries.
Our board of directors has undertaken a review of the independence of each director and considered whether each director has a material relationship with us that could compromise his ability to exercise independent judgment in carrying out his responsibilities. As a result of this review, our board of directors determined that Messrs. Carano, Fisher, Gordon, Jarvis, Schuler, Unterman and Varelas, representing seven of our nine directors, were “independent directors” as defined under the applicable rules and regulations of the Securities and Exchange Commission, or SEC, and the listing requirements and rules of the .
Committees of the Board of Directors
Our board of directors has the authority to appoint committees to perform certain management and administrative functions. Our board of directors has an audit committee, a compensation committee, and a nominating and corporate governance committee, each of which will have the composition and responsibilities described below. Members serve on these committees until their resignation or until otherwise determined by our board of directors.
Audit Committee
Messrs. Jarvis and Unterman, each of whom is a non-employee member of our board of directors, comprise our audit committee. Mr. Unterman is the chairman of our audit committee. Our board of directors has determined that each member of our audit committee meets the requirements for independence and financial literacy under the rules and regulations of the and the SEC. Our board of directors has also determined that Mr. Unterman qualifies as an “audit committee financial expert” as defined in the SEC rules and satisfies the financial sophistication requirements of the . We intend to appoint another director to the audit committee. The audit committee is responsible for, among other things:
| • | selecting and hiring our registered public accounting firm; |
| • | evaluating the performance and independence of our registered public accounting firm; |
| • | approving the audit and pre-approving any non-audit services to be performed by our registered public accounting firm; |
| • | reviewing our financial statements and related disclosures and reviewing our critical accounting policies and practices; |
| • | reviewing the adequacy and effectiveness of our internal control policies and procedures and our disclosure controls and procedures; |
| • | overseeing procedures for the treatment of complaints on accounting, internal accounting controls, or audit matters; |
107
Table of Contents
| • | reviewing and discussing with management and the independent registered public accounting firm the results of our annual audit, our quarterly financial statements, and our publicly filed reports; |
| • | reviewing and approving in advance any proposed related person transactions; and |
| • | preparing the audit committee report that the SEC requires in our annual proxy statement. |
Compensation Committee
Messrs. Carano and Fisher, each of whom is a non-employee member of our board of directors, comprise our compensation committee. Mr. is the chairman of our compensation committee. Our board of directors has determined that each member of our compensation committee meets the requirements for independence under the rules of the and SEC rules and regulations, as well as Section 162(m) of the Internal Revenue Code. The compensation committee is responsible for, among other things:
| • | reviewing and approving our Chief Executive Officer’s and other executive officers’ annual base salaries, incentive compensation plans, including the specific goals and amounts, equity compensation, employment agreements, severance arrangements and change in control agreements, and any other benefits, compensation or arrangements; |
| • | administering our equity compensation plans; |
| • | overseeing our overall compensation philosophy, compensation plans, and benefits programs; and |
| • | preparing the compensation committee report that the SEC will require in our annual proxy statement. |
Nominating and Corporate Governance Committee
Messrs. , and , each of whom is a non-employee member of our board of directors, comprise our nominating and corporate governance committee. Mr. is the chairman of our nominating and corporate governance committee. Our board of directors has determined that each member of our nominating and corporate governance committee meets the requirements for independence under the rules of the . The nominating and corporate governance committee is responsible for, among other things:
| • | evaluating and making recommendations regarding the composition, organization, and governance of our board of directors and its committees; |
| • | evaluating and making recommendations regarding the creation of additional committees or the change in mandate or dissolution of committees; |
| • | reviewing and making recommendations with regard to our corporate governance guidelines and compliance with laws and regulations; and |
| • | reviewing and approving conflicts of interest of our directors and corporate officers, other than related person transactions reviewed by the audit committee. |
Compensation Committee Interlocks and Insider Participation
None of the members of our compensation committee is or has been an officer or employee of our company. None of our executive officers currently serves, or in the past year has served, as a member of the compensation committee or director (or other board committee performing equivalent functions or, in the absence of any such committee, the entire board of directors) of any entity that has one or more executive officers serving on our compensation committee or our board of directors.
Non-Employee Director Compensation
Prior to this offering, we had not implemented a formal policy with respect to compensation payable to our non-employee directors for service as directors. From time to time, we have granted stock options to those non-
108
Table of Contents
employee directors who are also not affiliated with our venture fund investors for their service on our board of directors. We have not paid cash compensation to any of our non-employee directors. We do, however, reimburse our directors for expenses associated with attending meetings of our board and meetings of committees of our board.
109
Table of Contents
Our named executive officers for 2012, which consist of the person who served as our principal executive officer during 2012, the next two most highly compensated executive officers who served as executive officers in 2012, and one former executive who otherwise would have been one of our two most highly compensated executive officers had he been employed through the end of 2012, are as follows:
| • | King R. Lee, III, our former President and Chief Executive Officer, and current Executive Chairman;* |
| • | James Moise, our former Chief Revenue Officer;** |
| • | David H. Russian, our Chief Financial Officer; and |
| • | Brian Carr, our former Senior Vice President, Worldwide Enterprise Sales.*** |
| * | Mr. Lee’s employment as President and Chief Executive Officer terminated in January 2013, in connection with the hiring of Christy Wyatt, our current President and Chief Executive Officer. Mr. Lee has continued to provide services to us as Executive Chairman. |
| ** | Mr. Moise’s employment with the Company terminated in December 2012. |
| *** | Mr. Carr’s employment with the Company terminated in February 2013. |
2012 Summary Compensation Table
The following table provides information regarding the compensation of our named executive officers during the year ended December 31, 2012.
Name and Principal Position | Year | Salary | Option Awards(1) | Non-Equity Incentive Plan Compensation | All Other Compensation(2) | Total | ||||||||||||||||||
King R. Lee, III | 2012 | $ | 390,000 | $ | 1,089,000 | $ | — | $ | 8,011 | (3) | $ | 1,487,011 | ||||||||||||
former President and Chief Executive Officer and current Executive Chairman | ||||||||||||||||||||||||
James Moise | 2012 | 244,391 | 1,089,000 | — | 193,842 | (4) | 1,525,733 | |||||||||||||||||
former Chief Revenue Officer | ||||||||||||||||||||||||
David H. Russian | 2012 | 272,435 | 326,700 | — | 1,500 | 600,635 | ||||||||||||||||||
Senior Vice President and Chief Financial Officer | ||||||||||||||||||||||||
Brian Carr | 2012 | 225,000 | — | 227,210 | (5) | 6,811 | (6) | 459,021 | ||||||||||||||||
former Senior Vice President, Worldwide Enterprise Sales | ||||||||||||||||||||||||
| (1) | The amounts in the “Option Awards” column reflect the aggregate grant date fair value of option awards granted during 2012 computed in accordance with FASB ASC Topic 718. The assumptions that we used to calculate these amounts are discussed in Note 2 to our financial statements included at the end of this prospectus. As required by SEC rules, the amounts shown exclude the impact of estimated forfeitures related to service-based vesting conditions. |
| (2) | Includes $1,500 company matching contribution made by us with respect to the named executive officer’s 401(k) contribution. |
| (3) | Includes $6,511 for spouse’s attendance at a company event. |
| (4) | Includes (i) a severance payment of $125,000 described further under “Executive Compensation— Executive Employment Agreements”; (ii) $16,444 for reimbursement of commuting expenses; (iii) $30,887 for temporary housing; (iv) $14,700, which represents the amount paid to Mr. Moise on his termination date for accrued but unused paid time off; and (v) $5,311 for guest attendance at a company event. Mr. Moise’s employment terminated in December 2012. |
| (5) | This amount represents a cash award under our 2012 Sales Commission Plan. |
| (6) | Includes $5,311 for spouse’s attendance at a company event. |
110
Table of Contents
Outstanding Equity Awards at Fiscal Year-End
The following table provides information regarding equity awards held by our named executive officers at December 31, 2012.
| Option Awards | ||||||||||||||||
| Vesting Commencement Date | Number of Securities Underlying Unexercised Options | Option Exercise Price | Option Expiration Date | |||||||||||||
Name | Exercisable | |||||||||||||||
King R. Lee, III | 12/10/2003 | 13,048 | (1) | $ | 1.23 | 12/09/2013 | ||||||||||
| 09/19/2006 | 350,000 | (1) | $ | 0.11 | 11/27/2016 | |||||||||||
| 08/01/2010 | 7,279,961 | (2)(3) | $ | 0.66 | 11/16/2020 | |||||||||||
| 12/15/2011 | 1,000,000 | (2)(4) | $ | 1.68 | 01/16/2022 | |||||||||||
James Moise | 12/20/2011 | 250,000 | (1)(5) | $ | 1.68 | 01/16/2022 | ||||||||||
David H. Russian | 08/09/2010 | 1,500,000 | (2)(6) | $ | 0.66 | 11/16/2020 | ||||||||||
| 12/15/2011 | 300,000 | (2)(7) | $ | 1.68 | 01/16/2022 | |||||||||||
Brian Carr | 04/05/2010 | 1,500,000 | (2)(8) | $ | 0.62 | 04/19/2020 | ||||||||||
| (1) | All of the shares underlying the option are fully vested and immediately exercisable. |
| (2) | The option is subject to an early exercise provision and is immediately exercisable. Shares underlying the option vest as to 12.5% six months from the vesting commencement date and 1/48th of the shares vest monthly thereafter. |
| (3) | As of December 31, 2012, 4,311,100 shares underlying the option were vested. In connection with Mr. Lee’s transition to Executive Chairman in January 2013, the number of shares underlying the option was reduced to 6,240,872 shares. None of the forfeited shares underlying the option were vested. |
| (4) | As of December 31, 2012, 250,000 shares underlying the option were vested. In connection with Mr. Lee’s transition to Executive Chairman in January 2013, the number of shares subject to the option was reduced to 312,500 shares. None of the forfeited shares underlying the option were vested. |
| (5) | Mr. Moise’s employment with the Company terminated in December 2012, and he has exercised all 250,000 vested and exercisable shares underlying the option. |
| (6) | As of December 31, 2012, 875,000 shares underlying the option were vested. |
| (7) | As of December 31, 2012, 75,000 shares underlying the option were vested. |
| (8) | As of December 31, 2012, 1,000,000 shares underlying the option were vested. Mr. Carr’s employment with the Company terminated in February 2013. Mr. Carr has exercised 500,000 shares underlying the option. He has until May 6, 2013 to exercise the remaining 562,500 vested and exercisable shares underlying the option. |
Executive Employment Agreements
King R. Lee, III
We entered into an executive employment offer letter with King R. Lee, III, our former President and Chief Executive Officer, dated September 29, 2010, which was subsequently amended on November 17, 2010. In January 2013, Mr. Lee’s role as President and Chief Executive Officer was terminated, but he remained with us as our Executive Chairman. In connection with his transition to the role of Executive Chairman, Mr. Lee executed a letter agreement, or the Lee Transition Letter, under which he agreed to reduce the number of shares subject to his outstanding stock options, as described below. Mr. Lee received no severance when his role as President and Chief Executive Officer was terminated.
On November 17, 2010, Mr. Lee was granted an option to purchase 7,279,961 shares of our common stock at an exercise price equal to $0.66 per share, which is subject to time-based vesting requirements based on his continuous service with us. Under the Lee Transition Letter, the number of shares subject to this option grant was reduced to 6,240,872, and Mr. Lee will vest in the remaining unvested shares subject to this option grant at a rate of 148,444 shares per month subject to his continued service with us.
On January 17, 2012, Mr. Lee was granted an option to purchase 1,000,000 shares of our common stock at an exercise price equal to $1.68 per share, which is subject to time-based vesting requirements based on his
111
Table of Contents
continuous service with us. Under the Lee Transition Letter, the number of shares subject to this option grant was reduced to 312,500, and Mr. Lee will vest in the remaining unvested shares subject to this option grant at a rate of 5,208 per month subject to his continued service with us. Under the terms of his option agreements, 100% of any then unvested options will vest upon an “involuntary termination” (as defined in the option agreements) occurring at any time during the period beginning 15 days prior to the execution of a definitive agreement evidencing a “change in control” (as defined in the option agreements) and ending 12 months following, a “change in control.”
James Moise
We entered into an executive employment offer letter with James Moise, our former Chief Revenue Officer, dated December 19, 2011. In December 2012, Mr. Moise’s employment was terminated. His base salary before his employment terminated was $250,000, and he was eligible to earn an annual incentive bonus of up to 80% of his base salary. However, Mr. Moise did not receive an annual incentive bonus for 2012 because he was not employed with us through the date that any bonus would have been paid. In connection with his employment termination, we entered into a separation agreement with Mr. Moise pursuant to which he received a lump sum severance payment equal to $125,000, representing six months of his base salary as of his employment termination date, in exchange for a release of claims against us.
David H. Russian
We entered into an executive employment offer letter with David H. Russian, our Senior Vice President and Chief Financial Officer, dated October 15, 2010. The executive employment offer letter has no specific term and constitutes at-will employment. Mr. Russian’s current annual base salary is $297,670 and he is eligible to earn an annual incentive bonus of up to 50% of his base salary.
On November 17, 2010, Mr. Russian was granted an option to purchase 1,500,000 shares of our common stock at an exercise price equal to $0.66 per share, which is subject to time-based vesting requirements based on his continuous service with us.
On January 17, 2012, Mr. Russian was granted an option to purchase 300,000 shares of our common stock at an exercise price equal to $1.68 per share, which is subject to time-based vesting requirements based on his continuous service with us.
Under the terms of his option agreements, 100% of any then unvested options will vest upon an “involuntary termination” (as defined in the option agreements) occurring at any time during the period beginning 15 days prior to the execution of a definitive agreement evidencing a “change in control” (as defined in the option agreements) and ending 12 months following, a “change in control.”
If Mr. Russian is involuntarily terminated by us other than for “cause,” death, or “permanent disability” (as such terms are defined in the offer letter), subject to his timely execution of a release of claims and timely return of all Company property, Mr. Russian will receive a lump sum payment equal to six months base salary as well as payment of the monthly premiums under COBRA for him and his dependents for up to six months.
Brian Carr
We entered into an executive employment offer letter with Brian Carr, our former Senior Vice President, Worldwide Enterprise Sales, dated April 15, 2010. In February 2013, Mr. Carr’s employment was terminated. His base salary before his employment terminated was $225,000, and he was eligible to earn an incentive bonus under our 2012 Sales Commission Plan, which was paid upon Mr. Carr’s termination. In connection with his employment termination, we entered into a separation agreement with Mr. Carr pursuant to which he received a
112
Table of Contents
lump sum severance payment equal to $112,500, representing six months of his base salary on his employment termination date, in exchange for a release of claims against us.
Christy Wyatt
We entered into an executive employment offer letter with Christy Wyatt, our current President and Chief Executive Officer, dated December 12, 2012. The executive employment offer letter has no specific term and constitutes at-will employment. Ms. Wyatt’s current annual base salary is $400,000, and she is eligible to earn an annual incentive bonus of up to 100% of her base salary. Ms. Wyatt also received a signing bonus equal to $300,000, which is repayable to us if Ms. Wyatt voluntarily terminates her employment within 12 months of her start date other than for “good reason” (as defined in the offer letter), death or disability.
Original Options. Ms. Wyatt was granted an option to purchase 6,827,185 shares of our common stock at an exercise price equal to $4.13 per share, which is subject to time-based vesting requirements based on her continuous service with us. Ms. Wyatt also is eligible to receive an additional option grant to offset any dilution resulting from our Series C preferred stock financing, which we consummated in April 2013. The exercise price for such option shall equal the fair market value of our common stock on the date of grant and shall be subject to time-based vesting requirements based on her continuous service with us.
Supplemental Options. Ms. Wyatt was granted an option to purchase 1,137,864 shares of our common stock at an exercise price equal to equal to $4.13 per share. The shares subject to this option are eligible to vest only if and when we achieve certain financial milestones for the preceding 12-month period. Ms. Wyatt also is eligible to receive an additional option grant to offset any dilution resulting from our Series C redeemable convertible preferred stock financing. The exercise price for such option grant shall equal the fair market value of our common stock on the date of grant.
If Ms. Wyatt is terminated without “cause” (as defined in her letter) or terminates her employment for “good reason” outside of the period of time beginning three months prior to, and ending 24 months following, a “change in control” (as defined in the offer letter) (the “change in control period”), she will receive a lump sum payment equal to 12 months of her then-current base salary plus her target bonus and 100% of the annual incentive bonus for the year of termination, prorated to her termination date. She also will receive 12 months acceleration of vesting of unvested “original options” (as identified above) and a period of up to 12 months post-termination to exercise all vested stock options. Ms. Wyatt will also receive a lump sum payment equal to the monthly premium under COBRA for her and her dependents for up to 12 months, if she elects COBRA coverage. The payments and benefits under this paragraph are subject to her timely execution of a release of claims and timely return of our property.
If Ms. Wyatt is terminated without “cause” or terminates her employment for “good reason” during the change in control period, she will receive lump sum payment equal to 18 months of her then-current base salary plus 1.5 times her target bonus, and 100% of the annual incentive bonus for the year of termination, prorated to her termination date. In addition, 100% of her unvested original options (as identified above) will vest and she will have up to 12 months post-termination to exercise all vested stock options. Ms. Wyatt also will receive an additional bonus payment equal to 18 months of her then-current base salary. Ms. Wyatt will also receive a lump sum payment equal to the monthly premium under COBRA for her and her dependents for up to 18 months, if she elects COBRA coverage. The payments and benefits under this paragraph are subject to her timely execution of a release of claims and timely return of our property.
Further, in the event any of the amounts described above would constitute “parachute payments” within the meaning of Section 280G of the Internal Revenue Code and otherwise could be subject to excise tax under Section 4999 of the Internal Revenue Code, Ms. Wyatt would be entitled to receive either full payment of benefits under this offer letter or such lesser amount which would result in no portion of the benefits being subject to the excise tax, whichever results in the greater amount of after-tax benefits to Ms. Wyatt.
113
Table of Contents
Employee Benefit Plans and Stock Plans
2013 Equity Incentive Plan
Prior to the effectiveness of this offering, our board of directors intends to adopt a 2013 Equity Incentive Plan, or the 2013 Plan, which we expect our stockholders will approve. Subject to stockholder approval, the 2013 Plan will be effective upon the later to occur of its adoption by our board of directors or one business day prior to the effective date of the registration statement of which this prospectus forms a part, but is not expected to be utilized until after the completion of this offering. Our 2013 Plan will provide for the grant of incentive stock options, within the meaning of Section 422 of the Internal Revenue Code, to our employees and any parent and subsidiary corporations’ employees, and for the grant of nonstatutory stock options, restricted stock, restricted stock units, stock appreciation rights, performance units and performance shares to our employees, directors and consultants and our parent and subsidiary corporations’ employees and consultants.
Authorized Shares. A total of shares of our common stock are expected to be reserved for issuance pursuant to the 2013 Plan, of which no awards are issued and outstanding. In addition, the shares to be reserved for issuance under our 2013 Plan will also include (a) those shares reserved but unissued under our 2006 Stock Plan, as amended and restated, or the 2006 Plan, and (b) shares returned to our 2006 Plan as the result of expiration or termination of awards (provided that the maximum number of shares that may be added to the 2013 Plan pursuant to (a) and (b) is shares). The number of shares available for issuance under the 2013 Plan will also include an annual increase on the first day of each fiscal year beginning in 2014, equal to the least of:
| • | shares; |
| • | % of the outstanding shares of common stock as of the last day of our immediately preceding fiscal year; or |
| • | such other amount as our board of directors may determine. |
Plan Administration. Our board of directors or one or more committees appointed by our board of directors will administer the 2013 Plan. We anticipate that the compensation committee of our board of directors will administer our 2013 Plan. In the case of awards intended to qualify as ‘‘performance-based compensation’’ within the meaning of Section 162(m) of the Internal Revenue Code, the committee will consist of two or more ‘‘outside directors’’ within the meaning of Section 162(m). In addition, if we determine it is desirable to qualify transactions under the 2013 Plan as exempt under Rule 16b-3 of the Securities Exchange Act of 1934, as amended, such transactions will be structured to satisfy the requirements for exemption under Rule 16b-3. Subject to the provisions of our 2013 Plan, the administrator has the power to administer the 2013 Plan, including but not limited to, the power to interpret the terms of the 2013 Plan and awards granted under it, to create, amend and revoke rules relating to the 2013 Plan, including creating sub-plans, and to determine the terms of the awards, including the exercise price, the number of shares subject to each such award, the exercisability of the awards, and the form of consideration, if any, payable upon exercise. The administrator also has the authority to amend existing awards to reduce or increase their exercise price, to allow participants the opportunity to transfer outstanding awards to a financial institution or other person or entity selected by the administrator, and to institute an exchange program by which outstanding awards may be surrendered in exchange for awards of the same type, which may have a higher or lower exercise price or different terms, awards of a different type and/or cash.
Stock Options. Stock options may be granted under the 2013 Plan. The exercise price of options granted under our 2013 Plan must at least be equal to the fair market value of our common stock on the date of grant. The term of an incentive stock option may not exceed 10 years, except that with respect to any participant who owns more than 10% of the voting power of all classes of our outstanding stock, the term must not exceed 5 years and the exercise price must equal at least 110% of the fair market value on the grant date. The administrator will determine the methods of payment of the exercise price of an option, which may include cash, shares or other property acceptable to the administrator, as well as other types of consideration permitted by applicable law. After the termination of service of an employee, director or consultant, he or she may exercise his or her option
114
Table of Contents
for the period of time stated in his or her option agreement. Generally, if termination is due to death or disability, the option will remain exercisable for 12 months. In all other cases, the option will generally remain exercisable for three months following the termination of service. However, in no event may an option be exercised later than the expiration of its term. Subject to the provisions of our 2013 Plan, the administrator determines the other terms of the options.
Stock Appreciation Rights. Stock appreciation rights may be granted under our 2013 Plan. Stock appreciation rights allow the recipient to receive the appreciation in the fair market value of our common stock between the exercise date and the date of grant. Stock appreciation rights may not have a term exceeding 10 years. After the termination of service of an employee, director or consultant, he or she may exercise his or her stock appreciation right for the period of time stated in his or her option agreement. However, in no event may a stock appreciation right be exercised later than the expiration of its term. Subject to the provisions of our 2013 Plan, the administrator determines the other terms of stock appreciation rights, including when such rights become exercisable and whether to pay any increased appreciation in cash or with shares of our common stock, or a combination thereof, except that the per share exercise price for the shares to be issued pursuant to the exercise of a stock appreciation right will be no less than 100% of the fair market value per share on the date of grant.
Restricted Stock. Restricted stock may be granted under our 2013 Plan. Restricted stock awards are grants of shares of our common stock that vest in accordance with terms and conditions established by the administrator. The administrator will determine the number of shares of restricted stock granted to any employee, director or consultant and, subject to the provisions of our 2013 Plan, will determine the terms and conditions of such awards. The administrator may impose whatever conditions to vesting it determines to be appropriate (for example, the administrator may set restrictions based on the achievement of specific performance goals or continued service to us); Notwithstanding the foregoing, the administrator, in its sole discretion, may accelerate the time at which any restrictions will lapse or be removed. Recipients of restricted stock awards generally will have voting and dividend rights with respect to such shares upon grant without regard to vesting, unless the administrator provides otherwise. Shares of restricted stock that do not vest are subject to our right of repurchase or forfeiture.
Restricted Stock Units. Restricted stock units may be granted under our 2013 Plan. Restricted stock units are bookkeeping entries representing an amount equal to the fair market value of one share of our common stock. Subject to the provisions of our 2013 Plan, the administrator determines the terms and conditions of restricted stock units, including the vesting criteria (which may include accomplishing specified performance criteria or continued service to us) and the form and timing of payment. Notwithstanding the foregoing, the administrator, in its sole discretion, may accelerate the time at which any restrictions will lapse or be removed.
Performance Units and Performance Shares. Performance units and performance shares may be granted under our 2013 Plan. Performance units and performance shares are awards that will result in a payment to a participant only if performance goals established by the administrator are achieved or the awards otherwise vest. The administrator will establish organizational or individual performance goals or other vesting criteria in its discretion, which, depending on the extent to which they are met, will determine the number and/or the value of performance units and performance shares to be paid out to participants. After the grant of a performance unit or performance share, the administrator, in its sole discretion, may reduce or waive any performance criteria or other vesting provisions for such performance units or performance shares. Performance units shall have an initial dollar value established by the administrator prior to the grant date. Performance shares shall have an initial value equal to the fair market value of our common stock on the grant date. The administrator, in its sole discretion, may pay earned performance units or performance shares in the form of cash, in shares or in some combination thereof.
Outside Directors. Our 2013 Plan will provide that all non-employee directors will be eligible to receive all types of awards (except for incentive stock options) under the 2013 Plan.
Non-Transferability of Awards. Unless the administrator provides otherwise, our 2013 Plan generally will not allow for the transfer of awards and only the recipient of an award may exercise an award during his or her lifetime.
115
Table of Contents
Certain Adjustments. In the event of certain changes in our capitalization, to prevent diminution or enlargement of the benefits or potential benefits available under the 2013 Plan, the administrator will adjust the number and class of shares that may be delivered under the Plan and/or the number, class and price of shares covered by each outstanding award, and the numerical share limits set forth in the 2013 Plan. In the event of our proposed liquidation or dissolution, the administrator will notify participants as soon as practicable and all awards will terminate immediately prior to the consummation of such proposed transaction.
Merger or Change in Control. Our 2013 Plan will provide that in the event of a merger or change in control, as defined under the 2013 Plan, each outstanding award will be treated as the administrator determines, except that if a successor corporation or its parent or subsidiary does not assume or substitute an equivalent award for any outstanding award, then such award will fully vest, all restrictions on such award will lapse, all performance goals or other vesting criteria applicable to such award will be deemed achieved at 100% of target levels and such award will become fully exercisable, if applicable, for a specified period prior to the transaction. The award will then terminate upon the expiration of the specified period of time. If the service of an outside director is terminated on or following a change of control, other than pursuant to a voluntary resignation, his or her options, restricted stock units and stock appreciation rights, if any, will vest fully and become immediately exercisable, all restrictions on his or her restricted stock will lapse, all performance goals or other vesting requirements for his or her performance shares and units will be deemed achieved at 100% of target levels, and all other terms and conditions met.
Amendment, Termination. The administrator will have the authority to amend, suspend or terminate the 2013 Plan provided such action does not impair the existing rights of any participant. Our 2013 Plan will automatically terminate in 2023, unless we terminate it sooner.
2006 Stock Plan, as Amended
Our board of directors and our stockholders adopted our 2006 Stock Plan in November 2006, and our stockholders approved it in January 2007. Our 2006 Plan was most recently amended in December 2011. Our 2006 Plan will be terminated in connection with this offering, and accordingly, no shares are available for issuance under this plan. All outstanding awards will continue to be governed by their existing terms. As of December 31, 2012, options to purchase 54,675,778 shares of our common stock remained outstanding under our 2006 Plan. Awards granted under the 2006 Plan are subject to terms generally similar to those described above with respect to awards granted under the 2013 Plan. Our 2006 Plan provides that, in the event of a merger or consolidation, each award will be subject to the agreement of merger or consolidation. Such agreement will provide for one or more of the following: the continuation, assumption or substitution of awards, full acceleration of awards followed by the cancellation of such awards, and/or the cancellation of outstanding awards in exchange for a cash payment. Our 2006 Plan generally provides that an option may be transferrable only by: a beneficiary designation, a will, or the laws of descent and distribution. However, the stock option agreement may allow for transfer of nonstatutory stock option by gift or domestic relations order to a family member. Incentive stock options may be exercised during the participant’s lifetime only by the participant or the participant’s guardian.
Visto Corporation 1996 Stock Plan, as Amended and Restated
Our 1996 Stock Plan, as amended and restated, or the 1996 Plan, was adopted by our board of directors on September 23, 1996, and was subsequently amended and restated, most recently on July 23, 2002. In November 2006, our board of directors terminated the 1996 Plan in connection with the adoption of our 2006 Plan. The 1996 Plan continues to govern the terms of any outstanding awards granted thereunder, but no future awards will be granted under the 1996 Plan. Awards granted under the 1996 Plan are subject to terms generally similar to those described above with respect to awards granted under the 2013 Plan. After the termination of service of an employee, officer, director, consultant, or advisor, who received stock options under the 1996 Plan, he or she may exercise his or her option for the period of time provided in his or her option agreement. Generally, if termination is due to reasons other than death or disability, the option will remain exercisable for at least three
116
Table of Contents
months. Generally, if termination is due to disability, the option will remain exercisable for at least six months. If termination is due to death, the option will remain exercisable for at least 12 months. During a participant’s lifetime, his or her options granted under the 1996 Plan may be exercisable only by the participant or the participant’s guardian or legal representatives, and shall not be transferrable by the participant other than by beneficiary designation, will, or the laws of descent and distribution. The 1996 Plan provided that in the event of a merger or other consolidation, each outstanding award will be treated in accordance with the agreement of merger or consolidation. The agreement may provide for (a) the continuation of the outstanding options by us, if we are the surviving corporation, (b) the assumption of the 1996 Plan and outstanding options thereunder, (c) the substitution by the surviving corporation or its parent of options with substantially the same terms for such outstanding options, or (d) the cancellation of such outstanding options without payment or consideration.
SumooH, Inc. 2009 Stock Incentive Plan
In connection with our acquisition of Copiun in September 2012, we assumed options granted under the SumooH, Inc. 2009 Stock Incentive Plan, as amended and restated, or the Copiun Plan, for former employees of Copiun who continued employment with us after the closing. We converted these options into options to purchase shares of our common stock. The Copiun Plan will continue to govern the terms of these assumed options, but no future awards will be granted under the Copiun Plan. Awards granted under the Copiun Plan are subject to terms generally similar to those described above with respect to awards granted under the 2013 Plan. After the termination of service of an employee, officer, director, consultant, or advisor, who received stock options under the Copiun Plan, he or she may exercise his or her option for the period of time stated in his or her option agreement. For California participants, generally, if termination is due to reasons other than cause, death, or disability, the option will remain exercisable for at least 30 days. If a California participant is terminated due to death or “permanent and total disability,” the option will remain exercisable for at least six months. Except as the administrator may otherwise determine or provide in an award, options shall not be sold, assigned, transferred, pledged, or otherwise encumbered by the person to whom they were granted, except by will or the laws of descent and distribution, or, other than in the case of an incentive stock option, pursuant to a qualified domestic relations order. The Copiun Plan provides that in the event of a reorganization, such as a merger or combination of the company with or into another entity, a share exchange transaction, or a liquidation or dissolution of the company, the administrator may take any one or more of the actions described in the Copiun Plan.
OnDeego, Inc. 2010 Stock Incentive Plan, as Amended and Restated
In connection with our acquisition of AppCentral in October 2012, the board of directors assumed options granted under the OnDeego, Inc. 2010 Stock Incentive Plan, as amended and restated, or the AppCentral Plan, for former employees of AppCentral who continued employment with us after the closing. We converted these options into options to purchase shares of our common stock. The AppCentral Plan will continue to govern the terms of these assumed options, but no future awards will be granted under the AppCentral Plan. Awards granted under the AppCentral Plan are subject to terms generally similar to those described above with respect to awards granted under the 2013 Plan. After the termination of service of an employee, director, or consultant, he or she may exercise his or her option for the period of time stated in his or her option agreement. Generally, if termination is due to death or disability, the option will remain exercisable for at least six months. If termination is due to reasons other than death or disability, the option will generally remain exercisable for at least 30 days after termination. However, if termination is due to cause, the option agreement may provide that the option terminates on the effective date of the optionee’s termination. During a grantee’s lifetime, his or her options may be exercisable only by the grantee or the grantee’s guardian or legal representatives, and shall not be transferrable other than by beneficiary designation, will, or the laws of descent and distribution. However, the board of directors may, in its sole discretion, allow a holder of a nonstatutory option to make transfers to a revocable trust, to one or more family members, or to a trust established for the benefit of the grantee and/or one or more family members.
117
Table of Contents
401(k) Plan
We maintain a tax-qualified retirement plan that provides eligible U.S. employees with an opportunity to save for retirement on a tax advantaged basis. Eligible employees automatically are enrolled in the 401(k) plan to defer eligible compensation at a rate of 3%, and may elect to defer a higher percentage of eligible compensation subject to applicable annual Code limits. We have the ability to make discretionary contributions to the 401(k) plan. We currently make matching contributions of 50% of the first 6% of an employee’s contributions up to $1,500 per year. Contributions are allocated to each participant’s individual account and are then invested in selected investment alternatives according to the participants’ directions. The 401(k) plan is intended to be qualified under Section 401(a) of the Code with the 401(k) plan’s related trust intended to be tax exempt under Section 501(a) of the Code. As a tax-qualified retirement plan, contributions to the 401(k) plan and earnings on those contributions are not taxable to the employees until distributed from the 401(k) plan.
Limitation on Liability and Indemnification Matters
Our amended and restated certificate of incorporation and amended and restated bylaws, each to be effective upon the completion of this offering, will provide that we will indemnify our directors and officers, and may indemnify our employees and other agents, to the fullest extent permitted by the Delaware General Corporation Law, which prohibits our amended and restated certificate of incorporation from limiting the liability of our directors for the following:
| • | any breach of the director’s duty of loyalty to us or to our stockholders; |
| • | acts or omissions not in good faith or that involve intentional misconduct or a knowing violation of law; |
| • | unlawful payment of dividends or unlawful stock repurchases or redemptions; and |
| • | any transaction from which the director derived an improper personal benefit. |
If Delaware law is amended to authorize corporate action further eliminating or limiting the personal liability of a director, then the liability of our directors will be eliminated or limited to the fullest extent permitted by Delaware law, as so amended. Our amended and restated certificate of incorporation does not eliminate a director’s duty of care and in appropriate circumstances, equitable remedies, such as injunctive or other forms of non-monetary relief, remain available under Delaware law. This provision also does not affect a director’s responsibilities under any other laws, such as the federal securities laws or other state or federal laws. Under our amended and restated bylaws, we will also be empowered to purchase insurance on behalf of any person whom we are required or permitted to indemnify.
In addition to the indemnification required in our amended and restated certificate of incorporation and amended and restated bylaws, we plan to enter into indemnification agreements with each of our current directors, officers, and some employees before the completion of this offering. These agreements will provide indemnification for certain expenses and liabilities incurred in connection with any action, suit, proceeding, or alternative dispute resolution mechanism, or hearing, inquiry, or investigation that may lead to the foregoing, to which they are a party, or are threatened to be made a party, by reason of the fact that they are or were a director, officer, employee, agent, or fiduciary of our company, or any of our subsidiaries, by reason of any action or inaction by them while serving as an officer, director, agent, or fiduciary, or by reason of the fact that they were serving at our request as a director, officer, employee, agent, or fiduciary of another entity. In the case of an action or proceeding by, or in the right of, our company or any of our subsidiaries, no indemnification will be provided for any claim where a court determines that the indemnified party is prohibited from receiving indemnification. We believe that these bylaw provisions and indemnification agreements are necessary to attract and retain qualified persons as directors and officers. We also maintain directors’ and officers’ liability insurance.
The limitation of liability and indemnification provisions in our amended and restated certificate of incorporation and amended and restated bylaws may discourage stockholders from bringing a lawsuit against
118
Table of Contents
directors for breach of their fiduciary duties. They may also reduce the likelihood of derivative litigation against directors and officers, even though an action, if successful, might benefit us and our stockholders. A stockholder’s investment may be harmed to the extent we pay the costs of settlement and damage awards against directors and officers pursuant to these indemnification provisions. Insofar as we may provide indemnification for liabilities arising under the Securities Act to our current directors, officers, and controlling persons pursuant to the foregoing provisions, or otherwise, we have been advised that, in the opinion of the SEC, such indemnification is against public policy as expressed in the Securities Act, and is, therefore, unenforceable. There is no pending litigation or proceeding naming any of our directors or officers as to which indemnification is being sought, nor are we aware of any pending or threatened litigation that may result in claims for indemnification by any director or officer.
119
Table of Contents
CERTAIN RELATIONSHIPS AND RELATED PARTY TRANSACTIONS
Below we describe transactions and series of similar transactions, during our last three fiscal years, to which we were a party or will be a party, in which:
| • | the amounts involved exceeded or will exceed $120,000; and |
| • | any of our directors, executive officers or beneficial holders of more than 5% of any class of our capital stock, or any immediate family member of such related person, had or will have a direct or indirect material interest. |
Other than as described below, there has not been, nor is there any currently proposed transactions or series of similar transactions to which we have been or will be a party other than compensation arrangements, which are described where required under “Executive Compensation.”
Series B-1 Redeemable Convertible Preferred Stock Warrant Exercises
In March 2012, we sold an aggregate of 1,084,831 shares of our Series B-1 redeemable convertible preferred stock at a purchase price of $1.00 per share in connection with the exercises of certain outstanding warrants to purchase Series B-1 redeemable convertible preferred stock. Each share of our Series B-1 redeemable convertible preferred stock will convert automatically into one share of our common stock upon the completion of this offering. The following table summarizes the Series B-1 redeemable convertible preferred stock purchased by entities related to certain members of our Board of Directors:
Name of Stockholder | Shares of Series B-1 Redeemable Convertible Preferred Stock | Aggregate Purchase Price | ||||||
Entities affiliated with Oak Investment Partners(1) | 681,750 | $ | 681,750 | |||||
Entities affiliated with Saints Rustic Canyon(2) | 272,700 | 272,700 | ||||||
| (1) | Consists of shares purchased by Oak Investment Partners X, LP and Oak X Affiliates Fund, LP. Mr. Carano, a member of our board of directors, is affiliated with these entities. |
| (2) | Consists of shares purchased by Saints Rustic Canyon, LP. Mr. Unterman, a member of our board of directors, is affiliated with this entity. |
Series C Preferred Stock Financing
In April 2013, we sold an aggregate of 12,180,269 shares of our Series C redeemable convertible preferred stock at a purchase price of $4.105 per share for an aggregate purchase price of approximately $50 million. Each share of our Series C redeemable convertible preferred stock will convert automatically into one share of our common stock immediately prior to the completion of this offering. The following table summarizes the Series C redeemable convertible preferred stock purchased by entities related to certain members of our Board of Directors:
Name of Stockholder | Shares of Series C Redeemable Convertible Preferred Stock | Aggregate Purchase Price | ||||||
Entities affiliated with Riverwood Capital(1) | 9,744,215 | $ | 40,000,000 | |||||
| (1) | Consists of shares purchased by Riverwood Capital L.P., Riverwood Capital (Parallel – A) L.P. and Riverwood Capital (Parallel – B) L.P. Mr. Varelas, a member of our board of directors, is affiliated with these entities. |
120
Table of Contents
Investors’ Rights Agreement
We are party to an investors’ rights agreement that provides, among other things, that holders of our redeemable convertible preferred stock, including stockholders affiliated with some of our directors, have the right to demand that we file a registration statement or request that their shares be covered by a registration statement that we are otherwise filing. For a more detailed description of these registration rights, see “Description of Capital Stock—Registration Rights.”
Employment Arrangements and Indemnification Agreements
We have entered into employment and consulting arrangements with certain of our current and former executive officers. See “Executive Compensation—Executive Employment Arrangements.”
We have also entered into indemnification agreements with each of our directors and officers. The indemnification agreements and our amended and restated certificate of incorporation and amended and restated bylaws in effect upon the completion of this offering require us to indemnify our directors and officers to the fullest extent permitted by Delaware law. See “Executive Compensation—Limitation on Liability and Indemnification Matters.”
Severance and Separation Agreements
Many of our executive officers are entitled to certain severance benefits. See “Executive Compensation—Potential Payments Upon Termination or Upon Termination Following a Change in Control.”
Stock Option Grants to Executive Officers and Directors
We have granted stock options to our executive officers and one of our non-employee directors. See “Executive Compensation” and “Management—Non-Employee Director Compensation.”
Transactions with Motorola
In February 2009, we acquired all of the outstanding shares of common stock of Good Technology, Inc. from Motorola. In connection with this purchase, we issued 15,497,586 shares of our Series B-1 redeemable convertible preferred stock and warrants to purchase an additional 1,084,831 shares of our Series B-1 redeemable convertible preferred stock, and Motorola became a holder of more than 5% of our outstanding securities. Motorola subsequently sold all of its shares and warrants to existing Series B-1 redeemable convertible preferred stockholders in December 2011. For the year ended December 31, 2011, we recognized revenues from sales to Motorola of $0.2 million. In addition, we issued a note payable to Motorola for $3.0 million in October 2010 in connection with an agreement between us and Motorola to resolve all disputes and claims related to the acquisition by us of Good Technology, Inc. from Motorola. The note payable was fully repaid as of December 31, 2011.
Policies and Procedures for Related Party Transactions
We will adopt a formal written policy that will be effective upon the closing of this offering providing that our executive officers, directors, nominees for election as directors, beneficial owners of more than 5% of any class of our capital stock, any member of the immediate family of any of the foregoing persons, and any firm, corporation or other entity in which any of the foregoing persons is employed or is a general partner or principal or in a similar position or in which such person has a 5% or greater beneficial ownership interest, are not permitted to enter into a related party transaction with us without the approval of our audit committee, subject to the exceptions described below. In approving or rejecting any such proposal, our audit committee will consider the relevant facts and circumstances available and deemed relevant to our audit committee, including whether the
121
Table of Contents
transaction is on terms no less favorable than terms generally available to an unaffiliated third party under the same or similar circumstances and the extent of the related party’s interest in the transaction. Our audit committee has determined that certain transactions will not require audit committee approval, including certain employment arrangements of executive officers, director compensation, transactions with another company at which a related party’s only relationship is as a director, non-executive employee or beneficial owner of less than 10% of that company’s outstanding capital stock, transactions where a related party’s interest arises solely from the ownership of our common stock and all holders of our common stock received the same benefit on a pro rata basis, and transactions available to all employees generally.
122
Table of Contents
PRINCIPAL AND SELLING STOCKHOLDERS
The following table presents information with respect to the beneficial ownership of our common stock as of December 31, 2012, and as adjusted to reflect the sale of common stock in this offering assuming no exercise of the underwriters’ option to purchase additional shares, by:
| • | each stockholder known by us to be the beneficial owner of more than 5% of our common stock; |
| • | each of our named executive officers; |
| • | each of our directors; |
| • | all of our executive officers and directors as a group; and |
| • | each selling stockholder. |
We have determined beneficial ownership in accordance with the rules of the SEC, and thus it represents sole or shared voting or investment power with respect to our securities. Unless otherwise indicated below, to our knowledge, the persons and entities named in the table have sole voting and sole investment power with respect to all shares that they beneficially own, subject to community property laws where applicable. We have deemed shares of our common stock subject to options that are currently exercisable or exercisable within 60 days of December 31, 2012 to be outstanding and to be beneficially owned by the person holding the option for the purpose of computing the percentage ownership of that person but have not treated them as outstanding for the purpose of computing the percentage ownership of any other person.
We have based percentage ownership of our common stock before this offering on 159,142,812 shares of our common stock outstanding on December 31, 2012, which includes 114,371,043 shares of common stock resulting from the automatic conversion upon the closing of this offering of all shares of our redeemable convertible preferred stock which were outstanding as of December 31, 2012, as if this conversion had occurred as of December 31, 2012. Percentage ownership of our common stock after this offering also assumes our sale of shares of common stock in this offering. Unless otherwise indicated, the address of each of the individuals and entities named below that owns 5% or more of our common stock is c/o Good Technology Corporation, 430 N. Mary Avenue, Suite 200, Sunnyvale, California 94085.
| Shares Beneficially Owned Prior to This Offering | Number of Shares Being Offered in This Offering | Shares Beneficially Owned After This Offering | ||||||||||||
Name of Beneficial Owner | Shares | Percentage | Shares | Percentage | ||||||||||
5% Stockholders: | ||||||||||||||
Entities affiliated with Oak Investment Partners(1) | 46,541,226 | 29.2 | % | |||||||||||
Entities affiliated with Draper Fisher Jurvetson(2) | 24,223,707 | 15.2 | ||||||||||||
Entities affiliated with Saints Rustic Capital(3) | 14,376,802 | 9.0 | ||||||||||||
Entities affiliated with Meritech Capital Partners(4) | 13,067,033 | 8.2 | ||||||||||||
Brian A. Bogosian(5) | 10,132,019 | 6.4 | ||||||||||||
Named Executive Officers and Directors: | ||||||||||||||
King R. Lee, III(6) | 6,916,420 | 4.2 | ||||||||||||
James Moise(7) | 250,000 | * | ||||||||||||
David H. Russian(8) | 1,800,000 | 1.1 | ||||||||||||
Brian Carr(9) | 1,062,500 | * | ||||||||||||
Bandel L. Carano(10) | 46,541,226 | 29.2 | ||||||||||||
John H.N. Fisher(11) | 24,223,707 | 15.2 | ||||||||||||
Scot B. Jarvis(12) | 463,048 | * | ||||||||||||
Barry M. Schuler(13) | 8,639,327 | 5.4 | ||||||||||||
Thomas E. Unterman(14) | 14,376,802 | 9.0 | ||||||||||||
All executive officers and directors as a group (10 persons)(15) | 97,383,703 | 56.9 | ||||||||||||
Other Selling Stockholders: | ||||||||||||||
123
Table of Contents
| * | Represents beneficial ownership of less than 1%. |
| (1) | Consists of (i) 45,805,874 shares held of record by Oak Investment Partners X, LP, or Oak X; and (ii) 735,352 shares held of record by Oak X Affiliates Fund, LP, or Oak X Affiliates. Oak Associates X, LLC, or Oak Associates X GP is the general partner of Oak X. Oak X Affiliates, LLC, or Oak X Affiliates GP, is the general partner of Oak X Affiliates. Bandel L. Carano, Edward F. Glassmeyer, Fredric W. Harman and Ann H. Lamont, as the managing members of Oak Associates X GP and Oak X Affiliates GP, share voting and dispositive power with respect to the shares held by Oak X and Oak X Affiliates GP. The address for each of these entities is c/o Oak Investment Partners, 525 University Avenue, Suite 1300, Palo Alto, California 94301. |
| (2) | Consists of (i) 7,098,844 shares held of record by Draper Fisher Jurvetson Fund VI, L.P., or Fund VI; (ii) 198,463 shares held of record by Draper Fisher Jurvetson Partners VI, LLC, or Partners VI; (iii) 159,024 shares held of record by Draper Fisher Jurvetson ePlanet Partners Fund, LLC, or ePlanet Partners; (iv) 7,657,019 shares held of record by Draper Fisher Jurvetson ePlanet Ventures L.P., or ePlanet Ventures; (v) 135,171 shares held of record by Draper Fisher Jurvetson ePlanet Ventures GmbH & Co. KG, or ePlanet GmbH; (vi) 7,993,105 shares held of record by Draper Fisher Jurvetson Growth Fund 2006, L.P., or Growth Fund; (vii) 646,222 shares held of record by Draper Fisher Jurvetson Partners Growth Fund 2006, LLC, or Partners Growth; and (viii) 335,859 shares held of record by Draper Associates, L.P., or DALP. Timothy C. Draper, John H.N. Fisher, and Stephen T. Jurvetson, as the managing members of the general partner entities of Fund VI, Partners VI and ePlanet Partners, share voting and dispositive power with respect to the shares held by Fund VI, Partners VI and ePlanet Partners. Messrs. Draper, Fisher, Jurvetson and Asad Jamal, as the managing members of the general partner entities of ePlanet Ventures and ePlanet GmbH, share voting and dispositive power with respect to the shares held by ePlanet Ventures and ePlanet GmbH. Mark W. Bailey, Mr. Fisher and Barry M. Shuler, as the managing members of the general partner of Growth Fund, share voting and dispositive power with respect to the shares held by Growth Fund. Any three of Messrs. Bailey, Draper, Fisher and Jurvetson and Mr. Schuler, as the managing members of Partners Growth, share voting and dispositive power with respect to the shares held by Partners Growth. Mr. Draper, as the President of Draper Associates, Inc., the general partner of DALP, shares voting and dispositive power with respect to the shares held by DALP. The address for each of these entities is c/o Draper Fisher Jurvetson, 2882 Sand Hill Road, Suite 150, Menlo Park, California 94025. |
| (3) | Consists of (i) 12,838,404 shares held of record by Saints Rustic Canyon, LP, or SRC LP; and (ii) 1,538,398 shares held of record by Rustic Canyon Ventures SBIC, LP, or RCV SBIC. Thomas E. Unterman, Nate Redmond, Neal Hansch, Kenneth B. Sawyer, David P. Quinlavin and Chia Griarte, as the managing members of Saints Rustic Canyon LLC, the general partner of SRC LP, share voting and dispositive power with respect to the shares held by SRC LP. Thomas E. Unterman, Nate Redmond, David Travers and Neal Hansch, as the managing members of Rustic Canyon Ventures SBIC, LLC, the general partner of RCV SBIC, share voting and dispositive power with respect to the shares held by RCV SBIC. The address for each of these entities is c/o Saints Rustic Capital; 475 Sansome Street, Suite 1850, San Francisco, California 94111. |
| (4) | Consists of (i) 12,644,968 shares held of record by Meritech Capital Partners II, L.P., or MCP II; (ii) 325,369 shares held of record by Meritech Capital Affiliates II, L.P., or MCA II; and (iii) 96,696 shares held of record by MCP Entrepreneur Partners II L.P., or MCP ENT II. Meritech Management Associates II L.L.C., or MMA II, a managing member of Meritech Capital Associates II L.L.C., the general partner of MCP II, MCA II and MCP ENT II, has sole voting and dispositive power with respect to the shares held by MCP II, MCA II and MCP ENT II. Paul S. Madera and Michael B. Gordon, as the managing members of MMA II, share voting and dispositive power with respect to the shares held by MCP II, MCA II and MCP ENT II. The address for each of these entities is c/o Meritech Capital Partners, 245 Lytton Avenue, Suite 350, Palo Alto, California 94301. |
| (5) | Consists of (i) 9,732,019 shares held of record by Mr. Bogosian; (ii) 200,000 shares held of record by Mr. Bogosian as custodian for his elder daughter; and (iii) 200,000 shares held of record by Mr. Bogosian as custodian for his younger daughter. |
| (6) | Consists of 6,916,420 shares exercisable within 60 days of December 31, 2012, which reflects a reduction in his beneficial ownership in connection with Mr. Lee’s transition to Executive Chairman in January 2013, of which 5,379,896 are fully vested. |
| (7) | Consists of 250,000 shares exercisable within 60 days of December 31, 2012, all of which are fully vested. On February 27, 2013, all of these shares were exercised and are held of record by Mr. Moise. |
| (8) | Consists of 1,800,000 shares exercisable within 60 days of December 31, 2012, 1,025,000 of which are fully vested. |
| (9) | Consists of 1,062,500 shares exercisable within 60 days of December 31, 2012, all of which are fully vested. |
| (10) | Consists of the shares listed in footnote (1) above, which are held by the Oak Investment Partners entities. Mr. Carano, one of our directors, is a managing partner at Oak Investment Partners and shares voting and dispositive power with respect to the shares held by Oak Investment Partners. |
| (11) | Consists of the shares listed in footnote (2) above, which are held by the Draper Fisher Jurvetson entities. Mr. Fisher, one of our directors, is a managing director at Draper Fisher Jurvetson and shares voting and dispositive power with respect to the shares held by Draper Fisher Jurvetson. |
| (12) | Consists of (i) 350,000 shares held of record by Mr. Jarvis; and (ii) 113,048 shares exercisable within 60 days of December 31, 2012, all of which are fully vested. |
| (13) | Consists of the shares held of record by Growth Fund and Partners Growth as listed in footnote (2) above. Mr. Schuler, one of our directors, is a managing director at Draper Fisher Jurvetson and shares voting and dispositive power with respect to the shares held by Growth Fund and Partners Growth. |
| (14) | Consists of the shares listed in footnote (3) above, which are held by the Saints Rustic Capital entities. Mr. Unterman, one of our directors, is a managing member at Rustic Canyon Ventures SBIC, LLC and a managing director at Saints Rustic Canyon LLC and shares voting and dispositive power with respect to the shares held by Saints Rustic Capital. |
| (15) | Consists of (i) 85,491,735 shares beneficially owned by our current directors and officers; and (ii) 11,891,968 shares subject to options exercisable within 60 days of December 31, 2012, of which 9,070,026 shares are fully vested. |
124
Table of Contents
General
The following is a summary of the rights of our common stock and redeemable convertible preferred stock and certain provisions of our amended and restated certificate of incorporation and amended and restated bylaws as they will be in effect upon the completion of this offering. This summary does not purport to be complete and is qualified in its entirety by the provisions of our amended and restated certificate of incorporation and amended and restated bylaws, copies of which have been filed as exhibits to the registration statement of which this prospectus is a part.
Immediately following the completion of this offering, our authorized capital stock will consist of shares, with a par value of $0.0001 per share, of which:
| • | shares will be designated as common stock; and |
| • | shares will be designated as preferred stock. |
As of December 31, 2012, we had outstanding 159,142,812 shares of common stock, held by approximately 523 stockholders of record, and no shares of redeemable convertible preferred stock, assuming the automatic conversion of all outstanding shares of our redeemable convertible preferred stock into common stock on a one-to-one basis effective immediately prior to the completion of this offering. The conversion price of the Series C redeemable convertible preferred stock may be reduced to an amount that represents a 33% discount to the price of the common stock sold in this offering if the price of the common stock sold in this offering is not at least $6.13. In addition, as of December 31, 2012, we had outstanding options to acquire 55,859,579 shares of our common stock and outstanding warrants that will become exercisable for 4,470,009 shares of our common stock.
Common Stock
The holders of common stock are entitled to one vote per share on all matters submitted to a vote of our stockholders and do not have cumulative voting rights. Accordingly, holders of a majority of the shares of common stock entitled to vote in any election of directors may elect all of the directors standing for election. Subject to preferences that may be applicable to any preferred stock outstanding at the time, the holders of outstanding shares of common stock are entitled to receive ratably any dividends declared by our board of directors out of assets legally available. In addition, the terms of our credit facility currently prohibit us from paying dividends on our capital stock without the prior approval of our lender. See the section entitled “Dividend Policy.” Upon our liquidation, dissolution, or winding up, holders of our common stock are entitled to share ratably in all assets remaining after payment of liabilities and the liquidation preference of any then outstanding shares of preferred stock. Holders of common stock have no preemptive or conversion rights or other subscription rights. There are no redemption or sinking fund provisions applicable to the common stock.
Preferred Stock
After the completion of this offering, no shares of preferred stock will be outstanding. Pursuant to our amended and restated certificate of incorporation, our board of directors will have the authority, without further action by the stockholders, to issue from time to time up to shares of preferred stock in one or more series. Our board of directors may designate the rights, preferences, privileges, and restrictions of the preferred stock, including dividend rights, conversion rights, voting rights, redemption rights, liquidation preferences, sinking fund terms, and the number of shares constituting any series or the designation of any series. The issuance of preferred stock could have the effect of restricting dividends on the common stock, diluting the voting power of the common stock, impairing the liquidation rights of the common stock, or delaying, deterring, or preventing a change in control. Such issuance could have the effect of decreasing the market price of the common stock. We currently have no plans to issue any shares of preferred stock.
125
Table of Contents
Options
As of December 31, 2012, we had outstanding options to purchase an aggregate of 55,859,579 shares of our common stock, with a weighted-average exercise price of $1.21, pursuant to our 2006 Stock Plan, the Copiun Plan, the AppCentral Plan and our 1996 Stock Plan.
Warrants
As of December 31, 2012, a warrant to purchase 4,432,961 shares of our common stock at an exercise price of $1.83 per share was outstanding. Such warrant may be exercised at any time before or on the date of the closing of this offering, after which date the warrant will terminate.
As of December 31, 2012, a warrant to purchase 13,048 shares of our common stock at an exercise price of $6.438 per share was outstanding. Such warrant may be exercised only on the earlier of (i) the date of the closing of this offering or (ii) on December 17, 2013, after which the warrant will terminate.
As of December 31, 2012, a warrant to purchase 24,000 shares of our common stock at an exercise price of $0.22 per share was outstanding. This warrant expires on October 31, 2015.
Each of the warrants to purchase shares of our common stock has a net exercise provision under which its holder may, in lieu of payment of the exercise price in cash, surrender the warrant and receive a net amount of shares based on the fair market value of our common stock at the time of exercise of the warrant, after deducting the aggregate exercise price. Each warrant contains provisions for the adjustment of the exercise price and the number of shares issuable upon the exercise of the warrant in the event of certain stock dividends, stock splits, reorganizations, reclassifications and consolidations. Certain of the holders of the shares issuable upon exercise of our warrants are entitled to registration rights with respect to such shares as described in greater detail under the heading “—Registration Rights.”
Registration Rights
Certain holders of our common stock are entitled to rights with respect to the registration of their shares under the Securities Act. These registration rights are contained in our Investors’ Rights Agreement, or IRA, dated as of April 15, 2013, between us and the holders of these shares, which was entered into in connection with our redeemable convertible preferred stock financings, and include demand registration rights, short-form registration rights, and piggyback registration rights. The registration rights set forth in the IRA expire five years following the date of this offering, with the consummation of a “liquidation event,” as defined in our Amended and Restated Certificate of Incorporation, or, with respect to any particular stockholder, when such stockholder is able to sell all of its shares pursuant to Rule 144 of the Securities Act or a similar exemption during any 90-day period We will pay the registration expenses (other than underwriting discounts, selling commissions and stock transfer taxes) of the holders of the shares registered pursuant to the registrations described below. In an underwritten offering, the managing underwriter, if any, has the right, subject to specified conditions, to limit the number of shares such holders may include.
Demand Registration Rights
The holders of an aggregate of 128,797,445 shares of our common stock, or their permitted transferees, are entitled to demand registration rights. Under the terms of the IRA, we will be required, upon the written request of holders of at least 20% of the shares that are entitled to registration rights under the IRA, to register, as soon as practicable, all or a portion of these shares for public resale if the proposed aggregate offering price of the shares to be registered by the holders requesting registration is at least $15.0 million, subject to exceptions set forth in the IRA. We are required to effect only two registrations pursuant to this provision of the IRA. We are not required to effect a demand registration until the earlier of October 15, 2014 or 180 days after the effective date of this offering.
126
Table of Contents
Form S-3 Registration Rights
The holders of an aggregate of 128,797,445 shares of our common stock or their permitted transferees are also entitled to S-3 registration rights. Under the terms of the IRA, we will be required, upon written request of holders of at least 10% of the shares that are entitled to registration rights under the IRA, to register on Form S-3, as soon as practicable, all or a portion of these shares for public resale if the proposed aggregate offering price of the shares to be registered by the holders requesting registration is at least $3.0 million, subject to exceptions set forth in the IRA.
Piggyback Registration Rights
Following the completion of this offering, the holders of an aggregate of 128,797,445 shares of our common stock or their permitted transferees are entitled to piggyback registration rights. If we register any of our securities for our own account, after the completion of this offering, the holders of these shares are entitled to include their shares in the registration. The underwriters of any underwritten offering have the right to limit the number of shares registered by these holders for marketing reasons, subject to limitations set forth in the IRA.
Anti-Takeover Effects of Delaware Law and Our Certificate of Incorporation and Bylaws
Our amended and restated certificate of incorporation and amended and restated bylaws to be effective upon the completion of this offering will contain provisions that could have the effect of delaying, deferring, or discouraging another party from acquiring control of us. These provisions and certain provisions of Delaware law, which are summarized below, could discourage takeovers, coercive or otherwise. These provisions are also designed, in part, to encourage persons seeking to acquire control of us to negotiate first with our board of directors. We believe that the benefits of increased protection of our potential ability to negotiate with an unfriendly or unsolicited acquirer outweigh the disadvantages of discouraging a proposal to acquire us.
Undesignated Preferred Stock. As discussed above under “—Preferred Stock,” our board of directors will have the ability to designate and issue preferred stock with voting or other rights or preferences that could deter hostile takeovers or delay changes in our control or management.
Limits on Ability of Stockholders to Act by Written Consent or Call a Special Meeting. Our amended and restated certificate of incorporation will provide that our stockholders may not act by written consent. This limit on the ability of stockholders to act by written consent may lengthen the amount of time required to take stockholder actions. As a result, the holders of a majority of our capital stock would not be able to amend the amended and restated bylaws or remove directors without holding a meeting of stockholders called in accordance with the amended and restated bylaws.
In addition, our amended and restated bylaws will provide that special meetings of the stockholders may be called only by the chairman of our board of directors, the chief executive officer, the president (in the absence of a chief executive officer), or our board of directors. A stockholder may not call a special meeting, which may delay the ability of our stockholders to force consideration of a proposal or for holders controlling a majority of our capital stock to take any action, including the removal of directors.
Requirements for Advance Notification of Stockholder Nominations and Proposals. Our amended and restated bylaws will establish advance notice procedures with respect to stockholder proposals and the nomination of candidates for election as directors, other than nominations made by or at the direction of our board of directors or a committee of the board of directors. These advance notice procedures may have the effect of precluding the conduct of certain business at a meeting if the proper procedures are not followed and may also discourage or deter a potential acquirer from conducting a solicitation of proxies to elect its own slate of directors or otherwise attempt to obtain control of our company.
Board Classification. Our board of directors will be divided into three classes. The directors in each class will serve for a three-year term, one class being elected each year by our stockholders. This system of electing
127
Table of Contents
and removing directors may tend to discourage a third party from making a tender offer or otherwise attempting to obtain control of us, by making it more difficult for stockholders to replace a majority of the directors.
Delaware Anti-Takeover Statute. We will be subject to the provisions of Section 203 of the Delaware General Corporation Law regulating corporate takeovers. In general, Section 203 prohibits a publicly held Delaware corporation from engaging, under certain circumstances, in a business combination with an interested stockholder for a period of three years following the date the person became an interested stockholder unless:
| • | prior to the date of the transaction, our board of directors approved either the business combination or the transaction that resulted in the stockholder becoming an interested stockholder; |
| • | upon completion of the transaction that resulted in the stockholder becoming an interested stockholder, the interested stockholder owned at least 85% of the voting stock of the corporation outstanding at the time the transaction commenced, excluding for purposes of determining the voting stock outstanding, but not the outstanding voting stock owned by the interested stockholder, (1) shares owned by persons who are directors and also officers and (2) shares owned by employee stock plans in which employee participants do not have the right to determine confidentially whether shares held subject to the plan will be tendered in a tender or exchange offer; or |
| • | at or subsequent to the date of the transaction, the business combination is approved by our board of directors and authorized at an annual or special meeting of stockholders, and not by written consent, by the affirmative vote of at least 66 2/3% of the outstanding voting stock that is not owned by the interested stockholder. |
Generally, a business combination includes a merger, asset or stock sale, or other transaction resulting in a financial benefit to the interested stockholder. An interested stockholder is a person who, together with affiliates and associates, owns or, within three years prior to the determination of interested stockholder status, did own 15% or more of a corporation’s outstanding voting stock. We expect the existence of this provision to have an anti-takeover effect with respect to transactions that our board of directors does not approve in advance. We also anticipate that Section 203 may discourage attempts that might result in a premium over the market price for the shares of common stock held by stockholders.
The provisions of Delaware law and the provisions of our amended and restated certificate of incorporation and amended and restated bylaws could have the effect of discouraging others from attempting hostile takeovers and as a consequence, they might also inhibit temporary fluctuations in the market price of our common stock that often result from actual or rumored hostile takeover attempts. These provisions might also have the effect of preventing changes in our management. It is also possible that these provisions could make it more difficult to accomplish transactions that stockholders might otherwise deem to be in their best interests.
Transfer Agent and Registrar
Upon the completion of this offering, the transfer agent and registrar for our common stock will be . The transfer agent’s address is , and its telephone number is .
Exchange Listing
We intend to apply to list our common stock on the under the symbol “ .”
128
Table of Contents
SHARES ELIGIBLE FOR FUTURE SALE
Prior to this offering, there has been no public market for shares of our common stock. Future sales of substantial amounts of shares of common stock, including shares issued upon the exercise of outstanding options, in the public market after this offering, or the possibility of these sales occurring, could adversely affect the prevailing market price for our common stock or impair our ability to raise equity capital.
Upon the completion of this offering, based on shares outstanding as of December 31, 2012, a total of shares of common stock will be outstanding, assuming the automatic conversion of all outstanding shares of redeemable convertible preferred stock into shares of common stock immediately prior to the completion of this offering. Of these shares, all shares of common stock sold in this offering by us and the selling stockholders, plus any shares sold upon exercise of the underwriters’ over-allotment option, will be freely tradable in the public market without restriction or further registration under the Securities Act, unless these shares are held by “affiliates,” as that term is defined in Rule 144 under the Securities Act.
The remaining shares of common stock will be “restricted securities,” as that term is defined in Rule 144 under the Securities Act. These restricted securities are eligible for public sale only if they are registered under the Securities Act or if they qualify for an exemption from registration under Rules 144 or 701 under the Securities Act, which are summarized below.
Subject to the lock-up agreements described below and the provisions of Rules 144 and 701 under the Securities Act, these restricted securities will be available for sale in the public market at various times beginning more than 180 days (subject to extension) after the date of this prospectus.
Rule 144
In general, under Rule 144 as currently in effect, once we have been subject to public company reporting requirements for at least 90 days, a person who is not deemed to have been one of our affiliates for purposes of the Securities Act at any time during the 90 days preceding a sale and who has beneficially owned the shares proposed to be sold for at least six months, including the holding period of any prior owner other than our affiliates, is entitled to sell such shares without complying with the manner of sale, volume limitation, or notice provisions of Rule 144, subject to compliance with the public information requirements of Rule 144. If such a person has beneficially owned the shares proposed to be sold for at least one year, including the holding period of any prior owner other than our affiliates, then such person is entitled to sell such shares without complying with any of the requirements of Rule 144.
In general, under Rule 144, as currently in effect, our affiliates or persons selling shares on behalf of our affiliates are entitled to sell upon expiration of the lock-up agreements described below, within any three-month period beginning 90 days after the date of this prospectus, a number of shares that does not exceed the greater of:
| • | 1% of the number of shares of common stock then outstanding, which will equal approximately shares immediately after this offering; or |
| • | the average weekly trading volume of the common stock during the four calendar weeks preceding the filing of a notice on Form 144 with respect to such sale. |
Sales under Rule 144 by our affiliates or persons selling shares on behalf of our affiliates are also subject to certain manner of sale provisions and notice requirements and to the availability of current public information about us.
Rule 701
Rule 701 generally allows a stockholder who purchased shares of our common stock pursuant to a written compensatory plan or contract and who is not deemed to have been an affiliate of our company during the
129
Table of Contents
immediately preceding 90 days to sell these shares in reliance upon Rule 144 but without being required to comply with the public information, holding period, volume limitation, or notice provisions of Rule 144. Rule 701 also permits affiliates of our company to sell their Rule 701 shares under Rule 144 without complying with the holding period requirements of Rule 144. However, all holders of Rule 701 shares are required to wait until 90 days after the date of this prospectus before selling such shares pursuant to Rule 701.
Lock-Up Agreements
We, the selling stockholders, all of our directors and officers, and the holders of substantially all of our common stock, or securities exercisable for or convertible into our common stock outstanding immediately prior to this offering have agreed that, without the prior written consent of Morgan Stanley & Co. LLC and Barclays Capital Inc. on behalf of the underwriters, we and they will not, during the period ending 180 days after the date of this prospectus:
| • | offer, pledge, sell, contract to sell, sell any option or contract to purchase, purchase any option or contract to sell, grant any option, right or warrant to purchase, lend or otherwise transfer or dispose of, directly or indirectly, any shares of common stock or any securities convertible into or exercisable or exchangeable for shares of common stock; or |
| • | enter into any swap or other arrangement that transfers to another, in whole or in part, any of the economic consequences of ownership of our common stock; |
whether any such transaction described above is to be settled by delivery of common stock or such other securities, in cash or otherwise. See “Underwriters” for a description of the lock up agreements with the underwriters. All of our stockholders are subject to a market standoff agreement with us which impose similar restrictions.
Registration Rights
The holders of 128,797,445 shares of common stock or their transferees will be entitled to various rights with respect to the registration of these shares under the Securities Act. Registration of these shares under the Securities Act would result in these shares becoming fully tradable without restriction under the Securities Act immediately upon the effectiveness of the registration, except for shares purchased by affiliates. See “Description of Capital Stock—Registration Rights” for additional information.
Registration Statements on Form S-8
Upon the completion of this offering, we intend to file a registration statement on Form S-8 under the Securities Act to register all of the shares of common stock issued or reserved for issuance under our stock option plans. Shares covered by this registration statement will be eligible for sale in the public market, upon the expiration or release from the terms of the lock-up agreements and subject to vesting of such shares.
130
Table of Contents
MATERIAL UNITED STATES FEDERAL INCOME TAX CONSEQUENCES TO NON-U.S. HOLDERS
The following is a summary of the material U.S. federal income tax consequences to non-U.S. holders of the ownership and disposition of our common stock, but does not purport to be a complete analysis of all the potential tax considerations relating thereto. This summary is based upon the provisions of the U.S. Internal Revenue Code or the Code, U.S. Treasury Regulations promulgated thereunder, administrative rulings and judicial decisions, all as of the date hereof, all of which are subject to change, possibly with retroactive effect, which could result in U.S. federal income consequences different than those summarized below. We have not sought a ruling from the Internal Revenue Service, or IRS, with respect to the statements made and the conclusions reached in the following summary, and there can be no assurance that the IRS will agree with such statements and conclusions.
This summary does not address any tax considerations arising under the laws of any state, local or other jurisdiction, the potential application of the Medicare contribution tax or, except as provided below, any other federal tax considerations. This summary is limited to investors who will hold our common stock as a capital asset for tax purposes. This summary does not address all tax considerations that may be important to a particular investor in light of the investor’s circumstances or to certain categories of non-U.S. investors that may be subject to special rules, such as:
| • | banks, insurance companies or other financial institutions (except to the extent specifically set forth below); |
| • | tax-exempt organizations; |
| • | controlled foreign corporations, passive foreign investment companies and corporations that accumulate earnings to avoid U.S. federal income tax; |
| • | dealers in securities or currencies; |
| • | traders in securities that elect to use a mark-to-market method of accounting for their securities holdings; |
| • | persons that own, or are deemed to own, more than 5% of our capital stock (except to the extent specifically set forth below); |
| • | certain former citizens or long-term residents of the United States; |
| • | persons who hold our common stock as a position in a hedging transaction, “straddle,” “conversion transaction” or other risk reduction transaction; or |
| • | persons deemed to sell our common stock under the constructive sale provisions of the Internal Revenue Code. |
In addition, if a partnership (including any entity classified as a partnership for U.S. federal income tax purposes) holds our common stock, the tax treatment of a partner generally will depend on the status of the partner and upon the activities of the partnership. Accordingly, this discussion does not address tax considerations applicable to partnerships that hold our common stock and any such partnerships or partners in such partnerships should consult their tax advisors.
The following discussion of material U.S. federal income tax consequences to non-U.S. holders is for general information only. You are urged to consult your tax advisor with respect to the application of the U.S. federal income tax laws to your particular situation, as well as any tax consequences of the purchase, ownership and disposition of our common stock arising under other U.S. federal tax rules or under the laws of any state, local, non-U.S. or other taxing jurisdiction or under any applicable tax treaty.
131
Table of Contents
Non-U.S. Holder Defined
For purposes of this discussion, you are a non-U.S. holder if you are a beneficial owner of our common stock other than a (1) U.S. citizen or U.S. resident alien, (2) a corporation or other entity taxable as a corporation for U.S. federal income tax purposes, that was created or organized in or under the laws of the United States, any state thereof or the District of Columbia, (3) an estate whose income is subject to U.S. federal income taxation regardless of its source, (4) a trust that either is subject to the supervision of a court within the United States and has one or more U.S. persons with authority to control all of its substantial decisions, or has a valid election in effect under applicable U.S. Treasury Regulations to be treated as a United States person or (5) a partnership.
Distributions on Common Stock
If we make distributions on our common stock, these distributions generally will constitute dividends for U.S. tax purposes to the extent paid from our current or accumulated earnings and profits, as determined under U.S. federal income tax principles. To the extent these distributions exceed both our current and our accumulated earnings and profits, they will constitute a return of capital and will first reduce your basis in our common stock, but not below zero, and then will be treated as gain from the sale of stock. See “—Gains on Disposition of Common Stock.”
Any dividend paid to you generally will be subject to withholding either at a rate of 30% of the gross amount of the dividend or such lower rate as may be specified by an applicable income tax treaty. In order to receive a reduced treaty rate, you must provide us with an IRS Form W-8BEN or other applicable version of IRS Form W-8 certifying qualification for the reduced rate. If you are eligible for a reduced rate of withholding pursuant to an income tax treaty, you may obtain a refund of any excess amounts withheld by filing an appropriate claim for refund with the IRS. If you hold our common stock through a financial institution or other agent acting on your behalf, you will be required to provide appropriate documentation to the agent, which then will be required to provide certification to us or our paying agent, either directly or through other intermediaries.
Dividends received by you that are effectively connected with your conduct of a U.S. trade or business (and, if an income tax treaty applies, attributable to a permanent establishment maintained by you in the United States) are exempt from withholding. In order to claim this exemption, you must provide us with an IRS Form W-8ECI or other applicable version of IRS Form W-8 properly certifying exemption. Such effectively connected dividends, although not subject to withholding, are taxed at the same graduated U.S. federal income tax rates applicable to U.S. persons, net of certain deductions and credits. In addition, if you are a corporate non-U.S. holder, dividends you receive that are effectively connected with your conduct of a U.S. trade or business (and, if an income tax treaty applies, attributable to a permanent establishment maintained by you in the United States) may also be subject to a branch profits tax at a rate of 30% or such lower rate as may be specified by an applicable income tax treaty.
Gain on Disposition of Common Stock
Subject to the discussion below regarding recent legislative withholding developments, you generally will not be subject to U.S. federal income tax on any gain realized upon the sale or other disposition of our common stock unless:
| • | the gain is effectively connected with your conduct of a U.S. trade or business (and, if an income tax treaty applies, the gain is attributable to a permanent establishment maintained by you in the U.S.); |
| • | you are an individual who is present in the U.S. for a period or periods aggregating 183 days or more during the calendar year in which the sale or disposition occurs and certain other conditions are met; or |
| • | our common stock constitutes a U.S. real property interest by reason of our status as a “United States real property holding corporation,” or USRPHC, for U.S. federal income tax purposes at any time |
132
Table of Contents
within the shorter of the five-year period preceding the disposition and your holding period for our common stock. |
If you are described in the first bullet above, you will generally be required to pay tax on the net gain derived from the sale at the same graduated U.S. federal income tax rates applicable to U.S. persons (net of certain deductions and credits), and if you are a corporate non-U.S. holder, you may be subject to branch profits tax at a rate of 30% or such lower rate as may be specified by an applicable income tax treaty. If you are described in the second bullet above, you will be required to pay a flat 30% tax on the gain derived from the sale, which tax may be offset by U.S. source capital losses (even though you are not considered a resident of the United States).
We believe that we are not currently and will not become a USRPHC. However, because the determination of whether we are a USRPHC depends on the fair market value of our U.S. real property relative to the fair market value of our other business assets, there can be no assurance that we will not become a USRPHC in the future. Even if we become a USRPHC, however, as long as our common stock is regularly traded on an established securities market, our common stock will be treated as a U.S. real property interest only if you actually or constructively hold more than 5% of such regularly traded common stock at any time during the applicable period described above.
Federal Estate Tax
Our common stock beneficially owned by an individual who is not a citizen or resident of the United States (as defined for U.S. federal estate tax purposes) at the time of death generally will be includable in the decedent’s gross estate for U.S. federal estate tax purposes, unless an applicable estate tax treaty provides otherwise.
Backup Withholding and Information Reporting
Generally, we must report annually to the IRS the amount of dividends paid to you, your name and address, and the amount of tax withheld, if any. A similar report is sent to you. Pursuant to applicable income tax treaties or other agreements, the IRS may make these reports available to tax authorities in your country of residence.
Payments of dividends on or the gross proceeds of disposition of our common stock may be subject to additional information reporting and backup withholding at a current rate of 28% unless you establish an exemption, for example by properly certifying your non-U.S. status on a Form W-8BEN or other applicable version of IRS Form W-8. Notwithstanding the foregoing, backup withholding and information reporting may apply if either we or our paying agent has actual knowledge, or reason to know, that you are a U.S. person.
Backup withholding is not an additional tax. Any amounts withheld from a payment to you under the backup withholding rules will be allowed as a credit against your U.S. federal income tax liability and may entitle you to a refund, provided that the required information or returns are furnished to the IRS in a timely manner.
Foreign Accounts
A U.S. federal withholding tax of 30% may apply to dividends and the gross proceeds of a disposition of our common stock to a “foreign financial institution” (as specifically defined for this purpose) unless such institution enters into an agreement with the U.S. government to withhold on certain payments and to collect and provide to the U.S. tax authorities substantial information regarding U.S. account holders of such institution (which includes certain equity and debt holders of such institution, as well as certain account holders that are foreign entities with U.S. owners). The legislation also will generally impose a U.S. federal withholding tax of 30% on dividends and the gross proceeds of a disposition of our stock to a non-financial foreign entity unless such entity provides the withholding agent with either a certification that it does not have any substantial direct or indirect U.S. owners or
133
Table of Contents
provides information regarding direct and indirect U.S. owners of the entity. The withholding provisions described above generally apply to payments of dividends on our stock made on or after January 1, 2014 and to payments of gross proceeds from a sale or other disposition of such stock on or after January 1, 2017. Prospective investors are encouraged to consult with their own tax advisors regarding the possible implications of these withholding provisions on their investment in our common stock.
134
Table of Contents
Under the terms and subject to the conditions contained in an underwriting agreement dated the date of this prospectus, the underwriters named below, for whom Morgan Stanley & Co. LLC, Barclays Capital Inc., Merrill Lynch, Pierce, Fenner & Smith Incorporated and Citigroup Global Markets Inc. are acting as representatives, have severally agreed to purchase, and we and the selling stockholders have agreed to sell to them, severally, the number of shares indicated below:
Name | Number of Shares | |
Morgan Stanley & Co. LLC | ||
Barclays Capital Inc. | ||
Merrill Lynch, Pierce, Fenner & Smith Incorporated | ||
Citigroup Global Markets Inc. | ||
Oppenheimer & Co. Inc. | ||
| ||
Total | ||
|
The underwriters and the representatives are collectively referred to as the “underwriters” and the “representatives,” respectively. The underwriters are offering the shares of common stock subject to their acceptance of the shares from us and subject to prior sale. The underwriting agreement provides that the obligations of the several underwriters to pay for and accept delivery of the shares of common stock offered by this prospectus are subject to the approval of certain legal matters by their counsel and to certain other conditions. The underwriters are obligated to take and pay for all of the shares of common stock offered by this prospectus if any such shares are taken. However, the underwriters are not required to take or pay for the shares covered by the underwriters’ over-allotment option described below. If an underwriter defaults, the underwriting agreement provides that the purchase commitments of the non-defaulting underwriters may be increased.
The underwriters initially propose to offer part of the shares of common stock directly to the public at the initial public offering price listed on the cover page of this prospectus and part to certain dealers at a price that represents a concession not in excess of $ a share under the initial public offering price. Any underwriter may allow a concession not in excess of $ a share to other underwriters or to certain dealers. After the initial offering of the shares of common stock, the offering price and other selling terms may from time to time be varied by the representative. The offering of the shares by the underwriters is subject to receipt and acceptance and subject to the underwriters’ right to reject any order in whole or in part.
We and the selling stockholders have granted to the underwriters an option, exercisable for 30 days from the date of this prospectus, to purchase up to additional shares of common stock at the initial public offering price listed on the cover page of this prospectus, less underwriting discounts and commissions. To the extent the option is exercised, each underwriter will become obligated, subject to certain conditions, to purchase about the same percentage of the additional shares of common stock as the number listed next to the underwriter’s name in the preceding table bears to the total number of shares of common stock listed next to the names of all underwriters in the preceding table.
135
Table of Contents
The following table shows the per share and total public offering price, underwriting discounts and commissions, and proceeds before expenses to us and the selling stockholders. These amounts are shown assuming both no exercise and full exercise of the underwriters’ option to purchase up to an additional shares of our common stock.
| Total | ||||||||||||
| Per Share | No Exercise | Full Exercise | ||||||||||
Public offering price | $ | $ | $ | |||||||||
Underwriting discounts and commissions paid by: | ||||||||||||
Us | ||||||||||||
The selling stockholders | ||||||||||||
Proceeds, before expenses, to us | ||||||||||||
Proceeds, before expenses, to selling stockholders | ||||||||||||
The estimated offering expenses payable by us, exclusive of the underwriting discounts and commissions, are approximately $ million, which includes legal, accounting and printing costs and various other fees associated with the registration and listing of our common stock.
The underwriters have informed us that they do not intend sales to discretionary accounts to exceed 5% of the total number of shares of common stock offered by them.
We intend to apply to have our common stock quoted on under the trading symbol “ .”
We, all of our directors and officers and the selling stockholders have agreed with the representatives that we and they will not, duringthe 180-day period following the date of this prospectus:
| • | offer, pledge, sell, contract to sell, sell any option or contract to purchase, purchase any option or contract to sell, grant any option, right or warrant to purchase lend or otherwise transfer or dispose of, directly or indirectly, any shares of common stock or other securities convertible into or exercisable or exchangeable for common stock; or |
| • | enter into any swap or other arrangement that transfers to another, in whole or in part, any of the economic consequences of ownership of the common stock, whether any such transaction described in these first two bullets is to be settled by delivery of common stock or such other securities, in cash or otherwise; or |
| • | in our case, file any registration statement with the SEC relating to the offering of any shares of common stock or any securities convertible into or exercisable or exchangeable for common stock. |
Morgan Stanley & Co. LLC and Barclays Capital Inc. may, in their sole discretion, release the common stock and other securities subject to the lock-up agreements described above, in whole or in part, at any time with or without notice. The restrictions described in the immediately preceding paragraph shall not apply to:
| • | the sale of shares of common stock pursuant to the underwriting agreement; |
| • | transactions by a security holder relating to shares of common stock or other securities acquired in open market transactions after completion of this offering, provided that no filing under Section 16(a) of the Exchange Act is required or voluntarily made in connection with subsequent sales of common stock or other securities acquired in such open market transactions; |
| • | the transfer by a security holder of shares of common stock or any securities convertible into or exercisable or exchangeable for common stock to (i) an immediate family member of a security holder or to a trust formed for the benefit of the security holder or immediate family member, (ii) by bona fide gift, will or intestacy, (iii) if the security holder is a corporation, partnership, limited liability company or other business entity (A) to another corporation, partnership, limited liability company or other |
136
Table of Contents
business entity that controls, is controlled by or is under common control with the security holder or (B) as part of a disposition, transfer or distribution by the security holder to its equity holders or (iv) if the security holder is a trust, to a trustor or beneficiary of the trust; provided that in the case, the transferee, donee or distributee shall sign and deliver a lock up agreement prior to or upon such transfer or distribution, and no filing under Section 16(a) of the Exchange Act, reporting a reduction of beneficial ownership of shares of Common Stock, shall be required or shall be voluntarily made during the 180-day restricted period; or |
| • | the receipt by a security holder from us of shares of common stock upon the exercise of options, or the transfer by a security holder of shares of common stock or any securities convertible into common stock to us upon a vesting event of our securities or upon the exercise of options or warrants to purchase our securities on a “cashless” or “net exercise” basis to cover tax withholding obligations of such security holder in connection with such vesting or exercise, provided that such shares of common stock received upon exercise of options or warrants remain subject to the restrictions set forth above and in the case of any transfer pursuant to such vesting event or exercise, any filing under Section 16(a) of the Exchange Act that shall be required to be made in connection with such transfer shall state that the purpose of such transfer was to cover tax withholding obligations of the security holder in connection with such vesting or exercise. |
| • | the transfer by a security holder of shares of common stock or any security convertible into or exercisable or exchangeable for common stock to us pursuant to agreements in effect on the date of this prospectus under which we have the option to repurchase such shares or securities or a right of first refusal with respect to transfers of such shares or securities, provided that no filing under Section 16(a) of the Exchange Act, reporting a reduction of beneficial ownership of shares of Common Stock, shall be required or shall be voluntarily made during the 180-day restricted period; |
| • | the establishment of a trading plan pursuant to Rule 10b5-1 under the Exchange Act for the transfer of shares of common stock, provided that (i) such plan does not provide for the transfer of common stock during the 180-day restricted period and (ii) to the extent a public announcement or filing under the Exchange Act, if any, is required of or voluntarily made by or on behalf of a security holder or us regarding the establishment of such plan, such announcement or filing shall include a statement to the effect that no transfer of common stock may be made under such plan during the 180-day restricted period; |
| • | the establishment of a trading plan pursuant to Rule 10b5-1 under the Exchange Act for the transfer of shares of common stock, provided that such plan does not provide for the transfer of common stock during the 180-day restricted period and that no public filing or other public announcement of such plan by us or such holders regarding the establishment of such plan is not required to be, or voluntarily made by or on behalf of, the security holder or us; and |
| • | the conversion of our outstanding redeemable convertible preferred stock into shares of common stock, providedthat such shares of common stock remain subject to restrictions set forth above. |
In order to facilitate our initial public offering of common stock, the underwriters may engage in transactions that stabilize, maintain or otherwise affect the price of common stock. Specifically, the underwriters may sell more shares than they are obligated to purchase under the underwriting agreement, creating a short position. A short sale is covered if the short position is no greater than the number of shares available for purchase by the underwriters under the over-allotment option. The underwriters can close out a covered short sale by exercising the over-allotment option or purchasing shares in the open market. In determining the source of shares to close out a covered short sale, the underwriters will consider, among other things, the open market price of shares compared to the price available under the underwriters’ over-allotment option. The underwriters may also sell shares in excess of the over-allotment option, creating a naked short position. The underwriters must close out any naked short position by purchasing shares in the open market. A naked short position is more likely to be created if the underwriters are concerned that there may be downward pressure on the price of the common
137
Table of Contents
stock in the open market after pricing that could adversely affect investors who purchase in our initial public offering. In addition, to stabilize the price of common stock, the underwriters may bid for, and purchase, shares of common stock in the open market. The underwriting syndicate also may reclaim selling concessions allowed to an underwriter or a dealer for distributing common stock in the offering, if the syndicate repurchases previously distributed common stock to cover syndicate short positions or to stabilize the price of common stock. These activities may raise or maintain the market price of common stock above independent market levels or prevent or retard a decline in the market price of the common stock. The underwriters are not required to engage in these activities and may end any of these activities at any time. The underwriters may also impose a penalty bid. This occurs when a particular underwriter repays to the underwriters a portion of the underwriting discount received by it because the representatives have repurchased shares sold by or for the account of such underwriter in stabilizing or short covering transactions.
We, the selling stockholders and the several underwriters have agreed to indemnify each other against certain liabilities, including liabilities under the Securities Act.
A prospectus in electronic format may be made available on websites maintained by one or more underwriters, or selling group members, if any, participating in our initial public offering. The representatives may agree to allocate a number of shares of common stock to underwriters for sale to their online brokerage account holders. Internet distributions will be allocated by the representatives to underwriters that may make Internet distributions on the same basis as other allocations.
The underwriters and their respective affiliates are full service financial institutions engaged in various activities, which may include securities trading, commercial and investment banking, financial advisory, investment management, principal investment, hedging, financing and brokerage activities. Certain of the underwriters and their respective affiliates have, from time to time, performed, and may in the future perform, various financial advisory and investment banking services for us, for which they received or will receive customary fees and expenses.
In the ordinary course of their various business activities, the underwriters and their respective affiliates may make or hold a broad array of investments and actively trade debt and equity securities (or related derivative securities) and financial instruments (including bank loans) for their own account and for the accounts of their customers and may at any time hold long and short positions in such securities and instruments. Such investment and securities activities may involve our securities and instruments (directly, as collateral securing other obligations or otherwise). The underwriters and their respective affiliates may also make investment recommendations and/or publish or express independent research views in respect of such securities or instruments and may at any time hold, or recommend to clients that they acquire, long and/or short positions in such securities and instruments.
In the ordinary course of business, we have sold, and may in the future sell, products or services to one or more of the underwriters or their respective affiliates in arms-length transactions on market competitive terms.
In connection with our Series C redeemable convertible preferred stock financing in April 2013, Morgan Stanley Expansion Capital LP and MS Expansion Co-Investment Vehicle LP., affiliates of Morgan Stanley & Co. LLC, purchased an aggregate of 2,436,054 shares of our Series C redeemable convertible preferred stock at a purchase price of $4.105 per share.
Pricing of the Offering
Prior to our initial public offering, there has been no public market for our common stock. The initial public offering price will be determined by negotiations between us, the selling stockholders and the representatives of the underwriters. Among the factors considered in determining the initial public offering price were our future prospects and those of our industry in general, our sales, earnings and certain other financial and operating
138
Table of Contents
information in recent periods, and the price-earnings ratios, price-sales ratios, market prices of securities, and certain financial and operating information of companies engaged in activities similar to ours. The estimated initial public offering price range set forth on the cover page of this preliminary prospectus is subject to change as a result of market conditions and other factors. Neither we nor the underwriters can assure investors that an active trading market for the shares will develop, or that after the offering the shares will trade in the public market at or above the initial public offering price.
Selling Restrictions
European Economic Area
In relation to each Member State of the European Economic Area which has implemented the Prospectus Directive, each underwriter has represented and agreed that with effect from and including the date on which the Prospectus Directive is implemented in that Member State it has not made and will not make an offer of securities to the public in that Member State, except that it may, with effect from and including such date, make an offer of securities to the public in that Member State:
| • | at any time to legal entities which are authorized or regulated to operate in the financial markets or, if not so authorized or regulated, whose corporate purpose is solely to invest in securities; |
| • | at any time to any legal entity which has two or more of (i) an average of at least 250 employees during the last financial year; (ii) a total balance sheet of more than €43,000,000 and (iii) an annual net turnover of more than €50,000,000, as shown in its last annual or consolidated accounts; or |
| • | at any time in any other circumstances which do not require the publication by us of a prospectus pursuant to Article 3 of the Prospectus Directive. |
For the purposes of the above, the expression an “offer of securities to the public” in relation to any securities in any Member State means the communication in any form and by any means of sufficient information on the terms of the offer and the securities to be offered so as to enable an investor to decide to purchase or subscribe for the securities, as the same may be varied in that Member State by any measure implementing the Prospectus Directive in that Member State, and the expression Prospectus Directive means Directive 2003/71/EC and includes any relevant implementing measure in that Member State.
United Kingdom
This prospectus and any other material in relation to the shares described herein is only being distributed to, and is only directed at, persons in the United Kingdom that are qualified investors within the meaning of Article 2(1)(e) of the Prospective Directive (“qualified investors”) that also (i) have professional experience in matters relating to investments falling within Article 19(5) of the Financial Services and Markets Act 2000 (Financial Promotion) Order 2005, as amended, or the Order, (ii) who fall within Article 49(2)(a) to (d) of the Order or (iii) to whom it may otherwise lawfully be communicated (all such persons together being referred to as “relevant persons”). The shares are only available to, and any invitation, offer or agreement to purchase or otherwise acquire such shares will be engaged in only with, relevant persons. This prospectus and its contents are confidential and should not be distributed, published or reproduced (in whole or in part) or disclosed by recipients to any other person in the United Kingdom. Any person in the United Kingdom that is not a relevant person should not act or rely on this prospectus or any of its contents.
Hong Kong
The shares may not be offered or sold by means of any document other than (i) in circumstances which do not constitute an offer to the public within the meaning of the Companies Ordinance (Cap.32, Laws of Hong Kong), or (ii) to “professional investors” within the meaning of the Securities and Futures Ordinance (Cap.571, Laws of Hong Kong) and any rules made thereunder, or (iii) in other circumstances which do not result in the
139
Table of Contents
document being a “prospectus” within the meaning of the Companies Ordinance (Cap.32, Laws of Hong Kong), and no advertisement, invitation or document relating to the shares may be issued or may be in the possession of any person for the purpose of issue (in each case whether in Hong Kong or elsewhere), which is directed at, or the contents of which are likely to be accessed or read by, the public in Hong Kong (except if permitted to do so under the laws of Hong Kong) other than with respect to shares which are or are intended to be disposed of only to persons outside Hong Kong or only to “professional investors” within the meaning of the Securities and Futures Ordinance (Cap.571 Laws of Hong Kong) and any rules made thereunder.
Singapore
This prospectus has not been registered as a prospectus with the Monetary Authority of Singapore. Accordingly, this prospectus and any other document or material in connection with the offer or sale, or invitation for subscription or purchase, of the shares may not be circulated or distributed, nor may the shares be offered or sold, or be made the subject of an invitation for subscription or purchase, whether directly or indirectly, to persons in Singapore other than (i) to an institutional investor under Section 274 of the Securities and Futures Act, Chapter 289 of Singapore (SFA), (ii) to a relevant person, or any person pursuant to Section 275(1A), and in accordance with the conditions, specified in Section 275 of the SFA or (iii) otherwise pursuant to, and in accordance with the conditions of, any other applicable provision of the SFA.
Where the shares are subscribed or purchased under Section 275 by a relevant person which is: (a) a corporation (which is not an accredited investor) the sole business of which is to hold investments and the entire share capital of which is owned by one or more individuals, each of whom is an accredited investor; or (b) a trust (where the trustee is not an accredited investor) whose sole purpose is to hold investments and each beneficiary is an accredited investor, shares, debentures and units of shares and debentures of that corporation or the beneficiaries’ rights and interest in that trust shall not be transferable for six months after that corporation or that trust has acquired the shares under Section 275 except: (i) to an institutional investor under Section 274 of the SFA or to a relevant person, or any person pursuant to Section 275(1A), and in accordance with the conditions, specified in Section 275 of the SFA; (ii) where no consideration is given for the transfer; or (iii) by operation of law.
Japan
The securities have not been and will not be registered under the Financial Instruments and Exchange Law of Japan (the Financial Instruments and Exchange Law) and each underwriter has agreed that it will not offer or sell any securities, directly or indirectly, in Japan or to, or for the benefit of, any resident of Japan (which term as used herein means any person resident in Japan, including any corporation or other entity organized under the laws of Japan), or to others for re-offering or resale, directly or indirectly, in Japan or to a resident of Japan, except pursuant to an exemption from the registration requirements of, and otherwise in compliance with, the Financial Instruments and Exchange Law and any other applicable laws, regulations and ministerial guidelines of Japan.
Notice to Prospective Investors in Switzerland
The shares may not be publicly offered in Switzerland and will not be listed on the SIX Swiss Exchange (SIX) or on any other stock exchange or regulated trading facility in Switzerland. This document has been prepared without regard to the disclosure standards for issuance prospectuses under art. 652a or art. 1156 of the Swiss Code of Obligations or the disclosure standards for listing prospectuses under art. 27 ff. of the SIX Listing Rules or the listing rules of any other stock exchange or regulated trading facility in Switzerland. Neither this document nor any other offering or marketing material relating to the shares or the offering may be publicly distributed or otherwise made publicly available in Switzerland.
Neither this document nor any other offering or marketing material relating to the offering, the company, or the shares have been or will be filed with or approved by any Swiss regulatory authority. In particular, this
140
Table of Contents
document will not be filed with, and the offer of shares will not be supervised by, the Swiss Financial Market Supervisory Authority FINMA (FINMA), and the offer of shares has not been and will not be authorized under the Swiss Federal Act on Collective Investment Schemes (CISA). The investor protection afforded to acquirers of interests in collective investment schemes under the CISA does not extend to acquirers of the shares.
Notice to Prospective Investors in the Dubai International Financial Centre
This prospectus relates to an Exempt Offer in accordance with the Offered Securities Rules of the Dubai Financial Services Authority (DFSA). This prospectus is intended for distribution only to persons of a type specified in the Offered Securities Rules of the DFSA. It must not be delivered to, or relied on by, any other person. The DFSA has no responsibility for reviewing or verifying any documents in connection with Exempt Offers. The DFSA has not approved this prospectus nor taken steps to verify the information set forth herein and has no responsibility for the prospectus. The shares to which this prospectus relates may be illiquid and/or subject to restrictions on their resale. Prospective purchasers of the shares offered should conduct their own due diligence on the shares. If you do not understand the contents of this prospectus you should consult an authorized financial advisor.
141
Table of Contents
The validity of the shares of common stock offered hereby will be passed upon for us by Wilson Sonsini Goodrich & Rosati, P.C., Palo Alto, California. Fenwick & West LLP, Mountain View, California, is acting as counsel to the underwriters.
The consolidated financial statements as of December 31, 2011 and 2012 and for each of the three years in the period ended December 31, 2012 included in this prospectus have been so included in reliance on the report of PricewaterhouseCoopers LLP, an independent registered public accounting firm, given on the authority of said firm as experts in auditing and accounting.
WHERE YOU CAN FIND ADDITIONAL INFORMATION
We have filed with the SEC a registration statement on Form S-1 under the Securities Act with respect to the shares of common stock offered by this prospectus. This prospectus, which constitutes a part of the registration statement, does not contain all of the information set forth in the registration statement, some of which is contained in exhibits to the registration statement as permitted by the rules and regulations of the SEC. For further information with respect to us and our common stock, we refer you to the registration statement, including the exhibits filed as a part of the registration statement. Statements contained in this prospectus concerning the contents of any contract or any other document is not necessarily complete. If a contract or document has been filed as an exhibit to the registration statement, please see the copy of the contract or document that has been filed. Each statement in this prospectus relating to a contract or document filed as an exhibit is qualified in all respects by the filed exhibit. You may obtain copies of this information by mail from the Public Reference Section of the SEC, 100 F Street, N.E., Room 1580, Washington, D.C. 20549, at prescribed rates. You may obtain information on the operation of the public reference rooms by calling the SEC at 1-800-SEC-0330. The SEC also maintains an Internet website that contains reports, proxy statements, and other information about issuers, like us, that file electronically with the SEC. The address of that website is www.sec.gov.
As a result of this offering, we will become subject to the information and reporting requirements of the Securities Exchange Act of 1934 and, in accordance with this law, will file periodic reports, proxy statements, and other information with the SEC. These periodic reports, proxy statements, and other information will be available for inspection and copying at the SEC’s public reference facilities and the website of the SEC referred to above. We also maintain a website at www.good.com. Upon completion of this offering, you may access these materials free of charge as soon as reasonably practicable after they are electronically filed with, or furnished to, the SEC. Information contained on our website is not a part of this prospectus and the inclusion of our website address in this prospectus is an inactive textual reference only.
142
Table of Contents
INDEX TO CONSOLIDATED FINANCIAL STATEMENTS
| Page | ||||
| F-2 | ||||
| F-3 | ||||
| F-4 | ||||
Consolidated Statements of Redeemable Convertible Preferred Stock and of Deficit | F-5 | |||
| F-6 | ||||
| F-7 | ||||
F-1
Table of Contents
REPORT OF INDEPENDENT REGISTERED PUBLIC ACCOUNTING FIRM
To the Board of Directors and Stockholders of
Good Technology Corporation
In our opinion, the accompanying consolidated balance sheets and the related consolidated statements of operations, consolidated statements of redeemable convertible preferred stock and of deficit and consolidated statements of cash flows present fairly, in all material respects, the financial position of Good Technology Corporation and its subsidiaries (the “Company”) at December 31, 2011 and December 31, 2012, and the results of their operations and their cash flows for each of the three years in the period ended December 31, 2012 in conformity with accounting principles generally accepted in the United States of America. These financial statements are the responsibility of the Company’s management. Our responsibility is to express an opinion on these financial statements based on our audits. We conducted our audits of these statements in accordance with the standards of the Public Company Accounting Oversight Board (United States). Those standards require that we plan and perform the audit to obtain reasonable assurance about whether the financial statements are free of material misstatement. An audit includes examining, on a test basis, evidence supporting the amounts and disclosures in the consolidated financial statements, assessing the accounting principles used and significant estimates made by management, and evaluating the overall financial statement presentation. We believe that our audits provide a reasonable basis for our opinion.
/s/ PricewaterhouseCoopers LLP
San Jose, California
April 26, 2013
F-2
Table of Contents
Consolidated Balance Sheets
(In thousands, except per share data)
| December 31, 2011 | December 31, 2012 | Pro forma deficit as of December 31, 2012 | ||||||||||
| (unaudited) | ||||||||||||
ASSETS | ||||||||||||
CURRENT ASSETS: | ||||||||||||
Cash and cash equivalents | $ | 40,544 | $ | 29,466 | ||||||||
Accounts receivable, net | 31,481 | 47,376 | ||||||||||
Restricted cash | 1,383 | 610 | ||||||||||
Deferred commissions, current portion | 2,345 | 4,347 | ||||||||||
Prepaid expenses and other current assets | 6,479 | 9,650 | ||||||||||
|
|
|
| |||||||||
Total current assets | 82,232 | 91,449 | ||||||||||
NON-CURRENT ASSETS: | ||||||||||||
Property and equipment, net | 12,197 | 17,718 | ||||||||||
Deferred commissions, net of current portion | 10,289 | 15,594 | ||||||||||
Intangible assets, net | 3,663 | 23,419 | ||||||||||
Goodwill | 39,912 | 66,156 | ||||||||||
Other assets | 1,571 | 396 | ||||||||||
|
|
|
| |||||||||
Total non-current assets | 67,632 | 123,283 | ||||||||||
|
|
|
| |||||||||
TOTAL ASSETS | $ | 149,864 | $ | 214,732 | ||||||||
|
|
|
| |||||||||
LIABILITIES, REDEEMABLE CONVERTIBLE PREFERRED STOCK AND DEFICIT | ||||||||||||
CURRENT LIABILITIES: | ||||||||||||
Accounts payable | $ | 8,922 | $ | 14,702 | ||||||||
Accrued compensation and related benefits | 10,100 | 18,463 | ||||||||||
Income taxes payable, current portion | 287 | 398 | ||||||||||
Notes payable, current portion | 4,433 | 6,971 | ||||||||||
Capital lease obligations, current portion | 1,190 | 827 | ||||||||||
Deferred revenues, current portion | 63,636 | 86,990 | ||||||||||
Accrued and other current liabilities | 7,573 | 6,506 | ||||||||||
|
|
|
| |||||||||
Total current liabilities | 96,141 | 134,857 | ||||||||||
NON-CURRENT LIABILITIES: | ||||||||||||
Notes payable, net of current portion | 7,668 | 8,196 | ||||||||||
Capital lease obligation, net of current portion | 827 | — | ||||||||||
Deferred revenues, net of current portion | 232,772 | 289,601 | ||||||||||
Income taxes payable, net of current portion | 4,199 | 4,352 | ||||||||||
Other non-current liabilities | 3,060 | 4,437 | ||||||||||
|
|
|
| |||||||||
Total non-current liabilities | 248,526 | 306,586 | ||||||||||
|
|
|
| |||||||||
TOTAL LIABILITIES | 344,667 | 441,443 | ||||||||||
|
|
|
| |||||||||
Commitments and contingencies (Note 7) | ||||||||||||
Redeemable convertible preferred stock, par value of $0.0001 per share: | ||||||||||||
173,500 and 179,750 shares authorized, 107,074 and 114,371 shares issued and outstanding as of December 31, 2011 and 2012, respectively (liquidation preference of $138,519 as of December 31, 2012) actual; no shares issued and outstanding pro forma (unaudited) | 88,522 | 121,228 | $ | — | ||||||||
DEFICIT: | ||||||||||||
Common stock, par value $0.0001 per share, 328,500 shares authorized as of December 31, 2011 and 2012; 23,537 and 44,772 shares issued and outstanding as of December 31, 2011 and 2012, respectively, actual; 159,143 shares issued and outstanding pro forma (unaudited) | 2 | 4 | 16 | |||||||||
Additional paid-in capital | 117,125 | 142,946 | 264,162 | |||||||||
Accumulated deficit | (399,876 | ) | (490,339 | ) | (490,339 | ) | ||||||
|
|
|
|
|
| |||||||
Total Good Technology Corporation stockholders’ deficit | (282,749 | ) | (347,389 | ) | (226,161 | ) | ||||||
Noncontrolling interest | (576 | ) | (550 | ) | (550 | ) | ||||||
|
|
|
|
|
| |||||||
Total deficit | (283,325 | ) | (347,939 | ) | $ | (226,711 | ) | |||||
|
|
|
|
|
| |||||||
TOTAL LIABILITIES, REDEEMABLE CONVERTIBLE PREFERRED STOCK AND DEFICIT | $ | 149,864 | $ | 214,732 | ||||||||
|
|
|
| |||||||||
The accompanying notes are an integral part of these consolidated financial statements.
F-3
Table of Contents
Consolidated Statements of Operations
(In thousands, except per share data)
| Years Ended December 31, | ||||||||||||
| 2010 | 2011 | 2012 | ||||||||||
Revenues: | ||||||||||||
Software and services | $ | 40,002 | $ | 58,125 | $ | 93,528 | ||||||
Intellectual property licensing | 25,600 | 27,221 | 23,077 | |||||||||
|
|
|
|
|
| |||||||
Total revenues | 65,602 | 85,346 | 116,605 | |||||||||
Cost of revenues | 15,318 | 19,853 | 32,016 | |||||||||
|
|
|
|
|
| |||||||
Gross profit | 50,284 | 65,493 | 84,589 | |||||||||
|
|
|
|
|
| |||||||
Operating expenses: | ||||||||||||
Research and development | 27,079 | 28,854 | 45,601 | |||||||||
Sales and marketing | 37,308 | 47,440 | 93,980 | |||||||||
General and administrative | 19,713 | 24,485 | 34,374 | |||||||||
|
|
|
|
|
| |||||||
Total operating expenses | 84,100 | 100,779 | 173,955 | |||||||||
|
|
|
|
|
| |||||||
Loss from operations | (33,816 | ) | (35,286 | ) | (89,366 | ) | ||||||
Other income (expense), net | 51 | (752 | ) | (602 | ) | |||||||
Interest expense | (441 | ) | (574 | ) | (926 | ) | ||||||
|
|
|
|
|
| |||||||
Loss before benefit from (provision for) income taxes | (34,206 | ) | (36,612 | ) | (90,894 | ) | ||||||
Benefit from (provision for) income taxes | (6,223 | ) | (4,379 | ) | 457 | |||||||
|
|
|
|
|
| |||||||
Net loss | (40,429 | ) | (40,991 | ) | (90,437 | ) | ||||||
(Income) loss attributable to noncontrolling interest | 572 | (214 | ) | (26 | ) | |||||||
|
|
|
|
|
| |||||||
Net loss attributable to Good Technology Corporation common stockholders | $ | (39,857 | ) | $ | (41,205 | ) | $ | (90,463 | ) | |||
|
|
|
|
|
| |||||||
Net loss per share attributable to Good Technology Corporation common stockholders, basic and diluted | $ | (5.90 | ) | $ | (2.11 | ) | $ | (2.75 | ) | |||
|
|
|
|
|
| |||||||
Weighted average shares used in computing net loss per share attributable to Good Technology Corporation common stockholders, basic and diluted | 6,761 | 19,518 | 32,915 | |||||||||
|
|
|
|
|
| |||||||
Pro forma net loss per share attributable to Good Technology Corporation common stockholders, basic and diluted (unaudited) | $ | (0.63 | ) | |||||||||
|
| |||||||||||
Weighted average shares used in computing pro forma net loss per share attributable to Good Technology Corporation common stockholders, basic and diluted (unaudited) | 142,521 | |||||||||||
|
| |||||||||||
The accompanying notes are an integral part of these consolidated financial statements.
F-4
Table of Contents
Consolidated Statements of Redeemable Convertible Preferred Stock and Deficit
(In thousands)
| Redeemable Convertible Preferred Stock | Common Stock | Additional Paid-in Capital | Accumulated Deficit | Total Good Technology Corporation Stockholders’ Deficit | Noncontrolling Interest | Total Deficit | ||||||||||||||||||||||||||||||||
| Shares | Amount | Shares | Amount | |||||||||||||||||||||||||||||||||||
Balances as of December 31, 2009 | 107,074 | $ | 88,522 | 5,329 | $ | 1 | $ | 104,765 | $ | (318,814 | ) | $ | (214,048 | ) | $ | (218 | ) | $ | (214,266 | ) | ||||||||||||||||||
Issuance of common stock for Cloudsync acquisition | — | — | 1,000 | — | 620 | — | 620 | — | 620 | |||||||||||||||||||||||||||||
Stock-based compensation | — | — | — | — | 2,580 | — | 2,580 | — | 2,580 | |||||||||||||||||||||||||||||
Exercise of stock options | — | — | 2,856 | — | 380 | — | 380 | — | 380 | |||||||||||||||||||||||||||||
Net loss | — | — | — | — | — | (39,857 | ) | (39,857 | ) | (572 | ) | (40,429 | ) | |||||||||||||||||||||||||
|
|
|
|
|
|
|
|
|
|
|
|
|
|
|
|
|
| |||||||||||||||||||||
Balances as of December 31, 2010 | 107,074 | 88,522 | 9,185 | 1 | 108,345 | (358,671 | ) | (250,325 | ) | (790 | ) | (251,115 | ) | |||||||||||||||||||||||||
Issuance of common stock warrants to customer | — | — | — | — | 1,607 | — | 1,607 | — | 1,607 | |||||||||||||||||||||||||||||
Stock-based compensation | — | — | — | — | 4,471 | — | 4,471 | — | 4,471 | |||||||||||||||||||||||||||||
Exercise of stock options | — | — | 14,352 | 1 | 2,702 | — | 2,703 | — | 2,703 | |||||||||||||||||||||||||||||
Net loss | — | — | — | — | — | (41,205 | ) | (41,205 | ) | 214 | (40,991 | ) | ||||||||||||||||||||||||||
|
|
|
|
|
|
|
|
|
|
|
|
|
|
|
|
|
| |||||||||||||||||||||
Balances as of December 31, 2011 | 107,074 | 88,522 | 23,537 | 2 | 117,125 | (399,876 | ) | (282,749 | ) | (576 | ) | (283,325 | ) | |||||||||||||||||||||||||
Exercise of Series B-1 redeemable convertible preferred stock warrants | 1,085 | 2,714 | — | — | — | — | — | — | — | |||||||||||||||||||||||||||||
Issuance of Series B-2 redeemable convertible preferred stock for Copiun acquisition | 3,649 | 17,662 | — | — | — | — | — | — | — | |||||||||||||||||||||||||||||
Issuance of Series B-3 redeemable convertible preferred stock for AppCentral acquisition | 2,563 | 12,330 | — | — | — | — | — | — | — | |||||||||||||||||||||||||||||
Issuance of common stock and stock options for Copiun acquisition | — | — | 1,378 | — | 7,126 | — | 7,126 | — | 7,126 | |||||||||||||||||||||||||||||
Issuance of common stock and stock options for AppCentral acquisition | — | — | 960 | — | 6,349 | — | 6,349 | — | 6,349 | |||||||||||||||||||||||||||||
Issuance of restricted common stock | — | — | 348 | — | — | — | — | — | — | |||||||||||||||||||||||||||||
Stock-based compensation | — | — | — | — | 9,201 | — | 9,201 | — | 9,201 | |||||||||||||||||||||||||||||
Exercise of stock options | — | — | 18,549 | 2 | 3,096 | — | 3,098 | — | 3,098 | |||||||||||||||||||||||||||||
Vesting of early exercised stock options | — | — | — | — | 49 | — | 49 | — | 49 | |||||||||||||||||||||||||||||
Net loss | — | — | — | — | — | (90,463 | ) | (90,463 | ) | 26 | (90,437 | ) | ||||||||||||||||||||||||||
|
|
|
|
|
|
|
|
|
|
|
|
|
|
|
|
|
| |||||||||||||||||||||
Balances as of December 31, 2012 | 114,371 | $ | 121,228 | 44,772 | $ | 4 | $ | 142,946 | $ | (490,339 | ) | $ | (347,389 | ) | $ | (550 | ) | $ | (347,939 | ) | ||||||||||||||||||
|
|
|
|
|
|
|
|
|
|
|
|
|
|
|
|
|
| |||||||||||||||||||||
The accompanying notes are an integral part of these consolidated financial statements.
F-5
Table of Contents
Consolidated Statements of Cash Flows
(In thousands)
| Years Ended December 31, | ||||||||||||
| 2010 | 2011 | 2012 | ||||||||||
CASH FLOWS FROM OPERATING ACTIVITIES: | ||||||||||||
Net loss | $ | (40,429 | ) | $ | (40,991 | ) | $ | (90,437 | ) | |||
Adjustments to reconcile net loss to net cash provided by (used in) operating activities: | ||||||||||||
Stock-based compensation | 2,580 | 4,471 | 9,201 | |||||||||
Non-cash expenses related to warrant issued to customer | — | 1,607 | — | |||||||||
Depreciation and amortization | 3,574 | 3,423 | 7,769 | |||||||||
Gain on sale of patents | — | — | (353 | ) | ||||||||
Impairment of intangible assets | 514 | — | — | |||||||||
Foreign currency (gain) loss | 106 | 248 | (336 | ) | ||||||||
Deferred income taxes | (320 | ) | (482 | ) | (3,421 | ) | ||||||
Provision for (recovery of) bad debts | 10 | (3 | ) | 140 | ||||||||
Remeasurement of fair value of warrant liability | (43 | ) | 471 | 637 | ||||||||
(Gain) loss on disposal of property and equipment | — | 121 | (160 | ) | ||||||||
Changes in operating assets and liabilities: | ||||||||||||
Accounts receivable | (9,598 | ) | (14,539 | ) | (15,444 | ) | ||||||
Deferred commissions | (4,143 | ) | (8,491 | ) | (7,307 | ) | ||||||
Prepaid expenses and other current assets | (251 | ) | (974 | ) | (1,108 | ) | ||||||
Other assets | 231 | 57 | 101 | |||||||||
Income taxes payable | 4,618 | (3,124 | ) | 264 | ||||||||
Accounts payable and other liabilities | 2,103 | 6,865 | 11,379 | |||||||||
Deferred revenues | 18,715 | 60,370 | 80,016 | |||||||||
|
|
|
|
|
| |||||||
Net cash provided by (used in) operating activities | (22,333 | ) | 9,029 | (9,059 | ) | |||||||
|
|
|
|
|
| |||||||
CASH FLOWS FROM INVESTING ACTIVITIES: | ||||||||||||
Acquisitions, net of cash acquired | (1,459 | ) | — | 826 | ||||||||
Decrease in restricted cash | 776 | 4,825 | 773 | |||||||||
Purchase of property and equipment | (2,844 | ) | (8,954 | ) | (10,435 | ) | ||||||
Proceeds from sale of patents | — | — | 353 | |||||||||
Proceeds from sale of property and equipment | — | — | 541 | |||||||||
|
|
|
|
|
| |||||||
Net cash used in investing activities | (3,527 | ) | (4,129 | ) | (7,942 | ) | ||||||
|
|
|
|
|
| |||||||
CASH FLOWS FROM FINANCING ACTIVITIES: | ||||||||||||
Proceeds from issuance of common stock | 380 | 2,703 | 3,147 | |||||||||
Proceeds from issuance of preferred stock | — | — | 1,085 | |||||||||
Principal payments on capital leases | (983 | ) | (1,148 | ) | (1,190 | ) | ||||||
Borrowings on notes payable | — | 13,965 | 8,342 | |||||||||
Payments on notes payable | — | (4,129 | ) | (5,486 | ) | |||||||
Proceeds from sale and leaseback transactions | 689 | — | — | |||||||||
|
|
|
|
|
| |||||||
Net cash provided by financing activities | 86 | 11,391 | 5,898 | |||||||||
|
|
|
|
|
| |||||||
EFFECT OF EXCHANGE RATE CHANGES ON CASH AND CASH EQUIVALENTS | (465 | ) | 168 | 25 | ||||||||
NET INCREASE (DECREASE) IN CASH AND CASH EQUIVALENTS | (26,239 | ) | 16,459 | (11,078 | ) | |||||||
CASH AND CASH EQUIVALENTS — Beginning of period | 50,324 | 24,085 | 40,544 | |||||||||
|
|
|
|
|
| |||||||
CASH AND CASH EQUIVALENTS — End of period | $ | 24,085 | $ | 40,544 | $ | 29,466 | ||||||
|
|
|
|
|
| |||||||
SUPPLEMENTAL DISCLOSURES OF CASH FLOW INFORMATION: | ||||||||||||
Cash paid for interest | $ | 441 | $ | 468 | $ | 788 | ||||||
|
|
|
|
|
| |||||||
Cash paid for income taxes | $ | 1,630 | $ | 7,692 | $ | 1,431 | ||||||
|
|
|
|
|
| |||||||
NON-CASH INVESTING AND FINANCING ACTIVITIES: | ||||||||||||
Issuance of preferred stock for acquisitions | $ | — | $ | — | $ | 29,992 | ||||||
|
|
|
|
|
| |||||||
Issuance of common stock for acquisitions | $ | 620 | $ | — | $ | 6,827 | ||||||
|
|
|
|
|
| |||||||
Issuance of restricted common stock for acquisitions | $ | — | $ | — | $ | 3,864 | ||||||
|
|
|
|
|
| |||||||
Grant of common stock options for acquisitions | $ | — | $ | — | $ | 2,784 | ||||||
|
|
|
|
|
| |||||||
Property and equipment acquired under capital leases | $ | 688 | $ | — | $ | — | ||||||
|
|
|
|
|
| |||||||
Issuance of common stock warrants | $ | — | $ | 1,607 | $ | — | ||||||
|
|
|
|
|
| |||||||
Transfer of warrant liability to Series B-1 preferred stock upon exercise | $ | — | $ | — | $ | 1,629 | ||||||
|
|
|
|
|
| |||||||
Accounts payable related to property and equipment purchases | $ | 4 | $ | 1,636 | $ | 1,338 | ||||||
|
|
|
|
|
| |||||||
The accompanying notes are an integral part of these consolidated financial statements.
F-6
Table of Contents
Notes to consolidated financial statements
1. Formation and business of the company
Visto Corporation (“Visto” or the “Company”) was incorporated in Delaware in July 1996. In February 2009, Visto acquired Good Technology, Inc. from Motorola, Inc. (“Motorola”) and began doing business as Good Technology (“Good”). In September 2012, Visto changed its name to Good Technology Corporation.
Good provides a secure mobility solution for enterprises and governments worldwide, which consists of a secure mobile computing platform, a suite of collaboration applications and a third-party application and partner ecosystem that enables enterprises to increase productivity and transform business processes. The Company’s secure mobile computing platform, Good Dynamics, provides both security and application services to enable independent software vendors, or ISVs, systems integrators, or SIs, and internal enterprise development organizations to build applications that include the Company’s security functionality and simplify application development across devices and operating systems. The Good Collaboration Suite includes Good for Enterprise, which provides secure mobile email, calendar, contacts, attachments, notes and browsing, along with Good Share and Good Connect for file sharing and instant messaging, respectively. Good works with a broad set of third-party ISVs and SIs to incorporate its security architecture and management framework into the run-time environment of many existing, popular applications. These applications can be managed and published in “app stores” to streamline their distribution and policy management.
For the years ended December 31, 2011 and 2012, the Company incurred a net loss of $41.0 million and $90.4 million, respectively. The Company had an accumulated deficit of $490.3 million and cash and cash equivalents of $29.5 million as of December 31, 2012.
The Company has been successful in growing its business operations, completing rounds of private equity financing and securing a term loan of $22.5 million which, as of December 31, 2012, the Company had an outstanding principal balance of $15.2 million. In the third quarter of 2012, the Company was not in compliance with certain financial covenants of the loan agreement; however, the Company obtained waivers from the lender and amended certain covenants, reestablishing compliance with the loan terms in April 2013 (see Note 6). In April 2013, the Company issued 12.2 million shares of Series C redeemable convertible preferred stock for gross proceeds of $50.0 million (see Note 19). There can be no assurance, that the Company will be successful in executing its business plan, maintaining its existing customer base or achieving profitability. Failure to generate sufficient revenues, achieve planned gross margins, control operating costs or raise sufficient additional funds may require the Company to modify, delay or abandon some of its planned future expansion or expenditures, which could have a material adverse effect on the Company’s business, operating results, financial condition and ability to achieve its intended business objectives.
2. Summary of significant accounting policies
Basis of presentation
The consolidated financial statements include the Company’s accounts and the accounts of its wholly- and majority-owned subsidiaries. The Company reports noncontrolling interest positions as a separate component of consolidated deficit from Good Technology Corporation common stockholders’ deficit. Intercompany transactions and balances have been eliminated. Because the Company does not have any other comprehensive income (loss) components, total comprehensive loss only includes the Company’s net loss.
Unaudited pro forma deficit
In the event that an initial public offering of the Company’s common stock, or IPO, is completed, all shares of the Company’s outstanding redeemable convertible preferred stock will convert into common stock
F-7
Table of Contents
GOOD TECHNOLOGY CORPORATION
Notes to consolidated financial statements—(Continued)
automatically, as further described in Note 12. The unaudited pro forma deficit as of December 31, 2012 gives effect to the automatic conversion of all outstanding shares of redeemable convertible preferred stock into an aggregate of 114,371,043 shares of common stock. The pro forma deficit does not give effect to any proceeds from the qualifying IPO of the Company’s common stock.
Use of estimates
The Company’s consolidated financial statements are prepared in accordance with U.S. generally accepted accounting principles (“GAAP”). GAAP requires management to make judgments, estimates and assumptions that may affect the reported amounts of assets and liabilities as of the date of its consolidated financial statements as well as the reported amounts of revenues and expenses during the periods presented. These judgments, estimates and assumptions are used for, but not limited to: revenue recognition including customer useful lives, litigation claims, fair value of assets acquired and liabilities assumed in business combinations, implied fair value of goodwill, potential impairment of property and equipment, potential impairment of intangible assets and goodwill, provision for income taxes including required valuation allowances and uncertain tax positions, and the fair value of redeemable convertible preferred stock, common stock and stock options issued. The Company bases its estimates on various factors and information which may include, but are not limited to, history and prior experience, current economic conditions and information from third-party professionals that management believes to be reasonable under the circumstances, the results of which form the basis for making judgments about the carrying value of assets and liabilities and recorded amounts of revenues and expenses that are not readily apparent from other sources. Actual results may differ from these estimates, and these differences may be material.
Foreign currency
The functional currency of the Company and its subsidiaries is the U.S. dollar. Accordingly, the financial statements of the subsidiaries that are maintained in the local currency are remeasured into U.S. dollars at the reporting date. Unrealized gains or losses on transactions in currencies other than the U.S. dollar are recognized in the consolidated statements of operations.
Cash and cash equivalents
The Company considers highly liquid investments with a maturity of three months or less as of the date of purchase to be cash equivalents. Cash equivalents as of December 31, 2011 and 2012 consisted of a money market mutual fund.
Revenue recognition
The Company sells software solutions which are composed of secure mobile collaboration applications and mobile application platforms, and essential software-related connectivity services delivered through the Company’s network operating center. The Company also generates revenues from licensing of its intellectual property. The Company’s customers include companies operating corporate communication networks, original equipment manufacturers (OEM), and telecommunication carriers.
The Company recognizes revenues provided the following criteria of revenue recognition are met: (1) it enters into a legally binding arrangement with a customer; (2) products or services are delivered; (3) fees are fixed or determinable and free of contingencies or significant uncertainties; and (4) collection is probable.
Nearly all of the Company’s enterprise software licensing arrangements are multiple element arrangements, which include licenses to use the Company’s software on the customers’ servers and mobile devices, software
F-8
Table of Contents
GOOD TECHNOLOGY CORPORATION
Notes to consolidated financial statements—(Continued)
maintenance and support, and secure connectivity services. The majority of the Company’s software is sold under perpetual licenses and includes an initial software maintenance and support period of one to three years. Software maintenance and support consists of software maintenance and customer support which are delivered for a single fee and can be renewed upon contract expiration at the customer’s option. Software maintenance includes unspecified software upgrades, updates and bug fixes. Customer support consists of access to live technical support technicians, on-line knowledge resources and on-site support for premium-level customers. For time-based software license sales the license, maintenance and support fees are bundled into a single selling unit with a defined period of use. Both perpetual and time-based licenses also include essential access to the Company’s network operating center secure connectivity service which enables the secure connection between the customers’ servers and their mobile devices. Further, the delivered software elements are essential to the functionality and utility of the secure connectivity service. The Company provides its customers with access to the secure connectivity service for the entire term of the time-based licenses, and perpetually with perpetual software licenses.
All of the deliverables are deemed to be in the scope of the software revenue recognition rules. The secure connectivity service element is essential to the functionality of the delivered software and, as such, these services do not qualify for separate accounting as a service, and accordingly, contract accounting is applied to both the software and service elements included in the arrangement. Following the units-of-delivery method the Company recognizes the entire arrangement fee ratably over the service performance period, as the integrated solution is delivered in the same pattern. As the customer is purchasing an integrated solution, for which the elements are inseparable due to the essential nature of the software and service elements to one another, the associated revenues are presented in a single line item, Software and services, in the Company’s consolidated statements of operations.
Since the secure connectivity service obligation is perpetual, the Company utilizes an estimated average length of the customer relationship to determine the amortization period for arrangements with a perpetual license that can be transferred to new users, mobile devices or operating systems. The Company estimates the average length of the customer relationship to be five years based on historical trends, technological obsolescence and industry perspectives. In arrangements that do not allow for transferability of the perpetual license, such as the Company’s sales to OEM customers, the Company utilizes the estimated life of the consumer’s mobile device, or 18 months. The Company estimates the average life of the consumer’s mobile device based on industry reports and device refresh eligibility periods by mobile carriers. All elements bundled with the perpetual license are amortized over the same service delivery period.
Revenues from time-based software licenses and any bundled elements are recognized over the contractual term, generally one to three years. When an arrangement includes both time-based and perpetual software licenses, all revenues are recognized ratably over the longer of the service delivery periods applicable to time-based and perpetual software licenses.
In certain arrangements with telecommunication carriers, license, maintenance and support, and secure connectivity services are billed monthly in arrears based on actual usage. Estimated revenues are recognized when carriers provide reliable sales data within a reasonable time frame following the end of each month to allow for the Company to make reasonable estimates of revenues. Revenues from the remaining carriers are recognized when billed.
The Company also provides professional services such as deployment, consulting, and training. These services can be part of software license arrangements, or sold separately. When professional services are sold as part of software license arrangements, amortization of revenue for the entire transaction does not commence until completion and acceptance of these professional services, as delivery is not considered to have occurred.
F-9
Table of Contents
GOOD TECHNOLOGY CORPORATION
Notes to consolidated financial statements—(Continued)
Revenues from professional services sold separately from software licenses are recognized upon completion of the services, and have not been material to date.
Revenues from renewals of support and maintenance contracts are recognized ratably over the contract term.
The Company’s standard payment terms are net 30 days. However, payment terms may vary based on the country in which the agreement is executed and for certain customers. Payments due within three months are deemed to be fixed or determinable based on the Company’s successful collection history in such arrangements. If payments in the arrangement are due over a longer period, revenues are not recognized until the amounts become due or collected.
The Company occasionally guarantees certain service levels, such as uptime, as outlined in individual customer contracts. To the extent that these service levels are not achieved, the Company reduces revenues for any credits given to the customer as a result. The Company has the ability to determine such service level credits prior to the associated revenues being recognized, and historically, these credits have not been significant.
Intellectual property licensing revenues represent cash settlements with various companies for infringement of the Company’s patents, or direct licenses of the Company’s intellectual property. As part of these settlements, the Company has granted such companies licenses and a release from all prior damages associated with the Company’s patent assets, and in certain circumstances rights to future intellectual property developed by the Company. Revenues from these agreements are recognized, based on the terms of the agreements with licensees, immediately, when the Company has no remaining obligations to the licensee, or amortized over performance periods of up to 13.8 years, when the Company has granted to licensees rights to receive future intellectual property it may develop.
Deferred revenues
Deferred revenues consist of both intellectual property licensing revenues and payments received in advance of revenue recognition from software licensing and service arrangements. Such revenues are recognized as revenue recognition criteria are met. Deferred revenues that are expected to be recognized during the succeeding 12-month period are recorded as current deferred revenues and the remaining portion is recorded as noncurrent. As of December 31, 2011 and 2012, approximately 52% and 35% of total deferred revenues, respectively, was related to intellectual property licensing revenues.
Deferred commissions
The Company defers commissions as the costs are closely related to the deferred revenues from the related customer contracts and therefore should be expensed over the same period that the related revenues are recognized. The Company capitalizes incremental and directly related commission costs upon the execution of the sales contract by the customer. Amortization of deferred commissions is included in sales and marketing expense in the consolidated statements of operations. Payments to sales personnel are made shortly after the receipt of the related customer payment.
Concentrations of credit risk and significant customers
Financial instruments that are potentially subject to credit risk consist of cash, cash equivalents, currency forward contracts and trade receivables. The Company’s cash and cash equivalents are generally held with several large financial institutions worldwide in order to reduce exposure to any single financial institution. In the United States, the Company holds deposits with certain financial institutions that may exceed FDIC insurance limits. It also holds a portion of its cash in a money market mutual fund sponsored by a large financial institution. The currency forward contracts are entered into with a large financial institution in order to mitigate credit and
F-10
Table of Contents
GOOD TECHNOLOGY CORPORATION
Notes to consolidated financial statements—(Continued)
counterparty risk. The risk with respect to trade receivables is mitigated by credit evaluations that management performs on its customers, the short duration of customer payment terms for a significant majority of customer contracts and by diversification of the customer base.
For the year ended December 31, 2010, two customers accounted for 30% and 22% of total revenues. For the year ended December 31, 2011, three customers accounted for 23%, 18% and 12% of total revenues, and one customer accounted for 13% of total accounts receivable at December 31, 2011. For the year ended December 31, 2012, three customers accounted for 17%, 14% and 12% of total revenues, and two customers accounted for 17% and 12% of total accounts receivable at December 31, 2012.
Warrants to purchase redeemable convertible preferred stock and common stock
Freestanding warrants to purchase shares of the Company’s redeemable convertible preferred stock are classified as non-current liabilities in the consolidated balance sheets and are carried at fair value because the warrants may obligate the Company to transfer assets to the holders at a future date under certain circumstances, such as a change in control. The warrants are subject to remeasurement at each balance sheet date and any change in the estimated fair value is recognized as a component of other income (expense), net, in the consolidated statements of operations. The Company estimates the fair value of these warrants at issuance and at each balance sheet date using the Black-Scholes option pricing model.
The Company continued to adjust the liability for changes in fair value until the exercise of the warrants in March 2012, at which time the liability was remeasured and transferred to redeemable convertible preferred stock.
The Company also issued common stock warrants in 2011 that are included in Good Technology Corporation stockholders’ deficit. The fair value of these warrants is estimated at issuance using the Black-Scholes option pricing model and is not subject to subsequent remeasurement.
Fair value of financial instruments
Carrying amounts of certain of the Company’s financial instruments, including cash equivalents, accounts receivable, and accounts payable approximate fair values due to their short maturities. The carrying amounts of the warrant liability and foreign currency forward contracts represent their fair value. The carrying amount of notes payable approximates its fair value based on borrowing rates currently available to the Company for loans with similar terms.
Fair value is defined as the price that would be received from selling an asset or paid to transfer a liability in an orderly transaction between market participants at the measurement date. When determining fair value, the Company considers the principal or most advantageous market in which the Company would transact, and takes into consideration the assumptions that market participants would use when pricing the asset or liability. The Company’s assessment of the significance of a particular input to the fair value measurement of an asset or liability requires management to make judgments and to consider specific characteristics of that asset or liability.
The current accounting guidance provides three levels of inputs that may be used to measure fair value, as follows:
| • | Level 1—Unadjusted quoted prices in active markets for identical assets or liabilities. |
| • | Level 2—Observable inputs other than Level 1 prices, such as quoted prices for similar assets or liabilities, quoted prices in markets with insufficient volume or infrequent transactions (less active |
F-11
Table of Contents
GOOD TECHNOLOGY CORPORATION
Notes to consolidated financial statements—(Continued)
markets), or model-derived valuations in which all significant inputs are observable or can be derived principally from or corroborated with observable market data for substantially the full term of the assets or liabilities. |
| • | Level 3—Unobservable inputs to the valuation methodology that are significant to the measurement of the fair value of assets or liabilities. |
Foreign currency forward contracts
Forward contracts are carried at fair value in the Company’s consolidated balance sheets. The fair values of the forward contracts generally represent the estimated amounts the Company would expect to receive or pay upon termination of the contracts as of the reporting date.
During the years ended December 31, 2010, 2011 and 2012, the Company held short-term forward contracts to sell foreign currency, which were used to hedge foreign currency-denominated asset or liability balances. The Company’s goal was to reduce its potential exposure to the changes that currency exchange rates might have on its operating results, cash flows and financial position. These foreign currency forward contracts were not designated nor accounted for using hedge accounting treatment. Changes in the fair value of these forward contracts were included in other income (expense), net. The Company did not hold or issue financial instruments for speculative or trading purposes.
As of December 31, 2011, outstanding foreign currency forward contracts had a total notional value of €6.0 million and £1.4 million (approximately $10.0 million combined using the exchange rate as of December 31, 2011). Fair value of these contracts was a liability of approximately $23,000 and was included in other current liabilities as of December 31, 2011. As of December 31, 2012, outstanding foreign currency forward contracts had a total notional value of €7.1 million and £2.4 million (approximately $13.3 million combined using the exchange rate as of December 31, 2012). The fair value of these contracts was a liability of approximately $7,000 and was included in other current liabilities as of December 31, 2012.
The Company recognized a net gain (loss) from foreign currency forward contracts of $(12,000), $77,000 and $(349,000) for the years ended December 31, 2010, 2011 and 2012, respectively.
Stock-based compensation
The Company accounts for stock-based awards using a fair value-based method. For equity awards granted to employees, the Company estimates the fair value of share-based payment awards on the grant date using an option pricing model. The value of awards expected to vest is recognized as expense on a straight-line basis over the requisite service period, which is generally the vesting term of the awards.
The Company selected the Black-Scholes option pricing model as the most appropriate method for determining the estimated fair value for stock-based awards. The Black-Scholes model requires the use of highly subjective and complex assumptions which determine the fair value of stockbased awards, including the option’s expected term and the price volatility of the underlying stock. Forfeitures are estimated at the time of grant and revised, if necessary, in subsequent period if actual forfeitures differ from those estimates.
Advertising expense
Advertising costs are charged to sales and marketing expense as incurred. Costs related to advertising for the years ended December 31, 2010, 2011 and 2012 were $2.7 million, $1.4 million and $1.0 million, respectively.
F-12
Table of Contents
GOOD TECHNOLOGY CORPORATION
Notes to consolidated financial statements—(Continued)
Allowance for doubtful accounts
The allowance for doubtful accounts reflects management’s best estimate of probable losses inherent in the Company’s accounts receivable balance. The allowance is determined based on known troubled accounts, historical experience and other currently available evidence. The allowance for doubtful accounts was $17,000 and $108,000 as of December 31, 2011 and 2012, respectively.
Research and development
The Company charges costs related to research, design and development of products to research and development expense as incurred. The types of costs included in research and development expenses primarily consist of personnel costs, consulting costs and allocated facilities and information technology costs.
Software development costs
Software development costs incurred in conjunction with product development of software that will be licensed is charged to research and development expense until technological feasibility is established. To date, the period between achieving technological feasibility, which management defines as the establishment of a working model, and general availability of software has been short and associated software development costs during this period have been insignificant. Accordingly, costs eligible for capitalization of software development costs were not material to the Company’s consolidated financial statements for the years ended December 31, 2010, 2011 and 2012.
Property and equipment
Property and equipment are recorded at cost less accumulated depreciation. Expenditures for major additions and improvements are capitalized, while minor replacements, maintenance and repairs are charged to expense as incurred. Depreciation expense is recorded over the estimated useful lives of the assets. Leasehold improvements are amortized over the estimated useful lives or lease terms, whichever is shorter. Leased property and equipment meeting certain capital lease criteria is capitalized, and the net present value of the related lease payments is recorded as a liability. Amortization of capital leased assets is recorded using the straight-line method over their estimated useful lives or the lease terms, whichever is shorter, and is included in depreciation and amortization expense in the statements of operations.
Internal use software costs
Costs related to software acquired, developed or modified solely to meet the Company’s internal requirements, with no substantive plans to market such software at the time of development, are capitalized. These costs include the costs associated with the Company’s data and reporting systems as well as development costs for its Good Secure Cloud. Costs incurred during the preliminary planning and evaluation stage of the project and during post implementation operational stage are expensed as incurred. Costs incurred during the application development stage of the project are capitalized. The Company defines the design, configuration, and coding process as the application development stage. No amounts were capitalized in the year ended December 31, 2010. For the years ended December 31, 2011 and 2012, the Company capitalized costs of $3.8 million and $6.6 million, respectively, related to computer software developed for internal use, which is included in property and equipment, net on the consolidated balance sheets.
F-13
Table of Contents
GOOD TECHNOLOGY CORPORATION
Notes to consolidated financial statements—(Continued)
Goodwill and impairment analysis
Goodwill represents the excess of the purchase price of an acquired business over the fair value of the net tangible and identifiable intangible assets acquired. The carrying amount of goodwill is reviewed at least annually and whenever events or changes in circumstances indicate that the carrying value may not be recoverable. The goodwill impairment analysis is comprised of a two-step process. The first step compares the fair value of the Company’s reporting units to the carrying amount of their net assets. The Company operates in one reportable business segment and has one reporting unit, the Company as a whole. If the fair value of the Company’s net assets exceeds the carrying amount of those assets, goodwill is considered not to be impaired and management is not required to perform additional testing. If the carrying amount exceeds the fair value of the Company’s net assets, the Company must perform a second step in order to determine the implied fair value of its goodwill. If the carrying amount exceeds the implied fair value of its goodwill, the Company records an impairment loss equal to the difference. Management performs its annual impairment analysis each year on September 30. The Company did not recognize any goodwill impairment charges for the years ended December 31, 2010, 2011 and 2012.
Impairment of long-lived assets
The Company evaluates long-lived assets, such as property and equipment and amortizable intangible assets, for impairment whenever events or changes in circumstances indicate that the carrying value of an asset may not be recoverable. If indicators of impairment exist and the undiscounted future cash flows that the assets are expected to generate are less than the carrying value of the assets, the Company reduces the carrying amount of the assets to their estimated fair values based on a discounted cash flow approach or, when available and appropriate, to comparable market values.
Income taxes
The Company utilizes the asset and liability method of accounting for income taxes, under which deferred taxes are determined based on the temporary differences between the financial statement and tax basis of assets and liabilities using tax rates expected to be in effect during the years in which the basis differences reverse and for operating losses and tax credit carry-forwards.
The Company is required to evaluate the realizability of its deferred tax assets on an ongoing basis to determine whether there is a need for a valuation allowance with respect to such deferred tax assets. A valuation allowance is recorded when it is more likely than not that some of the deferred tax assets will not be realized. Significant management judgment is required in determining any valuation allowance recorded against deferred tax assets. In evaluating the ability to recover deferred tax assets, the Company considers available positive and negative evidence giving greater weight to its recent cumulative losses and its ability to carryback losses against prior taxable income and lesser weight to its projected financial results. The Company also considers, commensurate with its objective verifiability, the forecast of future taxable income including the reversal of temporary differences and the implementation of feasible and prudent tax planning strategies.
The Company accounts for uncertainty in income taxes using a two-step approach to recognizing and measuring uncertain tax positions. The first step is to evaluate the tax position for recognition by determining if the weight of available evidence indicates that it is more likely than not that the position will be sustained on audit, including resolution of related appeals or litigation processes, if any. The second step is to measure the tax benefit as the largest amount that is more than 50% likely of being realized upon settlement. The Company classifies the liability for unrecognized tax benefits as current to the extent that the Company anticipates payment (or receipt) of cash within one year. Interest and penalties related to uncertain tax positions are recognized in the provision for income taxes.
F-14
Table of Contents
GOOD TECHNOLOGY CORPORATION
Notes to consolidated financial statements—(Continued)
Noncontrolling interest
In February 2007, the Company acquired 76% of Altexia SA (“Altexia”). The Company follows the applicable accounting guidance for the 24% share of noncontrolling interest of Altexia and classifies this noncontrolling interest as a component of deficit within the consolidated balance sheets and presents net loss attributable to the noncontrolling interest in the consolidated statements of operations. The guidance requires that the noncontrolling interest continue to be attributed its share of losses even if that attribution results in a deficit noncontrolling interest balance.
Net income (loss) per share attributable to Good Technology Corporation common stockholders
Basic net loss per share attributable to Good Technology Corporation common stockholders is computed by dividing the net loss attributable to Good Technology Corporation common stockholders by the weighted-average number of shares of common stock outstanding during the period. Diluted net loss per share attributable to Good Technology Corporation common stockholders is computed by giving effect to all potential shares of common stock, including stock options, warrants and redeemable convertible preferred stock, to the extent dilutive. Due to net losses for all the periods presented, basic and diluted loss per share attributable to Good Technology Corporation common stockholders were the same, as the effect of potentially dilutive securities would have been anti-dilutive.
Recent accounting pronouncements
In June 2011, the Financial Accounting Standards Board (“FASB”) issued amendments to the FASB Accounting Standard Codification relating to presentation of comprehensive income. The amendments require that all non-owner changes in stockholders’ equity be presented either in a single continuous statement of comprehensive income or in two separate but consecutive statements. The amendments should be applied retrospectively, and are effective for fiscal years, and interim periods with those years, beginning after December 15, 2011. The amendment had no impact on the Company’s financial statements as the Company does not have comprehensive income.
In September 2011, the FASB issued Accounting Standards Update,Testing Goodwill for Impairment (the revised standard). The revised standard is intended to reduce the cost and complexity of the annual goodwill impairment test by providing entities an option to perform a “qualitative” assessment to determine whether further impairment testing is necessary. The revised standard is effective for annual and interim goodwill impairment tests performed for fiscal years beginning after December 15, 2011. An entity has the option to first assess qualitative factors to determine whether it is necessary to perform the current two-step test. If an entity believes, as a result of its qualitative assessment, that it is more-likely-than-not that the fair value of a reporting unit is less than its carrying amount, the quantitative impairment test is required. The adoption of this update did not have an impact on the Company’s consolidated results of operations and financial condition.
In July 2012, the FASB issued amended standards to simplify how entities test indefinite-lived intangible assets for impairment which improve consistency in impairment testing requirements among long-lived asset categories. These amended standards permit an assessment of qualitative factors to determine whether it is more likely than not that the fair value of an indefinite-lived intangible asset is less than its carrying value. For assets in which this assessment concludes it is more likely than not that the fair value is more than its carrying value, these amended standards eliminate the requirement to perform quantitative impairment testing as outlined in the previously issued standards. These amended standards were effective for the Company beginning in the fourth quarter of 2012. The Company currently does not have any indefinite-lived intangible assets.
F-15
Table of Contents
GOOD TECHNOLOGY CORPORATION
Notes to consolidated financial statements—(Continued)
3. Business combinations
The Company completed one business combination in 2010 and two business combinations in 2012. There were no business combinations completed during 2011.
| Allocation of Purchase Consideration | ||||||||||||||||||||||||||||||||||||
| Purchase Consideration | Net Tangible Liabilities Assumed | Goodwill | Purchased Intangibles Assets—Finite Lives | |||||||||||||||||||||||||||||||||
| Developed/ Core Technology | Useful Life (Yrs.) | Trade Name | Useful Life (Yrs.) | Customer Relation- ships | Useful Life (Yrs.) | Non- Compete Covenant | Useful Life (Yrs.) | |||||||||||||||||||||||||||||
| (in thousands) | ||||||||||||||||||||||||||||||||||||
2010 | ||||||||||||||||||||||||||||||||||||
Cloudsync, Inc. | $ | 2,079 | $ | (323 | ) | $ | 1,569 | $ | 625 | 2 | $ | 208 | 7 | $ | — | — | $ | — | — | |||||||||||||||||
|
|
|
|
|
|
|
|
|
|
|
|
|
| |||||||||||||||||||||||
2012 | ||||||||||||||||||||||||||||||||||||
Copiun, Inc.. | $ | 24,788 | $ | (3,212 | ) | $ | 15,133 | $ | 11,554 | 5 | $ | — | — | $ | 1,073 | 4 | $ | 240 | 2 | |||||||||||||||||
AppCentral, Inc. | 18,679 | (1,233 | ) | 11,111 | 8,400 | 5 | — | — | 401 | 4 | — | — | ||||||||||||||||||||||||
|
|
|
|
|
|
|
|
|
|
|
|
|
| |||||||||||||||||||||||
Total | $ | 43,467 | $ | (4,445 | ) | $ | 26,244 | $ | 19,954 | $ | — | $ | 1,474 | $ | 240 | |||||||||||||||||||||
|
|
|
|
|
|
|
|
|
|
|
|
|
| |||||||||||||||||||||||
The Company issued the following equity instruments and paid cash for the acquisition of these companies (in thousands):
| Cash | Shares of Preferred Stock Issued | Shares of Common Stock Issued | Restricted Stock Awards Issued | Common Stock Options Issued | Total | |||||||||||||||||||||
2010 | ||||||||||||||||||||||||||
Cloudsync, Inc. | Fair value of purchase consideration | $ | 1,459 | $ | — | $ | 620 | $ | — | $ | — | $ | 2,079 | |||||||||||||
|
| |||||||||||||||||||||||||
| (shares/options) | — | 1,000 | — | — | ||||||||||||||||||||||
2012 | ||||||||||||||||||||||||||
Copiun, Inc. | Fair value of purchase consideration | $ | — | $ | 17,662 | $ | 4,129 | $ | 2,223 | $ | 774 | $ | 24,788 | |||||||||||||
| (shares/options) | 3,649 | 896 | 482 | 181 | ||||||||||||||||||||||
AppCentral, Inc. | Fair value of purchase consideration | $ | — | $ | 12,330 | $ | 2,698 | $ | 1,641 | $ | 2,010 | $ | 18,679 | |||||||||||||
| (shares/options) | 2,563 | 597 | 363 | 570 | ||||||||||||||||||||||
|
| |||||||||||||||||||||||||
Total | $ | 43,467 | ||||||||||||||||||||||||
|
| |||||||||||||||||||||||||
Acquisition of Cloudsync, Inc.
In January 2010, the Company acquired all outstanding common shares of Cloudsync, Inc. (“Cloudsync”), a provider of mobile device management, remote help desk and global positioning software for enterprises, government and other organizations seeking to better manage their mobile device assets. The Company acquired Cloudsync to address the growing demand for cloud-based services such as mobile support to devices in the field and applications to assist IT administrators in monitoring device location and usage. Pro forma financial information has not been provided as it would not be materially different from the financial information that was previously reported. The results of Cloudsync have been included in the results of operations of the Company since the date of acquisition. Developed/core technology represents the fair values of the Cloudsync browser-based platform and underlying applications. Trademark represents the fair value of brand and name recognition
F-16
Table of Contents
GOOD TECHNOLOGY CORPORATION
Notes to consolidated financial statements—(Continued)
associated with the marketing of Cloudsync’s services. The goodwill balance is not deductible for tax purposes. The goodwill is primarily attributable to the expected synergies and revenue opportunities when combining the Company’s security mobile solutions with Cloudsync’s cloud offerings. The fair value of intangible assets was based on the income approach. The acquisition costs which were expensed were not material.
Acquisition of Copiun, Inc.
In September 2012, the Company entered into an Agreement and Plan of Merger and Reorganization (the “Copiun Agreement”) with Copiun, Inc. (“Copiun”), a Delaware corporation, to acquire all the outstanding shares of Copiun. The Company acquired Copiun for its secure mobile collaboration capabilities allowing mobile workers to access, share and sync corporate documents on their mobile devices without compromising the security of this data. The Company plans to incorporate this technology into its Good Dynamics platform.
The Company issued 482,000 shares of restricted common stock and 181,000 common stock options to former Copiun employees, the fair values of which were included as a component of the purchase price, as they related to pre-acquisition services. The acquisition date fair value of other shares of restricted common stock and common stock options granted to former Copiun employees will be expensed over the remaining vesting period as post-merger compensation expense. The total cash and cash equivalents obtained from Copiun was $0.4 million. The Company withheld 10% of the purchase consideration, which is included in the table above, for 12 months following the acquisition date in the event of certain breaches of the Copiun Agreement.
The Company utilized multiple approaches and methodologies to determine the value of the Company’s preferred and common stock issued for Copiun. The two primary approaches were the fundamental analysis, which uses generally accepted valuation methodologies to derive an indication of value and the stock transaction approach, which utilizes the indicated values from actual transactions in the Company’s common stock. The fundamental analysis and the stock transaction approach were weighted based on the facts and circumstances of each valuation. The weight assigned to the stock transaction approach was estimated based on the volume, comparability and proximity of the transactions to the valuation date. Throughout the year, the volume and size of third-party transactions increased. Accordingly, the Company increased its reliance and valuation weighting toward the stock transaction approach. The value difference between preferred and common stock was due to the different rights and preferences of the securities including liquidation preference. The Company used the Black-Scholes valuation model to value the assumed Copiun options. However, as the options were deep in-the-money, the value was essentially derived from their intrinsic value.
The acquisition was accounted for as a purchase business combination. The Company allocated the purchase price to tangible assets acquired, liabilities assumed and identifiable intangible assets acquired based on their estimated fair values. The excess of the purchase price over the aggregate fair values was recorded as goodwill. The value of goodwill represents approximately 61% of the total purchase price. The goodwill represents the expected benefits of Copiun’s product features and capabilities as these technologies become integrated into the Company’s Good Dynamics product platform. The Company believes the ability for enterprises to access, share and synchronize corporate documents using a mobile device will become an integrated part of an enterprise’s workflow. Copiun’s product offerings are currently in their early stages of being widely adopted by enterprises, but as these technologies continue to gain momentum in the enterprise, the Company expects to benefit from having Copiun’s product capabilities within its Good Dynamics product platform. The goodwill is not deductible for tax purposes.
The Company has estimated the fair value of the Copiun-related other intangible assets using the income approach and these identifiable intangible assets are subject to amortization. Developed technology represents a
F-17
Table of Contents
GOOD TECHNOLOGY CORPORATION
Notes to consolidated financial statements—(Continued)
combination of processes, patents and trade secrets developed through years of experience in design and development of the products. Customer relationships represent contractual and non-contractual sales of current and future versions of existing products to existing customers. The non-compete agreements represent the fair value to the Company of contracts that place restrictions on the ability of certain former Copiun executives to compete for a period of two years.
The Company incurred $0.5 million in acquisition-related costs for the Copiun acquisition, which are included within general and administrative costs.
Acquisition of AppCentral, Inc.
In October 2012, the Company entered into an Agreement and Plan of Merger and Reorganization (the “AppCentral Agreement”) with AppCentral, Inc. (“AppCentral”), a Delaware corporation, to acquire all the outstanding shares of AppCentral. The Company acquired AppCentral for its mobile application management and application security wrapping technology. The technology allows enterprises to easily distribute, manage, and secure mobile enterprise applications. These solutions will enable enterprises to increase mobile worker productivity while protecting data and applications on current mobile devices. The Company plans to incorporate this technology into its Good Dynamics platform.
The Company issued 363,000 shares of restricted common stock and 570,000 common stock options to former AppCentral employees, the fair values of which were included as a component of the purchase price, as they related to pre-acquisition services. The acquisition date fair value of other shares of restricted common stock and common stock options granted to former AppCentral employees will be expensed over the remaining vesting period as post-merger compensation expense. The total cash and cash equivalents obtained from AppCentral was $0.4 million. The Company withheld 15% of the purchase consideration, which is included in the table above, for 12 months following the acquisition date in the event of certain breaches of the AppCentral Agreement.
The Company utilized multiple approaches and methodologies to determine the value of the Company’s preferred and common stock issued for AppCentral. The two primary approaches were the fundamental analysis, which uses generally accepted valuation methodologies to derive an indication of value and the stock transaction approach, which utilizes the indicated values from actual transactions in the Company’s common stock. The fundamental analysis and the stock transaction approach were weighted based on the facts and circumstances of each valuation. The weight assigned to the stock transaction approach was estimated based on the volume, comparability and proximity of the transactions to the valuation date. Throughout the year, the volume and size of third-party transactions increased. Accordingly, the Company increased its reliance and valuation weighting toward the stock transaction approach. The value difference between preferred and common stock was due to the different rights and preferences of the securities including liquidation preference. The Company used the Black-Scholes valuation model to value the assumed AppCentral options. Expected term inputs ranged from 0.53 to 5.36 years, with 57.6% volatility, 0% dividend rate, and a 0.47% interest rate.
The acquisition was accounted for as a purchase business combination. The Company allocated the purchase price to tangible assets acquired, liabilities assumed and identifiable intangible assets acquired based on their estimated fair values. The excess of the purchase price over the aggregate fair values was recorded as goodwill. The value of goodwill represents approximately 59% of the total purchase price. The goodwill represents the additional value the Company expects to gain from AppCentral product features and capabilities as these technologies become integrated into the Good Dynamics platform. The capability for enterprises to distribute and deploy applications that are internally developed to their employees is a capability resident in AppCentral software. In addition, AppCentral’s software offerings allow enterprises to see usage and data analytics to better
F-18
Table of Contents
GOOD TECHNOLOGY CORPORATION
Notes to consolidated financial statements—(Continued)
understand how applications are being used, how often they are downloaded and what transaction flows are being followed within the enterprise. These technologies are currently in their early stages of being widely adopted by enterprises, but as these technologies continue to gain momentum in the enterprise, the Company expects to benefit from having AppCentral’s capabilities within its Good Dynamics platform. The goodwill is not deductible for tax purposes.
The Company has estimated the fair value of the AppCentral related other intangible assets using the income approach and these identifiable intangible assets are subject to amortization. Developed technology represents a combination of processes, patents and trade secrets developed through years of experience in design and development of the products. Customer relationships represent contractual and non-contractual sales of current and future versions of existing products to existing customers.
The Company incurred $0.2 million in acquisition-related costs for the AppCentral acquisition, which are included within general and administrative costs.
Acquired intangibles amortization period and method
For the Copiun and AppCentral acquisitions, the amortization period and method of significant acquired intangibles was estimated based on the following information:
Developed technology:The Company’s experience with technology refreshment cycles in the mobile security sector suggested that five years is a reasonable estimate of the period of amortization. In addition, based on data the Company monitors for estimating its customer’s life for revenue recognition purposes, it observed that five years was a reasonable estimate for its relationship with a customer; which, based on this five year technology refresh cycle, could be a reason for why a customer may decide to move to a competing or new mobile solution. In terms of estimating the amortization method, the Company determined that the straight-line method was appropriate. The Company considered whether it was possible that the asset would be consumed in a manner that was not straight-line. The associated cash flows for which the developed technology relates are more heavily weighted in the later years; however, the Company believes that the timing of these cash flows do not meet as high a level of confidence to determine them to be “reliably determinable” and therefore the Company assumed a straight-line method of amortization.
Customer relationships: The Company determined a four year estimated life to be reasonable and this is consistent with what it has used in the past for customer relationships. Further, in determining the useful life the Company considered the period of expected cash flows used to measure the fair value of the customer relationships. The Company then analyzed the population and timing of the cash flows and determined that 80% of the cash flows are estimated to be realized in the next four years. If the range was expanded to 90%, the cash flows were as long as five years. The Company determined however that it would be more appropriate to amortize the relationship over the threshold for which it begins to exceed a significant majority (i.e. more than 75%) of what would be realized. This estimate, coupled with the Company’s historical experience, allowed it to determine that four years was reasonable. Absent a more reasonable method, the Company selected the straight-line method of amortization.
Pro forma financial information (unaudited)
The operating results of Cloudsync, Copiun and AppCentral have been included in the consolidated financial statements since their acquisition dates, and have not been significant. The unaudited pro forma financial information below includes the business combination accounting effects from the acquisitions including amortization charges from acquired intangible assets and the related tax effects as though Copiun and
F-19
Table of Contents
GOOD TECHNOLOGY CORPORATION
Notes to consolidated financial statements—(Continued)
AppCentral were acquired as of January 1, 2011. Cloudsync was acquired in January 2010 and has therefore been included in the Company’s operating results since that date. The unaudited pro forma financial information for the years ended December 31, 2011 and 2012, as presented below, is for informational purposes only and is not indicative of the results of operations that would have been achieved if the acquisitions had taken place on January 1, 2011 (in thousands, except per share amounts).
| Years Ended December 31, | ||||||||
| 2011 | 2012 | |||||||
Revenues | $ | 85,893 | $ | 117,728 | ||||
Net loss attributable to Good Technology Corporation common stockholders | $ | (49,843 | ) | $ | (105,647 | ) | ||
Basic and diluted net loss per share attributable to Good Technology Corporation common stockholders | $ | (2.31 | ) | $ | (3.03 | ) | ||
4. Consolidated balance sheet detail
Prepaid expenses and other current assets
Prepaid expenses and other current assets consisted of the following (in thousands):
| As of December 31, | ||||||||
| 2011 | 2012 | |||||||
Prepaid expenses | $ | 2,495 | $ | 6,037 | ||||
Current deferred tax asset and tax receivable | 3,045 | 2,367 | ||||||
Other current assets | 939 | 1,246 | ||||||
|
|
|
| |||||
Prepaid expenses and other current assets | $ | 6,479 | $ | 9,650 | ||||
|
|
|
| |||||
Property and equipment
Property and equipment was comprised of the following (in thousands):
| As of December 31, |
| |||||||||||
| 2011 | 2012 | Useful Life | ||||||||||
Land | $ | 120 | $ | — | ||||||||
Building | 413 | — | 15 years | |||||||||
Furniture and fixtures | 1,621 | 1,965 | 5 years | |||||||||
Computers and equipment | 8,491 | 11,185 | 3 years | |||||||||
Software | 997 | 9,348 | 3 years | |||||||||
Construction in process | 3,830 | 2,759 | — | |||||||||
Leasehold improvements | 3,375 | 3,425 | | Shorter of useful life or lease term | | |||||||
|
|
|
| |||||||||
Total property and equipment | 18,847 | 28,682 | ||||||||||
Less accumulated depreciation and amortization | (6,650 | ) | (10,964 | ) | ||||||||
|
|
|
| |||||||||
Property and equipment, net | $ | 12,197 | $ | 17,718 | ||||||||
|
|
|
| |||||||||
Depreciation and amortization expense was $2.4 million, $2.7 million and $5.9 million for the years ended December 31, 2010, 2011 and 2012, respectively. In December 2011, the Company exercised its option to purchase the building and land located in Bordeaux, France which was previously held as a capital lease. In May 2012, the Company sold the building and land for $0.5 million, resulting in a gain of $0.2 million.
F-20
Table of Contents
GOOD TECHNOLOGY CORPORATION
Notes to consolidated financial statements—(Continued)
Accrued and other current liabilities
Detail of accrued and other current liabilities was as follows (in thousands):
| As of December 31, | ||||||||
| 2011 | 2012 | |||||||
Accrued royalties | $ | 1,155 | $ | 2,899 | ||||
Accrued sales and value-added tax | 2,837 | 1,780 | ||||||
Deferred rent | 310 | 360 | ||||||
Deferred tax liability | 851 | 160 | ||||||
Accrued sales and marketing expenses | 1,191 | 62 | ||||||
Other current liabilities | 1,229 | 1,245 | ||||||
|
|
|
| |||||
Accrued and other current liabilities | $ | 7,573 | $ | 6,506 | ||||
|
|
|
| |||||
5. Intangible assets, net and goodwill
Intangible assets
Gross carrying amount and accumulated amortization by class of intangible assets were as follows (in thousands):
| Gross Assets | Accumulated Amortization | Net Assets | ||||||||||
December 31, 2011: | ||||||||||||
Developed/core technology | $ | 4,157 | $ | (1,699 | ) | $ | 2,458 | |||||
Customer relationships | 1,309 | (958 | ) | 351 | ||||||||
Trade names | 1,200 | (346 | ) | 854 | ||||||||
Other | 23 | (23 | ) | — | ||||||||
|
|
|
|
|
| |||||||
| $ | 6,689 | $ | (3,026 | ) | $ | 3,663 | ||||||
|
|
|
|
|
| |||||||
December 31, 2012: | ||||||||||||
Developed/core technology | $ | 24,111 | $ | (3,265 | ) | $ | 20,846 | |||||
Customer relationships | 2,783 | (1,147 | ) | 1,636 | ||||||||
Trade names | 1,200 | (468 | ) | 732 | ||||||||
Other | 262 | (57 | ) | 205 | ||||||||
|
|
|
|
|
| |||||||
Total intangible assets | $ | 28,356 | $ | (4,937 | ) | $ | 23,419 | |||||
|
|
|
|
|
| |||||||
During the year ended December 31, 2010, the Company incurred an impairment charge for the intangible assets related to one of its acquisitions after the Company determined that it would no longer support the on-going products and core technology, resulting in an impairment expense of $0.5 million. The Company acquired $21.7 million of intangible assets in the year ended December 31, 2012 in connection with the Copiun and AppCentral acquisitions.
The Company amortizes developed/core technology over 2-8 years, customer relationships over 4-7 years, trade names over 7-10 years and other intangibles over 1.5-2 years. The Company amortizes developed/core technology in cost of revenues and customer relationships, trade names, and other intangibles in sales and marketing expenses. Amortization expense for intangible assets was $1.2 million, $0.8 million and $1.9 million for the years ended December 31, 2010, 2011 and 2012, respectively.
F-21
Table of Contents
GOOD TECHNOLOGY CORPORATION
Notes to consolidated financial statements—(Continued)
The estimated future amortization expense related to intangible assets, assuming no future impairment, is as follows (in thousands):
| Amount | ||||
2013 | $ | 5,180 | ||
2014 | 5,146 | |||
2015 | 5,060 | |||
2016 | 4,872 | |||
2017 | 3,038 | |||
Thereafter | 123 | |||
|
| |||
Total | $ | 23,419 | ||
|
| |||
Goodwill
The changes in the carrying value of goodwill are as follows (in thousands):
| Amount | ||||
Balance as of December 31, 2009 | $ | 38,343 | ||
Goodwill recorded for Cloudsync. | 1,569 | |||
|
| |||
Balance as of December 31, 2010 | 39,912 | |||
2011 additions | — | |||
|
| |||
Balance as of December 31, 2011 | 39,912 | |||
Goodwill recorded for Copiun | 15,133 | |||
Goodwill recorded for AppCentral | 11,111 | |||
|
| |||
Balance as of December 31, 2012 | $ | 66,156 | ||
|
| |||
6. Debt
Term loan and revolving credit facility
In January 2011, the Company entered into a loan and security agreement with a bank for funding its working capital and other general corporate needs. This agreement was amended in July 2011, October 2011 and June 2012. The amendments allowed for the Company to borrow up to an aggregate $22.5 million. Advances may be repaid over a period of 36 months or 48 months and carry an interest rate fixed as of the funding date equal to the Wall Street Journal prime rate plus 2.0%. In January 2011 and September 2011, the Company borrowed $6.0 million and $2.5 million, respectively, repayable in 36 monthly installments from the date of each borrowing. In December 2011, the Company borrowed $5.5 million repayable in 48 monthly installments. Each of these borrowings had an interest rate of 5.25%. In July 2012 and September 2012, the Company borrowed $6.0 million and $2.5 million, respectively, repayable in 36 monthly installments from the date of borrowing. Each of these 2012 borrowings had an interest rate of 5.0%. The borrowings had end of term payments of $165,000, $68,750, $192,500, $75,000 and $31,250 for the January 2011, September 2011, December 2011, July 2012 and September 2012 borrowings, respectively. As a result, the effective interest rate for the loans combined is approximately 7.0%. As part of the June 2012 amendment, the Company also renegotiated the annual interest rate on a prospective basis on its 2011 borrowings ($9.8 million principal outstanding at June 2012) with this same bank from 5.25% to 5.0%. The lower interest rate was effective beginning in July 2012 for the remaining terms of the loans. The renegotiation of the interest rate was not so substantial as to be considered to result in the
F-22
Table of Contents
GOOD TECHNOLOGY CORPORATION
Notes to consolidated financial statements—(Continued)
extinguishment of the original debt and therefore, the Company did not record a gain or loss upon the modification. The principal amounts outstanding on the loans as of December 31, 2012 were $15.2 million. No additional amounts were available for borrowing at December 31, 2012.
As of December 31, 2012, the agreement also provided for an asset-based revolving line of credit of up to $10.0 million. The amount available on the revolving line of credit at any point in time is based on 80% of eligible receivables and is subject to a borrowing base calculation. Principal amounts outstanding under the revolving line accrue interest at a floating per annum rate equal to the Wall Street Journal prime rate plus 1.5% and are repayable monthly. No borrowings have been made against the revolving line of credit, but as of December 31, 2012, the available borrowing base was reduced by $4.3 million for outstanding letters of credit; bringing down the available revolving line of credit to $5.7 million. The revolving credit line has a nonrefundable annual commitment fee of 0.5% on the maximum revolving line as well as an unused line charge to be paid quarterly, between 0.3%-0.5% per annum depending on the average unused portion of the revolving line. Further, a letter of credit fee is charged to the Company of 1.25% per annum of the face amount of each letter of credit issued during the term of such issuance and upon the renewal of such letter of credit.
The term loans and the revolving line of credit under the agreement are collateralized by all Company assets with the exception of intellectual property; however, it does include all proceeds of all intellectual property. In addition, the Company has provided a negative pledge regarding its intellectual property and cannot encumber it without the lender’s consent. The agreement contains financial covenants which require the Company (1) to maintain liquidity of unused amounts on the borrowings or the revolving line, whichever is less, plus unrestricted cash and cash equivalents (“unrestricted cash”) of at least $10.0 million; (2) to achieve cash flow performance metrics as defined in the amended agreement; (3) limit capital expenditures to no greater than $12.0 million annually; and (4) to maintain defined ratio levels for maximum senior leverage, minimum fixed charge coverage and current assets-to-current liabilities. Immediately upon the occurrence and during the continuance of an event of default, including the non-compliance with the above financial covenants, the lender may increase the interest rate per annum 3.0% above the rate that is otherwise applicable. Both the term loan and the revolving credit facility contain a material adverse change clause in an event of default of any financial covenants. For the quarter ended September 30, 2012, the Company was not in compliance with the fixed charge coverage ratio and for October 2012, the Company was not in compliance with the current assets-to-current liabilities ratio. In November 2012, the Company obtained a waiver from the lender for a fee of $0.2 million, which the Company has recorded as debt issuance cost within notes payable and is amortizing over the remaining term of the note. As a condition of the waiver, the Company agreed to reduce its undrawn revolving credit line from $15.0 million to $10.0 million, decreased the required unrestricted cash requirement, excluding unused amounts on the borrowings or the revolving line, from $10.0 million to $7.5 million, and added financial covenants that require the Company to maintain a certain ratio of cash and accounts receivable balances to outstanding loan and revolving credit line balances, and to secure at least $50.0 million in capital financing. In April 2013, the Company issued Series C redeemable convertible preferred stock for gross proceeds of $50.0 million and the Company was in compliance with all these covenants as of April 2013. Following the financing, the Company and the lender negotiated an additional loan covenant to maintain a defined minimum adjusted gross profit amount measured on a trailing six month basis. In addition, the Company is required to maintain unrestricted cash and cash equivalents and unused amounts on the borrowings of at least $17.5 million. The maximum revolving credit line amount was reestablished to $15.0 million.
F-23
Table of Contents
GOOD TECHNOLOGY CORPORATION
Notes to consolidated financial statements—(Continued)
Aggregate annual payments due on the term loans as of December 31, 2012 are as follows (in thousands):
| Amount | ||||
2013 | $ | 7,645 | ||
2014 | 5,451 | |||
2015 | 3,537 | |||
|
| |||
Total payments | 16,633 | |||
Less: amount representing interest | (1,297 | ) | ||
|
| |||
Total debt | 15,336 | |||
Less: unamortized debt issuance costs | (169 | ) | ||
|
| |||
| 15,167 | ||||
Less: current portion | (6,971 | ) | ||
|
| |||
| $ | 8,196 | |||
|
| |||
Other notes payable
In October 2010, the Company reached an agreement with Motorola to resolve all disputes and claims related to the acquisition by the Company of Good Technology, Inc. from Motorola. As part of the agreement, the Company agreed to pay Motorola $3.0 million plus 5.0% interest in twelve monthly installments beginning in October 2010. As of December 31, 2010, $2.3 million was outstanding on the note payable and it was fully paid as of December 31, 2011.
7. Commitments and contingencies
Lease commitments
The Company has numerous facility operating leases and equipment under capital lease at locations in the United States and other countries. Future minimum lease payments under all noncancellable operating and capital leases with terms in excess of one year were as follows as of December 31, 2012 (in thousands):
| Capital Leases | Operating Leases | |||||||
2013 | $ | 842 | $ | 3,818 | ||||
2014 | — | 3,499 | ||||||
2015 | — | 3,007 | ||||||
2016 | — | 2,950 | ||||||
2017 | — | 2,924 | ||||||
Thereafter | — | 3,848 | ||||||
|
|
|
| |||||
Total minimum lease payments | 842 | $ | 20,046 | |||||
|
| |||||||
Deduct: Amounts representing interest | (15 | ) | ||||||
|
| |||||||
Present value of minimum lease payments | 827 | |||||||
Deduct: Current portion of capital lease obligation | (827 | ) | ||||||
|
| |||||||
Long-term portion of capital lease obligation | $ | — | ||||||
|
| |||||||
F-24
Table of Contents
GOOD TECHNOLOGY CORPORATION
Notes to consolidated financial statements—(Continued)
The Company recognizes rent expense on a straight-line basis over the lease period. Total rent expense was $2.3 million, $2.4 million and $3.5 million for the years ended December 31, 2010, 2011 and 2012, respectively.
The following table sets forth the composition of capital leases reflected as property and equipment, net in the consolidated balance sheets (in thousands):
| As of December 31, | ||||||||
| 2011 | 2012 | |||||||
Computers and equipment | $ | 3,391 | $ | 3,391 | ||||
Accumulated amortization | (2,900 | ) | (3,346 | ) | ||||
|
|
|
| |||||
Total | $ | 491 | $ | 45 | ||||
|
|
|
| |||||
Depreciation expense for property and equipment under capital leases was $1.1 million, $1.0 million and $0.4 million for the years ended December 31, 2010, 2011 and 2012, respectively.
Litigation
The Company is party to various legal proceedings. Management currently believes that the ultimate outcome of these proceedings, individually and in the aggregate, will not have a material adverse effect on its financial position, results of operations and statement of cash flows. If, however, an unfavorable ruling were to occur in any of the legal proceedings described below, there exists the possibility of a material adverse effect on the Company’s financial position, results of operations and cash flows. The Company accrues for litigation matters that it considers probable and for which the loss can be reasonably estimated. In the event that a probable loss cannot be reasonably estimated, the Company has not accrued for such losses. The Company discloses potential losses when they are reasonably possible. Legal costs incurred and expected to be incurred related to litigation matters are expensed as incurred.
Altexia SA settlement.In March 2011, the Company paid $2.0 million related to a settlement agreement with the former majority shareholders of Altexia SA, an entity acquired by the Company in February 2007. Approximately $0.7 million related to an earnout arrangement with the prior shareholders of Altexia and was expensed in prior years through 2009. Approximately $0.6 million related to the earnout arrangement, and was accounted for as an adjustment to the purchase price. The remaining $0.7 million was related to non-pecuniary damages, which was expensed in 2011. Under the terms of the settlement agreement, the Company and former majority shareholders agreed to definitively and irrevocably end the dispute between the two parties. Also in connection with the settlement agreement, $0.8 million held in escrow for the purchase of minority shares in Altexia SA was returned to the Company.
Employee matter.In September 2012, the Company was delivered a written notice seeking damages by an employee. On October 3, 2012 without admitting any liability, the Company offered to settle these claims. The offer includes a combination of equity compensation, wages, and other payments totaling approximately $3.0 million, net of expected insurance recovery. The Company believes that payment of this amount to settle this matter is probable and recorded an expense for this amount in its results of operations for the quarter ended September 30, 2012. The Company is not able to estimate when this amount is likely to be paid out. In October 2012, a claim was filed regarding this matter with the Superior Court of the State of California in Santa Clara County seeking compensatory and exemplary damages as well as other fees.
Excitor litigation.After being placed on notice by the Company of its infringement of the Company’s patents and other claims of unfair business practices, on August 9, 2011, Excitor A/S (“Excitor”) filed in U.S. Federal Court for the Southern District, New York seeking a declaration that they do not infringe on the Company’s patents and that the patents are invalid. The Excitor motion seeks a judicial determination as well as
F-25
Table of Contents
GOOD TECHNOLOGY CORPORATION
Notes to consolidated financial statements—(Continued)
recovery of costs. On May 23, 2012, the Company filed a patent infringement motion against Excitor in the U.S. Federal Court for the Southern District, New York and subsequently filed similar actions against Excitor in Germany, Sweden, and Finland. The Company was seeking an injunction as well as monetary damages from infringement of the Company’s intellectual property rights. On January 23, 2013, Excitor and the Company entered into a settlement agreement resolving the claims made in the litigation, which included certain payments and royalties payable to the Company and the grant of a non-exclusive license of certain of the Company’s patents to Excitor.
LRW / Fixmo litigation. In June 2011, the Company filed a patent infringement lawsuit against Little Red Wagon Technologies, et al., or LRW, in U.S. Federal Court for the Northern District, Texas. In the connection with this litigation, the Company subsequently filed suit against Fixmo, Inc., or Fixmo, on the basis that Fixmo was serving as a distributor and reseller of LRW’s technology products and/or that Fixmo’s products also infringe certain of the Company’s patents. The Company is seeking a permanent injunction against infringement, monetary damages and attorney’s fees and costs against LRW and Fixmo. In January 2013, a claims construction hearing, also known as a Markman hearing, was conducted in the N.D. Texas Action. The court’s ruling on this Markman hearing has not yet occurred.
MobileIron / AirWatch litigation.On November 14, 2012, the Company filed separate patent infringement lawsuits against MobileIron and AirWatch in the U.S. District Court for the Northern District of California. The lawsuits assert that MobileIron and AirWatch have infringed upon four of the Company’s patents. The Company is seeking permanent injunction against infringement, monetary damages and attorney’s fees and costs against MobileIron and AirWatch. In addition, the Company claims that MobileIron has violated the Lanham Act and related law by engaging in a marketing campaign based on falsehoods and misleading claims about Good Technology and its product offerings. In its response to the Company’s lawsuit against it, in March 2013, MobileIron asserted a claim that the Company is infringing one of MobileIron’s U.S. patents. The Company is currently in the very early stages of the litigation and will be vigorously pursuing the lawsuits against MobileIron and AirWatch and defending any claims against the Company. The Company’s analysis of the asserted MobileIron patent is in the early stages and it is unable to predict the likelihood of success of MobileIron’s infringement claim.
Other matters. The Company periodically may receive claims relating to the quality of its products, including claims for additional labor costs, reimbursement to customers for damages incurred from system down time or other network disruptions, costs for software defects or other damages. Receipt of these claims and requests occurs in the ordinary course of the Company’s business, and the Company responds based on the specific circumstances of each event. The Company records an accrual for losses relating to these types of claims when it considers those losses probable and when a reasonable estimate of loss can be determined.
Guarantees and indemnifications
The Company’s software licensing agreements generally include a limited warranty that its software will substantially conform to the specifications set forth in relevant end user documentation during the warranty period, usually 90 days from the date of electronic delivery of software to the customer.
The Company’s software sales agreements generally include certain provisions for indemnifying customers against liabilities if the Company’s products infringe a third party’s intellectual property rights. To date, the Company has not incurred any material costs as a result of such indemnifications and has not accrued any liabilities related to such obligations in the consolidated financial statements.
The Company has also agreed to indemnify its directors and executive officers for costs associated with any fees, expenses, judgments, fines and settlement amounts incurred by them in any action or proceeding to which
F-26
Table of Contents
GOOD TECHNOLOGY CORPORATION
Notes to consolidated financial statements—(Continued)
any of them are, or are threatened to be, made a party by reason of their service as a director or officer. The Company maintains director and officer insurance coverage that would generally enable it to recover a portion of any future amounts paid. The Company also may be subject to indemnification obligations by law with respect to the actions of its employees under certain circumstances and in certain jurisdictions.
Restricted cash and letters of credit
As of December 31, 2011, restricted cash primarily consisted of $1.2 million with respect to a marketing development fund agreement with a customer. Additionally, the Company entered into irrevocable stand-by letters of credit in connection with agreements with a travel service provider. This letter of credit was collateralized by a restricted bank deposit of $0.2 million. As of December 31, 2012, restricted cash of $0.4 million related to a security deposit for legal services while the stand-by letters of credit was unchanged at $0.2 million.
Arrangement with BoxTone, Inc.
In December 2012, the Company and BoxTone, Inc. (“BoxTone”) entered into an agreement whereby the Company will resell BoxTone’s software to the Company’s customers. The arrangement provides the Company’s customers access to BoxTone’s advanced mobile device management, mobile application management and mobile service management capabilities. Under the terms of the arrangement, the Company is obligated to purchase a minimum of $12.0 million of BoxTone’s software licenses throughout 2013. In addition, as part of the arrangement, the Company paid BoxTone $0.8 million in 2012 to perform certain research and development services which is being recognized as research and development expenses as the services are provided. As of December 31, 2012, $0.4 million of the amount paid for the research and development services was recorded in prepaid expenses and other current assets.
8. Intellectual property licensing
In December 2010, the Company and Nokia Corporation (“Nokia”) entered into a License Agreement (“Agreement”) pursuant to which the Company granted a nonexclusive, nontransferable, irrevocable, perpetual license to certain intellectual property to Nokia. As part of the Agreement, Nokia agreed to make certain payments and assigned to the Company certain patents. The Company granted to Nokia a nonexclusive, worldwide license to all patent rights owned or sub-licensable by the Company for up to a period of three years from the date of license. The Company is recognizing revenues on the license on a straight-line basis over three years.
In July 2009, the Company and Research in Motion (“RIM”) entered into a Global Transaction Agreement pursuant to which all outstanding litigation between the parties was settled. The parties also entered into a Settlement Agreement (the “Settlement Agreement”) and a License Agreement (the “License”). In addition, the Company agreed to assign certain patents to RIM, pursuant to a Patent Purchase Agreement and enter into a Grant-Back License Agreement. As part of the Settlement Agreement, RIM agreed to pay the Company $267.5 million and assigned to the Company certain patents. The Company does not intend to use any of the patents assigned to it. The Company assigned no value to the cross-license as it was given in the context of litigation and is deemed defensive in nature. Since the license from the Company to RIM contains a license to future intellectual property developed by the Company over a ten-year period (the recapture period), the total consideration received from RIM will be amortized ratably over the period beginning in November 2005 (the date of first alleged infringement) and ending in July 2019 (the end of the recapture period).
In September 2007, the Company and IBM entered into a Patent License Agreement (the “License Agreement”) pursuant to which the Company granted IBM a nonexclusive, non-transferable, irrevocable,
F-27
Table of Contents
GOOD TECHNOLOGY CORPORATION
Notes to consolidated financial statements—(Continued)
perpetual, worldwide license under its Licensed Patents as defined in the License Agreement with an effective filing date that is prior to four years after the effective date of the License. The Company received no licenses and no covenant not-to-sue from IBM. Under the terms of the License Agreement, IBM is entitled to receive rights to future intellectual property during a four year patent capture period; as a result the consideration received was amortized on a straight-line basis over the 48-month recapture period.
As part of the agreements with Nokia and IBM described above, the Company received an aggregate of $34.5 million in cash payments.
9. Equity incentive plans
The Company’s equity incentive plans are broad-based retention programs. The plans are intended to attract and retain talented employees, directors and nonemployee consultants. In November 2006, the Company adopted the Visto Corporation 2006 Stock Plan (the “2006 Plan”) which replaced its Visto 1996 Stock Plan, its 2003 U.K. Stock Plan and its International Stock Plan (collectively, the “Prior Plans”). Following the effective date of the 2006 Plan, any shares remaining available for grant under the Prior Plans were no longer available for grant. The 2006 Plan provides for the granting of stock options to employees, directors and consultants. Incentive stock options may be granted only to employees. Nonqualified stock options may be granted to employees, directors and consultants. The exercise price of an incentive stock option and a nonqualified stock option shall not be less than 100% of the fair market value of such shares on the date of grant. Stock options granted under the 2006 Plan generally vest over a four year period and expire no more than ten years from the date of grant. The number of shares of common stock reserved for issuance under the 2006 Plan is 96,514,382.
In connection with the acquisitions of Copiun, Inc. and AppCentral, Inc., the Company assumed the outstanding stock options and restricted stock awards under the Copiun 2009 Stock Incentive Plan (the “Copiun Plan”) and the AppCentral 2010 Stock Incentive Plan (the “AppCentral Plan”), respectively (see Note 3). Outstanding stock options generally vest over four years and expire ten years from the date of grant. No additional shares, including forfeitures and cancellations, are available for future grant under these plans.
The following table summarizes the stock option activity under the Plans for the indicated periods:
| Options Outstanding | ||||||||||||||||
| Shares Available for Future Grants | Shares Subject to Options Outstanding | Weighted- Average Exercise Price Per Option | Weighted- Average Remaining Contractual Terms (Yrs) | |||||||||||||
Balances as of December 31, 2011 | 5,064,109 | 64,522,868 | $ | 0.50 | ||||||||||||
Authorized | 9,371,500 | |||||||||||||||
Granted(1) | (13,689,671 | ) | 14,172,719 | $ | 3.12 | |||||||||||
Options assumed in acquisitions | — | 750,062 | $ | 0.92 | ||||||||||||
Options exercised | — | (18,549,449 | ) | $ | 0.17 | |||||||||||
Terminated/cancelled/forfeited | 4,994,077 | (5,036,621 | ) | $ | 1.31 | |||||||||||
|
|
|
| |||||||||||||
Balances as of December 31, 2012 | 5,740,015 | 55,859,579 | $ | 1.21 | 7.62 | |||||||||||
|
|
|
| |||||||||||||
Vested and expected to vest as of December 31, 2012 | 51,416,354 | $ | 1.12 | 7.31 | ||||||||||||
|
| |||||||||||||||
Exercisable as of December 31, 2012 | 30,263,242 | $ | 0.66 | 6.73 | ||||||||||||
|
| |||||||||||||||
| (1) | Included in options granted are 483,048 shares subject to options related to future services to be provided by former Copiun and AppCentral employees. |
F-28
Table of Contents
GOOD TECHNOLOGY CORPORATION
Notes to consolidated financial statements—(Continued)
The weighted average grant date fair value of options granted during the years ended December 31, 2010, 2011, and 2012 was $0.37, $0.77, and $1.83, respectively.
The intrinsic value of unexercised and outstanding stock options that are expected to vest is the difference between the exercise price and the fair value of the underlying common stock as of December 31, 2012. The aggregate intrinsic value for stock options outstanding as of December 31, 2010, 2011, and 2012 was $19.4 million, $76.0 million and $183.9 million, respectively.
The intrinsic value of exercised stock options is the difference between the exercise price and the fair value of the underlying common stock as of the exercise date. The total intrinsic value of stock options exercised for the years ended December 31, 2010, 2011, and 2012 was $1.5 million, $12.2 million, and $63.6 million, respectively.
The aggregate intrinsic value for stock options exercisable as of December 31, 2012 was $116.3 million. The aggregate intrinsic value of stock options vested and expected to vest, net of estimated forfeitures as of December 31, 2012, was $173.9 million.
The aggregate grant date fair value for vested options for the years ended December 31, 2010, 2011 and 2012 was $1.9 million, $3.9 million, and $6.7 million, respectively.
As of December 31, 2012, there was $21.5 million of total unrecognized stock-based compensation expense related to stock options, net of expected forfeitures, that will be recognized over the weighted average period of 2.45 years.
Restricted stock awards
In connection with the Copiun and AppCentral acquisitions, the Company assumed 734,000 and 459,000 shares of restricted common stock, respectively (see Note 3). As of December 31, 2012, 479,000 of these restricted stock awards were vested. As of December 31, 2012, there was $1.2 million of unamortized stock-based compensation expense related to unvested restricted stock awards, which are expected to be recognized over a weighted average period of 1.45 years.
Stock-based compensation expense
The following table sets forth the total stock-based compensation expense included in the Company’s consolidated statements of operations (in thousands):
| Years Ended December 31, | ||||||||||||
| 2010 | 2011 | 2012 | ||||||||||
Cost of revenues | $ | 131 | $ | 369 | $ | 774 | ||||||
Research and development | 656 | 1,032 | 2,529 | |||||||||
Sales and marketing | 850 | 1,457 | 3,263 | |||||||||
General and administrative | 943 | 1,613 | 2,635 | |||||||||
|
|
|
|
|
| |||||||
Total | $ | 2,580 | $ | 4,471 | $ | 9,201 | ||||||
|
|
|
|
|
| |||||||
In 2010, the Company negotiated a stock option modification with its former CEO as a part of his exit package which accelerated the vesting period of some of his options and extended the time that he could exercise his vested options for up to two years. As a result of the extended exercise period, the modification resulted in
F-29
Table of Contents
GOOD TECHNOLOGY CORPORATION
Notes to consolidated financial statements—(Continued)
$0.4 million additional stock compensation expense in 2010, which is included in amounts shown above. These options were exercised during 2012.
The weighted average estimated fair value of stock options granted during the years ended December 31, 2010, 2011 and 2012, were calculated under the Black-Scholes option pricing model, using the following weighted average assumptions:
| Years Ended December 31, | ||||||||||||
| 2010 | 2011 | 2012 | ||||||||||
Risk-free rate | 1.83 | % | 1.35 | % | 0.82 | % | ||||||
Expected dividend yield | 0.00 | % | 0.00 | % | 0.00 | % | ||||||
Expected volatility | 68.10 | % | 67.04 | % | 58.85 | % | ||||||
Expected term (years) | 6.03 | 6.03 | 6.05 | |||||||||
As the Company has no active trading history, expected volatility was derived from historical volatilities of several peer companies deemed to be comparable to the Company’s business.
The expected term represents the period that the Company’s stock-based awards are expected to be outstanding. As the Company does not have sufficient historical experience for determining the expected term of the stock option awards granted, it has based its expected term on the simplified method available under U.S. GAAP.
The absence of an active market for the Company’s common stock also requires the Company’s board of directors, the members of which the Company believes have extensive business, finance and venture capital experience, to estimate the fair value of its common stock for purposes of granting options and for determining stock-based compensation expense for the periods presented. The Company obtained contemporaneous third-party valuations to assist the board of directors in determining fair market value. These contemporaneous third-party valuations used the methodologies, approaches and assumptions consistent with the American Institute of Certified Public Accountants Practice Guide, Valuation of Privately-Held-Company Equity Securities Issued as Compensation, or the AICPA Practice Guide. All options granted were intended to be exercisable at a price per share not less than the fair value of the shares of the Company’s common stock underlying those options on their respective dates of grant.
Common stock subject to repurchase
The Company allows employees to exercise options prior to vesting. In addition, the Company has restricted stock awards from acquisitions which employees had exercised prior to vesting. The Company has the right to repurchase these options and restricted stock awards at the original purchase price paid by the employee for any unvested (but exercised) shares of common stock upon the termination of the employee. The consideration received for an exercise of an option or restricted stock award is considered to be a deposit of the exercise price and the related dollar amount is recorded as a liability on the consolidated balance sheets. The liability is reclassified into equity on a pro rata basis as the options and restricted stock awards vest. The shares subject to repurchase are not deemed to be issued for accounting purposes until those shares vest. As of December 31, 2012, 756,414 shares of common stock were subject to repurchase for $53,000.
F-30
Table of Contents
GOOD TECHNOLOGY CORPORATION
Notes to consolidated financial statements—(Continued)
10. Income taxes
The components of income (loss) before income taxes were as follows (in thousands):
| Years Ended December 31, | ||||||||||||
| 2010 | 2011 | 2012 | ||||||||||
United States | $ | (32,474 | ) | $ | (38,769 | ) | $ | (93,114 | ) | |||
Foreign | (1,732 | ) | 2,157 | 2,220 | ||||||||
|
|
|
|
|
| |||||||
Total | $ | (34,206 | ) | $ | (36,612 | ) | $ | (90,894 | ) | |||
|
|
|
|
|
| |||||||
The components of the benefit from (provision for) income taxes were as follows (in thousands):
| Years Ended December 31, | ||||||||||||
| 2010 | 2011 | 2012 | ||||||||||
Current provision: | ||||||||||||
US Federal tax | $ | — | $ | — | $ | — | ||||||
US state tax | (3,455 | ) | (447 | ) | (366 | ) | ||||||
Foreign tax | (3,088 | ) | (4,414 | ) | (2,598 | ) | ||||||
|
|
|
|
|
| |||||||
| (6,543 | ) | (4,861 | ) | (2,964 | ) | |||||||
|
|
|
|
|
| |||||||
Deferred benefit: | ||||||||||||
US Federal tax | 292 | — | 3,167 | |||||||||
US state tax | 28 | — | 260 | |||||||||
Foreign tax | — | 482 | (6 | ) | ||||||||
|
|
|
|
|
| |||||||
| 320 | 482 | 3,421 | ||||||||||
Total benefit from (provision for) income taxes | $ | (6,223 | ) | $ | (4,379 | ) | $ | 457 | ||||
|
|
|
|
|
| |||||||
Included in the income tax benefit for the year ended December 31, 2012 was a $3.4 million tax benefit from the release of valuation allowances from the Company’s deferred tax assets (“DTAs”). In connection with the Company’s acquisition of Copiun during 2012, deferred tax liabilities (“DTLs”) were established, primarily related to the acquired identifiable intangible assets. These DTLs exceeded the acquired DTAs by $3.4 million, thus allowing the Company to realize a tax benefit by releasing the valuation allowances associated with the Company’s overall DTAs.
A reconciliation between the statutory U.S. federal income tax rate of 35.0% and the Company’s actual effective income tax rate is as follows:
| Years Ended December 31, | ||||||||||||
| 2010 | 2011 | 2012 | ||||||||||
Expected provision at statutory federal rate | 35.0 | % | 35.0 | % | 35.0 | % | ||||||
Change in valuation allowance | (41.8 | ) | (37.4 | ) | (33.5 | ) | ||||||
State income taxes, net of federal tax benefits | 1.7 | (0.2 | ) | 2.6 | ||||||||
Stock-based compensation | (1.8 | ) | (2.3 | ) | (2.1 | ) | ||||||
Foreign income or losses taxed at different rates | (6.1 | ) | 1.4 | (0.1 | ) | |||||||
Foreign withholding tax | (3.0 | ) | (6.5 | ) | (1.9 | ) | ||||||
Tax credits | 1.8 | 0.2 | 0.3 | |||||||||
Other | (4.0 | ) | (2.1 | ) | 0.2 | |||||||
|
|
|
|
|
| |||||||
Total benefit from (provision for) income taxes | (18.2 | )% | (11.9 | )% | 0.5 | % | ||||||
|
|
|
|
|
| |||||||
F-31
Table of Contents
GOOD TECHNOLOGY CORPORATION
Notes to consolidated financial statements—(Continued)
Deferred income taxes reflect the tax effects of net operating loss and tax credit carry-forwards and the net temporary differences between the carrying amounts of assets and liabilities for financial reporting and the amounts used for income tax purposes. The components of the Company’s deferred tax assets and liabilities were as follows (in thousands):
| Years Ended December 31, | ||||||||
| 2011 | 2012 | |||||||
Deferred tax assets: | ||||||||
Net operating losses | $ | 73,285 | $ | 88,776 | ||||
Deferred revenues | 62,962 | 87,657 | ||||||
Research and development and other credits | 7,387 | 10,762 | ||||||
Accrued expenses and reserves | 1,345 | 4,531 | ||||||
Stock-based compensation | 1,882 | 2,584 | ||||||
Fixed assets | 1,804 | 947 | ||||||
Other | 700 | 879 | ||||||
|
|
|
| |||||
Gross deferred tax assets | 149,365 | 196,136 | ||||||
Valuation allowance | (143,719 | ) | (178,332 | ) | ||||
|
|
|
| |||||
Total deferred tax assets after valuation allowance | $ | 5,646 | $ | 17,804 | ||||
|
|
|
| |||||
Deferred tax liabilities: | ||||||||
Acquired intangible assets | (1,331 | ) | (8,904 | ) | ||||
Deferred commissions | (3,212 | ) | (7,755 | ) | ||||
Unrealized losses | (621 | ) | (669 | ) | ||||
|
|
|
| |||||
Total deferred tax liabilities | (5,164 | ) | (17,328 | ) | ||||
|
|
|
| |||||
Net deferred tax assets | $ | 482 | $ | 476 | ||||
|
|
|
| |||||
Reported as: | ||||||||
Current deferred tax assets(1) | $ | 5 | $ | 1,972 | ||||
Current deferred tax liabilities(2) | (851 | ) | (160 | ) | ||||
Non-current deferred tax assets(3) | 1,328 | 221 | ||||||
Non-current deferred tax liabilities(4) | — | (1,557 | ) | |||||
|
|
|
| |||||
Net deferred tax assets | $ | 482 | $ | 476 | ||||
|
|
|
| |||||
| (1) | Included within prepaid expenses and other current assets on the consolidated balance sheets |
| (2) | Included within accrued and other current liabilities on the consolidated balance sheets. |
| (3) | Included within other assets on the consolidated balance sheets. |
| (4) | Included within other non-current liabilities on the consolidated balance sheets. |
During 2010, 2011 and 2012, the Company maintained a valuation allowance against its US deferred tax assets based on the assessment of both its positive and negative evidence, including significant losses incurred to date, such that it is more likely than not that these assets will not be realized. The Company intends to maintain a valuation allowance until sufficient positive evidence exists to support a reversal of a valuation allowance. The Company’s non-US jurisdictions have net deferred tax assets. Based on the assessment of both positive and negative evidence for each non-US jurisdiction, it is more likely than not these assets will be realized and thus no valuation allowance is required.
F-32
Table of Contents
GOOD TECHNOLOGY CORPORATION
Notes to consolidated financial statements—(Continued)
The following table details changes in the valuation allowance for deferred tax assets (in thousands):
| Beginning Balance | Increases | Valuation Allowance Release | Balance at Year End | |||||||||||||
Year ended December 31, 2012 | $ | (143,719 | ) | $ | (38,039 | ) | $ | 3,426 | (1) | $ | (178,332 | ) | ||||
Year ended December 31, 2011 | (129,906 | ) | (13,813 | ) | — | (143,719 | ) | |||||||||
Year ended December 31, 2010 | (115,622 | ) | (14,284 | ) | — | (129,906 | ) | |||||||||
| (1) | Includes a tax benefit related to the release of valuation allowances as a result of the Copiun acquisition. |
The Company incurs income and withholding taxes in a number of jurisdictions with the most significant amounts incurred in South Korea, Spain, United Kingdom, China and state taxes in the United States.
At December 31, 2012, the Company had net operating loss carry forwards for federal tax income purposes of approximately $275.2 million, which expire in the period from 2021 to 2032 and federal tax credits of approximately $12.1 million, which expire in the period from 2020 to 2024.
At December 31, 2012, the Company had net operating loss carry forwards for state income tax purposes of approximately $246.9 million, which will expire at various dates from 2014 to 2031, and various tax credits of approximately $6.3 million, which will not expire.
Approximately $57.0 million of federal and $30.6 million of state net operating loss carry-forwards are attributable to employee stock option deductions, the benefit from which will be allocated to paid-in-capital rather than current income when recognized. Because of the change of ownership provisions of the Tax Reform Act of 1986, use of a portion of the Company’s net operating loss and tax credit carry-forwards may be subject to an annual limitation. The net operating loss and tax credit carry-forwards may expire before utilization.
The total amount of gross unrecognized tax benefits was $9.4 million as of December 31, 2012, of which up to $3.0 million would affect the Company’s effective tax rate if realized. A reconciliation of the beginning and ending amount of unrecognized tax benefits in 2010, 2011 and 2012 was as follows (in thousands):
| As of December 31, | ||||||||||||
| 2010 | 2011 | 2012 | ||||||||||
Beginning of year gross unrecognized tax benefits | $ | 7,231 | $ | 8,265 | $ | 9,013 | ||||||
Additions for tax positions taken in a prior year | 57 | 549 | 245 | |||||||||
Additions for tax positions taken in the current year | 1,060 | 274 | 272 | |||||||||
Adjustments for tax positions for changes in currency translation | (13 | ) | 16 | 50 | ||||||||
Reductions for tax positions taken in the prior year | (70 | ) | — | (21 | ) | |||||||
Reductions for tax positions taken in the prior year due to statutes lapsing | — | (91 | ) | (110 | ) | |||||||
|
|
|
|
|
| |||||||
End of year gross unrecognized tax benefits | $ | 8,265 | $ | 9,013 | $ | 9,449 | ||||||
|
|
|
|
|
| |||||||
The Company’s policy is to recognize interest and penalties accrued on any unrecognized tax benefits as a component of income tax expense. The Company recognized income tax expense related to interest and penalties of $0.5 million, $0.1 million and $0.1 million in the years ended December 31, 2010, 2011 and 2012, respectively. As of December 31, 2011 and 2012, the Company had a liability for interest and penalties of $1.3 million and $1.4 million, respectively.
The Company does not anticipate that the amount of existing unrecognized tax benefits will significantly increase or decrease with the next 12 months. The Company files income tax returns in the United States and
F-33
Table of Contents
GOOD TECHNOLOGY CORPORATION
Notes to consolidated financial statements—(Continued)
various states, which typically have three or four tax years open at any point in time. Because of the net operating loss carry-forwards, substantially all of the Company’s tax years remain open to federal and state tax examination. The Company’s foreign tax returns are open to audit under the statutes of limitations of the respective foreign countries in which the subsidiaries are located.
U.S. income taxes and foreign withholding taxes associated with the repatriation of earnings of foreign subsidiaries were not provided for on a cumulative total of $6.5 million of undistributed earnings for certain foreign subsidiaries as of December 31, 2012. The Company intends to reinvest these earnings indefinitely in its foreign subsidiaries. If these earnings were distributed to the United States in the form of dividends or otherwise, or if the shares of the relevant foreign subsidiaries were sold or otherwise transferred, the Company would be subject to additional U.S. income taxes (subject to an adjustment for foreign tax credits) and foreign withholding taxes. Determination of the amount of unrecognized deferred income tax liability related to these earnings is not practicable.
11. Fair value measurements
Assets and liabilities measured and recorded at fair value on a recurring basis consisted of the following types of instruments as of December 31, 2011 and 2012 (in thousands):
| December 31, 2011 | ||||||||||||||||
| Level 1 | Level 2 | Level 3 | Total | |||||||||||||
Assets | ||||||||||||||||
Money market funds | $ | 38,909 | $ | — | $ | — | $ | 38,909 | ||||||||
|
|
|
|
|
|
|
| |||||||||
Liabilities | ||||||||||||||||
Foreign currency forward contracts | $ | — | $ | 23 | $ | — | $ | 23 | ||||||||
|
|
|
|
|
|
|
| |||||||||
Series B-1 preferred stock warrants | $ | — | $ | — | $ | 992 | $ | 992 | ||||||||
|
|
|
|
|
|
|
| |||||||||
| December 31, 2012 | ||||||||||||||||
| Level 1 | Level 2 | Level 3 | Total | |||||||||||||
Assets | ||||||||||||||||
Money market funds | $ | 23,866 | $ | — | $ | — | $ | 23,866 | ||||||||
|
|
|
|
|
|
|
| |||||||||
Liabilities | ||||||||||||||||
Foreign currency forward contracts | $ | — | $ | 7 | $ | — | $ | 7 | ||||||||
|
|
|
|
|
|
|
| |||||||||
The aggregate fair value of the Company’s money market funds approximated amortized cost and, as such, there were no unrealized gains or losses on money market funds as of December 31, 2011 and 2012.
F-34
Table of Contents
GOOD TECHNOLOGY CORPORATION
Notes to consolidated financial statements—(Continued)
The table below presents a reconciliation for the Series B-1 preferred stock warrant liability measured and recorded at fair value on a recurring basis using Level 3 inputs for the years ended December 31, 2010, 2011 and 2012 (in thousands):
| Years ended December 31, | ||||||||||||
| 2010 | 2011 | 2012 | ||||||||||
Current provision | ||||||||||||
Beginning balance | $ | 564 | $ | 521 | $ | 992 | ||||||
Loss (gain) recognized in earnings | (43 | ) | 471 | 637 | ||||||||
Exercises | — | — | (1,629 | ) | ||||||||
|
|
|
|
|
| |||||||
Ending balance | $ | 521 | $ | 992 | $ | — | ||||||
|
|
|
|
|
| |||||||
The valuation of the preferred stock warrants and input assumptions used in the valuation is discussed in Note 13. There were no transfers between Level 1 and Level 2 into Level 3 for the periods presented.
12. Redeemable convertible preferred stock and deficit
Redeemable convertible preferred stock
The following table lists the shares of redeemable convertible preferred stock authorized and outstanding as of December 31, 2012 (in thousands, except per share amounts):
| Shares Authorized | Shares Issued and Outstanding | Carrying Amount | Aggregate Liquidation Preference | Liquidation Price per Share | ||||||||||||||||
Series B-1 | 173,500 | 108,159 | $ | 91,236 | $ | 108,159 | $ | 1.00 | ||||||||||||
Series B-2 | 3,650 | 3,649 | 17,662 | 17,954 | $ | 4.92 | ||||||||||||||
Series B-3 | 2,600 | 2,563 | 12,330 | 12,406 | $ | 4.84 | ||||||||||||||
|
|
|
|
|
|
|
| |||||||||||||
| 179,750 | 114,371 | $ | 121,228 | $ | 138,519 | |||||||||||||||
|
|
|
|
|
|
|
| |||||||||||||
The Series B-2 and Series B-3 preferred shares were issued in connection with the Copiun and AppCentral acquisitions, respectively (See Note 3).
Voting rights.The holder of each share of Series B-1, Series B-2 and B-3 redeemable convertible preferred stock is entitled to one vote for each share of common stock into which it is convertible. The holders, voting as a separate class, are entitled to elect four members of the Board of Directors. The holders of common stock, voting separately as a class, shall be entitled to elect one member of the Board of Directors. Holders of redeemable convertible preferred stock and common stock, voting together on an as converted to common stock basis, are entitled to elect any remaining members of the Board of Directors.
Dividend provisions.The holders of Series B-1, Series B-2 and B-3 redeemable convertible preferred stock shall be entitled to receive noncumulative dividends when, as and if declared by the Board of Directors, out of any assets legally available therefore, prior and in preference to any declaration or payment of any dividend on the common stock, at a rate of $0.08, $0.3936 and $0.3872 per share per annum, respectively, as adjusted. No dividends have been declared or paid as of December 31, 2012.
Conversion.Each share of Series B-1, Series B-2 and B-3 redeemable convertible preferred stock is convertible, at the option of the holder, into common stock which is fully paid and nonassessable determined by
F-35
Table of Contents
GOOD TECHNOLOGY CORPORATION
Notes to consolidated financial statements—(Continued)
dividing the applicable original issue price by the conversion price applicable to such shares in effect at the date of conversion, initially on a one for one basis, subject to certain anti-dilution adjustments as set forth in the Company’s restated certificate of incorporation. The conversion price for Series B-1, Series B-2 and B-3 redeemable convertible preferred stock is $1.00, $4.84 and $4.81, respectively. Conversion is automatic upon the earlier of (a) closing of a firm commitment underwritten public offering of the Company’s common stock at an aggregate offering price of not less than $40.0 million and at a price not less than $3.00 per share, or (b) the holders of a majority of the then outstanding shares of preferred stock (voting together as a single class on an as-converted basis) have voted in favor of such a conversion in connection with a liquidation event or a financing transaction in which the per share price is less than $1.00, as adjusted.
Liquidation preference.In the event of any liquidation event, whether voluntary or involuntary, the holders of Series B-1, Series B-2 and Series B-3 redeemable convertible preferred stock shall be entitled to receive, prior and in preference to any distribution of any of the Company’s assets or funds to holders of common stock, an amount equal to each Series’ respective per share amount, plus all accrued or declared but unpaid dividends on such share. For purposes hereof, a liquidation event shall consist of (a) the sale, transfer, exclusive license or other disposition of all or substantially all of the Company’s assets, (b) a merger or consolidation of the Company with or into another entity, (c) the transfer of the Company’s securities to a person or group of affiliated persons that, after such closing, would result in such party holding 50.0% or more of the Company’s then outstanding voting stock, or (d) a liquidation, dissolution or winding up of the Company. These liquidation features cause the Company’s redeemable convertible preferred stock to be classified as mezzanine capital rather than as a component of Good Technology Corporation stockholders’ deficit.
Common stock
Shares of common stock reserved for issuance on an as-if converted basis is as follows (in thousands):
| As of December 31, | ||||||||
| 2011 | 2012 | |||||||
Conversion of redeemable convertible preferred stock | 107,074 | 114,371 | ||||||
Exercise of stock options | 64,523 | 55,860 | ||||||
Available for option grants | 5,064 | 5,740 | ||||||
Exercise of common stock warrants | 4,470 | 4,470 | ||||||
|
|
|
| |||||
| 181,131 | 180,441 | |||||||
|
|
|
| |||||
13. Warrants
Series B-1 redeemable convertible preferred stock warrants
As part of the Company’s acquisition of Good Technology, Inc. from Motorola, the Company issued warrants to purchase 1,084,831 shares of the Company’s Series B-1 redeemable convertible preferred stock to Motorola. The warrants were exercisable from the date of issuance in February 2009 through February 2014, or five years, at an exercise price of $1.00 per warrant. The warrants could be exercised for cash or net share settled. The warrants expire upon the earlier to occur of (i) February 27, 2014 or (ii) the consummation of a termination event (defined as either the sale by the Company of its preferred stock or common stock pursuant to a registration statement under the Securities Act of 1933 or a liquidation event, as such term is defined in the Company’s restated certificate of incorporation). The initial per share fair value of the warrants was determined to be $0.56 based on the Black-Scholes valuation model using the following assumptions: (a) volatility of 70%, (b) contractual term of five years, and (c) risk-free interest rate of 1.99%, and (d) fair value of $0.97 per share of preferred stock. As of
F-36
Table of Contents
GOOD TECHNOLOGY CORPORATION
Notes to consolidated financial statements—(Continued)
December 31, 2010, the per share fair value of the warrants was determined to be $0.48 using the following assumptions: (a) volatility of 70%, (b) remaining contractual term of 3.16 years, and (c) risk-free interest rate of 1.02%, and (d) fair value of $1.01 per share of preferred stock. As of December 31, 2011, the per share fair value of the warrants was determined to be $0.91 using the following assumptions: (a) volatility of 60%, (b) expected contractual term of 1.30 years, (c) risk-free interest rate of 0.12% and (d) fair value of $1.82 per share of preferred stock.
The Company recorded a gain of $43,000, a loss of $0.5 million and a loss of $0.6 million for the changes in the estimated fair value of the preferred stock warrants for the years ended December 31, 2010, 2011 and 2012, respectively. The preferred warrants were classified in other non-current liabilities on the Company’s consolidated balance sheets. In March 2012, all holders of the warrants exercised their warrants for gross proceeds of $1.1 million. The Company recorded the proceeds and reclassified the fair value of the warrant liability at the exercise date in redeemable convertible preferred stock.
Common stock warrants
In July 2009, the Company agreed to offer LG Electronics common stock warrants in order to promote a strategic relationship. The warrants gave LG Electronics rights for up to 5.0% of the Company’s fully diluted shares, conditional upon the achievement of cumulative sales milestones of supported hand-set devices generated by the customer prior to June 30, 2012.
The first issuance of warrants for up to 2.5% of the Company’s fully diluted shares was triggered when the Company’s cumulative sales to LG Electronics reached a predefined target. The second issuance of warrants for up to an additional 2.5% of the Company’s fully diluted shares would only be triggered when the Company’s cumulative sales to LG Electronics reached a second target. In May 2011, the first cumulative sales performance milestone was reached and warrants for 4,432,961 shares of common stock at an exercise price of $1.83 per share were issued. LG Electronics may exercise the warrants from the date of issuance for cash or via net share settlement. The warrant expires upon the earlier to occur of (i) May 23, 2016 or (ii) the consummation of a termination event (defined as either the sale by the Company of its preferred stock or common stock pursuant to a registration statement under the Securities Act of 1933 or a liquidation event, as such term is defined in the Company’s restated certificate of incorporation). The per share fair value of the warrants on date of issue was determined to be $0.36 based on the Black-Scholes valuation model using the following assumptions: (a) volatility of 70%, (b) expected term of 2.9 years, (c) risk-free interest rate of 0.91% and (d) fair value of $1.12 per share of common stock. The Company recorded the fair value at issuance, or $1.6 million, as a reduction in revenues and a decrease in Good Technology Corporation stockholders’ deficit. The second issuance of warrants for the additional 2.5% of the Company’s fully diluted shares was not issued since the Company’s cumulative sales to LG Electronics did not reach the second cumulative sales performance milestone. The Company is no longer obligated to issue any additional common stock warrants to LG Electronics.
14. Employee benefit plans
The Company has made a 401(k) retirement savings plan available to all full-time United States employees. Under this plan, employee and employer contributions and accumulated plan earnings qualify for favorable tax treatment under Section 401(k) of the Internal Revenue Code. The Company’s contributions to the plan began in 2012 and totaled $0.6 million for that year.
The Company has a retirement savings plan available to all of its full-time United Kingdom employees. Under this United Kingdom plan, employee contributions and accumulated plan earnings qualify for favorable tax treatment under Chapter IV, Part XIV, of the United Kingdom Income and Corporation Taxes Act of 1988.
F-37
Table of Contents
GOOD TECHNOLOGY CORPORATION
Notes to consolidated financial statements—(Continued)
Company contributions to the United Kingdom plan for the years ended December 31, 2010, 2011 and 2012 were $85,000, $133,000 and $156,000, respectively.
15. Related party transactions
Transactions with Motorola—In February 2009, the Company acquired all of the outstanding common shares of Good Technology, Inc. from Motorola. In connection with this purchase, the Company issued 15,497,586 shares of its Series B-1 preferred shares and warrants to purchase an additional 1,084,831 of the same shares. Motorola subsequently sold all of its shares and warrants to existing Series B-1 preferred stockholders. For the year ended December 31, 2011, the Company recognized revenues from sales to Motorola of $0.2 million, with no revenues prior to 2011. In addition, the Company issued a note payable to Motorola for $3.0 million, in October 2010 in connection with an agreement between the Company and Motorola to resolve all disputes and claims related to the acquisition by the Company of Good Technology, Inc. from Motorola. The note payable was fully repaid as of December 31, 2011.
Transactions with LG Electronics—The Company had revenues of approximately $3.8 million, $15.3 million, and $16.5 million for the years ended December 31, 2010, 2011 and 2012, respectively, from sales to LG Electronics. Accounts receivable from LG Electronics was $1.4 million at both December 31, 2011 and 2012. As discussed in Note 13, the Company issued common stock warrants in 2011 to LG Electronics.
16. Segment reporting
Operating segments are defined as components of an enterprise about which separate financial information is available that is evaluated regularly by the chief operating decision maker, or decision making group, in deciding how to allocate resources and in assessing performance. The Company’s chief operating decision maker is its Chief Executive Officer. The Chief Executive Officer reviews financial information presented on a consolidated basis, accompanied by information about revenues by geographic region for purposes of allocating resources and evaluating financial performance. The Company has one business activity and there are no segment managers who are held accountable for operations, operating results and plans below the consolidated level. Accordingly, the Company has a single reportable segment.
Product Information
The following table sets forth the Company’s revenues by product line. The Company segments software and services revenue by enterprise software and services and carrier and consumer software and services. Enterprise software and services consist of the Good for Enterprise and Good Dynamics products, and associated maintenance and support services, excluding Good for Enterprise telecommunication carrier customers. Carrier and OEM software and services consist of Good for You products, Good for Enterprise telecommunication carriers and OEM handset manufacturers pursuant to royalty and licensing arrangement. Intellectual property licensing revenues represent cash settlements with various companies for infringement of the Company’s patents, or direct licenses of the Company’s intellectual property.
| Years ended December 31, | ||||||||||||
| 2010 | 2011 | 2012 | ||||||||||
Enterprise software and services | $ | 6,774 | $ | 16,138 | $ | 45,123 | ||||||
Carrier and OEM software and services | 33,228 | 41,987 | 48,405 | |||||||||
|
|
|
|
|
| |||||||
Total software and services revenues | 40,002 | 58,125 | 93,528 | |||||||||
Intellectual property licensing | 25,600 | 27,221 | 23,077 | |||||||||
|
|
|
|
|
| |||||||
Total revenues | $ | 65,602 | $ | 85,346 | $ | 116,605 | ||||||
|
|
|
|
|
| |||||||
F-38
Table of Contents
GOOD TECHNOLOGY CORPORATION
Notes to consolidated financial statements—(Continued)
Geographical information
Operations outside of the United Sates consist principally of research and development and sales activities. Geographic revenues are identified by the location of the end customer and in the event that the Company delivers its software to an OEM, reseller or other channel partner and does not have end customer location information, geographic revenues are identified by the “deliver to” location of the OEM, reseller or other channel partner. The following table presents the Company’s revenues by geographic area (in thousands):
| Years ended December 31, | ||||||||||||
| 2010 | 2011 | 2012 | ||||||||||
United States | $ | 20,050 | $ | 27,331 | $ | 58,160 | ||||||
Canada | 19,606 | 19,603 | 20,353 | |||||||||
Europe | 21,167 | 22,773 | 20,439 | |||||||||
South Korea | 3,777 | 15,124 | 16,457 | |||||||||
Other | 1,002 | 515 | 1,196 | |||||||||
|
|
|
|
|
| |||||||
Total | $ | 65,602 | $ | 85,346 | $ | 116,605 | ||||||
|
|
|
|
|
| |||||||
A substantial majority of the Company’s long lived fixed assets reside in the United States as of December 31, 2011 and 2012.
17. Net loss per share attributable to Good Technology Corporation common stockholders
The Company’s basic net loss per share attributable to Good Technology Corporation common stockholders is calculated by dividing the net loss attributable to Good Technology Corporation common stockholders by the weighted-average number of shares of common stock outstanding for the period. The diluted net loss per share attributable to Good Technology Corporation common stockholders is computed by giving effect to all potential common stock equivalents outstanding for the period, if dilutive. For purposes of this calculation, redeemable convertible preferred stock, stock options to purchase common stock, warrants to purchase redeemable convertible preferred stock and warrants to purchase common stock are considered to be common stock equivalents but have been excluded from the calculation of diluted net loss per share attributable to Good Technology Corporation common stockholders as their effect is antidilutive.
The following table sets forth the computation of the Company’s basic and diluted net loss per share attributable to Good Technology Corporation common stockholders for the years ended December 31, 2010, 2011 and 2012 (in thousands, except per share amounts):
| As of December 31, | ||||||||||||
| 2010 | 2011 | 2012 | ||||||||||
Net loss attributable to Good Technology Corporation common stockholders | $ | (39,857 | ) | $ | (41,205 | ) | $ | (90,463 | ) | |||
|
|
|
|
|
| |||||||
Shares used in computing net loss per share attributable to Good Technology Corporation common stockholders, basic and diluted | 6,761 | 19,518 | 32,915 | |||||||||
|
|
|
|
|
| |||||||
Net loss per share attributable to Good Technology Corporation common stockholders, basic and diluted | $ | (5.90 | ) | $ | (2.11 | ) | $ | (2.75 | ) | |||
|
|
|
|
|
| |||||||
F-39
Table of Contents
GOOD TECHNOLOGY CORPORATION
Notes to consolidated financial statements—(Continued)
The following outstanding common stock equivalents were excluded from the computation of diluted net loss per share attributable to Good Technology Corporation common stockholders for the periods presented because including them would have been antidilutive (in thousands):
| Years Ended December 31, | ||||||||||||
| 2010 | 2011 | 2012 | ||||||||||
Redeemable convertible preferred stock | 107,074 | 107,074 | 114,371 | |||||||||
Options to purchase common stock | 71,625 | 64,523 | 55,860 | |||||||||
Preferred stock warrants | 1,085 | 1,085 | — | |||||||||
Common stock warrants | 57 | 4,470 | 4,470 | |||||||||
18. Pro forma net loss per share attributable to Good Technology Corporation common stockholders (unaudited)
Pro forma basic and diluted net loss per share attributable to Good Technology Corporation common stockholders has been computed to give effect to the assumed conversion of all shares of redeemable convertible preferred stock into common stock upon a qualifying IPO. Also, the numerator in the pro forma basic and diluted net loss per share attributable to Good Technology Corporation common stockholders calculation has been adjusted to remove gains and losses resulting from remeasurements of the preferred stock warrant liability as the related warrants would not be outstanding.
The following table sets forth the computation of the Company’s pro forma basic and diluted net loss per share attributable to Good Technology Corporation common stockholders for the year ended December 31, 2012 (in thousands, except per share data):
Net loss attributable to Good Technology Corporation common stockholders | $ | (90,463 | ) | |
Less: Change in fair value of preferred stock warrant liabilities | 637 | |||
|
| |||
Net loss used in computing pro forma net loss per share attributable to Good Technology Corporation common stockholders, basic and diluted | $ | (89,826 | ) | |
|
| |||
Shares used in computing net loss per share attributable to Good Technology Corporation common stockholders, basic and diluted | 32,915 | |||
Pro forma adjustments to reflect assumed conversion of redeemable convertible preferred stock | 109,606 | |||
|
| |||
Shares used in computing pro forma net loss per share attributable to Good Technology Corporation common stockholders, basic and diluted | 142,521 | |||
|
| |||
Pro forma net loss per share attributable to Good Technology Corporation common stockholders, basic and diluted | $ | (0.63 | ) | |
|
|
19. Subsequent events
The Company evaluated subsequent events through April 26, 2013, the date on which these consolidated financial statements were issued.
On January 14, 2013, the Company appointed Christy Wyatt as President and Chief Executive Officer, as well as a member of the Board of Directors. In addition to salary and bonus, Ms. Wyatt’s compensation package included a starting bonus of $0.3 million and options to purchase 6,827,185 shares of the Company’s common stock of which 10% will vest upon the six-month anniversary of employment, and the remainder will vest at 1/54th per month until fully vested upon the five year anniversary of employment. In addition, Ms. Wyatt was
F-40
Table of Contents
GOOD TECHNOLOGY CORPORATION
Notes to consolidated financial statements—(Continued)
granted options to purchase 1,137,864 shares of the Company’s common stock which vest upon the achievement of a future sales target. Management will evaluate, on a quarterly basis, the likelihood of achieving the target performance metric in determining stock-based compensation expense for these option grants.
In April 2013, the Company issued 12.2 million shares of Series C redeemable convertible preferred stock for gross proceeds of $50.0 million. These shares of Series C preferred stock have all of the same rights and preferences as Series B-1, B-2 and B-3 preferred stock, including conversion to shares of common stock at their original purchase prices, at a conversion ratio of 1:1, and with rights to receipt of unpaid dividends. Shares of Series C redeemable convertible preferred stock vote together with common stock as one class, having one vote per share on as as-converted basis. Investors in Series C redeemable convertible preferred stock are entitled to elect one Board seat, and the lead investor is entitled to standard observation rights.
In the event of the closing of a qualifying IPO, the Series C redeemable convertible preferred stock will convert into shares of common stock at a conversion price of $4.105, unless the IPO price is lower than $6.13, in which case, the conversion price will be equivalent to a 33% discount from the IPO price. The Company determined that the special conversion feature of the Series C redeemable convertible preferred stock potentially providing for conversion of shares into common stock at a discount to the offering price in the event of the closing of a qualifying IPO is a “contingent beneficial conversion” feature. Upon completion of an initial public offering, the Company will potentially recognize a charge for the discount amount as a deemed dividend within additional paid-in capital.
In April 2013, following the issuance of the Series C preferred stock, the Company amended the terms of the covenants contained in its loan agreement with Silicon Valley Bank (see Note 6).
F-41
Table of Contents

Table of Contents

Table of Contents
PART II
INFORMATION NOT REQUIRED IN PROSPECTUS
ITEM 13. OTHER EXPENSES OF ISSUANCE AND DISTRIBUTION.
The following table sets forth all expenses to be paid by the Registrant, other than underwriting discounts and commissions, in connection with this offering. All amounts shown are estimates.
SEC registration fee | $ | * | ||
FINRA filing fee | * | |||
Exchange listing fee | * | |||
Printing and engraving | * | |||
Legal fees and expenses | * | |||
Accounting fees and expenses | * | |||
Blue sky fees and expenses (including legal fees) | * | |||
Transfer agent and registrar fees | * | |||
Miscellaneous | * | |||
|
| |||
Total | $ | * | ||
|
|
| * | To be completed by amendment. |
ITEM 14. INDEMNIFICATION OF DIRECTORS AND OFFICERS.
Section 145 of the Delaware General Corporation Law authorizes a corporation’s board of directors to grant, and authorizes a court to award, indemnity to officers, directors and other corporate agents.
As permitted by Section 102(b)(7) of the Delaware General Corporation Law, the Registrant’s certificate of incorporation includes provisions that eliminate the personal liability of its directors and officers for monetary damages for breach of their fiduciary duty as directors and officers.
In addition, as permitted by Section 145 of the Delaware General Corporation Law, the certificate of incorporation and bylaws of the Registrant provide that:
| • | The Registrant shall indemnify its directors and officers for serving the Registrant in those capacities or for serving other business enterprises at the Registrant’s request, to the fullest extent permitted by Delaware law. Delaware law provides that a corporation may indemnify such person if such person acted in good faith and in a manner such person reasonably believed to be in or not opposed to the best interests of the Registrant and, with respect to any criminal proceeding, had no reasonable cause to believe such person’s conduct was unlawful. |
| • | The Registrant may, in its discretion, indemnify employees and agents in those circumstances where indemnification is permitted by applicable law. |
| • | The Registrant is required to advance expenses, as incurred, to its directors and officers in connection with defending a proceeding, except that such director or officer shall undertake to repay such advances if it is ultimately determined that such person is not entitled to indemnification. |
| • | The Registrant will not be obligated pursuant to the amended and restated bylaws to indemnify a person with respect to proceedings initiated by that person, except with respect to proceedings authorized by the Registrant’s board of directors or brought to enforce a right to indemnification. |
| • | The rights conferred in the amended and restated certificate of incorporation and amended and restated bylaws are not exclusive, and the Registrant is authorized to enter into indemnification agreements with its directors, officers, employees, and agents and to obtain insurance to indemnify such persons. |
| • | The Registrant may not retroactively amend the bylaw provisions to reduce its indemnification obligations to directors, officers, employees, and agents. |
II-1
Table of Contents
The Registrant’s policy is to enter into separate indemnification agreements with each of its directors and officers that provide the maximum indemnity allowed to directors and executive officers by Section 145 of the Delaware General Corporation Law and also to provide for certain additional procedural protections. The Registrant also maintains directors and officers insurance to insure such persons against certain liabilities.
These indemnification provisions and the indemnification agreements entered into between the Registrant and its officers and directors may be sufficiently broad to permit indemnification of the Registrant’s officers and directors for liabilities (including reimbursement of expenses incurred) arising under the Securities Act.
The underwriting agreement filed as Exhibit 1.1 to this registration statement provides for indemnification by the underwriters of the Registrant and its officers and directors for certain liabilities arising under the Securities Act and otherwise.
ITEM 15. RECENT SALES OF UNREGISTERED SECURITIES.
Since January 1, 2010, the Registrant made sales of the following unregistered securities:
Preferred Stock Issuances
| • | On March 20, 2012, the Registrant issued 1,084,831 shares of its Series B-1 convertible preferred stock to five entities at a purchase price of $1.00 per share in connection with the exercises of warrants. |
| • | On April 15, 2013, the Registrant issued 12,180,269 shares of its Series C convertible preferred stock to five entities at a purchase price of $4.105 per share. |
Acquisition Issuances
| • | On January 26, 2010 and September 1, 2010, the Registrant issued an aggregate of 1,000,000 shares of its common stock to four individuals and two entities as consideration in connection with a merger with a company. |
| • | On September 19, 2012, the Registrant issued (i) 3,649,172 shares of its Series B-2 convertible preferred stock to twenty-five individuals and twelve entities and (ii) 1,629,047 shares of its common stock to ten individuals as consideration in connection with a merger with a company. |
| • | On October 1, 2012, the Registrant issued (i) 2,563,300 shares of its Series B-3 convertible preferred stock to seven individuals and two entities and (ii) 1,055,495 shares of its common stock to eight individuals and one entity as consideration in connection with a merger with a company. |
Plan-Related Issuances
| • | From January 1, 2010 to December 31, 2012, the Registrant granted to its directors, officers, employees, consultants and other service providers options to purchase an aggregate of 54,738,632 shares of common stock with exercise prices ranging from $0.62 to $4.50 per share under its 2006 Plan. |
| • | From January 1, 2010 to December 31, 2012, options were granted to employees and a former director of Copiun to purchase an aggregate of 351,930 shares of common stock at an exercise price of $0.28 per share under the Copiun Plan, adopted by the Registrant on September 19, 2012. |
| • | From January 1, 2010 to December 31, 2012, options were granted to employees and consultants to purchase an aggregate of 881,180 shares of common stock with exercise prices ranging from $1.06 to $1.52 per share under the AppCentral Plan adopted by the Company on October 1, 2012. |
II-2
Table of Contents
| • | From January 1, 2010 to December 31, 2012, the Registrant issued to its directors, officers, employees, consultants and other service providers an aggregate of 35,717,478 shares of common stock at purchase prices ranging from $0.11 to $2.35 per share in connection with the exercise of options granted under its 2006 Plan. |
| • | From January 1, 2010 to December 31, 2012, the Registrant issued to one employee an aggregate of 3,905 shares of common stock at a purchase price of $0.28 per share in connection with the exercise of an option granted under the Copiun Plan. |
| • | From January 1, 2010 to December 31, 2012, the Registrant issued to its employees an aggregate of 35,492 shares of common stock at purchase prices ranging from $1.06 to $1.45 per share in connection with the exercise of options granted under the AppCentral Plan. |
| • | From January 1, 2010 to December 31, 2012, the Registrant issued to its employees and consultants an aggregate of 104,783 shares of common stock in connection with restricted stock awards granted under the Copiun Plan. |
The Registrant believes these transactions were exempt from registration under the Securities Act in reliance upon Section 4(2) of the Securities Act (or Regulation D or Regulation S promulgated thereunder), or Rule 701 promulgated under Section 3(b) of the Securities Act as transactions by an issuer not involving any public offering or pursuant to benefit plans and contracts relating to compensation as provided under Rule 701. The recipients of the securities in each of these transactions represented their intentions to acquire the securities for investment only and not with a view to or for sale in connection with any distribution thereof, and appropriate legends were placed upon the stock certificates issued in these transactions. All recipients had adequate access, through their relationships with us, to information about the Registrant.
ITEM 16. EXHIBITS AND FINANCIAL STATEMENT SCHEDULES.
(a) Exhibits. We have filed the exhibits listed on the accompanying Exhibit Index of this Registration Statement.
(b) Financial Statement Schedules. All financial statement schedules are omitted because the information called for is not required or is shown either in the consolidated financial statements or in the notes thereto.
ITEM 17. UNDERTAKINGS.
The undersigned Registrant hereby undertakes to provide to the underwriters at the closing specified in the underwriting agreement certificates in such denominations and registered in such names as required by the underwriters to permit prompt delivery to each purchaser.
Insofar as indemnification for liabilities arising under the Securities Act of 1933 may be permitted to directors, officers and controlling persons of the Registrant pursuant to the foregoing provisions, or otherwise, the Registrant has been advised that in the opinion of the Securities and Exchange Commission such indemnification is against public policy as expressed in the Act and is, therefore, unenforceable. In the event that a claim for indemnification against such liabilities (other than the payment by the Registrant of expenses incurred or paid by a director, officer or controlling person of the Registrant in the successful defense of any action, suit or proceeding) is asserted by such director, officer or controlling person in connection with the securities being registered, the Registrant will, unless in the opinion of its counsel the matter has been settled by controlling precedent, submit to a court of appropriate jurisdiction the question whether such indemnification by it is against public policy as expressed in the Act and will be governed by the final adjudication of such issue.
II-3
Table of Contents
The undersigned Registrant hereby undertakes that:
(1) For purposes of determining any liability under the Securities Act of 1933, the information omitted from the form of prospectus filed as part of this registration statement in reliance upon Rule 430A and contained in a form of prospectus filed by the Registrant pursuant to Rule 424(b)(1) or (4) or 497(h) under the Securities Act shall be deemed to be part of this registration statement as of the time it was declared effective.
(2) For the purpose of determining any liability under the Securities Act of 1933, each post-effective amendment that contains a form of prospectus shall be deemed to be a new registration statement relating to the securities offered therein, and the offering of such securities at that time shall be deemed to be the initial bona fide offering thereof.
II-4
Table of Contents
SIGNATURES
Pursuant to the requirements of the Securities Act of 1933, as amended, the registrant has duly caused this Registration Statement to be signed on its behalf by the undersigned, thereunto duly authorized, in the City of Sunnyvale, State of California, on , 2013.
| GOOD TECHNOLOGY CORPORATION | ||
By: |
| |
Christy Wyatt Chief Executive Officer | ||
POWER OF ATTORNEY
KNOW ALL PERSONS BY THESE PRESENTS, that each person whose signature appears below constitutes and appoints Christy Wyatt and David H. Russian, and each of them, as his or her true and lawful attorneys-in-fact and agent, with full power of substitution and resubstitution, for him or her and in his or her name, place and stead, in any and all capacities, to sign the Registration Statement on Form S-1 of Good Technology Corporation, and any or all amendments (including post-effective amendments) thereto and any new registration statement with respect to the offering contemplated thereby filed pursuant to Rule 462(b) of the Securities Act of 1933, as amended, and to file the same, with all exhibits thereto, and other documents in connection therewith, with the Securities and Exchange Commission, granting unto said attorneys-in-fact and agents full power and authority to do and perform each and every act and thing requisite or necessary to be done in and about the premises hereby ratifying and confirming all that said attorneys-in-fact and agent, or his substitute or substitutes, may lawfully do or cause to be done by virtue hereof.
Pursuant to the requirements of the Securities Act of 1933, as amended, this registration statement on Form S-1 has been signed by the following persons in the capacities and on the dates indicated.
Signature | Title | Date | ||
Christy Wyatt | Chief Executive Officer, President and Director (Principal Executive Officer) | , 2013 | ||
David H. Russian | Chief Financial Officer, Senior Vice President (Principal Accounting and Financial Officer) | , 2013 | ||
King R. Lee, III | Director | , 2013 | ||
Bandel L. Carano | Director | , 2013 | ||
John H. N. Fisher | Director | , 2013 | ||
Marc D. Gordon | Director | , 2013 | ||
Scot B. Jarvis | Director | , 2013 | ||
II-5
Table of Contents
Signature | Title | Date | ||
Barry M. Schuler | Director | , 2013 | ||
Thomas E. Unterman | Director | , 2013 | ||
Christopher P. Varelas | Director | , 2013 | ||
II-6
Table of Contents
EXHIBIT INDEX
Exhibit Number | Description | |
| 1.1* | Form of Underwriting Agreement. | |
| 3.1* | Form of Amended and Restated Certificate of Incorporation of the Registrant to become effective upon closing of this offering. | |
| 3.2* | Form of Amended and Restated Bylaws of the Registrant to become effective upon closing of this offering | |
| 3.3 | Amended and Restated Certificate of Incorporation of the Registrant, as currently in effect. | |
| 3.4 | Amended and Restated Bylaws of the Registrant, as currently in effect. | |
| 4.1* | Form of Common Stock Certificate of the Registrant. | |
| 4.2 | Amended and Restated Investors’ Rights Agreement, dated as of April 15, 2013, between the Registrant and certain holders of the Registrant’s capital stock named therein. | |
| 5.1* | Opinion of Wilson Sonsini Goodrich and Rosati, Professional Corporation. | |
| 10.1 | Loan and Security Agreement, as amended, among Good Technology, Inc., Visto Corporation and Silicon Valley Bank, dated January 26, 2011. | |
| 10.2* | Form of Indemnification Agreement between the Registrant and its directors and officers. | |
| 10.3 | 1996 Stock Plan, as amended, and Forms of Stock Option Agreement under the 1996 Stock Plan. | |
| 10.4 | 2006 Stock Plan, as amended, and Forms of Stock Option Agreement under the 2006 Stock Plan. | |
| 10.5 | Copiun, Inc. 2009 Stock Incentive Plan and Form of Stock Option Agreement under the Copiun, Inc. 2009 Stock Incentive Plan. | |
| 10.6 | AppCentral, Inc. 2010 Stock Incentive Plan, as amended, and Form of Stock Option Agreement under the AppCentral, Inc. 2010 Stock Incentive Plan. | |
| 10.7* | 2013 Equity Incentive Plan | |
| 10.8* | Employment Offer Letter between the Registrant and Christy Wyatt. | |
| 10.9 | Employment Offer Letter between the Registrant and David Russian, dated as of October 15, 2010. | |
| 10.10 | Employment Offer Letter between the Registrant and Ron Vaisbort, dated as of December 23, 2010. | |
| 10.11 | Employment Offer Letter between the Registrant and Peter Barker, dated as of February 20, 2013. | |
| 10.12 | Employment Offer Letter between the Registrant and Daniel Stoks, dated as of March 13, 2013. | |
| 10.13 | Triple Net Space Lease dated May 26, 2011 between North Mary Office LLC and the Registrant. | |
| 21.1 | List of subsidiaries of the Registrant. | |
| 23.1* | Consent of PricewaterhouseCoopers LLP, Independent Registered Public Accounting Firm. | |
| 23.2* | Consent of Wilson Sonsini Goodrich & Rosati, Professional Corporation. | |
| 24.1 | Power of Attorney (see the signature page to this Registration Statement on Form S-1). | |
| * | To be filed by amendment. |