Our foreign subsidiaries use their local currency as their functional currency. We translate assets and liabilities into U.S. dollars at exchange rates in effect at the balance sheet date. We translate income and expense accounts at the average monthly exchange rates during the year. We record resulting translation adjustments, net of income taxes, as a separate component of accumulated other comprehensive income.
Our accumulated other comprehensive income consists only of foreign currency translation adjustments, net of income taxes.
Basic net income per share excludes any dilutive effects of options. We compute basic net income per share using the weighted average number of common shares outstanding during the period. We compute diluted net income per share using the weighted average number of common and common stock equivalent shares outstanding during the period. We excluded common equivalent shares of 186,000 and 262,000 from the computation of diluted net income per share for 2007 and 2006, respectively, because their effect was antidilutive.
The following table sets forth the computation of basic and diluted net income per share:
Also included in SFAS 141(R) are a substantial number of new disclosure requirements. SFAS 141(R) applies prospectively to business combinations for which the acquisition date is on or after the beginning of the first annual reporting period beginning on or after December 15, 2008. Earlier adoption is prohibited. Accordingly, a calendar year-end company is required to record and disclose business combinations following existing GAAP until January 1, 2009. Consequently, we will adopt the provisions of SFAS 141(R) for our fiscal year beginning January 1, 2009. We believe that SFAS 141(R) is applicable to us, but cannot yet reasonably estimate the impact of the statement.
In December 2007, FASB issued FASB Statement No. 160,Noncontrolling Interests in Consolidated Financial Statements—An Amendment of ARB No. 51. SFAS 160 establishes new accounting and reporting standards for a noncontrolling interest in a subsidiary and for the deconsolidation of a subsidiary. Specifically, this statement requires the recognition of a noncontrolling interest (minority interest) as equity in the consolidated financial statements and separate from the parent’s equity. The amount of net income attributable to the noncontrolling interest will be included in consolidated net income on the face of the income statement. SFAS 160 clarifies that changes in a parent’s ownership interest in a subsidiary that do not result in deconsolidation are equity transactions if the parent retains its controlling financial interest. In addition, SFAS 160 requires that a parent recognize a gain or loss in net income when a subsidiary is deconsolidated. Such gain or loss will be measured using the fair value of the noncontrolling equity investment on the deconsolidation date. SFAS 160 also includes expanded disclosure requirements regarding the interests of the parent and its noncontrolling interest. SFAS 160 is effective for fiscal years, and interim periods within those fiscal years, beginning on or after December 15, 2008. Earlier adoption is prohibited. We will adopt SFAS 160 at the beginning of our fiscal year commencing January 1, 2009. We believe SFAS 160 will be applicable to us in that minority interest will be listed separately in shareholders’ equity, but we cannot yet reasonably estimate the other impacts to our consolidated financial statements.
In September 2006, FASB issued FASB Statement No. 157,Fair Value Measurements. SFAS 157 defines fair value, establishes a framework for measuring fair value in GAAP, and expands disclosures about fair value measurements. SFAS 157 applies under other accounting pronouncements that require or permit fair value measurements, the FASB having previously concluded in those accounting pronouncements that fair value is the relevant measurement attribute. Accordingly, SFAS 157 does not require any new fair value measurements. SFAS 157 is effective for financial statements issued for fiscal years beginning after November 15, 2007, and interim periods within those fiscal years. Earlier application is encouraged, provided that the reporting entity has not yet issued financial statements for that fiscal year, including financial statements for an interim period within that fiscal year. We will adopt the provisions of SFAS 157 in our fiscal year commencing January 1, 2008. We currently believe that adoption of the provisions of SFAS 157 will not have a material impact on our consolidated financial statements.
3. Notes Receivable and Other Assets
As of December 31, 2007, our notes receivable and other assets consisted of $2.7 million in notes, $0.3 million in investments, and $1.1 million in other long-term assets. On November 7, 2007, we entered into a cooperative business arrangement with Care2.com, Inc., whereby Care2 agreed that we will become the e-commence provider for Care2 in return for a percentage of our revenue generated from such customer leads. Additionally, Care2 agreed to promote Gaiam subscriptions to Care2 customers and to not pursue subscription business. We loaned Care2 $2.7 million, evidenced by a 6% interest bearing senior secured promissory note due November 7, 2011, purchased 254,237 shares of Care2 Series D-1 Preferred Stock for cash of $300,000, and received warrants to subscribe for and purchase from Care2 additional stock. The warrants had no estimated fair value as of December 31, 2007.
Notes receivable and other assets as of December 31, 2006 consisted of $1.3 million of investments, $2.4 million in notes and related interest receivable, and $0.6 million of other long-term assets. On January 5, 2006, we entered into an agreement with Alps Communications and Life Balance Media Holdings LLC, to sell 19,968 Series A Preferred Units of Life Balance Media Holdings to Alps, an investment that we previously accounted for using the equity method. The purchase price per unit was equal to the amount we paid for our investment during 2005. Alps assumed all unpaid Series A Capital Contribution commitments from us and executed a 7.5% interest bearing promissory note due February 28, 2009 in the principal amount of $2.3 million. After the closing of this transaction, we owned 4,876 units, or less than 4%, of Life Balance Media Holdings. This transaction resulted in a gain of $0.5 million which is included in other income (expense) for the year ended December 31, 2006. On February 6, 2007, we entered into a stock repurchase agreement with Revolution Living and Alps. As part of the stock repurchase agreement Alps prepaid its promissory note principal plus accrued interest in the amount of $2.4 million and acquired our investment in Life Balance Media Holdings for $1.4 million in cash.
On June 23, 2006, we purchased, for $3.5 million, an approximate 34% ownership interest in Cinema Circle, the parent company of Spiritual Cinema Circle, a subscription-based DVD film club. We accounted for this investment under the equity method and we recognized the excess of the cost of the investment over the underlying equity in the net assets of Cinema Circle, $2.3 million, as goodwill. During July 2006, we purchased an additional 29% interest in Cinema Circle for $3.4 million. With the purchase of the additional interest, our ownership was approximately 63% and, therefore, commencing with the effective dates of the additional share purchases, Cinema Circle met the accounting criteria to be considered a business combination as outlined in SFAS No. 141,Business Combinations and we began consolidating Cinema Circle’s results of operations effective July 31, 2006. On September 30, 2006, we reduced our investment in Cinema Circle to a 15% ownership interest and changed our accounting for Cinema Circle from the consolidation to cost method. See Note 4, Mergers and Acquisitions.
59
4. Mergers and Acquisitions
We include results from operations of acquired companies in our consolidated financial statements from their respective effective acquisition dates. We expect that none of the goodwill resulting from acquisition of companies during 2006 will be deductible for tax purposes.
In August 2005, we entered into agreements with Revolution Living, LLC, its founder, Steve Case, and Revolution Living’s Life Balance Media Holdings subsidiary. Under the terms of the Agreements, we acquired a minority interest in Life Balance Media Holdings for approximately $7.5 million. We accounted for this investment using the equity method, so our share of the losses sustained by Life Balance Media Holdings from the date of acquisition through December 31, 2005, totaling $0.6 million, have been reflected in our statement of operations for 2005. Effective in January 2006, we reduced our ownership in Life Balance Media Holdings to less than 4%. On February 6, 2007, we sold the last part of our interest in Life Balance Media Holdings for $1.4 million in cash. See Note 3, Notes Receivable and Other Assets. On July 19, 2007, we acquired 100% ownership interest in Life Balance Media Holdings. See our 2007 aggregated business acquisitions discussion below.
In September 2005, we acquired a majority of the assets held by GoodTimes and certain of its affiliates for $34.4 million in cash plus $0.6 million in estimated acquisition, legal and accounting costs. GoodTimes’ assets included entertainment programming and home video products distributed through various channels, including television, retailers and the Internet. We commenced distribution of titles and content acquired in this asset purchase on September 13, 2005. At December 31, 2005, we initially allocated the $35.0 million purchase price as $29.1 million to media library, $13.2 million to tangible assets, and $7.3 million to assumed liabilities. During 2006, we reduced the aggregate purchase price to $34.8 million due to unrealized estimated acquisition costs and adjusted the estimated fair values by allocating $32.3 million to the media library, $9.4 million to tangible assets, and $6.9 million to assumed liabilities. We based the adjustments primarily on additional facts about benefits and obligations as of the purchase date which were identified during the allocation period after the acquisition date. As a result of the adjustment to the media library, we recorded in September 2006 additional amortization expense of $0.3 million.
In October 2005, we acquired a 53.4% ownership interest in Newmark Media, a distribution company specializing in placing wellness media products in the grocery and drugstore channels for an approximately $0.8 million cash contribution to Newmark. We allocated the purchase price to the net tangible assets, and, as Newmark had negative net worth, we recorded $0.9 million in goodwill. On December 31, 2006, we acquired the 46.6% minority ownership interest in Newmark for $0.3 million cash and recorded an additional $0.2 million in goodwill. The stock purchase agreement calls for additional consideration of up to $0.1 million contingent upon the achievement of certain distribution and product mix goals over the next two years. During 2007 we recognized half of this contingent consideration as additional goodwill. We have not yet recognized the remainder of the contingent consideration because its amount is not determinable beyond a reasonable doubt. We believe that Newmark’s expertise in product placement in these under-penetrated channels more than compensates for the goodwill recorded.
On December 30, 2005, we increased our ownership percentage in Conscious Media, Inc., a multimedia company, to 51% for an additional investment of $3.5 million. We acquired shares directly from the Conscious Media for its $1.5 million in notes receivable and issued 146,667 shares of our Class A common stock and promissory notes totaling $0.2 million to certain Conscious Media shareholders. We have recorded a reduction to retained earnings and our investment of $0.7 million to reflect our share of the results from operations of Conscious Media from the date of our original investment in 2002 to the end of 2005, when we acquired the majority ownership interest, and recognized $6.9 million in goodwill.
On September 29, 2006, we increased our ownership percentage in Conscious Media from 51% to 86% by issuing 149,698 shares of our Class A common stock valued at $1.9 million and recognized additional goodwill of $1.4 million. During the fourth quarter of 2006, we invested another $3.2 million, comprised of 220,026 shares of our Class A common stock, of which 85,526 shares were issued to two of our outside board members, and cash of $0.2 million. As a result of this latest investment, we effectively owned all of Conscious Media’s outstanding stock as of November 8, 2006 and recognized additional goodwill of $3.3 million. We believe that Conscious Media’s expertise in media programming, development and post production will complement our current businesses and future growth, at a lower cost than we could develop on our own.
On September 30, 2006, we, Cinema Circle, and Spiritual Cinema, one of our newly formed subsidiaries, entered into a Share Exchange Agreement. Prior to our original investment in Cinema Circle (see Note 3, Notes Receivable and Other Assets), Cinema Circle had two business segments, direct (primarily subscription clubs) and film production. Under the Exchange Agreement, Spiritual Cinema acquired 100% of the equity and net assets of Cinema Circle’s direct segment from Cinema Circle in exchange for 76% of
60
our interest in Cinema Circle and 15% of Spiritual Cinema. Of the $6.9 million determined cost of our 85% ownership in Spiritual Cinema, we allocated $5.6 million to goodwill, $0.5 million to customer lists, and the remainder to net tangible assets and minority interest. We are amortizing the customer lists on a straight-line basis over 17 months. We plan to invest in our community business over the next year to better capitalize on strong relationships with our loyal consumer audience and growing broadband subscription trends. This will allow us to focus on better leveraging of our content through subscriptions and community. The films distributed to Spiritual Cinema’s members are meaningful inspirational and spiritual family films that complement our product offerings.
During 2007, we acquired varying amounts of controlling ownership interest in several entities for a total cost of approximately $17.9 million, including direct acquisition costs and other liabilities, of which $14.5 million was paid in cash, $1.5 million in shares of our Class A common stock, and $1.9 million in assumed liabilities. Three of the acquisitions call for additional consideration, payable in cash or shares of our Class A common stock (up to a maximum of 50,000 shares), contingent upon the achievement of a certain membership threshold within the next two years or our sale of the acquired business or its assets, the amount of revenue generated from certain potential customers and the collection of certain rebates, or the attaining of a certain level of pre-tax profits in our community business over its first twelve months of operations. As additional consideration for the solar energy integrator, our wholly owned subsidiary, Real Goods Solar, granted to the sellers warrants to purchase 40,000 shares of Real Goods’ Class A common stock at an exercise price of $3.20 per share. The warrants commence vesting only upon an initial public offering of Real Goods’ Class A common stock or our sale of 50% or more of the company. We have not yet recognized any of the contingent or additional consideration because the amounts are not determinable beyond a reasonable doubt. At the time any of the contingent or additional consideration becomes probable and can be estimated, we will recognize it as additional purchase price and allocate it to goodwill and other intangibles, as appropriate.
The acquired companies include Zaadz, a leading social networking site in the LOHAS space; Lime, a multimedia lifestyle company; Conscious Enlightenment, an on-line and off-line community; and a solar system integration company. With regards to the acquisitions, we assumed liabilities for severance ($0.2 million) due to downsizing of the workforce, facility lease obligations ($0.2 million) as a result of relocation, and a noncancellable contract ($0.6 million) which obligated us to perform services with no future benefit to the combined companies. During 2007, we charged $0.1 million to the severance liability, $0.1 million to the facility lease obligation liability, and $0.5 million to the noncancellable contract liability. As of December 31, 2007, the remaining balances were immaterial. We anticipate completing the downsizing and relocation activities by the end of the second quarter of 2008.
In connection with the acquisitions, we have preliminarily recognized $10.5 million and $3.8 million of direct to consumer and business segment goodwill, respectively, of which we expect $3.8 million to be deductible for tax purposes, $1.4 million of intangibles subject to amortization (37 month weighted-average useful life), and $0.3 million of indefinite life domain names. The amortizable intangibles are customer related of $0.8 million (23 month weighted-average useful life) and marketing related of $0.6 million (53 month weighted-average useful life). We are still in the process of finalizing our assessment of the estimated fair value of the net assets acquired and, thus, the amount of goodwill and other intangibles is subject to refinement.
The following is supplemental unaudited pro forma information for the aggregated 2007 acquisitions as if we had acquired the businesses on January 1, 2006. The pro forma adjustments are based on currently available information and upon assumptions that we believe are reasonable in order to reflect, on a pro forma basis, the impact of these 2007 acquisitions on our historical financial information. The unaudited pro forma information should not be relied upon as being indicative of our results of operations had the acquisitions occurred on the dates assumed. The unaudited pro forma financial information also does not project the results of operations for any future period or date.
| | | | | | | |
| | | | |
| | Pro Forma | |
| | | |
| | Years ended December 31, | |
| | | |
(in thousands, except per share data) | | 2007 | | 2006 | |
| | | | | | |
| | (unaudited) | |
Net revenue | | $ | 273,835 | | $ | 228,317 | |
Income before income taxes and minority interest | | $ | 12,225 | | $ | 5,160 | |
Net income | | $ | 7,079 | | $ | 2,973 | |
| | | | | | | | |
| | | | | | | |
Net income per share: | | | | | | | |
Basic | | $ | 0.28 | | $ | 0.12 | |
Diluted | | $ | 0.28 | | $ | 0.12 | |
| | | | | | | | |
61
5. Property and Equipment
Property and equipment, stated at lower of cost or fair value, consists of the following as of December 31:
| | | | | | | |
| | | | | | |
(in thousands) | | 2007 | | | 2006 | |
| | | | | | | | | |
Land | | $ | 3,100 | | | $ | 3,100 | |
Buildings | | | 1,587 | | | | 1,587 | |
Furniture, fixtures and equipment | | | 6,158 | | | | 5,580 | |
Leasehold improvements | | | 1,754 | | | | 1,475 | |
Website development costs | | | 5,962 | | | | 4,763 | |
Studio, computer and telephone equipment | | | 8,842 | | | | 7,864 | |
Warehouse and distribution equipment | | | 1,921 | | | | 1,191 | |
| | | | | | | | | |
| | | 29,324 | | | | 25,560 | |
Accumulated depreciation and amortization | | | (19,815 | ) | | | (17,776 | ) |
| | | | | | | | | |
| | $ | 9,509 | | | $ | 7,784 | |
| | | | | | | | | |
6. Leases, Commitments and Contingencies
We lease office and warehouse space through operating leases. Some of the leases have renewal clauses, which range from 1 to 10 years. The following schedule represents the annual future minimum payments, as of December 31, 2007:
| | | | |
| | | | |
(in thousands) | | Operating | |
| | | | | |
2008 | | $ | 3,455 | |
2009 | | | 2,447 | |
2010 | | | 1,699 | |
2011 | | | 1,191 | |
2012 | | | 1,137 | |
2013 | | | 1,137 | |
2014 | | | 1,016 | |
2015 | | | 254 | |
| | | | | |
Total minimum lease payments | | $ | 12,336 | |
| | | | | |
We incurred rent expense of $4.2 million, $4.3 million and $2.7 million for the years ended December 31, 2007, 2006 and 2005, respectively.
On January 15, 2008, we entered into an option to purchase land, an office building, and improvements located in Colorado for approximately $13.2 million in cash, which we estimate to be well below its replacement value.
7. Accrued Liabilities
Accrued liabilities consist of the following as of December 31:
| | | | | | | |
| | | | | | |
(in thousands) | | 2007 | | | 2006 | |
| | | | | | | | | |
Accrued royalties | | $ | 3,242 | | | $ | 2,266 | |
Accrued compensation | | | 4,348 | | | | 2,016 | |
Income taxes payable | | | 832 | | | | 415 | |
Other accrued liabilities | | | 2,209 | | | | 539 | |
| | | | | | | | | |
| | $ | 10,631 | | | $ | 5,236 | |
| | | | | | | | | |
8. Line of Credit
We have a revolving line of credit agreement with a financial institution, which expires on October 22, 2009. The credit agreement permits borrowings up to the lesser of $15 million or our borrowing base which is calculated based upon the collateral value of our accounts receivable, inventory, and certain property and equipment. Borrowings under this agreement bear interest at the lower of prime rate less 75 basis points or LIBO plus 275 basis points. Borrowings are secured by a pledge of certain of our assets, and the agreement contains various financial covenants, including those requiring compliance with certain financial ratios. At December 31, 2007, we had no amounts outstanding under this agreement; however, $1.2 million was reserved for outstanding letters of credit. We believe we have complied with all of the financial covenants.
62
9. Income Taxes
Our provision for income taxes is comprised of the following:
| | | | | | | | | | | | |
| | | | | | | | | | | | | |
| | Years ended December 31, | |
| | | |
(in thousands) | | | 2007 | | | 2006 | | 2005 | |
| | | | | | | | | | | | | |
Current: | | | | | | | | | | | | |
Federal | | | $ | 5,404 | | | $ | 2,115 | | $ | 346 | |
State | | | | 1,196 | | | | 474 | | | 48 | |
International | | | | (132 | ) | | | (362 | ) | | 301 | |
| | | | | | | | | | | | | |
| | | | 6,468 | | | | 2,227 | | | 695 | |
| | | | | | | | | | | | | |
Deferred: | | | | | | | | | | | | |
Federal | | | | (624 | ) | | | 916 | | | 232 | |
State | | | | (138 | ) | | | 207 | | | 47 | |
International | | | | 61 | | | | 424 | | | — | |
| | | | | | | | | | | | | |
| | | | (701 | ) | | | 1,547 | | | 279 | |
| | | | | | | | | | | | | |
Total | | | $ | 5,767 | | | $ | 3,774 | | $ | 974 | |
| | | | | | | | | | | | | |
Variations from the federal statutory rate are as follows:
| | | | | | | | | | | | |
| | | | | | | | | | | | | |
(in thousands) | | | 2007 | | | 2006 | | 2005 | |
| | | | | | | | | | | | | |
| | | | | | | | | | | | |
Expected federal income tax expense at statutory rate of 34% | | | $ | 4,944 | | | $ | 3,246 | | $ | 978 | |
Effect of permanent differences | | | | 92 | | | | 48 | | | 30 | |
State income tax expense, net of federal benefit and
utilization of net operating loss | | | | 721 | | | | 433 | | | 66 | |
Effect of differences between U.S. taxation and foreign taxation | | | | 10 | | | | 47 | | | (100 | ) |
| | | | | | | | | | | | | |
Income tax expense | | | $ | 5,767 | | | $ | 3,774 | | $ | 974 | |
| | | | | | | | | | | | | |
Deferred income taxes reflect net tax effects of temporary differences between the carrying amounts of assets and liabilities for financial reporting purposes and the amounts used for income tax purposes. The components of the net accumulated deferred income tax assets as of December 31, 2007 and 2006 are as follows:
| | | | | | | | | |
| | | | | | | | | | |
| | As of December 31, | |
| | | |
(in thousands) | | | 2007 | | | 2006 | |
| | | | | | | | |
Deferred tax assets (liabilities): | | | | | | | | | |
Current: | | | | | | | | | |
Provision for doubtful accounts | | | $ | 491 | | | $ | 553 | |
Inventory-related expense | | | | 1,322 | | | | 456 | |
Accrued liabilities | | | | 4,365 | | | | 3,104 | |
Net operating loss, or NOL, carryforward | | | | 337 | | | | — | |
Prepaid and deferred catalog costs | | | | (584 | ) | | | (709 | ) |
Charitable carryforward | | | | 44 | | | | — | |
Foreign tax credit | | | | 30 | | | | — | |
| | | | | | | | | | |
Total current deferred tax assets | | | $ | 6,005 | | | $ | 3,404 | |
| | | | | | | | | | |
Non-current: | | | | | | | | | |
Depreciation and amortization | | | $ | 420 | | | $ | (578 | ) |
Section 181 qualified production expense | | | | (2,770 | ) | | | — | |
NOL carryforward | | | | 6,891 | | | | 7,026 | |
Foreign exchange rate gain | | | | (551 | ) | | | (490 | ) |
Other | | | | 67 | | | | — | |
| | | | | | | | | | |
Total non-current deferred tax assets | | | $ | 4,057 | | | $ | 5,958 | |
| | | | | | | | | | |
Total net deferred tax assets | | | $ | 10,062 | | | $ | 9,362 | |
| | | | | | | | | | |
63
At December 31, 2007, we had made no provision for U.S. federal and state income taxes on approximately $0.3 million of undistributed foreign earnings, which are expected to remain outside of the U.S. indefinitely. Upon any future distribution of foreign earnings in the form of dividends or otherwise, we would be subject to U.S. income taxes (subject to an adjustment for foreign tax credits), state income taxes, and withholding taxes payable to the various foreign countries. Determination of the amount of unrecognized deferred U.S. income tax liability is not practicable because of the complexities associated with its hypothetical calculation. Our foreign subsidiaries generated income before minority interest and income taxes of approximately $0.2 million during 2007 and 2006 and $1.2 million during 2005.
At December 31, 2007 and 2006, we had NOL carryforwards of approximately $18.7 million and $18.0 million, respectively, associated with acquisitions completed in 2001, 2002, 2005, 2006, and 2007, which may be used to offset future taxable income. These carryforwards expire between 2019 and 2027. The Internal Revenue Code contains provisions that limit the NOL available for use in any given year upon the occurrence of certain events, including significant changes in ownership interest. A change in ownership of a company of greater than 50% within a three-year period results in an annual limitation on the utilization of NOL carryforwards from tax periods prior to the ownership changes. Our NOL carryforwards as of December 31, 2007 are subject to annual limitations due to changes in ownership.
We expect all the deferred tax assets at December 31, 2007 to be fully recoverable through the reversal of taxable temporary differences in future years as a result of normal business activities. We had no valuation allowance as of December 31, 2007 or 2006. We realized $0.7 million and $2.2 million in tax benefits recorded to additional paid-in capital as a result of the exercise of stock options for the years ended December 31, 2007 and 2006, respectively.
Effective January 1, 2007, we adopted the provisions of the Financial Accounting Standards Board (“FASB”) Interpretation No. 48,Accounting of Uncertainty in Income Taxes—An Interpretation of FASB Statement No. 109. Under FIN 48, we must recognize the tax benefit from an uncertain tax position only if it is more likely than not that the tax position will be sustained on examination by the taxing authorities, based on the technical merits of the position. We measure the tax benefits recognized in the consolidated financial statements from such a position based on the largest benefit that has a greater than 50% likelihood of being realized upon ultimate resolution. The application of income tax law is inherently complex. Laws and regulations in this area are voluminous and are often ambiguous. As such, we are required to make many subjective assumptions and judgments regarding our income tax exposures. Interpretations of and guidance surrounding income tax law and regulations change over time and may result in changes to our subjective assumptions and judgments which can materially affect amounts recognized in our Consolidated balance sheets and Consolidated statements of operations. The result of the reassessment of our tax positions in accordance with FIN 48 did not have a material impact on our consolidated financial statements. Our federal tax returns for all years after 2003 and our state tax returns after 2002 are subject to future examination by tax authorities for all our tax jurisdictions. We recognize interest and penalties related to income tax matters in other income (expense) and corporate, general and administration expenses, respectively.
10. Shareholders’ Equity
During 2005, we issued a total of 8,221 shares of our Class A common stock to our independent directors, in lieu of cash compensation, for services rendered in 2004, and issued 62,634 shares of Class A common stock upon exercise of options granted under our 1999 Long-Term Incentive Plan. On July 7, 2005, we issued and sold 2,821,317 unregistered shares of our Class A common stock for an aggregate purchase price of approximately $18.7 million to certain funds advised by Prentice Capital Management, LP. The holders of these shares have certain registration rights. On August 22, 2005, we issued and sold 2.5 million unregistered shares of our Class A common stock for an aggregate purchase price of $20 million to Revolution Living, LLC. Additionally, we issued 60,000 shares of our Class A common stock as purchase consideration for a media catalog business and issued 146,667 shares of Class A common stock to purchase shares of Conscious Media.
During 2006, we issued a total of 7,692 shares of our Class A common stock to our independent directors, in lieu of cash compensation, for services rendered in 2005 and 2006 and issued 671,784 shares of our Class A common stock upon exercise of options granted under our 1999 Long-Term Incentive Plan. On May 24, 2006, we sold 5,000,000 shares of our Class A common stock and on June 13, 2006 we sold 690,000 shares of our Class A common stock in an underwritten offering. The combined sale generated gross proceeds of $99.6 million. We issued 149,698 and 220,026 shares of our Class A common stock on September 29, 2006 and November 8, 2006, respectively, to acquire additional ownership of Conscious Media. See Note 4, Mergers and Acquisitions.
64
During 2007, we issued a total of 4,955 shares of our Class A common stock to our independent directors, in lieu of cash compensation, for services rendered in 2006 and 2007; issued 1,875 restricted shares of our Class A common stock to two of our named executive officers as bonus compensation; issued 80,795 shares of our Class A common stock as part of the consideration to acquire controlling ownership interests in two businesses (see Note 4, Mergers and Acquisitions); and issued 216,070 shares of our Class A common stock upon exercise of options under our 1999 Long-Term Incentive Plan.
On February 6, 2007, we entered into a stock repurchase agreement (the “Agreement”) with Revolution Living and Alps, whereby we repurchased 2.5 million of our Class A common stock from Revolution Living for $13.14 per share or $32.8 million in cash, Alps prepaid its promissory note principal plus accrued interest in the amount of $2.4 million, Alps acquired our investment in Life Balance Media Holdings for $1.5 million in cash, and David Golden, Chief Financial Officer of Revolution, resigned from the Board of Directors of Gaiam. Also as part of the Agreement, Jirka Rysavy, our Chairman and largest shareholder, purchased for $7.2 million Revolution Living’s option to acquire approximately 2.3 million of his Gaiam shares at $10 per share. The price to repurchase the option was calculated as the spread between the negotiated $13.14 share price for our purchase of the shares from Revolution Living and the $10 option exercise price. The $13.14 per share price agreed to by the parties was the average price over the last 90 days of our shares prior to the closing. We accounted for the re-acquired stock under the cost method. Since we have not yet decided the ultimate disposition of the re-acquired stock, we reflected its cost at December 31, 2007 as a $32.9 million reduction to additional paid-in capital.
As of December 31, 2007, we had the following Class A common shares reserved for future issuance:
| | | |
| | | | |
Conversion of Class B common shares | | 5,400,000 | |
Awards under the 1999 Long-Term Incentive Plan: | | | |
Stock options outstanding | | 883,670 | |
Shares reserved for issuance to directors in lieu of cash compensation for 2007 services rendered | | 513 | |
| | | | |
Total shares reserved for future issuance | | 6,284,183 | |
| | | | |
Each holder of shares of our Class A common stock is entitled to one vote for each share held on all matters submitted to a vote of shareholders. Each share of our Class B common stock is entitled to ten votes on all matters submitted to a vote of shareholders. There are no cumulative voting rights. All holders of shares of our Class A common stock and shares of our Class B common stock vote as a single class on all matters that are submitted to the shareholders for a vote. Accordingly, holders of a majority of the shares of our Class A common stock and shares of our Class B common stock entitled to vote in any election of directors may elect all of the directors who stand for election. Shareholders may consent to an action in writing and without a meeting under certain circumstances.
Shares of our Class A common stock and shares of our Class B common stock are entitled to receive dividends, if any, as may be declared by the board of directors out of legally available funds. In the event of a liquidation, dissolution or winding up of our Company, the shares of our Class A common stock and shares of our Class B common stock are entitled to share ratably in our assets remaining after the payment of all of our debts and other liabilities. Holders of shares of our Class A common stock and shares of our Class B common stock have no preemptive, subscription or redemption rights, and there are no redemption or sinking fund provisions applicable to the shares of our Class A common stock and our Class B common stock.
Our Class B common stock may not be transferred unless converted into shares of our Class A common stock, other than certain transfers to affiliates, family members, and charitable organizations. The shares of our Class B common stock are convertible one-for-one into shares of our Class A common stock, at the option of the holder of the shares of our Class B common stock.
As part of additional consideration for the acquisition of a solar energy integrator, Real Goods issued, on November 1, 2007, seven-year warrants to purchase 40,000 shares of Real Goods’ Class A common stock at an exercise price of $3.20 per share. See Note 4, Mergers and Acquisitions.
65
11. Share-Based Compensation
Our share-based compensation program is a long-term retention program that is intended to attract, retain and provide incentives for talented employees, officers, and directors, and to align shareholder and employee interests. We grant options under our 1999 Long-Term Incentive Plan, which provides for the granting of options to purchase up to 3 million shares of our Class A common stock and terminates no later than June 1, 2009. We generally grant options under our Plan with an exercise price equal to the closing market price of our stock at the date of the grant and the options normally vest and become exercisable at 2% per month for the 50 months beginning in the eleventh month after date of grant. We recognize the compensation expense related to share-based payment awards on a straight-line basis over the requisite service periods of the awards, which are generally five years for employees and two years for Board members and named executive officers’ restricted stock wards. Grants typically expire seven years from the date of grant.
The determination of the fair value of share-based payment awards on the date of grant using the Black-Scholes option-pricing model is affected by our stock price as well as assumptions regarding a number of complex and subjective variables. We derive the expected terms from the historical behavior of participant groupings. We base expected volatilities on the historically realized volatility of our stock over the expected term. Our use of historically realized volatilities is based upon the expectation that future volatility over the expected term is not likely to differ from historical results. We base the risk-free interest rate used in the option valuation model on U.S. Treasury zero-coupon issues with remaining terms similar to the expected term on the options. We do not anticipate paying any cash dividends in the foreseeable future and, therefore, we use an expected dividend yield of zero in the option valuation model. In accordance with SFAS No. 123(R), we are required to estimate forfeitures at the time of grant and revise those estimates in subsequent periods if actual forfeitures differ from those estimates. We use historical data by participant groupings to estimate option forfeitures and record share-based compensation expense only for those awards that are expected to vest.
| | | | | | | | |
| | | | | | | | | |
| | 2007 | | 2006 | | 2005 | |
| | | | | | | | | |
| | | | | | | | |
Expected volatility | | 49% - 59 | % | | 51% - 61 | % | 38.4% - 46.9 | % |
Weighted-average volatility | | 57 | % | | 59 | % | 42 | % |
Expected dividends | | 0 | % | | 0 | % | 0 | % |
Expected term (in years) | | 2.0 – 5.8 | | | 1.5 – 5.9 | | 5 | |
Risk-free rate | | 4.13% - 4.88 | % | | 4.27% - 5.13 | % | 2.28% - 4.39 | % |
The table below presents a summary of option activity under the Plan as of December 31, 2007, and changes during the year then ended:
| | | | | | | | | | | |
| | | | | | | | | | | | |
| | Shares | | Weighted-
Average
Exercise
Price | | Weighted-
Average Remaining
Contractual
Term | | Aggregate
Intrinsic
Value | |
| | | | | | | | | | | | |
| | | | | | | | | | | |
Outstanding at January 1, 2007 | | 1,027,740 | | $ | 10.59 | | | | | | |
Granted | | 333,000 | | | 15.64 | | | | | | |
Exercised | | (216,070 | ) | | 12.59 | | | | | | |
Forfeited or expired | | (261,000 | ) | | 13.91 | | | | | | |
| | | | | | | | | | | |
Outstanding at December 31, 2007 | | 883,670 | | $ | 11.02 | | 4.0 | | $ | 15,692,126 | |
| | | | | | | | | | | | |
Exercisable at December 31, 2007 | | 403,200 | | $ | 8.18 | | 2.2 | | $ | 8,305,221 | |
| | | | | | | | | | | | |
We issue new shares upon the exercise of options. We received $2.7 million and $3.9 million in cash from stock options exercised during 2007 and 2006, respectively. The weighted-average grant-date fair value of options granted during the years 2007, 2006, and 2005 was $8.28, $8.06, and $4.37, respectively. The total intrinsic value of options exercised during the years ended December 31, 2007, 2006, and 2005, was $2.1 million, $6.3 million, and $0.3 million, respectively. The total fair value of shares vested during the years ended December 31, 2007, 2006, and 2005 was $0.7 million, $0.4 million, and $1.4 million, respectively.
The share-based compensation cost charged against income was $1.1 million, $0.7 million, and none during 2007, 2006, and 2005, respectively, and is shown in corporate, general and administration expenses. The total income tax benefit recognized for share-based compensation was $0.4 million, $0.3 million, and none for 2007, 2006, and 2005, respectively. As of December 31, 2007, there was $3.0 million of unrecognized cost related to nonvested shared-based compensation arrangements granted under the Plan. We expect that cost to be recognized over a weighted-average period of 3.5 years.
66
During 2007, we extended the post-termination exercise grace period from 30 days to approximately six months for vested options belonging to a former employee. This modification had an immaterial effect on compensation expense for the year ended December 31, 2007.
During 2007, our subsidiary, Gaiam Energy Tech granted 300,000 options at $0.20 per share under its 2007 Long-Term Incentive Plan, which provides for the granting of up to 1,000,000 common shares. Under this plan, options are typically granted with an exercise price equal to the estimated market price of Gaiam Energy Tech’s stock at the date of grant, vest based on performance or service conditions, and expire seven years from the date of grant. Expected volatilities are based on a value calculated using the historical volatility of comparable public companies in Gaiam Energy Tech’s industry. Expected life is based on the specific vesting terms of the option, anticipated changes to market value and expected employee exercise behavior. The risk-free interest rate used in the option valuation model is based on U.S. Treasury zero-coupon issues with remaining terms similar to the expected term on the options. Gaiam Energy Tech’s successor, Real Goods, assumed these options on January 31, 2008, at an exercise price of $3.20 per share. We valued these options using an expected volatility of 67%, expected term of 4.0 years, a risk-free interest rate of 4.875%, and no expected dividends. In determining the fair value of Real Goods’ common stock at the date of grant of stock options, we set the market value based on a combination of many different factors, such as an independent offer to purchase a portion of Real Goods in exchange for preferred stock, the value of recent Gaiam Energy Tech acquisitions, and an evaluation performed by an independent firm retained for that purpose. The options assumed are for Real Goods’ Class A common stock and vest only upon the initial public offering of Real Goods’ Class A common stock or our sale of 50% or more of the company, (50% vest upon an initial public offering and thereafter vest approximately 2.0% per month during the 25-month period subsequent to the completion of Real Goods’ initial public offering). The performance of this condition was not probable as of December 31, 2007; therefore, we have recognized no compensation expense related to these options. As of December 31, 2007, there was $0.5 million of unrecognized cost related to these nonvested share-based compensation arrangements. The ultimate recognition of compensation cost, if any, is dependent on the Real Goods initial public offering, the occurrence or timing of which cannot accurately be predicted.
12. Segment and Geographic Information
We manage our business and aggregate our operational and financial information in accordance with two reportable segments. The direct to consumer segment contains the direct response marketing programs, catalog, Internet, solar, and subscription community sales channels, while the business segment comprises the retailers, media and corporate account channels.
Although we are able to track revenues by sales channel, the management, allocation of resources and analysis and reporting of expenses is solely on a combined basis, at the reportable segment level.
Contribution margin is defined as net sales, less cost of goods sold and direct expenses. Financial information for our segments is as follows:
Segment Information
| | | | | | | | | | | |
| |
| | Years ended December 31, | |
| | |
(in thousands) | | 2007 | | | 2006 | | 2005 | |
| |
Net revenue: | | | | | | | | | | | |
Direct to consumer | | $ | 151,462 | | | $ | 125,708 | | $ | 72,337 | |
Business | | | 111,481 | | | | 93,772 | | | 70,155 | |
| |
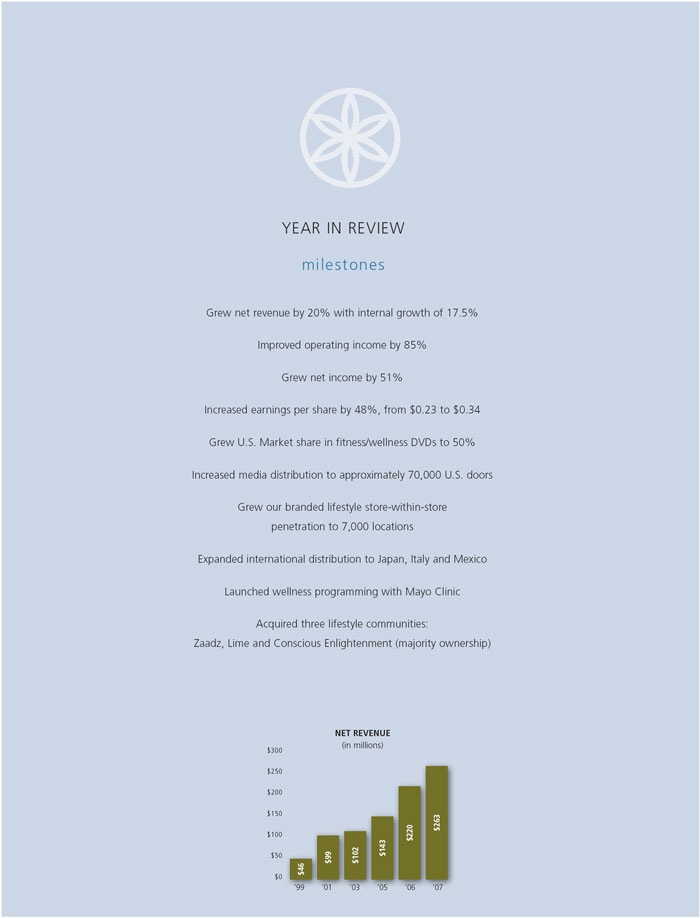
Consolidated net revenue | | | 262,943 | | | | 219,480 | | | 142,492 | |
Contribution margin (loss): | | | | | | | | | | | |
Direct to consumer | | | (2,904 | ) | | | (2,291 | ) | | (781 | ) |
Business | | | 13,357 | | | | 7,932 | | | 3,867 | |
| |
Consolidated contribution margin | | | 10,453 | | | | 5,641 | | | 3,086 | |
Reconciliation of contribution margin to net income: | | | | | | | | | | | |
Other income (expense) | | | 4,148 | | | | 3,905 | | | (175 | ) |
Income tax expense | | | 5,767 | | | | 3,774 | | | 974 | |
Minority interest in net income of consolidated subsidiary, net of income taxes | | | (310 | ) | | | (128 | ) | | (601 | ) |
| |
Net income | | $ | 8,524 | | | $ | 5,644 | | $ | 1,336 | |
| |
67
The direct to consumer and business segments had total assets as follows:
| | | | | | | | | | | |
| | | | | | | | | | | | |
| | As of December 31, | |
| | | |
(in thousands) | | 2007 | | | 2006 | | 2005 | |
| | | | | | | | | | | | |
Total assets: | | | | | | | | | | | |
Direct to consumer | | $ | 95,146 | | | $ | 89,507 | | $ | 33,565 | |
Business | | | 145,566 | | | | 161,461 | | | 122,536 | |
| | | | | | | | | | | | |
| | $ | 240,712 | | | $ | 250,968 | | $ | 156,101 | |
| | | | | | | | | | | | |
Major Customer
Sales to our largest customer for 2007, 2006 and 2005 accounted for less than 10%, 10.1% and 12.1% of total revenue, respectively, during these periods and are reported in our business segment.
Geographic Information
We sell and distribute essentially the same products in the United States and several foreign countries. The major geographic territories are the U.S., Canada, Japan, and the U.K. and are based on the location of the customer. The following represents geographical data for our operations as of and for the year ended December 31:
| | | | | | | | | | | |
| | | | | | | | | | | |
(in thousands) | | 2007 | | | 2006 | | 2005 | |
| | | | | | | | |
Revenue: | | | | | | | | | | | |
United States | | $ | 229,279 | | | $ | 206,584 | | $ | 128,034 | |
International | | | 33,664 | | | | 12,896 | | | 14,458 | |
| | | | | | | | | | | | |
| | $ | 262,943 | | | $ | 219,480 | | $ | 142,492 | |
| | | | | | | | | | | | |
Long-Lived Assets: | | | | | | | | | | | |
United States | | $ | 47,794 | | | $ | 44,172 | | $ | 46,466 | |
International | | | 1,521 | | | | 1,750 | | | 1,729 | |
| | | | | | | | | | | | |
| | $ | 49,315 | | | $ | 45,922 | | $ | 48,195 | |
| | | | | | | | | | | |
| | | | | | | | | | |
| | | | | | | | | | |
| | | | | | | | | | | |
| | As of December 31, | |
| | | |
(in thousands) | | 2007 | | | 2006 | | 2005 | |
| | | | | | | | | |
Components of Long-Lived Assets (1): | | | | | | | | | | | |
Property and equipment, net | | $ | 9,509 | | | $ | 7,784 | | $ | 9,428 | |
Media Library, net | | | 37,566 | | | | 37,201 | | | 38,339 | |
Other Intangibles, net | | | 1,554 | | | | 530 | | | 146 | |
Notes receivable and other assets | | | 686 | | | | 407 | | | 282 | |
| | | | | | | | | | | | |
| | $ | 49,315 | | | $ | 45,922 | | $ | 48,195 | |
| | | | | | | | | | | | |
| |
(1) | Excludes other non-current assets (non-current deferred tax assets, net, goodwill, investments, notes receivable, and security deposits) of $50,331, $38,199, and $31,637 for 2007, 2006, and 2005, respectively. |
68
13. Quarterly Results of Operations (Unaudited)
The following is a summary of the quarterly results of operations for the years ended December 31, 2007 and 2006:
| | | | | | | | | | | | | |
| | |
| | Fiscal Year 2007 Quarters Ended | |
| | | |
(in thousands, except per share data) | | March 31 | | June 30 | | September 30 | | December 31 | |
| | |
|
Net revenue | | $ | 58,458 | | $ | 52,361 | | $ | 70,318 | | $ | 81,806 | |
Gross profit | | | 37,476 | | | 33,631 | | | 46,144 | | | 51,127 | |
Income (loss) before income taxes and minority interests | | | 2,828 | | | (783 | ) | | 5,224 | | | 7,332 | |
Net income (loss) | | | 1,752 | | | (346 | ) | | 2,918 | | | 4,200 | |
Diluted net income (loss) per share | | $ | 0.07 | | $ | (0.01 | ) | $ | 0.12 | | $ | 0.17 | |
Weighted average shares outstanding-diluted | | | 25,813 | | | 24,655 | | | 24,970 | | | 25,154 | |
| | |
| | | | | | | | | | | | | |
| | |
| | Fiscal Year 2006 Quarters Ended | |
| | | |
(in thousands, except per share data) | | March 31 | | June 30 | | September 30 | | December 31 | |
| | |
|
Net revenue | | $ | 51,752 | | $ | 43,161 | | $ | 51,786 | | $ | 72,781 | |
Gross profit | | | 33,162 | | | 26,891 | | | 32,629 | | | 47,648 | |
Income (loss) before income taxes and minority interests | | | 1,587 | | | (2,125 | ) | | 2,522 | | | 7,562 | |
Net income (loss) | | | 890 | | | (1,166 | ) | | 1,653 | | | 4,267 | |
Diluted net income (loss) per share | | $ | 0.04 | | $ | (0.05 | ) | $ | 0.06 | | $ | 0.16 | |
Weighted average shares outstanding-diluted | | | 20,795 | | | 23,140 | | | 26,864 | | | 27,211 | |
| | |
14. Subsequent Events
On February 7, 2008, Real Goods filed a preliminary registration statement with the Securities and Exchange Commission relating to a proposed initial public offering of a minority interest of its Class A common stock.
On February 1, 2008, we sold our investment in the non-LOHAS business newspapers that were previously acquired as part of the Conscious Media acquisition.
On March 17, 2008, we re-acquired 75,800 shares of our Class A common stock for an average price of $17.55 per share in the open market.
Schedule II – Consolidated valuation and qualifying accounts
| | | | | | | | | | | | | |
| | |
(in thousands) | | Balance at
Beginning of
Year | | Additions
Charged to
Costs and
Expenses (1) | | Deductions | | Balance at
End of
Year (1) | |
| | |
| | | | | | | | | | | | | |
Allowance for doubtful accounts: | | | | | | | | | | | | | |
2007 | | $ | 1,443 | | $ | 312 | | $ | 476 | | $ | 1,279 | |
2006 | | $ | 826 | | $ | 2,917 | | $ | 2,300 | | $ | 1,443 | |
2005 | | $ | 642 | | $ | 952 | | $ | 768 | | $ | 826 | |
| | | | | | | | | | | | | |
Allowance for product returns: | | | | | | | | | | | | | |
2007 | | $ | 6,891 | | $ | 30,216 | | $ | 30,348 | | $ | 6,759 | |
2006 | | $ | 4,819 | | $ | 17,457 | | $ | 15,385 | | $ | 6,891 | |
2005 | | $ | 1,814 | | $ | 6,350 | | $ | 3,345 | | $ | 4,819 | |
|
|
(1) Includes reserves associated with acquired assets/companies. |
Changes in and disagreements with accountants on accounting and financial disclosures
Not applicable.
69
Directors and executive officers
The information required by this section is incorporated herein by reference to Gaiam’s Proxy Statement for its Annual Meeting of Shareholders, to be held on June 3, 2008, to be filed with the Commission pursuant to Regulation 14A.
GENERAL INFORMATION
|
BOARD OF DIRECTORS |
|
Jirka Rysavy |
Founder, Chairman of Gaiam |
|
Lynn Powers |
President of Gaiam |
|
James Argyropoulos |
Founder and former Chairman of |
The Cherokee Group |
|
Barnet M. Feinblum |
CEO of Organic Vintners; |
Former CEO of Horizon Organic and |
Celestial Seasonings |
|
Barbara Mowry |
CEO of Silver Creek Systems; |
Former CEO of Requisite Technology |
|
Ted Nark |
Former CEO and Chairman of |
White Cap Industries; |
Former CEO of Corporate Express Australia |
|
Paul H. Ray |
Author of “The Integral Culture |
Survey,” a study that first identified |
Cultural Creatives |
|
EXECUTIVE OFFICERS |
|
Vilia Valentine |
Chief Financial Officer |
and Treasurer |
|
John Jackson |
Secretary and Vice President |
of Corporate Development |
|
DIVIDEND POLICY |
We have never paid cash dividends |
on our common stock. |
|
Ordering Financial Statements |
A copy of our annual report |
or form 10-K may be obtained |
without charge upon written request to: |
|
Gaiam, Inc. Investor Relations |
360 Interlocken Blvd. |
Broomfield, CO 80021 |
investorrelations@gaiam.com |
|
We do not mail quarterly |
financial reports to shareholders. |
This information is available |
on our website: www.gaiam.com. |
|
ANNUAL MEETING |
Tuesday, June 3, 2008 |
4:30 p.m. (MST) |
Marriott Courtyard Boulder Louisville |
948 West Dillon Road |
Louisville, Colorado 80027 |
|
TRANSFER AGENT & REGISTRAR |
Information about stock |
certificates, address changes, |
and shareholding matters |
can be obtained from: |
|
Computershare Trust Company, N.A. |
250 Royall Street |
Canton, MA 02021 |
Tel: 303.262.0600 |
www.computershare.com |
|
Trading information |
The common stock of Gaiam, Inc. is traded on |
the NASDAQ Stock Market (symbol: GAIA). If |
you wish to become a shareholder, please |
contact a stockbroker. |
70


