| | |
 | | ANNUAL REPORT |
AMG Funds
December 31, 2016

AMG Renaissance Large Cap Growth Fund
Class N: MRLTX | Class I: MRLSX | Class Z: MRLIX
AMG Renaissance International Equity Fund
Class N: RIEIX | Class I: RIESX | Class Z: RIELX
| | | | |
| www.amgfunds.com | | | | | AR024-1216 |
|
| AMG Funds |
Annual Report—December 31, 2016 |
| | | | |
TABLE OF CONTENTS | | PAGE | |
LETTER TO SHAREHOLDERS | | | 2 | |
| |
ABOUT YOUR FUND’S EXPENSES | | | 3 | |
| |
PORTFOLIO MANAGER’S COMMENTS, FUND SNAPSHOTS, AND SCHEDULES OF PORTFOLIO INVESTMENTS | | | | |
| |
AMG Renaissance Large Cap Growth Fund | | | 4 | |
AMG Renaissance International Equity Fund | | | 9 | |
| |
NOTES TO SCHEDULES OF PORTFOLIO INVESTMENTS | | | 15 | |
| |
FINANCIAL STATEMENTS | | | | |
| |
Statement of Assets and Liabilities | | | 18 | |
Balance sheets, net asset value (NAV) per share computations and cumulative undistributed amounts | | | | |
| |
Statement of Operations | | | 20 | |
Detail of sources of income, expenses, and realized and unrealized gains (losses) during the fiscal year | | | | |
| |
Statements of Changes in Net Assets | | | 21 | |
Detail of changes in assets for the past two fiscal years | | | | |
| |
Financial Highlights | | | 22 | |
Historical net asset values per share, distributions, total returns, income and expense ratios, turnover ratios and net assets | | | | |
| |
Notes to Financial Statements | | | 26 | |
Accounting and distribution policies, details of agreements and transactions with Fund management and affiliates, and descriptions of certain investment risks | | | | |
| |
REPORT OF INDEPENDENT REGISTERED PUBLIC ACCOUNTING FIRM | | | 33 | |
| |
TRUSTEES AND OFFICERS | | | 34 | |
Nothing contained herein is to be considered an offer, sale or solicitation of an offer to buy shares of any series of the AMG Funds family of mutual funds. Such offering is made only by prospectus, which includes details as to offering price and other material information.
| | |
| | Letter to Shareholders |
DEAR SHAREHOLDER:
While the year got off to a rocky start, overall U.S. equity investors enjoyed strong positive returns for 2016. The S&P 500 Index, a widely-followed barometer of the U.S. equity market, returned 12.0% during the prior twelve months. Small cap investors were also rewarded with a return of 21.3% for the small cap Russell 2000® Index.
After the market’s initial stumble, investors had to balance a number of noteworthy events, including the U.K.’s planned exit from the European Union (“Brexit”), a contentious U.S. presidential election and the U.S. Federal Reserve’s second rate increase of 25 basis points to 0.50%-0.75%. Following the surprise election of Donald Trump as the 45th President of the United States, investors witnessed a rally in pro-cyclical sectors as the new administration’s plans for tax reform and increased fiscal spending drove anticipation of stronger future economic growth. Along with higher equity prices, long-term interest rates rose and the U.S. Dollar strengthened. Commodity prices collapsed, but then rebounded on indications of an increase in U.S. infrastructure spending and a small uptick in China’s third-quarter Gross Domestic Product (GDP). Oil prices also experienced volatility as they continued their fall from 2015, bottoming in February and subsequently recovering more than 100%. This recovery lent some much needed support to the beleaguered energy industry, which ended the year with the highest returns of any sector in the S&P 500 Index. In total, all sectors but the health care sector were positive for 2016; however, there was significant dispersion in performance across sectors. Energy, telecommunication services and financials returned 27%, 23% and 21%, respectively, while companies within the consumer staples, real estate and health care sectors returned 5%, 4% and (3)%, respectively. Internationally, stocks lagged their U.S. counterparts, returning 4.5%, as measured by the MSCI ACWI ex USA (in U.S. Dollar terms).
The Bloomberg Barclays U.S. Aggregate Bond Index, a broad U.S. bond market benchmark, returned 2.7% for the year ended December 31, 2016. Over the course of the year, interest rates and credit spreads gyrated at times, putting pressure on bond prices. While stocks finished strong, bond prices were less fortunate, as rising interest rates caused yields to rise and bond prices to fall. The 10-year U.S. Treasury note’s yield started the year at 2.24%, bottomed at 1.37% in July, and ended the year much higher at 2.45%. High yield, on the other hand, was very strong, as investor risk appetite improved and spreads tightened 470 basis points. The Bloomberg Barclays U.S. Corporate High Yield Bond Index ended the year with a healthy 17.1% return.
We are excited to announce as of October 1, 2016, the AMG Funds family of mutual funds fully integrated the former Aston Funds. AMG Funds and Aston Funds shareholders will now have access to the differentiated solutions of AMG Funds, which represents a single point of access to one of the largest line-ups of boutique managers and products in the world.
AMG Funds appreciates the privilege of providing investment tools to you and your clients. Our foremost goal at AMG Funds is to provide investment solutions that help our shareholders successfully reach their long-term investment goals. By partnering with AMG’s affiliated investment boutiques, AMG Funds provides access to a distinctive array of actively-managed return-oriented investment strategies. Additionally, we oversee and distribute a number of complementary open-architecture mutual funds subadvised by unaffiliated investment managers. We thank you for your continued confidence and investment in AMG Funds. You can rest assured that under all market conditions our team is focused on delivering excellent investment management services for your benefit.
Respectfully,

Jeffery Cerutti
President
AMG Funds
| | | | | | | | | | | | | | |
Average Annual Total Returns | | Periods ended December 31, 2016 | |
| | | 1 Year | | | 3 Years | | | 5 Years | |
Stocks: | | | | | | | | | | | | | | |
Large Caps | | (S&P 500 Index) | | | 11.96 | % | | | 8.87 | % | | | 14.66 | % |
Small Caps | | (Russell 2000® Index) | | | 21.31 | % | | | 6.74 | % | | | 14.46 | % |
International | | (MSCI All Country World ex-USA Index) | | | 4.50 | % | | | (1.78 | )% | | | 5.00 | % |
Bonds: | | | | | | | | | | | | | | |
Investment Grade | | (Bloomberg Barclays U.S. Aggregate Bond Index) | | | 2.65 | % | | | 3.03 | % | | | 2.23 | % |
High Yield | | (Bloomberg Barclays U.S. Corporate High Yield Index) | | | 17.13 | % | | | 4.66 | % | | | 7.36 | % |
Tax-exempt | | (Bloomberg Barclays Municipal Bond Index) | | | 0.25 | % | | | 4.14 | % | | | 3.28 | % |
Treasury Bills | | (BofA Merrill Lynch 6 month U.S. Treasury Bill) | | | 0.67 | % | | | 0.34 | % | | | 0.27 | % |
2
About Your Fund’s Expenses
As a shareholder of a Fund, you may incur two types of costs: (1) transaction costs, which may include sales charges (loads) on purchase payments; redemption fees; and exchange fees; and (2) ongoing costs, including management fees; distribution (12b-1) fees; and other Fund expenses. This example is intended to help you understand your ongoing costs (in dollars) of investing in the Fund and to compare these costs with the ongoing costs of investing in other mutual funds. The example is based on $1,000 invested at the beginning of the period and held for the entire period as indicated below.
ACTUAL EXPENSES
The first line of the following table provides information about the actual account values and actual expenses. You may use the information in this line, together with the amount you invested, to estimate the expenses that you paid over the period. Simply divide your account value by $1,000 (for example, an $8,600 account value divided by $1,000 = 8.6), then multiply the result by the number in the first line under the heading entitled “Expenses Paid During Period” to estimate the expenses you paid on your account during this period.
HYPOTHETICAL EXAMPLE FOR COMPARISON PURPOSES
The second line of the following table provides information about hypothetical account values and hypothetical expenses based on the Fund’s actual expense ratio and an assumed annual rate of return of 5% before expenses, which is not the Fund’s actual return. The hypothetical account values and expenses may not be used to estimate the actual ending account balance or expenses you paid for the period. You may use this information to compare the ongoing costs of investing in the Fund and other funds by comparing this 5% hypothetical example with the 5% hypothetical examples that appear in the shareholder reports of other funds.
Please note that the expenses shown in the table are meant to highlight your ongoing costs only and do not reflect any transactional costs, such as sales charges (loads), redemption fees, or exchange fees. Therefore, the second line of the table is useful in comparing ongoing costs only, and will not help you determine the relative total costs of owning different funds.
| | | | | | | | | | | | | | | | |
| | | Expense | | | Beginning | | | Ending | | | Expenses | |
| | | Ratio for | | | Account Value | | | Account Value | | | Paid During | |
| Six Months Ended December 31, 2016 | | the Period | | | 07/01/16 | | | 12/31/16 | | | the Period* | |
AMG Renaissance Large Cap Growth Fund | | | | | | | | | | | | | | | | |
Class N | | | | | | | | | | | | | | | | |
Based on Actual Fund Return | | | 1.16 | % | | $ | 1,000 | | | $ | 1,109 | | | $ | 6.15 | |
Hypothetical (5% return before expenses) | | | 1.16 | % | | $ | 1,000 | | | $ | 1,019 | | | $ | 5.89 | |
Class I | | | | | | | | | | | | | | | | |
Based on Actual Fund Return | | | 0.82 | % | | $ | 1,000 | | | $ | 1,110 | | | $ | 4.35 | |
Hypothetical (5% return before expenses) | | | 0.82 | % | | $ | 1,000 | | | $ | 1,021 | | | $ | 4.17 | |
Class Z | | | | | | | | | | | | | | | | |
Based on Actual Fund Return | | | 0.66 | % | | $ | 1,000 | | | $ | 1,112 | | | $ | 3.50 | |
Hypothetical (5% return before expenses) | | | 0.66 | % | | $ | 1,000 | | | $ | 1,022 | | | $ | 3.35 | |
AMG Renaissance International Equity Fund | | | | | | | | | | | | | | | | |
Class N | | | | | | | | | | | | | | | | |
Based on Actual Fund Return | | | 1.35 | % | | $ | 1,000 | | | $ | 1,026 | | | $ | 6.87 | |
Hypothetical (5% return before expenses) | | | 1.35 | % | | $ | 1,000 | | | $ | 1,018 | | | $ | 6.85 | |
Class I | | | | | | | | | | | | | | | | |
Based on Actual Fund Return | | | 0.97 | % | | $ | 1,000 | | | $ | 1,027 | | | $ | 4.94 | |
Hypothetical (5% return before expenses) | | | 0.97 | % | | $ | 1,000 | | | $ | 1,020 | | | $ | 4.93 | |
Class Z | | | | | | | | | | | | | | | | |
Based on Actual Fund Return | | | 0.85 | % | | $ | 1,000 | | | $ | 1,028 | | | $ | 4.33 | |
Hypothetical (5% return before expenses) | | | 0.85 | % | | $ | 1,000 | | | $ | 1,021 | | | $ | 4.32 | |
| * | Expenses are equal to the Fund’s annualized expense ratio multiplied by the average account value over the period, multiplied by the number of days in the most recent fiscal half-year (184), then divided by 366. |
|
| AMG Renaissance Large Cap Growth Fund |
| Portfolio Manager’s Comments (unaudited) |
THE YEAR IN REVIEW
The AMG Renaissance Large Cap Growth Fund (Class I)1(the “Fund”) returned 9.1% for the year ending December 31, 2016, while its primary benchmark, the Russell 1000® Growth Index, rose 7.1%.
The surprising election of president-elect Donald Trump resulted in sharp reactions in the stock, bond and currency markets. After initially falling the night of the election, U.S. stocks gained steadily throughout November and December, led by financial and industrial issues. The S&P 500 posted a 1.7% loss for the fourth quarter pre-election, but gained 4.6% after the election. Trump’s victory raised expectations of a more pro-business political climate over the next four years, with a more restrained regulatory environment and lower corporate taxes contributing to higher corporate profits.
The U.S. Dollar also posted strong gains post-election, helped in part by declines in other currencies, most notably the Mexican Peso. Rising short-term interest rates also contributed to the Dollar’s strength, as the U.S. Federal Reserve (the Fed) raised their target for the fed funds rate to a range of 0.50% to 0.75% on December 14. The Fed also announced that they expect to raise rates another three times during 2017.
Bonds were the loser post-election, as prices on long-term Treasury bonds tumbled. The yield on 30-year U.S. Treasury bonds rose to 3.1% by the end of the quarter, the highest level since the quarter ending 6/30/15. Interest-rate increases by the Fed contributed to the negative sentiment on bonds but, even more significantly, inflation expectations have risen. President-elect Trump’s budget plans might result in increased federal budget deficits, at least in the short term, and rising energy prices are also contributing to higher inflation expectations.
Consumer confidence, as measured by the Conference Board, rose in December to its highest reading since 2001. A similar confidence survey by the University of Michigan showed the highest confidence reading in the past 13 years. Rising
optimism may provide a boost to the economy over the next few quarters, even before new government economic policies are initiated.
The recent post-election stock market rally was the strongest the U.S. has experienced over the past 100+ years. As to what followed other strong gains, the record is somewhat mixed. The average gain in the next calendar year after a post-election rally of 5% or more has been 11%. However, this average includes a gain of 30.0% (in 1925) as well as a loss of 8.7% (in 1901)2.
Market leadership within the stock market shifted dramatically following the election. While the energy, financial and materials sectors were poor performers for 2015 and 2016 leading up to the election, they were among the strongest sectors over the remainder of 2016. Conversely, the consumer staples and utilities sectors were among the strongest performing sectors through November 7, but then were significant underperformers through year-end. Rising expectations for economic growth contributed to the gains in more cyclically-sensitive sectors, such as energy, at the expense of traditionally defensive sectors such as utilities.
If economic growth does accelerate, companies with exposure to capital spending should potentially benefit. Historically, corporations have invested cash in excess of their actual operating cash flow in capital spending projects which, over time, contributes to rising productivity and stronger economic growth. However, since the financial crisis of 2008, many companies have underinvested in capital spending projects, preferring to use cash to buy back stock or pay out dividends. A return to a more traditional pattern of capital investment could be very beneficial to overall economic growth, and especially beneficial to companies involved in the capital spending sector, such as technology and industrial companies.
The S&P 500 P/E ratio rose to 21.0X by quarter-end, marking its highest level since quarter ending 9/30/093. The inverse of this measure, the E/P ratio or earnings yield, can be compared with the yield on bonds to provide a picture of the relative
valuation of stocks vs. bonds. As the earnings yield on stocks has declined, the yield on bonds has increased, with the result that the spread between these two yields has contracted to its lowest point since the financial crisis. Even so, this measure is still unusually high relative to longer-term history, suggesting that investors are still underpricing stocks, overpricing bonds, or perhaps a little of both.
For the year 2016, our selections in the technology sector, along with our over weighted position and selections in the industrial sector, made the most positive contribution to relative returns for the year. Notable performers over the period include Cummins 61%, Marriott 44% (sold during the period) and F5 Networks 49%. On the negative side, our selections in consumer staples and health care sectors detracted the most from our relative performance for the year. Notable underperformers include McKesson (28%), Gilead Sciences (28%) and Express Scripts (21%).
The new political environment we are about to experience is likely to be very different from the past, and a certain amount of uncertainty and volatility is to be expected. However, we are also encouraged by recently rising economic optimism and confident in the ability of American businesses to continue to compete and grow. We believe that the Fund is well positioned to take advantage of an improving economic landscape in the coming year. We continue to find good investment opportunity in stocks, particularly high-quality companies in the technology, consumer discretionary, health care and industrial sectors.
| 1 | Prior to October 1, 2016, the Fund’s Class I shares were known as Service Class shares. |
| 2 | Dow Jones Industrial Average, since inception in 1896 |
| 3 | Standard & Poors, FactSet |
This commentary reflects the viewpoint of the portfolio manager, The Renaissance Group LLC, as of December 31, 2016, and is not intended as a forecast or guarantee of future results and is subject to change without notice.
AMG Renaissance Large Cap Growth Fund
Portfolio Manager’s Comments (continued)
CUMULATIVE TOTAL RETURN PERFORMANCE
AMG Renaissance Large Cap Growth Fund’s cumulative total return is based on the daily change in net asset value (NAV), and assumes that all dividends and distributions were reinvested. The graph compares a hypothetical $10,000 investment made in AMG Renaissance Large Cap Growth Fund’s Class I (formerly Service Class) on June 3, 2009 (commencement of operations) to a $10,000 investment made in the Russell 1000® Growth Index for the same time period. The graph and table do not reflect the deduction of taxes that a shareholder would pay on a Fund distribution or redemption of shares. The listed returns for the Fund are net of expenses and the returns for the index exclude expenses. Total returns would have been lower had certain expenses not been reduced.
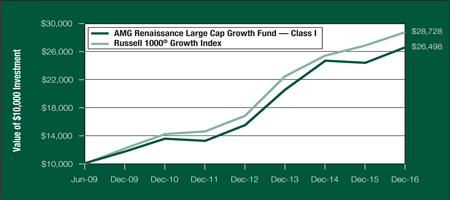
The table below shows the average annual total returns for the AMG Renaissance Large Cap Growth Fund and the Russell 1000® Growth Index for the same time periods ended December 31, 2016.
| | | | | | | | | | | | | | | | |
| | | One | | | Five | | | Since | | | Inception | |
| Average Annual Total Returns1 | | Year | | | Years | | | Inception | | | Date | |
AMG Renaissance Large Cap Growth Fund 2,3,4 | |
Class N5 | | | 8.81 | % | | | 15.02 | % | | | 13.38 | % | | | 06/03/09 | |
Class I5 | | | 9.12 | % | | | 15.41 | % | | | 13.72 | % | | | 06/03/09 | |
Class Z5 | | | 9.38 | % | | | 15.59 | % | | | 13.92 | % | | | 06/03/09 | |
Russell 1000® Growth Index6 | | | 7.08 | % | | | 14.50 | % | | | 14.94 | % | | | 06/03/09 | † |
The performance data shown represents past performance. Past performance is not a guarantee of future results. Current performance may be lower or higher than the performance data quoted. The investment return and principal value of an investment will fluctuate so that an investor’s shares, when redeemed, may be worth more or less than their original cost.
Investors should carefully consider the Fund’s investment objectives, risks, charges, and expenses before investing. For performance information through the most recent month end, current net asset values per share for the Fund and other information, please call (800) 835-3879 or visit our website at www.amgfunds.com for a free prospectus. Read it carefully before investing or sending money.
Distributed by AMG Distributors, Inc., member FINRA/SIPC.
| † | The date reflects inception date of the Fund, not the index. |
| 1 | Total return equals income yield plus share price change and assumes reinvestment of all dividends and capital gain distributions. Returns are net of fees and may reflect offsets of Fund expenses as described in the prospectus. No adjustment has been made for taxes payable by shareholders on their reinvested dividends and capital gain distributions. Returns for periods greater than one year are annualized. The listed returns on the Fund are net of expenses and based on the published NAV as of December 31, 2016. All returns are in U.S. dollars ($). |
| 2 | From time to time, the Fund’s advisor has waived its fees and/or absorbed Fund expenses, which has resulted in higher returns. |
| 3 | The Fund invests in large-capitalization companies that may underperform other stock funds (such as funds that focus on small- and medium-capitalization companies) when stocks of large capitalization companies are out of favor. |
| 4 | The Fund invests in growth stocks, which may be more sensitive to market movements because their prices tend to reflect future investor expectations rather than just current profits. |
| 5 | Effective October 1, 2016, the Investor Class, Service Class and Institutional Class of AMG Renaissance Large Cap Growth Fund were renamed Class N, Class I and Class Z, respectively. |
| 6 | The Russell 1000® Growth Index is a market capitalization weighted index that measures the performance of those Russell 1000® companies with higher price-to-book ratios and higher forecasted growth values. Unlike the Fund, the Russell 1000® Growth Index is unmanaged, is not available for investment and does not incur expenses. |
The Russell 1000® Growth Index is a trademark of the London Stock Exchange Group companies.
Not FDIC insured, nor bank guaranteed. May lose value.
5
|
| AMG Renaissance Large Cap Growth Fund |
| Fund Snapshots (unaudited) |
| December 31, 2016 |
PORTFOLIO BREAKDOWN
| | | | | | | | |
Sector | | AMG Renaissance
Large Cap
Growth Fund* | | | Russell 1000®
Growth Index | |
Information Technology | | | 30.2 | % | | | 31.4 | % |
Consumer Discretionary | | | 20.7 | % | | | 20.8 | % |
Health Care | | | 18.2 | % | | | 16.1 | % |
Industrials | | | 16.6 | % | | | 11.1 | % |
Financials | | | 7.4 | % | | | 2.9 | % |
Consumer Staples | | | 3.2 | % | | | 9.5 | % |
Materials | | | 1.8 | % | | | 3.6 | % |
Real Estate | | | 0.0 | % | | | 2.7 | % |
Energy | | | 0.0 | % | | | 0.6 | % |
Telecommunication Services | | | 0.0 | % | | | 1.3 | % |
Other Assets and Liabilities | | | 1.9 | % | | | 0.0 | % |
| * | As a percentage of net assets. |
TOP TEN HOLDINGS
| | | | |
| | | % of | |
Security Name | | Net Assets | |
F5 Networks, Inc. | | | 2.2 | % |
Texas Instruments, Inc.** | | | 2.1 | |
The Boeing Co. | | | 2.1 | |
Cummins, Inc. | | | 2.1 | |
Darden Restaurants, Inc. | | | 2.1 | |
Juniper Networks, Inc. | | | 2.0 | |
Lam Research Corp. | | | 2.0 | |
Apple, Inc. | | | 2.0 | |
Western Digital Corp. | | | 2.0 | |
Microsoft Corp. | | | 2.0 | |
| | | | |
Top Ten as a Group | | | 20.6 | % |
| | | | |
| ** | Top Ten Holdings as of June 30, 2016. |
Because a fund’s strategy may result in multiple investments in particular sectors of the economy, its performance may depend on the performance of those sectors and may fluctuate more widely than investments diversified across more sectors. For additional information on these and other risk considerations, please see the Fund’s prospectus.
Any sectors, industries, or securities discussed should not be perceived as investment recommendations. Mention of a specific security should not be considered a recommendation to buy or solicitation to sell that security. Specific securities mentioned in this report may have been sold from the Fund’s portfolio of investments by the time you receive this report.
6
|
| AMG Renaissance Large Cap Growth Fund |
| Schedule of Portfolio Investments |
| December 31, 2016 |
| | | | | | | | |
| | | Shares | | | Value | |
Common Stocks—98.1% | | | | | | | | |
Consumer Discretionary—20.7% | | | | | |
AutoZone, Inc.* | | | 1,587 | | | $ | 1,253,397 | |
Carnival Corp. | | | 25,203 | | | | 1,312,068 | |
Darden Restaurants, Inc. | | | 20,313 | | | | 1,477,161 | |
Discovery Communications, Inc., Class A*, 1 | | | 46,692 | | | | 1,279,828 | |
Dollar General Corp. | | | 13,287 | | | | 984,168 | |
Foot Locker, Inc. | | | 18,237 | | | | 1,292,821 | |
The Home Depot, Inc. | | | 8,722 | | | | 1,169,446 | |
The Interpublic Group of Cos., Inc. | | | 50,675 | | | | 1,186,302 | |
Lowe’s Cos., Inc. | | | 14,528 | | | | 1,033,231 | |
O’Reilly Automotive, Inc.* | | | 4,613 | | | | 1,284,305 | |
Ross Stores, Inc. | | | 19,157 | | | | 1,256,699 | |
Scripps Networks Interactive, Inc., Class A | | | 18,160 | | | | 1,296,079 | |
Total Consumer Discretionary | | | | 14,825,505 | |
Consumer Staples—3.2% | | | | | |
CVS Health Corp. | | | 12,539 | | | | 989,452 | |
The Kroger Co. | | | 38,237 | | | | 1,319,559 | |
Total Consumer Staples | | | | | | | 2,309,011 | |
Financials—7.4% | | | | | | | | |
American Express Co. | | | 18,392 | | | | 1,362,479 | |
The Charles Schwab Corp. | | | 33,134 | | | | 1,307,799 | |
Prudential Financial, Inc. | | | 12,434 | | | | 1,293,882 | |
T. Rowe Price Group, Inc. | | | 17,702 | | | | 1,332,253 | |
Total Financials | | | | | | | 5,296,413 | |
Health Care—18.2% | | | | | | | | |
Aetna, Inc. | | | 10,568 | | | | 1,310,538 | |
Amgen, Inc. | | | 7,995 | | | | 1,168,949 | |
Anthem, Inc. | | | 8,749 | | | | 1,257,844 | |
Biogen, Inc.* | | | 4,562 | | | | 1,293,692 | |
Cardinal Health, Inc. | | | 15,324 | | | | 1,102,868 | |
Celgene Corp.* | | | 11,215 | | | | 1,298,136 | |
Cigna Corp. | | | 9,352 | | | | 1,247,463 | |
Express Scripts Holding Co.* | | | 15,758 | | | | 1,083,993 | |
Gilead Sciences, Inc. | | | 14,010 | | | | 1,003,256 | |
| | | | | | | | |
| | | Shares | | | Value | |
Hologic, Inc.* | | | 33,901 | | | $ | 1,360,108 | |
McKesson Corp. | | | 6,785 | | | | 952,953 | |
Total Health Care | | | | | | | 13,079,800 | |
Industrials—16.6% | | | | | | | | |
Alaska Air Group, Inc. | | | 14,583 | | | | 1,293,950 | |
The Boeing Co. | | | 9,605 | | | | 1,495,306 | |
Cummins, Inc. | | | 10,818 | | | | 1,478,496 | |
Illinois Tool Works, Inc. | | | 10,463 | | | | 1,281,299 | |
Masco Corp. | | | 36,225 | | | | 1,145,434 | |
Rockwell Automation, Inc. | | | 10,055 | | | | 1,351,392 | |
Southwest Airlines Co. | | | 26,674 | | | | 1,329,432 | |
Stanley Black & Decker, Inc. | | | 10,106 | | | | 1,159,057 | |
United Parcel Service, Inc., Class B | | | 11,758 | | | | 1,347,937 | |
Total Industrials | | | | | | | 11,882,303 | |
Information Technology—30.2% | | | | | |
Alphabet, Inc., Class A* | | | 1,635 | | | | 1,295,656 | |
Apple, Inc. | | | 12,451 | | | | 1,442,075 | |
Applied Materials, Inc. | | | 41,667 | | | | 1,344,594 | |
Citrix Systems, Inc.* | | | 14,231 | | | | 1,270,971 | |
Electronic Arts, Inc.* | | | 15,459 | | | | 1,217,551 | |
F5 Networks, Inc.* | | | 10,920 | | | | 1,580,342 | |
Facebook, Inc., Class A* | | | 10,778 | | | | 1,240,009 | |
Juniper Networks, Inc. | | | 51,914 | | | | 1,467,090 | |
Lam Research Corp. | | | 13,869 | | | | 1,466,369 | |
Microsoft Corp. | | | 22,519 | | | | 1,399,331 | |
Oracle Corp. | | | 31,675 | | | | 1,217,904 | |
Skyworks Solutions, Inc. | | | 18,077 | | | | 1,349,629 | |
Synopsys, Inc.* | | | 23,332 | | | | 1,373,322 | |
Texas Instruments, Inc. | | | 20,539 | | | | 1,498,731 | |
Total System Services, Inc. | | | 22,565 | | | | 1,106,362 | |
Western Digital Corp. | | | 20,893 | | | | 1,419,679 | |
Total Information Technology | | | | 21,689,615 | |
Materials—1.8% | | | | | | | | |
The Dow Chemical Co. | | | 22,669 | | | | 1,297,120 | |
Total Common Stocks
(cost $63,640,367) | | | | 70,379,767 | |
The accompanying notes are an integral part of these financial statements.
7
AMG Renaissance Large Cap Growth Fund
Schedule of Portfolio Investments (continued)
| | | | | | | | |
| | | Principal
Amount | | | Value | |
Short-Term Investments—1.3% | | | | | | | | |
Repurchase Agreements—0.7%2 | | | | | | | | |
Daiwa Capital Markets America, dated 12/30/16, due 01/03/17, 0.520% total to be received $488,082 (collateralized by various U.S. Government Agency Obligations, 0.000% - 6.500%, 03/02/17 - 02/01/49, totaling $497,815) | | $ | 488,054 | | | $ | 488,054 | |
| | |
| | | Shares | | | | |
Other Investment Companies—0.6%3 | |
Dreyfus Government Cash Management Fund, Institutional Class Shares, 0.45% | | | 418,561 | | | | 418,561 | |
Total Short-Term Investments
(cost $906,615) | | | | 906,615 | |
| | | | | | |
| | | | | Value | |
Total Investments—99.4%
(cost $64,546,982) | | $ | 71,286,382 | |
Other Assets, less Liabilities—0.6% | | | 422,138 | |
Net Assets—100.0% | | $ | 71,708,520 | |
The accompanying notes are an integral part of these financial statements.
8
AMG Renaissance International Equity Fund
Portfolio Manager’s Comments (unaudited)
The AMG Renaissance International Equity Fund (Class Z)1 (the “Fund”) returned (1.83)% for the year ended December 31, 2016, while its primary benchmark, the MSCI All Country World Index (“ACWI”) ex USA, returned 4.50%.
MARKET OVERVIEW
The Santa Claus/Trump rally enjoyed in the United States failed to find its way overseas during the fourth quarter. The positive momentum from the third quarter was fleeting for international equities, with many markets falling victim to the stronger U.S. Dollar and uncertainty surrounding president-elect Trump’s policies. The MSCI ACWI ex USA Index was up 4.9% in local currency terms, but lost 1.3% in U.S. Dollar terms as the Dollar rallied on hope for a stronger U.S. economy. The U.S. Federal Reserve’s decision to raise its interest rate in mid-December was as expected, although this solidified downward pressure on many foreign currencies, especially those in Emerging Markets, as central bankers in those countries have kept rates low in an effort to spur economic growth. Emerging Markets, which had been outperforming developed markets through September, sold off on fears of possible implementation of U.S. trade tariffs, with China and Mexico being the highest profile targets of the incoming U.S. President. Although the MSCI Emerging Market Index fell 4.2% during the quarter while the developed market MSCI EAFE Index lost 0.7%, Emerging Markets outperformed developed markets for the calendar year.
Another notable development during the quarter was the accelerating outperformance of value stocks relative to growth stocks. Value stocks have beaten growth issues since mid-2016, particularly in the fourth quarter when the MSCI ACWI ex USA Value Index added 2.3%, while the MSCI ex USA Growth Index sank (6.3)%. The last time value stocks outperformed growth stocks by such a wide margin was in 2009 and, prior to that, in 2000. The return disparity was most evident in the performance of the financial sector
(typically seen as a value play) which was one of the best-performing sectors in our benchmark.
The stronger U.S. Dollar was a consistent headwind for U.S. Dollar-based international investors throughout the year, but especially so after the U.S. election. Post-election through year-end, the Mexican Peso fell 12% and the Japanese Yen gave up 10% versus the Dollar, while the Brazilian Real fell 2.6%. For all of 2016, however, commodity-related currencies were generally stronger against the Dollar, with the Brazilian Real gaining 22% and the Russian Ruble up 20%2.
PERFORMANCE REVIEW
The energy sector was the best-performing sector in the benchmark, with crude oil (West Texas Intermediate) gaining 11% for the quarter. The Fund’s underweight to the sector was the largest detractor from relative performance during the period. A surprise decision by OPEC to reduce production along with additional cuts by non-OPEC members, including Russia, eased concerns about an oversupply of crude oil. While reduced supply from OPEC will help stabilize prices, OPEC’s historical lack of compliance towards their production quotas, along with increased production from U.S. fracking efforts, are reasons to remain cautious that oil prices will continue to rise. Although the Fund currently has no direct energy exposure, we are actively reviewing potential candidates in light of the changes in OPEC’s production.
Consumer discretionary holdings were most additive to Fund returns for the period because of favorable stock selection. With equity markets embracing more risk during the second half of the year, it was not surprising to see the more defensive consumer staples companies lag the overall market. Within the Fund, three of our four positions that were held during the year lost value. However, our benchmark relative underweight to this sector resulted in a positive allocation effect.
Information technology companies were some of the best-performing stocks through the third quarter of 2016, but investors rotated out of many of these firms during the last three months, resulting in a general weakness among our
technology shares. We still maintain an overweight to technology-related companies, as we believe long-term prospects for chips used in autos, smartphones and the Internet of Things will result in attractive investment returns.
The Fund’s performance for the period benefitted from stock selection in the financial sector. We enjoyed good stock performance from our developed market financials but this was partially undone by Emerging Market financials. We continue to look for attractive financial companies in our universe because the prospect of higher interest rates across the globe should give bank earnings a boost.
The Fund’s returns benefitted from stronger Emerging Market currencies but this was offset by weaker developed market currencies, most notably the British Pound, which sank 19% for the year. We maintained an overweighting to Emerging Markets in the portfolio, which detracted from overall performance, as these countries performed worse than developed countries. Investor flows into Emerging Market ETFs, which had been strong, weakened considerably in the fourth quarter. South Korea was our weakest Emerging Market country, followed by Taiwan, which was hurt due to the general downturn in technology-related shares. Among our developed market countries, Bermuda and Singapore contributed the most to relative returns, while France and Japan detracted the most. Our Japanese holdings, which account for our single largest country exposure, faced a stiff headwind as the Yen weakened 13% relative to the U.S. Dollar during the quarter.
OUTLOOK
One of the biggest questions facing international investors in 2017 is the possible enactment of trade tariffs by the Trump administration. Our belief is that Trump’s campaign rhetoric will be toned down considerably after he is in office. The stakes are certainly very large, as China, Mexico and Canada account for 47% of all imported goods and a similar level of all U.S. exports are sent to these three countries3. Any tariffs imposed on
9
AMG Renaissance International Equity Fund
Portfolio Manager’s Comments (continued)
these nations would likely result in retaliatory tariffs being imposed on U.S. companies, resulting in a no-win situation. Tariffs may be levied on particular items such as steel, but an all-out trade war with our long-time trading partners would benefit no one.
Another question facing U.S. investors is whether ongoing strength in the U.S. Dollar will continue to erode returns from foreign securities. Over the long term, returns from currencies are “mean reverting,” suggesting that currency prices will revert to their long-term averages over time. While strength in the U.S. Dollar may persist in the short term, currencies tend to move in multi-year cycles, and this rally may be getting long in the tooth. In the meantime, a positive effect of the U.S. Dollar strength is that foreign firms that sell to the U.S. will enjoy higher profits in local currency terms.
According to the International Monetary Fund, global economic growth is set to expand from 3.1% in 2016 to 3.4% in 2017. Along with this economic expansion will come higher company earnings, which should lead to higher equity valuations. Earnings per share for all companies in the MSCI ACWI ex USA Index are expected to grow
from $15.41 to $17.57 according to estimates from FactSet. This represents earnings growth of almost 14% compared to negative earnings growth the previous three years. Profit margins are also expected to widen, leading to higher overall Return on Equity, which should support higher valuations.
Another positive for equity markets in 2017 is the improvement in China’s economy. The country continues to move from an export-driven economy to one focused more on services, which should lead to a more sustainable and less volatile economy. Recent Purchasing Managers Index data shows a slow but steady rise in both the manufacturing and services components of the index. While the 10% plus year-over-year GDP growth from a decade ago is a fading memory, economists expect a more reasonable and manageable 6% to 7% GDP growth4.
The outlook for international equities is just as uncertain as it was at the beginning of 2016. As we enter 2017, we accept the fact that the financial and political landscape may continue to surprise us. In early 2016, few investors (including us) predicted a rally in crude prices, a vote in favor
of Brexit and Donald Trump winning the U.S. presidential election. Even so, our active management approach gives us the ability to position portfolios to take advantage of changes in the investment landscape and to capitalize on new information. This ability will likely be as important as ever in 2017, with uncertainty abounding. We believe that accelerating earnings growth, improving profitability and reasonable valuations in many foreign markets provide the framework for international equities to perform well in 2017.
This commentary reflects the viewpoint of the portfolio manager, The Renaissance Group LLC, as of December 31, 2016, and is not intended as a forecast or guarantee of future results and is subject to change without notice.
| 1 | Prior to October 1, 2016, the Fund’s Class Z shares were known as Institutional shares. |
10
AMG Renaissance International Equity Fund
Portfolio Manager’s Comments (continued)
CUMULATIVE TOTAL RETURN PERFORMANCE
AMG Renaissance International Equity Fund’s cumulative total return is based on the daily change in net asset value (NAV), and assumes that all dividends and distributions were reinvested. The graph compares a hypothetical $10,000 investment made in AMG Renaissance International Equity Fund’s Class Z (formerly Institutional Class) on June 16, 2014 (commencement of operations) to a $10,000 investment made in the MSCI ACWI ex USA Index for the same time period. The graph and table do not reflect the deduction of taxes that a shareholder would pay on a Fund distribution or redemption of shares. The listed returns for the Fund are net of expenses and the returns for the index exclude expenses. Total returns would have been lower had certain expenses not been reduced.
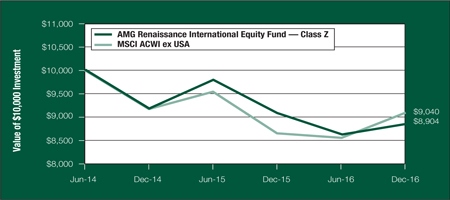
The table below shows the total returns for the AMG Renaissance International Equity Fund and the MSCI ACWI ex USA Index for the same time periods ended December 31, 2016.
| | | | | | | | | | | | |
| Average Annual Total Returns1 | | One
Year | | | Since
Inception | | | Inception
Date | |
AMG Renaissance International Equity Fund 2,3,4,5,6 | | | | | | | | | | | | |
Class N7 | | | (2.37 | )% | | | (4.91 | )% | | | 06/16/14 | |
Class I7 | | | (2.02 | )% | | | (4.57 | )% | | | 06/16/14 | |
Class Z7 | | | (1.83 | )% | | | (4.46 | )% | | | 06/16/14 | |
MSCI ACWI ex USA8 | | | 4.50 | % | | | (3.89 | )% | | | 06/16/14 | † |
The performance data shown represents past performance. Past performance is not a guarantee of future results. Current performance may be lower or higher than the performance data quoted. The investment return and principal value of an investment will fluctuate so that an investor’s shares, when redeemed, may be worth more or less than their original cost.
Investors should carefully consider the Fund’s investment objectives, risks, charges, and expenses before investing. For performance information through the most recent month end, current net asset values per share for the Fund and other information, please call (800) 835-3879 or visit our website at www.amgfunds.com for a free prospectus. Read it carefully before investing or sending money.
Distributed by AMG Distributors, Inc., member FINRA/SIPC.
| † | The date reflects inception date of the Fund, not the index. |
| 1 | Total return equals income yield plus share price change and assumes reinvestment of all dividends and capital gain distributions. Returns are net of fees and may reflect offsets of Fund expenses as described in the prospectus. No adjustment has been made for taxes payable by shareholders on their reinvested dividends and capital gain distributions. Returns for periods greater than one year are annualized. The listed returns on the Fund are net of expenses and based on the published NAV as of December 31, 2016. All returns are in U.S. dollars ($). |
| 2 | From time to time, the Fund’s advisor has waived its fees and/or absorbed Fund expenses, which has resulted in higher returns. |
| 3 | The Fund is subject to the risks associated with investments in emerging markets, such as erratic earnings patterns, economic and political instability, changing exchange controls, limitations on repatriation of foreign capital and changes in local governmental attitudes toward private investment, possibly leading to nationalization or confiscation of investor assets. |
| 4 | The Fund is subject to risks associated with investments in mid-capitalization companies such as greater price volatility, lower trading volume, and less liquidity than the stocks of larger, more established companies. |
| 5 | The Fund invests in growth stocks, which may be more sensitive to market movements because their prices tend to reflect future investor expectations rather than just current profits. |
| 6 | Investments in international securities are subject to certain risks of overseas investing including currency fluctuations and changes in political and economic conditions, which could result in significant market fluctuations. The Fund is subject to currency risk resulting from fluctuations in exchange rates that may affect the total loss or gain on a non-U.S. Dollar investment when converted back to U.S. Dollars. |
| 7 | Effective October 1, 2016, the Investor Class, Service Class and Institutional Class of AMG Renaissance International Equity Fund were renamed Class N, Class I and Class Z, respectively. |
| 8 | The MSCI All Country World Index (“ACWI”) ex USA is a free float-adjusted market-capitalization weighted index that is designed to measure the equity market performance of developed and emerging markets. The index consists of 45 country indices comprising 22 developed and 23 emerging market country indices. Unlike the Fund, the Index is unmanaged, is not available for investment and does not incur expenses. All MSCI data is provided ‘as is.’ The products described herein are not sponsored or endorsed and have not been reviewed or passed on by MSCI. In no event shall MSCI, its affiliates, or any MSCI data provider have any liability of any kind in connection with the MSCI data or the products described herein. Copying or redistributing the MSCI data is strictly prohibited. |
Not FDIC insured, nor bank guaranteed. May lose value.
|
| AMG Renaissance International Equity Fund |
| Fund Snapshots (unaudited) |
| December 31, 2016 |
PORTFOLIO BREAKDOWN
| | | | | | | | |
Sector | | AMG Renaissance
International
Equity Fund* | | | MSCI ACWI
ex USA | |
Information Technology | | | 17.7 | % | | | 9.3 | % |
Consumer Discretionary | | | 17.4 | % | | | 11.4 | % |
Industrials | | | 15.0 | % | | | 11.6 | % |
Financials | | | 14.9 | % | | | 23.3 | % |
Telecommunication Services | | | 8.9 | % | | | 4.7 | % |
Materials | | | 7.2 | % | | | 8.0 | % |
Consumer Staples | | | 7.1 | % | | | 9.8 | % |
Health Care | | | 5.6 | % | | | 8.1 | % |
Real Estate | | | 3.3 | % | | | 3.3 | % |
Utilities | | | 1.8 | % | | | 3.2 | % |
Energy | | | 0.0 | % | | | 7.3 | % |
Other Assets and Liabilities | | | 1.1 | % | | | 0.0 | % |
TOP TEN HOLDINGS
| | | | |
Security Name | | %of
Net Assets | |
China Lodging Group, Ltd., Sponsored ADR | | | 2.2 | % |
Validus Holdings, Ltd. | | | 2.1 | |
Mitsubishi Electric Corp., ADR | | | 2.1 | |
DBS Group Holdings, Ltd., Sponsored ADR | | | 2.1 | |
Magna International, Inc. | | | 2.1 | |
Jazz Pharmaceuticals PLC | | | 2.0 | |
WH Group, Ltd., ADR | | | 2.0 | |
Bridgestone Corp., ADR | | | 2.0 | |
Pandora A/S, ADR | | | 2.0 | |
Infineon Technologies AG, ADR | | | 1.9 | |
| | | | |
Top Ten as a Group | | | 20.5 | % |
| | | | |
| * | As a percentage of net assets. |
Because a fund’s strategy may result in multiple investments in particular sectors of the economy, its performance may depend on the performance of those sectors and may fluctuate more widely than investments diversified across more sectors. For additional information on these and other risk considerations, please see the Fund’s prospectus.
Any sectors, industries, or securities discussed should not be perceived as investment recommendations. Mention of a specific security should not be considered a recommendation to buy or solicitation to sell that security. Specific securities mentioned in this report may have been sold from the Fund’s portfolio of investments by the time you receive this report.
12
|
| AMG Renaissance International Equity Fund |
| Schedule of Portfolio Investments |
| December 31, 2016 |
| | | | | | | | |
| | | Shares | | | Value | |
Common Stocks—98.9% | | | | | | | | |
Consumer Discretionary—17.4% | |
Bridgestone Corp., ADR (Japan) | | | 2,247 | | | $ | 40,558 | |
Carnival PLC, ADR (United States) | | | 733 | | | | 37,522 | |
China Lodging Group, Ltd., Sponsored ADR (China) | | | 868 | | | | 44,997 | |
Magna International, Inc. (Canada) | | | 990 | | | | 42,966 | |
Pandora A/S, ADR (Denmark)1 | | | 1,233 | | | | 40,122 | |
Persimmon PLC, ADR (United Kingdom) | | | 893 | | | | 38,931 | |
Renault, S.A., ADR (France) | | | 2,107 | | | | 37,568 | |
Tata Motors, Ltd., Sponsored ADR (India) | | | 1,017 | | | | 34,975 | |
Valeo, S.A., Sponsored ADR (France) | | | 1,381 | | | | 39,497 | |
Total Consumer Discretionary | | | | | | | 357,136 | |
Consumer Staples—7.1% | | | | | | | | |
Heineken N.V., Sponsored ADR (Netherlands) | | | 887 | | | | 33,183 | |
Koninklijke Ahold Delhaize NV, Sponsored ADR (Netherlands) | | | 1,698 | | | | 35,648 | |
Unilever PLC, Sponsored ADR (United Kingdom) | | | 865 | | | | 35,206 | |
WH Group, Ltd., ADR (Hong Kong) | | | 2,581 | | | | 41,361 | |
Total Consumer Staples | | | | | | | 145,398 | |
Financials—14.9% | | | | | | | | |
Allianz SE, Sponsored ADR (Germany) | | | 2,276 | | | | 37,508 | |
DBS Group Holdings, Ltd., Sponsored ADR (Singapore) | | | 900 | | | | 42,971 | |
Grupo Financiero Banorte SAB de CV, | | | | | | | | |
Sponsored ADR (Mexico) | | | 1,344 | | | | 33,412 | |
Kasikornbank PCL, ADR (Thailand) | | | 1,737 | | | | 34,219 | |
Manulife Financial Corp. (Canada) | | | 2,102 | | | | 37,458 | |
ORIX Corp., Sponsored ADR (Japan) | | | 482 | | | | 37,514 | |
Turkiye Garanti Bankasi A.S., ADR (Turkey) | | | 18,372 | | | | 38,397 | |
Validus Holdings, Ltd. (Bermuda) | | | 795 | | | | 43,733 | |
Total Financials | | | | | | | 305,212 | |
Health Care—5.6% | | | | | | | | |
ICON PLC (Ireland)* | | | 526 | | | | 39,555 | |
Jazz Pharmaceuticals PLC (Ireland)* | | | 381 | | | | 41,540 | |
Shire PLC,ADR (United States) | | | 202 | | | | 34,417 | |
Total Health Care | | | | | | | 115,512 | |
Industrials—15.0% | | | | | | | | |
AerCap Holdings N.V. (Ireland)* | | | 927 | | | | 38,572 | |
Canadian National Railway Co. (Canada) | | | 555 | | | | 37,407 | |
China Eastern Airlines Corp., Ltd., ADR (China)1 | | | 1,774 | | | | 39,649 | |
Controladora Vuela Cia de Aviacion SAB de CV, ADR (Mexico)* | | | 2,613 | | | | 39,300 | |
| | | | | | | | |
| | | Shares | | | Value | |
Mitsubishi Electric Corp., ADR (Japan) | | | 1,567 | | | $ | 43,516 | |
Ryanair Holdings PLC, Sponsored ADR (Ireland)* | | | 450 | | | | 37,467 | |
SMC Corp., Sponsored ADR (Japan) | | | 2,890 | | | | 34,073 | |
Vestas Wind Systems A/S, ADR (Denmark) | | | 1,727 | | | | 37,510 | |
Total Industrials | | | | | | | 307,494 | |
Information Technology—17.7% | |
AAC Technologies Holdings, Inc., ADR (China) | | | 395 | | | | 35,718 | |
Advanced Semiconductor Engineering, Inc., ADR (Taiwan) | | | 6,482 | | | | 32,669 | |
Capgemini, S.A., ADR (France) | | | 2,105 | | | | 35,396 | |
Check Point Software Technologies, Ltd. (Israel)* | | | 444 | | | | 37,500 | |
Infineon Technologies AG, ADR (Germany) | | | 2,317 | | | | 40,038 | |
Murata Manufacturing Co., Ltd., ADR (Japan)1 | | | 1,128 | | | | 37,630 | |
NetEase, Inc., ADR (China) | | | 160 | | | | 34,454 | |
NXP Semiconductors N.V. (Netherlands)* | | | 383 | | | | 37,538 | |
Taiwan Semiconductor Manufacturing Co., Ltd., Sponsored ADR (Taiwan) | | | 1,369 | | | | 39,359 | |
Wipro, Ltd., ADR (India)1 | | | 3,491 | | | | 33,793 | |
Total Information Technology | | | | | | | 364,095 | |
Materials—7.2% | | | | | | | | |
Akzo Nobel NV, Sponsored ADR (Netherlands) | | | 1,844 | | | | 38,171 | |
Arkema, S.A., Sponsored ADR (France) | | | 382 | | | | 37,321 | |
Linde AG, Sponsored ADR (Germany) | | | 2,314 | | | | 38,343 | |
Toray Industries, Inc., ADR (Japan) | | | 2,141 | | | | 34,470 | |
Total Materials | | | | | | | 148,305 | |
Real Estate—3.3% | | | | | | | | |
Colliers International Group, Inc. (Canada) | | | 923 | | | | 33,920 | |
Unibail-Rodamco SE, ADR (France) | | | 1,470 | | | | 34,942 | |
Total Real Estate | | | | | | | 68,862 | |
Telecommunication Services—8.9% | |
Bezeq The Israeli Telecommunication Corp., | | | | | | | | |
Ltd., ADR (Iceland) | | | 4,100 | | | | 38,991 | |
China Mobile, Ltd., Sponsored ADR (Hong Kong) | | | 637 | | | | 33,398 | |
KDDI Corp., ADR (Japan)1 | | | 2,991 | | | | 37,836 | |
Nippon Telegraph & Telephone Corp., ADR (Japan) | | | 832 | | | | 35,002 | |
SK Telecom Co., Ltd., Sponsored ADR (South Korea) | | | 1,782 | | | | 37,244 | |
Total Telecommunication Services | | | | | | | 182,471 | |
Utilities—1.8% | | | | | | | | |
Korea Electric Power Corp., Sponsored ADR (South Korea)* | | | 2,032 | | | | 37,551 | |
Total Common Stocks
(cost $1,987,412) | | | | | | | 2,032,036 | |
The accompanying notes are an integral part of these financial statements.
13
AMG Renaissance International Equity Fund
Schedule of Portfolio Investments (continued)
| | | | | | | | |
| | | Principal
Amount | | | Value | |
Short-Term Investments—2.9% | |
Repurchase Agreements—2.9%2 | |
Citigroup Global Markets, Inc., dated 12/30/16, due 01/03/17, 0.510% total to be received $59,999 (collateralized by various U.S. Government Agency Obligations, 0.125% - 1.750%, 04/15/20 - 01/15/28, totaling $61,196) | | $ | 59,996 | | | $ | 59,996 | |
Total Short-Term Investments
(cost $59,996) | | | | | | | 59,996 | |
| | | | |
| | | Value | |
Total Investments—101.8%
(cost $2,047,408) | | $ | 2,092,032 | |
Other Assets, less Liabilities—(1.8)% | | | (37,541 | ) |
Net Assets—100.0% | | $ | 2,054,491 | |
The accompanying notes are an integral part of these financial statements.
14
Notes to Schedules of Portfolio Investments
The following footnotes should be read in conjunction with each of the Schedules of Portfolio Investments previously presented in this report.
At December 31, 2016, the approximate cost of investments and the aggregate gross unrealized appreciation and depreciation for federal income tax were as follows:
| | | | | | | | | | | | | | | | |
| Fund | | Cost | | | Appreciation | | | Depreciation | | | Net | |
AMG Renaissance Large Cap Growth Fund | | $ | 64,577,155 | | | $ | 8,297,428 | | | $ | (1,588,201 | ) | | $ | 6,709,227 | |
AMG Renaissance International Equity Fund | | | 2,224,998 | | | | 144,484 | | | | (277,450 | ) | | | (132,966 | ) |
| * | Non-income producing security. |
| 1 | Some or all of these securities were out on loan to various brokers as of December 31, 2016, amounting to the following: |
| | | | | | | | |
| Fund | | Market Value | | | % of Net Assets | |
AMG Renaissance Large Cap Growth Fund | | $ | 473,288 | | | | 0.7 | % |
AMG Renaissance International Equity Fund | | | 58,323 | | | | 2.8 | % |
| 2 | Collateral received from brokers for securities lending was invested in these joint repurchase agreements. |
| 3 | Yield shown represents the December 31, 2016, seven-day average yield, which refers to the sum of the previous seven days’ dividends paid, expressed as an annual percentage. |
The accompanying notes are an integral part of these financial statements.
15
Notes to Schedules of Portfolio Investments (continued)
| | | | | | | | |
Country | | AMG Renaissance
International
Equity Fund† | | | MSCI ACWI
ex USA†† | |
Australia | | | 0.0 | % | | | 5.2 | % |
Austria | | | 0.0 | % | | | 0.1 | % |
Belgium | | | 0.0 | % | | | 0.8 | % |
Bermuda | | | 2.2 | % | | | 0.0 | % |
Brazil | | | 0.0 | % | | | 1.7 | % |
Canada | | | 7.5 | % | | | 7.1 | % |
Chile | | | 0.0 | % | | | 0.3 | % |
China | | | 7.6 | % | | | 6.0 | % |
Colombia | | | 0.0 | % | | | 0.1 | % |
Czech Republic | | | 0.0 | % | | | 0.0 | %# |
Denmark | | | 3.8 | % | | | 1.2 | % |
Egypt | | | 0.0 | % | | | 0.0 | %# |
Finland | | | 0.0 | % | | | 0.7 | % |
France | | | 9.1 | % | | | 7.2 | % |
Germany | | | 5.7 | % | | | 6.5 | % |
Greece | | | 0.0 | % | | | 0.1 | % |
Hong Kong | | | 3.7 | % | | | 2.3 | % |
Hungary | | | 0.0 | % | | | 0.1 | % |
Iceland | | | 1.9 | % | | | 0.0 | % |
India | | | 3.4 | % | | | 1.9 | % |
Indonesia | | | 0.0 | % | | | 0.6 | % |
Ireland | | | 7.7 | % | | | 0.3 | % |
Israel | | | 1.8 | % | | | 0.5 | % |
Italy | | | 0.0 | % | | | 1.5 | % |
Japan | | | 14.8 | % | | | 16.9 | % |
Malaysia | | | 0.0 | % | | | 0.6 | % |
Mexico | | | 3.6 | % | | | 0.8 | % |
Netherlands | | | 7.1 | % | | | 2.3 | % |
New Zealand | | | 0.0 | % | | | 0.1 | % |
| | | | | | | | |
Country | | AMG Renaissance
International
Equity Fund† | | | MSCI ACWI
ex USA†† | |
Norway | | | 0.0 | % | | | 0.5 | % |
Peru | | | 0.0 | % | | | 0.1 | % |
Philippines | | | 0.0 | % | | | 0.3 | % |
Poland | | | 0.0 | % | | | 0.3 | % |
Portugal | | | 0.0 | % | | | 0.1 | % |
Qatar | | | 0.0 | % | | | 0.2 | % |
Russia | | | 0.0 | % | | | 1.0 | % |
Singapore | | | 2.1 | % | | | 0.9 | % |
South Africa | | | 0.0 | % | | | 1.6 | % |
South Korea | | | 3.7 | % | | | 3.3 | % |
Spain | | | 0.0 | % | | | 2.2 | % |
Sweden | | | 0.0 | % | | | 2.0 | % |
Switzerland | | | 0.0 | % | | | 6.1 | % |
Taiwan | | | 3.5 | % | | | 2.8 | % |
Thailand | | | 1.7 | % | | | 0.5 | % |
Turkey | | | 1.9 | % | | | 0.2 | % |
United Arab Emirates | | | 0.0 | % | | | 0.2 | % |
United Kingdom | | | 3.7 | % | | | 12.8 | % |
United States | | | 3.5 | % | | | 0.0 | % |
| | | | | | | | |
| | | 100.0 | % | | | 100.0 | % |
| | | | | | | | |
| † | As a percentage of total long term investments as of December 31, 2016. |
The accompanying notes are an integral part of these financial statements.
16
Notes to Schedules of Portfolio Investments (continued)
The following table summarizes the inputs used to value the Funds’ investments by the fair value hierarchy levels as of December 31, 2016: (See Note 1(a) in the Notes to Financial Statements.)
| | | | | | | | | | | | | | | | |
| | | Quoted Prices in Active Markets
for Identical Investments | | | Significant Other
Observable Inputs | | | Significant
Unobservable Inputs | | | | |
| | | Level 1 | | | Level 2 | | | Level 3 | | | Total | |
AMG Renaissance Large Cap Growth Fund | | | | | | | | | | | | | | | | |
Investments in Securities | | | | | | | | | | | | | | | | |
Common Stocks† | | | 70,379,767 | | | | — | | | | — | | | | 70,379,767 | |
Short-Term Investments | | | | | | | | | | | | | | | | |
Repurchase Agreements | | | — | | | $ | 488,054 | | | | — | | | | 488,054 | |
Other Investment Companies | | | 418,561 | | | | — | | | | — | | | | 418,561 | |
| | | | | | | | | | | | | | | | |
Total Investments in Securities | | $ | 70,798,328 | | | $ | 488,054 | | | | — | | | $ | 71,286,382 | |
| | | | | | | | | | | | | | | | |
| | | | |
| | | Quoted Prices in Active Markets
for Identical Investments | | | Significant Other
Observable Inputs | | | Significant
Unobservable Inputs | | | | |
| | | Level 1 | | | Level 2 | | | Level 3 | | | Total | |
AMG Renaissance International Equity Fund | | | | | | | | | | | | | | | | |
Investments in Securities | | | | | | | | | | | | | | | | |
Common Stocks† | | $ | 2,032,036 | | | | — | | | | — | | | $ | 2,032,036 | |
Short-Term Investments | | | | | | | | | | | | | | | | |
Repurchase Agreements | | | — | | | $ | 59,996 | | | | — | | | | 59,996 | |
| | | | | | | | | | | | | | | | |
Total Investments in Securities | | $ | 2,032,036 | | | $ | 59,996 | | | | — | | | $ | 2,092,032 | |
| | | | | | | | | | | | | | | | |
| † | All common stocks held in the Fund are Level 1 securities. For a detailed breakout of the common stocks by major industry classification, please refer to the respective Schedules of Portfolio Investments. |
As of December 31, 2016, the Funds had no transfers between levels from the beginning of the reporting period.
INVESTMENTS DEFINITIONS AND ABBREVIATIONS:
ADR: ADR after the name of a holding stands for American Depositary Receipt, representing ownership of foreign securities on deposit with a domestic custodian bank. The value of an ADR security is determined or significantly influenced by trading on exchanges not located in the United States or Canada. Sponsored ADRs are initiated by the underlying foreign company.
PLC: Public Limited Company.
The accompanying notes are an integral part of these financial statements.
17
Statement of Assets and Liabilities
December 31, 2016
| | | | | | | | |
| | | AMG Renaissance
Large Cap
Growth Fund# | | | AMG Renaissance
International
Equity Fund# | |
Assets: | | | | | | | | |
Investments at value* (including securities on loan valued at $ 473,288 and $ 58,323, respectively) | | $ | 71,286,382 | | | $ | 2,092,032 | |
Receivable for Fund shares sold | | | 698,924 | | | | — | |
Receivable for investments sold | | | 639,216 | | | | 70,776 | |
Dividends and other receivables | | | 51,295 | | | | 1,517 | |
Receivable from affiliate | | | 22,436 | | | | 19,160 | |
Prepaid expenses | | | 21,974 | | | | 19,290 | |
Total assets | | | 72,720,227 | | | | 2,202,775 | |
Liabilities: | | | | | | | | |
Payable upon return of securities loaned | | | 488,054 | | | | 59,996 | |
Payable for Fund shares repurchased | | | 432,093 | | | | — | |
Payable to Custodian | | | — | | | | 51,193 | |
Accrued expenses: | | | | | | | | |
Investment advisory and management fees | | | 33,816 | | | | 710 | |
Administrative fees | | | 9,222 | | | | 266 | |
Shareholder servicing fees—Class I | | | 1,834 | | | | 48 | |
Shareholder servicing fees—Class N | | | 615 | | | | 85 | |
Distribution fees—Class N | | | 615 | | | | 85 | |
Professional fees | | | 24,730 | | | | 26,316 | |
Custodian fees | | | 3,187 | | | | 5,691 | |
Trustees fees and expenses | | | 35 | | | | — | |
Other | | | 17,506 | | | | 3,894 | |
Total liabilities | | | 1,011,707 | | | | 148,284 | |
Net Assets | | $ | 71,708,520 | | | $ | 2,054,491 | |
* Investments at cost | | $ | 64,546,982 | | | $ | 2,047,408 | |
| # | Effective October 1, 2016, the Funds’ share classes were renamed as described in Note 1 of the Notes to the Financial Statements. |
The accompanying notes are an integral part of these financial statements.
18
Statement of Assets and Liabilities (continued)
| | | | | | | | |
| | | AMG Renaissance
Large Cap
Growth Fund# | | | AMG Renaissance
International
Equity Fund# | |
Net Assets Represent: | | | | | | | | |
Paid-in capital | | $ | 64,213,917 | | | $ | 2,489,022 | |
Distributions in excess of net investment income | | | — | | | | (5,591 | ) |
Accumulated net realized gain (loss) from investments | | | 755,203 | | | | (473,564 | ) |
Net unrealized appreciation of investments | | | 6,739,400 | | | | 44,624 | |
Net Assets | | $ | 71,708,520 | | | $ | 2,054,491 | |
Class N: | | | | | | | | |
Net Assets | | $ | 3,068,845 | | | $ | 356,608 | |
Shares outstanding | | | 258,753 | | | | 42,109 | |
Net asset value, offering and redemption price per share | | $ | 11.86 | | | $ | 8.47 | |
Class I: | | | | | | | | |
Net Assets | | $ | 14,172,987 | | | $ | 179,028 | |
Shares outstanding | | | 1,186,614 | | | | 21,138 | |
Net asset value, offering and redemption price per share | | $ | 11.94 | | | $ | 8.47 | |
Class Z: | | | | | | | | |
Net Assets | | $ | 54,466,688 | | | $ | 1,518,855 | |
Shares outstanding | | | 4,611,708 | | | | 179,340 | |
Net asset value, offering and redemption price per share | | $ | 11.81 | | | $ | 8.47 | |
| # | Effective October 1, 2016, the Funds’ share classes were renamed as described in Note 1 of the Notes to the Financial Statements. |
The accompanying notes are an integral part of these financial statements.
19
Statement of Operations
For the year ended December 31, 2016
| | | | | | | | |
| | | AMG Renaissance
Large Cap Growth
Fund# | | | AMG Renaissance
International
Equity Fund# | |
Investment Income: | | | | | | | | |
Dividend income | | $ | 1,009,806 | | | $ | 66,321 | |
Securities lending income | | | 6,523 | | | | 6,679 | |
Interest income | | | 3,251 | | | | 98 | |
Foreign withholding tax | | | — | | | | (7,191 | ) |
Total investment income | | | 1,019,580 | | | | 65,907 | |
Expenses: | | | | | | | | |
Investment advisory and management fees | | | 362,938 | | | | 10,361 | |
Administrative fees | | | 147,286 | | | | 5,945 | |
Shareholder servicing fees—Class I | | | 23,027 | | | | 177 | |
Shareholder servicing fees—Class N | | | 5,834 | | | | 1,657 | |
Distribution fees—Class N | | | 5,834 | | | | 1,657 | |
Registration fees | | | 35,379 | | | | 35,751 | |
Professional fees | | | 32,181 | | | | 30,157 | |
Reports to shareholders | | | 20,538 | | | | 5,127 | |
Transfer agent | | | 10,031 | | | | 770 | |
Custodian | | | 5,159 | | | | 6,169 | |
Trustees fees and expenses | | | 4,969 | | | | 208 | |
Miscellaneous | | | 2,629 | | | | 1,946 | |
Total expenses before offsets | | | 655,805 | | | | 99,925 | |
Expense reimbursements | | | (185,526 | ) | | | (74,416 | ) |
Expense reductions | | | (3,292 | ) | | | (1,298 | ) |
Net expenses | | | 466,987 | | | | 24,211 | |
Net investment income | | | 552,593 | | | | 41,696 | |
Net Realized and Unrealized Gain (Loss): | | | | | | | | |
Net realized gain (loss) on investments | | | 1,749,376 | | | | (227,905 | ) |
Net change in unrealized appreciation (depreciation) of investments | | | 3,950,607 | | | | 93,548 | |
Net realized and unrealized gain (loss) | | | 5,699,983 | | | | (134,357 | ) |
Net increase (decrease) in net assets resulting from operations | | $ | 6,252,576 | | | $ | (92,661 | ) |
| # | Effective October 1, 2016, the Funds’ share classes were renamed as described in Note 1 of the Notes to the Financial Statements. |
The accompanying notes are an integral part of these financial statements.
20
Statements of Changes in Net Assets
For the years ended December 31,
| | | | | | | | | | | | | | | | |
| | | AMG Renaissance
Large Cap
Growth Fund# | | | AMG Renaissance
International
Equity Fund# | |
| | | 2016 | | | 2015 | | | 2016 | | | 2015 | |
Increase (Decrease) in Net Assets Resulting From Operations: | | | | | | | | | | | | | | | | |
Net investment income | | $ | 552,593 | | | $ | 278,475 | | | $ | 41,696 | | | $ | 31,520 | |
Net realized gain (loss) on investments | | | 1,749,376 | | | | 983,859 | | | | (227,905 | ) | | | (190,412 | ) |
Net change in unrealized appreciation (depreciation) of investments | | | 3,950,607 | | | | (2,228,379 | ) | | | 93,548 | | | | 104,965 | |
Net increase (decrease) in net assets resulting from operations | | | 6,252,576 | | | | (966,045 | ) | | | (92,661 | ) | | | (53,927 | ) |
Distributions to Shareholders: | | | | | | | | | | | | | | | | |
From net investment income: | | | | | | | | | | | | | | | | |
Class N | | | (12,054 | ) | | | — | | | | (7,871 | ) | | | (10,052 | ) |
Class I | | | (94,667 | ) | | | (63,670 | ) | | | (4,116 | ) | | | (1,852 | ) |
Class Z | | | (447,027 | ) | | | (216,729 | ) | | | (35,776 | ) | | | (21,950 | ) |
From net realized gain on investments: | | | | | | | | | | | | | | | | |
Class N | | | (41,286 | ) | | | (52,705 | ) | | | — | | | | — | |
Class I | | | (205,073 | ) | | | (362,066 | ) | | | — | | | | — | |
Class Z | | | (778,779 | ) | | | (916,813 | ) | | | — | | | | — | |
From paid-in capital: | | | | | | | | | | | | | | | | |
Class N | | | — | | | | — | | | | (3,077 | ) | | | — | |
Class I | | | — | | | | — | | | | (1,609 | ) | | | — | |
Class Z | | | — | | | | — | | | | (13,989 | ) | | | — | |
Total distributions to shareholders | | | (1,578,886 | ) | | | (1,611,983 | ) | | | (66,438 | ) | | | (33,854 | ) |
Capital Share Transactions:1 | | | | | | | | | | | | | | | | |
Net increase (decrease) from capital share transactions | | | 3,346,471 | | | | 36,500,463 | | | | (906,207 | ) | | | 1,078,835 | |
Total increase (decrease) in net assets | | | 8,020,161 | | | | 33,922,435 | | | | (1,065,306 | ) | | | 991,054 | |
Net Assets: | | | | | | | | | | | | | | | | |
Beginning of year | | | 63,688,359 | | | | 29,765,924 | | | | 3,119,797 | | | | 2,128,743 | |
End of year | | $ | 71,708,520 | | | $ | 63,688,359 | | | $ | 2,054,491 | | | $ | 3,119,797 | |
End of year distributions in excess of net investment income | | | — | | | | — | | | $ | (5,591 | ) | | $ | (176 | ) |
| | | | | | | | | | | | | | | | |
| # | Effective October 1, 2016, the Funds’ share classes were renamed as described in Note 1 of the Notes to the Financial Statements. |
| 1 | See Note 1(g) of the Notes to Financial Statements. |
The accompanying notes are an integral part of these financial statements.
21
AMG Renaissance Large Cap Growth Fund
Financial Highlights
For a share outstanding throughout each year
| | | | | | | | | | | | | | | | | | | | |
| | | For the years ended December 31, | |
| Class N | | 2016# | | | 2015 | | | 2014 | | | 2013 | | | 2012 | |
Net Asset Value, Beginning of Year | | $ | 11.10 | | | $ | 11.51 | | | $ | 11.80 | | | $ | 11.63 | | | $ | 10.77 | |
Income from Investment Operations: | | | | | | | | | | | | | | | | | | | | |
Net investment income1,2 | | | 0.04 | | | | 0.01 | | | | 0.03 | | | | 0.01 | | | | 0.01 | |
Net realized and unrealized gain (loss) on investments | | | 0.94 | | | | (0.18 | ) | | | 2.30 | | | | 3.95 | | | | 1.83 | |
Total income (loss) from investment operations | | | 0.98 | | | | (0.17 | ) | | | 2.33 | | | | 3.96 | | | | 1.84 | |
Less Distributions to Shareholders from: | | | | | | | | | | | | | | | | | | | | |
Net investment income | | | (0.05 | ) | | | — | | | | (0.03 | ) | | | (0.08 | ) | | | (0.01 | ) |
Net realized gain on investments | | | (0.17 | ) | | | (0.24 | ) | | | (2.59 | ) | | | (3.71 | ) | | | (0.97 | ) |
Total distributions to shareholders | | | (0.22 | ) | | | (0.24 | ) | | | (2.62 | ) | | | (3.79 | ) | | | (0.98 | ) |
Net Asset Value, End of Year | | $ | 11.86 | | | $ | 11.10 | | | $ | 11.51 | | | $ | 11.80 | | | $ | 11.63 | |
Total Return2 | | | 8.81 | % | | | (1.53 | )% | | | 19.59 | %4 | | | 34.17 | %4 | | | 17.10 | % |
Ratio of net expenses to average net assets (with offsets/reductions) | | | 1.15 | % | | | 1.14 | % | | | 1.14 | % | | | 1.17 | %5 | | | 1.15 | %6 |
Ratio of expenses to average net assets (with offsets) | | | 1.16 | % | | | 1.16 | % | | | 1.16 | % | | | 1.18 | %5 | | | 1.17 | %6 |
Ratio of total expenses to average net assets (without offsets/reductions)3 | | | 1.44 | % | | | 1.58 | % | | | 1.97 | % | | | 1.71 | %5 | | | 1.65 | %6 |
Ratio of net investment income to average net assets2 | | | 0.39 | % | | | 0.09 | % | | | 0.23 | % | | | 0.10 | %5 | | | 0.10 | %6 |
Portfolio turnover | | | 37 | % | | | 48 | % | | | 60 | % | | | 53 | % | | | 86 | % |
Net assets at end of year (000’s omitted) | | $ | 3,069 | | | $ | 2,533 | | | $ | 7,239 | | | $ | 984 | | | $ | 562 | |
| | | | | | | | | | | | | | | | | | | | |
| |
| | | For the years ended December 31, | |
| Class I | | 2016# | | | 2015 | | | 2014 | | | 2013 | | | 2012 | |
Net Asset Value, Beginning of Year | | $ | 11.17 | | | $ | 11.59 | | | $ | 11.87 | | | $ | 11.68 | | | $ | 10.83 | |
Income from Investment Operations: | | | | | | | | | | | | | | | | | | | | |
Net investment income1,2 | | | 0.08 | | | | 0.06 | | | | 0.07 | | | | 0.07 | | | | 0.05 | |
Net realized and unrealized gain (loss) on investments | | | 0.94 | | | | (0.20 | ) | | | 2.33 | | | | 3.97 | | | | 1.82 | |
Total income (loss) from investment operations | | | 1.02 | | | | (0.14 | ) | | | 2.40 | | | | 4.04 | | | | 1.87 | |
Less Distributions to Shareholders from: | | | | | | | | | | | | | | | | | | | | |
Net investment income | | | (0.08 | ) | | | (0.04 | ) | | | (0.05 | ) | | | (0.11 | ) | | | (0.05 | ) |
Net realized gain on investments | | | (0.17 | ) | | | (0.24 | ) | | | (2.63 | ) | | | (3.74 | ) | | | (0.97 | ) |
Total distributions to shareholders | | | (0.25 | ) | | | (0.28 | ) | | | (2.68 | ) | | | (3.85 | ) | | | (1.02 | ) |
Net Asset Value, End of Year | | $ | 11.94 | | | $ | 11.17 | | | $ | 11.59 | | | $ | 11.87 | | | $ | 11.68 | |
Total Return2 | | | 9.12 | % | | | (1.23 | )% | | | 20.08 | % | | | 34.75 | % | | | 17.42 | % |
Ratio of net expenses to average net assets (with offsets/reductions) | | | 0.81 | % | | | 0.80 | % | | | 0.75 | % | | | 0.77 | %5 | | | 0.82 | %6 |
Ratio of expenses to average net assets (with offsets) | | | 0.82 | % | | | 0.82 | % | | | 0.77 | % | | | 0.78 | %5 | | | 0.84 | %6 |
Ratio of total expenses to average net assets (without offsets/reductions)3 | | | 1.10 | % | | | 1.23 | % | | | 1.59 | % | | | 1.30 | %5 | | | 1.32 | %6 |
Ratio of net investment income to average net assets2 | | | 0.73 | % | | | 0.52 | % | | | 0.51 | % | | | 0.49 | %5 | | | 0.43 | %6 |
Portfolio turnover | | | 37 | % | | | 48 | % | | | 60 | % | | | 53 | % | | | 86 | % |
Net assets at end of year (000’s omitted) | | $ | 14,173 | | | $ | 17,189 | | | $ | 14,343 | | | $ | 11,336 | | | $ | 8,814 | |
| | | | | | | | | | | | | | | | | | | | |
22
AMG Renaissance Large Cap Growth Fund
Financial Highlights
For a share outstanding throughout each year
| | | | | | | | | | | | | | | | | | | | |
| | | For the years ended December 31, | |
| Class Z | | 2016# | | | 2015 | | | 2014 | | | 2013 | | | 2012 | |
Net Asset Value, Beginning of Year | | $ | 11.04 | | | $ | 11.45 | | | $ | 11.76 | | | $ | 11.58 | | | $ | 10.74 | |
Income from Investment Operations: | | | | | | | | | | | | | | | | | | | | |
Net investment income1,2 | | | 0.10 | | | | 0.09 | | | | 0.08 | | | | 0.08 | | | | 0.08 | |
Net realized and unrealized gain (loss) on investments | | | 0.94 | | | | (0.21 | ) | | | 2.31 | | | | 3.94 | | | | 1.81 | |
Total income (loss) from investment operations | | | 1.04 | | | | (0.12 | ) | | | 2.39 | | | | 4.02 | | | | 1.89 | |
Less Distributions to Shareholders from: | | | | | | | | | | | | | | | | | | | | |
Net investment income | | | (0.10 | ) | | | (0.05 | ) | | | (0.07 | ) | | | (0.13 | ) | | | (0.08 | ) |
Net realized gain on investments | | | (0.17 | ) | | | (0.24 | ) | | | (2.63 | ) | | | (3.71 | ) | | | (0.97 | ) |
Total distributions to shareholders | | | (0.27 | ) | | | (0.29 | ) | | | (2.70 | ) | | | (3.84 | ) | | | (1.05 | ) |
Net Asset Value, End of Year | | $ | 11.81 | | | $ | 11.04 | | | $ | 11.45 | | | $ | 11.76 | | | $ | 11.58 | |
Total Return2 | | | 9.38 | % | | | (1.06 | )% | | | 20.15 | % | | | 34.95 | % | | | 17.62 | % |
Ratio of net expenses to average net assets (with offsets/reductions) | | | 0.65 | % | | | 0.64 | % | | | 0.64 | % | | | 0.67 | %5 | | | 0.65 | %6 |
Ratio of expenses to average net assets (with offsets) | | | 0.66 | % | | | 0.66 | % | | | 0.66 | % | | | 0.68 | %5 | | | 0.67 | %6 |
Ratio of total expenses to average net assets (without offsets/reductions)3 | | | 0.94 | % | | | 1.07 | % | | | 1.51 | % | | | 1.16 | %5 | | | 1.15 | %6 |
Ratio of net investment income to average net assets2 | | | 0.89 | % | | | 0.76 | % | | | 0.63 | % | | | 0.58 | %5 | | | 0.64 | %6 |
Portfolio turnover | | | 37 | % | | | 48 | % | | | 60 | % | | | 53 | % | | | 86 | % |
Net assets at end of year (000’s omitted) | | $ | 54,467 | | | $ | 43,966 | | | $ | 8,184 | | | $ | 3,612 | | | $ | 15,674 | |
| | | | | | | | | | | | | | | | | | | | |
23
AMG Renaissance International Equity Fund
Financial Highlights
For a share outstanding throughout each period
| | | | | | | | | | | | |
| | | For the years ended
December 31, | | | For the period from June 16, 2014 through | |
| Class N | | 2016# | | | 2015 | | | December 31, 2014* | |
Net Asset Value, Beginning of Period | | $ | 8.90 | | | $ | 9.13 | | | $ | 10.00 | |
Income from Investment Operations: | | | | | | | | | | | | |
Net investment income1,2 | | | 0.12 | | | | 0.06 | 7 | | | 0.03 | |
Net realized and unrealized loss on investments | | | (0.33 | ) | | | (0.20 | ) | | | (0.87 | ) |
Total loss from investment operations | | | (0.21 | ) | | | (0.14 | ) | | | (0.84 | ) |
Less Distributions to Shareholders from: | | | | | | | | | | | | |
Net investment income | | | (0.16 | ) | | | (0.09 | ) | | | (0.03 | ) |
Paid-in capital | | | (0.06 | ) | | | — | | | | — | |
Total distributions to shareholders | | | (0.22 | ) | | | (0.09 | ) | | | (0.03 | ) |
Net Asset Value, End of Period | | $ | 8.47 | | | $ | 8.90 | | | $ | 9.13 | |
Total Return2 | | | (2.37 | )% | | | (1.56 | )%4 | | | (8.45 | )%4,8 |
Ratio of net expenses to average net assets (with offsets/reductions) | | | 1.30 | % | | | 1.29 | % | | | 1.12 | %9 |
Ratio of expenses to average net assets (with offsets) | | | 1.35 | % | | | 1.35 | % | | | 1.22 | %9 |
Ratio of total expenses to average net assets (without offsets/reductions)3 | | | 4.00 | % | | | 4.78 | % | | | 7.85 | %9 |
Ratio of net investment income to average net assets2 | | | 1.36 | % | | | 0.68 | % | | | 0.49 | %9 |
Portfolio turnover | | | 93 | % | | | 46 | % | | | 20 | %8 |
Net assets at end of period (000’s omitted) | | $ | 357 | | | $ | 1,010 | | | $ | 85 | |
| | | | | | | | | | | | |
| | |
| | | For the years ended
December 31, | | | For the period
from June 16, 2014 through | |
| Class I | | 2016# | | | 2015 | | | December 31, 2014* | |
Net Asset Value, Beginning of Period | | $ | 8.93 | | | $ | 9.12 | | | $ | 10.00 | |
Income from Investment Operations: | | | | | | | | | | | | |
Net investment income1,2 | | | 0.13 | | | | 0.11 | 7 | | | 0.05 | |
Net realized and unrealized loss on investments | | | (0.31 | ) | | | (0.21 | ) | | | (0.89 | ) |
Total loss from investment operations | | | (0.18 | ) | | | (0.10 | ) | | | (0.84 | ) |
Less Distributions to Shareholders from: | | | | | | | | | | | | |
Net investment income | | | (0.20 | ) | | | (0.09 | ) | | | (0.04 | ) |
Paid-in capital | | | (0.08 | ) | | | — | | | | — | |
Total distributions to shareholders | | | (0.28 | ) | | | (0.09 | ) | | | (0.04 | ) |
Net Asset Value, End of Period | | $ | 8.47 | | | $ | 8.93 | | | $ | 9.12 | |
Total Return2 | | | (2.02 | )% | | | (1.11 | )% | | | (8.36 | )%8 |
Ratio of net expenses to average net assets (with offsets/reductions) | | | 0.90 | % | | | 0.87 | % | | | 0.87 | %9 |
Ratio of expenses to average net assets (with offsets) | | | 0.95 | % | | | 0.93 | % | | | 0.96 | %9 |
Ratio of total expenses to average net assets (without offsets/reductions)3 | | | 4.00 | % | | | 4.28 | % | | | 7.98 | %9 |
Ratio of net investment income to average net assets2 | | | 1.54 | % | | | 1.17 | % | | | 0.86 | %9 |
Portfolio turnover | | | 93 | % | | | 46 | % | | | 20 | %8 |
Net assets at end of period (000’s omitted) | | $ | 179 | | | $ | 177 | | | $ | 100 | |
| | | | | | | | | | | | |
24
AMG Renaissance International Equity Fund
Financial Highlights
For a share outstanding throughout each period
| | | | | | | | | | | | |
| | | For the years ended
December 31, | | | For the period
from June 16, 2014 through | |
| Class Z | | 2016# | | | 2015 | | | December 31, 2014* | |
Net Asset Value, Beginning of Period | | $ | 8.92 | | | $ | 9.12 | | | $ | 10.00 | |
Income from Investment Operations: | | | | | | | | | | | | |
Net investment income1,2 | | | 0.15 | | | | 0.13 | 7 | | | 0.05 | |
Net realized and unrealized loss on investments | | | (0.31 | ) | | | (0.23 | ) | | | (0.88 | ) |
Total loss from investment operations | | | (0.16 | ) | | | (0.10 | ) | | | (0.83 | ) |
Less Distributions to Shareholders from: | | | | | | | | | | | | |
Net investment income | | | (0.21 | ) | | | (0.10 | ) | | | (0.05 | ) |
Paid-in capital | | | (0.08 | ) | | | — | | | | — | |
Total distributions to shareholders | | | (0.29 | ) | | | (0.10 | ) | | | (0.05 | ) |
Net Asset Value, End of Period | | $ | 8.47 | | | $ | 8.92 | | | $ | 9.12 | |
Total Return2 | | | (1.83 | )% | | | (1.08 | )% | | | (8.32 | )%8 |
Ratio of net expenses to average net assets (with offsets/reductions) | | | 0.80 | % | | | 0.79 | % | | | 0.76 | %9 |
Ratio of expenses to average net assets (with offsets) | | | 0.85 | % | | | 0.85 | % | | | 0.85 | %9 |
Ratio of total expenses to average net assets (without offsets/reductions)3 | | | 3.79 | % | | | 4.03 | % | | | 7.70 | %9 |
Ratio of net investment income to average net assets2 | | | 1.71 | % | | | 1.34 | % | | | 0.91 | %9 |
Portfolio turnover | | | 93 | % | | | 46 | % | | | 20 | %8 |
Net assets at end of period (000’s omitted) | | $ | 1,519 | | | $ | 1,933 | | | $ | 1,944 | |
| | | | | | | | | | | | |
Notes to Financial Highlights
| * | Commencement of operations was on June 16, 2014. |
| # | Effective October 1, 2016, the Investor Class, Service Class and Institutional Class of AMG Renaissance Large Cap Growth Fund and AMG Renaissance International Equity Fund were renamed as Class N, Class I and Class Z, respectively. |
| 1 | Per share numbers have been calculated using average shares. |
| 2 | Total returns and net investment income would have been lower had certain expenses not been offset. |
| 3 | Excludes the impact of expense reimbursements or fee waivers and expense reductions such as brokerage credits, but includes expense repayments and non-reimbursable expenses, if any, such as interest, taxes and extraordinary expenses. (See Notes 1(c) and 2 in the Notes to Financial Statements.) |
| 4 | The Total Return is based on the Financial Statement Net Asset Values as shown in the Financial Highlights. |
| 5 | Includes non-routine extraordinary expenses amounting to 0.019%, 0.019% and 0.021% of average net assets for the Class N, Class I and Class Z, respectively. |
| 6 | Includes non-routine extraordinary expenses amounting to 0.004%, 0.004% and 0.004% of average net assets for the Class N, Class I and Class Z, respectively. |
| 7 | Includes non-recurring dividends. Without these dividends, net investment income per share would have been $0.05, $0.10 and $0.12 for the Class N, Class I and Class Z, respectively. |
25
Notes to Financial Statements
December 31, 2016
1. SUMMARY OF SIGNIFICANT ACCOUNTING POLICIES
AMG Funds (the “Trust”) is an open-end management investment company, organized as a Massachusetts business trust and registered under the Investment Company Act of 1940, as amended (the “1940 Act”). Currently, the Trust consists of a number of different funds, each having distinct investment management objectives, strategies, risks, and policies. Included in this report are the AMG Renaissance Large Cap Growth Fund (“Large Cap Growth”) and AMG Renaissance International Equity Fund (“International Equity”), each a “Fund” and collectively the “Funds.”
Effective October 1, 2016, the Investor Class, Service Class and Institutional Class of the Funds were renamed Class N, Class I and Class Z, respectively.
Each Fund offers three classes of shares: Class N, Class I, and Class Z. Each class represents an interest in the same assets of the respective Fund. Although all share classes generally have identical voting rights, each share class votes separately when required by law. Different share classes may pay different distribution amounts to the extent the net asset value per share and/or the expenses of such share classes differ. Each share class has its own expense structure. Please refer to a current prospectus for additional information on each share class.
The Funds’ financial statements are prepared in accordance with accounting principles generally accepted in the United States of America (“U.S. GAAP”) including accounting and reporting guidance pursuant to Accounting Standards Codification Topic 946 applicable to investment companies. U.S. GAAP require management to make estimates and assumptions that affect the reported amounts of assets and liabilities and disclosure of contingent assets and liabilities at the date of the financial statements and the reported amounts of income and expenses during the reporting period. Actual results could differ from those estimates and such differences could be material. The following is a summary of significant accounting policies followed by the Funds in the preparation of their financial statements:
a. VALUATION OF INVESTMENTS
Equity securities traded on a national securities exchange or reported on the NASDAQ national market system (“NMS”) are valued at the last quoted sales price on the primary exchange or, if applicable, the NASDAQ official closing price or the official closing price of the relevant exchange or, lacking any sales, at the last quoted bid price or the mean between the last quoted bid and ask prices (the “exchange mean price”). Equity securities traded in the over-the-counter market (other than NMS securities) are valued at the exchange mean price. Foreign equity securities (securities principally traded in markets other than U.S. markets) are valued at the official closing price on the primary exchange or, for markets that either do not offer an official closing price or where the official closing price may not be representative of the overall market, the last quoted sale price.
Fixed income securities purchased with a remaining maturity of 60 days or less are valued at amortized cost, provided that the amortized cost value is approximately the same as the fair value of the security valued without the use of amortized cost. Investments in other open-end regulated investment companies are valued at their end of day net asset value per share.
The Funds’ portfolio investments are generally valued based on independent market quotations or prices or, if none, “evaluative” or other market based valuations provided by third-party pricing services approved by the Board of Trustees of the Trust (the “Board”). Under certain circumstances, the value of certain Fund portfolio investments (including derivatives) may be based on an evaluation of fair value, pursuant to procedures established by and under the general supervision of the Board. The Valuation Committee, which is comprised of the Independent Trustees of the Board, and the Pricing Committee, which is comprised of representatives from AMG Funds LLC (the “Investment Manager”) are the committees appointed by the Board to make fair value determinations. Each Fund may use the fair value of a portfolio investment to calculate its net asset value (“NAV”) in the event that the market quotation, price or market based valuation for the portfolio investment is not readily available or otherwise not determinable pursuant to the Board’s valuation procedures, if the Investment Manager or the Pricing Committee believes the quotation, price or market based valuation to be unreliable, or in certain other circumstances. When determining the fair value of an investment, the Pricing Committee and, if required under the Trust’s securities valuation procedures, the Valuation Committee, seeks to determine the price that the Fund might reasonably expect to receive from current sale of that portfolio investment in an arms-length transaction. Fair value determinations shall be based upon consideration of all available facts and information, including, but not limited to (i) attributes specific to the investment; (ii) fundamental and analytical data relating to the investment; and (iii) the value of other comparable securities or relevant financial instruments, including derivative securities, traded on other markets or among dealers.
The values assigned to fair value portfolio investments are based on available information and do not necessarily represent amounts that might ultimately be realized in the future, since such amounts depend on future developments inherent in long-term investments. Because of the inherent uncertainty of valuation, those estimated values may differ significantly from the values that would have been used had a ready market for the investments existed, and the differences could be material. The Board will be presented with a quarterly report showing as of the most recent quarter end, all outstanding securities fair valued by the Fund, including a comparison with the prior quarter end and the percentage of the Fund that the security represents at each quarter end.
With respect to foreign equity securities and certain foreign fixed income securities, the Board has adopted a policy that securities held in a Fund that can be fair valued by the applicable fair value pricing service are fair valued on each business day provided that each individual price exceeds a pre-established confidence level.
U.S. GAAP defines fair value as the price that a fund would receive to sell an asset or pay to transfer a liability in an orderly transaction between market participants at the measurement date. U.S. GAAP also establishes a framework for measuring fair value, and a three-level hierarchy for fair value measurements based upon the transparency of inputs to the valuation of an asset or liability. Inputs may be observable or unobservable and refer broadly to the assumptions that market participants would use in pricing the asset or liability. Observable inputs reflect the assumptions market participants would use in pricing the asset or liability based on market data obtained from sources independent of the Funds. Unobservable inputs reflect the Funds’ own
Notes to Financial Statements (continued)
assumptions about the assumptions that market participants would use in pricing the asset or liability developed based on the best information available in the circumstances. Each investment is assigned a level based upon the observability of the inputs which are significant to the overall valuation.
The three-tier hierarchy of inputs is summarized below:
Level 1 – inputs are quoted prices in active markets for identical investments (e.g., equity securities, open-end investment companies)
Level 2 – other observable inputs (including, but not limited to: quoted prices for similar assets or liabilities in markets that are active, quoted prices for identical or similar assets or liabilities in markets that are not active, inputs other than quoted prices that are observable for the assets or liabilities (such as interest rates, yield curves, volatilities, prepayment speeds, loss severities, credit risks and default rates) or other market corroborated inputs) (e.g., debt securities, government securities, foreign currency exchange contracts, foreign securities utilizing international fair value pricing, broker-quoted securities, fair valued securities with observable inputs)
Level 3 – inputs are significant unobservable inputs (including the Fund’s own assumptions used to determine the fair value of investments) (e.g., fair valued securities with unobservable inputs)
Changes in inputs or methodologies used for valuing investments may result in a transfer in or out of levels within the fair value hierarchy. The inputs or methodologies used for valuing investments may not necessarily be an indication of the risk associated with investing in those investments. Transfers between different levels of the fair value disclosure hierarchy are deemed to have occurred as of the beginning of the reporting period.
b. SECURITY TRANSACTIONS
Security transactions are accounted for as of trade date. Realized gains and losses on securities sold are determined on the basis of identified cost.
c. INVESTMENT INCOME AND EXPENSES
Dividend income is recorded on the ex-dividend date. Dividends from foreign securities are recorded on the ex-dividend date, and if after the fact as soon as the Fund becomes aware of the ex-dividend date, except for Korean securities where dividends are recorded on confirmation date. Interest income, which includes amortization of premium and accretion of discount on debt securities, is accrued as earned. Dividend and interest income on foreign securities is recorded gross of any withholding tax. Non-cash dividends included in dividend income, if any, are reported at the fair market value of the securities received. Other income and expenses are recorded on an accrual basis. Expenses that cannot be directly attributed to a Fund are apportioned among the funds in the Trust and other trusts within the AMG Funds family of mutual funds (collectively, the “AMG Funds family”) upon their relative average net assets or number of shareholders. Investment income, realized and unrealized gains and losses, the common expenses of each Fund, and certain Fund level expense reductions, if any, are allocated on a pro-rata basis to each class based on the relative net assets of each class to the total net assets of each Fund.
The Funds had certain portfolio trades directed to various brokers, under a brokerage recapture program. Credits received from the brokerage recapture
program are earned and paid on a monthly basis, and are recorded as expense offsets, which serve to reduce the Fund’s overall expense ratio. For the year ended December 31, 2016, the impact on the expense ratios were as follows: Large Cap Growth—$3,292 or 0.01% and International Equity—$1,298 or 0.05%.
d. DIVIDENDS AND DISTRIBUTIONS
Fund distributions resulting from either net investment income or realized net capital gains, if any, will normally be declared and paid at least annually in December, as described in the Funds’ prospectus. Distributions to shareholders are recorded on the ex-dividend date. Distributions are determined in accordance with federal income tax regulations, which may differ from net investment income and net realized capital gains for financial statement purposes (U.S. GAAP). Differences may be permanent or temporary. Permanent differences are reclassified among capital accounts in the financial statements to reflect their tax character. Permanent book and tax basis differences, if any, relating to shareholder distributions will result in reclassifications to paid-in capital. Temporary differences arise when certain items of income, expense and gain or loss are recognized in different periods for financial statement and tax purposes; these differences will reverse at some time in the future. Temporary differences are due to differences between book and tax treatment of losses for excise tax purposes, mark-to-market of passive foreign investment companies and wash sales.
The tax character of distributions paid during the years ended December 31, 2016 and December 31, 2015 were as follows:
| | | | | | | | | | | | | | | | |
| | | Large Cap
Growth | | | International
Equity | |
Distributions
paid from: | | 2016 | | | 2015 | | | 2016 | | | 2015 | |
Ordinary income | | $ | 552,593 | | | $ | 276,128 | | | $ | 47,763 | | | $ | 33,854 | |
Short-term capital gains | | | 259,317 | | | | 208,417 | | | | — | | | | — | |
Long-term capital gains | | | 766,976 | | | | 1,127,438 | | | | — | | | | — | |
Return of capital | | | — | | | | — | | | | 18,675 | | | | — | |
| | | | | | | | | | | | | | | | |
| | $ | 1,578,886 | | | $ | 1,611,983 | | | $ | 66,438 | | | $ | 33,854 | |
| | | | | | | | | | | | | | | | |
As of December 31, 2016, the components of distributable earnings (excluding unrealized appreciation/depreciation) on a tax basis consisted of:
| | | | | | | | |
| | | Large Cap Growth | | | International
Equity | |
Capital loss carryforward | | | — | | | $ | 290,300 | |
Undistributed short-term capital gains | | $ | 393,247 | | | | — | |
Undistributed long-term capital gains | | | 392,129 | | | | — | |
Late-year loss deferral | | | — | | | | 11,265 | |
e. FEDERAL TAXES
Each Fund currently qualifies as an investment company and intends to comply with the requirements under Subchapter M of the Internal Revenue Code of 1986, as amended, to distribute substantially all of its taxable income and gains to its shareholders and to meet certain diversification and income requirements
Notes to Financial Statements (continued)
with respect to investment companies. Therefore, no provision for federal income or excise tax is included in the accompanying financial statements.
Additionally, based on each Fund’s understanding of the tax rules and rates related to income, gains and transactions for the foreign jurisdictions in which it invests, each Fund will provide for foreign taxes, and where appropriate, deferred foreign taxes.
Management has analyzed the Funds’ tax positions taken on federal income tax returns as of December 31, 2016, and for all open tax years (generally, the three prior taxable years) and has concluded that no provision for federal income tax is required in the Funds’ financial statements. Additionally, Management is not aware of any tax position for which it is reasonably possible that the total amounts of unrecognized tax benefits will change materially in the next twelve months.
Net capital losses incurred may be carried forward for an unlimited time period, and retain their tax character as either short-term or long-term capital losses.
f. CAPITAL LOSS CARRYOVERS AND DEFERRALS
As of December 31, 2016, the following Fund had accumulated net realized capital loss carryovers from securities transactions for federal income tax
purposes as shown in the following chart. These amounts may be used to offset future realized capital gains for an unlimited time period.
| | | | | | | | | | | | |
| | | Capital Loss | | | | |
| | | Carryover Amounts | | | | |
| Fund | | Short-Term | | | Long-Term | | | Total | |
International Equity | | $ | 165,305 | | | $ | 124,995 | | | $ | 290,300 | |
Large Cap Growth had no accumulated net realized capital loss carryovers from securities transactions for federal income tax purposes. Should the Fund incur net capital losses for the year ended December 31, 2016, such amounts may be used to offset future realized capital gains, for an unlimited time period.
g. CAPITAL STOCK
The Trust’s Declaration of Trust authorizes for each Fund the issuance of an unlimited number of shares of beneficial interest, without par value. Each Fund records sales and repurchases of its capital stock on the trade date. The cost of securities contributed to the Funds in connection with the issuance of shares is based on the valuation of those securities in accordance with the Funds’ policy on investment valuation.
For the years ended December 31, 2016 and 2015, the capital stock transactions by class for the Funds were as follows:
| | | | | | | | | | | | | | | | | | | | | | | | | | | | | | | | |
| | | Large Cap Growth | | | International Equity | |
| | | 2016 | | | 2015 | | | 2016 | | | 2015 | |
| | | Shares | | | Amount | | | Shares | | | Amount | | | Shares | | | Amount | | | Shares | | | Amount | |
Class N: | | | | | | | | | | | | | | | | | | | | | | | | | | | | | | | | |
Proceeds from sale of shares | | | 138,761 | | | $ | 1,589,266 | | | | 226,083 | | | $ | 2,596,952 | | | | 197,520 | | | $ | 1,723,821 | | | | 104,778 | | | $ | 949,033 | |
Reinvestment of dividends and distributions | | | 4,416 | | | | 53,340 | | | | 4,693 | | | | 52,517 | | | | 1,266 | | | | 10,712 | | | | 1,064 | | | | 9,540 | |
Cost of shares repurchased | | | (112,631 | ) | | | (1,251,597 | ) | | | (631,350 | ) | | | (7,279,709 | ) | | | (270,158 | ) | | | (2,310,451 | ) | | | (1,619 | ) | | | (14,834 | ) |
| | | | | | | | | | | | | | | | | | | | | | | | | | | | | | | | |
Net increase (decrease) | | | 30,546 | | | $ | 391,009 | | | | (400,574 | ) | | $ | (4,630,240 | ) | | | (71,372 | ) | | $ | (575,918 | ) | | | 104,223 | | | $ | 943,739 | |
| | | | | | | | | | | | | | | | | | | | | | | | | | | | | | | | |
Class I: | | | | | | | | | | | | | | | | | | | | | | | | | | | | | | | | |
Proceeds from sale of shares | | | 172,150 | | | $ | 1,951,891 | | | | 785,504 | | | $ | 9,235,948 | | | | 627 | | | $ | 5,438 | | | | 19,851 | | | $ | 201,139 | |
Reinvestment of dividends and distributions | | | 24,439 | | | | 297,441 | | | | 35,623 | | | | 401,275 | | | | 676 | | | | 5,725 | | | | 206 | | | | 1,852 | |
Cost of shares repurchased | | | (549,050 | ) | | | (6,135,507 | ) | | | (519,835 | ) | | | (6,030,685 | ) | | | — | | | | — | | | | (11,185 | ) | | | (99,845 | ) |
| | | | | | | | | | | | | | | | | | | | | | | | | | | | | | | | |
Net increase (decrease) | | | (352,461 | ) | | $ | (3,886,175 | ) | | | 301,292 | | | $ | 3,606,538 | | | | 1,303 | | | $ | 11,163 | | | | 8,872 | | | $ | 103,146 | |
| | | | | | | | | | | | | | | | | | | | | | | | | | | | | | | | |
Class Z: | | | | | | | | | | | | | | | | | | | | | | | | | | | | | | | | |
Proceeds from sale of shares | | | 1,447,385 | | | $ | 15,950,625 | | | | 3,444,351 | | | $ | 39,566,123 | | | | 7,377 | | | $ | 62,517 | | | | 1,028 | | | $ | 10,000 | |
Reinvestment of dividends and distributions | | | 47,804 | | | | 575,081 | | | | 54,488 | | | | 606,485 | | | | 5,882 | | | | 49,765 | | | | 2,442 | | | | 21,950 | |
Cost of shares repurchased | | | (864,683 | ) | | | (9,684,069 | ) | | | (232,344 | ) | | | (2,648,443 | ) | | | (50,512 | ) | | | (453,734 | ) | | | — | | | | — | |
| | | | | | | | | | | | | | | | | | | | | | | | | | | | | | | | |
Net increase (decrease) | | | 630,506 | | | $ | 6,841,637 | | | | 3,266,495 | | | $ | 37,524,165 | | | | (37,253 | ) | | ($ | 341,452 | ) | | | 3,470 | | | $ | 31,950 | |
| | | | | | | | | | | | | | | | | | | | | | | | | | | | | | | | |
At December 31, 2016, certain unaffiliated shareholders of record, including omnibus accounts, individually or collectively held greater than 10% of the net assets of the Funds as follows: Large Cap Growth—one owns 40%; International Equity—two own 65%. Transactions by these shareholders may have a material impact on their respective Fund.
28
Notes to Financial Statements (continued)
h. REPURCHASE AGREEMENTS AND JOINT REPURCHASE AGREEMENTS
The Funds may enter into repurchase agreements for temporary cash management purposes provided that the value of the underlying collateral, including accrued interest, will equal or exceed the value of the repurchase agreement during the term of the agreement. The underlying collateral for all repurchase agreements is held in safekeeping by the Funds’ custodian or at the Federal Reserve Bank. If the seller defaults and the value of the collateral declines, or if bankruptcy proceedings commence with respect to the seller of the security, realization of the collateral by the Funds may be delayed or limited.
Additionally, the Funds may enter into joint repurchase agreements for reinvestment of cash collateral on securities lending transactions under the securities lending program offered by The Bank of New York Mellon (“BNYM”) (the “Program”), provided that the value of the underlying collateral, including accrued interest, will equal or exceed the value of the joint repurchase agreement during the term of the agreement. The Funds participate on a pro rata basis with other clients of BNYM in its share of the underlying collateral under such joint repurchase agreements and in its share of proceeds from any repurchases or other disposition of the underlying collateral. The underlying collateral for joint repurchase agreements is held in safekeeping by the Funds’ custodian or at the Federal Reserve Bank. If the seller defaults and the value of the collateral declines, or if bankruptcy proceedings commence with respect to the seller of the security, realization of the collateral by the Funds may be delayed or limited. Pursuant to the Program, the Funds are indemnified for such losses by BNYM.
At December 31, 2016, the market value of repurchase agreements or joint repurchase agreements outstanding for Large Cap Growth and International Equity were $488,054 and $59,996, respectively.
i. FOREIGN CURRENCY TRANSLATION
The books and records of the Funds are maintained in U.S. dollars. The value of investments, assets and liabilities denominated in currencies other than U.S. dollars are translated into U.S. dollars based upon current foreign exchange rates. Purchases and sales of foreign investments, income and expenses are converted into U.S. dollars based on currency exchange rates prevailing on the respective dates of such transactions. Net realized and unrealized gain (loss) on foreign currency transactions represent: (1) foreign exchange gains and losses from the sale and holdings of foreign currencies; (2) gains and losses between trade date and settlement date on investment securities transactions and forward foreign currency exchange contracts; and (3) gains and losses from the difference between amounts of interest and dividends recorded and the amounts actually received.
The Funds do not isolate the net realized and unrealized gain or loss resulting from changes in exchange rates from the fluctuations in market prices of securities held. Such fluctuations are included with the net realized and unrealized gain or loss on investments.
j. FOREIGN SECURITIES
International Equity invests in securities of foreign entities and in instruments denominated in foreign currencies which involve risks not typically associated with investments in domestic securities. Non-domestic securities carry special
risks, such as exposure to currency fluctuations, less developed or less efficient trading markets, political instability, a lack of company information, differing auditing and legal standards, and, potentially, less liquidity. A Fund’s investments in emerging market countries are exposed to additional risks. A Fund’s performance will be influenced by political, social and economic factors affecting companies in emerging market countries. Emerging market countries generally have economic structures that are less diverse and mature, and political systems that are less stable, than those of developed countries.
Realized gains in certain countries may be subject to foreign taxes at the Fund level, and would pay such foreign taxes at the appropriate rate for each jurisdiction.
2. AGREEMENTS AND TRANSACTIONS WITH AFFILIATES
For each of the Funds, the Trust has entered into an investment advisory agreement under which the Investment Manager, a subsidiary and the U.S. retail distribution arm of Affiliated Managers Group, Inc. (“AMG”), serves as investment manager to the Funds and is responsible for the Funds’ overall administration and operations. The Investment Manager selects one or more subadvisors for the Funds (subject to Board approval) and monitors each subadvisor’s investment performance, security holdings and investment strategies. Each Fund’s investment portfolio is managed by The Renaissance Group LLC (“Renaissance”), who serves pursuant to a subadvisory agreement with the Investment Manager. AMG indirectly owns a majority interest in Renaissance.
Investment management fees are paid directly by the Funds to the Investment Manager based on average daily net assets. For the year ended December 31, 2016, the Funds’ investment management fees were paid at the following annual rate of each Fund’s respective average daily net assets:
| | | | |
Large Cap Growth | | | 0.55 | % |
International Equity | | | 0.40 | % |
The Investment Manager has contractually agreed, through at least May 1, 2017, to waive management fees and/or reimburse fund expenses in order to limit total annual Fund operating expenses after fee waiver and expense reimbursements (exclusive of taxes, interest (including interest incurred in connection with bank and custody overdrafts), shareholder servicing fees, distribution and service (12b-1) fees, brokerage commissions and other transaction costs, acquired fund fees and expenses, and extraordinary expenses) of Large Cap Growth and International Equity to 0.66% and 0.85%, respectively, of each Fund’s average daily net assets subject to later reimbursement by the Funds in certain circumstances. The contractual expense limitation may only be terminated in the event the Investment Manager or a successor ceases to be the investment manager of the Fund or a successor fund, by mutual agreement between the Investment Manager and the Board, or in the event of the Fund’s liquidation unless the Fund is reorganized or is a party to a merger in which the surviving entity is successor to the accounting and performance information of the Fund.
Each Fund is obligated to repay the Investment Manager such amounts waived, paid, or reimbursed in future years provided that the repayment occurs within thirty-six (36) months after the waiver or reimbursement and that such
Notes to Financial Statements (continued)
repayment would not cause the Fund’s total annual operating expenses after fee waiver and respective expense reimbursements in any such future year to exceed that Fund’s respective contractual expense limitation amount.
At December 31, 2016, each Fund’s expiration of reimbursement is as follows:
| | | | | | | | |
| Expiration Period | | Large Cap
Growth | | | International
Equity | |
Less than 1 year | | $ | 139,196 | | | $ | 84,048 | |
Within 2 years | | | 186,914 | | | | 81,993 | |
Within 3 years | | | 185,526 | | | | 74,416 | |
| | | | | | | | |
Total Amount Subject to Reimbursement | | $ | 511,636 | | | $ | 240,457 | |
| | | | | | | | |
The Trust, on behalf of the Funds, has entered into an amended and restated Administration Agreement under which the Investment Manager serves as the Funds’ administrator (the “Administrator”) and is responsible for all non-portfolio management aspects of managing the Funds’ operations, including administration and shareholder services to each Fund as further described in each Fund’s prospectus. Effective October 1, 2016, each Fund pays a fee to the Administrator at the rate of 0.15% per annum of the Fund’s average daily net assets for this service. Prior to October 1, 2016, the Funds paid an administration fee under a similar contract at an annual rate of 0.25% of each Fund’s average daily net assets.
The Funds are distributed by AMG Distributors, Inc. (the “Distributor”), a wholly-owned subsidiary of the Investment Manager. The Distributor serves as the distributor and underwriter for each Fund and is a registered broker-dealer and member of the Financial Industry Regulatory Authority, Inc. (“FINRA”). Shares of each Fund will be continuously offered and will be sold directly to prospective purchasers and through brokers, dealers or other financial intermediaries who have executed selling agreements with the Distributor. Subject to the compensation arrangement discussed below, generally the Distributor bears all or a portion of the expenses of providing services pursuant to the distribution agreement, including the payment of the expenses relating to the distribution of prospectuses for sales purposes and any advertising or sales literature.
The Trust has adopted a distribution and service plan (the “Plan”) with respect to Class N shares of each Fund, in accordance with the requirements of Rule 12b-1 under the 1940 Act and the requirements of the applicable rules of FINRA regarding asset-based sales charges. Pursuant to the Plan, each Fund may make payments to the Distributor for its expenditures in financing any activity primarily intended to result in the sale of each such class of the Fund’s shares and for maintenance and personal service provided to existing shareholders of that class. The Plan authorizes payments to the Distributor of 0.25% annually of each Fund’s average daily net assets attributable to the Class N shares.
For each of the Class N and Class I shares, the Board has approved reimbursement payments to the Investment Manager for shareholder servicing expenses (“shareholder servicing fees”) incurred. Shareholder servicing fees include payments to financial intermediaries, such as broker-dealers (including fund supermarket platforms, banks, and trust companies who provide shareholder recordkeeping, account servicing and other services. The Class N
and Class I shares may reimburse the Investment Manager for the actual amount incurred up to a maximum annual rate of each Class’s average daily net asset value as shown in the table below.
The impact on the annualized expense ratios for the year ended December 31, 2016, were as follows:
| | | | | | | | |
| Fund | | Maximum
Amount
Approved | | | Actual
Amount
Incurred | |
Large Cap Growth | | | | | | | | |
Class N | | | 0.25 | % | | | 0.25 | % |
Class I* | | | 0.25 | % | | | 0.16 | % |
International Equity | | | | | | | | |
Class N | | | 0.25 | % | | | 0.25 | % |
Class I | | | 0.15 | % | | | 0.10 | % |
| * | Effective October 1, 2016, the maximum annual rate was decreased to 0.15% from 0.25%. |
The Board provides supervision of the affairs of the Trust, other trusts within the AMG Funds family. The Trustees of the Trust who are not affiliated with an Investment Manager receive an annual retainer and per meeting fees for regular, special and telephonic meetings, and they are reimbursed for out-of-pocket expenses incurred while carrying out their duties as Board members. The Chairman of the Board and the Audit Committee Chair receive additional annual retainers. Certain Trustees and Officers of the Funds are Officers and/or Directors of the Investment Manager, AMG and/or the Distributor.
The Securities and Exchange Commission (the “SEC”) has granted an exemptive order that permits the Funds to lend and borrow money for certain temporary purposes directly to and from other eligible funds in the AMG Funds family. Participation in this interfund lending program is voluntary for both the borrowing and lending funds, and an interfund loan is only made if it benefits each participating fund. The Administrator manages the program according to procedures approved by the Board, and the Board monitors the operation of the program. An interfund loan must comply with certain conditions set out in the exemptive order, which are designed to assure fairness and protect all participating funds. For the year ended December 31, 2016, Large Cap Growth and International Equity neither borrowed from nor lent to other funds in the AMG Funds family. At December 31, 2016, the Funds had no interfund loans outstanding.
3. PURCHASES AND SALES OF SECURITIES
Purchases and sales of securities (excluding short-term securities and U.S. Government Obligations) for the year ended December 31, 2016, were as follows:
| | | | | | | | |
| | | Long-Term Securities | |
| Fund | | Purchases | | | Sales | |
Large Cap Growth | | $ | 26,187,171 | | | $ | 24,124,140 | |
International Equity | | | 2,367,518 | | | | 3,316,717 | |
The Funds had no purchases or sales of U.S. Government Obligations during the year ended December 31, 2016.
Notes to Financial Statements (continued)
4. PORTFOLIO SECURITIES LOANED
The Funds participate in the Program providing for the lending of securities to qualified brokers. Securities lending income includes earnings of such temporary cash investments, plus or minus any rebate to a borrower. These earnings (after any rebate) are then divided between BNYM, as a fee for its services under the Program, and the Funds, according to agreed-upon rates. Collateral on all securities loaned is accepted in cash and is maintained at a minimum level of 102% (105% in the case of certain foreign securities) of the market value, plus interest, if applicable, of investments on loan. It is the Funds’ policy to obtain additional collateral from or return excess collateral to the borrower by the end of the next business day, following the valuation date of the securities loaned. Therefore, the value of the collateral held may be temporarily less than the value of the securities on loan. Lending securities entails a risk of loss to the Funds if and to the extent that the market value of the securities loaned were to increase and the borrower did not increase the collateral accordingly, and the borrower fails to return the securities. Under the terms of the Program, the Funds are indemnified for such losses by BNYM. Cash collateral is held in a separate omnibus account managed by BNYM, who is authorized to exclusively enter into joint overnight government repurchase agreements. BNYM bears the risk of any deficiency in the amount of the cash collateral available for return to the borrower due to any loss on the collateral invested.
At December 31, 2016, the value of the securities loaned and cash collateral received, were as follows:
| | | | | | | | |
| | | Securities | | | Cash Collateral | |
| Fund | | Loaned | | | Received | |
Large Cap Growth | | $ | 473,288 | | | $ | 488,054 | |
International Equity | | | 58,323 | | | | 59,996 | |
5. COMMITMENTS AND CONTINGENCIES
Under the Trust’s organizational documents, its trustees and officers are indemnified against certain liabilities arising out of the performance of their duties to the Trust. In addition, in the normal course of business, the Funds may enter into contracts and agreements that contain a variety of representations and warranties, which provide general indemnifications. The maximum exposure to the Funds under these arrangements is unknown, as this would involve future claims that may be made against a Fund that have not yet occurred. However, based on experience, the Funds had no prior claims or losses and expect the risks of loss to be remote.
6. MASTER NETTING AGREEMENTS
The Funds may enter into master netting agreements with their counterparties for the securities lending program and repurchase agreements, which provide the right, in the event of default (including bankruptcy or insolvency) for the non-defaulting party to liquidate the collateral and calculate net exposure to the defaulting party or request additional collateral. For financial reporting purposes, the Funds do not offset financial assets and financial liabilities that are subject to master netting agreements in the Statement of Assets and Liabilities. For securities lending transactions, see Note 4.
The following table is a summary of the Funds’ open repurchase agreements that are subject to a master netting agreement as of December 31, 2016:
| | | | | | | | | | | | | | | | |
| | | | | | Gross Amount Not Offset in the
Statement of Assets and Liabilities | | | | |
| Fund | | Net Amounts of Assets
Presented in the Statement
of Assets and Liabilities | | | Financial
Instruments | | | Cash Collateral
Received | | | Net Amount | |
Large Cap Growth | | | | | | | | | | | | | | | | |
Daiwa Capital Markets America | | $ | 488,054 | | | $ | 488,054 | | | | — | | | | — | |
| | | | | | | | | | | | | | | | |
Totals | | $ | 488,054 | | | $ | 488,054 | | | | — | | | | — | |
| | | | | | | | | | | | | | | | |
International Equity | | | | | | | | | | | | | | | | |
Citigroup Global Markets, Inc. | | $ | 59,996 | | | $ | 59,996 | | | | — | | | | — | |
| | | | | | | | | | | | | | | | |
Totals | | $ | 59,996 | | | $ | 59,996 | | | | — | | | | — | |
| | | | | | | | | | | | | | | | |
7. REGULATORY UPDATES
On October 13, 2016, the SEC amended existing rules intended to modernize reporting and disclosure of information. These amendments relate to Regulation S-X, which sets forth the form and content of financial statements. At this time, management is evaluating the implications of adopting these amendments and their impact on the financial statements and accompanying notes.
8. SUBSEQUENT EVENTS
The Funds have determined that no material events or transactions occurred through the issuance date of the Funds’ financial statements, which require an additional disclosure in or adjustment of the Funds’ financial statements except for the following: Effective February 27, 2017, the maximum annual rate of shareholder servicing fees of the Funds’ Class N shares will be decreased to 0.15%. Please refer to each Fund’s prospectus for further details.
Notes to Financial Statements (continued)
TAX INFORMATION (unaudited)
The AMG Renaissance Large Cap Growth Fund and the AMG Renaissance International Equity Fund each hereby designates the maximum amount allowable of their net taxable income as qualified dividends as provided in the Jobs and Growth Tax Relief Reconciliation Act of 2003. The 2016 Form 1099-DIV you receive for the Funds will show the tax status of all distributions paid to you during the calendar year.
In accordance with federal tax law, the following Fund elected to provide foreign taxes paid and the income sourced from foreign countries. Accordingly, the Fund hereby makes the following designations regarding its period ended December 31, 2016.
AMG Renaissance International Equity
| • | | The total amount of taxes paid and income sourced from foreign countries was $5,248 and $66,451, respectively. |
Pursuant to section 852 of the Internal Revenue Code, AMG Renaissance Large Cap Growth Fund and AMG Renaissance International Equity Fund each hereby designates $766,976 and $0, respectively, as a capital gain distribution with respect to the taxable year ended December 31, 2016, or if subsequently determined to be different, the net capital gains of such year.
32
Report of Independent Registered Public Accounting Firm
TO THE BOARD OF TRUSTEES OF AMG FUNDS AND THE SHAREHOLDERS OF AMG RENAISSANCE LARGE CAP GROWTH FUND AND AMG RENAISSANCE INTERNATIONAL EQUITY FUND:
In our opinion, the accompanying statements of assets and liabilities, including the schedules of portfolio investments, and the related statements of operations and of changes in net assets and the financial highlights present fairly, in all material respects, the financial position of AMG Renaissance Large Cap Growth Fund and AMG Renaissance International Equity Fund (the “Funds”) as of December 31, 2016, and the results of each of their operations, the changes in each of their net assets and the financial highlights for each of the periods indicated, in conformity with accounting principles generally accepted in the United States of America. These financial statements and financial highlights (hereafter referred to as “financial statements”) are the responsibility of the Funds’ management. Our responsibility is to express an opinion on these financial statements based on our audits. We conducted our audits of these financial statements in accordance with the standards of the Public Company Accounting Oversight Board (United States). Those standards require that we plan and perform the audit to obtain reasonable assurance about whether the financial statements are free of material misstatement. An audit includes examining, on a test basis, evidence supporting the amounts and disclosures in the financial statements, assessing the accounting principles used and significant estimates made by management, and evaluating the overall financial statement presentation. We believe that our audits, which included confirmation of securities as of December 31, 2016 by correspondence with the custodian and brokers, and the application of alternative auditing procedures where securities purchased had not been received, provide a reasonable basis for our opinion.
PricewaterhouseCoopers LLP
Boston, Massachusetts
February 28, 2017
33
AMG Funds
Trustees and Officers
| | | | |
| The Trustees and Officers of the Trust, their business addresses, principal occupations for the past five years and ages are listed below. The Trustees provide broad supervision over the affairs of the Trust and the Funds. The Trustees are experienced executives who meet periodically throughout the year to oversee the Funds’ activities, review contractual arrangements with | | companies that provide services to the Funds, and review the Funds’ performance. Unless otherwise noted, the address of each Trustee or Officer is the address of the Trust: 600 Steamboat Road, Suite 300, Greenwich, Connecticut 06830. There is no stated term of office for Trustees. Trustees serve until their resignation, retirement or removal in accordance with the Trust’s | | organizational documents and policies adopted by the Board from time to time. The Chairman of the Trustees, President, Treasurer and Secretary of the Trust are elected by the Trustees annually. Other officers hold office at the pleasure of the Trustees. |
Independent Trustees
The following Trustees are not “interested persons” of the Trust within the meaning of the 1940 Act:
| | |
Number of Funds Overseen in Fund Complex | | Name, Age, Principal Occupation(s) During Past 5 Years and Other Directorships Held by Trustee |
| |
• Trustee since 2012 • Oversees 67 Funds in Fund Complex | | Bruce B. Bingham, 68 Partner, Hamilton Partners (real estate development firm) (1987-Present); Director of The Yacktman Funds (2000-2012). |
| |
• Trustee since 1999 • Oversees 67 Funds in Fund Complex | | Edward J. Kaier, 71 Attorney at Law and Partner, Teeters Harvey Marrone & Kaier LLP (2007-Present); Attorney at Law and Partner, Hepburn Willcox Hamilton & Putnam, LLP (1977-2007); Trustee of Third Avenue Trust (5 portfolios); Trustee of Third Avenue Variable Trust (1 portfolio). |
| |
• Trustee since 2013 • Oversees 69 Funds in Fund Complex | | Kurt A. Keilhacker, 53 Managing Member, TechFund Capital (1997-Present); Managing Member, TechFund Europe (2000-Present); Board Member, 6wind SA, (2002-Present); Managing Member, Elementum Ventures (2013-Present); Trustee, Gordon College (2001-2016). |
| |
• Trustee since 2004 • Oversees 67 Funds in Fund Complex | | Steven J. Paggioli, 66 Independent Consultant (2002-Present); Formerly Executive Vice President and Director, The Wadsworth Group (1986-2001); Executive Vice President, Secretary and Director, Investment Company Administration, LLC (1990-2001); Vice President, Secretary and Director, First Fund Distributors, Inc. (1991-2001); Trustee, Professionally Managed Portfolios (32 portfolios); Advisory Board Member, Sustainable Growth Advisors, LP; Independent Director, Chase Investment Counsel (2008–Present). |
| |
• Trustee since 2013 • Oversees 67 Funds in Fund Complex | | Richard F. Powers III, 71 Adjunct Professor, Boston College (2010-2013); President and CEO of Van Kampen Investments Inc. (1998-2003). |
| |
• Independent Chairman • Trustee since 1999 • Oversees 69 Funds in Fund Complex | | Eric Rakowski, 58 Professor, University of California at Berkeley School of Law (1990-Present); Director of Harding, Loevner Funds, Inc. (9 portfolios); Trustee of Third Avenue Trust (5 portfolios); Trustee of Third Avenue Variable Trust (1 portfolio). |
| |
• Trustee since 2013 • Oversees 69 Funds in Fund Complex | | Victoria L. Sassine, 51 Lecturer, Babson College (2007–Present). |
| |
• Trustee since 2004 • Oversees 67 Funds in Fund Complex | | Thomas R. Schneeweis, 69 Professor Emeritus, University of Massachusetts (2013-Present); Partner, S Capital Wealth Advisors (2015-Present); President, TRS Associates (1982-Present); Board Member, Chartered Alternative Investment Association (“CAIA”) (2002-Present); Director, CAIA Foundation (Education) (2010-Present); Director, Institute for Global Asset and Risk Management (Education) (2010-Present); Partner, S Capital Management, LLC (2007-2015); Director, CISDM at the University of Massachusetts, (1996-2013); President, Alternative Investment Analytics, LLC, (formerly Schneeweis Partners, LLC) (2001-2013); Professor of Finance, University of Massachusetts (1977-2013). |
Interested Trustees
Each Trustee in the following table is an “interested person” of the Trust within the meaning of the 1940 Act. Ms. Carsman is an interested person of the Trust within the meaning of the 1940 Act by virtue of her position with, and interest in securities of, AMG.
| | |
Number of Funds Overseen in Fund Complex | | Name, Age, Principal Occupation(s) During Past 5 Years and Other Directorships Held by Trustee |
• Trustee since 2011 • Oversees 69 Funds in Fund Complex | | Christine C. Carsman, 64 Executive Vice President, Deputy General Counsel and Chief Regulatory Counsel, Affiliated Managers Group, Inc. (2017-Present); Senior Vice President and Deputy General Counsel, Affiliated Managers Group, Inc. (2011-2016); Senior Vice President and Chief Regulatory Counsel, Affiliated Managers Group, Inc. (2007-2011); Vice President and Chief Regulatory Counsel, Affiliated Managers Group, Inc. (2004-2007); Secretary and Chief Legal Officer, AMG Funds, AMG Funds I, AMG Funds II and AMG Funds III (2004-2011); Senior Counsel, Vice President and Director of Operational Risk Management and Compliance, Wellington Management Company, LLP (1995-2004). |
34
AMG Funds
Trustees and Officers (continued)
Officers
| | |
Position(s) Held with Fund and Length of Time Served | | Name, Age, Principal Occupation(s) During Past 5 Years |
• President since 2014 • Principal Executive Officer since 2014 • Chief Executive Officer since 2016 | | Jeffrey T. Cerutti, 49 Chief Executive Officer, AMG Funds LLC (2014-Present); Director, President and Principal, AMG Distributors, Inc. (2014-Present); President and Principal Executive Officer, AMG Funds, AMG Funds I, AMG Funds II and AMG Funds III (2014-Present); Chief Executive Officer, President and Principal Executive Officer, AMG Funds IV, (2015-Present); Chief Executive Officer, AMG Funds, AMG Funds I, AMG Funds II and AMG Funds III (2016-Present); Chief Executive Officer, Aston Asset Management, LLC (2016); President, VP Distributors, (2011-2014); Executive Vice President, Head of Distribution, Virtus Investment Partners, Inc. (2010-2014); Managing Director, Head of Sales, UBS Global Asset Management (2001-2010). |
| |
• Chief Operating Officer since 2007 | | Keitha L. Kinne, 58 Chief Operating Officer, AMG Funds LLC (2007-Present); Chief Investment Officer, AMG Funds LLC (2008-Present); Chief Operating Officer, AMG Distributors, Inc. (2007-Present); Chief Operating Officer, AMG Funds, AMG Funds I, AMG Funds II, and AMG Funds III (2007-Present); Chief Operating Officer, AMG Funds IV, (2016-Present); Chief Operating Officer and Chief Investment Officer, Aston Asset Management, LLC (2016); President and Principal Executive Officer, AMG Funds, AMG Funds I, AMG Funds II and AMG Funds III (2012-2014); Managing Partner, AMG Funds LLC (2007-2014); President, AMG Funds (2012-2014); President, AMG Distributors, Inc. (2012-2014); Managing Director, Legg Mason & Co., LLC (2006-2007); Managing Director, Citigroup Asset Management (2004-2006). |
| |
• Secretary since 2015 • Chief Legal Officer since 2015 | | Mark J. Duggan, 52 Senior Vice President and Senior Counsel, AMG Funds LLC (2015-Present); Secretary and Chief Legal Officer, AMG Funds, AMG Funds I, AMG Funds II and AMG Funds III (2015-Present); Secretary and Chief Legal Officer, AMG Funds IV, (2015-Present); Attorney, K&L Gates, LLP (2009-2015). |
| |
• Chief Financial Officer since 2007 • Treasurer since 1999 • Principal Financial Officer since 2008 | | Donald S. Rumery, 58 Senior Vice President, Director of Mutual Funds Services, AMG Funds LLC (2005-Present); Principal Financial Officer, AMG Funds, AMG Funds I, AMG Funds II and AMG Funds III (2008-Present); Treasurer, Chief Financial Officer, Principal Financial Officer and Principal Accounting Officer, AMG Funds IV, (2016-Present); Treasurer, AMG Funds, (1999-Present); Treasurer, AMG Funds III (1995-Present); Treasurer, (AMG Funds I and AMG Funds II (2000-Present); Chief Financial Officer, AMG Funds, AMG Funds I, AMG Funds II and AMG Funds III (2007-Present); Treasurer and Chief Financial Officer, AMG Distributors, Inc. (2000-2012); Vice President, AMG Funds LLC, (1994-2004). |
| |
• Chief Compliance Officer since 2016 | | Gerald F. Dillenburg, 50 Chief Compliance Officer and Sarbanes Oxley Code of Ethics Compliance Officer, AMG Funds, AMG Funds I, AMG Funds II and AMG Funds III (2016-Present); Chief Compliance Officer, AMG Funds IV (1996-Present); Sarbanes-Oxley Code of Ethics Compliance Officer, AMG Funds IV (2016-Present); Chief Compliance Officer, Aston Asset Management, LLC (2006-2016); Chief Operating Officer, Aston Funds (2003-2016); Secretary, Aston Funds (1996-2015); Chief Financial Officer, Aston Funds (1997-2010); Chief Financial Officer, Aston Asset Management, LLC (2006-2010); Treasurer, Aston Funds (1996-2010). |
| |
• Anti-Money Laundering Compliance Officer since 2014 | | Patrick J. Spellman, 42 Senior Vice President, Chief Compliance Officer, AMG Funds LLC (2011-Present); Chief Compliance Officer, AMG Distributors, Inc., (2010-Present); Anti-Money Laundering Compliance Officer, AMG Funds, AMG Funds I, AMG Funds II, and AMG Funds III (2014-Present); Anti-Money Laundering Officer, AMG Funds IV, (2016-Present); Compliance Manager, Legal and Compliance, Affiliated Managers Group, Inc. (2005-2011). |
| |
• Assistant Secretary since 2016 | | Maureen A. Meredith, 31 Vice President, Counsel, AMG Funds LLC (2015-Present); Assistant Secretary, AMG Funds, AMG Funds I, AMG Funds II, AMG Funds III and AMG Funds IV (2016-Present); Associate, Ropes & Gray LLP (2011-2015); Law Fellow, Massachusetts Appleseed Center for Law and Justice (2010-2011). |
| |
• Assistant Secretary since 2016 | | Diana M. Podgorny, 37 Vice President, Counsel, AMG Funds LLC (2016-Present); Assistant Secretary, AMG Funds, AMG Funds I, AMG Funds II and AMG Funds III (2016-Present); Assistant Secretary, AMG Funds IV (2010-Present); Vice President, Counsel, Aston Asset Management, LLC (2010-2016). |
| |
• Assistant Secretary since 2016 | | Marc Peirce, 54 Vice President, Compliance Officer, AMG Funds LLC (2016-Present); Assistant Secretary, AMG Funds IV (2001-Present); Assistant Secretary, AMG Funds, AMG Funds I, AMG Funds II and AMG Funds III (2016-Present); Vice President, Aston Asset Management, LLC (1998-2016); Assistant Chief Compliance Officer, Aston Asset Management, LLC (2006-2016). |
The accompanying notes are an integral part of these financial statements.
35
THIS PAGE INTENTIONALLY LEFT BLANK
| | | | |
INVESTMENT MANAGER AND ADMINISTRATOR AMG Funds LLC 600 Steamboat Road, Suite 300
Greenwich, CT 06830
(800) 835-3879 DISTRIBUTOR AMG Distributors, Inc. 600 Steamboat Road, Suite 300
Greenwich, CT 06830
(800)-835-3879 SUBADVISOR The Renaissance Group LLC
625 Eden Park Drive, Suite 1200
Cincinnati, OH 45202 CUSTODIAN The Bank of New York Mellon 2 Hanson Place
Brooklyn, NY 11217 LEGAL COUNSEL Ropes & Gray LLP Prudential Tower, 800 Boylston Street
Boston, MA 02199-3600 | | TRANSFER AGENT BNY Mellon Investment Servicing (US) Inc. Attn: AMG Funds P.O. Box 9769 Providence, RI 02940 (800) 548-4539 FOR MANAGERSCHOICETM ONLY AMG Funds
c/o BNY Mellon Investment Servicing (US) Inc.
P.O. Box 9847
Providence, Rhode Island 02940-8047
(800) 358-7668 | | This report is prepared for the Funds’ shareholders. It is authorized for distribution to prospective investors only when preceded or accompanied by an effective prospectus. To receive a free copy of the prospectus or Statement of Additional Information, which includes additional information about Fund Trustees, please contact us by calling 800.835.3879. Distributed by AMG Distributors, Inc., member FINRA/SIPC. Current net asset values per share for each Fund are available on the Funds’ website at www.amgfunds.com. A description of the policies and procedures each Fund uses to vote its proxies is available: (i) without charge, upon request, by calling 800.835.3879, or (ii) on the Securities and Exchange Commission’s (SEC) website at www.sec.gov. For information regarding each Fund’s proxy voting record for the 12-month period ended June 30, call 800.835.3879 or visit the SEC website at www.sec.gov. The Funds file their complete schedule of portfolio holdings with the SEC for the first and third quarters of each fiscal year on Form N-Q. The Funds’ Forms N-Q are available on the SEC’s website at www.sec.gov. A Funds’ Forms N-Q may be reviewed and copied at the SEC’s Public Reference Room in Washington, DC. Information on the operation of the Public Reference Room may be obtained by calling 1-800-SEC-0330. To review a complete list of the Funds’ portfolio holdings, or to view the most recent quarterly holdings report, semiannual report, or annual report, please visit www.amgfunds.com. |
| | | | |
AFFILIATE SUBADVISED FUNDS BALANCED FUNDS AMG Chicago Equity Partners Balanced Chicago Equity Partners, LLC AMG FQ Global Risk-Balanced First Quadrant, L.P. EQUITY FUNDS AMG Chicago Equity Partners Small Cap Value Chicago Equity Partners, LLC AMG FQ Tax-Managed U.S. Equity AMG FQ U.S. Equity First Quadrant, L.P. AMG Frontier Small Cap Growth Frontier Capital Management Company, LLC AMG GW&K Small Cap Core AMG GW&K Small Cap Growth AMG GW&K U.S. Small Cap Growth GW&K Investment Management, LLC AMG Renaissance International Equity AMG Renaissance Large Cap Growth The Renaissance Group LLC AMG River Road Dividend All Cap Value AMG River Road Dividend All Cap Value II AMG River Road Focused Absolute Value AMG River Road Long-Short AMG River Road Select Value AMG River Road Small Cap Value River Road Asset Management, LLC AMG SouthernSun Small Cap AMG SouthernSun Global Opportunities AMG SouthernSun U.S. Equity SouthernSun Asset Management, LLC AMG Systematic Large Cap Value AMG Systematic Mid Cap Value Systematic Financial Management, L.P. AMG TimesSquare All Cap Growth AMG TimesSquare Emerging Markets Small Cap AMG TimesSquare International Small Cap AMG TimesSquare Mid Cap Growth AMG TimesSquare Small Cap Growth TimesSquare Capital Management, LLC | | AMG Trilogy Emerging Markets Equity AMG Trilogy Emerging Wealth Equity AMG Trilogy Global Equity AMG Trilogy International Small Cap Trilogy Global Advisors, L.P. AMG Yacktman AMG Yacktman Focused AMG Yacktman Focused Fund—Security Selection Only AMG Yacktman Special Opportunities Yacktman Asset Management LP FIXED INCOME FUNDS AMG GW&K Core Bond AMG GW&K Enhanced Core Bond AMG GW&K Municipal Bond AMG GW&K Municipal Enhanced Yield GW&K Investment Management, LLC OPEN-ARCHITECTURE FUNDS ALTERNATIVE FUNDS AMG Managers Lake Partners LASSO Alternative Lake Partners, Inc. BALANCED FUNDS AMG Managers Montag & Caldwell Balanced Montag & Caldwell, LLC EQUITY FUNDS AMG Managers Brandywine AMG Managers Brandywine Advisors Mid Cap Growth AMG Managers Brandywine Blue Friess Associates, LLC AMG Managers Cadence Capital Appreciation AMG Managers Cadence Emerging Companies AMG Managers Cadence Mid Cap Cadence Capital Management, LLC AMG Managers CenterSquare Real Estate CenterSquare Investment Management, Inc. AMG Managers Emerging Opportunities Lord, Abbett & Co. LLC WEDGE Capital Management L.L.P. Next Century Growth Investors LLC RBC Global Asset Management (U.S.) Inc. | | AMG Managers Essex Small/Micro Cap Growth Essex Investment Management Co., LLC AMG Managers Fairpointe Focused Equity AMG Managers Fairpointe Mid Cap Fairpointe Capital LLC AMG Managers Guardian Capital Global Dividend Guardian Capital LP AMG Managers LMCG Small Cap Growth LMCG Investments, LLC AMG Managers Montag & Caldwell Growth AMG Managers Montag & Caldwell Mid Cap Growth Montag & Caldwell, LLC AMG Managers Pictet International Pictet Asset Management Limited AMG Managers Silvercrest Small Cap Silvercrest Asset Management Group LLC AMG Managers Skyline Special Equities Skyline Asset Management, L.P. AMG Managers Special Equity Ranger Investment Management, L.P. Lord, Abbett & Co. LLC Smith Asset Management Group, L.P.
Federated MDTA LLC AMG Managers Value Partners Asia Dividend Value Partners Hong Kong Limited FIXED INCOME FUNDS AMG Managers Amundi Intermediate Government AMG Managers Amundi Short Duration Government Amundi Smith Breeden LLC AMG Managers Doubleline Core Plus Bond DoubleLine Capital LP AMG Managers Global Income Opportunity AMG Managers Loomis Sayles Bond Loomis, Sayles & Co., L.P. AMG Managers High Yield J.P. Morgan Investment Management Inc. |
| | | | |
| | | |
AR024-1216  | | | | | www.amgfunds.com |