0001089951 af:C000176472Member oef:MaterialsSectorMember 2024-06-30
UNITED STATES
SECURITIES AND EXCHANGE COMMISSION
Washington, D.C. 20549
FORM N-CSR
CERTIFIED SHAREHOLDER REPORT OF REGISTERED MANAGEMENT INVESTMENT COMPANIES
Investment Company Act file number
(Exact name of registrant as specified in charter)
680 Washington Boulevard, Suite 500, Stamford, Connecticut 06901
(Address of principal executive offices) (Zip code)
AMG Funds LLC
680 Washington Boulevard, Suite 500, Stamford, Connecticut 06901
(Name and address of agent for service)
Registrant's telephone number, including area code:
Date of reporting period:
January 01, 2024 - June 30, 2024
(Semi-Annual Shareholder Report)
Item 1. Reports to Shareholders
(a)
AMG GW&K Municipal Bond Fund
Class N/GWMTX
SEMI-ANNUAL SHAREHOLDER REPORT | June 30, 2024
This semi-annual shareholder report contains important information about AMG GW&K Municipal Bond Fund (the “Fund”) for the period of January 1, 2024 to June 30, 2024. You can find additional information about the Fund at https://wealth.amg.com/resources/order-literature. You can also request this information by contacting us at 800-548-4539.
Fund Expenses
What were the Fund costs for the last six months?
(Based on a hypothetical $10,000 investment)
| Fund (Class) | Costs of a $10,000 investment | Costs paid as a percentage of a $10,000 investment |
AMG GW&K Municipal Bond Fund
(Class N/GWMTX) | $36 | 0.72% |
Key Fund Statistics (as of June 30, 2024)
| Fund net assets | $1,009,911,288% |
| Total number of portfolio holdings | $198% |
| Net advisory fees paid | $731,935% |
| Portfolio turnover rate as of the end of the reporting period | $15% |
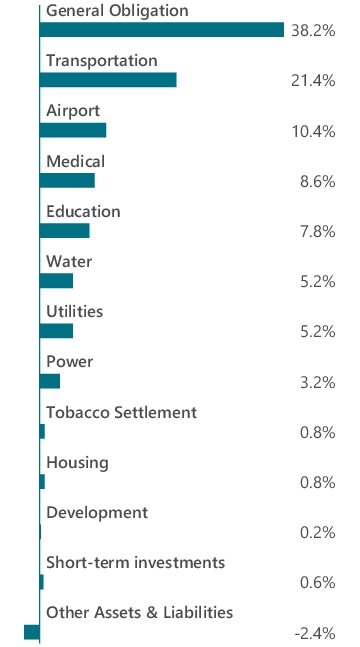
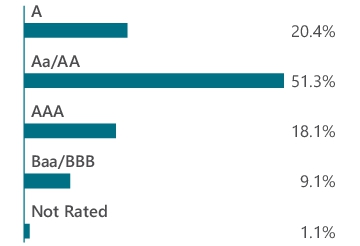
Graphical Representation of Holdings (as of June 30, 2024)
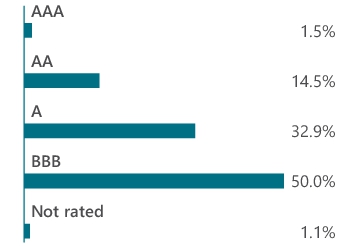
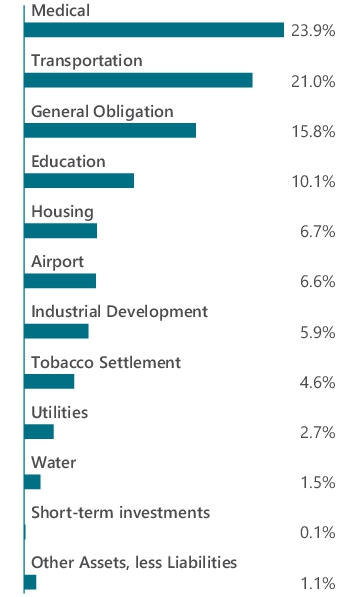
Top ten holdings and portfolio breakdown are shown as a percentage of net assets of the Fund and ratings are shown as a percentage of total long-term investments of the Fund.
| Iowa Finance Authority, State Revolving Fund Green Bond, 5.000%, 08/01/30 | 1.5% |
| Metropolitan Transportation Authority, Green Bond, Series B, 5.000%, 11/15/27 | 1.5% |
| Triborough Bridge & Tunnel Authority, Series C, 5.000%, 11/15/36 | 1.4% |
| Commonwealth of Massachusetts, Series A, 5.000%, 03/01/32 | 1.3% |
| State of Maryland, Department of Transportation, 5.000%, 09/01/29 | 1.3% |
| State of Maryland, Department of Transportation, 5.000%, 10/01/28 | 1.2% |
| Louisiana Stadium & Exposition District, Series A, 5.000%, 07/01/42 | 1.2% |
| City of San Antonio Electric & Gas Systems, Series A, 5.000%, 02/01/31 | 1.2% |
| State of Illinois, Series B, 5.000%, 05/01/34 | 1.1% |
| State of Wisconsin Transportation, Series 2, 5.000%, 07/01/29 | 1.1% |
| Top Ten as a Group | 12.8% |
Availability of Additional Information
You can find additional information about the Fund such as the prospectus, financial information, fund holdings and proxy voting information at https://wealth.amg.com/resources/order-literature. You can also request this information by contacting us at 800.548.4539.
Householding
In order to reduce expenses, we will deliver a single copy of prospectuses, proxies, financial reports and other communication to shareholders with the same residential address, provided they have the same last name or we reasonably believe them to be members of the same family. Unless we are notified otherwise, we will continue to send recipients only one copy of these materials for as long as they remain a shareholder of the Fund. If you would like to receive individual mailings, please call 800.548.4539 and we will begin sending you separate copies of these materials within 30 days after receiving your request.
For additional information, please navigate to the additional material at https://wealth.amg.com/resources/order-literature.
AMG GW&K Municipal Bond Fund
Class I/GWMIX
SEMI-ANNUAL SHAREHOLDER REPORT | June 30, 2024
This semi-annual shareholder report contains important information about AMG GW&K Municipal Bond Fund (the “Fund”) for the period of January 1, 2024 to June 30, 2024. You can find additional information about the Fund at https://wealth.amg.com/resources/order-literature. You can also request this information by contacting us at 800-548-4539.
Fund Expenses
What were the Fund costs for the last six months?
(Based on a hypothetical $10,000 investment)
| Fund (Class) | Costs of a $10,000 investment | Costs paid as a percentage of a $10,000 investment |
AMG GW&K Municipal Bond Fund
(Class I/GWMIX) | $19 | 0.39% |
Key Fund Statistics (as of June 30, 2024)
| Fund net assets | $1,009,911,288% |
| Total number of portfolio holdings | $198% |
| Net advisory fees paid | $731,935% |
| Portfolio turnover rate as of the end of the reporting period | $15% |
Graphical Representation of Holdings (as of June 30, 2024)
Top ten holdings and portfolio breakdown are shown as a percentage of net assets of the Fund and ratings are shown as a percentage of total long-term investments of the Fund.
| Iowa Finance Authority, State Revolving Fund Green Bond, 5.000%, 08/01/30 | 1.5% |
| Metropolitan Transportation Authority, Green Bond, Series B, 5.000%, 11/15/27 | 1.5% |
| Triborough Bridge & Tunnel Authority, Series C, 5.000%, 11/15/36 | 1.4% |
| Commonwealth of Massachusetts, Series A, 5.000%, 03/01/32 | 1.3% |
| State of Maryland, Department of Transportation, 5.000%, 09/01/29 | 1.3% |
| State of Maryland, Department of Transportation, 5.000%, 10/01/28 | 1.2% |
| Louisiana Stadium & Exposition District, Series A, 5.000%, 07/01/42 | 1.2% |
| City of San Antonio Electric & Gas Systems, Series A, 5.000%, 02/01/31 | 1.2% |
| State of Illinois, Series B, 5.000%, 05/01/34 | 1.1% |
| State of Wisconsin Transportation, Series 2, 5.000%, 07/01/29 | 1.1% |
| Top Ten as a Group | 12.8% |
Availability of Additional Information
You can find additional information about the Fund such as the prospectus, financial information, fund holdings and proxy voting information at https://wealth.amg.com/resources/order-literature. You can also request this information by contacting us at 800.548.4539.
Householding
In order to reduce expenses, we will deliver a single copy of prospectuses, proxies, financial reports and other communication to shareholders with the same residential address, provided they have the same last name or we reasonably believe them to be members of the same family. Unless we are notified otherwise, we will continue to send recipients only one copy of these materials for as long as they remain a shareholder of the Fund. If you would like to receive individual mailings, please call 800.548.4539 and we will begin sending you separate copies of these materials within 30 days after receiving your request.
For additional information, please navigate to the additional material at https://wealth.amg.com/resources/order-literature.
AMG GW&K Municipal Enhanced SMA Shares
MESHX
SEMI-ANNUAL SHAREHOLDER REPORT | June 30, 2024
This semi-annual shareholder report contains important information about AMG GW&K Municipal Enhanced SMA Shares (the “Fund”) for the period of January 1, 2024 to June 30, 2024. You can find additional information about the Fund at https://wealth.amg.com/resources/order-literature. You can also request this information by contacting us at 800-548-4539.
Fund Expenses
What were the Fund costs for the last six months?
(Based on a hypothetical $10,000 investment)
| Fund (Class) | Costs of a $10,000 investment | Costs paid as a percentage of a $10,000 investment |
AMG GW&K Municipal Enhanced SMA Shares
(MESHX) | $0 | 0.00% |
Key Fund Statistics (as of June 30, 2024)
| Fund net assets | $143,825,618% |
| Total number of portfolio holdings | $115% |
| Net advisory fees paid | $0% |
| Portfolio turnover rate as of the end of the reporting period | $8% |
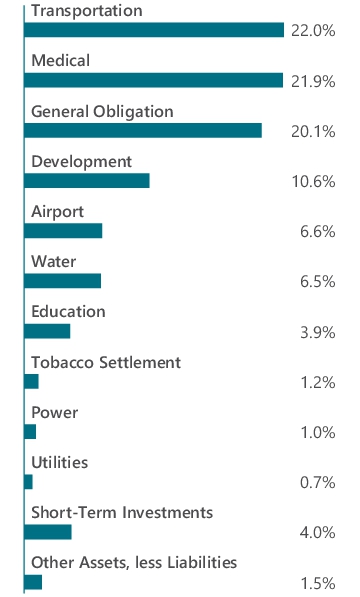
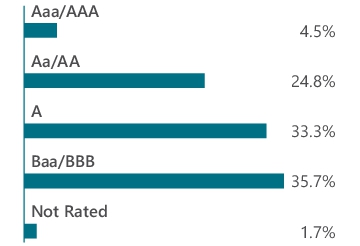
Graphical Representation of Holdings (as of June 30, 2024)
Top ten holdings and portfolio breakdown are shown as a percentage of net assets of the Fund and ratings are shown as a percentage of total long-term investments of the Fund.
| County of Jefferson Sewer Revenue, 5.500%, 10/01/53 | 3.6% |
| Rhode Island Health and Educational Building Corp., 5.250%, 05/15/54 | 3.3% |
| Texas Private Activity Bond Surface Transportation Corp., 5.000%, 06/30/58 | 2.9% |
| Pennsylvania Economic Development Financing Authority, (AGM), 5.000%, 12/31/57 | 2.8% |
| Metropolitan Transportation Authority, Series 1, Revenue, 4.750%, 11/15/45 | 2.6% |
| North Carolina Turnpike Authority, Series A, 5.000%, 01/01/58 | 2.6% |
| Florida Housing Finance Corp., Series 3, 4.750%, 07/01/54 | 2.4% |
| Massachusetts Development Finance Agency, 5.250%, 07/01/52 | 2.2% |
| Louisiana Stadium & Exposition District, Series A, 5.250%, 07/01/53 | 2.0% |
| New York Transportation Development Corp., 6.000%, 06/30/54 | 1.9% |
| Top Ten as a Group | 26.3% |
Availability of Additional Information
You can find additional information about the Fund such as the prospectus, financial information, fund holdings and proxy voting information at https://wealth.amg.com/resources/order-literature. You can also request this information by contacting us at 800.548.4539.
Householding
In order to reduce expenses, we will deliver a single copy of prospectuses, proxies, financial reports and other communication to shareholders with the same residential address, provided they have the same last name or we reasonably believe them to be members of the same family. Unless we are notified otherwise, we will continue to send recipients only one copy of these materials for as long as they remain a shareholder of the Fund. If you would like to receive individual mailings, please call 800.548.4539 and we will begin sending you separate copies of these materials within 30 days after receiving your request.
For additional information, please navigate to the additional material at https://wealth.amg.com/resources/order-literature.
AMG GW&K Municipal Enhanced Yield Fund
Class N/GWMNX
SEMI-ANNUAL SHAREHOLDER REPORT | June 30, 2024
This semi-annual shareholder report contains important information about AMG GW&K Municipal Enhanced Yield Fund (the “Fund”) for the period of January 1, 2024 to June 30, 2024. You can find additional information about the Fund at https://wealth.amg.com/resources/order-literature. You can also request this information by contacting us at 800-548-4539.
Fund Expenses
What were the Fund costs for the last six months?
(Based on a hypothetical $10,000 investment)
| Fund (Class) | Costs of a $10,000 investment | Costs paid as a percentage of a $10,000 investment |
AMG GW&K Municipal Enhanced Yield Fund
(Class N/GWMNX) | $49 | 0.99% |
Key Fund Statistics (as of June 30, 2024)
| Fund net assets | $203,804,926% |
| Total number of portfolio holdings | $75% |
| Net advisory fees paid | $365,630% |
| Portfolio turnover rate as of the end of the reporting period | $14% |
Graphical Representation of Holdings (as of June 30, 2024)
Top ten holdings and portfolio breakdown are shown as a percentage of net assets of the Fund and ratings are shown as a percentage of total long-term investments of the Fund.
| Texas Private Activity Bond Surface Transportation Corp., 5.000%, 06/30/58 | 3.9% |
| Public Authority for Colorado Energy Natural Gas Purchase Revenue, 6.500%, 11/15/38 | 3.2% |
| Richland County School District No 2, Series A, 1.875%, 03/01/38 | 3.0% |
| City of Chattanooga Electric, 2.000%, 09/01/40 | 2.7% |
| Philadelphia Authority for Industrial Development, 5.250%, 11/01/52 | 2.7% |
| Pennsylvania Economic Development Financing Authority, 5.250%, 06/30/53 | 2.6% |
| Central Plains Energy Project #3, Series A, 5.000%, 09/01/42 | 2.5% |
| New York Transportation Development Corp., 4.000%, 04/30/53 | 2.3% |
| Rhode Island Health and Educational Building Corp., 5.250%, 05/15/54 | 2.3% |
| Escambia County Health Facilities Authority, 4.000%, 08/15/50 | 2.2% |
| Top Ten as a Group | 27.4% |
Availability of Additional Information
You can find additional information about the Fund such as the prospectus, financial information, fund holdings and proxy voting information at https://wealth.amg.com/resources/order-literature. You can also request this information by contacting us at 800.548.4539.
Householding
In order to reduce expenses, we will deliver a single copy of prospectuses, proxies, financial reports and other communication to shareholders with the same residential address, provided they have the same last name or we reasonably believe them to be members of the same family. Unless we are notified otherwise, we will continue to send recipients only one copy of these materials for as long as they remain a shareholder of the Fund. If you would like to receive individual mailings, please call 800.548.4539 and we will begin sending you separate copies of these materials within 30 days after receiving your request.
For additional information, please navigate to the additional material at https://wealth.amg.com/resources/order-literature.
AMG GW&K Municipal Enhanced Yield Fund
Class I/GWMEX
SEMI-ANNUAL SHAREHOLDER REPORT | June 30, 2024
This semi-annual shareholder report contains important information about AMG GW&K Municipal Enhanced Yield Fund (the “Fund”) for the period of January 1, 2024 to June 30, 2024. You can find additional information about the Fund at https://wealth.amg.com/resources/order-literature. You can also request this information by contacting us at 800-548-4539.
Fund Expenses
What were the Fund costs for the last six months?
(Based on a hypothetical $10,000 investment)
| Fund (Class) | Costs of a $10,000 investment | Costs paid as a percentage of a $10,000 investment |
AMG GW&K Municipal Enhanced Yield Fund
(Class I/GWMEX) | $32 | 0.64% |
Key Fund Statistics (as of June 30, 2024)
| Fund net assets | $203,804,926% |
| Total number of portfolio holdings | $75% |
| Net advisory fees paid | $365,630% |
| Portfolio turnover rate as of the end of the reporting period | $14% |
Graphical Representation of Holdings (as of June 30, 2024)
Top ten holdings and portfolio breakdown are shown as a percentage of net assets of the Fund and ratings are shown as a percentage of total long-term investments of the Fund.
| Texas Private Activity Bond Surface Transportation Corp., 5.000%, 06/30/58 | 3.9% |
| Public Authority for Colorado Energy Natural Gas Purchase Revenue, 6.500%, 11/15/38 | 3.2% |
| Richland County School District No 2, Series A, 1.875%, 03/01/38 | 3.0% |
| City of Chattanooga Electric, 2.000%, 09/01/40 | 2.7% |
| Philadelphia Authority for Industrial Development, 5.250%, 11/01/52 | 2.7% |
| Pennsylvania Economic Development Financing Authority, 5.250%, 06/30/53 | 2.6% |
| Central Plains Energy Project #3, Series A, 5.000%, 09/01/42 | 2.5% |
| New York Transportation Development Corp., 4.000%, 04/30/53 | 2.3% |
| Rhode Island Health and Educational Building Corp., 5.250%, 05/15/54 | 2.3% |
| Escambia County Health Facilities Authority, 4.000%, 08/15/50 | 2.2% |
| Top Ten as a Group | 27.4% |
Availability of Additional Information
You can find additional information about the Fund such as the prospectus, financial information, fund holdings and proxy voting information at https://wealth.amg.com/resources/order-literature. You can also request this information by contacting us at 800.548.4539.
Householding
In order to reduce expenses, we will deliver a single copy of prospectuses, proxies, financial reports and other communication to shareholders with the same residential address, provided they have the same last name or we reasonably believe them to be members of the same family. Unless we are notified otherwise, we will continue to send recipients only one copy of these materials for as long as they remain a shareholder of the Fund. If you would like to receive individual mailings, please call 800.548.4539 and we will begin sending you separate copies of these materials within 30 days after receiving your request.
For additional information, please navigate to the additional material at https://wealth.amg.com/resources/order-literature.
AMG GW&K Municipal Enhanced Yield Fund
Class Z/GWMZX
SEMI-ANNUAL SHAREHOLDER REPORT | June 30, 2024
This semi-annual shareholder report contains important information about AMG GW&K Municipal Enhanced Yield Fund (the “Fund”) for the period of January 1, 2024 to June 30, 2024. You can find additional information about the Fund at https://wealth.amg.com/resources/order-literature. You can also request this information by contacting us at 800-548-4539.
Fund Expenses
What were the Fund costs for the last six months?
(Based on a hypothetical $10,000 investment)
| Fund (Class) | Costs of a $10,000 investment | Costs paid as a percentage of a $10,000 investment |
AMG GW&K Municipal Enhanced Yield Fund
(Class Z/GWMZX) | $29 | 0.59% |
Key Fund Statistics (as of June 30, 2024)
| Fund net assets | $203,804,926% |
| Total number of portfolio holdings | $75% |
| Net advisory fees paid | $365,630% |
| Portfolio turnover rate as of the end of the reporting period | $14% |
Graphical Representation of Holdings (as of June 30, 2024)
Top ten holdings and portfolio breakdown are shown as a percentage of net assets of the Fund and ratings are shown as a percentage of total long-term investments of the Fund.
| Texas Private Activity Bond Surface Transportation Corp., 5.000%, 06/30/58 | 3.9% |
| Public Authority for Colorado Energy Natural Gas Purchase Revenue, 6.500%, 11/15/38 | 3.2% |
| Richland County School District No 2, Series A, 1.875%, 03/01/38 | 3.0% |
| City of Chattanooga Electric, 2.000%, 09/01/40 | 2.7% |
| Philadelphia Authority for Industrial Development, 5.250%, 11/01/52 | 2.7% |
| Pennsylvania Economic Development Financing Authority, 5.250%, 06/30/53 | 2.6% |
| Central Plains Energy Project #3, Series A, 5.000%, 09/01/42 | 2.5% |
| New York Transportation Development Corp., 4.000%, 04/30/53 | 2.3% |
| Rhode Island Health and Educational Building Corp., 5.250%, 05/15/54 | 2.3% |
| Escambia County Health Facilities Authority, 4.000%, 08/15/50 | 2.2% |
| Top Ten as a Group | 27.4% |
Availability of Additional Information
You can find additional information about the Fund such as the prospectus, financial information, fund holdings and proxy voting information at https://wealth.amg.com/resources/order-literature. You can also request this information by contacting us at 800.548.4539.
Householding
In order to reduce expenses, we will deliver a single copy of prospectuses, proxies, financial reports and other communication to shareholders with the same residential address, provided they have the same last name or we reasonably believe them to be members of the same family. Unless we are notified otherwise, we will continue to send recipients only one copy of these materials for as long as they remain a shareholder of the Fund. If you would like to receive individual mailings, please call 800.548.4539 and we will begin sending you separate copies of these materials within 30 days after receiving your request.
For additional information, please navigate to the additional material at https://wealth.amg.com/resources/order-literature.
AMG GW&K Small Cap Core Fund
Class N/GWETX
SEMI-ANNUAL SHAREHOLDER REPORT | June 30, 2024
This semi-annual shareholder report contains important information about AMG GW&K Small Cap Core Fund (the “Fund”) for the period of January 1, 2024 to June 30, 2024. You can find additional information about the Fund at https://wealth.amg.com/resources/order-literature. You can also request this information by contacting us at 800-548-4539.
Fund Expenses
What were the Fund costs for the last six months?
(Based on a hypothetical $10,000 investment)
| Fund (Class) | Costs of a $10,000 investment | Costs paid as a percentage of a $10,000 investment |
AMG GW&K Small Cap Core Fund
(Class N/GWETX) | $65 | 1.30% |
Key Fund Statistics (as of June 30, 2024)
| Fund net assets | $619,541,994% |
| Total number of portfolio holdings | $96% |
| Net advisory fees paid | $2,176,779% |
| Portfolio turnover rate as of the end of the reporting period | $9% |
Graphical Representation of Holdings (as of June 30, 2024)
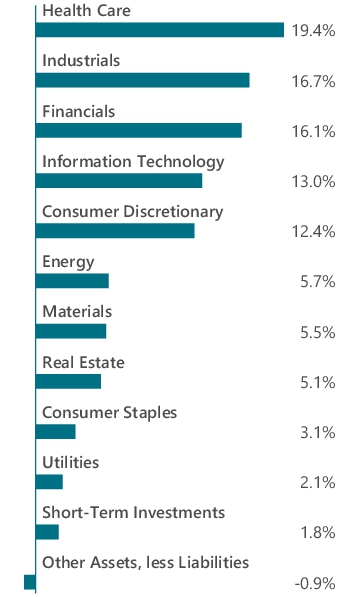
Top ten holdings and portfolio breakdown are shown as a percentage of net assets of the Fund.
| SPX Technologies, Inc. | 2.3% |
| Texas Roadhouse, Inc. | 2.1% |
| Appfolio, Inc., Class A | 2.1% |
| MACOM Technology Solutions Holdings, Inc. | 2.0% |
| Medpace Holdings, Inc. | 1.9% |
| RBC Bearings, Inc. | 1.9% |
| HealthEquity, Inc. | 1.8% |
| Stifel Financial Corp. | 1.8% |
| Matador Resources Co. | 1.8% |
| Novanta, Inc. | 1.8% |
| Top Ten as a Group | 19.5% |
Availability of Additional Information
You can find additional information about the Fund such as the prospectus, financial information, fund holdings and proxy voting information at https://wealth.amg.com/resources/order-literature. You can also request this information by contacting us at 800.548.4539.
Householding
In order to reduce expenses, we will deliver a single copy of prospectuses, proxies, financial reports and other communication to shareholders with the same residential address, provided they have the same last name or we reasonably believe them to be members of the same family. Unless we are notified otherwise, we will continue to send recipients only one copy of these materials for as long as they remain a shareholder of the Fund. If you would like to receive individual mailings, please call 800.548.4539 and we will begin sending you separate copies of these materials within 30 days after receiving your request.
For additional information, please navigate to the additional material at https://wealth.amg.com/resources/order-literature.
AMG GW&K Small Cap Core Fund
Class I/GWEIX
SEMI-ANNUAL SHAREHOLDER REPORT | June 30, 2024
This semi-annual shareholder report contains important information about AMG GW&K Small Cap Core Fund (the “Fund”) for the period of January 1, 2024 to June 30, 2024. You can find additional information about the Fund at https://wealth.amg.com/resources/order-literature. You can also request this information by contacting us at 800-548-4539.
Fund Expenses
What were the Fund costs for the last six months?
(Based on a hypothetical $10,000 investment)
| Fund (Class) | Costs of a $10,000 investment | Costs paid as a percentage of a $10,000 investment |
AMG GW&K Small Cap Core Fund
(Class I/GWEIX) | $48 | 0.95% |
Key Fund Statistics (as of June 30, 2024)
| Fund net assets | $619,541,994% |
| Total number of portfolio holdings | $96% |
| Net advisory fees paid | $2,176,779% |
| Portfolio turnover rate as of the end of the reporting period | $9% |
Graphical Representation of Holdings (as of June 30, 2024)
Top ten holdings and portfolio breakdown are shown as a percentage of net assets of the Fund.
| SPX Technologies, Inc. | 2.3% |
| Texas Roadhouse, Inc. | 2.1% |
| Appfolio, Inc., Class A | 2.1% |
| MACOM Technology Solutions Holdings, Inc. | 2.0% |
| Medpace Holdings, Inc. | 1.9% |
| RBC Bearings, Inc. | 1.9% |
| HealthEquity, Inc. | 1.8% |
| Stifel Financial Corp. | 1.8% |
| Matador Resources Co. | 1.8% |
| Novanta, Inc. | 1.8% |
| Top Ten as a Group | 19.5% |
Availability of Additional Information
You can find additional information about the Fund such as the prospectus, financial information, fund holdings and proxy voting information at https://wealth.amg.com/resources/order-literature. You can also request this information by contacting us at 800.548.4539.
Householding
In order to reduce expenses, we will deliver a single copy of prospectuses, proxies, financial reports and other communication to shareholders with the same residential address, provided they have the same last name or we reasonably believe them to be members of the same family. Unless we are notified otherwise, we will continue to send recipients only one copy of these materials for as long as they remain a shareholder of the Fund. If you would like to receive individual mailings, please call 800.548.4539 and we will begin sending you separate copies of these materials within 30 days after receiving your request.
For additional information, please navigate to the additional material at https://wealth.amg.com/resources/order-literature.
AMG GW&K Small Cap Core Fund
Class Z/GWEZX
SEMI-ANNUAL SHAREHOLDER REPORT | June 30, 2024
This semi-annual shareholder report contains important information about AMG GW&K Small Cap Core Fund (the “Fund”) for the period of January 1, 2024 to June 30, 2024. You can find additional information about the Fund at https://wealth.amg.com/resources/order-literature. You can also request this information by contacting us at 800-548-4539.
Fund Expenses
What were the Fund costs for the last six months?
(Based on a hypothetical $10,000 investment)
| Fund (Class) | Costs of a $10,000 investment | Costs paid as a percentage of a $10,000 investment |
AMG GW&K Small Cap Core Fund
(Class Z/GWEZX) | $45 | 0.90% |
Key Fund Statistics (as of June 30, 2024)
| Fund net assets | $619,541,994% |
| Total number of portfolio holdings | $96% |
| Net advisory fees paid | $2,176,779% |
| Portfolio turnover rate as of the end of the reporting period | $9% |
Graphical Representation of Holdings (as of June 30, 2024)
Top ten holdings and portfolio breakdown are shown as a percentage of net assets of the Fund.
| SPX Technologies, Inc. | 2.3% |
| Texas Roadhouse, Inc. | 2.1% |
| Appfolio, Inc., Class A | 2.1% |
| MACOM Technology Solutions Holdings, Inc. | 2.0% |
| Medpace Holdings, Inc. | 1.9% |
| RBC Bearings, Inc. | 1.9% |
| HealthEquity, Inc. | 1.8% |
| Stifel Financial Corp. | 1.8% |
| Matador Resources Co. | 1.8% |
| Novanta, Inc. | 1.8% |
| Top Ten as a Group | 19.5% |
Availability of Additional Information
You can find additional information about the Fund such as the prospectus, financial information, fund holdings and proxy voting information at https://wealth.amg.com/resources/order-literature. You can also request this information by contacting us at 800.548.4539.
Householding
In order to reduce expenses, we will deliver a single copy of prospectuses, proxies, financial reports and other communication to shareholders with the same residential address, provided they have the same last name or we reasonably believe them to be members of the same family. Unless we are notified otherwise, we will continue to send recipients only one copy of these materials for as long as they remain a shareholder of the Fund. If you would like to receive individual mailings, please call 800.548.4539 and we will begin sending you separate copies of these materials within 30 days after receiving your request.
For additional information, please navigate to the additional material at https://wealth.amg.com/resources/order-literature.
AMG GW&K Small Cap Value Fund
Class N/SKSEX
SEMI-ANNUAL SHAREHOLDER REPORT | June 30, 2024
This semi-annual shareholder report contains important information about AMG GW&K Small Cap Value Fund (the “Fund”) for the period of January 1, 2024 to June 30, 2024. You can find additional information about the Fund at https://wealth.amg.com/resources/order-literature. You can also request this information by contacting us at 800-548-4539.
Fund Expenses
What were the Fund costs for the last six months?
(Based on a hypothetical $10,000 investment)
| Fund (Class) | Costs of a $10,000 investment | Costs paid as a percentage of a $10,000 investment |
AMG GW&K Small Cap Value Fund
(Class N/SKSEX) | $57 | 1.15% |
Key Fund Statistics (as of June 30, 2024)
| Fund net assets | $234,572,911% |
| Total number of portfolio holdings | $88% |
| Net advisory fees paid | $802,618% |
| Portfolio turnover rate as of the end of the reporting period | $10% |
Graphical Representation of Holdings (as of June 30, 2024)
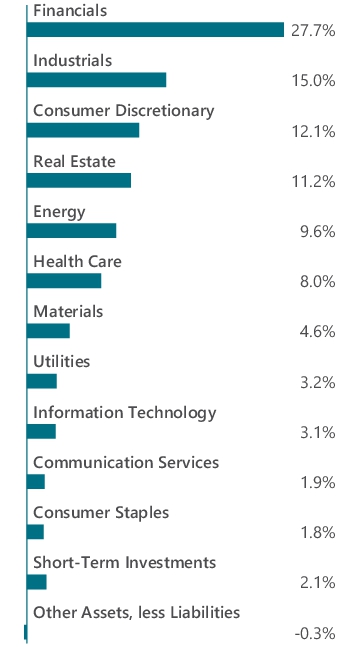
Top ten holdings and portfolio breakdown are shown as a percentage of net assets of the Fund.
| Piper Sandler Cos. | 2.2% |
| Federal Agricultural Mortgage Corp., Class C | 2.2% |
| Primoris Services Corp. | 2.2% |
| Selective Insurance Group, Inc. | 2.2% |
| Independence Realty Trust, Inc., REIT | 2.1% |
| Integer Holdings Corp. | 2.1% |
| Permian Resources Corp. | 2.1% |
| Boot Barn Holdings, Inc. | 2.0% |
| PJT Partners, Inc., Class A | 2.0% |
| CBIZ, Inc. | 2.0% |
| Top Ten as a Group | 21.1% |
Availability of Additional Information
You can find additional information about the Fund such as the prospectus, financial information, fund holdings and proxy voting information at https://wealth.amg.com/resources/order-literature. You can also request this information by contacting us at 800.548.4539.
Householding
In order to reduce expenses, we will deliver a single copy of prospectuses, proxies, financial reports and other communication to shareholders with the same residential address, provided they have the same last name or we reasonably believe them to be members of the same family. Unless we are notified otherwise, we will continue to send recipients only one copy of these materials for as long as they remain a shareholder of the Fund. If you would like to receive individual mailings, please call 800.548.4539 and we will begin sending you separate copies of these materials within 30 days after receiving your request.
For additional information, please navigate to the additional material at https://wealth.amg.com/resources/order-literature.
AMG GW&K Small Cap Value Fund
Class I/SKSIX
SEMI-ANNUAL SHAREHOLDER REPORT | June 30, 2024
This semi-annual shareholder report contains important information about AMG GW&K Small Cap Value Fund (the “Fund”) for the period of January 1, 2024 to June 30, 2024. You can find additional information about the Fund at https://wealth.amg.com/resources/order-literature. You can also request this information by contacting us at 800-548-4539.
Fund Expenses
What were the Fund costs for the last six months?
(Based on a hypothetical $10,000 investment)
| Fund (Class) | Costs of a $10,000 investment | Costs paid as a percentage of a $10,000 investment |
AMG GW&K Small Cap Value Fund
(Class I/SKSIX) | $47 | 0.95% |
Key Fund Statistics (as of June 30, 2024)
| Fund net assets | $234,572,911% |
| Total number of portfolio holdings | $88% |
| Net advisory fees paid | $802,618% |
| Portfolio turnover rate as of the end of the reporting period | $10% |
Graphical Representation of Holdings (as of June 30, 2024)
Top ten holdings and portfolio breakdown are shown as a percentage of net assets of the Fund.
| Piper Sandler Cos. | 2.2% |
| Federal Agricultural Mortgage Corp., Class C | 2.2% |
| Primoris Services Corp. | 2.2% |
| Selective Insurance Group, Inc. | 2.2% |
| Independence Realty Trust, Inc., REIT | 2.1% |
| Integer Holdings Corp. | 2.1% |
| Permian Resources Corp. | 2.1% |
| Boot Barn Holdings, Inc. | 2.0% |
| PJT Partners, Inc., Class A | 2.0% |
| CBIZ, Inc. | 2.0% |
| Top Ten as a Group | 21.1% |
Availability of Additional Information
You can find additional information about the Fund such as the prospectus, financial information, fund holdings and proxy voting information at https://wealth.amg.com/resources/order-literature. You can also request this information by contacting us at 800.548.4539.
Householding
In order to reduce expenses, we will deliver a single copy of prospectuses, proxies, financial reports and other communication to shareholders with the same residential address, provided they have the same last name or we reasonably believe them to be members of the same family. Unless we are notified otherwise, we will continue to send recipients only one copy of these materials for as long as they remain a shareholder of the Fund. If you would like to receive individual mailings, please call 800.548.4539 and we will begin sending you separate copies of these materials within 30 days after receiving your request.
For additional information, please navigate to the additional material at https://wealth.amg.com/resources/order-literature.
AMG GW&K Small Cap Value Fund
Class Z/SKSZX
SEMI-ANNUAL SHAREHOLDER REPORT | June 30, 2024
This semi-annual shareholder report contains important information about AMG GW&K Small Cap Value Fund (the “Fund”) for the period of January 1, 2024 to June 30, 2024. You can find additional information about the Fund at https://wealth.amg.com/resources/order-literature. You can also request this information by contacting us at 800-548-4539.
Fund Expenses
What were the Fund costs for the last six months?
(Based on a hypothetical $10,000 investment)
| Fund (Class) | Costs of a $10,000 investment | Costs paid as a percentage of a $10,000 investment |
AMG GW&K Small Cap Value Fund
(Class Z/SKSZX) | $45 | 0.90% |
Key Fund Statistics (as of June 30, 2024)
| Fund net assets | $234,572,911% |
| Total number of portfolio holdings | $88% |
| Net advisory fees paid | $802,618% |
| Portfolio turnover rate as of the end of the reporting period | $10% |
Graphical Representation of Holdings (as of June 30, 2024)
Top ten holdings and portfolio breakdown are shown as a percentage of net assets of the Fund.
| Piper Sandler Cos. | 2.2% |
| Federal Agricultural Mortgage Corp., Class C | 2.2% |
| Primoris Services Corp. | 2.2% |
| Selective Insurance Group, Inc. | 2.2% |
| Independence Realty Trust, Inc., REIT | 2.1% |
| Integer Holdings Corp. | 2.1% |
| Permian Resources Corp. | 2.1% |
| Boot Barn Holdings, Inc. | 2.0% |
| PJT Partners, Inc., Class A | 2.0% |
| CBIZ, Inc. | 2.0% |
| Top Ten as a Group | 21.1% |
Availability of Additional Information
You can find additional information about the Fund such as the prospectus, financial information, fund holdings and proxy voting information at https://wealth.amg.com/resources/order-literature. You can also request this information by contacting us at 800.548.4539.
Householding
In order to reduce expenses, we will deliver a single copy of prospectuses, proxies, financial reports and other communication to shareholders with the same residential address, provided they have the same last name or we reasonably believe them to be members of the same family. Unless we are notified otherwise, we will continue to send recipients only one copy of these materials for as long as they remain a shareholder of the Fund. If you would like to receive individual mailings, please call 800.548.4539 and we will begin sending you separate copies of these materials within 30 days after receiving your request.
For additional information, please navigate to the additional material at https://wealth.amg.com/resources/order-literature.
AMG GW&K Small/Mid Cap Core Fund
Class N/GWGVX
SEMI-ANNUAL SHAREHOLDER REPORT | June 30, 2024
This semi-annual shareholder report contains important information about AMG GW&K Small/Mid Cap Core Fund (the “Fund”) for the period of January 1, 2024 to June 30, 2024. You can find additional information about the Fund at https://wealth.amg.com/resources/order-literature. You can also request this information by contacting us at 800-548-4539.
Fund Expenses
What were the Fund costs for the last six months?
(Based on a hypothetical $10,000 investment)
| Fund (Class) | Costs of a $10,000 investment | Costs paid as a percentage of a $10,000 investment |
AMG GW&K Small/Mid Cap Core Fund
(Class N/GWGVX) | $54 | 1.07% |
Key Fund Statistics (as of June 30, 2024)
| Fund net assets | $707,862,215% |
| Total number of portfolio holdings | $88% |
| Net advisory fees paid | $2,151,504% |
| Portfolio turnover rate as of the end of the reporting period | $9% |
Graphical Representation of Holdings (as of June 30, 2024)
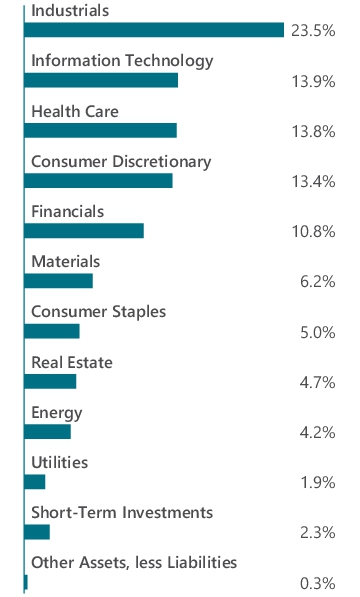
Top ten holdings and portfolio breakdown are shown as a percentage of net assets of the Fund.
| BJ's Wholesale Club Holdings, Inc. | 2.3% |
| Texas Roadhouse, Inc. | 2.2% |
| CyberArk Software, Ltd. (Israel) | 2.0% |
| Piper Sandler Cos. | 1.9% |
| Entegris, Inc. | 1.8% |
| Manhattan Associates, Inc. | 1.8% |
| Comfort Systems USA, Inc. | 1.7% |
| Cavco Industries, Inc. | 1.7% |
| Voya Financial, Inc. | 1.7% |
| Element Solutions, Inc. | 1.6% |
| Top Ten as a Group | 18.7% |
Availability of Additional Information
You can find additional information about the Fund such as the prospectus, financial information, fund holdings and proxy voting information at https://wealth.amg.com/resources/order-literature. You can also request this information by contacting us at 800.548.4539.
Householding
In order to reduce expenses, we will deliver a single copy of prospectuses, proxies, financial reports and other communication to shareholders with the same residential address, provided they have the same last name or we reasonably believe them to be members of the same family. Unless we are notified otherwise, we will continue to send recipients only one copy of these materials for as long as they remain a shareholder of the Fund. If you would like to receive individual mailings, please call 800.548.4539 and we will begin sending you separate copies of these materials within 30 days after receiving your request.
For additional information, please navigate to the additional material at https://wealth.amg.com/resources/order-literature.
AMG GW&K Small/Mid Cap Core Fund
Class I/GWGIX
SEMI-ANNUAL SHAREHOLDER REPORT | June 30, 2024
This semi-annual shareholder report contains important information about AMG GW&K Small/Mid Cap Core Fund (the “Fund”) for the period of January 1, 2024 to June 30, 2024. You can find additional information about the Fund at https://wealth.amg.com/resources/order-literature. You can also request this information by contacting us at 800-548-4539.
Fund Expenses
What were the Fund costs for the last six months?
(Based on a hypothetical $10,000 investment)
| Fund (Class) | Costs of a $10,000 investment | Costs paid as a percentage of a $10,000 investment |
AMG GW&K Small/Mid Cap Core Fund
(Class I/GWGIX) | $44 | 0.87% |
Key Fund Statistics (as of June 30, 2024)
| Fund net assets | $707,862,215% |
| Total number of portfolio holdings | $88% |
| Net advisory fees paid | $2,151,504% |
| Portfolio turnover rate as of the end of the reporting period | $9% |
Graphical Representation of Holdings (as of June 30, 2024)
Top ten holdings and portfolio breakdown are shown as a percentage of net assets of the Fund.
| BJ's Wholesale Club Holdings, Inc. | 2.3% |
| Texas Roadhouse, Inc. | 2.2% |
| CyberArk Software, Ltd. (Israel) | 2.0% |
| Piper Sandler Cos. | 1.9% |
| Entegris, Inc. | 1.8% |
| Manhattan Associates, Inc. | 1.8% |
| Comfort Systems USA, Inc. | 1.7% |
| Cavco Industries, Inc. | 1.7% |
| Voya Financial, Inc. | 1.7% |
| Element Solutions, Inc. | 1.6% |
| Top Ten as a Group | 18.7% |
Availability of Additional Information
You can find additional information about the Fund such as the prospectus, financial information, fund holdings and proxy voting information at https://wealth.amg.com/resources/order-literature. You can also request this information by contacting us at 800.548.4539.
Householding
In order to reduce expenses, we will deliver a single copy of prospectuses, proxies, financial reports and other communication to shareholders with the same residential address, provided they have the same last name or we reasonably believe them to be members of the same family. Unless we are notified otherwise, we will continue to send recipients only one copy of these materials for as long as they remain a shareholder of the Fund. If you would like to receive individual mailings, please call 800.548.4539 and we will begin sending you separate copies of these materials within 30 days after receiving your request.
For additional information, please navigate to the additional material at https://wealth.amg.com/resources/order-literature.
AMG GW&K Small/Mid Cap Core Fund
Class Z/GWGZX
SEMI-ANNUAL SHAREHOLDER REPORT | June 30, 2024
This semi-annual shareholder report contains important information about AMG GW&K Small/Mid Cap Core Fund (the “Fund”) for the period of January 1, 2024 to June 30, 2024. You can find additional information about the Fund at https://wealth.amg.com/resources/order-literature. You can also request this information by contacting us at 800-548-4539.
Fund Expenses
What were the Fund costs for the last six months?
(Based on a hypothetical $10,000 investment)
| Fund (Class) | Costs of a $10,000 investment | Costs paid as a percentage of a $10,000 investment |
AMG GW&K Small/Mid Cap Core Fund
(Class Z/GWGZX) | $41 | 0.82% |
Key Fund Statistics (as of June 30, 2024)
| Fund net assets | $707,862,215% |
| Total number of portfolio holdings | $88% |
| Net advisory fees paid | $2,151,504% |
| Portfolio turnover rate as of the end of the reporting period | $9% |
Graphical Representation of Holdings (as of June 30, 2024)
Top ten holdings and portfolio breakdown are shown as a percentage of net assets of the Fund.
| BJ's Wholesale Club Holdings, Inc. | 2.3% |
| Texas Roadhouse, Inc. | 2.2% |
| CyberArk Software, Ltd. (Israel) | 2.0% |
| Piper Sandler Cos. | 1.9% |
| Entegris, Inc. | 1.8% |
| Manhattan Associates, Inc. | 1.8% |
| Comfort Systems USA, Inc. | 1.7% |
| Cavco Industries, Inc. | 1.7% |
| Voya Financial, Inc. | 1.7% |
| Element Solutions, Inc. | 1.6% |
| Top Ten as a Group | 18.7% |
Availability of Additional Information
You can find additional information about the Fund such as the prospectus, financial information, fund holdings and proxy voting information at https://wealth.amg.com/resources/order-literature. You can also request this information by contacting us at 800.548.4539.
Householding
In order to reduce expenses, we will deliver a single copy of prospectuses, proxies, financial reports and other communication to shareholders with the same residential address, provided they have the same last name or we reasonably believe them to be members of the same family. Unless we are notified otherwise, we will continue to send recipients only one copy of these materials for as long as they remain a shareholder of the Fund. If you would like to receive individual mailings, please call 800.548.4539 and we will begin sending you separate copies of these materials within 30 days after receiving your request.
For additional information, please navigate to the additional material at https://wealth.amg.com/resources/order-literature.
AMG Renaissance Large Cap Growth Fund
Class N/MRLTX
SEMI-ANNUAL SHAREHOLDER REPORT | June 30, 2024
This semi-annual shareholder report contains important information about AMG Renaissance Large Cap Growth Fund (the “Fund”) for the period of January 1, 2024 to June 30, 2024. You can find additional information about the Fund at https://wealth.amg.com/resources/order-literature. You can also request this information by contacting us at 800-548-4539.
Fund Expenses
What were the Fund costs for the last six months?
(Based on a hypothetical $10,000 investment)
| Fund (Class) | Costs of a $10,000 investment | Costs paid as a percentage of a $10,000 investment |
AMG Renaissance Large Cap Growth Fund
(Class N/MRLTX) | $52 | 1.00% |
Key Fund Statistics (as of June 30, 2024)
| Fund net assets | $136,520,735% |
| Total number of portfolio holdings | $57% |
| Net advisory fees paid | $258,298% |
| Portfolio turnover rate as of the end of the reporting period | $21% |
Graphical Representation of Holdings (as of June 30, 2024)
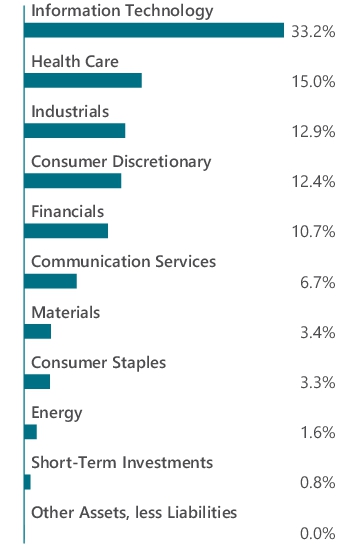
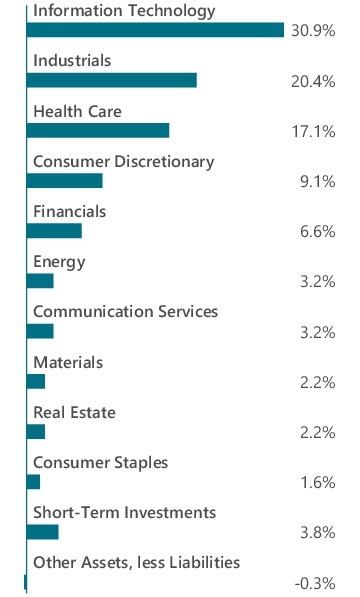
Top ten holdings and portfolio breakdown are shown as a percentage of net assets of the Fund.
| Apple, Inc. | 3.3% |
| Microsoft Corp. | 3.2% |
| Amazon.com, Inc. | 2.7% |
| Broadcom, Inc. | 2.5% |
| Alphabet, Inc., Class A | 2.5% |
| KLA Corp. | 2.3% |
| Applied Materials, Inc. | 2.3% |
| Meta Platforms, Inc., Class A | 2.3% |
| Lam Research Corp. | 2.2% |
| Motorola Solutions, Inc. | 2.0% |
| Top Ten as a Group | 25.3% |
Availability of Additional Information
You can find additional information about the Fund such as the prospectus, financial information, fund holdings and proxy voting information at https://wealth.amg.com/resources/order-literature. You can also request this information by contacting us at 800.548.4539.
Householding
In order to reduce expenses, we will deliver a single copy of prospectuses, proxies, financial reports and other communication to shareholders with the same residential address, provided they have the same last name or we reasonably believe them to be members of the same family. Unless we are notified otherwise, we will continue to send recipients only one copy of these materials for as long as they remain a shareholder of the Fund. If you would like to receive individual mailings, please call 800.548.4539 and we will begin sending you separate copies of these materials within 30 days after receiving your request.
For additional information, please navigate to the additional material at https://wealth.amg.com/resources/order-literature.
AMG Renaissance Large Cap Growth Fund
Class I/MRLSX
SEMI-ANNUAL SHAREHOLDER REPORT | June 30, 2024
This semi-annual shareholder report contains important information about AMG Renaissance Large Cap Growth Fund (the “Fund”) for the period of January 1, 2024 to June 30, 2024. You can find additional information about the Fund at https://wealth.amg.com/resources/order-literature. You can also request this information by contacting us at 800-548-4539.
Fund Expenses
What were the Fund costs for the last six months?
(Based on a hypothetical $10,000 investment)
| Fund (Class) | Costs of a $10,000 investment | Costs paid as a percentage of a $10,000 investment |
AMG Renaissance Large Cap Growth Fund
(Class I/MRLSX) | $38 | 0.73% |
Key Fund Statistics (as of June 30, 2024)
| Fund net assets | $136,520,735% |
| Total number of portfolio holdings | $57% |
| Net advisory fees paid | $258,298% |
| Portfolio turnover rate as of the end of the reporting period | $21% |
Graphical Representation of Holdings (as of June 30, 2024)
Top ten holdings and portfolio breakdown are shown as a percentage of net assets of the Fund.
| Apple, Inc. | 3.3% |
| Microsoft Corp. | 3.2% |
| Amazon.com, Inc. | 2.7% |
| Broadcom, Inc. | 2.5% |
| Alphabet, Inc., Class A | 2.5% |
| KLA Corp. | 2.3% |
| Applied Materials, Inc. | 2.3% |
| Meta Platforms, Inc., Class A | 2.3% |
| Lam Research Corp. | 2.2% |
| Motorola Solutions, Inc. | 2.0% |
| Top Ten as a Group | 25.3% |
Availability of Additional Information
You can find additional information about the Fund such as the prospectus, financial information, fund holdings and proxy voting information at https://wealth.amg.com/resources/order-literature. You can also request this information by contacting us at 800.548.4539.
Householding
In order to reduce expenses, we will deliver a single copy of prospectuses, proxies, financial reports and other communication to shareholders with the same residential address, provided they have the same last name or we reasonably believe them to be members of the same family. Unless we are notified otherwise, we will continue to send recipients only one copy of these materials for as long as they remain a shareholder of the Fund. If you would like to receive individual mailings, please call 800.548.4539 and we will begin sending you separate copies of these materials within 30 days after receiving your request.
For additional information, please navigate to the additional material at https://wealth.amg.com/resources/order-literature.
AMG Renaissance Large Cap Growth Fund
Class Z/MRLIX
SEMI-ANNUAL SHAREHOLDER REPORT | June 30, 2024
This semi-annual shareholder report contains important information about AMG Renaissance Large Cap Growth Fund (the “Fund”) for the period of January 1, 2024 to June 30, 2024. You can find additional information about the Fund at https://wealth.amg.com/resources/order-literature. You can also request this information by contacting us at 800-548-4539.
Fund Expenses
What were the Fund costs for the last six months?
(Based on a hypothetical $10,000 investment)
| Fund (Class) | Costs of a $10,000 investment | Costs paid as a percentage of a $10,000 investment |
AMG Renaissance Large Cap Growth Fund
(Class Z/MRLIX) | $35 | 0.66% |
Key Fund Statistics (as of June 30, 2024)
| Fund net assets | $136,520,735% |
| Total number of portfolio holdings | $57% |
| Net advisory fees paid | $258,298% |
| Portfolio turnover rate as of the end of the reporting period | $21% |
Graphical Representation of Holdings (as of June 30, 2024)
Top ten holdings and portfolio breakdown are shown as a percentage of net assets of the Fund.
| Apple, Inc. | 3.3% |
| Microsoft Corp. | 3.2% |
| Amazon.com, Inc. | 2.7% |
| Broadcom, Inc. | 2.5% |
| Alphabet, Inc., Class A | 2.5% |
| KLA Corp. | 2.3% |
| Applied Materials, Inc. | 2.3% |
| Meta Platforms, Inc., Class A | 2.3% |
| Lam Research Corp. | 2.2% |
| Motorola Solutions, Inc. | 2.0% |
| Top Ten as a Group | 25.3% |
Availability of Additional Information
You can find additional information about the Fund such as the prospectus, financial information, fund holdings and proxy voting information at https://wealth.amg.com/resources/order-literature. You can also request this information by contacting us at 800.548.4539.
Householding
In order to reduce expenses, we will deliver a single copy of prospectuses, proxies, financial reports and other communication to shareholders with the same residential address, provided they have the same last name or we reasonably believe them to be members of the same family. Unless we are notified otherwise, we will continue to send recipients only one copy of these materials for as long as they remain a shareholder of the Fund. If you would like to receive individual mailings, please call 800.548.4539 and we will begin sending you separate copies of these materials within 30 days after receiving your request.
For additional information, please navigate to the additional material at https://wealth.amg.com/resources/order-literature.
AMG TimesSquare Emerging Markets Small Cap Fund
Class N/TQENX
SEMI-ANNUAL SHAREHOLDER REPORT | June 30, 2024
This semi-annual shareholder report contains important information about AMG TimesSquare Emerging Markets Small Cap Fund (the “Fund”) for the period of January 1, 2024 to June 30, 2024. You can find additional information about the Fund at https://wealth.amg.com/resources/order-literature. You can also request this information by contacting us at 800-548-4539.
Fund Expenses
What were the Fund costs for the last six months?
(Based on a hypothetical $10,000 investment)
| Fund (Class) | Costs of a $10,000 investment | Costs paid as a percentage of a $10,000 investment |
AMG TimesSquare Emerging Markets Small Cap Fund
(Class N/TQENX) | $83 | 1.65% |
Key Fund Statistics (as of June 30, 2024)
| Fund net assets | $1,914,529% |
| Total number of portfolio holdings | $85% |
| Net advisory fees paid | $0% |
| Portfolio turnover rate as of the end of the reporting period | $40% |
Graphical Representation of Holdings (as of June 30, 2024)
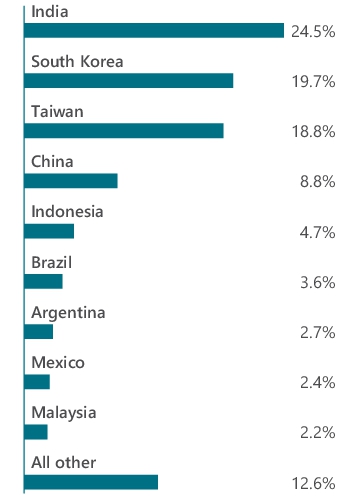
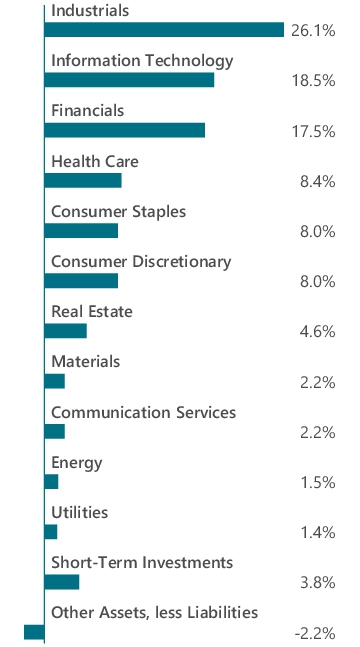
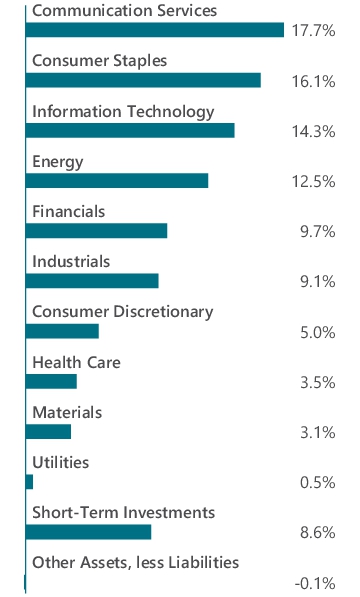
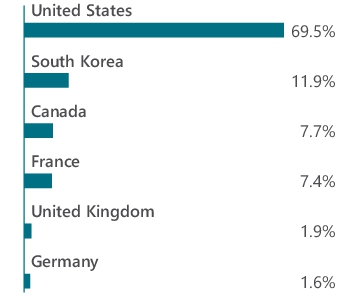
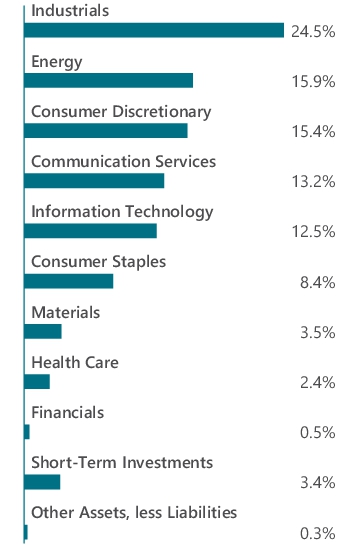
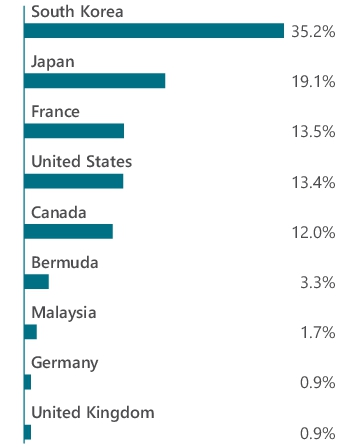
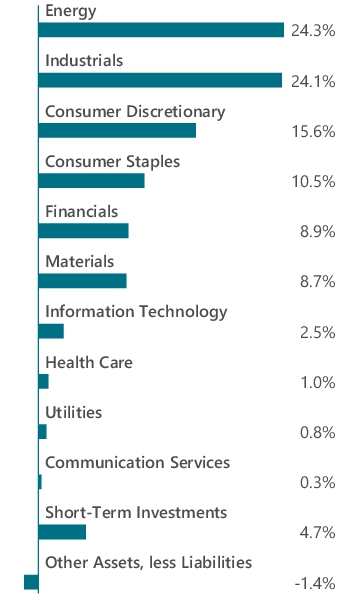
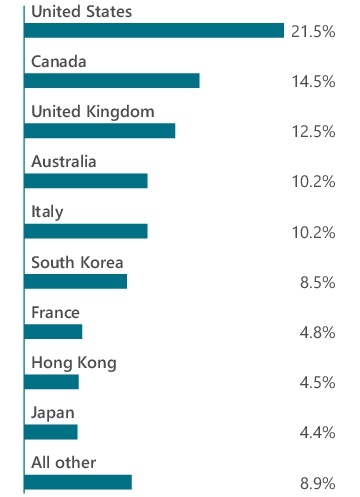
Top ten holdings and portfolio breakdown are shown as a percentage of net assets of the Fund and country allocation is shown as a percentage of total long-term investments of the Fund.
| KINX, Inc. (South Korea) | 2.7% |
| Despegar.com Corp. (Argentina) | 2.7% |
| Raymond, Ltd. (India) | 2.4% |
| WinWay Technology Co., Ltd. (Taiwan) | 2.2% |
| Bora Pharmaceuticals Co., Ltd. (Taiwan) | 2.1% |
| M31 Technology Corp. (Taiwan) | 2.0% |
| Accton Technology Corp. (Taiwan) | 1.9% |
| LIG Nex1 Co., Ltd. (South Korea) | 1.9% |
| ISC Co., Ltd. (South Korea) | 1.8% |
| Arcos Dorados Holdings, Inc., Class A (Uruguay) | 1.8% |
| Top Ten as a Group | 21.5% |
Availability of Additional Information
You can find additional information about the Fund such as the prospectus, financial information, fund holdings and proxy voting information at https://wealth.amg.com/resources/order-literature. You can also request this information by contacting us at 800.548.4539.
Householding
In order to reduce expenses, we will deliver a single copy of prospectuses, proxies, financial reports and other communication to shareholders with the same residential address, provided they have the same last name or we reasonably believe them to be members of the same family. Unless we are notified otherwise, we will continue to send recipients only one copy of these materials for as long as they remain a shareholder of the Fund. If you would like to receive individual mailings, please call 800.548.4539 and we will begin sending you separate copies of these materials within 30 days after receiving your request.
For additional information, please navigate to the additional material at https://wealth.amg.com/resources/order-literature.
AMG TimesSquare Emerging Markets Small Cap Fund
Class I/TQEIX
SEMI-ANNUAL SHAREHOLDER REPORT | June 30, 2024
This semi-annual shareholder report contains important information about AMG TimesSquare Emerging Markets Small Cap Fund (the “Fund”) for the period of January 1, 2024 to June 30, 2024. You can find additional information about the Fund at https://wealth.amg.com/resources/order-literature. You can also request this information by contacting us at 800-548-4539.
Fund Expenses
What were the Fund costs for the last six months?
(Based on a hypothetical $10,000 investment)
| Fund (Class) | Costs of a $10,000 investment | Costs paid as a percentage of a $10,000 investment |
AMG TimesSquare Emerging Markets Small Cap Fund
(Class I/TQEIX) | $63 | 1.25% |
Key Fund Statistics (as of June 30, 2024)
| Fund net assets | $1,914,529% |
| Total number of portfolio holdings | $85% |
| Net advisory fees paid | $0% |
| Portfolio turnover rate as of the end of the reporting period | $40% |
Graphical Representation of Holdings (as of June 30, 2024)
Top ten holdings and portfolio breakdown are shown as a percentage of net assets of the Fund and country allocation is shown as a percentage of total long-term investments of the Fund.
| KINX, Inc. (South Korea) | 2.7% |
| Despegar.com Corp. (Argentina) | 2.7% |
| Raymond, Ltd. (India) | 2.4% |
| WinWay Technology Co., Ltd. (Taiwan) | 2.2% |
| Bora Pharmaceuticals Co., Ltd. (Taiwan) | 2.1% |
| M31 Technology Corp. (Taiwan) | 2.0% |
| Accton Technology Corp. (Taiwan) | 1.9% |
| LIG Nex1 Co., Ltd. (South Korea) | 1.9% |
| ISC Co., Ltd. (South Korea) | 1.8% |
| Arcos Dorados Holdings, Inc., Class A (Uruguay) | 1.8% |
| Top Ten as a Group | 21.5% |
Availability of Additional Information
You can find additional information about the Fund such as the prospectus, financial information, fund holdings and proxy voting information at https://wealth.amg.com/resources/order-literature. You can also request this information by contacting us at 800.548.4539.
Householding
In order to reduce expenses, we will deliver a single copy of prospectuses, proxies, financial reports and other communication to shareholders with the same residential address, provided they have the same last name or we reasonably believe them to be members of the same family. Unless we are notified otherwise, we will continue to send recipients only one copy of these materials for as long as they remain a shareholder of the Fund. If you would like to receive individual mailings, please call 800.548.4539 and we will begin sending you separate copies of these materials within 30 days after receiving your request.
For additional information, please navigate to the additional material at https://wealth.amg.com/resources/order-literature.
AMG TimesSquare Emerging Markets Small Cap Fund
Class Z/TQEZX
SEMI-ANNUAL SHAREHOLDER REPORT | June 30, 2024
This semi-annual shareholder report contains important information about AMG TimesSquare Emerging Markets Small Cap Fund (the “Fund”) for the period of January 1, 2024 to June 30, 2024. You can find additional information about the Fund at https://wealth.amg.com/resources/order-literature. You can also request this information by contacting us at 800-548-4539.
Fund Expenses
What were the Fund costs for the last six months?
(Based on a hypothetical $10,000 investment)
| Fund (Class) | Costs of a $10,000 investment | Costs paid as a percentage of a $10,000 investment |
AMG TimesSquare Emerging Markets Small Cap Fund
(Class Z/TQEZX) | $63 | 1.25% |
Key Fund Statistics (as of June 30, 2024)
| Fund net assets | $1,914,529% |
| Total number of portfolio holdings | $85% |
| Net advisory fees paid | $0% |
| Portfolio turnover rate as of the end of the reporting period | $40% |
Graphical Representation of Holdings (as of June 30, 2024)
Top ten holdings and portfolio breakdown are shown as a percentage of net assets of the Fund and country allocation is shown as a percentage of total long-term investments of the Fund.
| KINX, Inc. (South Korea) | 2.7% |
| Despegar.com Corp. (Argentina) | 2.7% |
| Raymond, Ltd. (India) | 2.4% |
| WinWay Technology Co., Ltd. (Taiwan) | 2.2% |
| Bora Pharmaceuticals Co., Ltd. (Taiwan) | 2.1% |
| M31 Technology Corp. (Taiwan) | 2.0% |
| Accton Technology Corp. (Taiwan) | 1.9% |
| LIG Nex1 Co., Ltd. (South Korea) | 1.9% |
| ISC Co., Ltd. (South Korea) | 1.8% |
| Arcos Dorados Holdings, Inc., Class A (Uruguay) | 1.8% |
| Top Ten as a Group | 21.5% |
Availability of Additional Information
You can find additional information about the Fund such as the prospectus, financial information, fund holdings and proxy voting information at https://wealth.amg.com/resources/order-literature. You can also request this information by contacting us at 800.548.4539.
Householding
In order to reduce expenses, we will deliver a single copy of prospectuses, proxies, financial reports and other communication to shareholders with the same residential address, provided they have the same last name or we reasonably believe them to be members of the same family. Unless we are notified otherwise, we will continue to send recipients only one copy of these materials for as long as they remain a shareholder of the Fund. If you would like to receive individual mailings, please call 800.548.4539 and we will begin sending you separate copies of these materials within 30 days after receiving your request.
For additional information, please navigate to the additional material at https://wealth.amg.com/resources/order-literature.
AMG TimesSquare Global Small Cap Fund
Class N/TSYNX
SEMI-ANNUAL SHAREHOLDER REPORT | June 30, 2024
This semi-annual shareholder report contains important information about AMG TimesSquare Global Small Cap Fund (the “Fund”) for the period of January 1, 2024 to June 30, 2024. You can find additional information about the Fund at https://wealth.amg.com/resources/order-literature. You can also request this information by contacting us at 800-548-4539.
Fund Expenses
What were the Fund costs for the last six months?
(Based on a hypothetical $10,000 investment)
| Fund (Class) | Costs of a $10,000 investment | Costs paid as a percentage of a $10,000 investment |
AMG TimesSquare Global Small Cap Fund
(Class N/TSYNX) | $62 | 1.25% |
Key Fund Statistics (as of June 30, 2024)
| Fund net assets | $1,795,557% |
| Total number of portfolio holdings | $86% |
| Net advisory fees paid | $0% |
| Portfolio turnover rate as of the end of the reporting period | $38% |
Graphical Representation of Holdings (as of June 30, 2024)
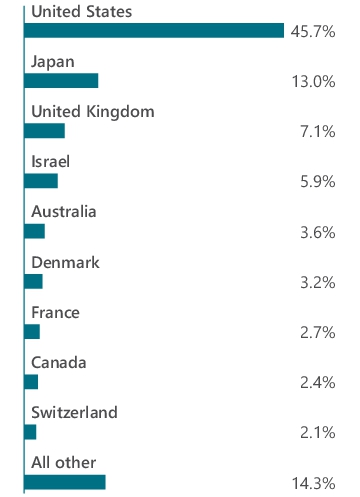
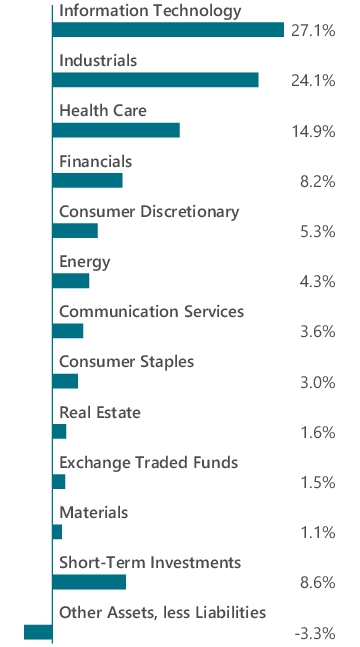
Top ten holdings and portfolio breakdown are shown as a percentage of net assets of the Fund and country allocation is shown as a percentage of total long-term investments of the Fund.
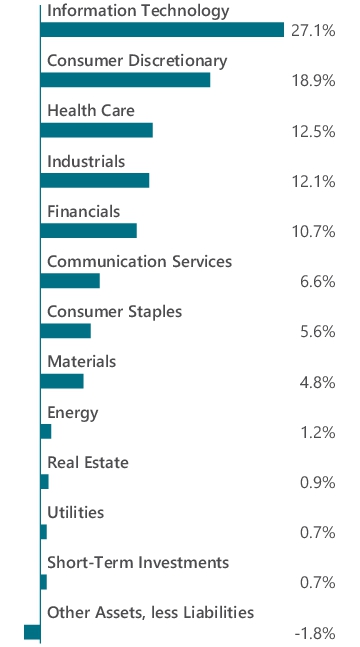
| Webster Financial Corp. (United States) | 2.3% |
| Casella Waste Systems, Inc., Class A (United States) | 2.3% |
| CyberArk Software, Ltd. (Israel) | 2.3% |
| Performance Food Group Co. (United States) | 2.3% |
| Chemed Corp. (United States) | 2.3% |
| National Storage Affiliates Trust, REIT (United States) | 2.2% |
| Regal Rexnord Corp. (United States) | 2.2% |
| Universal Display Corp. (United States) | 2.1% |
| JFrog, Ltd. (Israel) | 2.0% |
| Synaptics, Inc. (United States) | 2.0% |
| Top Ten as a Group | 22.0% |
Availability of Additional Information
You can find additional information about the Fund such as the prospectus, financial information, fund holdings and proxy voting information at https://wealth.amg.com/resources/order-literature. You can also request this information by contacting us at 800.548.4539.
Householding
In order to reduce expenses, we will deliver a single copy of prospectuses, proxies, financial reports and other communication to shareholders with the same residential address, provided they have the same last name or we reasonably believe them to be members of the same family. Unless we are notified otherwise, we will continue to send recipients only one copy of these materials for as long as they remain a shareholder of the Fund. If you would like to receive individual mailings, please call 800.548.4539 and we will begin sending you separate copies of these materials within 30 days after receiving your request.
For additional information, please navigate to the additional material at https://wealth.amg.com/resources/order-literature.
AMG TimesSquare Global Small Cap Fund
Class I/TSYIX
SEMI-ANNUAL SHAREHOLDER REPORT | June 30, 2024
This semi-annual shareholder report contains important information about AMG TimesSquare Global Small Cap Fund (the “Fund”) for the period of January 1, 2024 to June 30, 2024. You can find additional information about the Fund at https://wealth.amg.com/resources/order-literature. You can also request this information by contacting us at 800-548-4539.
Fund Expenses
What were the Fund costs for the last six months?
(Based on a hypothetical $10,000 investment)
| Fund (Class) | Costs of a $10,000 investment | Costs paid as a percentage of a $10,000 investment |
AMG TimesSquare Global Small Cap Fund
(Class I/TSYIX) | $50 | 1.00% |
Key Fund Statistics (as of June 30, 2024)
| Fund net assets | $1,795,557% |
| Total number of portfolio holdings | $86% |
| Net advisory fees paid | $0% |
| Portfolio turnover rate as of the end of the reporting period | $38% |
Graphical Representation of Holdings (as of June 30, 2024)
Top ten holdings and portfolio breakdown are shown as a percentage of net assets of the Fund and country allocation is shown as a percentage of total long-term investments of the Fund.
| Webster Financial Corp. (United States) | 2.3% |
| Casella Waste Systems, Inc., Class A (United States) | 2.3% |
| CyberArk Software, Ltd. (Israel) | 2.3% |
| Performance Food Group Co. (United States) | 2.3% |
| Chemed Corp. (United States) | 2.3% |
| National Storage Affiliates Trust, REIT (United States) | 2.2% |
| Regal Rexnord Corp. (United States) | 2.2% |
| Universal Display Corp. (United States) | 2.1% |
| JFrog, Ltd. (Israel) | 2.0% |
| Synaptics, Inc. (United States) | 2.0% |
| Top Ten as a Group | 22.0% |
Availability of Additional Information
You can find additional information about the Fund such as the prospectus, financial information, fund holdings and proxy voting information at https://wealth.amg.com/resources/order-literature. You can also request this information by contacting us at 800.548.4539.
Householding
In order to reduce expenses, we will deliver a single copy of prospectuses, proxies, financial reports and other communication to shareholders with the same residential address, provided they have the same last name or we reasonably believe them to be members of the same family. Unless we are notified otherwise, we will continue to send recipients only one copy of these materials for as long as they remain a shareholder of the Fund. If you would like to receive individual mailings, please call 800.548.4539 and we will begin sending you separate copies of these materials within 30 days after receiving your request.
For additional information, please navigate to the additional material at https://wealth.amg.com/resources/order-literature.
AMG TimesSquare Global Small Cap Fund
Class Z/TSYZX
SEMI-ANNUAL SHAREHOLDER REPORT | June 30, 2024
This semi-annual shareholder report contains important information about AMG TimesSquare Global Small Cap Fund (the “Fund”) for the period of January 1, 2024 to June 30, 2024. You can find additional information about the Fund at https://wealth.amg.com/resources/order-literature. You can also request this information by contacting us at 800-548-4539.
Fund Expenses
What were the Fund costs for the last six months?
(Based on a hypothetical $10,000 investment)
| Fund (Class) | Costs of a $10,000 investment | Costs paid as a percentage of a $10,000 investment |
AMG TimesSquare Global Small Cap Fund
(Class Z/TSYZX) | $50 | 1.00% |
Key Fund Statistics (as of June 30, 2024)
| Fund net assets | $1,795,557% |
| Total number of portfolio holdings | $86% |
| Net advisory fees paid | $0% |
| Portfolio turnover rate as of the end of the reporting period | $38% |
Graphical Representation of Holdings (as of June 30, 2024)
Top ten holdings and portfolio breakdown are shown as a percentage of net assets of the Fund and country allocation is shown as a percentage of total long-term investments of the Fund.
| Webster Financial Corp. (United States) | 2.3% |
| Casella Waste Systems, Inc., Class A (United States) | 2.3% |
| CyberArk Software, Ltd. (Israel) | 2.3% |
| Performance Food Group Co. (United States) | 2.3% |
| Chemed Corp. (United States) | 2.3% |
| National Storage Affiliates Trust, REIT (United States) | 2.2% |
| Regal Rexnord Corp. (United States) | 2.2% |
| Universal Display Corp. (United States) | 2.1% |
| JFrog, Ltd. (Israel) | 2.0% |
| Synaptics, Inc. (United States) | 2.0% |
| Top Ten as a Group | 22.0% |
Availability of Additional Information
You can find additional information about the Fund such as the prospectus, financial information, fund holdings and proxy voting information at https://wealth.amg.com/resources/order-literature. You can also request this information by contacting us at 800.548.4539.
Householding
In order to reduce expenses, we will deliver a single copy of prospectuses, proxies, financial reports and other communication to shareholders with the same residential address, provided they have the same last name or we reasonably believe them to be members of the same family. Unless we are notified otherwise, we will continue to send recipients only one copy of these materials for as long as they remain a shareholder of the Fund. If you would like to receive individual mailings, please call 800.548.4539 and we will begin sending you separate copies of these materials within 30 days after receiving your request.
For additional information, please navigate to the additional material at https://wealth.amg.com/resources/order-literature.
AMG TimesSquare International Small Cap Fund
Class N/TCMPX
SEMI-ANNUAL SHAREHOLDER REPORT | June 30, 2024
This semi-annual shareholder report contains important information about AMG TimesSquare International Small Cap Fund (the “Fund”) for the period of January 1, 2024 to June 30, 2024. You can find additional information about the Fund at https://wealth.amg.com/resources/order-literature. You can also request this information by contacting us at 800-548-4539.
Fund Expenses
What were the Fund costs for the last six months?
(Based on a hypothetical $10,000 investment)
| Fund (Class) | Costs of a $10,000 investment | Costs paid as a percentage of a $10,000 investment |
AMG TimesSquare International Small Cap Fund
(Class N/TCMPX) | $67 | 1.31% |
Key Fund Statistics (as of June 30, 2024)
| Fund net assets | $144,560,380% |
| Total number of portfolio holdings | $89% |
| Net advisory fees paid | $576,117% |
| Portfolio turnover rate as of the end of the reporting period | $37% |
Graphical Representation of Holdings (as of June 30, 2024)
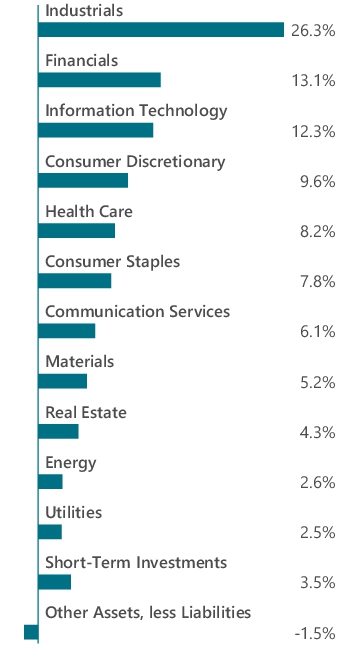
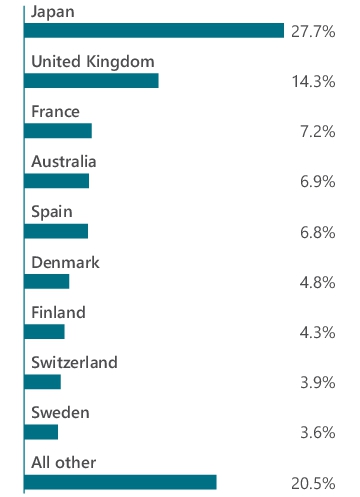
Top ten holdings and portfolio breakdown are shown as a percentage of net assets of the Fund and country allocation is shown as a percentage of total long-term investments of the Fund.
| Viscofan, S.A. (Spain) | 2.5% |
| Rakuten Bank, Ltd. (Japan) | 2.5% |
| Nippon Gas Co., Ltd. (Japan) | 2.4% |
| Siegfried Holding AG (Switzerland) | 2.4% |
| Integral Corp. (Japan) | 2.2% |
| Ringkjoebing Landbobank A/S (Denmark) | 2.2% |
| Steadfast Group, Ltd. (Australia) | 2.1% |
| CyberArk Software, Ltd. (Israel) | 2.0% |
| Tate & Lyle PLC (United Kingdom) | 2.0% |
| Rohto Pharmaceutical Co., Ltd. (Japan) | 2.0% |
| Top Ten as a Group | 22.3% |
Availability of Additional Information
You can find additional information about the Fund such as the prospectus, financial information, fund holdings and proxy voting information at https://wealth.amg.com/resources/order-literature. You can also request this information by contacting us at 800.548.4539.
Householding
In order to reduce expenses, we will deliver a single copy of prospectuses, proxies, financial reports and other communication to shareholders with the same residential address, provided they have the same last name or we reasonably believe them to be members of the same family. Unless we are notified otherwise, we will continue to send recipients only one copy of these materials for as long as they remain a shareholder of the Fund. If you would like to receive individual mailings, please call 800.548.4539 and we will begin sending you separate copies of these materials within 30 days after receiving your request.
For additional information, please navigate to the additional material at https://wealth.amg.com/resources/order-literature.
AMG TimesSquare International Small Cap Fund
Class I/TQTIX
SEMI-ANNUAL SHAREHOLDER REPORT | June 30, 2024
This semi-annual shareholder report contains important information about AMG TimesSquare International Small Cap Fund (the “Fund”) for the period of January 1, 2024 to June 30, 2024. You can find additional information about the Fund at https://wealth.amg.com/resources/order-literature. You can also request this information by contacting us at 800-548-4539.
Fund Expenses
What were the Fund costs for the last six months?
(Based on a hypothetical $10,000 investment)
| Fund (Class) | Costs of a $10,000 investment | Costs paid as a percentage of a $10,000 investment |
AMG TimesSquare International Small Cap Fund
(Class I/TQTIX) | $57 | 1.12% |
Key Fund Statistics (as of June 30, 2024)
| Fund net assets | $144,560,380% |
| Total number of portfolio holdings | $89% |
| Net advisory fees paid | $576,117% |
| Portfolio turnover rate as of the end of the reporting period | $37% |
Graphical Representation of Holdings (as of June 30, 2024)
Top ten holdings and portfolio breakdown are shown as a percentage of net assets of the Fund and country allocation is shown as a percentage of total long-term investments of the Fund.
| Viscofan, S.A. (Spain) | 2.5% |
| Rakuten Bank, Ltd. (Japan) | 2.5% |
| Nippon Gas Co., Ltd. (Japan) | 2.4% |
| Siegfried Holding AG (Switzerland) | 2.4% |
| Integral Corp. (Japan) | 2.2% |
| Ringkjoebing Landbobank A/S (Denmark) | 2.2% |
| Steadfast Group, Ltd. (Australia) | 2.1% |
| CyberArk Software, Ltd. (Israel) | 2.0% |
| Tate & Lyle PLC (United Kingdom) | 2.0% |
| Rohto Pharmaceutical Co., Ltd. (Japan) | 2.0% |
| Top Ten as a Group | 22.3% |
Availability of Additional Information
You can find additional information about the Fund such as the prospectus, financial information, fund holdings and proxy voting information at https://wealth.amg.com/resources/order-literature. You can also request this information by contacting us at 800.548.4539.
Householding
In order to reduce expenses, we will deliver a single copy of prospectuses, proxies, financial reports and other communication to shareholders with the same residential address, provided they have the same last name or we reasonably believe them to be members of the same family. Unless we are notified otherwise, we will continue to send recipients only one copy of these materials for as long as they remain a shareholder of the Fund. If you would like to receive individual mailings, please call 800.548.4539 and we will begin sending you separate copies of these materials within 30 days after receiving your request.
For additional information, please navigate to the additional material at https://wealth.amg.com/resources/order-literature.
AMG TimesSquare International Small Cap Fund
Class Z/TCMIX
SEMI-ANNUAL SHAREHOLDER REPORT | June 30, 2024
This semi-annual shareholder report contains important information about AMG TimesSquare International Small Cap Fund (the “Fund”) for the period of January 1, 2024 to June 30, 2024. You can find additional information about the Fund at https://wealth.amg.com/resources/order-literature. You can also request this information by contacting us at 800-548-4539.
Fund Expenses
What were the Fund costs for the last six months?
(Based on a hypothetical $10,000 investment)
| Fund (Class) | Costs of a $10,000 investment | Costs paid as a percentage of a $10,000 investment |
AMG TimesSquare International Small Cap Fund
(Class Z/TCMIX) | $54 | 1.06% |
Key Fund Statistics (as of June 30, 2024)
| Fund net assets | $144,560,380% |
| Total number of portfolio holdings | $89% |
| Net advisory fees paid | $576,117% |
| Portfolio turnover rate as of the end of the reporting period | $37% |
Graphical Representation of Holdings (as of June 30, 2024)
Top ten holdings and portfolio breakdown are shown as a percentage of net assets of the Fund and country allocation is shown as a percentage of total long-term investments of the Fund.
| Viscofan, S.A. (Spain) | 2.5% |
| Rakuten Bank, Ltd. (Japan) | 2.5% |
| Nippon Gas Co., Ltd. (Japan) | 2.4% |
| Siegfried Holding AG (Switzerland) | 2.4% |
| Integral Corp. (Japan) | 2.2% |
| Ringkjoebing Landbobank A/S (Denmark) | 2.2% |
| Steadfast Group, Ltd. (Australia) | 2.1% |
| CyberArk Software, Ltd. (Israel) | 2.0% |
| Tate & Lyle PLC (United Kingdom) | 2.0% |
| Rohto Pharmaceutical Co., Ltd. (Japan) | 2.0% |
| Top Ten as a Group | 22.3% |
Availability of Additional Information
You can find additional information about the Fund such as the prospectus, financial information, fund holdings and proxy voting information at https://wealth.amg.com/resources/order-literature. You can also request this information by contacting us at 800.548.4539.
Householding
In order to reduce expenses, we will deliver a single copy of prospectuses, proxies, financial reports and other communication to shareholders with the same residential address, provided they have the same last name or we reasonably believe them to be members of the same family. Unless we are notified otherwise, we will continue to send recipients only one copy of these materials for as long as they remain a shareholder of the Fund. If you would like to receive individual mailings, please call 800.548.4539 and we will begin sending you separate copies of these materials within 30 days after receiving your request.
For additional information, please navigate to the additional material at https://wealth.amg.com/resources/order-literature.
AMG TimesSquare Mid Cap Growth Fund
Class N/TMDPX
SEMI-ANNUAL SHAREHOLDER REPORT | June 30, 2024
This semi-annual shareholder report contains important information about AMG TimesSquare Mid Cap Growth Fund (the “Fund”) for the period of January 1, 2024 to June 30, 2024. You can find additional information about the Fund at https://wealth.amg.com/resources/order-literature. You can also request this information by contacting us at 800-548-4539.
This report describes changes to the Fund that occurred during the reporting period.
Fund Expenses
What were the Fund costs for the last six months?
(Based on a hypothetical $10,000 investment)
| Fund (Class) | Costs of a $10,000 investment | Costs paid as a percentage of a $10,000 investment |
AMG TimesSquare Mid Cap Growth Fund
(Class N/TMDPX) | $61 | 1.18% |
Key Fund Statistics (as of June 30, 2024)
| Fund net assets | $1,350,136,571% |
| Total number of portfolio holdings | $75% |
| Net advisory fees paid | $5,275,579% |
| Portfolio turnover rate as of the end of the reporting period | $13% |
Graphical Representation of Holdings (as of June 30, 2024)
Top ten holdings and portfolio breakdown are shown as a percentage of net assets of the Fund.
| Crowdstrike Holdings, Inc., Class A | 3.2% |
| Cintas Corp. | 2.8% |
| Verisk Analytics, Inc., Class A | 2.5% |
| Cencora, Inc. | 2.5% |
| Amphenol Corp., Class A | 2.4% |
| O'Reilly Automotive, Inc. | 2.4% |
| Gartner, Inc. | 2.3% |
| Waste Connections, Inc. (Canada) | 2.3% |
| Monolithic Power Systems, Inc. | 2.1% |
| Teradyne, Inc. | 2.0% |
| Top Ten as a Group | 24.5% |
Recent Fund Changes
This is a summary of certain changes to the Fund since January 1, 2024. For more complete information, you may review the Fund's prospectus at https://wealth.amg.com/resources/order-literature. The Fund's prospectus is also available without charge by calling 800.548.4539 or by sending an e-mail request to shareholderservices@amg.com.
Effective July 1, 2024, the management fee for the Fund was reduced from 0.79% to 0.66%, which resulted in the overall reduction of the Fund’s net expense ratios as compared with the Fund’s prior fee structure.
Availability of Additional Information
You can find additional information about the Fund such as the prospectus, financial information, fund holdings and proxy voting information at https://wealth.amg.com/resources/order-literature. You can also request this information by contacting us at 800.548.4539.
Householding
In order to reduce expenses, we will deliver a single copy of prospectuses, proxies, financial reports and other communication to shareholders with the same residential address, provided they have the same last name or we reasonably believe them to be members of the same family. Unless we are notified otherwise, we will continue to send recipients only one copy of these materials for as long as they remain a shareholder of the Fund. If you would like to receive individual mailings, please call 800.548.4539 and we will begin sending you separate copies of these materials within 30 days after receiving your request.
For additional information, please navigate to the additional material at https://wealth.amg.com/resources/order-literature.
AMG TimesSquare Mid Cap Growth Fund
Class I/TQMIX
SEMI-ANNUAL SHAREHOLDER REPORT | June 30, 2024
This semi-annual shareholder report contains important information about AMG TimesSquare Mid Cap Growth Fund (the “Fund”) for the period of January 1, 2024 to June 30, 2024. You can find additional information about the Fund at https://wealth.amg.com/resources/order-literature. You can also request this information by contacting us at 800-548-4539.
This report describes changes to the Fund that occurred during the reporting period.
Fund Expenses
What were the Fund costs for the last six months?
(Based on a hypothetical $10,000 investment)
| Fund (Class) | Costs of a $10,000 investment | Costs paid as a percentage of a $10,000 investment |
AMG TimesSquare Mid Cap Growth Fund
(Class I/TQMIX) | $53 | 1.03% |
Key Fund Statistics (as of June 30, 2024)
| Fund net assets | $1,350,136,571% |
| Total number of portfolio holdings | $75% |
| Net advisory fees paid | $5,275,579% |
| Portfolio turnover rate as of the end of the reporting period | $13% |
Graphical Representation of Holdings (as of June 30, 2024)
Top ten holdings and portfolio breakdown are shown as a percentage of net assets of the Fund.
| Crowdstrike Holdings, Inc., Class A | 3.2% |
| Cintas Corp. | 2.8% |
| Verisk Analytics, Inc., Class A | 2.5% |
| Cencora, Inc. | 2.5% |
| Amphenol Corp., Class A | 2.4% |
| O'Reilly Automotive, Inc. | 2.4% |
| Gartner, Inc. | 2.3% |
| Waste Connections, Inc. (Canada) | 2.3% |
| Monolithic Power Systems, Inc. | 2.1% |
| Teradyne, Inc. | 2.0% |
| Top Ten as a Group | 24.5% |
Recent Fund Changes
This is a summary of certain changes to the Fund since January 1, 2024. For more complete information, you may review the Fund's prospectus at https://wealth.amg.com/resources/order-literature. The Fund's prospectus is also available without charge by calling 800.548.4539 or by sending an e-mail request to shareholderservices@amg.com.
Effective July 1, 2024, the management fee for the Fund was reduced from 0.79% to 0.66%, which resulted in the overall reduction of the Fund’s net expense ratios as compared with the Fund’s prior fee structure.
Availability of Additional Information
You can find additional information about the Fund such as the prospectus, financial information, fund holdings and proxy voting information at https://wealth.amg.com/resources/order-literature. You can also request this information by contacting us at 800.548.4539.
Householding
In order to reduce expenses, we will deliver a single copy of prospectuses, proxies, financial reports and other communication to shareholders with the same residential address, provided they have the same last name or we reasonably believe them to be members of the same family. Unless we are notified otherwise, we will continue to send recipients only one copy of these materials for as long as they remain a shareholder of the Fund. If you would like to receive individual mailings, please call 800.548.4539 and we will begin sending you separate copies of these materials within 30 days after receiving your request.
For additional information, please navigate to the additional material at https://wealth.amg.com/resources/order-literature.
AMG TimesSquare Mid Cap Growth Fund
Class Z/TMDIX
SEMI-ANNUAL SHAREHOLDER REPORT | June 30, 2024
This semi-annual shareholder report contains important information about AMG TimesSquare Mid Cap Growth Fund (the “Fund”) for the period of January 1, 2024 to June 30, 2024. You can find additional information about the Fund at https://wealth.amg.com/resources/order-literature. You can also request this information by contacting us at 800-548-4539.
This report describes changes to the Fund that occurred during the reporting period.
Fund Expenses
What were the Fund costs for the last six months?
(Based on a hypothetical $10,000 investment)
| Fund (Class) | Costs of a $10,000 investment | Costs paid as a percentage of a $10,000 investment |
AMG TimesSquare Mid Cap Growth Fund
(Class Z/TMDIX) | $50 | 0.98% |
Key Fund Statistics (as of June 30, 2024)
| Fund net assets | $1,350,136,571% |
| Total number of portfolio holdings | $75% |
| Net advisory fees paid | $5,275,579% |
| Portfolio turnover rate as of the end of the reporting period | $13% |
Graphical Representation of Holdings (as of June 30, 2024)
Top ten holdings and portfolio breakdown are shown as a percentage of net assets of the Fund.
| Crowdstrike Holdings, Inc., Class A | 3.2% |
| Cintas Corp. | 2.8% |
| Verisk Analytics, Inc., Class A | 2.5% |
| Cencora, Inc. | 2.5% |
| Amphenol Corp., Class A | 2.4% |
| O'Reilly Automotive, Inc. | 2.4% |
| Gartner, Inc. | 2.3% |
| Waste Connections, Inc. (Canada) | 2.3% |
| Monolithic Power Systems, Inc. | 2.1% |
| Teradyne, Inc. | 2.0% |
| Top Ten as a Group | 24.5% |
Recent Fund Changes
This is a summary of certain changes to the Fund since January 1, 2024. For more complete information, you may review the Fund's prospectus at https://wealth.amg.com/resources/order-literature. The Fund's prospectus is also available without charge by calling 800.548.4539 or by sending an e-mail request to shareholderservices@amg.com.
Effective July 1, 2024, the management fee for the Fund was reduced from 0.79% to 0.66%, which resulted in the overall reduction of the Fund’s net expense ratios as compared with the Fund’s prior fee structure.
Availability of Additional Information
You can find additional information about the Fund such as the prospectus, financial information, fund holdings and proxy voting information at https://wealth.amg.com/resources/order-literature. You can also request this information by contacting us at 800.548.4539.
Householding
In order to reduce expenses, we will deliver a single copy of prospectuses, proxies, financial reports and other communication to shareholders with the same residential address, provided they have the same last name or we reasonably believe them to be members of the same family. Unless we are notified otherwise, we will continue to send recipients only one copy of these materials for as long as they remain a shareholder of the Fund. If you would like to receive individual mailings, please call 800.548.4539 and we will begin sending you separate copies of these materials within 30 days after receiving your request.
For additional information, please navigate to the additional material at https://wealth.amg.com/resources/order-literature.
AMG TimesSquare Small Cap Growth Fund
Class N/TSCPX
SEMI-ANNUAL SHAREHOLDER REPORT | June 30, 2024
This semi-annual shareholder report contains important information about AMG TimesSquare Small Cap Growth Fund (the “Fund”) for the period of January 1, 2024 to June 30, 2024. You can find additional information about the Fund at https://wealth.amg.com/resources/order-literature. You can also request this information by contacting us at 800-548-4539.
This report describes changes to the Fund that occurred during the reporting period.
Fund Expenses
What were the Fund costs for the last six months?
(Based on a hypothetical $10,000 investment)
| Fund (Class) | Costs of a $10,000 investment | Costs paid as a percentage of a $10,000 investment |
AMG TimesSquare Small Cap Growth Fund
(Class N/TSCPX) | $60 | 1.18% |
Key Fund Statistics (as of June 30, 2024)
| Fund net assets | $166,269,735% |
| Total number of portfolio holdings | $82% |
| Net advisory fees paid | $606,930% |
| Portfolio turnover rate as of the end of the reporting period | $30% |
Graphical Representation of Holdings (as of June 30, 2024)
Top ten holdings and portfolio breakdown are shown as a percentage of net assets of the Fund.
| Casella Waste Systems, Inc., Class A | 2.8% |
| CyberArk Software, Ltd. (Israel) | 2.7% |
| Vertex, Inc., Class A | 2.5% |
| JFrog, Ltd. (Israel) | 2.5% |
| BJ's Wholesale Club Holdings, Inc. | 2.1% |
| Victory Capital Holdings, Inc., Class A | 2.0% |
| Matador Resources Co. | 1.9% |
| Hamilton Lane, Inc., Class A | 1.9% |
| Smartsheet, Inc., Class A | 1.9% |
| Esab Corp. | 1.9% |
| Top Ten as a Group | 22.2% |
Recent Fund Changes
This is a summary of certain changes to the Fund since January 1, 2024. For more complete information, you may review the Fund's prospectus at https://wealth.amg.com/resources/order-literature. The Fund's prospectus is also available without charge by calling 800.548.4539 or by sending an e-mail request to shareholderservices@amg.com.
Effective July 1, 2024, the following fee changes for the Fund took effect and resulted in the overall reduction of the Fund’s net expense ratios as compared with the Fund’s prior fee structure: (i) the management fee for the Fund was reduced from 0.79% to 0.76%; and (ii) the Fund’s existing contractual expense limitation agreement with AMG Funds LLC (the “Investment Manager”) was replaced with a new contractual expense limitation agreement with the Investment Manager pursuant to which the Investment Manager agreed, through at least May 1, 2026, to limit total annual operating expenses (exclusive of taxes, interest (including interest incurred in connection with bank and custody overdrafts and in connection with securities sold short), shareholder servicing fees, distribution and service (12b-1) fees, brokerage commissions and other transaction costs, dividends payable with respect to securities sold short, acquired fund fees and expenses, and extraordinary expenses) of the Fund to the annual rate of 0.96% (reduced from 0.99%) of the Fund’s average daily net assets, subject to later reimbursement by the Fund in certain circumstances.
Availability of Additional Information
You can find additional information about the Fund such as the prospectus, financial information, fund holdings and proxy voting information at https://wealth.amg.com/resources/order-literature. You can also request this information by contacting us at 800.548.4539.
Householding
In order to reduce expenses, we will deliver a single copy of prospectuses, proxies, financial reports and other communication to shareholders with the same residential address, provided they have the same last name or we reasonably believe them to be members of the same family. Unless we are notified otherwise, we will continue to send recipients only one copy of these materials for as long as they remain a shareholder of the Fund. If you would like to receive individual mailings, please call 800.548.4539 and we will begin sending you separate copies of these materials within 30 days after receiving your request.
For additional information, please navigate to the additional material at https://wealth.amg.com/resources/order-literature.
AMG TimesSquare Small Cap Growth Fund
Class I/TSQIX
SEMI-ANNUAL SHAREHOLDER REPORT | June 30, 2024
This semi-annual shareholder report contains important information about AMG TimesSquare Small Cap Growth Fund (the “Fund”) for the period of January 1, 2024 to June 30, 2024. You can find additional information about the Fund at https://wealth.amg.com/resources/order-literature. You can also request this information by contacting us at 800-548-4539.
This report describes changes to the Fund that occurred during the reporting period.
Fund Expenses
What were the Fund costs for the last six months?
(Based on a hypothetical $10,000 investment)
| Fund (Class) | Costs of a $10,000 investment | Costs paid as a percentage of a $10,000 investment |
AMG TimesSquare Small Cap Growth Fund
(Class I/TSQIX) | $53 | 1.05% |
Key Fund Statistics (as of June 30, 2024)
| Fund net assets | $166,269,735% |
| Total number of portfolio holdings | $82% |
| Net advisory fees paid | $606,930% |
| Portfolio turnover rate as of the end of the reporting period | $30% |
Graphical Representation of Holdings (as of June 30, 2024)
Top ten holdings and portfolio breakdown are shown as a percentage of net assets of the Fund.
| Casella Waste Systems, Inc., Class A | 2.8% |
| CyberArk Software, Ltd. (Israel) | 2.7% |
| Vertex, Inc., Class A | 2.5% |
| JFrog, Ltd. (Israel) | 2.5% |
| BJ's Wholesale Club Holdings, Inc. | 2.1% |
| Victory Capital Holdings, Inc., Class A | 2.0% |
| Matador Resources Co. | 1.9% |
| Hamilton Lane, Inc., Class A | 1.9% |
| Smartsheet, Inc., Class A | 1.9% |
| Esab Corp. | 1.9% |
| Top Ten as a Group | 22.2% |
Recent Fund Changes
This is a summary of certain changes to the Fund since January 1, 2024. For more complete information, you may review the Fund's prospectus at https://wealth.amg.com/resources/order-literature. The Fund's prospectus is also available without charge by calling 800.548.4539 or by sending an e-mail request to shareholderservices@amg.com.
Effective July 1, 2024, the following fee changes for the Fund took effect and resulted in the overall reduction of the Fund’s net expense ratios as compared with the Fund’s prior fee structure: (i) the management fee for the Fund was reduced from 0.79% to 0.76%; and (ii) the Fund’s existing contractual expense limitation agreement with AMG Funds LLC (the “Investment Manager”) was replaced with a new contractual expense limitation agreement with the Investment Manager pursuant to which the Investment Manager agreed, through at least May 1, 2026, to limit total annual operating expenses (exclusive of taxes, interest (including interest incurred in connection with bank and custody overdrafts and in connection with securities sold short), shareholder servicing fees, distribution and service (12b-1) fees, brokerage commissions and other transaction costs, dividends payable with respect to securities sold short, acquired fund fees and expenses, and extraordinary expenses) of the Fund to the annual rate of 0.96% (reduced from 0.99%) of the Fund’s average daily net assets, subject to later reimbursement by the Fund in certain circumstances.
Availability of Additional Information
You can find additional information about the Fund such as the prospectus, financial information, fund holdings and proxy voting information at https://wealth.amg.com/resources/order-literature. You can also request this information by contacting us at 800.548.4539.
Householding
In order to reduce expenses, we will deliver a single copy of prospectuses, proxies, financial reports and other communication to shareholders with the same residential address, provided they have the same last name or we reasonably believe them to be members of the same family. Unless we are notified otherwise, we will continue to send recipients only one copy of these materials for as long as they remain a shareholder of the Fund. If you would like to receive individual mailings, please call 800.548.4539 and we will begin sending you separate copies of these materials within 30 days after receiving your request.
For additional information, please navigate to the additional material at https://wealth.amg.com/resources/order-literature.
AMG TimesSquare Small Cap Growth Fund
Class Z/TSCIX
SEMI-ANNUAL SHAREHOLDER REPORT | June 30, 2024
This semi-annual shareholder report contains important information about AMG TimesSquare Small Cap Growth Fund (the “Fund”) for the period of January 1, 2024 to June 30, 2024. You can find additional information about the Fund at https://wealth.amg.com/resources/order-literature. You can also request this information by contacting us at 800-548-4539.
This report describes changes to the Fund that occurred during the reporting period.
Fund Expenses
What were the Fund costs for the last six months?
(Based on a hypothetical $10,000 investment)
| Fund (Class) | Costs of a $10,000 investment | Costs paid as a percentage of a $10,000 investment |
AMG TimesSquare Small Cap Growth Fund
(Class Z/TSCIX) | $50 | 0.98% |
Key Fund Statistics (as of June 30, 2024)
| Fund net assets | $166,269,735% |
| Total number of portfolio holdings | $82% |
| Net advisory fees paid | $606,930% |
| Portfolio turnover rate as of the end of the reporting period | $30% |
Graphical Representation of Holdings (as of June 30, 2024)
Top ten holdings and portfolio breakdown are shown as a percentage of net assets of the Fund.
| Casella Waste Systems, Inc., Class A | 2.8% |
| CyberArk Software, Ltd. (Israel) | 2.7% |
| Vertex, Inc., Class A | 2.5% |
| JFrog, Ltd. (Israel) | 2.5% |
| BJ's Wholesale Club Holdings, Inc. | 2.1% |
| Victory Capital Holdings, Inc., Class A | 2.0% |
| Matador Resources Co. | 1.9% |
| Hamilton Lane, Inc., Class A | 1.9% |
| Smartsheet, Inc., Class A | 1.9% |
| Esab Corp. | 1.9% |
| Top Ten as a Group | 22.2% |
Recent Fund Changes
This is a summary of certain changes to the Fund since January 1, 2024. For more complete information, you may review the Fund's prospectus at https://wealth.amg.com/resources/order-literature. The Fund's prospectus is also available without charge by calling 800.548.4539 or by sending an e-mail request to shareholderservices@amg.com.
Effective July 1, 2024, the following fee changes for the Fund took effect and resulted in the overall reduction of the Fund’s net expense ratios as compared with the Fund’s prior fee structure: (i) the management fee for the Fund was reduced from 0.79% to 0.76%; and (ii) the Fund’s existing contractual expense limitation agreement with AMG Funds LLC (the “Investment Manager”) was replaced with a new contractual expense limitation agreement with the Investment Manager pursuant to which the Investment Manager agreed, through at least May 1, 2026, to limit total annual operating expenses (exclusive of taxes, interest (including interest incurred in connection with bank and custody overdrafts and in connection with securities sold short), shareholder servicing fees, distribution and service (12b-1) fees, brokerage commissions and other transaction costs, dividends payable with respect to securities sold short, acquired fund fees and expenses, and extraordinary expenses) of the Fund to the annual rate of 0.96% (reduced from 0.99%) of the Fund’s average daily net assets, subject to later reimbursement by the Fund in certain circumstances.
Availability of Additional Information
You can find additional information about the Fund such as the prospectus, financial information, fund holdings and proxy voting information at https://wealth.amg.com/resources/order-literature. You can also request this information by contacting us at 800.548.4539.
Householding
In order to reduce expenses, we will deliver a single copy of prospectuses, proxies, financial reports and other communication to shareholders with the same residential address, provided they have the same last name or we reasonably believe them to be members of the same family. Unless we are notified otherwise, we will continue to send recipients only one copy of these materials for as long as they remain a shareholder of the Fund. If you would like to receive individual mailings, please call 800.548.4539 and we will begin sending you separate copies of these materials within 30 days after receiving your request.
For additional information, please navigate to the additional material at https://wealth.amg.com/resources/order-literature.
AMG Yacktman Focused Fund
Class N/YAFFX
SEMI-ANNUAL SHAREHOLDER REPORT | June 30, 2024
This semi-annual shareholder report contains important information about AMG Yacktman Focused Fund (the “Fund”) for the period of January 1, 2024 to June 30, 2024. You can find additional information about the Fund at https://wealth.amg.com/resources/order-literature. You can also request this information by contacting us at 800-548-4539.
Fund Expenses
What were the Fund costs for the last six months?
(Based on a hypothetical $10,000 investment)
| Fund (Class) | Costs of a $10,000 investment | Costs paid as a percentage of a $10,000 investment |
AMG Yacktman Focused Fund
(Class N/YAFFX) | $63 | 1.24% |
Key Fund Statistics (as of June 30, 2024)
| Fund net assets | $3,552,952,953% |
| Total number of portfolio holdings | $60% |
| Net advisory fees paid | $15,877,423% |
| Portfolio turnover rate as of the end of the reporting period | $1% |
Graphical Representation of Holdings (as of June 30, 2024)
Top ten holdings and portfolio breakdown are shown as a percentage of net assets of the Fund and country allocation is shown as a percentage of total long-term investments of the Fund.
| Samsung Electronics Co., Ltd., 1.560% (South Korea) | 10.6% |
| Bolloré SE (France) | 8.3% |
| Canadian Natural Resources, Ltd. (Canada) | 8.1% |
| Microsoft Corp. | 4.4% |
| Alphabet, Inc., Class C | 4.3% |
| U-Haul Holding Co., Non-Voting Shares | 3.1% |
| KT&G Corp. (South Korea) | 2.9% |
| Fox Corp., Class B | 2.7% |
| News Corp., Class A | 2.6% |
| The Charles Schwab Corp. | 2.5% |
| Top Ten as a Group | 49.5% |
Availability of Additional Information
You can find additional information about the Fund such as the prospectus, financial information, fund holdings and proxy voting information at https://wealth.amg.com/resources/order-literature. You can also request this information by contacting us at 800.548.4539.
Householding
In order to reduce expenses, we will deliver a single copy of prospectuses, proxies, financial reports and other communication to shareholders with the same residential address, provided they have the same last name or we reasonably believe them to be members of the same family. Unless we are notified otherwise, we will continue to send recipients only one copy of these materials for as long as they remain a shareholder of the Fund. If you would like to receive individual mailings, please call 800.548.4539 and we will begin sending you separate copies of these materials within 30 days after receiving your request.
For additional information, please navigate to the additional material at https://wealth.amg.com/resources/order-literature.
AMG Yacktman Focused Fund
Class I/YAFIX
SEMI-ANNUAL SHAREHOLDER REPORT | June 30, 2024
This semi-annual shareholder report contains important information about AMG Yacktman Focused Fund (the “Fund”) for the period of January 1, 2024 to June 30, 2024. You can find additional information about the Fund at https://wealth.amg.com/resources/order-literature. You can also request this information by contacting us at 800-548-4539.
Fund Expenses
What were the Fund costs for the last six months?
(Based on a hypothetical $10,000 investment)
| Fund (Class) | Costs of a $10,000 investment | Costs paid as a percentage of a $10,000 investment |
AMG Yacktman Focused Fund
(Class I/YAFIX) | $54 | 1.06% |
Key Fund Statistics (as of June 30, 2024)
| Fund net assets | $3,552,952,953% |
| Total number of portfolio holdings | $60% |
| Net advisory fees paid | $15,877,423% |
| Portfolio turnover rate as of the end of the reporting period | $1% |
Graphical Representation of Holdings (as of June 30, 2024)
Top ten holdings and portfolio breakdown are shown as a percentage of net assets of the Fund and country allocation is shown as a percentage of total long-term investments of the Fund.
| Samsung Electronics Co., Ltd., 1.560% (South Korea) | 10.6% |
| Bolloré SE (France) | 8.3% |
| Canadian Natural Resources, Ltd. (Canada) | 8.1% |
| Microsoft Corp. | 4.4% |
| Alphabet, Inc., Class C | 4.3% |
| U-Haul Holding Co., Non-Voting Shares | 3.1% |
| KT&G Corp. (South Korea) | 2.9% |
| Fox Corp., Class B | 2.7% |
| News Corp., Class A | 2.6% |
| The Charles Schwab Corp. | 2.5% |
| Top Ten as a Group | 49.5% |
Availability of Additional Information
You can find additional information about the Fund such as the prospectus, financial information, fund holdings and proxy voting information at https://wealth.amg.com/resources/order-literature. You can also request this information by contacting us at 800.548.4539.
Householding
In order to reduce expenses, we will deliver a single copy of prospectuses, proxies, financial reports and other communication to shareholders with the same residential address, provided they have the same last name or we reasonably believe them to be members of the same family. Unless we are notified otherwise, we will continue to send recipients only one copy of these materials for as long as they remain a shareholder of the Fund. If you would like to receive individual mailings, please call 800.548.4539 and we will begin sending you separate copies of these materials within 30 days after receiving your request.
For additional information, please navigate to the additional material at https://wealth.amg.com/resources/order-literature.
AMG Yacktman Fund
Class I/YACKX
SEMI-ANNUAL SHAREHOLDER REPORT | June 30, 2024
This semi-annual shareholder report contains important information about AMG Yacktman Fund (the “Fund”) for the period of January 1, 2024 to June 30, 2024. You can find additional information about the Fund at https://wealth.amg.com/resources/order-literature. You can also request this information by contacting us at 800-548-4539.
Fund Expenses
What were the Fund costs for the last six months?
(Based on a hypothetical $10,000 investment)
| Fund (Class) | Costs of a $10,000 investment | Costs paid as a percentage of a $10,000 investment |
AMG Yacktman Fund
(Class I/YACKX) | $36 | 0.70% |
Key Fund Statistics (as of June 30, 2024)
| Fund net assets | $8,307,516,262% |
| Total number of portfolio holdings | $68% |
| Net advisory fees paid | $17,953,514% |
| Portfolio turnover rate as of the end of the reporting period | $2% |
Graphical Representation of Holdings (as of June 30, 2024)
Top ten holdings and portfolio breakdown are shown as a percentage of net assets of the Fund and country allocation is shown as a percentage of total long-term investments of the Fund.
| Canadian Natural Resources, Ltd. (Canada) | 7.0% |
| Bolloré SE (France) | 6.8% |
| Samsung Electronics Co., Ltd., 1.560% (South Korea) | 6.1% |
| Microsoft Corp. | 4.3% |
| Alphabet, Inc., Class C | 4.2% |
| The Charles Schwab Corp. | 2.8% |
| PepsiCo, Inc. | 2.8% |
| News Corp., Class A | 2.7% |
| The Procter & Gamble Co. | 2.6% |
| U-Haul Holding Co., Non-Voting Shares | 2.1% |
| Top Ten as a Group | 41.4% |
Availability of Additional Information
You can find additional information about the Fund such as the prospectus, financial information, fund holdings and proxy voting information at https://wealth.amg.com/resources/order-literature. You can also request this information by contacting us at 800.548.4539.
Householding
In order to reduce expenses, we will deliver a single copy of prospectuses, proxies, financial reports and other communication to shareholders with the same residential address, provided they have the same last name or we reasonably believe them to be members of the same family. Unless we are notified otherwise, we will continue to send recipients only one copy of these materials for as long as they remain a shareholder of the Fund. If you would like to receive individual mailings, please call 800.548.4539 and we will begin sending you separate copies of these materials within 30 days after receiving your request.
For additional information, please navigate to the additional material at https://wealth.amg.com/resources/order-literature.
AMG Yacktman Global Fund
Class N/YFSNX
SEMI-ANNUAL SHAREHOLDER REPORT | June 30, 2024
This semi-annual shareholder report contains important information about AMG Yacktman Global Fund (the “Fund”) for the period of January 1, 2024 to June 30, 2024. You can find additional information about the Fund at https://wealth.amg.com/resources/order-literature. You can also request this information by contacting us at 800-548-4539.
Fund Expenses
What were the Fund costs for the last six months?
(Based on a hypothetical $10,000 investment)
| Fund (Class) | Costs of a $10,000 investment | Costs paid as a percentage of a $10,000 investment |
AMG Yacktman Global Fund
(Class N/YFSNX) | $57 | 1.13% |
Key Fund Statistics (as of June 30, 2024)
| Fund net assets | $172,619,428% |
| Total number of portfolio holdings | $60% |
| Net advisory fees paid | $619,235% |
| Portfolio turnover rate as of the end of the reporting period | $2% |
Graphical Representation of Holdings (as of June 30, 2024)
Top ten holdings and portfolio breakdown are shown as a percentage of net assets of the Fund and country allocation is shown as a percentage of total long-term investments of the Fund.
| Bolloré SE (France) | 9.4% |
| Samsung Electronics Co., Ltd., 1.560% (South Korea) | 8.5% |
| Canadian Natural Resources, Ltd. (Canada) | 7.2% |
| Samsung C&T Corp. (South Korea) | 5.1% |
| Hyundai Motor Co., 8.200% (South Korea) | 4.6% |
| Total Energy Services, Inc. (Canada) | 4.3% |
| HI-LEX Corp. (Japan) | 3.9% |
| Cie de L'Odet SE (France) | 3.6% |
| Unit Corp. (United States) | 3.4% |
| Ocean Wilsons Holdings, Ltd. (Bermuda) | 3.2% |
| Top Ten as a Group | 53.2% |
Availability of Additional Information
You can find additional information about the Fund such as the prospectus, financial information, fund holdings and proxy voting information at https://wealth.amg.com/resources/order-literature. You can also request this information by contacting us at 800.548.4539.
Householding
In order to reduce expenses, we will deliver a single copy of prospectuses, proxies, financial reports and other communication to shareholders with the same residential address, provided they have the same last name or we reasonably believe them to be members of the same family. Unless we are notified otherwise, we will continue to send recipients only one copy of these materials for as long as they remain a shareholder of the Fund. If you would like to receive individual mailings, please call 800.548.4539 and we will begin sending you separate copies of these materials within 30 days after receiving your request.
For additional information, please navigate to the additional material at https://wealth.amg.com/resources/order-literature.
AMG Yacktman Global Fund
Class I/YFSIX
SEMI-ANNUAL SHAREHOLDER REPORT | June 30, 2024
This semi-annual shareholder report contains important information about AMG Yacktman Global Fund (the “Fund”) for the period of January 1, 2024 to June 30, 2024. You can find additional information about the Fund at https://wealth.amg.com/resources/order-literature. You can also request this information by contacting us at 800-548-4539.
Fund Expenses
What were the Fund costs for the last six months?
(Based on a hypothetical $10,000 investment)
| Fund (Class) | Costs of a $10,000 investment | Costs paid as a percentage of a $10,000 investment |
AMG Yacktman Global Fund
(Class I/YFSIX) | $47 | 0.93% |
Key Fund Statistics (as of June 30, 2024)
| Fund net assets | $172,619,428% |
| Total number of portfolio holdings | $60% |
| Net advisory fees paid | $619,235% |
| Portfolio turnover rate as of the end of the reporting period | $2% |
Graphical Representation of Holdings (as of June 30, 2024)
Top ten holdings and portfolio breakdown are shown as a percentage of net assets of the Fund and country allocation is shown as a percentage of total long-term investments of the Fund.
| Bolloré SE (France) | 9.4% |
| Samsung Electronics Co., Ltd., 1.560% (South Korea) | 8.5% |
| Canadian Natural Resources, Ltd. (Canada) | 7.2% |
| Samsung C&T Corp. (South Korea) | 5.1% |
| Hyundai Motor Co., 8.200% (South Korea) | 4.6% |
| Total Energy Services, Inc. (Canada) | 4.3% |
| HI-LEX Corp. (Japan) | 3.9% |
| Cie de L'Odet SE (France) | 3.6% |
| Unit Corp. (United States) | 3.4% |
| Ocean Wilsons Holdings, Ltd. (Bermuda) | 3.2% |
| Top Ten as a Group | 53.2% |
Availability of Additional Information
You can find additional information about the Fund such as the prospectus, financial information, fund holdings and proxy voting information at https://wealth.amg.com/resources/order-literature. You can also request this information by contacting us at 800.548.4539.
Householding
In order to reduce expenses, we will deliver a single copy of prospectuses, proxies, financial reports and other communication to shareholders with the same residential address, provided they have the same last name or we reasonably believe them to be members of the same family. Unless we are notified otherwise, we will continue to send recipients only one copy of these materials for as long as they remain a shareholder of the Fund. If you would like to receive individual mailings, please call 800.548.4539 and we will begin sending you separate copies of these materials within 30 days after receiving your request.
For additional information, please navigate to the additional material at https://wealth.amg.com/resources/order-literature.
AMG Yacktman Special Opportunities Fund
Class I/YASSX
SEMI-ANNUAL SHAREHOLDER REPORT | June 30, 2024
This semi-annual shareholder report contains important information about AMG Yacktman Special Opportunities Fund (the “Fund”) for the period of January 1, 2024 to June 30, 2024. You can find additional information about the Fund at https://wealth.amg.com/resources/order-literature. You can also request this information by contacting us at 800-548-4539.
Fund Expenses
What were the Fund costs for the last six months?
(Based on a hypothetical $10,000 investment)
| Fund (Class) | Costs of a $10,000 investment | Costs paid as a percentage of a $10,000 investment |
AMG Yacktman Special Opportunities Fund
(Class I/YASSX) | $45 | 0.89% |
Key Fund Statistics (as of June 30, 2024)
| Fund net assets | $54,178,053% |
| Total number of portfolio holdings | $47% |
| Net advisory fees paid | $147,646% |
| Portfolio turnover rate as of the end of the reporting period | $6% |
Graphical Representation of Holdings (as of June 30, 2024)
Top ten holdings and portfolio breakdown are shown as a percentage of net assets of the Fund and country allocation is shown as a percentage of total long-term investments of the Fund.
| Omni Bridgeway, Ltd. (Australia) | 7.5% |
| Legacy Housing Corp. (United States) | 5.5% |
| Total Energy Services, Inc. (Canada) | 5.4% |
| Cie de L'Odet SE (France) | 4.7% |
| Arrow Exploration Corp. (Canada) | 4.5% |
| Italian Wine Brands S.P.A (Italy) | 4.4% |
| Fila S.P.A. (Italy) | 4.4% |
| Texhong International Group, Ltd. (Hong Kong) | 4.3% |
| U-Haul Holding Co., Non-Voting Shares (United States) | 4.2% |
| Macfarlane Group PLC (United Kingdom) | 4.2% |
| Top Ten as a Group | 49.1% |
Availability of Additional Information
You can find additional information about the Fund such as the prospectus, financial information, fund holdings and proxy voting information at https://wealth.amg.com/resources/order-literature. You can also request this information by contacting us at 800.548.4539.
Householding
In order to reduce expenses, we will deliver a single copy of prospectuses, proxies, financial reports and other communication to shareholders with the same residential address, provided they have the same last name or we reasonably believe them to be members of the same family. Unless we are notified otherwise, we will continue to send recipients only one copy of these materials for as long as they remain a shareholder of the Fund. If you would like to receive individual mailings, please call 800.548.4539 and we will begin sending you separate copies of these materials within 30 days after receiving your request.
For additional information, please navigate to the additional material at https://wealth.amg.com/resources/order-literature.
AMG Yacktman Special Opportunities Fund
Class Z/YASLX
SEMI-ANNUAL SHAREHOLDER REPORT | June 30, 2024
This semi-annual shareholder report contains important information about AMG Yacktman Special Opportunities Fund (the “Fund”) for the period of January 1, 2024 to June 30, 2024. You can find additional information about the Fund at https://wealth.amg.com/resources/order-literature. You can also request this information by contacting us at 800-548-4539.
Fund Expenses
What were the Fund costs for the last six months?
(Based on a hypothetical $10,000 investment)
| Fund (Class) | Costs of a $10,000 investment | Costs paid as a percentage of a $10,000 investment |
AMG Yacktman Special Opportunities Fund
(Class Z/YASLX) | $40 | 0.79% |
Key Fund Statistics (as of June 30, 2024)
| Fund net assets | $54,178,053% |
| Total number of portfolio holdings | $47% |
| Net advisory fees paid | $147,646% |
| Portfolio turnover rate as of the end of the reporting period | $6% |
Graphical Representation of Holdings (as of June 30, 2024)
Top ten holdings and portfolio breakdown are shown as a percentage of net assets of the Fund and country allocation is shown as a percentage of total long-term investments of the Fund.
| Omni Bridgeway, Ltd. (Australia) | 7.5% |
| Legacy Housing Corp. (United States) | 5.5% |
| Total Energy Services, Inc. (Canada) | 5.4% |
| Cie de L'Odet SE (France) | 4.7% |
| Arrow Exploration Corp. (Canada) | 4.5% |
| Italian Wine Brands S.P.A (Italy) | 4.4% |
| Fila S.P.A. (Italy) | 4.4% |
| Texhong International Group, Ltd. (Hong Kong) | 4.3% |
| U-Haul Holding Co., Non-Voting Shares (United States) | 4.2% |
| Macfarlane Group PLC (United Kingdom) | 4.2% |
| Top Ten as a Group | 49.1% |
Availability of Additional Information
You can find additional information about the Fund such as the prospectus, financial information, fund holdings and proxy voting information at https://wealth.amg.com/resources/order-literature. You can also request this information by contacting us at 800.548.4539.
Householding
In order to reduce expenses, we will deliver a single copy of prospectuses, proxies, financial reports and other communication to shareholders with the same residential address, provided they have the same last name or we reasonably believe them to be members of the same family. Unless we are notified otherwise, we will continue to send recipients only one copy of these materials for as long as they remain a shareholder of the Fund. If you would like to receive individual mailings, please call 800.548.4539 and we will begin sending you separate copies of these materials within 30 days after receiving your request.
For additional information, please navigate to the additional material at https://wealth.amg.com/resources/order-literature.
(b) Not applicable.
Item 2. CODE OF ETHICS
Not required in this filing.
Item 3. AUDIT COMMITTEE FINANCIAL EXPERT
Not required in this filing.
Item 4. PRINCIPAL ACCOUNTANT FEES AND SERVICES
Not required in this filing.
Item 5. AUDIT COMMITTEE OF LISTED REGISTRANTS
Not applicable.
Item 6. INVESTMENTS
The schedule of investments in securities of unaffiliated issuers as of the close of the reporting period is included in the financial statements filed under Item 7 hereof.
Item 7. FINANCIAL STATEMENTS AND FINANCIAL HIGHLIGHTS FOR OPEN-END MANAGEMENT INVESTMENT COMPANIES.
| | |

| | SEMI-ANNUAL REPORT |
| | | | | | |
| | | AMG Funds |
| | | | |
| | | June 30, 2024 | | | | |
| | |
| | |  |
| | |
| | | AMG GW&K Small Cap Core Fund |
| | | Class N: GWETX | | Class I: GWEIX | | Class Z: GWEZX |
| | |
| | | AMG GW&K Small Cap Value Fund |
| | | | |
| | | Class N: SKSEX | | Class I: SKSIX | | Class Z: SKSZX |
| | |
| | | AMG GW&K Small/Mid Cap Core Fund |
| | | | |
| | | Class N: GWGVX | | Class I: GWGIX | | Class Z: GWGZX |
| | | | |
| | | | | | | |
| | | | | | |
| | | | | | | |
| | | |
| wealth.amg.com | | 063024 | | | SAR089 | |
| | |
| | AMG Funds Semi-Annual Report — June 30, 2024 (unaudited) |
Nothing contained herein is to be considered an offer, sale or solicitation of an offer to buy shares of any series of the AMG Funds Family of Funds. Such offering is made only by prospectus, which includes details as to offering price and other material information.
| | |
| | AMG GW&K Small Cap Core Fund Schedule of Portfolio Investments (unaudited) June 30, 2024 |
| | | | | | | | |
| | | Shares | | | Value | |
| | |
Common Stocks - 99.1% | | | | | | | | |
| |
Consumer Discretionary - 12.4% | | | | | |
| | |
Asbury Automotive Group, Inc.* | | | 29,257 | | | | $6,666,793 | |
| | |
Boot Barn Holdings, Inc.* | | | 56,910 | | | | 7,337,406 | |
| | |
Chuy’s Holdings, Inc.* | | | 119,674 | | | | 3,101,950 | |
| | |
First Watch Restaurant Group, Inc.*,1 | | | 76,562 | | | | 1,344,429 | |
| | |
Fox Factory Holding Corp.* | | | 63,566 | | | | 3,063,245 | |
| | |
Grand Canyon Education, Inc.* | | | 53,559 | | | | 7,493,440 | |
| | |
Helen of Troy, Ltd.* | | | 38,444 | | | | 3,565,296 | |
| | |
Oxford Industries, Inc.1 | | | 73,226 | | | | 7,333,584 | |
| | |
Patrick Industries, Inc. | | | 62,857 | | | | 6,823,127 | |
| | |
Revolve Group, Inc.*,1 | | | 118,056 | | | | 1,878,271 | |
| | |
Skyline Champion Corp.* | | | 118,135 | | | | 8,003,646 | |
| | |
Texas Roadhouse, Inc. | | | 77,698 | | | | 13,341,524 | |
| | |
Tri Pointe Homes, Inc.* | | | 178,543 | | | | 6,650,727 | |
| | |
Total Consumer Discretionary | | | | | | | 76,603,438 | |
| |
Consumer Staples - 3.1% | | | | | |
| | |
Central Garden & Pet Co., Class A* | | | 287,205 | | | | 9,486,381 | |
| | |
Utz Brands, Inc.1 | | | 322,804 | | | | 5,371,459 | |
| | |
The Vita Coco Co., Inc.*,1 | | | 153,403 | | | | 4,272,273 | |
| | |
Total Consumer Staples | | | | | | | 19,130,113 | |
| |
Energy - 5.7% | | | | | |
| | |
ChampionX Corp. | | | 158,748 | | | | 5,272,021 | |
| | |
Chord Energy Corp. | | | 39,470 | | | | 6,618,330 | |
| | |
Magnolia Oil & Gas Corp., Class A1 | | | 403,064 | | | | 10,213,642 | |
| | |
Matador Resources Co. | | | 184,834 | | | | 11,016,106 | |
| | |
Patterson-UTI Energy, Inc. | | | 199,044 | | | | 2,062,096 | |
| | |
Total Energy | | | | | | | 35,182,195 | |
| |
Financials - 16.1% | | | | | |
| | |
Ameris Bancorp | | | 163,755 | | | | 8,245,064 | |
| | |
The Baldwin Insurance Group, Inc.* | | | 159,732 | | | | 5,665,694 | |
| | |
Cathay General Bancorp | | | 158,590 | | | | 5,982,015 | |
| | |
Cohen & Steers, Inc.1 | | | 120,224 | | | | 8,723,454 | |
| | |
Flywire Corp.* | | | 452,133 | | | | 7,410,460 | |
| | |
Glacier Bancorp, Inc. | | | 127,692 | | | | 4,765,465 | |
| | |
Horace Mann Educators Corp. | | | 218,990 | | | | 7,143,454 | |
| | |
Houlihan Lokey, Inc. | | | 63,804 | | | | 8,604,607 | |
| | |
Independent Bank Corp. | | | 88,514 | | | | 4,489,430 | |
| | |
OceanFirst Financial Corp. | | | 337,920 | | | | 5,369,549 | |
| | |
Pacific Premier Bancorp, Inc. | | | 265,558 | | | | 6,099,867 | |
| | |
Perella Weinberg Partners | | | 235,074 | | | | 3,819,953 | |
| | |
Seacoast Banking Corp. of Florida | | | 257,797 | | | | 6,094,321 | |
| | |
Stifel Financial Corp. | | | 131,792 | | | | 11,090,297 | |
| | | | | | | | |
| | | Shares | | | Value | |
| | |
UMB Financial Corp.* | | | 77,200 | | | | $6,440,024 | |
| | |
Total Financials | | | | | | | 99,943,654 | |
| |
Health Care - 19.4% | | | | | |
| | |
Agios Pharmaceuticals, Inc.* | | | 93,104 | | | | 4,014,644 | |
| | |
Arcutis Biotherapeutics, Inc.*,1 | | | 310,981 | | | | 2,892,123 | |
| | |
Artivion, Inc.*,1 | | | 224,043 | | | | 5,746,703 | |
| | |
AtriCure, Inc.* | | | 151,434 | | | | 3,448,152 | |
| | |
Azenta, Inc.* | | | 86,459 | | | | 4,549,473 | |
| | |
BioCryst Pharmaceuticals, Inc.*,1 | | | 560,342 | | | | 3,462,914 | |
| | |
CryoPort, Inc.*,1 | | | 123,317 | | | | 852,120 | |
| | |
Globus Medical, Inc., Class A* | | | 141,017 | | | | 9,658,254 | |
| | |
Halozyme Therapeutics, Inc.* | | | 198,454 | | | | 10,391,051 | |
| | |
HealthEquity, Inc.* | | | 132,378 | | | | 11,410,984 | |
| | |
ICU Medical, Inc.* | | | 29,065 | | | | 3,451,469 | |
| | |
Insmed, Inc.* | | | 115,913 | | | | 7,766,171 | |
| | |
Integra LifeSciences Holdings Corp.* | | | 76,520 | | | | 2,229,793 | |
| | |
Intra-Cellular Therapies, Inc.* | | | 107,463 | | | | 7,360,141 | |
| | |
Medpace Holdings, Inc.* | | | 29,316 | | | | 12,073,795 | |
| | |
Paragon 28, Inc.*,1 | | | 236,038 | | | | 1,614,500 | |
| | |
Phreesia, Inc.* | | | 280,161 | | | | 5,939,413 | |
| | |
Progyny, Inc.* | | | 144,488 | | | | 4,133,802 | |
| | |
SpringWorks Therapeutics, Inc.* | | | 81,626 | | | | 3,074,851 | |
| | |
Supernus Pharmaceuticals, Inc.* | | | 227,543 | | | | 6,086,775 | |
| | |
US Physical Therapy, Inc.1 | | | 59,441 | | | | 5,493,537 | |
| | |
Veracyte, Inc.*,1 | | | 213,531 | | | | 4,627,217 | |
| | |
Total Health Care | | | | | | | 120,277,882 | |
| |
Industrials - 16.7% | | | | | |
| | |
Alamo Group, Inc. | | | 36,409 | | | | 6,298,757 | |
| | |
Allegiant Travel Co.1 | | | 36,217 | | | | 1,819,180 | |
| | |
CBIZ, Inc.* | | | 126,136 | | | | 9,346,678 | |
| | |
Chart Industries, Inc.*,1 | | | 41,995 | | | | 6,061,558 | |
| | |
Ducommun, Inc.* | | | 61,117 | | | | 3,548,453 | |
| | |
Heartland Express, Inc. | | | 147,439 | | | | 1,817,923 | |
| | |
Hillman Solutions Corp.* | | | 596,456 | | | | 5,278,636 | |
| | |
ICF International, Inc. | | | 62,184 | | | | 9,231,837 | |
| | |
ITT, Inc. | | | 73,466 | | | | 9,490,338 | |
| | |
Primoris Services Corp. | | | 172,059 | | | | 8,584,023 | |
| | |
RBC Bearings, Inc.* | | | 42,609 | | | | 11,495,056 | |
| | |
Shoals Technologies Group, Inc., Class A* | | | 320,817 | | | | 2,001,898 | |
| | |
SPX Technologies, Inc.* | | | 98,810 | | | | 14,044,853 | |
| | |
Sterling Infrastructure, Inc.* | | | 36,748 | | | | 4,348,758 | |
| | |
UFP Industries, Inc. | | | 90,291 | | | | 10,112,592 | |
| | |
Total Industrials | | | | | | | 103,480,540 | |
The accompanying notes are an integral part of these financial statements.
2
| | |
| | AMG GW&K Small Cap Core Fund Schedule of Portfolio Investments (continued) |
| | | | | | | | |
| | | Shares | | | Value | |
| |
Information Technology - 13.0% | | | | | |
| | |
Advanced Energy Industries, Inc. | | | 42,522 | | | | $4,624,693 | |
| | |
Allegro MicroSystems, Inc.*,1 | | | 205,513 | | | | 5,803,687 | |
| | |
Appfolio, Inc., Class A* | | | 52,522 | | | | 12,845,305 | |
| | |
The Descartes Systems Group, Inc. (Canada)* | | | 108,638 | | | | 10,520,504 | |
| | |
Endava PLC, Sponsored ADR (United Kingdom)* | | | 86,169 | | | | 2,519,582 | |
| | |
Intapp, Inc.* | | | 273,906 | | | | 10,044,133 | |
| | |
MACOM Technology Solutions Holdings, Inc.* | | | 114,123 | | | | 12,721,291 | |
| | |
Novanta, Inc.* | | | 67,313 | | | | 10,979,423 | |
| | |
Silicon Laboratories, Inc.* | | | 49,283 | | | | 5,452,178 | |
| | |
Viavi Solutions, Inc.* | | | 692,784 | | | | 4,759,426 | |
| | |
Total Information Technology | | | | | | | 80,270,222 | |
| |
Materials - 5.5% | | | | | |
| | |
Avient Corp. | | | 222,540 | | | | 9,713,871 | |
| | |
Balchem Corp. | | | 54,503 | | | | 8,390,737 | |
| | |
Minerals Technologies, Inc. | | | 94,706 | | | | 7,875,751 | |
| | |
Silgan Holdings, Inc. | | | 198,554 | | | | 8,404,791 | |
| | |
Total Materials | | | | | | | 34,385,150 | |
| |
Real Estate - 5.1% | | | | | |
| | |
Agree Realty Corp., REIT | | | 97,243 | | | | 6,023,232 | |
| | |
National Health Investors, Inc., REIT | | | 82,516 | | | | 5,588,809 | |
| | |
Ryman Hospitality Properties, Inc., REIT | | | 93,827 | | | | 9,369,564 | |
| | |
STAG Industrial, Inc., REIT | | | 296,322 | | | | 10,685,371 | |
| | |
Total Real Estate | | | | | | | 31,666,976 | |
| |
Utilities - 2.1% | | | | | |
| | |
IDACORP, Inc. | | | 62,280 | | | | 5,801,382 | |
| | | | | | | | |
| | | Shares | | | Value | |
| | |
Northwestern Energy Group, Inc. | | | 142,247 | | | | $7,123,730 | |
| | |
Total Utilities | | | | | | | 12,925,112 | |
| | |
Total Common Stocks | | | | | | | | |
(Cost $460,894,895) | | | | | | | 613,865,282 | |
| | |
| | | Principal
Amount | | | | |
| |
Short-Term Investments - 1.8% | | | | | |
| |
Joint Repurchase Agreements - 0.6%2 | | | | | |
| | |
Bethesda Securities LLC, dated 06/28/24, due 07/01/24, 5.450% total to be received $23,884 (collateralized by various U.S. Government Agency Obligations, 2.500% - 6.070%, 10/01/27 - 01/01/57, totaling $24,350) | | | $23,873 | | | | 23,873 | |
| | |
State of Wisconsin Investment Board, dated 06/28/24, due 07/01/24, 5.450% total to be received $3,801,726 (collateralized by various U.S. Treasuries, 0.125% - 3.625%, 10/15/25 -02/15/53, totaling $3,868,589) | | | 3,800,000 | | | | 3,800,000 | |
| | |
Total Joint Repurchase Agreements | | | | | | | 3,823,873 | |
| |
Repurchase Agreements - 1.2% | | | | | |
| | |
Fixed Income Clearing Corp., dated 06/28/24, due 07/01/24, 5.150% total to be received $7,622,270 (collateralized by a U.S. Treasury Note, 0.125%, 04/15/25, totaling $7,771,438) | | | 7,619,000 | | | | 7,619,000 | |
| | |
Total Short-Term Investments | | | | | | | | |
(Cost $11,442,873) | | | | | | | 11,442,873 | |
| | |
Total Investments - 100.9% | | | | | | | | |
(Cost $472,337,768) | | | | | | | 625,308,155 | |
| |
Other Assets, less Liabilities - (0.9)% | | | | (5,766,161) | |
| | |
Net Assets - 100.0% | | | | | | | $619,541,994 | |
| | * | Non-income producing security. |
| | 1 | Some of these securities, amounting to $42,508,487 or 6.9% of net assets, were out on loan to various borrowers and are collateralized by cash and various U.S. Treasury Obligations. See Note 4 of Notes to Financial Statements. |
| | 2 | Cash collateral received for securities lending activity was invested in these joint repurchase agreements. |
ADR American Depositary Receipt
REIT Real Estate Investment Trust
The accompanying notes are an integral part of these financial statements.
3
| | |
| | AMG GW&K Small Cap Core Fund Schedule of Portfolio Investments (continued) |
The following table summarizes the inputs used to value the Fund’s investments by the fair value hierarchy levels as of June 30, 2024:
| | | | | | | | | | | | | | | | |
| | | Level 1 | | | Level 2 | | | Level 3 | | | Total | |
| | | | |
Investments in Securities | | | | | | | | | | | | | | | | |
| | | | |
Common Stocks† | | $ | 613,865,282 | | | | — | | | | — | | | $ | 613,865,282 | |
| | | | |
Short-Term Investments | | | | | | | | | | | | | | | | |
| | | | |
Joint Repurchase Agreements | | | — | | | $ | 3,823,873 | | | | — | | | | 3,823,873 | |
| | | | |
Repurchase Agreements | | | — | | | | 7,619,000 | | | | — | | | | 7,619,000 | |
| | | | | | | | | | | | | | | | |
| | | | |
Total Investments in Securities | | $ | 613,865,282 | | | $ | 11,442,873 | | | | — | | | $ | 625,308,155 | |
| | | | | | | | | | | | | | | | |
| | † | All common stocks held in the Fund are Level 1 securities. For a detailed breakout of common stocks by major industry classification, please refer to the Fund’s Schedule of Portfolio Investments. |
For the six months ended June 30, 2024, there were no transfers in or out of Level 3.
The accompanying notes are an integral part of these financial statements.
4
| | |
| | AMG GW&K Small Cap Value Fund Schedule of Portfolio Investments (unaudited) June 30, 2024 |
| | | | | | | | |
| | | Shares | | | Value | |
| | |
Common Stocks - 98.2% | | | | | | | | |
| |
Communication Services - 1.9% | | | | | |
| | |
IMAX Corp. (Canada)*,1 | | | 126,885 | | | | $2,127,861 | |
| | |
Ziff Davis, Inc.* | | | 41,830 | | | | 2,302,742 | |
| | |
Total Communication Services | | | | | | | 4,430,603 | |
| |
Consumer Discretionary - 12.1% | | | | | |
| | |
Academy Sports & Outdoors, Inc. | | | 55,130 | | | | 2,935,673 | |
| | |
Arhaus, Inc.1 | | | 90,700 | | | | 1,536,458 | |
| | |
BJ’s Restaurants, Inc.* | | | 50,450 | | | | 1,750,615 | |
| | |
Boot Barn Holdings, Inc.* | | | 36,441 | | | | 4,698,338 | |
| | |
First Watch Restaurant Group, Inc.*,1 | | | 121,426 | | | | 2,132,241 | |
| | |
Fox Factory Holding Corp.* | | | 35,375 | | | | 1,704,721 | |
| | |
Group 1 Automotive, Inc. | | | 15,347 | | | | 4,562,356 | |
| | |
Helen of Troy, Ltd.* | | | 20,534 | | | | 1,904,323 | |
| | |
Patrick Industries, Inc. | | | 22,500 | | | | 2,442,375 | |
| | |
Tri Pointe Homes, Inc.* | | | 71,105 | | | | 2,648,661 | |
| | |
Worthington Enterprises, Inc.1 | | | 44,938 | | | | 2,126,916 | |
| | |
Total Consumer Discretionary | | | | | | | 28,442,677 | |
| |
Consumer Staples - 1.8% | | | | | |
| | |
Central Garden & Pet Co.*,1 | | | 93,790 | | | | 3,610,915 | |
| | |
Central Garden & Pet Co., Class A* | | | 22,441 | | | | 741,226 | |
| | |
Total Consumer Staples | | | | | | | 4,352,141 | |
| |
Energy - 9.6% | | | | | |
| | |
California Resources Corp. | | | 36,140 | | | | 1,923,371 | |
| | |
Chord Energy Corp. | | | 21,275 | | | | 3,567,392 | |
| | |
Crescent Energy Co., Class A | | | 156,270 | | | | 1,851,799 | |
| | |
Magnolia Oil & Gas Corp., Class A | | | 124,805 | | | | 3,162,559 | |
| | |
Matador Resources Co. | | | 53,411 | | | | 3,183,296 | |
| | |
Northern Oil & Gas, Inc. | | | 64,385 | | | | 2,393,190 | |
| | |
Permian Resources Corp. | | | 301,468 | | | | 4,868,708 | |
| | |
Solaris Oilfield Infrastructure, Inc., Class A | | | 180,390 | | | | 1,547,746 | |
| | |
Total Energy | | | | | | | 22,498,061 | |
| |
Financials - 27.7% | | | | | |
| | |
Ameris Bancorp | | | 74,044 | | | | 3,728,115 | |
| | |
Atlantic Union Bankshares Corp. | | | 107,524 | | | | 3,532,163 | |
| | |
Cathay General Bancorp | | | 69,397 | | | | 2,617,655 | |
| | |
City Holding Co. | | | 30,866 | | | | 3,279,513 | |
| | |
Community Financial System, Inc. | | | 50,295 | | | | 2,374,427 | |
| | |
Enterprise Financial Services Corp. | | | 47,735 | | | | 1,952,839 | |
| | |
Federal Agricultural Mortgage Corp., Class C | | | 28,422 | | | | 5,139,266 | |
| | |
First Financial Bancorp | | | 112,739 | | | | 2,505,061 | |
| | |
First Interstate BancSystem, Inc., Class A | | | 105,905 | | | | 2,940,982 | |
| | |
Glacier Bancorp, Inc. | | | 51,595 | | | | 1,925,525 | |
| | | | | | | | |
| | | Shares | | | Value | |
| | |
International Bancshares Corp. | | | 69,248 | | | | $3,961,678 | |
| | |
OceanFirst Financial Corp. | | | 118,803 | | | | 1,887,780 | |
| | |
Pacific Premier Bancorp, Inc. | | | 85,289 | | | | 1,959,088 | |
| | |
Piper Sandler Cos. | | | 22,907 | | | | 5,272,504 | |
| | |
PJT Partners, Inc., Class A1 | | | 43,388 | | | | 4,681,999 | |
| | |
Seacoast Banking Corp. of Florida | | | 73,427 | | | | 1,735,814 | |
| | |
Selective Insurance Group, Inc. | | | 54,113 | | | | 5,077,423 | |
| | |
Stifel Financial Corp. | | | 51,326 | | | | 4,319,083 | |
| | |
Walker & Dunlop, Inc. | | | 45,082 | | | | 4,427,052 | |
| | |
WesBanco, Inc. | | | 57,823 | | | | 1,613,840 | |
| | |
Total Financials | | | | | | | 64,931,807 | |
| |
Health Care - 8.0% | | | | | |
| | |
BioCryst Pharmaceuticals, Inc.* | | | 228,310 | | | | 1,410,956 | |
| | |
Integer Holdings Corp.* | | | 42,722 | | | | 4,946,780 | |
| | |
Ligand Pharmaceuticals, Inc.* | | | 35,233 | | | | 2,968,733 | |
| | |
NeoGenomics, Inc.* | | | 196,508 | | | | 2,725,566 | |
| | |
OmniAb, Inc.*,2,3 | | | 10,502 | | | | 0 | |
| | |
OmniAb, Inc.*,2,3 | | | 10,502 | | | | 0 | |
| | |
Paragon 28, Inc.*,1 | | | 312,944 | | | | 2,140,537 | |
| | |
Supernus Pharmaceuticals, Inc.* | | | 95,206 | | | | 2,546,761 | |
| | |
Ultragenyx Pharmaceutical, Inc.* | | | 49,554 | | | | 2,036,669 | |
| | |
Total Health Care | | | | | | | 18,776,002 | |
| |
Industrials - 15.0% | | | | | |
| | |
Atkore, Inc. | | | 25,134 | | | | 3,391,331 | |
| | |
CBIZ, Inc.* | | | 63,178 | | | | 4,681,490 | |
| | |
Chart Industries, Inc.*,1 | | | 18,175 | | | | 2,623,379 | |
| | |
Columbus McKinnon Corp. | | | 84,602 | | | | 2,922,153 | |
| | |
Gates Industrial Corp. PLC* | | | 134,675 | | | | 2,129,212 | |
| | |
Hillenbrand, Inc. | | | 76,096 | | | | 3,045,362 | |
| | |
Hillman Solutions Corp.* | | | 181,819 | | | | 1,609,098 | |
| | |
ICF International, Inc. | | | 13,382 | | | | 1,986,692 | |
| | |
MDU Resources Group, Inc. | | | 94,000 | | | | 2,359,400 | |
| | |
Primoris Services Corp. | | | 101,950 | | | | 5,086,285 | |
| | |
UFP Industries, Inc. | | | 34,398 | | | | 3,852,576 | |
| | |
Wabash National Corp. | | | 65,875 | | | | 1,438,710 | |
| | |
Total Industrials | | | | | | | 35,125,688 | |
| |
Information Technology - 3.1% | | | | | |
| | |
Endava PLC, Sponsored ADR (United Kingdom)* | | | 46,405 | | | | 1,356,882 | |
| | |
Power Integrations, Inc. | | | 28,854 | | | | 2,025,262 | |
| | |
Silicon Laboratories, Inc.* | | | 23,804 | | | | 2,633,437 | |
| | |
Viavi Solutions, Inc.* | | | 185,325 | | | | 1,273,183 | |
| | |
Total Information Technology | | | | | | | 7,288,764 | |
The accompanying notes are an integral part of these financial statements.
5
| | |
| | AMG GW&K Small Cap Value Fund Schedule of Portfolio Investments (continued) |
| | | | | | | | |
| | | Shares | | | Value | |
| | |
Materials - 4.6% | | | | | | | | |
| | |
Minerals Technologies, Inc. | | | 35,796 | | | | $2,976,795 | |
| | |
Orion, S.A. | | | 172,651 | | | | 3,787,963 | |
| | |
Radius Recycling, Inc., Class A | | | 56,920 | | | | 869,168 | |
| | |
Silgan Holdings, Inc. | | | 38,550 | | | | 1,631,822 | |
| | |
Worthington Steel, Inc. | | | 44,818 | | | | 1,495,129 | |
| | |
Total Materials | | | | | | | 10,760,877 | |
| | |
Real Estate - 11.2% | | | | | | | | |
| | |
Acadia Realty Trust, REIT | | | 112,810 | | | | 2,021,555 | |
| | |
Agree Realty Corp., REIT | | | 40,922 | | | | 2,534,709 | |
| | |
Essential Properties Realty Trust, Inc., REIT 1 | | | 85,000 | | | | 2,355,350 | |
| | |
Four Corners Property Trust, Inc.,
REIT 1 | | | 125,018 | | | | 3,084,194 | |
| | |
Getty Realty Corp., REIT | | | 103,202 | | | | 2,751,365 | |
| | |
Independence Realty Trust, Inc., REIT | | | 267,697 | | | | 5,016,642 | |
| | |
LXP Industrial Trust, REIT | | | 144,974 | | | | 1,322,163 | |
| | |
Plymouth Industrial REIT, Inc. | | | 99,215 | | | | 2,121,217 | |
| | |
STAG Industrial, Inc., REIT | | | 78,525 | | | | 2,831,611 | |
| | |
Xenia Hotels & Resorts, Inc., REIT | | | 156,546 | | | | 2,243,304 | |
| | |
Total Real Estate | | | | | | | 26,282,110 | |
| | |
Utilities - 3.2% | | | | | | | | |
| | |
IDACORP, Inc. | | | 31,049 | | | | 2,892,214 | |
| | |
Northwestern Energy Group, Inc. | | | 43,933 | | | | 2,200,165 | |
| | * | Non-income producing security. |
| | 1 | Some of these securities, amounting to $11,857,013 or 5.1% of net assets, were out on loan to various borrowers and are collateralized by cash and various U.S. Treasury Obligations. See Note 4 of Notes to Financial Statements. |
| | 2 | Security’s value was determined by using significant unobservable inputs. |
| | 3 | These securities are restricted and are not available for re-sale. Ligand Pharmaceuticals, Inc. (“Ligand”) completed a spin-off of OmniAb, Inc on November 2, 2022. Ligand shareholders received new holdings of OmniAb earn-out shares. The market value of earn-out shares was $0 on the date of the spin-off. At June 30, 2024, for each holding of OmniAb earn-out shares the cost was $19,190 and the market value of each was $0, which represents 0% of net assets. |
| | | | | | | | |
| | | Shares | | | Value | |
| | |
Southwest Gas Holdings, Inc. | | | 33,732 | | | | $2,374,058 | |
| | |
Total Utilities | | | | | | | 7,466,437 | |
| | |
Total Common Stocks | | | | | | | | |
(Cost $188,673,976) | | | | | | | 230,355,167 | |
| | |
| | | Principal
Amount | | | | |
Short-Term Investments - 2.1% | | | | | | | | |
| |
Joint Repurchase Agreements - 0.4%4 | | | | | |
| | |
Bethesda Securities LLC, dated 06/28/24, due 07/01/24, 5.450% total to be received $913,478 (collateralized by various U.S. Government Agency Obligations, 2.500% - 6.070%, 10/01/27 - 01/01/57, totaling $931,324) | | | $913,063 | | | | 913,063 | |
| |
Repurchase Agreements - 1.7% | | | | | |
| | |
Fixed Income Clearing Corp., dated 06/28/24, due 07/01/24, 5.150% total to be received $4,114,765 (collateralized by a U.S. Treasury Note, 0.125%, 04/15/25, totaling $4,195,295) | | | 4,113,000 | | | | 4,113,000 | |
| | |
Total Short-Term Investments | | | | | | | | |
(Cost $5,026,063) | | | | | | | 5,026,063 | |
| | |
Total Investments - 100.3% | | | | | | | | |
(Cost $193,700,039) | | | | | | | 235,381,230 | |
| |
Other Assets, less Liabilities - (0.3)% | | | | (808,319 | ) |
| | |
Net Assets - 100.0% | | | | | | | $234,572,911 | |
| | 4 | Cash collateral received for securities lending activity was invested in these joint repurchase agreements. |
| | ADR | American Depositary Receipt |
| | REIT | Real Estate Investment Trust |
The accompanying notes are an integral part of these financial statements.
6
| | |
| | AMG GW&K Small Cap Value Fund Schedule of Portfolio Investments (continued) |
The following table summarizes the inputs used to value the Fund’s investments by the fair value hierarchy levels as of June 30, 2024:
| | | | | | | | | | | | | | | | |
| | | Level 1 | | | Level 2 | | | Level 3 | | | Total | |
| | | | |
Investments in Securities | | | | | | | | | | | | | | | | |
| | | | |
Common Stocks | | | | | | | | | | | | | | | | |
| | | | |
Financials | | | $64,931,807 | | | | — | | | | — | | | | $64,931,807 | |
| | | | |
Industrials | | | 35,125,688 | | | | — | | | | — | | | | 35,125,688 | |
| | | | |
Consumer Discretionary | | | 28,442,677 | | | | — | | | | — | | | | 28,442,677 | |
| | | | |
Real Estate | | | 26,282,110 | | | | — | | | | — | | | | 26,282,110 | |
| | | | |
Energy | | | 22,498,061 | | | | — | | | | — | | | | 22,498,061 | |
| | | | |
Health Care | | | 18,776,002 | | | | — | | | | $0 | | | | 18,776,002 | |
| | | | |
Materials | | | 10,760,877 | | | | — | | | | — | | | | 10,760,877 | |
| | | | |
Utilities | | | 7,466,437 | | | | — | | | | — | | | | 7,466,437 | |
| | | | |
Information Technology | | | 7,288,764 | | | | — | | | | — | | | | 7,288,764 | |
| | | | |
Communication Services | | | 4,430,603 | | | | — | | | | — | | | | 4,430,603 | |
| | | | |
Consumer Staples | | | 4,352,141 | | | | — | | | | — | | | | 4,352,141 | |
| | | | |
Short-Term Investments | | | | | | | | | | | | | | | | |
| | | | |
Joint Repurchase Agreements | | | — | | | | $913,063 | | | | — | | | | 913,063 | |
| | | | |
Repurchase Agreements | | | — | | | | 4,113,000 | | | | — | | | | 4,113,000 | |
| | | | | | | | | | | | | | | | |
| | | | |
Total Investments in Securities | | | $230,355,167 | | | | $5,026,063 | | | | $0 | | | | $235,381,230 | |
| | | | | | | | | | | | | | | | |
The Level 3 common stocks were received as a result of a corporate action. The security’s value was determined by using significant unobservable inputs. For the current period ended June 30, 2024, the change in unrealized depreciation was $0.
For the six months ended June 30, 2024, there were no transfers in or out of Level 3. The Fund did not have any purchases and sales of Level 3 securities for the same period.
The accompanying notes are an integral part of these financial statements.
7
| | |
| | AMG GW&K Small/Mid Cap Core Fund Schedule of Portfolio Investments (unaudited) June 30, 2024 |
| | | | | | | | |
| | | Shares | | | Value | |
| | |
Common Stocks - 97.4% | | | | | | | | |
| |
Consumer Discretionary - 13.4% | | | | | |
| | |
Bright Horizons Family Solutions, Inc.* | | | 79,640 | | | | $8,766,771 | |
| | |
Burlington Stores, Inc.* | | | 38,334 | | | | 9,200,160 | |
| | |
Carter’s, Inc. | | | 44,588 | | | | 2,763,119 | |
| | |
Cavco Industries, Inc.* | | | 34,283 | | | | 11,867,746 | |
| | |
Churchill Downs, Inc. | | | 44,500 | | | | 6,212,200 | |
| | |
Dorman Products, Inc.* | | | 74,731 | | | | 6,836,392 | |
| | |
Five Below, Inc.* | | | 44,261 | | | | 4,823,121 | |
| | |
Gentherm, Inc.* | | | 84,894 | | | | 4,186,972 | |
| | |
Grand Canyon Education, Inc.* | | | 40,741 | | | | 5,700,073 | |
| | |
Group 1 Automotive, Inc. | | | 19,409 | | | | 5,769,908 | |
| | |
Polaris, Inc. | | | 64,164 | | | | 5,024,683 | |
| | |
Texas Roadhouse, Inc. | | | 91,130 | | | | 15,647,932 | |
| | |
Tri Pointe Homes, Inc.* | | | 95,145 | | | | 3,544,151 | |
| | |
Vail Resorts, Inc. | | | 23,137 | | | | 4,167,668 | |
| | |
Total Consumer Discretionary | | | | | | | 94,510,896 | |
| |
Consumer Staples - 5.0% | | | | | |
| | |
BJ’s Wholesale Club Holdings, Inc.* | | | 184,534 | | | | 16,209,467 | |
| | |
Lancaster Colony Corp. | | | 44,004 | | | | 8,315,436 | |
| | |
Performance Food Group Co.* | | | 161,113 | | | | 10,651,180 | |
| | |
Total Consumer Staples | | | | | | | 35,176,083 | |
| |
Energy - 4.2% | | | | | |
| | |
ChampionX Corp. | | | 125,771 | | | | 4,176,855 | |
| | |
Magnolia Oil & Gas Corp., Class A1 | | | 261,251 | | | | 6,620,101 | |
| | |
Matador Resources Co. | | | 109,370 | | | | 6,518,452 | |
| | |
Ovintiv, Inc. | | | 156,175 | | | | 7,319,922 | |
| | |
Permian Resources Corp. | | | 331,000 | | | | 5,345,650 | |
| | |
Total Energy | | | | | | | 29,980,980 | |
| |
Financials - 10.8% | | | | | |
| | |
Atlantic Union Bankshares Corp. | | | 186,881 | | | | 6,139,041 | |
| | |
Glacier Bancorp, Inc. | | | 124,490 | | | | 4,645,967 | |
| | |
Kinsale Capital Group, Inc. | | | 26,725 | | | | 10,296,608 | |
| | |
MarketAxess Holdings, Inc. | | | 18,416 | | | | 3,692,961 | |
| | |
Pinnacle Financial Partners, Inc. | | | 125,308 | | | | 10,029,652 | |
| | |
Piper Sandler Cos. | | | 59,484 | | | | 13,691,432 | |
| | |
Stifel Financial Corp. | | | 94,428 | | | | 7,946,116 | |
| | |
Voya Financial, Inc. | | | 165,767 | | | | 11,794,322 | |
| | |
Wintrust Financial Corp. | | | 84,047 | | | | 8,283,672 | |
| | |
Total Financials | | | | | | | 76,519,771 | |
| |
Health Care - 13.8% | | | | | |
| | |
Acadia Healthcare Co., Inc.* | | | 92,720 | | | | 6,262,309 | |
| | |
Azenta, Inc.* | | | 129,883 | | | | 6,834,443 | |
| | | | | | | | |
| | | Shares | | | Value | |
| | |
Bio-Rad Laboratories, Inc., Class A* | | | 21,302 | | | | $5,817,789 | |
| | |
Globus Medical, Inc., Class A* | | | 147,121 | | | | 10,076,317 | |
| | |
Halozyme Therapeutics, Inc.* | | | 160,450 | | | | 8,401,162 | |
| | |
Hologic, Inc.* | | | 136,677 | | | | 10,148,267 | |
| | |
Integer Holdings Corp.* | | | 93,500 | | | | 10,826,365 | |
| | |
Intra-Cellular Therapies, Inc.* | | | 114,415 | | | | 7,836,283 | |
| | |
Jazz Pharmaceuticals PLC* | | | 60,934 | | | | 6,503,486 | |
| | |
Neurocrine Biosciences, Inc.* | | | 77,859 | | | | 10,718,849 | |
| | |
Tandem Diabetes Care, Inc.* | | | 219,403 | | | | 8,839,747 | |
| | |
Vericel Corp.* | | | 125,862 | | | | 5,774,549 | |
| | |
Total Health Care | | | | | | | 98,039,566 | |
| | |
Industrials - 23.5% | | | | | | | | |
| | |
API Group Corp.* | | | 246,256 | | | | 9,266,613 | |
| | |
Atkore, Inc. | | | 59,913 | | | | 8,084,061 | |
| | |
Booz Allen Hamilton Holding Corp. | | | 63,205 | | | | 9,727,250 | |
| | |
Chart Industries, Inc.*,1 | | | 39,859 | | | | 5,753,248 | |
| | |
Columbus McKinnon Corp. | | | 171,331 | | | | 5,917,773 | |
| | |
Comfort Systems USA, Inc. | | | 40,162 | | | | 12,214,068 | |
| | |
Exponent, Inc. | | | 75,716 | | | | 7,202,106 | |
| | |
Federal Signal Corp. | | | 126,415 | | | | 10,577,143 | |
| | |
Gates Industrial Corp. PLC* | | | 560,881 | | | | 8,867,529 | |
| | |
Gibraltar Industries, Inc.* | | | 98,740 | | | | 6,768,627 | |
| | |
Hexcel Corp. | | | 82,525 | | | | 5,153,686 | |
| | |
IDEX Corp. | | | 51,777 | | | | 10,417,532 | |
| | |
ITT, Inc. | | | 73,617 | | | | 9,509,844 | |
| | |
Lincoln Electric Holdings, Inc. | | | 36,372 | | | | 6,861,214 | |
| | |
Nordson Corp. | | | 44,800 | | | | 10,390,912 | |
| | |
Paylocity Holding Corp.* | | | 50,135 | | | | 6,610,300 | |
| | |
RBC Bearings, Inc.* | | | 35,499 | | | | 9,576,920 | |
| | |
Schneider National, Inc., Class B1 | | | 207,177 | | | | 5,005,396 | |
| | |
Simpson Manufacturing Co., Inc. | | | 26,312 | | | | 4,434,361 | |
| | |
SiteOne Landscape Supply, Inc.* | | | 53,140 | | | | 6,451,727 | |
| | |
The Toro Co. | | | 78,791 | | | | 7,367,747 | |
| | |
Total Industrials | | | | | | | 166,158,057 | |
| | |
Information Technology - 13.9% | | | | | | | | |
| | |
CCC Intelligent Solutions Holdings, Inc.* | | | 942,849 | | | | 10,475,052 | |
| | |
Cognex Corp. | | | 218,357 | | | | 10,210,373 | |
| | |
CyberArk Software, Ltd. (Israel)* | | | 52,184 | | | | 14,268,149 | |
| | |
Entegris, Inc. | | | 95,159 | | | | 12,884,529 | |
| | |
Globant SA (Uruguay)* | | | 48,918 | | | | 8,720,123 | |
| | |
MACOM Technology Solutions Holdings, Inc.* | | | 75,444 | | | | 8,409,743 | |
| | |
Manhattan Associates, Inc.* | | | 50,233 | | | | 12,391,476 | |
| | |
Procore Technologies, Inc.* | | | 108,395 | | | | 7,187,673 | |
The accompanying notes are an integral part of these financial statements.
8
| | |
| | AMG GW&K Small/Mid Cap Core Fund Schedule of Portfolio Investments (continued) |
| | | | | | | | |
| | | Shares | | | Value | |
| |
Information Technology - 13.9% | | | | | |
(continued) | | | | | | | | |
| | |
Silicon Laboratories, Inc.* | | | 51,178 | | | | $5,661,822 | |
| | |
Zebra Technologies Corp., Class A* | | | 25,896 | | | | 8,000,051 | |
| | |
Total Information Technology | | | | | | | 98,208,991 | |
| |
Materials - 6.2% | | | | | |
| | |
AptarGroup, Inc. | | | 37,696 | | | | 5,307,974 | |
| | |
Eagle Materials, Inc. | | | 47,353 | | | | 10,297,383 | |
| | |
Element Solutions, Inc. | | | 420,193 | | | | 11,395,634 | |
| | |
Quaker Chemical Corp. | | | 46,571 | | | | 7,903,099 | |
| | |
RPM International, Inc. | | | 83,993 | | | | 9,044,366 | |
| | |
Total Materials | | | | | | | 43,948,456 | |
| |
Real Estate - 4.7% | | | | | |
| | |
Agree Realty Corp., REIT | | | 100,620 | | | | 6,232,403 | |
| | |
Easterly Government Properties, Inc., REIT 1 | | | 392,562 | | | | 4,855,992 | |
| | |
EastGroup Properties, Inc., REIT | | | 40,290 | | | | 6,853,329 | |
| | |
Healthpeak Properties, Inc., REIT | | | 168,711 | | | | 3,306,735 | |
| | |
National Storage Affiliates Trust, REIT | | | 117,294 | | | | 4,834,859 | |
| | |
Sun Communities, Inc., REIT | | | 60,732 | | | | 7,308,489 | |
| | |
Total Real Estate | | | | | | | 33,391,807 | |
| | | | | | | | |
| | | Shares | | | Value | |
| |
Utilities - 1.9% | | | | | |
| | |
IDACORP, Inc. | | | 71,751 | | | | $6,683,605 | |
| | |
Portland General Electric Co.1 | | | 149,399 | | | | 6,460,013 | |
| | |
Total Utilities | | | | | | | 13,143,618 | |
| | |
Total Common Stocks | | | | | | | | |
(Cost $567,364,513) | | | | | | | 689,078,225 | |
| | |
| | | Principal
Amount | | | | |
| | |
Short-Term Investments - 2.3% | | | | | | | | |
| |
Repurchase Agreements - 2.3% | | | | | |
| | |
Fixed Income Clearing Corp., dated 06/28/24, due 07/01/24, 5.150% total to be received $16,506,081 (collateralized by a U.S. Treasury Note, 0.125%, 04/15/25, totaling $16,829,088) | | $ | 16,499,000 | | | | 16,499,000 | |
Total Short-Term Investments | | | | | | | | |
(Cost $16,499,000) | | | | | | | 16,499,000 | |
Total Investments - 99.7% | | | | | | | | |
(Cost $583,863,513) | | | | | | | 705,577,225 | |
Other Assets, less Liabilities - 0.3% | | | | 2,284,990 | |
| | |
Net Assets - 100.0% | | | | | | | $707,862,215 | |
| | * | Non-income producing security. |
| | 1 | Some of these securities, amounting to $20,397,995 or 2.9% of net assets, were out on loan to various borrowers and are collateralized by various U.S. Treasury Obligations. |
| | | See Note 4 of Notes to Financial Statements. |
REIT Real Estate Investment Trust
The following table summarizes the inputs used to value the Fund’s investments by the fair value hierarchy levels as of June 30, 2024:
| | | | | | | | | | | | | | | | |
| | | Level 1 | | | Level 2 | | | Level 3 | | | Total | |
| | | | |
Investments in Securities | | | | | | | | | | | | | | | | |
| | | | |
Common Stocks† | | $ | 689,078,225 | | | | — | | | | — | | | $ | 689,078,225 | |
| | | | |
Short-Term Investments | | | | | | | | | | | | | | | | |
| | | | |
Repurchase Agreements | | | — | | | $ | 16,499,000 | | | | — | | | | 16,499,000 | |
| | | | | | | | | | | | | | | | |
| | | | |
Total Investments in Securities | | $ | 689,078,225 | | | $ | 16,499,000 | | | | — | | | $ | 705,577,225 | |
| | | | | | | | | | | | | | | | |
| | † | All common stocks held in the Fund are Level 1 securities. For a detailed breakout of common stocks by major industry classification, please refer to the Fund’s Schedule of Portfolio Investments. |
For the six months ended June 30, 2024, there were no transfers in or out of Level 3.
The accompanying notes are an integral part of these financial statements.
9
| | |
| | Statement of Assets and Liabilities (unaudited) June 30, 2024 |
| | | | | | | | | | | | | | | |
| | | AMG
GW&K Small Cap
Core Fund | | AMG
GW&K Small Cap
Value Fund | | AMG
GW&K Small/Mid
Cap
Core Fund |
| | | |
Assets: | | | | | | | | | | | | | | | |
| | | |
Investments at value1 (including securities on loan valued at $42,508,487, $11,857,013, and $20,397,995, respectively) | | | | $625,308,155 | | | | | $235,381,230 | | | | | $705,577,225 | |
| | | |
Cash | | | | 250 | | | | | 155 | | | | | 3,560,554 | |
| | | |
Receivable for investments sold | | | | — | | | | | — | | | | | 4,008,678 | |
| | | |
Dividend and interest receivables | | | | 424,814 | | | | | 370,463 | | | | | 382,504 | |
| | | |
Securities lending income receivable | | | | 4,740 | | | | | 1,467 | | | | | 1,326 | |
| | | |
Receivable for Fund shares sold | | | | 6,404 | | | | | 21,397 | | | | | 380,556 | |
| | | |
Receivable from affiliate | | | | 2,389 | | | | | 9,044 | | | | | 2,596 | |
| | | |
Prepaid expenses and other assets | | | | 26,714 | | | | | 21,429 | | | | | 35,737 | |
| | | |
Total assets | | | | 625,773,466 | | | | | 235,805,185 | | | | | 713,949,176 | |
| | | |
Liabilities: | | | | | | | | | | | | | | | |
| | | |
Payable upon return of securities loaned | | | | 3,823,873 | | | | | 913,063 | | | | | — | |
| | | |
Payable for investments purchased | | | | — | | | | | — | | | | | 5,363,921 | |
| | | |
Payable for Fund shares repurchased | | | | 1,865,976 | | | | | 68,046 | | | | | 174,910 | |
| | | |
Accrued expenses: | | | | | | | | | | | | | | | |
| | | |
Investment advisory and management fees | | | | 355,013 | | | | | 134,424 | | | | | 356,735 | |
| | | |
Administrative fees | | | | 76,074 | | | | | 28,805 | | | | | 86,307 | |
| | | |
Distribution fees | | | | 1,628 | | | | | — | | | | | 10,664 | |
| | | |
Shareholder service fees | | | | 18,214 | | | | | 33,712 | | | | | 13,110 | |
| | | |
Other | | | | 90,694 | | | | | 54,224 | | | | | 81,314 | |
| | | |
Total liabilities | | | | 6,231,472 | | | | | 1,232,274 | | | | | 6,086,961 | |
| | | |
Commitments and Contingencies (Notes 2 & 6) | | | | | | | | | | | | | | | |
| | | |
Net Assets | | | | $619,541,994 | | | | | $234,572,911 | | | | | $707,862,215 | |
| | | |
1 Investments at cost | | | | $472,337,768 | | | | | $193,700,039 | | | | | $583,863,513 | |
The accompanying notes are an integral part of these financial statements.
10
| | |
| | Statement of Assets and Liabilities (continued) |
| | | | | | | | | | | | | | | |
| | | AMG
GW&K Small Cap
Core Fund | | AMG
GW&K Small Cap
Value Fund | | AMG
GW&K Small/Mid
Cap
Core Fund |
| | | |
Net Assets Represent: | | | | | | | | | | | | | | | |
| | | |
Paid-in capital | | | | $448,663,410 | | | | | $176,034,922 | | | | | $581,720,101 | |
| | | |
Total distributable earnings | | | | 170,878,584 | | | | | 58,537,989 | | | | | 126,142,114 | |
| | | |
Net Assets | | | | $619,541,994 | | | | | $234,572,911 | | | | | $707,862,215 | |
| | | |
Class N: | | | | | | | | | | | | | | | |
| | | |
Net Assets | | | | $7,851,045 | | | | | $148,542,028 | | | | | $51,943,582 | |
| | | |
Shares outstanding | | | | 261,213 | | | | | 5,049,946 | | | | | 2,934,890 | |
| | | |
Net asset value, offering and redemption price per share | | | | $30.06 | | | | | $29.41 | | | | | $17.70 | |
| | | |
Class I: | | | | | | | | | | | | | | | |
| | | |
Net Assets | | | | $420,684,110 | | | | | $80,076,009 | | | | | $322,140,224 | |
| | | |
Shares outstanding | | | | 13,566,980 | | | | | 2,723,057 | | | | | 18,119,059 | |
| | | |
Net asset value, offering and redemption price per share | | | | $31.01 | | | | | $29.41 | | | | | $17.78 | |
| | | |
Class Z: | | | | | | | | | | | | | | | |
| | | |
Net Assets | | | | $191,006,839 | | | | | $5,954,874 | | | | | $333,778,409 | |
| | | |
Shares outstanding | | | | 6,153,779 | | | | | 203,275 | | | | | 18,737,329 | |
| | | |
Net asset value, offering and redemption price per share | | | | $31.04 | | | | | $29.29 | | | | | $17.81 | |
The accompanying notes are an integral part of these financial statements.
11
| | |
| | Statement of Operations (unaudited) For the six months ended June 30, 2024 |
| | | | | | | | | | | | |
| | | AMG
GW&K Small Cap
Core Fund | | AMG
GW&K Small Cap
Value Fund | | AMG
GW&K Small/Mid
Cap
Core Fund |
| | | |
Investment Income: | | | | | | | | | | | | |
| | | |
Dividend income | | | $3,316,989 | | | | $2,548,867 | | | | $3,334,356 | |
| | | |
Interest income | | | 301,179 | | | | 63,942 | | | | 276,716 | |
| | | |
Securities lending income | | | 17,142 | | | | 9,362 | | | | 7,779 | |
| | | |
Foreign withholding tax | | | (280 | ) | | | (1,103 | ) | | | (49 | ) |
| | | |
Total investment income | | | 3,635,030 | | | | 2,621,068 | | | | 3,618,802 | |
| | | |
Expenses: | | | | | | | | | | | | |
| | | |
Investment advisory and management fees | | | 2,194,266 | | | | 852,694 | | | | 2,157,496 | |
| | | |
Administrative fees | | | 470,200 | | | | 182,720 | | | | 521,975 | |
| | | |
Distribution fees - Class N | | | 10,174 | | | | — | | | | 66,289 | |
| | | |
Shareholder servicing fees - Class N | | | 6,104 | | | | 193,507 | | | | — | |
| | | |
Shareholder servicing fees - Class I | | | 104,349 | | | | 20,684 | | | | 77,851 | |
| | | |
Professional fees | | | 36,789 | | | | 27,137 | | | | 40,299 | |
| | | |
Custodian fees | | | 32,234 | | | | 17,954 | | | | 31,225 | |
| | | |
Registration fees | | | 27,475 | | | | 21,874 | | | | 26,722 | |
| | | |
Trustee fees and expenses | | | 24,118 | | | | 9,310 | | | | 26,064 | |
| | | |
Reports to shareholders | | | 23,865 | | | | 14,700 | | | | 23,269 | |
| | | |
Transfer agent fees | | | 12,667 | | | | 12,134 | | | | 16,871 | |
| | | |
Interest expense | | | — | | | | — | | | | 10,379 | |
| | | |
Miscellaneous | | | 17,072 | | | | 7,874 | | | | 15,534 | |
| | | |
Total expenses before offsets | | | 2,959,313 | | | | 1,360,588 | | | | 3,013,974 | |
| | | |
Expense reimbursements | | | (17,487 | ) | | | (50,076 | ) | | | (5,992 | ) |
| | | |
Expense reductions | | | (2,733 | ) | | | (12,000 | ) | | | (15,097 | ) |
| | | |
Net expenses | | | 2,939,093 | | | | 1,298,512 | | | | 2,992,885 | |
| | | | | | | | | | | | |
| | | |
Net investment income | | | 695,937 | | | | 1,322,556 | | | | 625,917 | |
| | | |
Net Realized and Unrealized Gain (Loss): | | | | | | | | | | | | |
| | | |
Net realized gain on investments | | | 19,821,404 | | | | 13,735,511 | | | | 16,404,237 | |
| | | |
Net change in unrealized appreciation/depreciation on investments | | | (6,259,592 | ) | | | (18,048,652 | ) | | | 3,625,213 | |
| | | |
Net realized and unrealized gain (loss) | | | 13,561,812 | | | | (4,313,141 | ) | | | 20,029,450 | |
| | | | | | | | | | | | |
| | | |
Net increase (decrease) in net assets resulting from operations | | | $14,257,749 | | | | $(2,990,585 | ) | | | $20,655,367 | |
The accompanying notes are an integral part of these financial statements.
12
| | |
| | Statements of Changes in Net Assets For the six months ended June 30, 2024 (unaudited) and the fiscal year ended December 31, 2023 |
| | | | | | | | | | | | | | | | |
| | | AMG
GW&K Small Cap
Core Fund | | AMG
GW&K Small Cap
Value Fund |
| | | | |
| | | June 30, 2024 | | December 31, 2023 | | June 30, 2024 | | December 31, 2023 |
| | | | |
Increase (Decrease) in Net Assets Resulting From Operations: | | | | | | | | | | | | | | | | |
| | | | |
Net investment income | | | $695,937 | | | | $2,529,328 | | | | $1,322,556 | | | | $1,789,651 | |
| | | | |
Net realized gain on investments | | | 19,821,404 | | | | 1,660,979 | | | | 13,735,511 | | | | 2,909,094 | |
| | | | |
Net change in unrealized appreciation/depreciation on investments | | | (6,259,592 | ) | | | 44,726,622 | | | | (18,048,652 | ) | | | 35,560,602 | |
| | | | |
Net increase (decrease) in net assets resulting from operations | | | 14,257,749 | | | | 48,916,929 | | | | (2,990,585 | ) | | | 40,259,347 | |
| | | | |
Distributions to Shareholders: | | | | | | | | | | | | | | | | |
| | | | |
Class N | | | — | | | | (58,273 | ) | | | — | | | | (2,472,103 | ) |
| | | | |
Class I | | | — | | | | (4,206,615 | ) | | | — | | | | (1,481,630 | ) |
| | | | |
Class Z | | | — | | | | (2,323,516 | ) | | | — | | | | (107,131 | ) |
| | | | |
Total distributions to shareholders | | | — | | | | (6,588,404 | ) | | | — | | | | (4,060,864 | ) |
| | | | |
Capital Share Transactions:1 | | | | | | | | | | | | | | | | |
| | | | |
Net decrease from capital share transactions | | | (35,431,029 | ) | | | (62,153,366 | ) | | | (20,035,268 | ) | | | (30,511,025 | ) |
| | | | | | | | | | | | | | | | |
| | | | |
Total increase (decrease) in net assets | | | (21,173,280 | ) | | | (19,824,841 | ) | | | (23,025,853 | ) | | | 5,687,458 | |
| | | | |
Net Assets: | | | | | | | | | | | | | | | | |
| | | | |
Beginning of period | | | 640,715,274 | | | | 660,540,115 | | | | 257,598,764 | | | | 251,911,306 | |
| | | | |
End of period | | | $619,541,994 | | | | $640,715,274 | | | | $234,572,911 | | | | $257,598,764 | |
1 See Note 1(g) of the Notes to Financial Statements.
The accompanying notes are an integral part of these financial statements.
13
| | |
| | Statements of Changes in Net Assets (continued) For the six months ended June 30, 2024 (unaudited) and the fiscal year ended December 31, 2023 |
| | | | | | | | | | |
| | | AMG
GW&K Small/Mid
Cap Core Fund |
| | |
| | | June 30, 2024 | | December 31, 2023 |
| | |
Increase in Net Assets Resulting From Operations: | | | | | | | | | | |
| | |
Net investment income | | | | $625,917 | | | | | $1,287,315 | |
| | |
Net realized gain (loss) on investments | | | | 16,404,237 | | | | | (7,110,048 | ) |
| | |
Net change in unrealized appreciation/depreciation on investments | | | | 3,625,213 | | | | | 92,679,674 | |
| | |
Net increase in net assets resulting from operations | | | | 20,655,367 | | | | | 86,856,941 | |
| | |
Distributions to Shareholders: | | | | | | | | | | |
| | |
Class I | | | | — | | | | | (568,708 | ) |
| | |
Class Z | | | | — | | | | | (857,186 | ) |
| | |
Total distributions to shareholders | | | | — | | | | | (1,425,894 | ) |
| | |
Capital Share Transactions:1 | | | | | | | | | | |
| | |
Net increase (decrease) from capital share transactions | | | | (9,706,200 | ) | | | | 47,327,881 | |
| | | | | | | | | | |
| | |
Total increase in net assets | | | | 10,949,167 | | | | | 132,758,928 | |
| | |
Net Assets: | | | | | | | | | | |
| | |
Beginning of period | | | | 696,913,048 | | | | | 564,154,120 | |
| | |
End of period | | | | $707,862,215 | | | | | $696,913,048 | |
| 1 | See Note 1(g) of the Notes to Financial Statements. |
The accompanying notes are an integral part of these financial statements.
14
| | |
| | AMG GW&K Small Cap Core Fund Financial Highlights For a share outstanding throughout each fiscal period |
| | | | | | | | | | | | | | | | | | | | | | | | | | | | | | | | |
| | | For the six months ended | | | | For the fiscal years ended December 31, |
| Class N | | June 30, 2024
(unaudited) | | | | 2023 | | 2022 | | 2021 | | 2020 | | 2019 |
| | | | | | | |
Net Asset Value, Beginning of Period | | | | $29.42 | | | | | | | $27.43 | | | | | $33.13 | | | | | $29.97 | | | | | $26.09 | | | | | $21.03 | |
| | | | | | | |
Income (loss) from Investment Operations: | | | | | | | | | | | | | | | | | | | | | | | | | | | | | | | | |
| | | | | | | |
Net investment income (loss)1,2 | | | | (0.02 | ) | | | | | | 0.00 | 3 | | | | (0.06 | ) | | | | (0.15 | ) | | | | (0.03 | ) | | | | (0.04 | ) |
| | | | | | | |
Net realized and unrealized gain (loss) on investments | | | | 0.66 | | | | | | | 2.19 | | | | | (5.43 | ) | | | | 6.34 | | | | | 4.64 | | | | | 6.47 | |
| | | | | | | |
Total income (loss) from investment operations | | | | 0.64 | | | | | | | 2.19 | | | | | (5.49 | ) | | | | 6.19 | | | | | 4.61 | | | | | 6.43 | |
| | | | | | | |
Less Distributions to Shareholders from: | | | | | | | | | | | | | | | | | | | | | | | | | | | | | | | | |
| | | | | | | |
Net investment income | | | | — | | | | | | | (0.03 | ) | | | | — | | | | | — | | | | | — | | | | | — | |
| | | | | | | |
Net realized gain on investments | | | | — | | | | | | | (0.17 | ) | | | | (0.21 | ) | | | | (3.03 | ) | | | | (0.73 | ) | | | | (1.37 | ) |
| | | | | | | |
Total distributions to shareholders | | | | — | | | | | | | (0.20 | ) | | | | (0.21 | ) | | | | (3.03 | ) | | | | (0.73 | ) | | | | (1.37 | ) |
| | | | | | | |
Net Asset Value, End of Period | | | | $30.06 | | | | | | | $29.42 | | | | | $27.43 | | | | | $33.13 | | | | | $29.97 | | | | | $26.09 | |
| | | | | | | |
Total Return2,4 | | | | 2.17 | %5 | | | | | | 8.02 | % | | | | (16.58 | )% | | | | 21.01 | % | | | | 17.73 | % | | | | 30.66 | % |
| | | | | | | |
Ratio of net expenses to average net assets6 | | | | 1.30 | %7 | | | | | | 1.30 | %8 | | | | 1.29 | %8 | | | | 1.30 | %8 | | | | 1.29 | % | | | | 1.29 | % |
| | | | | | | |
Ratio of gross expenses to average net assets9 | | | | 1.31 | %7 | | | | | | 1.31 | %8 | | | | 1.30 | %8 | | | | 1.30 | %8 | | | | 1.30 | % | | | | 1.31 | % |
| | | | | | | |
Ratio of net investment income (loss) to average net assets2 | | | | (0.14 | )%7 | | | | | | 0.02 | % | | | | (0.22 | )% | | | | (0.45 | )% | | | | (0.14 | )% | | | | (0.15 | )% |
| | | | | | | |
Portfolio turnover | | | | 9 | %5 | | | | | | 20 | % | | | | 25 | % | | | | 33 | % | | | | 37 | % | | | | 20 | % |
| | | | | | | |
Net assets end of period (000’s) omitted | | | | $7,851 | | | | | | | $8,336 | | | | | $8,533 | | | | | $11,278 | | | | | $8,667 | | | | | $10,239 | |
| | | | | | | | | | | | | | | | | | | | | | | | | | | | | | | | | |
15
| | |
| | AMG GW&K Small Cap Core Fund Financial Highlights For a share outstanding throughout each fiscal period |
| | | | | | | | | | | | | | | | | | | | | | | | | | | | | | | | |
| | | For the six months ended | | | | For the fiscal years ended December 31, |
| Class I | | June 30, 2024
(unaudited) | | | | 2023 | | 2022 | | 2021 | | 2020 | | 2019 |
| | | | | | | |
Net Asset Value, Beginning of Period | | | | $30.30 | | | | | | | $28.24 | | | | | $34.02 | | | | | $30.61 | | | | | $26.57 | | | | | $21.37 | |
| | | | | | | |
Income (loss) from Investment Operations: | | | | | | | | | | | | | | | | | | | | | | | | | | | | | | | | |
| | | | | | | |
Net investment income (loss)1,2 | | | | 0.03 | | | | | | | 0.11 | | | | | 0.04 | | | | | (0.03 | ) | | | | 0.05 | | | | | 0.05 | |
| | | | | | | |
Net realized and unrealized gain (loss) on investments | | | | 0.68 | | | | | | | 2.25 | | | | | (5.57 | ) | | | | 6.47 | | | | | 4.76 | | | | | 6.58 | |
| | | | | | | |
Total income (loss) from investment operations | | | | 0.71 | | | | | | | 2.36 | | | | | (5.53 | ) | | | | 6.44 | | | | | 4.81 | | | | | 6.63 | |
| | | | | | | |
Less Distributions to Shareholders from: | | | | | | | | | | | | | | | | | | | | | | | | | | | | | | | | |
| | | | | | | |
Net investment income | | | | — | | | | | | | (0.13 | ) | | | | (0.04 | ) | | | | — | | | | | (0.04 | ) | | | | (0.06 | ) |
| | | | | | | |
Net realized gain on investments | | | | — | | | | | | | (0.17 | ) | | | | (0.21 | ) | | | | (3.03 | ) | | | | (0.73 | ) | | | | (1.37 | ) |
| | | | | | | |
Total distributions to shareholders | | | | — | | | | | | | (0.30 | ) | | | | (0.25 | ) | | | | (3.03 | ) | | | | (0.77 | ) | | | | (1.43 | ) |
| | | | | | | |
Net Asset Value, End of Period | | | | $31.01 | | | | | | | $30.30 | | | | | $28.24 | | | | | $34.02 | | | | | $30.61 | | | | | $26.57 | |
| | | | | | | |
Total Return2,4 | | | | 2.34 | %5 | | | | | | 8.39 | % | | | | (16.27 | )% | | | | 21.38 | % | | | | 18.16 | % | | | | 31.13 | % |
| | | | | | | |
Ratio of net expenses to average net assets6 | | | | 0.95 | %7 | | | | | | 0.95 | %8 | | | | 0.94 | %8 | | | | 0.95 | %8 | | | | 0.94 | % | | | | 0.94 | % |
| | | | | | | |
Ratio of gross expenses to average net assets9 | | | | 0.96 | %7 | | | | | | 0.96 | %8 | | | | 0.95 | %8 | | | | 0.95 | %8 | | | | 0.95 | % | | | | 0.96 | % |
| | | | | | | |
Ratio of net investment income (loss) to average net assets2 | | | | 0.21 | %7 | | | | | | 0.37 | % | | | | 0.13 | % | | | | (0.10 | )% | | | | 0.21 | % | | | | 0.20 | % |
| | | | | | | |
Portfolio turnover | | | | 9 | %5 | | | | | | 20 | % | | | | 25 | % | | | | 33 | % | | | | 37 | % | | | | 20 | % |
| | | | | | | |
Net assets end of period (000’s) omitted | | | | $420,684 | | | | | | | $421,136 | | | | | $433,066 | | | | | $546,326 | | | | | $470,373 | | | | | $331,703 | |
| | | | | | | | | | | | | | | | | | | | | | | | | | | | | | | | | |
16
| | |
| | AMG GW&K Small Cap Core Fund Financial Highlights For a share outstanding throughout each fiscal period |
| | | | | | | | | | | | | | | | | | | | | | | | | | | | | | | | |
| | | For the six months ended | | | | For the fiscal years ended December 31, |
| Class Z | | June 30, 2024
(unaudited) | | | | 2023 | | 2022 | | 2021 | | 2020 | | 2019 |
| | | | | | | |
Net Asset Value, Beginning of Period | | | | $30.32 | | | | | | | $28.26 | | | | | $34.05 | | | | | $30.61 | | | | | $26.57 | | | | | $21.37 | |
| | | | | | | |
Income (loss) from Investment Operations: | | | | | | | | | | | | | | | | | | | | | | | | | | | | | | | | |
| | | | | | | |
Net investment income (loss)1,2 | | | | 0.04 | | | | | | | 0.12 | | | | | 0.05 | | | | | (0.02 | ) | | | | 0.07 | | | | | 0.06 | |
| | | | | | | |
Net realized and unrealized gain (loss) on investments | | | | 0.68 | | | | | | | 2.26 | | | | | (5.58 | ) | | | | 6.49 | | | | | 4.75 | | | | | 6.59 | |
| | | | | | | |
Total income (loss) from investment operations | | | | 0.72 | | | | | | | 2.38 | | | | | (5.53 | ) | | | | 6.47 | | | | | 4.82 | | | | | 6.65 | |
| | | | | | | |
Less Distributions to Shareholders from: | | | | | | | | | | | | | | | | | | | | | | | | | | | | | | | | |
| | | | | | | |
Net investment income | | | | — | | | | | | | (0.15 | ) | | | | (0.05 | ) | | | | — | | | | | (0.05 | ) | | | | (0.08 | ) |
| | | | | | | |
Net realized gain on investments | | | | — | | | | | | | (0.17 | ) | | | | (0.21 | ) | | | | (3.03 | ) | | | | (0.73 | ) | | | | (1.37 | ) |
| | | | | | | |
Total distributions to shareholders | | | | — | | | | | | | (0.32 | ) | | | | (0.26 | ) | | | | (3.03 | ) | | | | (0.78 | ) | | | | (1.45 | ) |
| | | | | | | |
Net Asset Value, End of Period | | | | $31.04 | | | | | | | $30.32 | | | | | $28.26 | | | | | $34.05 | | | | | $30.61 | | | | | $26.57 | |
| | | | | | | |
Total Return2,4 | | | | 2.38 | %5 | | | | | | 8.44 | % | | | | (16.25 | )% | | | | 21.48 | % | | | | 18.21 | % | | | | 31.13 | % |
| | | | | | | |
Ratio of net expenses to average net assets6 | | | | 0.90 | %7 | | | | | | 0.90 | %8 | | | | 0.89 | %8 | | | | 0.90 | %8 | | | | 0.89 | % | | | | 0.89 | % |
| | | | | | | |
Ratio of gross expenses to average net assets9 | | | | 0.91 | %7 | | | | | | 0.91 | %8 | | | | 0.90 | %8 | | | | 0.90 | %8 | | | | 0.90 | % | | | | 0.91 | % |
| | | | | | | |
Ratio of net investment income (loss) to average net assets2 | | | | 0.26 | %7 | | | | | | 0.42 | % | | | | 0.18 | % | | | | (0.05 | )% | | | | 0.26 | % | | | | 0.25 | % |
| | | | | | | |
Portfolio turnover | | | | 9 | %5 | | | | | | 20 | % | | | | 25 | % | | | | 33 | % | | | | 37 | % | | | | 20 | % |
| | | | | | | |
Net assets end of period (000’s) omitted | | | | $191,007 | | | | | | | $211,244 | | | | | $218,941 | | | | | $199,851 | | | | | $125,848 | | | | | $110,020 | |
| | | | | | | | | | | | | | | | | | | | | | | | | | | | | | | | | |
| 1 | Per share numbers have been calculated using average shares. |
| 2 | Total returns and net investment income (loss) would have been lower had certain expenses not been offset. |
| 3 | Less than $0.005 per share. |
| 4 | The total return is calculated using the published Net Asset Value as of period end. |
| 6 | Includes reduction from broker recapture amounting to less than 0.01% for the six months ended June 30, 2024, less than 0.01%, 0.01%, less than 0.01%, 0.01% and 0.01% for the fiscal years ended December 31, 2023, 2022, 2021, 2020 and 2019, respectively. |
| 8 | Such ratio includes recapture of waived/reimbursed fees from prior periods amounting to less than 0.01%, less than 0.01% and 0.01% for the fiscal years ended December 31, 2023, 2022 and 2021, respectively. |
| 9 | Excludes the impact of expense reimbursement or fee waivers and expense reductions such as brokerage credits, but includes expense repayments and non-reimbursable expenses, if any, such as interest, taxes, and extraordinary expenses. (See Note 1(c) and 2 in the Notes to Financial Statements.) |
17
| | |
| | AMG GW&K Small Cap Value Fund Financial Highlights For a share outstanding throughout each fiscal period |
| | | | | | | | | | | | | | | | | | | | | | | | | | | | | | | | |
| | | For the six
months ended | | | | For the fiscal years ended December 31, |
| Class N | | June 30, 2024 (unaudited) | | | | 2023 | | 2022 | | 2021 | | 2020 | | 2019 |
| | | | | | | |
Net Asset Value, Beginning of Period | | | | $29.76 | | | | | | | $25.73 | | | | | $30.90 | | | | | $26.71 | | | | | $37.16 | | | | | $30.93 | |
| | | | | | | |
Income (loss) from Investment Operations: | | | | | | | | | | | | | | | | | | | | | | | | | | | | | | | | |
| | | | | | | |
Net investment income1,2 | | | | 0.15 | | | | | | | 0.17 | | | | | 0.13 | | | | | 0.09 | | | | | 0.08 | | | | | 0.07 | |
| | | | | | | |
Net realized and unrealized gain (loss) on investments | | | | (0.50 | ) | | | | | | 4.31 | | | | | (4.87 | ) | | | | 8.41 | | | | | 1.00 | | | | | 8.79 | |
| | | | | | | |
Total income (loss) from investment operations | | | | (0.35 | ) | | | | | | 4.48 | | | | | (4.74 | ) | | | | 8.50 | | | | | 1.08 | | | | | 8.86 | |
| | | | | | | |
Less Distributions to Shareholders from: | | | | | | | | | | | | | | | | | | | | | | | | | | | | | | | | |
| | | | | | | |
Net investment income | | | | — | | | | | | | (0.20 | ) | | | | (0.15 | ) | | | | (0.08 | ) | | | | (0.08 | ) | | | | (0.09 | ) |
| | | | | | | |
Net realized gain on investments | | | | — | | | | | | | (0.25 | ) | | | | (0.28 | ) | | | | (4.23 | ) | | | | (11.45 | ) | | | | (2.54 | ) |
| | | | | | | |
Total distributions to shareholders | | | | — | | | | | | | (0.45 | ) | | | | (0.43 | ) | | | | (4.31 | ) | | | | (11.53 | ) | | | | (2.63 | ) |
| | | | | | | |
Net Asset Value, End of Period | | | | $29.41 | | | | | | | $29.76 | | | | | $25.73 | | | | | $30.90 | | | | | $26.71 | | | | | $37.16 | |
| | | | | | | |
Total Return2,3 | | | | (1.18 | )%4 | | | | | | 17.43 | % | | | | (15.33 | )% | | | | 32.93 | % | | | | 3.29 | % | | | | 28.64 | % |
| | | | | | | |
Ratio of net expenses to average net assets | | | | 1.15 | %5,6 | | | | | | 1.14 | %6 | | | | 1.13 | %6 | | | | 1.13 | %6 | | | | 1.17 | % | | | | 1.17 | % |
| | | | | | | |
Ratio of gross expenses to average net assets7 | | | | 1.19 | %5 | | | | | | 1.19 | % | | | | 1.18 | % | | | | 1.17 | % | | | | 1.21 | % | | | | 1.20 | % |
| | | | | | | |
Ratio of net investment income to average net assets2 | | | | 1.01 | %5 | | | | | | 0.64 | % | | | | 0.47 | % | | | | 0.28 | % | | | | 0.28 | % | | | | 0.19 | % |
| | | | | | | |
Portfolio turnover | | | | 10 | %4 | | | | | | 14 | % | | | | 19 | % | | | | 41 | % | | | | 115 | % | | | | 20 | % |
| | | | | | | |
Net assets end of period (000’s) omitted | | | | $148,542 | | | | | | | $165,040 | | | | | $162,011 | | | | | $223,586 | | | | | $243,655 | | | | | $359,550 | |
| | | | | | | | | | | | | | | | | | | | | | | | | | | | | | | | | |
18
| | |
| | AMG GW&K Small Cap Value Fund Financial Highlights For a share outstanding throughout each fiscal period |
| | | | | | | | | | | | | | | | | | | | | | | | | | | | | | | | |
| | | For the six
months ended | | | | For the fiscal years ended December 31, |
| Class I | | June 30, 2024 (unaudited) | | | | 2023 | | 2022 | | 2021 | | 2020 | | 2019 |
| | | | | | | |
Net Asset Value, Beginning of Period | | | | $29.73 | | | | | | | $25.69 | | | | | $30.87 | | | | | $26.79 | | | | | $37.23 | | | | | $31.05 | |
| | | | | | | |
Income (loss) from Investment Operations: | | | | | | | | | | | | | | | | | | | | | | | | | | | | | | | | |
| | | | | | | |
Net investment income1,2 | | | | 0.18 | | | | | | | 0.23 | | | | | 0.18 | | | | | 0.15 | | | | | 0.14 | | | | | 0.13 | |
| | | | | | | |
Net realized and unrealized gain (loss) on investments | | | | (0.50 | ) | | | | | | 4.31 | | | | | (4.87 | ) | | | | 8.42 | | | | | 1.02 | | | | | 8.83 | |
| | | | | | | |
Total income (loss) from investment operations | | | | (0.32 | ) | | | | | | 4.54 | | | | | (4.69 | ) | | | | 8.57 | | | | | 1.16 | | | | | 8.96 | |
| | | | | | | |
Less Distributions to Shareholders from: | | | | | | | | | | | | | | | | | | | | | | | | | | | | | | | | |
| | | | | | | |
Net investment income | | | | — | | | | | | | (0.25 | ) | | | | (0.21 | ) | | | | (0.26 | ) | | | | (0.15 | ) | | | | (0.24 | ) |
| | | | | | | |
Net realized gain on investments | | | | — | | | | | | | (0.25 | ) | | | | (0.28 | ) | | | | (4.23 | ) | | | | (11.45 | ) | | | | (2.54 | ) |
| | | | | | | |
Total distributions to shareholders | | | | — | | | | | | | (0.50 | ) | | | | (0.49 | ) | | | | (4.49 | ) | | | | (11.60 | ) | | | | (2.78 | ) |
| | | | | | | |
Net Asset Value, End of Period | | | | $29.41 | | | | | | | $29.73 | | | | | $25.69 | | | | | $30.87 | | | | | $26.79 | | | | | $37.23 | |
| | | | | | | |
Total Return2,3 | | | | (1.08 | )%4 | | | | | | 17.73 | % | | | | (15.19 | )% | | | | 33.17 | % | | | | 3.50 | % | | | | 28.86 | % |
| | | | | | | |
Ratio of net expenses to average net assets | | | | 0.95 | %5,6 | | | | | | 0.94 | %6 | | | | 0.93 | %6 | | | | 0.93 | %6 | | | | 0.99 | % | | | | 1.01 | % |
| | | | | | | |
Ratio of gross expenses to average net assets7 | | | | 0.99 | %5 | | | | | | 0.99 | % | | | | 0.98 | % | | | | 0.97 | % | | | | 1.03 | % | | | | 1.04 | % |
| | | | | | | |
Ratio of net investment income to average net assets2 | | | | 1.21 | %5 | | | | | | 0.84 | % | | | | 0.67 | % | | | | 0.48 | % | | | | 0.46 | % | | | | 0.35 | % |
| | | | | | | |
Portfolio turnover | | | | 10 | %4 | | | | | | 14 | % | | | | 19 | % | | | | 41 | % | | | | 115 | % | | | | 20 | % |
| | | | | | | |
Net assets end of period (000’s) omitted | | | | $80,076 | | | | | | | $86,357 | | | | | $81,319 | | | | | $115,837 | | | | | $83,003 | | | | | $122,323 | |
| | | | | | | | | | | | | | | | | | | | | | | | | | | | | | | | | |
19
| | |
| | AMG GW&K Small Cap Value Fund Financial Highlights For a share outstanding throughout each fiscal period |
| | | | | | | | | | | | | | | | | | | | | | | | | | | | | | | | |
| | | For the six | | | | | | | | | | | | |
| | | months ended | | | | For the fiscal years ended December 31, |
| Class Z | | June 30, 2024
(unaudited) | | | | 2023 | | 2022 | | 2021 | | 2020 | | 2019 |
| | | | | | | |
Net Asset Value, Beginning of Period | | | | $29.61 | | | | | | | $25.59 | | | | | $30.76 | | | | | $26.72 | | | | | $37.16 | | | | | $31.10 | |
| | | | | | | |
Income (loss) from Investment Operations: | | | | | | | | | | | | | | | | | | | | | | | | | | | | | | | | |
| | | | | | | |
Net investment income1,2 | | | | 0.18 | | | | | | | 0.24 | | | | | 0.20 | | | | | 0.16 | | | | | 0.16 | | | | | 0.16 | |
| | | | | | | |
Net realized and unrealized gain (loss) on investments | | | | (0.50 | ) | | | | | | 4.30 | | | | | (4.87 | ) | | | | 8.41 | | | | | 1.02 | | | | | 8.84 | |
| | | | | | | |
Total income (loss) from investment operations | | | | (0.32 | ) | | | | | | 4.54 | | | | | (4.67 | ) | | | | 8.57 | | | | | 1.18 | | | | | 9.00 | |
| | | | | | | |
Less Distributions to Shareholders from: | | | | | | | | | | | | | | | | | | | | | | | | | | | | | | | | |
| | | | | | | |
Net investment income | | | | — | | | | | | | (0.27 | ) | | | | (0.22 | ) | | | | (0.30 | ) | | | | (0.17 | ) | | | | (0.40 | ) |
| | | | | | | |
Net realized gain on investments | | | | — | | | | | | | (0.25 | ) | | | | (0.28 | ) | | | | (4.23 | ) | | | | (11.45 | ) | | | | (2.54 | ) |
| | | | | | | |
Total distributions to shareholders | | | | — | | | | | | | (0.52 | ) | | | | (0.50 | ) | | | | (4.53 | ) | | | | (11.62 | ) | | | | (2.94 | ) |
| | | | | | | |
Net Asset Value, End of Period | | | | $29.29 | | | | | | | $29.61 | | | | | $25.59 | | | | | $30.76 | | | | | $26.72 | | | | | $37.16 | |
| | | | | | | |
Total Return2,3 | | | | (1.08 | )%4 | | | | | | 17.77 | % | | | | (15.16 | )% | | | | 33.27 | % | | | | 3.57 | % | | | | 28.94 | % |
| | | | | | | |
Ratio of net expenses to average net assets | | | | 0.90 | %5,6 | | | | |
| 0.89
| %6
| | |
| 0.88
| %6
| | | | 0.88 | %6 | | | | 0.92 | % | | | | 0.92 | % |
| | | | | | | |
Ratio of gross expenses to average net assets7 | | |
| 0.94
| %5
| | | | | | 0.94 | % | | | | 0.93 | % | | | | 0.92 | % | | | | 0.96 | % | | | | 0.95 | % |
| | | | | | | |
Ratio of net investment income to average net assets2 | | |
| 1.26
| %5
| | | | | | 0.89 | % | | | | 0.72 | % | | | | 0.53 | % | | | | 0.53 | % | | | | 0.44 | % |
| | | | | | | |
Portfolio turnover | | | | 10 | %4 | | | | | | 14 | % | | | | 19 | % | | | | 41 | % | | | | 115 | % | | | | 20 | % |
| | | | | | | |
Net assets end of period (000’s) omitted | | | | $5,955 | | | | | | | $6,202 | | | | | $8,582 | | | | | $32,710 | | | | | $10,481 | | | | | $11,815 | |
| | | | | | | | | | | | | | | | | | | | | | | | | | | | | | | | | |
| 1 | Per share numbers have been calculated using average shares. |
| 2 | Total returns and net investment income would have been lower had certain expenses not been offset. |
| 3 | The total return is calculated using the published Net Asset Value as of period end. |
| 6 | Includes reduction from broker recapture amounting to less than 0.01% for the six months ended June 30, 2024, 0.01%, 0.01% and 0.02% for the fiscal years ended December 31, 2023, 2022 and 2021, respectively. |
| 7 | Excludes the impact of expense reimbursement or fee waivers and expense reductions such as brokerage credits, but includes expense repayments and non-reimbursable expenses, if any, such as interest, taxes, and extraordinary expenses. (See Note 1(c) and 2 in the Notes to Financial Statements.) |
20
| | |
| | AMG GW&K Small/Mid Cap Core Fund Financial Highlights For a share outstanding throughout each fiscal period |
| | | | | | | | | | | | | | | | | | | | | | | | | | | | | | | | |
| | | For the six | | | | | | | | | | | | |
| | | months ended | | | | For the fiscal years ended December 31, |
| Class N | | June 30, 2024
(unaudited) | | | | 2023 | | 2022 | | 2021 | | 2020 | | 2019 |
| | | | | | | |
Net Asset Value, Beginning of Period | | | | $17.20 | | | | | | | $15.02 | | | | | $19.08 | | | | | $16.04 | | | | | $13.03 | | | | | $9.99 | |
| | | | | | | |
Income (loss) from Investment Operations: | | | | | | | | | | | | | | | | | | | | | | | | | | | | | | | | |
| | | | | | | |
Net investment income (loss)1,2 | | | | (0.00 | )3 | | | | | | (0.00 | )3 | | | | 0.01 | | | | | (0.06 | ) | | | | (0.01 | ) | | | | 0.00 | 4 |
| | | | | | | | |
Net realized and unrealized gain (loss) on investments | | | | 0.50 | | | | | | | 2.18 | | | | | (3.47 | ) | | | | 4.14 | | | | | 3.02 | | | | | 3.07 | |
| | | | | | | |
Total income (loss) from investment operations | | | | 0.50 | | | | | | | 2.18 | | | | | (3.46 | ) | | | | 4.08 | | | | | 3.01 | | | | | 3.07 | |
| | | | | | | |
Less Distributions to Shareholders from: | | | | | | | | | | | | | | | | | | | | | | | | | | | | | | | | |
| | | | | | | |
Net investment income | | | | — | | | | | | | — | | | | | (0.00 | )3 | | | | — | | | | | — | | | | | (0.01 | ) |
| | | | | | | |
Net realized gain on investments | | | | — | | | | | | | — | | | | | (0.60 | ) | | | | (1.04 | ) | | | | — | | | | | (0.02 | ) |
| | | | | | | |
Total distributions to shareholders | | | | — | | | | | | | — | | | | | (0.60 | ) | | | | (1.04 | ) | | | | — | | | | | (0.03 | ) |
| | | | | | | |
Net Asset Value, End of Period | | | | $17.70 | | | | | | | $17.20 | | | | | $15.02 | | | | | $19.08 | | | | | $16.04 | | | | | $13.03 | |
| | | | | | | |
Total Return2,5 | | | | 2.91 | %6 | | | | | | 14.51 | % | | | | (18.15 | )% | | | | 25.63 | % | | | | 23.10 | % | | | | 30.64 | % |
| | | | | | | |
Ratio of net expenses to average net assets7 | | |
| 1.07
| %8,9
| | | | |
| 1.07
| %10
| | |
| 1.06
| %10
| | |
| 1.06
| %10
| | | | 1.10 | % | | | | 1.09 | % |
| | | | | | | |
Ratio of gross expenses to average net assets11 | | | | 1.07 | %8 | | | | |
| 1.08
| %10
| | |
| 1.08
| %10
| | |
| 1.08
| %10
| | | | 1.13 | % | | | | 1.14 | % |
| | | | | | | |
Ratio of net investment income (loss) to average net assets2 | | |
| (0.03
| )%8
| | | | | | (0.01 | )% | | | | 0.04 | % | | | | (0.32 | )% | | | | (0.07 | )% | | | | 0.02 | % |
| | | | | | | |
Portfolio turnover | | | | 9 | %6 | | | | | | 19 | % | | | | 25 | % | | | | 19 | % | | | | 29 | % | | | | 18 | % |
| | | | | | | |
Net assets end of period (000’s) omitted | | | | $51,944 | | | | | | | $53,076 | | | | | $51,333 | | | | | $70,736 | | | | | $224 | | | | | $172 | |
| | | | | | | | | | | | | | | | | | | | | | | | | | | | | | | | | |
21
| | |
| | AMG GW&K Small/Mid Cap Core Fund Financial Highlights For a share outstanding throughout each fiscal period |
| | | | | | | | | | | | | | | | | | | | | | | | | | | | | | | | |
| | | For the six | | | | | | | | | | | | |
| | | months ended | | | | For the fiscal years ended December 31, |
| Class I | | June 30, 2024
(unaudited) | | | | 2023 | | 2022 | | 2021 | | 2020 | | 2019 |
| | | | | | | |
Net Asset Value, Beginning of Period | | | | $17.26 | | | | | | | $15.07 | | | | | $19.15 | | | | | $16.06 | | | | | $13.04 | | | | | $9.99 | |
| | | | | | | |
Income (loss) from Investment Operations: | | | | | | | | | | | | | | | | | | | | | | | | | | | | | | | | |
| | | | | | | |
Net investment income (loss)1,2 | | | | 0.02 | | | | | | | 0.03 | | | | | 0.04 | | | | | (0.02 | ) | | | | 0.01 | | | | | 0.02 | |
| | | | | | | |
Net realized and unrealized gain (loss) on investments | | | | 0.50 | | | | | | | 2.19 | | | | | (3.48 | ) | | | | 4.15 | | | | | 3.03 | | | | | 3.07 | |
| | | | | | | |
Total income (loss) from investment operations | | | | 0.52 | | | | | | | 2.22 | | | | | (3.44 | ) | | | | 4.13 | | | | | 3.04 | | | | | 3.09 | |
| | | | | | | |
Less Distributions to Shareholders from: | | | | | | | | | | | | | | | | | | | | | | | | | | | | | | | | |
| | | | | | | |
Net investment income | | | | — | | | | | | | (0.03 | ) | | | | (0.04 | ) | | | | — | | | | | (0.02 | ) | | | | (0.02 | ) |
| | | | | | | |
Net realized gain on investments | | | | — | | | | | | | — | | | | | (0.60 | ) | | | | (1.04 | ) | | | | — | | | | | (0.02 | ) |
| | | | | | | |
Total distributions to shareholders | | | | — | | | | | | | (0.03 | ) | | | | (0.64 | ) | | | | (1.04 | ) | | | | (0.02 | ) | | | | (0.04 | ) |
| | | | | | | |
Net Asset Value, End of Period | | | | $17.78 | | | | | | | $17.26 | | | | | $15.07 | | | | | $19.15 | | | | | $16.06 | | | | | $13.04 | |
| | | | | | | |
Total Return2,5 | | | | 3.01 | %6 | | | | | | 14.76 | % | | | | (18.01 | )% | | | | 25.91 | % | | | | 23.31 | % | | | | 30.86 | % |
| | | | | | | |
Ratio of net expenses to average net assets7 | | | | 0.87 | %8,9 | | | | | | 0.87 | %10 | | | | 0.86 | %10 | | | | 0.86 | %10 | | | | 0.92 | % | | | | 0.94 | % |
| | | | | | | |
Ratio of gross expenses to average net assets11 | | | | 0.87 | %8 | | | | | | 0.88 | %10 | | | | 0.88 | %10 | | | | 0.88 | %10 | | | | 0.95 | % | | | | 0.99 | % |
| | | | | | | |
Ratio of net investment income (loss) to average net assets2 | | | | 0.17 | %8 | | | | | | 0.19 | % | | | | 0.24 | % | | | | (0.12 | )% | | | | 0.11 | % | | | | 0.17 | % |
| | | | | | | |
Portfolio turnover | | | | 9 | %6 | | | | | | 19 | % | | | | 25 | % | | | | 19 | % | | | | 29 | % | | | | 18 | % |
| | | | | | | |
Net assets end of period (000’s) omitted | | | | $322,140 | | | | | | | $296,659 | | | | | $250,024 | | | | | $293,614 | | | | | $165,840 | | | | | $102,784 | |
| | | | | | | | | | | | | | | | | | | | | | | | | | | | | | | | | |
22
| | |
| | AMG GW&K Small/Mid Cap Core Fund Financial Highlights For a share outstanding throughout each fiscal period |
| | | | | | | | | | | | | | | | | | | | | | | | | | | | | | | | |
| | | For the six | | | | | | | | | | | | |
| | | months ended | | | | For the fiscal years ended December 31, |
| Class Z | | June 30, 2024
(unaudited) | | | | 2023 | | 2022 | | 2021 | | 2020 | | 2019 |
| | | | | | | |
Net Asset Value, Beginning of Period | | | | $17.29 | | | | | | | $15.10 | | | | | $19.18 | | | | | $16.07 | | | | | $13.05 | | | | | $10.00 | |
| | | | | | | |
Income (loss) from Investment Operations: | | | | | | | | | | | | | | | | | | | | | | | | | | | | | | | | |
| | | | | | | |
Net investment income (loss)1,2 | | | | 0.02 | | | | | | | 0.04 | | | | | 0.05 | | | | | (0.01 | ) | | | | 0.02 | | | | | 0.03 | |
| | | | | | | |
Net realized and unrealized gain (loss) on investments | | | | 0.50 | | | | | | | 2.19 | | | | | (3.48 | ) | | | | 4.16 | | | | | 3.03 | | | | | 3.07 | |
| | | | | | | |
Total income (loss) from investment operations | | | | 0.52 | | | | | | | 2.23 | | | | | (3.43 | ) | | | | 4.15 | | | | | 3.05 | | | | | 3.10 | |
| | | | | | | |
Less Distributions to Shareholders from: | | | | | | | | | | | | | | | | | | | | | | | | | | | | | | | | |
| | | | | | | |
Net investment income | | | | — | | | | | | | (0.04 | ) | | | | (0.05 | ) | | | | — | | | | | (0.03 | ) | | | | (0.03 | ) |
| | | | | | | |
Net realized gain on investments | | | | — | | | | | | | — | | | | | (0.60 | ) | | | | (1.04 | ) | | | | — | | | | | (0.02 | ) |
| | | | | | | |
Total distributions to shareholders | | | | — | | | | | | | (0.04 | ) | | | | (0.65 | ) | | | | (1.04 | ) | | | | (0.03 | ) | | | | (0.05 | ) |
| | | | | | | |
Net Asset Value, End of Period | | | | $17.81 | | | | | | | $17.29 | | | | | $15.10 | | | | | $19.18 | | | | | $16.07 | | | | | $13.05 | |
| | | | | | | |
Total Return2,5 | | | | 3.01 | %6 | | | | | | 14.78 | % | | | | (17.94 | )% | | | | 26.02 | % | | | | 23.37 | % | | | | 30.94 | % |
| | | | | | | |
Ratio of net expenses to average net assets7 | | | | 0.82 | %8,9 | | | | | | 0.82 | %10 | | | | 0.81 | %10 | | | | 0.81 | %10 | | | | 0.83 | % | | | | 0.84 | % |
| | | | | | | |
Ratio of gross expenses to average net assets11 | | | | 0.82 | %8 | | | | | | 0.83 | %10 | | | | 0.83 | %10 | | | | 0.83 | %10 | | | | 0.86 | % | | | | 0.89 | % |
| | | | | | | |
Ratio of net investment income (loss) to average net assets2 | | | | 0.22 | %8 | | | | | | 0.24 | % | | | | 0.29 | % | | | | (0.07 | )% | | | | 0.19 | % | | | | 0.27 | % |
| | | | | | | |
Portfolio turnover | | | | 9 | %6 | | | | | | 19 | % | | | | 25 | % | | | | 19 | % | | | | 29 | % | | | | 18 | % |
| | | | | | | |
Net assets end of period (000’s) omitted | | | | $333,778 | | | | | | | $347,178 | | | | | $262,798 | | | | | $198,961 | | | | | $104,705 | | | | | $95,884 | |
| | | | | | | | | | | | | | | | | | | | | | | | | | | | | | | | | |
| 1 | Per share numbers have been calculated using average shares. |
| 2 | Total returns and net investment income (loss) would have been lower had certain expenses not been offset. |
| 3 | Less than $(0.005) per share. |
| 4 | Less than $0.005 per share. |
| 5 | The total return is calculated using the published Net Asset Value as of period end. |
| 7 | Includes reduction from broker recapture amounting to less than 0.01% for the six months ended June 30, 2024, less than 0.01%, less than 0.01%, 0.01%, 0.01% and 0.01% for the fiscal years ended December 31, 2023, 2022, 2021, 2020 and 2019, respectively. |
| 9 | Includes interest expense of less than 0.01% related to participation in the interfund lending program. |
| 10 | Such ratio includes recapture of waived/reimbursed fees from prior periods amounting to less than 0.01%. |
| 11 | Excludes the impact of expense reimbursement or fee waivers and expense reductions such as brokerage credits, but includes expense repayments and non-reimbursable expenses, if any, such as interest, taxes, and extraordinary expenses. (See Note 1(c) and 2 in the Notes to Financial Statements.) |
23
| | |
| | Notes to Financial Statements (unaudited) June 30, 2024 |
1. ORGANIZATION AND SUMMARY OF SIGNIFICANT ACCOUNTING POLICIES
AMG Funds (the “Trust”) is an open-end management investment company, organized as a Massachusetts business trust, and registered under the Investment Company Act of 1940, as amended (the “1940 Act”). Currently, the Trust consists of a number of different funds, each having distinct investment management objectives, strategies, risks, and policies. Included in this report are AMG Funds: AMG GW&K Small Cap Core Fund (“Small Cap Core”), AMG GW&K Small Cap Value Fund (“Small Cap Value”) and AMG GW&K Small/Mid Cap Core Fund (“Small/Mid Cap Core”), each a “Fund” and collectively, the “Funds”.
Each Fund offers Class N shares, Class I shares and Class Z shares. Each class represents an interest in the same assets of the respective Fund. Although all share classes generally have identical voting rights, each share class votes separately when required by law. Different share classes may have different net asset values per share to the extent the share classes pay different distribution amounts and/or the expenses of such share classes differ. Each share class has its own expense structure. Please refer to a current prospectus for additional information on each share class.
The Funds’ financial statements are prepared in accordance with accounting principles generally accepted in the United States of America (“U.S. GAAP”), including accounting and reporting guidance pursuant to Accounting Standards Codification Topic 946 applicable to investment companies. U.S. GAAP requires management to make estimates and assumptions that affect the reported amounts of assets and liabilities and disclosure of contingent assets and liabilities at the date of the financial statements and the reported amounts of income and expenses during the reporting period. Actual results could differ from those estimates and such differences could be material. The following is a summary of significant accounting policies followed by the Funds in the preparation of their financial statements:
a. VALUATION OF INVESTMENTS
Equity securities traded on a national securities exchange or reported on the NASDAQ national market system (“NMS”) are valued at the last quoted sales price on the primary exchange or, if applicable, the NASDAQ official closing price or the official closing price of the relevant exchange or, lacking any sales, at the last quoted bid price. Equity securities held by the Funds that are traded in the over-the-counter market (other than NMS securities) are valued at the bid price. Foreign equity securities (securities principally traded in markets other than U.S. markets) held by the Funds are valued at the official closing price on the primary exchange or, for markets that either do not offer an official closing price or where the official closing price may not be representative of the overall market, the last quoted sale price.
Fixed income securities purchased with a remaining maturity of 60 days or less are valued at amortized cost, provided that the amortized cost value is approximately the same as the fair value of the security valued without the use of amortized cost. Investments in other open-end registered investment companies are valued at their end of day net asset value per share.
The Funds’ portfolio investments are generally valued based on independent market quotations or prices or, if none, “evaluative” or other market based valuations provided by third party pricing services. Pursuant to Rule 2a-5 under the 1940 Act, the Funds’ Board of Trustees (the “Board”) designated AMG Funds LLC (the “Investment Manager”) as the Funds’ Valuation Designee to perform the
Funds’ fair value determinations. Such determinations are subject to Board oversight and certain reporting and other requirements intended to ensure that the Board receives the information it needs to oversee the Investment Manager’s fair value determinations.
Under certain circumstances, the value of certain Fund portfolio investments may be based on an evaluation of fair value, pursuant to procedures established by the Investment Manager and under the general supervision of the Board. The Funds may use the fair value of a portfolio investment to calculate its net asset value (“NAV”) in the event that the market quotation, price or market based valuation for the portfolio investment is not readily available or otherwise not determinable pursuant to the Funds’ valuation procedures, if the Investment Manager believes the quotation, price or market based valuation to be unreliable, or in certain other circumstances. When determining the fair value of an investment, the Investment Manager seeks to determine the price that the Funds might reasonably expect to receive from current sale of that portfolio investment in an arms-length transaction. Fair value determinations shall be based upon consideration of all available facts and information, including, but not limited to (i) attributes specific to the investment; (ii) fundamental and analytical data relating to the investment; and (iii) the value of other comparable securities or relevant financial instruments, including derivative securities, traded on other markets or among dealers.
The values assigned to fair value portfolio investments are based on available information and do not necessarily represent amounts that might ultimately be realized in the future, since such amounts depend on future developments inherent in long-term investments. Because of the inherent uncertainty of valuation, those estimated values may differ significantly from the values that would have been used had a ready market for the investments existed, and the differences could be material. The Board will be presented with quarterly reports, as of the most recent quarter end, summarizing all fair value activity, material fair value matters that occurred during the quarter, and all outstanding securities fair valued by the Funds. Additionally, the Board will be presented with an annual report that assesses the adequacy and effectiveness of the Investment Manager’s process for determining the fair value of the Funds’ investments.
With respect to foreign equity securities and certain foreign fixed income securities, securities held in the Funds that can be fair valued by the applicable fair value pricing service are fair valued on each business day provided that each individual price exceeds a pre-established confidence level.
U.S. GAAP defines fair value as the price that a fund would receive to sell an asset or pay to transfer a liability in an orderly transaction between market participants at the measurement date. U.S. GAAP also establishes a framework for measuring fair value, and a three level hierarchy for fair value measurements based upon the transparency of inputs to the valuation of an asset or liability. Inputs may be observable or unobservable and refer broadly to the assumptions that market participants would use in pricing the asset or liability. Observable inputs reflect the assumptions market participants would use in pricing the asset or liability based on market data obtained from sources independent of the Funds.
Unobservable inputs reflect the Funds’ own assumptions about the assumptions that market participants would use in pricing the asset or liability developed based on the best information available in the circumstances. Each investment is assigned a level based upon the observability of the inputs which are significant to the overall valuation.
The three-tier hierarchy of inputs is summarized below:
Level 1 – inputs are quoted prices in active markets for identical investments (e.g., equity securities, open-end investment companies)
24
| | |
| | Notes to Financial Statements (continued) |
Level 2 – other observable inputs (including, but not limited to: quoted prices for similar assets or liabilities in markets that are active, quoted prices for identical or similar assets or liabilities in markets that are not active, inputs other than quoted prices that are observable for the assets or liabilities (such as interest rates, yield curves, volatilities, prepayment speeds, loss severities, credit risks and default rates) or other market corroborated inputs) (e.g., debt securities, government securities, foreign currency exchange contracts, foreign securities utilizing international fair value pricing, fair valued securities with observable inputs)
Level 3 – inputs are significant unobservable inputs (including the Fund’s own assumptions used to determine the fair value of investments) (e.g., fair valued securities with unobservable inputs)
Changes in inputs or methodologies used for valuing investments may result in a transfer in or out of levels within the fair value hierarchy. The inputs or methodologies used for valuing investments may not necessarily be an indication of the risk associated with investing in those investments.
b. SECURITY TRANSACTIONS
Security transactions are accounted for as of trade date. Realized gains and losses on securities sold are determined on the basis of identified cost.
c. INVESTMENT INCOME AND EXPENSES
Dividend income is recorded on the ex-dividend date. Interest income, which includes amortization of premium and accretion of discount on debt securities, is accrued as earned. Dividend and interest income on foreign securities is recorded gross of any withholding tax. Non-cash dividends included in dividend income, if any, are reported at the fair market value of the securities received. Upon notification from the issuer, distributions received from a real estate investment trust (REIT) may be redesignated as a reduction of cost of investments and/or realized gain. Other income and expenses are recorded on an accrual basis. Expenses that cannot be directly attributed to a Fund are apportioned among the funds in the Trust and other funds within the AMG Funds Family of Funds (collectively, the “AMG Funds Family”) based upon their relative average net assets or number of shareholders. Investment income, realized and unrealized capital gains and losses, the common expenses of each Fund, and certain fund level expense reductions, if any, are allocated on a pro-rata basis to each class based on the relative net assets of each class to the total net assets of each Fund.
The Funds had certain portfolio trades directed to various brokers under a brokerage recapture program. Credits received from the brokerage recapture program are earned and paid on a monthly basis, and are recorded as expense offsets, which serve to reduce the Fund’s overall expense ratio. For the six months ended June 30, 2024, the impact on the expenses and expense ratios were as follows: Small Cap Core $2,733 or less than 0.01%, Small Cap Value $12,000 or less than 0.01% and Small/Mid Cap Core $15,097 or less than 0.01%.
d. DIVIDENDS AND DISTRIBUTIONS
Fund distributions resulting from either net investment income or realized net capital gains, if any, will normally be declared and paid at least annually in December. Distributions to shareholders are recorded on the ex-dividend date. Distributions are determined in accordance with federal income tax regulations, which may differ from net investment income and net realized capital gains for financial statement purposes (U.S. GAAP). Differences may be permanent or temporary. Permanent differences are reclassified among capital accounts in the
financial statements to reflect their tax character. Permanent book and tax basis differences, if any, relating to shareholder distributions will result in reclassifications to paid-in capital. Temporary differences arise when certain items of income, expense and gain or loss are recognized in different periods for financial statement and tax purposes; these differences will reverse at some time in the future. There were no permanent differences for Small Cap Core, Small Cap Value, and Small/Mid Cap Core. Temporary differences for Small Cap Core, Small Cap Value, and Small/Mid Cap Core are primarily due to wash sale loss deferrals.
At June 30, 2024, the aggregate cost for federal income tax purposes approximates the aggregate cost for book purposes. The approximate cost of investments and the aggregate gross unrealized appreciation and depreciation for federal income tax purposes were as follows:
| | | | | | | | | | | | | | | | |
| Fund | | Cost | | | Appreciation | | | Depreciation | | | Net Appreciation | |
| | | | |
Small Cap Core | | | $472,337,768 | | | | $202,627,547 | | | | $(49,657,160) | | | | $152,970,387 | |
| | | | |
Small Cap Value | | | 193,700,039 | | | | 53,978,116 | | | | (12,296,925) | | | | 41,681,191 | |
| | | | |
Small/Mid Cap Core | | | 583,863,513 | | | | 154,857,105 | | | | (33,143,393) | | | | 121,713,712 | |
e. FEDERAL TAXES
Each Fund currently qualifies as an investment company and intends to comply with the requirements under Subchapter M of the Internal Revenue Code of 1986, as amended (the “Code”), and to distribute substantially all of its taxable income and gains to its shareholders and to meet certain diversification and income requirements with respect to investment companies. The Investment Manager has analyzed the Funds’ tax positions taken on federal income tax returns for all open tax years (generally, the three prior taxable years), and has concluded that no provision for federal income tax is required in the Funds’ financial statements. Additionally, the Investment Manager is not aware of any tax position for which it is reasonably possible that the total amounts of unrecognized tax benefit/detriment will change materially in the next twelve months.
Furthermore, based on each Fund’s understanding of the tax rules and rates related to income, gains and transactions for the foreign jurisdictions in which it invests, each Fund will provide for foreign taxes, and where appropriate, deferred foreign taxes.
f. CAPITAL LOSS CARRYOVERS AND DEFERRALS
As of December 31, 2023, the following Fund had capital loss carryovers for federal income tax purposes as shown in the following chart. These amounts may be used to offset future realized capital gains indefinitely, and retain their character as short-term and/or long-term.
| | | | | | | | | | | | |
Fund | | Short-Term | | | Long-Term | | | Total | |
| | | |
Small/Mid Cap Core | | | $9,036,444 | | | | $1,885,800 | | | | $10,922,244 | |
As of December 31, 2023, Small Cap Core and Small Cap Value had no capital loss carryovers for federal income tax purposes. Should the Funds incur net capital losses for the fiscal year ended December 31, 2024, such amounts may be used to offset future realized capital gains indefinitely, and retain their character as either short-term and/or long-term.
25
| | |
| | Notes to Financial Statements (continued) |
g. CAPITAL STOCK
The Trust’s Amended and Restated Agreement and Declaration of Trust authorizes for each applicable Fund the issuance of an unlimited number of shares of beneficial interest, without par value. Each Fund records sales and repurchases of its capital stock on the trade date.
For the six months ended June 30, 2024 (unaudited) and the fiscal year ended December 31, 2023, the capital stock transactions by class for the Funds were as follows:
| | | | | | | | | | | | | | | | | | | | | | | | | | | | | | | | |
| | | Small Cap Core | | | | Small Cap Value | |
| | | June 30, 2024 | | | December 31, 2023 | | | June 30, 2024 | | | December 31, 2023 | |
| | | | | | | | |
| | | Shares | | | | Amount | | | | Shares | | | | Amount | | | | Shares | | | | Amount | | | | Shares | | | | Amount | |
| | | | | | | | |
Class N: | | | | | | | | | | | | | | | | | | | | | | | | | | | | | | | | |
| | | | | | | | |
Shares sold | | | 8,917 | | | | $264,673 | | | | 29,118 | | | | $817,133 | | | | 86,000 | | | | $2,525,751 | | | | 180,373 | | | | $4,935,921 | |
| | | | | | | | |
Shares issued in reinvestment of distributions | | | — | | | | — | | | | 2,003 | | | | 58,273 | | | | — | | | | — | | | | 82,894 | | | | 2,445,379 | |
| | | | | | | | |
Shares redeemed | | | (31,050) | | | | (918,998) | | | | (58,835) | | | | (1,645,587) | | | | (581,145) | | | | (17,075,583) | | | | (1,015,943) | | | | (27,541,793) | |
| | | | | | | | | | | | | | | | | | | | | | | | | | | | | | | | |
| | | | | | | | |
Net decrease | | | (22,133) | | | | $(654,325) | | | | (27,714) | | | | $(770,181) | | | | (495,145) | | | | $(14,549,832) | | | | (752,676) | | | | $(20,160,493) | |
| | | | | | | | | | | | | | | | | | | | | | | | | | | | | | | | |
| | | | | | | | |
Class I: | | | | | | | | | | | | | | | | | | | | | | | | | | | | | | | | |
| | | | | | | | |
Shares sold | | | 1,228,664 | | | | $37,725,659 | | | | 2,751,955 | | | | $79,493,243 | | | | 79,935 | | | | $2,372,152 | | | | 288,685 | | | | $7,769,687 | |
| | | | | | | | |
Shares issued in reinvestment of distributions | | | — | | | | — | | | | 128,635 | | | | 3,852,621 | | | | — | | | | — | | | | 48,671 | | | | 1,433,860 | |
| | | | | | | | |
Shares redeemed | | | (1,561,486) | | | | (47,333,037) | | | | (4,316,175) | | | | (122,609,775) | | | | (262,001) | | | | (7,678,709) | | | | (597,479) | | | | (16,210,599) | |
| | | | | | | | | | | | | | | | | | | | | | | | | | | | | | | | |
| | | | | | | | |
Net decrease | | | (332,822) | | | | $(9,607,378) | | | | (1,435,585) | | | | $(39,263,911) | | | | (182,066) | | | | $(5,306,557) | | | | (260,123) | | | | $(7,007,052) | |
| | | | | | | | | | | | | | | | | | | | | | | | | | | | | | | | |
| | | | | | | | |
Class Z: | | | | | | | | | | | | | | | | | | | | | | | | | | | | | | | | |
| | | | | | | | |
Shares sold | | | 343,183 | | | | $10,138,278 | | | | 1,965,678 | | | | $58,356,284 | | | | 7,095 | | | | $209,457 | | | | 47,660 | | | | $1,319,831 | |
| | | | | | | | |
Shares issued in reinvestment of distributions | | | — | | | | — | | | | 74,897 | | | | 2,244,651 | | | | — | | | | — | | | | 3,651 | | | | 107,131 | |
| | | | | | | | |
Shares redeemed | | | (1,156,450) | | | | (35,307,604) | | | | (2,820,695) | | | | (82,720,209) | | | | (13,315) | | | | (388,336) | | | | (177,185) | | | | (4,770,442) | |
| | | | | | | | | | | | | | | | | | | | | | | | | | | | | | | | |
| | | | | | | | |
Net decrease | | | (813,267) | | | | $(25,169,326) | | | | (780,120) | | | | $(22,119,274) | | | | (6,220) | | | | $(178,879) | | | | (125,874) | | | | $(3,343,480) | |
| | | | | | | | | | | | | | | | | | | | | | | | | | | | | | | | |
| | |
| | | Small/Mid Cap Core | | | | | |
| | | June 30, 2024 | | | December 31, 2023 | | | | | | | |
| | | | | | | | |
| | | Shares | | | | Amount | | | | Shares | | | | Amount | | | | | | | | | | | | | | | | | |
| | | | | | | | |
Class N: | | | | | | | | | | | | | | | | | | | | | | | | | | | | | | | | |
| | | | | | | | |
Shares sold | | | 70,148 | | | | $1,258,680 | | | | 102,414 | | | | $1,577,823 | | | | | | | | | | | | | | | | | |
| | | | | | | | |
Shares redeemed | | | (220,537) | | | | (3,936,139) | | | | (434,221) | | | | (6,733,845) | | | | | | | | | | | | | | | | | |
| | | | | | | | | | | | | | | | | | | | | | | | | | | | | | | | |
| | | | | | | | |
Net decrease | | | (150,389) | | | | $(2,677,459) | | | | (331,807) | | | | $(5,156,022) | | | | | | | | | | | | | | | | | |
| | | | | | | | | | | | | | | | | | | | | | | | | | | | | | | | |
| | | | | | | | |
Class I: | | | | | | | | | | | | | | | | | | | | | | | | | | | | | | | | |
| | | | | | | | |
Shares sold | | | 2,497,498 | | | | $44,406,700 | | | | 3,440,965 | | | | $54,073,777 | | | | | | | | | | | | | | | | | |
| | | | | | | | |
Shares issued in reinvestment of distributions | | | — | | | | — | | | | 31,529 | | | | 535,995 | | | | | | | | | | | | | | | | | |
| | | | | | | | |
Shares redeemed | | | (1,562,233) | | | | (27,775,392) | | | | (2,874,163) | | | | (45,263,249) | | | | | | | | | | | | | | | | | |
| | | | | | | | | | | | | | | | | | | | | | | | | | | | | | | | |
| | | | | | | | |
Net increase | | | 935,265 | | | | $16,631,308 | | | | 598,331 | | | | $9,346,523 | | | | | | | | | | | | | | | | | |
| | | | | | | | | | | | | | | | | | | | | | | | | | | | | | | | |
| | | | | | | | |
Class Z: | | | | | | | | | | | | | | | | | | | | | | | | | | | | | | | | |
| | | | | | | | |
Shares sold | | | 1,653,964 | | | | $29,558,372 | | | | 7,272,985 | | | | $116,360,111 | | | | | | | | | | | | | | | | | |
| | | | | | | | |
Shares issued in reinvestment of distributions | | | — | | | | — | | | | 47,547 | | | | 809,723 | | | | | | | | | | | | | | | | | |
| | | | | | | | |
Shares redeemed | | | (2,992,626) | | | | (53,218,421) | | | | (4,648,999) | | | | (74,032,454) | | | | | | | | | | | | | | | | | |
| | | | | | | | | | | | | | | | | | | | | | | | | | | | | | | | |
| | | | | | | | |
Net increase (decrease) | | | (1,338,662) | | | | $(23,660,049) | | | | 2,671,533 | | | | $43,137,380 | | | | | | | | | | | | | | | | | |
| | | | | | | | | | | | | | | | | | | | | | | | | | | | | | | | |
26
| | |
| | Notes to Financial Statements (continued) |
h. REPURCHASE AGREEMENTS AND JOINT REPURCHASE AGREEMENTS
The Funds may enter into third-party and bilateral repurchase agreements for temporary cash management purposes and for reinvestment of cash collateral on securities lending transactions under the securities lending program offered by The Bank of New York Mellon (“BNYM”) (the “Securities Lending Program”) (collectively, “Repurchase Agreements”). The value of the underlying collateral, including accrued interest, must equal or exceed the value of the Repurchase Agreements during the term of the agreement. For joint repurchase agreements, the Funds participate on a pro rata basis with other clients of BNYM in their share of the underlying collateral under such joint repurchase agreements and in their share of proceeds from any repurchase or other disposition of the underlying collateral. The underlying collateral for all Repurchase Agreements is held by the Funds’ custodian or at the Federal Reserve Bank. If the seller defaults and the value of the collateral declines, or if bankruptcy proceedings commence with respect to the seller of the security, realization of the collateral by the Funds may be delayed or limited. Pursuant to the Securities Lending Program, the Funds are indemnified for such losses by BNYM on joint repurchase agreements.
At June 30, 2024, the market value of Repurchase Agreements outstanding for Small Cap Core, Small Cap Value and Small/Mid Cap Core was $11,442,873, $5,026,063 and $16,499,000 respectively.
2. AGREEMENTS AND TRANSACTIONS WITH AFFILIATES
For each of the Funds, the Trust has entered into an investment advisory agreement under which the Investment Manager, a subsidiary and the U.S. wealth platform of Affiliated Managers Group, Inc. (“AMG”), serves as investment manager to the Funds and is responsible for the Funds’ overall administration and operations. The Investment Manager selects and recommends, subject to the approval of the Board and, in certain circumstances, shareholders, the subadviser for the Funds and monitors the subadviser’s investment performance, security holdings and investment strategies. Each Fund’s investment portfolio is managed by GW&K Investment Management, LLC (“GW&K”), who serves as subadviser pursuant to a subadvisory agreement with the Investment Manager. AMG indirectly owns a majority interest in GW&K.
Investment management fees are paid directly by the Funds to the Investment Manager based on average daily net assets. For the six months ended June 30, 2024, the Funds’ investment management fees were paid at the following annual rates of each Fund’s respective average daily net assets:
| | | | |
Small Cap Core | | | 0.70 | % |
| |
Small Cap Value | | | 0.70 | % |
| |
Small/Mid Cap Core | | | 0.62 | % |
The fee paid to GW&K for its services as subadviser is paid out of the fee the Investment Manager receives from each Fund and does not increase the expenses of each Fund.
The Investment Manager has contractually agreed, through at least May 1, 2025, to waive management fees and/or pay or reimburse fund expenses in order to limit total annual Fund operating expenses after fee waiver and expense reimbursements (exclusive of taxes, interest (including interest incurred in connection with bank and custody overdrafts, and in connection with securities sold short), shareholder servicing fees, distribution and service (12b-1) fees,
brokerage commissions and other transaction costs, dividends payable with respect to securities sold short, acquired fund fees and expenses and extraordinary expenses) of Small Cap Core, Small Cap Value and Small/Mid Cap Core to the annual rate of 0.90%, 0.90% and 0.82%, respectively, of each Fund’s average daily net assets (this annual rate or such other annual rate that may be in effect from time to time, the “Expense Cap”), subject to later reimbursement by the Funds in certain circumstances.
In general, for a period of up to 36 months after the date any amounts are paid, waived or reimbursed by the Investment Manager, the Investment Manager may recover such amounts from a Fund, provided that such repayment would not cause the Fund’s total annual operating expenses after fee waiver and expense reimbursements (exclusive of the items noted in the parenthetical above) to exceed either (i) the Expense Cap in effect at the time such amounts were paid, waived or reimbursed, or (ii) the Expense Cap in effect at the time of such repayment by the Fund.
The contractual expense limitation may only be terminated in the event the Investment Manager or a successor ceases to be the investment manager of a Fund or a successor fund, by mutual agreement between the Investment Manager and the Board, or in the event of a Fund’s liquidation unless the Fund is reorganized or is a party to a merger in which the surviving entity is successor to the accounting and performance information of a Fund.
For the six months ended June 30, 2024, the Investment Manager’s expense reimbursements, and repayments of prior reimbursements by the Funds to the Investment Manager, if any, are as follows:
| | | | |
| | | Expense Reimbursements | | Repayment of Prior Reimbursements |
| | |
Small Cap Core | | $17,487 | | — |
| | |
Small Cap Value | | 50,076 | | — |
| | |
Small/Mid Cap Core | | 5,992 | | — |
At June 30, 2024, the Funds’ expiration of reimbursements subject to recoupment is as follows:
| | | | | | | | | | | | |
Expiration Period | | Small Cap Core | | | Small Cap Value | | | Small/Mid Cap Core | |
| | | |
Less than 1 year | | | — | | | | $53,215 | | | | $43,099 | |
| | | |
1-2 years | | | $6,079 | | | | 101,247 | | | | 44,070 | |
| | | |
2-3 years | | | 60,184 | | | | 100,560 | | | | 62,375 | |
| | | | | | | | | | | | |
| | | |
Total | | | $66,263 | | | | $255,022 | | | | $149,544 | |
| | | | | | | | | | | | |
The Trust, on behalf of the Funds, has entered into an amended and restated Administration Agreement under which the Investment Manager serves as the Funds’ administrator (the “Administrator”) and is responsible for certain aspects of managing the Funds’ operations, including administration and shareholder services to each Fund. Each Fund pays a fee to the Administrator at the rate of 0.15% per annum of the Fund’s average daily net assets for this service.
The Funds are distributed by AMG Distributors, Inc. (the “Distributor”), a wholly-owned subsidiary of the Investment Manager. The Distributor serves as the distributor and underwriter for each Fund and is a registered broker-dealer and member of the Financial Industry Regulatory Authority, Inc. (“FINRA”). Shares of each Fund will be continuously offered and will be sold directly to prospective
27
| | |
| | Notes to Financial Statements (continued) |
purchasers and through brokers, dealers or other financial intermediaries who have executed selling agreements with the Distributor. Generally, the Distributor bears all or a portion of the expenses of providing services pursuant to the distribution agreement, including the payment of the expenses relating to the distribution of prospectuses for sales purposes and any advertising or sales literature.
The Trust has adopted a distribution and service plan (the “Plan”) with respect to the Class N shares of each Fund, except Small Cap Value, in accordance with the requirements of Rule 12b-1 under the 1940 Act and the requirements of the applicable rules of FINRA regarding asset-based sales charges. Pursuant to the Plan, each Fund, except Small Cap Value, may make payments to the Distributor for its expenditures in financing any activity primarily intended to result in the sale of each Fund’s Class N shares and for maintenance and personal service provided to existing shareholders of that class. The Plan authorizes payments to the Distributor up to 0.25% annually of each Fund’s, except Small Cap Value’s, average daily net assets attributable to the Class N shares. The portion of payments made under the plan by Class N shares of each Fund, except Small Cap Value, for shareholder servicing may not exceed an annual rate of 0.25% of the average daily net asset value of each Fund’s shares of that class owned by clients of such broker, dealer or financial intermediary.
For each of Class N and Class I shares of Small Cap Core and Small Cap Value, and for Small/Mid Cap Core Class I shares, the Board has approved reimbursement payments to the Investment Manager for shareholder servicing expenses (“shareholder servicing fees”) incurred. Shareholder servicing fees include payments to financial intermediaries, such as broker-dealers (including fund supermarket platforms), banks, and trust companies who provide shareholder recordkeeping, account servicing and other services. The Class N and Class I shares may reimburse the Investment Manager for the actual amount incurred up to a maximum annual rate of each Class’s average daily net assets as shown in the table below.
The impact on the annualized expense ratios for the six months ended June 30, 2024, was as follows:
| | | | | | | | |
| Fund | | Maximum Annual
Amount
Approved | | | Actual
Amount
Incurred | |
| | |
Small Cap Core | | | | | | | | |
| | |
Class N | | | 0.15% | | | | 0.15% | |
| | |
Class I | | | 0.05% | | | | 0.05% | |
| | |
Small Cap Value | | | | | | | | |
| | |
Class N | | | 0.25% | | | | 0.25% | |
| | |
Class I | | | 0.05% | | | | 0.05% | |
| | |
Small/Mid Cap Core | | | | | | | | |
| | |
Class I | | | 0.05% | | | | 0.05% | |
The Board provides supervision of the affairs of the Trust and other trusts within the AMG Funds Family. The Trustees of the Trust who are not affiliated with the Investment Manager receive an annual retainer and per meeting fees for regular, special and telephonic meetings, and they are reimbursed for out-of-pocket expenses incurred while carrying out their duties as Board members. The Chairman of the Board and the Audit Committee Chair receive additional annual
retainers. Certain Trustees and Officers of the Funds are Officers and/or Directors of the Investment Manager, AMG and/or the Distributor.
The Securities and Exchange Commission (the “SEC”) granted an exemptive order that permits certain eligible funds in the AMG Funds Family to lend and borrow money for certain temporary purposes directly to and from other eligible funds in the AMG Funds Family. Participation in this interfund lending program is voluntary for both the borrowing and lending funds, and an interfund loan is only made if it benefits each participating fund. The Administrator manages the program according to procedures approved by the Board, and the Board monitors the operation of the program. An interfund loan must comply with certain conditions set out in the exemptive order, which are designed to assure fairness and protect all participating funds. The interest earned and interest paid on interfund loans are included on the Statement of Operations as interest income and interest expense, respectively. At June 30, 2024, the Funds had no interfund loans outstanding.
The following Funds utilized the interfund loan program during the six months ended June 30, 2024 as follows:
| | | | | | | | | | | | | | | | |
| Fund | | Average
Lent | | | Number
of Days | | | Interest
Earned | | | Average
Interest Rate | |
| | | | |
Small Cap Core | | $ | 1,041,707 | | | | 4 | | | | $711 | | | | 6.225% | |
| | | | |
| Fund | | Average
Borrowed | | | Number
of Days | | | Interest
Paid | | | Average
Interest Rate | |
| | | | |
Small/Mid Cap Core | | $ | 8,698,375 | | | | 7 | | | $ | 10,379 | | | | 6.222% | |
Small Cap Value did not participate in the interfund lending program for the six months ended June 30, 2024.
3. PURCHASES AND SALES OF SECURITIES
Purchases and sales of securities (excluding short-term securities and U.S. Government Obligations) for the six months ended June 30, 2024, were as follows:
| | | | | | | | |
| | | Long Term Securities | |
| | |
| Fund | | Purchases | | | Sales | |
| | |
Small Cap Core | | $ | 56,473,767 | | | $ | 89,403,966 | |
| | |
Small Cap Value | | | 25,280,448 | | | | 45,698,757 | |
| | |
Small/Mid Cap Core | | | 64,724,636 | | | | 93,951,347 | |
The Funds had no purchases or sales of U.S. Government Obligations during the six months ended June 30, 2024.
4. PORTFOLIO SECURITIES LOANED
The Funds participate in the Securities Lending Program providing for the lending of securities to qualified borrowers. Securities lending income includes earnings of such temporary cash investments, plus or minus any rebate to a borrower. These earnings (after any rebate) are then divided between BNYM, as a fee for its services under the Securities Lending Program, and the Funds, according to agreed-upon rates. Collateral on all securities loaned is accepted in cash, U.S. Treasury Obligations or U.S. Government Agency Obligations. Collateral is maintained at a minimum level of 102% (105% in the case of certain foreign securities) of the market value, plus interest, if applicable, of investments on loan. It is the Funds’ policy to obtain additional collateral from or return excess collateral
28
| | |
| | Notes to Financial Statements (continued) |
to the borrower by the end of the next business day, following the valuation date of the securities loaned. Therefore, the value of the collateral held may be temporarily less than the value of the securities on loan. Lending securities entails a risk of loss to the Funds if and to the extent that the market value of the securities loaned were to increase and the borrower did not increase the collateral accordingly, and the borrower fails to return the securities. Under the terms of the Securities Lending Program, the Funds are indemnified for such losses by BNYM. Cash collateral is held in separate omnibus accounts managed by BNYM, who is authorized to exclusively enter into joint repurchase agreements for that cash collateral. Securities collateral is held in separate omnibus accounts managed by BNYM and cannot be sold or pledged. BNYM bears the risk of any deficiency in the amount of the cash collateral available for return to the borrower due to any loss on the collateral invested. Loans of securities are terminable by a Fund at any time and the borrower, after notice, is required to return borrowed securities as soon as practical, which is normally within three business days.
The value of securities loaned on positions held, cash collateral and securities collateral received at June 30, 2024, was as follows:
| | | | | | | | | | | | | | | | |
| Fund | | Securities
Loaned | | | Cash
Collateral
Received | | | Securities
Collateral
Received | | | Total
Collateral
Received | |
| | | | |
Small Cap Core | | | $42,508,487 | | | | $3,823,873 | | | | $39,376,649 | | | | $43,200,522 | |
| | | | |
Small Cap Value | | | 11,857,013 | | | | 913,063 | | | | 11,143,373 | | | | 12,056,436 | |
| | | | |
Small/Mid Cap Core | | | 20,397,995 | | | | — | | | | 20,737,203 | | | | 20,737,203 | |
The following table summarizes the securities received as collateral for securities lending at June 30, 2024:
| | | | | | | | |
| Fund | | Collateral
Type | | Coupon
Range | | Maturity
Date Range | |
| | | |
Small Cap Core | | U.S. Treasury
Obligations | | 0.000%-5.368% | | | 07/30/24-11/15/53 | |
| | | |
Small Cap Value | | U.S. Treasury
Obligations | | 0.000%-5.368% | | | 07/31/24-11/15/53 | |
| | | |
Small/Mid Cap Core | | U.S. Treasury
Obligations | | 0.125%-5.250% | | | 10/15/24-05/15/52 | |
5. FUND RISKS
In the normal course of business, the Funds invest in securities or other instruments and may enter into certain transactions, and such activities subject the Funds to various risks. Below is a summary of some, but not all, of those risks. Each risk described below does not necessarily apply to each Fund. Please refer to each Fund’s prospectus for a description of the principal risks associated with investing in a particular Fund. The value of securities or other instruments may also be affected by various factors, including, without limitation: (i) the general economy; (ii) the overall market; or (iii) price fluctuations.
Market Risk: Market prices of investments held by the Funds may fall rapidly or unpredictably due to a variety of factors, including economic, political, or market
conditions, or other factors including terrorism, war, natural disasters and the spread of infectious illness or other public health issues, including epidemics or pandemics, or in response to events that affect particular industries or companies.
Management Risk: Because each Fund is an actively managed investment portfolio, security selection or focus on securities in a particular style, market sector or group of companies may cause the Funds to incur losses or underperform relative to its benchmarks or other funds with a similar investment objective. There can be no guarantee that GW&K’s investment techniques and risk analysis will produce the desired result.
Small- and Mid-Capitalization Stock Risk: The stocks of small- and mid-capitalization companies often have greater price volatility, lower trading volume, and less liquidity than the stocks of larger, more established companies.
Growth Stock Risk: The prices of equity securities of companies that are expected to experience relatively rapid earnings growth, or “growth stocks,” may be more sensitive to market movements because the prices tend to reflect future investor expectations rather than just current profits.
Value Stock Risk: Value stocks may perform differently from the market as a whole and may be undervalued by the market for a long period of time.
Liquidity Risk: The Funds may not be able to dispose of particular investments, such as illiquid securities, readily at favorable times or prices or the Funds may have to sell them at a loss.
Real Estate Industry Risk: Investments in the Funds may be subject to many of the same risks as a direct investment in real estate. The stock prices of companies in the real estate industry, including REITs, are typically sensitive to changes in real estate values, property taxes, interest rates, cash flow of underlying real estate assets, occupancy rates, government regulations affecting zoning, land use, and rents, as well as the management skill and creditworthiness of the issuer. REITs also depend generally on their ability to generate cash flow to make distributions to shareholders or unitholders and are subject to the risk of failing to qualify for favorable tax treatment under the Code.
6. COMMITMENTS AND CONTINGENCIES
Under the Trust’s organizational documents, their Trustees and Officers are indemnified against certain liabilities arising out of the performance of their duties to the Trust. In addition, in the normal course of business, the Funds may enter into contracts and agreements that contain a variety of representations and warranties, which provide general indemnifications. The maximum exposure to the Funds under these arrangements is unknown, as this would involve future claims that may be made against a Fund that have not yet occurred. However, based on experience, the Funds have no prior claims or losses and expect the risks of loss to be remote.
7. MASTER NETTING AGREEMENTS
The Funds may enter into master netting agreements with their counterparties for the Securities Lending Program and Repurchase Agreements, which provide the right, in the event of default (including bankruptcy or insolvency) for the non-defaulting party to liquidate the collateral and calculate net exposure to the defaulting party or request additional collateral. For financial reporting purposes, the Funds do not offset financial assets and financial liabilities that are subject to master netting agreements in the Statement of Assets and Liabilities. For securities lending transactions, see Note 4.
29
| | |
| | Notes to Financial Statements (continued) |
The following table is a summary of the Funds’ open Repurchase Agreements that are subject to a master netting agreement as of June 30, 2024:
| | | | | | | | | | | | | | | | | | |
| | | | | | Gross Amount Not Offset in the
Statement of Assets and Liabilities | | | | | | | |
| Fund | | Gross Amounts of
Assets Presented in
the Statement of
Assets and Liabilities | | | Offset Amount | | Net Asset Balance | | | Collateral
Received | | | Net
Amount | |
| | | | | |
Small Cap Core | | | | | | | | | | | | | | | | | | |
| | | | | |
Bethesda Securities LLC | | | $23,873 | | | — | | | $23,873 | | | | $23,873 | | | | — | |
| | | | | |
State of Wisconsin Investment Board | | | 3,800,000 | | | — | | | 3,800,000 | | | | 3,800,000 | | | | — | |
| | | | | |
Fixed Income Clearing Corp. | | | 7,619,000 | | | — | | | 7,619,000 | | | | 7,619,000 | | | | — | |
| | | | | | | | | | | | | | | | | | |
| | | | | |
Total | | | $11,442,873 | | | — | | | $11,442,873 | | | | $11,442,873 | | | | — | |
| | | | | | | | | | | | | | | | | | |
| | | | | |
Small Cap Value | | | | | | | | | | | | | | | | | | |
| | | | | |
Bethesda Securities LLC | | | $913,063 | | | — | | | $913,063 | | | | $913,063 | | | | — | |
| | | | | |
Fixed Income Clearing Corp. | | | 4,113,000 | | | — | | | 4,113,000 | | | | 4,113,000 | | | | — | |
| | | | | | | | | | | | | | | | | | |
| | | | | |
Total | | | $5,026,063 | | | — | | | $5,026,063 | | | | $5,026,063 | | | | — | |
| | | | | | | | | | | | | | | | | | |
| | | | | |
Small/Mid Cap Core | | | | | | | | | | | | | | | | | | |
| | | | | |
Fixed Income Clearing Corp. | | | $16,499,000 | | | — | | | $16,499,000 | | | | $16,499,000 | | | | — | |
8. SUBSEQUENT EVENTS
The Funds have determined that no material events or transactions occurred through the issuance date of the Funds’ financial statements which require an additional disclosure in or adjustment of the Funds’ financial statements.
30
| | |
| | Other Information (unaudited) |
ITEM 8. CHANGES IN AND DISAGREEMENTS WITH ACCOUNTANTS FOR OPEN-END MANAGEMENT INVESTMENT COMPANIES
During the six months ended June 30, 2024, there were no changes in and/or disagreements with accountants.
ITEM 9. PROXY DISCLOSURES FOR OPEN-END MANAGEMENT INVESTMENT COMPANIES
Not applicable.
ITEM 10. REMUNERATION PAID TO DIRECTORS, OFFICERS, AND OTHERS OF OPEN-END MANAGEMENT INVESTMENT COMPANIES
The remuneration paid to the Trustees during the six months ended June 30, 2024, is reflected as “Trustee fees and expenses” on the Statement of Operations and is set forth in the table below. There was no remuneration paid to any Fund officer or to any affiliated person of any Fund Trustee or officer during the six months ended June 30, 2024.
| | | | |
| | | Trustee fees and expenses | |
| |
AMG GW&K Small Cap Core Fund | | | $24,118 | |
| |
AMG GW&K Small Cap Value Fund | | | 9,310 | |
| |
AMG GW&K Small/Mid Cap Core Fund | | | 26,064 | |
31
| | |
| | ITEM 11. STATEMENT REGARDING BASIS FOR APPROVAL OF INVESTMENT ADVISORY CONTRACT |
| | | | | | | | |
AMG GW&K Small Cap Core Fund, AMG GW&K Small Cap Value Fund, and AMG GW&K Small/Mid Cap Core Fund: Approval of Investment Management and Subadvisory Agreements on June 12, 2024 At an in-person meeting held on June 12, 2024, the Board of Trustees (the “Board” or the “Trustees”) of AMG Funds (the “Trust”), and separately a majority of the Trustees who are not “interested persons” of the Trust (the “Independent Trustees”), approved (i) the Investment Management Agreement, as amended pursuant to letter agreements at any time prior to the date of the meeting, with AMG Funds LLC (the “Investment Manager”) for each of AMG GW&K Small Cap Core Fund, AMG GW&K Small Cap Value Fund, and AMG GW&K Small/Mid Cap Core Fund (each, a “Fund,” and collectively, the “Funds”), and separately each of Amendment No. 1 thereto dated July 1, 2015, and Amendment No. 2 thereto dated October 1, 2016 (collectively, the “Investment Management Agreement”); and (ii) the Subadvisory Agreement with respect to each Fund, as amended at any time prior to the date of the meeting (collectively, the “Subadvisory Agreements”), with GW&K Investment Management, LLC, the Funds’ subadviser (the “Subadviser”). The Independent Trustees were separately represented by independent legal counsel in connection with their consideration of the approval of these agreements. In considering the Investment Management Agreement and the Subadvisory Agreements, the Trustees reviewed a variety of materials relating to each Fund, the Investment Manager and the Subadviser, including the nature, extent and quality of services, comparative performance, fee and expense information for an appropriate peer group of similar mutual funds for each Fund (each, a “Peer Group”), performance information for the relevant benchmark index for each Fund (each, a “Fund Benchmark”), other relevant matters, including management fees, the profitability of the Investment Manager and the Subadviser, and the potential for economies of scale that may be shared with the Funds, and other information provided to them on a periodic basis throughout the year. Prior to voting, the Independent Trustees: (a) reviewed the foregoing information with their independent legal counsel; (b) received materials from their independent legal counsel discussing the legal standards applicable to their consideration of the Investment Management Agreement and Subadvisory Agreements; and (c) met with their independent legal counsel in private sessions at which no representatives of management were present. | | | | NATURE, EXTENT AND QUALITY OF SERVICES In considering the nature, extent and quality of the services provided by the Investment Manager, the Trustees reviewed information provided by the Investment Manager at the June 12, 2024 meeting and prior meetings relating to the Investment Manager’s operations and personnel. Among other things, the Investment Manager provided financial information, information about its supervisory and professional staff and descriptions of its organizational and management structure. The Trustees also took into account information provided periodically throughout the previous year by the Investment Manager in Board meetings relating to the performance of its duties with respect to the Funds and the Trustees’ knowledge of the Investment Manager’s management and the quality of the performance of the Investment Manager’s duties under the Investment Management Agreement and Administration Agreement. In the course of their deliberations regarding the Investment Manager, the Trustees evaluated, among other things: (a) the extent and quality of the Investment Manager’s oversight of the operation and management of the Funds; (b) the quality of the Investment Manager’s oversight of the performance by the Subadviser of its portfolio management duties; (c) the Investment Manager’s ability to supervise the Funds’ other service providers; and (d) the Investment Manager’s compliance program. The Trustees also took into account that, in performing its functions under the Investment Management Agreement and supervising the Subadviser, the Investment Manager: performs periodic detailed analyses and reviews of the performance by the Subadviser of its obligations to each Fund, including without limitation, analysis and review of portfolio and other compliance matters and review of the Subadviser’s investment performance with respect to each Fund; prepares and presents periodic reports to the Board regarding the investment performance of the Subadviser and other information regarding the Subadviser, at such times and in such forms as the Board may reasonably request; reviews and considers any changes in the personnel of the Subadviser responsible for performing the Subadviser’s obligations and makes appropriate reports to the Board; reviews and considers any changes in the ownership or senior management of the Subadviser and makes appropriate reports to the Board; performs periodic in-person, telephonic or videoconference diligence meetings, including with respect to compliance matters, with representatives of the Subadviser; assists the Board and management of the Trust in | | | | developing and reviewing information with respect to the initial approval of each Subadvisory Agreement and annual consideration of each Subadvisory Agreement thereafter; prepares recommendations with respect to the continued retention of the Subadviser or the replacement of the Subadviser, including at the request of the Board; identifies potential successors to, or replacements of, the Subadviser or potential additional subadvisers, including performing appropriate due diligence, and developing and presenting to the Board a recommendation as to any such successor, replacement, or additional subadviser, including at the request of the Board; designates and compensates from its own resources such personnel as the Investment Manager may consider necessary or appropriate to the performance of its services; and performs such other review and reporting functions as the Board shall reasonably request consistent with the Investment Management Agreement and applicable law. The Trustees noted the affiliation of the Subadviser with the Investment Manager, noting any potential conflicts of interest. The Trustees also took into account the financial condition of the Investment Manager with respect to its ability to provide the services required under the Investment Management Agreement and the Investment Manager’s undertaking to maintain contractual expense limitations for the Funds. The Trustees also considered the Investment Manager’s risk management processes. The Trustees also reviewed information relating to the Subadviser’s operations and personnel and the investment philosophy, strategies and techniques (its “Investment Strategy”) used in managing each Fund. Among other things, the Trustees reviewed information on portfolio management and other professional staff, information regarding the Subadviser’s organizational and management structure and the Subadviser’s brokerage policies and practices. The Trustees considered specific information provided regarding the experience of the individuals at the Subadviser with portfolio management responsibility for each Fund, including the information set forth in each Fund’s prospectus and statement of additional information. In the course of their deliberations, the Trustees evaluated, among other things: (a) the services rendered by the Subadviser in the past; (b) the qualifications and experience of the Subadviser’s personnel; and (c) the Subadviser’s compliance program. The Trustees also took into account the financial condition of the Subadviser with respect to its ability to provide the |
32
| | |
| | ITEM 11. STATEMENT REGARDING BASIS FOR APPROVAL OF INVESTMENT ADVISORY CONTRACT (continued) |
| | | | | | | | |
services required under each Subadvisory Agreement. The Trustees also considered the Subadviser’s risk management processes. PERFORMANCE The Board considered each Fund’s net performance during relevant time periods as compared to the Fund’s Peer Group and Fund Benchmark, considered the gross performance of each Fund as compared to the Subadviser’s relevant performance composite that utilizes a similar investment strategy and approach, and noted that the Board reviews on a quarterly basis detailed information about both a Fund’s performance results and portfolio composition, as well as the Subadviser’s Investment Strategy. The Board was mindful of the Investment Manager’s expertise, resources, and attention to monitoring the Subadviser’s performance, investment style and risk-adjusted performance with respect to the Funds and its discussions with the management of the Funds’ subadviser during the period regarding the factors that contributed to the performance of the Funds. With respect to AMG GW&K Small Cap Core Fund, among other information relating to the Fund’s performance, the Trustees noted that the Fund’s performance for Class N shares (which share class has the earliest inception date of all the share classes of the Fund) for the 1-year, 3-year, 5-year and 10-year periods ended March 31, 2024, was below the median performance of the Peer Group and below, above, above, and above, respectively, the performance of the Fund Benchmark, the Russell 2000 Index. The Trustees took into account management’s discussion of the Fund’s performance, including the reasons for the Fund’s recent underperformance and longer-term outperformance relative to the Fund Benchmark and the Fund’s underperformance relative to the Peer Group. The Trustees also took into account the fact that the Fund’s Class Z and Class I shares ranked in the top half relative to its Peer Group for the 2022 calendar year. The Trustees concluded that the Fund’s overall performance has been satisfactory in light of the Fund’s investment objective, strategies and policies. With respect to AMG GW&K Small Cap Value Fund, among other information relating to the Fund’s performance, the Trustees noted that the Fund’s performance for Class N shares (which share class has the earliest inception date and the largest amount of assets of all the share classes of the Fund) for the 1-year, 3-year, 5-year and 10-year periods ended March 31, 2024, was below, below, above, and below, respectively, the median | | | | performance of the Peer Group and below, above, above, and below, respectively, the performance of the Fund Benchmark, the Russell 2000 Value Index. The Trustees took into account management’s discussion of the Fund’s performance, including the reasons for the Fund’s more recent underperformance relative to the Peer Group and the Fund Benchmark and the fact that the Fund ranked in the top half relative to its Peer Group for the 2023 and 2021 calendar years. The Trustees also took into account the fact that the Fund’s subadviser and investment strategy changed effective December 4, 2020, and that the performance information prior to that date reflected that of the Fund’s prior subadviser and investment strategy. The Trustees concluded that the Fund’s overall performance has been satisfactory in light of the Fund’s investment objective, strategies and policies. With respect to AMG GW&K Small/Mid Cap Core Fund, among other information relating to the Fund’s performance, the Trustees noted that the Fund’s performance for Class I shares (which share class has the earliest inception date of all the share classes of the Fund) for the 1-year, 3-year, and 5-year periods ended March 31, 2024 and for the period from the Fund’s inception on June 30, 2015 through March 31, 2024 was below, below, above, and below, respectively, the median performance of the Peer Group and below, above, above, and above, respectively, the performance of the Fund Benchmark, the Russell 2500 Index. The Trustees took into account management’s discussion of the Fund’s performance, including the reasons for the Fund’s more recent underperformance relative to its Peer Group and Fund Benchmark and longer-term outperformance relative to the Fund Benchmark and the fact that the Fund ranked in the top quintile relative to its Peer Group for the 5-year period. The Trustees concluded that the Fund’s overall performance has been satisfactory in light of the Fund’s investment objective, strategies and policies. ADVISORY AND SUBADVISORY FEES; FUND EXPENSES; PROFITABILITY; AND ECONOMIES OF SCALE In considering the reasonableness of the advisory fee payable to the Investment Manager, the Trustees reviewed information provided by the Investment Manager at the June 12, 2024 meeting and prior meetings setting forth all revenues and other benefits, both direct and indirect (including any so-called “fallout benefits” such as reputational value derived from the Investment Manager serving as Investment Manager to a Fund), received by the Investment Manager and its affiliates attributable to managing each Fund and all the mutual funds in the | | | | AMG Funds Family of Funds; the cost of providing such services; the significant risks undertaken as Investment Manager and sponsor of the Funds, including investment, operational, enterprise, entrepreneurial, litigation, regulatory and compliance risks; and the resulting profitability to the Investment Manager and its affiliates from these relationships. The Trustees also considered the amount of the advisory fee retained by the Investment Manager after payment of the subadvisory fee with respect to each Fund. The Trustees also noted payments are made from the Subadviser to the Investment Manager, and other payments are made from the Investment Manager to the Subadviser. The Trustees also considered management’s discussion of the current asset levels of the Funds, and the impact on profitability of both the current asset levels and any future growth of assets of the Funds. In considering the cost of services to be provided by the Investment Manager under the Investment Management Agreement and the profitability to the Investment Manager of its relationship with each Fund, the Trustees noted the undertaking by the Investment Manager to maintain contractual expense limitations for the Funds. The Board also took into account management’s discussion of the advisory fee structure, and the services the Investment Manager provides in performing its functions under the Investment Management Agreement and supervising the Subadviser. Based on the foregoing, the Trustees concluded that the profitability to the Investment Manager is reasonable and that the Investment Manager is not realizing material benefits from economies of scale that would warrant adjustments to the advisory fee at this time. Also, with respect to economies of scale, the Trustees noted that as each Fund’s assets increase over time, the Fund may realize other economies of scale to the extent the increase in assets is proportionally greater than the increase in certain other expenses. In considering the reasonableness of the subadvisory fees payable by the Investment Manager to the Subadviser, the Trustees reviewed information regarding the cost to the Subadviser of providing subadvisory services to each Fund and the resulting profitability from these relationships. The Trustees noted that, because the Subadviser is an affiliate of the Investment Manager, a portion of the Subadviser’s revenues or profits might be shared directly or indirectly with the Investment Manager. The Trustees also noted that the subadvisory fees are paid by the Investment Manager out of its advisory fee. The Board also took into account management’s discussion of the subadvisory fee structure, and the services the Subadviser provides in performing its |
33
| | |
| | ITEM 11. STATEMENT REGARDING BASIS FOR APPROVAL OF INVESTMENT ADVISORY CONTRACT (continued) |
| | | | | | | | |
functions under each Subadvisory Agreement. Based on the foregoing, the Trustees concluded that the profitability to the Subadviser is reasonable and that the Subadviser is not realizing material benefits from economies of scale that would warrant adjustments to the subadvisory fees at this time. Also, with respect to economies of scale, the Trustees noted that as a Fund’s assets increase over time, the Fund may realize other economies of scale to the extent the increase in assets is proportionally greater than the increase in certain other expenses. With respect to AMG GW&K Small Cap Core Fund, the Trustees noted that the management fees (which include both the advisory and administration fees) and total expenses (net of applicable expense waivers/reimbursements) of Class I shares (the class of shares which is the primary focus of the Fund’s distribution) of the Fund as of March 31, 2024, were both rated in the Average rating level of the Fund’s Peer Group. The Trustees noted that the rating level corresponded to the Fund’s quintile ranking in its Peer Group. The Trustees took into account the fact that the Investment Manager has contractually agreed, through May 1, 2025, to limit the Fund’s net annual operating expenses (subject to certain excluded expenses) to 0.90%. The Trustees concluded that, in light of the nature, extent and quality of the services provided by the Investment Manager and the Subadviser (which is an affiliate of the Investment Manager), the foregoing expense limitation and the considerations noted above with respect to the Investment Manager and the Subadviser, the Fund’s advisory and subadvisory fees are reasonable. With respect to AMG GW&K Small Cap Core Fund, the Trustees noted that the management fees (which | | | | include both the advisory and administration fees) and total expenses (net of applicable expense waivers/reimbursements) of Class I shares (the class of shares which is the primary focus of the Fund’s distribution) of the Fund as of March 31, 2024, were both rated in the Average rating level of the Fund’s Peer Group. The Trustees noted that the rating level corresponded to the Fund’s quintile ranking in its Peer Group. The Trustees took into account the fact that the Investment Manager has contractually agreed, through May 1, 2025, to limit the Fund’s net annual operating expenses (subject to certain excluded expenses) to 0.90%. The Trustees concluded that, in light of the nature, extent and quality of the services provided by the Investment Manager and the Subadviser (which is an affiliate of the Investment Manager), the foregoing expense limitation and the considerations noted above with respect to the Investment Manager and the Subadviser, the Fund’s advisory and subadvisory fees are reasonable. With respect to AMG GW&K Small/Mid Cap Core Fund, the Trustees noted that the management fees (which include both the advisory and administration fees) and total expenses (net of applicable expense waivers/reimbursements) of Class I shares (the class of shares which is the primary focus of the Fund’s distribution) of the Fund as of March 31, 2024, were both rated in the Average rating level of the Fund’s Peer Group. The Trustees noted that the rating level corresponded to the Fund’s quintile ranking in its Peer Group. The Trustees took into account the fact that the Investment Manager has contractually agreed, through May 1, 2025, to limit the Fund’s net annual operating expenses (subject to certain excluded expenses) to 0.82%. The Trustees concluded that, in light of the nature, extent and | | | | quality of the services provided by the Investment Manager and the Subadviser (which is an affiliate of the Investment Manager), the foregoing expense limitation and the considerations noted above with respect to the Investment Manager and the Subadviser, the Fund’s advisory and subadvisory fees are reasonable. * * * * After consideration of the foregoing, the Trustees also reached the following conclusions (in addition to the conclusions discussed above) regarding the Investment Management and Subadvisory Agreements: (a) the Investment Manager and the Subadviser have demonstrated that they possess the capability and resources to perform the duties required of them under the Investment Management Agreement and each Subadvisory Agreement and (b) the Investment Manager and Subadviser maintain appropriate compliance programs. Based on all of the above-mentioned factors and their related conclusions, with no single factor or conclusion being determinative and with each Trustee not necessarily attributing the same weight to each factor, the Trustees concluded that approval of the Investment Management Agreement and each Subadvisory Agreement would be in the best interests of the applicable Fund and its shareholders. Accordingly, on June 12, 2024, the Trustees, and separately a majority of the Independent Trustees, voted to approve the Investment Management Agreement and the Subadvisory Agreement for each Fund. |
34
THIS PAGE INTENTIONALLY LEFT BLANK
THIS PAGE INTENTIONALLY LEFT BLANK
| | |
| | |
| | | | |
INVESTMENT MANAGER AND ADMINISTRATOR AMG Funds LLC 680 Washington Blvd., Suite 500 Stamford, CT 06901 800.548.4539 DISTRIBUTOR AMG Distributors, Inc. 680 Washington Blvd., Suite 500 Stamford, CT 06901 800.548.4539 SUBADVISER GW&K Investment Management, LLC 222 Berkeley St. Boston, MA 02116 CUSTODIAN The Bank of New York Mellon Mutual Funds Custody 240 Greenwich Street New York, NY 10286 LEGAL COUNSEL Ropes & Gray LLP Prudential Tower, 800 Boylston Street Boston, MA 02199-3600 | | TRANSFER AGENT BNY Mellon Investment Servicing (US) Inc. AMG Funds Attn: 534426 AIM 154-0520 500 Ross Street Pittsburgh, PA 15262 800.548.4539 TRUSTEES Jill R. Cuniff Kurt A. Keilhacker Peter W. MacEwen Steven J. Paggioli Eric Rakowski Victoria L. Sassine Garret W. Weston | | This report is prepared for the Funds’ shareholders. It is authorized for distribution to prospective investors only when preceded or accompanied by an effective prospectus. To receive a free copy of the prospectus or Statement of Additional Information, which includes additional information about Fund Trustees, please contact us by calling 800.548.4539. Distributed by AMG Distributors, Inc., member FINRA/SIPC. Current net asset values per share for each Fund are available on the Funds’ website at wealth.amg.com. A description of the policies and procedures each Fund uses to vote its proxies is available: (i) without charge, upon request, by calling 800.548.4539, or (ii) on the Securities and Exchange Commission’s (SEC) website at sec.gov. For information regarding each Fund’s proxy voting record for the 12-month period ended June 30, call 800.548.4539 or visit the SEC website at sec.gov. The Funds file their complete schedule of portfolio holdings with the SEC for the first and third quarters of each fiscal year as an exhibit to their reports on Form N-PORT. The Funds’ portfolio holdings on Form N-PORT are available on the SEC’s website at sec.gov and the Funds’ website at wealth.amg.com. To review a complete list of the Funds’ portfolio holdings, or to view the most recent semi-annual report or annual report, please visit wealth.amg.com. |
| | |
| | |
| | | | | | | | |
EQUITY FUNDS AMG Boston Common Global Impact Boston Common Asset Management, LLC AMG Frontier Small Cap Growth Frontier Capital Management Co., LLC AMG GW&K Small Cap Core AMG GW&K Small Cap Value AMG GW&K Small/Mid Cap Core AMG GW&K Small/Mid Cap Growth AMG GW&K International Small Cap GW&K Investment Management, LLC AMG Montrusco Bolton Large Cap Growth Montrusco Bolton Investments, Inc. AMG Renaissance Large Cap Growth The Renaissance Group LLC | | | | | | AMG River Road Dividend All Cap Value AMG River Road Focused Absolute Value AMG River Road Large Cap Value Select AMG River Road Mid Cap Value AMG River Road Small-Mid Cap Value AMG River Road Small Cap Value River Road Asset Management, LLC AMG TimesSquare Emerging Markets Small Cap AMG TimesSquare Global Small Cap AMG TimesSquare International Small Cap AMG TimesSquare Mid Cap Growth AMG TimesSquare Small Cap Growth TimesSquare Capital Management, LLC AMG Veritas Asia Pacific AMG Veritas China AMG Veritas Global Focus AMG Veritas Global Real Return Veritas Asset Management LLP AMG Yacktman AMG Yacktman Focused AMG Yacktman Global AMG Yacktman Special Opportunities Yacktman Asset Management LP | | FIXED INCOME FUNDS AMG Beutel Goodman Core Plus Bond Beutel, Goodman & Company Ltd. AMG GW&K Core Bond ESG AMG GW&K ESG Bond AMG GW&K Municipal Bond AMG GW&K Municipal Enhanced Yield GW&K Investment Management, LLC ALTERNATIVE FUNDS AMG Systematica Managed Futures Strategy Systematica Investments Limited, acting as general partner of Systematica Investments LP |
| | | | | | |
| | | | | | | |
| | | |
| wealth.amg.com | | 063024 | | | SAR089 | |
| | |
| | SEMI-ANNUAL REPORT |
| | | |
| | | | | | |
| | | AMG Funds |
| | | | |
| | | June 30, 2024 | | | | |
| | |
| | | |
| | |
| | | AMG GW&K ESG Bond Fund |
| | | Class N: MGFIX | | Class I: MGBIX | | |
| | |
| | | AMG GW&K Enhanced Core Bond ESG Fund |
| | | Class N: MFDAX | | Class I: MFDSX | | Class Z: MFDYX |
| | |
| | | AMG GW&K High Income Fund |
| | | Class N: MGGBX | | Class I: GWHIX | | |
| | |
| | | AMG GW&K Municipal Bond Fund |
| | | Class N: GWMTX | | Class I: GWMIX | | |
| | |
| | | AMG GW&K Municipal Enhanced Yield Fund |
| | | Class N: GWMNX | | Class I: GWMEX | | Class Z: GWMZX |
| | | | |
| | | | | |
wealth.amg.com | | 063024 | | SAR088 |
| | |
| | | |
| | | AMG Funds Semi-Annual Report — June 30, 2024 (unaudited) |
Nothing contained herein is to be considered an offer, sale or solicitation of an offer to buy shares of any
series of the AMG Funds Family of Funds. Such offering is made only by prospectus, which includes details as to
offering price and other material information.
| | |
| | AMG GW&K ESG Bond Fund Schedule of Portfolio Investments (unaudited) June 30, 2024 |
| | | | | | | | |
| | | Principal
Amount | | | Value | |
| | |
Corporate Bonds and Notes - 49.4% | | | | | | | | |
| | |
Basic Materials - 5.3% | | | | | | | | |
| | |
Air Products and Chemicals, Inc.
2.700%, 05/15/40 | | | $1,950,000 | | | | $1,391,102 | |
| | |
Alcoa Nederland Holding, B.V. (Netherlands)
4.125%, 03/31/291,2 | | | 2,150,000 | | | | 1,994,152 | |
| | |
Celanese US Holdings LLC
6.550%, 11/15/30 | | | 3,999,000 | | | | 4,178,928 | |
| | |
CF Industries, Inc.
5.150%, 03/15/34 | | | 1,170,000 | | | | 1,121,948 | |
| | |
FMG Resources August 2006 Pty, Ltd. (Australia)
4.500%, 09/15/271,2 | | | 2,750,000 | | | | 2,627,765 | |
| | |
Freeport-McMoRan, Inc.
4.625%, 08/01/30 | | | 2,111,000 | | | | 2,030,806 | |
| | |
HB Fuller Co.
4.250%, 10/15/28 | | | 3,150,000 | | | | 2,968,948 | |
| | |
Methanex Corp. (Canada)
5.125%, 10/15/27 | | | 1,205,000 | | | | 1,162,315 | |
| | |
Novelis Corp.
3.250%, 11/15/261 | | | 2,175,000 | | | | 2,046,684 | |
| | |
Steel Dynamics, Inc.
5.375%, 08/15/34 | | | 1,540,000 | | | | 1,513,646 | |
| | |
Total Basic Materials | | | | | | | 21,036,294 | |
| |
Communications - 4.1% | | | | | |
| | |
AT&T, Inc.
4.300%, 02/15/30 | | | 1,000,000 | | | | 958,037 | |
| | |
CCO Holdings LLC/CCO Holdings Capital Corp.
4.500%, 05/01/32 | | | 2,500,000 | | | | 2,013,553 | |
| | |
Cisco Systems, Inc.
5.500%, 01/15/40 | | | 1,400,000 | | | | 1,421,147 | |
| | |
Cogent Communications Group, Inc.
3.500%, 05/01/261 | | | 3,365,000 | | | | 3,222,565 | |
| | |
Comcast Corp.
4.650%, 02/15/332 | | | 2,117,000 | | | | 2,043,823 | |
| | |
Discovery Communications LLC
3.950%, 03/20/28 | | | 2,047,000 | | | | 1,913,044 | |
| | |
Lamar Media Corp.
4.875%, 01/15/29 | | | 3,250,000 | | | | 3,123,034 | |
| | |
Verizon Communications, Inc.
5.500%, 02/23/542 | | | 1,625,000 | | �� | | 1,590,747 | |
| | |
Total Communications | | | | | | | 16,285,950 | |
| |
Consumer, Cyclical - 7.8% | | | | | |
| | |
Air Canada (Canada)
3.875%, 08/15/261 | | | 1,180,000 | | | | 1,122,406 | |
| | |
Aramark Services, Inc.
5.000%, 02/01/281 | | | 3,020,000 | | | | 2,920,711 | |
| | |
Caesars Entertainment, Inc.
6.500%, 02/15/321 | | | 975,000 | | | | 979,781 | |
| | |
Hasbro, Inc.
3.900%, 11/19/292 | | | 3,105,000 | | | | 2,863,719 | |
| | | | | | | | |
| | | Principal
Amount | | | Value | |
| | |
Hilton Domestic Operating Co., Inc.
4.875%, 01/15/30 | | | $2,600,000 | | | | $2,495,414 | |
| | |
The Home Depot, Inc.
5.875%, 12/16/36 | | | 1,450,000 | | | | 1,536,344 | |
| | |
KB Home
4.800%, 11/15/29 | | | 1,222,000 | | | | 1,152,163 | |
6.875%, 06/15/27 | | | 1,726,000 | | | | 1,761,145 | |
| | |
M/I Homes, Inc.
3.950%, 02/15/30 | | | 335,000 | | | | 298,599 | |
| | |
Mattel, Inc.
3.750%, 04/01/291 | | | 1,075,000 | | | | 991,402 | |
6.200%, 10/01/40 | | | 1,661,000 | | | | 1,637,230 | |
| | |
Murphy Oil USA, Inc.
4.750%, 09/15/29 | | | 2,250,000 | | | | 2,131,197 | |
| | |
Penske Automotive Group, Inc.
3.750%, 06/15/29 | | | 1,750,000 | | | | 1,579,383 | |
| | |
PulteGroup, Inc.
6.000%, 02/15/35 | | | 2,050,000 | | | | 2,107,294 | |
| | |
Toll Brothers Finance Corp.
4.875%, 03/15/27 | | | 2,225,000 | | | | 2,191,897 | |
| | |
Travel + Leisure Co.
4.625%, 03/01/301 | | | 575,000 | | | | 523,282 | |
6.000%, 04/01/273 | | | 475,000 | | | | 473,996 | |
| | |
Walmart, Inc.
4.050%, 06/29/48 | | | 1,850,000 | | | | 1,536,302 | |
| | |
Yum! Brands, Inc.
3.625%, 03/15/312 | | | 3,010,000 | | | | 2,656,460 | |
| | |
Total Consumer, Cyclical | | | | | | | 30,958,725 | |
| |
Consumer, Non-cyclical - 8.1% | | | | | |
| | |
Advocate Health & Hospitals Corp.
4.272%, 08/15/48 | | | 1,670,000 | | | | 1,433,894 | |
| | |
Anheuser-Busch InBev Worldwide, Inc.
4.375%, 04/15/38 | | | 2,200,000 | | | | 2,002,577 | |
| | |
APi Group DE, Inc.
4.125%, 07/15/291 | | | 1,255,000 | | | | 1,142,051 | |
| | |
Ashtead Capital, Inc.
1.500%, 08/12/261 | | | 1,786,000 | | | | 1,627,978 | |
| | |
Campbell Soup Co.
2.375%, 04/24/30 | | | 2,180,000 | | | | 1,875,782 | |
| | |
Centene Corp.
3.375%, 02/15/30 | | | 3,620,000 | | | | 3,213,161 | |
| | |
CommonSpirit Health
3.347%, 10/01/29 | | | 1,075,000 | | | | 986,744 | |
| | |
The Ford Foundation
Series 2020, 2.415%, 06/01/50 | | | 2,690,000 | | | | 1,615,705 | |
| | |
HCA, Inc.
3.500%, 09/01/30 | | | 3,050,000 | | | | 2,751,212 | |
| | |
Kraft Heinz Foods Co.
4.625%, 10/01/39 | | | 2,480,000 | | | | 2,196,793 | |
The accompanying notes are an integral part of these financial statements.
2
| | |
| | AMG GW&K ESG Bond Fund Schedule of Portfolio Investments (continued) |
| | | | | | | | |
| | | Principal
Amount | | | Value | |
| |
Consumer, Non-cyclical - 8.1% (continued) | | | | | |
| | |
Prime Security Services Borrower LLC/Prime Finance, Inc.
5.750%, 04/15/261 | | | $2,800,000 | | | | $2,778,726 | |
| | |
Sysco Corp.
2.400%, 02/15/30 | | | 2,125,000 | | | | 1,841,112 | |
| | |
Teleflex, Inc.
4.250%, 06/01/281 | | | 2,120,000 | | | | 1,997,823 | |
| | |
Tenet Healthcare Corp.
4.625%, 06/15/28 | | | 1,735,000 | | | | 1,649,982 | |
| | |
Teva Pharmaceutical Finance Netherlands III, B.V. (Netherlands)
5.125%, 05/09/292 | | | 2,300,000 | | | | 2,212,528 | |
| | |
United Rentals North America, Inc.
3.875%, 02/15/312 | | | 3,400,000 | | | | 3,033,331 | |
| | |
Total Consumer, Non-cyclical | | | | | | | 32,359,399 | |
| |
Financials - 11.4% | | | | | |
| | |
Bank of America Corp. | | | | | | | | |
MTN, (4.330% to 03/15/49 then 3 month SOFR + 1.782%), 4.330%, 03/15/504,5 | | | 2,775,000 | | | | 2,316,555 | |
(5.872% to 09/15/33 then SOFR + 1.840%), 5.872%, 09/15/344,5 | | | 3,050,000 | | | | 3,137,520 | |
| | |
The Bank of New York Mellon Corp. Series H, (3.700% to 03/20/26 then | | | | | | | | |
| | |
U.S. Treasury Yield Curve CMT 5 year + 3.352%),
3.700%, 03/20/262,4,5,6 | | | 2,165,000 | | | | 2,056,458 | |
| | |
The Charles Schwab Corp.
Series G, (5.375% to 06/01/25 then | | | | | | | | |
| | |
U.S. Treasury Yield Curve CMT 5 year + 4.971%),
5.375%, 06/01/254,5,6 | | | 2,000,000 | | | | 1,977,550 | |
| | |
Citigroup, Inc. Series P, (5.950% to 05/15/25 then 3 month SOFR + 4.167%),
5.950%, 05/15/252,4,5,6 | | | 1,550,000 | | | | 1,539,872 | |
| | |
Series T, (6.250% to 08/15/26 then 3 month SOFR + 4.779%), 6.250%, 08/15/264,5,6 | | | 1,075,000 | | | | 1,074,249 | |
| | |
Crown Castle, Inc.
4.000%, 03/01/27 | | | 1,040,000 | | | | 1,004,509 | |
| | |
The Goldman Sachs Group, Inc.
Series X, (7.500% to 05/10/29 then | | | | | | | | |
| | |
U.S. Treasury Yield Curve CMT 5 year + 2.809%),
7.500%, 05/10/294,5,6 | | | 2,977,000 | | | | 3,061,410 | |
| | |
Huntington Bancshares, Inc. (4.443% to 08/04/27 then SOFR + 1.970%), 4.443%, 08/04/282,4,5 | | | 2,430,000 | | | | 2,353,840 | |
| | |
JPMorgan Chase & Co. | | | | | | | | |
| | |
(3.157% to 04/22/41 then SOFR + 1.460%), 3.157%, 04/22/424,5 | | | 2,710,000 | | | | 2,016,652 | |
| | |
MetLife, Inc. | | | | | | | | |
Series G, (3.850% to 09/15/25 then U.S. Treasury Yield Curve CMT 5 year + 3.576%), 3.850%, 09/15/252,4,5,6 | | | 2,130,000 | | | | 2,061,543 | |
| | | | | | | | |
| | | Principal
Amount | | | Value | |
| | |
Morgan Stanley | | | | | | | | |
(4.431% to 01/23/29 then 3 month SOFR + 1.890%), 4.431%, 01/23/304,5 | | | $2,048,000 | | | | $1,981,213 | |
| | |
The PNC Financial Services Group, Inc. | | | | | | | | |
(5.068% to 01/24/33 then SOFR + 1.933%), 5.068%, 01/24/344,5 | | | 2,386,000 | | | | 2,306,181 | |
| | |
SBA Communications Corp.
3.875%, 02/15/27 | | | 1,265,000 | | | | 1,205,581 | |
| | |
SLM Corp.
3.125%, 11/02/26 | | | 3,365,000 | | | | 3,134,398 | |
4.200%, 10/29/25 | | | 838,000 | | | | 815,127 | |
| | |
Starwood Property Trust, Inc.
4.375%, 01/15/271,2 | | | 1,775,000 | | | | 1,680,520 | |
| | |
Truist Financial Corp., MTN | | | | | | | | |
(5.867% to 06/08/33 then SOFR + 2.361%), 5.867%, 06/08/344,5 | | | 2,288,000 | | | | 2,305,382 | |
| | |
US Bancorp | | | | | | | | |
(5.775% to 06/12/28 then SOFR + 2.020%), 5.775%, 06/12/294,5 | | | 2,350,000 | | | | 2,385,582 | |
| | |
Wells Fargo & Co. | | | | | | | | |
Series U, 5.875%, 06/15/252,5,6 | | | 4,228,000 | | | | 4,208,681 | |
| | |
Weyerhaeuser Co.
6.875%, 12/15/33 | | | 2,600,000 | | | | 2,839,290 | |
| | |
Total Financials | | | | | | | 45,462,113 | |
| |
Industrials - 7.8% | | | | | |
| | |
AECOM
5.125%, 03/15/27 | | | 1,650,000 | | | | 1,621,413 | |
| | |
Ball Corp.
2.875%, 08/15/30 | | | 3,625,000 | | | | 3,079,535 | |
| | |
BWX Technologies, Inc.
4.125%, 06/30/281 | | | 1,210,000 | | | | 1,129,386 | |
| | |
Clean Harbors, Inc.
4.875%, 07/15/271 | | | 2,070,000 | | | | 2,003,631 | |
| | |
Clearwater Paper Corp.
4.750%, 08/15/281 | | | 1,950,000 | | | | 1,802,552 | |
| | |
Crown Americas LLC/Crown Americas Capital Corp. V
4.250%, 09/30/26 | | | 1,650,000 | | | | 1,589,855 | |
| | |
Graphic Packaging International LLC
3.500%, 03/01/291 | | | 2,850,000 | | | | 2,554,238 | |
| | |
Howmet Aerospace, Inc.
6.875%, 05/01/25 | | | 1,025,000 | | | | 1,032,580 | |
| | |
Jacobs Engineering Group, Inc.
5.900%, 03/01/33 | | | 4,068,000 | | | | 4,065,861 | |
| | |
L3Harris Technologies, Inc.
5.050%, 06/01/29 | | | 2,047,000 | | | | 2,032,611 | |
| | |
Mueller Water Products, Inc.
4.000%, 06/15/291 | | | 3,000,000 | | | | 2,746,733 | |
| | |
Owens Corning
7.000%, 12/01/363 | | | 1,800,000 | | | | 2,001,789 | |
The accompanying notes are an integral part of these financial statements.
3
| | |
| | AMG GW&K ESG Bond Fund Schedule of Portfolio Investments (continued) |
| | | | | | | | |
| | | Principal
Amount | | | Value | |
| | |
Industrials - 7.8% (continued) | | | | | | | | |
| | |
Packaging Corp. of America
5.700%, 12/01/33 | | | $2,140,000 | | | | $2,173,760 | |
| | |
Sonoco Products Co.
2.850%, 02/01/322 | | | 1,822,000 | | | | 1,513,868 | |
| | |
United Parcel Service, Inc.
6.200%, 01/15/38 | | | 1,500,000 | | | | 1,624,071 | |
| | |
Total Industrials | | | | | | | 30,971,883 | |
| | |
Technology - 4.1% | | | | | | | | |
| | |
Broadcom, Inc.
4.300%, 11/15/32 | | | 2,820,000 | | | | 2,635,768 | |
| | |
Crowdstrike Holdings, Inc.
3.000%, 02/15/29 | | | 1,285,000 | | | | 1,158,615 | |
| | |
Dell International LLC/EMC Corp.
8.100%, 07/15/36 | | | 972,000 | | | | 1,159,186 | |
| | |
Kyndryl Holdings, Inc.
3.150%, 10/15/31 | | | 2,375,000 | | | | 1,988,816 | |
| | |
Microsoft Corp.
2.525%, 06/01/50 | | | 2,450,000 | | | | 1,546,975 | |
| | |
MSCI, Inc.
3.250%, 08/15/331 | | | 2,015,000 | | | | 1,664,657 | |
| | |
Open Text Holdings, Inc.
4.125%, 02/15/301 | | | 1,125,000 | | | | 1,014,531 | |
| | |
SK Hynix, Inc. (South Korea)
2.375%, 01/19/311,2 | | | 3,000,000 | | | | 2,470,708 | |
| | |
Twilio, Inc.
3.625%, 03/15/29 | | | 600,000 | | | | 539,693 | |
3.875%, 03/15/31 | | | 2,194,000 | | | | 1,929,589 | |
| | |
Total Technology | | | | | | | 16,108,538 | |
| | |
Utilities - 0.8% | | | | | | | | |
| | |
National Rural Utilities Cooperative Finance Corp.
1.350%, 03/15/31 | | | 4,160,000 | | | | 3,254,178 | |
| |
Total Corporate Bonds and Notes
(Cost $209,632,616) | | | | 196,437,080 | |
| |
| Asset-Backed Securities - 2.6% | | | | | |
| | |
American Express Credit Account Master Trust
Series 2022-4, Class A
4.950%, 10/15/27 | | | 2,145,000 | | | | 2,134,255 | |
| | |
Ford Credit Auto Owner Trust
Series 2022-B, Class A4
3.930%, 08/15/27 | | | 2,353,000 | | | | 2,304,254 | |
| | |
John Deere Owner Trust
Series 2022-A, Class A4
2.490%, 01/16/29 | | | 2,206,000 | | | | 2,128,936 | |
| | |
Santander Drive Auto Receivables Trust | | | | | | | | |
Series 2020-4, Class D
1.480%, 01/15/27 | | | 1,033,155 | | | | 1,020,406 | |
Series 2022-7, Class B
5.950%, 01/17/28 | | | 2,100,000 | | | | 2,103,264 | |
| | | | | | | | |
| | | Principal
Amount | | | Value | |
| | |
Toyota Auto Receivables Owner Trust
Series 2021-B, Class A4
0.530%, 10/15/26 | | | $923,000 | | | $ | 889,106 | |
| |
Total Asset-Backed Securities
(Cost $10,579,582) | | | | 10,580,221 | |
| |
| Mortgage-Backed Securities - 1.8% | | | | | |
| | |
Chase Home Lending Mortgage Trust Series
Series 2024-1, Class A6 6.500%, 01/25/551,5 | | | 1,477,496 | | | | 1,477,549 | |
| | |
GS Mortgage-Backed Securities Corp. Trust | | | | | | | | |
Series 2021-PJ4, Class A6 2.500%, 09/25/511,5 | | | 2,833,934 | | | | 2,559,504 | |
Series 2021-PJ9, Class A8 2.500%, 02/26/521,5 | | | 1,603,894 | | | | 1,380,042 | |
| | |
Morgan Stanley Residential Mortgage Loan Trust Series 2024-1, Class A4 5.500%, 12/25/531,5 | | | 1,763,108 | | | | 1,736,258 | |
| |
Total Mortgage-Backed Securities
(Cost $7,193,154) | | | | 7,153,353 | |
| |
| Municipal Bonds - 4.1% | | | | | |
| | |
California Health Facilities Financing Authority
4.190%, 06/01/37 | | | 3,500,000 | | | | 3,186,492 | |
| | |
California State General Obligation, School Improvements, Build America Bonds 7.550%, 04/01/39 | | | 2,280,000 | | | | 2,710,271 | |
| | |
Dallas Fort Worth International Airport, Series A
4.507%, 11/01/51 | | | 1,000,000 | | | | 887,557 | |
| | |
JobsOhio Beverage System, Series A
2.833%, 01/01/38 | | | 3,700,000 | | | | 2,999,107 | |
| | |
New Jersey Economic Development Authority, Pension Funding, Series A (National Insured)
7.425%, 02/15/29 | | | 3,300,000 | | | | 3,515,407 | |
| | |
Port Authority of New York & New Jersey
6.040%, 12/01/29 | | | 1,750,000 | | | | 1,845,486 | |
| | |
University of California, Series BI
1.697%, 05/15/29 | | | 1,200,000 | | | | 1,045,344 | |
| |
Total Municipal Bonds
(Cost $19,056,858) | | | | 16,189,664 | |
| |
| U.S. Government and Agency Obligations - 40.8% | | | | | |
| |
Fannie Mae - 15.1% | | | | | |
| | |
FNMA
3.500%,
02/01/35 to 02/01/51 | | | 31,056,233 | | | | 28,470,120 | |
4.000%, 07/01/44 to 06/01/49 | | | 19,040,988 | | | | 17,735,219 | |
4.500%, 05/01/48 to 06/01/49 | | | 5,752,762 | | | | 5,571,299 | |
5.000%, 05/01/50 | | | 2,534,435 | | | | 2,495,730 | |
5.500%, 11/01/52 | | | 5,968,968 | | | | 5,985,090 | |
| |
Total Fannie Mae | | | | 60,257,458 | |
| |
Freddie Mac - 13.1% | | | | | |
| | |
FHLMC
2.000%, 03/01/36 | | | 7,193,037 | | | | 6,359,346 | |
3.000%, 04/01/51 | | | 14,669,979 | | | | 12,619,470 | |
The accompanying notes are an integral part of these financial statements.
4
| | |
| | AMG GW&K ESG Bond Fund Schedule of Portfolio Investments (continued) |
| | | | | | | | |
| | | Principal
Amount | | | Value | |
| |
Freddie Mac - 13.1% (continued) | | | | | |
| | |
FHLMC
3.500%, 02/01/50 | | | $8,159,261 | | | $ | 7,313,927 | |
4.500%, 10/01/48 to 12/01/48 | | | 8,498,652 | | | | 8,132,686 | |
5.500%, 07/01/53 | | | 6,245,176 | | | | 6,235,153 | |
| | |
Freddie Mac Multifamily Structured Pass Through Certificates | | | | | | | | |
Series K134, Class A2
2.243%, 10/25/315 | | | 6,230,000 | | | | 5,266,018 | |
| | |
Freddie Mac REMICS | | | | | | | | |
Series 5106, Class KA
2.000%, 03/25/41 | | | 4,451,607 | | | | 4,026,193 | |
Series 5297, Class DA
5.000%, 12/25/52 | | | 2,044,893 | | | | 1,985,526 | |
| |
Total Freddie Mac | | | | 51,938,319 | |
| |
Ginnie Mae - 0.5% | | | | | |
| | |
GNMA | | | | | | | | |
Series 2023-111, Class FD
(SOFR + 1.000%, Cap 7.000%, Floor 1.000%), 6.333%, 08/20/535 | | | 2,053,842 | | | | 2,045,919 | |
| |
U.S. Treasury Obligations - 12.1% | | | | | |
| | |
U.S. Treasury Bonds
1.250%, 05/15/50 | | | 5,625,000 | | | | 2,787,891 | |
1.875%, 02/15/51 | | | 14,997,000 | | | | 8,758,014 | |
2.250%, 05/15/41 | | | 16,359,000 | | | | 11,835,992 | |
2.500%, 02/15/46 | | | 2,096,000 | | | | 1,476,861 | |
3.125%, 05/15/48 | | | 10,968,000 | | | | 8,529,334 | |
3.500%, 02/15/39 | | | 5,500,000 | | | | 4,948,926 | |
| | | | | | | | |
| | | Principal
Amount | | | Value | |
| | |
U.S. Treasury Bonds
3.625%, 02/15/53 | | | $2,010,000 | | | $ | 1,709,913 | |
3.875%, 02/15/43 | | | 4,474,000 | | | | 4,044,076 | |
| | |
U.S. Treasury Notes
3.875%, 11/30/29 | | | 4,100,000 | | | | 4,004,547 | |
| | |
Total U.S. Treasury Obligations | | | | | | | 48,095,554 | |
| |
Total U.S. Government and Agency Obligations
(Cost $190,986,432) | | | | 162,337,250 | |
| |
Short-Term Investments - 5.1% | | | | | |
| |
Joint Repurchase Agreements - 4.2%7 | | | | | |
| | |
State of Wisconsin Investment Board, dated 06/28/24, due 07/01/24, 5.450% total to be received $16,832,736 (collateralized by various U.S. Treasuries, 0.125% - 3.625%, 10/15/25 -02/15/53, totaling $17,128,784) | | | 16,825,095 | | | | 16,825,095 | |
| |
Repurchase Agreements - 0.9% | | | | | |
| | |
Fixed Income Clearing Corp., dated 06/28/24, due 07/01/24, 5.150% total to be received $3,469,488 (collateralized by a U.S. Treasury Note, 0.125%, 04/15/25, totaling $3,537,438) | | | 3,468,000 | | | | 3,468,000 | |
| | |
Total Short-Term Investments
(Cost $20,293,095) | | | | | | | 20,293,095 | |
| | |
Total Investments - 103.8%
(Cost $457,741,737) | | | | | | | 412,990,663 | |
| |
Other Assets, less Liabilities - (3.8)% | | | | (15,112,297 | ) |
| | |
Net Assets - 100.0% | | | | | | $ | 397,878,366 | |
| 1 | Security exempt from registration under Rule 144A of the Securities Act of 1933. These securities may be resold in transactions exempt from registration, normally to qualified institutional buyers. At June 30, 2024, the value of these securities amounted to $48,195,635 or 12.1% of net assets. |
| 2 | Some of these securities, amounting to $21,447,918 or 5.4% of net assets, were out on loan to various borrowers and are collateralized by cash and various U.S. Treasury Obligations. See Note 4 of Notes to Financial Statements. |
| 3 | Step Bond: A debt instrument with either deferred interest payments or an interest rate that resets at specific times during its term. |
| 4 | Fixed to variable rate investment. The rate shown reflects the fixed rate in effect at June 30, 2024. Rate will reset at a future date. |
| 5 | Variable rate security. The rate shown is based on the latest available information as of June 30, 2024. Certain variable rate securities are not based on a published reference rate and spread but are determined by the issuer or agent and are based on current market conditions. These securities do not indicate a reference rate and spread in their description above. |
| 6 | Perpetuity Bond. The date shown represents the next call date. |
| 7 | Cash collateral received for securities lending activity was invested in these joint repurchase agreements. |
| | |
| CMT | | Constant Maturity Treasury |
| |
| FHLMC | | Freddie Mac |
| |
| FNMA | | Fannie Mae |
| |
| GNMA | | Ginnie Mae |
| |
| MTN | | Medium-Term Note |
| |
| National Insured | | National Public Finance Guarantee Corp. |
| |
| REMICS | | Real Estate Mortgage Investment Conduit |
| |
| SOFR | | Secured Overnight Financing Rate |
The accompanying notes are an integral part of these financial statements.
5
| | |
| | AMG GW&K ESG Bond Fund Schedule of Portfolio Investments (continued) |
The following table summarizes the inputs used to value the Fund’s investments by the fair value hierarchy levels as of June 30, 2024:
| | | | | | | | | | | | | | | | | | | | | | | | |
| | | Level 1 | | | Level 2 | | | Level 3 | | | Total | |
Investments in Securities | | | | | | | | | | | | | | | | | | | | | | | | |
| | | | | | |
Corporate Bonds and Notes† | | | — | | | | | | | | $196,437,080 | | | | — | | | | | | | | $196,437,080 | |
| | | | | | |
Asset-Backed Securities | | | — | | | | | | | | 10,580,221 | | | | — | | | | | | | | 10,580,221 | |
| | | | | | |
Mortgage-Backed Securities | | | — | | | | | | | | 7,153,353 | | | | — | | | | | | | | 7,153,353 | |
| | | | | | |
Municipal Bonds† | | | — | | | | | | | | 16,189,664 | | | | — | | | | | | | | 16,189,664 | |
| | | | | | |
U.S. Government and Agency Obligations† | | | — | | | | | | | | 162,337,250 | | | | — | | | | | | | | 162,337,250 | |
| | | | | | |
Short-Term Investments | | | | | | | | | | | | | | | | | | | | | | | | |
| | | | | | |
Joint Repurchase Agreements | | | — | | | | | | | | 16,825,095 | | | | — | | | | | | | | 16,825,095 | |
| | | | | | |
Repurchase Agreements | | | — | | | | | | | | 3,468,000 | | | | — | | | | | | | | 3,468,000 | |
| | | | | | | | | | | | | | | | | | | | | | | | |
| | | | | | |
Total Investments in Securities | | | — | | | | | | | | $412,990,663 | | | | — | | | | | | | | $412,990,663 | |
| | | | | | | | | | | | | | | | | | | | | | | | |
| | † | All corporate bonds and notes, municipal bonds and U.S. government and agency obligations held in the Fund are Level 2 securities. For a detailed breakout of corporate bonds and notes, municipal bonds and U.S. government and agency obligations by major industry or agency classification, please refer to the Fund’s Schedule of Portfolio Investments. |
For the six months ended June 30, 2024, there were no transfers in or out of Level 3.
The accompanying notes are an integral part of these financial statements.
6
| | |
| | AMG GW&K Enhanced Core Bond ESG Fund Schedule of Portfolio Investments (unaudited) June 30, 2024 |
| | | | | | | | |
| | | Shares | | | Value | |
| |
Short-Term Investments - 100.3% | | | | | |
| |
Other Investment Companies - 100.3% | | | | | |
| | |
Dreyfus Institutional Preferred Government Money Market Fund, Institutional Shares, 5.27%1,2 | | | 27,524,882 | | | | $27,524,882 | |
| | |
Total Short-Term Investments | | | | | | | | |
(Cost $27,524,882) | | | | | | | 27,524,882 | |
| | | | | | |
| | | | | Value | |
| |
Total Investments - 100.3% | | | | |
(Cost $27,524,882) | | | | | $27,524,882 | |
| |
Other Assets, less Liabilities - (0.3)% | | | (89,795 | ) |
| | |
Net Assets - 100.0% | | | | | $27,435,087 | |
| 1 | Yield shown represents the June 30, 2024, seven day average yield, which refers to the sum of the previous seven days’ dividends paid, expressed as an annual percentage. |
| 2 | A copy of the security’s annual report to shareholders may be obtained without charge on the SEC’s website (http://www.sec.gov). |
The following table summarizes the inputs used to value the Fund’s investments by the fair value hierarchy levels as of June 30, 2024:
| | | | | | | | | | | | | | | | | | | | | | | | | | | | | | | | |
| | | | | | Level 1 | | | | | | Level 2 | | | | | | Level 3 | | | | | | Total | |
Investments in Securities | | | | | | | | | | | | | | | | | | | | | | | | | | | | | | | | |
| | | | | | | | |
Short-Term Investments | | | | | | | | | | | | | | | | | | | | | | | | | | | | | | | | |
| | | | | | | | |
Other Investment Companies | | | | | | | $27,524,882 | | | | | | | | — | | | | | | | | — | | | | | | | | $27,524,882 | |
| | | | | | | | | | | | | | | | | | | | | | | | | | | | | | | | |
| | | | | | | | |
Total Investments in Securities | | | | | | | $27,524,882 | | | | | | | | — | | | | | | | | — | | | | | | | | $27,524,882 | |
| | | | | | | | | | | | | | | | | | | | | | | | | | | | | | | | |
For the six months ended June 30, 2024, there were no transfers in or out of Level 3.
The accompanying notes are an integral part of these financial statements.
7
| | |
| | AMG GW&K High Income Fund Schedule of Portfolio Investments (unaudited) June 30, 2024 |
| | | | | | | | |
| | | Shares | | | Value | |
| |
Short-Term Investments - 100.9% | | | | | |
| |
Other Investment Companies - 100.9% | | | | | |
| | |
Dreyfus Institutional Preferred Government Money Market Fund, Institutional Shares, 5.27%1,2 | | | 6,746,570 | | | | $6,746,570 | |
| | |
Total Short-Term Investments | | | | | | | | |
(Cost $6,746,570) | | | | | | | 6,746,570 | |
| | | | | | |
| | | | | Value | |
| |
Total Investments - 100.9% | | | | |
(Cost $6,746,570) | | | | | $6,746,570 | |
| |
Other Assets, less Liabilities - (0.9)% | | | (60,255 | ) |
| | |
Net Assets - 100.0% | | | | | $6,686,315 | |
| 1 | Yield shown represents the June 30, 2024, seven day average yield, which refers to the sum of the previous seven days’ dividends paid, expressed as an annual percentage. |
| 2 | A copy of the security’s annual report to shareholders may be obtained without charge on the SEC’s website (http://www.sec.gov). |
The following table summarizes the inputs used to value the Fund’s investments by the fair value hierarchy levels as of June 30, 2024:
| | | | | | | | | | | | | | | | | | | | | | | | | | | | | | | | |
| | | | | | Level 1 | | | | | | Level 2 | | | | | | Level 3 | | | | | | Total | |
Investments in Securities | | | | | | | | | | | | | | | | | | | | | | | | | | | | | | | | |
| | | | | | | | |
Short-Term Investments | | | | | | | | | | | | | | | | | | | | | | | | | | | | | | | | |
| | | | | | | | |
Other Investment Companies | | | | | | | $6,746,570 | | | | | | | | — | | | | | | | | — | | | | | | | | $6,746,570 | |
| | | | | | | | | | | | | | | | | | | | | | | | | | | | | | | | |
| | | | | | | | |
Total Investments in Securities | | | | | | | $6,746,570 | | | | | | | | — | | | | | | | | — | | | | | | | | $6,746,570 | |
| | | | | | | | | | | | | | | | | | | | | | | | | | | | | | | | |
For the six months ended June 30, 2024, there were no transfers in or out of Level 3.
The accompanying notes are an integral part of these financial statements.
8
| | |
| | AMG GW&K Municipal Bond Fund Schedule of Portfolio Investments (unaudited) June 30, 2024 |
| | | | | | | | |
| | | Principal
Amount | | | Value | |
| |
Municipal Bonds - 101.8% | | | | | |
| |
Alabama - 1.4% | | | | | |
| | |
Alabama Public School and College Authority, Series A
5.000%, 11/01/34 | | | $7,500,000 | | | | $8,335,789 | |
| | |
County of Jefferson
5.250%, 10/01/49 | | | 5,810,000 | | | | 6,214,269 | |
| | |
Total Alabama | | | | | | | 14,550,058 | |
| | |
Arizona - 1.3% | | | | | | | | |
| | |
Arizona Board of Regents
5.000%, 08/01/31 | | | 3,400,000 | | | | 3,818,486 | |
| | |
City of Glendale
5.000%, 07/01/36 | | | 4,920,000 | | | | 5,694,528 | |
| | |
Maricopa County Industrial Development Authority, Series D,
5.000%, 12/01/401 | | | 2,150,000 | | | | 2,312,981 | |
5.000%, 12/01/411 | | | 1,000,000 | | | | 1,069,430 | |
| | |
Total Arizona | | | | | | | 12,895,425 | |
| | |
California - 6.0% | | | | | | | | |
| | |
California Municipal Finance Authority, Community Medical Centers, Series A
5.000%, 02/01/31 | | | 900,000 | | | | 920,352 | |
| | |
City of Los Angeles Department of Airports, Series C
5.000%, 05/15/30 | | | 5,515,000 | | | | 5,948,709 | |
| | |
Los Angeles Unified School District, Series A
5.000%, 07/01/33 | | | 6,500,000 | | | | 7,546,486 | |
| | |
San Francisco City & County Airport Commission, San Francisco International Airport, Series A,
5.000%, 05/01/32 | | | 3,000,000 | | | | 3,243,987 | |
5.000%, 05/01/34 | | | 5,010,000 | | | | 5,285,475 | |
5.000%, 05/01/35 | | | 5,800,000 | | | | 6,116,595 | |
| | |
State of California,
5.000%, 09/01/29 | | | 4,075,000 | | | | 4,216,245 | |
5.000%, 09/01/33 | | | 5,000,000 | | | | 5,819,366 | |
5.000%, 09/01/35 | | | 5,000,000 | | | | 5,807,067 | |
5.000%, 09/01/35 | | | 2,500,000 | | | | 2,922,564 | |
5.000%, 10/01/36 | | | 5,000,000 | | | | 5,772,007 | |
| | |
The Regents of the University of California, Series BV
5.000%, 05/15/40 | | | 6,000,000 | | | | 6,878,773 | |
| | |
Total California | | | | | | | 60,477,626 | |
| | |
Colorado - 0.5% | | | | | | | | |
| | |
Colorado Health Facilities Authority, Series A
5.000%, 08/01/33 | | | 4,260,000 | | | | 4,549,625 | |
| | |
Connecticut - 4.0% | | | | | | | | |
| | |
Connecticut State Health & Educational Facilities Authority,
5.000%, 07/01/31 | | | 6,205,000 | | | | 6,630,588 | |
5.000%, 07/01/33 | | | 2,750,000 | | | | 2,933,407 | |
5.000%, 07/01/34 | | | 3,100,000 | | | | 3,305,190 | |
| | | | | | | | |
| | | Principal
Amount | | | Value | |
| | |
State of Connecticut Special Tax Obligation, Transportation Infrastructure, Series A
5.000%, 01/01/30 | | | $10,180,000 | | | | $10,741,120 | |
| | |
State of Connecticut Special Tax Obligation, Transportation Infrastructure, Series B
5.000%, 10/01/35 | | | 7,500,000 | | | | 7,960,262 | |
| | |
State of Connecticut, Series A
5.000%, 01/15/31 | | | 7,650,000 | | | | 8,392,510 | |
| | |
Total Connecticut | | | | | | | 39,963,077 | |
| | |
District of Columbia - 1.8% | | | | | | | | |
| | |
District of Columbia, Series A
5.000%, 06/01/30 | | | 6,020,000 | | | | 6,203,090 | |
| | |
District of Columbia, Series B
5.000%, 06/01/31 | | | 5,080,000 | | | | 5,430,109 | |
| | |
District of Columbia, Series C
5.000%, 12/01/34 | | | 6,000,000 | | | | 6,878,146 | |
| | |
Total District of Columbia | | | | | | | 18,511,345 | |
| | |
Florida - 4.6% | | | | | | | | |
| | |
Escambia County Health Facilities Authority
5.000%, 08/15/37 | | | 6,000,000 | | | | 6,161,132 | |
| | |
Florida Development Finance Corp.
4.000%, 11/15/33 | | | 10,000,000 | | | | 10,301,652 | |
| | |
Florida Housing Finance Corp., Series 3, (GNMA FNMA FHLMC)
4.500%, 07/01/44 | | | 5,000,000 | | | | 5,006,804 | |
| | |
Florida’s Turnpike Enterprise, Department of Transportation, Series C
5.000%, 07/01/28 | | | 7,075,000 | | | | 7,294,040 | |
| | |
Lee Memorial Health System, Series A1
5.000%, 04/01/34 | | | 3,145,000 | | | | 3,333,419 | |
| | |
Orange County Health Facilities Authority, Series A
5.000%, 10/01/31 | | | 4,525,000 | | | | 4,648,858 | |
| | |
State Board of Administration Finance Corp., Series A
5.526%, 07/01/34 | | | 10,000,000 | | | | 10,060,965 | |
| | |
Total Florida | | | | | | | 46,806,870 | |
| | |
Illinois - 8.3% | | | | | | | | |
| | |
Chicago O’Hare International Airport, Senior Lien, Series A,
5.000%, 01/01/35 | | | 5,010,000 | | | | 5,411,719 | |
5.000%, 01/01/36 | | | 10,050,000 | | | | 10,448,865 | |
5.000%, 01/01/38 | | | 5,500,000 | | | | 5,693,573 | |
| | |
Illinois Finance Authority, Series A,
4.000%, 08/15/37 | | | 5,910,000 | | | | 5,961,248 | |
5.000%, 04/01/34 | | | 3,500,000 | | | | 4,050,521 | |
| | |
Illinois Finance Authority, Series B
5.000%, 04/01/351 | | | 2,970,000 | | | | 3,426,730 | |
The accompanying notes are an integral part of these financial statements.
9
| | |
| | AMG GW&K Municipal Bond Fund Schedule of Portfolio Investments (continued) |
| | | | | | | | |
| | | Principal
Amount | | | Value | |
| | |
Illinois - 8.3% (continued) | | | | | | | | |
| | |
Illinois State Toll Highway Authority, Senior Revenue, Series A,
5.000%, 01/01/30 | | | $10,110,000 | | | | $10,862,701 | |
5.000%, 12/01/31 | | | 9,735,000 | | | | 9,910,054 | |
5.000%, 01/01/36 | | | 3,000,000 | | | | 3,469,878 | |
| | |
State of Illinois, Series A
5.250%, 03/01/37 | | | 8,500,000 | | | | 9,441,958 | |
| | |
State of Illinois, Series B,
5.000%, 05/01/34 | | | 10,000,000 | | | | 10,964,664 | |
5.250%, 05/01/42 | | | 2,000,000 | | | | 2,217,584 | |
5.250%, 05/01/45 | | | 2,000,000 | | | | 2,185,262 | |
| | |
Total Illinois | | | | | | | 84,044,757 | |
| | |
Indiana - 0.9% | | | | | | | | |
| | |
Indiana Finance Authority, Series 1
5.000%, 10/01/29 | | | 3,555,000 | | | | 3,889,639 | |
| | |
Indiana Finance Authority, Series A
5.000%, 02/01/32 | | | 5,000,000 | | | | 5,595,679 | |
| | |
Total Indiana | | | | | | | 9,485,318 | |
| | |
Iowa - 1.6% | | | | | | | | |
| | |
Iowa Finance Authority, State Revolving Fund Green Bond
5.000%, 08/01/30 | | | 15,025,000 | | | | 15,809,995 | |
| | |
Kentucky - 1.3% | | | | | | | | |
| | |
Kentucky State Property & Building Commission, Series A
5.000%, 11/01/29 | | | 3,010,000 | | | | 3,248,751 | |
| | |
Kentucky State Property & Building Commission, Series B
5.000%, 11/01/29 | | | 4,000,000 | | | | 4,317,277 | |
| | |
Louisville/Jefferson County Metropolitan Government, Norton Healthcare Inc.
5.000%, 10/01/29 | | | 5,505,000 | | | | 5,615,160 | |
| | |
Total Kentucky | | | | | | | 13,181,188 | |
| | |
Louisiana - 1.7% | | | | | | | | |
| | |
Louisiana Stadium & Exposition District, Series A,
5.000%, 07/01/40 | | | 2,750,000 | | | | 3,016,332 | |
5.000%, 07/01/42 | | | 11,500,000 | | | | 12,501,322 | |
| | |
State of Louisiana, Series A
5.000%, 09/01/30 | | | 2,000,000 | | | | 2,133,204 | |
| | |
Total Louisiana | | | | | | | 17,650,858 | |
| | |
Maryland - 3.9% | | | | | | | | |
| | |
Maryland State Transportation Authority
5.000%, 07/01/33 | | | 6,350,000 | | | | 7,020,196 | |
| | |
State of Maryland, Department of Transportation,
5.000%, 10/01/28 | | | 12,365,000 | | | | 12,811,229 | |
5.000%, 09/01/29 | | | 12,205,000 | | | | 12,880,483 | |
| | |
State of Maryland, State & Local Facilities Loan of 2019, 1st Series
5.000%, 03/15/30 | | | 6,000,000 | | | | 6,519,636 | |
| | |
Total Maryland | | | | | | | 39,231,544 | |
| | | | | | | | |
| | | | | | | | |
| | | Principal
Amount | | | Value | |
| |
Massachusetts - 3.4% | | | | | |
| | |
Commonwealth of Massachusetts, Series A,
5.000%, 03/01/32 | | | $11,355,000 | | | | $12,887,416 | |
5.000%, 03/01/35 | | | 4,710,000 | | | | 5,481,201 | |
| | |
Massachusetts Bay Transportation Authority, Series A,
5.000%, 07/01/38 | | | 5,000,000 | | | | 5,696,950 | |
5.000%, 07/01/39 | | | 4,730,000 | | | | 5,370,442 | |
| | |
Massachusetts Development Finance Agency
5.250%, 07/01/48 | | | 4,250,000 | | | | 4,552,411 | |
| | |
Total Massachusetts | | | | | | | 33,988,420 | |
| | |
Michigan - 0.8% | | | | | | | | |
| | |
Michigan Finance Authority, Henry Ford Health System
5.000%, 11/15/29 | | | 3,500,000 | | | | 3,596,931 | |
| | |
Wayne County Airport Authority, Series A,
5.000%, 12/01/37 | | | 2,285,000 | | | | 2,527,881 | |
5.000%, 12/01/39 | | | 1,800,000 | | | | 1,976,250 | |
| | |
Total Michigan | | | | | | | 8,101,062 | |
| | |
Nebraska - 0.6% | | | | | | | | |
| | |
Omaha Public Power District, Series B,
5.000%, 02/01/361 | | | 3,000,000 | | | | 3,440,992 | |
5.000%, 02/01/371 | | | 2,000,000 | | | | 2,281,505 | |
| | |
Total Nebraska | | | | | | | 5,722,497 | |
| | |
New Jersey - 6.4% | | | | | | | | |
| | |
New Jersey Economic Development Authority, Series A
5.250%, 11/01/40 | | | 7,000,000 | | | | 7,774,156 | |
| | |
New Jersey Economic Development Authority, Series SSS,
5.250%, 06/15/36 | | | 3,000,000 | | | | 3,470,708 | |
5.250%, 06/15/37 | | | 2,000,000 | | | | 2,301,961 | |
| | |
New Jersey State Turnpike Authority, Series D
5.000%, 01/01/28 | | | 6,000,000 | | | | 6,144,666 | |
| | |
New Jersey Transportation Trust Fund Authority, Series A,
5.250%, 06/15/41 | | | 2,700,000 | | | | 3,020,480 | |
5.250%, 06/15/42 | | | 2,500,000 | | | | 2,785,788 | |
| | |
New Jersey Transportation Trust Fund Authority, Series B,
5.000%, 06/15/30 | | | 6,255,000 | | | | 6,823,241 | |
5.000%, 06/15/31 | | | 7,615,000 | | | | 8,410,366 | |
5.000%, 06/15/32 | | | 5,750,000 | | | | 6,346,476 | |
5.000%, 06/15/33 | | | 6,000,000 | | | | 6,617,706 | |
| | |
New Jersey Transportation Trust Fund Authority, Series BB
4.000%, 06/15/37 | | | 3,000,000 | | | | 3,049,241 | |
| | |
New Jersey Turnpike Authority, Series C
5.000%, 01/01/451 | | | 4,000,000 | | | | 4,365,641 | |
| | |
South Jersey Transportation Authority,
5.000%, 11/01/39 | | | 1,150,000 | | | | 1,233,310 | |
5.000%, 11/01/41 | | | 2,565,000 | | | | 2,730,244 | |
| | |
Total New Jersey | | | | | | | 65,073,984 | |
| | | | | | | | |
The accompanying notes are an integral part of these financial statements.
10
| | |
| | AMG GW&K Municipal Bond Fund Schedule of Portfolio Investments (continued) |
| | | | | | | | |
| | | Principal
Amount | | | Value | |
| | |
New Mexico - 0.8% | | | | | | | | |
| | |
New Mexico Finance Authority, Series A
5.000%, 06/15/30 | | | $7,500,000 | | | | $8,268,068 | |
| | |
New York - 20.0% | | | | | | | | |
| | |
City of New York
5.000%, 08/01/34 | | | 5,000,000 | | | | 5,739,629 | |
| | |
City of New York, Series B-1
5.000%, 08/01/32 | | | 3,000,000 | | | | 3,403,810 | |
| | |
City of New York, Series C,
5.000%, 08/01/33 | | | 1,500,000 | | | | 1,656,094 | |
5.000%, 08/01/34 | | | 3,250,000 | | | | 3,586,630 | |
| | |
City of New York, Series D
5.000%, 04/01/32 | | | 7,705,000 | | | | 8,704,489 | |
| | |
City of New York, Series L-5
5.000%, 04/01/33 | | | 6,500,000 | | | | 7,243,206 | |
| | |
Long Island Power Authority
5.000%, 09/01/35 | | | 5,030,000 | | | | 5,386,750 | |
| | |
Metropolitan Transportation Authority, Green Bond, Series B
5.000%, 11/15/27 | | | 14,225,000 | | | | 14,973,601 | |
| | |
Metropolitan Transportation Authority, Series F
5.000%, 11/15/28 | | | 4,760,000 | | | | 4,844,327 | |
| | |
New York City Municipal Water Finance Authority, Series 2
5.000%, 06/15/36 | | | 4,000,000 | | | | 4,759,430 | |
| | |
New York City Transitional Finance Authority Building Aid Revenue, Series S-3, (State Aid Withholding)
5.000%, 07/15/31 | | | 5,080,000 | | | | 5,399,015 | |
| | |
New York City Transitional Finance Authority, Future Tax Secured Subordinate, Series A-1,
5.000%, 05/01/40 | | | 2,500,000 | | | | 2,790,333 | |
5.000%, 05/01/41 | | | 3,000,000 | | | | 3,329,407 | |
| | |
New York City Transitional Finance Authority, Future Tax Secured Subordinate, Series E-1
5.000%, 02/01/37 | | | 7,000,000 | | | | 7,761,461 | |
| | |
New York City Transitional Finance Authority, Future Tax Secured Subordinate, Series F-1,
5.000%, 11/01/31 | | | 2,500,000 | | | | 2,802,061 | |
5.000%, 11/01/32 | | | 4,000,000 | | | | 4,478,366 | |
5.000%, 02/01/39 | | | 4,000,000 | | | | 4,435,463 | |
| | |
New York State Dormitory Authority 4.000%, 05/01/39 | | | 2,000,000 | | | | 2,004,200 | |
| | |
New York State Dormitory Authority, Series A,
5.000%, 03/15/31 | | | 7,670,000 | | | | 8,226,149 | |
5.000%, 03/15/32 | | | 3,000,000 | | | | 3,340,642 | |
5.000%, 03/15/33 | | | 3,200,000 | | | | 3,610,182 | |
5.000%, 03/15/40 | | | 5,250,000 | | | | 5,938,216 | |
5.000%, 03/15/41 | | | 9,340,000 | | | | 10,507,808 | |
| | |
New York State Dormitory Authority, Series E
5.000%, 03/15/32 | | | 8,410,000 | | | | 8,525,005 | |
| | |
New York State Thruway Authority, Series K
5.000%, 01/01/31 | | | 4,430,000 | | | | 4,458,248 | |
| | | | | | | | |
| | | | | | | | |
| | | Principal
Amount | | | Value | |
| | |
New York State Urban Development Corp.
5.000%, 03/15/32 | | | $7,000,000 | | | | $7,763,688 | |
| | |
New York Transportation Development Corp.,
4.000%, 10/31/41 | | | 1,250,000 | | | | 1,126,394 | |
4.000%, 10/31/46 | | | 1,500,000 | | | | 1,293,000 | |
5.000%, 12/01/30 | | | 1,000,000 | | | | 1,088,639 | |
5.000%, 12/01/31 | | | 1,100,000 | | | | 1,197,842 | |
5.000%, 12/01/32 | | | 1,450,000 | | | | 1,578,767 | |
5.000%, 12/01/33 | | | 1,000,000 | | | | 1,088,767 | |
5.000%, 12/01/36 | | | 10,000,000 | | | | 10,710,587 | |
5.250%, 06/30/49 | | | 5,000,000 | | | | 5,222,923 | |
6.000%, 06/30/54 | | | 3,000,000 | | | | 3,294,688 | |
| | |
New York Transportation Development Corp. (AGM)
5.000%, 06/30/49 | | | 2,000,000 | | | | 2,073,033 | |
| | |
Port Authority of New York & New Jersey, Series 221
5.000%, 07/15/32 | | | 6,545,000 | | | | 6,988,293 | |
| | |
Triborough Bridge & Tunnel Authority
5.000%, 11/15/33 | | | 3,970,000 | | | | 4,555,731 | |
| | |
Triborough Bridge & Tunnel Authority, Series C,
5.000%, 11/15/35 | | | 2,000,000 | | | | 2,290,570 | |
5.000%, 11/15/361 | | | 12,000,000 | | | | 13,835,460 | |
| | |
Total New York | | | | | | | 202,012,904 | |
| | |
North Carolina - 2.1% | | | | | | | | |
| | |
County of Union Enterprise System Revenue,
1.750%, 06/01/34 | | | 3,300,000 | | | | 2,590,934 | |
1.750%, 06/01/35 | | | 4,225,000 | | | | 3,261,148 | |
1.850%, 06/01/36 | | | 4,315,000 | | | | 3,301,055 | |
2.125%, 06/01/40 | | | 3,350,000 | | | | 2,447,208 | |
| | |
North Carolina Turnpike Authority, Series A, (AGM)
5.000%, 01/01/58 | | | 9,000,000 | | | | 9,504,209 | |
| | |
Total North Carolina | | | | | | | 21,104,554 | |
| | |
Ohio - 1.1% | | | | | | | | |
| | |
Ohio Housing Finance Agency, Series A, (GNMA FNMA FHLMC)
4.350%, 09/01/44 | | | 2,995,000 | | | | 3,003,671 | |
| | |
Ohio State General Obligation, Series T
5.000%, 05/01/30 | | | 5,000,000 | | | | 5,244,586 | |
| | |
Ohio Water Development Authority Water Pollution Control Loan Fund, Series B
5.000%, 06/01/35 | | | 2,500,000 | | | | 2,886,814 | |
| | |
Total Ohio | | | | | | | 11,135,071 | |
| | |
Pennsylvania - 3.2% | | | | | | | | |
| | |
Allegheny County Airport Authority, Series A,
5.000%, 01/01/31 | | | 1,350,000 | | | | 1,446,747 | |
| | |
5.000%, 01/01/32 | | | 2,215,000 | | | | 2,374,285 | |
| | |
Commonwealth Financing Authority, Pennsylvania Tobacco
5.000%, 06/01/32 | | | 7,910,000 | | | | 8,348,367 | |
| | | | | | | | |
The accompanying notes are an integral part of these financial statements.
11
| | |
| | AMG GW&K Municipal Bond Fund Schedule of Portfolio Investments (continued) |
| | | | | | | | |
| | | Principal
Amount | | | Value | |
| | |
Pennsylvania - 3.2% (continued) | | | | | | | | |
| | |
Hospitals & Higher Education Facilities Authority of Philadelphia, (AGM)
4.000%, 07/01/38 | | | $2,500,000 | | | | $2,504,075 | |
4.000%, 07/01/39 | | | 2,000,000 | | | | 1,986,465 | |
| | |
Pennsylvania Economic Development Financing Authority,
5.250%, 06/30/35 | | | 3,000,000 | | | | 3,282,432 | |
5.750%, 06/30/48 | | | 6,000,000 | | | | 6,501,881 | |
| | |
Pennsylvania Turnpike Commission, Series A
5.000%, 12/01/33 | | | 5,000,000 | | | | 5,665,022 | |
| | |
Total Pennsylvania | | | | | | | 32,109,274 | |
| | |
Rhode Island - 0.5% | | | | | | | | |
| | |
Rhode Island Health and Educational Building Corp.
5.250%, 05/15/49 | | | 4,300,000 | | | | 4,583,435 | |
| | |
South Carolina - 1.2% | | | | | | | | |
| | |
Richland County School District No 2, Series A, (South Carolina School District)
2.000%, 03/01/38 | | | 6,190,000 | | | | 4,698,445 | |
2.000%, 03/01/39 | | | 10,080,000 | | | | 7,407,100 | |
| | |
Total South Carolina | | | | | | | 12,105,545 | |
| | |
Tennessee - 0.6% | | | | | | | | |
| | |
City of Chattanooga Electric System Revenue
2.000%, 09/01/39 | | | 8,925,000 | | | | 6,510,467 | |
| | |
Texas - 12.2% | | | | | | | | |
| | |
City of Corpus Christi Utility System, Junior Lien Revenue Improvement
5.000%, 07/15/29 | | | 3,125,000 | | | | 3,327,993 | |
| | |
City of Houston Airport System, Series A,
4.000%, 07/01/35 | | | 1,100,000 | | | | 1,089,810 | |
4.000%, 07/01/36 | | | 1,100,000 | | | | 1,091,890 | |
5.000%, 07/01/34 | | | 2,835,000 | | | | 3,038,031 | |
| | |
City of San Antonio Electric & Gas Systems, Series A,
5.000%, 02/01/31 | | | 10,715,000 | | | | 11,906,752 | |
5.000%, 02/01/34 | | | 5,460,000 | | | | 6,235,563 | |
5.000%, 02/01/35 | | | 3,000,000 | | | | 3,424,780 | |
5.000%, 02/01/37 | | | 3,010,000 | | | | 3,314,293 | |
5.000%, 02/01/38 | | | 2,985,000 | | | | 3,273,238 | |
| | |
City of San Antonio TX Electric & Gas Systems Revenue, Series A,
5.000%, 02/01/35 | | | 1,000,000 | | | | 1,154,839 | |
5.000%, 02/01/36 | | | 1,000,000 | | | | 1,152,060 | |
| | |
County of Harris Toll Road First Lien, Series A
5.000%, 08/15/34 | | | 5,000,000 | | | | 5,729,744 | |
| | |
County of Harris TX Toll Road Revenue, Series A
5.000%, 08/15/36 | | | 4,000,000 | | | | 4,616,391 | |
| | |
Denton Independent School District, (PSF-GTD)
5.000%, 08/15/33 | | | 5,000,000 | | | | 5,756,633 | |
5.000%, 08/15/35 | | | 3,000,000 | | | | 3,460,654 | |
| | |
Lamar Consolidated Independent School District
5.000%, 02/15/34 | | | 7,965,000 | | | | 9,037,031 | |
| | | | | | | | |
| | | | | | | | |
| | | Principal
Amount | | | Value | |
| | |
Leander Independent School District, (PSF-GTD)
5.000%, 02/15/32 | | | $6,795,000 | | | | $7,674,634 | |
| | |
Lower Colorado River Authority
5.000%, 05/15/31 | | | 6,000,000 | | | | 6,671,195 | |
| | |
North Texas Municipal Water District Water System Revenue Refunding and Improvement
5.000%, 09/01/29 | | | 7,350,000 | | | | 7,601,957 | |
| | |
North Texas Tollway Authority, 2nd Tier, Series B,
5.000%, 01/01/31 | | | 2,000,000 | | | | 2,031,845 | |
5.000%, 01/01/32 | | | 3,010,000 | | | | 3,122,673 | |
| | |
North Texas Tollway Authority, Series A
5.250%, 01/01/38 | | | 4,500,000 | | | | 5,070,579 | |
| | |
Prosper Independent School District, Series A, (PSF-GTD)
1.750%, 02/15/34 | | | 3,565,000 | | | | 2,815,385 | |
1.750%, 02/15/35 | | | 5,155,000 | | | | 3,992,391 | |
| | |
State of Texas, Series A
5.000%, 10/01/29 | | | 5,000,000 | | | | 5,095,744 | |
| | |
Texas Private Activity Bond Surface Transportation Corp.,
5.500%, 06/30/41 | | | 1,000,000 | | | | 1,079,686 | |
5.500%, 06/30/42 | | | 1,000,000 | | | | 1,077,747 | |
5.500%, 06/30/43 | | | 1,000,000 | | | | 1,075,433 | |
| | |
Texas Private Activity Bond Surface Transportation Corp., Series A,
4.000%, 12/31/37 | | | 5,000,000 | | | | 5,015,999 | |
4.000%, 12/31/38 | | | 3,735,000 | | | | 3,731,742 | |
| | |
Total Texas | | | | | | | 123,666,712 | |
| | |
Utah - 2.8% | | | | | | | | |
| | |
Intermountain Power Agency,
5.000%, 07/01/33 | | | 3,500,000 | | | | 3,970,362 | |
5.000%, 07/01/34 | | | 3,500,000 | | | | 3,973,777 | |
5.000%, 07/01/35 | | | 3,250,000 | | | | 3,674,848 | |
| | |
Intermountain Power Agency, Series A
5.000%, 07/01/34 | | | 5,250,000 | | | | 5,881,035 | |
| | |
Salt Lake City Corp. Airport Revenue, Series A,
5.000%, 07/01/29 | | | 3,450,000 | | | | 3,598,557 | |
5.000%, 07/01/30 | | | 6,585,000 | | | | 6,875,041 | |
| | |
Total Utah | | | | | | | 27,973,620 | |
| | |
Virginia - 1.5% | | | | | | | | |
| | |
Virginia College Building Authority
5.000%, 02/01/33 | | | 8,250,000 | | | | 9,478,616 | |
| | |
Virginia Small Business Financing Authority,
4.000%, 01/01/37 | | | 3,000,000 | | | | 3,013,387 | |
4.000%, 01/01/38 | | | 3,000,000 | | | | 2,998,403 | |
| | |
Total Virginia | | | | | | | 15,490,406 | |
| | |
Washington - 4.0% | | | | | | | | |
| | |
Energy Northwest, Series A
5.000%, 07/01/35 | | | 8,000,000 | | | | 9,213,234 | |
| | |
Port of Seattle, Series C
5.000%, 08/01/31 | | | 5,000,000 | | | | 5,386,838 | |
| | | | | | | | |
The accompanying notes are an integral part of these financial statements.
12
| | |
| | AMG GW&K Municipal Bond Fund Schedule of Portfolio Investments (continued) |
| | | | | | | | |
| | | Principal
Amount | | | Value | |
| |
Washington - 4.0% (continued) | | | | | |
| | |
State of Washington School Improvements, Series C
5.000%, 02/01/28 | | | $7,370,000 | | | | $7,558,271 | |
| | |
State of Washington, Series B
5.000%, 08/01/31 | | | 4,680,000 | | | | 4,823,852 | |
| | |
State of Washington, Series R
5.000%, 07/01/31 | | | 9,975,000 | | | | 10,041,564 | |
| | |
Washington Health Care Facilities Authority, Series A
5.000%, 08/01/38 | | | 3,270,000 | | | | 3,452,230 | |
| | |
Total Washington | | | | | | | 40,475,989 | |
| | |
West Virginia - 1.6% | | | | | | | | |
| | |
West Virginia Hospital Finance Authority, Series B
6.000%, 09/01/48 | | | 5,250,000 | | | | 5,963,077 | |
| | |
West Virginia Parkways Authority,
5.000%, 06/01/37 | | | 1,750,000 | | | | 1,940,079 | |
5.000%, 06/01/38 | | | 2,000,000 | | | | 2,200,467 | |
5.000%, 06/01/39 | | | 5,150,000 | | | | 5,634,143 | |
| | |
Total West Virginia | | | | | | | 15,737,766 | |
| | | | | | | | |
| | | | | | | | |
| | | Principal
Amount | | | Value | |
| | |
Wisconsin - 1.7% | | | | | | | | |
| | |
State of Wisconsin Transportation, Series 2
5.000%, 07/01/29 | | | $10,405,000 | | | | $10,935,814 | |
| | |
State of Wisconsin, Series 2
5.000%, 05/01/35 | | | 5,000,000 | | | | 5,767,616 | |
| | |
Total Wisconsin | | | | | | | 16,703,430 | |
| | |
Total Municipal Bonds
(Cost $1,057,250,789) | | | | | | | 1,027,920,890 | |
| |
Short-Term Investments - 0.6% | | | | | |
| |
Repurchase Agreements - 0.6% | | | | | |
| | |
Fixed Income Clearing Corp., dated 06/28/24, due 07/01/24, 5.150% total to be received $6,464,773 (collateralized by a U.S. Treasury Note, 0.125%, 04/15/25, totaling $6,591,308) | | | 6,462,000 | | | | 6,462,000 | |
| | |
Total Short-Term Investments
(Cost $6,462,000) | | | | | | | 6,462,000 | |
| | |
Total Investments - 102.4%
(Cost $1,063,712,789) | | | | | | | 1,034,382,890 | |
| |
Other Assets, less Liabilities - (2.4)% | | | | (24,471,602 | ) |
| | |
Net Assets - 100.0% | | | | | | | $1,009,911,288 | |
| | | | | | |
1 All or part of a security is delayed delivery transaction. The market value for delayed delivery securities at June 30, 2024, amounted to $30,732,739, or 3.0% of net assets. | | FNMA | | Fannie Mae |
| | | | GNMA | | Ginnie Mae |
| AGM | | Assured Guaranty Municipal Corp. | | PSF-GTD | | Permanent School Fund Guaranteed |
| FHLMC | | Freddie Mac | | | | |
The following table summarizes the inputs used to value the Fund’s investments by the fair value hierarchy levels as of June 30, 2024:
| | | | | | | | | | | | | | | | | | | | | | | | |
| | | Level 1 | | | Level 2 | | | Level 3 | | | Total | |
Investments in Securities | | | | | | | | | | | | | | | | | | | | | | | | |
| | | | | | |
Municipal Bonds† | | | — | | | | | | | | $1,027,920,890 | | | | — | | | | | | | | $1,027,920,890 | |
| | | | | | |
Short-Term Investments | | | | | | | | | | | | | | | | | | | | | | | | |
| | | | | | |
Repurchase Agreements | | | — | | | | | | | | 6,462,000 | | | | — | | | | | | | | 6,462,000 | |
| | | | | | | | | | | | | | | | | | | | | | | | |
| | | | | | |
Total Investments in Securities | | | — | | | | | | | | $1,034,382,890 | | | | — | | | | | | | | $1,034,382,890 | |
| | | | | | | | | | | | | | | | | | | | | | | | |
| | † | All municipal bonds held in the Fund are Level 2 securities. For a detailed breakout of municipal bonds by major classification, please refer to the Fund’s Schedule of Portfolio Investments. |
For the six months ended June 30, 2024, there were no transfers in or out of Level 3.
The accompanying notes are an integral part of these financial statements.
13
| | |
| | AMG GW&K Municipal Enhanced Yield Fund Schedule of Portfolio Investments (unaudited) June 30, 2024 |
| | | | | | | | |
| | | Principal
Amount | | | Value | |
| | |
Municipal Bonds - 98.7% | | | | | | | | |
| | |
Alabama - 1.5% | | | | | | | | |
| | |
County of Jefferson Sewer Revenue
5.500%, 10/01/53 | | | $2,750,000 | | | | $2,976,075 | |
| | |
California - 5.1% | | | | | | | | |
| | |
California Municipal Finance Authority,
5.000%, 05/15/43 | | | 2,515,000 | | | | 2,581,734 | |
5.000%, 05/15/48 | | | 3,855,000 | | | | 3,924,426 | |
| | |
California Municipal Finance Authority, Series A
4.000%, 02/01/51 | | | 1,260,000 | | | | 1,141,013 | |
| | |
Riverside County Transportation Commission, Series C
4.000%, 06/01/47 | | | 2,870,000 | | | | 2,740,562 | |
| | |
Total California | | | | | | | 10,387,735 | |
| | |
Colorado - 5.4% | | | | | | | | |
| | |
Colorado Health Facilities Authority, Series A
5.000%, 08/01/44 | | | 4,185,000 | | | | 4,309,193 | |
| | |
Public Authority for Colorado Energy Natural Gas Purchase Revenue
6.500%, 11/15/38 | | | 5,395,000 | | | | 6,611,481 | |
| | |
Total Colorado | | | | | | | 10,920,674 | |
| | |
Connecticut - 2.0% | | | | | | | | |
| | |
Connecticut State Health & Educational Facilities Authority,
4.000%, 07/01/40 | | | 2,845,000 | | | | 2,743,571 | |
4.000%, 07/01/42 | | | 1,465,000 | | | | 1,371,276 | |
| | |
Total Connecticut | | | | | | | 4,114,847 | |
| | |
Florida - 12.1% | | | | | | | | |
| | |
Brevard County Health Facilities Authority, Series A
5.000%, 04/01/47 | | | 1,000,000 | | | | 1,046,969 | |
| | |
City of Tampa, Series B
5.000%, 07/01/50 | | | 2,065,000 | | | | 2,124,634 | |
| | |
County of Miami-Dade Florida Seaport Department, Series 1, (AGM)
4.000%, 10/01/45 | | | 2,730,000 | | | | 2,547,302 | |
| | |
County of Miami-Dade Florida Seaport Department, Series A
5.250%, 10/01/52 | | | 1,260,000 | | | | 1,331,297 | |
| | |
Escambia County Health Facilities Authority
4.000%, 08/15/50 | | | 5,065,000 | | | | 4,460,873 | |
| | |
Florida Development Finance Corp.,
4.000%, 02/01/52 | | | 2,515,000 | | | | 1,906,808 | |
5.000%, 02/01/52 | | | 1,675,000 | | | | 1,595,454 | |
| | |
Florida Housing Finance Corp., Series 3, (GNMA FNMA FHLMC)
4.750%, 07/01/54 | | | 2,000,000 | | | | 2,000,492 | |
| | |
Hillsborough County Industrial Development Authority
4.000%, 08/01/50 | | | 4,185,000 | | | | 3,760,938 | |
| | |
| | | | | | | | |
| | | | | | | | |
| | | Principal
Amount | | | Value | |
| | |
Miami Beach Health Facilities Authority 4.000%, 11/15/46 | | | $4,185,000 | | | | $3,973,443 | |
| | |
Total Florida | | | | | | | 24,748,210 | |
| | |
Illinois - 7.1% | | | | | | | | |
| | |
Chicago O’Hare International Airport, Senior Lien, Series A
5.000%, 01/01/48 | | | 3,000,000 | | | | 3,035,073 | |
| | |
Metropolitan Pier & Exposition Authority,
4.000%, 06/15/52 | | | 2,515,000 | | | | 2,327,249 | |
5.000%, 06/15/50 | | | 4,185,000 | | | | 4,324,753 | |
| | |
State of Illinois
5.750%, 05/01/45 | | | 2,515,000 | | | | 2,731,548 | |
| | |
State of Illinois,
Series A 4.000%, 03/01/40 | | | 1,000,000 | | | | 969,619 | |
| | |
State of Illinois, Series B 5.250%, 05/01/47 | | | 1,000,000 | | | | 1,084,792 | |
| | |
Total Illinois | | | | | | | 14,473,034 | |
| | |
Massachusetts - 3.3% | | | | | | | | |
| | |
Massachusetts Development Finance Agency,
4.000%, 07/01/51 | | | 4,340,000 | | | | 3,659,236 | |
5.250%, 07/01/52 | | | 2,795,000 | | | | 2,984,923 | |
| | |
Total Massachusetts | | | | | | | 6,644,159 | |
| | |
Minnesota - 1.1% | | | | | | | | |
| | |
Duluth Economic Development Authority, Series A
5.000%, 02/15/48 | | | 2,140,000 | | | | 2,163,970 | |
| | |
Nebraska - 2.5% | | | | | | | | |
| | |
Central Plains Energy Project #3, Series A 5.000%, 09/01/42 | | | 4,655,000 | | | | 5,060,614 | |
| | |
New Jersey - 6.8% | | | | | | | | |
| | |
New Jersey Transportation Trust Fund Authority, Series AA
4.000%, 06/15/50 | | | 1,675,000 | | | | 1,594,935 | |
| | |
South Jersey Transportation Authority,
4.625%, 11/01/47 | | | 1,680,000 | | | | 1,711,734 | |
5.250%, 11/01/52 | | | 3,770,000 | | | | 4,007,453 | |
| | |
Tobacco Settlement Financing Corp., Series A,
5.000%, 06/01/46 | | | 2,095,000 | | | | 2,139,695 | |
5.250%, 06/01/46 | | | 2,755,000 | | | | 2,848,316 | |
| | |
Tobacco Settlement Financing Corp., Series B
5.000%, 06/01/46 | | | 1,500,000 | | | | 1,513,721 | |
| | |
Total New Jersey | | | | | | | 13,815,854 | |
| | |
New York - 13.6% | | | | | | | | |
| | |
Metropolitan Transportation Authority, Series 1,
4.750%, 11/15/45 | | | 1,660,000 | | | | 1,703,452 | |
5.000%, 11/15/50 | | | 1,000,000 | | | | 1,041,546 | |
5.250%, 11/15/55 | | | 2,530,000 | | | | 2,661,005 | |
| | |
New York State Dormitory Authority, Series A,
4.000%, 07/01/47 | | | 1,675,000 | | | | 1,606,398 | |
4.000%, 07/01/52 | | | 1,775,000 | | | | 1,663,963 | |
| | |
| | | | | | | | |
The accompanying notes are an integral part of these financial statements.
14
| | |
| | AMG GW&K Municipal Enhanced Yield Fund Schedule of Portfolio Investments (continued) |
| | | | | | | | |
| | |
| Principal
Amount |
| | | Value | |
| | |
New York - 13.6% (continued) | | | | | | | | |
| | |
New York Transportation Development Corp.,
4.000%, 04/30/53 | | | $5,790,000 | | | | $4,804,913 | |
5.000%, 12/01/41 | | | 2,185,000 | | | | 2,288,911 | |
5.500%, 06/30/54 | | | 1,500,000 | | | | 1,589,906 | |
5.625%, 04/01/40 | | | 4,000,000 | | | | 4,349,672 | |
6.000%, 04/01/35 | | | 2,500,000 | | | | 2,825,560 | |
6.000%, 06/30/54 | | | 2,000,000 | | | | 2,196,459 | |
| | |
Suffolk Regional Off-Track Betting Co.
5.750%, 12/01/44 | | | 1,000,000 | | | | 1,041,569 | |
| | |
Total New York | | | | | | | 27,773,354 | |
| | |
Ohio - 0.5% | | | | | | | | |
| | |
Ohio Housing Finance Agency, Series A, (GNMA FNMA FHLMC)
4.550%, 09/01/49 | | | 1,000,000 | | | | 1,003,533 | |
| | |
Pennsylvania - 9.8% | | | | | | | | |
| | |
Allegheny County Airport Authority, Series A
5.000%, 01/01/51 | | | 4,185,000 | | | | 4,310,530 | |
| | |
Montgomery County Higher Education and Health Authority, Series B
5.000%, 05/01/52 | | | 3,980,000 | | | | 4,109,707 | |
| | |
Pennsylvania Economic Development Financing Authority
5.250%, 06/30/53 | | | 5,025,000 | | | | 5,212,917 | |
| | |
Pennsylvania Turnpike Commission, Series A
4.000%, 12/01/50 | | | 1,065,000 | | | | 996,948 | |
| | |
Philadelphia Authority for Industrial Development
5.250%, 11/01/52 | | | 5,185,000 | | | | 5,436,757 | |
| | |
Total Pennsylvania | | | | | | | 20,066,859 | |
| | |
Rhode Island - 4.7% | | | | | | | | |
| | |
Rhode Island Health and Educational Building Corp.,
5.250%, 05/15/49 | | | 2,000,000 | | | | 2,131,830 | |
5.250%, 05/15/54 | | | 4,500,000 | | | | 4,775,165 | |
| | |
Tobacco Settlement Financing Corp., Series A 5.000%, 06/01/40 | | | 2,755,000 | | | | 2,770,224 | |
| | |
Total Rhode Island | | | | | | | 9,677,219 | |
| | |
South Carolina - 3.0% | | | | | | | | |
| | |
Richland County School District No 2, Series A, (South Carolina School District)
1.875%, 03/01/38 | | | 8,290,000 | | | | 6,083,090 | |
| | |
Tennessee - 5.2% | | | | | | | | |
| | |
City of Chattanooga Electric 2.000%, 09/01/40 | | | 7,710,000 | | | | 5,473,874 | |
| | |
Knox County Health Educational & Housing Facility Board, Series 1, (BAM)
5.125%, 07/01/54 | | | 1,900,000 | | | | 2,004,845 | |
| | |
Knox County Health Educational & Housing Facility Board, Series A1, (BAM)
5.500%, 07/01/54 | | | 1,000,000 | | | | 1,087,484 | |
| | |
| | | | | | | | |
| | | | | | | | |
| | | Principal
Amount | | | Value | |
| | |
Metropolitan Government Nashville & Davidson County Health & Educational Facilities
5.250%, 05/01/53 | | | $2,000,000 | | | | $2,126,789 | |
| | |
Total Tennessee | | | | | | | 10,692,992 | |
| | |
Texas - 6.0% | | | | | | | | |
| | |
Central Texas Regional Mobility Authority, Series B
4.000%, 01/01/51 | | | 1,000,000 | | | | 953,853 | |
| | |
Texas Private Activity Bond Surface Transportation Corp.,
5.000%, 06/30/58 | | | 7,800,000 | | | | 7,955,241 | |
5.500%, 12/31/58 | | | 1,120,000 | | | | 1,214,259 | |
| | |
Texas Private Activity Bond Surface Transportation Corp., Series A 4.000%, 12/31/39 | | | 2,055,000 | | | | 2,045,674 | |
| | |
Total Texas | | | | | | | 12,169,027 | |
| | |
Virginia - 6.4% | | | | | | | | |
| | |
Lynchburg Economic Development Authority
4.000%, 01/01/55 | | | 1,260,000 | | | | 1,176,586 | |
| | |
Virginia Small Business Financing Authority,
4.000%, 01/01/39 | | | 2,515,000 | | | | 2,485,092 | |
4.000%, 01/01/40 | | | 2,515,000 | | | | 2,457,915 | |
5.000%, 12/31/47 | | | 2,145,000 | | | | 2,219,828 | |
5.000%, 12/31/49 | | | 2,095,000 | | | | 2,122,305 | |
5.000%, 12/31/52 | | | 2,655,000 | | | | 2,684,415 | |
| | |
Total Virginia | | | | | | | 13,146,141 | |
| | |
Washington - 0.5% | | | | | | | | |
| | |
Washington State Housing Finance Commission
5.500%, 07/01/49 | | | 1,000,000 | | | | 1,072,392 | |
| | |
West Virginia - 1.5% | | | | | | | | |
| | |
West Virginia Hospital Finance Authority, Series B
6.000%, 09/01/53 | | | 2,625,000 | | | | 2,960,547 | |
| | |
Wisconsin - 0.6% | | | | | | | | |
| | |
Public Finance Authority, Series A
5.000%, 06/01/411 | | | 1,250,000 | | | | 1,265,139 | |
| | |
Total Municipal Bonds
(Cost $212,022,431) | | | | | | | 201,215,465 | |
| | |
Short-Term Investments - 0.2% | | | | | | | | |
| |
Repurchase Agreements - 0.2% | | | | | |
| | |
Fixed Income Clearing Corp., dated 06/28/24, due 07/01/24, 5.150% total to be received $271,116 (collateralized by a U.S. Treasury Note, 0.125%, 04/15/25, totaling $276,477) | | | 271,000 | | | | 271,000 | |
| | |
Total Short-Term Investments
(Cost $271,000) | | | | | | | 271,000 | |
| | |
Total Investments - 98.9%
(Cost $212,293,431) | | | | | | | 201,486,465 | |
| |
Other Assets, less Liabilities - 1.1% | | | | 2,318,461 | |
| |
Net Assets - 100.0% | | | | $203,804,926 | |
| |
| | | | | |
The accompanying notes are an integral part of these financial statements.
15
| | |
| | AMG GW&K Municipal Enhanced Yield Fund Schedule of Portfolio Investments (continued) |
| 1 | Security exempt from registration under Rule 144A of the Securities Act of 1933. This security may be resold in transactions exempt from registration, normally to qualified institutional buyers. At June 30, 2024, the value of this security amounted to $1,265,139 or 0.6% of net assets. |
| | |
BAM FHLMC FNMA GNMA | | Build America Mutual Assurance Co. Freddie Mac Fannie Mae Ginnie Mae |
AGM Assured Guaranty Municipal Corp.
The following table summarizes the inputs used to value the Fund’s investments by the fair value hierarchy levels as of June 30, 2024:
| | | | | | | | | | | | | | | | | | | | |
| | | Level 1 | | Level 2 | | Level 3 | | Total |
| | | | |
Investments in Securities | | | | | | | | | | | | | | | | | | | | |
| | | | |
Municipal Bonds† | | | | — | | | | $ | 201,215,465 | | | | | — | | | | $ | 201,215,465 | |
| | | | |
Short-Term Investments | | | | | | | | | | | | | | | | | | | | |
| | | | |
Repurchase Agreements | | | | — | | | | | 271,000 | | | | | — | | | | | 271,000 | |
| | | | | | | | | | | | | | | | | | | | |
| | | | |
Total Investments in Securities | | | | — | | | | $ | 201,486,465 | | | | | — | | | | $ | 201,486,465 | |
| | | | | | | | | | | | | | | | | | | | |
| | † | All municipal bonds held in the Fund are Level 2 securities. For a detailed breakout of municipal bonds by major classification, please refer to the Fund’s Schedule of Portfolio Investments. |
For the six months ended June 30, 2024, there were no transfers in or out of Level 3.
The accompanying notes are an integral part of these financial statements.
16
| | |
| | Statement of Assets and Liabilities (unaudited) June 30, 2024 |
| | | | | | | | | | | | | | | | | | | | | | | | | |
| | | AMG GW&K
ESG
Bond Fund | | AMG
GW&K Enhanced
Core Bond
ESG Fund | | AMG
GW&K High
Income Fund | | AMG
GW&K
Municipal
Bond Fund | | AMG
GW&K Municipal
Enhanced
Yield Fund |
Assets: | | | | | | | | | | | | | | | | | | | | | | | | | |
| | | | | |
Investments at value1 (including securities on loan valued at $21,447,918, $0, $0, $0, and $0, respectively) | | | | $412,990,663 | | | | | $27,524,882 | | | | | $6,746,570 | | | | | $1,034,382,890 | | | | | $201,486,465 | |
| | | | | |
Cash | | | | 533 | | | | | — | | | | | — | | | | | 965 | | | | | 931 | |
| | | | | |
Receivable for investments sold | | | | — | | | | | — | | | | | — | | | | | 4,649,076 | | | | | — | |
| | | | | |
Receivable for delayed delivery investments sold | | | | — | | | | | — | | | | | — | | | | | — | | | | | 637,605 | |
| | | | | |
Interest receivables | | | | 3,551,890 | | | | | 60,423 | | | | | 14,158 | | | | | 13,445,102 | | | | | 2,708,715 | |
| | | | | |
Securities lending income receivable | | | | 4,976 | | | | | 197 | | | | | 286 | | | | | — | | | | | — | |
| | | | | |
Receivable for Fund shares sold | | | | 137,809 | | | | | 34,559 | | | | | — | | | | | 819,557 | | | | | 77,841 | |
| | | | | |
Receivable from affiliate | | | | 11,920 | | | | | 37,065 | | | | | 14,545 | | | | | 51,118 | | | | | 15,506 | |
| | | | | |
Prepaid expenses and other assets | | | | 29,658 | | | | | — | | | | | — | | | | | 41,983 | | | | | 18,284 | |
| | | | | |
Total assets | | | | 416,727,449 | | | | | 27,657,126 | | | | | 6,775,559 | | | | | 1,053,390,691 | | | | | 204,945,347 | |
| | | | | |
Liabilities: | | | | | | | | | | | | | | | | | | | | | | | | | |
| | | | | |
Payable upon return of securities loaned | | | | 16,825,095 | | | | | — | | | | | — | | | | | — | | | | | — | |
| | | | | |
Payable for investments purchased | | | | 1,610,249 | | | | | — | | | | | — | | | | | 11,067,102 | | | | | — | |
| | | | | |
Payable for delayed delivery investments purchased | | | | — | | | | | — | | | | | — | | | | | 30,592,532 | | | | | 610,890 | |
| | | | | |
Payable for Fund shares repurchased | | | | 156,049 | | | | | 164,162 | | | | | 54,254 | | | | | 1,347,727 | | | | | 365,428 | |
| | | | | |
Due to custodian | | | | — | | | | | 5,598 | | | | | — | | | | | — | | | | | — | |
| | | | | |
Accrued expenses: | | | | | | | | | | | | | | | | | | | | | | | | | |
| | | | | |
Investment advisory and management fees | | | | 75,827 | | | | | 8,382 | | | | | 2,366 | | | | | 172,866 | | | | | 76,144 | |
| | | | | |
Administrative fees | | | | 49,452 | | | | | 4,192 | | | | | 910 | | | | | 124,270 | | | | | 25,381 | |
| | | | | |
Distribution fees | | | | — | | | | | 820 | | | | | — | | | | | 2,391 | | | | | 680 | |
| | | | | |
Shareholder service fees | | | | 56,689 | | | | | 1,286 | | | | | 1,357 | | | | | 42,160 | | | | | 8,727 | |
| | | | | |
Other | | | | 75,722 | | | | | 37,599 | | | | | 30,357 | | | | | 130,355 | | | | | 53,171 | |
| | | | | |
Total liabilities | | | | 18,849,083 | | | | | 222,039 | | | | | 89,244 | | | | | 43,479,403 | | | | | 1,140,421 | |
| | | | | |
Commitments and Contingencies (Notes 2 & 5) | | | | | | | | | | | | | | | | | | | | | | | | | |
| | | | | |
Net Assets | | | | $397,878,366 | | | | | $27,435,087 | | | | | $6,686,315 | | | | | $1,009,911,288 | | | | | $203,804,926 | |
| | | | | |
1 Investments at cost | | | | $457,741,737 | | | | | $27,524,882 | | | | | $6,746,570 | | | | | $1,063,712,789 | | | | | $212,293,431 | |
The accompanying notes are an integral part of these financial statements.
17
| | |
| | Statement of Assets and Liabilities (continued) |
| | | | | | | | | | | | | | | | | | | | | | | | | |
| | | AMG GW&K
ESG
Bond Fund | | AMG
GW&K Enhanced
Core Bond
ESG Fund | | AMG
GW&K High
Income Fund | | AMG
GW&K Municipal
Bond Fund | | AMG
GW&K Municipal
Enhanced
Yield Fund |
| | | | | |
Net Assets Represent: | | | | | | | | | | | | | | | | | | | | | | | | | |
| | | | | |
Paid-in capital | | | | $490,352,097 | | | | | $38,014,594 | | | | | $8,407,503 | | | | | $1,069,616,764 | | | | | $231,856,131 | |
| | | | | |
Total distributable loss | | | | (92,473,731 | ) | | | | (10,579,507 | ) | | | | (1,721,188 | ) | | | | (59,705,476 | ) | | | | (28,051,205 | ) |
| | | | | |
Net Assets | | | | $397,878,366 | | | | | $27,435,087 | | | | | $6,686,315 | | | | | $1,009,911,288 | | | | | $203,804,926 | |
| | | | | |
Class N: | | | | | | | | | | | | | | | | | | | | | | | | | |
| | | | | |
Net Assets | | | | $241,736,925 | | | | | $7,517,164 | | | | | $5,846,078 | | | | | $11,817,511 | | | | | $3,042,130 | |
| | | | | |
Shares outstanding | | | | 11,297,799 | | | | | 844,191 | | | | | 283,942 | | | | | 1,050,995 | | | | | 332,509 | |
| | | | | |
Net asset value, offering and redemption price per share | | | | $21.40 | | | | | $8.90 | | | | | $20.59 | | | | | $11.24 | | | | | $9.15 | |
| | | | | |
Class I: | | | | | | | | | | | | | | | | | | | | | | | | | |
| | | | | |
Net Assets | | | | $156,141,441 | | | | | $14,540,667 | | | | | $840,237 | | | | | $998,093,777 | | | | | $200,638,529 | |
| | | | | |
Shares outstanding | | | | 7,296,510 | | | | | 1,626,543 | | | | | 40,837 | | | | | 88,242,714 | | | | | 22,661,569 | |
| | | | | |
Net asset value, offering and redemption price per share | | | | $21.40 | | | | | $8.94 | | | | | $20.58 | | | | | $11.31 | | | | | $8.85 | |
| | | | | |
Class Z: | | | | | | | | | | | | | | | | | | | | | | | | | |
| | | | | |
Net Assets | | | | — | | | | | $5,377,256 | | | | | — | | | | | — | | | | | $124,267 | |
| | | | | |
Shares outstanding | | | | — | | | | | 601,751 | | | | | — | | | | | — | | | | | 14,039 | |
| | | | | |
Net asset value, offering and redemption price per share | | | | — | | | | | $8.94 | | | | | — | | | | | — | | | | | $8.85 | |
The accompanying notes are an integral part of these financial statements.
18
| | |
| | Statement of Operations (unaudited) For the six months ended June 30, 2024 |
| | | | | | | | | | | | | | | | | | | | |
| | | AMG
GW&K ESG
Bond Fund | | AMG
GW&K Enhanced
Core Bond
ESG Fund | | AMG
GW&K High
Income Fund | | AMG
GW&K Municipal
Bond Fund | | AMG
GW&K Municipal
Enhanced
Yield Fund |
| | | | | |
Investment Income: | | | | | | | | | | | | | | | | | | | | |
| | | | | |
Dividend income | | | — | | | | $60,405 | | | | $14,262 | | | | — | | | | — | |
| | | | | |
Interest income | | | $8,423,863 | | | | 782,174 | | | | 306,566 | | | $ | 14,552,022 | | | $ | 4,104,387 | |
| | | | | |
Securities lending income | | | 46,232 | | | | 5,542 | | | | 5,318 | | | | — | | | | — | |
| | | | | |
Foreign withholding tax | | | (6,188 | ) | | | (67 | ) | | | (141 | ) | | | — | | | | — | |
| | | | | |
Total investment income | | | 8,463,907 | | | | 848,054 | | | | 326,005 | | | | 14,552,022 | | | | 4,104,387 | |
| | | | | |
Expenses: | | | | | | | | | | | | | | | | | | | | |
| | | | | |
Investment advisory and management fees | | | 471,616 | | | | 56,955 | | | | 22,233 | | | | 1,066,353 | | | | 466,004 | |
| | | | | |
Administrative fees | | | 307,576 | | | | 28,477 | | | | 8,551 | | | | 767,132 | | | | 155,334 | |
| | | | | |
Distribution fees - Class N | | | — | | | | 11,163 | | | | — | | | | 14,199 | | | | 4,218 | |
| | | | | |
Shareholder servicing fees - Class N | | | 314,608 | | | | — | | | | 8,459 | | | | 7,213 | | | | 2,531 | |
| | | | | |
Shareholder servicing fees - Class I | | | 39,604 | | | | 8,763 | | | | 1,159 | | | | 252,871 | | | | 50,904 | |
| | | | | |
Professional fees | | | 41,130 | | | | 7,090 | | | | 7,359 | | | | 54,104 | | | | 26,055 | |
| | | | | |
Reports to shareholders | | | 31,718 | | | | 14,966 | | | | 6,928 | | | | 25,892 | | | | 6,741 | |
| | | | | |
Registration fees | | | 28,292 | | | | 43,705 | | | | 23,802 | | | | 36,760 | | | | 22,474 | |
| | | | | |
Custodian fees | | | 26,565 | | | | 17,821 | | | | 13,472 | | | | 41,733 | | | | 16,394 | |
| | | | | |
Trustee fees and expenses | | | 15,790 | | | | 1,420 | | | | 410 | | | | 38,866 | | | | 8,098 | |
| | | | | |
Transfer agent fees | | | 11,970 | | | | 2,274 | | | | 914 | | | | 18,566 | | | | 4,001 | |
| | | | | |
Interest expense | | | — | | | | — | | | | — | | | | — | | | | 349 | |
| | | | | |
Miscellaneous | | | 12,449 | | | | 4,676 | | | | 5,012 | | | | 23,843 | | | | 6,255 | |
| | | | | |
Total expenses before offsets | | | 1,301,318 | | | | 197,310 | | | | 98,299 | | | | 2,347,532 | | | | 769,358 | |
| | | | | |
Expense reimbursements | | | (65,389 | ) | | | (86,603 | ) | | | (55,202 | ) | | | (334,418 | ) | | | (100,374 | ) |
| | | | | |
Fee waivers | | | — | | | | (3,470 | ) | | | (1,041 | ) | | | — | | | | — | |
| | | | | |
Net expenses | | | 1,235,929 | | | | 107,237 | | | | 42,056 | | | | 2,013,114 | | | | 668,984 | |
| | | | | |
| | | | | | | | | | | | | | | | | | | | |
| | | | | |
Net investment income | | | 7,227,978 | | | | 740,817 | | | | 283,949 | | | | 12,538,908 | | | | 3,435,403 | |
| | | | | |
Net Realized and Unrealized Loss: | | | | | | | | | | | | | | | | | | | | |
| | | | | |
Net realized loss on investments | | | (7,515,374 | ) | | | (3,436,483 | ) | | | (169,536 | ) | | | (3,658,855 | ) | | | (1,082,875 | ) |
| | | | | |
Net change in unrealized appreciation/depreciation on investments | | | (1,379,102 | ) | | | 2,754,428 | | | | 58,851 | | | | (22,375,297 | ) | | | (241,610 | ) |
| | | | | |
Net realized and unrealized loss | | | (8,894,476 | ) | | | (682,055 | ) | | | (110,685 | ) | | | (26,034,152 | ) | | | (1,324,485 | ) |
| | | | | |
| | | | | | | | | | | | | | | | | | | | |
| | | | | |
Net increase (decrease) in net assets resulting from operations | | | $(1,666,498 | ) | | | $58,762 | | | | $173,264 | | | | $(13,495,244 | ) | | | $2,110,918 | |
The accompanying notes are an integral part of these financial statements.
19
| | |
| | Statements of Changes in Net Assets For the six months ended June 30, 2024 (unaudited) and the fiscal year ended December 31, 2023 |
| | | | | | | | | | | | | | | | | | | | | | | | |
| | | AMG GW&K
ESG Bond Fund | | | AMG
GW&K Enhanced
Core Bond ESG Fund | | | AMG
GW&K High
Income Fund | |
| | | | | | |
| | | June 30, 2024 | | | December 31, 2023 | | | June 30, 2024 | | | December 31, 2023 | | | June 30, 2024 | | | December 31, 2023 | |
| | | | | | |
Increase (Decrease) in Net Assets Resulting From Operations: | | | | | | | | | | | | | | | | | | | | | | | | |
| | | | | | |
Net investment income | | | $7,227,978 | | | | $13,959,156 | | | | $740,817 | | | | $1,330,094 | | | | $283,949 | | | | $758,990 | |
| | | | | | |
Net realized loss on investments | | | (7,515,374 | ) | | | (19,675,989 | ) | | | (3,436,483 | ) | | | (1,593,070 | ) | | | (169,536 | ) | | | (225,634 | ) |
| | | | | | |
Net change in unrealized appreciation/depreciation on investments | | | (1,379,102 | ) | | | 34,991,525 | | | | 2,754,428 | | | | 2,720,322 | | | | 58,851 | | | | 825,281 | |
| | | | | | |
Net increase (decrease) in net assets resulting from operations | | | (1,666,498 | ) | | | 29,274,692 | | | | 58,762 | | | | 2,457,346 | | | | 173,264 | | | | 1,358,637 | |
| | | | | | |
Distributions to Shareholders: | | | | | | | | | | | | | | | | | | | | | | | | |
| | | | | | |
Class N | | | (4,328,571 | ) | | | (8,492,938 | ) | | | (274,602 | ) | | | (347,751 | ) | | | (252,488 | ) | | | (325,482 | ) |
| | | | | | |
Class I | | | (2,893,513 | ) | | | (5,729,614 | ) | | | (601,555 | ) | | | (691,238 | ) | | | (118,105 | ) | | | (446,846 | ) |
| | | | | | |
Class Z | | | — | | | | — | | | | (212,553 | ) | | | (280,142 | ) | | | — | | | | — | |
| | | | | | |
Total distributions to shareholders | | | (7,222,084 | ) | | | (14,222,552 | ) | | | (1,088,710 | ) | | | (1,319,131 | ) | | | (370,593 | ) | | | (772,328 | ) |
| | | | | | |
Capital Share Transactions:1 | | | | | | | | | | | | | | | | | | | | | | | | |
| | | | | | |
Net decrease from capital share transactions | | | (28,654,508 | ) | | | (72,637,330 | ) | | | (12,351,626 | ) | | | (768,427 | ) | | | (7,131,530 | ) | | | (3,839,684 | ) |
| | | | | | |
| | | | | | | | | | | | | | | | | | | | | | | | |
| | | | | | |
Total increase (decrease) in net assets | | | (37,543,090 | ) | | | (57,585,190 | ) | | | (13,381,574 | ) | | | 369,788 | | | | (7,328,859 | ) | | | (3,253,375 | ) |
| | | | | | |
Net Assets: | | | | | | | | | | | | | | | | | | | | | | | | |
| | | | | | |
Beginning of period | | | 435,421,456 | | | | 493,006,646 | | | | 40,816,661 | | | | 40,446,873 | | | | 14,015,174 | | | | 17,268,549 | |
| | | | | | |
End of period | | | $397,878,366 | | | | $435,421,456 | | | | $27,435,087 | | | | $40,816,661 | | | | $6,686,315 | | | | $14,015,174 | |
| 1 | See Note 1(g) of the Notes to Financial Statements. |
The accompanying notes are an integral part of these financial statements.
20
| | |
| | Statements of Changes in Net Assets (continued) For the six months ended June 30, 2024 (unaudited) and the fiscal year ended December 31, 2023 |
| | | | | | | | | | | | | | | | |
| | | AMG
GW&K Municipal
Bond Fund | | AMG
GW&K Municipal
Enhanced Yield Fund |
| | | | |
| | | June 30, 2024 | | December 31, 2023 | | June 30, 2024 | | December 31, 2023 |
| | | | |
Increase (Decrease) in Net Assets Resulting From Operations: | | | | | | | | | | | | | | | | |
| | | | |
Net investment income | | | $12,538,908 | | | | $22,827,789 | | | | $3,435,403 | | | | $7,868,751 | |
| | | | |
Net realized loss on investments | | | (3,658,855 | ) | | | (16,640,418 | ) | | | (1,082,875 | ) | | | (10,403,174 | ) |
| | | | |
Net change in unrealized appreciation/depreciation on investments | | | (22,375,297 | ) | | | 53,394,216 | | | | (241,610 | ) | | | 24,812,114 | |
| | | | |
Net increase (decrease) in net assets resulting from operations | | | (13,495,244 | ) | | | 59,581,587 | | | | 2,110,918 | | | | 22,277,691 | |
| | | | |
Distributions to Shareholders: | | | | | | | | | | | | | | | | |
| | | | |
Class N | | | (122,045 | ) | | | (240,964 | ) | | | (45,882 | ) | | | (109,195 | ) |
| | | | |
Class I | | | (12,430,098 | ) | | | (22,338,212 | ) | | | (3,397,416 | ) | | | (7,709,369 | ) |
| | | | |
Class Z | | | — | | | | — | | | | (2,080 | ) | | | (3,806 | ) |
| | | | |
Total distributions to shareholders | | | (12,552,143 | ) | | | (22,579,176 | ) | | | (3,445,378 | ) | | | (7,822,370 | ) |
| | | | |
Capital Share Transactions:1 | | | | | | | | | | | | | | | | |
| | | | |
Net increase (decrease) from capital share transactions | | | 7,270,119 | | | | (89,576,367 | ) | | | (6,268,880 | ) | | | (62,041,101 | ) |
| | | | | | | | | | | | | | | | |
| | | | |
Total decrease in net assets | | | (18,777,268 | ) | | | (52,573,956 | ) | | | (7,603,340 | ) | | | (47,585,780 | ) |
| | | | |
Net Assets: | | | | | | | | | | | | | | | | |
| | | | |
Beginning of period | | | 1,028,688,556 | | | | 1,081,262,512 | | | | 211,408,266 | | | | 258,994,046 | |
| | | | |
End of period | | | $1,009,911,288 | | | | $1,028,688,556 | | | | $203,804,926 | | | | $211,408,266 | |
| 1 | See Note 1(g) of the Notes to Financial Statements. |
The accompanying notes are an integral part of these financial statements.
21
| | | | | | |
| | | AMG GW&K ESG Bond Fund Financial Highlights For a share outstanding throughout each fiscal period |
| | | | | | | | | | | | | | | | | | | | | | | | | | | | | | | | |
| | | For the six | | | | | | | | | | | | |
| | | months ended | | | | For the fiscal years ended December 31, |
| Class N | | June 30, 2024
(unaudited) | | | | 2023 | | 2022 | | 2021 | | 2020 | | 2019 |
| | | | | | | |
Net Asset Value, Beginning of Period | | | | $21.85 | | | | | | | $21.11 | | | | | $24.88 | | | | | $28.12 | | | | | $27.14 | | | | | $25.49 | |
| | | | | | | |
Income (loss) from Investment Operations: | | | | | | | | | | | | | | | | | | | | | | | | | | | | | | | | |
| | | | | | | |
Net investment income1,2 | | | | 0.37 | | | | | | | 0.63 | | | | | 0.44 | | | | | 0.44 | | | | | 0.90 | | | | | 0.94 | |
| | | | | | | |
Net realized and unrealized gain (loss) on investments | | | | (0.45 | ) | | | | | | 0.75 | | | | | (3.70 | ) | | | | (0.83 | ) | | | | 1.03 | | | | | 1.85 | |
| | | | | | | |
Total income (loss) from investment operations | | | | (0.08 | ) | | | | | | 1.38 | | | | | (3.26 | ) | | | | (0.39 | ) | | | | 1.93 | | | | | 2.79 | |
| | | | | | | |
Less Distributions to Shareholders from: | | | | | | | | | | | | | | | | | | | | | | | | | | | | | | | | |
| | | | | | | |
Net investment income | | | | (0.37 | ) | | | | | | (0.64 | ) | | | | (0.47 | ) | | | | (0.47 | ) | | | | (0.88 | ) | | | | (0.98 | ) |
| | | | | | | |
Net realized gain on investments | | | | — | | | | | | | — | | | | | (0.04 | ) | | | | (2.38 | ) | | | | (0.07 | ) | | | | (0.16 | ) |
| | | | | | | |
Total distributions to shareholders | | | | (0.37 | ) | | | | | | (0.64 | ) | | | | (0.51 | ) | | | | (2.85 | ) | | | | (0.95 | ) | | | | (1.14 | ) |
| | | | | | | |
Net Asset Value, End of Period | | | | $21.40 | | | | | | | $21.85 | | | | | $21.11 | | | | | $24.88 | | | | | $28.12 | | | | | $27.14 | |
| | | | | | | |
Total Return2,3 | | | | (0.35 | )%4 | | | | | | 6.69 | % | | | | (13.17 | )% | | | | (1.29 | )% | | | | 7.34 | % | | | | 11.10 | % |
| | | | | | | |
Ratio of net expenses to average net assets | | | | 0.68 | %5 | | | | | | 0.68 | % | | | | 0.68 | % | | | | 0.69 | %6 | | | | 0.71 | % | | | | 0.72 | %7 |
| | | | | | | |
Ratio of gross expenses to average net assets8 | | | | 0.71 | %5 | | | | | | 0.70 | % | | | | 0.69 | % | | | | 0.69 | %6 | | | | 0.72 | % | | | | 0.73 | %7 |
| | | | | | | |
Ratio of net investment income to average net assets2 | | | | 3.45 | %5 | | | | | | 2.94 | % | | | | 1.98 | % | | | | 1.71 | % | | | | 3.31 | % | | | | 3.53 | % |
| | | | | | | |
Portfolio turnover | | | | 18 | %4 | | | | | | 27 | % | | | | 23 | % | | | | 186 | % | | | | 25 | % | | | | 20 | % |
| | | | | | | |
Net assets end of period (000’s) omitted | | | | $241,737 | | | | | | | $269,529 | | | | | $301,028 | | | | | $427,818 | | | | | $555,124 | | | | | $618,381 | |
| | | | | | | | | | | | | | | | | | | | | | | | | | | | | | | | | |
22
| | | | | | |
| | | AMG GW&K ESG Bond Fund Financial Highlights For a share outstanding throughout each fiscal period |
| | | | | | | | | | | | | | | | | | | | | | | | | | | | | | | | |
| | | For the six | | | | | | | | | | | | |
| | | months ended | | | | For the fiscal years ended December 31, |
| Class I | | June 30, 2024
(unaudited) | | | | 2023 | | 2022 | | 2021 | | 2020 | | 2019 |
| | | | | | | |
Net Asset Value, Beginning of Period | | | | $21.85 | | | | | | | $21.12 | | | | | $24.89 | | | | | $28.13 | | | | | $27.14 | | | | | $25.49 | |
| | | | | | | |
Income (loss) from Investment Operations: | | | | | | | | | | | | | | | | | | | | | | | | | | | | | | | | |
| | | | | | | |
Net investment income1,2 | | | | 0.39 | | | | | | | 0.67 | | | | | 0.49 | | | | | 0.50 | | | | | 0.95 | | | | | 0.99 | |
| | | | | | | |
Net realized and unrealized gain (loss) on investments | | | | (0.45 | ) | | | | | | 0.75 | | | | | (3.71 | ) | | | | (0.83 | ) | | | | 1.05 | | | | | 1.85 | |
| | | | | | | |
Total income (loss) from investment operations | | | | (0.06 | ) | | | | | | 1.42 | | | | | (3.22 | ) | | | | (0.33 | ) | | | | 2.00 | | | | | 2.84 | |
| | | | | | | |
Less Distributions to Shareholders from: | | | | | | | | | | | | | | | | | | | | | | | | | | | | | | | | |
| | | | | | | |
Net investment income | | | | (0.39 | ) | | | | | | (0.69 | ) | | | | (0.51 | ) | | | | (0.53 | ) | | | | (0.94 | ) | | | | (1.03 | ) |
| | | | | | | |
Net realized gain on investments | | | | — | | | | | | | — | | | | | (0.04 | ) | | | | (2.38 | ) | | | | (0.07 | ) | | | | (0.16 | ) |
| | | | | | | |
Total distributions to shareholders | | | | (0.39 | ) | | | | | | (0.69 | ) | | | | (0.55 | ) | | | | (2.91 | ) | | | | (1.01 | ) | | | | (1.19 | ) |
| | | | | | | |
Net Asset Value, End of Period | | | $ | 21.40 | | | | | | $ | 21.85 | | | | $ | 21.12 | | | | $ | 24.89 | | | | $ | 28.13 | | | | $ | 27.14 | |
| | | | | | | |
Total Return2,3 | | | | (0.25 | )%4 | | | | | | 6.85 | % | | | | (12.99 | )% | | | | (1.05 | )% | | | | 7.57 | % | | | | 11.32 | % |
| | | | | | | |
Ratio of net expenses to average net assets | | | | 0.48 | %5 | | | | | | 0.48 | % | | | | 0.48 | % | | | | 0.49 | %6 | | | | 0.50 | % | | | | 0.52 | %7 |
| | | | | | | |
Ratio of gross expenses to average net assets8 | | | | 0.51 | %5 | | | | | | 0.50 | % | | | | 0.49 | % | | | | 0.49 | %6 | | | | 0.51 | % | | | | 0.53 | %7 |
| | | | | | | |
Ratio of net investment income to average net assets2 | | | | 3.65 | %5 | | | | | | 3.14 | % | | | | 2.18 | % | | | | 1.91 | % | | | | 3.52 | % | | | | 3.73 | % |
| | | | | | | |
Portfolio turnover | | | | 18 | %4 | | | | | | 27 | % | | | | 23 | % | | | | 186 | % | | | | 25 | % | | | | 20 | % |
| | | | | | | |
Net assets end of period (000’s) omitted | | | | $156,141 | | | | | | | $165,892 | | | | | $191,979 | | | | | $327,121 | | | | | $546,698 | | | | | $605,353 | |
| | | | | | | | | | | | | | | | | | | | | | | | | | | | | | | | | |
| 1 | Per share numbers have been calculated using average shares. |
| 2 | Total returns and net investment income would have been lower had certain expenses not been offset. |
| 3 | The total return is calculated using the published Net Asset Value as of period end. |
| 6 | Ratio includes recapture of reimbursed fees from prior years amounting to less than 0.01% for the fiscal year ended December 31, 2021. |
| 7 | Includes 0.01% of extraordinary expense related to legal expense in support of an investment held in the portfolio. |
| 8 | Excludes the impact of expense reimbursement or fee waivers and expense reductions such as brokerage credits, but includes expense repayments and non-reimbursable expenses, if any, such as interest, taxes, and extraordinary expenses. (See Note 1(c) and 2 in the Notes to Financial Statements.) |
23
| | | | | | |
| | | AMG GW&K Enhanced Core Bond ESG Fund Financial Highlights For a share outstanding throughout each fiscal period |
| | | | | | | | | | | | | | | | | | | | | | | | | | | | | | | | |
| | | For the six | | | | | | | | | | | | |
| | | months ended | | | | For the fiscal years ended December 31, |
| Class N | | June 30, 2024
(unaudited) | | | | 2023 | | 2022 | | 2021 | | 2020 | | 2019 |
| | | | | | | |
Net Asset Value, Beginning of Period | | | | $9.15 | | | | | | | $8.92 | | | | | $10.61 | | | | | $10.90 | | | | | $10.15 | | | | | $9.43 | |
| | | | | | | |
Income (loss) from Investment Operations: | | | | | | | | | | | | | | | | | | | | | | | | | | | | | | | | |
| | | | | | | |
Net investment income1,2 | | | | 0.17 | | | | | | | 0.29 | | | | | 0.19 | | | | | 0.14 | | | | | 0.20 | | | | | 0.24 | |
| | | | | | | |
Net realized and unrealized gain (loss) on investments | | | | (0.15 | ) | | | | | | 0.22 | | | | | (1.69 | ) | | | | (0.28 | ) | | | | 0.75 | | | | | 0.73 | |
| | | | | | | |
Total income (loss) from investment operations | | | | 0.02 | | | | | | | 0.51 | | | | | (1.50 | ) | | | | (0.14 | ) | | | | 0.95 | | | | | 0.97 | |
| | | | | | | |
Less Distributions to Shareholders from: | | | | | | | | | | | | | | | | | | | | | | | | | | | | | | | | |
| | | | | | | |
Net investment income | | | | (0.27 | ) | | | | | | (0.28 | ) | | | | (0.19 | ) | | | | (0.14 | ) | | | | (0.20 | ) | | | | (0.25 | ) |
| | | | | | | |
Paid in capital | | | | — | | | | | | | — | | | | | — | | | | | (0.01 | ) | | | | — | | | | | — | |
| | | | | | | |
Total distributions to shareholders | | | | (0.27 | ) | | | | | | (0.28 | ) | | | | (0.19 | ) | | | | (0.15 | ) | | | | (0.20 | ) | | | | (0.25 | ) |
| | | | | | | |
Net Asset Value, End of Period | | | | $8.90 | | | | | | | $9.15 | | | | | $8.92 | | | | | $10.61 | | | | | $10.90 | | | | | $10.15 | |
| | | | | | | |
Total Return2,3 | | |
| 0.20
| %4
| | | | | | 5.89 | % | | | | (14.17 | )% | | | | (1.26 | )% | | | | 9.41 | % | | | | 10.35 | % |
| | | | | | | |
Ratio of net expenses to average net assets | | |
| 0.69
| %5
| | | | | | 0.73 | % | | | | 0.73 | % | | | | 0.73 | % | | | | 0.73 | % | | | | 0.73 | % |
| | | | | | | |
Ratio of gross expenses to average net assets6 | | |
| 1.16
| %5
| | | | | | 1.05 | % | | | | 1.00 | % | | | | 0.93 | % | | | | 1.06 | % | | | | 1.16 | % |
| | | | | | | |
Ratio of net investment income to average net assets2 | | |
| 3.78
| %5
| | | | | | 3.20 | % | | | | 1.99 | % | | | | 1.32 | % | | | | 1.86 | % | | | | 2.43 | % |
| | | | | | | |
Portfolio turnover | | | | 24 | %4 | | | | | | 51 | % | | | | 54 | % | | | | 86 | % | | | | 101 | % | | | | 71 | % |
| | | | | | | |
Net assets end of period (000’s) omitted | | | | $7,517 | | | | | | | $11,370 | | | | | $10,680 | | | | | $13,736 | | | | | $15,794 | | | | | $14,779 | |
| | | | | | | | | | | | | | | | | | | | | | | | | | | | | | | | | |
24
| | | | | | |
| | | AMG GW&K Enhanced Core Bond ESG Fund Financial Highlights For a share outstanding throughout each fiscal period |
| | | | | | | | | | | | | | | | | | | | | | | | | | | | | | | | |
| | | For the six | | | | | | | | | | | | |
| | | months ended | | | | For the fiscal years ended December 31, |
| Class I | | June 30, 2024
(unaudited) | | | | 2023 | | 2022 | | 2021 | | 2020 | | 2019 |
| | | | | | | |
Net Asset Value, Beginning of Period | | | | $9.18 | | | | | | | $8.95 | | | | | $10.65 | | | | | $10.94 | | | | | $10.19 | | | | | $9.47 | |
| | | | | | | |
Income (loss) from Investment Operations: | | | | | | | | | | | | | | | | | | | | | | | | | | | | | | | | |
| | | | | | | |
Net investment income1,2 | | | | 0.18 | | | | | | | 0.30 | | | | | 0.21 | | | | | 0.16 | | | | | 0.22 | | | | | 0.26 | |
| | | | | | | |
Net realized and unrealized gain (loss) on investments | | | | (0.15 | ) | | | | | | 0.23 | | | | | (1.70 | ) | | | | (0.28 | ) | | | | 0.75 | | | | | 0.73 | |
| | | | | | | |
Total income (loss) from investment operations | | | | 0.03 | | | | | | | 0.53 | | | | | (1.49 | ) | | | | (0.12 | ) | | | | 0.97 | | | | | 0.99 | |
| | | | | | | |
Less Distributions to Shareholders from: | | | | | | | | | | | | | | | | | | | | | | | | | | | | | | | | |
| | | | | | | |
Net investment income | | | | (0.27 | ) | | | | | | (0.30 | ) | | | | (0.21 | ) | | | | (0.16 | ) | | | | (0.22 | ) | | | | (0.27 | ) |
| | | | | | | |
Paid in capital | | | | — | | | | | | | — | | | | | — | | | | | (0.01 | ) | | | | — | | | | | — | |
| | | | | | | |
Total distributions to shareholders | | | | (0.27 | ) | | | | | | (0.30 | ) | | | | (0.21 | ) | | | | (0.17 | ) | | | | (0.22 | ) | | | | (0.27 | ) |
| | | | | | | |
Net Asset Value, End of Period | | | | $8.94 | | | | | | | $9.18 | | | | | $8.95 | | | | | $10.65 | | | | | $10.94 | | | | | $10.19 | |
| | | | | | | |
Total Return2,3 | | | | 0.36 | %4 | | | | | | 6.05 | % | | | | (14.07 | )% | | | | (1.07 | )% | | | | 9.57 | % | | | | 10.51 | % |
| | | | | | | |
Ratio of net expenses to average net assets | | | | 0.55 | %5 | | | | | | 0.56 | % | | | | 0.56 | % | | | | 0.56 | % | | | | 0.55 | % | | | | 0.55 | % |
| | | | | | | |
Ratio of gross expenses to average net assets6 | | | | 1.02 | %5 | | | | | | 0.88 | % | | | | 0.83 | % | | | | 0.76 | % | | | | 0.88 | % | | | | 0.98 | % |
| | | | | | | |
Ratio of net investment income to average net assets2 | | | | 3.92 | %5 | | | | | | 3.37 | % | | | | 2.16 | % | | | | 1.49 | % | | | | 2.04 | % | | | | 2.62 | % |
| | | | | | | |
Portfolio turnover | | | | 24 | %4 | | | | | | 51 | % | | | | 54 | % | | | | 86 | % | | | | 101 | % | | | | 71 | % |
| | | | | | | |
Net assets end of period (000’s) omitted | | | | $14,541 | | | | | | | $21,805 | | | | | $19,890 | | | | | $33,402 | | | | | $27,800 | | | | | $8,502 | |
| | | | | | | | | | | | | | | | | | | | | | | | | | | | | | | | | |
25
| | | | | | |
| | | AMG GW&K Enhanced Core Bond ESG Fund Financial Highlights For a share outstanding throughout each fiscal period |
| | | | | | | | | | | | | | | | | | | | | | | | | | | | | | | | |
| | | For the six | | | | | | | | | | | | |
| | | months ended | | | | For the fiscal years ended December 31, |
| Class Z | | June 30, 2024
(unaudited) | | | | 2023 | | 2022 | | 2021 | | 2020 | | 2019 |
| | | | | | | |
Net Asset Value, Beginning of Period | | | | $9.18 | | | | | | | $8.95 | | | | | $10.65 | | | | | $10.93 | | | | | $10.18 | | | | | $9.46 | |
| | | | | | | |
Income (loss) from Investment Operations: | | | | | | | | | | | | | | | | | | | | | | | | | | | | | | | | |
| | | | | | | |
Net investment income1,2 | | | | 0.18 | | | | | | | 0.31 | | | | | 0.21 | | | | | 0.17 | | | | | 0.22 | | | | | 0.27 | |
| | | | | | | |
Net realized and unrealized gain (loss) on investments | | | | (0.14 | ) | | | | | | 0.23 | | | | | (1.69 | ) | | | | (0.27 | ) | | | | 0.75 | | | | | 0.72 | |
| | | | | | | |
Total income (loss) from investment operations | | | | 0.04 | | | | | | | 0.54 | | | | | (1.48 | ) | | | | (0.10 | ) | | | | 0.97 | | | | | 0.99 | |
| | | | | | | |
Less Distributions to Shareholders from: | | | | | | | | | | | | | | | | | | | | | | | | | | | | | | | | |
| | | | | | | |
Net investment income | | | | (0.28 | ) | | | | | | (0.31 | ) | | | | (0.22 | ) | | | | (0.17 | ) | | | | (0.22 | ) | | | | (0.27 | ) |
| | | | | | | |
Paid in capital | | | | — | | | | | | | — | | | | | — | | | | | (0.01 | ) | | | | — | | | | | — | |
| | | | | | | |
Total distributions to shareholders | | | | (0.28 | ) | | | | | | (0.31 | ) | | | | (0.22 | ) | | | | (0.18 | ) | | | | (0.22 | ) | | | | (0.27 | ) |
| | | | | | | |
Net Asset Value, End of Period | | | | $8.94 | | | | | | | $9.18 | | | | | $8.95 | | | | | $10.65 | | | | | $10.93 | | | | | $10.18 | |
| | | | | | | |
Total Return2,3 | | | | 0.43 | %4 | | | | | | 6.13 | % | | | | (14.00 | )% | | | | (0.92 | )% | | | | 9.65 | % | | | | 10.59 | % |
| | | | | | | |
Ratio of net expenses to average net assets | | |
| 0.46
| %5
| | | | | | 0.48 | % | | | | 0.48 | % | | | | 0.48 | % | | | | 0.48 | % | | | | 0.48 | % |
| | | | | | | |
Ratio of gross expenses to average net assets6 | | |
| 0.93
| %5
| | | | | | 0.80 | % | | | | 0.75 | % | | | | 0.68 | % | | | | 0.81 | % | | | | 0.91 | % |
| | | | | | | |
Ratio of net investment income to average net assets2 | | |
| 4.01
| %5
| | | | | | 3.45 | % | | | | 2.24 | % | | | | 1.57 | % | | | | 2.11 | % | | | | 2.72 | % |
| | | | | | | |
Portfolio turnover | | | | 24 | %4 | | | | | | 51 | % | | | | 54 | % | | | | 86 | % | | | | 101 | % | | | | 71 | % |
| | | | | | | |
Net assets end of period (000’s) omitted | | | | $5,377 | | | | | | | $7,641 | | | | | $9,877 | | | | | $13,712 | | | | | $11,552 | | | | | $10,080 | |
| | | | | | | | | | | | | | | | | | | | | | | | | | | | | | | | | |
| 1 | Per share numbers have been calculated using average shares. |
| 2 | Total returns and net investment income would have been lower had certain expenses not been offset. |
| 3 | The total return is calculated using the published Net Asset Value as of period end. |
| 6 | Excludes the impact of expense reimbursement or fee waivers and expense reductions such as brokerage credits, but includes expense repayments and non-reimbursable expenses, if any, such as interest, taxes, and extraordinary expenses. (See Note 1(c) and 2 in the Notes to Financial Statements.) |
26
| | | | | | |
| | | AMG GW&K High Income Fund Financial Highlights For a share outstanding throughout each fiscal period |
| | | | | | | | | | | | | | | | | | | | | | | | | | | | | | | | |
| | | For the six | | | | | | | | | | | | |
| | | months ended | | | | For the fiscal years ended December 31, |
| Class N | | June 30, 2024
(unaudited) | | | | 2023 | | 2022 | | 2021 | | 2020 | | 2019 |
| | | | | | | |
Net Asset Value, Beginning of Period | | | | $20.91 | | | | | | | $20.11 | | | | | $22.46 | | | | | $22.23 | | | | | $21.52 | | | | | $20.04 | |
| | | | | | | |
Income (loss) from Investment Operations: | | | | | | | | | | | | | | | | | | | | | | | | | | | | | | | | |
| | | | | | | |
Net investment income1,2 | | | | 0.51 | | | | | | | 0.96 | | | | | 0.67 | | | | | 0.53 | | | | | 0.51 | | | | | 0.57 | |
| | | | | | | |
Net realized and unrealized gain (loss) on investments | | | | (0.06 | ) | | | | | | 0.83 | | | | | (2.20 | ) | | | | 0.28 | | | | | 2.09 | | | | | 0.98 | |
| | | | | | | |
Total income (loss) from investment operations | | | | 0.45 | | | | | | | 1.79 | | | | | (1.53 | ) | | | | 0.81 | | | | | 2.60 | | | | | 1.55 | |
| | | | | | | |
Less Distributions to Shareholders from: | | | | | | | | | | | | | | | | | | | | | | | | | | | | | | | | |
| | | | | | | |
Net investment income | | | | (0.77 | ) | | | | | | (0.99 | ) | | | | (0.77 | ) | | | | (0.53 | ) | | | | (0.48 | ) | | | | (0.07 | ) |
| | | | | | | |
Net realized gain on investments | | | | — | | | | | | | — | | | | | (0.05 | ) | | | | (0.05 | ) | | | | (1.41 | ) | | | | — | |
| | | | | | | |
Total distributions to shareholders | | | | (0.77 | ) | | | | | | (0.99 | ) | | | | (0.82 | ) | | | | (0.58 | ) | | | | (1.89 | ) | | | | (0.07 | ) |
| | | | | | | |
Net Asset Value, End of Period | | | | $20.59 | | | | | | | $20.91 | | | | | $20.11 | | | | | $22.46 | | | | | $22.23 | | | | | $21.52 | |
| | | | | | | |
Total Return2,3 | | |
| 2.21
| %4
| | | | | | 9.13 | % | | | | (6.80 | )% | | | | 3.67 | % | | | | 12.16 | % | | | | 7.67 | % |
| | | | | | | |
Ratio of net expenses to average net assets | | |
| 0.82
| %5
| | | | | | 0.84 | % | | | | 0.86 | %6 | | | | 0.84 | % | | | | 0.89 | % | | | | 0.89 | % |
| | | | | | | |
Ratio of gross expenses to average net assets7 | | |
| 1.81
| %5
| | | | | | 1.48 | % | | | | 1.32 | % | | | | 1.37 | % | | | | 1.70 | % | | | | 1.87 | % |
| | | | | | | |
Ratio of net investment income to average net assets2 | | |
| 4.90
| %5
| | | | | | 4.72 | % | | | | 3.22 | % | | | | 2.36 | % | | | | 2.28 | % | | | | 2.70 | % |
| | | | | | | |
Portfolio turnover | | | | 25 | %4 | | | | | | 25 | % | | | | 74 | % | | | | 97 | % | | | | 157 | % | | | | 52 | % |
| | | | | | | |
Net assets end of period (000’s) omitted | | | | $5,846 | | | | | | | $7,061 | | | | | $6,528 | | | | | $8,157 | | | | | $10,302 | | | | | $9,638 | |
| | | | | | | | | | | | | | | | | | | | | | | | | | | | | | | | | |
27
| | | | | | |
| | | AMG GW&K High Income Fund Financial Highlights For a share outstanding throughout each fiscal period |
| | | | | | | | | | | | | | | | | | | | | | | | | | | | | | | | | | | | | | | | |
| | | For the six
months ended | | For the fiscal years ended December 31, | | For the fiscal
period ended
December 31, |
| Class I | | June 30, 2024
(unaudited) | | 2023 | | 2022 | | 20218 |
| | | | | | | | |
Net Asset Value, Beginning of Period | | | | | | | | | $20.90 | | | | | | | | | | $20.10 | | | | | $22.45 | | | | | | | | | | $22.27 | | | | | | |
| | | | | | | | |
Income (loss) from Investment Operations: | | | | | | | | | | | | | | | | | | | | | | | | | | | | | | | | | | | | | | | | |
| | | | | | | | |
Net investment income1,2 | | | | | | | | | 0.53 | | | | | | | | | | 1.00 | | | | | 0.71 | | | | | | | | | | 0.46 | | | | | | |
| | | | | | | | |
Net realized and unrealized gain (loss) on investments | | | | | | | | | (0.05 | ) | | | | | | | | | 0.83 | | | | | (2.20 | ) | | | | | | | | | 0.35 | | | | | | |
| | | | | | | | |
Total income (loss) from investment operations | | | | | | | | | 0.48 | | | | | | | | | | 1.83 | | | | | (1.49 | ) | | | | | | | | | 0.81 | | | | | | |
| | | | | | | | |
Less Distributions to Shareholders from: | | | | | | | | | | | | | | | | | | | | | | | | | | | | | | | | | | | | | | | | |
| | | | | | | | |
Net investment income | | | | | | | | | (0.80 | ) | | | | | | | | | (1.03 | ) | | | | (0.81 | ) | | | | | | | | | (0.58 | ) | | | | | |
| | | | | | | | |
Net realized gain on investments | | | | | | | | | — | | | | | | | | | | — | | | | | (0.05 | ) | | | | | | | | | (0.05 | ) | | | | | |
| | | | | | | | |
Total distributions to shareholders | | | | | | | | | (0.80 | ) | | | | | | | | | (1.03 | ) | | | | (0.86 | ) | | | | | | | | | (0.63 | ) | | | | | |
| | | | | | | | |
Net Asset Value, End of Period | | | | | | | | | $20.58 | | | | | | | | | | $20.90 | | | | | $20.10 | | | | | | | | | | $22.45 | | | | | | |
| | | | | | | | |
Total Return2,3 | | | | | | | |
| 2.28
| %4
| | | | | | | | | 9.35 | % | | | | (6.63 | )% | | | | | | | | | 3.68 | %4 | | | | | |
| | | | | | | | |
Ratio of net expenses to average net assets | | | | | | | |
| 0.62
| %5
| | | | | | | | | 0.64 | % | | |
| 0.66
| %6
| | | | | | | |
| 0.64
| %5
| | | | | |
| | | | | | | | |
Ratio of gross expenses to average net assets7 | | | | | | | |
| 1.61
| %5
| | | | | | | | | 1.28 | % | | | | 1.12 | % | | | | | | | |
| 1.17
| %5
| | | | | |
| | | | | | | | |
Ratio of net investment income to average net assets2 | | | | | | | |
| 5.10
| %5
| | | | | | | | | 4.92 | % | | | | 3.42 | % | | | | | | | |
| 2.56
| %5
| | | | | |
| | | | | | | | |
Portfolio turnover | | | | | | | |
| 25
| %4
| | | | | | | | | 25 | % | | | | 74 | % | | | | | | | | | 97 | % | | | | | |
| | | | | | | | |
Net assets end of period (000’s) omitted | | | | | | | | | $840 | | | | | | | | | | $6,954 | | | | | $10,740 | | | | | | | | | | $13,166 | | | | | | |
| | | | | | | | | | | | | | | | | | | | | | | | | | | | | | | | | | | | | | | | | |
| 1 | Per share numbers have been calculated using average shares. |
| 2 | Total returns and net investment income would have been lower had certain expenses not been offset. |
| 3 | The total return is calculated using the published Net Asset Value as of period end. |
| 6 | Includes interest expense totaling 0.02% related to participation in the interfund lending program. |
| 7 | Excludes the impact of expense reimbursement or fee waivers and expense reductions such as brokerage credits, but includes expense repayments and non-reimbursable expenses, if any, such as interest, taxes, and extraordinary expenses. (See Note 1(c) and 2 in the Notes to Financial Statements.) |
| 8 | Commencement of operations was on March 15, 2021. |
28
| | |
| | AMG GW&K Municipal Bond Fund Financial Highlights For a share outstanding throughout each fiscal period |
| | | | | | | | | | | | | | | | | | | | | | | | | | | | | | | | |
| | | For the six | | | | | | | | | | | | |
| | | months ended | | | | For the fiscal years ended December 31, |
| Class N | | June 30, 2024
(unaudited) | | | | 2023 | | 2022 | | 2021 | | 2020 | | 2019 |
| | | | | | | |
Net Asset Value, Beginning of Period | | | | $11.53 | | | | | | | $11.11 | | | | | $12.24 | | | | | $12.45 | | | | | $12.12 | | | | | $11.48 | |
| | | | | | | |
Income (loss) from Investment Operations: | | | | | | | | | | | | | | | | | | | | | | | | | | | | | | | | |
| | | | | | | |
Net investment income (loss)1,2 | | | | 0.12 | | | | | | | 0.21 | | | | | 0.15 | | | | | 0.13 | | | | | 0.15 | | | | | 0.19 | |
| | | | | | | |
Net realized and unrealized gain (loss) on investments | | | | (0.29 | ) | | | | | | 0.42 | | | | | (1.10 | ) | | | | (0.11 | ) | | | | 0.33 | | | | | 0.64 | |
| | | | | | | |
Total income (loss) from investment operations | | | | (0.17 | ) | | | | | | 0.63 | | | | | (0.95 | ) | | | | 0.02 | | | | | 0.48 | | | | | 0.83 | |
| | | | | | | |
Less Distributions to Shareholders from: | | | | | | | | | | | | | | | | | | | | | | | | | | | | | | | | |
| | | | | | | |
Net investment income | | | | (0.12 | ) | | | | | | (0.21 | ) | | | | (0.16 | ) | | | | (0.13 | ) | | | | (0.15 | ) | | | | (0.19 | ) |
| | | | | | | |
Net realized gain on investments | | | | — | | | | | | | — | | | | | (0.02 | ) | | | | (0.10 | ) | | | | — | | | | | — | |
| | | | | | | |
Total distributions to shareholders | | | | (0.12 | ) | | | | | | (0.21 | ) | | | | (0.18 | ) | | | | (0.23 | ) | | | | (0.15 | ) | | | | (0.19 | ) |
| | | | | | | |
Net Asset Value, End of Period | | | | $11.24 | | | | | | | $11.53 | | | | | $11.11 | | | | | $12.24 | | | | | $12.45 | | | | | $12.12 | |
| | | | | | | |
Total Return2,3 | | |
| (1.46
| )%4
| | | | | | 5.72 | % | | | | (7.80 | )% | | | | 0.10 | % | | | | 4.31 | % | | | | 7.29 | % |
| | | | | | | |
Ratio of net expenses to average net assets | | | | 0.72 | %5 | | | | | | 0.72 | % | | | | 0.72 | % | | | | 0.71 | % | | | | 0.71 | % | | | | 0.71 | % |
| | | | | | | |
Ratio of gross expenses to average net assets6 | | | | 0.79 | %5 | | | | | | 0.79 | % | | | | 0.78 | % | | | | 0.76 | % | | | | 0.77 | % | | | | 0.78 | % |
| | | | | | | |
Ratio of net investment income to average net assets2 | | | | 2.13 | %5 | | | | | | 1.85 | % | | | | 1.35 | % | | | | 1.01 | % | | | | 1.25 | % | | | | 1.59 | % |
| | | | | | | |
Portfolio turnover | | | | 15 | %4 | | | | | | 29 | % | | | | 20 | % | | | | 24 | % | | | | 17 | % | | | | 18 | % |
| | | | | | | |
Net assets end of period (000’s) omitted | | | | $11,818 | | | | | | | $12,081 | | | | | $12,972 | | | | | $17,112 | | | | | $18,153 | | | | | $18,711 | |
| | | | | | | | | | | | | | | | | | | | | | | | | | | | | | | | | |
29
| | |
| | AMG GW&K Municipal Bond Fund Financial Highlights For a share outstanding throughout each fiscal period |
| | | | | | | | | | | | | | | | | | | | | | | | | | | | | | | | |
| | | For the six | | | | | | | | | | | | |
| | | months ended | | | | For the fiscal years ended December 31, |
| Class I | | June 30, 2024
(unaudited) | | | | 2023 | | 2022 | | 2021 | | 2020 | | 2019 |
| | | | | | | |
Net Asset Value, Beginning of Period | | | | $11.60 | | | | | | | $11.18 | | | | | $12.31 | | | | | $12.52 | | | | | $12.18 | | | | | $11.54 | |
| | | | | | | |
Income (loss) from Investment Operations: | | | | | | | | | | | | | | | | | | | | | | | | | | | | | | | | |
| | | | | | | |
Net investment income1,2 | | | | 0.14 | | | | | | | 0.25 | | | | | 0.19 | | | | | 0.17 | | | | | 0.19 | | | | | 0.23 | |
| | | | | | | |
Net realized and unrealized gain (loss) on investments | | | | (0.29 | ) | | | | | | 0.41 | | | | | (1.11 | ) | | | | (0.11 | ) | | | | 0.34 | | | | | 0.64 | |
| | | | | | | |
Total income (loss) from investment operations | | | | (0.15 | ) | | | | | | 0.66 | | | | | (0.92 | ) | | | | 0.06 | | | | | 0.53 | | | | | 0.87 | |
| | | | | | | |
Less Distributions to Shareholders from: | | | | | | | | | | | | | | | | | | | | | | | | | | | | | | | | |
| | | | | | | |
Net investment income | | | | (0.14 | ) | | | | | | (0.24 | ) | | | | (0.19 | ) | | | | (0.17 | ) | | | | (0.19 | ) | | | | (0.23 | ) |
| | | | | | | |
Net realized gain on investments | | | | — | | | | | | | — | | | | | (0.02 | ) | | | | (0.10 | ) | | | | — | | | | | — | |
| | | | | | | |
Total distributions to shareholders | | | | (0.14 | ) | | | | | | (0.24 | ) | | | | (0.21 | ) | | | | (0.27 | ) | | | | (0.19 | ) | | | | (0.23 | ) |
| | | | | | | |
Net Asset Value, End of Period | | | | $11.31 | | | | | | | $11.60 | | | | | $11.18 | | | | | $12.31 | | | | | $12.52 | | | | | $12.18 | |
| | | | | | | |
Total Return2,3 | | | | (1.30 | )%4 | | | | | | 6.04 | % | | | | (7.45 | )% | | | | 0.43 | % | | | | 4.70 | % | | | | 7.58 | % |
| | | | | | | |
Ratio of net expenses to average net assets | | | | 0.39 | %5 | | | | | | 0.39 | % | | | | 0.39 | % | | | | 0.39 | % | | | | 0.39 | % | | | | 0.39 | % |
| | | | | | | |
Ratio of gross expenses to average net assets6 | | | | 0.46 | %5 | | | | | | 0.46 | % | | | | 0.45 | % | | | | 0.44 | % | | | | 0.45 | % | | | | 0.46 | % |
| | | | | | | |
Ratio of net investment income to average net assets2 | | | | 2.46 | %5 | | | | | | 2.18 | % | | | | 1.68 | % | | | | 1.33 | % | | | | 1.57 | % | | | | 1.91 | % |
| | | | | | | |
Portfolio turnover | | | | 15 | %4 | | | | | | 29 | % | | | | 20 | % | | | | 24 | % | | | | 17 | % | | | | 18 | % |
| | | | | | | |
Net assets end of period (000’s) omitted | | | | $998,094 | | | | | | | $1,016,607 | | | | | $1,068,290 | | | | | $1,331,958 | | | | | $1,287,667 | | | | | $1,014,514 | |
| | | | | | | | | | | | | | | | | | | | | | | | | | | | | | | | | |
| 1 | Per share numbers have been calculated using average shares. |
| 2 | Total returns and net investment income would have been lower had certain expenses not been offset. |
| 3 | The total return is calculated using the published Net Asset Value as of period end. |
| 6 | Excludes the impact of expense reimbursement or fee waivers and expense reductions such as brokerage credits, but includes expense repayments and non-reimbursable expenses, if any, such as interest, taxes, and extraordinary expenses. (See Note 1(c) and 2 in the Notes to Financial Statements.) |
30
| | |
| | AMG GW&K Municipal Enhanced Yield Fund Financial Highlights For a share outstanding throughout each fiscal period |
| | | | | | | | | | | | | | | | | | | | | | | | | | | | | | | | |
| | | For the six | | | | | | | | | | | | |
| | | months ended | | | | For the fiscal years ended December 31, |
| Class N | | June 30, 2024
(unaudited) | | | | 2023 | | 2022 | | 2021 | | 2020 | | 2019 |
| | | | | | | |
Net Asset Value, Beginning of Period | | | | $9.20 | | | | | | | $8.56 | | | | | $10.74 | | | | | $10.69 | | | | | $10.42 | | | | | $9.69 | |
| | | | | | | |
Income (loss) from Investment Operations: | | | | | | | | | | | | | | | | | | | | | | | | | | | | | | | | |
| | | | | | | |
Net investment income1,2 | | | | 0.13 | | | | | | | 0.25 | | | | | 0.22 | | | | | 0.20 | | | | | 0.23 | | | | | 0.26 | |
| | | | | | | |
Net realized and unrealized gain (loss) on investments | | | | (0.05 | ) | | | | | | 0.64 | | | | | (2.17 | ) | | | | 0.18 | | | | | 0.37 | | | | | 0.78 | |
| | | | | | | |
Total income (loss) from investment operations | | | | 0.08 | | | | | | | 0.89 | | | | | (1.95 | ) | | | | 0.38 | | | | | 0.60 | | | | | 1.04 | |
| | | | | | | |
Less Distributions to Shareholders from: | | | | | | | | | | | | | | | | | | | | | | | | | | | | | | | | |
| | | | | | | |
Net investment income | | | | (0.13 | ) | | | | | | (0.25 | ) | | | | (0.20 | ) | | | | (0.19 | ) | | | | (0.21 | ) | | | | (0.25 | ) |
| | | | | | | |
Net realized gain on investments | | | | — | | | | | | | — | | | | | (0.03 | ) | | | | (0.14 | ) | | | | (0.12 | ) | | | | (0.06 | ) |
| | | | | | | |
Total distributions to shareholders | | | | (0.13 | ) | | | | | | (0.25 | ) | | | | (0.23 | ) | | | | (0.33 | ) | | | | (0.33 | ) | | | | (0.31 | ) |
| | | | | | | |
Net Asset Value, End of Period | | | | $9.15 | | | | | | | $9.20 | | | | | $8.56 | | | | | $10.74 | | | | | $10.69 | | | | | $10.42 | |
| | | | | | | |
Total Return2,3 | | | | 0.89 | %4 | | | | | | 10.53 | % | | | | (18.19 | )% | | | | 3.59 | % | | | | 5.95 | % | | | | 10.92 | % |
| | | | | | | |
Ratio of net expenses to average net assets | | | | 0.99 | %5,6 | | | | | | 0.99 | % | | | | 0.99 | % | | | | 0.99 | % | | | | 0.99 | % | | | | 0.99 | % |
| | | | | | | |
Ratio of gross expenses to average net assets7 | | | | 1.09 | %5 | | | | | | 1.08 | % | | | | 1.07 | % | | | | 1.05 | % | | | | 1.07 | % | | | | 1.08 | % |
| | | | | | | |
Ratio of net investment income to average net assets2 | | | | 2.97 | %5 | | | | | | 2.87 | % | | | | 2.39 | % | | | | 1.85 | % | | | | 2.17 | % | | | | 2.56 | % |
| | | | | | | |
Portfolio turnover | | | | 14 | %4 | | | | | | 24 | % | | | | 45 | % | | | | 61 | % | | | | 81 | % | | | | 40 | % |
| | | | | | | |
Net assets end of period (000’s) omitted | | | | $3,042 | | | | | | | $5,964 | | | | | $2,955 | | | | | $14,923 | | | | | $5,015 | | | | | $5,722 | |
| | | | | | | | | | | | | | | | | | | | | | | | | | | | | | | | | |
31
| | |
| | AMG GW&K Municipal Enhanced Yield Fund Financial Highlights For a share outstanding throughout each fiscal period |
| | | | | | | | | | | | | | | | | | | | | | | | | | | | | | | | |
| | | For the six | | | | | | | | | | | | |
| | | months ended | | | | For the fiscal years ended December 31, |
| Class I | | June 30, 2024
(unaudited) | | | | 2023 | | 2022 | | 2021 | | 2020 | | 2019 |
| | | | | | | |
Net Asset Value, Beginning of Period | | | | $8.91 | | | | | | | $8.30 | | | | | $10.43 | | | | | $10.40 | | | | | $10.15 | | | | | $9.45 | |
| | | | | | | |
Income (loss) from Investment Operations: | | | | | | | | | | | | | | | | | | | | | | | | | | | | | | | | |
| | | | | | | |
Net investment income1,2 | | | | 0.15 | | | | | | | 0.27 | | | | | 0.24 | | | | | 0.23 | | | | | 0.25 | | | | | 0.29 | |
| | | | | | | |
Net realized and unrealized gain (loss) on investments | | | | (0.06 | ) | | | | | | 0.62 | | | | | (2.09 | ) | | | | 0.17 | | | | | 0.37 | | | | | 0.76 | |
| | | | | | | |
Total income (loss) from investment operations | | | | 0.09 | | | | | | | 0.89 | | | | | (1.85 | ) | | | | 0.40 | | | | | 0.62 | | | | | 1.05 | |
| | | | | | | |
Less Distributions to Shareholders from: | | | | | | | | | | | | | | | | | | | | | | | | | | | | | | | | |
| | | | | | | |
Net investment income | | | | (0.15 | ) | | | | | | (0.28 | ) | | | | (0.25 | ) | | | | (0.23 | ) | | | | (0.25 | ) | | | | (0.29 | ) |
| | | | | | | |
Net realized gain on investments | | | | — | | | | | | | — | | | | | (0.03 | ) | | | | (0.14 | ) | | | | (0.12 | ) | | | | (0.06 | ) |
| | | | | | | |
Total distributions to shareholders | | | | (0.15 | ) | | | | | | (0.28 | ) | | | | (0.28 | ) | | | | (0.37 | ) | | | | (0.37 | ) | | | | (0.35 | ) |
| | | | | | | |
Net Asset Value, End of Period | | | | $8.85 | | | | | | | $8.91 | | | | | $8.30 | | | | | $10.43 | | | | | $10.40 | | | | | $10.15 | |
| | | | | | | |
Total Return2,3 | | | | 1.00 | %4 | | | | | | 10.89 | % | | | | (17.86 | )% | | | | 3.94 | % | | | | 6.31 | % | | | | 11.28 | % |
| | | | | | | |
Ratio of net expenses to average net assets | | | | 0.64 | %5,6 | | | | | | 0.64 | % | | | | 0.64 | % | | | | 0.64 | % | | | | 0.64 | % | | | | 0.64 | % |
| | | | | | | |
Ratio of gross expenses to average net assets7 | | | | 0.74 | %5 | | | | | | 0.73 | % | | | | 0.72 | % | | | | 0.70 | % | | | | 0.72 | % | | | | 0.73 | % |
| | | | | | | |
Ratio of net investment income to average net assets2 | | | | 3.32 | %5 | | | | | | 3.22 | % | | | | 2.74 | % | | | | 2.20 | % | | | | 2.52 | % | | | | 2.91 | % |
| | | | | | | |
Portfolio turnover | | | | 14 | %4 | | | | | | 24 | % | | | | 45 | % | | | | 61 | % | | | | 81 | % | | | | 40 | % |
| | | | | | | |
Net assets end of period (000’s) omitted | | | | $200,639 | | | | | | | $205,322 | | | | | $255,928 | | | | | $369,473 | | | | | $323,439 | | | | | $273,228 | |
| | | | | | | | | | | | | | | | | | | | | | | | | | | | | | | | | |
32
| | |
| | AMG GW&K Municipal Enhanced Yield Fund Financial Highlights For a share outstanding throughout each fiscal period |
| | | | | | | | | | | | | | | | | | | | | | | | | | | | | | | | |
| | | For the six | | | | | | | | | | | | |
| | | months ended | | | | For the fiscal years ended December 31, |
| Class Z | | June 30, 2024
(unaudited) | | | | 2023 | | 2022 | | 2021 | | 2020 | | 2019 |
| | | | | | | |
Net Asset Value, Beginning of Period | | | | $8.91 | | | | | | | $8.30 | | | | | $10.43 | | | | | $10.40 | | | | | $10.15 | | | | | $9.44 | |
| | | | | | | |
Income (loss) from Investment Operations: | | | | | | | | | | | | | | | | | | | | | | | | | | | | | | | | |
| | | | | | | |
Net investment income1,2 | | | | 0.15 | | | | | | | 0.28 | | | | | 0.25 | | | | | 0.24 | | | | | 0.26 | | | | | 0.30 | |
| | | | | | | |
Net realized and unrealized gain (loss) on investments | | | | (0.06 | ) | | | | | | 0.61 | | | | | (2.10 | ) | | | | 0.17 | | | | | 0.37 | | | | | 0.76 | |
| | | | | | | |
Total income (loss) from investment operations | | | | 0.09 | | | | | | | 0.89 | | | | | (1.85 | ) | | | | 0.41 | | | | | 0.63 | | | | | 1.06 | |
| | | | | | | |
Less Distributions to Shareholders from: | | | | | | | | | | | | | | | | | | | | | | | | | | | | | | | | |
| | | | | | | |
Net investment income | | | | (0.15 | ) | | | | | | (0.28 | ) | | | | (0.25 | ) | | | | (0.24 | ) | | | | (0.26 | ) | | | | (0.29 | ) |
| | | | | | | |
Net realized gain on investments | | | | — | | | | | | | — | | | | | (0.03 | ) | | | | (0.14 | ) | | | | (0.12 | ) | | | | (0.06 | ) |
| | | | | | | |
Total distributions to shareholders | | | | (0.15 | ) | | | | | | (0.28 | ) | | | | (0.28 | ) | | | | (0.38 | ) | | | | (0.38 | ) | | | | (0.35 | ) |
| | | | | | | |
Net Asset Value, End of Period | | | | $8.85 | | | | | | | $8.91 | | | | | $8.30 | | | | | $10.43 | | | | | $10.40 | | | | | $10.15 | |
| | | | | | | |
Total Return2,3 | | | | 1.03 | %4 | | | | | | 10.95 | % | | | | (17.82 | )% | | | | 3.99 | % | | | | 6.37 | % | | | | 11.45 | % |
| | | | | | | |
Ratio of net expenses to average net assets | | | | 0.59 | %5,6 | | | | | | 0.59 | % | | | | 0.59 | % | | | | 0.59 | % | | | | 0.59 | % | | | | 0.59 | % |
| | | | | | | |
Ratio of gross expenses to average net assets7 | | | | 0.69 | %5 | | | | | | 0.68 | % | | | | 0.67 | % | | | | 0.65 | % | | | | 0.67 | % | | | | 0.68 | % |
| | | | | | | |
Ratio of net investment income to average net assets2 | | | | 3.37 | %5 | | | | | | 3.27 | % | | | | 2.79 | % | | | | 2.25 | % | | | | 2.57 | % | | | | 2.96 | % |
| | | | | | | |
Portfolio turnover | | | | 14 | %4 | | | | | | 24 | % | | | | 45 | % | | | | 61 | % | | | | 81 | % | | | | 40 | % |
| | | | | | | |
Net assets end of period (000’s) omitted | | | | $124 | | | | | | | $123 | | | | | $111 | | | | | $135 | | | | | $130 | | | | | $120 | |
| | | | | | | | | | | | | | | | | | | | | | | | | | | | | | | | | |
| 1 | Per share numbers have been calculated using average shares. |
| 2 | Total returns and net investment income would have been lower had certain expenses not been offset. |
| 3 | The total return is calculated using the published Net Asset Value as of period end. |
| 6 | Includes interest expense of less than 0.01% related to participation in the interfund lending program. |
| 7 | Excludes the impact of expense reimbursement or fee waivers and expense reductions such as brokerage credits, but includes expense repayments and non-reimbursable expenses, if any, such as interest, taxes, and extraordinary expenses. (See Note 1(c) and 2 in the Notes to Financial Statements.) |
33
| | |
| | Notes to Financial Statements (unaudited) June 30, 2024 |
1. ORGANIZATION AND SUMMARY OF SIGNIFICANT ACCOUNTING POLICIES
AMG Funds, AMG Funds II (“Trust II”) and AMG Funds III (“Trust III”) (the “Trusts”) are open-end management investment companies, organized as Massachusetts business trusts, and registered under the Investment Company Act of 1940, as amended (the “1940 Act”). Currently, the Trusts consist of a number of different funds, each having distinct investment management objectives, strategies, risks, and policies. Included in this report are AMG Funds: AMG GW&K Municipal Bond Fund (“Municipal Bond”), AMG GW&K Municipal Enhanced Yield Fund (“Municipal Enhanced”), Trust II: AMG GW&K Enhanced Core Bond ESG Fund (“Enhanced Core Bond ESG”) and Trust III: AMG GW&K ESG Bond Fund (“ESG Bond”) and AMG GW&K High Income Fund (“High Income”), each a “Fund” and collectively, the “Funds”.
Each Fund offers different classes of shares. All Funds offer Class N shares and Class I shares; and Enhanced Core Bond ESG and Municipal Enhanced offer Class Z shares. Each class represents an interest in the same assets of the respective Fund. Although all share classes generally have identical voting rights, each share class votes separately when required by law. Different share classes may have different net asset values per share to the extent the share classes pay different distribution amounts and/or the expenses of such share classes differ. Each share class has its own expense structure. Please refer to a current prospectus for additional information on each share class.
On June 12, 2024, the Boards of Trustees of AMG Funds II and AMG Funds III approved a plan to liquidate and terminate Enhanced Core Bond ESG and High Income (the “Liquidation”) on or around September 11, 2024 (the “Liquidation Date”). In conjunction with the Liquidation, Enhanced Core Bond ESG and High Income sold their portfolio investments and invested the proceeds in cash and cash equivalents. Effective June 14, 2024, Enhanced Core Bond ESG and High Income discontinued accruing 12b-1 Distribution fees through the Liquidation Date, and effective June 17, 2024, and through the Liquidation Date, the Investment Manager waived its management fee and will waive the right to recoup any prior reimbursed expenses under Enhanced Core Bond ESG’s and High Income’s Expense Limitation Agreements. Since immediately following the close of business on June 13, 2024, Enhanced Core Bond ESG and High Income no longer accept investments, except for investments made through existing asset allocation programs investing in Enhanced Core Bond ESG and High Income, and shares purchased pursuant to automatic investment programs, such as automatic investments through 401(k) plans and reinvestments of any dividends and distributions.
The Funds’ financial statements are prepared in accordance with accounting principles generally accepted in the United States of America (“U.S. GAAP”), including accounting and reporting guidance pursuant to Accounting Standards Codification Topic 946 applicable to investment companies. U.S. GAAP requires management to make estimates and assumptions that affect the reported amounts of assets and liabilities and disclosure of contingent assets and liabilities at the date of the financial statements and the reported amounts of income and expenses during the reporting period. Actual results could differ from those estimates and such differences could be material. The following is a summary of significant accounting policies followed by the Funds in the preparation of their financial statements:
a. VALUATION OF INVESTMENTS
Fixed income securities purchased with a remaining maturity exceeding 60 days are valued at the evaluated bid price provided by an authorized pricing service or,
if an evaluated price is not available, by reference to other securities which are considered comparable in credit rating, interest rate, due date and other features (generally referred to as “matrix pricing”) or other similar pricing methodologies. Investments in certain mortgage-backed and stripped mortgage-backed securities, convertible securities, derivatives and other debt securities not traded on an organized securities market are valued on the basis of valuations provided by dealers or by a pricing service which uses information with respect to transactions in such securities and various relationships between such securities and yield to maturity in determining value.
Fixed income securities purchased with a remaining maturity of 60 days or less are valued at amortized cost, provided that the amortized cost value is approximately the same as the fair value of the security valued without the use of amortized cost. Investments in other open-end registered investment companies are valued at their end of day net asset value per share.
The Funds’ portfolio investments are generally valued based on independent market quotations or prices or, if none, “evaluative” or other market based valuations provided by third party pricing services. Pursuant to Rule 2a-5 under the 1940 Act, the Funds’ Boards of Trustees (the “Board”) designated AMG Funds LLC (the “Investment Manager”) as the Funds’ Valuation Designee to perform the Funds’ fair value determinations. Such determinations are subject to Board oversight and certain reporting and other requirements intended to ensure that the Board receives the information it needs to oversee the Investment Manager’s fair value determinations.
Under certain circumstances, the value of certain Fund portfolio investments may be based on an evaluation of fair value, pursuant to procedures established by the Investment Manager and under the general supervision of the Board. The Funds may use the fair value of a portfolio investment to calculate its net asset value (“NAV”) in the event that the market quotation, price or market based valuation for the portfolio investment is not readily available or otherwise not determinable pursuant to the Funds’ valuation procedures, if the Investment Manager believes the quotation, price or market based valuation to be unreliable, or in certain other circumstances. When determining the fair value of an investment, the Investment Manager seeks to determine the price that the Funds might reasonably expect to receive from current sale of that portfolio investment in an arms-length transaction. Fair value determinations shall be based upon consideration of all available facts and information, including, but not limited to (i) attributes specific to the investment; (ii) fundamental and analytical data relating to the investment; and (iii) the value of other comparable securities or relevant financial instruments, including derivative securities, traded on other markets or among dealers.
The values assigned to fair value portfolio investments are based on available information and do not necessarily represent amounts that might ultimately be realized in the future, since such amounts depend on future developments inherent in long-term investments. Because of the inherent uncertainty of valuation, those estimated values may differ significantly from the values that would have been used had a ready market for the investments existed, and the differences could be material. The Board will be presented with quarterly reports, as of the most recent quarter end, summarizing all fair value activity, material fair value matters that occurred during the quarter, and all outstanding securities fair valued by the Funds. Additionally, the Board will be presented with an annual report that assesses the adequacy and effectiveness of the Investment Manager’s process for determining the fair value of the Funds’ investments.
U.S. GAAP defines fair value as the price that a fund would receive to sell an asset or pay to transfer a liability in an orderly transaction between market participants
34
| | |
| | Notes to Financial Statements (continued) |
at the measurement date. U.S. GAAP also establishes a framework for measuring fair value, and a three level hierarchy for fair value measurements based upon the transparency of inputs to the valuation of an asset or liability. Inputs may be observable or unobservable and refer broadly to the assumptions that market participants would use in pricing the asset or liability. Observable inputs reflect the assumptions market participants would use in pricing the asset or liability based on market data obtained from sources independent of the Funds. Unobservable inputs reflect the Funds’ own assumptions about the assumptions that market participants would use in pricing the asset or liability developed based on the best information available in the circumstances. Each investment is assigned a level based upon the observability of the inputs which are significant to the overall valuation.
The three-tier hierarchy of inputs is summarized below:
Level 1 – inputs are quoted prices in active markets for identical investments (e.g., equity securities, open-end investment companies)
Level 2 – other observable inputs (including, but not limited to: quoted prices for similar assets or liabilities in markets that are active, quoted prices for identical or similar assets or liabilities in markets that are not active, inputs other than quoted prices that are observable for the assets or liabilities (such as interest rates, yield curves, volatilities, prepayment speeds, loss severities, credit risks and default rates) or other market corroborated inputs) (e.g., debt securities, government securities, foreign currency exchange contracts, foreign securities utilizing international fair value pricing, fair valued securities with observable inputs)
Level 3 – inputs are significant unobservable inputs (including the Fund’s own assumptions used to determine the fair value of investments) (e.g., fair valued securities with unobservable inputs)
Changes in inputs or methodologies used for valuing investments may result in a transfer in or out of levels within the fair value hierarchy. The inputs or methodologies used for valuing investments may not necessarily be an indication of the risk associated with investing in those investments.
b. SECURITY TRANSACTIONS
Security transactions are accounted for as of trade date. Realized gains and losses on securities sold are determined on the basis of identified cost.
c. INVESTMENT INCOME AND EXPENSES
Interest income, which includes amortization of premium and accretion of discount on debt securities, is accrued as earned. Interest income on foreign securities is recorded gross of any withholding tax. Other income and expenses are recorded on an accrual basis. Expenses that cannot be directly attributed to a Fund are apportioned among the funds in the Trusts and other trusts or funds within the AMG Funds Family of Funds (collectively, the “AMG Funds Family”) based upon their relative average net assets or number of shareholders. Investment income, realized and unrealized capital gains and losses, the common expenses of each Fund, and certain fund level expense reductions, if any, are allocated on a pro-rata basis to each class based on the relative net assets of each class to the total net assets of each Fund.
d. DIVIDENDS AND DISTRIBUTIONS
Fund distributions resulting from net investment income, if any, will normally be declared and paid monthly by the Funds. Fund distributions resulting from realized
net capital gains, if any, will normally be declared and paid at least annually in December. Distributions to shareholders are recorded on the ex-dividend date. Distributions are determined in accordance with federal income tax regulations, which may differ from net investment income and net realized capital gains for financial statement purposes (U.S. GAAP). Differences may be permanent or temporary. Permanent differences are reclassified among capital accounts in the financial statements to reflect their tax character. Permanent book and tax basis differences, if any, relating to shareholder distributions will result in reclassifications to paid-in capital. Temporary differences arise when certain items of income, expense and gain or loss are recognized in different periods for financial statement and tax purposes; these differences will reverse at some time in the future. Permanent differences are primarily due to redemptions in kind for Enhanced Core Bond ESG, High Income and Municipal Enhanced. There were no permanent differences for ESG Bond or Municipal Bond. Temporary differences are primarily due to wash sale loss deferrals for ESG Bond and Municipal Enhanced and premium amortization on callable bonds for ESG Bond. Enhanced Core Bond ESG, High Income and Municipal Bond had no temporary differences.
At June 30, 2024, the aggregate cost for federal income tax purposes approximates the aggregate cost for book purposes. The approximate cost of investments and the aggregate gross unrealized appreciation and depreciation for federal income tax purposes were as follows:
| | | | | | | | | | | | | | | | |
| Fund | | Cost | | | Appreciation | | | Depreciation | | | Net Depreciation | |
| | | | |
ESG Bond | | | $457,741,737 | | | | $2,406,987 | | | | $(47,158,061 | ) | | | $(44,751,074 | ) |
| | | | |
Enhanced Core Bond ESG | | | 27,524,882 | | | | — | | | | — | | | | — | |
| | | | |
High Income | | | 6,746,570 | | | | — | | | | — | | | | — | |
| | | | |
Municipal Bond | | | 1,063,712,789 | | | | 5,108,959 | | | | (34,438,858 | ) | | | (29,329,899 | ) |
| | | | |
Municipal Enhanced | | | 212,293,431 | | | | 2,696,769 | | | | (13,503,735 | ) | | | (10,806,966 | ) |
e. FEDERAL TAXES
Each Fund currently qualifies as an investment company and intends to comply with the requirements under Subchapter M of the Internal Revenue Code of 1986, as amended, and to distribute substantially all of its taxable income and gains to its shareholders and to meet certain diversification and income requirements with respect to investment companies. The Investment Manager has analyzed the Funds’ tax positions taken on federal income tax returns for all open tax years (generally, the three prior taxable years), and has concluded that no provision for federal income tax is required in the Funds’ financial statements. Additionally, the Investment Manager is not aware of any tax position for which it is reasonably possible that the total amounts of unrecognized tax benefit/detriment will change materially in the next twelve months.
Furthermore, based on each Fund’s understanding of the tax rules and rates related to income, gains and transactions for the foreign jurisdictions in which it invests, each Fund will provide for foreign taxes, and where appropriate, deferred foreign taxes.
35
| | |
| | Notes to Financial Statements (continued) |
f. CAPITAL LOSS CARRYOVERS AND DEFERRALS
As of December 31, 2023, the Funds had capital loss carryovers for federal income tax purposes as shown in the following chart. These amounts may be used to offset future realized capital gains indefinitely, and retain their character as short-term and/or long-term.
| | | | | | | | | | | | |
Fund | | Short-Term | | | Long-Term | | | Total | |
| | | |
ESG Bond | | | $9,213,293 | | | | $30,595,067 | | | | $39,808,360 | |
| | | | | | | | | | | | |
Fund | | Short-Term | | | Long-Term | | | Total | |
| | | |
Enhanced Core Bond ESG | | | $2,675,067 | | | | $3,874,633 | | | | $6,549,700 | |
| | | |
High Income | | | 398,620 | | | | 1,036,677 | | | | 1,435,297 | |
| | | |
Municipal Bond | | | 1,211,437 | | | | 25,741,340 | | | | 26,952,777 | |
| | | |
Municipal Enhanced | | | 4,404,660 | | | | 11,810,700 | | | | 16,215,360 | |
g. CAPITAL STOCK
Each of AMG Funds’ Amended and Restated Agreement and Declaration of Trust, AMG Funds II’s Amended and Restated Declaration of Trust, and AMG Funds III’s Declaration of Trust authorizes for each applicable Fund the issuance of an unlimited number of shares of beneficial interest, without par value. Each Fund records sales and repurchases of its capital stock on the trade date. For the fiscal year ended December 31, 2023, Municipal Enhanced delivered securities, and cash in connection with redemptions in-kind transactions in the amount of $46,736,183 for subscriptions in-kind to AMG GW&K Municipal Enhanced SMA Shares, an affiliated fund, and a related party. For the purposes of U.S. GAAP, the transactions were treated as sales of securities and the resulting gain or loss was recognized based on the market value of the securities on the date of the transfer. For tax purposes, no gains or losses were recognized.
For the six months ended June 30, 2024 (unaudited) and the fiscal year ended December 31, 2023, the capital stock transactions by class for the Funds were as follows:
| | | | | | | | | | | | | | | | | | | | | | | | | | | | | | | | |
| | | ESG Bond | | | | Enhanced Core Bond ESG | |
| | | June 30, 2024 | | | December 31, 2023 | | | June 30, 2024 | | | December 31, 2023 | |
| | | | | | | | |
| | | Shares | | | | Amount | | | | Shares | | | | Amount | | | | Shares | | | | Amount | | | | Shares | | | | Amount | |
| | | | | | | | |
Class N: | | | | | | | | | | | | | | | | | | | | | | | | | | | | | | | | |
| | | | | | | | |
Shares sold | | | 233,326 | | | | $5,004,534 | | | | 502,045 | | | | $10,618,434 | | | | 51,840 | | | | $465,722 | | | | 384,052 | | | | $3,446,741 | |
| | | | | | | | |
Shares issued in reinvestment of distributions | | | 200,184 | | | | 4,270,980 | | | | 395,272 | | | | 8,384,556 | | | | 25,076 | | | | 223,137 | | | | 32,277 | | | | 287,738 | |
| | | | | | | | |
Shares redeemed | | | (1,472,770) | | | | (31,593,566) | | | | (2,817,229) | | | | (59,923,434) | | | | (475,535) | | | | (4,260,195) | | | | (370,741) | | | | (3,342,409) | |
| | | | | | | | | | | | | | | | | | | | | | | | | | | | | | | | |
| | | | | | | | |
Net increase (decrease) | | | (1,039,260) | | | | $(22,318,052) | | | | (1,919,912) | | | | $(40,920,444) | | | | (398,619) | | | | $(3,571,336) | | | | 45,588 | | | | $392,070 | |
| | | | | | | | | | | | | | | | | | | | | | | | | | | | | | | | |
| | | | | | | | |
Class I: | | | | | | | | | | | | | | | | | | | | | | | | | | | | | | | | |
| | | | | | | | |
Shares sold | | | 644,818 | | | | $13,853,438 | | | | 1,156,432 | | | | $24,647,398 | | | | 258,879 | | | | $2,342,986 | | | | 1,011,926 | | | | $9,000,136 | |
| | | | | | | | |
Shares issued in reinvestment of distributions | | | 129,567 | | | | 2,764,575 | | | | 259,536 | | | | 5,507,823 | | | | 65,832 | | | | 588,259 | | | | 74,147 | | | | 663,551 | |
| | | | | | | | |
Shares redeemed | | | (1,070,182) | | | | (22,954,469) | | | | (2,914,785) | | | | (61,872,107) | | | | (1,072,672) | | | | (9,636,926) | | | | (933,098) | | | | (8,401,244) | |
| | | | | | | | | | | | | | | | | | | | | | | | | | | | | | | | |
| | | | | | | | |
Net increase (decrease) | | | (295,797) | | | | $(6,336,456) | | | | (1,498,817) | | | | $(31,716,886) | | | | (747,961) | | | | $(6,705,681) | | | | 152,975 | | | | $1,262,443 | |
| | | | | | | | | | | | | | | | | | | | | | | | | | | | | | | | |
| | | | | | | | |
Class Z: | | | | | | | | | | | | | | | | | | | | | | | | | | | | | | | | |
| | | | | | | | |
Shares sold | | | — | | | | — | | | | — | | | | — | | | | 61,586 | | | | $553,423 | | | | 143,285 | | | | $1,297,193 | |
| | | | | | | | |
Shares issued in reinvestment of distributions | | | — | | | | — | | | | — | | | | — | | | | 23,188 | | | | 207,028 | | | | 30,302 | | | | 271,456 | |
| | | | | | | | |
Shares redeemed | | | — | | | | — | | | | — | | | | — | | | | (315,335) | | | | (2,835,060) | | | | (444,712) | | | | (3,991,589) | |
| | | | | | | | | | | | | | | | | | | | | | | | | | | | | | | | |
| | | | | | | | |
Net decrease | | | — | | | | — | | | | — | | | | — | | | | (230,561) | | | | $(2,074,609) | | | | (271,125) | | | | $(2,422,940) | |
| | | | | | | | | | | | | | | | | | | | | | | | | | | | | | | | |
| | |
| | | High Income | | | | Municipal Bond | |
| | | June 30, 2024 | | | December 31, 2023 | | | June 30, 2024 | | | December 31, 2023 | |
| | | | | | | | |
| | | Shares | | | | Amount | | | | Shares | | | | Amount | | | | Shares | | | | Amount | | | | Shares | | | | Amount | |
| | | | | | | | |
Class N: | | | | | | | | | | | | | | | | | | | | | | | | | | | | | | | | |
| | | | | | | | |
Shares sold | | | 17,155 | | | | $357,564 | | | | 80,767 | | | | $1,656,985 | | | | 351,551 | | | | $3,984,094 | | | | 418,863 | | | | $4,709,065 | |
| | | | | | | | |
Shares issued in reinvestment of distributions | | | 11,802 | | | | 244,102 | | | | 15,456 | | | | 314,368 | | | | 9,290 | | | | 104,922 | | | | 18,635 | | | | 207,971 | |
| | | | | | | | |
Shares redeemed | | | (82,697) | | | | (1,710,885) | | | | (83,177) | | | | (1,699,230) | | | | (357,567) | | | | (4,054,495) | | | | (556,927) | | | | (6,183,058) | |
| | | | | | | | | | | | | | | | | | | | | | | | | | | | | | | | |
| | | | | | | | |
Net increase (decrease) | | | (53,740) | | | | $(1,109,219) | | | | 13,046 | | | | $272,123 | | | | 3,274 | | | | $34,521 | | | | (119,429) | | | | $(1,266,022) | |
| | | | | | | | | | | | | | | | | | | | | | | | | | | | | | | | |
36
| | |
| | Notes to Financial Statements (continued) |
| | | | | | | | | | | | | | | | | | | | | | | | | | | | | | | | |
| | | High Income | | | | Municipal Bond | |
| | | June 30, 2024 | | | December 31, 2023 | | | June 30, 2024 | | | December 31, 2023 | |
| | | | | | | | |
| | | Shares | | | | Amount | | | | Shares | | | | Amount | | | | Shares | | | | Amount | | | | Shares | | | | Amount | |
| | | | | | | | |
Class I: | | | | | | | | | | | | | | | | | | | | | | | | | | | | | | | | |
| | | | | | | | |
Shares sold | | | 37,655 | | | | $784,917 | | | | 58,087 | | | | $1,187,228 | | | | 13,066,061 | | | | $149,467,439 | | | | 37,373,757 | | | | $421,157,504 | |
| | | | | | | | |
Shares issued in reinvestment of distributions | | | 5,683 | | | | 118,105 | | | | 21,980 | | | | 446,846 | | | | 826,135 | | | | 9,381,871 | | | | 1,488,315 | | | | 16,699,309 | |
| | | | | | | | |
Shares redeemed | | | (335,188) | | | | (6,925,333) | | | | (281,706) | | | | (5,745,881) | | | | (13,292,312) | | | | (151,613,712) | | | | (46,781,942) | | | | (526,167,158) | |
| | | | | | | | | | | | | | | | | | | | | | | | | | | | | | | | |
| | | | | | | | |
Net increase (decrease) | | | (291,850) | | | | $(6,022,311) | | | | (201,639) | | | | $(4,111,807) | | | | 599,884 | | | | $7,235,598 | | | | (7,919,870) | | | | $(88,310,345) | |
| | | | | | | | | | | | | | | | | | | | | | | | | | | | | | | | |
| | |
| | | Municipal Enhanced | | | | | |
| | | June 30, 2024 | | | December 31, 2023 | | | | | | | |
| | | | | | | | |
| | | Shares | | | | Amount | | | | Shares | | | | Amount | | | | | | | | | | | | | | | | | |
| | | | | | | | |
Class N: | | | | | | | | | | | | | | | | | | | | | | | | | | | | | | | | |
| | | | | | | | |
Shares sold | | | 779,629 | | | | $7,072,813 | | | | 1,862,046 | | | | $16,341,115 | | | | | | | | | | | | | | | | | |
| | | | | | | | |
Shares issued in reinvestment of distributions | | | 2,834 | | | | 25,706 | | | | 8,269 | | | | 72,921 | | | | | | | | | | | | | | | | | |
| | | | | | | | |
Shares redeemed | | | (1,098,349) | | | | (10,025,108) | | | | (1,567,017) | | | | (13,721,798) | | | | | | | | | | | | | | | | | |
| | | | | | | | | | | | | | | | | | | | | | | | | | | | | | | | |
| | | | | | | | |
Net increase (decrease) | | | (315,886) | | | | $(2,926,589) | | | | 303,298 | | | | $2,692,238 | | | | | | | | | | | | | | | | | |
| | | | | | | | | | | | | | | | | | | | | | | | | | | | | | | | |
| | | | | | | | |
Class I: | | | | | | | | | | | | | | | | | | | | | | | | | | | | | | | | |
| | | | | | | | |
Shares sold | | | 3,499,842 | | | | $30,963,142 | | | | 14,554,470 | | | | $124,614,205 | | | | | | | | | | | | | | | | | |
| | | | | | | | |
Shares issued in reinvestment of distributions | | | 139,893 | | | | 1,228,430 | | | | 330,028 | | | | 2,811,647 | | | | | | | | | | | | | | | | | |
| | | | | | | | |
Shares redeemed | | | (4,023,359) | | | | (35,535,943) | | | | (22,667,440) | | | | (192,162,997) | 1 | | | | | | | | | | | | | | | | |
| | | | | | | | | | | | | | | | | | | | | | | | | | | | | | | | |
| | | | | | | | |
Net decrease | | | (383,624) | | | | $(3,344,371) | | | | (7,782,942) | | | | $(64,737,145) | | | | | | | | | | | | | | | | | |
| | | | | | | | | | | | | | | | | | | | | | | | | | | | | | | | |
| | | | | | | | |
Class Z: | | | | | | | | | | | | | | | | | | | | | | | | | | | | | | | | |
| | | | | | | | |
Shares issued in reinvestment of distributions | | | 236 | | | | $2,080 | | | | 448 | | | | $3,806 | | | | | | | | | | | | | | | | | |
| | | | | | | | | | | | | | | | | | | | | | | | | | | | | | | | |
| | | | | | | | |
Net increase | | | 236 | | | | $2,080 | | | | 448 | | | | $3,806 | | | | | | | | | | | | | | | | | |
| | | | | | | | | | | | | | | | | | | | | | | | | | | | | | | | |
1 Includes redemption in-kind in the amount of $46,736,183.
h. REPURCHASE AGREEMENTS AND JOINT REPURCHASE AGREEMENTS
The Funds may enter into third-party and bilateral repurchase agreements for temporary cash management purposes and for reinvestment of cash collateral on securities lending transactions under the securities lending program offered by The Bank of New York Mellon (“BNYM”) (the “Securities Lending Program”) (collectively, “Repurchase Agreements”). The value of the underlying collateral, including accrued interest, must equal or exceed the value of the Repurchase Agreements during the term of the agreement. For joint repurchase agreements, the Funds participate on a pro rata basis with other clients of BNYM in their share of the underlying collateral under such joint repurchase agreements and in their share of proceeds from any repurchase or other disposition of the underlying collateral. The underlying collateral for all Repurchase Agreements is held by the Funds’ custodian or at the Federal Reserve Bank. If the seller defaults and the value of the collateral declines, or if bankruptcy proceedings commence with respect to the seller of the security, realization of the collateral by the Funds may be delayed or limited. Pursuant to the Securities Lending Program, the Funds are indemnified for such losses by BNYM on joint repurchase agreements.
At June 30, 2024, the market value of Repurchase Agreements outstanding for ESG Bond, Municipal Bond and Municipal Enhanced was $20,293,095, $6,462,000 and $271,000, respectively.
i. DELAYED DELIVERY TRANSACTIONS AND WHEN-ISSUED SECURITIES
The Funds may enter into securities transactions on a delayed delivery or when issued basis. Payment and delivery may take place after the customary settlement period for that security. The price of the underlying securities and the date when the securities will be delivered and paid for are fixed at the time the transaction is negotiated. During the time a delayed delivery sell is outstanding, the contract is marked to market daily and equivalent deliverable securities are held for the transaction. The value of the securities purchased on a delayed delivery or when-issued basis are identified as such in each Fund’s Schedule of Portfolio Investments. With respect to purchase commitments, the Funds identify securities as segregated in their records with a value at least equal to the amount of the commitment. Delayed delivery or when-issued securities that have been purchased from and sold to different brokers are reflected as an investment in
37
| | |
| | Notes to Financial Statements (continued) |
securities and a forward sale commitment in the Fund’s Statement of Assets and Liabilities. For financial reporting purposes, the Fund does offset the receivable and payable for delayed delivery investments purchased and sold. Losses may arise due to changes in the value of the underlying securities or if the counterparty does not perform under the contract, or if the issuer does not issue the securities due to political, economic, or other factors.
During the six months ended June 30, 2024, Municipal Enhanced entered into securities transactions on a delayed delivery or when issued basis. At June 30, 2024, there were no delayed delivery or when issued securities.
2. AGREEMENTS AND TRANSACTIONS WITH AFFILIATES
For each of the Funds, the Trusts have entered into investment advisory agreements under which the Investment Manager, a subsidiary and the U.S. wealth platform of Affiliated Managers Group, Inc. (“AMG”), serves as investment manager to the Funds and is responsible for the Funds’ overall administration and operations. The Investment Manager selects and recommends, subject to the approval of the Boards and, in certain circumstances, shareholders, the subadviser(s) for the Funds and monitors the subadviser’s investment performance, security holdings and investment strategies. Each Fund’s investment portfolio is managed by GW&K Investment Management, LLC (“GW&K”), who serves as subadviser pursuant to a subadvisory agreement with the Investment Manager. AMG indirectly owns a majority interest in GW&K.
Investment management fees are paid directly by the Funds to the Investment Manager based on average daily net assets. For the six months ended June 30, 2024, the Funds’ investment management fees were paid at the following annual rates of each Fund’s respective average daily net assets:
| | | | |
ESG Bond | | | 0.23 | % |
| |
Enhanced Core Bond ESG | | | 0.30 | % |
| |
High Income | | | 0.39 | % |
| |
Municipal Bond | | | 0.21 | %1 |
| |
on first $25 million | | | 0.35 | % |
| |
on next $25 million | | | 0.30 | % |
| |
on next $50 million | | | 0.25 | % |
| |
on balance over $100 million | | | 0.20 | % |
| |
Municipal Enhanced | | | 0.45 | % |
1 The rate shown is the effective rate as of June 30, 2024.
The fee paid to GW&K for its services as subadviser is paid out of the fee the Investment Manager receives from each Fund and does not increase the expenses of each Fund.
The Investment Manager has contractually agreed, through at least May 1, 2025, to waive management fees and/or pay or reimburse fund expenses in order to limit total annual Fund operating expenses after fee waiver and expense reimbursements (exclusive of taxes, interest (including interest incurred in connection with bank and custody overdrafts, and in connection with securities sold short), shareholder servicing fees, distribution and service (12b-1) fees, brokerage commissions and other transaction costs, dividends payable with respect to securities sold short, acquired fund fees and expenses and extraordinary expenses) of ESG Bond, Enhanced Core Bond ESG, High Income,
Municipal Bond, and Municipal Enhanced to the annual rate of 0.43%, 0.48%, 0.59%, 0.34%, and 0.59%, respectively, of each Fund’s average daily net assets (this annual rate or such other annual rate that may be in effect from time to time, the “Expense Cap”), subject to later reimbursement by the Funds in certain circumstances.
In general, for a period of up to 36 months after the date any amounts are paid, waived or reimbursed by the Investment Manager, the Investment Manager may recover such amounts from a Fund, provided that such repayment would not cause the Fund’s total annual operating expenses after fee waiver and expense reimbursements (exclusive of the items noted in the parenthetical above) to exceed either (i) the Expense Cap in effect at the time such amounts were paid, waived or reimbursed, or (ii) the Expense Cap in effect at the time of such repayment by the Fund.
The contractual expense limitation may only be terminated in the event the Investment Manager or a successor ceases to be the investment manager of a Fund or a successor fund, by mutual agreement between the Investment Manager and the Boards, or in the event of a Fund’s liquidation unless the Fund is reorganized or is a party to a merger in which the surviving entity is successor to the accounting and performance information of a Fund.
For the six months ended June 30, 2024, the Investment Manager’s expense reimbursements, and repayments of prior reimbursements by the Funds to the Investment Manager, if any, are as follows:
| | | | |
| | | Expense Reimbursements | | Repayment of Prior Reimbursements |
| | |
ESG Bond | | $65,389 | | — |
| | |
Enhanced Core Bond ESG | | 86,603 | | — |
| | |
High Income | | 55,202 | | — |
| | |
Municipal Bond | | 334,418 | | — |
| | |
Municipal Enhanced | | 100,374 | | — |
At June 30, 2024, the Funds’ expiration of reimbursements subject to recoupment is as follows:
| | | | | | | | | | | | |
Expiration Period | | ESG Bond | | | Municipal Bond | | | Municipal Enhanced | |
| | | |
Less than 1 year | | | $51,752 | | | | $719,840 | | | | $230,878 | |
| | | |
1-2 years | | | 86,383 | | | | 748,215 | | | | 217,440 | |
| | | |
2-3 years | | | 107,311 | | | | 717,835 | | | | 217,680 | |
| | | | | | | | | | | | |
| | | |
Total | | | $245,446 | | | | $2,185,890 | | | | $665,998 | |
| | | | | | | | | | | | |
Effective June 17, 2024, for Enhanced Core Bond ESG and High Income the Investment Manager waived its management fee and right to recoup any prior reimbursed expenses under Enhanced Core Bond ESG’s and High Income’s Expense Limitation Agreements. For the six months ended June 30, 2024, the investment management fees for Enhanced Core Bond ESG and High Income were reduced by $3,470 and $1,041, respectively, or 0.02% of average daily net assets.
The Trusts, on behalf of the Funds, have entered into an amended and restated Administration Agreement under which the Investment Manager serves as the Funds’ administrator (the “Administrator”) and is responsible for certain aspects of managing the Funds’ operations, including administration and shareholder
38
| | |
| | Notes to Financial Statements (continued) |
services to each Fund. Each Fund pays a fee to the Administrator at the rate of 0.15% per annum of the Fund’s average daily net assets for this service.
The Funds are distributed by AMG Distributors, Inc. (the “Distributor”), a wholly-owned subsidiary of the Investment Manager. The Distributor serves as the distributor and underwriter for each Fund and is a registered broker-dealer and member of the Financial Industry Regulatory Authority, Inc. (“FINRA”). Shares of each Fund will be continuously offered and will be sold directly to prospective purchasers and through brokers, dealers or other financial intermediaries who have executed selling agreements with the Distributor. Generally, the Distributor bears all or a portion of the expenses of providing services pursuant to the distribution agreement, including the payment of the expenses relating to the distribution of prospectuses for sales purposes and any advertising or sales literature.
The Trusts have adopted a distribution and service plan (the “Plan”) with respect to the Class N shares, in accordance with the requirements of Rule 12b-1 under the 1940 Act and the requirements of the applicable rules of FINRA regarding asset-based sales charges. Pursuant to the Plan, Enhanced Core Bond ESG, Municipal Bond and Municipal Enhanced may make payments to the Distributor for its expenditures in financing any activity primarily intended to result in the sale of each Fund’s Class N shares and for maintenance and personal service provided to existing shareholders of that class. The Plan authorizes payments to the Distributor up to 0.25% annually of Enhanced Core Bond ESG, Municipal Bond and Municipal Enhanced average daily net assets attributable to the Class N shares. The portion of payments made under the plan by Class N shares of Enhanced Core Bond ESG, Municipal Bond and Municipal Enhanced for shareholder servicing may not exceed an annual rate of 0.25% of the average daily net asset value of each Fund’s shares of that class owned by clients of such broker, dealer or financial intermediary.
For each of Class N and Class I shares of ESG Bond, High Income, Municipal Bond, and Municipal Enhanced, and for Enhanced Core Bond ESG’s Class I shares, the Board has approved reimbursement payments to the Investment Manager for shareholder servicing expenses (“shareholder servicing fees”) incurred. Shareholder servicing fees include payments to financial intermediaries, such as broker-dealers (including fund supermarket platforms), banks, and trust companies who provide shareholder recordkeeping, account servicing and other services. The Class N and Class I shares may reimburse the Investment Manager for the actual amount incurred up to a maximum annual rate of each Class’s average daily net assets as shown in the table below.
The impact on the annualized expense ratios for the six months ended June 30, 2024, was as follows:
| | | | | | | | |
| Fund | | Maximum Annual
Amount
Approved | | | Actual
Amount
Incurred | |
| | |
ESG Bond | | | | | | | | |
| | |
Class N | | | 0.25% | | | | 0.25% | |
| | |
Class I | | | 0.05% | | | | 0.05% | |
| | |
Enhanced Core Bond ESG | | | | | | | | |
| | |
Class I | | | 0.10% | | | | 0.08% | |
| | |
High Income | | | | | | | | |
| | |
Class N | | | 0.25% | | | | 0.25% | |
| | |
Class I | | | 0.05% | | | | 0.05% | |
| | |
Municipal Bond | | | | | | | | |
| | |
Class N | | | 0.15% | | | | 0.13% | |
| | |
Class I | | | 0.05% | | | | 0.05% | |
| | |
Municipal Enhanced | | | | | | | | |
| | |
Class N | | | 0.15% | | | | 0.15% | |
| | |
Class I | | | 0.05% | | | | 0.05% | |
The Board provides supervision of the affairs of the Trusts and other trusts within the AMG Funds Family. The Trustees of the Trusts who are not affiliated with the Investment Manager receive an annual retainer and per meeting fees for regular, special and telephonic meetings, and they are reimbursed for out-of-pocket expenses incurred while carrying out their duties as Board members. The Chairman of the Board and the Audit Committee Chair receive additional annual retainers. Certain Trustees and Officers of the Funds are Officers and/or Directors of the Investment Manager, AMG and/or the Distributor.
The Securities and Exchange Commission (the “SEC”) granted an exemptive order that permits certain eligible funds in the AMG Funds Family to lend and borrow money for certain temporary purposes directly to and from other eligible funds in the AMG Funds Family. Participation in this interfund lending program is voluntary for both the borrowing and lending funds, and an interfund loan is only made if it benefits each participating fund. The Administrator manages the program according to procedures approved by the Board, and the Board monitors the operation of the program. An interfund loan must comply with certain conditions set out in the exemptive order, which are designed to assure fairness and protect all participating funds. The interest earned and interest paid on interfund loans are included on the Statement of Operations as interest income and interest expense, respectively. At June 30, 2024, the Funds had no interfund loans outstanding. The Funds did not lend during the six months ended June 30, 2024.
The following Fund utilized the interfund loan program during the six months ended June 30, 2024 as follows:
| | | | | | | | | | | | | | | | |
| Fund | | Average
Borrowed | | | Number
of Days | | | Interest
Paid | | | Average
Interest Rate | |
| | | | |
Municipal Enhanced | | $ | 2,049,864 | | | | 1 | | | | $349 | | | | 6.215% | |
39
| | |
| | Notes to Financial Statements (continued) |
3. PURCHASES AND SALES OF SECURITIES
Purchases and sales of securities (excluding short-term securities and U.S. Government Obligations) for the six months ended June 30, 2024, were as follows:
| | | | | | | | |
| | | Long Term Securities | |
| | |
| Fund | | Purchases | | | Sales | |
| | |
ESG Bond | | | $53,194,626 | | | | $79,762,186 | |
| | |
Enhanced Core Bond ESG | | | 4,654,271 | | | | 24,631,119 | |
| | |
High Income | | | 2,497,584 | | | | 16,060,393 | |
| | |
Municipal Bond | | | 204,995,847 | | | | 150,809,183 | |
| | |
Municipal Enhanced | | | 28,026,669 | | | | 33,262,651 | |
Purchases and sales of U.S. Government Obligations for the six months ended June 30, 2024 were as follows:
| | | | | | | | |
| | | U.S. Government Obligations | |
| | |
| Fund | | Purchases | | | Sales | |
| | |
ESG Bond | | | $18,371,458 | | | | $21,734,426 | |
| | |
Enhanced Core Bond ESG | | | 3,215,725 | | | | 22,537,734 | |
4. PORTFOLIO SECURITIES LOANED
The Funds, except Municipal Bond and Municipal Enhanced, participate in the Securities Lending Program providing for the lending of securities to qualified borrowers. Securities lending income includes earnings of such temporary cash investments, plus or minus any rebate to a borrower. These earnings (after any rebate) are then divided between BNYM, as a fee for its services under the Securities Lending Program, and the Funds, according to agreed-upon rates. Collateral on all securities loaned is accepted in cash, U.S. Treasury Obligations or U.S. Government Agency Obligations. Collateral is maintained at a minimum level of 102% (105% in the case of certain foreign securities) of the market value, plus interest, if applicable, of investments on loan. It is the Funds’ policy to obtain additional collateral from or return excess collateral to the borrower by the end of the next business day, following the valuation date of the securities loaned. Therefore, the value of the collateral held may be temporarily less than the value of the securities on loan. Lending securities entails a risk of loss to the Funds if and to the extent that the market value of the securities loaned were to increase and the borrower did not increase the collateral accordingly, and the borrower fails to return the securities. Under the terms of the Securities Lending Program, the Funds are indemnified for such losses by BNYM. Cash collateral is held in separate omnibus accounts managed by BNYM, who is authorized to exclusively enter into joint repurchase agreements for that cash collateral. Securities collateral is held in separate omnibus accounts managed by BNYM and cannot be sold or pledged. BNYM bears the risk of any deficiency in the amount of the cash collateral available for return to the borrower due to any loss on the collateral invested. Loans of securities are terminable by a Fund at any time and the borrower, after notice, is required to return borrowed securities as soon as practical, which is normally within three business days.
The value of securities loaned on positions held, cash collateral and securities collateral received at June 30, 2024, was as follows:
| | | | | | | | | | | | | | | | |
| Fund | | Securities
Loaned | | | Cash
Collateral
Received | | | Securities
Collateral Received | | | Total Collateral Received | |
| | | | |
ESG Bond | | | $21,447,918 | | | | $16,825,095 | | | | $5,491,355 | | | | $22,316,450 | |
The following table summarizes the securities received as collateral for securities lending at June 30, 2024:
| | | | | | | | |
| Fund | | Collateral Type | | Coupon
Range | | Maturity Date Range | |
| | | |
ESG Bond | | U.S. Treasury
Obligations | | 0.125%-5.250% | | | 10/15/24-05/15/52 | |
5. FUND RISKS
In the normal course of business, the Funds invest in securities or other instruments and may enter into certain transactions, and such activities subject the Funds to various risks. Below is a summary of some, but not all, of those risks. Each risk described below does not necessarily apply to each Fund. Please refer to each Fund’s prospectus for a description of the principal risks associated with investing in a particular Fund. The value of securities or other instruments may also be affected by various factors, including, without limitation: (i) the general economy; (ii) the overall market as well as local, regional or global political and/or social instability; or (iii) price fluctuations.
Market Risk: Market prices of investments held by the Funds may fall rapidly or unpredictably due to a variety of factors, including economic, political, or market conditions, or other factors including terrorism, war, natural disasters and the spread of infectious illness or other public health issues, including epidemics or pandemics, or in response to events that affect particular industries or companies.
Management Risk: Because the Funds are actively managed investment portfolios, security selection or focus on securities in a particular style, market sector or group of companies may cause the Funds to incur losses or underperform relative to its benchmarks or other funds with a similar investment objective. There can be no guarantee that GW&K’s investment techniques and risk analysis will produce the desired result.
Municipal Market Risk: Factors unique to the municipal bond market may negatively affect the value of the Funds’ investment in municipal bonds. These factors include political or legislative changes, and uncertainties related to the tax status of the securities and the rights of investors in the securities. The Funds may invest in a group of municipal obligations that are related in such a way that an economic, business, or political development affecting one would also affect the others.
Sector Risk: Issuers and companies that are in similar industry sectors may be similarly affected by particular economic or market events; to the extent certain Funds have substantial holdings within a particular sector, the risks associated with that sector increase. A portion of certain Funds’ assets may be invested in fixed income securities that would tend to respond similarly to particular economic or political developments or the interest on which is based on revenues or otherwise related to similar types of projects. An example would be securities of issuers whose revenues are paid from similar types of projects, such as health care (including hospitals), utilities, or transportation.
Debt Securities Risk: The value of a debt security changes in response to various factors, including, for example, market-related factors, such as changes in interest rates or changes in the actual or perceived ability of an issuer to meet its
40
| | |
| | Notes to Financial Statements (continued) |
obligations. Investments in debt securities are subject to, among other risks, credit risk, interest rate risk, extension risk, prepayment risk and liquidity risk.
Interest Rate Risk: Fixed coupon payments (cash flows) of bonds and debt securities may become less competitive with the market in periods of rising interest rates and cause bond prices to decline. During periods of increasing interest rates, the Funds may experience high levels of volatility and shareholder redemptions, and may have to sell securities at times when it would otherwise not do so, and at unfavorable prices, which could reduce the returns of the Funds.
Credit and Counterparty Risk: The issuer of bonds or other debt securities may be unable or unwilling, or may be perceived as unable or unwilling, to make timely interest, principal or settlement payments or otherwise honor its obligations.
Prepayment Risk: A debtor may exercise its right to pay back a bond or other debt security earlier than expected or required during periods of decreasing interest rates.
Extension Risk: During periods of rising interest rates, a debtor may pay back a bond or other fixed income security slower than expected or required, and the value of such security may fall.
Asset-Backed and Mortgage-Backed Securities Risk: Investments in asset-backed and mortgage-backed securities involve risk of severe credit downgrades, loss due to prepayments that occur earlier or later than expected, illiquidity and default.
U.S. Government Securities Risk: Obligations issued by some U.S. Government agencies, authorities, instrumentalities, or sponsored enterprises such as Government National Mortgage Association (“GNMA”) are backed by the full faith and credit of the U.S. Government, while obligations issued by others, such as Federal National Mortgage Association (“FNMA”), Federal Home Loan Mortgage Corporation (“FHLMC”), and Federal Home Loan Banks (“FHLBs”), are not backed by the full faith and credit of the U.S. Government and are backed solely by the entity’s own resources or by the ability of the entity to borrow from the U.S. Treasury. If one of these agencies defaults on a loan, there is no guarantee that the U.S. Government will provide financial support.
Liquidity Risk: The Funds may not be able to dispose of particular investments, such as illiquid securities, readily at favorable times or prices or the Fund may have to sell them at a loss.
High Yield Risk: Below investment grade debt securities and unrated securities of similar credit quality (commonly known as “junk bonds” or “high yield securities”) may be subject to greater levels of interest rate, credit, liquidity, and market risk than higher-rated securities. These securities are considered predominately speculative with respect to the issuer’s continuing ability to make principal and interest payments.
ESG Investing Risk: Because applying a Fund’s ESG investment criteria may result in the selection or exclusion of securities of certain issuers for reasons other than financial performance, a Fund’s investment returns may underperform funds that do not incorporate ESG factors into their investment process. The incorporation of ESG criteria into the investment process may affect a Fund’s investment exposure to certain companies, sectors, regions, countries or types of investments, which could negatively impact a Fund’s performance depending on whether such investments are in or out of favor. Applying ESG criteria to investment decisions is qualitative and subjective by nature, and there is no guarantee that the criteria utilized by GW&K or any judgment exercised by GW&K will improve the financial performance of a Fund or reflect the beliefs or values of any particular investor. ESG standards differ by region and industry, and a company’s ESG practices or GW&K’s assessment of a company’s ESG practices may change over time. GW&K’s evaluation of a company also may be dependent on the availability of timely, complete and accurate ESG data reported by issuers and/or third party data providers. Different methodologies may be used by the various issuers and third party sources that provide ESG data, and such ESG data often lacks standardization, consistency and transparency.
6. COMMITMENTS AND CONTINGENCIES
Under the Trusts’ organizational documents, their Trustees and Officers are indemnified against certain liabilities arising out of the performance of their duties to the Trusts. In addition, in the normal course of business, the Funds may enter into contracts and agreements that contain a variety of representations and warranties, which provide general indemnifications. The maximum exposure to the Funds under these arrangements is unknown, as this would involve future claims that may be made against a Fund that have not yet occurred. However, based on experience, the Funds had no prior claims or losses and expect the risks of loss to be remote.
7. RISKS ASSOCIATED WITH HIGH YIELD SECURITIES
Investing in high yield securities involves greater risks and considerations not typically associated with U.S. Government and other high quality/investment grade securities. High yield securities are generally below investment grade securities and do not have an established retail secondary market. Economic downturns may disrupt the high yield market and impair the issuer’s ability to repay principal and interest. Also, an increase in interest rates would likely have an adverse impact on the value of such obligations and could cause the securities to become less liquid.
8. MASTER NETTING AGREEMENTS
The Funds may enter into master netting agreements with their counterparties for the Securities Lending Program and Repurchase Agreements, which provide the right, in the event of default (including bankruptcy or insolvency) for the non-defaulting party to liquidate the collateral and calculate net exposure to the defaulting party or request additional collateral. For financial reporting purposes, the Funds do not offset financial assets and financial liabilities that are subject to master netting agreements in the Statement of Assets and Liabilities. For securities lending transactions, see Note 4.
The following table is a summary of the Funds’ open Repurchase Agreements that are subject to a master netting agreement as of June 30, 2024:
41
| | |
| | Notes to Financial Statements (continued) |
| | | | | | | | | | | | | | | | | | |
| | | | | | Gross Amount Not Offset in the
Statement of Assets and Liabilities | | | | | | | |
| Fund | | Gross Amounts of
Assets Presented in
the Statement of Assets and Liabilities | | | Offset Amount | | Net
Asset
Balance | | | Collateral
Received | | | Net
Amount | |
| | | | | |
ESG Bond | | | | | | | | | | | | | | | | | | |
| | | | | |
State of Wisconsin Investment Board | | | $16,825,095 | | | — | | | $16,825,095 | | | | $16,825,095 | | | | — | |
| | | | | |
Fixed Income Clearing Corp. | | | 3,468,000 | | | — | | | 3,468,000 | | | | 3,468,000 | | | | — | |
| | | | | | | | | | | | | | | | | | |
| | | | | |
Total | | | $20,293,095 | | | — | | | $20,293,095 | | | | $20,293,095 | | | | — | |
| | | | | | | | | | | | | | | | | | |
| | | | | |
Municipal Bond | | | | | | | | | | | | | | | | | | |
| | | | | |
Fixed Income Clearing Corp. | | | $6,462,000 | | | — | | | $6,462,000 | | | | $6,462,000 | | | | — | |
| | | | | |
Municipal Enhanced | | | | | | | | | | | | | | | | | | |
| | | | | |
Fixed Income Clearing Corp. | | | $271,000 | | | — | | | $271,000 | | | | $271,000 | | | | — | |
9. SUBSEQUENT EVENTS
The Funds have determined that no material events or transactions occurred through the issuance date of the Funds’ financial statements which require an additional disclosure in or adjustment of the Funds’ financial statements.
42
| | |
| | Other Information (unaudited) |
ITEM 8. CHANGES IN AND DISAGREEMENTS WITH ACCOUNTANTS FOR OPEN-END MANAGEMENT INVESTMENT COMPANIES
During the six months ended June 30, 2024, there were no changes in and/or disagreements with accountants.
ITEM 9. PROXY DISCLOSURES FOR OPEN-END MANAGEMENT INVESTMENT COMPANIES
Not applicable.
ITEM 10. REMUNERATION PAID TO DIRECTORS, OFFICERS, AND OTHERS OF OPEN-END MANAGEMENT INVESTMENT COMPANIES
The remuneration paid to the Trustees during the six months ended June 30, 2024, is reflected as “Trustee fees and expenses” on the Statement of Operations and is set forth in the table below. There was no remuneration paid to any Fund officer or to any affiliated person of any Fund Trustee or officer during the six months ended June 30, 2024.
| | | | |
| | | Trustee fees and expenses | |
| |
AMG GW&K ESG Bond Fund | | | $15,790 | |
| |
AMG GW&K Enhanced Core Bond ESG Fund | | | 1,420 | |
| |
AMG GW&K High Income Fund | | | 410 | |
| |
AMG GW&K Municipal Bond Fund | | | 38,866 | |
| |
AMG GW&K Municipal Enhanced Yield Fund | | | 8,098 | |
43
| | |
| | ITEM 11. STATEMENT REGARDING BASIS FOR APPROVAL OF INVESTMENT ADVISORY CONTRACT |
| | | | | | | | |
AMG GW&K Municipal Enhanced Yield Fund, AMG GW&K Municipal Bond Fund, AMG GW&K Enhanced Core Bond ESG Fund, AMG GW&K ESG Bond Fund, and AMG GW&K High Income Fund: Approval of Investment Management and Subadvisory Agreements on June 12, 2024 At an in-person meeting held on June 12, 2024, the Board of Trustees (the “Board” or the “Trustees”) of each of AMG Funds, AMG Funds II, and AMG Funds III (each, a “Trust” and collectively, the “Trusts”), and separately a majority of the Trustees who are not “interested persons” of the Trusts (the “Independent Trustees”), approved (i) the Investment Management Agreement, as amended pursuant to letter agreements at any time prior to the date of the meeting, with AMG Funds LLC (the “Investment Manager”) and AMG Funds for each of AMG GW&K Municipal Enhanced Yield Fund and AMG GW&K Municipal Bond Fund, and separately each of Amendment No. 1 thereto dated July 1, 2015, and Amendment No. 2 thereto dated October 1, 2016; the Investment Management Agreement, as amended pursuant to letter agreements at any time prior to the date of the meeting, with the Investment Manager and AMG Funds II for AMG GW&K Enhanced Core Bond ESG Fund, and separately each of Amendment No. 1 thereto, Amendment No. 2 thereto dated July 1, 2015, and Amendment No. 3 thereto dated October 1, 2016; and the Fund Management Agreement, as amended pursuant to letter agreements at any time prior to the date of the meeting, with the Investment Manager and AMG Funds III for AMG GW&K ESG Bond Fund and AMG GW&K High Income Fund, and separately each of Amendment No. 1 thereto dated July 1, 2015, and Amendment No. 2 thereto dated October 1, 2016 (collectively, the “Investment Management Agreements”); and (ii) the Subadvisory Agreement with respect to each of AMG GW&K Municipal Enhanced Yield Fund, AMG GW&K Municipal Bond Fund, AMG GW&K Enhanced Core Bond ESG Fund, AMG GW&K ESG Bond Fund, and AMG GW&K High Income Fund (each, a “Fund,” and collectively, the “Funds”), as amended at any time prior to the date of the meeting (collectively, the “Subadvisory Agreements”), with GW&K Investment Management, LLC, the Funds’ subadviser (the “Subadviser”). The Independent Trustees were separately represented by independent legal counsel in connection with their consideration of the approval of these agreements. In considering the Investment Management Agreements and the Subadvisory Agreements, the Trustees reviewed a variety of materials relating to each Fund, the Investment Manager and the Subadviser, including the nature, | | | | extent and quality of services, comparative performance, fee and expense information for an appropriate peer group of similar mutual funds for each Fund (each, a “Peer Group”), performance information for the relevant benchmark index for each Fund (each, a “Fund Benchmark”), other relevant matters, including management fees, the profitability of the Investment Manager and the Subadviser, and the potential for economies of scale that may be shared with the Funds, and other information provided to them on a periodic basis throughout the year. Prior to voting, the Independent Trustees: (a) reviewed the foregoing information with their independent legal counsel; (b) received materials from their independent legal counsel discussing the legal standards applicable to their consideration of the Investment Management Agreements and Subadvisory Agreements; and (c) met with their independent legal counsel in private sessions at which no representatives of management were present. NATURE, EXTENT AND QUALITY OF SERVICES In considering the nature, extent and quality of the services provided by the Investment Manager, the Trustees reviewed information provided by the Investment Manager at the June 12, 2024 meeting and prior meetings relating to the Investment Manager’s operations and personnel. Among other things, the Investment Manager provided financial information, information about its supervisory and professional staff and descriptions of its organizational and management structure. The Trustees also took into account information provided periodically throughout the previous year by the Investment Manager in Board meetings relating to the performance of its duties with respect to the Funds and the Trustees’ knowledge of the Investment Manager’s management and the quality of the performance of the Investment Manager’s duties under the Investment Management Agreements and Administration Agreement. In the course of their deliberations regarding the Investment Manager, the Trustees evaluated, among other things: (a) the extent and quality of the Investment Manager’s oversight of the operation and management of the Funds; (b) the quality of the Investment Manager’s oversight of the performance by the Subadviser of its portfolio management duties; (c) the Investment Manager’s ability to supervise the Funds’ other service providers; and (d) the Investment Manager’s compliance program. The Trustees also took into account that, in performing its functions under the Investment Management Agreements and | | | | supervising the Subadviser, the Investment Manager: performs periodic detailed analyses and reviews of the performance by the Subadviser of its obligations to each Fund, including without limitation, analysis and review of portfolio and other compliance matters and review of the Subadviser’s investment performance with respect to each Fund; prepares and presents periodic reports to the Board regarding the investment performance of the Subadviser and other information regarding the Subadviser, at such times and in such forms as the Board may reasonably request; reviews and considers any changes in the personnel of the Subadviser responsible for performing the Subadviser’s obligations and makes appropriate reports to the Board; reviews and considers any changes in the ownership or senior management of the Subadviser and makes appropriate reports to the Board; performs periodic in-person, telephonic or videoconference diligence meetings, including with respect to compliance matters, with representatives of the Subadviser; assists the Board and management of the Trusts in developing and reviewing information with respect to the initial approval of each Subadvisory Agreement and annual consideration of each Subadvisory Agreement thereafter; prepares recommendations with respect to the continued retention of the Subadviser or the replacement of the Subadviser, including at the request of the Board; identifies potential successors to, or replacements of, the Subadviser or potential additional subadvisers, including performing appropriate due diligence, and developing and presenting to the Board a recommendation as to any such successor, replacement, or additional subadviser, including at the request of the Board; designates and compensates from its own resources such personnel as the Investment Manager may consider necessary or appropriate to the performance of its services; and performs such other review and reporting functions as the Board shall reasonably request consistent with the Investment Management Agreements and applicable law. The Trustees noted the affiliation of the Subadviser with the Investment Manager, noting any potential conflicts of interest. The Trustees also took into account the financial condition of the Investment Manager with respect to its ability to provide the services required under the Investment Management Agreements and the Investment Manager’s undertaking to maintain contractual expense limitations for the Funds. The Trustees also considered the Investment Manager’s risk management processes. |
44
| | |
| | ITEM 11. STATEMENT REGARDING BASIS FOR APPROVAL OF INVESTMENT ADVISORY CONTRACT (continued) |
| | | | | | | | |
The Trustees also reviewed information relating to the Subadviser’s operations and personnel and the investment philosophy, strategies and techniques (its “Investment Strategy”) used in managing each Fund. Among other things, the Trustees reviewed information on portfolio management and other professional staff, information regarding the Subadviser’s organizational and management structure and the Subadviser’s brokerage policies and practices. The Trustees considered specific information provided regarding the experience of the individuals at the Subadviser with portfolio management responsibility for each Fund, including the information set forth in each Fund’s prospectus and statement of additional information. In the course of their deliberations, the Trustees evaluated, among other things: (a) the services rendered by the Subadviser in the past; (b) the qualifications and experience of the Subadviser’s personnel; and (c) the Subadviser’s compliance program. The Trustees also took into account the financial condition of the Subadviser with respect to its ability to provide the services required under each Subadvisory Agreement. The Trustees also considered the Subadviser’s risk management processes. PERFORMANCE The Board considered each Fund’s net performance during relevant time periods as compared to the Fund’s Peer Group and Fund Benchmark, considered the gross performance of each Fund as compared to the Subadviser’s relevant performance composite that utilizes a similar investment strategy and approach, and noted that the Board reviews on a quarterly basis detailed information about both a Fund’s performance results and portfolio composition, as well as the Subadviser’s Investment Strategy. The Board was mindful of the Investment Manager’s expertise, resources, and attention to monitoring the Subadviser’s performance, investment style and risk-adjusted performance with respect to the Funds and its discussions with the management of the Funds’ subadviser during the period regarding the factors that contributed to the performance of the Funds. With respect to AMG GW&K Municipal Enhanced Yield Fund, among other information relating to the Fund’s performance, the Trustees noted that the Fund’s performance for Class I shares (which share class has the earliest inception date and the largest amount of assets of all the share classes of the Fund) for the 1-year, 3-year, 5-year and 10-year periods ended March 31, 2024, was below, below, below, and above, respectively, the median performance of the Peer Group and above, below, | | | | below, and below, respectively, the performance of the Fund Benchmark, the Bloomberg U.S. Municipal Bond BAA Index. The Trustees took into account management’s discussion of the Fund’s performance, including the reasons for the Fund’s recent outperformance relative to the Fund Benchmark and longer-term underperformance relative to the Fund Benchmark and the Peer Group. The Trustees also took into account the fact that Class I shares of the Fund ranked in the top percentile relative to the Peer Group for the 2023 calendar year and in the top decile relative to the Peer Group for the 2020 and 2019 calendar years. The Trustees concluded that the Fund’s overall performance has been satisfactory in light of the Fund’s investment objective, strategies and policies. With respect to AMG GW&K Municipal Bond Fund, among other information relating to the Fund’s performance, the Trustees noted that the Fund’s performance for Class I shares (which share class has the largest amount of assets of all the share classes of the Fund) for the 1-year, 3-year, 5-year, and 10-year periods ended March 31, 2024, was below, below, below, and above, respectively, the median performance of the Peer Group and above, below, below, and below, respectively, the performance of the Fund Benchmark, the Bloomberg 10-Year Municipal Bond Index. The Trustees took into account management’s discussion of the Fund’s performance, including the reasons for the Fund’s recent outperformance relative to the Fund Benchmark and longer-term underperformance relative to the Fund Benchmark and the Peer Group. The Trustees also took into account the fact that Class I shares of the Fund ranked in the top third relative to its Peer Group for the 10-year period and that the Fund ranked in the top half of its Peer Group for the 2022 and 2023 calendar years. The Trustees concluded that the Fund’s overall performance has been satisfactory in light of the Fund’s investment objective, strategies and policies. With respect to AMG GW&K Enhanced Core Bond ESG Fund, among other information relating to the Fund’s performance, the Trustees noted that the Fund’s performance for Class N shares (which share class has one of the earliest inception dates and the largest amount of assets of all the share classes of the Fund with that inception date) for the 1-year, 3-year, 5-year and 10-year periods ended March 31, 2024, was below the median performance of the Peer Group and above, below, above, and below, respectively, the performance of the Fund Benchmark, the Bloomberg U.S. Aggregate Bond Index. The Trustees took into account management’s discussion of the Fund’s performance, including the | | | | reasons for the Fund’s underperformance relative to the Peer Group and more recent outperformance relative to the Fund Benchmark. The Trustees also took into account management’s recommendation to liquidate the Fund effective on or around September 11, 2024, which was approved by the Board. With respect to AMG GW&K ESG Bond Fund, among other information relating to the Fund’s performance, the Trustees noted that the Fund’s performance for Class N shares (which share class has the earliest inception date and the largest amount of assets of all the share classes of the Fund) for the 1-year, 3-year, 5-year and 10-year periods ended March 31, 2024, was below, above, above, and above, respectively, the median performance of the Peer Group and above the performance of the Fund Benchmark, the Bloomberg U.S. Aggregate Bond Index. The Trustees took into account management’s discussion of the Fund’s performance, including the reasons for the Fund’s outperformance relative to the Fund Benchmark and longer-term outperformance relative to the Peer Group. The Trustees also took into account the fact that the Fund’s subadviser, investment strategy, and Fund Benchmark changed effective March 19, 2021, and that the performance information prior to that date reflected that of the Fund’s prior subadviser and investment strategy. The Trustees considered management’s discussion that the Fund’s performance has been in line with management’s expectations since the current Subadviser assumed subadvisory responsibilities. The Trustees concluded that the Fund’s overall performance has been satisfactory. With respect to AMG GW&K High Income Fund, among other information relating to the Fund’s performance, the Trustees noted that the Fund’s performance for Class N shares (which share class has the earliest inception date of all the share classes of the Fund) for the 1-year, 3-year, 5-year and 10-year periods ended March 31, 2024, was below, below, above, and below, respectively, the median performance of the Peer Group and below, below, above, and below, respectively, the performance of the Fund Benchmark, the Bloomberg U.S. High Yield 1-5 Year Ba Index. The Trustees took into account management’s discussion of the Fund’s performance, including the reasons for the Fund’s more recent underperformance relative to the Peer Group and the Fund Benchmark and the fact that Class N shares of the Fund ranked in the top quintile relative to its Peer Group for the 5-year period. The Trustees also took into account the fact that the Fund’s subadviser, investment strategy, and Fund Benchmark changed effective December 4, 2020, |
45
| | |
| | ITEM 11. STATEMENT REGARDING BASIS FOR APPROVAL OF INVESTMENT ADVISORY CONTRACT (continued) |
| | | | | | | | |
and that the performance information prior to that date reflected that of the Fund’s prior subadviser and investment strategy. The Trustees also took into account management’s recommendation to liquidate the Fund effective on or around September 11, 2024, which was approved by the Board. ADVISORY AND SUBADVISORY FEES; FUND EXPENSES; PROFITABILITY; AND ECONOMIES OF SCALE In considering the reasonableness of the advisory fee payable to the Investment Manager, the Trustees reviewed information provided by the Investment Manager at the June 12, 2024 meeting and prior meetings setting forth all revenues and other benefits, both direct and indirect (including any so-called “fallout benefits” such as reputational value derived from the Investment Manager serving as Investment Manager to a Fund), received by the Investment Manager and its affiliates attributable to managing each Fund and all the mutual funds in the AMG Funds Family of Funds; the cost of providing such services; the significant risks undertaken as Investment Manager and sponsor of the Funds, including investment, operational, enterprise, entrepreneurial, litigation, regulatory and compliance risks; and the resulting profitability to the Investment Manager and its affiliates from these relationships. The Trustees also considered the amount of the advisory fee retained by the Investment Manager after payment of the subadvisory fee with respect to each Fund. The Trustees also noted payments are made from the Subadviser to the Investment Manager, and other payments are made from the Investment Manager to the Subadviser. The Trustees also considered management’s discussion of the current asset levels of the Funds, and the impact on profitability of both the current asset levels and any future growth of assets of the Funds. In considering the cost of services to be provided by the Investment Manager under each Investment Management Agreement and the profitability to the Investment Manager of its relationship with each Fund, the Trustees noted the undertaking by the Investment Manager to maintain contractual expense limitations for the Funds. The Board also took into account management’s discussion of the advisory fee structure, and the services the Investment Manager provides in performing its functions under each Investment Management Agreement and supervising the Subadviser. Based on the foregoing, the Trustees concluded that the profitability to the Investment Manager is reasonable and that the Investment Manager is not realizing material benefits from economies of scale that would | | | | warrant adjustments to the advisory fee at this time. Also with respect to economies of scale, the Trustees noted that as each Fund’s assets increase over time, the Fund may realize other economies of scale to the extent the increase in assets is proportionally greater than the increase in certain other expenses. In considering the reasonableness of the subadvisory fees payable by the Investment Manager to the Subadviser, the Trustees reviewed information regarding the cost to the Subadviser of providing subadvisory services to each Fund and the resulting profitability from these relationships. The Trustees noted that, because the Subadviser is an affiliate of the Investment Manager, a portion of the Subadviser’s revenues or profits might be shared directly or indirectly with the Investment Manager. The Trustees also noted that the subadvisory fees are paid by the Investment Manager out of its advisory fee. The Board also took into account management’s discussion of the subadvisory fee structure, and the services the Subadviser provides in performing its functions under each Subadvisory Agreement. Based on the foregoing, the Trustees concluded that the profitability to the Subadviser is reasonable and that the Subadviser is not realizing material benefits from economies of scale that would warrant adjustments to the subadvisory fees at this time. Also with respect to economies of scale, the Trustees noted that as a Fund’s assets increase over time, the Fund may realize other economies of scale to the extent the increase in assets is proportionally greater than the increase in certain other expenses. With respect to AMG GW&K Municipal Enhanced Yield Fund, the Trustees noted that the management fees (which include both the advisory and administration fees) and total expenses (net of applicable expense waivers/reimbursements) of Class I shares (the class of shares which is the primary focus of the Fund’s distribution) of the Fund as of March 31, 2024, were rated in the High and the Above Average rating level, respectively, of the Fund’s Peer Group. The Trustees noted that the rating levels corresponded to the Fund’s quintile ranking in its Peer Group. The Trustees took into account the fact that the Investment Manager has contractually agreed, through May 1, 2025, to limit the Fund’s net annual operating expenses (subject to certain excluded expenses) to 0.59%. The Board also took into account management’s discussion of the Fund’s expenses and competitiveness with comparably sized funds and select competitors. The Trustees concluded that, in light of the nature, extent and quality of the services provided by the Investment Manager and the Subadviser (which is an affiliate of | | | | the Investment Manager), the foregoing expense limitation and the considerations noted above with respect to the Investment Manager and the Subadviser, the Fund’s advisory and subadvisory fees are reasonable. With respect to AMG GW&K Municipal Bond Fund, the Trustees noted that the management fees (which include both the advisory and administration fees) and total expenses (net of applicable expense waivers/reimbursements) of Class I shares (the class of shares which is the primary focus of the Fund’s distribution) of the Fund as of March 31, 2024, were rated in the Below Average and the Low rating level, respectively, of the Fund’s Peer Group. The Trustees noted that the rating levels corresponded to the Fund’s quintile ranking in its Peer Group. The Trustees took into account the fact that the Investment Manager has contractually agreed, through May 1, 2025, to limit the Fund’s net annual operating expenses (subject to certain excluded expenses) to 0.34%. The Trustees concluded that, in light of the nature, extent and quality of the services provided by the Investment Manager and the Subadviser (which is an affiliate of the Investment Manager), the foregoing expense limitation and the considerations noted above with respect to the Investment Manager and the Subadviser, the Fund’s advisory and subadvisory fees are reasonable. With respect to AMG GW&K Enhanced Core Bond ESG Fund, the Trustees noted that the management fees (which include both the advisory and administration fees) and total expenses (net of applicable expense waivers/reimbursements) of Class I shares (the class of shares which is the primary focus of the Fund’s distribution) of the Fund as of March 31, 2024, were rated in the Average and the Above Average rating level, respectively, of the Fund’s Peer Group. The Trustees noted that the rating levels corresponded to the Fund’s quintile ranking in its Peer Group. The Trustees took into account the fact that the Investment Manager has contractually agreed, through May 1, 2025, to limit the Fund’s net annual operating expenses (subject to certain excluded expenses) to 0.48%. The Trustees also took into account management’s discussion of the Fund’s expenses, including fees and expenses relative to comparably sized funds and select competitors, and the Fund’s small size relative to its peer universe. The Trustees concluded that, in light of the nature, extent and quality of the services provided by the Investment Manager and the Subadviser (which is an affiliate of the Investment Manager), the foregoing expense limitation and the considerations noted |
| | | | | | | | |
| | | | | | | | |
46
| | |
| | ITEM 11. STATEMENT REGARDING BASIS FOR APPROVAL OF INVESTMENT ADVISORY CONTRACT (continued) |
| | | | | | | | |
above with respect to the Investment Manager and the Subadviser, the Fund’s advisory and subadvisory fees are reasonable. With respect to AMG GW&K ESG Bond Fund, the Trustees noted that the management fees (which include both the advisory and administration fees) and total expenses (net of applicable expense waivers/reimbursements) of Class I shares (the class of shares which is the primary focus of the Fund’s distribution) of the Fund as of March 31, 2024, were rated in the Below Average and the Average rating level, respectively, of the Peer Group. The Trustees noted that the rating levels corresponded to the Fund’s quintile ranking in its Peer Group. The Trustees took into account the fact that the Investment Manager has contractually agreed, through May 1, 2025, to limit the Fund’s net annual operating expenses (subject to certain excluded expenses) to 0.43%. The Trustees concluded that, in light of the nature, extent and quality of the services provided by the Investment Manager and the Subadviser (which is an affiliate of the Investment Manager), the foregoing expense limitation and the considerations noted above with respect to the Investment Manager and the Subadviser, the Fund’s advisory and subadvisory fees are reasonable. With respect to AMG GW&K High Income Fund, the Trustees noted that the management fees (which include both the advisory and administration fees) and total expenses (net of applicable expense | | | | waivers/reimbursements) of Class I shares (the class of shares which is the primary focus of the Fund’s distribution) of the Fund as of March 31, 2024, were rated in the Below Average and the Average rating level, respectively, of the Peer Group. The Trustees noted that the rating level corresponded to the Fund’s quintile ranking in its Peer Group. The Trustees took into account the fact that the Investment Manager has contractually agreed, through May 1, 2025, to limit the Fund’s net annual operating expenses (subject to certain excluded expenses) to 0.59%. The Trustees concluded that, in light of the nature, extent and quality of the services provided by the Investment Manager and the Subadviser (which is an affiliate of the Investment Manager), the foregoing expense limitation and the considerations noted above with respect to the Investment Manager and the Subadviser, the Fund’s advisory and subadvisory fees are reasonable. PROPOSED LIQUIDATION OF AMG GW&K ENHANCED CORE BOND ESG FUND AND AMG GW&K HIGH INCOME FUND The Trustees also considered and approved a proposal by management to liquidate AMG GW&K Enhanced Core Bond ESG Fund and AMG GW&K High Income Fund on or around September 11, 2024. The Trustees noted that, although such proposal was approved by the Trustees, renewal of the Investment Management Agreements and Subadvisory Agreements relating to such Funds needed to be | | | | considered since the terms of such agreements otherwise would have expired prior to July 1, 2024. * * * * After consideration of the foregoing, the Trustees also reached the following conclusions (in addition to the conclusions discussed above) regarding the Investment Management and Subadvisory Agreements: (a) the Investment Manager and the Subadviser have demonstrated that they possess the capability and resources to perform the duties required of them under each Investment Management Agreement and each Subadvisory Agreement and (b) the Investment Manager and Subadviser maintain appropriate compliance programs. Based on all of the above-mentioned factors and their related conclusions, with no single factor or conclusion being determinative and with each Trustee not necessarily attributing the same weight to each factor, the Trustees concluded that approval of each Investment Management Agreement and each Subadvisory Agreement would be in the best interests of the applicable Fund and its shareholders. Accordingly, on June 12, 2024, the Trustees, and separately a majority of the Independent Trustees, voted to approve the Investment Management Agreement and the Subadvisory Agreement for each Fund. |
| | | | | | | | |
| | | | | | | | |
47
THIS PAGE INTENTIONALLY LEFT BLANK
| | |
| | |
| | | | |
INVESTMENT MANAGER AND ADMINISTRATOR AMG Funds LLC 680 Washington Blvd., Suite 500 Stamford, CT 06901 800.548.4539 DISTRIBUTOR AMG Distributors, Inc. 680 Washington Blvd., Suite 500 Stamford, CT 06901 800.548.4539 SUBADVISER GW&K Investment Management, LLC 222 Berkeley St. Boston, MA 02116 CUSTODIAN The Bank of New York Mellon Mutual Funds Custody 240 Greenwich Street New York, NY 10286 LEGAL COUNSEL Ropes & Gray LLP Prudential Tower, 800 Boylston Street Boston, MA 02199-3600 | | TRANSFER AGENT BNY Mellon Investment Servicing (US) Inc. AMG Funds Attn: 534426 AIM 154-0520 500 Ross Street Pittsburgh, PA 15262 800.548.4539 TRUSTEES Jill R. Cuniff Kurt A. Keilhacker Peter W. MacEwen Steven J. Paggioli Eric Rakowski Victoria L. Sassine Garret W. Weston | | This report is prepared for the Funds’ shareholders. It is authorized for distribution to prospective investors only when preceded or accompanied by an effective prospectus. To receive a free copy of the prospectus or Statement of Additional Information, which includes additional information about Fund Trustees, please contact us by calling 800.548.4539. Distributed by AMG Distributors, Inc., member FINRA/SIPC. Current net asset values per share for each Fund are available on the Funds’ website at wealth.amg.com. A description of the policies and procedures each Fund uses to vote its proxies is available: (i) without charge, upon request, by calling 800.548.4539, or (ii) on the Securities and Exchange Commission’s (SEC) website at sec.gov. For information regarding each Fund’s proxy voting record for the 12-month period ended June 30, call 800.548.4539 or visit the SEC website at sec.gov. The Funds file their complete schedule of portfolio holdings with the SEC for the first and third quarters of each fiscal year as an exhibit to their reports on Form N-PORT. The Funds’ portfolio holdings on Form N-PORT are available on the SEC’s website at sec.gov and the Funds’ website at wealth.amg.com. To review a complete list of the Funds’ portfolio holdings, or to view the most recent semi-annual report or annual report, please visit wealth.amg.com. |
| | |
 | | |
| | | | | | |
EQUITY FUNDS AMG Boston Common Global Impact Boston Common Asset Management, LLC AMG Frontier Small Cap Growth Frontier Capital Management Co., LLC AMG GW&K Small Cap Core AMG GW&K Small Cap Value AMG GW&K Small/Mid Cap Core AMG GW&K Small/Mid Cap Growth AMG GW&K International Small Cap GW&K Investment Management, LLC AMG Montrusco Bolton Large Cap Growth Montrusco Bolton Investments, Inc. AMG Renaissance Large Cap Growth The Renaissance Group LLC | | | | AMG River Road Dividend All Cap Value AMG River Road Focused Absolute Value AMG River Road Large Cap Value Select AMG River Road Mid Cap Value AMG River Road Small-Mid Cap Value AMG River Road Small Cap Value River Road Asset Management, LLC AMG TimesSquare Emerging Markets Small Cap AMG TimesSquare Global Small Cap AMG TimesSquare International Small Cap AMG TimesSquare Mid Cap Growth AMG TimesSquare Small Cap Growth TimesSquare Capital Management, LLC AMG Veritas Asia Pacific AMG Veritas China AMG Veritas Global Focus AMG Veritas Global Real Return Veritas Asset Management LLP AMG Yacktman AMG Yacktman Focused AMG Yacktman Global AMG Yacktman Special Opportunities Yacktman Asset Management LP | | FIXED INCOME FUNDS AMG Beutel Goodman Core Plus Bond Beutel, Goodman & Company Ltd. AMG GW&K Core Bond ESG AMG GW&K ESG Bond AMG GW&K Municipal Bond AMG GW&K Municipal Enhanced Yield GW&K Investment Management, LLC ALTERNATIVE FUNDS AMG Systematica Managed Futures Strategy Systematica Investments Limited, acting as general partner of Systematica Investments LP |
| | | | | | | |
| | | | | | | |
| | | | | | | |
| | | | | | | |
| | | | | | |
| | | | | | | |
| | | |
| wealth.amg.com | | 063024 | | | SAR088 | |
| | |
| | SEMI-ANNUAL REPORT |
| | | |
| | | | | | |
| | | AMG Funds |
| | | | |
| | | June 30, 2024 | | | | |
| | |
| | |  |
| | |
| | | AMG Renaissance Large Cap Growth Fund |
| | | Class N: MRLTX | | Class I: MRLSX | | Class Z: MRLIX |
| | | | | | | |
| | | | |
| | | | | |
wealth.amg.com | | 063024 | | SAR024 |
| | |
| | | |
| | | AMG Funds Semi-Annual Report — June 30, 2024 (unaudited) |
Nothing contained herein is to be considered an offer, sale or solicitation of an offer to buy shares of any series of the AMG Funds Family of Funds. Such offering is made only by prospectus, which includes details as to offering price and other material information.
| | |
| | AMG Renaissance Large Cap Growth Fund Schedule of Portfolio Investments (unaudited) June 30, 2024 |
| | | | | | | | |
| | | Shares | | | Value | |
| | |
Common Stocks - 99.2% | | | | | | | | |
| | |
Communication Services - 6.7% | | | | | | | | |
| | |
Alphabet, Inc., Class A | | | 18,632 | | | | $3,393,819 | |
| | |
Meta Platforms, Inc., Class A | | | 6,222 | | | | 3,137,257 | |
| | |
Netflix, Inc.* | | | 3,922 | | | | 2,646,879 | |
| | |
Total Communication Services | | | | | | | 9,177,955 | |
| |
Consumer Discretionary - 12.4% | | | | | |
| | |
Airbnb, Inc., Class A* | | | 16,416 | | | | 2,489,158 | |
| | |
Amazon.com, Inc.* | | | 18,800 | | | | 3,633,100 | |
| | |
Lowe’s Cos., Inc. | | | 9,717 | | | | 2,142,210 | |
| | |
Lululemon Athletica, Inc. (Canada)* | | | 5,018 | | | | 1,498,877 | |
| | |
Marriott International, Inc., Class A | | | 9,565 | | | | 2,312,530 | |
| | |
O’Reilly Automotive, Inc.* | | | 2,213 | | | | 2,337,061 | |
| | |
Royal Caribbean Cruises, Ltd.* | | | 15,571 | | | | 2,482,484 | |
| | |
Total Consumer Discretionary | | | | | | | 16,895,420 | |
| |
Consumer Staples - 3.3% | | | | | |
| | |
BJ’s Wholesale Club Holdings, Inc.* | | | 26,845 | | | | 2,358,065 | |
| | |
Target Corp. | | | 14,758 | | | | 2,184,774 | |
| | |
Total Consumer Staples | | | | | | | 4,542,839 | |
| |
Energy - 1.6% | | | | | |
| | |
EOG Resources, Inc. | | | 17,704 | | | | 2,228,403 | |
| |
Financials - 10.7% | | | | | |
| | |
Arch Capital Group, Ltd. (Bermuda)* | | | 24,141 | | | | 2,435,586 | |
| | |
Everest Group, Ltd. (Bermuda) | | | 5,205 | | | | 1,983,209 | |
| | |
Fiserv, Inc.* | | | 15,857 | | | | 2,363,327 | |
| | |
Mastercard, Inc., Class A | | | 5,029 | | | | 2,218,594 | |
| | |
PayPal Holdings, Inc.* | | | 26,577 | | | | 1,542,263 | |
| | |
Visa, Inc., Class A1 | | | 8,438 | | | | 2,214,722 | |
| | |
WEX, Inc.* | | | 10,631 | | | | 1,883,175 | |
| | |
Total Financials | | | | | | | 14,640,876 | |
| |
Health Care - 15.0% | | | | | |
| | |
Cencora, Inc. | | | 10,172 | | | | 2,291,752 | |
| | |
Chemed Corp. | | | 4,203 | | | | 2,280,464 | |
| | |
Danaher Corp. | | | 9,332 | | | | 2,331,600 | |
| | |
HCA Healthcare, Inc. | | | 7,268 | | | | 2,335,063 | |
| | |
ICON PLC (Ireland)* | | | 7,358 | | | | 2,306,512 | |
| | |
McKesson Corp. | | | 4,093 | | | | 2,390,476 | |
| | |
The Cigna Group | | | 6,569 | | | | 2,171,514 | |
| | |
Thermo Fisher Scientific, Inc. | | | 3,456 | | | | 1,911,168 | |
| | |
Vertex Pharmaceuticals, Inc.* | | | 5,099 | | | | 2,390,003 | |
| | |
Total Health Care | | | | | | | 20,408,552 | |
| |
Industrials - 12.9% | | | | | |
| | |
Cintas Corp. | | | 3,463 | | | | 2,425,000 | |
| | | | | | | | |
| | | Shares | | | Value | |
| | |
Ferguson PLC (United Kingdom) | | | 11,337 | | | | $2,195,410 | |
| | |
Honeywell International, Inc. | | | 11,554 | | | | 2,467,241 | |
| | |
Illinois Tool Works, Inc. | | | 7,296 | | | | 1,728,860 | |
| | |
Lincoln Electric Holdings, Inc. | | | 9,417 | | | | 1,776,423 | |
| | |
Quanta Services, Inc. | | | 8,842 | | | | 2,246,664 | |
| | |
Waste Management, Inc. | | | 11,877 | | | | 2,533,839 | |
| | |
WW Grainger, Inc. | | | 2,478 | | | | 2,235,751 | |
| | |
Total Industrials | | | | | | | 17,609,188 | |
| |
Information Technology - 33.2% | | | | | |
| | |
Adobe, Inc.* | | | 3,747 | | | | 2,081,608 | |
| | |
Amphenol Corp., Class A | | | 39,020 | | | | 2,628,777 | |
| | |
Apple, Inc. | | | 21,170 | | | | 4,458,825 | |
| | |
Applied Materials, Inc. | | | 13,406 | | | | 3,163,682 | |
| | |
Broadcom, Inc. | | | 2,148 | | | | 3,448,679 | |
| | |
Cadence Design Systems, Inc.* | | | 7,842 | | | | 2,413,376 | |
| | |
Gartner, Inc.* | | | 5,172 | | | | 2,322,538 | |
| | |
KLA Corp. | | | 3,905 | | | | 3,219,712 | |
| | |
Lam Research Corp. | | | 2,832 | | | | 3,015,655 | |
| | |
Microsoft Corp. | | | 9,744 | | | | 4,355,081 | |
| | |
Motorola Solutions, Inc. | | | 7,172 | | | | 2,768,751 | |
| | |
PTC, Inc.* | | | 13,233 | | | | 2,404,039 | |
| | |
QUALCOMM, Inc. | | | 11,341 | | | | 2,258,900 | |
| | |
Roper Technologies, Inc. | | | 4,108 | | | | 2,315,515 | |
| | |
salesforce.com, Inc. | | | 7,643 | | | | 1,965,015 | |
| | |
ServiceNow, Inc.* | | | 3,155 | | | | 2,481,944 | |
| | |
Total Information Technology | | | | | | | 45,302,097 | |
| |
Materials - 3.4% | | | | | |
| | |
Ecolab, Inc. | | | 10,165 | | | | 2,419,270 | |
| | |
The Sherwin-Williams Co. | | | 7,272 | | | | 2,170,183 | |
| | |
Total Materials | | | | | | | 4,589,453 | |
| | |
Total Common Stocks
(Cost $85,408,274) | | | | | | | 135,394,783 | |
| | |
Short-Term Investments - 0.8% | | | | | | | | |
| |
Other Investment Companies - 0.8% | | | | | |
| | |
Dreyfus Government Cash Management Fund, Institutional Shares, 5.19%2 | | | 457,937 | | | | 457,937 | |
| | |
Dreyfus Institutional Preferred Government Money Market Fund, Institutional Shares, 5.27%2 | | | 686,905 | | | | 686,905 | |
| |
Total Short-Term Investments
(Cost $1,144,842) | | | | 1,144,842 | |
| |
Total Investments - 100.0%
(Cost $86,553,116) | | | | 136,539,625 | |
| |
Other Assets, less Liabilities - (0.0)%# | | | | (18,890 | ) |
| |
Net Assets - 100.0% | | | | $136,520,735 | |
The accompanying notes are an integral part of these financial statements.
2
| | |
| | AMG Renaissance Large Cap Growth Fund Schedule of Portfolio Investments (continued) |
| * | Non-income producing security. |
| 1 | Some of this security, amounting to $2,192,412 or 1.6% of net assets, was out on loan to various borrowers and is collateralized by various U.S. Treasury Obligations. See Note 4 of Notes to Financial Statements. |
| 2 | Yield shown represents the June 30, 2024, seven day average yield, which refers to the sum of the previous seven days’ dividends paid, expressed as an annual percentage. |
The following table summarizes the inputs used to value the Fund’s investments by the fair value hierarchy levels as of June 30, 2024:
| | | | | | | | | | | | | | | | | | | | |
| | | Level 1 | | Level 2 | | Level 3 | | Total |
| | | | |
Investments in Securities | | | | | | | | | | | | | | | | | | | | |
| | | | |
Common Stocks† | | | $ | 135,394,783 | | | | | — | | | | | — | | | | $ | 135,394,783 | |
| | | | |
Short-Term Investments | | | | | | | | | | | | | | | | | | | | |
| | | | |
Other Investment Companies | | | | 1,144,842 | | | | | — | | | | | — | | | | | 1,144,842 | |
| | | | | | | | | | | | | | | | | | | | |
| | | | |
Total Investments in Securities | | | $ | 136,539,625 | | | | | — | | | | | — | | | | $ | 136,539,625 | |
| | | | | | | | | | | | | | | | | | | | |
| | † | All common stocks held in the Fund are Level 1 securities. For a detailed breakout of common stocks by major industry classification, please refer to the Fund’s Schedule of Portfolio Investments. |
For the six months ended June 30, 2024, there were no transfers in or out of Level 3.
The accompanying notes are an integral part of these financial statements.
3
| | |
| | Statement of Assets and Liabilities (unaudited) June 30, 2024 |
| | | | |
| | | AMG Renaissance
Large Cap
Growth Fund |
| |
Assets: | | | | |
| |
Investments at value1 (including securities on loan valued at $2,192,412) | | | $136,539,625 | |
| |
Dividend and interest receivables | | | 60,840 | |
| |
Securities lending income receivable | | | 193 | |
| |
Receivable for Fund shares sold | | | 20,846 | |
| |
Receivable from affiliate | | | 11,090 | |
| |
Prepaid expenses and other assets | | | 26,886 | |
| |
Total assets | | | 136,659,480 | |
| |
Liabilities: | | | | |
| |
Payable for Fund shares repurchased | | | 5,157 | |
| |
Accrued expenses: | | | | |
| |
Investment advisory and management fees | | | 53,692 | |
| |
Administrative fees | | | 16,676 | |
| |
Distribution fees | | | 13,767 | |
| |
Shareholder service fees | | | 7,228 | |
| |
Other | | | 42,225 | |
| |
Total liabilities | | | 138,745 | |
|
Commitments and Contingencies (Notes 2 & 6) | |
| |
Net Assets | | | $136,520,735 | |
| |
1 Investments at cost | | | $86,553,116 | |
The accompanying notes are an integral part of these financial statements.
4
| | |
| | Statement of Assets and Liabilities (continued) |
| | | | |
| | | AMG Renaissance
Large Cap Growth Fund |
| |
Net Assets Represent: | | | | |
| |
Paid-in capital | | | $76,133,770 | |
| |
Total distributable earnings | | | 60,386,965 | |
| |
Net Assets | | | $136,520,735 | |
| |
Class N: | | | | |
| |
Net Assets | | | $67,609,248 | |
| |
Shares outstanding | | | 3,684,105 | |
| |
Net asset value, offering and redemption price per share | | | $18.35 | |
| |
Class I: | | | | |
| |
Net Assets | | | $43,785,253 | |
| |
Shares outstanding | | | 2,350,597 | |
| |
Net asset value, offering and redemption price per share | | | $18.63 | |
| |
Class Z: | | | | |
| |
Net Assets | | | $25,126,234 | |
| |
Shares outstanding | | | 1,376,128 | |
| |
Net asset value, offering and redemption price per share | | | $18.26 | |
The accompanying notes are an integral part of these financial statements.
5
| | |
| | Statement of Operations (unaudited) For the six months ended June 30, 2024 |
| | | | |
| | | AMG Renaissance
Large Cap
Growth Fund |
| |
Investment Income: | | | | |
| |
Dividend income | | | $509,052 | |
| |
Securities lending income | | | 1,187 | |
| |
Total investment income | | | 510,239 | |
| |
Expenses: | | | | |
| |
Investment advisory and management fees | | | 325,611 | |
| |
Administrative fees | | | 101,126 | |
| |
Distribution fees - Class N | | | 83,777 | |
| |
Shareholder servicing fees - Class N | | | 28,819 | |
| |
Shareholder servicing fees - Class I | | | 15,063 | |
| |
Registration fees | | | 22,420 | |
| |
Professional fees | | | 20,761 | |
| |
Custodian fees | | | 13,048 | |
| |
Reports to shareholders | | | 11,678 | |
| |
Transfer agent fees | | | 7,892 | |
| |
Trustee fees and expenses | | | 5,007 | |
| |
Interest expense | | | 2,190 | |
| |
Miscellaneous | | | 4,723 | |
| |
Total expenses before offsets | | | 642,115 | |
| |
Expense reimbursements | | | (67,313 | ) |
| |
Expense reductions | | | (1,076 | ) |
| |
Net expenses | | | 573,726 | |
| | | | |
| |
Net investment loss | | | (63,487 | ) |
| |
Net Realized and Unrealized Gain: | | | | |
| |
Net realized gain on investments | | | 9,665,251 | |
| |
Net change in unrealized appreciation/depreciation on investments | | | 4,179,924 | |
| |
Net realized and unrealized gain | | | 13,845,175 | |
| | | | |
| |
Net increase in net assets resulting from operations | | | $13,781,688 | |
The accompanying notes are an integral part of these financial statements.
6
| | |
| | Statements of Changes in Net Assets For the six months ended June 30, 2024 (unaudited) and the fiscal year ended December 31, 2023 |
| | | | | | | | |
| | | AMG Renaissance
Large Cap
Growth Fund |
| | |
| | | June 30, 2024 | | December 31, 2023 |
| | |
Increase in Net Assets Resulting From Operations: | | | | | | | | |
| | |
Net investment income (loss) | | | $(63,487 | ) | | | $243,832 | |
| | |
Net realized gain on investments | | | 9,665,251 | | | | 9,073,938 | |
| | |
Net change in unrealized appreciation/depreciation on investments | | | 4,179,924 | | | | 18,753,772 | |
| | |
Net increase in net assets resulting from operations | | | 13,781,688 | | | | 28,071,542 | |
| | |
Distributions to Shareholders: | | | | | | | | |
| | |
Class N | | | — | | | | (4,555,570 | ) |
| | |
Class I | | | — | | | | (3,137,397 | ) |
| | |
Class Z | | | — | | | | (1,750,282 | ) |
| | |
Total distributions to shareholders | | | — | | | | (9,443,249 | ) |
| | |
Capital Share Transactions:1 | | | | | | | | |
| | |
Net increase (decrease) from capital share transactions | | | (11,596,227 | ) | | | 12,471,195 | |
| | | | | | | | |
| | |
Total increase in net assets | | | 2,185,461 | | | | 31,099,488 | |
| | |
Net Assets: | | | | | | | | |
| | |
Beginning of period | | | 134,335,274 | | | | 103,235,786 | |
| | |
End of period | | | $136,520,735 | | | | $134,335,274 | |
| 1 | See Note 1(g) of the Notes to Financial Statements. |
The accompanying notes are an integral part of these financial statements.
7
| | |
| | AMG Renaissance Large Cap Growth Fund Financial Highlights For a share outstanding throughout each fiscal period |
| | | | | | | | | | | | | | | | | | | | | | | | | | | | | | |
| | | For the six | | | | | | | | | | |
| | | months ended | | For the fiscal years ended December 31, |
| Class N | | June 30, 2024
(unaudited) | | 2023 | | 2022 | | 2021 | | 2020 | | 2019 |
| | | | | | |
Net Asset Value, Beginning of Period | | | | $16.61 | | | | | $14.28 | | | | | $18.41 | | | | | $15.31 | | | | | $13.01 | | | | | $10.48 | |
| | | | | | |
Income (loss) from Investment Operations: | | | | | | | | | | | | | | | | | | | | | | | | | | | | | | |
| | | | | | |
Net investment income (loss)1,2 | | | | (0.02 | ) | | | | 0.01 | | | | | 0.03 | | | | | 0.00 | 3,4 | | | | 0.01 | | | | | 0.06 | |
| | | | | | |
Net realized and unrealized gain (loss) on investments | | | | 1.76 | | | | | 3.55 | | | | | (3.16 | ) | | | | 4.57 | | | | | 3.04 | | | | | 3.61 | |
| | | | | | |
Total income (loss) from investment operations | | | | 1.74 | | | | | 3.56 | | | | | (3.13 | ) | | | | 4.57 | | | | | 3.05 | | | | | 3.67 | |
| | | | | | |
Less Distributions to Shareholders from: | | | | | | | | | | | | | | | | | | | | | | | | | | | | | | |
| | | | | | |
Net investment income | | | | — | | | | | (0.01 | ) | | | | (0.02 | ) | | | | (0.00 | )3 | | | | (0.02 | ) | | | | (0.08 | ) |
| | | | | | |
Net realized gain on investments | | | | — | | | | | (1.22 | ) | | | | (0.98 | ) | | | | (1.47 | ) | | | | (0.73 | ) | | | | (1.06 | ) |
| | | | | | |
Total distributions to shareholders | | | | — | | | | | (1.23 | ) | | | | (1.00 | ) | | | | (1.47 | ) | | | | (0.75 | ) | | | | (1.14 | ) |
| | | | | | |
Net Asset Value, End of Period | | | | $18.35 | | | | | $16.61 | | | | | $14.28 | | | | | $18.41 | | | | | $15.31 | | | | | $13.01 | |
| | | | | | |
Total Return2,5 | | |
| 10.48
| %6
| | | | 25.04 | % | | | | (17.05 | )% | | | | 30.02 | % | | | | 23.54 | % | | | | 35.16 | % |
| | | | | | |
Ratio of net expenses to average net assets7 | | |
| 1.00
| %8,9
| | | | 1.00 | % | | | | 1.00 | % | | | | 1.00 | % | | | | 1.00 | % | | | | 1.00 | %9 |
| | | | | | |
Ratio of gross expenses to average net assets10 | | | | 1.10 | %8 | | | | 1.12 | % | | | | 1.15 | % | | | | 1.13 | % | | | | 1.19 | % | | | | 1.17 | % |
| | | | | | |
Ratio of net investment income (loss) to average net assets2 | | | | (0.25 | )%8 | | | | 0.05 | % | | | | 0.22 | % | | | | 0.00 | %11 | | | | 0.10 | % | | | | 0.48 | % |
| | | | | | |
Portfolio turnover | | | | 21 | %6 | | | | 35 | % | | | | 28 | % | | | | 18 | % | | | | 28 | % | | | | 40 | % |
| | | | | | |
Net assets end of period (000’s) omitted | | | | $67,609 | | | | | $65,422 | | | | | $56,264 | | | | | $79,490 | | | | | $67,688 | | | | | $63,900 | |
| | | | | | | | | | | | | | | | | | | | | | | | | | | | | | | |
8
| | |
| | AMG Renaissance Large Cap Growth Fund Financial Highlights For a share outstanding throughout each fiscal period |
| | | | | | | | | | | | | | | | | | | | | | | | | | | | | | |
| | | For the six | | | | | | | | | | |
| | | months ended | | For the fiscal years ended December 31, |
| Class I | | June 30, 2024
(unaudited) | | 2023 | | 2022 | | 2021 | | 2020 | | 2019 |
| | | | | | |
Net Asset Value, Beginning of Period | | | | $16.84 | | | | | $14.46 | | | | | $18.63 | | | | | $15.48 | | | | | $13.14 | | | | | $10.58 | |
| | | | | | |
Income (loss) from Investment Operations: | | | | | | | | | | | | | | | | | | | | | | | | | | | | | | |
| | | | | | |
Net investment income1,2 | | | | 0.00 | 3 | | | | 0.05 | | | | | 0.07 | | | | | 0.04 | 4 | | | | 0.05 | | | | | 0.09 | |
| | | | | | |
Net realized and unrealized gain (loss) on investments | | | | 1.79 | | | | | 3.60 | | | | | (3.19 | ) | | | | 4.62 | | | | | 3.07 | | | | | 3.64 | |
| | | | | | |
Total income (loss) from investment operations | | | | 1.79 | | | | | 3.65 | | | | | (3.12 | ) | | | | 4.66 | | | | | 3.12 | | | | | 3.73 | |
| | | | | | |
Less Distributions to Shareholders from: | | | | | | | | | | | | | | | | | | | | | | | | | | | | | | |
| | | | | | |
Net investment income | | | | — | | | | | (0.05 | ) | | | | (0.07 | ) | | | | (0.04 | ) | | | | (0.05 | ) | | | | (0.11 | ) |
| | | | | | |
Net realized gain on investments | | | | — | | | | | (1.22 | ) | | | | (0.98 | ) | | | | (1.47 | ) | | | | (0.73 | ) | | | | (1.06 | ) |
| | | | | | |
Total distributions to shareholders | | | | — | | | | | (1.27 | ) | | | | (1.05 | ) | | | | (1.51 | ) | | | | (0.78 | ) | | | | (1.17 | ) |
| | | | | | |
Net Asset Value, End of Period | | | | $18.63 | | | | | $16.84 | | | | | $14.46 | | | | | $18.63 | | | | | $15.48 | | | | | $13.14 | |
| | | | | | |
Total Return2,5 | | | | 10.63 | %6 | | | | 25.47 | % | | | | (16.87 | )% | | | | 30.30 | % | | | | 23.90 | % | | | | 35.42 | % |
| | | | | | |
Ratio of net expenses to average net assets7 | | | | 0.73 | %8,9 | | | | 0.73 | % | | | | 0.73 | % | | | | 0.75 | % | | | | 0.75 | % | | | | 0.75 | %9 |
| | | | | | |
Ratio of gross expenses to average net assets10 | | | | 0.83 | %8 | | | | 0.85 | % | | | | 0.88 | % | | | | 0.88 | % | | | | 0.94 | % | | | | 0.92 | % |
| | | | | | |
Ratio of net investment income to average net assets2 | | | | 0.02 | %8 | | | | 0.32 | % | | | | 0.48 | % | | | | 0.25 | % | | | | 0.35 | % | | | | 0.73 | % |
| | | | | | |
Portfolio turnover | | | | 21 | %6 | | | | 35 | % | | | | 28 | % | | | | 18 | % | | | | 28 | % | | | | 40 | % |
| | | | | | |
Net assets end of period (000’s) omitted | | | | $43,785 | | | | | $44,970 | | | | | $25,585 | | | | | $12,599 | | | | | $9,414 | | | | | $8,410 | |
| | | | | | | | | | | | | | | | | | | | | | | | | | | | | | | |
| | | | | | | | | | | | | | | | | | | | | | | | | | | | | | | |
9
| | |
| | AMG Renaissance Large Cap Growth Fund Financial Highlights For a share outstanding throughout each fiscal period |
| | | | | | | | | | | | | | | | | | | | | | | | | | | | | | |
| | | For the six | | | | | | | | | | |
| | | months ended | | For the fiscal years ended December 31, |
| Class Z | | June 30, 2024
(unaudited) | | 2023 | | 2022 | | 2021 | | 2020 | | 2019 |
| | | | | | |
Net Asset Value, Beginning of Period | | | | $16.50 | | | | | $14.18 | | | | | $18.31 | | | | | $15.22 | | | | | $12.94 | | | | | $10.43 | |
| | | | | | |
Income (loss) from Investment Operations: | | | | | | | | | | | | | | | | | | | | | | | | | | | | | | |
| | | | | | |
Net investment income1,2 | | | | 0.01 | | | | | 0.06 | | | | | 0.09 | | | | | 0.06 | 4 | | | | 0.06 | | | | | 0.10 | |
| | | | | | |
Net realized and unrealized gain (loss) on investments | | | | 1.75 | | | | | 3.54 | | | | | (3.16 | ) | | | | 4.56 | | | | | 3.01 | | | | | 3.60 | |
| | | | | | |
Total income (loss) from investment operations | | | | 1.76 | | | | | 3.60 | | | | | (3.07 | ) | | | | 4.62 | | | | | 3.07 | | | | | 3.70 | |
| | | | | | |
Less Distributions to Shareholders from: | | | | | | | | | | | | | | | | | | | | | | | | | | | | | | |
| | | | | | |
Net investment income | | | | — | | | | | (0.06 | ) | | | | (0.08 | ) | | | | (0.06 | ) | | | | (0.06 | ) | | | | (0.13 | ) |
| | | | | | |
Net realized gain on investments | | | | — | | | | | (1.22 | ) | | | | (0.98 | ) | | | | (1.47 | ) | | | | (0.73 | ) | | | | (1.06 | ) |
| | | | | | |
Total distributions to shareholders | | | | — | | | | | (1.28 | ) | | | | (1.06 | ) | | | | (1.53 | ) | | | | (0.79 | ) | | | | (1.19 | ) |
| | | | | | |
Net Asset Value, End of Period | | | | $18.26 | | | | | $16.50 | | | | | $14.18 | | | | | $18.31 | | | | | $15.22 | | | | | $12.94 | |
| | | | | | |
Total Return2,5 | | | | 10.67 | %6 | | | | 25.54 | % | | | | (16.83 | )% | | | | 30.54 | % | | | | 23.90 | % | | | | 35.58 | % |
| | | | | | |
Ratio of net expenses to average net assets7 | | | | 0.66 | %8,9 | | | | 0.66 | % | | | | 0.66 | % | | | | 0.66 | % | | | | 0.66 | % | | | | 0.66 | %9 |
| | | | | | |
Ratio of gross expenses to average net assets10 | | | | 0.76 | %8 | | | | 0.78 | % | | | | 0.81 | % | | | | 0.79 | % | | | | 0.85 | % | | | | 0.83 | % |
| | | | | | |
Ratio of net investment income to average net assets2 | | | | 0.09 | %8 | | | | 0.39 | % | | | | 0.55 | % | | | | 0.34 | % | | | | 0.44 | % | | | | 0.82 | % |
| | | | | | |
Portfolio turnover | | | | 21 | %6 | | | | 35 | % | | | | 28 | % | | | | 18 | % | | | | 28 | % | | | | 40 | % |
| | | | | | |
Net assets end of period (000’s) omitted | | | | $25,126 | | | | | $23,943 | | | | | $21,386 | | | | | $20,721 | | | | | $17,068 | | | | | $20,372 | |
| | | | | | | | | | | | | | | | | | | | | | | | | | | | | | | |
| 1 | Per share numbers have been calculated using average shares. |
| 2 | Total returns and net investment income (loss) would have been lower had certain expenses not been offset. |
| 3 | Less than $0.005 or $(0.005) per share. |
| 4 | Includes non-recurring dividends. Without these dividends, net investment income (loss) per share would have been $(0.02), $0.02, and $0.04 for Class N, Class I and Class Z, respectively. |
| 5 | The total return is calculated using the published Net Asset Value as of period end. |
| 7 | Includes reduction from broker recapture amounting to less than 0.01% for the six months ended June 30, 2024 and for the fiscal years ended December 31, 2023, 2022, 2021 and 2020, and 0.01% for the fiscal year ended December 31, 2019, respectively. |
| 9 | Includes interest expense of less than 0.01% for the six months ended June 30, 2024 and 0.01% for the fiscal year ended December 31, 2019 related to participation in the interfund lending program. |
| 10 | Excludes the impact of expense reimbursement or fee waivers and expense reductions such as brokerage credits, but includes expense repayments and non-reimbursable expenses, if any, such as interest, taxes, and extraordinary expenses. (See Note 1(c) and 2 in the Notes to Financial Statements.) |
10
| | |
| | Notes to Financial Statements (unaudited) June 30, 2024 |
1. ORGANIZATION AND SUMMARY OF SIGNIFICANT ACCOUNTING POLICIES
AMG Funds (the “Trust”) is an open-end management investment company, organized as a Massachusetts business trust, and registered under the Investment Company Act of 1940, as amended (the “1940 Act”). Currently, the Trust consists of a number of different funds, each having distinct investment management objectives, strategies, risks, and policies. Included in this report is AMG Renaissance Large Cap Growth Fund (the “Fund”).
The Fund offers Class N, Class I, and Class Z shares. Each class represents an interest in the same assets of the Fund. Although all share classes generally have identical voting rights, each share class votes separately when required by law. Different share classes may have different net asset values per share to the extent the share classes pay different distribution amounts and/or the expenses of such share classes differ. Each share class has its own expense structure. Please refer to a current prospectus for additional information on each share class.
The Fund’s financial statements are prepared in accordance with accounting principles generally accepted in the United States of America (“U.S. GAAP”), including accounting and reporting guidance pursuant to Accounting Standards Codification Topic 946 applicable to investment companies. U.S. GAAP requires management to make estimates and assumptions that affect the reported amounts of assets and liabilities and disclosure of contingent assets and liabilities at the date of the financial statements and the reported amounts of income and expenses during the reporting period. Actual results could differ from those estimates and such differences could be material. The following is a summary of significant accounting policies followed by the Fund in the preparation of its financial statements:
a. VALUATION OF INVESTMENTS
Equity securities traded on a national securities exchange or reported on the NASDAQ national market system (“NMS”) are valued at the last quoted sales price on the primary exchange or, if applicable, the NASDAQ official closing price or the official closing price of the relevant exchange or, lacking any sales, at the last quoted bid price. Equity securities held by the Fund that are traded in the over-the-counter market (other than NMS securities) are valued at the bid price. Foreign equity securities (securities principally traded in markets other than U.S. markets) held by the Fund are valued at the official closing price on the primary exchange or, for markets that either do not offer an official closing price or where the official closing price may not be representative of the overall market, the last quoted sale price.
Fixed income securities purchased with a remaining maturity of 60 days or less are valued at amortized cost, provided that the amortized cost value is approximately the same as the fair value of the security valued without the use of amortized cost. Investments in other open-end registered investment companies are valued at their end of day net asset value per share.
The Fund’s portfolio investments are generally valued based on independent market quotations or prices or, if none, “evaluative” or other market based valuations provided by third party pricing services. Pursuant to Rule 2a-5 under the 1940 Act, the Fund’s Board of Trustees (the “Board”) designated AMG Funds LLC (the “Investment Manager”) as the Fund’s Valuation Designee to perform the Fund’s fair value determinations. Such determinations are subject to Board oversight and certain reporting and other requirements intended to ensure that
the Board receives the information it needs to oversee the Investment Manager’s fair value determinations.
Under certain circumstances, the value of certain Fund portfolio investments may be based on an evaluation of fair value, pursuant to procedures established by the Investment Manager and under the general supervision of the Board. The Fund may use the fair value of a portfolio investment to calculate its net asset value (“NAV”) in the event that the market quotation, price or market based valuation for the portfolio investment is not readily available or otherwise not determinable pursuant to the Fund’s valuation procedures, if the Investment Manager believes the quotation, price or market based valuation to be unreliable, or in certain other circumstances. When determining the fair value of an investment, the Investment Manager seeks to determine the price that the Fund might reasonably expect to receive from current sale of that portfolio investment in an arms-length transaction. Fair value determinations shall be based upon consideration of all available facts and information, including, but not limited to (i) attributes specific to the investment; (ii) fundamental and analytical data relating to the investment; and (iii) the value of other comparable securities or relevant financial instruments, including derivative securities, traded on other markets or among dealers.
The values assigned to fair value portfolio investments are based on available information and do not necessarily represent amounts that might ultimately be realized in the future, since such amounts depend on future developments inherent in long-term investments. Because of the inherent uncertainty of valuation, those estimated values may differ significantly from the values that would have been used had a ready market for the investments existed, and the differences could be material. The Board will be presented with quarterly reports, as of the most recent quarter end, summarizing all fair value activity, material fair value matters that occurred during the quarter, and all outstanding securities fair valued by the Fund. Additionally, the Board will be presented with an annual report that assesses the adequacy and effectiveness of the Investment Manager’s process for determining the fair value of the Fund’s investments.
With respect to foreign equity securities and certain foreign fixed income securities, securities held in the Fund that can be fair valued by the applicable fair value pricing service are fair valued on each business day provided that each individual price exceeds a pre-established confidence level.
U.S. GAAP defines fair value as the price that a fund would receive to sell an asset or pay to transfer a liability in an orderly transaction between market participants at the measurement date. U.S. GAAP also establishes a framework for measuring fair value, and a three level hierarchy for fair value measurements based upon the transparency of inputs to the valuation of an asset or liability. Inputs may be observable or unobservable and refer broadly to the assumptions that market participants would use in pricing the asset or liability. Observable inputs reflect the assumptions market participants would use in pricing the asset or liability based on market data obtained from sources independent of the Fund. Unobservable inputs reflect the Fund’s own assumptions about the assumptions that market participants would use in pricing the asset or liability developed based on the best information available in the circumstances. Each investment is assigned a level based upon the observability of the inputs which are significant to the overall valuation.
The three-tier hierarchy of inputs is summarized below:
Level 1 – inputs are quoted prices in active markets for identical investments (e.g., equity securities, open-end investment companies)
11
| | |
| | Notes to Financial Statements (continued) |
Level 2 – other observable inputs (including, but not limited to: quoted prices for similar assets or liabilities in markets that are active, quoted prices for identical or similar assets or liabilities in markets that are not active, inputs other than quoted prices that are observable for the assets or liabilities (such as interest rates, yield curves, volatilities, prepayment speeds, loss severities, credit risks and default rates) or other market corroborated inputs) (e.g., debt securities, government securities, foreign currency exchange contracts, foreign securities utilizing international fair value pricing, fair valued securities with observable inputs)
Level 3 – inputs are significant unobservable inputs (including the Fund’s own assumptions used to determine the fair value of investments) (e.g., fair valued securities with unobservable inputs)
Changes in inputs or methodologies used for valuing investments may result in a transfer in or out of levels within the fair value hierarchy. The inputs or methodologies used for valuing investments may not necessarily be an indication of the risk associated with investing in those investments.
b. SECURITY TRANSACTIONS
Security transactions are accounted for as of trade date. Realized gains and losses on securities sold are determined on the basis of identified cost.
c. INVESTMENT INCOME AND EXPENSES
Dividend income is recorded on the ex-dividend date. Interest income, which includes amortization of premium and accretion of discount on debt securities, is accrued as earned. Dividend and interest income on foreign securities is recorded gross of any withholding tax. Non-cash dividends included in dividend income, if any, are reported at the fair market value of the securities received. Other income and expenses are recorded on an accrual basis. Expenses that cannot be directly attributed to the Fund are apportioned among the funds in the Trust and other trusts or funds within the AMG Funds Family of Funds (collectively, the “AMG Funds Family”) based upon their relative average net assets or number of shareholders. Investment income, realized and unrealized capital gains and losses, the common expenses of the Fund, and certain fund level expense reductions, if any, are allocated on a pro-rata basis to each class based on the relative net assets of each class to the total net assets of the Fund.
The Fund had certain portfolio trades directed to various brokers under a brokerage recapture program. Credits received from the brokerage recapture program are earned and paid on a monthly basis, and are recorded as expense offsets, which serve to reduce the Fund’s overall expense ratio. For the six months ended June 30, 2024, the impact on the expenses and expense ratios was $1,076 and less than 0.01%, respectively.
d. DIVIDENDS AND DISTRIBUTIONS
Fund distributions resulting from either net investment income or realized net capital gains, if any, will normally be declared and paid at least annually in
December. Distributions to shareholders are recorded on the ex-dividend date. Distributions are determined in accordance with federal income tax regulations, which may differ from net investment income and net realized capital gains for financial statement purposes (U.S. GAAP). Differences may be permanent or temporary. Permanent differences are reclassified among capital accounts in the financial statements to reflect their tax character. Permanent book and tax basis differences, if any, relating to shareholder distributions will result in reclassifications to paid-in capital. Temporary differences arise when certain items of income, expense and gain or loss are recognized in different periods for financial statement and tax purposes; these differences will reverse at some time in the future. Permanent differences are primarily due to tax equalization utilized. Temporary differences are primarily due to wash sale loss deferrals.
At June 30, 2024, the aggregate cost for federal income tax purposes approximates the aggregate cost for book purposes. The approximate cost of investments and the aggregate gross unrealized appreciation and depreciation for federal income tax purposes were as follows:
| | | | | | |
| Cost | | Appreciation | | Depreciation | | Net Appreciation |
| | | |
| $86,553,116 | | $52,305,080 | | $(2,318,571) | | $49,986,509 |
e. FEDERAL TAXES
The Fund currently qualifies as an investment company and intends to comply with the requirements under Subchapter M of the Internal Revenue Code of 1986, as amended, and to distribute substantially all of its taxable income and gains to its shareholders and to meet certain diversification and income requirements with respect to investment companies. The Investment Manager has analyzed the Fund’s tax positions taken on federal income tax returns for all open tax years (generally, the three prior taxable years), and has concluded that no provision for federal income tax is required in the Fund’s financial statements. Additionally, the Investment Manager is not aware of any tax position for which it is reasonably possible that the total amounts of unrecognized tax benefit/detriment will change materially in the next twelve months.
Furthermore, based on the Fund’s understanding of the tax rules and rates related to income, gains and transactions for the foreign jurisdictions in which it invests, the Fund will provide for foreign taxes, and where appropriate, deferred foreign taxes.
f. CAPITAL LOSS CARRYOVERS AND DEFERRALS
As of December 31, 2023, the Fund had no capital loss carryovers for federal income tax purposes. Should the Fund incur net capital losses for the fiscal year ended December 31, 2024, such amounts may be used to offset future realized capital gains indefinitely, and retain their character as short-term and/or long-term.
g. CAPITAL STOCK
The Trust’s Amended and Restated Agreement and Declaration of Trust authorizes for the Fund the issuance of an unlimited number of shares of beneficial interest, without par value. The Fund records sales and repurchases of its capital stock on the trade date.
12
| | |
| | Notes to Financial Statements (continued) |
For the six months ended June 30, 2024 (unaudited) and the fiscal year ended December 31, 2023, the capital stock transactions by class for the Fund were as follows:
| | | | | | | | | | | | | | | | |
| | |
| | | June 30, 2024 | | | December 31, 2023 | |
| | | | |
| | | Shares | | | Amount | | | Shares | | | Amount | |
| | | | |
Class N: | | | | | | | | | | | | | | | | |
| | | | |
Shares sold | | | 48,949 | | | | $862,395 | | | | 152,280 | | | | $2,409,381 | |
| | | | |
Shares issued in reinvestment of distributions | | | — | | | | — | | | | 243,694 | | | | 3,986,834 | |
| | | | |
Shares redeemed | | | (304,050) | | | | (5,444,679) | | | | (397,378) | | | | (6,282,365) | |
| | | | | | | | | | | | | | | | |
| | | | |
Net increase (decrease) | | | (255,101) | | | | $(4,582,284) | | | | (1,404) | | | | $113,850 | |
| | | | | | | | | | | | | | | | |
| | | | |
Class I: | | | | | | | | | | | | | | | | |
| | | | |
Shares sold | | | 396,087 | | | | $7,129,474 | | | | 1,841,207 | | | | $28,308,530 | |
| | | | |
Shares issued in reinvestment of distributions | | | — | | | | — | | | | 188,381 | | | | 3,125,239 | |
| | | | |
Shares redeemed | | | (716,633) | | | | (12,827,369) | | | | (1,128,271) | | | | (18,173,646) | |
| | | | | | | | | | | | | | | | |
| | | | |
Net increase (decrease) | | | (320,546) | | | | $(5,697,895) | | | | 901,317 | | | | $13,260,123 | |
| | | | | | | | | | | | | | | | |
| | | | |
Class Z: | | | | | | | | | | | | | | | | |
| | | | |
Shares sold | | | 39,372 | | | | $699,821 | | | | 109,971 | | | | $1,690,410 | |
| | | | |
Shares issued in reinvestment of distributions | | | — | | | | — | | | | 104,585 | | | | 1,699,513 | |
| | | | |
Shares redeemed | | | (114,662) | | | | (2,015,869) | | | | (270,825) | | | | (4,292,701) | |
| | | | | | | | | | | | | | | | |
| | | | |
Net decrease | | | (75,290) | | | | $(1,316,048) | | | | (56,269) | | | | $(902,778) | |
| | | | | | | | | | | | | | | | |
h. REPURCHASE AGREEMENTS AND JOINT REPURCHASE AGREEMENTS
The Fund may enter into third-party and bilateral repurchase agreements for temporary cash management purposes and for reinvestment of cash collateral on securities lending transactions under the securities lending program offered by The Bank of New York Mellon (“BNYM”) (the “Securities Lending Program”) (collectively, “Repurchase Agreements”). The value of the underlying collateral, including accrued interest, must equal or exceed the value of the Repurchase Agreements during the term of the agreement. For joint repurchase agreements, the Fund participates on a pro rata basis with other clients of BNYM in its share of the underlying collateral under such joint repurchase agreements and in its share of proceeds from any repurchase or other disposition of the underlying collateral. The underlying collateral for all Repurchase Agreements is held by the Fund’s custodian or at the Federal Reserve Bank. If the seller defaults and the value of the collateral declines, or if bankruptcy proceedings commence with respect to the seller of the security, realization of the collateral by the Fund may be delayed or limited. Pursuant to the Securities Lending Program, the Fund is indemnified for such losses by BNYM on joint repurchase agreements.
At June 30, 2024, the Fund had no Repurchase Agreements outstanding.
2. AGREEMENTS AND TRANSACTIONS WITH AFFILIATES
The Trust has entered into an investment advisory agreement under which the Investment Manager, a subsidiary and the U.S. wealth platform of Affiliated Managers Group, Inc. (“AMG”), serves as investment manager to the Fund and is responsible for the Fund’s overall administration and operations. The Investment Manager selects and recommends, subject to the approval of the Board and, in certain circumstances, shareholders, the subadviser for the Fund and monitors the
subadviser’s investment performance, security holdings and investment strategies. The Fund’s investment portfolio is managed by The Renaissance Group LLC (“Renaissance”) who serves as subadviser pursuant to a subadvisory agreement with the Investment Manager. AMG indirectly owns a majority interest in Renaissance.
Investment management fees are paid directly by the Fund to the Investment Manager based on average daily net assets. For the six months ended June 30, 2024, the Fund paid an investment management fee at the following annual rates of the Fund’s average daily net assets:
| | | | |
| |
on the first $50 million | | | 0.55% | |
| |
on the next $25 million | | | 0.50% | |
| |
on the next $25 million | | | 0.45% | |
| |
on balance over $100 million | | | 0.40% | |
The fee paid to Renaissance for its services as subadviser is paid out of the fee the Investment Manager receives from the Fund and does not increase the expenses of the Fund.
The Investment Manager has contractually agreed, through at least May 1, 2025, to waive management fees and/or pay or reimburse fund expenses in order to limit total annual Fund operating expenses after fee waiver and expense reimbursements (exclusive of taxes, interest (including interest incurred in connection with bank and custody overdrafts, and in connection with securities sold short), shareholder servicing fees, distribution and service (12b-1) fees, brokerage commissions and other transaction costs, dividends payable with
13
| | |
| | Notes to Financial Statements (continued) |
respect to securities sold short, acquired fund fees and expenses and extraordinary expenses) to the annual rate of 0.66% of the Fund’s average daily net assets (this annual rate or such other annual rate that may be in effect from time to time, the “Expense Cap”), subject to later reimbursement by the Fund in certain circumstances.
In general, for a period of up to 36 months after the date any amounts are paid, waived or reimbursed by the Investment Manager, the Investment Manager may recover such amounts from the Fund, provided that such repayment would not cause the Fund’s total annual operating expenses after fee waiver and expense reimbursements (exclusive of the items noted in the parenthetical above) to exceed either (i) the Expense Cap in effect at the time such amounts were paid, waived or reimbursed, or (ii) the Expense Cap in effect at the time of such repayment by the Fund.
The contractual expense limitation may only be terminated in the event the Investment Manager or a successor ceases to be the investment manager of the Fund or a successor fund, by mutual agreement between the Investment Manager and the Board, or in the event of the Fund’s liquidation unless the Fund is reorganized or is a party to a merger in which the surviving entity is successor to the accounting and performance information of the Fund.
For the six months ended June 30, 2024, the Investment Manager reimbursed the Fund $67,313, and did not recoup any previously reimbursed expenses. At June 30, 2024, the Fund’s expiration of reimbursements subject to recoupment is as follows:
| | | | |
| |
Expiration Period | | | |
| |
Less than 1 year | | | $125,520 | |
| |
1-2 years | | | 145,484 | |
| |
2-3 years | | | 148,478 | |
| | | | |
| |
Total | | | $419,482 | |
| | | | |
The Trust, on behalf of the Fund, has entered into an amended and restated Administration Agreement under which the Investment Manager serves as the Fund’s administrator (the “Administrator”) and is responsible for certain aspects of managing the Fund’s operations, including administration and shareholder services to the Fund. The Fund pays a fee to the Administrator at the rate of 0.15% per annum of the Fund’s average daily net assets for this service.
The Fund is distributed by AMG Distributors, Inc. (the “Distributor”), a wholly-owned subsidiary of the Investment Manager. The Distributor serves as the distributor and underwriter for the Fund and is a registered broker-dealer and member of the Financial Industry Regulatory Authority, Inc. (“FINRA”). Shares of the Fund will be continuously offered and will be sold directly to prospective purchasers and through brokers, dealers or other financial intermediaries who have executed selling agreements with the Distributor. Generally, the Distributor bears all or a portion of the expenses of providing services pursuant to the distribution agreement, including the payment of the expenses relating to the distribution of prospectuses for sales purposes and any advertising or sales literature.
The Trust has adopted a distribution and service plan (the “Plan”) with respect to the Class N shares, in accordance with the requirements of Rule 12b-1 under the 1940 Act and the requirements of the applicable rules of FINRA regarding asset-based sales charges. Pursuant to the Plan, the Fund may make payments to the Distributor for its expenditures in financing any activity primarily intended to result in the sale of the Fund’s Class N shares and for maintenance and personal
service provided to existing shareholders of that class. The Plan authorizes payments to the Distributor up to 0.25% annually of the Fund’s average daily net assets attributable to the Class N shares.
For each of the Class N and Class I shares, the Board has approved reimbursement payments to the Investment Manager for shareholder servicing expenses (“shareholder servicing fees”) incurred. Shareholder servicing fees include payments to financial intermediaries, such as broker-dealers (including fund supermarket platforms), banks, and trust companies who provide shareholder recordkeeping, account servicing and other services. The Class N and Class I shares may reimburse the Investment Manager for the actual amount incurred up to a maximum annual rate of each Class’s average daily net assets as shown in the table below. Effective December 31, 2022, the Investment Manager agreed, through December 31, 2023, to waive a portion of shareholder servicing fees paid by Class I as necessary to ensure the fees were limited to 0.07%. On December 31, 2023, the Investment Manager agreed to renew the waiver through December 31, 2024.
The impact on the annualized expense ratios for the six months ended June 30, 2024, was as follows:
| | | | | | | | |
| | |
| | Maximum Annual
Amount
Approved | | | Actual
Amount
Incurred | |
| | |
Class N | | | 0.15 | % | | | 0.09 | % |
| | |
Class I | | | 0.15 | % | | | 0.07 | % |
The Board provides supervision of the affairs of the Trust and other trusts within the AMG Funds Family. The Trustees of the Trust who are not affiliated with the Investment Manager receive an annual retainer and per meeting fees for regular, special and telephonic meetings, and they are reimbursed for out-of-pocket expenses incurred while carrying out their duties as Board members. The Chairman of the Board and the Audit Committee Chair receive additional annual retainers. Certain Trustees and Officers of the Fund are Officers and/or Directors of the Investment Manager, AMG and/or the Distributor.
The Securities and Exchange Commission (the “SEC”) granted an exemptive order that permits certain eligible funds in the AMG Funds Family to lend and borrow money for certain temporary purposes directly to and from other eligible funds in the AMG Funds Family. Participation in this interfund lending program is voluntary for both the borrowing and lending funds, and an interfund loan is only made if it benefits each participating fund. The Administrator manages the program according to procedures approved by the Board, and the Board monitors the operation of the program. An interfund loan must comply with certain conditions set out in the exemptive order, which are designed to assure fairness and protect all participating funds. The interest earned and interest paid on interfund loans are included on the Statement of Operations as interest income and interest expense, respectively. At June 30, 2024, the Fund had no interfund loans outstanding. The Fund did not lend during the six months ended June 30, 2024.
The Fund utilized the interfund loan program during the six months ended June 30, 2024 as follows:
| | | | | | |
Average
Borrowed | | Number
of Days | | Interest
Paid | | Average
Interest Rate |
| | | |
| $6,445,828 | | 2 | | $2,190 | | 6.200% |
14
| | |
| | Notes to Financial Statements (continued) |
3. PURCHASES AND SALES OF SECURITIES
Purchases and sales of securities (excluding short-term securities and U.S. Government Obligations) for the six months ended June 30, 2024, were $27,551,675 and $38,250,616, respectively.
The Fund had no purchases or sales of U.S. Government Obligations during the six months ended June 30, 2024.
4. PORTFOLIO SECURITIES LOANED
The Fund participates in the Securities Lending Program providing for the lending of securities to qualified borrowers. Securities lending income includes earnings of such temporary cash investments, plus or minus any rebate to a borrower. These earnings (after any rebate) are then divided between BNYM, as a fee for its services under the Securities Lending Program, and the Fund, according to agreed-upon rates. Collateral on all securities loaned is accepted in cash, U.S. Treasury Obligations or U.S. Government Agency Obligations. Collateral is maintained at a minimum level of 102% (105% in the case of certain foreign securities) of the market value, plus interest, if applicable, of investments on loan. It is the Fund’s policy to obtain additional collateral from or return excess collateral to the borrower by the end of the next business day, following the valuation date of the securities loaned. Therefore, the value of the collateral held may be temporarily less than the value of the securities on loan. Lending securities entails a risk of loss to the Fund if and to the extent that the market value of the securities loaned were to increase and the borrower did not increase the collateral accordingly, and the borrower fails to return the securities. Under the terms of the Securities Lending Program, the Fund is indemnified for such losses by BNYM. Cash collateral is held in separate omnibus accounts managed by BNYM, who is authorized to exclusively enter into joint repurchase agreements for that cash collateral. Securities collateral is held in separate omnibus accounts managed by BNYM and cannot be sold or pledged. BNYM bears the risk of any deficiency in the amount of the cash collateral available for return to the borrower due to any loss on the collateral invested. Loans of securities are terminable at any time and the borrower, after notice, is required to return borrowed securities as soon as practical, which is normally within three business days.
The value of securities loaned on positions held, cash collateral and securities collateral received at June 30, 2024, was as follows:
| | | | | | |
Securities Loaned | | Cash Collateral Received | | Securities Collateral Received | | Total Collateral Received |
| | | |
| $2,192,412 | | — | | $2,272,893 | | $2,272,893 |
The following table summarizes the securities received as collateral for securities lending at June 30, 2024:
| | | | |
Collateral
Type | | Coupon Range | | Maturity Date Range |
| | |
| U.S. Treasury Obligations | | 0.000%-5.456% | | 07/15/24-08/15/53 |
5. FUND RISKS
In the normal course of business, the Fund invests in securities or other instruments and may enter into certain transactions, and such activities subject the Fund to various risks. The value of securities or other instruments may also be affected by various factors, including, without limitation: (i) the general economy;
(ii) the overall market; or (iii) price fluctuations. Please refer to the Fund’s current prospectus for additional information about the Fund’s principal risks.
Market Risk: Market prices of investments held by the Fund may fall rapidly or unpredictably due to a variety of factors, including economic, political, or market conditions, or other factors including terrorism, war, natural disasters and the spread of infectious illness or other public health issues, including epidemics or pandemics, or in response to events that affect particular industries or companies.
Management Risk: Because the Fund is an actively managed investment portfolio, security selection or focus on securities in a particular style, market sector or group of companies may cause the Fund to incur losses or underperform relative to its benchmarks or other funds with a similar investment objective. There can be no guarantee that Renaissance’s investment techniques and risk analysis will produce the desired result.
Large-Capitalization Stock Risk: The stocks of large-capitalization companies are generally more mature and may not be able to reach the same levels of growth as the stocks of small- or mid-capitalization companies.
Mid-Capitalization Stock Risk: The stocks of mid-capitalization companies often have greater price volatility, lower trading volume, and less liquidity than the stocks of larger, more established companies.
Growth Stock Risk: The prices of equity securities of companies that are expected to experience relatively rapid earnings growth, or “growth stocks,” may be more sensitive to market movements because the prices tend to reflect future investor expectations rather than just current profits.
Sector Risk: Issuers and companies that are in similar industry sectors may be similarly affected by particular economic or market events; to the extent the Fund has substantial holdings within a particular sector, the risks associated with that sector increase.
6. COMMITMENTS AND CONTINGENCIES
Under the Trust’s organizational documents, its Trustees and Officers are indemnified against certain liabilities arising out of the performance of their duties to the Trust. In addition, in the normal course of business, the Fund may enter into contracts and agreements that contain a variety of representations and warranties, which provide general indemnifications. The maximum exposure to the Fund under these arrangements is unknown, as this would involve future claims that may be made against the Fund that have not yet occurred. However, based on experience, the Fund had no prior claims or losses and expects the risks of loss to be remote.
7. MASTER NETTING AGREEMENTS
The Fund may enter into master netting agreements with its counterparties for the Securities Lending Program and Repurchase Agreements, which provide the right, in the event of default (including bankruptcy or insolvency) for the non-defaulting party to liquidate the collateral and calculate net exposure to the defaulting party or request additional collateral. For financial reporting purposes, the Fund does not offset financial assets and financial liabilities that are subject to master netting agreements in the Statement of Assets and Liabilities. For securities lending transactions, see Note 4. At June 30, 2024, the Fund had no Repurchase Agreements outstanding.
15
| | |
| | Notes to Financial Statements (continued) |
8. SUBSEQUENT EVENTS
The Fund has determined that no material events or transactions occurred through the issuance date of the Fund’s financial statements which require an additional disclosure in or adjustment of the Fund’s financial statements.
16
| | |
| | Other Information (unaudited) |
ITEM 8. CHANGES IN AND DISAGREEMENTS WITH ACCOUNTANTS FOR OPEN-END MANAGEMENT INVESTMENT COMPANIES
During the six months ended June 30, 2024, there were no changes in and/or disagreements with accountants.
ITEM 9. PROXY DISCLOSURES FOR OPEN-END MANAGEMENT INVESTMENT COMPANIES
Not applicable.
ITEM 10. REMUNERATION PAID TO DIRECTORS, OFFICERS, AND OTHERS OF OPEN-END MANAGEMENT INVESTMENT COMPANIES
The remuneration paid to the Trustees during the six months ended June 30, 2024, was $5,007, which is reflected as “Trustee fees and expenses” on the Statement of Operations. There was no remuneration paid to any Fund officer or to any affiliated person of any Fund Trustee or officer during the six months ended June 30, 2024.
17
| | |
| | ITEM 11. STATEMENT REGARDING BASIS FOR APPROVAL OF INVESTMENT ADVISORY CONTRACT |
| | | | | | | | |
AMG Renaissance Large Cap Growth Fund: Approval of Investment Management Agreement and Subadvisory Agreement on June 12, 2024 At an in-person meeting held on June 12, 2024, the Board of Trustees (the “Board” or the “Trustees”), and separately a majority of the Trustees who are not “interested persons” of AMG Funds (the “Trust”) (the “Independent Trustees”), approved (i) the Investment Management Agreement, as amended pursuant to letter agreements at any time prior to the date of the meeting, with AMG Funds LLC (the “Investment Manager”) for AMG Renaissance Large Cap Growth Fund (the “Fund”) and separately each of Amendment No. 1 thereto dated July 1, 2015, and Amendment No. 2 thereto dated October 1, 2016 (collectively, the “Investment Management Agreement”); and (ii) the Subadvisory Agreement with respect to the Fund, as amended at any time prior to the date of the meeting (the “Subadvisory Agreement”), with The Renaissance Group LLC, the Fund’s subadviser (the “Subadviser”). The Independent Trustees were separately represented by independent legal counsel in connection with their consideration of the approval of these agreements. In considering the Investment Management Agreement and Subadvisory Agreement, the Trustees reviewed a variety of materials relating to the Fund, the Investment Manager and the Subadviser, including the nature, extent and quality of services, comparative performance, fee and expense information for an appropriate peer group of similar mutual funds for the Fund (the “Peer Group”), performance information for the relevant benchmark index for the Fund (the “Fund Benchmark”), other relevant matters, including management fees, the profitability of the Investment Manager and the Subadviser, and the potential for economies of scale that may be shared with the Fund, and other information provided to them on a periodic basis throughout the year. Prior to voting, the Independent Trustees: (a) reviewed the foregoing information with their independent legal counsel; (b) received materials from their independent legal counsel discussing the legal standards applicable to their consideration of the Investment Management Agreement and the Subadvisory Agreement; and (c) met with their independent legal counsel in private sessions at which no representatives of management were present. NATURE, EXTENT AND QUALITY OF SERVICES In considering the nature, extent and quality of the services provided by the Investment Manager, the Trustees reviewed information provided by the | | | | Investment Manager at the June 12, 2024 meeting and prior meetings relating to the Investment Manager’s operations and personnel. Among other things, the Investment Manager provided financial information, information about its supervisory and professional staff and descriptions of its organizational and management structure. The Trustees also took into account information provided periodically throughout the previous year by the Investment Manager in Board meetings relating to the performance of its duties with respect to the Fund and the Trustees’ knowledge of the Investment Manager’s management and the quality of the performance of the Investment Manager’s duties under the Investment Management Agreement and Administration Agreement. In the course of their deliberations regarding the Investment Manager, the Trustees evaluated, among other things: (a) the extent and quality of the Investment Manager’s oversight of the operation and management of the Fund; (b) the quality of the Investment Manager’s oversight of the performance by the Subadviser of its portfolio management duties; (c) the Investment Manager’s ability to supervise the Fund’s other service providers; and (d) the Investment Manager’s compliance program. The Trustees also took into account that, in performing its functions under the Investment Management Agreement and supervising the Subadviser, the Investment Manager: performs periodic detailed analyses and reviews of the performance by the Subadviser of its obligations to the Fund, including without limitation, analysis and review of portfolio and other compliance matters and review of the Subadviser’s investment performance with respect to the Fund; prepares and presents periodic reports to the Board regarding the investment performance of the Subadviser and other information regarding the Subadviser, at such times and in such forms as the Board may reasonably request; reviews and considers any changes in the personnel of the Subadviser responsible for performing the Subadviser’s obligations and makes appropriate reports to the Board; reviews and considers any changes in the ownership or senior management of the Subadviser and makes appropriate reports to the Board; performs periodic in-person, telephonic or videoconference diligence meetings, including with respect to compliance matters, with representatives of the Subadviser; assists the Board and management of the Trust in developing and reviewing information with respect to the initial approval of the Subadvisory Agreement and annual consideration of the Subadvisory | | | | Agreement thereafter; prepares recommendations with respect to the continued retention of the Subadviser or the replacement of the Subadviser, including at the request of the Board; identifies potential successors to, or replacements of, the Subadviser or potential additional subadvisers, including performing appropriate due diligence, and developing and presenting to the Board a recommendation as to any such successor, replacement, or additional subadviser, including at the request of the Board; designates and compensates from its own resources such personnel as the Investment Manager may consider necessary or appropriate to the performance of its services; and performs such other review and reporting functions as the Board shall reasonably request consistent with the Investment Management Agreement and applicable law. The Trustees noted the affiliation of the Subadviser with the Investment Manager, noting any potential conflicts of interest. The Trustees also took into account the financial condition of the Investment Manager with respect to its ability to provide the services required under the Investment Management Agreement and the Investment Manager’s undertaking to maintain a contractual expense limitation for the Fund. The Trustees also considered the Investment Manager’s risk management processes. The Trustees also reviewed information relating to the Subadviser’s operations and personnel and the investment philosophy, strategies and techniques (its “Investment Strategy”) used in managing the Fund. Among other things, the Trustees reviewed information on portfolio management and other professional staff, information regarding the Subadviser’s organizational and management structure and the Subadviser’s brokerage policies and practices. The Trustees considered specific information provided regarding the experience of the individuals at the Subadviser with portfolio management responsibility for the Fund, including the information set forth in the Fund’s prospectus and statement of additional information. In the course of their deliberations, the Trustees evaluated, among other things: (a) the services rendered by the Subadviser in the past; (b) the qualifications and experience of the Subadviser’s personnel; and (c) the Subadviser’s compliance program. The Trustees also took into account the financial condition of the Subadviser with respect to its ability to provide the services required under the Subadvisory Agreement. The Trustees also considered the Subadviser’s risk management processes. |
18
| | |
| | ITEM 11. STATEMENT REGARDING BASIS FOR APPROVAL OF INVESTMENT ADVISORY CONTRACT (continued) |
| | | | | | | | |
PERFORMANCE The Board considered the Fund’s net performance during relevant time periods as compared to the Fund’s Peer Group and Fund Benchmark, considered the gross performance of the Fund as compared to the Subadviser’s relevant performance composite that utilizes a similar investment strategy and approach, and noted that the Board reviews on a quarterly basis detailed information about both the Fund’s performance results and portfolio composition, as well as the Subadviser’s Investment Strategy. The Board was mindful of the Investment Manager’s expertise, resources and attention to monitoring the Subadviser’s performance, investment style and risk-adjusted performance with respect to the Fund and its discussions with the management of the Fund’s subadviser during the period regarding the factors that contributed to the performance of the Fund. Among other information relating to the Fund’s performance, the Trustees noted that the Fund’s performance for Class N shares (which share class has the largest amount of assets of all the share classes of the Fund) for the 1-year, 3-year, 5-year and 10-year periods ended March 31, 2024, was below, above, above, and below, respectively, the median performance of the Peer Group and below, above, below, and below, respectively, the performance of the Fund Benchmark, the Russell 1000 Growth Index. The Trustees took into account management’s discussion of the Fund’s performance, including the reasons for the Fund’s recent underperformance relative to the Peer Group and Fund Benchmark. The Trustees also noted that the Fund ranked in the top decile relative to its Peer Group for the 3-year period and the top quartile relative to its Peer Group for the 5-year period. The Trustees concluded that the Fund’s overall performance has been satisfactory in light of the Fund’s investment objective, strategies and policies. ADVISORY AND SUBADVISORY FEES; FUND EXPENSES; PROFITABILITY; AND ECONOMIES OF SCALE In considering the reasonableness of the advisory fee payable to the Investment Manager, the Trustees reviewed information provided by the Investment Manager at the June 12, 2024 meeting and prior meetings setting forth all revenues and other benefits, both direct and indirect (including any so-called “fallout benefits” such as reputational value derived from the Investment Manager serving as Investment Manager to the Fund), received by the Investment Manager and its affiliates attributable to managing the Fund and all the mutual funds in the | | | | AMG Funds Family of Funds; the cost of providing such services; the significant risks undertaken as Investment Manager and sponsor of the Fund, including investment, operational, enterprise, entrepreneurial, litigation, regulatory and compliance risks; and the resulting profitability to the Investment Manager and its affiliates from these relationships. The Trustees also considered the amount of the advisory fee retained by the Investment Manager after payment of the subadvisory fee with respect to the Fund. The Trustees also considered management’s discussion of the current asset level of the Fund, and the impact on profitability of both the current asset level and any future growth of assets of the Fund. In considering the cost of services to be provided by the Investment Manager under the Investment Management Agreement and the profitability to the Investment Manager of its relationship with the Fund, the Trustees noted the undertaking by the Investment Manager to maintain a contractual expense limitation for the Fund. The Board also took into account management’s discussion of the advisory fee structure, and the services the Investment Manager provides in performing its functions under the Investment Management Agreement and supervising the Subadviser. Based on the foregoing, the Trustees concluded that the profitability to the Investment Manager is reasonable and that the Investment Manager is not realizing material benefits from economies of scale that would warrant adjustments to the advisory fee at this time. Also, with respect to economies of scale, the Trustees noted that as the Fund’s assets increase over time, the Fund may realize other economies of scale to the extent the increase in assets is proportionally greater than the increase in certain other expenses. In considering the reasonableness of the subadvisory fee payable by the Investment Manager to the Subadviser, the Trustees reviewed information regarding the cost to the Subadviser of providing subadvisory services to the Fund and the resulting profitability from the relationship. The Trustees noted that, because the Subadviser is an affiliate of the Investment Manager, a portion of the Subadviser’s revenues or profits might be shared directly or indirectly with the Investment Manager. The Trustees also noted that the subadvisory fees are paid by the Investment Manager out of its advisory fee. The Board also took into account management’s discussion of the subadvisory fee structure, and the services the Subadviser provides in performing its functions under the Subadvisory Agreement. Based on the foregoing, the Trustees concluded that the profitability to the Subadviser is reasonable and that | | | | the Subadviser is not realizing material benefits from economies of scale that would warrant adjustments to the subadvisory fees at this time. Also, with respect to economies of scale, the Trustees noted that as the Fund’s assets increase over time, the Fund may realize other economies of scale to the extent the increase in assets is proportionally greater than the increase in certain other expenses. The Trustees noted that the management fees (which include both the advisory and administration fees) and total expenses (net of applicable expense waivers/reimbursements) of Class I shares (the class of shares which is the primary focus of the Fund’s distribution) of the Fund as of March 31, 2024, were both rated in the Average rating level of the Fund’s Peer Group. The Trustees noted that the rating level corresponded to the Fund’s quintile ranking in its Peer Group. The Trustees took into account the fact that the Investment Manager has contractually agreed, through May 1, 2025, to limit the Fund’s net annual operating expenses (subject to certain excluded expenses) to 0.66%. The Trustees also considered that the Investment Manager was voluntarily waiving a portion of shareholder servicing fees for Class I shares of the Fund. The Trustees concluded that, in light of the nature, extent and quality of the services provided by the Investment Manager and the Subadviser (which is an affiliate of the Investment Manager), the foregoing expense limitation and the considerations noted above with respect to the Investment Manager and the Subadviser, the Fund’s advisory and subadvisory fees are reasonable. * * * * After consideration of the foregoing, the Trustees also reached the following conclusions (in addition to the conclusions discussed above) regarding the Investment Management Agreement and the Subadvisory Agreement: (a) the Investment Manager and the Subadviser have demonstrated that they possess the capability and resources to perform the duties required of them under the Investment Management Agreement and the Subadvisory Agreement and (b) the Investment Manager and Subadviser maintain appropriate compliance programs. Based on all of the above-mentioned factors and their related conclusions, with no single factor or conclusion being determinative and with each Trustee not necessarily attributing the same weight to each factor, the Trustees concluded that approval of the Investment Management Agreement and the Subadvisory Agreement would be in the best interests of the Fund and its shareholders. |
19
| | |
| | ITEM 11. STATEMENT REGARDING BASIS FOR APPROVAL OF INVESTMENT ADVISORY CONTRACT (continued) |
| | | | | | | | |
| Accordingly, on June 12, 2024, the Trustees, and separately a majority of the Independent Trustees, | | | | voted to approve the Investment Management Agreement and the Subadvisory Agreement for the Fund. | | | | |
20
| | |
| | |
| | | | |
INVESTMENT MANAGER AND ADMINISTRATOR AMG Funds LLC 680 Washington Blvd., Suite 500 Stamford, CT 06901 800.548.4539 DISTRIBUTOR AMG Distributors, Inc. 680 Washington Blvd., Suite 500 Stamford, CT 06901 800.548.4539 SUBADVISER The Renaissance Group LLC 50 East RiverCenter Boulevard Suite 1200 Covington, KY 41011 CUSTODIAN The Bank of New York Mellon Mutual Funds Custody 240 Greenwich Street New York, NY 10286 LEGAL COUNSEL Ropes & Gray LLP Prudential Tower, 800 Boylston Street Boston, MA 02199-3600 | | TRANSFER AGENT BNY Mellon Investment Servicing (US) Inc. AMG Funds Attn: 534426 AIM 154-0520 500 Ross Street Pittsburgh, PA 15262 800.548.4539 TRUSTEES Jill R. Cuniff Kurt A. Keilhacker Peter W. MacEwen Steven J. Paggioli Eric Rakowski Victoria L. Sassine Garret W. Weston | | This report is prepared for the Fund’s shareholders. It is authorized for distribution to prospective investors only when preceded or accompanied by an effective prospectus. To receive a free copy of the prospectus or Statement of Additional Information, which includes additional information about Fund Trustees, please contact us by calling 800.548.4539. Distributed by AMG Distributors, Inc., member FINRA/SIPC. Current net asset values per share for the Fund are available on the Fund’s website at wealth.amg.com. A description of the policies and procedures the Fund uses to vote its proxies is available: (i) without charge, upon request, by calling 800.548.4539, or (ii) on the Securities and Exchange Commission’s (SEC) website at sec.gov. For information regarding the Fund’s proxy voting record for the 12-month period ended June 30, call 800.548.4539 or visit the SEC website at sec.gov. The Fund files its complete schedule of portfolio holdings with the SEC for the first and third quarters of each fiscal year as an exhibit to its reports on Form N-PORT. The Fund’s portfolio holdings on Form N-PORT are available on the SEC’s website at sec.gov and the Fund’s website at wealth.amg.com. To review a complete list of the Fund’s portfolio holdings, or to view the most recent semi-annual report or annual report, please visit wealth.amg.com. |
| | |
| | |
| | | | | | | | |
EQUITY FUNDS AMG Boston Common Global Impact Boston Common Asset Management, LLC AMG Frontier Small Cap Growth Frontier Capital Management Co., LLC AMG GW&K Small Cap Core AMG GW&K Small Cap Value AMG GW&K Small/Mid Cap Core AMG GW&K Small/Mid Cap Growth AMG GW&K International Small Cap GW&K Investment Management, LLC AMG Montrusco Bolton Large Cap Growth Montrusco Bolton Investments, Inc. AMG Renaissance Large Cap Growth The Renaissance Group LLC | | | | | | AMG River Road Dividend All Cap Value AMG River Road Focused Absolute Value AMG River Road Large Cap Value Select AMG River Road Mid Cap Value AMG River Road Small-Mid Cap Value AMG River Road Small Cap Value River Road Asset Management, LLC AMG TimesSquare Emerging Markets Small Cap AMG TimesSquare Global Small Cap AMG TimesSquare International Small Cap AMG TimesSquare Mid Cap Growth AMG TimesSquare Small Cap Growth TimesSquare Capital Management, LLC AMG Veritas Asia Pacific AMG Veritas China AMG Veritas Global Focus AMG Veritas Global Real Return Veritas Asset Management LLP AMG Yacktman AMG Yacktman Focused AMG Yacktman Global AMG Yacktman Special Opportunities Yacktman Asset Management LP | | FIXED INCOME FUNDS AMG Beutel Goodman Core Plus Bond Beutel, Goodman & Company Ltd. AMG GW&K Core Bond ESG AMG GW&K ESG Bond AMG GW&K Municipal Bond AMG GW&K Municipal Enhanced Yield GW&K Investment Management, LLC ALTERNATIVE FUNDS AMG Systematica Managed Futures Strategy Systematica Investments Limited, acting as general partner of Systematica Investments LP |
| | | | |
| | | | | |
| | | |
| wealth.amg.com | | 063024 | | SAR024 |
| | |
| | SEMI-ANNUAL REPORT |
| | | | | | |
| | | AMG Funds |
| | | | |
| | | June 30, 2024 | | | | |
| | |
| | |  |
| | |
| | | AMG TimesSquare Small Cap Growth Fund |
| | | Class N: TSCPX | | Class I: TSQIX | | Class Z: TSCIX |
| | |
| | | AMG TimesSquare Mid Cap Growth Fund |
| | | | |
| | | Class N: TMDPX | | Class I: TQMIX | | Class Z: TMDIX |
| | |
| | | AMG TimesSquare International Small Cap Fund |
| | | | |
| | | Class N: TCMPX | | Class I: TQTIX | | Class Z: TCMIX |
| | |
| | | AMG TimesSquare Emerging Markets Small Cap Fund |
| | | | |
| | | Class N: TQENX | | Class I: TQEIX | | Class Z: TQEZX |
| | |
| | | AMG TimesSquare Global Small Cap Fund |
| | | | |
| | | Class N: TSYNX | | Class I: TSYIX | | Class Z: TSYZX |
| | | | |
| | | | | | | |
| | | | | | |
| | | | | | | |
| | | |
| wealth.amg.com | | 063024 | | | SAR012 | |
| | |
| | AMG Funds Semi-Annual Report — June 30, 2024 (unaudited) |
Nothing contained herein is to be considered an offer, sale or solicitation of an offer to buy shares of any series of the AMG Funds Family of Funds. Such offering is made only by prospectus, which includes details as to offering price and other material information.
| | |
| | AMG TimesSquare Small Cap Growth Fund Schedule of Portfolio Investments (unaudited) June 30, 2024 |
| | | | | | | | |
| | | Shares | | | Value | |
| | |
Common Stocks - 93.2% | | | | | | | | |
| |
Communication Services - 3.6% | | | | | |
| | |
Bumble, Inc., Class A* | | | 110,150 | | | | $1,157,676 | |
| | |
IAC, Inc.* | | | 32,280 | | | | 1,512,318 | |
| | |
Integral Ad Science Holding Corp.* | | | 214,900 | | | | 2,088,828 | |
| | |
MediaAlpha, Inc., Class A* | | | 90,303 | | | | 1,189,291 | |
| | |
Total Communication Services | | | | | | | 5,948,113 | |
| |
Consumer Discretionary - 5.3% | | | | | |
| | |
Boot Barn Holdings, Inc.* | | | 11,100 | | | | 1,431,123 | |
| | |
European Wax Center, Inc., Class A*,1 | | | 94,400 | | | | 937,392 | |
| | |
Global-e Online, Ltd. (Israel)* | | | 61,000 | | | | 2,212,470 | |
| | |
Savers Value Village, Inc.*,1 | | | 63,530 | | | | 777,607 | |
| | |
Topgolf Callaway Brands Corp.* | | | 91,000 | | | | 1,392,300 | |
| | |
Warby Parker, Inc., Class A* | | | 124,300 | | | | 1,996,258 | |
| | |
Total Consumer Discretionary | | | | | | | 8,747,150 | |
| |
Consumer Staples - 3.0% | | | | | |
| | |
BJ’s Wholesale Club Holdings, Inc.* | | | 40,000 | | | | 3,513,600 | |
| | |
Freshpet, Inc.* | | | 11,500 | | | | 1,487,985 | |
| | |
Total Consumer Staples | | | | | | | 5,001,585 | |
| |
Energy - 4.3% | | | | | |
| | |
Cactus, Inc., Class A1 | | | 47,700 | | | | 2,515,698 | |
| | |
Magnolia Oil & Gas Corp., Class A1 | | | 57,480 | | | | 1,456,543 | |
| | |
Matador Resources Co. | | | 54,220 | | | | 3,231,512 | |
| | |
Total Energy | | | | | | | 7,203,753 | |
| |
Financials - 8.2% | | | | | |
| | |
AvidXchange Holdings, Inc.* | | | 191,440 | | | | 2,308,766 | |
| | |
Hamilton Lane, Inc., Class A | | | 26,000 | | | | 3,213,080 | |
| | |
MVB Financial Corp. | | | 72,000 | | | | 1,342,080 | |
| | |
PJT Partners, Inc., Class A1 | | | 8,000 | | | | 863,280 | |
| | |
Safety Insurance Group, Inc. | | | 36,080 | | | | 2,707,083 | |
| | |
Victory Capital Holdings, Inc., Class A | | | 69,100 | | | | 3,298,143 | |
| | |
Total Financials | | | | | | | 13,732,432 | |
| |
Health Care - 14.9% | | | | | |
| | |
Addus HomeCare Corp.* | | | 22,500 | | | | 2,612,475 | |
| | |
Ascendis Pharma A/S, ADR (Denmark)* | | | 19,570 | | | | 2,668,956 | |
| | |
Certara, Inc.* | | | 77,770 | | | | 1,077,114 | |
| | |
CG oncology, Inc.* | | | 28,720 | | | | 906,690 | |
| | |
Day One Biopharmaceuticals, Inc.*,1 | | | 140,070 | | | | 1,930,165 | |
| | |
HealthEquity, Inc.* | | | 23,690 | | | | 2,042,078 | |
| | |
Intra-Cellular Therapies, Inc.* | | | 34,640 | | | | 2,372,494 | |
| | |
Krystal Biotech, Inc.*,1 | | | 6,980 | | | | 1,281,807 | |
| | |
Merus, N.V. (Netherlands)* | | | 15,500 | | | | 917,135 | |
| | |
MoonLake Immunotherapeutics (Switzerland)* | | | 16,910 | | | | 743,533 | |
| | | | | | | | |
| | | Shares | | | Value | |
| | |
Newamsterdam Pharma Co., N.V. (Netherlands)* | | | 20,570 | | | | $395,150 | |
| | |
Phreesia, Inc.* | | | 71,100 | | | | 1,507,320 | |
| | |
Silk Road Medical, Inc.* | | | 94,050 | | | | 2,543,112 | |
| | |
Vericel Corp.* | | | 32,000 | | | | 1,468,160 | |
| | |
Xenon Pharmaceuticals, Inc. (Canada)* | | | 58,920 | | | | 2,297,291 | |
| | |
Total Health Care | | | | | | | 24,763,480 | |
| |
Industrials - 24.1% | | | | | |
| | |
ACV Auctions, Inc., Class A* | | | 143,000 | | | | 2,609,750 | |
| | |
Applied Industrial Technologies, Inc. | | | 8,700 | | | | 1,687,800 | |
| | |
The AZEK Co., Inc.* | | | 58,530 | | | | 2,465,869 | |
| | |
Casella Waste Systems, Inc., Class A* | | | 47,500 | | | | 4,712,950 | |
| | |
Comfort Systems USA, Inc. | | | 6,300 | | | | 1,915,956 | |
| | |
Construction Partners, Inc., Class A* | | | 29,000 | | | | 1,601,090 | |
| | |
Embraer, S.A., Sponsored ADR (Brazil)* | | | 55,510 | | | | 1,432,158 | |
| | |
EMCOR Group, Inc. | | | 3,000 | | | | 1,095,240 | |
| | |
Esab Corp. | | | 32,500 | | | | 3,068,975 | |
| | |
Exponent, Inc. | | | 19,000 | | | | 1,807,280 | |
| | |
ICF International, Inc. | | | 13,280 | | | | 1,971,549 | |
| | |
ITT, Inc. | | | 11,000 | | | | 1,420,980 | |
| | |
Loar Holdings, Inc.* | | | 20,000 | | | | 1,068,200 | |
| | |
MYR Group, Inc.* | | | 6,500 | | | | 882,115 | |
| | |
Paycor HCM, Inc.* | | | 57,635 | | | | 731,964 | |
| | |
RBC Bearings, Inc.* | | | 6,460 | | | | 1,742,779 | |
| | |
Regal Rexnord Corp. | | | 22,000 | | | | 2,974,840 | |
| | |
Tetra Tech, Inc. | | | 12,300 | | | | 2,515,104 | |
| | |
WillScot Mobile Mini Holdings Corp.* | | | 78,000 | | | | 2,935,920 | |
| | |
WNS Holdings, Ltd. (India)* | | | 26,370 | | | | 1,384,425 | |
| | |
Total Industrials | | | | | | | 40,024,944 | |
| |
Information Technology - 27.1% | | | | | |
| | |
Clearwater Analytics Holdings, Inc., Class A* | | | 150,010 | | | | 2,778,185 | |
| | |
Cohu, Inc.* | | | 47,740 | | | | 1,580,194 | |
| | |
Credo Technology Group Holding, Ltd.* | | | 72,000 | | | | 2,299,680 | |
| | |
CyberArk Software, Ltd. (Israel)* | | | 16,195 | | | | 4,428,037 | |
| | |
FormFactor, Inc.* | | | 38,000 | | | | 2,300,140 | |
| | |
HashiCorp, Inc., Class A* | | | 26,000 | | | | 875,940 | |
| | |
Impinj, Inc.* | | | 8,800 | | | | 1,379,576 | |
| | |
Intapp, Inc.* | | | 36,100 | | | | 1,323,787 | |
| | |
JFrog, Ltd. (Israel)* | | | 110,610 | | | | 4,153,406 | |
| | |
Kulicke & Soffa Industries, Inc. (Singapore) | | | 58,230 | | | | 2,864,334 | |
| | |
MACOM Technology Solutions Holdings, Inc.* | | | 19,000 | | | | 2,117,930 | |
| | |
Onto Innovation, Inc.* | | | 8,700 | | | | 1,910,172 | |
| | |
PowerSchool Holdings, Inc., Class A* | | | 88,057 | | | | 1,971,596 | |
| | |
Q2 Holdings, Inc.* | | | 35,000 | | | | 2,111,550 | |
The accompanying notes are an integral part of these financial statements.
2
| | |
| | AMG TimesSquare Small Cap Growth Fund Schedule of Portfolio Investments (continued) |
| | | | | | | | |
| | | Shares | | | Value | |
| |
Information Technology - 27.1% | | | | | |
(continued) | | | | | | | | |
| | |
Silvaco Group, Inc.* | | | 43,795 | | | | $787,434 | |
| | |
Smartsheet, Inc., Class A* | | | 71,000 | | | | 3,129,680 | |
| | |
Synaptics, Inc.* | | | 28,500 | | | | 2,513,700 | |
| | |
Vertex, Inc., Class A* | | | 116,000 | | | | 4,181,800 | |
| | |
Workiva, Inc.* | | | 33,590 | | | | 2,451,734 | |
| | |
Total Information Technology | | | | | | | 45,158,875 | |
| |
Materials - 1.1% | | | | | |
| | |
Avient Corp. | | | 41,400 | | | | 1,807,110 | |
| |
Real Estate - 1.6% | | | | | |
| | |
National Storage Affiliates Trust, REIT1 | | | 63,060 | | | | 2,599,333 | |
| |
Total Common Stocks | | | | | |
(Cost $128,103,255) | | | | | | | 154,986,775 | |
| | |
Exchange Traded Funds - 1.5% | | | | | | | | |
| | |
iShares Russell 2000 Growth ETF1 | | | | | | | | |
(Cost $2,220,034) | | | 9,200 | | | | 2,415,276 | |
| | |
| |
| Principal
Amount |
| | | | |
| | |
Short-Term Investments - 8.6% | | | | | | | | |
| |
Joint Repurchase Agreements - 3.3%2 | | | | | |
| | |
Bethesda Securities LLC, dated 06/28/24, due 07/01/24, 5.450% total to be received $68,255 (collateralized by various U.S. Government Agency Obligations, 2.500% - 6.070%, 10/01/27 - 01/01/57, totaling $69,588) | | | $68,224 | | | | 68,224 | |
| | | | | | | | |
| | | Principal
Amount | | | Value | |
| | |
State of Wisconsin Investment Board, dated 06/28/24, due 07/01/24, 5.450% total to be received $5,402,453 (collateralized by various U.S. Treasuries, 0.125% - 3.625%, 10/15/25 -02/15/53, totaling $5,497,469) | | | $5,400,000 | | | | $5,400,000 | |
| | |
Total Joint Repurchase Agreements | | | | | | | 5,468,224 | |
| | |
| | | Shares | | | | | |
| |
Other Investment Companies - 5.3% | | | | | |
| | |
Dreyfus Government Cash Management Fund, Institutional Shares, 5.19%3 | | | 3,571,474 | | | | 3,571,474 | |
| | |
Dreyfus Institutional Preferred Government Money Market Fund, Institutional Shares, 5.27%3 | | | 5,357,210 | | | | 5,357,210 | |
| | |
Total Other Investment Companies | | | | | | | 8,928,684 | |
| |
Total Short-Term Investments | | | | | |
(Cost $14,396,908) | | | | | | | 14,396,908 | |
| | |
Total Investments - 103.3% | | | | | | | | |
(Cost $144,720,197) | | | | | | | 171,798,959 | |
| |
Other Assets, less Liabilities - (3.3)% | | | | (5,529,224 | ) |
| | |
Net Assets - 100.0% | | | | | | | $166,269,735 | |
| | * | Non-income producing security. |
| | 1 | Some of these securities, amounting to $11,397,291 or 6.9% of net assets, were out on loan to various borrowers and are collateralized by cash and various U.S. Treasury Obligations. See Note 4 of Notes to Financial Statements. |
| | 2 | Cash collateral received for securities lending activity was invested in these joint repurchase agreements. |
| | 3 | Yield shown represents the June 30, 2024, seven day average yield, which refers to the sum of the previous seven days’ dividends paid, expressed as an annual percentage. |
ADR American Depositary Receipt
ETF Exchange Traded Fund
REIT Real Estate Investment Trust
The accompanying notes are an integral part of these financial statements.
3
| | |
| | AMG TimesSquare Small Cap Growth Fund Schedule of Portfolio Investments (continued) |
The following table summarizes the inputs used to value the Fund’s investments by the fair value hierarchy levels as of June 30, 2024:
| | | | | | | | | | | | | | | | |
| | | Level 1 | | | Level 2 | | | Level 3 | | | Total | |
| | | | |
Investments in Securities | | | | | | | | | | | | | | | | |
| | | | |
Common Stocks† | | $ | 154,986,775 | | | | — | | | | — | | | $ | 154,986,775 | |
| | | | |
Exchange Traded Funds | | | 2,415,276 | | | | — | | | | — | | | | 2,415,276 | |
| | | | |
Short-Term Investments | | | | | | | | | | | | | | | | |
| | | | |
Joint Repurchase Agreements | | | — | | | $ | 5,468,224 | | | | — | | | | 5,468,224 | |
| | | | |
Other Investment Companies | | | 8,928,684 | | | | — | | | | — | | | | 8,928,684 | |
| | | | | | | | | | | | | | | | |
| | | | |
Total Investments in Securities | | $ | 166,330,735 | | | $ | 5,468,224 | | | | — | | | $ | 171,798,959 | |
| | | | | | | | | | | | | | | | |
| | † | All common stocks held in the Fund are Level 1 securities. For a detailed breakout of common stocks by major industry classification, please refer to the Fund’s Schedule of Portfolio Investments. |
For the six months ended June 30, 2024, there were no transfers in or out of Level 3.
The accompanying notes are an integral part of these financial statements.
4
| | |
| | AMG TimesSquare Mid Cap Growth Fund Schedule of Portfolio Investments (unaudited) June 30, 2024 |
| | | | | | | | |
| | | Shares | | | Value | |
| | |
Common Stocks - 96.5% | | | | | | | | |
| |
Communication Services - 3.2% | | | | | |
| | |
IAC, Inc.* | | | 250,300 | | | | $11,726,555 | |
| | |
Pinterest, Inc., Class A* | | | 512,000 | | | | 22,563,840 | |
| | |
Take-Two Interactive Software, Inc.* | | | 60,500 | | | | 9,407,145 | |
| | |
Total Communication Services | | | | | | | 43,697,540 | |
| |
Consumer Discretionary - 9.1% | | | | | |
| | |
Brunswick Corp. | | | 192,700 | | | | 14,022,779 | |
| | |
DoorDash, Inc., Class A* | | | 127,290 | | | | 13,846,606 | |
| | |
Floor & Decor Holdings, Inc., Class A*,1 | | | 123,100 | | | | 12,237,371 | |
| | |
O’Reilly Automotive, Inc.* | | | 30,260 | | | | 31,956,376 | |
| | |
Pool Corp.1 | | | 32,275 | | | | 9,919,076 | |
| | |
Ross Stores, Inc. | | | 188,900 | | | | 27,450,948 | |
| | |
Tractor Supply Co. | | | 50,760 | | | | 13,705,200 | |
| | |
Total Consumer Discretionary | | | | | | | 123,138,356 | |
| |
Consumer Staples - 1.6% | | | | | |
| | |
BJ’s Wholesale Club Holdings, Inc.* | | | 246,400 | | | | 21,643,776 | |
| |
Energy - 3.2% | | | | | |
| | |
Cheniere Energy, Inc. | | | 157,600 | | | | 27,553,208 | |
| | |
Permian Resources Corp. | | | 951,600 | | | | 15,368,340 | |
| | |
Total Energy | | | | | | | 42,921,548 | |
| |
Financials - 6.6% | | | | | |
| | |
Brown & Brown, Inc. | | | 127,800 | | | | 11,426,598 | |
| | |
Interactive Brokers Group, Inc., Class A | | | 126,714 | | | | 15,535,137 | |
| | |
RenaissanceRe Holdings, Ltd. (Bermuda) | | | 103,700 | | | | 23,177,987 | |
| | |
TPG, Inc. | | | 550,120 | | | | 22,802,474 | |
| | |
WEX, Inc.* | | | 86,980 | | | | 15,407,637 | |
| | |
Total Financials | | | | | | | 88,349,833 | |
| |
Health Care - 17.1% | | | | | |
| | |
Argenx SE, ADR (Netherlands)* | | | 30,550 | | | | 13,137,722 | |
| | |
Ascendis Pharma A/S, ADR (Denmark)* | | | 102,700 | | | | 14,006,226 | |
| | |
Cencora, Inc. | | | 147,500 | | | | 33,231,750 | |
| | |
Charles River Laboratories International, Inc.* | | | 39,443 | | | | 8,148,135 | |
| | |
Chemed Corp. | | | 42,925 | | | | 23,290,246 | |
| | |
Dexcom, Inc.* | | | 214,800 | | | | 24,354,024 | |
| | |
Encompass Health Corp. | | | 182,100 | | | | 15,622,359 | |
| | |
ICON PLC (Ireland)*,1 | | | 56,600 | | | | 17,742,402 | |
| | |
IDEXX Laboratories, Inc.* | | | 44,600 | | | | 21,729,120 | |
| | |
Legend Biotech Corp., ADR *,1 | | | 357,392 | | | | 15,828,892 | |
| | |
Repligen Corp.* | | | 72,770 | | | | 9,173,386 | |
| | |
Stevanato Group S.P.A. (Italy)1 | | | 471,726 | | | | 8,651,455 | |
| | |
Veeva Systems, Inc., Class A* | | | 140,285 | | | | 25,673,558 | |
| | |
Total Health Care | | | | | | | 230,589,275 | |
| | | | | | | | |
| | | Shares | | | Value | |
| |
Industrials - 20.4% | | | | | |
| | |
AMETEK, Inc. | | | 108,600 | | | | $18,104,706 | |
| | |
Carlisle Cos., Inc. | | | 39,800 | | | | 16,127,358 | |
| | |
Cintas Corp. | | | 54,400 | | | | 38,094,144 | |
| | |
Copart, Inc.* | | | 186,900 | | | | 10,122,504 | |
| | |
EMCOR Group, Inc. | | | 64,330 | | | | 23,485,596 | |
| | |
Equifax, Inc. | | | 76,389 | | | | 18,521,277 | |
| | |
GFL Environmental, Inc. (Canada) | | | 265,504 | | | | 10,336,071 | |
| | |
KBR, Inc. | | | 103,400 | | | | 6,632,076 | |
| | |
Nordson Corp. | | | 35,100 | | | | 8,141,094 | |
| | |
Regal Rexnord Corp. | | | 106,100 | | | | 14,346,842 | |
| | |
Rockwell Automation, Inc. | | | 48,815 | | | | 13,437,793 | |
| | |
Saia, Inc.* | | | 34,320 | | | | 16,277,633 | |
| | |
Verisk Analytics, Inc., Class A | | | 125,293 | | | | 33,772,728 | |
| | |
Waste Connections, Inc. (Canada) | | | 177,475 | | | | 31,122,016 | |
| | |
Watsco, Inc. | | | 37,100 | | | | 17,186,204 | |
| | |
Total Industrials | | | | | | | 275,708,042 | |
| |
Information Technology - 30.9% | | | | | |
| | |
Amphenol Corp., Class A | | | 474,800 | | | | 31,987,276 | |
| | |
Aspen Technology, Inc.* | | | 60,700 | | | | 12,056,841 | |
| | |
Bentley Systems, Inc., Class B1 | | | 339,000 | | | | 16,733,040 | |
| | |
Crowdstrike Holdings, Inc., Class A* | | | 114,400 | | | | 43,836,936 | |
| | |
CyberArk Software, Ltd. (Israel)* | | | 88,295 | | | | 24,141,619 | |
| | |
Elastic, N.V.* | | | 152,895 | | | | 17,416,269 | |
| | |
Gartner, Inc.* | | | 69,925 | | | | 31,400,521 | |
| | |
HashiCorp, Inc., Class A* | | | 480,700 | | | | 16,194,783 | |
| | |
HubSpot, Inc.* | | | 42,400 | | | | 25,007,096 | |
| | |
Marvell Technology, Inc. | | | 220,560 | | | | 15,417,144 | |
| | |
Microchip Technology, Inc. | | | 238,800 | | | | 21,850,200 | |
| | |
Monolithic Power Systems, Inc. | | | 34,000 | | | | 27,937,120 | |
| | |
Nice, Ltd., Sponsored ADR (Israel)* | | | 99,320 | | | | 17,080,060 | |
| | |
Palo Alto Networks, Inc.* | | | 49,757 | | | | 16,868,121 | |
| | |
Samsara, Inc., Class A* | | | 345,800 | | | | 11,653,460 | |
| | |
Smartsheet, Inc., Class A* | | | 377,300 | | | | 16,631,384 | |
| | |
Synopsys, Inc.* | | | 18,835 | | | | 11,207,955 | |
| | |
Teradyne, Inc. | | | 185,900 | | | | 27,567,111 | |
| | |
Tyler Technologies, Inc.* | | | 37,100 | | | | 18,653,138 | |
| | |
Universal Display Corp. | | | 47,064 | | | | 9,895,206 | |
| | |
Vertex, Inc., Class A* | | | 108,700 | | | | 3,918,635 | |
| | |
Total Information Technology | | | | | | | 417,453,915 | |
| |
Materials - 2.2% | | | | | |
| | |
Martin Marietta Materials, Inc. | | | 31,900 | | | | 17,283,420 | |
The accompanying notes are an integral part of these financial statements.
5
| | |
| | AMG TimesSquare Mid Cap Growth Fund Schedule of Portfolio Investments (continued) |
| | | | | | | | |
| | | Shares | | | Value | |
| |
Materials - 2.2% (continued) | | | | | |
| | |
RPM International, Inc. | | | 110,900 | | | | $11,941,712 | |
| | |
Total Materials | | | | | | | 29,225,132 | |
| | |
Real Estate - 2.2% | | | | | | | | |
| | |
CoStar Group, Inc.* | | | 210,400 | | | | 15,599,056 | |
| | |
CubeSmart, REIT | | | 323,500 | | | | 14,612,495 | |
| | |
Total Real Estate | | | | | | | 30,211,551 | |
| | |
Total Common Stocks | | | | | | | | |
(Cost $820,530,142) | | | | | | | 1,302,938,968 | |
| | |
| | | Principal
Amount | | | | |
Short-Term Investments - 3.8% | | | | | | | | |
| |
Joint Repurchase Agreements - 0.3%2 | | | | | |
| | |
Bethesda Securities LLC, dated 06/28/24, due 07/01/24, 5.450% total to be received $110,436 (collateralized by various U.S. Government Agency Obligations, 2.500% - 6.070%, 10/01/27 - 01/01/57, totaling $112,594) | | | $110,386 | | | | 110,386 | |
| | |
State of Wisconsin Investment Board, dated 06/28/24, due 07/01/24, 5.450% total to be received $4,001,817 (collateralized by various U.S. Treasuries, 0.125% - 3.625%, 10/15/25 -02/15/53, totaling $4,072,199) | | | 4,000,000 | | | | 4,000,000 | |
| | |
Total Joint Repurchase Agreements | | | | | | | 4,110,386 | |
| | | | | | | | |
| | | Shares | | | Value | |
| |
Other Investment Companies - 3.5% | | | | | |
| | |
Dreyfus Government Cash Management Fund, Institutional Shares, 5.19%3 | | | 18,665,397 | | | | $18,665,397 | |
| | |
Dreyfus Institutional Preferred Government Money Market Fund, Institutional Shares, 5.27%3 | | | 27,998,095 | | | | 27,998,095 | |
| | |
Total Other Investment Companies | | | | | | | 46,663,492 | |
| |
Total Short-Term Investments | | | | | |
(Cost $50,773,878) | | | | | | | 50,773,878 | |
| | |
Total Investments - 100.3% | | | | | | | | |
(Cost $871,304,020) | | | | | | | 1,353,712,846 | |
| |
Other Assets, less Liabilities - (0.3)% | | | | (3,576,275 | ) |
| | |
Net Assets - 100.0% | | | | | | | $1,350,136,571 | |
| | * | Non-income producing security. |
| | 1 | Some of these securities, amounting to $25,499,001 or 1.9% of net assets, were out on loan to various borrowers and are collateralized by cash and various U.S. Treasury Obligations. See Note 4 of Notes to Financial Statements. |
| | 2 | Cash collateral received for securities lending activity was invested in these joint repurchase agreements. |
| | 3 | Yield shown represents the June 30, 2024, seven day average yield, which refers to the sum of the previous seven days’ dividends paid, expressed as an annual percentage. |
ADR American Depositary Receipt
REIT Real Estate Investment Trust
The accompanying notes are an integral part of these financial statements.
6
| | |
| | AMG TimesSquare Mid Cap Growth Fund Schedule of Portfolio Investments (continued) |
The following table summarizes the inputs used to value the Fund’s investments by the fair value hierarchy levels as of June 30, 2024:
| | | | | | | | | | | | | | | | |
| | | Level 1 | | | Level 2 | | | Level 3 | | | Total | |
| | | | |
Investments in Securities | | | | | | | | | | | | | | | | |
| | | | |
Common Stocks† | | $ | 1,302,938,968 | | | | — | | | | — | | | | $1,302,938,968 | |
| | | | |
Short-Term Investments | | | | | | | | | | | | | | | | |
| | | | |
Joint Repurchase Agreements | | | — | | | | $4,110,386 | | | | — | | | | 4,110,386 | |
| | | | |
Other Investment Companies | | | 46,663,492 | | | | — | | | | — | | | | 46,663,492 | |
| | | | | | | | | | | | | | | | |
| | | | |
Total Investments in Securities | | $ | 1,349,602,460 | | | $ | 4,110,386 | | | | — | | | $ | 1,353,712,846 | |
| | | | | | | | | | | | | | | | |
| | † | All common stocks held in the Fund are Level 1 securities. For a detailed breakout of common stocks by major industry classification, please refer to the Fund’s Schedule of Portfolio Investments. |
For the six months ended June 30, 2024, there were no transfers in or out of Level 3.
The accompanying notes are an integral part of these financial statements.
7
| | |
| | AMG TimesSquare International Small Cap Fund Schedule of Portfolio Investments (unaudited) June 30, 2024 |
| | | | | | | | |
| | | Shares | | | Value | |
| | |
Common Stocks - 97.4% | | | | | | | | |
| |
Communication Services - 6.1% | | | | | |
| | |
Auto Trader Group PLC (United Kingdom)1 | | | 258,220 | | | | $2,599,029 | |
| | |
Baltic Classifieds Group PLC (Lithuania) | | | 244,770 | | | | 737,270 | |
| | |
CAR Group Ltd. (Australia) | | | 54,884 | | | | 1,284,953 | |
| | |
Hemnet Group AB (Sweden) | | | 27,100 | | | | 816,395 | |
| | |
Internet Initiative Japan, Inc. (Japan) | | | 94,230 | | | | 1,395,916 | |
| | |
IPSOS S.A. (France) | | | 22,210 | | | | 1,399,114 | |
| | |
Kadokawa Corp. (Japan) | | | 34,410 | | | | 554,296 | |
| | |
Total Communication Services | | | | | | | 8,786,973 | |
| |
Consumer Discretionary - 9.6% | | | | | |
| | |
ABC-Mart, Inc. (Japan) | | | 65,900 | | | | 1,156,548 | |
| | |
Arcos Dorados Holdings, Inc., Class A (Uruguay) | | | 193,320 | | | | 1,739,880 | |
| | |
CIE Automotive, S.A. (Spain) | | | 34,717 | | | | 961,429 | |
| | |
Dalata Hotel Group PLC (Ireland) | | | 496,566 | | | | 2,116,368 | |
| | |
Games Workshop Group PLC (United Kingdom) | | | 9,420 | | | | 1,268,768 | |
| | |
Goldwin, Inc. (Japan) | | | 16,390 | | | | 897,636 | |
| | |
JUMBO SA (Greece) | | | 72,230 | | | | 2,079,295 | |
| | |
KOMEDA Holdings Co., Ltd. (Japan)2 | | | 118,910 | | | | 2,010,822 | |
| | |
Samsonite International, S.A. (United States)1 | | | 569,660 | | | | 1,697,980 | |
| | |
Total Consumer Discretionary | | | | | | | 13,928,726 | |
| |
Consumer Staples - 7.8% | | | | | |
| | |
Kobe Bussan Co., Ltd. (Japan) | | | 66,588 | | | | 1,483,312 | |
| | |
Rohto Pharmaceutical Co., Ltd. (Japan) | | | 134,750 | | | | 2,821,065 | |
| | |
Sugi Holdings Co., Ltd. (Japan) | | | 34,501 | | | | 474,119 | |
| | |
Tate & Lyle PLC (United Kingdom) | | | 380,274 | | | | 2,874,612 | |
| | |
Viscofan, S.A. (Spain) | | | 56,014 | | | | 3,672,406 | |
| | |
Total Consumer Staples | | | | | | | 11,325,514 | |
| |
Energy - 2.6% | | | | | |
| | |
Pason Systems, Inc. (Canada) | | | 94,130 | | | | 1,268,094 | |
| | |
Technip Energies, N.V. (France) | | | 112,340 | | | | 2,523,879 | |
| | |
Total Energy | | | | | | | 3,791,973 | |
| |
Financials - 13.1% | | | | | |
| | |
FinecoBank Banca Fineco S.P.A. (Italy) | | | 89,853 | | | | 1,335,149 | |
| | |
Integral Corp. (Japan) | | | 100,120 | | | | 3,224,192 | |
| | |
Nordnet AB publ (Sweden)2 | | | 58,317 | | | | 1,222,261 | |
| | |
Pagseguro Digital, Ltd., Class A (Brazil)* | | | 62,920 | | | | 735,535 | |
| | |
Rakuten Bank, Ltd. (Japan)* | | | 196,600 | | | | 3,583,986 | |
| | |
Ringkjoebing Landbobank A/S (Denmark) | | | 18,920 | | | | 3,164,839 | |
| | |
St James’s Place PLC (United Kingdom) | | | 162,300 | | | | 1,115,302 | |
| | |
Steadfast Group, Ltd. (Australia) | | | 724,173 | | | | 2,972,103 | |
| | |
Topdanmark AS (Denmark)2 | | | 30,341 | | | | 1,602,467 | |
| | |
Total Financials | | | | | | | 18,955,834 | |
| | | | | | | | |
| | | Shares | | | Value | |
| |
Health Care - 8.2% | | | | | |
| | |
Ambu A/S, Class B (Denmark)*,2 | | | 102,180 | | | | $1,966,784 | |
| | |
Amplifon S.P.A. (Italy)2 | | | 28,765 | | | | 1,022,881 | |
| | |
Craneware PLC (United Kingdom) | | | 74,230 | | | | 2,167,569 | |
| | |
Nakanishi, Inc. (Japan) | | | 70,670 | | | | 1,118,874 | |
| | |
Siegfried Holding AG (Switzerland) | | | 3,390 | | | | 3,515,946 | |
| | |
Tecan Group AG (Switzerland)2 | | | 6,050 | | | | 2,025,644 | |
| | |
Total Health Care | | | | | | | 11,817,698 | |
| |
Industrials - 25.7% | | | | | |
| | |
Ag Growth International, Inc. (Canada) | | | 24,520 | | | | 941,333 | |
| | |
ALS, Ltd. (Australia) | | | 201,330 | | | | 1,875,085 | |
| | |
Arcadis, N.V. (Netherlands) | | | 23,260 | | | | 1,471,923 | |
| | |
AZ-COM MARUWA Holdings, Inc. (Japan)2 | | | 115,410 | | | | 840,713 | |
| | |
Bodycote PLC (United Kingdom) | | | 313,719 | | | | 2,694,539 | |
| | |
Daiei Kankyo Co., Ltd. (Japan) | | | 150,270 | | | | 2,555,306 | |
| | |
Danieli & C Officine Meccaniche S.P.A. (Italy) | | | 36,310 | | | | 1,384,349 | |
| | |
Diploma PLC (United Kingdom) | | | 33,880 | | | | 1,770,968 | |
| | |
DMG Mori Co., Ltd. (Japan) | | | 90,100 | | | | 2,356,739 | |
| | |
HD Hyundai Marine Solution Co., Ltd. (South Korea)* | | | 1,200 | | | | 113,331 | |
| | |
Howden Joinery Group PLC (United Kingdom) | | | 158,383 | | | | 1,751,707 | |
| | |
Interpump Group S.P.A. (Italy) | | | 9,217 | | | | 408,932 | |
| | |
IPH, Ltd. (Australia) | | | 326,270 | | | | 1,359,571 | |
| | |
Konecranes Oyj (Finland) | | | 38,110 | | | | 2,159,356 | |
| | |
MEITEC Group Holdings, Inc. (Japan) | | | 109,400 | | | | 2,217,627 | |
| | |
Nexans, S.A. (France) | | | 16,500 | | | | 1,815,958 | |
| | |
Organo Corp. (Japan) | | | 42,810 | | | | 2,199,800 | |
| | |
RENK Group AG (Germany)* | | | 35,610 | | | | 963,901 | |
| | |
Rotork PLC (United Kingdom) | | | 424,220 | | | | 1,804,040 | |
| | |
Saab AB, Class B (Sweden)2 | | | 89,980 | | | | 2,161,756 | |
| | |
SMS Co., Ltd. (Japan) | | | 49,130 | | | | 624,054 | |
| | |
SPIE, S.A. (France) | | | 58,720 | | | | 2,127,451 | |
| | |
Ventia Services Group Pty, Ltd. (Australia) | | | 581,500 | | | | 1,479,524 | |
| | |
Total Industrials | | | | | | | 37,077,963 | |
| |
Information Technology - 12.3% | | | | | |
| | |
Accton Technology Corp. (Taiwan) | | | 103,540 | | | | 1,762,195 | |
| | |
Alten, S.A. (France) | | | 3,500 | | | | 385,375 | |
| | |
Appier Group, Inc. (Japan)* | | | 90,300 | | | | 678,680 | |
| | |
CyberArk Software, Ltd. (Israel)* | | | 10,520 | | | | 2,876,379 | |
| | |
Finatext Holdings, Ltd. (Japan)* | | | 155,080 | | | | 888,433 | |
| | |
Fortnox AB (Sweden) | | | 137,800 | | | | 829,009 | |
| | |
Indra Sistemas, S.A. (Spain) | | | 64,260 | | | | 1,319,568 | |
| | |
Keywords Studios PLC (Ireland) | | | 32,860 | | | | 960,366 | |
The accompanying notes are an integral part of these financial statements.
8
| | |
| | AMG TimesSquare International Small Cap Fund Schedule of Portfolio Investments (continued) |
| | | | | | | | |
| | |
Shares | | |
Value | |
| |
Information Technology - 12.3%
(continued) | | | | | |
| | |
Nova, Ltd. (Israel)* | | | 6,560 | | | | $1,538,517 | |
| | |
QT Group Oyj (Finland)*,2 | | | 23,900 | | | | 1,977,995 | |
| | |
Siltronic AG (Germany) | | | 7,200 | | | | 559,927 | |
| | |
Simplex Holdings, Inc. (Japan) | | | 79,860 | | | | 1,414,111 | |
| | |
Socionext, Inc. (Japan) | | | 27,540 | | | | 655,276 | |
| | |
Sopra Steria Group (France) | | | 9,843 | | | | 1,914,092 | |
| | |
Total Information Technology | | | | | | | 17,759,923 | |
| |
Materials - 5.2% | | | | | |
| | |
Acerinox, S.A. (Spain) | | | 208,400 | | | | 2,170,617 | |
| | |
Huhtamaki Oyj (Finland) | | | 47,040 | | | | 1,881,182 | |
| | |
Imdex, Ltd. (Australia) | | | 590,900 | | | | 870,611 | |
| | |
Osisko Gold Royalties, Ltd. (Canada)2 | | | 167,110 | | | | 2,604,280 | |
| | |
Total Materials | | | | | | | 7,526,690 | |
| |
Real Estate - 4.3% | | | | | |
| | |
KDX Realty Investment Corp., REIT (Japan) | | | 2,630 | | | | 2,556,535 | |
| | |
Merlin Properties Socimi SA, REIT (Spain)2 | | | 136,680 | | | | 1,523,469 | |
| | |
The UNITE Group PLC, REIT (United Kingdom) | | | 193,830 | | | | 2,186,657 | |
| | |
Total Real Estate | | | | | | | 6,266,661 | |
| |
Utilities - 2.5% | | | | | |
| | |
Nippon Gas Co., Ltd. (Japan) | | | 233,910 | | | | 3,532,050 | |
| | |
Total Common Stocks
(Cost $117,408,699) | | | | | | | 140,770,005 | |
| | |
Preferred Stock - 0.6% | | | | | | | | |
| | |
Industrials - 0.6% | | | | | | | | |
| | |
Jungheinrich AG, 2.590% (Germany) | | | 27,860 | | | | 918,756 | |
| | |
Total Preferred Stock | | | | | | | | |
| | |
(Cost $960,571) | | | | | | | 918,756 | |
| | |
Rights - 0.0% | | | | | | | | |
| | |
Health Care - 0.0% | | | | | | | | |
| | |
Amplifon S.P.A., (Italy)* | | | | | | | | |
| | |
(Cost $0) | | | 28,765 | | | | 0 | |
| | |
| | | | | | | | |
| | | | | | | | |
| | | Principal
Amount | | | Value | |
| | |
Short-Term Investments - 3.5% | | | | | | | | |
| |
Joint Repurchase Agreements - 2.8%3 | | | | | |
| | |
Bethesda Securities LLC, dated 06/28/24, due 07/01/24, 5.450% total to be received $90,771 (collateralized by various U.S. Government Agency Obligations, 2.500% - 6.070%, 10/01/27 - 01/01/57, totaling $92,545) | | | $90,730 | | | | $90,730 | |
| | |
State of Wisconsin Investment Board, dated 06/28/24, due 07/01/24, 5.450% total to be received $3,901,771 (collateralized by various U.S. Treasuries, 0.125% - 3.625%, 10/15/25 -02/15/53, totaling $3,970,394) | | | 3,900,000 | | | | 3,900,000 | |
| |
Total Joint Repurchase Agreements | | | | 3,990,730 | |
| | |
| | | Shares | | | | |
| |
Other Investment Companies - 0.7% | | | | | |
| | |
Dreyfus Government Cash Management Fund, Institutional Shares, 5.19%4 | | | 394,116 | | | | 394,116 | |
| | |
Dreyfus Institutional Preferred Government Money Market Fund, Institutional Shares, 5.27%4 | | | 591,175 | | | | 591,175 | |
| |
Total Other Investment Companies | | | | 985,291 | |
| |
Total Short-Term Investments
(Cost $4,976,021) | | | | 4,976,021 | |
| |
Total Investments - 101.5%
(Cost $123,345,291) | | | | 146,664,782 | |
| |
Other Assets, less Liabilities - (1.5)% | | | | (2,104,402 | ) |
| |
Net Assets - 100.0% | | | | $144,560,380 | |
| | | | | |
| * | Non-income producing security. |
| 1 | Security exempt from registration under Rule 144A of the Securities Act of 1933. These securities may be resold in transactions exempt from registration, normally to qualified institutional buyers. At June 30, 2024, the value of these securities amounted to $4,297,009 or 3.0% of net assets. |
| 2 | Some of these securities, amounting to $9,881,047 or 6.8% of net assets, were out on loan to various borrowers and are collateralized by cash and various U.S. Treasury Obligations. See Note 4 of Notes to Financial Statements. |
| 3 | Cash collateral received for securities lending activity was invested in these joint repurchase agreements. |
| 4 | Yield shown represents the June 30, 2024, seven day average yield, which refers to the sum of the previous seven days’ dividends paid, expressed as an annual percentage. |
REIT Real Estate Investment Trust
The accompanying notes are an integral part of these financial statements.
9
| | |
| | AMG TimesSquare International Small Cap Fund Schedule of Portfolio Investments (continued) |
The following table summarizes the inputs used to value the Fund’s investments by the fair value hierarchy levels as of June 30, 2024:
| | | | | | | | | | | | | | | | | | | | |
| | | Level 1 | | Level 21 | | Level 3 | | Total |
| | | | |
Investments in Securities | | | | | | | | | | | | | | | | | | | | |
| | | | |
Common Stocks | | | | | | | | | | | | | | | | | | | | |
| | | | |
Industrials | | | | $3,402,914 | | | | | $33,675,049 | | | | | — | | | | | $37,077,963 | |
| | | | |
Financials | | | | 2,338,002 | | | | | 16,617,832 | | | | | — | | | | | 18,955,834 | |
| | | | |
Information Technology | | | | 5,375,262 | | | | | 12,384,661 | | | | | — | | | | | 17,759,923 | |
| | | | |
Consumer Discretionary | | | | 3,819,175 | | | | | 10,109,551 | | | | | — | | | | | 13,928,726 | |
| | | | |
Health Care | | | | 2,167,569 | | | | | 9,650,129 | | | | | — | | | | | 11,817,698 | |
| | | | |
Consumer Staples | | | | 2,874,612 | | | | | 8,450,902 | | | | | — | | | | | 11,325,514 | |
| | | | |
Communication Services | | | | — | | | | | 8,786,973 | | | | | — | | | | | 8,786,973 | |
| | | | |
Materials | | | | 2,604,280 | | | | | 4,922,410 | | | | | — | | | | | 7,526,690 | |
| | | | |
Real Estate | | | | — | | | | | 6,266,661 | | | | | — | | | | | 6,266,661 | |
| | | | |
Energy | | | | 1,268,094 | | | | | 2,523,879 | | | | | — | | | | | 3,791,973 | |
| | | | |
Utilities | | | | — | | | | | 3,532,050 | | | | | — | | | | | 3,532,050 | |
| | | | |
Preferred Stock | | | | | | | | | | | | | | | | | | | | |
| | | | |
Industrials | | | | — | | | | | 918,756 | | | | | — | | | | | 918,756 | |
| | | | |
Rights | | | | | | | | | | | | | | | | | | | | |
| | | | |
Health Care | | | | — | | | | | 0 | | | | | — | | | | | — | |
| | | | |
Short-Term Investments | | | | | | | | | | | | | | | | | | | | |
| | | | |
Joint Repurchase Agreements | | | | — | | | | | 3,990,730 | | | | | — | | | | | 3,990,730 | |
| | | | |
Other Investment Companies | | | | 985,291 | | | | | — | | | | | — | | | | | 985,291 | |
| | | | | | | | | | | | | | | | | | | | |
| | | | |
Total Investment in Securities | | | | $24,835,199 | | | | | $121,829,583 | | | | | — | | | | | $146,664,782 | |
| | | | | | | | | | | | | | | | | | | | |
| | 1 | An external pricing service is used to reflect any impact on security value due to market movements between the time the Fund valued such foreign securities and the earlier closing of foreign markets. |
For the six months ended June 30, 2024, there were no transfers in or out of Level 3.
The accompanying notes are an integral part of these financial statements.
10
| | |
| | AMG TimesSquare Emerging Markets Small Cap Fund Schedule of Portfolio Investments (unaudited) June 30, 2024 |
| | | | | | | | |
| | | Shares | | | Value | |
| | |
Common Stocks - 101.1% | | | | | | | | |
| | |
Communication Services - 6.6% | | | | | | | | |
| | |
Converge ICT Solutions, Inc. (Philippines)* | | | 152,000 | | | | $29,802 | |
| | |
KINX, Inc. (South Korea) | | | 860 | | | | 51,773 | |
| | |
Megacable Holdings SAB de CV (Mexico) | | | 7,150 | | | | 18,044 | |
| | |
Railtel Corp. of India, Ltd. (India) | | | 4,659 | | | | 25,935 | |
| | |
Total Communication Services | | | | | | | 125,554 | |
| |
Consumer Discretionary - 18.9% | | | | | |
| | |
Arcos Dorados Holdings, Inc., Class A (Uruguay) | | | 3,860 | | | | 34,740 | |
| | |
Cartrade Tech, Ltd. (India)* | | | 3,500 | | | | 32,727 | |
| | |
Despegar.com Corp. (Argentina)* | | | 3,900 | | | | 51,597 | |
| | |
JUMBO SA (Greece) | | | 785 | | | | 22,598 | |
| | |
Kalyan Jewellers India, Ltd. (India) | | | 3,969 | | | | 23,812 | |
| | |
Minor International PCL (Thailand) | | | 25,500 | | | | 20,786 | |
| | |
MR DIY Group M Bhd (Malaysia)1 | | | 54,800 | | | | 22,535 | |
| | |
OPAP, S.A. (Greece) | | | 1,100 | | | | 17,247 | |
| | |
PDS, Ltd. (India) | | | 4,540 | | | | 29,926 | |
| | |
Raymond, Ltd. (India) | | | 1,300 | | | | 45,489 | |
| | |
Tam Jai International Co., Ltd. (Hong Kong) | | | 158,800 | | | | 20,923 | |
| | |
Varroc Engineering, Ltd. (India)*,1 | | | 2,450 | | | | 19,092 | |
| | |
Xtep International Holdings, Ltd. (China) | | | 34,000 | | | | 20,889 | |
| | |
Total Consumer Discretionary | | | | | | | 362,361 | |
| |
Consumer Staples - 5.6% | | | | | |
| | |
Coca-Cola Icecek A.S. (Turkey) | | | 910 | | | | 23,018 | |
| | |
Giant Biogene Holding Co., Ltd. (China)1 | | | 3,202 | | | | 18,733 | |
| | |
LT Foods, Ltd. (India) | | | 7,250 | | | | 22,212 | |
| | |
Midi Utama Indonesia Tbk PT (Indonesia) | | | 763,200 | | | | 18,643 | |
| | |
ZJLD Group, Inc. (China)1 | | | 22,950 | | | | 23,699 | |
| | |
Total Consumer Staples | | | | | | | 106,305 | |
| |
Energy - 1.2% | | | | | |
| | |
AKR Corporindo Tbk PT (Indonesia) | | | 221,800 | | | | 21,943 | |
| |
Financials - 10.7% | | | | | |
| | |
Bairong, Inc. (China)*,1 | | | 18,700 | | | | 21,302 | |
| | |
BSE, Ltd. (India) | | | 379 | | | | 11,696 | |
| | |
Central Depository Services India, Ltd. (India) | | | 80 | | | | 2,283 | |
| | |
The Co. for Cooperative Insurance (Saudi Arabia) | | | 485 | | | | 18,689 | |
| | |
Green World FinTech Service Co., Ltd. (Taiwan) | | | 2,387 | | | | 31,850 | |
| | |
Kfin Technologies, Ltd. (India)* | | | 3,080 | | | | 25,794 | |
| | |
Pagseguro Digital, Ltd., Class A (Brazil)* | | | 1,760 | | | | 20,574 | |
| | |
PB Fintech, Ltd. (India)* | | | 1,556 | | | | 26,067 | |
| | |
Prudent Corporate Advisory Services, Ltd. (India) | | | 1,075 | | | | 24,416 | |
| | |
Tracxn Technologies, Ltd. (India)* | | | 21,731 | | | | 22,906 | |
| | |
Total Financials | | | | | | | 205,577 | |
| | |
| | | | | | | | |
| | | | | | | | |
| | | Shares | | | Value | |
| |
Health Care - 12.5% | | | | | |
| | |
Arrail Group, Ltd. (China)*,1 | | | 30,550 | | | | $20,089 | |
| | |
Bora Pharmaceuticals Co., Ltd. (Taiwan) | | | 1,549 | | | | 39,583 | |
| | |
Caregen Co., Ltd. (South Korea) | | | 1,440 | | | | 22,736 | |
| | |
Jinxin Fertility Group, Ltd. (China)1 | | | 68,100 | | | | 24,236 | |
| | |
Kangji Medical Holdings, Ltd. (China) | | | 26,350 | | | | 18,828 | |
| | |
Lotus Pharmaceutical Co., Ltd. (Taiwan) | | | 3,100 | | | | 29,575 | |
| | |
Lunit, Inc. (South Korea)* | | | 480 | | | | 16,180 | |
| | |
PharmaResearch Co., Ltd. (South Korea) | | | 230 | | | | 24,775 | |
| | |
Shanghai INT Medical Instruments Co., Ltd. (China) | | | 5,100 | | | | 17,596 | |
| | |
T&L Co., Ltd. (South Korea) | | | 520 | | | | 26,365 | |
| | |
Total Health Care | | | | | | | 239,963 | |
| |
Industrials - 12.1% | | | | | |
| | |
Allcargo Logistics, Ltd. (India)* | | | 25,000 | | | | 18,135 | |
| | |
Container Corp. Of India, Ltd. (India) | | | 30 | | | | 374 | |
| | |
Embraer, S.A., Sponsored ADR (Brazil)* | | | 750 | | | | 19,350 | |
| | |
Frontken Corp. Bhd (Malaysia) | | | 21,650 | | | | 20,420 | |
| | |
Grupo Aeroportuario del Centro Norte SAB de CV (Mexico) | | | 310 | | | | 2,631 | |
| | |
Grupo Traxion SAB de CV (Mexico)*,1 | | | 16,650 | | | | 24,754 | |
| | |
Hanwha Aerospace Co., Ltd. (South Korea) | | | 190 | | | | 34,266 | |
| | |
HD Hyundai Electric Co., Ltd. (South Korea) | | | 50 | | | | 11,173 | |
| | |
HD Hyundai Marine Solution Co., Ltd. (South Korea)* | | | 10 | | | | 944 | |
| | |
Hyosung Heavy Industries Corp. (South Korea) | | | 70 | | | | 17,476 | |
| | |
InPost, S.A. (Poland)* | | | 21 | | | | 370 | |
| | |
LIG Nex1 Co., Ltd. (South Korea) | | | 230 | | | | 36,760 | |
| | |
Maharah Human Resources Co. (Saudi Arabia) | | | 15,150 | | | | 24,184 | |
| | |
Quess Corp., Ltd. (India)1 | | | 2,881 | | | | 20,759 | |
| | |
Total Industrials | | | | | | | 231,596 | |
| |
Information Technology - 27.1% | | | | | |
| | |
Accton Technology Corp. (Taiwan) | | | 2,200 | | | | 37,443 | |
| | |
Alchip Technologies, Ltd. (Taiwan) | | | 380 | | | | 28,612 | |
| | |
Andes Technology Corp. (Taiwan) | | | 2,100 | | | | 27,943 | |
| | |
AP Memory Technology Corp. (Taiwan) | | | 2,350 | | | | 27,889 | |
| | |
Brogent Technologies, Inc. (Taiwan) | | | 200 | | | | 998 | |
| | |
Chinasoft International, Ltd. (China) | | | 10,850 | | | | 5,691 | |
| | |
Cyient, Ltd. (India) | | | 1,194 | | | | 26,225 | |
| | |
eCloudvalley Digital Technology Co., Ltd. (Taiwan) | | | 9,001 | | | | 28,853 | |
| | |
Elite Material Co., Ltd. (Taiwan) | | | 2,170 | | | | 31,633 | |
| | |
Genesys International Corp., Ltd. (India)* | | | 4,357 | | | | 30,906 | |
| | |
HPSP Co., Ltd. (South Korea) | | | 740 | | | | 20,809 | |
| | |
ISC Co., Ltd. (South Korea) | | | 740 | | | | 34,784 | |
The accompanying notes are an integral part of these financial statements.
11
| | |
| | AMG TimesSquare Emerging Markets Small Cap Fund Schedule of Portfolio Investments (continued) |
| | | | | | | | |
| | | Shares | | | Value | |
| |
Information Technology - 27.1%
(continued) | | | | | |
| | |
LWSA, S.A. (Brazil)*,1 | | | 19,650 | | | | $14,272 | |
| | |
M31 Technology Corp. (Taiwan) | | | 1,116 | | | | 38,783 | |
| | |
Metrodata Electronics Tbk PT (Indonesia) | | | 621,050 | | | | 21,808 | |
| | |
NEXTIN, Inc. (South Korea) | | | 680 | | | | 34,047 | |
| | |
Rategain Travel Technologies, Ltd. (India)* | | | 2,700 | | | | 24,106 | |
| | |
SOLUM Co., Ltd. (South Korea)* | | | 1,710 | | | | 25,963 | |
| | |
TOTVS, S.A. (Brazil) | | | 2,959 | | | | 16,118 | |
| | |
WinWay Technology Co., Ltd. (Taiwan) | | | 1,280 | | | | 41,315 | |
| | |
Total Information Technology | | | | | | | 518,198 | |
| |
Materials - 4.8% | | | | | |
| | |
EPL, Ltd. (India) | | | 9,150 | | | | 21,699 | |
| | |
NANOTIM Corp. (South Korea)* | | | 2,260 | | | | 22,267 | |
| | |
Samator Indo Gas Tbk PT (Indonesia) | | | 268,050 | | | | 29,219 | |
| | |
Welspun Corp., Ltd. (India) | | | 2,810 | | | | 18,426 | |
| | |
Total Materials | | | | | | | 91,611 | |
| |
Real Estate - 0.9% | | | | | |
| | |
Cencosud Shopping, S.A. (Chile) | | | 11,850 | | | | 17,944 | |
| | |
| | | | | | | | |
| | | | | | | | |
| | | Shares | | | Value | |
| |
Utilities - 0.7% | | | | | |
| | |
Emirates Central Cooling Systems Corp. (United Arab Emirates) | | | 34,700 | | | | $13,793 | |
| | |
Total Common Stocks
(Cost $1,692,007) | | | | | | | 1,934,845 | |
| | |
Short-Term Investments - 0.7% | | | | | | | | |
| |
Other Investment Companies - 0.7% | | | | | |
| | |
Dreyfus Government Cash Management Fund, Institutional Shares, 5.19%2 | | | 5,678 | | | | 5,678 | |
| | |
Dreyfus Institutional Preferred Government Money Market Fund, Institutional Shares, 5.27%2 | | | 8,518 | | | | 8,518 | |
| | |
Total Short-Term Investments
(Cost $14,196) | | | | | | | 14,196 | |
| | |
Total Investments - 101.8%
(Cost $1,706,203) | | | | | | | 1,949,041 | |
| |
Other Assets, less Liabilities - (1.8)% | | | | (34,512 | ) |
| |
Net Assets - 100.0% | | | | $1,914,529 | |
| |
| | | | | |
| * | Non-income producing security. |
| 1 | Security exempt from registration under Rule 144A of the Securities Act of 1933. These securities may be resold in transactions exempt from registration, normally to qualified institutional buyers. At June 30, 2024, the value of these securities amounted to $209,471 or 10.9% of net assets. |
| 2 | Yield shown represents the June 30, 2024, seven day average yield, which refers to the sum of the previous seven days’ dividends paid, expressed as an annual percentage. |
ADR American Depositary Receipt
The accompanying notes are an integral part of these financial statements.
12
| | |
| | AMG TimesSquare Emerging Markets Small Cap Fund Schedule of Portfolio Investments (continued) |
The following table summarizes the inputs used to value the Fund’s investments by the fair value hierarchy levels as of June 30, 2024:
| | | | | | | | | | | | | | | | | | | | |
| | | Level 1 | | Level 21 | | Level 3 | | Total |
| | | | |
Investments in Securities | | | | | | | | | | | | | | | | | | | | |
| | | | |
Common Stocks | | | | | | | | | | | | | | | | | | | | |
| | | | |
Information Technology | | | | $52,198 | | | | | $466,000 | | | | | — | | | | | $518,198 | |
| | | | |
Consumer Discretionary | | | | 126,182 | | | | | 236,179 | | | | | — | | | | | 362,361 | |
| | | | |
Health Care | | | | 69,158 | | | | | 170,805 | | | | | — | | | | | 239,963 | |
| | | | |
Industrials | | | | 84,439 | | | | | 147,157 | | | | | — | | | | | 231,596 | |
| | | | |
Financials | | | | 20,574 | | | | | 185,003 | | | | | — | | | | | 205,577 | |
| | | | |
Communication Services | | | | 18,044 | | | | | 107,510 | | | | | — | | | | | 125,554 | |
| | | | |
Consumer Staples | | | | 41,661 | | | | | 64,644 | | | | | — | | | | | 106,305 | |
| | | | |
Materials | | | | 29,219 | | | | | 62,392 | | | | | — | | | | | 91,611 | |
| | | | |
Energy | | | | 21,943 | | | | | — | | | | | — | | | | | 21,943 | |
| | | | |
Real Estate | | | | 17,944 | | | | | — | | | | | — | | | | | 17,944 | |
| | | | |
Utilities | | | | 13,793 | | | | | — | | | | | — | | | | | 13,793 | |
| | | | |
Short-Term Investments | | | | | | | | | | | | | | | | | | | | |
| | | | |
Other Investment Companies | | | | 14,196 | | | | | — | | | | | — | | | | | 14,196 | |
| | | | | | | | | | | | | | | | | | | | |
| | | | |
Total Investment in Securities | | | $ | 509,351 | | | | $ | 1,439,690 | | | | | — | | | | $ | 1,949,041 | |
| | | | | | | | | | | | | | | | | | | | |
| 1 | An external pricing service is used to reflect any impact on security value due to market movements between the time the Fund valued such foreign securities and the earlier closing of foreign markets. |
For the six months ended June 30, 2024, there were no transfers in or out of Level 3.
The accompanying notes are an integral part of these financial statements.
13
| | |
| | AMG TimesSquare Global Small Cap Fund Schedule of Portfolio Investments (unaudited) June 30, 2024 |
| | | | | | | | |
| | | Shares | | | Value | |
| | |
Common Stocks - 98.4% | | | | | | | | |
| |
Communication Services - 2.2% | | | | | |
| | |
Auto Trader Group PLC (United Kingdom)1 | | | 2,100 | | | | $21,137 | |
| | |
Integral Ad Science Holding
Corp. (United States)* | | | 1,910 | | | | 18,565 | |
| | |
Total Communication Services | | | | | | | 39,702 | |
| |
Consumer Discretionary - 8.0% | | | | | |
| | |
Arcos Dorados Holdings, Inc., Class A (Uruguay) | | | 3,330 | | | | 29,970 | |
| | |
Brunswick Corp. (United States) | | | 355 | | | | 25,833 | |
| | |
CIE Automotive, S.A. (Spain) | | | 425 | | | | 11,770 | |
| | |
Dalata Hotel Group PLC (Ireland) | | | 3,700 | | | | 15,769 | |
| | |
Games Workshop Group PLC (United Kingdom) | | | 100 | | | | 13,469 | |
| | |
Goldwin, Inc. (Japan) | | | 150 | | | | 8,215 | |
| | |
Topgolf Callaway Brands Corp. (United States)* | | | 835 | | | | 12,776 | |
| | |
Warby Parker, Inc., Class A (United States)* | | | 1,600 | | | | 25,696 | |
| | |
Total Consumer Discretionary | | | | | | | 143,498 | |
| |
Consumer Staples - 8.0% | | | | | |
| | |
Kobe Bussan Co., Ltd. (Japan) | | | 1,075 | | | | 23,947 | |
| | |
MatsukiyoCocokara & Co. (Japan) | | | 900 | | | | 12,924 | |
| | |
Performance Food Group Co. (United States)* | | | 620 | | | | 40,988 | |
| | |
Rohto Pharmaceutical Co., Ltd. (Japan) | | | 1,075 | | | | 22,506 | |
| | |
Tate & Lyle PLC (United Kingdom) | | | 2,450 | | | | 18,520 | |
| | |
Viscofan, S.A. (Spain) | | | 384 | | | | 25,176 | |
| | |
Total Consumer Staples | | | | | | | 144,061 | |
| |
Energy - 1.5% | | | | | |
| | |
Pason Systems, Inc. (Canada) | | | 1,150 | | | | 15,492 | |
| | |
Technip Energies, N.V. (France) | | | 525 | | | | 11,795 | |
| | |
Total Energy | | | | | | | 27,287 | |
| |
Financials - 17.5% | | | | | |
| | |
Bowhead Specialty Holdings, Inc. (United States)* | | | 756 | | | | 19,157 | |
| | |
FinecoBank Banca Fineco S.P.A. (Italy) | | | 900 | | | | 13,373 | |
| | |
Integral Corp. (Japan) | | | 600 | | | | 19,322 | |
| | |
Jack Henry & Associates, Inc. (United States) | | | 135 | | | | 22,413 | |
| | |
Nordnet AB publ (Sweden)2 | | | 750 | | | | 15,719 | |
| | |
PJT Partners, Inc., Class A (United States) | | | 160 | | | | 17,266 | |
| | |
Rakuten Bank, Ltd. (Japan)* | | | 1,400 | | | | 25,522 | |
| | |
RenaissanceRe Holdings, Ltd. (Bermuda) | | | 120 | | | | 26,821 | |
| | |
Ringkjoebing Landbobank A/S (Denmark) | | | 100 | | | | 16,728 | |
| | |
Safety Insurance Group, Inc. (United States) | | | 360 | | | | 27,011 | |
| | |
St James’s Place PLC (United Kingdom) | | | 2,050 | | | | 14,087 | |
| | |
Steadfast Group, Ltd. (Australia) | | | 8,575 | | | | 35,193 | |
| | |
Topdanmark AS (Denmark) | | | 350 | | | | 18,485 | |
| | | | | | | | |
| | | Shares | | | Value | |
| | |
Webster Financial Corp. (United States) | | | 970 | | | | $42,282 | |
| | |
Total Financials | | | | | | | 313,379 | |
| |
Health Care - 8.4% | | | | | |
| | |
Amplifon S.P.A. (Italy)2 | | | 300 | | | | 10,668 | |
| | |
Ascendis Pharma A/S, ADR (Denmark)* | | | 160 | | | | 21,821 | |
| | |
Chemed Corp. (United States) | | | 75 | | | | 40,693 | |
| | |
Encompass Health Corp. (United States) | | | 265 | | | | 22,734 | |
| | |
Siegfried Holding AG (Switzerland) | | | 20 | | | | 20,743 | |
| | |
Tecan Group AG (Switzerland) | | | 50 | | | | 16,741 | |
| | |
Xenon Pharmaceuticals, Inc. (Canada)* | | | 440 | | | | 17,156 | |
| | |
Total Health Care | | | | | | | 150,556 | |
| |
Industrials - 26.1% | | | | | |
| | |
Ag Growth International, Inc. (Canada) | | | 250 | | | | 9,597 | |
| | |
Arcadis, N.V. (Netherlands) | | | 225 | | | | 14,238 | |
| | |
AZ-COM MARUWA Holdings, Inc. (Japan) | | | 1,475 | | | | 10,745 | |
| | |
The AZEK Co., Inc. (United States)* | | | 630 | | | | 26,542 | |
| | |
Casella Waste Systems, Inc.,
Class A (United States)* | | | 425 | | | | 42,168 | |
| | |
Daiei Kankyo Co., Ltd. (Japan) | | | 1,250 | | | | 21,256 | |
| | |
Diploma PLC (United Kingdom) | | | 275 | | | | 14,375 | |
| | |
Driven Brands Holdings, Inc. (United States)* | | | 790 | | | | 10,057 | |
| | |
Embraer, S.A., Sponsored ADR (Brazil)* | | | 650 | | | | 16,770 | |
| | |
EMCOR Group, Inc. (United States) | | | 85 | | | | 31,032 | |
| | |
Esab Corp. (United States) | | | 370 | | | | 34,939 | |
| | |
HD Hyundai Marine Solution Co.,
Ltd. (South Korea)* | | | 10 | | | | 944 | |
| | |
IPH, Ltd. (Australia) | | | 2,375 | | | | 9,897 | |
| | |
KION Group AG (Germany) | | | 366 | | | | 15,289 | |
| | |
Loar Holdings, Inc. (United States)* | | | 231 | | | | 12,338 | |
| | |
Nexans, S.A. (France) | | | 150 | | | | 16,509 | |
| | |
Regal Rexnord Corp. (United States) | | | 290 | | | | 39,214 | |
| | |
Rotork PLC (United Kingdom) | | | 2,275 | | | | 9,675 | |
| | |
Saab AB, Class B (Sweden)2 | | | 800 | | | | 19,220 | |
| | |
Tetra Tech, Inc. (United States) | | | 135 | | | | 27,605 | |
| | |
Ventia Services Group Pty, Ltd. (Australia) | | | 7,300 | | | | 18,573 | |
| | |
The Weir Group PLC (United Kingdom) | | | 850 | | | | 21,258 | |
| | |
WESCO International, Inc. (United States) | | | 102 | | | | 16,169 | |
| | |
WillScot Mobile Mini Holdings
Corp. (United States)* | | | 800 | | | | 30,112 | |
| | |
Total Industrials | | | | | | | 468,522 | |
| |
Information Technology - 18.5% | | | | | |
| | |
Accton Technology Corp. (Taiwan) | | | 550 | | | | 9,361 | |
| | |
Astera Labs, Inc. (United States)*,2 | | | 3 | | | | 182 | |
| | |
CyberArk Software, Ltd. (Israel)* | | | 150 | | | | 41,013 | |
The accompanying notes are an integral part of these financial statements.
14
| | |
| | AMG TimesSquare Global Small Cap Fund Schedule of Portfolio Investments (continued) |
| | | | | | | | |
| | | Shares | | | Value | |
| | |
Information Technology - 18.5% (continued) | | | | | | | | |
| | |
JFrog, Ltd. (Israel)* | | | 975 | | | | $36,611 | |
| | |
MACOM Technology Solutions Holdings,
Inc. (United States)* | | | 260 | | | | 28,982 | |
| | |
Nice, Ltd., Sponsored ADR (Israel)*,2 | | | 160 | | | | 27,515 | |
| | |
Onto Innovation, Inc. (United States)* | | | 145 | | | | 31,836 | |
| | |
Simplex Holdings, Inc. (Japan) | | | 1,650 | | | | 29,217 | |
| | |
Sopra Steria Group (France) | | | 100 | | | | 19,446 | |
| | |
Synaptics, Inc. (United States)* | | | 400 | | | | 35,280 | |
| | |
TOTVS, S.A. (Brazil) | | | 2,133 | | | | 11,619 | |
| | |
Universal Display Corp. (United States) | | | 180 | | | | 37,845 | |
| | |
Workiva, Inc. (United States)* | | | 320 | | | | 23,357 | |
| | |
Total Information Technology | | | | | | | 332,264 | |
| | |
Materials - 2.2% | | | | | | | | |
| | |
Avient Corp. (United States) | | | 570 | | | | 24,880 | |
| | |
Huhtamaki Oyj (Finland) | | | 350 | | | | 13,997 | |
| | |
Total Materials | | | | | | | 38,877 | |
| | |
Real Estate - 4.6% | | | | | | | | |
| | |
KDX Realty Investment Corp., REIT (Japan) | | | 30 | | | | 29,162 | |
| | |
National Storage Affiliates Trust,
REIT (United States) | | | 960 | | | | 39,571 | |
| | |
The UNITE Group PLC, REIT (United Kingdom) | | | 1,200 | | | | 13,538 | |
| | |
Total Real Estate | | | | | | | 82,271 | |
| | |
Utilities - 1.4% | | | | | | | | |
| | |
Nippon Gas Co., Ltd. (Japan) | | | 1,725 | | | | 26,048 | |
| | |
Total Common Stocks | | | | | | | | |
(Cost $1,520,704) | | | | | | | 1,766,465 | |
| | | | | | | | |
| | | Shares | | | Value | |
| | |
Rights - 0.0% | | | | | | | | |
| | |
Health Care - 0.0% | | | | | | | | |
| | |
Amplifon S.P.A.* | | | | | | | | |
(Cost $0) | | | 300 | | | | $0 | |
| | |
| | | Principal
Amount | | | | |
Short-Term Investments - 3.8% | | | | | | | | |
| |
Joint Repurchase Agreements - 1.3%3 | | | | | |
| | |
Bethesda Securities LLC, dated 06/28/24, due 07/01/24, 5.450% total to be received $23,749 (collateralized by various U.S. Government Agency Obligations, 2.500% - 6.070%, 10/01/27 - 01/01/57, totaling $24,213) | | | $23,738 | | | | 23,738 | |
| | |
| | | Shares | | | | |
| | |
Other Investment Companies - 2.5% | | | | | | | | |
| | |
Dreyfus Government Cash Management Fund, Institutional Shares, 5.19%4 | | | 17,615 | | | | 17,615 | |
| | |
Dreyfus Institutional Preferred Government Money Market Fund, Institutional Shares, 5.27%4 | | | 26,423 | | | | 26,423 | |
| | |
Total Other Investment Companies | | | | | | | 44,038 | |
| | |
Total Short-Term Investments | | | | | | | | |
(Cost $67,776) | | | | | | | 67,776 | |
| | |
Total Investments - 102.2% | | | | | | | | |
(Cost $1,588,480) | | | | | | | 1,834,241 | |
| |
Other Assets, less Liabilities - (2.2)% | | | | (38,684 | ) |
| | |
Net Assets - 100.0% | | | | | | | $1,795,557 | |
| | * | Non-income producing security. |
| | 1 | Security exempt from registration under Rule 144A of the Securities Act of 1933. This security may be resold in transactions exempt from registration, normally to qualified institutional buyers. At June 30, 2024, the value of this security amounted to $21,137 or 1.2% of net assets. |
| | 2 | Some of these securities, amounting to $61,487 or 3.4% of net assets, were out on loan to various borrowers and are collateralized by cash and various U.S. Treasury Obligations. See Note 4 of Notes to Financial Statements. |
| | 3 | Cash collateral received for securities lending activity was invested in these joint repurchase agreements. |
| | 4 | Yield shown represents the June 30, 2024, seven day average yield, which refers to the sum of the previous seven days’ dividends paid, expressed as an annual percentage. |
ADR American Depositary Receipt
REIT Real Estate Investment Trust
The accompanying notes are an integral part of these financial statements.
15
| | |
| | AMG TimesSquare Global Small Cap Fund Schedule of Portfolio Investments (continued) |
The following table summarizes the inputs used to value the Fund’s investments by the fair value hierarchy levels as of June 30, 2024:
| | | | | | | | | | | | | | | | |
| | | Level 1 | | | Level 21 | | | Level 3 | | | Total | |
| | | | |
Investments in Securities | | | | | | | | | | | | | | | | |
| | | | |
Common Stocks | | | | | | | | | | | | | | | | |
| | | | |
Industrials | | | $297,487 | | | | $171,035 | | | | — | | | | $468,522 | |
| | | | |
Information Technology | | | 274,240 | | | | 58,024 | | | | — | | | | 332,264 | |
| | | | |
Financials | | | 173,435 | | | | 139,944 | | | | — | | | | 313,379 | |
| | | | |
Health Care | | | 102,404 | | | | 48,152 | | | | — | | | | 150,556 | |
| | | | |
Consumer Staples | | | 59,508 | | | | 84,553 | | | | — | | | | 144,061 | |
| | | | |
Consumer Discretionary | | | 94,275 | | | | 49,223 | | | | — | | | | 143,498 | |
| | | | |
Real Estate | | | 39,571 | | | | 42,700 | | | | — | | | | 82,271 | |
| | | | |
Communication Services | | | 18,565 | | | | 21,137 | | | | — | | | | 39,702 | |
| | | | |
Materials | | | 24,880 | | | | 13,997 | | | | — | | | | 38,877 | |
| | | | |
Energy | | | 15,492 | | | | 11,795 | | | | — | | | | 27,287 | |
| | | | |
Utilities | | | — | | | | 26,048 | | | | — | | | | 26,048 | |
| | | | |
Rights | | | | | | | | | | | | | | | | |
| | | | |
Health Care | | | — | | | | 0 | | | | — | | | | — | |
| | | | |
Short-Term Investments | | | | | | | | | | | | | | | | |
| | | | |
Joint Repurchase Agreements | | | — | | | | 23,738 | | | | — | | | | 23,738 | |
| | | | |
Other Investment Companies | | | 44,038 | | | | — | | | | — | | | | 44,038 | |
| | | | | | | | | | | | | | | | |
| | | | |
Total Investment in Securities | | | $1,143,895 | | | | $690,346 | | | | — | | | | $1,834,241 | |
| | | | | | | | | | | | | | | | |
| | 1 | An external pricing service is used to reflect any impact on security value due to market movements between the time the Fund valued such foreign securities and the earlier closing of foreign markets. |
For the six months ended June 30, 2024, there were no transfers in or out of Level 3.
The accompanying notes are an integral part of these financial statements.
16
| | |
| | Statement of Assets and Liabilities (unaudited) June 30, 2024 |
| | | | | | | | | | | | | | | | | | | | |
| | | AMG
TimesSquare
Small Cap
Growth Fund | | | AMG
TimesSquare
Mid Cap
Growth Fund | | | AMG
TimesSquare
International Small
Cap Fund | | | AMG
TimesSquare
Emerging
Markets Small
Cap Fund | | | AMG
TimesSquare
Global Small
Cap Fund | |
| | | | | |
Assets: | | | | | | | | | | | | | | | | | | | | |
| | | | | |
Investments at value1 (including securities on loan valued at $11,397,291, $25,499,001, $9,881,047, $0, and $61,487, respectively) | | | $171,798,959 | | | | $1,353,712,846 | | | | $146,664,782 | | | | $1,949,041 | | | | $1,834,241 | |
| | | | | |
Cash | | | — | | | | — | | | | — | | | | — | | | | 126 | |
| | | | | |
Foreign currency2 | | | — | | | | — | | | | 967,377 | | | | 4,351 | | | | 8,898 | |
| | | | | |
Receivable for investments sold | | | 26,473 | | | | — | | | | 1,411,595 | | | | 14,517 | | | | 502 | |
| | | | | |
Dividend and interest receivables | | | 87,684 | | | | 380,672 | | | | 1,096,496 | | | | 9,505 | | | | 2,149 | |
| | | | | |
Securities lending income receivable | | | 1,728 | | | | 4,553 | | | | 2,060 | | | | — | | | | 10 | |
| | | | | |
Receivable for Fund shares sold | | | 39,215 | | | | 1,596,871 | | | | 71,103 | | | | — | | | | — | |
| | | | | |
Receivable from affiliate | | | 5,842 | | | | — | | | | 6,050 | | | | 10,968 | | | | 5,925 | |
| | | | | |
Prepaid expenses and other assets | | | 20,661 | | | | 51,419 | | | | 22,185 | | | | 626 | | | | 41 | |
| | | | | |
Total assets | | | 171,980,562 | | | | 1,355,746,361 | | | | 150,241,648 | | | | 1,989,008 | | | | 1,851,892 | |
| | | | | |
Liabilities: | | | | | | | | | | | | | | | | | | | | |
| | | | | |
Payable upon return of securities loaned | | | 5,468,224 | | | | 4,110,386 | | | | 3,990,730 | | | | — | | | | 23,738 | |
| | | | | |
Payable for investments purchased | | | 54,874 | | | | — | | | | 1,424,153 | | | | 14,975 | | | | — | |
| | | | | |
Payable for Fund shares repurchased | | | 4,006 | | | | 281,092 | | | | 57,715 | | | | — | | | | — | |
| | | | | |
Payable for foreign capital gains tax | | | — | | | | — | | | | — | | | | 4,418 | | | | — | |
| | | | | |
Due to custodian | | | — | | | | 3,328 | | | | — | | | | — | | | | — | |
| | | | | |
Accrued expenses: | | | | | | | | | | | | | | | | | | | | |
| | | | | |
Investment advisory and management fees | | | 106,660 | | | | 868,044 | | | | 90,388 | | | | 1,481 | | | | 1,031 | |
| | | | | |
Administrative fees | | | 20,252 | | | | 164,819 | | | | 18,078 | | | | 234 | | | | 221 | |
| | | | | |
Distribution fees | | | — | | | | — | | | | — | | | | 28 | | | | 12 | |
| | | | | |
Shareholder service fees | | | 2,767 | | | | 84,836 | | | | 6,236 | | | | 17 | | | | — | |
| | | | | |
Other | | | 54,044 | | | | 97,285 | | | | 93,968 | | | | 53,326 | | | | 31,333 | |
| | | | | |
Total liabilities | | | 5,710,827 | | | | 5,609,790 | | | | 5,681,268 | | | | 74,479 | | | | 56,335 | |
| | | | |
Commitments and Contingencies (Notes 2 & 6) | | | | | | | | | | | | | | | | | |
| | | | | |
Net Assets | | | $166,269,735 | | | | $1,350,136,571 | | | | $144,560,380 | | | | $1,914,529 | | | | $1,795,557 | |
| | | | | |
1 Investments at cost | | | $144,720,197 | | | | $871,304,020 | | | | $123,345,291 | | | | $1,706,203 | | | | $1,588,480 | |
| | | | | |
2 Foreign currency at cost | | | — | | | | — | | | | $978,697 | | | | $4,350 | | | | $9,041 | |
The accompanying notes are an integral part of these financial statements.
17
| | |
| | Statement of Assets and Liabilities (continued) |
| | | | | | | | | | | | | | | | | | | | |
| | | AMG
TimesSquare
Small Cap
Growth Fund | | | AMG
TimesSquare
Mid Cap
Growth Fund | | | AMG
TimesSquare
International Small
Cap Fund | | | AMG
TimesSquare
Emerging
Markets Small
Cap Fund | | | AMG
TimesSquare
Global Small
Cap Fund | |
| | | | | |
Net Assets Represent: | | | | | | | | | | | | | | | | | | | | |
| | | | | |
Paid-in capital | | | $137,199,301 | | | | $827,548,494 | | | | $328,844,282 | | | | $2,759,661 | | | | $1,782,464 | |
| | | | | |
Total distributable earnings (loss) | | | 29,070,434 | | | | 522,588,077 | | | | (184,283,902) | | | | (845,132) | | | | 13,093 | |
| | | | | |
Net Assets | | | $166,269,735 | | | | $1,350,136,571 | | | | $144,560,380 | | | | $1,914,529 | | | | $1,795,557 | |
| | | | | |
Class N: | | | | | | | | | | | | | | | | | | | | |
| | | | | |
Net Assets | | | $14,306,570 | | | | $415,219,571 | | | | $8,297,866 | | | | $126,078 | | | | $60,641 | |
| | | | | |
Shares outstanding | | | 1,222,343 | | | | 25,356,682 | | | | 558,138 | | | | 12,171 | | | | 5,641 | |
| | | | | |
Net asset value, offering and redemption price per share | | | $11.70 | | | | $16.38 | | | | $14.87 | | | | $10.36 | | | | $10.75 | |
| | | | | |
Class I: | | | | | | | | | | | | | | | | | | | | |
| | | | | |
Net Assets | | | $8,815,539 | | | | $422,390,064 | | | | $84,312,627 | | | | $438,426 | | | | $35,493 | |
| | | | | |
Shares outstanding | | | 704,349 | | | | 24,069,889 | | | | 5,653,462 | | | | 41,863 | | | | 3,283 | |
| | | | | |
Net asset value, offering and redemption price per share | | | $12.52 | | | | $17.55 | | | | $14.91 | | | | $10.47 | | | | $10.81 | |
| | | | | |
Class Z: | | | | | | | | | | | | | | | | | | | | |
| | | | | |
Net Assets | | | $143,147,626 | | | | $512,526,936 | | | | $51,949,887 | | | | $1,350,025 | | | | $1,699,423 | |
| | | | | |
Shares outstanding | | | 11,353,449 | | | | 29,025,642 | | | | 3,485,317 | | | | 128,972 | | | | 157,172 | |
| | | | | |
Net asset value, offering and redemption price per share | | | $12.61 | | | | $17.66 | | | | $14.91 | | | | $10.47 | | | | $10.81 | |
The accompanying notes are an integral part of these financial statements.
18
| | |
| | Statement of Operations (unaudited) For the six months ended June 30, 2024 |
| | | | | | | | | | | | | | | | | | | | |
| | | AMG
TimesSquare
Small Cap
Growth Fund | | AMG
TimesSquare
Mid Cap
Growth Fund | | AMG
TimesSquare
International Small
Cap Fund | | AMG
TimesSquare
Emerging
Markets Small
Cap Fund | | AMG
TimesSquare
Global Small
Cap Fund |
| | | | | |
Investment Income: | | | | | | | | | | | | | | | | | | | | |
| | | | | |
Dividend income | | | $485,583 | | | | $4,859,721 | | | | $2,236,192 | | | | $19,331 | 1 | | | $16,356 | |
| | | | | |
Interest income | | | 765 | | | | 649 | | | | 935 | | | | — | | | | — | |
| | | | | |
Securities lending income | | | 12,149 | | | | 32,947 | | | | 47,260 | | | | 16 | | | | 85 | |
| | | | | |
Foreign withholding tax | | | — | | | | (21,510 | ) | | | (198,446 | ) | | | (1,472 | ) | | | (1,014 | ) |
| | | | | |
Total investment income | | | 498,497 | | | | 4,871,807 | | | | 2,085,941 | | | | 17,875 | | | | 15,427 | |
| | | | | |
Expenses: | | | | | | | | | | | | | | | | | | | | |
| | | | | |
Investment advisory and management fees | | | 650,049 | | | | 5,275,579 | | | | 621,161 | | | | 8,955 | | | | 6,384 | |
| | | | | |
Administrative fees | | | 123,427 | | | | 1,001,692 | | | | 124,232 | | | | 1,414 | | | | 1,368 | |
| | | | | |
Distribution fees - Class N | | | — | | | | — | | | | — | | | | 174 | | | | 75 | |
| | | | | |
Shareholder servicing fees - Class N | | | 12,733 | | | | 415,757 | | | | 10,756 | | | | 104 | | | | — | |
| | | | | |
Shareholder servicing fees - Class I | | | 3,117 | | | | 103,573 | | | | 28,915 | | | | — | | | | — | |
| | | | | |
Professional fees | | | 24,786 | | | | 58,260 | | | | 29,756 | | | | 26,735 | | | | 18,170 | |
| | | | | |
Registration fees | | | 20,173 | | | | 31,423 | | | | 24,137 | | | | 823 | | | | 24 | |
| | | | | |
Custodian fees | | | 18,739 | | | | 52,209 | | | | 54,570 | | | | 34,787 | | | | 15,748 | |
| | | | | |
Trustee fees and expenses | | | 6,357 | | | | 49,386 | | | | 7,418 | | | | 69 | | | | 68 | |
| | | | | |
Reports to shareholders | | | 5,277 | | | | 60,351 | | | | 32,432 | | | | 2,685 | | | | 2,711 | |
| | | | | |
Transfer agent fees | | | 3,122 | | | | 23,308 | | | | 11,969 | | | | 284 | | | | 183 | |
| | | | | |
Interest expense | | | — | | | | — | | | | 15,636 | | | | — | | | | — | |
| | | | | |
Miscellaneous | | | 5,808 | | | | 29,847 | | | | 8,995 | | | | 1,418 | | | | 1,370 | |
| | | | | |
Total expenses before offsets | | | 873,588 | | | | 7,101,385 | | | | 969,977 | | | | 77,448 | | | | 46,101 | |
| | | | | |
Expense reimbursements | | | (43,119 | ) | | | — | | | | (45,044 | ) | | | (65,387 | ) | | | (36,905 | ) |
| | | | | |
Expense reductions | | | (19,498 | ) | | | (48,807 | ) | | | — | | | | — | | | | — | |
| | | | | |
Net expenses | | | 810,971 | | | | 7,052,578 | | | | 924,933 | | | | 12,061 | | | | 9,196 | |
| | | | | | | | | | | | | | | | | | | | |
| | | | | |
Net investment income (loss) | | | (312,474 | ) | | | (2,180,771 | ) | | | 1,161,008 | | | | 5,814 | | | | 6,231 | |
| | | | | |
Net Realized and Unrealized Gain (Loss): | | | | | | | | | | | | | | | | | | | | |
| | | | | |
Net realized gain on investments | | | 4,569,068 | | | | 37,624,224 | | | | 14,710,889 | | | | 119,478 | | | | 27,731 | |
| | | | | |
Net realized loss on foreign currency transactions | | | — | | | | — | | | | (219,293 | ) | | | (514 | ) | | | (246 | ) |
| | | | | |
Net change in unrealized appreciation/depreciation on investments | | | 1,951,686 | | | | 45,794,881 | | | | (8,733,711 | ) | | | (64,219 | ) | | | (32,746 | ) |
| | | | | |
Net change in unrealized appreciation/depreciation on foreign currency translations | | | — | | | | (341 | ) | | | 38,371 | | | | (167 | ) | | | (182 | ) |
| | | | | |
Net realized and unrealized gain (loss) | | | 6,520,754 | | | | 83,418,764 | | | | 5,796,256 | | | | 54,578 | | | | (5,443 | ) |
| | | | | | | | | | | | | | | | | | | | |
| | | | | |
Net increase in net assets resulting from operations | | | $6,208,280 | | | | $81,237,993 | | | | $6,957,264 | | | | $60,392 | | | | $788 | |
| | | | | |
1 Includes non-recurring dividends of $3,482. | | | | | | | | | | | | | | | | | | | | |
The accompanying notes are an integral part of these financial statements.
19
| | |
| | Statements of Changes in Net Assets For the six months ended June 30, 2024 (unaudited) and the fiscal year ended December 31, 2023 |
| | | | | | | | | | | | | | | | | | | | | | | | |
| | | AMG
TimesSquare
Small Cap
Growth Fund | | AMG
TimesSquare
Mid Cap
Growth Fund | | AMG
TimesSquare
International Small
Cap Fund |
| | | | | | |
| | | June 30, 2024 | | December 31, 2023 | | June 30, 2024 | | December 31, 2023 | | June 30, 2024 | | December 31, 2023 |
| | | | | | |
Increase in Net Assets Resulting From Operations: | | | | | | | | | | | | | | | | | | | | | | | | |
| | | | | | |
Net investment income (loss) | | | $(312,474 | ) | | | $(695,613 | ) | | | $(2,180,771 | ) | | | $(3,238,837 | ) | | | $1,161,008 | | | | $3,898,825 | |
| | | | | | |
Net realized gain (loss) on investments | | | 4,569,068 | | | | 14,608,737 | | | | 37,624,224 | | | | 86,220,127 | | | | 14,491,596 | | | | (900,745 | ) |
| | | | | | |
Net change in unrealized appreciation/depreciation on investments | | | 1,951,686 | | | | 15,619,003 | | | | 45,794,540 | | | | 185,202,792 | | | | (8,695,340 | ) | | | 25,298,283 | |
| | | | | | |
Net increase in net assets resulting from operations | | | 6,208,280 | | | | 29,532,127 | | | | 81,237,993 | | | | 268,184,082 | | | | 6,957,264 | | | | 28,296,363 | |
| | | | | | |
Distributions to Shareholders: | | | | | | | | | | | | | | | | | | | | | | | | |
| | | | | | |
Class N | | | — | | | | — | | | | — | | | | (17,077,801 | ) | | | — | | | | (155,058 | ) |
| | | | | | |
Class I | | | — | | | | — | | | | — | | | | (15,567,072 | ) | | | — | | | | (1,731,160 | ) |
| | | | | | |
Class Z | | | — | | | | — | | | | — | | | | (18,481,755 | ) | | | — | | | | (1,880,383 | ) |
| | | | | | |
Total distributions to shareholders | | | — | | | | — | | | | — | | | | (51,126,628 | ) | | | — | | | | (3,766,601 | ) |
| | | | | | |
Capital Share Transactions:1 | | | | | | | | | | | | | | | | | | | | | | | | |
| | | | | | |
Net decrease from capital share transactions | | | (5,291,112 | ) | | | (92,828,128 | ) | | | (26,368,409 | ) | | | (44,126,377 | ) | | | (52,876,881 | ) | | | (272,230,172 | ) |
| | | | | | | | | | | | | | | | | | | | | | | | |
| | | | | | |
Total increase (decrease) in net assets | | | 917,168 | | | | (63,296,001 | ) | | | 54,869,584 | | | | 172,931,077 | | | | (45,919,617 | ) | | | (247,700,410 | ) |
| | | | | | |
Net Assets: | | | | | | | | | | | | | | | | | | | | | | | | |
| | | | | | |
Beginning of period | | | 165,352,567 | | | | 228,648,568 | | | | 1,295,266,987 | | | | 1,122,335,910 | | | | 190,479,997 | | | | 438,180,407 | |
| | | | | | |
End of period | | | $166,269,735 | | | | $165,352,567 | | | | $1,350,136,571 | | | | $1,295,266,987 | | | | $144,560,380 | | | | $190,479,997 | |
1 See Note 1(g) of the Notes to Financial Statements.
The accompanying notes are an integral part of these financial statements.
20
| | |
| | Statements of Changes in Net Assets (continued) For the six months ended June 30, 2024 (unaudited) and the fiscal year ended December 31, 2023 |
| | | | | | | | | | | | | | | | |
| | | AMG
TimesSquare
Emerging
Markets Small Cap Fund | | | AMG
TimesSquare
Global Small
Cap Fund | |
| | | | |
| | | June 30, 2024 | | | December 31, 2023 | | | June 30, 2024 | | | December 31, 2023 | |
| | | | |
Increase in Net Assets Resulting From Operations: | | | | | | | | | | | | | | | | |
| | | | |
Net investment income | | | $5,814 | | | | $4,802 | | | | $6,231 | | | | $6,494 | |
| | | | |
Net realized gain (loss) on investments | | | 118,964 | | | | 59,529 | | | | 27,485 | | | | (750 | ) |
| | | | |
Net change in unrealized appreciation/depreciation on investments | | | (64,386 | ) | | | 471,301 | | | | (32,928 | ) | | | 223,418 | |
| | | | |
Net increase in net assets resulting from operations | | | 60,392 | | | | 535,632 | | | | 788 | | | | 229,162 | |
| | | | |
Distributions to Shareholders: | | | | | | | | | | | | | | | | |
| | | | |
Class N | | | — | | | | (2,179 | ) | | | — | | | | (178 | ) |
| | | | |
Class I | | | — | | | | (9,752 | ) | | | — | | | | (193 | ) |
| | | | |
Class Z | | | — | | | | (31,518 | ) | | | — | | | | (9,197 | ) |
| | | | |
Total distributions to shareholders | | | — | | | | (43,449 | ) | | | — | | | | (9,568 | ) |
| | | | |
Capital Share Transactions:1 | | | | | | | | | | | | | | | | |
| | | | |
Net increase (decrease) from capital share transactions | | | (50,166 | ) | | | (3,292,898 | ) | | | 14,409 | | | | (142,183 | ) |
| | | | | | | | | | | | | | | | |
| | | | |
Total increase (decrease) in net assets | | | 10,226 | | | | (2,800,715 | ) | | | 15,197 | | | | 77,411 | |
| | | | |
Net Assets: | | | | | | | | | | | | | | | | |
| | | | |
Beginning of period | | | 1,904,303 | | | | 4,705,018 | | | | 1,780,360 | | | | 1,702,949 | |
| | | | |
End of period | | | $1,914,529 | | | | $1,904,303 | | | | $1,795,557 | | | | $1,780,360 | |
| | |
| 1 See Note 1(g) of the Notes to Financial Statements. | | | | | | | |
The accompanying notes are an integral part of these financial statements.
21
| | |
| | AMG TimesSquare Small Cap Growth Fund Financial Highlights For a share outstanding throughout each fiscal period |
| | | | | | | | | | | | | | | | | | | | | | | | | | | | | | | | |
| | | For the six | | | | | | | | | | | | |
| | | months ended | | | | For the fiscal years ended December 31, |
| Class N | | June 30, 2024
(unaudited) | | | | 2023 | | 2022 | | 2021 | | 2020 | | 2019 |
| | | | | | | |
Net Asset Value, Beginning of Period | | | | $11.28 | | | | | | | $9.69 | | | | | $14.09 | | | | | $16.45 | | | | | $13.96 | | | | | $12.21 | |
| | | | | | | |
Income (loss) from Investment Operations: | | | | | | | | | | | | | | | | | | | | | | | | | | | | | | | | |
| | | | | | | |
Net investment loss1,2 | | | | (0.03 | ) | | | | | | (0.06 | ) | | | | (0.09 | ) | | | | (0.17 | ) | | | | (0.11 | )3 | | | | (0.09 | ) |
| | | | | | | |
Net realized and unrealized gain (loss) on investments | | | | 0.45 | | | | | | | 1.65 | | | | | (3.62 | ) | | | | 1.18 | | | | | 4.92 | | | | | 3.47 | |
| | | | | | | |
Total income (loss) from investment operations | | | | 0.42 | | | | | | | 1.59 | | | | | (3.71 | ) | | | | 1.01 | | | | | 4.81 | | | | | 3.38 | |
| | | | | | | |
Less Distributions to Shareholders from: | | | | | | | | | | | | | | | | | | | | | | | | | | | | | | | | |
| | | | | | | |
Net realized gain on investments | | | | — | | | | | | | — | | | | | (0.69 | ) | | | | (3.37 | ) | | | | (2.32 | ) | | | | (1.63 | ) |
| | | | | | | |
Net Asset Value, End of Period | | | | $11.70 | | | | | | | $11.28 | | | | | $9.69 | | | | | $14.09 | | | | | $16.45 | | | | | $13.96 | |
| | | | | | | |
Total Return2,4 | | | | 3.72 | %5 | | | | | | 16.41 | % | | | | (26.41 | )% | | | | 6.72 | % | | | | 34.96 | % | | | | 27.98 | % |
| | | | | | | |
Ratio of net expenses to average net assets6 | | | | 1.18 | %7 | | | | | | 1.17 | % | | | | 1.17 | % | | | | 1.17 | %8 | | | | 1.16 | % | | | | 1.17 | % |
| | | | | | | |
Ratio of gross expenses to average net assets9 | | | | 1.24 | %7 | | | | | | 1.23 | % | | | | 1.20 | % | | | | 1.19 | %8 | | | | 1.20 | % | | | | 1.19 | % |
| | | | | | | |
Ratio of net investment loss to average net assets2 | | | | (0.57 | )%7 | | | | | | (0.53 | )% | | | | (0.79 | )% | | | | (0.97 | )% | | | | (0.79 | )% | | | | (0.63 | )% |
| | | | | | | |
Portfolio turnover | | | | 30 | %5 | | | | | | 63 | % | | | | 50 | % | | | | 65 | % | | | | 71 | % | | | | 62 | % |
| | | | | | | |
Net assets end of period (000’s) omitted | | | | $14,307 | | | | | | | $12,717 | | | | | $38,225 | | | | | $86,941 | | | | | $112,740 | | | | | $105,862 | |
| | | | | | | | | | | | | | | | | | | | | | | | | | | | | | | | | |
22
| | |
| | AMG TimesSquare Small Cap Growth Fund Financial Highlights For a share outstanding throughout each fiscal period |
| | | | | | | | | | | | | | | | | | | | | | | | | | | | | | | | |
| | | For the six | | | | | | | | | | | | |
| | | months ended | | | | For the fiscal years ended December 31, |
| Class I | | June 30, 2024
(unaudited) | | | | 2023 | | 2022 | | 2021 | | 2020 | | 2019 |
| | | | | | | |
Net Asset Value, Beginning of Period | | | | $12.06 | | | | | | | $10.34 | | | | | $14.96 | | | | | $17.25 | | | | | $14.53 | | | | | $12.64 | |
| | | | | | | |
Income (loss) from Investment Operations: | | | | | | | | | | | | | | | | | | | | | | | | | | | | | | | | |
| | | | | | | |
Net investment loss1,2 | | | | (0.03 | ) | | | | | | (0.05 | ) | | | | (0.08 | ) | | | | (0.15 | ) | | | | (0.10 | )3 | | | | (0.07 | ) |
| | | | | | | |
Net realized and unrealized gain (loss) on investments | | | | 0.49 | | | | | | | 1.77 | | | | | (3.85 | ) | | | | 1.23 | | | | | 5.14 | | | | | 3.59 | |
| | | | | | | |
Total income (loss) from investment operations | | | | 0.46 | | | | | | | 1.72 | | | | | (3.93 | ) | | | | 1.08 | | | | | 5.04 | | | | | 3.52 | |
| | | | | | | |
Less Distributions to Shareholders from: | | | | | | | | | | | | | | | | | | | | | | | | | | | | | | | | |
| | | | | | | |
Net realized gain on investments | | | | — | | | | | | | — | | | | | (0.69 | ) | | | | (3.37 | ) | | | | (2.32 | ) | | | | (1.63 | ) |
| | | | | | | |
Net Asset Value, End of Period | | | | $12.52 | | | | | | | $12.06 | | | | | $10.34 | | | | | $14.96 | | | | | $17.25 | | | | | $14.53 | |
| | | | | | | |
Total Return2,4 | | | | 3.82 | %5 | | | | | | 16.64 | % | | | | (26.34 | )% | | | | 6.81 | % | | | | 35.19 | % | | | | 28.13 | % |
| | | | | | | |
Ratio of net expenses to average net assets6 | | | | 1.05 | %7 | | | | | | 1.05 | % | | | | 1.05 | % | | | | 1.05 | %8 | | | | 1.03 | % | | | | 1.01 | % |
| | | | | | | |
Ratio of gross expenses to average net assets9 | | | | 1.11 | %7 | | | | | | 1.11 | % | | | | 1.08 | % | | | | 1.07 | %8 | | | | 1.07 | % | | | | 1.03 | % |
| | | | | | | |
Ratio of net investment loss to average net assets2 | | | | (0.44 | )%7 | | | | | | (0.41 | )% | | | | (0.67 | )% | | | | (0.85 | )% | | | | (0.66 | )% | | | | (0.47 | )% |
| | | | | | | |
Portfolio turnover | | | | 30 | %5 | | | | | | 63 | % | | | | 50 | % | | | | 65 | % | | | | 71 | % | | | | 62 | % |
| | | | | | | |
Net assets end of period (000’s) omitted | | | | $8,816 | | | | | | | $9,564 | | | | | $9,185 | | | | | $12,380 | | | | | $12,062 | | | | | $11,333 | |
| | | | | | | | | | | | | | | | | | | | | | | | | | | | | | | | | |
23
| | |
| | AMG TimesSquare Small Cap Growth Fund Financial Highlights For a share outstanding throughout each fiscal period |
| | | | | | | | | | | | | | | | | | | | | | | | | | | | | | | | |
| | | For the six | | | | | | | | | | | | |
| | | months ended | | | | For the fiscal years ended December 31, |
| Class Z | | June 30, 2024
(unaudited) | | | | 2023 | | 2022 | | 2021 | | 2020 | | 2019 |
| | | | | | | |
Net Asset Value, Beginning of Period | | | | $12.14 | | | | | | | $10.40 | | | | | $15.03 | | | | | $17.30 | | | | | $14.55 | | | | | $12.65 | |
| | | | | | | |
Income (loss) from Investment Operations: | | | | | | | | | | | | | | | | | | | | | | | | | | | | | | | | |
| | | | | | | |
Net investment loss1,2 | | | | (0.02 | ) | | | | | | (0.04 | ) | | | | (0.07 | ) | | | | (0.14 | ) | | | | (0.09 | )3 | | | | (0.07 | ) |
| | | | | | | |
Net realized and unrealized gain (loss) on investments | | | | 0.49 | | | | | | | 1.78 | | | | | (3.87 | ) | | | | 1.24 | | | | | 5.16 | | | | | 3.60 | |
| | | | | | | |
Total income (loss) from investment operations | | | | 0.47 | | | | | | | 1.74 | | | | | (3.94 | ) | | | | 1.10 | | | | | 5.07 | | | | | 3.53 | |
| | | | | | | |
Less Distributions to Shareholders from: | | | | | | | | | | | | | | | | | | | | | | | | | | | | | | | | |
| | | | | | | |
Net realized gain on investments | | | | — | | | | | | | — | | | | | (0.69 | ) | | | | (3.37 | ) | | | | (2.32 | ) | | | | (1.63 | ) |
| | | | | | | |
Net Asset Value, End of Period | | | | $12.61 | | | | | | | $12.14 | | | | | $10.40 | | | | | $15.03 | | | | | $17.30 | | | | | $14.55 | |
| | | | | | | |
Total Return2,4 | | | | 3.87 | %5 | | | | | | 16.73 | % | | | | (26.29 | )% | | | | 6.91 | % | | | | 35.35 | % | | | | 28.19 | % |
| | | | | | | |
Ratio of net expenses to average net assets6 | | | | 0.98 | %7 | | | | | | 0.97 | % | | | | 0.97 | % | | | | 0.97 | %8 | | | | 0.96 | % | | | | 0.97 | % |
| | | | | | | |
Ratio of gross expenses to average net assets9 | | | | 1.04 | %7 | | | | | | 1.03 | % | | | | 1.00 | % | | | | 0.99 | %8 | | | | 1.00 | % | | | | 0.99 | % |
| | | | | | | |
Ratio of net investment loss to average net assets2 | | | | (0.37 | )%7 | | | | | | (0.33 | )% | | | | (0.59 | )% | | | | (0.77 | )% | | | | (0.59 | )% | | | | (0.43 | )% |
| | | | | | | |
Portfolio turnover | | | | 30 | %5 | | | | | | 63 | % | | | | 50 | % | | | | 65 | % | | | | 71 | % | | | | 62 | % |
| | | | | | | |
Net assets end of period (000’s) omitted | | | | $143,148 | | | | | | | $143,072 | | | | | $181,238 | | | | | $312,604 | | | | | $320,535 | | | | | $367,787 | |
| | | | | | | | | | | | | | | | | | | | | | | | | | | | | | | | | |
| 1 | Per share numbers have been calculated using average shares. |
| 2 | Total returns and net investment loss would have been lower had certain expenses not been offset. |
| 3 | Includes non-recurring dividends. Without these dividends, net investment loss per share would have been $(0.12), $(0.10) and $(0.09) for Class N, Class I and Class Z, respectively. |
| 4 | The total return is calculated using the published Net Asset Value as of period end. |
| 6 | Includes reduction from broker recapture amounting to 0.01% for the six months ended June 30, 2024, 0.02%, 0.02%, 0.02%, 0.03% and 0.02% for the fiscal years ended December 31, 2023, 2022, 2021, 2020 and 2019, respectively. |
| 8 | Such ratio includes recapture of waived/reimbursed fees from prior periods amounting to 0.01%. |
| 9 | Excludes the impact of expense reimbursement or fee waivers and expense reductions such as brokerage credits, but includes expense repayments and non-reimbursable expenses, if any, such as interest, taxes, and extraordinary expenses. (See Note 1(c) and 2 in the Notes to Financial Statements.) |
24
| | |
| | AMG TimesSquare Mid Cap Growth Fund Financial Highlights For a share outstanding throughout each fiscal period |
| | | | | | | | | | | | | | | | | | | | | | | | | | | | | | | | |
| | | For the six | | | | | | | | | | | | |
| | | months ended | | | | For the fiscal years ended December 31, |
| Class N | | June 30, 2024
(unaudited) | | | | 2023 | | 2022 | | 2021 | | 2020 | | 2019 |
| | | | | | | |
Net Asset Value, Beginning of Period | | | | $15.41 | | | | | | | $12.88 | | | | | $17.24 | | | | | $19.66 | | | | | $17.69 | | | | | $15.00 | |
| | | | | | | |
Income (loss) from Investment Operations: | | | | | | | | | | | | | | | | | | | | | | | | | | | | | | | | |
| | | | | | | |
Net investment loss1,2 | | | | (0.04 | ) | | | | | | (0.06 | ) | | | | (0.06 | ) | | | | (0.10 | )3 | | | | (0.09 | )4 | | | | (0.07 | ) |
| | | | | | | |
Net realized and unrealized gain (loss) on investments | | | | 1.01 | | | | | | | 3.25 | | | | | (3.79 | ) | | | | 3.11 | | | | | 5.84 | | | | | 5.62 | |
| | | | | | | |
Total income (loss) from investment operations | | | | 0.97 | | | | | | | 3.19 | | | | | (3.85 | ) | | | | 3.01 | | | | | 5.75 | | | | | 5.55 | |
| | | | | | | |
Less Distributions to Shareholders from: | | | | | | | | | | | | | | | | | | | | | | | | | | | | | | | | |
| | | | | | | |
Net realized gain on investments | | | | — | | | | | | | (0.66 | ) | | | | (0.51 | ) | | | | (5.43 | ) | | | | (3.78 | ) | | | | (2.86 | ) |
| | | | | | | |
Net Asset Value, End of Period | | | | $16.38 | | | | | | | $15.41 | | | | | $12.88 | | | | | $17.24 | | | | | $19.66 | | | | | $17.69 | |
| | | | | | | |
Total Return2,5 | | | | 6.30 | %6 | | | | | | 24.82 | % | | | | (22.39 | )% | | | | 15.92 | % | | | | 33.03 | % | | | | 37.15 | % |
| | | | | | | |
Ratio of net expenses to average net assets7 | | | | 1.18 | %8 | | | | | | 1.18 | % | | | | 1.17 | % | | | | 1.17 | % | | | | 1.17 | % | | | | 1.17 | % |
| | | | | | | |
Ratio of gross expenses to average net assets9 | | | | 1.19 | %8 | | | | | | 1.19 | % | | | | 1.18 | % | | | | 1.18 | % | | | | 1.18 | % | | | | 1.18 | % |
| | | | | | | |
Ratio of net investment loss to average net assets2 | | | | (0.45 | )%8 | | | | | | (0.39 | )% | | | | (0.45 | )% | | | | (0.46 | )% | | | | (0.48 | )% | | | | (0.38 | )% |
| | | | | | | |
Portfolio turnover | | | | 13 | %6 | | | | | | 39 | % | | | | 44 | % | | | | 53 | % | | | | 74 | % | | | | 65 | % |
| | | | | | | |
Net assets end of period (000’s) omitted | | | | $415,220 | | | | | | | $411,238 | | | | | $368,938 | | | | | $535,289 | | | | | $613,501 | | | | | $518,267 | |
| | | | | | | | | | | | | | | | | | | | | | | | | | | | | | | | | |
25
| | |
| | AMG TimesSquare Mid Cap Growth Fund Financial Highlights For a share outstanding throughout each fiscal period |
| | | | | | | | | | | | | | | | | | | | | | | | | | | | | | | | |
| | | For the six | | | | | | | | | | | | |
| | | months ended | | | | For the fiscal years ended December 31, |
| Class I | | June 30, 2024
(unaudited) | | | | 2023 | | 2022 | | 2021 | | 2020 | | 2019 |
| | | | | | | |
Net Asset Value, Beginning of Period | | | | $16.50 | | | | | | | $13.73 | | | | | $18.31 | | | | | $20.58 | | | | | $18.35 | | | | | $15.46 | |
| | | | | | | |
Income (loss) from Investment Operations: | | | | | | | | | | | | | | | | | | | | | | | | | | | | | | | | |
| | | | | | | |
Net investment loss1,2 | | | | (0.03 | ) | | | | | | (0.04 | ) | | | | (0.04 | ) | | | | (0.07 | )3 | | | | (0.07 | )4 | | | | (0.05 | ) |
| | | | | | | |
Net realized and unrealized gain (loss) on investments | | | | 1.08 | | | | | | | 3.47 | | | | | (4.03 | ) | | | | 3.25 | | | | | 6.08 | | | | | 5.80 | |
| | | | | | | |
Total income (loss) from investment operations | | | | 1.05 | | | | | | | 3.43 | | | | | (4.07 | ) | | | | 3.18 | | | | | 6.01 | | | | | 5.75 | |
| | | | | | | |
Less Distributions to Shareholders from: | | | | | | | | | | | | | | | | | | | | | | | | | | | | | | | | |
| | | | | | | |
Net investment income | | | | — | | | | | | | — | | | | | — | | | | | (0.02 | ) | | | | — | | | | | — | |
| | | | | | | |
Net realized gain on investments | | | | — | | | | | | | (0.66 | ) | | | | (0.51 | ) | | | | (5.43 | ) | | | | (3.78 | ) | | | | (2.86 | ) |
| | | | | | | |
Total distributions to shareholders | | | | — | | | | | | | (0.66 | ) | | | | (0.51 | ) | | | | (5.45 | ) | | | | (3.78 | ) | | | | (2.86 | ) |
| | | | | | | |
Net Asset Value, End of Period | | | | $17.55 | | | | | | | $16.50 | | | | | $13.73 | | | | | $18.31 | | | | | $20.58 | | | | | $18.35 | |
| | | | | | | |
Total Return2,5 | | | | 6.36 | %6 | | | | | | 24.94 | % | | | | (22.23 | )% | | | | 16.04 | % | | | | 33.27 | % | | | | 37.33 | % |
| | | | | | | |
Ratio of net expenses to average net assets7 | | | | 1.03 | %8 | | | | | | 1.03 | % | | | | 1.02 | % | | | | 1.02 | % | | | | 1.04 | % | | | | 1.07 | % |
| | | | | | | |
Ratio of gross expenses to average net assets9 | | | | 1.04 | %8 | | | | | | 1.04 | % | | | | 1.03 | % | | | | 1.03 | % | | | | 1.05 | % | | | | 1.08 | % |
| | | | | | | |
Ratio of net investment loss to average net assets2 | | | | (0.30 | )%8 | | | | | | (0.24 | )% | | | | (0.30 | )% | | | | (0.31 | )% | | | | (0.35 | )% | | | | (0.28 | )% |
| | | | | | | |
Portfolio turnover | | | | 13 | %6 | | | | | | 39 | % | | | | 44 | % | | | | 53 | % | | | | 74 | % | | | | 65 | % |
| | | | | | | |
Net assets end of period (000’s) omitted | | | | $422,390 | | | | | | | $401,601 | | | | | $339,100 | | | | | $431,797 | | | | | $526,800 | | | | | $472,524 | |
| | | | | | | | | | | | | | | | | | | | | | | | | | | | | | | | | |
26
| | |
| | AMG TimesSquare Mid Cap Growth Fund Financial Highlights For a share outstanding throughout each fiscal period |
| | | | | | | | | | | | | | | | | | | | | | | | | | | | | | | | |
| | | For the six | | | | | | | | | | | | |
| | | months ended | | | | For the fiscal years ended December 31, |
| Class Z | | June 30, 2024
(unaudited) | | | | 2023 | | 2022 | | 2021 | | 2020 | | 2019 |
| | | | | | | |
Net Asset Value, Beginning of Period | | | | $16.60 | | | | | | | $13.81 | | | | | $18.39 | | | | | $20.65 | | | | | $18.39 | | | | | $15.48 | |
| | | | | | | |
Income (loss) from Investment Operations: | | | | | | | | | | | | | | | | | | | | | | | | | | | | | | | | |
| | | | | | | |
Net investment loss1,2 | | | | (0.02 | ) | | | | | | (0.03 | ) | | | | (0.04 | ) | | | | (0.06 | )3 | | | | (0.05 | )4 | | | | (0.03 | ) |
| | | | | | | |
Net realized and unrealized gain (loss) on investments | | | | 1.08 | | | | | | | 3.48 | | | | | (4.03 | ) | | | | 3.27 | | | | | 6.09 | | | | | 5.80 | |
| | | | | | | |
Total income (loss) from investment operations | | | | 1.06 | | | | | | | 3.45 | | | | | (4.07 | ) | | | | 3.21 | | | | | 6.04 | | | | | 5.77 | |
| | | | | | | |
Less Distributions to Shareholders from: | | | | | | | | | | | | | | | | | | | | | | | | | | | | | | | | |
| | | | | | | |
Net investment income | | | | — | | | | | | | — | | | | | — | | | | | (0.04 | ) | | | | — | | | | | — | |
| | | | | | | |
Net realized gain on investments | | | | — | | | | | | | (0.66 | ) | | | | (0.51 | ) | | | | (5.43 | ) | | | | (3.78 | ) | | | | (2.86 | ) |
| | | | | | | |
Total distributions to shareholders | | | | — | | | | | | | (0.66 | ) | | | | (0.51 | ) | | | | (5.47 | ) | | | | (3.78 | ) | | | | (2.86 | ) |
| | | | | | | |
Net Asset Value, End of Period | | | | $17.66 | | | | | | | $16.60 | | | | | $13.81 | | | | | $18.39 | | | | | $20.65 | | | | | $18.39 | |
| | | | | | | |
Total Return2,5 | | | | 6.39 | %6 | | | | | | 25.03 | % | | | | (22.18 | )% | | | | 16.10 | % | | | | 33.36 | % | | | | 37.41 | % |
| | | | | | | |
Ratio of net expenses to average net assets7 | | | | 0.98 | %8 | | | | | | 0.98 | % | | | | 0.97 | % | | | | 0.97 | % | | | | 0.97 | % | | | | 0.97 | % |
| | | | | | | |
Ratio of gross expenses to average net assets9 | | | | 0.99 | %8 | | | | | | 0.99 | % | | | | 0.98 | % | | | | 0.98 | % | | | | 0.98 | % | | | | 0.98 | % |
| | | | | | | |
Ratio of net investment loss to average net assets2 | | | | (0.25 | )%8 | | | | | | (0.19 | )% | | | | (0.25 | )% | | | | (0.26 | )% | | | | (0.28 | )% | | | | (0.18 | )% |
| | | | | | | |
Portfolio turnover | | | | 13 | %6 | | | | | | 39 | % | | | | 44 | % | | | | 53 | % | | | | 74 | % | | | | 65 | % |
| | | | | | | |
Net assets end of period (000’s) omitted | | | | $512,527 | | | | | | | $482,428 | | | | | $414,298 | | | | | $810,210 | | | | | $896,929 | | | | | $894,390 | |
| | | | | | | | | | | | | | | | | | | | | | | | | | | | | | | | | |
| 1 | Per share numbers have been calculated using average shares. |
| 2 | Total returns and net investment loss would have been lower had certain expenses not been offset. |
| 3 | Includes non-recurring dividends. Without these dividends, net investment loss per share would have been $(0.16), $(0.13) and $(0.12) for Class N, Class I and Class Z, respectively. |
| 4 | Includes non-recurring dividends. Without these dividends, net investment loss per share would have been $(0.11), $(0.08) and $(0.07) for Class N, Class I and Class Z, respectively. |
| 5 | The total return is calculated using the published Net Asset Value as of period end. |
| 7 | Includes reduction from broker recapture amounting to less than 0.01% for the six months ended June 30, 2024, and 0.01% for each fiscal year ended December 31, 2023, 2022, 2021, 2020 and 2019. |
| 9 | Excludes the impact of expense reimbursement or fee waivers and expense reductions such as brokerage credits, but includes expense repayments and non-reimbursable expenses, if any, such as interest, taxes, and extraordinary expenses. (See Note 1(c) and 2 in the Notes to Financial Statements.) |
27
| | |
| | AMG TimesSquare International Small Cap Fund Financial Highlights For a share outstanding throughout each fiscal period |
| | | | | | | | | | | | | | | | | | | | | | | | | | | | | | | | |
| | | For the six | | | | | | | | | | | | |
| | | months ended | | | | For the fiscal years ended December 31, |
| Class N | | June 30, 2024
(unaudited) | | | | 2023 | | 2022 | | 2021 | | 2020 | | 2019 |
| | | | | | | |
Net Asset Value, Beginning of Period | | | | $14.27 | | | | | | | $13.21 | | | | | $18.49 | | | | | $18.44 | | | | | $16.24 | | | | | $12.72 | |
| | | | | | | |
Income (loss) from Investment Operations: | | | | | | | | | | | | | | | | | | | | | | | | | | | | | | | | |
| | | | | | | |
Net investment income1,2 | | | | 0.09 | | | | | | | 0.14 | | | | | 0.19 | 3 | | | | 0.09 | | | | | 0.02 | | | | | 0.21 | 4 |
| | | | | | | | |
Net realized and unrealized gain (loss) on investments | | | | 0.51 | | | | | | | 1.16 | | | | | (5.36 | ) | | | | 0.14 | | | | | 2.18 | | | | | 3.55 | |
| | | | | | | |
Total income (loss) from investment operations | | | | 0.60 | | | | | | | 1.30 | | | | | (5.17 | ) | | | | 0.23 | | | | | 2.20 | | | | | 3.76 | |
| | | | | | | |
Less Distributions to Shareholders from: | | | | | | | | | | | | | | | | | | | | | | | | | | | | | | | | |
| | | | | | | |
Net investment income | | | | — | | | | | | | (0.24 | ) | | | | (0.11 | ) | | | | (0.18 | ) | | | | — | | | | | (0.24 | ) |
| | | | | | | |
Net Asset Value, End of Period | | | | $14.87 | | | | | | | $14.27 | | | | | $13.21 | | | | | $18.49 | | | | | $18.44 | | | | | $16.24 | |
| | | | | | | |
Total Return2,5 | | |
| 4.20
| %6
| | | | | | 9.92 | % | | | | (27.97 | )% | | | | 1.25 | % | | | | 13.55 | % | | | | 29.56 | % |
| | | | | | | |
Ratio of net expenses to average net assets | | |
| 1.31
| %7,8
| | | | |
| 1.27
| %8
| | | | 1.25 | % | | | | 1.22 | % | | | | 1.23 | % | | | | 1.23 | % |
| | | | | | | |
Ratio of gross expenses to average net assets9 | | |
| 1.36
| %7
| | | | | | 1.27 | % | | | | 1.25 | % | | | | 1.22 | % | | | | 1.23 | % | | | | 1.23 | % |
| | | | | | | |
Ratio of net investment income to average net assets2 | | |
| 1.20
| %7
| | | | | | 1.04 | % | | | | 1.33 | % | | | | 0.47 | % | | | | 0.17 | % | | | | 1.43 | % |
| | | | | | | |
Portfolio turnover | | | | 37 | %6 | | | | | | 69 | % | | | | 71 | % | | | | 73 | % | | | | 57 | % | | | | 40 | % |
| | | | | | | |
Net assets end of period (000’s) omitted | | | | $8,298 | | | | | | | $9,101 | | | | | $10,977 | | | | | $21,202 | | | | | $45,389 | | | | | $70,532 | |
| | | | | | | | | | | | | | | | | | | | | | | | | | | | | | | | | |
28
| | |
| | AMG TimesSquare International Small Cap Fund Financial Highlights For a share outstanding throughout each fiscal period |
| | | | | | | | | | | | | | | | | | | | | | | | | | | | | | | | |
| | | For the six | | | | | | | | | | | | |
| | | months ended | | | | For the fiscal years ended December 31, |
| Class I | | June 30, 2024
(unaudited) | | | | 2023 | | 2022 | | 2021 | | 2020 | | 2019 |
| | | | | | | |
Net Asset Value, Beginning of Period | | | | $14.30 | | | | | | | $13.23 | | | | | $18.52 | | | | | $18.49 | | | | | $16.26 | | | | | $12.74 | |
| | | | | | | |
Income (loss) from Investment Operations: | | | | | | | | | | | | | | | | | | | | | | | | | | | | | | | | |
| | | | | | | |
Net investment income1,2 | | | | 0.10 | | | | | | | 0.17 | | | | | 0.21 | 3 | | | | 0.12 | | | | | 0.05 | | | | | 0.24 | 4 |
| | | | | | | | |
Net realized and unrealized gain (loss) on investments | | | | 0.51 | | | | | | | 1.16 | | | | | (5.37 | ) | | | | 0.13 | | | | | 2.19 | | | | | 3.55 | |
| | | | | | | |
Total income (loss) from investment operations | | | | 0.61 | | | | | | | 1.33 | | | | | (5.16 | ) | | | | 0.25 | | | | | 2.24 | | | | | 3.79 | |
| | | | | | | |
Less Distributions to Shareholders from: | | | | | | | | | | | | | | | | | | | | | | | | | | | | | | | | |
| | | | | | | |
Net investment income | | | | — | | | | | | | (0.26 | ) | | | | (0.13 | ) | | | | (0.22 | ) | | | | (0.01 | ) | | | | (0.27 | ) |
| | | | | | | |
Net Asset Value, End of Period | | | | $14.91 | | | | | | | $14.30 | | | | | $13.23 | | | | | $18.52 | | | | | $18.49 | | | | | $16.26 | |
| | | | | | | |
Total Return2,5 | | | | 4.27 | %6 | | | | | | 10.11 | % | | | | (27.84 | )% | | | | 1.36 | % | | | | 13.75 | % | | | | 29.78 | % |
| | | | | | | |
Ratio of net expenses to average net assets | | | | 1.12 | %7,8 | | | | | | 1.11 | %8 | | | | 1.10 | % | | | | 1.07 | % | | | | 1.08 | % | | | | 1.06 | % |
| | | | | | | |
Ratio of gross expenses to average net assets9 | | | | 1.17 | %7 | | | | | | 1.11 | % | | | | 1.10 | % | | | | 1.07 | % | | | | 1.08 | % | | | | 1.06 | % |
| | | | | | | |
Ratio of net investment income to average net assets2 | | | | 1.39 | %7 | | | | | | 1.20 | % | | | | 1.48 | % | | | | 0.62 | % | | | | 0.32 | % | | | | 1.60 | % |
| | | | | | | |
Portfolio turnover | | | | 37 | %6 | | | | | | 69 | % | | | | 71 | % | | | | 73 | % | | | | 57 | % | | | | 40 | % |
| | | | | | | |
Net assets end of period (000’s) omitted | | | | $84,313 | | | | | | | $96,333 | | | | | $260,896 | | | | | $614,652 | | | | | $629,502 | | | | | $658,599 | |
| | | | | | | | | | | | | | | | | | | | | | | | | | | | | | | | | |
29
| | |
| | AMG TimesSquare International Small Cap Fund Financial Highlights For a share outstanding throughout each fiscal period |
| | | | | | | | | | | | | | | | | | | | | | | | | | |
| | | For the six | | | | | | | | | | | | | | | | | |
| | | months ended | | | | | For the fiscal years ended December 31, | |
| Class Z | | June 30, 2024
(unaudited) | | | | | 2023 | | | 2022 | | | 2021 | | | 2020 | | | 2019 |
| | | | | | | |
Net Asset Value, Beginning of Period | | | $14.29 | | | | | | $13.23 | | | | $18.53 | | | | $18.50 | | | | $16.26 | | | | $12.75 | |
| | | | | | | |
Income (loss) from Investment Operations: | | | | | | | | | | | | | | | | | | | | | | | | | | |
| | | | | | | |
Net investment income1,2 | | | 0.11 | | | | | | 0.18 | | | | 0.22 | 3 | | | 0.14 | | | | 0.06 | | | | 0.25 | 4 |
| | | | | | | |
Net realized and unrealized gain (loss) on investments | | | 0.51 | | | | | | 1.16 | | | | (5.37 | ) | | | 0.12 | | | | 2.20 | | | | 3.55 | |
| | | | | | | |
Total income (loss) from investment operations | | | 0.62 | | | | | | 1.34 | | | | (5.15 | ) | | | 0.26 | | | | 2.26 | | | | 3.80 | |
| | | | | | | |
Less Distributions to Shareholders from: | | | | | | | | | | | | | | | | | | | | | | | | | | |
| | | | | | | |
Net investment income | | | — | | | | | | (0.28 | ) | | | (0.15 | ) | | | (0.23 | ) | | | (0.02 | ) | | | (0.29 | ) |
| | | | | | | |
Net Asset Value, End of Period | | | $14.91 | | | | | | $14.29 | | | | $13.23 | | | | $18.53 | | | | $18.50 | | | | $16.26 | |
| | | | | | | |
Total Return2,5 | | | 4.34 | %6 | | | | | 10.22 | % | | | (27.78 | )% | | | 1.47 | % | | | 13.90 | % | | | 29.77 | % |
| | | | | | | |
Ratio of net expenses to average net assets | | | 1.06 | %7,8 | | | | | 1.02 | %8 | | | 1.00 | % | | | 0.97 | % | | | 0.98 | % | | | 0.98 | % |
| | | | | | | |
Ratio of gross expenses to average net assets9 | | | 1.11 | %7 | | | | | 1.02 | % | | | 1.00 | % | | | 0.97 | % | | | 0.98 | % | | | 0.98 | % |
| | | | | | | |
Ratio of net investment income to average net assets2 | | | 1.45 | %7 | | | | | 1.29 | % | | | 1.58 | % | | | 0.72 | % | | | 0.42 | % | | | 1.68 | % |
| | | | | | | |
Portfolio turnover | | | 37 | %6 | | | | | 69 | % | | | 71 | % | | | 73 | % | | | 57 | % | | | 40 | % |
| | | | | | | |
Net assets end of period (000’s) omitted | | | $51,950 | | | | | | $85,045 | | | | $166,307 | | | | $396,236 | | | | $397,976 | | | | $401,528 | |
| | | | | | | | | | | | | | | | | | | | | | | | | | | |
| 1 | Per share numbers have been calculated using average shares. |
| 2 | Total returns and net investment income would have been lower had certain expenses not been offset. |
| 3 | Includes non-recurring dividends. Without these dividends, net investment income per share would have been $0.15, $0.17 and $0.18 for Class N, Class I and Class Z, respectively. |
| 4 | Includes non-recurring dividends. Without these dividends, net investment income per share would have been $0.16, $0.18 and $0.20 for Class N, Class I and Class Z, respectively. |
| 5 | The total return is calculated using the published Net Asset Value as of period end. |
| 8 | Includes interest expense of 0.01% for the six months ended June 30, 2024 and 0.02% for the fiscal year ended December 31, 2023 related to participation in the interfund lending program. |
| 9 | Excludes the impact of expense reimbursement or fee waivers and expense reductions such as brokerage credits, but includes expense repayments and non-reimbursable expenses, if any, such as interest, taxes, and extraordinary expenses. (See Note 1(c) and 2 in the Notes to Financial Statements.) |
30
| | |
| | AMG TimesSquare Emerging Markets Small Cap Fund Financial Highlights For a share outstanding throughout each fiscal period |
| | | | | | | | | | | | | | | | | | | | | | | | | | | | | | | | |
| | | For the six | | | | | | | | | | | | |
| | | months ended | | | | For the fiscal years ended December 31, |
| Class N | | June 30, 2024
(unaudited) | | | | 2023 | | 2022 | | 2021 | | 2020 | | 2019 |
| | | | | | | |
Net Asset Value, Beginning of Period | | | | $10.05 | | | | | | | $8.29 | | | | | $10.52 | | | | | $13.66 | | | | | $11.03 | | | | | $9.49 | |
| | | | | | | |
Income (loss) from Investment Operations: | | | | | | | | | | | | | | | | | | | | | | | | | | | | | | | | |
| | | | | | | |
Net investment income (loss)1,2 | | | | 0.01 | 3 | | | | | | (0.02 | )4 | | | | 0.03 | | | | | (0.03 | ) | | | | 0.13 | 5 | | | | 0.03 | |
| | | | | | | |
Net realized and unrealized gain (loss) on investments | | | | 0.30 | | | | | | | 1.99 | | | | | (2.08 | ) | | | | 1.22 | | | | | 2.50 | | | | | 1.53 | |
| | | | | | | |
Total income (loss) from investment operations | | | | 0.31 | | | | | | | 1.97 | | | | | (2.05 | ) | | | | 1.19 | | | | | 2.63 | | | | | 1.56 | |
| | | | | | | |
Less Distributions to Shareholders from: | | | | | | | | | | | | | | | | | | | | | | | | | | | | | | | | |
| | | | | | | |
Net investment income | | | | — | | | | | | | (0.21 | ) | | | | — | | | | | (0.07 | ) | | | | (0.00 | )6 | | | | (0.02 | ) |
| | | | | | | |
Net realized gain on investments | | | | — | | | | | | | — | | | | | (0.18 | ) | | | | (4.26 | ) | | | | — | | | | | — | |
| | | | | | | |
Paid in capital | | | | — | | | | | | | — | | | | | — | | | | | — | | | | | — | | | | | (0.00 | )6 |
| | | | | | | |
Total distributions to shareholders | | | | — | | | | | | | (0.21 | ) | | | | (0.18 | ) | | | | (4.33 | ) | | | | (0.00 | )6 | | | | (0.02 | ) |
| | | | | | | |
Net Asset Value, End of Period | | | | $10.36 | | | | | | | $10.05 | | | | | $8.29 | | | | | $10.52 | | | | | $13.66 | | | | | $11.03 | |
| | | | | | | |
Total Return2,7 | | | | 2.98 | %8 | | | | | | 23.90 | % | | | | (19.43 | )% | | | | 9.10 | % | | | | 23.86 | % | | | | 16.49 | % |
| | | | | | | |
Ratio of net expenses to average net assets | | | | 1.65 | %9 | | | | | | 1.77 | %10 | | | | 1.68 | %10 | | | | 1.68 | %11 | | | | 1.65 | % | | | | 1.67 | %10 |
| | | | | | | |
Ratio of gross expenses to average net assets12 | | | | 8.59 | %9 | | | | | | 6.97 | % | | | | 4.23 | % | | | | 3.03 | %11 | | | | 3.66 | % | | | | 4.29 | % |
| | | | | | | |
Ratio of net investment income (loss) to average net assets2 | | | | 0.25 | %9 | | | | | | (0.22 | )% | | | | 0.34 | % | | | | (0.19 | )% | | | | 1.22 | % | | | | 0.31 | % |
| | | | | | | |
Portfolio turnover | | | | 40 | %8 | | | | | | 81 | % | | | | 104 | % | | | | 139 | % | | | | 129 | % | | | | 103 | % |
| | | | | | | |
Net assets end of period (000’s) omitted | | | | $126 | | | | | | | $107 | | | | | $65 | | | | | $49 | | | | | $43 | | | | | $39 | |
| | | | | | | | | | | | | | | | | | | | | | | | | | | | | | | | | |
31
| | |
| | AMG TimesSquare Emerging Markets Small Cap Fund Financial Highlights For a share outstanding throughout each fiscal period |
| | | | | | | | | | | | | | | | | | | | | | | | | | |
| | | For the six | | | | | | | | | | | | | | | | | |
| | | months ended | | | | | For the fiscal years ended December 31, | |
| Class I | | June 30, 2024
(unaudited) | | | | | 2023 | | | 2022 | | | 2021 | | | 2020 | | | 2019 |
| | | | | | | |
Net Asset Value, Beginning of Period | | | $10.15 | | | | | | $8.35 | | | | $10.56 | | | | $13.70 | | | | $11.05 | | | | $9.51 | |
| | | | | | | |
Income (loss) from Investment Operations: | | | | | | | | | | | | | | | | | | | | | | | | | | |
| | | | | | | |
Net investment income1,2 | | | 0.03 | 3 | | | | | 0.02 | 4 | | | 0.07 | | | | 0.03 | | | | 0.18 | 5 | | | 0.07 | |
| | | | | | | |
Net realized and unrealized gain (loss) on investments | | | 0.29 | | | | | | 2.02 | | | | (2.10 | ) | | | 1.23 | | | | 2.51 | | | | 1.53 | |
| | | | | | | |
Total income (loss) from investment operations | | | 0.32 | | | | | | 2.04 | | | | (2.03 | ) | | | 1.26 | | | | 2.69 | | | | 1.60 | |
| | | | | | | |
Less Distributions to Shareholders from: | | | | | | | | | | | | | | | | | | | | | | | | | | |
| | | | | | | |
Net investment income | | | — | | | | | | (0.24 | ) | | | — | | | | (0.14 | ) | | | (0.04 | ) | | | (0.05 | ) |
| | | | | | | |
Net realized gain on investments | | | — | | | | | | — | | | | (0.18 | ) | | | (4.26 | ) | | | — | | | | — | |
| | | | | | | |
Paid in capital | | | — | | | | | | — | | | | — | | | | — | | | | — | | | | (0.01 | ) |
| | | | | | | |
Total distributions to shareholders | | | — | | | | | | (0.24 | ) | | | (0.18 | ) | | | (4.40 | ) | | | (0.04 | ) | | | (0.06 | ) |
| | | | | | | |
Net Asset Value, End of Period | | | $10.47 | | | | | | $10.15 | | | | $8.35 | | | | $10.56 | | | | $13.70 | | | | $11.05 | |
| | | | | | | |
Total Return2,7 | | | 3.15 | %8 | | | | | 24.46 | % | | | (19.16 | )% | | | 9.50 | % | | | 24.49 | % | | | 16.83 | % |
| | | | | | | |
Ratio of net expenses to average net assets | | | 1.25 | %9 | | | | | 1.37 | %10 | | | 1.28 | %10 | | | 1.28 | %11 | | | 1.25 | % | | | 1.27 | %10 |
| | | | | | | |
Ratio of gross expenses to average net assets12 | | | 8.19 | %9 | | | | | 6.57 | % | | | 3.83 | % | | | 2.63 | %11 | | | 3.26 | % | | | 3.89 | % |
| | | | | | | |
Ratio of net investment income to average net assets2 | | | 0.65 | %9 | | | | | 0.18 | % | | | 0.74 | % | | | 0.21 | % | | | 1.62 | % | | | 0.71 | % |
| | | | | | | |
Portfolio turnover | | | 40 | %8 | | | | | 81 | % | | | 104 | % | | | 139 | % | | | 129 | % | | | 103 | % |
| | | | | | | |
Net assets end of period (000’s) omitted | | | $438 | | | | | | $425 | | | | $342 | | | | $434 | | | | $396 | | | | $310 | |
| | | | | | | | | | | | | | | | | | | | | | | | | | | |
32
| | |
| | AMG TimesSquare Emerging Markets Small Cap Fund Financial Highlights For a share outstanding throughout each fiscal period |
| | | | | | | | | | | | | | | | | | | | | | | | | | | | | | | | |
| | | For the six | | | | | | | | | | | | |
| | | months ended | | | | For the fiscal years ended December 31, |
| Class Z | | June 30, 2024
(unaudited) | | | | 2023 | | 2022 | | 2021 | | 2020 | | 2019 |
| | | | | | | |
Net Asset Value, Beginning of Period | | | | $10.14 | | | | | | | $8.35 | | | | | $10.55 | | | | | $13.70 | | | | | $11.05 | | | | | $9.51 | |
| | | | | | | |
Income (loss) from Investment Operations: | | | | | | | | | | | | | | | | | | | | | | | | | | | | | | | | |
| | | | | | | |
Net investment income1,2 | | | | 0.03 | 3 | | | | | | 0.02 | 4 | | | | 0.07 | | | | | 0.03 | | | | | 0.18 | 5 | | | | 0.07 | |
| | | | | | | |
Net realized and unrealized gain (loss) on investments | | | | 0.30 | | | | | | | 2.01 | | | | | (2.09 | ) | | | | 1.22 | | | | | 2.51 | | | | | 1.53 | |
| | | | | | | |
Total income (loss) from investment operations | | | | 0.33 | | | | | | | 2.03 | | | | | (2.02 | ) | | | | 1.25 | | | | | 2.69 | | | | | 1.60 | |
| | | | | | | |
Less Distributions to Shareholders from: | | | | | | | | | | | | | | | | | | | | | | | | | | | | | | | | |
| | | | | | | |
Net investment income | | | | — | | | | | | | (0.24 | ) | | | | — | | | | | (0.14 | ) | | | | (0.04 | ) | | | | (0.05 | ) |
| | | | | | | |
Net realized gain on investments | | | | — | | | | | | | — | | | | | (0.18 | ) | | | | (4.26 | ) | | | | — | | | | | — | |
| | | | | | | |
Paid in capital | | | | — | | | | | | | — | | | | | — | | | | | — | | | | | — | | | | | (0.01 | ) |
| | | | | | | |
Total distributions to shareholders | | | | — | | | | | | | (0.24 | ) | | | | (0.18 | ) | | | | (4.40 | ) | | | | (0.04 | ) | | | | (0.06 | ) |
| | | | | | | |
Net Asset Value, End of Period | | | | $10.47 | | | | | | | $10.14 | | | | | $8.35 | | | | | $10.55 | | | | | $13.70 | | | | | $11.05 | |
| | | | | | | |
Total Return2,7 | | | | 3.25 | %8 | | | | | | 24.34 | % | | | | (19.09 | )% | | | | 9.51 | % | | | | 24.40 | % | | | | 16.83 | % |
| | | | | | | |
Ratio of net expenses to average net assets | | | | 1.25 | %9 | | | | | | 1.37 | %10 | | | | 1.28 | %10 | | | | 1.28 | %11 | | | | 1.25 | % | | | | 1.27 | %10 |
| | | | | | | |
Ratio of gross expenses to average net assets12 | | | | 8.19 | %9 | | | | | | 6.57 | % | | | | 3.83 | % | | | | 2.63 | %11 | | | | 3.26 | % | | | | 3.89 | % |
| | | | | | | |
Ratio of net investment income to average net assets2 | | | | 0.65 | %9 | | | | | | 0.18 | % | | | | 0.74 | % | | | | 0.21 | % | | | | 1.62 | % | | | | 0.71 | % |
| | | | | | | |
Portfolio turnover | | | | 40 | %8 | | | | | | 81 | % | | | | 104 | % | | | | 139 | % | | | | 129 | % | | | | 103 | % |
| | | | | | | |
Net assets end of period (000’s) omitted | | | | $1,350 | | | | | | | $1,372 | | | | | $4,298 | | | | | $7,473 | | | | | $6,766 | | | | | $5,473 | |
| | | | | | | | | | | | | | | | | | | | | | | | | | | | | | | | | |
| 1 | Per share numbers have been calculated using average shares. |
| 2 | Total returns and net investment income (loss) would have been lower had certain expenses not been offset. |
| 3 | Includes non-recurring dividends. Without these dividends, net investment income (loss) per share would have been $(0.01), $0.01 and $0.01 for Class N, Class I and Class Z, respectively. |
| 4 | Includes non-recurring dividends. Without these dividends, net investment loss per share would have been $(0.05), $(0.01) and $(0.01) for Class N, Class I and Class Z, respectively. |
| 5 | Includes non-recurring dividends. Without these dividends, net investment income per share would have been $0.11, $0.16 and $0.16 for Class N, Class I and Class Z, respectively. |
| 6 | Less than $(0.005) per share. |
| 7 | The total return is calculated using the published Net Asset Value as of period end. |
| 10 | Includes interest expense totaling 0.12%, 0.03% and 0.02% for the fiscal years ended December 31, 2023, 2022 and 2019, respectively, related to participation in the interfund lending program and bank overdrafts. |
| 11 | Includes expense totaling 0.03% relating to excise tax expense. |
| 12 | Excludes the impact of expense reimbursement or fee waivers and expense reductions such as brokerage credits, but includes expense repayments and non-reimbursable expenses, if any, such as interest, taxes, and extraordinary expenses. (See Note 1(c) and 2 in the Notes to Financial Statements.) |
33
| | |
| | AMG TimesSquare Global Small Cap Fund Financial Highlights For a share outstanding throughout each fiscal period |
| | | | | | | | | | | | | | | | | | | | | | | | | | |
| | | For the six | | | | | | | | | | | | | | | | | |
| | | months ended | | | | | For the fiscal years ended December 31, | |
| Class N | | June 30, 2024
(unaudited) | | | | | 2023 | | | 2022 | | | 2021 | | | 2020 | | | 2019 |
| | | | | | | |
Net Asset Value, Beginning of Period | | | $10.76 | | | | | | $9.50 | | | | $12.50 | | | | $12.05 | | | | $10.84 | | | | $7.95 | |
| | | | | | | |
Income (loss) from Investment Operations: | | | | | | | | | | | | | | | | | | | | | | | | | | |
| | | | | | | |
Net investment income (loss)1,2 | | | 0.02 | | | | | | 0.01 | | | | 0.01 | | | | 0.00 | 3,4 | | | (0.02 | ) | | | 0.04 | |
| | | | | | | |
Net realized and unrealized gain (loss) on investments | | | (0.03 | ) | | | | | 1.28 | | | | (3.01 | ) | | | 1.31 | | | | 1.23 | | | | 2.95 | |
| | | | | | | |
Total income (loss) from investment operations | | | (0.01 | ) | | | | | 1.29 | | | | (3.00 | ) | | | 1.31 | | | | 1.21 | | | | 2.99 | |
| | | | | | | |
Less Distributions to Shareholders from: | | | | | | | | | | | | | | | | | | | | | | | | | | |
| | | | | | | |
Net investment income | | | — | | | | | | (0.03 | ) | | | — | | | | — | | | | — | | | | (0.10 | ) |
| | | | | | | |
Net realized gain on investments | | | — | | | | | | — | | | | — | | | | (0.86 | ) | | | — | | | | — | |
| | | | | | | |
Total distributions to shareholders | | | — | | | | | | (0.03 | ) | | | — | | | | (0.86 | ) | | | — | | | | (0.10 | ) |
| | | | | | | |
Net Asset Value, End of Period | | | $10.75 | | | | | | $10.76 | | | | $9.50 | | | | $12.50 | | | | $12.05 | | | | $10.84 | |
| | | | | | | |
Total Return2,5 | | | (0.09 | )%6 | | | | | 13.62 | % | | | (24.00 | )% | | | 11.08 | % | | | 11.16 | % | | | 37.60 | % |
| | | | | | | |
Ratio of net expenses to average net assets | | | 1.25 | %7 | | | | | 1.25 | % | | | 1.25 | % | | | 1.25 | % | | | 1.25 | % | | | 1.27 | %8 |
| | | | | | | |
Ratio of gross expenses to average net assets9 | | | 5.30 | %7 | | | | | 5.41 | % | | | 5.17 | % | | | 4.28 | % | | | 6.48 | % | | | 7.45 | % |
| | | | | | | |
Ratio of net investment income (loss) to average net assets2 | | | 0.44 | %7 | | | | | 0.14 | % | | | 0.15 | % | | | 0.00 | %10 | | | (0.18 | )% | | | 0.42 | % |
| | | | | | | |
Portfolio turnover | | | 38 | %6 | | | | | 59 | % | | | 51 | % | | | 59 | % | | | 42 | % | | | 80 | % |
| | | | | | | |
Net assets end of period (000’s) omitted | | | $61 | | | | | | $58 | | | | $53 | | | | $69 | | | | $63 | | | | $44 | |
| | | | | | | | | | | | | | | | | | | | | | | | | | | |
34
| | |
| | AMG TimesSquare Global Small Cap Fund Financial Highlights For a share outstanding throughout each fiscal period |
| | | | | | | | | | | | | | | | | | | | | | | | | | |
| | | For the six | | | | | | | | | | | | | | | | | |
| | | months ended | | | | | For the fiscal years ended December 31, | |
| Class I | | June 30, 2024
(unaudited) | | | | | 2023 | | | 2022 | | | 2021 | | | 2020 | | | 2019 |
| | | | | | | |
Net Asset Value, Beginning of Period | | | $10.81 | | | | | | $9.54 | | | | $12.54 | | | | $12.09 | | | | $10.85 | | | | $7.96 | |
| | | | | | | |
Income (loss) from Investment Operations: | | | | | | | | | | | | | | | | | | | | | | | | | | |
| | | | | | | |
Net investment income1,2 | | | 0.04 | | | | | | 0.04 | | | | 0.04 | | | | 0.03 | 3 | | | 0.01 | | | | 0.06 | |
| | | | | | | |
Net realized and unrealized gain (loss) on investments | | | (0.04 | ) | | | | | 1.29 | | | | (3.02 | ) | | | 1.31 | | | | 1.23 | | | | 2.96 | |
| | | | | | | |
Total income (loss) from investment operations | | | — | | | | | | 1.33 | | | | (2.98 | ) | | | 1.34 | | | | 1.24 | | | | 3.02 | |
| | | | | | | |
Less Distributions to Shareholders from: | | | | | | | | | | | | | | | | | | | | | | | | | | |
| | | | | | | |
Net investment income | | | — | | | | | | (0.06 | ) | | | (0.02 | ) | | | (0.03 | ) | | | — | | | | (0.13 | ) |
| | | | | | | |
Net realized gain on investments | | | — | | | | | | — | | | | — | | | | (0.86 | ) | | | — | | | | — | |
| | | | | | | |
Total distributions to shareholders | | | — | | | | | | (0.06 | ) | | | (0.02 | ) | | | (0.89 | ) | | | — | | | | (0.13 | ) |
| | | | | | | |
Net Asset Value, End of Period | | | $10.81 | | | | | | $10.81 | | | | $9.54 | | | | $12.54 | | | | $12.09 | | | | $10.85 | |
| | | | | | | |
Total Return2,5 | | | 0.00 | %6 | | | | | 13.94 | % | | | (23.76 | )% | | | 11.29 | % | | | 11.43 | % | | | 37.96 | % |
| | | | | | | |
Ratio of net expenses to average net assets | | | 1.00 | %7 | | | | | 1.00 | % | | | 1.00 | % | | | 1.00 | % | | | 1.00 | % | | | 1.02 | %8 |
| | | | | | | |
Ratio of gross expenses to average net assets9 | | | 5.05 | %7 | | | | | 5.16 | % | | | 4.92 | % | | | 4.03 | % | | | 6.23 | % | | | 7.20 | % |
| | | | | | | |
Ratio of net investment income to average net assets2 | | | 0.69 | %7 | | | | | 0.39 | % | | | 0.40 | % | | | 0.25 | % | | | 0.07 | % | | | 0.67 | % |
| | | | | | | |
Portfolio turnover | | | 38 | %6 | | | | | 59 | % | | | 51 | % | | | 59 | % | | | 42 | % | | | 80 | % |
| | | | | | | |
Net assets end of period (000’s) omitted | | | $35 | | | | | | $35 | | | | $31 | | | | $41 | | | | $37 | | | | $33 | |
| | | | | | | | | | | | | | | | | | | | | | | | | | | |
35
| | |
| | AMG TimesSquare Global Small Cap Fund Financial Highlights For a share outstanding throughout each fiscal period |
| | | | | | | | | | | | | | | | | | | | | | | | | | |
| | | For the six | | | | | | | | | | | | | | | | | |
| | | months ended | | | | | For the fiscal years ended December 31, | |
| Class Z | | June 30, 2024
(unaudited) | | | | | 2023 | | | 2022 | | | 2021 | | | 2020 | | | 2019 |
| | | | | | | |
Net Asset Value, Beginning of Period | | | $10.81 | | | | | | $9.54 | | | | $12.55 | | | | $12.09 | | | | $10.86 | | | | $7.96 | |
| | | | | | | |
Income (loss) from Investment Operations: | | | | | | | | | | | | | | | | | | | | | | | | | | |
| | | | | | | |
Net investment income1,2 | | | 0.04 | | | | | | 0.04 | | | | 0.04 | | | | 0.03 | 3 | | | 0.01 | | | | 0.06 | |
| | | | | | | |
Net realized and unrealized gain (loss) on investments | | | (0.04 | ) | | | | | 1.29 | | | | (3.03 | ) | | | 1.32 | | | | 1.22 | | | | 2.97 | |
| | | | | | | |
Total income (loss) from investment operations | | | — | | | | | | 1.33 | | | | (2.99 | ) | | | 1.35 | | | | 1.23 | | | | 3.03 | |
| | | | | | | |
Less Distributions to Shareholders from: | | | | | | | | | | | | | | | | | | | | | | | | | | |
| | | | | | | |
Net investment income | | | — | | | | | | (0.06 | ) | | | (0.02 | ) | | | (0.03 | ) | | | — | | | | (0.13 | ) |
| | | | | | | |
Net realized gain on investments | | | — | | | | | | — | | | | — | | | | (0.86 | ) | | | — | | | | — | |
| | | | | | | |
Total distributions to shareholders | | | — | | | | | | (0.06 | ) | | | (0.02 | ) | | | (0.89 | ) | | | — | | | | (0.13 | ) |
| | | | | | | |
Net Asset Value, End of Period | | | $10.81 | | | | | | $10.81 | | | | $9.54 | | | | $12.55 | | | | $12.09 | | | | $10.86 | |
| | | | | | | |
Total Return2,5 | | | 0.00 | %6 | | | | | 13.94 | % | | | (23.83 | )% | | | 11.38 | % | | | 11.33 | % | | | 38.09 | % |
| | | | | | | |
Ratio of net expenses to average net assets | | | 1.00 | %7 | | | | | 1.00 | % | | | 1.00 | % | | | 1.00 | % | | | 1.00 | % | | | 1.02 | %8 |
| | | | | | | |
Ratio of gross expenses to average net assets9 | | | 5.05 | %7 | | | | | 5.16 | % | | | 4.92 | % | | | 4.03 | % | | | 6.23 | % | | | 7.20 | % |
| | | | | | | |
Ratio of net investment income to average net assets2 | | | 0.69 | %7 | | | | | 0.39 | % | | | 0.40 | % | | | 0.25 | % | | | 0.07 | % | | | 0.67 | % |
| | | | | | | |
Portfolio turnover | | | 38 | %6 | | | | | 59 | % | | | 51 | % | | | 59 | % | | | 42 | % | | | 80 | % |
| | | | | | | |
Net assets end of period (000’s) omitted | | | $1,699 | | | | | | $1,687 | | | | $1,619 | | | | $2,578 | | | | $2,186 | | | | $2,032 | |
| | | | | | | | | | | | | | | | | | | | | | | | | | | |
| 1 | Per share numbers have been calculated using average shares. |
| 2 | Total returns and net investment income (loss) would have been lower had certain expenses not been offset. |
| 3 | Includes non-recurring dividends. Without these dividends, net investment income (loss) per share would have been $(0.02), $0.01 and $0.01 for Class N, Class I and Class Z, respectively. |
| 4 | Less than $0.005 per share. |
| 5 | The total return is calculated using the published Net Asset Value as of period end. |
| 8 | Includes interest expense related to participation in the interfund lending program and excise tax expense totaling 0.02%. |
| 9 | Excludes the impact of expense reimbursement or fee waivers and expense reductions such as brokerage credits, but includes expense repayments and non-reimbursable expenses, if any, such as interest, taxes, and extraordinary expenses. (See Note 1(c) and 2 in the Notes to Financial Statements.) |
36
| | |
| | Notes to Financial Statements (unaudited) June 30, 2024 |
1. ORGANIZATION AND SUMMARY OF SIGNIFICANT ACCOUNTING POLICIES
AMG Funds (the “Trust”) is an open-end management investment company, organized as a Massachusetts business trust, and registered under the Investment Company Act of 1940, as amended (the “1940 Act”). Currently, the Trust consists of a number of different funds, each having distinct investment management objectives, strategies, risks, and policies. Included in this report are AMG TimesSquare Small Cap Growth Fund (“Small Cap”), AMG TimesSquare Mid Cap Growth Fund (“Mid Cap”), AMG TimesSquare International Small Cap Fund (“International Small Cap”), AMG TimesSquare Emerging Markets Small Cap Fund (“Emerging Markets Small Cap”) and AMG TimesSquare Global Small Cap Fund (“Global Small Cap”), each a “Fund” and collectively, the “Funds”.
Each Fund offers Class N, Class I and Class Z shares. Each class represents an interest in the same assets of the respective Fund. Although all share classes generally have identical voting rights, each share class votes separately when required by law. Different share classes may have different net asset values per share to the extent the share classes pay different distribution amounts and/or the expenses of such share classes differ. Each share class has its own expense structure. Please refer to a current prospectus for additional information on each share class.
The Funds’ financial statements are prepared in accordance with accounting principles generally accepted in the United States of America (“U.S. GAAP”), including accounting and reporting guidance pursuant to Accounting Standards Codification Topic 946 applicable to investment companies. U.S. GAAP requires management to make estimates and assumptions that affect the reported amounts of assets and liabilities and disclosure of contingent assets and liabilities at the date of the financial statements and the reported amounts of income and expenses during the reporting period. Actual results could differ from those estimates and such differences could be material. The following is a summary of significant accounting policies followed by the Funds in the preparation of their financial statements:
a. VALUATION OF INVESTMENTS
Equity securities traded on a national securities exchange or reported on the NASDAQ national market system (“NMS”) are valued at the last quoted sales price on the primary exchange or, if applicable, the NASDAQ official closing price or the official closing price of the relevant exchange or, lacking any sales, at the last quoted bid price. Equity securities held by the Funds that are traded in the over-the-counter market (other than NMS securities) are valued at the bid price. Foreign equity securities (securities principally traded in markets other than U.S. markets) held by the Funds are valued at the official closing price on the primary exchange or, for markets that either do not offer an official closing price or where the official closing price may not be representative of the overall market, the last quoted sale price.
Fixed income securities purchased with a remaining maturity of 60 days or less are valued at amortized cost, provided that the amortized cost value is approximately the same as the fair value of the security valued without the use of amortized cost. Investments in other open-end registered investment companies are valued at their end of day net asset value per share.
The Funds’ portfolio investments are generally valued based on independent market quotations or prices or, if none, “evaluative” or other market based valuations provided by third party pricing services. Pursuant to Rule 2a-5 under
the 1940 Act, the Funds’ Board of Trustees (the “Board”) designated AMG Funds LLC (the “Investment Manager”) as the Funds’ Valuation Designee to perform the Funds’ fair value determinations. Such determinations are subject to Board oversight and certain reporting and other requirements intended to ensure that the Board receives the information it needs to oversee the Investment Manager’s fair value determinations.
Under certain circumstances, the value of certain Fund portfolio investments may be based on an evaluation of fair value, pursuant to procedures established by the Investment Manager and under the general supervision of the Board. The Funds may use the fair value of a portfolio investment to calculate its net asset value (“NAV”) in the event that the market quotation, price or market based valuation for the portfolio investment is not readily available or otherwise not determinable pursuant to the Funds’ valuation procedures, if the Investment Manager believes the quotation, price or market based valuation to be unreliable, or in certain other circumstances. When determining the fair value of an investment, the Investment Manager seeks to determine the price that the Funds might reasonably expect to receive from current sale of that portfolio investment in an arms-length transaction. Fair value determinations shall be based upon consideration of all available facts and information, including, but not limited to (i) attributes specific to the investment; (ii) fundamental and analytical data relating to the investment; and (iii) the value of other comparable securities or relevant financial instruments, including derivative securities, traded on other markets or among dealers.
The values assigned to fair value portfolio investments are based on available information and do not necessarily represent amounts that might ultimately be realized in the future, since such amounts depend on future developments inherent in long-term investments. Because of the inherent uncertainty of valuation, those estimated values may differ significantly from the values that would have been used had a ready market for the investments existed, and the differences could be material. The Board will be presented with quarterly reports, as of the most recent quarter end, summarizing all fair value activity, material fair value matters that occurred during the quarter, and all outstanding securities fair valued by the Funds. Additionally, the Board will be presented with an annual report that assesses the adequacy and effectiveness of the Investment Manager’s process for determining the fair value of the Funds’ investments.
With respect to foreign equity securities and certain foreign fixed income securities, securities held in the Funds that can be fair valued by the applicable fair value pricing service are fair valued on each business day provided that each individual price exceeds a pre-established confidence level.
U.S. GAAP defines fair value as the price that a fund would receive to sell an asset or pay to transfer a liability in an orderly transaction between market participants at the measurement date. U.S. GAAP also establishes a framework for measuring fair value, and a three level hierarchy for fair value measurements based upon the transparency of inputs to the valuation of an asset or liability. Inputs may be observable or unobservable and refer broadly to the assumptions that market participants would use in pricing the asset or liability. Observable inputs reflect the assumptions market participants would use in pricing the asset or liability based on market data obtained from sources independent of the Funds.
Unobservable inputs reflect the Funds’ own assumptions about the assumptions that market participants would use in pricing the asset or liability developed based on the best information available in the circumstances. Each investment is assigned a level based upon the observability of the inputs which are significant to the overall valuation.
The three-tier hierarchy of inputs is summarized below:
37
| | |
| | Notes to Financial Statements (continued) |
Level 1 – inputs are quoted prices in active markets for identical investments (e.g., equity securities, open-end investment companies)
Level 2 – other observable inputs (including, but not limited to: quoted prices for similar assets or liabilities in markets that are active, quoted prices for identical or similar assets or liabilities in markets that are not active, inputs other than quoted prices that are observable for the assets or liabilities (such as interest rates, yield curves, volatilities, prepayment speeds, loss severities, credit risks and default rates) or other market corroborated inputs) (e.g., debt securities, government securities, foreign currency exchange contracts, foreign securities utilizing international fair value pricing, fair valued securities with observable inputs)
Level 3 – inputs are significant unobservable inputs (including the Fund’s own assumptions used to determine the fair value of investments) (e.g., fair valued securities with unobservable inputs)
Changes in inputs or methodologies used for valuing investments may result in a transfer in or out of levels within the fair value hierarchy. The inputs or methodologies used for valuing investments may not necessarily be an indication of the risk associated with investing in those investments.
b. SECURITY TRANSACTIONS
Security transactions are accounted for as of trade date. Realized gains and losses on securities sold are determined on the basis of identified cost.
c. INVESTMENT INCOME AND EXPENSES
Dividend income is recorded on the ex-dividend date. Dividends from foreign securities are recorded on the ex-dividend date, and if after the fact, as soon as the Funds become aware of the ex-dividend date, except for Korean securities where dividends are recorded on confirmation date. Interest income, which includes amortization of premium and accretion of discount on debt securities, is accrued as earned. Dividend and interest income on foreign securities is recorded gross of any withholding tax. Non-cash dividends included in dividend income, if any, are reported at the fair market value of the securities received. Upon notification from the issuer, distributions received from a real estate investment trust (REIT) may be redesignated as a reduction of cost of investments and/or realized gain. Other income and expenses are recorded on an accrual basis. Expenses that cannot be directly attributed to a Fund are apportioned among the funds in the Trust and other trusts or funds within the AMG Funds Family of Funds (collectively, the “AMG Funds Family”) based upon their relative average net assets or number of shareholders. Investment income, realized and unrealized capital gains and losses, the common expenses of each Fund, and certain fund level expense reductions, if any, are allocated on a pro-rata basis to each class based on the relative net assets of each class to the total net assets of each Fund.
Small Cap and Mid Cap had certain portfolio trades directed to various brokers under a brokerage recapture program. Credits received from the brokerage recapture program are earned and paid on a monthly basis, and are recorded as expense offsets, which serve to reduce the Funds’ overall expense ratio. For the six months ended June 30, 2024, the impact on the expenses and expense ratios, if any, were as follows: Small Cap - $19,498 or 0.01% and Mid Cap - $48,807 or less than 0.01%.
d. DIVIDENDS AND DISTRIBUTIONS
Fund distributions resulting from either net investment income or realized net capital gains, if any, will normally be declared and paid at least annually in
December. Distributions to shareholders are recorded on the ex-dividend date. Distributions are determined in accordance with federal income tax regulations, which may differ from net investment income and net realized capital gains for financial statement purposes (U.S. GAAP). Differences may be permanent or temporary. Permanent differences are reclassified among capital accounts in the financial statements to reflect their tax character. Permanent book and tax basis differences, if any, relating to shareholder distributions will result in reclassifications to paid-in capital. Temporary differences arise when certain items of income, expense and gain or loss are recognized in different periods for financial statement and tax purposes; these differences will reverse at some time in the future. Permanent differences are primarily due to the write-off of net operating losses for Small Cap and Mid Cap. In addition, permanent differences for Mid Cap are due to tax equalization utilized. There were no permanent differences for International Small Cap, Emerging Markets Small Cap, or Global Small Cap. Temporary differences are primarily due to mark-to-market on passive foreign investment companies for Small Cap, International Small Cap, and Global Small Cap. Temporary differences for Emerging Markets Small Cap are due to cost adjustments on dividend income received from spinoffs and qualified late-year ordinary loss deferrals. In addition, each Fund had temporary differences due to wash sale loss deferrals.
At June 30, 2024, the aggregate cost for federal income tax purposes approximates the aggregate cost for book purposes. The approximate cost of investments and the aggregate gross unrealized appreciation and depreciation for federal income tax purposes were as follows:
| | | | | | | | | | | | | | | | |
| Fund | | Cost | | | Appreciation | | | Depreciation | | | Net Appreciation | |
| | | | |
Small Cap | | | $144,720,197 | | | | $37,139,528 | | | | $(10,060,766 | ) | | | $27,078,762 | |
| | | | |
Mid Cap | | | 871,304,020 | | | | 502,348,846 | | | | (19,940,020) | | | | 482,408,826 | |
| | | | |
International Small Cap | | | 123,345,291 | | | | 27,243,435 | | | | (3,923,944) | | | | 23,319,491 | |
| | | | |
Emerging Markets Small Cap | | | 1,706,203 | | | | 407,552 | | | | (164,714) | | | | 242,838 | |
| | | | |
Global Small Cap | | | 1,588,480 | | | | 315,888 | | | | (70,127) | | | | 245,761 | |
e. FEDERAL TAXES
Each Fund currently qualifies as an investment company and intends to comply with the requirements under Subchapter M of the Internal Revenue Code of 1986, as amended, and to distribute substantially all of its taxable income and gains to its shareholders and to meet certain diversification and income requirements with respect to investment companies. The Investment Manager has analyzed the Funds’ tax positions taken on federal income tax returns for all open tax years (generally, the three prior taxable years), and has concluded that no provision for federal income tax is required in the Funds’ financial statements. Additionally, the Investment Manager is not aware of any tax position for which it is reasonably possible that the total amounts of unrecognized tax benefit/detriment will change materially in the next twelve months.
Furthermore, based on each Fund’s understanding of the tax rules and rates related to income, gains and transactions for the foreign jurisdictions in which it invests, each Fund will provide for foreign taxes, and where appropriate, deferred foreign taxes.
38
| | |
| | Notes to Financial Statements (continued) |
f. CAPITAL LOSS CARRYOVERS AND DEFERRALS
As of December 31, 2023, the Funds had capital loss carryovers for federal income tax purposes as shown in the following chart. These amounts may be used to offset future realized capital gains indefinitely, and retain their character as short-term and/or long-term.
| | | | | | | | | | | | |
Fund | | Short-Term | | | Long-Term | | | Total | |
| | | |
International Small Cap | | | $148,363,459 | | | | $67,960,876 | | | | $216,324,335 | |
Emerging Markets Small Cap | | | 885,714 | | | | 242,473 | | | | 1,128,187 | |
| | | | | | | | | | | | |
Fund | | Short-Term | | | Long-Term | | | Total | |
| | | |
Global Small Cap | | | $222,989 | | | | $31,049 | | | | $254,038 | |
As of December 31, 2023, Small Cap and Mid Cap had no capital loss carryovers for federal income tax purposes. Should the Funds incur net capital losses for the fiscal year ended December 31, 2024, such amounts may be used to offset future realized capital gains indefinitely, and retain their character as short-term and/or long-term.
g. CAPITAL STOCK
The Trust’s Amended and Restated Agreement and Declaration of Trust authorizes for each Fund the issuance of an unlimited number of shares of beneficial interest, without par value. Each Fund records sales and repurchases of its capital stock on the trade date.
For the six months ended June 30, 2024 (unaudited) and the fiscal year ended December 31, 2023, the capital stock transactions by class for the Funds were as follows:
| | | | | | | | | | | | | | | | | | | | | | | | | | | | | | | | |
| | | Small Cap | | | | Mid Cap | |
| | | June 30, 2024 | | | December 31, 2023 | | | June 30, 2024 | | | December 31, 2023 | |
| | | | | | | | |
| | | Shares | | | | Amount | | | | Shares | | | | Amount | | | | Shares | | | | Amount | | | | Shares | | | | Amount | |
| | | | | | | | |
Class N: | | | | | | | | | | | | | | | | | | | | | | | | | | | | | | | | |
| | | | | | | | |
Shares sold | | | 193,869 | | | | $2,246,237 | | | | 149,591 | | | | $1,544,535 | | | | 929,863 | | | | $14,948,075 | | | | 1,274,860 | | | | $18,102,672 | |
| | | | | | | | |
Shares issued in reinvestment of distributions | | | — | | | | — | | | | — | | | | — | | | | — | | | | — | | | | 1,117,758 | | | | 17,056,989 | |
| | | | | | | | |
Shares redeemed | | | (98,739) | | | | (1,131,042) | | | | (2,966,125) | | | | (30,368,078) | | | | (2,260,549) | | | | (36,310,357) | | | | (4,347,913) | | | | (61,635,017) | |
| | | | | | | | | | | | | | | | | | | | | | | | | | | | | | | | |
| | | | | | | | |
Net increase (decrease) | | | 95,130 | | | | $1,115,195 | | | | (2,816,534) | | | | $(28,823,543) | | | | (1,330,686) | | | | $(21,362,282) | | | | (1,955,295) | | | | $(26,475,356) | |
| | | | | | | | | | | | | | | | | | | | | | | | | | | | | | | | |
| | | | | | | | |
Class I: | | | | | | | | | | | | | | | | | | | | | | | | | | | | | | | | |
| | | | | | | | |
Shares sold | | | 15,693 | | | | $192,905 | | | | 134,221 | | | | $1,459,754 | | | | 2,020,136 | | | | $34,966,454 | | | | 3,605,178 | | | | $54,683,241 | |
| | | | | | | | |
Shares issued in reinvestment of distributions | | | — | | | | — | | | | — | | | | — | | | | — | | | | — | | | | 929,609 | | | | 15,189,815 | |
| | | | | | | | |
Shares redeemed | | | (104,610) | | | | (1,278,796) | | | | (228,887) | | | | (2,631,354) | | | | (2,287,803) | | | | (39,506,568) | | | | (4,886,026) | | | | (74,099,111) | |
| | | | | | | | | | | | | | | | | | | | | | | | | | | | | | | | |
| | | | | | | | |
Net decrease | | | (88,917) | | | | $(1,085,891) | | | | (94,666) | | | | $(1,171,600) | | | | (267,667) | | | | $(4,540,114) | | | | (351,239) | | | | $(4,226,055) | |
| | | | | | | | | | | | | | | | | | | | | | | | | | | | | | | | |
| | | | | | | | |
Class Z: | | | | | | | | | | | | | | | | | | | | | | | | | | | | | | | | |
| | | | | | | | |
Shares sold | | | 334,110 | | | | $4,113,819 | | | | 1,503,089 | | | | $16,617,655 | | | | 2,388,355 | | | | $41,557,711 | | | | 4,876,000 | | | | $73,516,898 | |
| | | | | | | | |
Shares issued in reinvestment of distributions | | | — | | | | — | | | | — | | | | — | | | | — | | | | — | | | | 1,056,143 | | | | 17,362,982 | |
| | | | | | | | |
Shares redeemed | | | (764,782) | | | | (9,434,235) | | | | (7,141,397) | | | | (79,450,640) | | | | (2,424,748) | | | | (42,023,724) | | | | (6,876,645) | | | | (104,304,846) | |
| | | | | | | | | | | | | | | | | | | | | | | | | | | | | | | | |
| | | | | | | | |
Net decrease | | | (430,672) | | | | $(5,320,416) | | | | (5,638,308) | | | | $(62,832,985) | | | | (36,393) | | | | $(466,013) | | | | (944,502) | | | | $(13,424,966) | |
| | | | | | | | | | | | | | | | | | | | | | | | | | | | | | | | |
| | |
| | | International Small Cap | | | | Emerging Markets Small Cap | |
| | | June 30, 2024 | | | December 31, 2023 | | | June 30, 2024 | | | December 31, 2023 | |
| | | | | | | | |
| | | Shares | | | | Amount | | | | Shares | | | | Amount | | | | Shares | | | | Amount | | | | Shares | | | | Amount | |
| | | | | | | | |
Class N: | | | | | | | | | | | | | | | | | | | | | | | | | | | | | | | | |
| | | | | | | | |
Shares sold | | | 11,186 | | | | $164,306 | | | | 71,119 | | | | $988,188 | | | | 3,885 | | | | $38,937 | | | | 3,784 | | | | $34,508 | |
| | | | | | | | |
Shares issued in reinvestment of distributions | | | — | | | | — | | | | 11,212 | | | | 155,058 | | | | — | | | | — | | | | 220 | | | | 2,179 | |
| | | | | | | | |
Shares redeemed | | | (90,916) | | | | (1,321,427) | | | | (275,623) | | | | (3,836,992) | | | | (2,394) | | | | (24,617) | | | | (1,178) | | | | (11,350) | |
| | | | | | | | | | | | | | | | | | | | | | | | | | | | | | | | |
| | | | | | | | |
Net increase (decrease) | | | (79,730) | | | | $(1,157,121) | | | | (193,292) | | | | $(2,693,746) | | | | 1,491 | | | | $14,320 | | | | 2,826 | | | | $25,337 | |
| | | | | | | | | | | | | | | | | | | | | | | | | | | | | | | | |
39
| | |
| | Notes to Financial Statements (continued) |
| | | | | | | | | | | | | | | | | | | | | | | | | | | | | | | | |
| | | International Small Cap | | | | Emerging Markets Small Cap | |
| | | June 30, 2024 | | | December 31, 2023 | | | June 30, 2024 | | | December 31, 2023 | |
| | | | | | | | |
| | | Shares | | | | Amount | | | | Shares | | | | Amount | | | | Shares | | | | Amount | | | | Shares | | | | Amount | |
| | | | | | | | |
Class I: | | | | | | | | | | | | | | | | | | | | | | | | | | | | | | | | |
| | | | | | | | |
Shares sold | | | 273,713 | | | | $4,002,311 | | | | 859,552 | | | | $12,026,291 | | | | — | | | | — | | | | — | | | | — | |
| | | | | | | | |
Shares issued in reinvestment of distributions | | | — | | | | — | | | | 122,056 | | | | 1,691,697 | | | | — | | | | — | | | | 976 | | | | $9,752 | |
| | | | | | | | |
Shares redeemed | | | (1,357,038) | | | | (19,988,675) | | | | (13,966,035) | | | | (196,364,888) | | | | — | | | | — | | | | — | | | | — | |
| | | | | | | | | | | | | | | | | | | | | | | | | | | | | | | | |
| | | | | | | | |
Net increase (decrease) | | | (1,083,325) | | | | $(15,986,364) | | | | (12,984,427) | | | | $(182,646,900) | | | | — | | | | — | | | | 976 | | | | $9,752 | |
| | | | | | | | | | | | | | | | | | | | | | | | | | | | | | | | |
| | | | | | | | |
Class Z: | | | | | | | | | | | | | | | | | | | | | | | | | | | | | | | | |
| | | | | | | | |
Shares sold | | | 264,962 | | | | $3,883,485 | | | | 2,367,890 | | | | $33,277,315 | | | | — | | | | — | | | | — | | | | — | |
| | | | | | | | |
Shares issued in reinvestment of distributions | | | — | | | | — | | | | 135,712 | | | | 1,879,620 | | | | — | | | | — | | | | 3,158 | | | | $31,518 | |
| | | | | | | | |
Shares redeemed | | | (2,731,411) | | | | (39,616,881) | | | | (9,121,849) | | | | (122,046,461) | | | | (6,338) | | | | $(64,486) | | | | (382,669) | | | | (3,359,505) | |
| | | | | | | | | | | | | | | | | | | | | | | | | | | | | | | | |
| | | | | | | | |
Net decrease | | | (2,466,449) | | | | $(35,733,396) | | | | (6,618,247) | | | | $(86,889,526) | | | | (6,338) | | | | $(64,486) | | | | (379,511) | | | | $(3,327,987) | |
| | | | | | | | | | | | | | | | | | | | | | | | | | | | | | | | |
| | |
| | | Global Small Cap | | | | | |
| | | June 30, 2024 | | | December 31, 2023 | | | | | | | |
| | | | | | | | |
| | | Shares | | | | Amount | | | | Shares | | | | Amount | | | | | | | | | | | | | | | | | |
| | | | | | | | |
Class N: | | | | | | | | | | | | | | | | | | | | | | | | | | | | | | | | |
| | | | | | | | |
Shares sold | | | 287 | | | | $3,062 | | | | — | | | | — | | | | | | | | | | | | | | | | | |
| | | | | | | | |
Shares issued in reinvestment of distributions | | | — | | | | — | | | | 13 | | | | $141 | | | | | | | | | | | | | | | | | |
| | | | | | | | |
Shares redeemed | | | — | | | | — | | | | (215) | | | | (2,247) | | | | | | | | | | | | | | | | | |
| | | | | | | | | | | | | | | | | | | | | | | | | | | | | | | | |
| | | | | | | | |
Net increase (decrease) | | | 287 | | | | $3,062 | | | | (202) | | | | $(2,106) | | | | | | | | | | | | | | | | | |
| | | | | | | | | | | | | | | | | | | | | | | | | | | | | | | | |
| | | | | | | | |
Class I: | | | | | | | | | | | | | | | | | | | | | | | | | | | | | | | | |
| | | | | | | | |
Shares issued in reinvestment of distributions | | | — | | | | — | | | | 18 | | | | $193 | | | | | | | | | | | | | | | | | |
| | | | | | | | |
Class Z: | | | | | | | | | | | | | | | | | | | | | | | | | | | | | | | | |
| | | | | | | | |
Shares sold | | | 9,285 | | | | $100,000 | | | | — | | | | — | | | | | | | | | | | | | | | | | |
| | | | | | | | |
Shares issued in reinvestment of distributions | | | — | | | | — | | | | 865 | | | | $9,197 | | | | | | | | | | | | | | | | | |
| | | | | | | | |
Shares redeemed | | | (8,193) | | | | (88,653) | | | | (14,446) | | | | (149,467) | | | | | | | | | | | | | | | | | |
| | | | | | | | | | | | | | | | | | | | | | | | | | | | | | | | |
| | | | | | | | |
Net increase (decrease) | | | 1,092 | | | | $11,347 | | | | (13,581) | | | | $(140,270) | | | | | | | | | | | | | | | | | |
| | | | | | | | | | | | | | | | | | | | | | | | | | | | | | | | |
At June 30, 2024, certain shareholders of record individually or collectively held greater than 5% of the net assets of the Funds as follows: Emerging Markets Small Cap -three own 49%; Global Small Cap - three own 86%. Transactions by these shareholders may have a material impact on the Funds.
h. REPURCHASE AGREEMENTS AND JOINT REPURCHASE AGREEMENTS
The Funds may enter into third-party and bilateral repurchase agreements for temporary cash management purposes and for reinvestment of cash collateral on securities lending transactions under the securities lending program offered by The Bank of New York Mellon (“BNYM”) (the “Securities Lending Program”) (collectively, “Repurchase Agreements”). The value of the underlying collateral, including accrued interest, must equal or exceed the value of the Repurchase Agreements during the term of the agreement. For joint repurchase agreements, the Funds participate on a pro rata basis with other clients of BNYM in their share of the underlying collateral under such joint repurchase agreements and in their share of proceeds from any repurchase or other disposition of the underlying collateral. The underlying collateral for all Repurchase Agreements is held by the
Funds’ custodian or at the Federal Reserve Bank. If the seller defaults and the value of the collateral declines, or if bankruptcy proceedings commence with respect to the seller of the security, realization of the collateral by the Funds may be delayed or limited. Pursuant to the Securities Lending Program, the Funds are indemnified for such losses by BNYM on joint repurchase agreements.
At June 30, 2024, the market value of Repurchase Agreements outstanding for Small Cap, Mid Cap, International Small Cap and Global Small Cap was $5,468,224, $4,110,386, $3,990,730 and $23,738 respectively.
40
| | |
| | Notes to Financial Statements (continued) |
i. FOREIGN CURRENCY TRANSLATION
The books and records of the Funds are maintained in U.S. Dollars. The value of investments, assets and liabilities denominated in currencies other than U.S. Dollars are translated into U.S. Dollars based upon current foreign exchange rates. Purchases and sales of foreign investments, income and expenses are converted into U.S. Dollars based on currency exchange rates prevailing on the respective dates of such transactions. Net realized and unrealized gain (loss) on foreign currency transactions represent: (1) foreign exchange gains and losses from the sale and holdings of foreign currencies; (2) gains and losses between trade date and settlement date on investment securities transactions and foreign currency exchange contracts; and (3) gains and losses from the difference between amounts of interest and dividends recorded and the amounts actually received.
The Funds do not isolate the net realized and unrealized gain or loss resulting from changes in exchange rates from the fluctuations in market prices of securities held. Such fluctuations are included with the net realized and unrealized gain or loss on investments.
2. AGREEMENTS AND TRANSACTIONS WITH AFFILIATES
For each of the Funds, the Trust has entered into an investment advisory agreement under which the Investment Manager, a subsidiary and the U.S. wealth platform of Affiliated Managers Group, Inc. (“AMG”), serves as investment manager to the Funds and is responsible for the Funds’ overall administration and operations. The Investment Manager selects and recommends, subject to the approval of the Board and, in certain circumstances, shareholders, the subadviser for the Funds and monitors the subadviser’s investment performance, security holdings and investment strategies. Each Fund’s investment portfolio is managed by TimesSquare Capital Management, LLC (“TimesSquare”) who serves as subadviser pursuant to a subadvisory agreement with the Investment Manager. AMG indirectly owns a majority interest in TimesSquare.
Investment management fees are paid directly by the Funds to the Investment Manager based on average daily net assets. For the six months ended June 30, 2024, the Funds’ investment management fees were paid at the following annual rates of each Fund’s respective average daily net assets:
| | | | |
Small Cap | | | 0.79 | %1 |
| |
Mid Cap | | | 0.79 | %2 |
| |
International Small Cap | | | 0.75 | % |
| |
Emerging Markets Small Cap | | | 0.95 | % |
| |
Global Small Cap | | | 0.70 | % |
| 1 | The Board approved a reduction in the management fee rate from 0.79% to 0.76%, effective July 1, 2024. |
| 2 | The Board approved a reduction in the management fee rate from 0.79% to 0.66%, effective July 1, 2024. |
The fee paid to TimesSquare for its services as subadviser is paid out of the fee the Investment Manager receives from each Fund and does not increase the expenses of each Fund.
The Investment Manager has contractually agreed, through at least May 1, 2025, to waive management fees and/or pay or reimburse fund expenses in order to limit total annual Fund operating expenses after fee waiver and expense
reimbursements (exclusive of taxes, interest (including interest incurred in connection with bank and custody overdrafts, and in connection with securities sold short), shareholder servicing fees, distribution and service (12b-1) fees, brokerage commissions and other transaction costs, dividends payable with respect to securities sold short, acquired fund fees and expenses and extraordinary expenses) of Small Cap, Mid Cap, International Small Cap, Emerging Markets Small Cap and Global Small Cap to the annual rate of 0.99%, 1.13%, 1.05%, 1.25% and 1.00%, respectively, of each Fund’s average daily net assets (this annual rate or such other annual rate that may be in effect from time to time, the “Expense Cap”), subject to later reimbursement by the Funds in certain circumstances. The Board approved a reduction in Small Cap’s expense cap from 0.99% to 0.96%, effective July 1, 2024.
In general, for a period of up to 36 months after the date any amounts are paid, waived or reimbursed by the Investment Manager, the Investment Manager may recover such amounts from a Fund, provided that such repayment would not cause the Fund’s total annual operating expenses after fee waiver and expense reimbursements (exclusive of the items noted in the parenthetical above) to exceed either (i) the Expense Cap in effect at the time such amounts were paid, waived or reimbursed, or (ii) the Expense Cap in effect at the time of such repayment by the Fund.
The contractual expense limitation may only be terminated in the event the Investment Manager or a successor ceases to be the investment manager of a Fund or a successor fund, by mutual agreement between the Investment Manager and the Board, or in the event of a Fund’s liquidation unless the Fund is reorganized or is a party to a merger in which the surviving entity is successor to the accounting and performance information of a Fund.
For the six months ended June 30, 2024, the Investment Manager’s expense reimbursements, and repayments of prior reimbursements by the Funds to the Investment Manager, if any, are as follows:
| | | | |
| | | Expense Reimbursements | | Repayment of Prior Reimbursements |
| | |
Small Cap | | $43,119 | | — |
| | |
Mid Cap | | — | | — |
| | |
International Small Cap | | 45,044 | | — |
| | |
Emerging Markets Small Cap | | 65,387 | | — |
| | |
Global Small Cap | | 36,905 | | — |
At June 30, 2024, the Funds’ expiration of reimbursements subject to recoupment is as follows:
| | | | | | | | |
Expiration Period | | Small Cap | | | International Small Cap | |
| | |
Less than 1 year | | | $28,920 | | | | — | |
| | |
1-2 years | | | 50,246 | | | | — | |
| | |
2-3 years | | | 83,840 | | | | $45,044 | |
| | | | | | | | |
| | |
Total | | | $163,006 | | | | $45,044 | |
| | | | | | | | |
41
| | |
| | Notes to Financial Statements (continued) |
| | | | | | | | |
Expiration
Period | | Emerging Markets Small Cap | | | Global Small Cap | |
| | |
Less than 1 year | | | $122,037 | | | | $73,376 | |
| | |
1-2 years | | | 143,032 | | | | 82,328 | |
| | |
2-3 years | | | 160,778 | | | | 71,647 | |
| | | | | | | | |
| | |
Total | | | $425,847 | | | | $227,351 | |
| | | | | | | | |
The Trust, on behalf of the Funds, has entered into an amended and restated Administration Agreement under which the Investment Manager serves as the Funds’ administrator (the “Administrator”) and is responsible for certain aspects of managing the Funds’ operations, including administration and shareholder services to each Fund. Each Fund pays a fee to the Administrator at the rate of 0.15% per annum of the Fund’s average daily net assets for this service.
The Funds are distributed by AMG Distributors, Inc. (the “Distributor”), a wholly-owned subsidiary of the Investment Manager. The Distributor serves as the distributor and underwriter for each Fund and is a registered broker-dealer and member of the Financial Industry Regulatory Authority, Inc. (“FINRA”). Shares of each Fund will be continuously offered and will be sold directly to prospective purchasers and through brokers, dealers or other financial intermediaries who have executed selling agreements with the Distributor. Generally, the Distributor bears all or a portion of the expenses of providing services pursuant to the distribution agreement, including the payment of the expenses relating to the distribution of prospectuses for sales purposes and any advertising or sales literature.
The Trust has adopted a distribution and service plan (the “Plan”) with respect to the Class N shares of Emerging Markets Small Cap and Global Small Cap, in accordance with the requirements of Rule 12b-1 under the 1940 Act and the requirements of the applicable rules of FINRA regarding asset-based sales charges. Pursuant to the Plan, Emerging Markets Small Cap and Global Small Cap may make payments to the Distributor for its expenditures in financing any activity primarily intended to result in the sale of Emerging Markets Small Cap and Global Small Cap’s Class N shares and for maintenance and personal service provided to existing shareholders of that class. The Plan authorizes payments to the Distributor up to 0.25% annually of Emerging Markets Small Cap’s and Global Small Cap’s average daily net assets attributable to the Class N shares.
For each of the Class N and Class I shares, the Board has approved reimbursement payments to the Investment Manager for shareholder servicing expenses (“shareholder servicing fees”) incurred. Shareholder servicing fees include payments to financial intermediaries, such as broker-dealers (including fund supermarket platforms), banks, and trust companies who provide shareholder recordkeeping, account servicing and other services. The Class N and Class I shares may reimburse the Investment Manager for the actual amount incurred up to a maximum annual rate of each Class’s average daily net assets as shown in the table below.
The impact on the annualized expense ratios for the six months ended June 30, 2024, was as follows:
| | | | | | | | |
| Fund | | Maximum Annual
Amount
Approved | | | Actual
Amount
Incurred | |
| | |
Small Cap | | | | | | | | |
| | |
Class N | | | 0.20% | | | | 0.20% | |
| | |
Class I | | | 0.10% | | | | 0.07% | |
| | |
Mid Cap | | | | | | | | |
| | |
Class N | | | 0.20% | | | | 0.20% | |
| | |
Class I | | | 0.05% | | | | 0.05% | |
| | |
International Small Cap | | | | | | | | |
| | |
Class N | | | 0.25% | | | | 0.25% | |
| | |
Class I | | | 0.10% | | | | 0.06% | |
| | |
Emerging Markets Small Cap | | | | | | | | |
| | |
Class N | | | 0.15% | | | | 0.15% | |
| | |
Class I | | | 0.15% | | | | — | |
| | |
Global Small Cap | | | | | | | | |
| | |
Class N | | | 0.15% | | | | — | |
| | |
Class I | | | 0.15% | | | | — | |
The Board provides supervision of the affairs of the Trust and other trusts within the AMG Funds Family. The Trustees of the Trust who are not affiliated with the Investment Manager receive an annual retainer and per meeting fees for regular, special and telephonic meetings, and they are reimbursed for out-of-pocket expenses incurred while carrying out their duties as Board members. The Chairman of the Board and the Audit Committee Chair receive additional annual retainers. Certain Trustees and Officers of the Funds are Officers and/or Directors of the Investment Manager, AMG and/or the Distributor.
The Securities and Exchange Commission (the “SEC”) granted an exemptive order that permits certain eligible funds in the AMG Funds Family to lend and borrow money for certain temporary purposes directly to and from other eligible funds in the AMG Funds Family. Participation in this interfund lending program is voluntary for both the borrowing and lending funds, and an interfund loan is only made if it benefits each participating fund. The Administrator manages the program according to procedures approved by the Board, and the Board monitors the operation of the program. An interfund loan must comply with certain conditions set out in the exemptive order, which are designed to assure fairness and protect all participating funds. The interest earned and interest paid on interfund loans are included on the Statement of Operations as interest income and interest expense, respectively. At June 30, 2024, the Funds had no interfund loans outstanding.
The following Funds utilized the interfund loan program during the six months ended June 30, 2024 as follows:
| | | | | | | | | | | | | | | | |
| Fund | | Average
Lent | | | Number
of Days | | | Interest
Earned | | | Average
Interest Rate | |
| | | | |
Small Cap | | $ | 1,494,327 | | | | 3 | | | $ | 765 | | | | 6.230% | |
| | | | |
Mid Cap | | | 3,807,526 | | | | 1 | | | | 649 | | | | 6.225% | |
| | | | |
International Small Cap | | | 1,095,734 | | | | 5 | | | | 935 | | | | 6.226% | |
42
| | |
| | Notes to Financial Statements (continued) |
| | | | | | | | | | | | | | | | |
| Fund | | Average
Borrowed | | | Number
of Days | | | Interest
Paid | | | Average
Interest Rate | |
| | | | |
International Small Cap | | | $11,487,978 | | | | 8 | | | | $15,636 | | | | 6.210% | |
Emerging Markets Small Cap and Global Small Cap did not participate in the interfund lending program for the six months ended June 30, 2024.
3. PURCHASES AND SALES OF SECURITIES
Purchases and sales of securities (excluding short-term securities and U.S. Government Obligations) for the six months ended June 30, 2024, were as follows:
| | | | | | | | |
| | | Long Term Securities | |
| | |
| Fund | | Purchases | | | Sales |
| | |
Small Cap | | $ | 47,099,047 | | | $ | 59,229,739 | |
| | |
Mid Cap | | | 172,035,941 | | | | 222,081,462 | |
| | |
International Small Cap | | | 58,817,102 | | | | 105,948,898 | |
| | |
Emerging Markets Small Cap | | | 754,232 | | | | 823,346 | |
| | |
Global Small Cap | | | 704,875 | | | | 680,380 | |
The Funds had no purchases or sales of U.S. Government Obligations during the six months ended June 30, 2024.
4. PORTFOLIO SECURITIES LOANED
The Funds participate in the Securities Lending Program providing for the lending of securities to qualified borrowers. Securities lending income includes earnings of such temporary cash investments, plus or minus any rebate to a borrower. These earnings (after any rebate) are then divided between BNYM, as a fee for its services under the Securities Lending Program, and the Funds, according to agreed-upon rates. Collateral on all securities loaned is accepted in cash, U.S. Treasury Obligations or U.S. Government Agency Obligations. Collateral is maintained at a minimum level of 102% (105% in the case of certain foreign securities) of the market value, plus interest, if applicable, of investments on loan. It is the Funds’ policy to obtain additional collateral from or return excess collateral to the borrower by the end of the next business day, following the valuation date of the securities loaned. Therefore, the value of the collateral held may be temporarily less than the value of the securities on loan. Lending securities entails a risk of loss to the Funds if and to the extent that the market value of the securities loaned were to increase and the borrower did not increase the collateral accordingly, and the borrower fails to return the securities. Under the terms of the Securities Lending Program, the Funds are indemnified for such losses by BNYM. Cash collateral is held in separate omnibus accounts managed by BNYM, who is authorized to exclusively enter into joint repurchase agreements for that cash collateral. Securities collateral is held in separate omnibus accounts managed by BNYM and cannot be sold or pledged. BNYM bears the risk of any deficiency in the amount of the cash collateral available for return to the borrower due to any loss on the collateral invested. Loans of securities are terminable at any time and the borrower, after notice, is required to return borrowed securities as soon as practical, which is normally within three business days.
The value of securities loaned on positions held, cash collateral and securities collateral received at June 30, 2024, was as follows:
| | | | | | | | | | | | | | | | |
| Fund | | Securities
Loaned | | | Cash
Collateral
Received | | | Securities
Collateral Received | | | Total Collateral Received |
| | | | |
Small Cap | | | $11,397,291 | | | | $5,468,224 | | | | $6,165,786 | | | | $11,634,010 | |
| | | | |
Mid Cap | | | 25,499,001 | | | | 4,110,386 | | | | 22,618,629 | | | | 26,729,015 | |
| | | | |
International Small Cap | | | 9,881,047 | | | | 3,990,730 | | | | 7,996,983 | | | | 11,987,713 | |
| | | | |
Global Small Cap | | | 61,487 | | | | 23,738 | | | | 39,535 | | | | 63,273 | |
The following table summarizes the securities received as collateral for securities lending at June 30, 2024:
| | | | | | | | |
| Fund | | Collateral Type | | Coupon
Range | | Maturity Date Range |
| | | |
Small Cap | | U.S. Treasury
Obligations | | 0.000%-5.368% | | | 07/31/24-02/15/53 | |
| | | |
Mid Cap | | U.S. Treasury
Obligations | | 0.000%-5.368% | | | 07/30/24-11/15/53 | |
| | | |
International Small Cap | | U.S. Treasury
Obligations | | 0.000%-6.250% | | | 07/11/24-08/15/53 | |
| | | |
Global Small Cap | | U.S. Treasury
Obligations | | 0.000%-6.250% | | | 07/11/24-08/15/53 | |
5. FUND RISKS
In the normal course of business, the Funds invest in securities or other instruments and may enter into certain transactions, and such activities subject the Funds to various risks. Below is a summary of some, but not all, of those risks. Each risk described below does not necessarily apply to each Fund. Please refer to each Fund’s prospectus for a description of the principal risks associated with investing in a particular Fund. The value of securities or other instruments may also be affected by various factors, including, without limitation: (i) the general economy; (ii) the overall market as well as local, regional or global political and/or social instability; or (iii) currency and price fluctuations.
Market Risk: Market prices of investments held by the Funds may fall rapidly or unpredictably due to a variety of factors, including economic, political, or market conditions, or other factors including terrorism, war, natural disasters and the spread of infectious illness or other public health issues, including epidemics or pandemics, or in response to events that affect particular industries or companies.
Management Risk: Because the Funds are actively managed investment portfolios, security selection or focus on securities in a particular style, market sector or group of companies may cause the Funds to incur losses or underperform relative to its benchmarks or other funds with a similar investment objective. There can be no guarantee that TimesSquare’s investment techniques and risk analysis will produce the desired result.
Small-and Mid- Capitalization Stock Risk: The stocks of small- and mid-capitalization companies often have greater price volatility, lower trading volume, and less liquidity than the stocks of larger, more established companies.
Growth Stock Risk: The prices of equity securities of companies that are expected to experience relatively rapid earnings growth, or “growth stocks,” may be more sensitive to market movements because the prices tend to reflect future investor expectations rather than just current profits.
Liquidity Risk: The Funds may not be able to dispose of particular investments, such as illiquid securities, readily at favorable times or prices or the Funds may have to sell them at a loss.
43
| | |
| | Notes to Financial Statements (continued) |
Sector Risk: Issuers and companies that are in similar industry sectors may be similarly affected by particular economic or market events; to the extent the Funds have substantial holdings within a particular sector, the risks associated with that sector increase.
Frontier Markets Risk: Investments in frontier markets may be more volatile and less liquid than investments in more developed markets or in other emerging market countries. Risks that are characteristic of many emerging markets generally may be especially heightened in frontier markets due to political, economic, financial, or other factors.
Foreign Investment Risk: Investments in foreign issuers involve additional risks (such as risks arising from less frequent trading, changes in political or social conditions, and less publicly available information about non-U.S. issuers) that differ from those associated with investments in U.S. issuers and may result in greater price volatility.
Emerging Markets Risk: Investments in emerging markets are subject to the general risks of foreign investments, as well as additional risks which can result in greater price volatility. Such additional risks include the risk that markets in emerging market countries are typically less developed and less liquid than markets in developed countries and such markets are subjected to increased economic, political, or regulatory uncertainties.
Currency Risk: Fluctuations in exchange rates may affect the total loss or gain on a non-U.S. dollar investment when converted back to U.S. dollars and exposure to non-U.S. currencies may subject the certain Funds to the risk that those currencies will decline in value relative to the U.S. dollar. The values of foreign currencies relative to the U.S. dollar may fluctuate in response to, among other factors, interest rate changes, intervention (or failure to intervene) by national governments, central banks, or supranational entities such as the International Monetary Fund, the imposition of currency controls, and other political or regulatory developments.
Geographic Focus Risk: To the extent a Fund focuses its investments in a particular country, group of countries or geographic region, the Fund is particularly susceptible to economic, political, regulatory or other events or conditions affecting such countries or region, and the Fund’s NAV may be more volatile than the NAV of a more geographically diversified fund and may result in losses.
Risks Associated with Investment in Japan: Certain Funds are highly susceptible to the social, political, economic, regulatory and other conditions or events that may affect Japan’s economy. The Japanese economy is heavily dependent upon international trade, and, therefore, is particularly exposed to the risks of currency fluctuation, foreign trade policy and regional and global economic disruption, including the risk of increased tariffs, embargoes, and other trade limitations or factors. The Japanese economy, at times, has been impacted by government regulation, intervention, and protectionism; cross-ownership among major corporations; an aging demographic; and a declining population. The potential for natural disasters, such as earthquakes, volcanic eruptions, typhoons and tsunamis, could also have significant negative effects on Japan’s economy.
Political Risk: Changes in the general political and social environment of a country can have substantial effects on the value of investments exposed to that country.
Large Shareholder Risk: To the extent that a large number of shares of a Fund is held by a single shareholder (e.g., an institutional investor) or a group of shareholders with a common investment strategy, the Fund is subject to the risk that a redemption or large purchase by that shareholder or group of all or a large portion of its Fund shares will require the Fund to sell securities, or to invest additional cash, as the case may be, at disadvantageous prices, disrupt the Fund’s operations, or force the Fund’s liquidation. Purchases of a large number of shares may adversely affect the Fund’s performance to the extent that it takes time to invest new cash and the Fund maintains a larger cash position than it ordinarily would.
ESG Investing Risk: Because applying a Fund’s ESG investment criteria may result in the selection or exclusion of securities of certain issuers for reasons other than financial performance, the Fund’s investment returns may underperform funds that do not incorporate ESG factors into their investment process. The incorporation of ESG criteria into the investment process may affect the Fund’s investment exposure to certain companies, sectors, regions, countries or types of investments, which could negatively impact the Fund’s performance depending on whether such investments are in or out of favor. Applying ESG criteria to investment decisions is qualitative and subjective by nature, and there is no guarantee that the criteria utilized by TimesSquare or any judgment exercised by TimesSquare will improve the financial performance of the Fund or reflect the beliefs or values of any particular investor. ESG standards differ by region and industry, and a company’s ESG practices or TimesSquare’s assessment of a company’s ESG practices may change over time. TimesSquare’s evaluation of a company also may be dependent on the availability of timely, complete and accurate ESG data reported by issuers and/or third party data providers. Different methodologies may be used by the various issuers and third party sources that provide ESG data, and such ESG data often lacks standardization, consistency and transparency.
6. COMMITMENTS AND CONTINGENCIES
Under the Trust’s organizational documents, its Trustees and Officers are indemnified against certain liabilities arising out of the performance of their duties to the Trust. In addition, in the normal course of business, the Funds may enter into contracts and agreements that contain a variety of representations and warranties, which provide general indemnifications. The maximum exposure to the Funds under these arrangements is unknown, as this would involve future claims that may be made against a Fund that have not yet occurred. However, based on experience, the Funds had no prior claims or losses and expect the risks of loss to be remote.
7. MASTER NETTING AGREEMENTS
The Funds may enter into master netting agreements with their counterparties for the Securities Lending Program and Repurchase Agreements, which provide the right, in the event of default (including bankruptcy or insolvency) for the non-defaulting party to liquidate the collateral and calculate net exposure to the defaulting party or
44
| | |
| | Notes to Financial Statements (continued) |
request additional collateral. For financial reporting purposes, the Funds do not offset financial assets and financial liabilities that are subject to master netting agreements in the Statement of Assets and Liabilities. For securities lending transactions, see Note 4.
The following table is a summary of the Funds’ open Repurchase Agreements that are subject to a master netting agreement as of June 30, 2024:
| | | | | | | | | | | | | | | | |
| | | | | Gross Amount Not Offset in the
Statement of Assets and Liabilities | | | | |
| Fund | | Gross Amounts of Assets Presented in
the Statement of Assets and Liabilities | | Offset Amount | | Net Asset Balance | | Collateral Received | | Net
Amount |
| | | | | |
Small Cap | | | | | | | | | | | | | | | | |
| | | | | |
Bethesda Securities LLC | | | $68,224 | | | — | | | $68,224 | | | | $68,224 | | | — |
| | | | | |
State of Wisconsin Investment Board | | | 5,400,000 | | | — | | | 5,400,000 | | | | 5,400,000 | | | — |
| | | | | | | | | | | | | | | | |
| | | | | |
Total | | | $5,468,224 | | | — | | | $5,468,224 | | | | $5,468,224 | | | — |
| | | | | | | | | | | | | | | | |
| | | | | |
Mid Cap | | | | | | | | | | | | | | | | |
| | | | | |
Bethesda Securities LLC | | | $110,386 | | | — | | | $110,386 | | | | $110,386 | | | — |
| | | | | |
State of Wisconsin Investment Board | | | 4,000,000 | | | — | | | 4,000,000 | | | | 4,000,000 | | | — |
| | | | | | | | | | | | | | | | |
| | | | | |
Total | | | $4,110,386 | | | — | | | $4,110,386 | | | | $4,110,386 | | | — |
| | | | | | | | | | | | | | | | |
| | | | | |
International Small Cap | | | | | | | | | | | | | | | | |
| | | | | |
Bethesda Securities LLC | | | $90,730 | | | — | | | $90,730 | | | | $90,730 | | | — |
| | | | | |
State of Wisconsin Investment Board | | | 3,900,000 | | | — | | | 3,900,000 | | | | 3,900,000 | | | — |
| | | | | | | | | | | | | | | | |
| | | | | |
Total | | | $3,990,730 | | | — | | | $3,990,730 | | | | $3,990,730 | | | — |
| | | | | | | | | | | | | | | | |
| | | | | |
Global Small Cap | | | | | | | | | | | | | | | | |
| | | | | |
Bethesda Securities LLC | | | $23,738 | | | — | | | $23,738 | | | | $23,738 | | | — |
8. SUBSEQUENT EVENTS
The Funds have determined that no material events or transactions occurred through the issuance date of the Funds’ financial statements which require an additional disclosure in or adjustment of the Funds’ financial statements.
45
| | |
| | Other Information (unaudited) |
ITEM 8. CHANGES IN AND DISAGREEMENTS WITH ACCOUNTANTS FOR OPEN-END MANAGEMENT INVESTMENT COMPANIES
During the six months ended June 30, 2024, there were no changes in and/or disagreements with accountants.
ITEM 9. PROXY DISCLOSURES FOR OPEN-END MANAGEMENT INVESTMENT COMPANIES
Not applicable.
ITEM 10. REMUNERATION PAID TO DIRECTORS, OFFICERS, AND OTHERS OF OPEN-END MANAGEMENT INVESTMENT COMPANIES
The remuneration paid to the Trustees during the six months ended June 30, 2024, is reflected as “Trustee fees and expenses” on the Statement of Operations and is set forth in the table below. There was no remuneration paid to any Fund officer or to any affiliated person of any Fund Trustee or officer during the six months ended June 30, 2024.
| | | | |
| | | Trustee fees and expenses | |
| |
AMG TimesSquare Small Cap Growth Fund | | | $6,357 | |
| |
AMG TimesSquare Mid Cap Growth Fund | | | 49,386 | |
| |
AMG TimesSquare International Small Cap Fund | | | 7,418 | |
| |
AMG TimesSquare Emerging Markets Small Cap Fund | | | 69 | |
| |
AMG TimesSquare Global Small Cap Fund | | | 68 | |
46
| | |
| | ITEM 11. STATEMENT REGARDING BASIS FOR APPROVAL OF INVESTMENT ADVISORY CONTRACT |
| | | | | | | | |
AMG TimesSquare Mid Cap Growth Fund, AMG TimesSquare Small Cap Growth Fund, AMG TimesSquare International Small Cap Fund, AMG TimesSquare Emerging Markets Small Cap Fund, and AMG TimesSquare Global Small Cap Fund: Approval of Investment Management Agreement and Subadvisory Agreements on June 12, 2024 At an in-person meeting held on June 12, 2024, the Board of Trustees (the “Board” or the “Trustees”), and separately a majority of the Trustees who are not “interested persons” of AMG Funds (the “Trust”) (the “Independent Trustees”), approved (i) the Investment Management Agreement, as amended pursuant to letter agreements at any time prior to the date of the meeting, with AMG Funds LLC (the “Investment Manager”) for each of AMG TimesSquare Mid Cap Growth Fund, AMG TimesSquare Small Cap Growth Fund, AMG TimesSquare International Small Cap Fund, AMG TimesSquare Emerging Markets Small Cap Fund and AMG TimesSquare Global Small Cap Fund (each, a “Fund,” and collectively, the “Funds”) and separately each of Amendment No. 1 thereto dated July 1, 2015, and Amendment No. 2 thereto dated October 1, 2016 (collectively, the “Investment Management Agreement”); and (ii) the Subadvisory Agreement with respect to each Fund, as amended at any time prior to the date of the meeting (collectively, the “Subadvisory Agreements”), with TimesSquare Capital Management, LLC, the Funds’ subadviser (the “Subadviser”). The Independent Trustees were separately represented by independent legal counsel in connection with their consideration of the approval of these agreements. In considering the Investment Management Agreement and Subadvisory Agreements, the Trustees reviewed a variety of materials relating to each Fund, the Investment Manager and the Subadviser, including the nature, extent and quality of services, comparative performance, fee and expense information for an appropriate peer group of similar mutual funds for each Fund (each, a “Peer Group”), performance information for the relevant benchmark index for each Fund (each, a “Fund Benchmark”), other relevant matters, including management fees, the profitability of the Investment Manager and the Subadviser, and the potential for economies of scale that may be shared with the Funds, and other information provided to them on a periodic basis throughout the year. Prior to voting, the Independent Trustees: (a) reviewed the foregoing information with their independent legal counsel; (b) received materials from their independent legal counsel discussing the legal standards applicable to their consideration of the Investment Management | | | | Agreement and the Subadvisory Agreements; and (c) met with their independent legal counsel in private sessions at which no representatives of management were present. NATURE, EXTENT AND QUALITY OF SERVICES In considering the nature, extent and quality of the services provided by the Investment Manager, the Trustees reviewed information provided by the Investment Manager at the June 12, 2024 meeting and prior meetings relating to the Investment Manager’s operations and personnel. Among other things, the Investment Manager provided financial information, information about its supervisory and professional staff and descriptions of its organizational and management structure. The Trustees also took into account information provided periodically throughout the previous year by the Investment Manager in Board meetings relating to the performance of its duties with respect to the Funds and the Trustees’ knowledge of the Investment Manager’s management and the quality of the performance of the Investment Manager’s duties under the Investment Management Agreement and Administration Agreement. In the course of their deliberations regarding the Investment Manager, the Trustees evaluated, among other things: (a) the extent and quality of the Investment Manager’s oversight of the operation and management of the Funds; (b) the quality of the Investment Manager’s oversight of the performance by the Subadviser of its portfolio management duties; (c) the Investment Manager’s ability to supervise the Funds’ other service providers; and (d) the Investment Manager’s compliance program. The Trustees also took into account that, in performing its functions under the Investment Management Agreement and supervising the Subadviser, the Investment Manager: performs periodic detailed analyses and reviews of the performance by the Subadviser of its obligations to each Fund, including without limitation, analysis and review of portfolio and other compliance matters and review of the Subadviser’s investment performance with respect to each Fund; prepares and presents periodic reports to the Board regarding the investment performance of the Subadviser and other information regarding the Subadviser, at such times and in such forms as the Board may reasonably request; reviews and considers any changes in the personnel of the Subadviser responsible for performing the Subadviser’s obligations and makes appropriate reports to the Board; reviews and considers any changes in the ownership or senior management of the Subadviser and makes appropriate reports to the Board; performs periodic | | | | in-person, telephonic or videoconference diligence meetings, including with respect to compliance matters, with representatives of the Subadviser; assists the Board and management of the Trust in developing and reviewing information with respect to the initial approval of the Subadvisory Agreements and annual consideration of the Subadvisory Agreements thereafter; prepares recommendations with respect to the continued retention of the Subadviser or the replacement of the Subadviser, including at the request of the Board; identifies potential successors to, or replacements of, the Subadviser or potential additional subadvisers, including performing appropriate due diligence, and developing and presenting to the Board a recommendation as to any such successor, replacement, or additional subadviser, including at the request of the Board; designates and compensates from its own resources such personnel as the Investment Manager may consider necessary or appropriate to the performance of its services; and performs such other review and reporting functions as the Board shall reasonably request consistent with the Investment Management Agreement and applicable law. The Trustees noted the affiliation of the Subadviser with the Investment Manager, noting any potential conflicts of interest. The Trustees also took into account the financial condition of the Investment Manager with respect to its ability to provide the services required under the Investment Management Agreement and the Investment Manager’s undertaking to maintain contractual expense limitations for the Funds. The Trustees also considered the Investment Manager’s risk management processes. The Trustees also reviewed information relating to the Subadviser’s operations and personnel and the investment philosophy, strategies and techniques (its “Investment Strategy”) used in managing each Fund. Among other things, the Trustees reviewed information on portfolio management and other professional staff, information regarding the Subadviser’s organizational and management structure and the Subadviser’s brokerage policies and practices. The Trustees considered specific information provided regarding the experience of the individuals at the Subadviser with portfolio management responsibility for each Fund, including the information set forth in the Fund’s prospectus and statement of additional information. In the course of their deliberations, the Trustees evaluated, among other things: (a) the services rendered by the Subadviser in the past; (b) the qualifications and experience of the Subadviser’s personnel; and (c) the Subadviser’s compliance program. The Trustees also |
| | | | | | | | |
| | | | | | | | |
47
| | |
| | ITEM 11. STATEMENT REGARDING BASIS FOR APPROVAL OF INVESTMENT ADVISORY CONTRACT (continued) |
| | | | | | | | |
took into account the financial condition of the Subadviser with respect to its ability to provide the services required under the Subadvisory Agreements. The Trustees also considered the Subadviser’s risk management processes. PERFORMANCE The Board considered each Fund’s net performance during relevant time periods as compared to the Fund’s Peer Group and Fund Benchmark, considered the gross performance of the Fund as compared to the Subadviser’s relevant performance composite that utilizes a similar investment strategy and approach, and noted that the Board reviews on a quarterly basis detailed information about both the Fund’s performance results and portfolio composition, as well as the Subadviser’s Investment Strategy. The Board was mindful of the Investment Manager’s expertise, resources and attention to monitoring the Subadviser’s performance, investment style and risk-adjusted performance with respect to the Funds and its discussions with the management of the Funds’ subadviser during the period regarding the factors that contributed to the performance of the Funds. With respect to AMG TimesSquare Mid Cap Growth Fund, among other information relating to the Fund’s performance, the Trustees noted that the Fund’s performance for Class Z shares (which share class has one of the earliest inception dates and the largest amount of assets of all the share classes of the Fund) for the 1-year, 3-year, 5-year and 10-year periods ended March 31, 2024, was above the median performance of the Peer Group and above the performance of the Fund Benchmark, the Russell Midcap Growth Index. The Trustees took into account management’s discussion of the Fund’s performance, including the reasons for the Fund’s outperformance relative to the Peer Group and the Fund Benchmark. The Trustees also noted that the Fund ranked in the top decile relative to its Peer Group for the 3-year and 5-year periods and that Class Z shares of the Fund ranked in the top quintile relative to its Peer Group for the 1-year and 10-year periods. The Trustees concluded that the Fund’s overall performance has been satisfactory. With respect to AMG TimesSquare Small Cap Growth Fund, among other information relating to the Fund’s performance, the Trustees noted that the Fund’s performance for Class Z shares (which share class has one of the earliest inception dates and the largest amount of assets of all the share classes of the Fund) for the 1-year, 3-year, 5-year and 10-year periods ended March 31, 2024, was below the median performance of the Peer Group and below, | | | | above, below, and above, respectively, the performance of the Fund Benchmark, the Russell 2000 Growth Index. The Trustees took into account management’s discussion of the Fund’s performance, including the reasons for the Fund’s recent underperformance relative to the Fund Benchmark and the Peer Group and the Fund’s longer-term underperformance relative to the Peer Group. The Trustees also noted that the Fund ranked in the top half relative to its Peer Group for the 2022 calendar year. The Trustees concluded that the Fund’s overall performance has been satisfactory in light of the Fund’s investment objective, strategies and policies. With respect to AMG TimesSquare International Small Cap Fund, among other information relating to the Fund’s performance, the Trustees noted that the Fund’s performance for Class Z shares (which share class has one of the earliest inception dates and the largest amount of assets of all the share classes of the Fund with that inception date) for the 1-year, 3-year, 5-year and 10-year periods ended March 31, 2024, was below the median performance of the Peer Group and below the performance of the Fund Benchmark, the MSCI EAFE Small Cap Index. The Trustees took into account the reasons for the Fund’s underperformance relative to the Fund Benchmark and Peer Group and noted the impact of the Fund’s underperformance during certain calendar years on its longer-term performance. The Trustees also noted that the Fund ranked in the top half relative to its Peer Group for the 2022 calendar year. The Trustees concluded that the Fund’s overall performance has been satisfactory in light of the Fund’s investment objective, strategies and policies. With respect to AMG TimesSquare Emerging Markets Small Cap Fund, among other information relating to the Fund’s performance, the Trustees noted that the Fund’s performance for Class Z shares (which share class has one of the earliest inception dates and the largest amount of assets of all the share classes of the Fund) for the 1-year, 3-year and 5-year periods ended March 31, 2024 and for the period from the Fund’s inception on December 14, 2016 through March 31, 2024, was above the median performance of the Peer Group and below the performance of the Fund Benchmark, the MSCI Emerging Markets Small Cap Index. The Trustees took into account management’s discussion of the Fund’s performance, including the reasons for the Fund’s outperformance relative to the Peer Group and underperformance relative to the Fund Benchmark. The Trustees also noted that the Fund ranked in the top decile relative to its Peer Group for the 5-year period and in the top quintile relative to its Peer | | | | Group for the 1-year period and for the period from inception through March 31, 2024, and that Class Z shares of the Fund ranked in the top quintile relative to its Peer Group for the 3-year period. The Trustees concluded that the Fund’s overall performance has been satisfactory in light of the Fund’s investment objective, strategies and policies. With respect to AMG TimesSquare Global Small Cap Fund, among other information relating to the Fund’s performance, the Trustees noted that the Fund’s performance for Class Z shares (which share class has the largest amount of assets of all the share classes of the Fund) for the 1-year, 3-year and 5-year periods ended March 31, 2024 and for the period from the Fund’s inception on May 30, 2018 through March 31, 2024, was below, above, below, and below, respectively, the median performance of the Peer Group and below the performance of the Fund Benchmark, the MSCI World Small Cap Index. The Trustees took into account management’s discussion of the Fund’s performance, including reasons for the Fund’s underperformance relative to the Fund Benchmark and the Peer Group. The Trustees also noted that Class Z shares of the Fund ranked in the top third relative to its Peer Group for the 3-year period. The Trustees concluded that the Fund’s performance has been satisfactory in light of the Fund’s investment objective, strategies and policies. ADVISORY AND SUBADVISORY FEES; FUND EXPENSES; PROFITABILITY; AND ECONOMIES OF SCALE In considering the reasonableness of the advisory fee payable to the Investment Manager, the Trustees reviewed information provided by the Investment Manager at the June 12, 2024 meeting and prior meetings setting forth all revenues and other benefits, both direct and indirect (including any so-called “fallout benefits” such as reputational value derived from the Investment Manager serving as Investment Manager to a Fund), received by the Investment Manager and its affiliates attributable to managing each Fund and all the mutual funds in the AMG Funds Family of Funds; the cost of providing such services; the significant risks undertaken as Investment Manager and sponsor of the Funds, including investment, operational, enterprise, entrepreneurial, litigation, regulatory and compliance risks; and the resulting profitability to the Investment Manager and its affiliates from these relationships. The Trustees also considered the amount of the advisory fee retained by the Investment Manager after payment of the subadvisory fee with respect to each Fund. The Trustees also noted payments are made from the Subadviser to the Investment Manager, and other payments are made from the |
| | | | | | | | |
| | | | | | | | |
48
| | |
| | ITEM 11. STATEMENT REGARDING BASIS FOR APPROVAL OF INVESTMENT ADVISORY CONTRACT (continued) |
| | | | | | | | |
Investment Manager to the Subadviser. The Trustees also considered management’s discussion of the current asset level of each Fund, and the impact on profitability of both the current asset levels and any future growth of assets of the Funds. In considering the cost of services to be provided by the Investment Manager under the Investment Management Agreement and the profitability to the Investment Manager of its relationship with each Fund, the Trustees noted the undertaking by the Investment Manager to maintain contractual expense limitations for the Funds. The Board also took into account management’s discussion of the advisory fee structure, and the services the Investment Manager provides in performing its functions under the Investment Management Agreement and supervising the Subadviser. Based on the foregoing, the Trustees concluded that the profitability to the Investment Manager is reasonable and that the Investment Manager is not realizing material benefits from economies of scale that would warrant adjustments to the advisory fee at this time. Also, with respect to economies of scale, the Trustees noted that as each Fund’s assets increase over time, the Fund may realize other economies of scale to the extent the increase in assets is proportionally greater than the increase in certain other expenses. In considering the reasonableness of the subadvisory fees payable by the Investment Manager to the Subadviser, the Trustees reviewed information regarding the cost to the Subadviser of providing subadvisory services to each Fund and the resulting profitability from the relationships. The Trustees noted that, because the Subadviser is an affiliate of the Investment Manager, a portion of the Subadviser’s revenues or profits might be shared directly or indirectly with the Investment Manager. The Trustees also noted that the subadvisory fees are paid by the Investment Manager out of its advisory fee. The Board also took into account management’s discussion of the subadvisory fee structure, and the services the Subadviser provides in performing its functions under the Subadvisory Agreements. Based on the foregoing, the Trustees concluded that the profitability to the Subadviser is reasonable and that the Subadviser is not realizing material benefits from economies of scale that would warrant adjustments to the subadvisory fees at this time. Also, with respect to economies of scale, the Trustees noted that as a Fund’s assets increase over time, the Fund may realize other economies of scale to the extent the increase in assets is proportionally greater than the increase in certain other expenses. | | | | With respect to AMG TimesSquare Mid Cap Growth Fund, the Trustees noted that the management fees (which include both the advisory and administration fees) and total expenses (net of applicable expense waivers/reimbursements) of Class Z shares (the class of shares which is the primary focus of the Fund’s distribution) of the Fund as of March 31, 2024, were rated in the High and the Above Average rating level, respectively, of the Fund’s Peer Group. The Trustees noted that the rating levels corresponded to the Fund’s quintile ranking in its Peer Group. The Trustees took into account the fact that the Investment Manager has contractually agreed, through May 1, 2025, to limit the Fund’s net annual operating expenses (subject to certain excluded expenses) to 1.13%. The Trustees also noted that the Investment Manager proposed, effective July 1, 2024, to reduce the Fund’s management fee rate, and that this proposal was approved by the Board. The Trustees also took into account management’s discussion of the Fund’s expenses, including fees and expenses relative to comparably sized funds and key competitors. The Trustees concluded that, in light of the nature, extent and quality of the services provided by the Investment Manager and the Subadviser (which is an affiliate of the Investment Manager), the foregoing expense limitation and the considerations noted above with respect to the Investment Manager and the Subadviser, the Fund’s advisory and subadvisory fees are reasonable. With respect to AMG TimesSquare Small Cap Growth Fund, the Trustees noted that the management fees (which include both the advisory and administration fees) and total expenses (net of applicable expense waivers/reimbursements) of Class Z shares (the class of shares which is the primary focus of the Fund’s distribution) of the Fund as of March 31, 2024, were rated in the Above Average and the Average rating level, respectively, of the Fund’s Peer Group. The Trustees noted that the rating level corresponded to the Fund’s quintile ranking in its Peer Group. The Trustees took into account the fact that the Investment Manager has contractually agreed, through May 1, 2025, to limit the Fund’s net annual operating expenses (subject to certain excluded expenses) to 0.99%. The Trustees also took into account that the Investment Manager proposed, effective July 1, 2024 through May 1, 2026, to lower the Fund’s contractual expense limitation to 0.96% of the Fund’s net annual operating expenses (subject to certain excluded expenses), and that this proposal was approved by the Board. The Trustees also noted that the Investment Manager proposed, effective July 1, 2024, to reduce the Fund’s management fee rate, and that this proposal was approved by the | | | | Board. The Trustees concluded that, in light of the nature, extent and quality of the services provided by the Investment Manager and the Subadviser (which is an affiliate of the Investment Manager), the foregoing expense limitation and the considerations noted above with respect to the Investment Manager and the Subadviser, the Fund’s advisory and subadvisory fees are reasonable. With respect to AMG TimesSquare International Small Cap Fund, the Trustees noted that the management fees (which include both the advisory and administration fees) and total expenses (net of applicable expense waivers/reimbursements) of Class I shares (the class of shares which is the primary focus of the Fund’s distribution) of the Fund as of March 31, 2024, were rated in the Below Average and the Above Average rating level, respectively, of the Fund’s Peer Group. The Trustees noted that the rating levels corresponded to the Fund’s quintile ranking in its Peer Group. The Trustees took into account the fact that the Investment Manager has contractually agreed, through May 1, 2025, to limit the Fund’s net annual operating expenses (subject to certain excluded expenses) to 1.05%. The Trustees also took into account management’s discussion of the Fund’s expenses, including fees and expenses relative to comparably sized funds and key competitors. The Trustees concluded that, in light of the nature, extent and quality of the services provided by the Investment Manager and the Subadviser (which is an affiliate of the Investment Manager), the foregoing expense limitation and the considerations noted above with respect to the Investment Manager and the Subadviser, the Fund’s advisory and subadvisory fees are reasonable. With respect to AMG TimesSquare Emerging Markets Small Cap Fund, the Trustees noted that the management fees (which include both the advisory and administration fees) and total expenses (net of applicable expense waivers/reimbursements) of Class Z shares (the class of shares which is the primary focus of the Fund’s distribution) of the Fund as of March 31, 2024, were both rated in the High rating level of the Fund’s Peer Group. The Trustees noted that the rating level corresponded to the Fund’s quintile ranking in its Peer Group. The Trustees took into account the fact that the Investment Manager has contractually agreed, through May 1, 2025, to limit the Fund’s net annual operating expenses (subject to certain excluded expenses) to 1.25%. The Trustees also took into account management’s discussion of the Fund’s expenses, including fees and expenses relative to comparably sized funds and select competitors, and |
49
| | |
| | ITEM 11. STATEMENT REGARDING BASIS FOR APPROVAL OF INVESTMENT ADVISORY CONTRACT (continued) |
| | | | | | | | |
the Fund’s small size relative to its peer universe. The Trustees concluded that, in light of the nature, extent and quality of the services provided by the Investment Manager and the Subadviser (which is an affiliate of the Investment Manager), the foregoing expense limitation and the considerations noted above with respect to the Investment Manager and the Subadviser, the Fund’s advisory and subadvisory fees are reasonable. With respect to AMG TimesSquare Global Small Cap Fund, the Trustees noted that the management fees (which include both the advisory and administration fees) and total expenses (net of applicable expense waivers/reimbursements) of Class Z shares (the class of shares which is the primary focus of the Fund’s distribution) of the Fund as of March 31, 2024, were both rated in the Below Average rating level of the Fund’s Peer Group. The Trustees noted that the rating level corresponded to the Fund’s quintile ranking in its Peer Group. The Trustees took into | | | | account the fact that the Investment Manager has contractually agreed, through May 1, 2025, to limit the Fund’s net annual operating expenses (subject to certain excluded expenses) to 1.00%. The Trustees concluded that, in light of the nature, extent and quality of the services provided by the Investment Manager and the Subadviser (which is an affiliate of the Investment Manager), the foregoing expense limitation and the considerations noted above with respect to the Investment Manager and the Subadviser, the Fund’s advisory and subadvisory fees are reasonable. * * * * After consideration of the foregoing, the Trustees also reached the following conclusions (in addition to the conclusions discussed above) regarding the Investment Management Agreement and Subadvisory Agreements: (a) the Investment Manager and the Subadviser have demonstrated | | | | that they possess the capability and resources to perform the duties required of them under the Investment Management Agreement and each Subadvisory Agreement and (b) the Investment Manager and Subadviser maintain appropriate compliance programs. Based on all of the above-mentioned factors and their related conclusions, with no single factor or conclusion being determinative and with each Trustee not necessarily attributing the same weight to each factor, the Trustees concluded that approval of the Investment Management Agreement and the Subadvisory Agreements would be in the best interests of the applicable Fund and its shareholders. Accordingly, on June 12, 2024, the Trustees, and separately a majority of the Independent Trustees, voted to approve the Investment Management and the Subadvisory Agreements for each Fund. |
50
THIS PAGE INTENTIONALLY LEFT BLANK
THIS PAGE INTENTIONALLY LEFT BLANK
| | |
| | |
| | | | |
INVESTMENT MANAGER AND ADMINISTRATOR AMG Funds LLC 680 Washington Blvd., Suite 500 Stamford, CT 06901 800.548.4539 DISTRIBUTOR AMG Distributors, Inc. 680 Washington Blvd., Suite 500 Stamford, CT 06901 800.548.4539 SUBADVISER TimesSquare Capital Management, LLC 75 Rockefeller Plaza 30th Floor New York, NY 10019 CUSTODIAN The Bank of New York Mellon Mutual Funds Custody 240 Greenwich Street New York, NY 10286 | | LEGAL COUNSEL Ropes & Gray LLP Prudential Tower, 800 Boylston Street Boston, MA 02199-3600 TRANSFER AGENT BNY Mellon Investment Servicing (US) Inc. AMG Funds Attn: 534426 AIM 154-0520 500 Ross Street Pittsburgh, PA 15262 800.548.4539 TRUSTEES Jill R. Cuniff Kurt A. Keilhacker Peter W. MacEwen Steven J. Paggioli Eric Rakowski Victoria L. Sassine Garret W. Weston | | This report is prepared for the Funds’ shareholders. It is authorized for distribution to prospective investors only when preceded or accompanied by an effective prospectus. To receive a free copy of the prospectus or Statement of Additional Information, which includes additional information about Fund Trustees, please contact us by calling 800.548.4539. Distributed by AMG Distributors, Inc., member FINRA/SIPC. Current net asset values per share for each Fund are available on the Funds’ website at wealth.amg.com. A description of the policies and procedures each Fund uses to vote its proxies is available: (i) without charge, upon request, by calling 800.548.4539, or (ii) on the Securities and Exchange Commission’s (SEC) website at sec.gov. For information regarding the Funds’ proxy voting record for the 12-month period ended June 30, call 800.548.4539 or visit the SEC website at sec.gov. The Funds file their complete schedule of portfolio holdings with the SEC for the first and third quarters of each fiscal year as an exhibit to their reports on Form N-PORT. The Funds’ portfolio holdings on Form N-PORT are available on the SEC’s website at sec.gov and the Funds’ website at wealth.amg.com. To review a complete list of the Funds’ portfolio holdings, or to view the most recent semi-annual report or annual report, please visit wealth.amg.com. |
| | |
| | |
| | | | | | |
EQUITY FUNDS AMG Boston Common Global Impact Boston Common Asset Management, LLC AMG Frontier Small Cap Growth Frontier Capital Management Co., LLC AMG GW&K Small Cap Core AMG GW&K Small Cap Value AMG GW&K Small/Mid Cap Core AMG GW&K Small/Mid Cap Growth AMG GW&K International Small Cap GW&K Investment Management, LLC AMG Montrusco Bolton Large Cap Growth Montrusco Bolton Investments, Inc. AMG Renaissance Large Cap Growth The Renaissance Group LLC | | | | AMG River Road Dividend All Cap Value AMG River Road Focused Absolute Value AMG River Road Large Cap Value Select AMG River Road Mid Cap Value AMG River Road Small-Mid Cap Value AMG River Road Small Cap Value River Road Asset Management, LLC AMG TimesSquare Emerging Markets Small Cap AMG TimesSquare Global Small Cap AMG TimesSquare International Small Cap AMG TimesSquare Mid Cap Growth AMG TimesSquare Small Cap Growth TimesSquare Capital Management, LLC AMG Veritas Asia Pacific AMG Veritas China AMG Veritas Global Focus AMG Veritas Global Real Return Veritas Asset Management LLP AMG Yacktman AMG Yacktman Focused AMG Yacktman Global AMG Yacktman Special Opportunities Yacktman Asset Management LP | | FIXED INCOME FUNDS AMG Beutel Goodman Core Plus Bond Beutel, Goodman & Company Ltd. AMG GW&K Core Bond ESG AMG GW&K ESG Bond AMG GW&K Municipal Bond AMG GW&K Municipal Enhanced Yield GW&K Investment Management, LLC ALTERNATIVE FUNDS AMG Systematica Managed Futures Strategy Systematica Investments Limited, acting as general partner of Systematica Investments LP |
| | | | | | |
| | | | | | | |
| | | |
| wealth.amg.com | | 063024 | | | SAR012 | |
| | |
| | SEMI-ANNUAL REPORT |
| | | | | | |
| | | AMG Funds |
| | | | |
| | | June 30, 2024 | | | | |
| | |
| | |  |
| | |
| | | AMG Yacktman Fund |
| | | | |
| | | Class I: YACKX | | | | |
| | |
| | | AMG Yacktman Focused Fund |
| | | | |
| | | Class N: YAFFX | | Class I: YAFIX | | |
| | |
| | | AMG Yacktman Global Fund |
| | | | |
| | | Class N: YFSSNX | | Class I: YFSIX | | |
| | |
| | | AMG Yacktman Special Opportunities Fund |
| | | | |
| | | Class I: YASSX | | Class Z: YASLX | | |
| | | | | | | |
| | | | | | | |
| | | | | | | |
| | | | | | | |
| | | | | | |
| | | | | | | |
| | | |
| wealth.amg.com | | 063024 | | | SAR071 | |
| | |
| | AMG Funds Semi-Annual Report — June 30, 2024 (unaudited) |
Nothing contained herein is to be considered an offer, sale or solicitation of an offer to buy shares of any series of the AMG Funds Family of Funds. Such offering is made only by prospectus, which includes details as to offering price and other material information.
| | |
| | AMG Yacktman Fund Schedule of Portfolio Investments (unaudited) June 30, 2024 |
| | | | | | | | |
| | | Shares | | | Value | |
| |
Common Stocks - 83.9% | | | | | |
| |
Communication Services - 17.7% | | | | | |
| | |
Alphabet, Inc., Class C | | | 1,880,000 | | | | $344,829,600 | |
| | |
Bolloré SE (France) | | | 95,900,000 | | | | 563,021,644 | |
| | |
Comcast Corp., Class A | | | 1,100,000 | | | | 43,076,000 | |
| | |
Fox Corp., Class A1 | | | 2,400,000 | | | | 82,488,000 | |
| | |
Fox Corp., Class B | | | 3,100,000 | | | | 99,262,000 | |
| | |
News Corp., Class A | | | 8,000,000 | | | | 220,560,000 | |
| | |
The Walt Disney Co. | | | 900,000 | | | | 89,361,000 | |
| | |
Warner Bros Discovery, Inc.* | | | 4,400,000 | | | | 32,736,000 | |
| | |
Total Communication Services | | | | | | | 1,475,334,244 | |
| |
Consumer Discretionary - 3.5% | | | | | |
| | |
Booking Holdings, Inc. | | | 31,000 | | | | 122,806,500 | |
| | |
eBay, Inc. | | | 1,250,000 | | | | 67,150,000 | |
| | |
Hyundai Mobis Co., Ltd. (South Korea) | | | 550,000 | | | | 99,920,192 | |
| | |
Total Consumer Discretionary | | | | | | | 289,876,692 | |
| |
Consumer Staples - 16.1% | | | | | |
| | |
Associated British Foods PLC (United Kingdom) | | | 4,500,000 | | | | 140,507,388 | |
| | |
The Coca-Cola Co. | | | 1,385,000 | | | | 88,155,250 | |
| | |
Colgate-Palmolive Co. | | | 1,000,000 | | | | 97,040,000 | |
| | |
Darling Ingredients, Inc.* | | | 1,005,000 | | | | 36,933,750 | |
| | |
Ingredion, Inc. | | | 1,150,000 | | | | 131,905,000 | |
| | |
Kellanova | | | 1,200,000 | | | | 69,216,000 | |
| | |
Kenvue, Inc. | | | 5,000,000 | | | | 90,900,000 | |
| | |
KT&G Corp. (South Korea) | | | 1,452,810 | | | | 92,830,044 | |
| | |
PepsiCo, Inc. | | | 1,400,000 | | | | 230,902,000 | |
| | |
The Procter & Gamble Co. | | | 1,300,000 | | | | 214,396,000 | |
| | |
Sysco Corp. | | | 920,000 | | | | 65,678,800 | |
| | |
Tyson Foods, Inc., Class A | | | 1,460,000 | | | | 83,424,400 | |
| | |
Total Consumer Staples | | | | | | | 1,341,888,632 | |
| |
Energy - 12.5% | | | | | |
| | |
Canadian Natural Resources, Ltd. (Canada) | | | 16,400,000 | | | | 583,840,000 | |
| | |
ConocoPhillips | | | 890,000 | | | | 101,798,200 | |
| | |
Devon Energy Corp. | | | 1,610,000 | | | | 76,314,000 | |
| | |
Diamondback Energy, Inc. | | | 800,000 | | | | 160,152,000 | |
| | |
EOG Resources, Inc. | | | 955,000 | | | | 120,205,850 | |
| | |
Total Energy | | | | | | | 1,042,310,050 | |
| |
Financials - 9.7% | | | | | |
| | |
The Bank of New York Mellon Corp. | | | 2,100,000 | | | | 125,769,000 | |
| | |
Berkshire Hathaway, Inc., Class B* | | | 340,000 | | | | 138,312,000 | |
| | |
The Charles Schwab Corp. | | | 3,200,000 | | | | 235,808,000 | |
| | |
The Goldman Sachs Group, Inc. | | | 100,000 | | | | 45,232,000 | |
| | |
State Street Corp. | | | 1,800,000 | | | | 133,200,000 | |
| | | | | | | | |
| | | Shares | | | Value | |
| | |
Wells Fargo & Co. | | | 2,100,000 | | | | $124,719,000 | |
| | |
Total Financials | | | | | | | 803,040,000 | |
| |
Health Care - 3.5% | | | | | |
| | |
Elevance Health, Inc. | | | 290,000 | | | | 157,139,400 | |
| | |
Embecta Corp. | | | 1,600,000 | | | | 20,000,000 | |
| | |
Johnson & Johnson | | | 767,682 | | | | 112,204,401 | |
| | |
Total Health Care | | | | | | | 289,343,801 | |
| |
Industrials - 9.1% | | | | | |
| | |
Armstrong World Industries, Inc. | | | 735,000 | | | | 83,231,400 | |
| | |
Brenntag SE (Germany) | | | 1,850,000 | | | | 124,800,919 | |
| | |
GrafTech International, Ltd.* | | | 8,000,000 | | | | 7,760,000 | |
| | |
L3Harris Technologies, Inc. | | | 355,000 | | | | 79,725,900 | |
| | |
Lockheed Martin Corp. | | | 195,000 | | | | 91,084,500 | |
| | |
Northrop Grumman Corp. | | | 225,000 | | | | 98,088,750 | |
| | |
Samsung C&T Corp. (South Korea) | | | 700,000 | | | | 71,837,597 | |
| | |
U-Haul Holding Co.*,1 | | | 330,000 | | | | 20,370,900 | |
| | |
U-Haul Holding Co., Non-Voting Shares | | | 2,950,000 | | | | 177,059,000 | |
| | |
Total Industrials | | | | | | | 753,958,966 | |
| |
Information Technology - 8.2% | | | | | |
| | |
Cisco Systems, Inc. | | | 700,000 | | | | 33,257,000 | |
| | |
Cognizant Technology Solutions Corp., Class A | | | 2,600,000 | | | | 176,800,000 | |
| | |
Corning, Inc. | | | 1,100,000 | | | | 42,735,000 | |
| | |
Microsoft Corp. | | | 800,000 | | | | 357,560,000 | |
| | |
Oracle Corp. | | | 400,000 | | | | 56,480,000 | |
| | |
Samsung Electronics Co., Ltd. (South Korea) | | | 200,000 | | | | 11,770,764 | |
| | |
Total Information Technology | | | | | | | 678,602,764 | |
| |
Materials - 3.1% | | | | | |
| | |
Olin Corp. | | | 2,205,000 | | | | 103,965,750 | |
| | |
Reliance, Inc. | | | 530,000 | | | | 151,368,000 | |
| | |
Total Materials | | | | | | | 255,333,750 | |
| |
Utilities - 0.5% | | | | | |
| | |
Talen Energy Corp.* | | | 400,000 | | | | 44,408,000 | |
| | |
Total Common Stocks | | | | | | | | |
(Cost $4,250,826,946) | | | | | | | 6,974,096,899 | |
| | |
Preferred Stocks - 7.6% | | | | | | | | |
| |
Consumer Discretionary - 1.5% | | | | | |
| | |
Hyundai Motor Co., 7.960% (South Korea) | | | 400,000 | | | | 53,043,705 | |
| | |
Hyundai Motor Co., 8.200% (South Korea) | | | 523,882 | | | | 68,931,404 | |
| | |
Total Consumer Discretionary | | | | | | | 121,975,109 | |
| |
Information Technology - 6.1% | | | | | |
| | |
Samsung Electronics Co., Ltd., 1.560% (South Korea) | | | 11,050,000 | | | | 507,380,305 | |
| | |
Total Preferred Stocks | | | | | | | | |
(Cost $304,566,646) | | | | | | | 629,355,414 | |
The accompanying notes are an integral part of these financial statements.
2
| | |
| | AMG Yacktman Fund Schedule of Portfolio Investments (continued) |
| | | | | | | | |
| | | Principal
Amount | | | Value | |
| |
Short-Term Investments - 8.6% | | | | | |
| |
Joint Repurchase Agreements - 0.3%2 | | | | | |
| | |
Bethesda Securities LLC, dated 06/28/24, due 07/01/24, 5.450% total to be received $5,367,026 (collateralized by various U.S. Government Agency Obligations, 2.500% - 6.070%, 10/01/27 - 01/01/57, totaling $5,471,882) | | | $5,364,590 | | | | $5,364,590 | |
| | |
CF Secured, LLC, dated 06/28/24, due 07/01/24, 5.430% total to be received $544,186 (collateralized by various U.S. Government Agency Obligations and U.S. Treasuries, 0.000% - 8.500%, 04/30/27 - 04/20/72, totaling $554,819) | | | 543,940 | | | | 543,940 | |
| | |
Santander U.S. Capital Markets LLC, dated 06/28/24, due 07/01/24, 5.390% total to be received $550,883 (collateralized by various U.S. Government Agency Obligations, 0.010% - 6.833%, 09/25/28 - 03/20/71, totaling $561,649) | | | 550,636 | | | | 550,636 | |
| | |
State of Wisconsin Investment Board, dated 06/28/24, due 07/01/24, 5.450% total to be received $15,006,813 (collateralized by various U.S. Treasuries, 0.125% - 3.625%, 10/15/25 - 02/15/53, totaling $15,270,746) | | | 15,000,000 | | | | 15,000,000 | |
| | |
Total Joint Repurchase Agreements | | | | | | | 21,459,166 | |
| | | | | | | | |
| | | Principal
Amount | | | Value | |
| |
U.S. Government Obligations - 3.9% | | | | | |
| | |
U.S. Treasury Bills, 5.148%, 01/23/253 | | | $84,000,000 | | | | $81,642,330 | |
| | |
U.S. Treasury Bills, 5.160%, 06/12/253 | | | 83,000,000 | | | | 79,123,070 | |
| | |
U.S. Treasury Bills, 5.226%, 03/20/253 | | | 85,000,000 | | | | 81,936,457 | |
| | |
U.S. Treasury Bills, 5.366%, 10/03/243 | | | 80,000,000 | | | | 78,919,000 | |
| |
Total U.S. Government Obligations | | | | 321,620,857 | |
| |
Repurchase Agreements - 2.2% | | | | | |
| | |
Fixed Income Clearing Corp., dated 06/28/24, due 07/01/24, 5.150% total to be received $186,650,070 (collateralized by a U.S. Treasury Note, 0.125%, 04/15/25, totaling $190,301,516) | | | 186,570,000 | | | | 186,570,000 | |
| | |
| | | Shares | | | | |
| |
Other Investment Companies - 2.2% | | | | | |
| | |
JPMorgan U.S. Government Money Market Fund, IM Shares, 5.25%4 | | | 184,992,298 | | | | 184,992,298 | |
| | |
Total Short-Term Investments | | | | | | | | |
(Cost $715,021,767) | | | | | | | 714,642,321 | |
| |
Total Investments - 100.1% | | | | | |
(Cost $5,270,415,359) | | | | | | | 8,318,094,634 | |
| |
Other Assets, less Liabilities - (0.1)% | | | | (10,578,372 | ) |
| | |
Net Assets - 100.0% | | | | | | | $8,307,516,262 | |
| * | Non-income producing security. |
| 1 | Some of these securities, amounting to $21,411,643 or 0.3% of net assets, were out on loan to various borrowers and are collateralized by cash and various U.S. Treasury Obligations. See Note 4 of Notes to Financial Statements. |
| 2 | Cash collateral received for securities lending activity was invested in these joint repurchase agreements. |
| 3 | Represents yield to maturity at June 30, 2024. |
| 4 | Yield shown represents the June 30, 2024, seven day average yield, which refers to the sum of the previous seven days’ dividends paid, expressed as an annual percentage. |
The accompanying notes are an integral part of these financial statements.
3
| | |
| | AMG Yacktman Fund Schedule of Portfolio Investments (continued) |
The following table summarizes the inputs used to value the Fund’s investments by the fair value hierarchy levels as of June 30, 2024:
| | | | | | | | | | | | | | | | | | | | |
| | | Level 1 | | Level 21 | | Level 3 | | Total |
| | | | |
Investments in Securities | | | | | | | | | | | | | | | | | | | | |
| | | | |
Common Stocks | | | | | | | | | | | | | | | | | | | | |
| | | | |
Communication Services | | | | $912,312,600 | | | | | $563,021,644 | | | | | — | | | | | $1,475,334,244 | |
| | | | |
Consumer Staples | | | | 1,108,551,200 | | | | | 233,337,432 | | | | | — | | | | | 1,341,888,632 | |
| | | | |
Energy | | | | 1,042,310,050 | | | | | — | | | | | — | | | | | 1,042,310,050 | |
| | | | |
Financials | | | | 803,040,000 | | | | | — | | | | | — | | | | | 803,040,000 | |
| | | | |
Industrials | | | | 557,320,450 | | | | | 196,638,516 | | | | | — | | | | | 753,958,966 | |
| | | | |
Information Technology | | | | 666,832,000 | | | | | 11,770,764 | | | | | — | | | | | 678,602,764 | |
| | | | |
Consumer Discretionary | | | | 189,956,500 | | | | | 99,920,192 | | | | | — | | | | | 289,876,692 | |
| | | | |
Health Care | | | | 289,343,801 | | | | | — | | | | | — | | | | | 289,343,801 | |
| | | | |
Materials | | | | 255,333,750 | | | | | — | | | | | — | | | | | 255,333,750 | |
| | | | |
Utilities | | | | 44,408,000 | | | | | — | | | | | — | | | | | 44,408,000 | |
| | | | |
Preferred Stocks† | | | | — | | | | | 629,355,414 | | | | | — | | | | | 629,355,414 | |
| | | | |
Short-Term Investments | | | | | | | | | | | | | | | | | | | | |
| | | | |
Joint Repurchase Agreements | | | | — | | | | | 21,459,166 | | | | | — | | | | | 21,459,166 | |
| | | | |
U.S. Government Obligations | | | | — | | | | | 321,620,857 | | | | | — | | | | | 321,620,857 | |
| | | | |
Repurchase Agreements | | | | — | | | | | 186,570,000 | | | | | — | | | | | 186,570,000 | |
| | | | |
Other Investment Companies | | | | 184,992,298 | | | | | — | | | | | — | | | | | 184,992,298 | |
| | | | | | | | | | | | | | | | | | | | |
| | | | |
Total Investments in Securities | | | | $6,054,400,649 | | | | | $2,263,693,985 | | | | | — | | | | | $8,318,094,634 | |
| | | | | | | | | | | | | | | | | | | | |
| | † | All preferred stocks held in the Fund are Level 2 securities. For a detailed breakout of preferred stocks by major industry classification, please refer to Schedule of Portfolio Investments. |
| | 1 | An external pricing service is used to reflect any impact on security value due to market movements between the time the Fund valued such foreign securities and the earlier closing of foreign markets. |
For the six months ended June 30, 2024, there were no transfers in or out of Level 3.
The accompanying notes are an integral part of these financial statements.
4
| | |
| | AMG Yacktman Focused Fund Schedule of Portfolio Investments (unaudited) June 30, 2024 |
| | | | | | | | |
| | | Shares | | | Value | |
| | |
Common Stocks - 77.0% | | | | | | | | |
| |
Communication Services - 19.3% | | | | | |
| | |
Alphabet, Inc., Class C | | | 840,000 | | | | $154,072,800 | |
| | |
Bolloré SE (France) | | | 50,000,000 | | | | 293,546,217 | |
| | |
Fox Corp., Class B | | | 3,000,000 | | | | 96,060,000 | |
| | |
News Corp., Class A | | | 3,300,000 | | | | 90,981,000 | |
| | |
News Corp., Class B1 | | | 200,000 | | | | 5,678,000 | |
| | |
The Walt Disney Co. | | | 300,000 | | | | 29,787,000 | |
| | |
Warner Bros Discovery, Inc.* | | | 1,900,000 | | | | 14,136,000 | |
| | |
Total Communication Services | | | | | | | 684,261,017 | |
| |
Consumer Discretionary - 3.2% | | | | | |
| | |
eBay, Inc. | | | 950,000 | | | | 51,034,000 | |
| | |
Hyundai Home Shopping Network | | | | | | | | |
| | |
Corp. (South Korea) | | | 439,418 | | | | 16,309,702 | |
| | |
Hyundai Mobis Co., Ltd. (South Korea) | | | 260,000 | | | | 47,235,000 | |
| | |
Total Consumer Discretionary | | | | | | | 114,578,702 | |
| |
Consumer Staples - 13.0% | | | | | |
| | |
Associated British Foods PLC (United Kingdom) | | | 600,000 | | | | 18,734,319 | |
| | |
The Coca-Cola Co. | | | 470,000 | | | | 29,915,500 | |
| | |
Ingredion, Inc. | | | 510,000 | | | | 58,497,000 | |
| | |
Kellanova | | | 300,000 | | | | 17,304,000 | |
| | |
Kenvue, Inc. | | | 1,000,000 | | | | 18,180,000 | |
| | |
KT&G Corp. (South Korea) | | | 1,600,000 | | | | 102,235,027 | |
| | |
PepsiCo, Inc. | | | 540,000 | | | | 89,062,200 | |
| | |
The Procter & Gamble Co. | | | 540,000 | | | | 89,056,800 | |
| | |
Tyson Foods, Inc., Class A | | | 700,000 | | | | 39,998,000 | |
| | |
Total Consumer Staples | | | | | | | 462,982,846 | |
| |
Energy - 13.3% | | | | | |
| | |
Canadian Natural Resources, Ltd. (Canada) | | | 8,100,000 | | | | 288,360,000 | |
| | |
ConocoPhillips | | | 400,000 | | | | 45,752,000 | |
| | |
Devon Energy Corp. | | | 720,000 | | | | 34,128,000 | |
| | |
Diamondback Energy, Inc. | | | 290,000 | | | | 58,055,100 | |
| | |
EOG Resources, Inc. | | | 371,000 | | | | 46,697,770 | |
| | |
Total Energy | | | | | | | 472,992,870 | |
| |
Financials - 6.2% | | | | | |
| | |
The Bank of New York Mellon Corp. | | | 600,000 | | | | 35,934,000 | |
| | |
Berkshire Hathaway, Inc., Class B* | | | 100,000 | | | | 40,680,000 | |
| | |
The Charles Schwab Corp. | | | 1,225,000 | | | | 90,270,250 | |
| | |
State Street Corp. | | | 700,000 | | | | 51,800,000 | |
| | |
Total Financials | | | | | | | 218,684,250 | |
| |
Health Care - 1.3% | | | | | |
| | |
Johnson & Johnson | | | 322,427 | | | | 47,125,930 | |
| | |
| | | | | | | | |
| | | | | | | | |
| | | Shares | | | Value | |
| |
Industrials - 9.9% | | | | | |
| | |
Brenntag SE (Germany) | | | 600,000 | | | | $40,475,974 | |
| | |
L3Harris Technologies, Inc. | | | 170,000 | | | | 38,178,600 | |
| | |
Lockheed Martin Corp. | | | 95,000 | | | | 44,374,500 | |
| | |
Northrop Grumman Corp. | | | 90,000 | | | | 39,235,500 | |
| | |
Samsung C&T Corp. (South Korea) | | | 460,000 | | | | 47,207,564 | |
| | |
U-Haul Holding Co.* | | | 59,000 | | | | 3,642,070 | |
| | |
U-Haul Holding Co., Non-Voting Shares | | | 1,850,000 | | | | 111,037,000 | |
| | |
Yuasa Trading Co., Ltd. (Japan) | | | 800,000 | | | | 28,292,500 | |
| | |
Total Industrials | | | | | | | 352,443,708 | |
| |
Information Technology - 7.2% | | | | | |
| | |
Cognizant Technology Solutions Corp., Class A | | | 1,150,000 | | | | 78,200,000 | |
| | |
Microsoft Corp. | | | 350,000 | | | | 156,432,500 | |
| | |
Oracle Corp. | | | 150,000 | | | | 21,180,000 | |
| | |
Total Information Technology | | | | | | | 255,812,500 | |
| |
Materials - 3.6% | | | | | |
| | |
Nihon Parkerizing Co., Ltd. (Japan) | | | 1,868,100 | | | | 15,217,799 | |
| | |
Olin Corp. | | | 995,000 | | | | 46,914,250 | |
| | |
Reliance, Inc. | | | 230,000 | | | | 65,688,000 | |
| |
Total Materials | | | | 127,820,049 | |
| | |
Total Common Stocks
(Cost $1,799,293,140) | | | | | | | 2,736,701,872 | |
| | |
| | | Principal
Amount | | | | |
| |
Corporate Bonds and Notes - 0.7% | | | | | |
| |
Industrials - 0.7% | | | | | |
| | |
GrafTech Finance, Inc. 4.625%, 12/15/281,2 | | | $17,800,000 | | | | 11,283,235 | |
| | |
GrafTech Global Enterprises, Inc. 9.875%, 12/15/281,2 | | | 15,200,000 | | | | 11,203,390 | |
| |
Total Industrials | | | | 22,486,625 | |
| |
Total Corporate Bonds and Notes
(Cost $24,712,373) | | | | 22,486,625 | |
| | |
| | | Shares | | | | |
| | |
Preferred Stocks - 15.3% | | | | | | | | |
| |
Consumer Discretionary - 4.1% | | | | | |
| | |
Hyundai Motor Co., 7.960% (South Korea) | | | 438,620 | | | | 58,165,075 | |
| | |
Hyundai Motor Co., 8.200% (South Korea) | | | 661,380 | | | | 87,023,131 | |
| | |
Total Consumer Discretionary | | | | | | | 145,188,206 | |
| |
Consumer Staples - 0.6% | | | | | |
| | |
Amorepacific Corp., 2.050% (South Korea) | | | 250,000 | | | | 8,517,980 | |
| | |
LG Household & Health Care Co., Ltd., 2.320% (South Korea) | | | 118,000 | | | | 13,057,772 | |
| | |
Total Consumer Staples | | | | | | | 21,575,752 | |
| | |
| | | | | | | | |
The accompanying notes are an integral part of these financial statements.
5
| | |
| | AMG Yacktman Focused Fund Schedule of Portfolio Investments (continued) |
| | | | | | | | |
| | |
Shares | | | Value | |
| |
Information Technology - 10.6% | | | | | |
| | |
Samsung Electronics Co., Ltd., 1.560% (South Korea) | | | 8,200,000 | | | | $376,517,511 | |
| | |
Total Preferred Stocks
(Cost $319,184,914) | | | | | | | 543,281,469 | |
| | |
| | | Principal
Amount | | | | |
| | |
Short-Term Investments - 7.7% | | | | | | | | |
| |
Joint Repurchase Agreements - 0.6%3 | | | | | |
| | |
Bethesda Securities LLC, dated 06/28/24, due 07/01/24, 5.450% total to be received $5,378,680 (collateralized by various U.S. Government Agency Obligations, 2.500% - 6.070%, 10/01/27 - 01/01/57, totaling $5,483,763) | | | $5,376,238 | | | | 5,376,238 | |
| | |
CF Secured, LLC, dated 06/28/24, due 07/01/24, 5.430% total to be received $4,804,583 (collateralized by various U.S. Government Agency Obligations and U.S. Treasuries, 0.000% - 8.500%, 04/30/27 - 04/20/72, totaling $4,898,459) | | | 4,802,410 | | | | 4,802,410 | |
| | |
Santander U.S. Capital Markets LLC, dated 06/28/24, due 07/01/24, 5.390% total to be received $552,462 (collateralized by various U.S. Government Agency Obligations, 0.010% - 6.833%, 09/25/28 - 03/20/71, totaling $563,258) | | | 552,214 | | | | 552,214 | |
| | |
State of Wisconsin Investment Board, dated 06/28/24, due 07/01/24, 5.450% total to be received $10,779,799 (collateralized by various U.S. Treasuries, 0.125% - 3.625%, 10/15/25 - 02/15/53, totaling $10,969,389) | | | 10,774,905 | | | | 10,774,905 | |
| | |
Total Joint Repurchase Agreements | | | | | | | 21,505,767 | |
| | |
| | | | | | | | |
| | | | | | | | |
| | | Principal
Amount | | | Value | |
| |
U.S. Government Obligations - 3.9% | | | | | |
| | |
U.S. Treasury Bills, 5.148%, 01/23/254 | | | $36,000,000 | | | | $34,989,570 | |
| | |
U.S. Treasury Bills, 5.160%, 06/12/254 | | | 36,000,000 | | | | 34,318,440 | |
| | |
U.S. Treasury Bills, 5.226%, 03/20/254 | | | 37,000,000 | | | | 35,666,458 | |
| | |
U.S. Treasury Bills, 5.366%, 10/03/244 | | | 35,000,000 | | | | 34,527,062 | |
| | |
Total U.S. Government Obligations | | | | | | | 139,501,530 | |
| |
Repurchase Agreements - 1.5% | | | | | |
| | |
Fixed Income Clearing Corp., dated 06/28/24, due 07/01/24, 5.150% total to be received $54,242,269 (collateralized by a U.S. Treasury Note, 0.125%, 04/15/25, totaling $55,303,481) | | | 54,219,000 | | | | 54,219,000 | |
| | |
| | | Shares | | | | |
| |
Other Investment Companies - 1.7% | | | | | |
| | |
JPMorgan U.S. Government Money Market Fund, IM Shares, 5.25%5 | | | 59,443,368 | | | | 59,443,368 | |
| |
Total Short-Term Investments
(Cost $274,833,493) | | | | 274,669,665 | |
| |
Total Investments - 100.7%
(Cost $2,418,023,920) | | | | 3,577,139,631 | |
| |
Other Assets, less Liabilities - (0.7)% | | | | (24,186,678 | ) |
| |
Net Assets - 100.0% | | | | $3,552,952,953 | |
| |
| | | | | |
| * | Non-income producing security. |
| 1 | Some of these securities, amounting to $25,163,461 or 0.7% of net assets, were out on loan to various borrowers and are collateralized by cash and various U.S. Treasury Obligations. See Note 4 of Notes to Financial Statements. |
| 2 | Security exempt from registration under Rule 144A of the Securities Act of 1933. These securities may be resold in transactions exempt from registration, normally to qualified institutional buyers. At June 30, 2024, the value of these securities amounted to $22,486,625 or 0.6% of net assets. |
| 3 | Cash collateral received for securities lending activity was invested in these joint repurchase agreements. |
| 4 | Represents yield to maturity at June 30, 2024. |
| 5 | Yield shown represents the June 30, 2024, seven day average yield, which refers to the sum of the previous seven days’ dividends paid, expressed as an annual percentage. |
The accompanying notes are an integral part of these financial statements.
6
| | |
| | AMG Yacktman Focused Fund Schedule of Portfolio Investments (continued) |
The following table summarizes the inputs used to value the Fund’s investments by the fair value hierarchy levels as of June 30, 2024:
| | | | | | | | | | | | | | | | | | | | |
| | | Level 1 | | Level 21 | | Level 3 | | Total |
| | | | |
Investments in Securities | | | | | | | | | | | | | | | | | | | | |
Common Stocks | | | | | | | | | | | | | | | | | | | | |
| | | | |
Communication Services | | | | $390,714,800 | | | | | $293,546,217 | | | | | — | | | | | $684,261,017 | |
| | | | |
Energy | | | | 472,992,870 | | | | | — | | | | | — | | | | | 472,992,870 | |
| | | | |
Consumer Staples | | | | 342,013,500 | | | | | 120,969,346 | | | | | — | | | | | 462,982,846 | |
| | | | |
Industrials | | | | 236,467,670 | | | | | 115,976,038 | | | | | — | | | | | 352,443,708 | |
| | | | |
Information Technology | | | | 255,812,500 | | | | | — | | | | | — | | | | | 255,812,500 | |
| | | | |
Financials | | | | 218,684,250 | | | | | — | | | | | — | | | | | 218,684,250 | |
| | | | |
Materials | | | | 112,602,250 | | | | | 15,217,799 | | | | | — | | | | | 127,820,049 | |
| | | | |
Consumer Discretionary | | | | 51,034,000 | | | | | 63,544,702 | | | | | — | | | | | 114,578,702 | |
| | | | |
Health Care | | | | 47,125,930 | | | | | — | | | | | — | | | | | 47,125,930 | |
| | | | |
Corporate Bonds and Notes† | | | | — | | | | | 22,486,625 | | | | | — | | | | | 22,486,625 | |
| | | | |
Preferred Stocks | | | | | | | | | | | | | | | | | | | | |
| | | | |
Information Technology | | | | — | | | | | 376,517,511 | | | | | — | | | | | 376,517,511 | |
| | | | |
Consumer Discretionary | | | | — | | | | | 145,188,206 | | | | | — | | | | | 145,188,206 | |
| | | | |
Consumer Staples | | | | 8,517,980 | | | | | 13,057,772 | | | | | — | | | | | 21,575,752 | |
| | | | |
Short-Term Investments | | | | | | | | | | | | | | | | | | | | |
| | | | |
Joint Repurchase Agreements | | | | — | | | | | 21,505,767 | | | | | — | | | | | 21,505,767 | |
| | | | |
U.S. Government Obligations | | | | — | | | | | 139,501,530 | | | | | — | | | | | 139,501,530 | |
| | | | |
Repurchase Agreements | | | | — | | | | | 54,219,000 | | | | | — | | | | | 54,219,000 | |
| | | | |
Other Investment Companies | | | | 59,443,368 | | | | | — | | | | | — | | | | | 59,443,368 | |
| | | | | | | | | | | | | | | | | | | | |
| | | | |
Total Investments in Securities | | | | $2,195,409,118 | | | | | $1,381,730,513 | | | | | — | | | | | $3,577,139,631 | |
| | | | | | | | | | | | | | | | | | | | |
| | † | All corporate bonds and notes held in the Fund are level 2 securities. For a detailed breakout of corporate bonds and notes by major industry classification, please refer to the Fund’s Schedule of Portfolio Investments. |
| | 1 | An external pricing service is used to reflect any impact on security value due to market movements between the time the Fund valued such foreign securities and the earlier closing of foreign markets. |
For the six months ended June 30, 2024, there were no transfers in or out of Level 3.
The accompanying notes are an integral part of these financial statements.
7
| | |
| | AMG Yacktman Global Fund Schedule of Portfolio Investments (unaudited) June 30, 2024 |
| | | | | | | | |
| | | Shares | | | Value | |
| | |
Common Stocks - 79.3% | | | | | | | | |
| | |
Communication Services - 13.2% | | | | | | | | |
| | |
Alphabet, Inc., Class C (United States) | | | 4,700 | | | | $862,074 | |
| | |
Bolloré SE (France) | | | 2,750,000 | | | | 16,145,042 | |
| | |
Fox Corp., Class B (United States) | | | 115,000 | | | | 3,682,300 | |
| | |
News Corp., Class A (United States) | | | 30,000 | | | | 827,100 | |
| | |
Reading International, Inc., Class A (United States)* | | | 320,000 | | | | 454,400 | |
| | |
The Walt Disney Co. (United States) | | | 8,000 | | | | 794,320 | |
| | |
Total Communication Services | | | | | | | 22,765,236 | |
| |
Consumer Discretionary - 10.8% | | | | | |
| | |
Car Mate Manufacturing Co., Ltd. (Japan) | | | 52,500 | | | | 310,973 | |
| | |
Continental AG (Germany) | | | 10,000 | | | | 566,372 | |
| | |
Daewon San Up Co., Ltd. (South Korea) | | | 160,000 | | | | 731,650 | |
| | |
Dong Ah Tire & Rubber Co., Ltd. (South Korea) | | | 200,000 | | | | 1,792,953 | |
| | |
HI-LEX Corp. (Japan) | | | 730,000 | | | | 6,679,325 | |
| | |
Hyundai Home Shopping Network Corp. (South Korea) | | | 93,236 | | | | 3,460,603 | |
| | |
Hyundai Mobis Co., Ltd. (South Korea) | | | 25,000 | | | | 4,541,827 | |
| | |
Rinnai Corp. (Japan) | | | 24,000 | | | | 547,217 | |
| | |
Total Consumer Discretionary | | | | | | | 18,630,920 | |
| |
Consumer Staples - 4.9% | | | | | |
| | |
Associated British Foods PLC (United Kingdom) | | | 28,000 | | | | 874,268 | |
| | |
Kenvue, Inc. (United States) | | | 14,924 | | | | 271,318 | |
| | |
KT&G Corp. (South Korea) | | | 80,000 | | | | 5,111,751 | |
| | |
Naked Wines PLC (United Kingdom)* | | | 745,000 | | | | 612,141 | |
| | |
PepsiCo, Inc. (United States) | | | 5,000 | | | | 824,650 | |
| | |
The Procter & Gamble Co. (United States) | | | 5,000 | | | | 824,600 | |
| | |
Total Consumer Staples | | | | | | | 8,518,728 | |
| |
Energy - 15.9% | | | | | |
| | |
Amplify Energy Corp. (United States)* | | | 115,000 | | | | 779,700 | |
| | |
Canadian Natural Resources, Ltd. (Canada) | | | 350,000 | | | | 12,460,000 | |
| | |
Mi Chang Oil Industrial Co., Ltd. (South Korea) | | | 17,976 | | | | 991,842 | |
| | |
Total Energy Services, Inc. (Canada) | | | 1,050,000 | | | | 7,414,203 | |
| | |
Unit Corp. (United States) | | | 160,000 | | | | 5,840,000 | |
| | |
Total Energy | | | | | | | 27,485,745 | |
| |
Financials - 0.5% | | | | | |
| | |
The Charles Schwab Corp. (United States) | | | 12,000 | | | | 884,280 | |
| |
Health Care - 2.4% | | | | | |
| | |
BML, Inc. (Japan) | | | 120,000 | | | | 2,152,226 | |
| | |
Johnson & Johnson (United States) | | | 5,500 | | | | 803,880 | |
| | |
Kissei Pharmaceutical Co., Ltd. (Japan) | | | 9,400 | | | | 190,584 | |
| | |
Medipal Holdings Corp. (Japan) | | | 70,000 | | | | 1,067,171 | |
| | |
Total Health Care | | | | | | | 4,213,861 | |
| | |
| | | | | | | | |
| | | | | | | | |
| | | Shares | | | Value | |
| |
Industrials - 24.1% | | | | | |
| | |
Ajis Co., Ltd. (Japan) | | | 60,000 | | | | $928,585 | |
| | |
Brenntag SE (Germany) | | | 15,000 | | | | 1,011,899 | |
| | |
CB Industrial Product Holding Bhd (Malaysia) | | | 10,500,000 | | | | 2,759,936 | |
| | |
Cie de L’Odet SE (France) | | | 4,500 | | | | 6,304,878 | |
| | |
KFC, Ltd. (Japan) | | | 31,900 | | | | 297,380 | |
| | |
Komelon Corp. (South Korea) | | | 120,000 | | | | 784,917 | |
| | |
Ocean Wilsons Holdings, Ltd. (Bermuda) | | | 340,000 | | | | 5,544,343 | |
| | |
Parker Corp. (Japan) | | | 172,500 | | | | 994,044 | |
| | |
Sam Yung Trading Co., Ltd. (South Korea) | | | 180,000 | | | | 1,703,887 | |
| | |
Samsung C&T Corp. (South Korea) | | | 86,000 | | | | 8,825,762 | |
| | |
Sekisui Jushi Corp. (Japan) | | | 140,000 | | | | 1,986,539 | |
| | |
Shinwa Co., Ltd./Nagoya (Japan) | | | 100,000 | | | | 1,833,530 | |
| | |
U-Haul Holding Co. (United States)* | | | 6,000 | | | | 370,380 | |
| | |
U-Haul Holding Co., Non-Voting Shares (United States) | | | 60,000 | | | | 3,601,200 | |
| | |
Yuasa Trading Co., Ltd. (Japan) | | | 130,000 | | | | 4,597,531 | |
| | |
Total Industrials | | | | | | | 41,544,811 | |
| |
Information Technology - 4.0% | | | | | |
| | |
CAC Holdings Corp. (Japan) | | | 240,000 | | | | 2,800,432 | |
| | |
Cognizant Technology Solutions Corp., Class A | | | | | | | | |
| | |
(United States) | | | 10,000 | | | | 680,000 | |
| | |
Hochiki Corp. (Japan) | | | 160,000 | | | | 2,235,445 | |
| | |
INFOvine Co., Ltd. (South Korea) | | | 20,000 | | | | 302,942 | |
| | |
Microsoft Corp. (United States) | | | 1,800 | | | | 804,510 | |
| | |
Total Information Technology | | | | | | | 6,823,329 | |
| |
Materials - 3.5% | | | | | |
| | |
KISCO Holdings Co., Ltd. (South Korea) | | | 70,000 | | | | 998,845 | |
| | |
Kohsoku Corp. (Japan) | | | 90,000 | | | | 1,385,024 | |
| | |
Nihon Parkerizing Co., Ltd. (Japan) | | | 250,000 | | | | 2,036,534 | |
| | |
The Pack Corp. (Japan) | | | 70,000 | | | | 1,656,645 | |
| | |
Total Materials | | | | | | | 6,077,048 | |
| | |
Total Common Stocks
(Cost $115,643,577) | | | | | | | 136,943,958 | |
| | |
Preferred Stocks - 17.0% | | | | | | | | |
| |
Consumer Discretionary - 4.6% | | | | | |
| | |
Hyundai Motor Co., 8.200% (South Korea) | | | 60,000 | | | | 7,894,687 | |
| |
Consumer Staples - 3.5% | | | | | |
| | |
Amorepacific Corp., 2.050% (South Korea) | | | 25,000 | | | | 851,798 | |
| | |
LG Household & Health Care Co., Ltd., 2.320% (South Korea) | | | 47,000 | | | | 5,200,977 | |
| | |
Total Consumer Staples | | | | | | | 6,052,775 | |
| |
Industrials - 0.4% | | | | | |
| | |
Sebang Co., Ltd., 3.970% (South Korea) | | | 106,126 | | | | 597,513 | |
The accompanying notes are an integral part of these financial statements.
8
| | |
| | AMG Yacktman Global Fund Schedule of Portfolio Investments (continued) |
| | | | | | | | |
| | | Shares | | | Value | |
Information Technology - 8.5% | | | | | | | | |
| | |
Samsung Electronics Co., Ltd., 1.560% (South Korea) | | | 320,000 | | | | $14,693,366 | |
| | |
Total Preferred Stocks
(Cost $26,994,734) | | | | | | | 29,238,341 | |
| | |
Short-Term Investments - 3.4% | | | | | | | | |
| |
Other Investment Companies - 3.4% | | | | | |
| | |
Dreyfus Institutional Preferred Government Money Market Fund, Institutional Shares, 5.27%1 | | | 5,960,247 | | | | 5,960,247 | |
| | |
Total Short-Term Investments
(Cost $5,960,247) | | | | | | | 5,960,247 | |
| | |
| | | | | | | | |
| | | | | | | | |
| | | | | | Value | |
| | |
Total Investments - 99.7%
(Cost $148,598,558) | | | | | | | $172,142,546 | |
| |
Other Assets, less Liabilities - 0.3% | | | | 476,882 | |
| |
Net Assets - 100.0% | | | | $172,619,428 | |
| |
| | | | | |
| * | Non-income producing security. |
| 1 | Yield shown represents the June 30, 2024, seven day average yield, which refers to the sum of the previous seven days’ dividends paid, expressed as an annual percentage. |
The following table summarizes the inputs used to value the Fund’s investments by the fair value hierarchy levels as of June 30, 2024:
| | | | | | | | | | | | | | | | | | | | |
| | | Level 1 | | Level 21 | | Level 3 | | Total |
| | | | |
Investments in Securities | | | | | | | | | | | | | | | | | | | | |
| | | | |
Common Stocks | | | | | | | | | | | | | | | | | | | | |
| | | | |
Industrials | | | $ | 14,908,331 | | | | $ | 26,636,480 | | | | | — | | | | $ | 41,544,811 | |
| | | | |
Energy | | | | 26,493,903 | | | | | 991,842 | | | | | — | | | | | 27,485,745 | |
| | | | |
Communication Services | | | | 6,620,194 | | | | | 16,145,042 | | | | | — | | | | | 22,765,236 | |
| | | | |
Consumer Discretionary | | | | 2,103,926 | | | | | 16,526,994 | | | | | — | | | | | 18,630,920 | |
| | | | |
Consumer Staples | | | | 2,532,709 | | | | | 5,986,019 | | | | | — | | | | | 8,518,728 | |
| | | | |
Information Technology | | | | 1,787,452 | | | | | 5,035,877 | | | | | — | | | | | 6,823,329 | |
| | | | |
Materials | | | | — | | | | | 6,077,048 | | | | | — | | | | | 6,077,048 | |
| | | | |
Health Care | | | | 803,880 | | | | | 3,409,981 | | | | | — | | | | | 4,213,861 | |
| | | | |
Financials | | | | 884,280 | | | | | — | | | | | — | | | | | 884,280 | |
| | | | |
Preferred Stocks | | | | | | | | | | | | | | | | | | | | |
| | | | |
Information Technology | | | | — | | | | | 14,693,366 | | | | | — | | | | | 14,693,366 | |
| | | | |
Consumer Discretionary | | | | — | | | | | 7,894,687 | | | | | — | | | | | 7,894,687 | |
| | | | |
Consumer Staples | | | | 851,798 | | | | | 5,200,977 | | | | | — | | | | | 6,052,775 | |
| | | | |
Industrials | | | | 597,513 | | | | | — | | | | | — | | | | | 597,513 | |
| | | | |
Short-Term Investments | | | | | | | | | | | | | | | | | | | | |
| | | | |
Other Investment Companies | | | | 5,960,247 | | | | | — | | | | | — | | | | | 5,960,247 | |
| | | | | | | | | | | | | | | | | | | | |
| | | | |
Total Investments in Securities | | | $ | 63,544,233 | | | | $ | 108,598,313 | | | | | — | | | | $ | 172,142,546 | |
| | | | | | | | | | | | | | | | | | | | |
| | 1 | An external pricing service is used to reflect any impact on security value due to market movements between the time the Fund valued such foreign securities and the earlier closing of foreign markets. |
For the six months ended June 30, 2024, there were no transfers in or out of Level 3.
The accompanying notes are an integral part of these financial statements.
9
| | |
| | AMG Yacktman Special Opportunities Fund Schedule of Portfolio Investments (unaudited) June 30, 2024 |
| | | | | | | | |
| | | Shares | | | Value | |
| | |
Common Stocks - 95.0% | | | | | | | | |
| | |
Communication Services - 0.3% | | | | | | | | |
| | |
Reading International, Inc., Class A (United States)* | | | 120,000 | | | | $170,400 | |
| | |
Consumer Discretionary - 15.6% | | | | | | | | |
| | |
America’s Car-Mart, Inc. (United States)* | | | 29,000 | | | | 1,746,090 | |
| | |
B&S Group, S.A.R.L. (Luxembourg)1 | | | 75,000 | | | | 401,606 | |
| | |
Dong Ah Tire & Rubber Co., Ltd. (South Korea) | | | 48,000 | | | | 430,309 | |
| | |
Italian Design Brands S.P.A. (Italy)* | | | 50,000 | | | | 556,894 | |
| | |
Legacy Housing Corp. (United States)* | | | 130,000 | | | | 2,982,200 | |
| | |
Texhong International Group, Ltd. (Hong Kong)* | | | 4,202,500 | | | | 2,351,749 | |
| | |
Total Consumer Discretionary | | | | | | | 8,468,848 | |
| | |
Consumer Staples - 10.5% | | | | | | | | |
| | |
Delfi, Ltd. (Singapore) | | | 3,000,000 | | | | 1,908,361 | |
| | |
Italian Wine Brands S.P.A (Italy) | | | 102,500 | | | | 2,406,426 | |
| | |
Naked Wines PLC (United Kingdom)* | | | 900,000 | | | | 739,498 | |
| | |
NeoPharm Co., Ltd. (South Korea) | | | 29,000 | | | | 620,488 | |
| | |
Total Consumer Staples | | | | | | | 5,674,773 | |
| | |
Energy - 24.3% | | | | | | | | |
| | |
Amplify Energy Corp. (United States)* | | | 120,000 | | | | 813,600 | |
| | |
Arrow Exploration Corp. (Canada)* | | | 7,500,000 | | | | 2,417,591 | |
| | |
Hargreaves Services PLC (United Kingdom) | | | 215,000 | | | | 1,451,313 | |
| | |
Hemisphere Energy Corp. (Canada) | | | 637,400 | | | | 829,335 | |
| | |
Horizon Oil, Ltd. (Australia) | | | 11,000,000 | | | | 1,320,858 | |
| | |
Mi Chang Oil Industrial Co., Ltd. (South Korea) | | | 6,000 | | | | 331,056 | |
| | |
Noram Drilling A.S. (Norway) | | | 158,000 | | | | 580,088 | |
| | |
Pardee Resources Co., Inc. (United States) | | | 1,200 | | | | 345,600 | |
| | |
Total Energy Services, Inc. (Canada) | | | 417,900 | | | | 2,950,853 | |
| | |
Unit Corp. (United States) | | | 58,000 | | | | 2,117,000 | |
| | |
Total Energy | | | | | | | 13,157,294 | |
| | |
Financials - 8.9% | | | | | | | | |
| | |
A-Mark Precious Metals, Inc. (United States)2 | | | 25,000 | | | | 809,250 | |
| | |
Omni Bridgeway, Ltd. (Australia)* | | | 5,500,000 | | | | 4,035,243 | |
| | |
Total Financials | | | | | | | 4,844,493 | |
| | |
Health Care - 1.0% | | | | | | | | |
| | |
Medical Facilities Corp. (Canada) | | | 60,000 | | | | 554,804 | |
| | |
Industrials - 24.1% | | | | | | | | |
| | |
Boustead Singapore, Ltd. (Singapore) | | | 375,000 | | | | 287,437 | |
| | |
CB Industrial Product Holding Bhd (Malaysia) | | | 1,000,000 | | | | 262,851 | |
| | |
Cie de L’Odet SE (France) | | | 1,800 | | | | 2,521,951 | |
| | |
Fila S.P.A. (Italy) | | | 260,000 | | | | 2,389,075 | |
| | |
Komelon Corp. (South Korea) | | | 45,000 | | | | 294,344 | |
| | |
Macfarlane Group PLC (United Kingdom) | | | 1,500,000 | | | | 2,256,419 | |
| | | | | | | | |
| | | Shares | | | Value | |
| | |
Maezawa Industries, Inc. (Japan) | | | 60,000 | | | $ | 546,233 | |
| | |
Mitani Corp. (Japan) | | | 30,000 | | | | 303,002 | |
| | |
Ocean Wilsons Holdings, Ltd. (Bermuda) | | | 55,000 | | | | 896,879 | |
| | |
Sam Yung Trading Co., Ltd. (South Korea) | | | 80,000 | | | | 757,283 | |
| | |
Sekisui Jushi Corp. (Japan) | | | 18,000 | | | | 255,412 | |
| | |
U-Haul Holding Co., Non-Voting Shares (United States) | | | 38,000 | | | | 2,280,760 | |
| | |
Total Industrials | | | | | | | 13,051,646 | |
| | |
Information Technology - 0.8% | | | | | | | | |
| | |
Bixolon Co., Ltd. (South Korea) | | | 120,000 | | | | 404,068 | |
| | |
Materials - 8.7% | | | | | | | | |
| | |
Amerigo Resources, Ltd. (Canada) | | | 400,000 | | | | 453,200 | |
| | |
Brickability Group PLC (United Kingdom) | | | 2,450,000 | | | | 2,104,284 | |
| | |
KISCO Holdings Co., Ltd. (South Korea) | | | 48,000 | | | | 684,923 | |
| | |
Master Drilling Group, Ltd. (South Africa) | | | 450,000 | | | | 296,805 | |
| | |
Okamoto Industries, Inc. (Japan) | | | 28,000 | | | | 874,599 | |
| | |
SK Kaken Co., Ltd. (Japan) | | | 6,000 | | | | 320,716 | |
| | |
Total Materials | | | | | | | 4,734,527 | |
| | |
Utilities - 0.8% | | | | | | | | |
| | |
Maxim Power Corp. (Canada)* | | | 140,000 | | | | 408,319 | |
| | |
Total Common Stocks | | | | | | | | |
(Cost $47,500,417) | | | | | | | 51,469,172 | |
| | |
Preferred Stock - 1.7% | | | | | | | | |
| | |
Information Technology - 1.7% | | | | | | | | |
| | |
Samsung Electronics Co., Ltd., 1.560% (South Korea) | | | 20,000 | | | | 918,335 | |
| | |
Total Preferred Stock | | | | | | | | |
(Cost $320,545) | | | | | | | 918,335 | |
| | |
| |
| Principal
Amount |
| | | | |
| |
Short-Term Investments - 4.7% | | | | | |
| |
Joint Repurchase Agreements - 1.5%3 | | | | | |
| | |
Bethesda Securities LLC, dated 06/28/24, due 07/01/24, 5.450% total to be received $826,508 (collateralized by various U.S. Government Agency Obligations, 2.500% -6.070%, 10/01/27 - 01/01/57, totaling $842,656) | | $ | 826,133 | | | | 826,133 | |
| | |
| | | Shares | | | | | |
| |
Other Investment Companies - 3.2% | | | | | |
| | |
Dreyfus Institutional Preferred Government Money Market Fund, Institutional Shares, 5.27%4 | | | 1,727,398 | | | | 1,727,398 | |
| | |
Total Short-Term Investments | | | | | | | | |
(Cost $2,553,531) | | | | | | | 2,553,531 | |
| | |
Total Investments - 101.4% | | | | | | | | |
(Cost $50,374,493) | | | | | | | 54,941,038 | |
The accompanying notes are an integral part of these financial statements.
10
| | |
| | AMG Yacktman Special Opportunities Fund Schedule of Portfolio Investments (continued) |
| | | | | | |
| | | | | Value | |
| |
Other Assets, less Liabilities - (1.4)% | | | $(762,985) | |
| | |
Net Assets - 100.0% | | | | | $54,178,053 | |
| | * | Non-income producing security. |
| | 1 | Security exempt from registration under Rule 144A of the Securities Act of 1933. This security may be resold in transactions exempt from registration, normally to qualified institutional buyers. At June 30, 2024, the value of this security amounted to $401,606 or 0.7% of net assets. |
| | 2 | Some of this security, amounting to $801,158 or 1.5% of net assets, was out on loan to various borrowers and is collateralized by cash. See Note 4 of Notes to Financial Statements. |
| | 3 | Cash collateral received for securities lending activity was invested in these joint repurchase agreements. |
| | 4 | Yield shown represents the June 30, 2024, seven day average yield, which refers to the sum of the previous seven days’ dividends paid, expressed as an annual percentage. |
The following table summarizes the inputs used to value the Fund’s investments by the fair value hierarchy levels as of June 30, 2024:
| | | | | | | | | | | | | | | | |
| | | Level 1 | | | Level 21 | | | Level 3 | | | Total | |
| | | | |
Investments in Securities | | | | | | | | | | | | | | | | |
| | | | |
Common Stocks | | | | | | | | | | | | | | | | |
| | | | |
Energy | | | $12,826,238 | | | | $331,056 | | | | — | | | | $13,157,294 | |
| | | | |
Industrials | | | 9,146,269 | | | | 3,905,377 | | | | — | | | | 13,051,646 | |
| | | | |
Consumer Discretionary | | | 8,468,848 | | | | — | | | | — | | | | 8,468,848 | |
| | | | |
Consumer Staples | | | 739,498 | | | | 4,935,275 | | | | — | | | | 5,674,773 | |
| | | | |
Financials | | | 809,250 | | | | 4,035,243 | | | | — | | | | 4,844,493 | |
| | | | |
Materials | | | 750,005 | | | | 3,984,522 | | | | — | | | | 4,734,527 | |
| | | | |
Health Care | | | 554,804 | | | | — | | | | — | | | | 554,804 | |
| | | | |
Utilities | | | 408,319 | | | | — | | | | — | | | | 408,319 | |
| | | | |
Information Technology | | | — | | | | 404,068 | | | | — | | | | 404,068 | |
| | | | |
Communication Services | | | 170,400 | | | | — | | | | — | | | | 170,400 | |
| | | | |
Preferred Stock† | | | — | | | | 918,335 | | | | — | | | | 918,335 | |
| | | | |
Short-Term Investments | | | | | | | | | | | | | | | | |
| | | | |
Joint Repurchase Agreements | | | — | | | | 826,133 | | | | — | | | | 826,133 | |
| | | | |
Other Investment Companies | | | 1,727,398 | | | | — | | | | — | | | | 1,727,398 | |
| | | | | | | | | | | | | | | | |
| | | | |
Total Investments in Securities | | | $35,601,029 | | | | $19,340,009 | | | | — | | | | $54,941,038 | |
| | | | | | | | | | | | | | | | |
| | † | All preferred stocks held in the Fund are Level 2 securities. For a detailed breakout of preferred stocks by major industry classification, please refer to Schedule of Portfolio Investments. |
| | 1 | An external pricing service is used to reflect any impact on security value due to market movements between the time the Fund valued such foreign securities and the earlier closing of foreign markets. |
For the six months ended June 30, 2024, there were no transfers in or out of Level 3.
The accompanying notes are an integral part of these financial statements.
11
| | |
| | Statement of Assets and Liabilities (unaudited) June 30, 2024 |
| | | | | | | | | | | | | | | | | | | | |
| | | AMG Yacktman
Fund | | AMG Yacktman
Focused Fund | | AMG Yacktman
Global Fund | | AMG Yacktman
Special
Opportunities Fund |
| | | | |
Assets: | | | | | | | | | | | | | | | | | | | | |
| | | | |
Investments at value 1 (including securities on loan valued at $21,411,643, $25,163,461, $0, and $801,158, respectively) | | | | $8,318,094,634 | | | | | $3,577,139,631 | | | | | $172,142,546 | | | | | $54,941,038 | |
| | | | |
Cash | | | | 2,338 | | | | | 892 | | | | | — | | | | | — | |
| | | | |
Foreign currency2 | | | | 4,364,967 | | | | | 421,941 | | | | | 192,812 | | | | | 32,998 | |
| | | | |
Receivable for investments sold | | | | — | | | | | — | | | | | — | | | | | 141,282 | |
| | | | |
Dividend and interest receivables | | | | 15,599,721 | | | | | 6,293,181 | | | | | 521,336 | | | | | 80,182 | |
| | | | |
Securities lending income receivable | | | | 7,463 | | | | | 27,966 | | | | | 3 | | | | | 207 | |
| | | | |
Receivable for Fund shares sold | | | | 2,670,464 | | | | | 1,528,320 | | | | | 42 | | | | | — | |
| | | | |
Receivable from affiliate | | | | — | | | | | — | | | | | 6,355 | | | | | 3,508 | |
| | | | |
Prepaid expenses and other assets | | | | 144,511 | | | | | 86,625 | | | | | 15,507 | | | | | 12,500 | |
| | | | |
Total assets | | | | 8,340,884,098 | | | | | 3,585,498,556 | | | | | 172,878,601 | | | | | 55,211,715 | |
| | | | |
Liabilities: | | | | | | | | | | | | | | | | | | | | |
| | | | |
Payable upon return of securities loaned | | | | 21,459,166 | | | | | 21,505,767 | | | | | — | | | | | 826,133 | |
| | | | |
Payable for investments purchased | | | | 812,873 | | | | | 279,656 | | | | | — | | | | | — | |
| | | | |
Payable for Fund shares repurchased | | | | 5,795,280 | | | | | 7,103,499 | | | | | 81,641 | | | | | 131,378 | |
| | | | |
Accrued expenses: | | | | | | | | | | | | | | | | | | | | |
| | | | |
Investment advisory and management fees | | | | 2,929,176 | | | | | 2,553,432 | | | | | 101,701 | | | | | 17,089 | |
| | | | |
Administrative fees | | | | 1,024,179 | | | | | 440,247 | | | | | 21,486 | | | | | 6,785 | |
| | | | |
Shareholder service fees | | | | 580,368 | | | | | 263,888 | | | | | 390 | | | | | 1,921 | |
| | | | |
Other | | | | 766,794 | | | | | 399,114 | | | | | 53,955 | | | | | 50,356 | |
| | | | |
Total liabilities | | | | 33,367,836 | | | | | 32,545,603 | | | | | 259,173 | | | | | 1,033,662 | |
| | | | |
Commitments and Contingencies (Notes 2 & 6) | | | | | | | | | | | | | | | | | | | | |
| | | | |
Net Assets | | | | $8,307,516,262 | | | | | $3,552,952,953 | | | | | $172,619,428 | | | | | $54,178,053 | |
| | | | |
1 Investments at cost | | | | $5,270,415,359 | | | | | $2,418,023,920 | | | | | $148,598,558 | | | | | $50,374,493 | |
| | | | |
2 Foreign currency at cost | | | | $4,355,281 | | | | | $423,796 | | | | | $192,950 | | | | | $33,031 | |
The accompanying notes are an integral part of these financial statements.
12
| | |
| | Statement of Assets and Liabilities (continued) |
| | | | | | | | | | | | | | | | | | | | |
| | | AMG Yacktman
Fund | | AMG Yacktman
Focused Fund | | AMG Yacktman
Global Fund | | AMG Yacktman
Special
Opportunities Fund |
| | | | |
Net Assets Represent: | | | | | | | | | | | | | | | | | | | | |
| | | | |
Paid-in capital | | | | $4,883,471,744 | | | | | $2,225,942,305 | | | | | $149,299,851 | | | | | $50,143,970 | |
| | | | |
Total distributable earnings | | | | 3,424,044,518 | | | | | 1,327,010,648 | | | | | 23,319,577 | | | | | 4,034,083 | |
| | | | |
Net Assets | | | | $8,307,516,262 | | | | | $3,552,952,953 | | | | | $172,619,428 | | | | | $54,178,053 | |
| | | | |
Class N: | | | | | | | | | | | | | | | | | | | | |
| | | | |
Net Assets | | | | — | | | | | $1,735,304,572 | | | | | $2,360,123 | | | | | — | |
| | | | |
Shares outstanding | | | | — | | | | | 82,394,107 | | | | | 152,366 | | | | | — | |
| | | | |
Net asset value, offering and redemption price per share | | | | — | | | | | $21.06 | | | | | $15.49 | | | | | — | |
| | | | |
Class I: | | | | | | | | | | | | | | | | | | | | |
| | | | |
Net Assets | | | | $8,307,516,262 | | | | | $1,817,648,381 | | | | | $170,259,305 | | | | | $22,991,738 | |
| | | | |
Shares outstanding | | | | 339,605,095 | | | | | 86,589,809 | | | | | 10,952,157 | | | | | 2,109,062 | |
| | | | |
Net asset value, offering and redemption price per share | | | | $24.46 | | | | | $20.99 | | | | | $15.55 | | | | | $10.90 | |
| | | | |
Class Z: | | | | | | | | | | | | | | | | | | | | |
| | | | |
Net Assets | | | | — | | | | | — | | | | | — | | | | | $31,186,315 | |
| | | | |
Shares outstanding | | | | — | | | | | — | | | | | — | | | | | 2,850,899 | |
| | | | |
Net asset value, offering and redemption price per share | | | | — | | | | | — | | | | | — | | | | | $10.94 | |
The accompanying notes are an integral part of these financial statements.
13
| | |
| | Statement of Operations (unaudited) For the six months ended June 30, 2024 |
| | | | | | | | | | | | | | | | |
| | | AMG Yacktman
Fund | | AMG Yacktman
Focused Fund | | AMG Yacktman
Global Fund | | AMG Yacktman
Special
Opportunities Fund |
| | | | |
Investment Income: | | | | | | | | | | | | | | | | |
| | | | |
Dividend income | | | $99,509,842 | | | | $49,824,863 | | | | $3,120,935 | | | | $1,244,772 | |
| | | | |
Interest income | | | 12,994,609 | | | | 6,835,211 | | | | 1,284 | | | | 841 | |
| | | | |
Securities lending income | | | 38,794 | | | | 151,454 | | | | 188 | | | | 3,691 | |
| | | | |
Foreign withholding tax | | | (5,763,854 | ) | | | (4,456,483 | ) | | | (306,196 | ) | | | (66,921 | ) |
| | | | |
Total investment income | | | 106,779,391 | | | | 52,355,045 | | | | 2,816,211 | | | | 1,182,383 | |
| | | | |
Expenses: | | | | | | | | | | | | | | | | |
| | | | |
Investment advisory and management fees | | | 18,000,605 | | | | 15,893,787 | | | | 652,336 | | | | 173,896 | |
| | | | |
Administrative fees | | | 6,295,591 | | | | 2,740,308 | | | | 137,817 | | | | 50,256 | |
| | | | |
Shareholder servicing fees - Class N | | | — | | | | 1,637,801 | | | | 2,392 | | | | — | |
| | | | |
Shareholder servicing fees - Class I | | | 3,567,501 | | | | — | | | | — | | | | 17,169 | |
| | | | |
Custodian fees | | | 402,614 | | | | 221,367 | | | | 30,435 | | | | 23,671 | |
| | | | |
Trustee fees and expenses | | | 314,792 | | | | 137,538 | | | | 6,943 | | | | 2,709 | |
| | | | |
Professional fees | | | 283,481 | | | | 135,558 | | | | 23,699 | | | | 20,423 | |
| | | | |
Transfer agent fees | | | 217,226 | | | | 105,358 | | | | 3,462 | | | | 1,542 | |
| | | | |
Reports to shareholders | | | 216,845 | | | | 106,069 | | | | 4,739 | | | | 5,263 | |
| | | | |
Registration fees | | | 50,765 | | | | 42,317 | | | | 23,737 | | | | 9,846 | |
| | | | |
Interest expense | | | — | | | | — | | | | — | | | | 1,765 | |
| | | | |
Miscellaneous | | | 180,071 | | | | 79,054 | | | | 4,401 | | | | 3,000 | |
| | | | |
Total expenses before offsets | | | 29,529,491 | | | | 21,099,157 | | | | 889,961 | | | | 309,540 | |
| | | | |
Expense reimbursements | | | — | | | | — | | | | (33,101 | ) | | | (26,250 | ) |
| | | | |
Fee waivers | | | (47,091 | ) | | | (16,364 | ) | | | — | | | | — | |
| | | | |
Net expenses | | | 29,482,400 | | | | 21,082,793 | | | | 856,860 | | | | 283,290 | |
| | | | | | | | | | | | | | | | |
| | | | |
Net investment income | | | 77,296,991 | | | | 31,272,252 | | | | 1,959,351 | | | | 899,093 | |
| | | | |
Net Realized and Unrealized Gain: | | | | | | | | | | | | | | | | |
| | | | |
Net realized gain on investments | | | 261,360,436 | | | | 95,348,607 | | | | 3,871,000 | | | | 798,384 | |
| | | | |
Net realized loss on foreign currency transactions | | | (74,115 | ) | | | (667,681 | ) | | | (118,597 | ) | | | (13,752 | ) |
| | | | |
Net change in unrealized appreciation/depreciation on investments | | | 59,300,832 | | | | 32,731,023 | | | | (2,955,982 | ) | | | (280,356 | ) |
| | | | |
Net change in unrealized appreciation/depreciation on foreign currency translations | | | (255,720 | ) | | | (71,683 | ) | | | (11,646 | ) | | | (2,868 | ) |
| | | | |
Net realized and unrealized gain | | | 320,331,433 | | | | 127,340,266 | | | | 784,775 | | | | 501,408 | |
| | | | | | | | | | | | | | | | |
| | | | |
Net increase in net assets resulting from operations | | | $397,628,424 | | | | $158,612,518 | | | | $2,744,126 | | | | $1,400,501 | |
The accompanying notes are an integral part of these financial statements.
14
| | |
| | Statements of Changes in Net Assets For the six months ended June 30, 2024 (unaudited) and the fiscal year ended December 31, 2023 |
| | | | | | | | | | | | | | | | |
| | | AMG Yacktman
Fund | | AMG Yacktman
Focused Fund |
| | | | |
| | | June 30, 2024 | | December 31, 2023 | | June 30, 2024 | | December 31, 2023 |
| | | | |
Increase in Net Assets Resulting From Operations: | | | | | | | | | | | | | | | | |
| | | | |
Net investment income | | | $77,296,991 | | | | $137,379,211 | | | | $31,272,252 | | | | $39,881,779 | |
| | | | |
Net realized gain on investments | | | 261,286,321 | | | | 229,170,082 | | | | 94,680,926 | | | | 163,480,723 | |
| | | | |
Net change in unrealized appreciation/depreciation on investments | | | 59,045,112 | | | | 805,799,649 | | | | 32,659,340 | | | | 347,824,531 | |
| | | | |
Net increase in net assets resulting from operations | | | 397,628,424 | | | | 1,172,348,942 | | | | 158,612,518 | | | | 551,187,033 | |
| | | | |
Distributions to Shareholders: | | | | | | | | | | | | | | | | |
| | | | |
Class N | | | — | | | | — | | | | — | | | | (77,433,936 | ) |
| | | | |
Class I | | | — | | | | (360,103,585 | ) | | | — | | | | (84,719,132 | ) |
| | | | |
Total distributions to shareholders | | | — | | | | (360,103,585 | ) | | | — | | | | (162,153,068 | ) |
| | | | |
Capital Share Transactions:1 | | | | | | | | | | | | | | | | |
| | | | |
Net decrease from capital share transactions | | | (564,144,817 | ) | | | (311,253,360 | ) | | | (305,992,157 | ) | | | (225,102,893 | ) |
| | | | | | | | | | | | | | | | |
| | | | |
Total increase (decrease) in net assets | | | (166,516,393 | ) | | | 500,991,997 | | | | (147,379,639 | ) | | | 163,931,072 | |
| | | | |
Net Assets: | | | | | | | | | | | | | | | | |
| | | | |
Beginning of period | | | 8,474,032,655 | | | | 7,973,040,658 | | | | 3,700,332,592 | | | | 3,536,401,520 | |
| | | | |
End of period | | | $8,307,516,262 | | | | $8,474,032,655 | | | | $3,552,952,953 | | | | $3,700,332,592 | |
1 See Note 1(g) of the Notes to Financial Statements.
The accompanying notes are an integral part of these financial statements.
15
| | |
| | Statements of Changes in Net Assets (continued) For the six months ended June 30, 2024 (unaudited) and the fiscal year ended December 31, 2023 |
| | | | | | | | | | | | | | | | |
| | | AMG Yacktman
Global Fund | | AMG Yacktman
Special
Opportunities Fund |
| | | | |
| | | June 30, 2024 | | December 31, 2023 | | June 30, 2024 | | December 31, 2023 |
| | | | |
Increase in Net Assets Resulting From Operations: | | | | | | | | | | | | | | | | |
| | | | |
Net investment income | | | $1,959,351 | | | | $3,675,792 | | | | $899,093 | | | | $2,319,094 | |
| | | | |
Net realized gain on investments | | | 3,752,403 | | | | 5,159,484 | | | | 784,632 | | | | 2,226,959 | |
| | | | |
Net change in unrealized appreciation/depreciation on investments | | | (2,967,628 | ) | | | 17,849,533 | | | | (283,224 | ) | | | (2,610,422 | ) |
| | | | |
Net increase in net assets resulting from operations | | | 2,744,126 | | | | 26,684,809 | | | | 1,400,501 | | | | 1,935,631 | |
| | | | |
Distributions to Shareholders: | | | | | | | | | | | | | | | | |
| | | | |
Class N | | | — | | | | (164,990 | ) | | | — | | | | — | |
| | | | |
Class I | | | — | | | | (14,169,608 | ) | | | — | | | | (3,386,442 | ) |
| | | | |
Class Z | | | — | | | | — | | | | — | | | | (2,979,968 | ) |
| | | | |
Total distributions to shareholders | | | — | | | | (14,334,598 | ) | | | — | | | | (6,366,410 | ) |
| | | | |
Capital Share Transactions:1 | | | | | | | | | | | | | | | | |
| | | | |
Net increase (decrease) from capital share transactions | | | (20,190,685 | ) | | | 26,870,906 | | | | (20,352,528 | ) | | | (6,245,176 | ) |
| | | | | | | | | | | | | | | | |
| | | | |
Total increase (decrease) in net assets | | | (17,446,559 | ) | | | 39,221,117 | | | | (18,952,027 | ) | | | (10,675,955 | ) |
| | | | |
Net Assets: | | | | | | | | | | | | | | | | |
| | | | |
Beginning of period | | | 190,065,987 | | | | 150,844,870 | | | | 73,130,080 | | | | 83,806,035 | |
| | | | |
End of period | | | $172,619,428 | | | | $190,065,987 | | | | $54,178,053 | | | | $73,130,080 | |
1 See Note 1(g) of the Notes to Financial Statements.
The accompanying notes are an integral part of these financial statements.
16
| | |
| | AMG Yacktman Fund Financial Highlights For a share outstanding throughout each fiscal period |
| | | | | | | | | | | | | | | | | | | | | | | | | | | | | | | | |
| | | For the six
months ended | | | | For the fiscal years ended December 31, |
| Class I | | June 30, 2024
(unaudited) | | | | 2023 | | 2022 | | 2021 | | 2020 | | 2019 |
| | | | | | | |
Net Asset Value, Beginning of Period | | | | $23.34 | | | | | | | $21.13 | | | | | $24.50 | | | | | $21.26 | | | | | $20.48 | | | | | $19.05 | |
| | | | | | | |
Income (loss) from Investment Operations: | | | | | | | | | | | | | | | | | | | | | | | | | | | | | | | | |
| | | | | | | |
Net investment income1,2 | | | | 0.22 | | | | | | | 0.38 | | | | | 0.35 | | | | | 0.26 | 3 | | | | 0.27 | | | | | 0.35 | |
| | | | | | | |
Net realized and unrealized gain (loss) on investments | | | | 0.90 | | | | | | | 2.86 | | | | | (2.17 | ) | | | | 3.89 | | | | | 2.81 | | | | | 2.99 | |
| | | | | | | |
Total income (loss) from investment operations | | | | 1.12 | | | | | | | 3.24 | | | | | (1.82 | ) | | | | 4.15 | | | | | 3.08 | | | | | 3.34 | |
| | | | | | | |
Less Distributions to Shareholders from: | | | | | | | | | | | | | | | | | | | | | | | | | | | | | | | | |
| | | | | | | |
Net investment income | | | | — | | | | | | | (0.42 | ) | | | | (0.33 | ) | | | | (0.27 | ) | | | | (0.28 | ) | | | | (0.37 | ) |
| | | | | | | |
Net realized gain on investments | | | | — | | | | | | | (0.61 | ) | | | | (1.22 | ) | | | | (0.64 | ) | | | | (2.02 | ) | | | | (1.54 | ) |
| | | | | | | |
Total distributions to shareholders | | | | — | | | | | | | (1.03 | ) | | | | (1.55 | ) | | | | (0.91 | ) | | | | (2.30 | ) | | | | (1.91 | ) |
| | | | | | | |
Net Asset Value, End of Period | | | | $24.46 | | | | | | | $23.34 | | | | | $21.13 | | | | | $24.50 | | | | | $21.26 | | | | | $20.48 | |
| | | | | | | |
Total Return2,4 | | | | 4.80 | %5 | | | | | | 15.39 | % | | | | (7.37 | )% | | | | 19.63 | % | | | | 15.28 | % | | | | 17.66 | % |
| | | | | | | |
Ratio of net expenses to average net assets | | | | 0.70 | %6 | | | | | | 0.70 | % | | | | 0.70 | % | | | | 0.70 | % | | | | 0.70 | % | | | | 0.70 | % |
| | | | | | | |
Ratio of gross expenses to average net assets7 | | | | 0.70 | %6 | | | | | | 0.70 | % | | | | 0.70 | % | | | | 0.70 | % | | | | 0.71 | % | | | | 0.71 | % |
| | | | | | | |
Ratio of net investment income to average net assets2 | | | | 1.84 | %6 | | | | | | 1.68 | % | | | | 1.54 | % | | | | 1.09 | % | | | | 1.38 | % | | | | 1.70 | % |
| | | | | | | |
Portfolio turnover | | | | 2 | %5 | | | | | | 5 | % | | | | 11 | % | | | | 15 | % | | | | 27 | % | | | | 35 | % |
| | | | | | | |
Net assets end of period (000’s) omitted | | | | $8,307,516 | | | | | | | $8,474,033 | | | | | $7,973,041 | | | | | $9,475,623 | | | | | $7,636,139 | | | | | $8,242,523 | |
| | | | | | | | | | | | | | | | | | | | | | | | | | | | | | | | | |
| 1 | Per share numbers have been calculated using average shares. |
| 2 | Total returns and net investment income would have been lower had certain expenses not been offset. |
| 3 | Includes non-recurring dividends. Without these dividends, net investment income per share would have been $0.21. |
| 4 | The total return is calculated using the published Net Asset Value as of period end. |
| 7 | Excludes the impact of expense reimbursement or fee waivers and expense reductions such as brokerage credits, but includes expense repayments and non-reimbursable expenses, if any, such as interest, taxes, and extraordinary expenses. (See Note 1(c) and 2 in the Notes to Financial Statements.) |
17
| | |
| | AMG Yacktman Focused Fund Financial Highlights For a share outstanding throughout each fiscal period |
| | | | | | | | | | | | | | | | | | | | | | | | | | | | | | |
| | | For the six | | | | | | | | | | |
| | | months ended | | For the fiscal years ended December 31, |
| Class N | | June 30, 2024
(unaudited) | | 2023 | | 2022 | | 2021 | | 2020 | | 2019 |
| | | | | | |
Net Asset Value, Beginning of Period | | | | $20.18 | | | | | $18.11 | | | | | $21.21 | | | | | $19.09 | | | | | $18.25 | | | | | $17.78 | |
| | | | | | |
Income (loss) from Investment Operations: | | | | | | | | | | | | | | | | | | | | | | | | | | | | | | |
| | | | | | |
Net investment income (loss)1,2 | | | | 0.17 | | | | | 0.20 | | | | | 0.22 | | | | | 0.14 | 3 | | | | 0.15 | | | | | 0.23 | |
| | | | | | |
Net realized and unrealized gain (loss) on investments | | | | 0.71 | | | | | 2.76 | | | | | (1.94 | ) | | | | 2.98 | | | | | 2.95 | | | | | 3.13 | |
| | | | | | |
Total income (loss) from investment operations | | | | 0.88 | | | | | 2.96 | | | | | (1.72 | ) | | | | 3.12 | | | | | 3.10 | | | | | 3.36 | |
| | | | | | |
Less Distributions to Shareholders from: | | | | | | | | | | | | | | | | | | | | | | | | | | | | | | |
| | | | | | |
Net investment income | | | | — | | | | | (0.25 | ) | | | | (0.21 | ) | | | | (0.16 | ) | | | | (0.15 | ) | | | | (0.25 | ) |
| | | | | | |
Net realized gain on investments | | | | — | | | | | (0.64 | ) | | | | (1.17 | ) | | | | (0.84 | ) | | | | (2.11 | ) | | | | (2.64 | ) |
| | | | | | |
Total distributions to shareholders | | | | — | | | | | (0.89 | ) | | | | (1.38 | ) | | | | (1.00 | ) | | | | (2.26 | ) | | | | (2.89 | ) |
| | | | | | |
Net Asset Value, End of Period | | | | $21.06 | | | | | $20.18 | | | | | $18.11 | | | | | $21.21 | | | | | $19.09 | | | | | $18.25 | |
| | | | | | |
Total Return2,4 | | | | 4.36 | %5 | | | | 16.45 | % | | | | (8.06 | )% | | | | 16.45 | % | | | | 17.26 | % | | | | 19.13 | % |
| | | | | | |
Ratio of net expenses to average net assets | | | | 1.24 | %6 | | | | 1.25 | %7 | | | | 1.25 | %7 | | | | 1.25 | %7 | | | | 1.24 | % | | | | 1.24 | % |
| | | | | | |
Ratio of gross expenses to average net assets8 | | | | 1.24 | %6 | | | | 1.25 | %7 | | | | 1.25 | %7 | | | | 1.25 | %7 | | | | 1.26 | % | | | | 1.26 | % |
| | | | | | |
Ratio of net investment income to average net assets2 | | | | 1.62 | %6 | | | | 1.02 | % | | | | 1.14 | % | | | | 0.68 | % | | | | 0.85 | % | | | | 1.20 | % |
| | | | | | |
Portfolio turnover | | | | 1 | %5 | | | | 4 | % | | | | 13 | % | | | | 19 | % | | | | 33 | % | | | | 31 | % |
| | | | | | |
Net assets end of period (000’s) omitted | | | | $1,735,305 | | | | | $1,798,471 | | | | | $1,730,316 | | | | | $2,158,777 | | | | | $1,943,998 | | | | | $2,078,758 | |
| | | | | | | | | | | | | | | | | | | | | | | | | | | | | | | |
18
| | |
| | AMG Yacktman Focused Fund Financial Highlights For a share outstanding throughout each fiscal period |
| | | | | | | | | | | | | | | | | | | | | | | | | | | | | | |
| | | For the six | | | | | | | | | | |
| | | months ended | | For the fiscal years ended December 31, |
| Class I | | June 30, 2024
(unaudited) | | 2023 | | 2022 | | 2021 | | 2020 | | 2019 |
| | | | | | |
Net Asset Value, Beginning of Period | | | | $20.10 | | | | | $18.04 | | | | | $21.13 | | | | | $19.03 | | | | | $18.19 | | | | | $17.74 | |
| | | | | | |
Income (loss) from Investment Operations: | | | | | | | | | | | | | | | | | | | | | | | | | | | | | | |
| | | | | | |
Net investment income1,2 | | | | 0.19 | | | | | 0.23 | | | | | 0.26 | | | | | 0.18 | 3 | | | | 0.18 | | | | | 0.27 | |
| | | | | | |
Net realized and unrealized gain (loss) on investments | | | | 0.70 | | | | | 2.76 | | | | | (1.93 | ) | | | | 2.96 | | | | | 2.96 | | | | | 3.11 | |
| | | | | | |
Total income (loss) from investment operations | | | | 0.89 | | | | | 2.99 | | | | | (1.67 | ) | | | | 3.14 | | | | | 3.14 | | | | | 3.38 | |
| | | | | | |
Less Distributions to Shareholders from: | | | | | | | | | | | | | | | | | | | | | | | | | | | | | | |
| | | | | | |
Net investment income | | | | — | | | | | (0.29 | ) | | | | (0.25 | ) | | | | (0.20 | ) | | | | (0.19 | ) | | | | (0.29 | ) |
| | | | | | |
Net realized gain on investments | | | | — | | | | | (0.64 | ) | | | | (1.17 | ) | | | | (0.84 | ) | | | | (2.11 | ) | | | | (2.64 | ) |
| | | | | | |
Total distributions to shareholders | | | | — | | | | | (0.93 | ) | | | | (1.42 | ) | | | | (1.04 | ) | | | | (2.30 | ) | | | | (2.93 | ) |
| | | | | | |
Net Asset Value, End of Period | | | | $20.99 | | | | | $20.10 | | | | | $18.04 | | | | | $21.13 | | | | | $19.03 | | | | | $18.19 | |
| | | | | | |
Total Return2,4 | | | | 4.43 | %5 | | | | 16.67 | % | | | | (7.85 | )% | | | | 16.62 | % | | | | 17.52 | % | | | | 19.30 | % |
| | | | | | |
Ratio of net expenses to average net assets | | | | 1.06 | %6 | | | | 1.06 | % | | | | 1.06 | % | | | | 1.06 | % | | | | 1.06 | % | | | | 1.06 | % |
| | | | | | |
Ratio of gross expenses to average net assets8 | | | | 1.06 | %6 | | | | 1.06 | % | | | | 1.06 | % | | | | 1.06 | % | | | | 1.07 | % | | | | 1.07 | % |
| | | | | | |
Ratio of net investment income to average net assets2 | | | | 1.80 | %6 | | | | 1.21 | % | | | | 1.33 | % | | | | 0.87 | % | | | | 1.04 | % | | | | 1.39 | % |
| | | | | | |
Portfolio turnover | | | | 1 | %5 | | | | 4 | % | | | | 13 | % | | | | 19 | % | | | | 33 | % | | | | 31 | % |
| | | | | | |
Net assets end of period (000’s) omitted | | | | $1,817,648 | | | | | $1,901,862 | | | | | $1,806,085 | | | | | $2,309,078 | | | | | $1,695,239 | | | | | $1,554,975 | |
| | | | | | | | | | | | | | | | | | | | | | | | | | | | | | | |
| 1 | Per share numbers have been calculated using average shares. |
| 2 | Total returns and net investment income would have been lower had certain expenses not been offset. |
| 3 | Includes non-recurring dividends. Without these dividends, net investment income per share would have been $0.09 and $0.13 for Class N and Class I, respectively. |
| 4 | The total return is calculated using the published Net Asset Value as of period end. |
| 7 | Such ratio includes recapture of waived/reimbursed fees from prior periods amounting to less than 0.01%, less than 0.01% and 0.01% for the fiscal years ended 2023, 2022 and 2021, respectively. |
| 8 | Excludes the impact of expense reimbursement or fee waivers and expense reductions such as brokerage credits, but includes expense repayments and non-reimbursable expenses, if any, such as interest, taxes, and extraordinary expenses. (See Note 1(c) and 2 in the Notes to Financial Statements.) |
19
| | |
| | AMG Yacktman Global Fund Financial Highlights For a share outstanding throughout each fiscal period |
| | | | | | | | | | | | | | | | | | | | | | | | | | | | | | |
| | | For the six | | | | | | | | | | |
| | | months ended | | For the fiscal years ended December 31, |
| Class N | | June 30, 2024
(unaudited) | | 2023 | | 2022 | | 2021 | | 2020 | | 2019 |
| | | | | | |
Net Asset Value, Beginning of Period | | | | $15.30 | | | | | $14.21 | | | | | $16.36 | | | | | $15.69 | | | | | $13.90 | | | | | $11.94 | |
| | | | | | |
Income (loss) from Investment Operations: | | | | | | | | | | | | | | | | | | | | | | | | | | | | | | |
| | | | | | |
Net investment income1,2 | | | | 0.15 | | | | | 0.29 | 3 | | | | 0.21 | | | | | 0.19 | 4 | | | | 0.18 | | | | | 0.17 | |
| | | | | | |
Net realized and unrealized gain (loss) on investments | | | | 0.04 | | | | | 2.00 | | | | | (1.74 | ) | | | | 1.80 | | | | | 2.35 | | | | | 2.37 | |
| | | | | | |
Total income (loss) from investment operations | | | | 0.19 | | | | | 2.29 | | | | | (1.53 | ) | | | | 1.99 | | | | | 2.53 | | | | | 2.54 | |
| | | | | | |
Less Distributions to Shareholders from: | | | | | | | | | | | | | | | | | | | | | | | | | | | | | | |
| | | | | | |
Net investment income | | | | — | | | | | (0.68 | ) | | | | — | | | | | (0.55 | ) | | | | (0.23 | ) | | | | (0.25 | ) |
| | | | | | |
Net realized gain on investments | | | | — | | | | | (0.52 | ) | | | | (0.62 | ) | | | | (0.77 | ) | | | | (0.51 | ) | | | | (0.33 | ) |
| | | | | | |
Total distributions to shareholders | | | | — | | | | | (1.20 | ) | | | | (0.62 | ) | | | | (1.32 | ) | | | | (0.74 | ) | | | | (0.58 | ) |
| | | | | | |
Net Asset Value, End of Period | | | | $15.49 | | | | | $15.30 | | | | | $14.21 | | | | | $16.36 | | | | | $15.69 | | | | | $13.90 | |
| | | | | | |
Total Return2,5 | | |
| 1.24
| %6
| | | | 16.30 | % | | | | (9.31 | )% | | | | 12.96 | % | | | | 18.32 | % | | | | 21.40 | % |
| | | | | | |
Ratio of net expenses to average net assets | | |
| 1.13
| %7
| | | | 1.13 | % | | | | 1.13 | % | | |
| 1.16
| %8
| | | | 1.19 | % | | | | 1.12 | % |
| | | | | | |
Ratio of gross expenses to average net assets9 | | |
| 1.17
| %7
| | | | 1.16 | % | | | | 1.17 | % | | |
| 1.18
| %8
| | | | 1.25 | % | | | | 1.22 | % |
| | | | | | |
Ratio of net investment income to average net assets2 | | |
| 1.94
| %7
| | | | 1.92 | % | | | | 1.47 | % | | | | 1.12 | % | | | | 1.40 | % | | | | 1.28 | % |
| | | | | | |
Portfolio turnover | | | | 2 | %6 | | | | 11 | % | | | | 11 | % | | | | 17 | % | | | | 27 | % | | | | 23 | % |
| | | | | | |
Net assets end of period (000’s) omitted | | | | $2,360 | | | | | $2,325 | | | | | $1,354 | | | | | $775 | | | | | $431 | | | | | $183 | |
| | | | | | | | | | | | | | | | | | | | | | | | | | | | | | | |
20
| | |
| | AMG Yacktman Global Fund Financial Highlights For a share outstanding throughout each fiscal period |
| | | | | | | | | | | | | | | | | | | | | | | | | | | | | | |
| | | For the six | | | | | | | | | | |
| | | months ended | | For the fiscal years ended December 31, |
| Class I | | June 30, 2024
(unaudited) | | 2023 | | 2022 | | 2021 | | 2020 | | 2019 |
| | | | | | |
Net Asset Value, Beginning of Period | | | | $15.34 | | | | | $14.25 | | | | | $16.36 | | | | | $15.69 | | | | | $13.89 | | | | | $11.94 | |
| | | | | | |
Income (loss) from Investment Operations: | | | | | | | | | | | | | | | | | | | | | | | | | | | | | | |
| | | | | | |
Net investment income1,2 | | | | 0.17 | | | | | 0.32 | 3 | | | | 0.25 | | | | | 0.22 | 4 | | | | 0.20 | | | | | 0.17 | |
| | | | | | |
Net realized and unrealized gain (loss) on investments | | | | 0.04 | | | | | 2.00 | | | | | (1.74 | ) | | | | 1.79 | | | | | 2.35 | | | | | 2.36 | |
| | | | | | |
Total income (loss) from investment operations | | | | 0.21 | | | | | 2.32 | | | | | (1.49 | ) | | | | 2.01 | | | | | 2.55 | | | | | 2.53 | |
| | | | | | |
Less Distributions to Shareholders from: | | | | | | | | | | | | | | | | | | | | | | | | | | | | | | |
| | | | | | |
Net investment income | | | | — | | | | | (0.71 | ) | | | | — | | | | | (0.57 | ) | | | | (0.24 | ) | | | | (0.25 | ) |
| | | | | | |
Net realized gain on investments | | | | — | | | | | (0.52 | ) | | | | (0.62 | ) | | | | (0.77 | ) | | | | (0.51 | ) | | | | (0.33 | ) |
| | | | | | |
Total distributions to shareholders | | | | — | | | | | (1.23 | ) | | | | (0.62 | ) | | | | (1.34 | ) | | | | (0.75 | ) | | | | (0.58 | ) |
| | | | | | |
Net Asset Value, End of Period | | | | $15.55 | | | | | $15.34 | | | | | $14.25 | | | | | $16.36 | | | | | $15.69 | | | | | $13.89 | |
| | | | | | |
Total Return2,5 | | | | 1.37 | %6 | | | | 16.46 | % | | | | (9.06 | )% | | | | 13.08 | % | | | | 18.47 | % | | | | 21.32 | % |
| | | | | | |
Ratio of net expenses to average net assets | | | | 0.93 | %7 | | | | 0.93 | % | | | | 0.93 | % | | | | 1.00 | %8 | | | | 1.08 | % | | | | 1.08 | % |
| | | | | | |
Ratio of gross expenses to average net assets9 | | | | 0.97 | %7 | | | | 0.96 | % | | | | 0.97 | % | | | | 1.02 | %8 | | | | 1.15 | % | | | | 1.19 | % |
| | | | | | |
Ratio of net investment income to average net assets2 | | | | 2.14 | %7 | | | | 2.12 | % | | | | 1.67 | % | | | | 1.28 | % | | | | 1.51 | % | | | | 1.31 | % |
| | | | | | |
Portfolio turnover | | | | 2 | %6 | | | | 11 | % | | | | 11 | % | | | | 17 | % | | | | 27 | % | | | | 23 | % |
| | | | | | |
Net assets end of period (000’s) omitted | | | | $170,259 | | | | | $187,741 | | | | | $149,491 | | | | | $170,316 | | | | | $132,758 | | | | | $96,041 | |
| | | | | | | | | | | | | | | | | | | | | | | | | | | | | | | |
| 1 | Per share numbers have been calculated using average shares. |
| 2 | Total returns and net investment income would have been lower had certain expenses not been offset. |
| 3 | Includes non-recurring dividends. Without these dividends, net investment income per share would have been $0.23 and $0.26 for Class N and Class I, respectively. |
| 4 | Includes non-recurring dividends. Without these dividends, net investment income per share would have been $0.15 and $0.17 for Class N and Class I, respectively. |
| 5 | The total return is calculated using the published Net Asset Value as of period end. |
| 8 | Such ratio includes recapture of waived/reimbursed fees from prior periods amounting to less than 0.01%. |
| 9 | Excludes the impact of expense reimbursement or fee waivers and expense reductions such as brokerage credits, but includes expense repayments and non-reimbursable expenses, if any, such as interest, taxes, and extraordinary expenses. (See Note 1(c) and 2 in the Notes to Financial Statements.) |
21
| | |
| | AMG Yacktman Special Opportunities Fund Financial Highlights For a share outstanding throughout each fiscal period |
| | | | | | | | | | | | | | | | | | | | | | | | | | | | | | |
| | | For the six | | | | | | | | | | |
| | | months ended | | For the fiscal years ended December 31, |
| Class I | | June 30, 2024
(unaudited) | | 2023 | | 2022 | | 2021 | | 2020 | | 2019 |
| | | | | | |
Net Asset Value, Beginning of Period | | | | $10.68 | | | | | $11.27 | | | | | $13.16 | | | | | $11.02 | | | | | $10.04 | | | | | $9.82 | |
| | | | | | |
Income (loss) from Investment Operations: | | | | | | | | | | | | | | | | | | | | | | | | | | | | | | |
| | | | | | |
Net investment income (loss)1,2 | | | | 0.14 | | | | | 0.32 | 3 | | | | 0.08 | | | | | (0.01 | ) | | | | 0.20 | 4 | | | | 0.24 | |
| | | | | | |
Net realized and unrealized gain (loss) on investments | | | | 0.08 | | | | | 0.04 | | | | | (1.87 | ) | | | | 2.65 | | | | | 1.06 | | | | | 0.73 | |
| | | | | | |
Total income (loss) from investment operations | | | | 0.22 | | | | | 0.36 | | | | | (1.79 | ) | | | | 2.64 | | | | | 1.26 | | | | | 0.97 | |
| | | | | | |
Less Distributions to Shareholders from: | | | | | | | | | | | | | | | | | | | | | | | | | | | | | | |
| | | | | | |
Net investment income | | | | — | | | | | (0.68 | ) | | | | — | | | | | (0.15 | ) | | | | (0.23 | ) | | | | (0.21 | ) |
| | | | | | |
Net realized gain on investments | | | | — | | | | | (0.27 | ) | | | | (0.10 | ) | | | | (0.35 | ) | | | | (0.05 | ) | | | | (0.54 | ) |
| | | | | | |
Total distributions to shareholders | | | | — | | | | | (0.95 | ) | | | | (0.10 | ) | | | | (0.50 | ) | | | | (0.28 | ) | | | | (0.75 | ) |
| | | | | | |
Net Asset Value, End of Period | | | | $10.90 | | | | | $10.68 | | | | | $11.27 | | | | | $13.16 | | | | | $11.02 | | | | | $10.04 | |
| | | | | | |
Total Return2,5 | | | | 2.06 | %6 | | | | 3.24 | % | | | | (13.59 | )% | | | | 24.30 | % | | | | 12.66 | % | | | | 10.20 | % |
| | | | | | |
Ratio of net expenses to average net assets7 | | |
| 0.89
| %8,9
| | | | 1.13 | % | | |
| 1.96
| %10
| | |
| 2.29
| %10
| | | | 1.14 | % | | | | 1.29 | % |
| | | | | | |
Ratio of gross expenses to average net assets7,11 | | | | 0.97 | %8 | | | | 1.19 | % | | |
| 2.00
| %10
| | |
| 2.29
| %10
| | | | 1.23 | % | | | | 1.47 | % |
| | | | | | |
Ratio of net investment income (loss) to average net assets2,7 | | | | 2.63 | %8 | | | | 2.81 | % | | | | 0.69 | % | | | | (0.09 | )% | | | | 2.27 | % | | | | 2.32 | % |
| | | | | | |
Portfolio turnover | | | | 6 | %6 | | | | 24 | % | | | | 40 | % | | | | 21 | % | | | | 37 | % | | | | 24 | % |
| | | | | | |
Net assets end of period (000’s) omitted | | | | $22,992 | | | | | $38,793 | | | | | $47,024 | | | | | $33,912 | | | | | $13,881 | | | | | $11,701 | |
| | | | | | | | | | | | | | | | | | | | | | | | | | | | | | | |
22
| | |
| | AMG Yacktman Special Opportunities Fund Financial Highlights For a share outstanding throughout each fiscal period |
| | | | | | | | | | | | | | | | | | | | | | | | | | | | | | |
| | | For the six | | | | | | | | | | |
| | | months ended | | For the fiscal years ended December 31, |
| Class Z | | June 30, 2024
(unaudited) | | 2023 | | 2022 | | 2021 | | 2020 | | 2019 |
| | | | | | |
Net Asset Value, Beginning of Period | | | | $10.71 | | | | | $11.31 | | | | | $13.20 | | | | | $11.04 | | | | | $10.06 | | | | | $9.84 | |
| | | | | | |
Income (loss) from Investment Operations: | | | | | | | | | | | | | | | | | | | | | | | | | | | | | | |
| | | | | | |
Net investment income1,2 | | | | 0.15 | | | | | 0.33 | 3 | | | | 0.10 | | | | | 0.00 | 12 | | | | 0.21 | 4 | | | | 0.25 | |
| | | | | | |
Net realized and unrealized gain (loss) on investments | | | | 0.08 | | | | | 0.03 | | | | | (1.88 | ) | | | | 2.67 | | | | | 1.06 | | | | | 0.72 | |
| | | | | | |
Total income (loss) from investment operations | | | | 0.23 | | | | | 0.36 | | | | | (1.78 | ) | | | | 2.67 | | | | | 1.27 | | | | | 0.97 | |
| | | | | | |
Less Distributions to Shareholders from: | | | | | | | | | | | | | | | | | | | | | | | | | | | | | | |
| | | | | | |
Net investment income | | | | — | | | | | (0.69 | ) | | | | (0.01 | ) | | | | (0.16 | ) | | | | (0.24 | ) | | | | (0.21 | ) |
| | | | | | |
Net realized gain on investments | | | | — | | | | | (0.27 | ) | | | | (0.10 | ) | | | | (0.35 | ) | | | | (0.05 | ) | | | | (0.54 | ) |
| | | | | | |
Total distributions to shareholders | | | | — | | | | | (0.96 | ) | | | | (0.11 | ) | | | | (0.51 | ) | | | | (0.29 | ) | | | | (0.75 | ) |
| | | | | | |
Net Asset Value, End of Period | | | | $10.94 | | | | | $10.71 | | | | | $11.31 | | | | | $13.20 | | | | | $11.04 | | | | | $10.06 | |
| | | | | | |
Total Return2,5 | | | | 2.06 | %6 | | | | 3.44 | % | | | | (13.57 | )% | | | | 24.42 | % | | | | 12.83 | % | | | | 10.27 | % |
| | | | | | |
Ratio of net expenses to average net assets7 | | |
| 0.79
| %8,9
| | | | 1.03 | % | | |
| 1.86
| %10
| | |
| 2.19
| %10
| | | | 1.04 | % | | | | 1.19 | % |
| | | | | | |
Ratio of gross expenses to average net assets7,11 | | | | 0.87 | %8 | | | | 1.09 | % | | |
| 1.90
| %10
| | |
| 2.19
| %10
| | | | 1.13 | % | | | | 1.37 | % |
| | | | | | |
Ratio of net investment income to average net assets2,7 | | | | 2.73 | %8 | | | | 2.91 | % | | | | 0.79 | % | | | | 0.01 | % | | | | 2.37 | % | | | | 2.42 | % |
| | | | | | |
Portfolio turnover | | | | 6 | %6 | | | | 24 | % | | | | 40 | % | | | | 21 | % | | | | 37 | % | | | | 24 | % |
| | | | | | |
Net assets end of period (000’s) omitted | | | | $31,186 | | | | | $34,337 | | | | | $36,782 | | | | | $78,197 | | | | | $64,908 | | | | | $47,981 | |
| | | | | | | | | | | | | | | | | | | | | | | | | | | | | | | |
| 1 | Per share numbers have been calculated using average shares. |
| 2 | Total returns and net investment income (loss) would have been lower had certain expenses not been offset. |
| 3 | Includes non-recurring dividends. Without these dividends, net investment income per share would have been $0.27 and $0.28 for Class I and Class Z, respectively. |
| 4 | Includes non-recurring dividends. Without these dividends, net investment income per share would have been $0.17 and $0.18 for Class I and Class Z, respectively. |
| 5 | The total return is calculated using the published Net Asset Value as of period end. |
| 7 | Includes a performance adjustment amounting to (0.42)% for the six months ended June 30, 2024, which is not annualized, and (0.61)%, 0.22%, 0.55%, (0.60)% and (0.45)% for the fiscal years ended December 31, 2023, 2022, 2021, 2020 and 2019, respectively. (See Note 2 in the Notes to Financial Statements). |
| 9 | Includes interest expense of less than 0.01% related to participation in the interfund lending program. |
| 10 | Such ratio includes recapture of waived/reimbursed fees from prior periods amounting to 0.01%. |
| 11 | Excludes the impact of expense reimbursement or fee waivers and expense reductions such as brokerage credits, but includes expense repayments and non-reimbursable expenses, if any, such as interest, taxes, and extraordinary expenses. (See Note 1(c) and 2 in the Notes to Financial Statements.) |
| 12 | Less than $0.005 per share. |
23
| | |
| | Notes to Financial Statements (unaudited) June 30, 2024 |
1. ORGANIZATION AND SUMMARY OF SIGNIFICANT ACCOUNTING POLICIES
AMG Funds (the “Trust”) is an open-end management investment company, organized as a Massachusetts business trust, and registered under the Investment Company Act of 1940, as amended (the “1940 Act”). Currently, the Trust consists of a number of different funds, each having distinct investment management objectives, strategies, risks, and policies. Included in this report are AMG Yacktman Fund (“Yacktman Fund”), AMG Yacktman Focused Fund (“Yacktman Focused”), AMG Yacktman Global Fund (“Yacktman Global”) and AMG Yacktman Special Opportunities Fund (“Yacktman Special Opportunities”), each a “Fund” and collectively, the “Funds”.
Each Fund offers different classes of shares. Yacktman Fund and Yacktman Special Opportunities have established Class N, Class I and Class Z shares. Currently, Yacktman Fund offers only Class I shares and Yacktman Special Opportunities offers only Class I shares and Class Z shares. Yacktman Focused and Yacktman Global have established and offer Class N and Class I shares. Each class represents an interest in the same assets of the respective Fund. Although all share classes generally have identical voting rights, each share class votes separately when required by law. Different share classes may have different net asset values per share to the extent the share classes pay different distribution amounts and/or the expenses of such share classes differ. Each share class has its own expense structure. Please refer to a current prospectus for additional information on each share class.
Yacktman Focused, Yacktman Global and Yacktman Special Opportunities are non-diversified funds.
The Funds’ financial statements are prepared in accordance with accounting principles generally accepted in the United States of America (“U.S. GAAP”), including accounting and reporting guidance pursuant to Accounting Standards Codification Topic 946 applicable to investment companies. U.S. GAAP requires management to make estimates and assumptions that affect the reported amounts of assets and liabilities and disclosure of contingent assets and liabilities at the date of the financial statements and the reported amounts of income and expenses during the reporting period. Actual results could differ from those estimates and such differences could be material. The following is a summary of significant accounting policies followed by the Funds in the preparation of their financial statements:
a. VALUATION OF INVESTMENTS
Equity securities, including options, traded on a national securities exchange or reported on the NASDAQ national market system (“NMS”) are valued at the last quoted sales price on the primary exchange or, if applicable, the NASDAQ official closing price or the official closing price of the relevant exchange or, lacking any sales, at the last quoted bid price. Equity securities held by the Funds that are traded in the over-the-counter market (other than NMS securities) are valued at the bid price. Foreign equity securities (securities principally traded in markets other than U.S. markets) held by the Funds are valued at the official closing price on the primary exchange or, for markets that either do not offer an official closing price or where the official closing price may not be representative of the overall market, the last quoted sale price.
Fixed income securities purchased with a remaining maturity exceeding 60 days are valued at the evaluated bid price provided by an authorized pricing service or, if an evaluated price is not available, by reference to other securities which are
considered comparable in credit rating, interest rate, due date and other features (generally referred to as “matrix pricing”) or other similar pricing methodologies.
Fixed income securities purchased with a remaining maturity of 60 days or less are valued at amortized cost, provided that the amortized cost value is approximately the same as the fair value of the security valued without the use of amortized cost. Investments in other open-end registered investment companies are valued at their end of day net asset value per share.
The Funds’ portfolio investments are generally valued based on independent market quotations or prices or, if none, “evaluative” or other market based valuations provided by third party pricing services. Pursuant to Rule 2a-5 under the 1940 Act, the Funds’ Board of Trustees (the “Board”) designated AMG Funds LLC (the “Investment Manager”) as the Funds’ Valuation Designee to perform the Funds’ fair value determinations. Such determinations are subject to Board oversight and certain reporting and other requirements intended to ensure that the Board receives the information it needs to oversee the Investment Manager’s fair value determinations.
Under certain circumstances, the value of certain Fund portfolio investments may be based on an evaluation of fair value, pursuant to procedures established by the Investment Manager and under the general supervision of the Board. The Funds may use the fair value of a portfolio investment to calculate its net asset value (“NAV”) in the event that the market quotation, price or market based valuation for the portfolio investment is not readily available or otherwise not determinable pursuant to the Funds’ valuation procedures, if the Investment Manager believes the quotation, price or market based valuation to be unreliable, or in certain other circumstances. When determining the fair value of an investment, the Investment Manager seeks to determine the price that the Funds might reasonably expect to receive from current sale of that portfolio investment in an arms-length transaction. Fair value determinations shall be based upon consideration of all available facts and information, including, but not limited to (i) attributes specific to the investment; (ii) fundamental and analytical data relating to the investment; and (iii) the value of other comparable securities or relevant financial instruments, including derivative securities, traded on other markets or among dealers.
The values assigned to fair value portfolio investments are based on available information and do not necessarily represent amounts that might ultimately be realized in the future, since such amounts depend on future developments inherent in long-term investments. Because of the inherent uncertainty of valuation, those estimated values may differ significantly from the values that would have been used had a ready market for the investments existed, and the differences could be material. The Board will be presented with quarterly reports, as of the most recent quarter end, summarizing all fair value activity, material fair value matters that occurred during the quarter, and all outstanding securities fair valued by the Funds. Additionally, the Board will be presented with an annual report that assesses the adequacy and effectiveness of the Investment Manager’s process for determining the fair value of the Funds’ investments.
With respect to foreign equity securities and certain foreign fixed income securities, securities held in the Funds that can be fair valued by the applicable fair value pricing service are fair valued on each business day provided that each individual price exceeds a pre-established confidence level.
U.S. GAAP defines fair value as the price that a fund would receive to sell an asset or pay to transfer a liability in an orderly transaction between market participants at the measurement date. U.S. GAAP also establishes a framework for measuring fair value, and a three level hierarchy for fair value measurements based upon the transparency of inputs to the valuation of an asset or liability. Inputs may be
24
| | |
| | Notes to Financial Statements (continued) |
observable or unobservable and refer broadly to the assumptions that market participants would use in pricing the asset or liability. Observable inputs reflect the assumptions market participants would use in pricing the asset or liability based on market data obtained from sources independent of the Funds. Unobservable inputs reflect the Funds’ own assumptions about the assumptions that market participants would use in pricing the asset or liability developed based on the best information available in the circumstances. Each investment is assigned a level based upon the observability of the inputs which are significant to the overall valuation.
The three-tier hierarchy of inputs is summarized below:
Level 1 – inputs are quoted prices in active markets for identical investments (e.g., equity securities, open-end investment companies)
Level 2 – other observable inputs (including, but not limited to: quoted prices for similar assets or liabilities in markets that are active, quoted prices for identical or similar assets or liabilities in markets that are not active, inputs other than quoted prices that are observable for the assets or liabilities (such as interest rates, yield curves, volatilities, prepayment speeds, loss severities, credit risks and default rates) or other market corroborated inputs) (e.g., debt securities, government securities, foreign currency exchange contracts, foreign securities utilizing international fair value pricing, fair valued securities with observable inputs)
Level 3 – inputs are significant unobservable inputs (including the Fund’s own assumptions used to determine the fair value of investments) (e.g., fair valued securities with unobservable inputs)
Changes in inputs or methodologies used for valuing investments may result in a transfer in or out of levels within the fair value hierarchy. The inputs or methodologies used for valuing investments may not necessarily be an indication of the risk associated with investing in those investments.
b. SECURITY TRANSACTIONS
Security transactions are accounted for as of trade date. Realized gains and losses on securities sold are determined on the basis of identified cost.
c. INVESTMENT INCOME AND EXPENSES
Dividend income is recorded on the ex-dividend date. Dividends from foreign securities are recorded on the ex-dividend date, and if after the fact, as soon as the Funds become aware of the ex-dividend date, except for Korean securities where dividends are recorded on confirmation date. Interest income, which includes amortization of premium and accretion of discount on debt securities, is accrued as earned. Dividend and interest income on foreign securities is recorded gross of any withholding tax. Non-cash dividends included in dividend income, if any, are reported at the fair market value of the securities received. Other income and expenses are recorded on an accrual basis. Expenses that cannot be directly attributed to a Fund are apportioned among the funds in the Trust and other trusts or funds within the AMG Funds Family of Funds (collectively, the “AMG Funds Family”) based upon their relative average net assets or number of shareholders. Investment income, realized and unrealized capital gains and losses, the common expenses of each Fund, and certain fund level expense reductions, if any, are allocated on a pro-rata basis to each class based on the relative net assets of each class to the total net assets of each Fund.
d. DIVIDENDS AND DISTRIBUTIONS
Fund distributions resulting from either net investment income or realized net capital gains, if any, will normally be declared and paid at least annually in December. Distributions to shareholders are recorded on the ex-dividend date. Distributions are determined in accordance with federal income tax regulations, which may differ from net investment income and net realized capital gains for financial statement purposes (U.S. GAAP). Differences may be permanent or temporary. Permanent differences are reclassified among capital accounts in the financial statements to reflect their tax character. Permanent book and tax basis differences, if any, relating to shareholder distributions will result in reclassifications to paid-in capital. Temporary differences arise when certain items of income, expense and gain or loss are recognized in different periods for financial statement and tax purposes; these differences will reverse at some time in the future. Permanent differences for Yacktman Global are primarily due to passive foreign investment companies. There were no permanent differences for Yacktman Fund, Yacktman Focused and Yacktman Special Opportunities. Temporary differences are primarily due to write-off of outstanding defaulted securities interest for Yacktman Fund and Yacktman Focused, and premium amortization on callable bonds for Yacktman Focused. In addition, temporary differences for each Fund are due to wash sale loss deferrals, and mark-to-market on passive foreign investment companies. Temporary differences also include taxable dividends payable for Yacktman Global.
At June 30, 2024, the aggregate cost for federal income tax purposes approximates the aggregate cost for book purposes. The approximate cost of investments and the aggregate gross unrealized appreciation and depreciation for federal income tax purposes were as follows:
| | | | | | | | | | | | | | | | |
| Fund | | Cost | | | Appreciation | | | Depreciation | | | Net Appreciation | |
| | | | |
Yacktman Fund | | | $5,270,415,359 | | | | $3,241,345,935 | | | | $(193,666,660) | | | | $3,047,679,275 | |
| | | | |
Yacktman Focused | | | 2,418,023,920 | | | | 1,269,547,239 | | | | (110,431,528) | | | | 1,159,115,711 | |
| | | | |
Yacktman Global | | | 148,598,558 | | | | 32,090,639 | | | | (8,546,651) | | | | 23,543,988 | |
| | | | |
Yacktman Special Opportunities | | | 50,374,493 | | | | 13,278,896 | | | | (8,712,351) | | | | 4,566,545 | |
e. FEDERAL TAXES
Each Fund currently qualifies as an investment company and intends to comply with the requirements under Subchapter M of the Internal Revenue Code of 1986, as amended (the “Code”), and to distribute substantially all of its taxable income and gains to its shareholders and to meet certain diversification and income requirements with respect to investment companies. The Investment Manager has analyzed the Funds’ tax positions taken on federal income tax returns for all open tax years (generally, the three prior taxable years), and has concluded that no provision for federal income tax is required in the Funds’ financial statements. Additionally, the Investment Manager is not aware of any tax position for which it is reasonably possible that the total amounts of unrecognized tax benefit/detriment will change materially in the next twelve months.
Furthermore, based on each Fund’s understanding of the tax rules and rates related to income, gains and transactions for the foreign jurisdictions in which it invests, each Fund will provide for foreign taxes, and where appropriate, deferred foreign taxes.
25
| | |
| | Notes to Financial Statements (continued) |
f. CAPITAL LOSS CARRYOVERS AND DEFERRALS
As of December 31, 2023, the Funds had no capital loss carryovers for federal income tax purposes. Should the Funds incur net capital losses for the fiscal year
ended December 31, 2024, such amounts may be used to offset future realized capital gains indefinitely, and retain their character as short-term and/or long-term.
g. CAPITAL STOCK
The Trust’s Amended and Restated Agreement and Declaration of Trust authorizes for each Fund the issuance of an unlimited number of shares of beneficial interest, without par value. Each Fund records sales and repurchases of its capital stock on the trade date.
For the six months ended June 30, 2024 (unaudited) and the fiscal year ended December 31, 2023, the capital stock transactions by class for the Funds were as follows:
| | | | | | | | | | | | | | | | | | | | | | | | | | | | | | | | |
| | | Yacktman Fund | | | | Yacktman Focused | |
| | | June 30, 2024 | | | December 31, 2023 | | | June 30, 2024 | | | December 31, 2023 | |
| | | | | | | | |
| | | Shares | | | | Amount | | | | Shares | | | | Amount | | | | Shares | | | | Amount | | | | Shares | | | | Amount | |
| | | | | | | | |
Class N: | | | | | | | | | | | | | | | | | | | | | | | | | | | | | | | | |
| | | | | | | | |
Shares sold | | | — | | | | — | | | | — | | | | — | | | | 2,552,155 | | | | $53,263,065 | | | | 4,984,313 | | | | $96,043,282 | |
| | | | | | | | |
Shares issued in reinvestment of distributions | | | — | | | | — | | | | — | | | | — | | | | — | | | | — | | | | 3,855,512 | | | | 76,339,138 | |
| | | | | | | | |
Shares redeemed | | | — | | | | — | | | | — | | | | — | | | | (9,264,000) | | | | (192,698,250) | | | | (15,257,857) | | | | (294,725,391) | |
| | | | | | | | | | | | | | | | | | | | | | | | | | | | | | | | |
| | | | | | | | |
Net decrease | | | — | | | | — | | | | — | | | | — | | | | (6,711,845) | | | | $(139,435,185) | | | | (6,418,032) | | | | $(122,342,971) | |
| | | | | | | | | | | | | | | | | | | | | | | | | | | | | | | | |
| | | | | | | | |
Class I: | | | | | | | | | | | | | | | | | | | | | | | | | | | | | | | | |
| | | | | | | | |
Shares sold | | | 13,397,546 | | | | $323,467,835 | | | | 34,457,972 | | | | $767,882,557 | | | | 6,381,941 | | | | $132,623,848 | | | | 13,130,392 | | | | $251,622,460 | |
| | | | | | | | |
Shares issued in reinvestment of distributions | | | — | | | | — | | | | 14,266,780 | | | | 327,850,612 | | | | — | | | | — | | | | 3,901,519 | | | | 76,937,961 | |
| | | | | | | | |
Shares redeemed | | | (36,885,811) | | | | (887,612,652) | | | | (62,958,568) | | | | (1,406,986,529) | | | | (14,419,675) | | | | (299,180,820) | | | | (22,520,182) | | | | (431,320,343) | |
| | | | | | | | | | | | | | | | | | | | | | | | | | | | | | | | |
| | | | | | | | |
Net decrease | | | (23,488,265) | | | | $(564,144,817) | | | | (14,233,816) | | | | $(311,253,360) | | | | (8,037,734) | | | | $(166,556,972) | | | | (5,488,271) | | | | $(102,759,922) | |
| | | | | | | | | | | | | | | | | | | | | | | | | | | | | | | | |
| | | | | | | | | | | | | | | | | | | | | | | | | | | | | | | | |
| | | Yacktman Global | | | | Yacktman Special Opportunities | |
| | | June 30, 2024 | | | December 31, 2023 | | | June 30, 2024 | | | December 31, 2023 | |
| | | | | | | | |
| | | Shares | | | | Amount | | | | Shares | | | | Amount | | | | Shares | | | | Amount | | | | Shares | | | | Amount | |
| | | | | | | | |
Class N: | | | | | | | | | | | | | | | | | | | | | | | | | | | | | | | | |
| | | | | | | | |
Shares sold | | | 22,606 | | | | $356,812 | | | | 98,793 | | | | $1,485,778 | | | | — | | | | — | | | | — | | | | — | |
| | | | | | | | |
Shares issued in reinvestment of distributions | | | — | | | | — | | | | 10,847 | | | | 164,235 | | | | — | | | | — | | | | — | | | | — | |
| | | | | | | | |
Shares redeemed | | | (22,169) | | | | (346,349) | | | | (52,936) | | | | (798,154) | | | | — | | | | — | | | | — | | | | — | |
| | | | | | | | | | | | | | | | | | | | | | | | | | | | | | | | |
| | | | | | | | |
Net increase | | | 437 | | | | $10,463 | | | | 56,704 | | | | $851,859 | | | | — | | | | — | | | | — | | | | — | |
| | | | | | | | | | | | | | | | | | | | | | | | | | | | | | | | |
| | | | | | | | |
Class I: | | | | | | | | | | | | | | | | | | | | | | | | | | | | | | | | |
| | | | | | | | |
Shares sold | | | 368,576 | | | | $5,837,032 | | | | 2,402,734 | | | | $35,786,674 | | | | 146,836 | | | | $1,571,045 | | | | 1,647,292 | | | | $18,841,654 | |
| | | | | | | | |
Shares issued in reinvestment of distributions | | | — | | | | — | | | | 559,170 | | | | 8,482,587 | | | | — | | | | — | | | | 320,890 | | | | 3,380,430 | |
| | | | | | | | |
Shares redeemed | | | (1,652,153) | | | | (26,038,180) | | | | (1,219,771) | | | | (18,250,214) | | | | (1,669,572) | | | | (18,078,773) | | | | (2,507,310) | | | | (27,923,527) | |
| | | | | | | | | | | | | | | | | | | | | | | | | | | | | | | | |
| | | | | | | | |
Net increase (decrease) | | | (1,283,577) | | | | $(20,201,148) | | | | 1,742,133 | | | | $26,019,047 | | | | (1,522,736) | | | | $(16,507,728) | | | | (539,128) | | | | $(5,701,443) | |
| | | | | | | | | | | | | | | | | | | | | | | | | | | | | | | | |
| | | | | | | | |
Class Z: | | | | | | | | | | | | | | | | | | | | | | | | | | | | | | | | |
| | | | | | | | |
Shares sold | | | — | | | | — | | | | — | | | | — | | | | 27,874 | | | | $300,462 | | | | 72,604 | | | | $820,680 | |
| | | | | | | | |
Shares issued in reinvestment of distributions | | | — | | | | — | | | | — | | | | — | | | | — | | | | — | | | | 161,282 | | | | 1,704,410 | |
| | | | | | | | |
Shares redeemed | | | — | | | | — | | | | — | | | | — | | | | (381,839) | | | | (4,145,262) | | | | (281,776) | | | | (3,068,823) | |
| | | | | | | | | | | | | | | | | | | | | | | | | | | | | | | | |
| | | | | | | | |
Net decrease | | | — | | | | — | | | | — | | | | — | | | | (353,965) | | | | $(3,844,800) | | | | (47,890) | | | | $(543,733) | |
| | | | | | | | | | | | | | | | | | | | | | | | | | | | | | | | |
26
| | |
| | Notes to Financial Statements (continued) |
At June 30, 2024, one affiliated investor, Yacktman Asset Management LP, owned 15% of the net assets in Yacktman Special Opportunities. Transactions by shareholders of record that individually or collectively hold greater than 5% of a Fund’s net assets may have a material impact on a Fund.
h. REPURCHASE AGREEMENTS AND JOINT REPURCHASE AGREEMENTS
The Funds may enter into third-party and bilateral repurchase agreements for temporary cash management purposes and for reinvestment of cash collateral on securities lending transactions under the securities lending program offered by The Bank of New York Mellon (“BNYM”) (the “Securities Lending Program”) (collectively, “Repurchase Agreements”). The value of the underlying collateral, including accrued interest, must equal or exceed the value of the Repurchase Agreements during the term of the agreement. For joint repurchase agreements, the Funds participate on a pro rata basis with other clients of BNYM in their share of the underlying collateral under such joint repurchase agreements and in their share of proceeds from any repurchase or other disposition of the underlying collateral. The underlying collateral for all Repurchase Agreements is held by the Funds’ custodian or at the Federal Reserve Bank. If the seller defaults and the value of the collateral declines, or if bankruptcy proceedings commence with respect to the seller of the security, realization of the collateral by the Funds may be delayed or limited. Pursuant to the Securities Lending Program, the Funds are indemnified for such losses by BNYM on joint repurchase agreements.
At June 30, 2024, the market value of Repurchase Agreements outstanding for Yacktman Fund, Yacktman Focused, Yacktman Global and Yacktman Special Opportunities was $208,029,166, $75,724,767, $0 and $826,133, respectively.
i. FOREIGN CURRENCY TRANSLATION
The books and records of the Funds are maintained in U.S. Dollars. The value of investments, assets and liabilities denominated in currencies other than U.S. Dollars are translated into U.S. Dollars based upon current foreign exchange rates. Purchases and sales of foreign investments, income and expenses are converted into U.S. Dollars based on currency exchange rates prevailing on the respective dates of such transactions. Net realized and unrealized gain (loss) on foreign currency transactions represent: (1) foreign exchange gains and losses from the sale and holdings of foreign currencies; (2) gains and losses between trade date and settlement date on investment securities transactions and foreign currency exchange contracts; and (3) gains and losses from the difference between amounts of interest and dividends recorded and the amounts actually received.
The Funds do not isolate the net realized and unrealized gain or loss resulting from changes in exchange rates from the fluctuations in market prices of securities held. Such fluctuations are included with the net realized and unrealized gain or loss on investments.
2. AGREEMENTS AND TRANSACTIONS WITH AFFILIATES
For each of the Funds, the Trust has entered into an investment advisory agreement under which the Investment Manager, a subsidiary and the U.S. wealth platform of Affiliated Managers Group, Inc. (“AMG”), serves as investment manager to the Funds and is responsible for the Funds’ overall administration and operations. The Investment Manager selects and recommends, subject to the approval of the Board and, in certain circumstances, shareholders, the subadviser for the Funds and monitors the subadviser’s investment performance, security holdings and investment strategies. Each Fund’s investment portfolio is managed by Yacktman Asset Management LP (“Yacktman”) who serves as subadviser
pursuant to a subadvisory agreement with the Investment Manager. AMG indirectly owns a majority interest in Yacktman.
Investment management fees are paid directly by the Funds to the Investment Manager based on average daily net assets. For the six months ended June 30, 2024, the Funds’ investment management fees were paid at the following annual rates of each Fund’s respective average daily net assets:
| | | | |
Yacktman Fund | | | | |
| |
on first $500 million | | | 0.52 | % |
| |
next $500 million | | | 0.47 | % |
| |
over $1 billion | | | 0.42 | % |
| |
Yacktman Focused | | | 0.87 | % |
| |
Yacktman Global | | | 0.71 | % |
| |
Yacktman Special Opportunities | | | 1.37 | % |
The fee paid to Yacktman for its services as subadviser is paid out of the fee the Investment Manager receives from each Fund and does not increase the expenses of each Fund.
Yacktman Special Opportunities has a performance-based fee structure that consists of an investment management fee and a performance adjustment (“Performance Adjustment”). The monthly investment management fee is increased or reduced by the Performance Adjustment, based on the Fund’s performance relative to the MSCI ACWI All Cap Index over the then preceding twelve months. The Performance Adjustment for the Fund may not exceed plus or minus 0.75%. For the six months ended June 30, 2024, the Performance Adjustment decreased the management fee by a net amount of $285,110, resulting in an effective management fee rate of 0.95%.
The Investment Manager has contractually agreed, through at least May 1, 2025, to waive management fees and/or pay or reimburse fund expenses in order to limit total annual fund operating expenses after fee waiver and expense reimbursements (exclusive of taxes, interest (including interest incurred in connection with bank and custody overdrafts, and in connection with securities sold short), brokerage commissions and other transaction costs, dividends payable with respect to securities sold short, acquired fund fees and expenses, and extraordinary expenses, as well as shareholder servicing fees and distribution and service (12b-1) fees and, with respect to Yacktman Special Opportunities, investment management fees and administrative fees) of Yacktman Global and Yacktman Special Opportunities to the annual rate of 0.93% and 0.12%, respectively, of each Fund’s average daily net assets (this annual rate or such other annual rate that may be in effect for the applicable Fund or share class from time to time, the “Expense Cap”), subject to later reimbursement by the applicable Fund in certain circumstances.
In general, for a period of up to 36 months after the date any amounts are paid, waived or reimbursed by the Investment Manager, the Investment Manager may recover such amounts from a Fund, provided that such repayment would not cause the Fund’s total annual operating expenses after fee waiver and expense reimbursements (exclusive of the items noted in the parenthetical above) to exceed either (i) the Expense Cap in effect at the time such amounts were paid,
27
| | |
| | Notes to Financial Statements (continued) |
waived or reimbursed, or (ii) the Expense Cap in effect at the time of such repayment by the Fund.
The contractual expense limitation may only be terminated in the event the Investment Manager or a successor ceases to be the investment manager of a Fund or a successor fund, by mutual agreement between the Investment Manager and the Board, or in the event of a Fund’s liquidation (unless the Fund is reorganized or is a party to a merger in which the surviving entity is successor to the accounting and performance information of a Fund).
For the six months ended June 30, 2024, the Investment Manager’s expense reimbursements, and repayments of prior reimbursements by the Funds to the Investment Manager, if any, are as follows:
| | | | |
| | | Expense
Reimbursements | | Repayment of
Prior Reimbursements |
| | |
Yacktman Global | | $33,101 | | — |
| | |
Yacktman Special Opportunities | | 26,250 | | — |
At June 30, 2024, the Funds’ expiration of reimbursements subject to recoupment, if any, is as follows:
| | | | | | | | |
Expiration Period | | Yacktman Global | | | Yacktman Special Opportunities | |
| | |
Less than 1 year | | | $37,561 | | | | $5,456 | |
| | |
1-2 years | | | 58,793 | | | | 53,283 | |
| | |
2-3 years | | | 71,630 | | | | 47,556 | |
| | | | | | | | |
| | |
Total | | | $167,984 | | | | $106,295 | |
| | | | | | | | |
The Investment Manager has agreed to waive a portion of its management fee in consideration of a shareholder servicing rebate that it has received from JPMorgan Distribution Services, Inc., with respect to direct investments in the JPMorgan U.S. Government Money Market Fund, IM Shares by Yacktman Fund and Yacktman Focused. For the six months ended June 30, 2024, the investment management fees for Yacktman Fund and Yacktman Focused were reduced by $47,091 and $16,364, respectively, or less than 0.01% of average daily net assets.
The Trust, on behalf of the Funds, has entered into an amended and restated Administration Agreement under which the Investment Manager serves as the Funds’ administrator (the “Administrator”) and is responsible for certain aspects of managing the Funds’ operations, including administration and shareholder services to each Fund. Each Fund pays a fee to the Administrator at the rate of 0.15% per annum of the Fund’s average daily net assets for this service.
The Funds are distributed by AMG Distributors, Inc. (the “Distributor”), a wholly-owned subsidiary of the Investment Manager. The Distributor serves as the distributor and underwriter for each Fund and is a registered broker-dealer and member of the Financial Industry Regulatory Authority, Inc. (“FINRA”). Shares of each Fund will be continuously offered and will be sold directly to prospective purchasers and through brokers, dealers or other financial intermediaries who have executed selling agreements with the Distributor. Generally, the Distributor bears all or a portion of the expenses of providing services pursuant to the distribution agreement, including the payment of the expenses relating to the distribution of prospectuses for sales purposes and any advertising or sales literature.
For Class N of Yacktman Focused and Yacktman Global and for Class I of Yacktman Fund and Yacktman Special Opportunities, the Board has approved reimbursement payments to the Investment Manager for shareholder servicing expenses (“shareholder servicing fees”) incurred. Shareholder servicing fees include payments to financial intermediaries, such as broker-dealers (including fund supermarket platforms), banks, and trust companies who provide shareholder recordkeeping, account servicing and other services. The Class N shares of Yacktman Focused and Yacktman Global and Class I shares of Yacktman Fund and Yacktman Special Opportunities may reimburse the Investment Manager for the actual amount incurred up to a maximum annual rate of each Class’s average daily net assets as shown in the table below.
The impact on the annualized expense ratios for the six months ended June 30, 2024, was as follows:
| | | | | | | | |
| Fund | | Maximum Annual
Amount
Approved | | | Actual
Amount
Incurred | |
| | |
Yacktman Fund | | | | | | | | |
| | |
Class I | | | 0.20% | | | | 0.08% | |
| | |
Yacktman Focused | | | | | | | | |
| | |
Class N | | | 0.20% | | | | 0.18% | |
| | |
Yacktman Global | | | | | | | | |
| | |
Class N | | | 0.20% | | | | 0.20% | |
| | |
Yacktman Special Opportunities | | | | | | | | |
| | |
Class I | | | 0.10% | | | | 0.10% | |
The Board provides supervision of the affairs of the Trust and other trusts within the AMG Funds Family. The Trustees of the Trust who are not affiliated with the Investment Manager receive an annual retainer and per meeting fees for regular, special and telephonic meetings, and they are reimbursed for out-of-pocket expenses incurred while carrying out their duties as Board members. The Chairman of the Board and the Audit Committee Chair receive additional annual retainers. Certain Trustees and Officers of the Funds are Officers and/or Directors of the Investment Manager, AMG and/or the Distributor.
The Securities and Exchange Commission (the “SEC”) granted an exemptive order that permits certain eligible funds in the AMG Funds Family to lend and borrow money for certain temporary purposes directly to and from other eligible funds in the AMG Funds Family. Participation in this interfund lending program is voluntary for both the borrowing and lending funds, and an interfund loan is only made if it benefits each participating fund. The Administrator manages the program according to procedures approved by the Board, and the Board monitors the operation of the program. An interfund loan must comply with certain conditions set out in the exemptive order, which are designed to assure fairness and protect all participating funds. The interest earned and interest paid on interfund loans are included on the Statement of Operations as interest income and interest expense, respectively. At June 30, 2024, the Funds had no interfund loans outstanding.
The following Funds utilized the interfund loan program during the six months ended June 30, 2024 as follows:
| | | | | | | | | | | | | | | | |
| Fund | | Average
Lent | | | Number
of Days | | | Interest
Earned | | | Average
Interest Rate | |
| | | | |
Yacktman Fund | | $ | 11,501,152 | | | | 15 | | | $ | 29,413 | | | | 6.223% | |
28
| | |
| | Notes to Financial Statements (continued) |
| | | | | | | | | | | | | | | | |
| Fund | | Average
Lent | | | Number
of Days | | | Interest
Earned | | | Average
Interest Rate | |
| | | | |
Yacktman Focused | | | 11,479,542 | | | | 9 | | | | $17,602 | | | | 6.218% | |
| | | | |
Yacktman Global | | | 1,882,018 | | | | 4 | | | | 1,284 | | | | 6.225% | |
| | | | |
Yacktman Special Opportunities | | | 2,465,451 | | | | 2 | | | | 841 | | | | 6.225% | |
| | | | | | | | | | | | | | | | |
| Fund | | Average
Borrowed | | | Number
of Days | | | Interest
Paid | | | Average
Interest Rate | |
| | | | |
Yacktman Special Opportunities | | $ | 2,586,594 | | | | 4 | | | $ | 1,765 | | | | 6.225% | |
3. PURCHASES AND SALES OF SECURITIES
Purchases and sales of securities (excluding short-term securities and U.S. Government Obligations) for the six months ended June 30, 2024, were as follows:
| | | | | | | | |
| | | Long Term Securities | |
| | |
| Fund | | Purchases | | | Sales | |
| | |
Yacktman Fund | | $ | 186,813,900 | | | $ | 674,280,307 | |
| | |
Yacktman Focused | | | 28,996,520 | | | | 275,685,715 | |
| | |
Yacktman Global | | | 4,075,045 | | | | 18,488,569 | |
| | |
Yacktman Special Opportunities | | | 3,605,880 | | | | 18,436,280 | |
The Funds had no purchases or sales of U.S. Government Obligations during the six months ended June 30, 2024.
4. PORTFOLIO SECURITIES LOANED
The Funds participate in the Securities Lending Program providing for the lending of securities to qualified borrowers. Securities lending income includes earnings of such temporary cash investments, plus or minus any rebate to a borrower. These earnings (after any rebate) are then divided between BNYM, as a fee for its services under the Securities Lending Program, and the Funds, according to agreed-upon rates. Collateral on all securities loaned is accepted in cash, U.S. Treasury Obligations or U.S. Government Agency Obligations. Collateral is maintained at a minimum level of 102% (105% in the case of certain foreign securities) of the market value, plus interest, if applicable, of investments on loan. It is the Funds’ policy to obtain additional collateral from or return excess collateral to the borrower by the end of the next business day, following the valuation date of the securities loaned. Therefore, the value of the collateral held may be temporarily less than the value of the securities on loan. Lending securities entails a risk of loss to the Funds if and to the extent that the market value of the securities loaned were to increase and the borrower did not increase the collateral accordingly, and the borrower fails to return the securities. Under the terms of the Securities Lending Program, the Funds are indemnified for such losses by BNYM. Cash collateral is held in separate omnibus accounts managed by BNYM, who is authorized to exclusively enter into joint repurchase agreements for that cash collateral. Securities collateral is held in separate omnibus accounts managed by BNYM and cannot be sold or pledged. BNYM bears the risk of any deficiency in the amount of the cash collateral available for return to the borrower due to any loss on the collateral invested. Loans of securities are terminable at any time and the borrower, after notice, is required to return borrowed securities as soon as practical, which is normally within three business days.
Yacktman Global did not have any securities on loan at June 30, 2024.
The value of securities loaned on positions held, cash collateral and securities collateral received at June 30, 2024, was as follows:
| | | | | | | | | | | | | | | | |
| Fund | | Securities
Loaned | | | Cash
Collateral
Received | | | Securities
Collateral
Received | | | Total
Collateral
Received | |
| | | | |
Yacktman Fund | | | $21,411,643 | | | | $21,459,166 | | | | $396,890 | | | | $21,856,056 | |
| | | | |
Yacktman Focused | | | 25,163,461 | | | | 21,505,767 | | | | 4,137,768 | | | | 25,643,535 | |
| | | | |
Yacktman Special Opportunities | | | 801,158 | | | | 826,133 | | | | — | | | | 826,133 | |
The following table summarizes the securities received as collateral for securities lending at June 30, 2024:
| | | | | | | | |
| Fund | | Collateral Type | | Coupon
Range | | Maturity Date
Range | |
| | | |
Yacktman Fund | | U.S. Treasury Obligations | | 0.125%-5.250% | | | 10/15/24-05/15/52 | |
| | | |
Yacktman Focused | | U.S. Treasury Obligations | | 0.125%-5.250% | | | 10/15/24-05/15/52 | |
5. FUND RISKS
In the normal course of business, the Funds invest in securities or other instruments and may enter into certain transactions, and such activities subject the Funds to various risks. Below is a summary of some, but not all, of those risks. Each risk described below does not necessarily apply to each Fund. Please refer to each Fund’s prospectus for a description of the principal risks associated with investing in a particular Fund. The value of securities or other instruments may also be affected by various factors, including, without limitation: (i) the general economy; (ii) the overall market as well as local, regional or global political and/or social instability; or (iii) currency and price fluctuations.
Market Risk: Market prices of investments held by the Funds may fall rapidly or unpredictably due to a variety of factors, including economic, political, or market conditions, or other factors including terrorism, war, natural disasters and the spread of infectious illness or other public health issues, including epidemics or pandemics, or in response to events that affect particular industries or companies.
Management Risk: Because the Funds are actively managed investment portfolios, security selection or focus on securities in a particular style, market sector or group of companies may cause the Funds to incur losses or underperform relative to their benchmarks or other funds with a similar investment objective. There can be no guarantee that Yacktman’s investment techniques and risk analysis will produce the desired result.
Non-Diversified Fund Risk: Certain Funds are non-diversified and therefore a greater percentage of holdings may be focused in a small number of issuers or a single issuer, which can place the Funds at greater risk. Notwithstanding the Funds’ status as a “non-diversified” investment company under the 1940 Act, the Funds intend to qualify as a regulated investment company accorded favorable tax treatment under the Code, which imposes its own diversification requirements that are less restrictive than the requirements applicable to “diversified” investment companies under the 1940 Act. The Funds’ intention to qualify as a regulated investment company may limit their pursuit of their investment strategy and their investment strategy could limit their ability to so qualify.
29
| | |
| | Notes to Financial Statements (continued) |
Large-Capitalization Stock Risk: The stocks of large capitalization companies are generally more mature and may not be able to reach the same levels of growth as the stocks of small-, mid-, or micro capitalization companies.
Value Stock Risk: Value stocks may perform differently from the market as a whole and may be undervalued by the market for a long period of time.
Small-, Mid- and Micro- Capitalization Stock Risk: The stocks of small-,mid-, and micro- capitalization companies often have greater price volatility, lower trading volume, and less liquidity than the stocks of larger, more established companies.
Liquidity Risk: The Funds may not be able to dispose of particular investments, such as illiquid securities, readily at favorable times or prices or the Funds may have to sell them at a loss.
Sector Risk: Issuers and companies that are in similar industry sectors may be similarly affected by particular economic or market events; to the extent the Funds have substantial holdings within a particular sector, the risks associated with that sector increase.
Foreign Investment Risk: Investments in foreign issuers involve additional risks (such as risks arising from less frequent trading, changes in political or social conditions, and less publicly available information about non-U.S. issuers) that differ from those associated with investments in U.S. issuers and may result in greater price volatility.
Emerging Markets Risk: Investments in emerging markets are subject to the general risks of foreign investments, as well as additional risks which can result in greater price volatility. Such additional risks include the risk that markets in emerging market countries are typically less developed and less liquid than markets in developed countries and such markets are subjected to increased economic, political, or regulatory uncertainties.
Currency Risk: Fluctuations in exchange rates may affect the total loss or gain on a non-U.S. dollar investment when converted back to U.S. dollars and exposure to non-U.S. currencies may subject certain Funds to the risk that those currencies will decline in value relative to the U.S. dollar.
Geographic Focus Risk: To the extent a Fund focuses its investments in a particular country, group of countries or geographic region, the Fund is particularly susceptible to economic, political, regulatory or other events or conditions affecting such countries or region, and the Fund’s NAV may be more volatile than the NAV of a more geographically diversified fund and may result in losses.
Risks Associated with Investment in South Korea: Investments in South Korean issuers will subject a Fund to legal, regulatory, political, currency, security, and economic risks that are specific to South Korea. In addition, economic and political developments of South Korea’s neighbors, including escalated tensions involving North Korea and any outbreak of hostilities involving North Korea, or the threat of an outbreak of such hostilities, may have a severe adverse effect on the South Korean economy. The South Korean economy is reliant on trading exports, and disruptions or decreases in trade activity could lead to declines in South Korea’s economic growth potential.
Focused Investment Risk: To the extent a Fund invests a substantial portion of its assets in a relatively small number of securities or a particular market, industry, group of industries, country, region, group of countries, asset class or sector, it generally will be subject to greater risk than a fund that invests in a more diverse
investment portfolio. In addition, the value of the Fund would be more susceptible to any single economic, market, political or regulatory occurrence affecting, for example, that particular market, industry, region or sector.
Political Risk: Changes in the general political and social environment of a country can have substantial effects on the value of investments exposed to that country.
Debt Securities Risk: The value of a debt security changes in response to various factors, including, for example, market related factors, such as changes in interest rates or changes in the actual or perceived ability of an issuer to meet its obligations. Investments in debt securities are subject to, among other risks, credit risk, interest rate risk, extension risk, prepayment risk and liquidity risk.
Credit and Counterparty Risk: The issuer of bonds or other debt securities or a counterparty to a derivatives contract (including over-the-counter counterparties as well as brokers and clearinghouses in respect of exchange-traded and/or cleared products) may be unable or unwilling, or may be perceived as unable or unwilling, to make timely interest, principal or settlement payments or otherwise honor its obligations.
Interest Rate Risk: Fixed coupon payments (cash flows) of bonds and debt securities may become less competitive with the market in periods of rising interest rates and cause bond prices to decline. During periods of increasing interest rates, the Funds may experience high levels of volatility and shareholder redemptions, and may have to sell securities at times when they would otherwise not do so, and at unfavorable prices, which could reduce the returns of the Funds.
High Yield Risk: Below investment grade debt securities and unrated securities of similar credit quality (commonly known as “junk bonds” or “high yield securities”) may be subject to greater levels of interest rate, credit, liquidity, and market risk than higher-rated securities. These securities are considered predominately speculative with respect to the issuer’s continuing ability to make principal and interest payments.
6. COMMITMENTS AND CONTINGENCIES
Under the Trust’s organizational documents, its Trustees and Officers are indemnified against certain liabilities arising out of the performance of their duties to the Trust. In addition, in the normal course of business, the Funds may enter into contracts and agreements that contain a variety of representations and warranties, which provide general indemnifications. The maximum exposure to the Funds under these arrangements is unknown, as this would involve future claims that may be made against a Fund that have not yet occurred. However, based on experience, the Funds had no prior claims or losses and expect the risks of loss to be remote.
7. OPTIONS
The Funds may purchase and write call options and put options on a variety of underlying securities and instruments, including, but not limited to, specific securities, securities indices, futures contracts and foreign currencies. The Funds purchase or write call and put options to generate income and hedge against losses or lock in gains of underlying portfolio security positions. A call option gives the purchaser the right to buy, and obligates the writer to sell, the underlying security or instrument at the agreed-upon price during the option period. A put option gives the purchaser the right to sell, and obligates the writer to buy, the underlying security or instrument at the agreed-upon price during the option period. Options purchased are recorded as an asset, while options written (sold)
30
| | |
| | Notes to Financial Statements (continued) |
are recorded as liabilities. When a Fund writes options it bears the risk of an unfavorable change in the market value of the instrument underlying the written option. When an option expires, the premium (original option value) is realized as a gain if the option was written or as a loss if the option was purchased. When the exercise of an option results in a cash settlement, the difference between the premium and the settlement proceeds is recognized as realized gain or loss. When
securities are acquired or delivered upon exercise of an option, the acquisition cost or sale proceeds are adjusted by the amount of the premium. When an option is closed, the difference between the premium and the cost to close the position is realized as a gain or loss. The Funds did not hold option contracts during the six months ended June 30, 2024.
8. MASTER NETTING AGREEMENTS
The Funds may enter into master netting agreements with their counterparties for the Securities Lending Program and Repurchase Agreements, which provide the right, in the event of default (including bankruptcy or insolvency) for the non-defaulting party to liquidate the collateral and calculate net exposure to the defaulting party or request additional collateral. For financial reporting purposes, the Funds do not offset financial assets and financial liabilities that are subject to master netting agreements in the Statement of Assets and Liabilities. For securities lending transactions, see Note 4.
The following table is a summary of the Funds’ open Repurchase Agreements that are subject to a master netting agreement as of June 30, 2024:
| | | | | | | | | | | | | | | | | | | | | | | | | |
| | | | | | | |
| Gross Amount Not Offset in the
Statement of Assets and Liabilities |
| | | | | | | | | | |
| | | | | |
Fund | | |
| Gross Amounts of
Assets Presented in
the Statement of
Assets and Liabilities |
| | |
| Offset
Amount |
| | |
| Net
Asset Balance |
| | |
| Collateral
Received |
| | |
| Net
Amount |
|
| | | | | |
Yacktman Fund | | | | | | | | | | | | | | | | | | | | | | | | | |
| | | | | |
Bethesda Securities LLC | | | | $5,364,590 | | | | | — | | | | | $5,364,590 | | | | | $5,364,590 | | | | | — | |
| | | | | |
CF Secured, LLC | | | | 543,940 | | | | | — | | | | | 543,940 | | | | | 543,940 | | | | | — | |
| | | | | |
Santander U.S. Capital Markets LLC | | | | 550,636 | | | | | — | | | | | 550,636 | | | | | 550,636 | | | | | — | |
| | | | | |
State of Wisconsin Investment
Board | | | | 15,000,000 | | | | | — | | | | | 15,000,000 | | | | | 15,000,000 | | | | | — | |
| | | | | |
Fixed Income Clearing Corp. | | | | 186,570,000 | | | | | — | | | | | 186,570,000 | | | | | 186,570,000 | | | | | — | |
| | | | | | | | | | | | | | | | | | | | | | | | | |
| | | | | |
Total | | | | $208,029,166 | | | | | — | | | | | $208,029,166 | | | | | $208,029,166 | | | | | — | |
| | | | | | | | | | | | | | | | | | | | | | | | | |
| | | | | |
Yacktman Focused | | | | | | | | | | | | | | | | | | | | | | | | | |
| | | | | |
Bethesda Securities LLC | | | | $5,376,238 | | | | | — | | | | | $5,376,238 | | | | | $5,376,238 | | | | | — | |
| | | | | |
CF Secured, LLC | | | | 4,802,410 | | | | | — | | | | | 4,802,410 | | | | | 4,802,410 | | | | | — | |
| | | | | |
Santander U.S. Capital Markets LLC | | | | 552,214 | | | | | — | | | | | 552,214 | | | | | 552,214 | | | | | — | |
| | | | | |
State of Wisconsin Investment
Board | | | | 10,774,905 | | | | | — | | | | | 10,774,905 | | | | | 10,774,905 | | | | | — | |
| | | | | |
Fixed Income Clearing Corp. | | | | 54,219,000 | | | | | — | | | | | 54,219,000 | | | | | 54,219,000 | | | | | — | |
| | | | | | | | | | | | | | | | | | | | | | | | | |
| | | | | |
Total | | | | $75,724,767 | | | | | — | | | | | $75,724,767 | | | | | $75,724,767 | | | | | — | |
| | | | | | | | | | | | | | | | | | | | | | | | | |
| | | | | |
Yacktman Special Opportunities | | | | | | | | | | | | | | | | | | | | | | | | | |
| | | | | |
Bethesda Securities LLC | | | | $826,133 | | | | | — | | | | | $826,133 | | | | | $826,133 | | | | | — | |
9. SUBSEQUENT EVENTS
The Funds have determined that no material events or transactions occurred through the issuance date of the Funds’ financial statements which require an additional disclosure in or adjustment of the Funds’ financial statements.
31
| | |
| | Other Information (unaudited) |
ITEM 8. CHANGES IN AND DISAGREEMENTS WITH ACCOUNTANTS FOR OPEN-END MANAGEMENT INVESTMENT COMPANIES
During the six months ended June 30, 2024, there were no changes in and/or disagreements with accountants.
ITEM 9. PROXY DISCLOSURES FOR OPEN-END MANAGEMENT INVESTMENT COMPANIES
Not applicable.
ITEM 10. REMUNERATION PAID TO DIRECTORS, OFFICERS, AND OTHERS OF OPEN-END MANAGEMENT INVESTMENT COMPANIES
The remuneration paid to the Trustees during the six months ended June 30, 2024, is reflected as “Trustee fees and expenses” on the Statement of Operations and is set forth in the table below. There was no remuneration paid to any Fund officer or to any affiliated person of any Fund Trustee or officer during the six months ended June 30, 2024.
| | | | |
| | | Trustee fees and expenses | |
| |
AMG Yacktman Fund | | | $314,792 | |
| |
AMG Yacktman Focused Fund | | | 137,538 | |
| |
AMG Yacktman Global Fund | | | 6,943 | |
| |
AMG Yacktman Special Opportunities Fund | | | 2,709 | |
32
| | |
| | ITEM 11. STATEMENT REGARDING BASIS FOR APPROVAL OF INVESTMENT ADVISORY CONTRACT |
| | | | | | | | |
AMG Yacktman Focused Fund, AMG Yacktman Fund, AMG Yacktman Global Fund, and AMG Yacktman Special Opportunities Fund: Approval of Investment Management Agreement and Subadvisory Agreements on June 12, 2024 At an in-person meeting held on June 12, 2024, the Board of Trustees (the “Board” or the “Trustees”), and separately a majority of the Trustees who are not “interested persons” of AMG Funds (the “Trust”) (the “Independent Trustees”), approved (i) the Investment Management Agreement, as amended pursuant to letter agreements at any time prior to the date of the meeting, with AMG Funds LLC (the “Investment Manager”) for each of AMG Yacktman Focused Fund, AMG Yacktman Fund, AMG Yacktman Global Fund, and AMG Yacktman Special Opportunities Fund (each, a “Fund,” and collectively, the “Funds”) and separately each of Amendment No. 1 thereto dated July 1, 2015, and Amendment No. 2 thereto dated October 1, 2016 (collectively, the “Investment Management Agreement”); and (ii) the Subadvisory Agreement with respect to each Fund, as amended at any time prior to the date of the meeting (collectively, the “Subadvisory Agreements”), with Yacktman Asset Management LP, the Funds’ subadviser (the “Subadviser”). The Independent Trustees were separately represented by independent legal counsel in connection with their consideration of the approval of these agreements. In considering the Investment Management Agreement and the Subadvisory Agreements, the Trustees reviewed a variety of materials relating to the Funds, the Investment Manager and the Subadviser, including the nature, extent and quality of services, comparative performance, fee and expense information for an appropriate peer group of similar mutual funds for each Fund (each, a “Peer Group”), performance information for the relevant benchmark index for each Fund (each, a “Fund Benchmark”), other relevant matters, including management fees, the profitability of the Investment Manager and the Subadviser, and the potential for economies of scale that may be shared with the Funds, and other information provided to them on a periodic basis throughout the year. Prior to voting, the Independent Trustees: (a) reviewed the foregoing information with their independent legal counsel; (b) received materials from their independent legal counsel discussing the legal standards applicable to their consideration of the Investment Management Agreement and Subadvisory Agreements; and (c) met with their independent legal counsel in private sessions at which no representatives of management were present. | | | | NATURE, EXTENT AND QUALITY OF SERVICES In considering the nature, extent and quality of the services provided by the Investment Manager, the Trustees reviewed information provided by the Investment Manager at the June 12, 2024 meeting and prior meetings relating to the Investment Manager’s operations and personnel. Among other things, the Investment Manager provided financial information, information about its supervisory and professional staff and descriptions of its organizational and management structure. The Trustees also took into account information provided periodically throughout the previous year by the Investment Manager in Board meetings relating to the performance of its duties with respect to the Funds and the Trustees’ knowledge of the Investment Manager’s management and the quality of the performance of the Investment Manager’s duties under the Investment Management Agreement and Administration Agreement. In the course of their deliberations regarding the Investment Manager, the Trustees evaluated, among other things: (a) the extent and quality of the Investment Manager’s oversight of the operation and management of the Funds; (b) the quality of the Investment Manager’s oversight of the performance by the Subadviser of its portfolio management duties; (c) the Investment Manager’s ability to supervise the Funds’ other service providers; and (d) the Investment Manager’s compliance program. The Trustees also took into account that, in performing its functions under the Investment Management Agreement and supervising the Subadviser, the Investment Manager: performs periodic detailed analyses and reviews of the performance by the Subadviser of its obligations to each Fund, including without limitation, analysis and review of portfolio and other compliance matters and review of the Subadviser’s investment performance with respect to each Fund; prepares and presents periodic reports to the Board regarding the investment performance of the Subadviser and other information regarding the Subadviser, at such times and in such forms as the Board may reasonably request; reviews and considers any changes in the personnel of the Subadviser responsible for performing the Subadviser’s obligations and makes appropriate reports to the Board; reviews and considers any changes in the ownership or senior management of the Subadviser and makes appropriate reports to the Board; performs periodic in-person, telephonic or videoconference diligence meetings, including with respect to compliance matters, with representatives of the Subadviser; | | | | assists the Board and management of the Trust in developing and reviewing information with respect to the initial approval of each Subadvisory Agreement and annual consideration of each Subadvisory Agreement thereafter; prepares recommendations with respect to the continued retention of the Subadviser or the replacement of the Subadviser, including at the request of the Board; identifies potential successors to, or replacements of, the Subadviser or potential additional subadvisers, including performing appropriate due diligence, and developing and presenting to the Board a recommendation as to any such successor, replacement, or additional subadviser, including at the request of the Board; designates and compensates from its own resources such personnel as the Investment Manager may consider necessary or appropriate to the performance of its services; and performs such other review and reporting functions as the Board shall reasonably request consistent with the Investment Management Agreement and applicable law. The Trustees noted the affiliation of the Subadviser with the Investment Manager, noting any potential conflicts of interest. The Trustees also took into account the financial condition of the Investment Manager with respect to its ability to provide the services required under the Investment Management Agreement and the Investment Manager’s undertaking to maintain contractual expense limitations for AMG Yacktman Special Opportunities Fund and AMG Yacktman Global Fund. The Trustees also considered the Investment Manager’s risk management processes. The Trustees also reviewed information relating to the Subadviser’s operations and personnel and the investment philosophy, strategies and techniques (its “Investment Strategy”) used in managing each Fund. Among other things, the Trustees reviewed information on portfolio management and other professional staff, information regarding the Subadviser’s organizational and management structure and the Subadviser’s brokerage policies and practices. The Trustees considered specific information provided regarding the experience of the individuals at the Subadviser with portfolio management responsibility for each Fund, including the information set forth in the Fund’s prospectus and statement of additional information. In the course of their deliberations, the Trustees evaluated, among other things: (a) the services rendered by the Subadviser in the past; (b) the qualifications and experience of the Subadviser’s personnel; and (c) the |
33
| | |
| | ITEM 11. STATEMENT REGARDING BASIS FOR APPROVAL OF INVESTMENT ADVISORY CONTRACT (continued) |
| | | | | | | | |
Subadviser’s compliance program. The Trustees also took into account the financial condition of the Subadviser with respect to its ability to provide the services required under each Subadvisory Agreement. The Trustees also considered the Subadviser’s risk management processes. PERFORMANCE The Board considered each Fund’s net performance during relevant time periods as compared to the Fund’s Peer Group and Fund Benchmark and noted that the Board reviews on a quarterly basis detailed information about both the Fund’s performance results and portfolio composition, as well as the Subadviser’s Investment Strategy. The Board was mindful of the Investment Manager’s expertise, resources and attention to monitoring the Subadviser’s performance, investment style and risk-adjusted performance with respect to the Funds and its discussions with the management of the Funds’ subadviser during the period regarding the factors that contributed to the performance of the Funds. With respect to AMG Yacktman Focused Fund, among other information relating to the Fund’s performance, the Trustees noted that the Fund’s performance for Class N shares (which share class has the earliest inception date of all the share classes of the Fund) for the 1-year, 3-year, 5-year and 10-year periods ended March 31, 2024, was above, below, above, and above, respectively, the median performance of the Peer Group and above, below, above, and above, respectively, the performance of the Fund Benchmark, the Russell 1000 Value Index. The Trustees took into account management’s discussion of the Fund’s performance, including the reasons for the Fund’s more recent and longer-term outperformance and the fact that the Fund ranked in the top quintile relative to its Peer Group for the 10-year period. The Trustees concluded that the Fund’s overall performance has been satisfactory. With respect to AMG Yacktman Fund, among other information relating to the Fund’s performance, the Trustees noted that the Fund’s performance for Class I shares (the Fund’s sole share class) for the 1-year, 3-year, 5-year and 10-year periods ended March 31, 2024 was above, below, above, and above, respectively, the median performance of the Peer Group and above, below, above, and above, respectively, the performance of the Fund Benchmark, the Russell 1000 Value Index. The Trustees took into account management’s discussion of the Fund’s performance, including the reasons for the Fund’s more recent and longer-term | | | | outperformance and the fact that the Fund ranked in the top quartile relative to its Peer Group for the 10-year period. The Trustees concluded that the Fund’s overall performance has been satisfactory. With respect to AMG Yacktman Global Fund, among other information relating to the Fund’s performance, the Trustees noted that the Fund’s performance for Class I shares (which share class has the largest amount of assets of all the share classes of the Fund) for the 1-year, 3-year, and 5-year periods ended March 31, 2024 and for the period from the Fund’s inception on January 30, 2017 through March 31, 2024 was above, below, above, and above, respectively, the median performance of the Peer Group and below, below, below, and above, respectively, the performance of the Fund Benchmark, the MSCI World Index. The Trustees took into account management’s discussion of the Fund’s performance, including the reasons for the Fund’s more recent underperformance relative to the Fund Benchmark. The Trustees noted that Class I shares of the Fund ranked in the top percentile relative to its Peer Group for the period from inception through March 31, 2024, in the top quintile relative to its Peer Group for the 5-year period, and in the top third relative to its Peer Group for the 1-year period. The Trustees also took into account the fact that the Fund’s investment strategy and Fund Benchmark changed effective July 1, 2021, and that the performance information prior to that date reflected that of the Fund’s prior investment strategy. The Trustees concluded that the Fund’s overall performance has been satisfactory in light of the Fund’s investment objective, strategies and policies. With respect to AMG Yacktman Special Opportunities Fund, among other information relating to the Fund’s performance, the Trustees noted that the Fund’s performance for Class Z shares (which share class has the earliest inception date of all the share classes of the Fund) for the 1-year, 3-year, and 5-year periods ended March 31, 2024 and for the period from the Class Z shares’ inception on June 30, 2014 through March 31, 2024, was below, below, below, and above, respectively, the median performance of the Peer Group and below the performance of the Fund Benchmark, the MSCI ACWI All Cap Index. The Trustees took into account management’s discussion of the Fund’s performance, including the reasons for the Fund’s underperformance relative to the Peer Group and Fund Benchmark. The Trustees noted that Class Z shares of the Fund ranked in the top decile relative to its Peer Group for the period from inception through March 31, 2024. The Trustees | | | | concluded that the Fund’s overall performance has been satisfactory in light of the Fund’s investment objective, strategies and policies. ADVISORY AND SUBADVISORY FEES; FUND EXPENSES; PROFITABILITY; AND ECONOMIES OF SCALE In considering the reasonableness of the advisory fee payable to the Investment Manager, the Trustees reviewed information provided by the Investment Manager at the June 12, 2024 meeting and prior meetings setting forth all revenues and other benefits, both direct and indirect (including any so-called “fallout benefits” such as reputational value derived from the Investment Manager serving as Investment Manager to a Fund), received by the Investment Manager and its affiliates attributable to managing each Fund and all the mutual funds in the AMG Funds Family of Funds; the cost of providing such services; the significant risks undertaken as Investment Manager and sponsor of the Funds, including investment, operational, enterprise, entrepreneurial, litigation, regulatory and compliance risks; and the resulting profitability to the Investment Manager and its affiliates from these relationships. The Trustees also considered the amount of the advisory fee retained by the Investment Manager after payment of the subadvisory fee with respect to each Fund. The Trustees also noted payments are made from the Subadviser to the Investment Manager, and other payments are made from the Investment Manager to the Subadviser. The Trustees also considered management’s discussion of the current asset levels of the Funds, and the impact on profitability of both the current asset levels and any future growth of assets of the Funds. In considering the cost of services to be provided by the Investment Manager under the Investment Management Agreement and the profitability to the Investment Manager of its relationship with each Fund, the Trustees noted the undertaking by the Investment Manager to maintain contractual expense limitations for AMG Yacktman Special Opportunities Fund and AMG Yacktman Global Fund. The Board also took into account management’s discussion of the advisory fee structure, and the services the Investment Manager provides in performing its functions under the Investment Management Agreement and supervising the Subadviser. Based on the foregoing, the Trustees concluded that the profitability to the Investment Manager is reasonable and that the Investment Manager is not realizing material benefits from economies of scale that would warrant adjustments to the advisory fee at this time. Also with respect to |
34
| | |
| | ITEM 11. STATEMENT REGARDING BASIS FOR APPROVAL OF INVESTMENT ADVISORY CONTRACT (continued) |
| | | | | | | | |
economies of scale, the Trustees noted that as each Fund’s assets increase over time, the Fund may realize other economies of scale to the extent the increase in assets is proportionally greater than the increase in certain other expenses. In considering the reasonableness of the subadvisory fees payable by the Investment Manager to the Subadviser, the Trustees reviewed information regarding the cost to the Subadviser of providing subadvisory services to each Fund and the resulting profitability from the relationships. The Trustees noted that, because the Subadviser is an affiliate of the Investment Manager, a portion of the Subadviser’s revenues or profits might be shared directly or indirectly with the Investment Manager. The Trustees also noted that the subadvisory fees are paid by the Investment Manager out of its advisory fee. The Board also took into account management’s discussion of the subadvisory fee structure, and the services the Subadviser provides in performing its functions under each Subadvisory Agreement and the differences in, among other things, portfolio composition, cash holdings, security holdings, strategy and diversification among the Funds. Based on the foregoing, the Trustees concluded that the profitability to the Subadviser is reasonable and that the Subadviser is not realizing material benefits from economies of scale that would warrant adjustments to the subadvisory fees at this time. Also, with respect to economies of scale, the Trustees noted that as a Fund’s assets increase over time, the Fund may realize other economies of scale to the extent the increase in assets is proportionally greater than the increase in certain other expenses. With respect to AMG Yacktman Focused Fund, the Trustees noted that the management fees (which include both the advisory and administration fees) and total expenses of Class I shares (the class of shares which is the primary focus of the Fund’s distribution) of the Fund as of March 31, 2024, were both rated in the High rating level of the Fund’s Peer Group. The Trustees noted that the rating level corresponded to the Fund’s quintile ranking in its Peer Group. The Trustees also took into account management’s discussion of the Fund’s expenses and competitiveness with comparably sized funds and select competitors, as well as the Fund’s non-diversified, flexible investment approach. The Trustees concluded that, in light of the nature, extent and quality of the services provided by the | | | | Investment Manager and the Subadviser (which is an affiliate of the Investment Manager) and the considerations noted above with respect to the Investment Manager and the Subadviser, the Fund’s advisory and subadvisory fees are reasonable. With respect to AMG Yacktman Fund, the Trustees noted that the Fund’s management fees (which include both the advisory and administration fees) and total expenses as of March 31, 2024, were both rated in the Average rating level of the Fund’s Peer Group. The Trustees noted that the rating level corresponded to the Fund’s quintile ranking in its Peer Group. The Trustees concluded that, in light of the nature, extent and quality of the services provided by the Investment Manager and the Subadviser (which is an affiliate of the Investment Manager), and the considerations noted above with respect to the Investment Manager and the Subadviser, the Fund’s advisory and subadvisory fees are reasonable. With respect to AMG Yacktman Global Fund, the Trustees noted that the management fees (which include both the advisory and administration fees) and total expenses (net of applicable expense waivers/reimbursements) of Class I shares (the class of shares which is the primary focus of the Fund’s distribution) of the Fund as of March 31, 2024, were both rated in the Above Average rating level of the Fund’s Peer Group. The Trustees noted that the rating level corresponded to the Fund’s quintile ranking in its Peer Group. The Trustees took into account the fact that the Investment Manager has contractually agreed, through May 1, 2025, to limit the Fund’s net annual operating expenses (subject to certain excluded expenses) to 0.93%. The Trustees also took into account management’s discussion of the Fund’s expenses and competitiveness with comparably sized funds and select competitors. The Trustees concluded that, in light of the nature, extent and quality of the services provided by the Investment Manager and the Subadviser (which is an affiliate of the Investment Manager), the foregoing expense limitation and the considerations noted above with respect to the Investment Manager and the Subadviser, the Fund’s advisory and subadvisory fees are reasonable. With respect to AMG Yacktman Special Opportunities Fund, the Trustees noted that the management fees (which include both the advisory and administration fees) and total expenses (net of applicable expense | | | | waivers/reimbursements) of Class I shares (the class of shares which is the primary focus of the Fund’s distribution) of the Fund as of March 31, 2024, were both rated in the High rating level of the Fund’s Peer Group. The Trustees noted that the rating level corresponded to the Fund’s quintile ranking in its Peer Group. The Trustees took into account the fact that the Investment Manager has contractually agreed, through May 1, 2025, to limit the Fund’s net annual operating expenses (subject to certain excluded expenses) to 0.12%. The Trustees also took into account management’s discussion of the Fund’s expenses relative to comparably sized funds and select competitors, as well as the performance adjustment component of the Fund’s management fee. The Trustees concluded that, in light of the nature, extent and quality of the services provided by the Investment Manager and the Subadviser (which is an affiliate of the Investment Manager), the foregoing expense limitation and the considerations noted above with respect to the Investment Manager and the Subadviser, the Fund’s advisory and subadvisory fees are reasonable. * * * * After consideration of the foregoing, the Trustees also reached the following conclusions (in addition to the conclusions discussed above) regarding the Investment Management Agreement and Subadvisory Agreements: (a) the Investment Manager and the Subadviser have demonstrated that they possess the capability and resources to perform the duties required of them under the Investment Management Agreement and each Subadvisory Agreement and (b) the Investment Manager and Subadviser maintain appropriate compliance programs. Based on all of the above-mentioned factors and their related conclusions, with no single factor or conclusion being determinative and with each Trustee not necessarily attributing the same weight to each factor, the Trustees concluded that approval of the Investment Management Agreement and each Subadvisory Agreement would be in the best interests of the applicable Fund and its shareholders. Accordingly, on June 12, 2024, the Trustees, and separately a majority of the Independent Trustees, voted to approve the Investment Management and the Subadvisory Agreements for each Fund. |
35
THIS PAGE INTENTIONALLY LEFT BLANK
| | |
| | |
| | | | |
INVESTMENT MANAGER AND ADMINISTRATOR AMG Funds LLC 680 Washington Blvd., Suite 500 Stamford, CT 06901 800.548.4539 DISTRIBUTOR AMG Distributors, Inc. 680 Washington Blvd., Suite 500 Stamford, CT 06901 800.548.4539 SUBADVISER Yacktman Asset Management LP 6300 Bridgepoint Parkway Building One, Suite 500 Austin, TX 78730 CUSTODIAN The Bank of New York Mellon Mutual Funds Custody 240 Greenwich Street New York, NY 10286 | | LEGAL COUNSEL Ropes & Gray LLP Prudential Tower, 800 Boylston Street Boston, MA 02199-3600 TRANSFER AGENT BNY Mellon Investment Servicing (US) Inc. AMG Funds Attn: 534426 AIM 154-0520 500 Ross Street Pittsburgh, PA 15262 800.548.4539 TRUSTEES Jill R. Cuniff Kurt A. Keilhacker Peter W. MacEwen Steven J. Paggioli Eric Rakowski Victoria L. Sassine Garret W. Weston | | This report is prepared for the Funds’ shareholders. It is authorized for distribution to prospective investors only when preceded or accompanied by an effective prospectus. To receive a free copy of the prospectus or Statement of Additional Information, which includes additional information about Fund Trustees, please contact us by calling 800.548.4539. Distributed by AMG Distributors, Inc., member FINRA/SIPC. Current net asset values per share for each Fund are available on the Funds’ website at wealth.amg.com. A description of the policies and procedures each Fund uses to vote its proxies is available: (i) without charge, upon request, by calling 800.548.4539, or (ii) on the Securities and Exchange Commission’s (SEC) website at sec.gov. For information regarding the Funds’ proxy voting record for the 12-month period ended June 30, call 800.548.4539 or visit the SEC website at sec.gov. The Funds file their complete schedule of portfolio holdings with the SEC for the first and third quarters of each fiscal year as an exhibit to their reports on Form N-PORT. The Funds’ portfolio holdings on Form N-PORT are available on the SEC’s website at sec.gov and the Funds’ website at wealth.amg.com. To review a complete list of the Funds’ portfolio holdings, or to view the most recent semi-annual report or annual report, please visit wealth.amg.com. |
| | |
| | |
| | | | | | | | |
EQUITY FUNDS AMG Boston Common Global Impact Boston Common Asset Management, LLC AMG Frontier Small Cap Growth Frontier Capital Management Co., LLC AMG GW&K Small Cap Core AMG GW&K Small Cap Value AMG GW&K Small/Mid Cap Core AMG GW&K Small/Mid Cap Growth AMG GW&K International Small Cap GW&K Investment Management, LLC AMG Montrusco Bolton Large Cap Growth Montrusco Bolton Investments, Inc. AMG Renaissance Large Cap Growth The Renaissance Group LLC | | | | | | AMG River Road Dividend All Cap Value AMG River Road Focused Absolute Value AMG River Road Large Cap Value Select AMG River Road Mid Cap Value AMG River Road Small-Mid Cap Value AMG River Road Small Cap Value River Road Asset Management, LLC AMG TimesSquare Emerging Markets Small Cap AMG TimesSquare Global Small Cap AMG TimesSquare International Small Cap AMG TimesSquare Mid Cap Growth AMG TimesSquare Small Cap Growth TimesSquare Capital Management, LLC AMG Veritas Asia Pacific AMG Veritas China AMG Veritas Global Focus AMG Veritas Global Real Return Veritas Asset Management LLP AMG Yacktman AMG Yacktman Focused AMG Yacktman Global AMG Yacktman Special Opportunities Yacktman Asset Management LP | | FIXED INCOME FUNDS AMG Beutel Goodman Core Plus Bond Beutel, Goodman & Company Ltd. AMG GW&K Core Bond ESG AMG GW&K ESG Bond AMG GW&K Municipal Bond AMG GW&K Municipal Enhanced Yield GW&K Investment Management, LLC ALTERNATIVE FUNDS AMG Systematica Managed Futures Strategy Systematica Investments Limited, acting as general partner of Systematica Investments LP |
| | | | |
| | | | | |
| | | |
| wealth.amg.com | | 063024 | | SAR071 |
| | |
| | SEMI-ANNUAL REPORT |
| | | | | | |
| | | AMG Funds |
| | | | |
| | | June 30, 2024 | | | | |
| | |
| | | |
| | |
| | | AMG GW&K Municipal Enhanced SMA Shares |
| | | | |
| | | Ticker: MESHX | | | | |
| | | | | | | |
| | | | | | | |
| | | | | | | |
| | | | | | | |
| | | | |
| | | | | |
| | | |
| wealth.amg.com | | 063024 | | SAR090 |
| | |
| | | |
| | | AMG Funds Semi-Annual Report — June 30, 2024 (unaudited) |
| | | | | | |
| | Nothing contained herein is to be considered an offer, sale or solicitation of an offer to buy shares of any series of the AMG Funds Family of Funds. Such offering is made only by prospectus, which includes details as to offering price and other material information. | | | | |
| | |
| | AMG GW&K Municipal Enhanced SMA Shares Schedule of Portfolio Investments (unaudited) June 30, 2024 |
| | | | | | | | |
| | | Principal
Amount | | | Value | |
| |
Municipal Bonds - 94.5% | | | | | |
| |
Alabama - 3.6% | | | | | |
| | |
County of Jefferson Sewer Revenue
5.500%, 10/01/53 | | | $4,750,000 | | | | $5,140,494 | |
| | |
California - 1.9% | | | | | | | | |
| | |
California Municipal Finance Authority,
5.000%, 05/15/43 | | | 485,000 | | | | 497,869 | |
5.000%, 05/15/48 | | | 795,000 | | | | 809,317 | |
| | |
California Municipal Finance Authority, Series A
4.000%, 02/01/51 | | | 240,000 | | | | 217,336 | |
| | |
Riverside County Transportation Commission, Series B1
4.000%, 06/01/46 | | | 420,000 | | | | 403,040 | |
| | |
Riverside County Transportation Commission, Series C
4.000%, 06/01/47 | | | 555,000 | | | | 529,970 | |
| | |
San Diego County Regional Airport Authority, Series B
4.000%, 07/01/51 | | | 325,000 | | | | 303,931 | |
| | |
Total California | | | | | | | 2,761,463 | |
| | |
Colorado - 2.5% | | | | | | | | |
| | |
Colorado Health Facilities Authority, Series A,
5.000%, 08/01/44 | | | 930,000 | | | | 957,598 | |
5.250%, 12/01/54 | | | 1,000,000 | | | | 1,077,998 | |
| | |
Public Authority for Colorado Energy Natural Gas Purchase Revenue
6.500%, 11/15/38 | | | 1,275,000 | | | | 1,562,491 | |
| | |
Total Colorado | | | | | | | 3,598,087 | |
| | |
Connecticut - 0.9% | | | | | | | | |
| | |
Connecticut State Health & Educational Facilities Authority,
4.000%, 07/01/39 | | | 485,000 | | | | 475,361 | |
4.000%, 07/01/40 | | | 555,000 | | | | 535,213 | |
4.000%, 07/01/42 | | | 285,000 | | | | 266,767 | |
| | |
Total Connecticut | | | | | | | 1,277,341 | |
| | |
Florida - 11.7% | | | | | | | | |
| | |
Brevard County Health Facilities Authority, Series A
5.000%, 04/01/47 | | | 1,185,000 | | | | 1,240,658 | |
| | |
City of Tampa, Series B
5.000%, 07/01/50 | | | 495,000 | | | | 509,295 | |
| | |
County of Miami-Dade Florida Seaport Department, Series 1, (AGM)
4.000%, 10/01/45 | | | 2,265,000 | | | | 2,113,421 | |
| | |
County of Miami-Dade Florida Seaport Department, Series A
5.250%, 10/01/52 | | | 365,000 | | | | 385,653 | |
| | |
County of Miami-Dade Florida Water & Sewer System
4.000%, 10/01/48 | | | 1,675,000 | | | | 1,623,140 | |
| | | | | | | | |
| | | Principal
Amount | | | Value | |
| | |
Escambia County Health Facilities Authority
4.000%, 08/15/50 | | | $985,000 | | | | $867,514 | |
| | |
Florida Development Finance Corp.,
4.000%, 02/01/52 | | | 485,000 | | | | 367,714 | |
5.000%, 02/01/52 | | | 325,000 | | | | 309,566 | |
5.250%, 08/01/55 | | | 1,750,000 | | | | 1,827,045 | |
| | |
Florida Housing Finance Corp., Series 3, (GNMA FNMA FHLMC)
4.750%, 07/01/54 | | | 3,500,000 | | | | 3,500,860 | |
| | |
Hillsborough County Industrial Development Authority
4.000%, 08/01/50 | | | 815,000 | | | | 732,417 | |
| | |
Miami Beach Health Facilities Authority,
4.000%, 11/15/46 | | | 2,370,000 | | | | 2,250,194 | |
4.000%, 11/15/51 | | | 1,250,000 | | | | 1,166,664 | |
| | |
Total Florida | | | | | | | 16,894,141 | |
| | |
Georgia - 1.0% | | | | | | | | |
| | |
Columbia County Hospital Authority,
Series A 5.750%, 04/01/53 | | | 1,250,000 | | | | 1,396,814 | |
| | |
Illinois - 6.0% | | | | | | | | |
| | |
Chicago O’Hare International Airport, Senior Lien, Series A
5.000%, 01/01/48 | | | 1,100,000 | | | | 1,112,860 | |
| | |
Metropolitan Pier & Exposition Authority,
4.000%, 12/15/42 | | | 325,000 | | | | 320,264 | |
4.000%, 06/15/52 | | | 485,000 | | | | 448,794 | |
5.000%, 06/15/50 | | | 815,000 | | | | 842,216 | |
| | |
State of Illinois,
5.500%, 05/01/39 | | | 650,000 | | | | 711,537 | |
5.750%, 05/01/45 | | | 485,000 | | | | 526,760 | |
| | |
State of Illinois, Series A,
4.000%, 03/01/40 | | | 1,240,000 | | | | 1,202,328 | |
5.000%, 03/01/46 | | | 355,000 | | | | 370,165 | |
| | |
State of Illinois, Series B,
5.250%, 05/01/48 | | | 1,000,000 | | | | 1,081,626 | |
5.250%, 05/01/49 | | | 1,000,000 | | | | 1,079,085 | |
5.500%, 05/01/47 | | | 815,000 | | | | 886,847 | |
| | |
Total Illinois | | | | | | | 8,582,482 | |
| | |
Louisiana - 2.0% | | | | | | | | |
| | |
Louisiana Stadium & Exposition District, Series A 5.250%, 07/01/53 | | | 2,615,000 | | | | 2,821,282 | |
| | |
Massachusetts - 2.8% | | | | | | | | |
| | |
Massachusetts Development Finance Agency, 4.000%, 07/01/51 | | | 970,000 | | | | 817,848 | |
5.250%, 07/01/52 | | | 3,040,000 | | | | 3,246,571 | |
| | |
Total Massachusetts | | | | | | | 4,064,419 | |
| | |
Michigan - 1.8% | | | | | | | | |
| | |
Great Lakes Water Authority Water Supply System Revenue, Series B
5.250%, 07/01/53 | | | 2,405,000 | | | | 2,644,698 | |
The accompanying notes are an integral part of these financial statements.
2
| | |
| | AMG GW&K Municipal Enhanced SMA Shares Schedule of Portfolio Investments (continued) |
| | | | | | | | |
| | | Principal
Amount | | | Value | |
| | |
Minnesota - 1.2% | | | | | | | | |
| | |
Duluth Economic Development Authority, Series A
5.000%, 02/15/48 | | | $410,000 | | | | $414,592 | |
| | |
Minnesota Agricultural & Economic Development Board, Series 2024
5.250%, 01/01/54 | | | 1,250,000 | | | | 1,348,219 | |
| | |
Total Minnesota | | | | | | | 1,762,811 | |
| | |
Missouri - 1.0% | | | | | | | | |
| | |
Health & Educational Facilities Authority of the State of Missouri
4.000%, 06/01/53 | | | 1,500,000 | | | | 1,431,279 | |
| | |
Nebraska - 0.8% | | | | | | | | |
| | |
Central Plains Energy Project #3, Series A
5.000%, 09/01/42 | | | 1,025,000 | | | | 1,114,313 | |
| | |
New Jersey - 5.8% | | | | | | | | |
| | |
New Jersey Economic Development Authority, Series QQQ,
4.000%, 06/15/46 | | | 240,000 | | | | 234,588 | |
4.000%, 06/15/50 | | | 400,000 | | | | 382,085 | |
| | |
New Jersey Transportation Trust Fund Authority
5.250%, 06/15/46 | | | 325,000 | | | | 355,665 | |
| | |
New Jersey Transportation Trust Fund Authority, Series AA,
4.000%, 06/15/45 | | | 340,000 | | | | 328,983 | |
4.000%, 06/15/50 | | | 325,000 | | | | 309,465 | |
5.000%, 06/15/50 | | | 240,000 | | | | 252,028 | |
| | |
New Jersey Transportation Trust Fund Authority, Series BB
5.250%, 06/15/50 | | | 2,000,000 | | | | 2,185,698 | |
| | |
South Jersey Transportation Authority,
4.625%, 11/01/47 | | | 2,070,000 | | | | 2,109,100 | |
5.250%, 11/01/52 | | | 820,000 | | | | 871,648 | |
| | |
Tobacco Settlement Financing Corp., Series A,
5.000%, 06/01/46 | | | 405,000 | | | | 413,640 | |
5.250%, 06/01/46 | | | 530,000 | | | | 547,952 | |
| | |
Tobacco Settlement Financing Corp., Series B
5.000%, 06/01/46 | | | 290,000 | | | | 292,653 | |
| | |
Total New Jersey | | | | | | | 8,283,505 | |
| | |
New York - 14.4% | | | | | | | | |
| | |
City of New York, Series C
4.125%, 03/01/54 | | | 1,000,000 | | | | 984,459 | |
| | |
Metropolitan Transportation Authority, Series
1, 4.750%, 11/15/45 | | | 3,625,000 | | | | 3,719,888 | |
5.000%, 11/15/50 | | | 1,000,000 | | | | 1,041,546 | |
5.250%, 11/15/55 | | | 490,000 | | | | 515,372 | |
| | |
New York City Transitional Finance Authority Future Tax Secured, Series 1
5.000%, 05/01/48 | | | 1,000,000 | | | | 1,081,521 | |
| | |
New York State Dormitory Authority
5.000%, 05/01/52 | | | 485,000 | | | | 508,639 | |
| | | | | | | | |
| | | Principal
Amount | | | Value | |
| | |
New York State Dormitory Authority, Series A,
4.000%, 07/01/47 | | | $550,000 | | | | $527,474 | |
4.000%, 07/01/52 | | | 340,000 | | | | 318,731 | |
| | |
New York State Thruway Authority, Series B
4.000%, 01/01/45 | | | 325,000 | | | | 316,102 | |
| | |
New York State Urban Development Corp., Series A
4.000%, 03/15/48 | | | 1,175,000 | | | | 1,135,662 | |
| | |
New York Transportation Development Corp.,
4.000%, 12/01/39 | | | 295,000 | | | | 295,163 | |
4.000%, 04/30/53 | | | 1,125,000 | | | | 933,597 | |
5.000%, 12/01/40 | | | 845,000 | | | | 888,765 | |
5.000%, 12/01/41 | | | 815,000 | | | | 853,759 | |
5.500%, 06/30/54 | | | 1,000,000 | | | | 1,059,938 | |
5.625%, 04/01/40 | | | 1,000,000 | | | | 1,087,418 | |
6.000%, 04/01/35 | | | 500,000 | | | | 565,112 | |
6.000%, 06/30/54 | | | 2,500,000 | | | | 2,745,573 | |
| | |
New York Transportation Development Corp. (AGM)
5.000%, 06/30/49 | | | 1,110,000 | | | | 1,150,533 | |
| | |
Suffolk Regional Off-Track Betting Co.
6.000%, 12/01/53 | | | 1,000,000 | | | | 1,042,304 | |
| | |
Total New York | | | | | | | 20,771,556 | |
| |
North Carolina - 2.6% | | | | | |
| | |
North Carolina Turnpike Authority, Series A, (AGM)
5.000%, 01/01/58 | | | 3,500,000 | | | | 3,696,081 | |
| |
Ohio - 1.0% | | | | | |
| | |
Ohio Housing Finance Agency, Series A, (GNMA FNMA FHLMC) 4.550%, 09/01/49 | | | 1,500,000 | | | | 1,505,300 | |
| |
Pennsylvania - 7.9% | | | | | |
| | |
Allegheny County Airport Authority, Series A
5.000%, 01/01/51 | | | 815,000 | | | | 839,446 | |
| | |
Geisinger Authority
4.000%, 04/01/50 | | | 1,340,000 | | | | 1,264,400 | |
| | |
Montgomery County Higher Education and Health Authority, Series B
5.000%, 05/01/52 | | | 770,000 | | | | 795,094 | |
| | |
Pennsylvania Economic Development Financing Authority
5.250%, 06/30/53 | | | 2,185,000 | | | | 2,266,711 | |
| | |
Pennsylvania Economic Development Financing Authority, (AGM)
5.000%, 12/31/57 | | | 3,980,000 | | | | 4,107,781 | |
| | |
Pennsylvania Turnpike Commission, Series A
4.000%, 12/01/50 | | | 1,135,000 | | | | 1,062,475 | |
| | |
Philadelphia Authority for Industrial Development
5.250%, 11/01/52 | | | 1,010,000 | | | | 1,059,041 | |
| | |
Total Pennsylvania | | | | | | | 11,394,948 | |
The accompanying notes are an integral part of these financial statements.
3
| | |
| | AMG GW&K Municipal Enhanced SMA Shares Schedule of Portfolio Investments (continued) |
| | | | | | | | |
| | | Principal
Amount | | | Value | |
| |
Rhode Island - 4.4% | | | | | |
| | |
Rhode Island Health and Educational Building Corp.,
5.000%, 11/01/53 | | | $1,020,000 | | | | $1,081,049 | |
5.250%, 05/15/54 | | | 4,500,000 | | | | 4,775,165 | |
| | |
Tobacco Settlement Financing Corp., Series A
5.000%, 06/01/40 | | | 530,000 | | | | 532,929 | |
| | |
Total Rhode Island | | | | | | | 6,389,143 | |
| |
South Carolina - 2.4% | | | | | |
| | |
Richland County School District No 2, Series A, (South Carolina School District)
1.875%, 03/01/38 | | | 1,600,000 | | | | 1,174,058 | |
| | |
South Carolina Jobs-Economic Development Authority, Series A
5.500%, 11/01/54 | | | 2,000,000 | | | | 2,220,124 | |
| | |
Total South Carolina | | | | | | | 3,394,182 | |
| |
Tennessee - 3.7% | | | | | |
| | |
City of Chattanooga Electric
2.000%, 09/01/40 | | | 1,400,000 | | | | 993,959 | |
| | |
Knox County Health Educational & Housing Facility Board, Series 1, (BAM)
5.125%, 07/01/59 | | | 1,545,000 | | | | 1,618,542 | |
| | |
Knox County Health Educational & Housing Facility Board, Series A1, (BAM)
5.250%, 07/01/49 | | | 1,000,000 | | | | 1,071,158 | |
5.500%, 07/01/59 | | | 1,000,000 | | | | 1,082,832 | |
| | |
Metropolitan Government Nashville & Davidson County Health & Educational Facilities
5.250%, 05/01/53 | | | 520,000 | | | | 552,965 | |
| | |
Total Tennessee | | | | | | | 5,319,456 | |
| |
Texas - 7.8% | | | | | |
| | |
Central Texas Regional Mobility Authority, Series B,
4.000%, 01/01/51 | | | 2,000,000 | | | | 1,907,706 | |
5.000%, 01/01/45 | | | 1,590,000 | | | | 1,666,554 | |
| | |
City of Houston Airport System, Series A
4.000%, 07/01/48 | | | 240,000 | | | | 225,226 | |
| | |
Lower Colorado River Authority 5.000%, 05/15/51 | | | 1,365,000 | | | | 1,446,143 | |
| | |
Texas Private Activity Bond Surface Transportation Corp.,
5.000%, 06/30/58 | | | 4,050,000 | | | | 4,130,606 | |
5.500%, 12/31/58 | | | 650,000 | | | | 704,704 | |
| 1 | Security exempt from registration under Rule 144A of the Securities Act of 1933. This security may be resold in transactions exempt from registration, normally to qualified institutional buyers. At June 30, 2024, the value of this security amounted to $1,265,139 or 0.9% of net assets. |
| | |
| AGM | | Assured Guaranty Municipal Corp. |
| | | | | | | | |
| | | Principal
Amount | | | Value | |
| | |
Texas Private Activity Bond Surface Transportation Corp., Series A 4.000%, 12/31/39 | | | $1,180,000 | | | | $1,174,645 | |
| | |
Total Texas | | | | | | | 11,255,584 | |
| | |
Virginia - 3.8% | | | | | | | | |
| | |
Lynchburg Economic Development Authority 4.000%, 01/01/55 | | | 240,000 | | | | 224,112 | |
| | |
Virginia Small Business Financing Authority, 4.000%, 01/01/39 | | | 485,000 | | | | 479,232 | |
4.000%, 01/01/40 | | | 485,000 | | | | 473,991 | |
5.000%, 12/31/47 | | | 1,755,000 | | | | 1,816,223 | |
5.000%, 12/31/49 | | | 1,905,000 | | | | 1,929,829 | |
5.000%, 12/31/52 | | | 515,000 | | | | 520,706 | |
| | |
Total Virginia | | | | | | | 5,444,093 | |
| | |
Washington - 1.8% | | | | | | | | |
| | |
Washington State Housing Finance Commission, 5.000%, 07/01/54 | | | 1,500,000 | | | | 1,538,346 | |
5.500%, 07/01/49 | | | 1,000,000 | | | | 1,072,392 | |
| | |
Total Washington | | | | | | | 2,610,738 | |
| | |
West Virginia - 0.8% | | | | | | | | |
| | |
West Virginia Hospital Finance Authority, Series B 6.000%, 09/01/53 | | | 1,000,000 | | | | 1,127,827 | |
| | |
Wisconsin - 0.9% | | | | | | | | |
| | |
Public Finance Authority, Series A 5.000%, 06/01/411 | | | 1,250,000 | | | | 1,265,139 | |
| | |
Total Municipal Bonds
(Cost $133,226,783) | | | | | | | 135,947,176 | |
| | |
Short-Term Investments - 4.0% | | | | | | | | |
| |
Repurchase Agreements - 4.0% | | | | | |
| | |
Fixed Income Clearing Corp., dated 06/28/24, due 07/01/24, 5.150% total to be received $5,770,475 (collateralized by a U.S. Treasury Note, 0.125%, 04/15/25, totaling $5,883,419) | | | 5,768,000 | | | | 5,768,000 | |
| | |
Total Short-Term Investments
(Cost $5,768,000) | | | | | | | 5,768,000 | |
| |
Total Investments - 98.5%
(Cost $138,994,783) | | | | 141,715,176 | |
| |
Other Assets, less Liabilities - 1.5% | | | | 2,110,442 | |
| | |
Net Assets - 100.0% | | | | | | | $143,825,618 | |
| | |
| BAM | | Build America Mutual Assurance Co. |
| |
| FHLMC | | Freddie Mac |
| |
| FNMA | | Fannie Mae |
| |
| GNMA | | Ginnie Mae |
The accompanying notes are an integral part of these financial statements.
4
| | |
| | AMG GW&K Municipal Enhanced SMA Shares Schedule of Portfolio Investments (continued) |
The following table summarizes the inputs used to value the Fund’s investments by the fair value hierarchy levels as of June 30, 2024:
| | | | | | | | | | | | | | | | | | | | |
| | | Level 1 | | Level 2 | | Level 3 | | Total |
| | | | |
Investments in Securities | | | | | | | | | | | | | | | | | | | | |
| | | | |
Municipal Bonds† | | | | — | | | | $ | 135,947,176 | | | | | — | | | | $ | 135,947,176 | |
| | | | |
Short-Term Investments | | | | | | | | | | | | | | | | | | | | |
| | | | |
Repurchase Agreements | | | | — | | | | | 5,768,000 | | | | | — | | | | | 5,768,000 | |
| | | | | | | | | | | | | | | | | | | | |
| | | | |
Total Investments in Securities | | | | — | | | | $ | 141,715,176 | | | | | — | | | | $ | 141,715,176 | |
| | | | | | | | | | | | | | | | | | | | |
| | † | All municipal bonds held in the Fund are Level 2 securities. For a detailed breakout of municipal bonds by major classification, please refer to the Fund’s Schedule of Portfolio Investments. |
For the six months ended June 30, 2024, there were no transfers in or out of Level 3.
The accompanying notes are an integral part of these financial statements.
5
| | |
| | Statement of Assets and Liabilities (unaudited) June 30, 2024 |
| | | | | |
| | | AMG
GW&K Municipal
Enhanced SMA Shares |
| |
Assets: | | | | | |
| |
Investments at value1 | | | | $141,715,176 | |
| |
Cash | | | | 685 | |
| |
Receivable for delayed delivery investments sold | | | | 637,605 | |
| |
Interest receivables | | | | 1,910,801 | |
| |
Receivable for Fund shares sold | | | | 187,591 | |
| |
Receivable from affiliate | | | | 9,503 | |
| |
Prepaid expenses and other assets | | | | 9,795 | |
| |
Total assets | | | | 144,471,156 | |
| |
Liabilities: | | | | | |
| |
Payable for delayed delivery investments purchased | | | | 610,890 | |
| |
Accrued expenses: | | | | | |
| |
Other | | | | 34,648 | |
| |
Total liabilities | | | | 645,538 | |
|
Commitments and Contingencies (Notes 2 & 5) | |
| |
Net Assets | | | | $143,825,618 | |
| |
1 Investments at cost | | | | $138,994,783 | |
| |
Net Assets Represent: | | | | | |
| |
Paid-in capital | | | | $140,768,446 | |
| |
Total distributable earnings | | | | 3,057,172 | |
| |
Net Assets | | | | $143,825,618 | |
| |
| | | | | |
| |
Net assets | | | | $143,825,618 | |
| |
Shares outstanding | | | | 13,818,307 | |
| |
Net asset value, offering and redemption price per share | | | | $10.41 | |
The accompanying notes are an integral part of these financial statements.
6
| | |
| | Statement of Operations (unaudited) For the six months ended June 30, 2024 |
| | | | | |
| | | AMG
GW&K Municipal
Enhanced SMA Shares |
| |
Investment Income: | | | | | |
| |
Interest income | | | | $2,798,141 | |
| |
Total investment income | | | | 2,798,141 | |
| |
Expenses: | | | | | |
| |
Professional fees | | | | 21,759 | |
| |
Registration fees | | | | 11,536 | |
| |
Custodian fees | | | | 10,931 | |
| |
Reports to shareholders | | | | 5,099 | |
| |
Trustee fees and expenses | | | | 3,982 | |
| |
Transfer agent fees | | | | 1,408 | |
| |
Miscellaneous | | | | 1,491 | |
| |
Total expenses before offsets | | | | 56,206 | |
| |
Expense reimbursements | | | | (56,206 | ) |
| |
Net expenses | | | | — | |
| | | | | |
| |
Net investment income | | | | 2,798,141 | |
| |
Net Realized and Unrealized Loss: | | | | | |
| |
Net realized gain on investments | | | | 385,419 | |
| |
Net change in unrealized appreciation/depreciation on investments | | | | (1,260,592 | ) |
| |
Net realized and unrealized loss | | | | (875,173 | ) |
| | | | | |
| |
Net increase in net assets resulting from operations | | | | $1,922,968 | |
The accompanying notes are an integral part of these financial statements.
7
| | |
| | Statements of Changes in Net Assets For the six months ended June 30, 2024 (unaudited) and the fiscal period ended December 31, 2023 |
| | | | | | | | | | |
| | | AMG
GW&K Municipal
Enhanced SMA Shares |
| | |
| | | June 30, 2024 | | December 31, 2023 |
| | |
Increase in Net Assets Resulting From Operations: | | | | | | | | | | |
| | |
Net investment income | | | | $2,798,141 | | | | | $2,004,979 | |
| | |
Net realized gain (loss) on investments | | | | 385,419 | | | | | (93,911 | ) |
| | |
Net change in unrealized appreciation/depreciation on investments | | | | (1,260,592 | ) | | | | 3,980,985 | |
| | |
Net increase in net assets resulting from operations | | | | 1,922,968 | | | | | 5,892,053 | |
| | |
Distributions to Shareholders: | | | | (2,832,870 | ) | | | | (1,924,979 | ) |
| | |
Capital Share Transactions:1 | | | | | | | | | | |
| | |
Net increase from capital share transactions | | | | 46,805,210 | | | | | 93,963,236 | |
| | | | | | | | | | |
| | |
Total increase in net assets | | | | 45,895,308 | | | | | 97,930,310 | |
| | |
Net Assets: | | | | | | | | | | |
| | |
Beginning of period | | | | 97,930,310 | | | | | — | |
| | |
End of period | | | | $143,825,618 | | | | | $97,930,310 | |
| 1 | See Note 1(g) of the Notes to Financial Statements. |
The accompanying notes are an integral part of these financial statements.
8
| | |
| | AMG GW&K Municipal Enhanced SMA Shares Financial Highlights For a share outstanding throughout each fiscal period |
| | | | | | | | | | |
| | | | | For the fiscal |
| | | For the six | | period ended |
| | | months ended | | December 31, |
| | | June 30, 2024
(unaudited) | | 20231 |
| | |
Net Asset Value, Beginning of Period | | | | $10.51 | | | | | $10.00 | |
Income (loss) from Investment Operations: | | | | | | | | | | |
| | |
Net investment income2,3 | | | | 0.23 | | | | | 0.38 | |
| | |
Net realized and unrealized gain (loss) on investments | | | | (0.10 | ) | | | | 0.48 | |
| | |
Total income from investment operations | | | | 0.13 | | | | | 0.86 | |
Less Distributions to Shareholders from: | | | | | | | | | | |
| | |
Net investment income | | | | (0.23 | ) | | | | (0.35 | ) |
Net Asset Value, End of Period | | | | $10.41 | | | | | $10.51 | |
Total Return3,4 | | | | 1.27 | %5 | | | | 8.81 | %5 |
| | |
Ratio of net expenses to average net assets | | | | 0.00 | %6 | | | | 0.00 | %6 |
| | |
Ratio of gross expenses to average net assets7 | | | | 0.09 | %6 | | | | 0.20 | %6 |
| | |
Ratio of net investment income to average net assets3 | | | | 4.50 | %6 | | | | 4.55 | %6 |
| | |
Portfolio turnover | | | | 8 | %5 | | | | 12 | %5,8 |
| | |
Net assets end of period (000’s) omitted | | | | $143,826 | | | | | $97,930 | |
| | | | | | | | | | | |
| 1 | Commencement of operations was February 28, 2023. |
| 2 | Per share numbers have been calculated using average shares. |
| 3 | Total returns and net investment income would have been lower had certain expenses not been offset. |
| 4 | The total return is calculated using the published Net Asset Value as of period end. |
| 7 | Excludes the impact of expense reimbursement or fee waivers and expense reductions such as brokerage credits, but includes expense repayments and non-reimbursable expenses, if any, such as interest, taxes, and extraordinary expenses. (See Note 1(c) and 2 in the Notes to Financial Statements.) |
| 8 | Portfolio turnover rate excludes securities received from processing a subscription in-kind. |
9
| | |
| | Notes to Financial Statements (unaudited) June 30, 2024 |
1. ORGANIZATION AND SUMMARY OF SIGNIFICANT ACCOUNTING POLICIES
AMG Funds (the “Trust”) is an open-end management investment company, organized as a Massachusetts business trust, and registered under the Investment Company Act of 1940, as amended (the “1940 Act”). Currently, the Trust consists of a number of different funds, each having distinct investment management objectives, strategies, risks, and policies. Included in this report is AMG GW&K Municipal Enhanced SMA Shares (the “Fund”).
The Fund offers a single class of shares for purchase. Shares of the Fund may be purchased only by or on behalf of separately managed account clients where GW&K Investment Management, LLC (“GW&K”), the Fund’s subadviser, has an agreement with sponsors of separately managed account programs (“Program Sponsors”), or directly with the client, to provide management or advisory services to the managed account or to the Program Sponsor for its use in managing such account.
The Fund’s financial statements are prepared in accordance with accounting principles generally accepted in the United States of America (“U.S. GAAP”), including accounting and reporting guidance pursuant to Accounting Standards Codification Topic 946 applicable to investment companies. U.S. GAAP requires management to make estimates and assumptions that affect the reported amounts of assets and liabilities and disclosure of contingent assets and liabilities at the date of the financial statements and the reported amounts of income and expenses during the reporting period. Actual results could differ from those estimates and such differences could be material. The following is a summary of significant accounting policies followed by the Fund in the preparation of its financial statements:
a. VALUATION OF INVESTMENTS
Fixed income securities purchased with a remaining maturity exceeding 60 days are valued at the evaluated bid price provided by an authorized pricing service or, if an evaluated price is not available, by reference to other securities which are considered comparable in credit rating, interest rate, due date and other features (generally referred to as “matrix pricing”) or other similar pricing methodologies.
Fixed income securities purchased with a remaining maturity of 60 days or less are valued at amortized cost, provided that the amortized cost value is approximately the same as the fair value of the security valued without the use of amortized cost. Investments in other open-end registered investment companies are valued at their end of day net asset value per share.
The Fund’s portfolio investments are generally valued based on independent market quotations or prices or, if none, “evaluative” or other market based valuations provided by third party pricing services. Pursuant to Rule 2a-5 under the 1940 Act, the Fund’s Board of Trustees (the “Board”) designated AMG Funds LLC (the “Investment Manager”) as the Fund’s Valuation Designee to perform the Fund’s fair value determinations. Such determinations are subject to Board oversight and certain reporting and other requirements intended to ensure that the Board receives the information it needs to oversee the Investment Manager’s fair value determinations.
Under certain circumstances, the value of certain Fund portfolio investments may be based on an evaluation of fair value, pursuant to procedures established by the Investment Manager and under the general supervision of the Board. The Fund may use the fair value of a portfolio investment to calculate its net asset value (“NAV”) in the event that the market quotation, price or market based valuation for
the portfolio investment is not readily available or otherwise not determinable pursuant to the Fund’s valuation procedures, if the Investment Manager believes the quotation, price or market based valuation to be unreliable, or in certain other circumstances. When determining the fair value of an investment, the Investment Manager seeks to determine the price that the Fund might reasonably expect to receive from current sale of that portfolio investment in an arms-length transaction. Fair value determinations shall be based upon consideration of all available facts and information, including, but not limited to (i) attributes specific to the investment; (ii) fundamental and analytical data relating to the investment; and (iii) the value of other comparable securities or relevant financial instruments, including derivative securities, traded on other markets or among dealers.
The values assigned to fair value portfolio investments are based on available information and do not necessarily represent amounts that might ultimately be realized in the future, since such amounts depend on future developments inherent in long-term investments. Because of the inherent uncertainty of valuation, those estimated values may differ significantly from the values that would have been used had a ready market for the investments existed, and the differences could be material. The Board will be presented with quarterly reports, as of the most recent quarter end, summarizing all fair value activity, material fair value matters that occurred during the quarter, and all outstanding securities fair valued by the Fund. Additionally, the Board will be presented with an annual report that assesses the adequacy and effectiveness of the Investment Manager’s process for determining the fair value of the Fund’s investments.
U.S. GAAP defines fair value as the price that a fund would receive to sell an asset or pay to transfer a liability in an orderly transaction between market participants at the measurement date. U.S. GAAP also establishes a framework for measuring fair value, and a three level hierarchy for fair value measurements based upon the transparency of inputs to the valuation of an asset or liability. Inputs may be observable or unobservable and refer broadly to the assumptions that market participants would use in pricing the asset or liability. Observable inputs reflect the assumptions market participants would use in pricing the asset or liability based on market data obtained from sources independent of the Fund. Unobservable inputs reflect the Fund’s own assumptions about the assumptions that market participants would use in pricing the asset or liability developed based on the best information available in the circumstances. Each investment is assigned a level based upon the observability of the inputs which are significant to the overall valuation.
The three-tier hierarchy of inputs is summarized below:
Level 1 – inputs are quoted prices in active markets for identical investments (e.g., equity securities, open-end investment companies)
Level 2 – other observable inputs (including, but not limited to: quoted prices for similar assets or liabilities in markets that are active, quoted prices for identical or similar assets or liabilities in markets that are not active, inputs other than quoted prices that are observable for the assets or liabilities (such as interest rates, yield curves, volatilities, prepayment speeds, loss severities, credit risks and default rates) or other market corroborated inputs) (e.g., debt securities, government securities, foreign currency exchange contracts, foreign securities utilizing international fair value pricing, fair valued securities with observable inputs)
Level 3 – inputs are significant unobservable inputs (including the Fund’s own assumptions used to determine the fair value of investments) (e.g., fair valued securities with unobservable inputs)
10
| | |
| | Notes to Financial Statements (continued) |
Changes in inputs or methodologies used for valuing investments may result in a transfer in or out of levels within the fair value hierarchy. The inputs or methodologies used for valuing investments may not necessarily be an indication of the risk associated with investing in those investments.
b. SECURITY TRANSACTIONS
Security transactions are accounted for as of trade date. Realized gains and losses on securities sold are determined on the basis of identified cost.
c. INVESTMENT INCOME AND EXPENSES
Interest income, which includes amortization of premium and accretion of discount on debt securities, is accrued as earned. Dividend income is recorded on the ex-dividend date and other income and expenses are recorded on an accrual basis. Expenses that cannot be directly attributed to the Fund are apportioned among the funds in the Trust and other trusts or funds within the AMG Funds Family of Funds (collectively, the “AMG Funds Family”) based upon their relative average net assets or number of shareholders.
d. DIVIDENDS AND DISTRIBUTIONS
Fund distributions resulting from net investment income, if any, will normally be declared and paid monthly. Fund distributions resulting from net realized capital gains, if any, will normally be declared and paid at least annually in December. Distributions to shareholders are recorded on the ex-dividend date. Distributions are determined in accordance with federal income tax regulations, which may differ from net investment income and net realized capital gains for financial statement purposes (U.S. GAAP). Differences may be permanent or temporary. Permanent differences are reclassified among capital accounts in the financial statements to reflect their tax character. Permanent book and tax basis differences, if any, relating to shareholder distributions will result in reclassifications to paid-in capital. Temporary differences arise when certain items of income, expense and gain or loss are recognized in different periods for financial statement and tax purposes; these differences will reverse at some time in the future. There were no permanent or temporary differences.
At June 30, 2024, the aggregate cost for federal income tax purposes approximates the aggregate cost for book purposes. The approximate cost of investments and the aggregate gross unrealized appreciation and depreciation for federal income tax purposes were as follows:
| | | | | | |
| Cost | | Appreciation | | Depreciation | | Net Appreciation |
| | | |
| $138,994,783 | | $2,961,852 | | $(241,459) | | $2,720,393 |
e. FEDERAL TAXES
The Fund currently qualifies as an investment company and intends to comply with the requirements under Subchapter M of the Internal Revenue Code of 1986, as amended, and to distribute substantially all of its taxable income and gains to its shareholders and to meet certain diversification and income requirements with respect to investment companies. The Investment Manager has analyzed the Fund’s tax positions taken on federal income tax returns for all open tax years (generally, the three prior taxable years), and has concluded that no provision for federal income tax is required in the Fund’s financial statements. Additionally, the Investment Manager is not aware of any tax position for which it is reasonably possible that the total amounts of unrecognized tax benefit/detriment will change materially in the next twelve months.
f. CAPITAL LOSS CARRYOVERS AND DEFERRALS
As of December 31, 2023, the Fund had capital loss carryovers for federal income tax purposes as shown in the following chart. These amounts may be used to offset future realized capital gains indefinitely, and retain their character as short-term and/or long-term.
| | | | | | | | |
| Short-Term | | Long-Term | | | Total | |
$93,911 | | | — | | | | $93,911 | |
g. CAPITAL STOCK
The Trust’s Amended and Restated Agreement and Declaration of Trust authorizes for the Fund the issuance of an unlimited number of shares of beneficial interest, without par value. The Fund records sales and repurchases of its capital stock on the trade date. For the fiscal period ended December 31, 2023, the Fund received securities and cash in connection with subscriptions in-kind transactions in the amount of $46,736,183 from a redemption in-kind from the AMG GW&K Municipal Enhanced Yield Fund, an affiliated fund, and a related party. For the purposes of U.S. GAAP, the transactions were treated as purchases of securities at a cost equal to the market value of the securities on the date of the transfer.
11
| | |
| | Notes to Financial Statements (continued) |
For the six months ended June 30, 2024 (unaudited) and the fiscal period ended December 31, 2023, the capital stock transactions for the Fund were as follows:
| | | | | | | | | | | | | | | | |
| | |
| | | June 30, 2024 | | | December 31, 2023 | |
| | | | |
| | | Shares | | | Amount | | | Shares | | | Amount | |
| | | | |
| | | | | | | | | | | | | | | | |
| | | | |
Shares sold | | | 5,088,603 | | | | $52,987,124 | | | | 9,760,519 | | | | $98,358,593 | 1 |
| | | | |
Shares issued in reinvestment of distributions | | | 157,654 | | | | 1,631,738 | | | | 168,047 | | | | 1,683,854 | |
| | | | |
Shares redeemed | | | (749,084) | | | | (7,813,652) | | | | (607,432) | | | | (6,079,211) | |
| | | | | | | | | | | | | | | | |
| | | | |
Net increase | | | 4,497,173 | | | | $46,805,210 | | | | 9,321,134 | | | | $93,963,236 | |
| | | | | | | | | | | | | | | | |
1 Includes subscriptions in-kind in the amount of $46,736,183.
h. REPURCHASE AGREEMENTS
The Fund may enter into third-party and bilateral repurchase agreements for temporary cash management purposes. The value of the underlying collateral, including accrued interest, must equal or exceed the value of the repurchase agreements during the term of the agreement. The underlying collateral for all repurchase agreements is held by the Fund’s custodian or at the Federal Reserve Bank. If the seller defaults and the value of the collateral declines, or if bankruptcy proceedings commence with respect to the seller of the security, realization of the collateral by the Fund may be delayed or limited.
At June 30, 2024, the market value of repurchase agreements outstanding was $5,768,000.
i. DELAYED DELIVERY TRANSACTIONS AND WHEN-ISSUED SECURITIES
The Fund may enter into securities transactions on a delayed delivery or when issued basis. Payment and delivery may take place after the customary settlement period for that security. The price of the underlying securities and the date when the securities will be delivered and paid for are fixed at the time the transaction is negotiated. During the time a delayed delivery sell is outstanding, the contract is marked to market daily and equivalent deliverable securities are held for the transaction. The value of the securities purchased on a delayed delivery or when-issued basis are identified as such in the Fund’s Schedule of Portfolio Investments. With respect to purchase commitments, the Fund identifies securities as segregated in its records with a value at least equal to the amount of the commitment. Delayed delivery or when-issued securities that have been purchased from and sold to different brokers are reflected as an investment in securities and a forward sale commitment in the Fund’s Statement of Assets and Liabilities. For financial reporting purposes, the Fund does offset the receivable and payable for delayed delivery investments purchased and sold. Losses may arise due to changes in the value of the underlying securities or if the counterparty does not perform under the contract, or if the issuer does not issue the securities due to political, economic, or other factors.
During the six months ended June 30, 2024, the Fund entered into securities transactions on a delayed delivery or when issued basis. At June 30, 2024, there were no delayed delivery or when issued securities held by the Fund.
2. AGREEMENTS AND TRANSACTIONS WITH AFFILIATES
The Trust has entered into an investment advisory agreement under which the Investment Manager, a subsidiary and the U.S. wealth platform of Affiliated Managers Group, Inc. (“AMG”), serves as investment manager to the Fund and is responsible for the Fund’s overall administration and operations. The Investment Manager selects and recommends, subject to the approval of the Board and, in certain circumstances, shareholders, the Fund’s subadviser and monitors the subadviser’s investment performance, security holdings and investment strategies. The Fund’s investment portfolio is managed by GW&K, who serves as subadviser pursuant to a subadvisory agreement with the Investment Manager. AMG indirectly owns a majority interest in GW&K.
The Fund does not pay advisory fees to the Investment Manager or GW&K. Shareholders should be aware, however, that the Fund is an integral part of separately managed account programs, and the Investment Manager or GW&K will be compensated directly or indirectly by Program Sponsors or program participants for managed account advisory services.
The Investment Manager has contractually agreed, through at least May 1, 2025, to waive fees and/or pay or reimburse the Fund’s expenses in order to limit total annual operating expenses (exclusive of taxes, interest (including interest incurred in connection with bank and custody overdrafts and in connection with securities sold short), brokerage commissions and other transaction costs, dividends payable with respect to securities sold short, acquired fund fees and expenses, and extraordinary expenses) of the Fund to the annual rate of 0.00% of the average daily net assets attributable to the Fund. The contractual expense limitation may only be terminated in the event the Investment Manager or a successor ceases to be the investment manager of the Fund or a successor fund, by mutual agreement between the Investment Manager and the Board or in the event of the Fund’s liquidation unless the Fund is reorganized or is a party to a merger in which the surviving entity is successor to the accounting and performance information of the Fund.
For the six months ended June 30, 2024, the Investment Manager reimbursed the Fund $56,206.
The Trust, on behalf of the Fund, has entered into an amended and restated Administration Agreement under which the Investment Manager serves as the Fund’s administrator (the “Administrator”) and is responsible for certain aspects of managing the Fund’s operations, including administration and shareholder services to the Fund. The Fund does not pay administrative fees to the Investment Manager for these services.
12
| | |
| | Notes to Financial Statements (continued) |
The Fund is distributed by AMG Distributors, Inc. (the “Distributor”), a wholly-owned subsidiary of the Investment Manager. The Distributor serves as the distributor and underwriter for the Fund and is a registered broker-dealer and member of the Financial Industry Regulatory Authority, Inc. (“FINRA”). Shares of the Fund may be purchased only by or on behalf of separately managed account clients where GW&K has an agreement with the Program Sponsor (typically, a registered investment adviser or broker-dealer), or directly with the client, to provide management or advisory services to the managed account. Generally, the Distributor bears all or a portion of the expenses of providing services pursuant to the distribution agreement, including the payment of the expenses relating to the distribution of prospectuses for sales purposes and any advertising or sales literature.
The Board provides supervision of the affairs of the Trust and other trusts within the AMG Funds Family. The Trustees of the Trust who are not affiliated with the Investment Manager receive an annual retainer and per meeting fees for regular, special and telephonic meetings, and they are reimbursed for out-of-pocket expenses incurred while carrying out their duties as Board members. The Chairman of the Board and the Audit Committee Chair receive additional annual retainers. Certain Trustees and Officers of the Fund are Officers and/or Directors of the Investment Manager, AMG and/or the Distributor.
The Securities and Exchange Commission (the “SEC”) granted an exemptive order that permits certain eligible funds in the AMG Funds Family to lend and borrow money for certain temporary purposes directly to and from other eligible funds in the AMG Funds Family. Participation in this interfund lending program is voluntary for both the borrowing and lending funds, and an interfund loan is only made if it benefits each participating fund. The Administrator manages the program according to procedures approved by the Board, and the Board monitors the operation of the program. An interfund loan must comply with certain conditions set out in the exemptive order, which are designed to assure fairness and protect all participating funds. The interest earned and interest paid on interfund loans are included on the Statement of Operations as interest income and interest expense, respectively. At June 30, 2024, the Fund had no interfund loans outstanding. The Fund did not borrow during the six months ended June 30, 2024.
The Fund utilized the interfund loan program during the six months ended June 30, 2024 as follows:
| | | | | | |
Average Lent | | Number of Days | | Interest Earned | | Average
Interest Rate |
| | | |
$2,290,437 | | 5 | | $1,953 | | 6.225% |
3. PURCHASES AND SALES OF SECURITIES
Purchases and sales of securities (excluding short-term securities and U.S. Government Obligations) for the six months ended June 30, 2024, were $53,890,532 and $9,245,007, respectively.
The Fund had no purchases or sales of U.S. Government Obligations during the six months ended June 30, 2024.
4. FUND RISKS
In the normal course of business, the Fund invests in securities or other instruments and may enter into certain transactions, and such activities subject the Fund to various risks. The value of securities or other instruments may also be affected by various factors, including, without limitation: (i) the general economy;
(ii) the overall market; or (iii) price fluctuations. Please refer to the Fund’s current prospectus for additional information about the Fund’s principal risks.
Market Risk: Market prices of investments held by the Fund may fall rapidly or unpredictably due to a variety of factors, including economic, political, or market conditions, or other factors including terrorism, war, natural disasters and the spread of infectious illness or other public health issues, including epidemics or pandemics, or in response to events that affect particular industries or companies.
Management Risk: Because the Fund is an actively managed investment portfolio, security selection or focus on securities in a particular style, market sector or group of companies may cause the Fund to incur losses or underperform relative to its benchmarks or other funds with a similar investment objective. There can be no guarantee that GW&K’s investment techniques and risk analysis will produce the desired result.
Municipal Market Risk: Factors unique to the municipal bond market may negatively affect the value of the Fund’s investment in municipal bonds. These factors include political or legislative changes, and uncertainties related to the tax status of the securities and the rights of investors in the securities. The Fund may invest in a group of municipal obligations that are related in such a way that an economic, business, or political development affecting one would also affect the others.
Sector Risk: Issuers and companies that are in similar industry sectors may be similarly affected by particular economic or market events; to the extent the Fund has substantial holdings within a particular sector, the risks associated with that sector increase. A portion of the Fund’s assets may be invested in fixed income securities that would tend to respond similarly to particular economic or political developments or the interest on which is based on revenues or otherwise related to similar types of projects. An example would be securities of issuers whose revenues are paid from similar types of projects, such as health care (including hospitals) or transportation.
Debt Securities Risk: The value of a debt security changes in response to various factors, including, for example, market-related factors, such as changes in interest rates or changes in the actual or perceived ability of an issuer to meet its obligations. Investments in debt securities are subject to, among other risks, credit risk, interest rate risk, extension risk, prepayment risk and liquidity risk.
Interest Rate Risk: Fixed coupon payments (cash flows) of bonds and debt securities may become less competitive with the market in periods of rising interest rates and cause bond prices to decline. During periods of increasing interest rates, the Fund may experience high levels of volatility and shareholder redemptions, and may have to sell securities at times when it would otherwise not do so, and at unfavorable prices, which could reduce the returns of the Fund.
Credit and Counterparty Risk: The issuer of bonds or other debt securities may be unable or unwilling, or may be perceived as unable or unwilling, to make timely interest, principal or settlement payments or otherwise honor its obligations.
Prepayment Risk: A debtor may exercise its right to pay back a bond or other debt security earlier than expected or required during periods of decreasing interest rates.
Extension Risk: During periods of rising interest rates, a debtor may pay back a bond or other fixed income security slower than expected or required, and the value of such security may fall.
13
| | |
| | Notes to Financial Statements (continued) |
Liquidity Risk: The Fund may not be able to dispose of particular investments, such as illiquid securities, readily at favorable times or prices or the Fund may have to sell them at a loss.
High Yield Risk: Below investment grade debt securities and unrated securities of similar credit quality (commonly known as “junk bonds” or “high yield securities”) may be subject to greater levels of interest rate, credit, liquidity, and market risk than higher-rated securities. These securities are considered predominately speculative with respect to the issuer’s continuing ability to make principal and interest payments.
5. COMMITMENTS AND CONTINGENCIES
Under the Trust’s organizational documents, its Trustees and Officers are indemnified against certain liabilities arising out of the performance of their duties to the Trust. In addition, in the normal course of business, the Fund may enter into contracts and agreements that contain a variety of representations and warranties, which provide general indemnifications. The maximum exposure to the Fund under these arrangements is unknown, as this would involve future claims that may be made against the Fund that have not yet occurred. However, based on experience, the Fund had no prior claims or losses and expects the risks of loss to be remote.
6. MASTER NETTING AGREEMENTS
The Fund may enter into master netting agreements with its counterparties for repurchase agreements, which provide the right, in the event of default (including bankruptcy or insolvency) for the non-defaulting party to liquidate the collateral and calculate net exposure to the defaulting party or request additional collateral. For financial reporting purposes, the Fund does not offset financial assets and financial liabilities that are subject to master netting agreements in the Statement of Assets and Liabilities.
The following table is a summary of the Fund’s open Repurchase Agreements that are subject to a master netting agreement as of June 30, 2024:
| | | | | | | | | | | | | | | | |
| | | | | | Gross Amount Not Offset in the
Statement of Assets and Liabilities | | | | | | |
| | | | | |
| | | Gross Amounts of
Assets Presented in
the Statement of
Assets and Liabilities | | | Offset Amount | | Net Asset
Balance | | | Collateral
Received | | | Net
Amount |
| | | | | |
| | | | | | | | | | | | | | | | |
| | | | | |
Fixed Income Clearing Corp. | | | $5,768,000 | | | — | | | $5,768,000 | | | | $5,768,000 | | | — |
7. SUBSEQUENT EVENTS
The Fund has determined that no material events or transactions occurred through the issuance date of the Fund’s financial statements which require an additional disclosure in or adjustment of the Fund’s financial statements.
14
| | |
| | Other Information (unaudited) |
ITEM 8. CHANGES IN AND DISAGREEMENTS WITH ACCOUNTANTS FOR OPEN-END MANAGEMENT INVESTMENT COMPANIES
During the six months ended June 30, 2024, there were no changes in and/or disagreements with accountants.
ITEM 9. PROXY DISCLOSURES FOR OPEN-END MANAGEMENT INVESTMENT COMPANIES
Not applicable.
ITEM 10. REMUNERATION PAID TO DIRECTORS, OFFICERS, AND OTHERS OF OPEN-END MANAGEMENT INVESTMENT COMPANIES
The remuneration paid to the Trustees during the six months ended June 30, 2024, was $3,982, which is reflected as “Trustee fees and expenses” on the Statement of Operations. There was no remuneration paid to any Fund officer or to any affiliated person of any Fund Trustee or officer during the six months ended June 30, 2024.
15
| | |
| | ITEM 11. STATEMENT REGARDING BASIS FOR APPROVAL OF INVESTMENT ADVISORY CONTRACT |
| | | | |
AMG GW&K Municipal Enhanced SMA Shares: Approval of Investment Management Agreement and Subadvisory Agreement on June 12, 2024 At an in-person meeting held on June 12, 2024, the Board of Trustees (the “Board” or the “Trustees”), and separately a majority of the Trustees who are not “interested persons”, of AMG Funds (the “Trust”) (the “Independent Trustees”), approved (i) the Investment Management Agreement, as amended pursuant to letter agreements at any time prior to the date of the meeting, with AMG Funds LLC (the “Investment Manager”) for AMG GW&K Municipal Enhanced SMA Shares (the “Fund”) ( the “Investment Management Agreement”); and (ii) the Subadvisory Agreement, as amended at any time prior to the date of the meeting (the “Subadvisory Agreement”), with GW&K Investment Management, LLC, the Fund’s subadviser (the “Subadviser”). The Independent Trustees were separately represented by independent legal counsel in their consideration of the approval of these agreements. In considering the Investment Management Agreement and Subadvisory Agreement, the Trustees reviewed a variety of materials relating to the Fund, the Investment Manager and the Subadviser, including information regarding the nature, extent and quality of services, comparative performance, fee and expense information for an appropriate peer group of similar mutual funds for the Fund (the “Peer Group”), performance information for the relevant benchmark index for the Fund (the “Fund Benchmark”), other relevant matters, including management fees, the profitability of the Investment Manager and the Subadviser, and the potential for economies of scale that may be shared with the Fund, and other information provided to them on a periodic basis throughout the year. Prior to voting, the Independent Trustees: (a) reviewed the foregoing information with their independent legal counsel; (b) received materials from their independent legal counsel discussing the legal standards applicable to their consideration of the Investment Management Agreement and the Subadvisory Agreement; and (c) met with their independent legal counsel in private sessions at which no representatives of management were present. NATURE, EXTENT AND QUALITY OF SERVICES In considering the nature, extent and quality of the services to be provided by the Investment Manager, the Trustees reviewed information provided by the Investment Manager at the June 12, 2024 meeting and prior meetings relating to the Investment Manager’s operations and personnel. Among other | | things, the Investment Manager provided financial information, information about its supervisory and professional staff and descriptions of its organizational and management structure. The Trustees also took into account information provided periodically throughout the previous year by the Investment Manager in Board meetings relating to the performance of its duties with respect to the Fund and the Trustees’ knowledge of the Investment Manager’s management and the quality of the performance of the Investment Manager’s duties under the Investment Management Agreement and the Administration Agreement. In the course of their deliberations regarding the Investment Manager, the Trustees evaluated, among other things: (a) the extent and quality of the Investment Manager’s oversight of the operation and management of the Fund; (b) the quality of the Investment Manager’s oversight of the performance by the Subadviser of its portfolio management duties; (c) the Investment Manager’s ability to supervise the Fund’s other service providers; and (d) the Investment Manager’s compliance program. The Trustees also took into account that, in performing its functions under the Investment Management Agreement and supervising the Subadviser, the Investment Manager: performs periodic detailed analyses and reviews of the performance by the Subadviser of its obligations to the Fund, including without limitation, analysis and review of portfolio and other compliance matters and review of the Subadviser’s investment performance with respect to the Fund; prepares and presents periodic reports to the Board regarding the investment performance of the Subadviser and other information regarding the Subadviser, at such times and in such forms as the Board may reasonably request; reviews and considers any changes in the personnel of the Subadviser responsible for performing the Subadviser’s obligations and makes appropriate reports to the Board; reviews and considers any changes in the ownership or senior management of the Subadviser and makes appropriate reports to the Board; performs periodic in-person, telephonic or videoconference diligence meetings, including with respect to compliance matters, with representatives of the Subadviser; assists the Board and management of the Trust in developing and reviewing information with respect to the initial approval of the Subadvisory Agreement and annual consideration of the Subadvisory Agreement thereafter; prepares recommendations with respect to the continued retention of the Subadviser or the replacement of Subadviser, including at the request of the Board; identifies potential successors to, or replacements of, the Subadviser or potential additional subadvisers, | | including performing appropriate due diligence, and developing and presenting to the Board a recommendation as to any such successor, replacement, or additional subadviser, including at the request of the Board; designates and compensates from its own resources such personnel as the Investment Manager may consider necessary or appropriate to the performance of its services; and performs such other review and reporting functions as the Board shall reasonably request consistent with the Investment Management Agreement and applicable law. The Trustees noted the affiliation of the Subadviser with the Investment Manager, noting any potential conflicts of interest. The Trustees also took into account the financial condition of the Investment Manager with respect to its ability to provide the services required under the Investment Management Agreement and the Investment Manager’s undertaking to maintain a contractual expense limitation for the Fund. The Trustees also considered the Investment Manager’s risk management processes. The Trustees also reviewed information relating to the Subadviser’s operations and personnel and the investment philosophy, strategies and techniques (its “Investment Strategy”) used in managing the Fund. Among other things, the Trustees reviewed information on portfolio management and other professional staff, information regarding the Subadviser’s organizational and management structure and the Subadviser’s brokerage policies and practices. The Trustees considered specific information provided regarding the experience of the individuals at the Subadviser with portfolio management responsibility for the Fund, including the information set forth in the Fund’s prospectus and statement of additional information. In the course of their deliberations, the Trustees evaluated, among other things: (a) the services rendered by the Subadviser in the past; (b) the qualifications and experience of the Subadviser’s personnel; and (c) the Subadviser’s compliance program. The Trustees also took into account the financial condition of the Subadviser with respect to its ability to provide the services required under the Subadvisory Agreement. The Trustees also considered the Subadviser’s risk management processes. PERFORMANCE The Board considered the Fund’s net performance during relevant time periods as compared to the Fund’s Peer Group and Fund Benchmark, considered the gross performance of the Fund as compared to the Subadviser’s relevant performance composite that utilizes a similar investment strategy and |
16
| | |
| | ITEM 11. STATEMENT REGARDING BASIS FOR APPROVAL OF INVESTMENT ADVISORY CONTRACT (continued) |
| | | | |
approach, and noted that the Board reviews on a quarterly basis detailed information about both the Fund’s performance results and portfolio composition, as well as the Subadviser’s Investment Strategy. The Board was mindful of the Investment Manager’s expertise, resources and attention to monitoring the Subadviser’s performance, investment style and risk-adjusted performance with respect to the Fund and its discussions with the management of the Fund’s subadviser during the period regarding the factors that contributed to the performance of the Fund. Among other information relating to the Fund’s performance, the Trustees noted that the performance of the Fund’s sole share class for the 1-year period and the period from the Fund’s inception on February 28, 2023 through March 31, 2024, was above the median performance of the Peer Group and above the performance of the Fund Benchmark, the Bloomberg U.S. Municipal Bond BAA Index. The Trustees took into account management’s discussion of the Fund’s performance, including the reasons for the Fund’s outperformance and the fact that the Fund ranked in the top quintile relative to the Peer Group for the period from the Fund’s inception through March 31, 2024. The Trustees concluded that the Fund’s overall performance has been satisfactory. ADVISORY AND SUBADVISORY FEES; FUND EXPENSES; PROFITABILITY; AND ECONOMIES OF SCALE The Trustees noted that the Fund pays no advisory fee to the Investment Manager for the services provided under the Investment Management Agreement and that the Investment Manager pays no subadvisory fee to the Subadviser in exchange for the services provided under the Subadvisory Agreement. The Trustees noted that the Fund is an integral part of separately managed account programs, and the Investment Manager or the Subadviser is compensated directly or indirectly by program sponsors or program participants. The Trustees noted that the Investment Manager indirectly benefits from compensation received by the Subadviser because the Investment Manager and the Subadviser are affiliated. The Trustees reviewed information provided by the Investment Manager at the June 12, 2024 meeting and prior meetings setting forth all revenues and other benefits, both direct and indirect (including any so-called “fallout benefits” such as reputational value derived from the Investment Manager serving as | | Investment Manager to the Fund), received by the Investment Manager and its affiliates attributable to managing the Fund and all the mutual funds in the AMG Funds Family of Funds; the cost of providing such services; the significant risks undertaken as Investment Manager and sponsor of the Fund, including investment, operational, enterprise, entrepreneurial, litigation, regulatory and compliance risks; and the resulting profitability to the Investment Manager and its affiliates from these relationships. The Trustees also noted payments made from the Subadviser to the Investment Manager. The Trustees also considered management’s discussion of the current asset level of the Fund, and the impact on profitability of both the current asset level and any future growth of assets of the Fund. In considering the cost of services to be provided by the Investment Manager under the Investment Management Agreement and the profitability to the Investment Manager of its relationship with the Fund, the Trustees noted the undertaking by the Investment Manager to maintain a contractual expense limitation for the Fund. The Board also took into account the services the Investment Manager provides in performing its functions under the Investment Management Agreement and supervising the Subadviser. Based on the foregoing, the Trustees concluded that the profitability to the Investment Manager is reasonable and that the Investment Manager is not realizing material benefits from economies of scale that would warrant adjustments to the advisory fee at this time. The Trustees reviewed information regarding the cost to the Subadviser of providing subadvisory services to the Fund and the resulting profitability from the relationship. The Trustees noted that, because the Subadviser is an affiliate of the Investment Manager, a portion of the Subadviser’s revenues or profits might be shared directly or indirectly with the Investment Manager. The Trustees also noted that the Subadviser would receive no subadvisory fee from the Investment Manager with respect to the Fund, but that it would be separately compensated by program sponsors and program participants. The Trustees also took into account management’s discussion of the services the Subadviser provides in performing its functions under the Subadvisory Agreement. Based on the foregoing, the Trustees concluded that the profitability to the Subadviser is reasonable and that the Subadviser is not realizing material benefits from economies of scale that would warrant adjustments to the subadvisory fees at this time. Also, with | | respect to economies of scale, the Trustees noted that as the Fund’s assets increase over time, the Fund may realize other economies of scale to the extent the increase in assets is proportionally greater than the increase in certain other expenses. The Trustees noted that the Fund’s management fees (which include both the advisory and administration fees) and total expenses (net of applicable expense waivers/reimbursements) as of March 31, 2024, were both rated in the Low rating level of the Fund’s Peer Group. The Trustees noted that the rating level corresponded to the Fund’s quintile ranking in its Peer Group. The Trustees took into account the fact that the Investment Manager has contractually agreed, through May 1, 2025, to limit the Fund’s net annual operating expenses (subject to certain excluded expenses) to 0.00%. The Trustees concluded that, in light of the nature, extent and quality of the services provided by the Investment Manager and the Subadviser (which is an affiliate of the Investment Manager), the foregoing expense limitation and the considerations noted above with respect to the Investment Manager and the Subadviser, the Fund’s advisory and subadvisory fees are reasonable. * * * * After consideration of the foregoing, the Trustees also reached the following conclusions (in addition to the conclusions discussed above) regarding the Investment Management Agreement and the Subadvisory Agreement: (a) the Investment Manager and the Subadviser have demonstrated that they possess the capability and resources to perform the duties required of them under the Investment Management Agreement and the Subadvisory Agreement and (b) the Investment Manager and Subadviser maintain appropriate compliance programs. Based on all of the above-mentioned factors and their related conclusions, with no single factor or conclusion being determinative and with each Trustee not necessarily attributing the same weight to each factor, the Trustees concluded that approval of the Investment Management Agreement and the Subadvisory Agreement would be in the best interests of the Fund and its shareholders. Accordingly, on June 12, 2024, the Trustees, and separately a majority of the Independent Trustees, voted to approve the Investment Management Agreement and the Subadvisory Agreement for the Fund. |
17
| | |
|
| | |
| |
| | | | |
INVESTMENT MANAGER AND ADMINISTRATOR AMG Funds LLC 680 Washington Blvd., Suite 500 Stamford, CT 06901 800.548.4539 DISTRIBUTOR AMG Distributors, Inc. 680 Washington Blvd., Suite 500 Stamford, CT 06901 800.548.4539 SUBADVISER GW&K Investment Management, LLC 222 Berkeley St. Boston, MA 02116 CUSTODIAN The Bank of New York Mellon Mutual Funds Custody 240 Greenwich Street New York, NY 10286 LEGAL COUNSEL Ropes & Gray LLP Prudential Tower, 800 Boylston Street Boston, MA 02199-3600 | | TRANSFER AGENT BNY Mellon Investment Servicing (US) Inc. AMG Funds Attn: 534426 AIM 154-0520 500 Ross Street Pittsburgh, PA 15262 800.548.4539 TRUSTEES Jill R. Cuniff Kurt A. Keilhacker Peter W. MacEwen Steven J. Paggioli Eric Rakowski Victoria L. Sassine Garret W. Weston | | This report is prepared for the Fund’s shareholders. It is authorized for distribution to prospective investors only when preceded or accompanied by an effective prospectus. To receive a free copy of the prospectus or Statement of Additional Information, which includes additional information about Fund Trustees, please contact us by calling 800.548.4539. Distributed by AMG Distributors, Inc., member FINRA/SIPC. Current net asset values per share for the Fund are available on the Fund’s website at wealth.amg.com. A description of the policies and procedures the Fund uses to vote its proxies is available: (i) without charge, upon request, by calling 800.548.4539, or (ii) on the Securities and Exchange Commission’s (SEC) website at sec.gov. For information regarding the Fund’s proxy voting record for the 12-month period ended June 30, call 800.548.4539 or visit the SEC website at sec.gov. The Fund files its complete schedule of portfolio holdings with the SEC for the first and third quarters of each fiscal year as an exhibit to its reports on Form N-PORT. The Fund’s portfolio holdings on Form N-PORT are available on the SEC’s website at sec.gov and the Fund’s website at wealth.amg.com. To review a complete list of the Fund’s portfolio holdings, or to view the most recent semi-annual report or annual report, please visit wealth.amg.com. |
Item 12. DISCLOSURE OF PROXY VOTING POLICIES AND PROCEDURES FOR CLOSED-END MANAGEMENT INVESTMENT COMPANIES.
Not applicable.
Item 13. PORTFOLIO MANAGERS OF CLOSED-END MANAGEMENT INVESTMENT COMPANIES.
Not applicable.
Item 14. PURCHASES OF EQUITY SECURITIES BY CLOSED-END MANAGEMENT INVESTMENT COMPANIES AND AFFILIATED PURCHASERS.
Not applicable.
Item 15. SUBMISSION OF MATTERS TO A VOTE OF SECURITY HOLDERS.
Not applicable.
Item 16. CONTROLS AND PROCEDURES.
(a) The Registrant’s principal executive and principal financial officers have concluded, based on their evaluation of the registrant’s disclosure controls and procedures as of a date within 90 days of the filing of this report, that the Registrant’s disclosure controls and procedures are reasonably designed to ensure that information required to be disclosed by the Registrant on Form N-CSR is recorded, processed, summarized and reported within the required time periods and that information required to be disclosed by the registrant in the reports that it files or submits on Form N-CSR is accumulated and communicated to the Registrant’s management, including its principal executive and principal financial officers, as appropriate to allow timely decisions regarding required disclosure.
(b) There were no changes in the Registrant’s internal control over financial reporting during the period covered by this report that have materially affected, or are reasonably likely to materially affect, the internal control over financial reporting.
Item 17. DISCLOSURE OF SECURITIES LENDING ACTIVITIES FOR CLOSED-END MANAGEMENT INVESTMENT COMPANIES.
Not applicable.
Item 18. RECOVERY OF ERRONEOUSLY AWARDED COMPENSATION.
Not applicable.
Item 19. EXHIBITS
SIGNATURES
Pursuant to the requirements of the Securities Exchange Act of 1934 and the Investment Company Act of 1940, the registrant has duly caused this report to be signed on its behalf by the undersigned, thereunto duly authorized.
| | |
| AMG FUNDS |
| |
| By: | | /s/ Keitha L. Kinne |
| | Keitha L. Kinne, Principal Executive Officer |
|
| Date: September 9, 2024 |
Pursuant to the requirements of the Securities Exchange Act of 1934 and the Investment Company Act of 1940, this report has been signed below by the following persons on behalf of the registrant and in the capacities and on the dates indicated.
| | |
| By: | | /s/ Keitha L. Kinne |
| | Keitha L. Kinne, Principal Executive Officer |
|
| Date: September 9, 2024 |
| |
| By: | | /s/ Thomas Disbrow |
| | Thomas Disbrow, Principal Financial Officer |
|
| Date: September 9, 2024 |