link to searchable text of slide shown above
link to searchable text of slide shown above
link to searchable text of slide shown above

link to searchable text of slide shown above

link to searchable text of slide shown above
link to searchable text of slide shown above
link to searchable text of slide shown above
link to searchable text of slide shown above

link to searchable text of slide shown above
link to searchable text of slide shown above
link to searchable text of slide shown above
link to searchable text of slide shown above
link to searchable text of slide shown above

link to searchable text of slide shown above
link to searchable text of slide shown above

link to searchable text of slide shown above

link to searchable text of slide shown above
GREENVILLE FIRST BANCSHARES, INC.
www.greenvillefirst.com
[LOGO]
Southeast - February 6-7, 2006
Forward-Looking Statements
During the course of this presentation, management may make projections and forward-looking statements regarding events or the future financial performance of Greenville First Bancshares, Inc. We wish to caution you that these forward-looking statements involve certain risks and uncertainties, including a variety of factors that may cause Greenville First's actual results to differ materially from the anticipated results expressed in these forward-looking statements. Investors are cautioned not to place undue reliance on these forward-looking statements and are advised to review the risk factors that may affect Greenville First's operating results in documents filed by Greenville First Bancshares, Inc. with the Securities and Exchange Commission, including the Form SB-2 Registration Statement, the Annual report on Form 10-KSB and other required filings. Greenville First assumes no duty to update the forward-looking statements made in this presentation.
[LOGO]
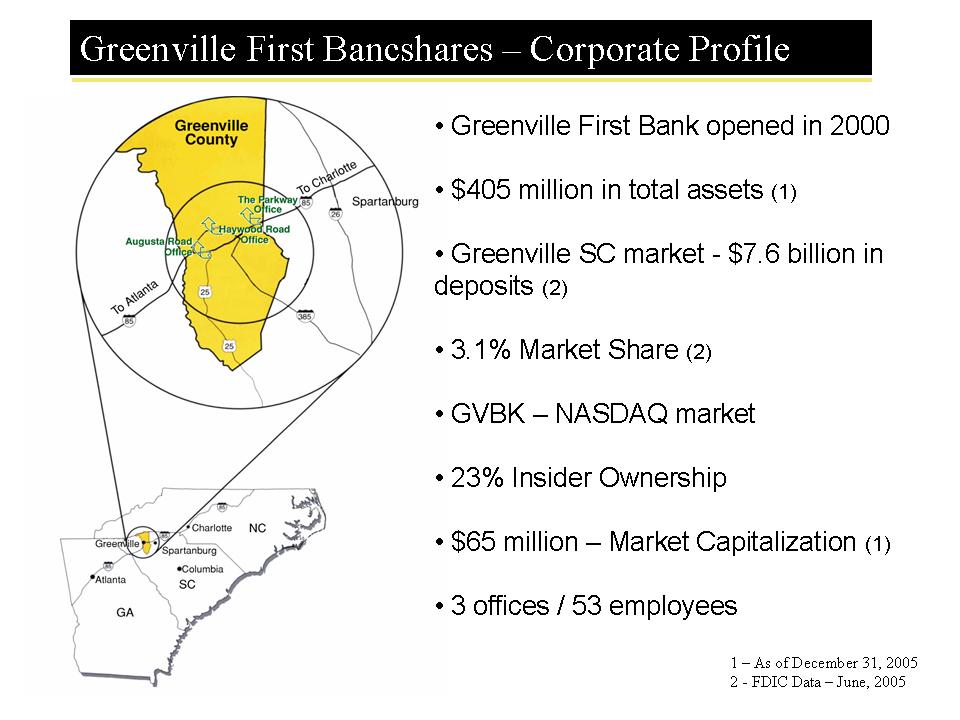
Greenville First Bancshares - Corporate Profile
[CHART]
Greenville First Bank opened in 2000
$405 million in total assets (1)
Greenville SC market - $7.6 billion in deposits (2)
3.1% Market Share (2)
GVBK - NASDAQ market
23% Insider Ownership
$65 million - Market Capitalization (1)
3 offices / 53 employees
1 - As of December 31, 2005
2 - FDIC Data - June, 2005
GVBK - Investment Profile
Growth Story
Performance Driven Leadership
Unique Client FIRST Model
Dynamic Greenville, SC Market
Performance / Momentum
[LOGO]
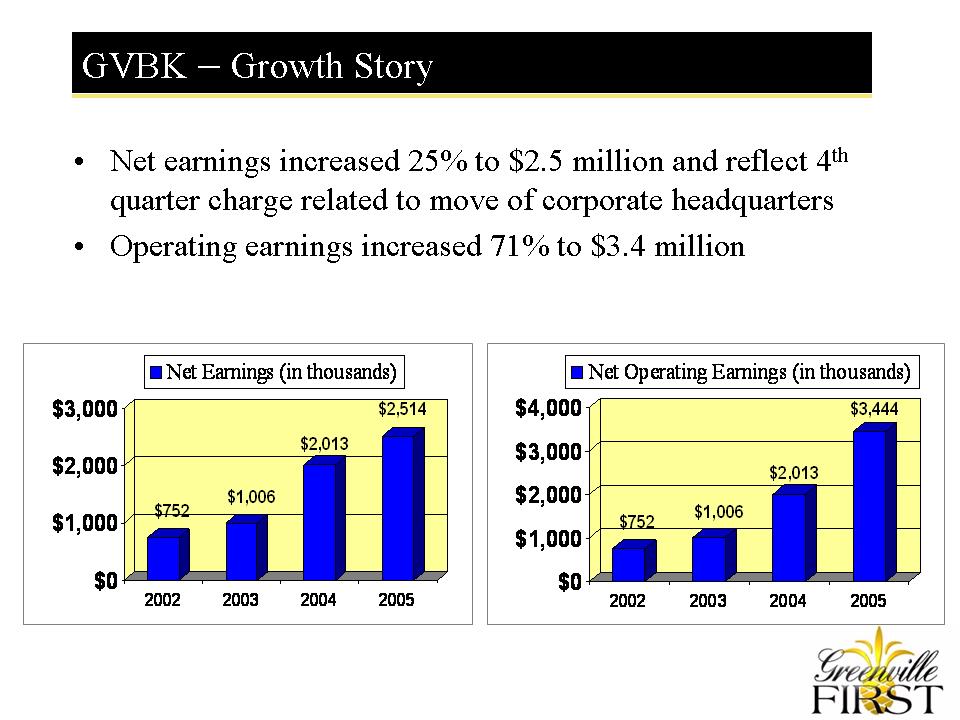
GVBK - Growth Story
Total Assets (in millions)
[CHART]
Loans (in millions)
[CHART]
[LOGO]
GVBK - Growth Story
Net Earnings (in thousands)
[CHART]
Net Operating Earnings (in thousands)
[CHART]
[LOGO]
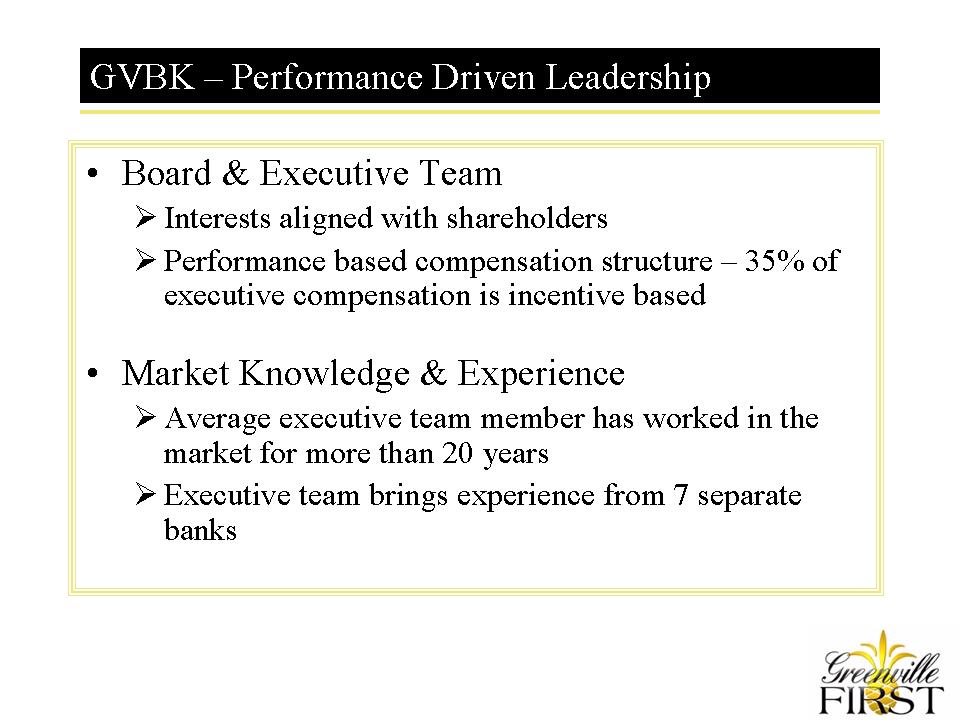
GVBK - Performance Driven Leadership
Market Knowledge & Experience
Average executive team member has worked in the market for more than 20 years
Executive team brings experience from 7 separate banks
[LOGO]
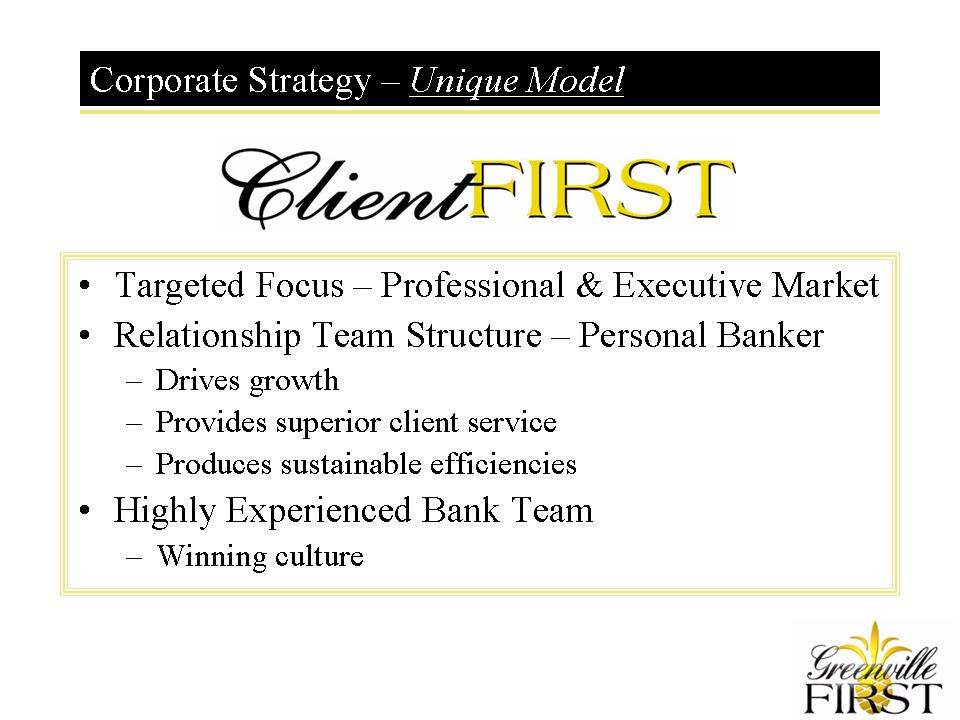
Corporate Strategy - Unique Model
Client FIRST
- Drives growth
- Provides superior client service
- Produces sustainable efficiencies
- Winning culture
[LOGO]
Dynamic Greenville Market
[CHART]
SC's most populous county
Largest deposit market in SC with over $7.6 billion in deposits
Deposit growth averaging 9% annually over the past five years
Diverse economy as market is home to over 240 international companies including BMW & Michelin
Source - FDIC 2005
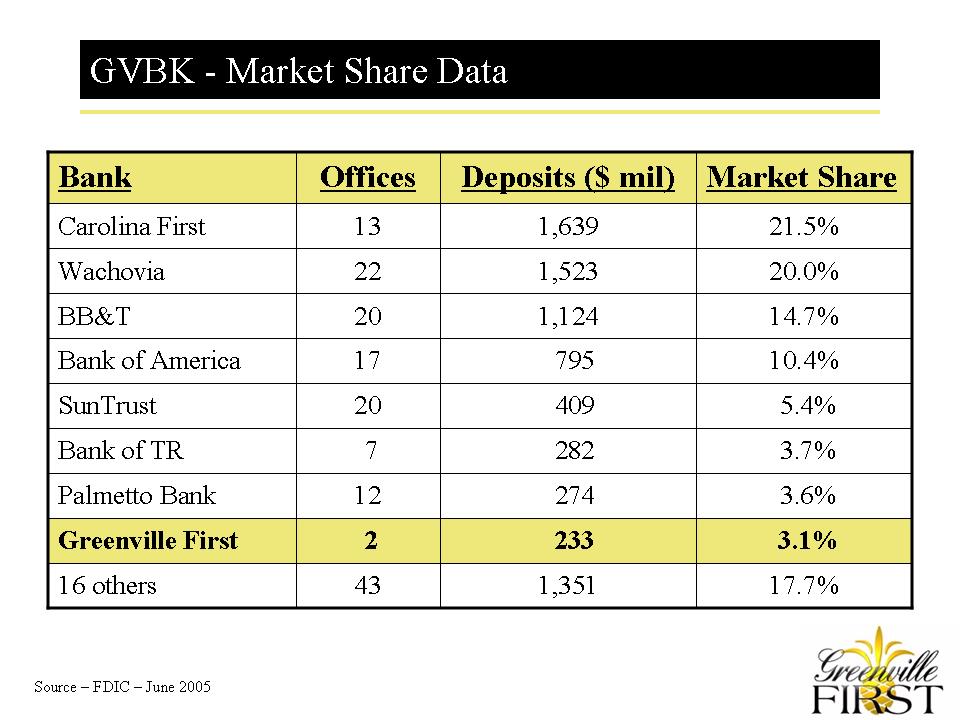
GVBK - Market Share Data
[CHART]
Source - FDIC - June 2005
[LOGO]
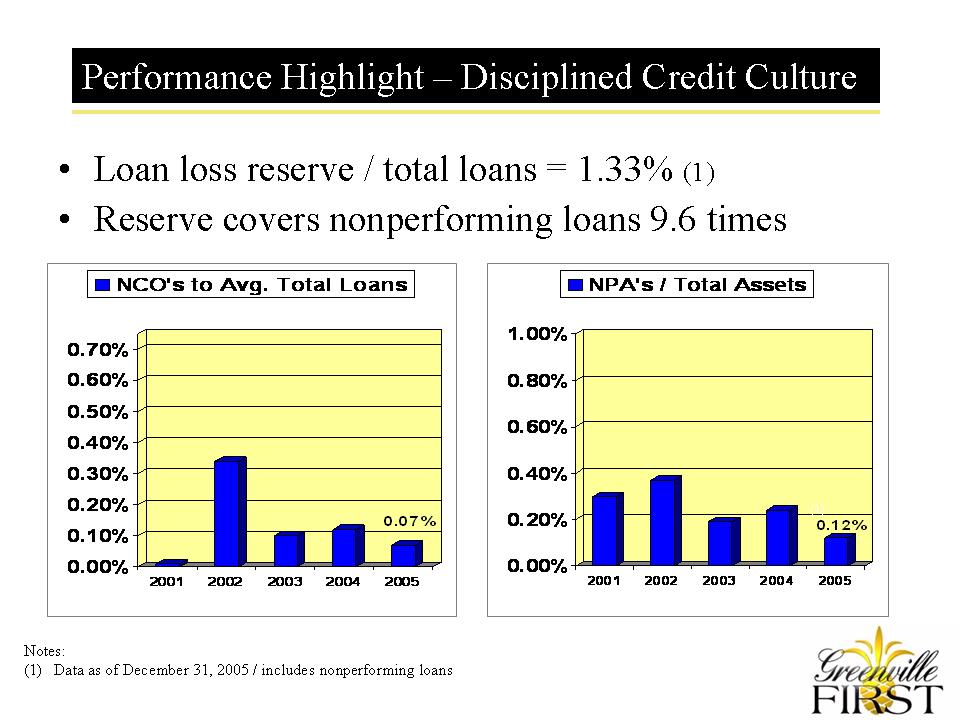
Performance Highlight - Disciplined Credit Culture
NCO's to Avg. Total Loans
[CHART]
NPA's /Total Assets
[CHART]
Notes:
(1) Data as of December 31, 2005 / includes nonperforming loans
[LOGO]
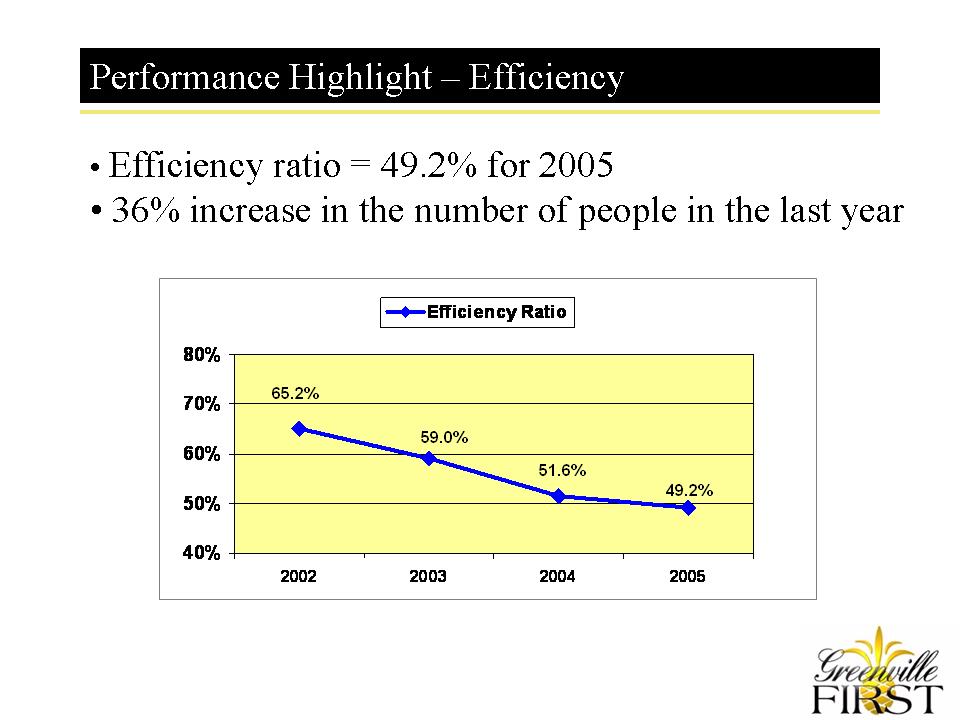
Performance Highlight - Efficiency
Efficiency Ratio
[CHART]
[LOGO]
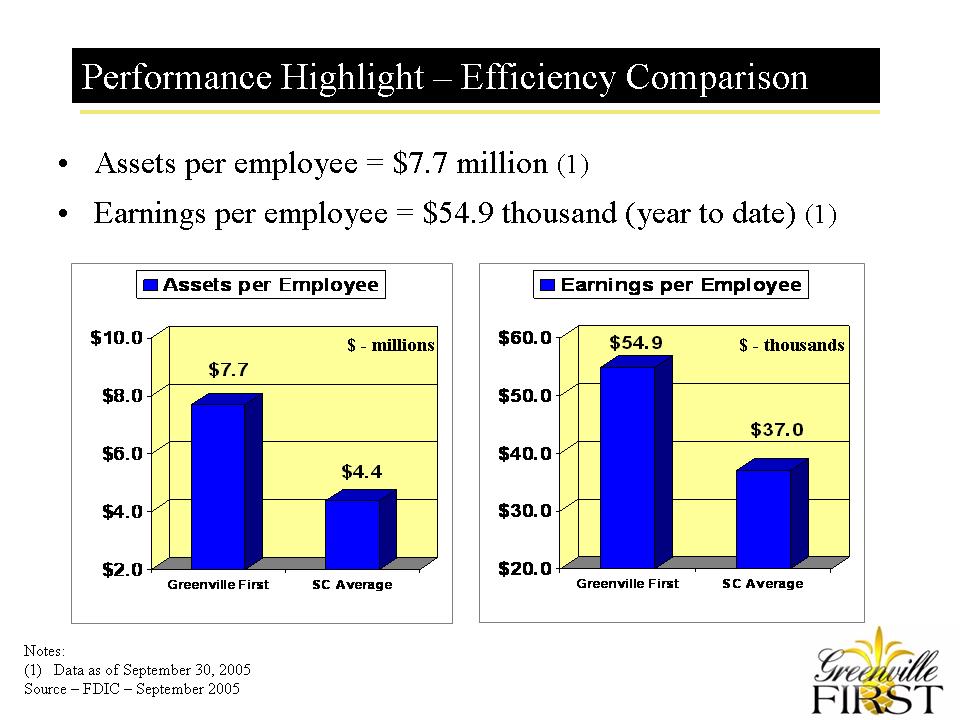
Performance Highlight - Efficiency Comparison
Assets per Employee
[CHART]
Earnings per Employee
[CHART]
Notes:
(1) Data as of September 30, 2005
Source - FDIC - September 2005
[LOGO]
GVBK - Momentum
- ROA & margin improvement
- Operating earnings increased 71%
- 36% increase in retail deposits
- 24% increase in transaction accounts
Return on Assets - operating earnings
[CHART]
Net Interest Margin
[CHART]
[LOGO]
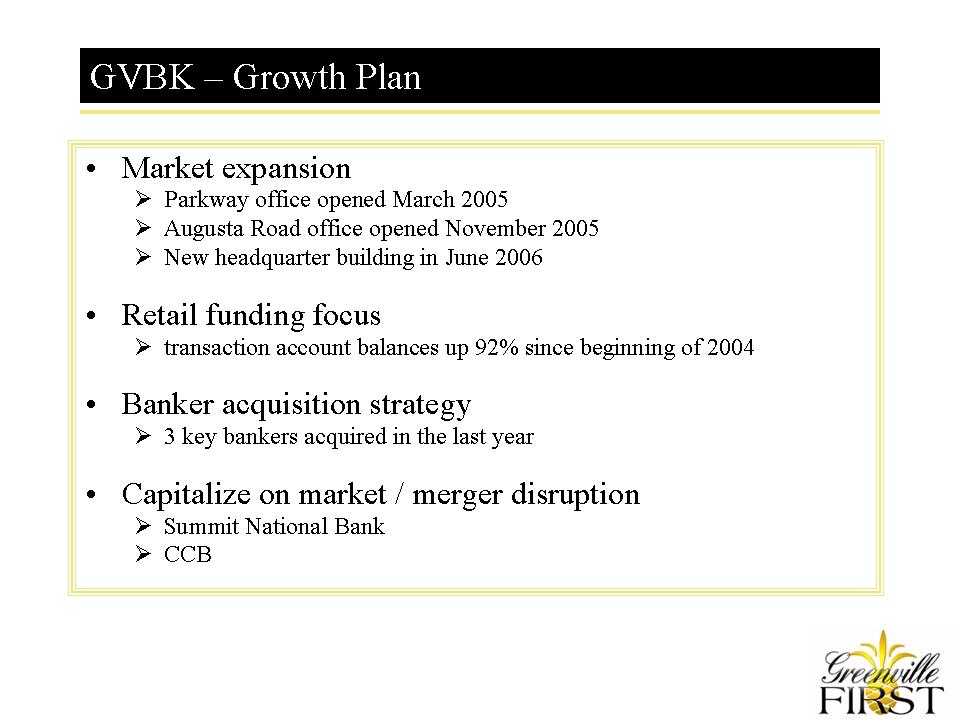
GVBK - Growth Plan
Market expansion
Parkway office opened March 2005
Augusta Road office opened November 2005
New headquarter building in June 2006
[LOGO]
GVBK - Summary
Experienced & Performance Driven Leadership
Unique Client FIRST Model
Attractive Greenville, SC Market
Growth Story
Solid Performance / Disciplined Credit Culture
Momentum
[LOGO]
Reconciliation of Non-GAAP Financial Measures
This presentation contains financial information determined by methods other than in accordance with Generally Accepted Accounting Principles ("GAAP"). Operating noninterest expense is used to compute the operating efficiency ratio.
Net income, (GAAP) $2,514
Non-operating items:
Impairment on real estate, net of income taxes 930
Operating earnings $3,444
Noninterest expense, (GAAP) $7,856
Non-operating items:
Impairment on real estate 1,500
Operating noninterest expense $6,356
[LOGO]