Exhibit 99.1
link to searchable text of slide shown above
link to searchable text of slide shown above

link to searchable text of slide shown above
link to searchable text of slide shown above

link to searchable text of slide shown above
link to searchable text of slide shown above
link to searchable text of slide shown above
link to searchable text of slide shown above
link to searchable text of slide shown above

link to searchable text of slide shown above

link to searchable text of slide shown above

link to searchable text of slide shown above
link to searchable text of slide shown above

link to searchable text of slide shown above
link to searchable text of slide shown above
link to searchable text of slide shown above
Searchable text section of graphics shown above
[LOGO] ; [LOGO]
GREENVILLE FIRST BANCSHARES, INC.
www.greenvillefirst.com
[LOGO]
Super-Community Bank Conference
Southeast - February 14-15, 2007
During the course of this presentation, management may make projections and forward-looking statements regarding events or the future financial performance of Greenville First Bancshares, Inc. We wish to caution you that these forward-looking statements involve certain risks and uncertainties, including a variety of factors (including a downturn in the economy, greater than expected non-interest expenses, excessive loan losses and other factors) that may cause Greenville First's actual results to differ materially from the anticipated results expressed in these forward-looking statements. Therefore, we can give no assurance that the results contemplated in the forward-looking statements will be realized. Investors are cautioned not to place undue reliance on these forward-looking statements and are advised to review the risk factors that may affect Greenville First's operating results in documents filed by Greenville First Bancshares, Inc. with the Securities and Exchange Commission, including the Form SB-2 Registration Statement, the Annual report on Form 10-K and other required filings. Greenville First assumes no duty to update the forward-looking statements made in this presentation.
[LOGO] & nbsp; [LOGO]
Greenville First Bancshares - Corporate Profile
[CHART]
• Greenville First Bank opened in 2000
• $509.5 million in total assets (1)
• Greenville SC market - $8.4 billion in
deposits - 3.6% market share (2)
• Columbia SC market - LPO opening
first quarter of 2007
• GVBK - NASDAQ market
• 23% Insider Ownership
• 3 offices / 61 employees
1 - As of December 31, 2006
2 - FDIC Data - June, 2006
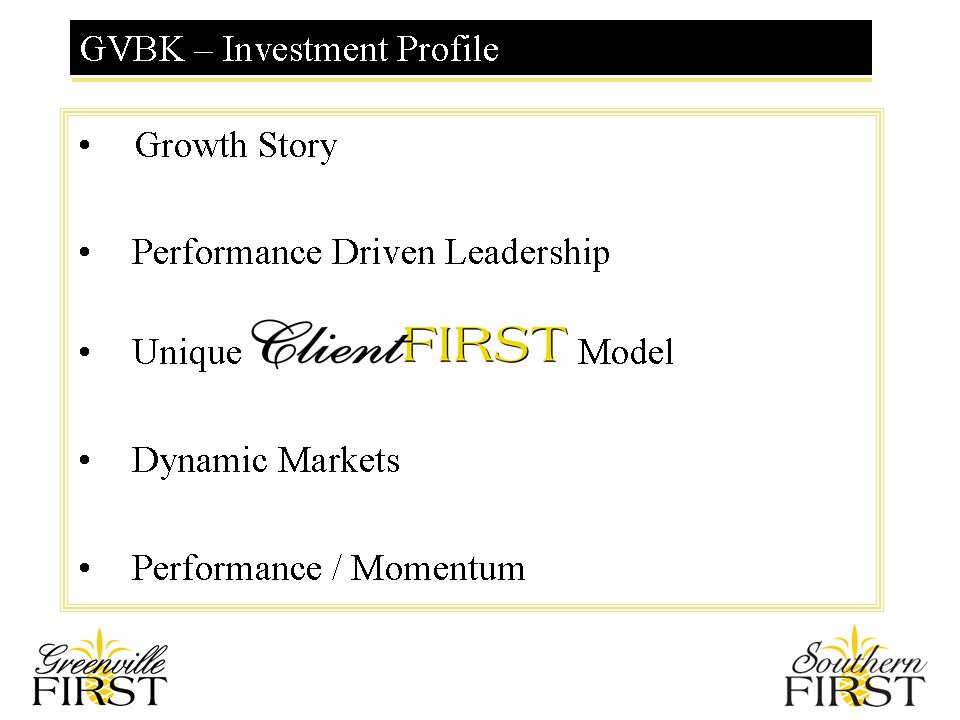
- Growth Story
- Performance Driven Leadership
- Unique Client First Model
- Dynamic Markets
- Performance / Momentum
[LOGO] & nbsp; [LOGO]
• Assets increased 26% to $509 million
• Loans increased 19% to $402 million
Total Assets (in millions)
[CHART]
Loans (in millions)
[CHART]
[LOGO] & nbsp; [LOGO]
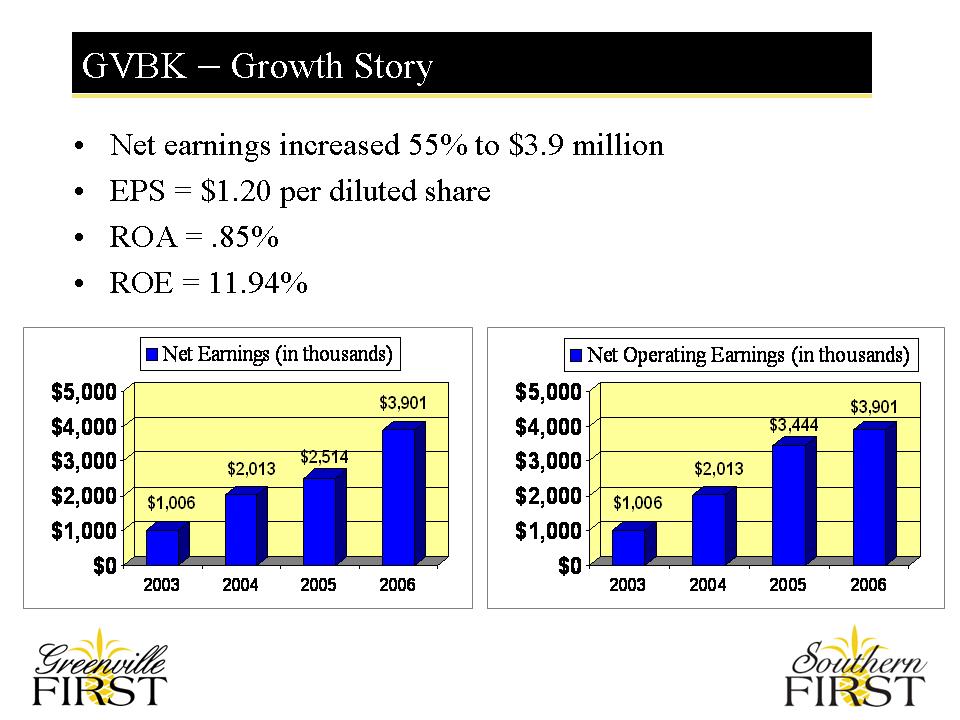
• Net earnings increased 55% to $3.9 million
• EPS = $1.20 per diluted share
• ROA = .85%
• ROE = 11.94%
Net Earnings (in thousands)
[CHART]
Net Operating Earnings (in thousands)
[CHART]
[LOGO] & nbsp; [LOGO]
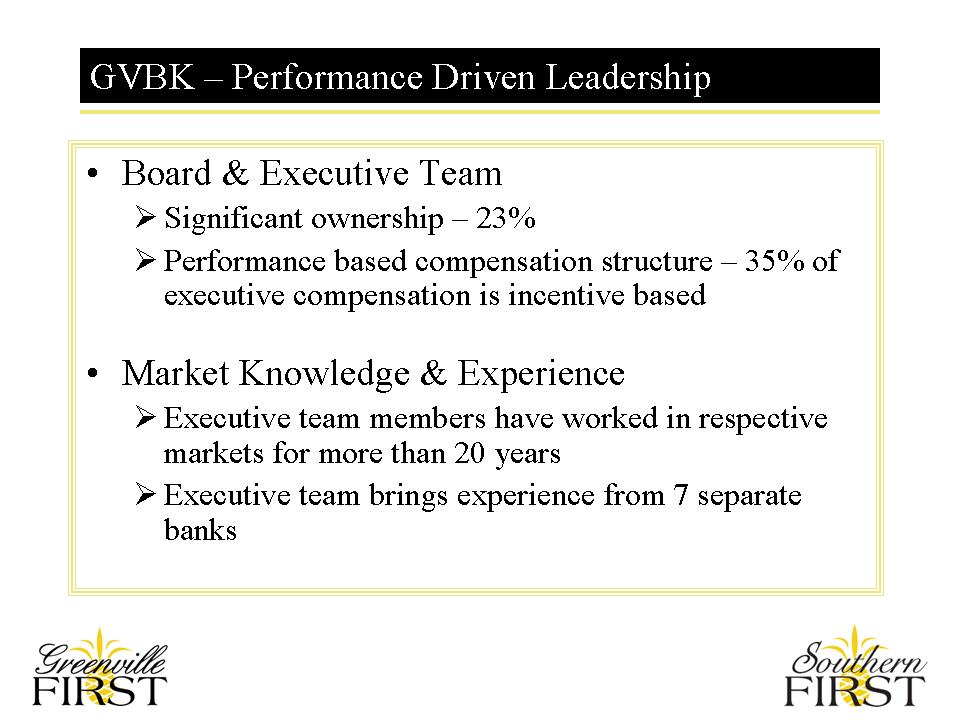
GVBK - Performance Driven Leadership
• Board & Executive Team
- - Significant ownership - 23%
- - Performance based compensation structure - 35% of executive compensation is incentive based
• Market Knowledge & Experience
- - Executive team members have worked in respective markets for more than 20 years
- - Executive team brings experience from 7 separate banks
[LOGO] & nbsp; [LOGO]
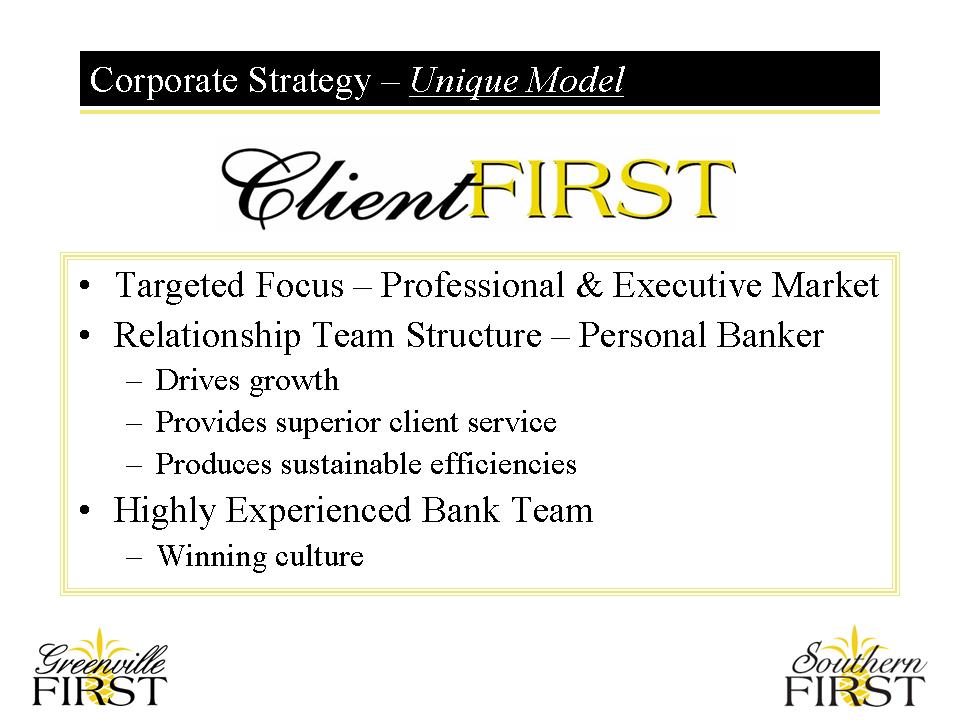
Corporate Strategy - Unique Model
Client FIRST
• Targeted Focus - Professional & Executive Market
• Relationship Team Structure - Personal Banker
- Drives growth
- Provides superior client service
- Produces sustainable efficiencies
• Highly Experienced Bank Team
- Winning culture
[LOGO] & nbsp; [LOGO]
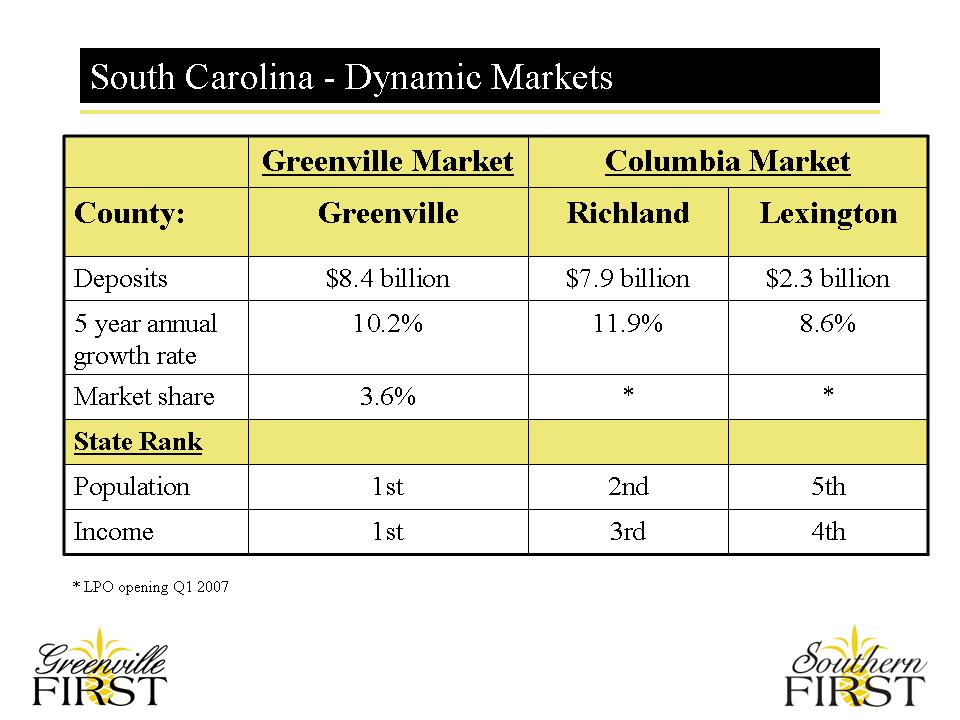
South Carolina - Dynamic Markets
[CHART]
* LPO opening Q1 2007
[LOGO] & nbsp; [LOGO]
GVBK - Greenville Market Share Data
[CHART]
Source - FDIC - June 2006
[LOGO] & nbsp; [LOGO]
Performance Highlight - Efficiency
• Operating efficiency ratio = 49.2% for 2006
• Infrastructure growth since 2004:
- - 2 new offices
- - 56% increase in the number of people
Efficiency Ratio
[CHART]
[LOGO] &nb sp; [LOGO]
Performance Highlight - Efficiency Comparison
• Assets per employee = $8.6 million (1)
• Earnings per employee = $59.7 thousand (year to date) (1)
Assets per Employee
[CHART]
Earnings per Employee
[CHART]
Notes:
(1) Data as of September 30, 2006
Source - FDIC - September 2006
[LOGO] & nbsp; [LOGO]
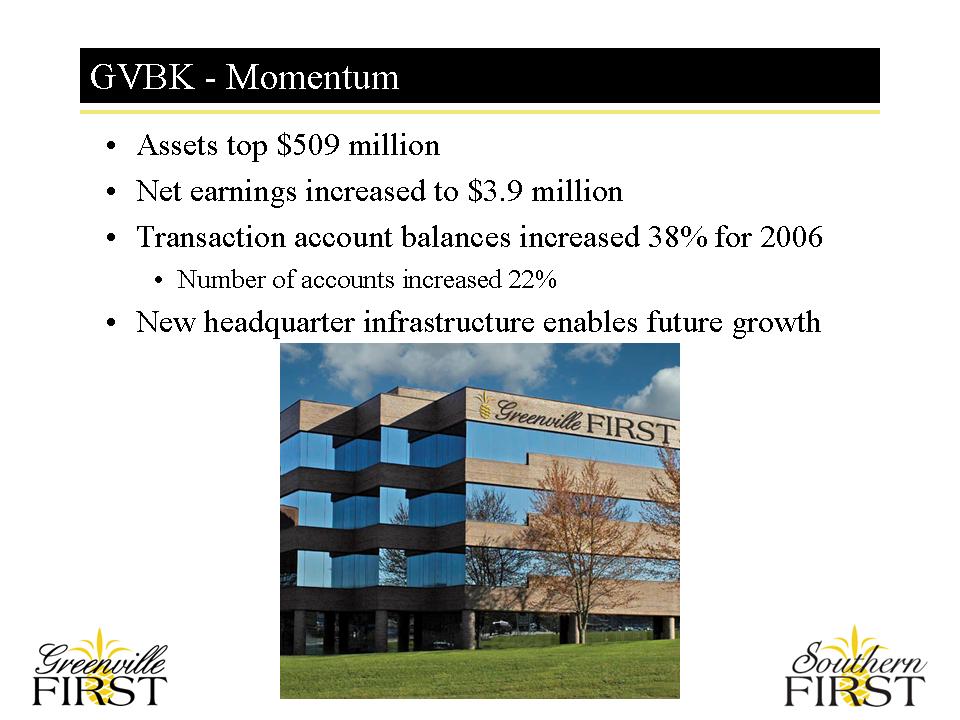
Assets top $509 million
Net earnings increased to $3.9 million
Transaction account balances increased 38% for 2006
- Number of accounts increased 22%
New headquarter infrastructure enables future growth
[GRAPHIC]
[LOGO] & nbsp; [LOGO]
[CHART]
[LOGO]
• Additional talent added to executive team
• Growth Story
• Experienced & Performance Driven Leadership
• Unique Client FIRST Model
• Dynamic South Carolina Markets
• Solid Performance / Momentum
• Strategic Expansion
[LOGO] &nb sp; [LOGO]
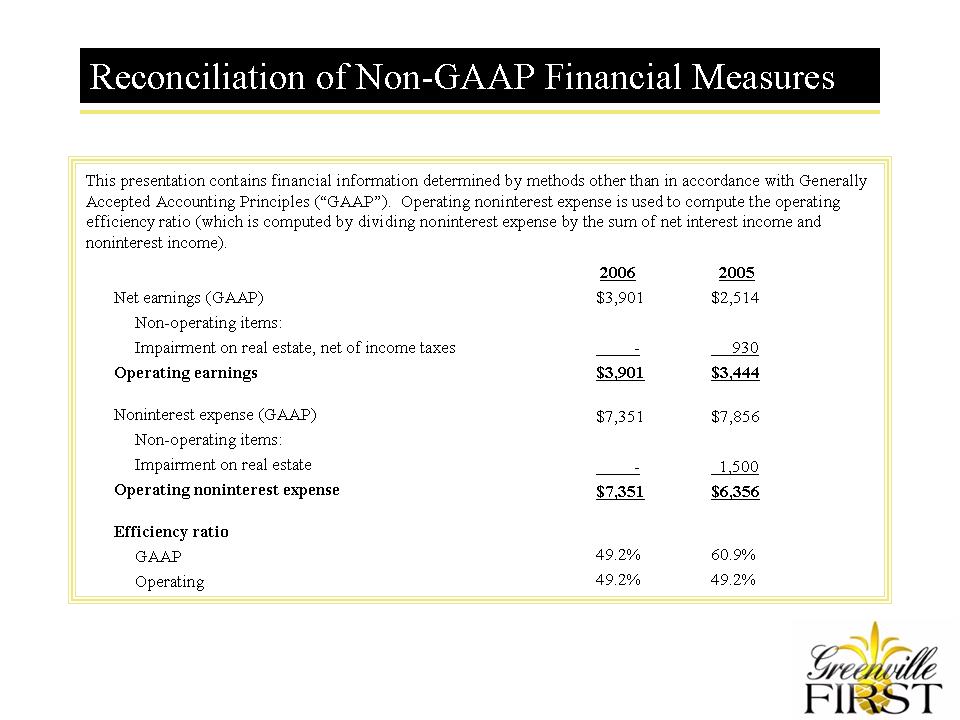
Reconciliation of Non-GAAP Financial Measures
This presentation contains financial information determined by methods other than in accordance with Generally Accepted Accounting Principles ("GAAP"). Operating noninterest expense is used to compute the operating efficiency ratio (which is computed by dividing noninterest by the sum of net interest income and noninterest income).
2006 2005
Net earnings, (GAAP) $3,901 $2,514
Non-operating items:
Impairment on real estate, net of income taxes - - 930
Operating earnings $3,901 $3,444
Noninterest expense, (GAAP) $7,351 $7,856
Non-operating items:
Impairment on real estate - - 1,500
Operating noninterest expense $7,351 $6,356
Efficiency ratio
GAAP 49.2% 60.9%
Operating 49.2% 49.2%
& nbsp; [LOGO]