Exhibit 99.1

Link to searchable text of slide shown above

Link to searchable text of slide shown above

Link to searchable text of slide shown above

Link to searchable text of slide shown above

Link to searchable text of slide shown above

Link to searchable text of slide shown above

Link to searchable text of slide shown above

Link to searchable text of slide shown above

Link to searchable text of slide shown above

Link to searchable text of slide shown above
Searchable text section of graphics shown above
[LOGO]
GREENVILLE FIRST BANCSHARES, INC.
www.greenvillefirst.com
[LOGO]
Financial Services Conference
November 11th, 2004
Forward-Looking Statements
During the course of this presentation, management may make projections and forward-looking statements regarding events or the future financial performance of Greenville First Bancshares, Inc. We wish to caution you that these forward-looking statements involve certain risks and uncertainties, including a variety of factors that may cause Greenville First’s actual results to differ materially from the anticipated results expressed in these forward-looking statements. Investors are cautioned not to place undue reliance on these forward-looking statements and are advised to review the risk factors that may affect Greenville First’s operating results in documents filed by Greenville First Bancshares, Inc. with the Securities and Exchange Commission, including the Form SB-2 Registration Statement, the Annual report on Form 10-KSB and other required filings. Greenville First assumes no duty to update the forward-looking statements made in this presentation.
[LOGO]
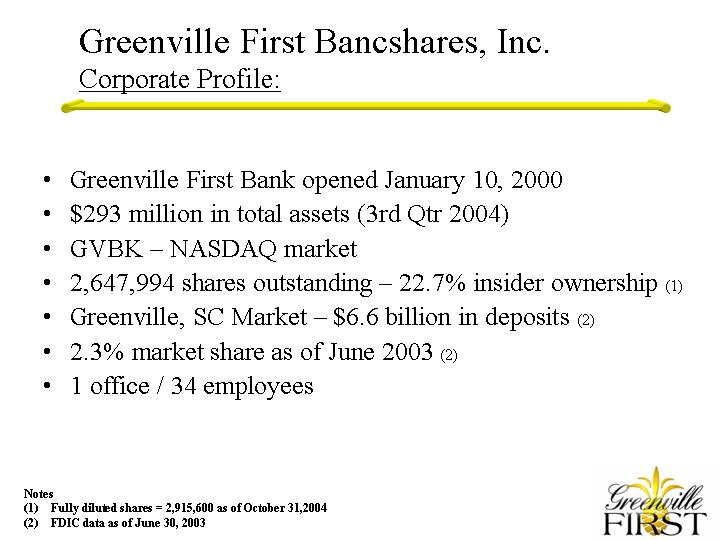
Greenville First Bancshares, Inc.
Corporate Profile:
• Greenville First Bank opened January 10, 2000
• $293 million in total assets (3rd Qtr 2004)
• GVBK — NASDAQ market
• 2,647,994 shares outstanding — 22.7% insider ownership (1)
• Greenville, SC Market — $6.6 billion in deposits (2)
• 2.3% market share as of June 2003 (2)
• 1 office / 34 employees
Notes
(1) Fully diluted shares = 2,915,600 as of October 31,2004
(2) FDIC data as of June 30, 2003
Corporate Strategy — Unique Model
Client First
• Focus
• Professional / Executive Market
• Structure
• Relationship Teams
• People
• Experienced & Performance Driven
Attractive Greenville Market
[CHART]
• SC’s most populous county
• Largest deposit market in SC with over $6.6 billion in deposits
• Deposit growth averaging 6% annually over the past five years
• Over 65% of deposits controlled by financial institutions headquartered outside of market
Source - - FDIC
Performance Highlight - GROWTH
• Asset growth is 36% over September 2003
• 3rd quarter year to date earnings up 97% over same period in 2003
Total Assets (in millions)
[CHART]
Net Earnings (in thousands)
[CHART]
Notes:
(1) As of September 30, 2004
(2) Through September 30, 2004
Performance Highlight — ASSET QUALITY
• Loan loss reserve / total loans = 1.33% (1)
• Loan loss reserve covers nonperforming loans more than 20 times
NCO’s to Avg. Total Loans
[CHART]
NPA’s / Total Assets
[CHART]
Notes:
(1) Data as of September 30, 2004 / includes nonperforming loans
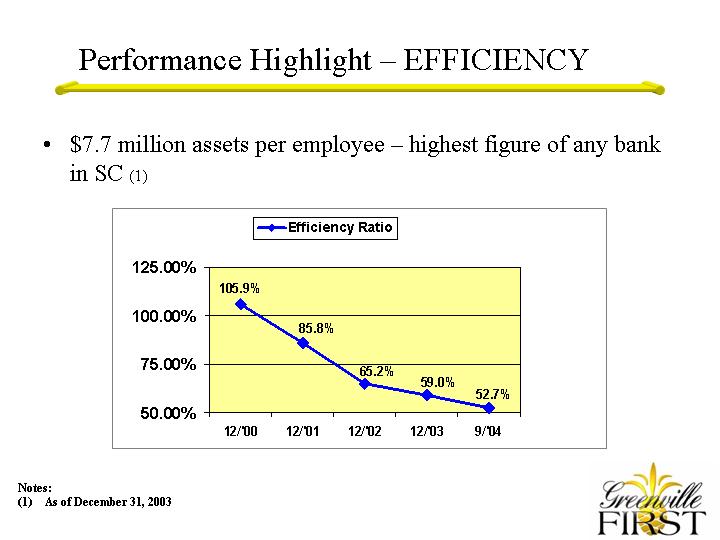
Performance Highlight — EFFICIENCY
• $7.7 million assets per employee — highest figure of any bank in SC (1)
Efficiency Ratio
[CHART]
Notes:
(1) As of December 31, 2003
Performance Highlight — MOMENTUM
• Asset growth
• 2004 is fastest growing period in company’s history
• Earnings growth
• Margin is expanding
• Retail funding focus
• Transaction account balances have increased 54% ytd 2004
• New capital
• $16.4 million of new capital provides foundation for continued growth
• Market expansion
• 2 strategic offices opening in 2005
Greenville First Bancshares, Inc.
Summary
• Experienced & Performance Oriented Leadership
• Unique ClientFirst Model
• Attractive Greenville, SC Market
• Growth Story
• Disciplined Credit Culture
• Momentum


