UNITED STATES
SECURITIES AND EXCHANGE COMMISSION
Washington, D.C. 20549
Form 10-Q
(Mark One)
| |
☑ | QUARTERLY REPORT PURSUANT TO SECTION 13 OR 15(d) OF THE SECURITIES EXCHANGE ACT OF 1934 |
For the quarterly period ended September 30, 2024
or
| |
☐ | TRANSITION REPORT PURSUANT TO SECTION 13 OR 15(d) OF THE SECURITIES EXCHANGE ACT OF 1934 |
Commission File Number 001-32318

DEVON ENERGY CORPORATION
(Exact name of registrant as specified in its charter)
| | |
Delaware |
| 73-1567067 |
(State or other jurisdiction of incorporation or organization) |
| (I.R.S. Employer identification No.) |
| |
333 West Sheridan Avenue, Oklahoma City, Oklahoma |
| 73102-5015 |
(Address of principal executive offices) |
| (Zip code) |
Registrant’s telephone number, including area code: (405) 235-3611
Former name, address and former fiscal year, if changed from last report: Not applicable
Securities registered pursuant to Section 12(b) of the Act:
| | |
Title of each class | Trading Symbol | Name of each exchange on which registered |
Common Stock, par value $0.10 per share | DVN | The New York Stock Exchange |
Indicate by check mark whether the registrant (1) has filed all reports required to be filed by Section 13 or 15(d) of the Securities Exchange Act of 1934 during the preceding 12 months (or for such shorter period that the registrant was required to file such reports), and (2) has been subject to such filing requirements for the past 90 days. Yes ☑ No ☐
Indicate by check mark whether the registrant has submitted electronically every Interactive Data File required to be submitted pursuant to Rule 405 of Regulation S-T (§232.405 of this chapter) during the preceding 12 months (or for such shorter period that the registrant was required to submit such files). Yes ☑ No ☐
Indicate by check mark whether the registrant is a large accelerated filer, an accelerated filer, a non-accelerated filer, smaller reporting company or an emerging growth company. See the definitions of “large accelerated filer,” “accelerated filer,” “smaller reporting company,” and “emerging growth company” in Rule 12b-2 of the Exchange Act.
| | | | | | | | |
Large accelerated filer | | ☑ | Accelerated filer | | ☐ | Non-accelerated filer | | ☐ |
Smaller reporting company |
| ☐ | Emerging growth company |
| ☐ | | | |
If an emerging growth company, indicate by check mark if the registrant has elected not to use the extended transition period for complying with any new or revised financial accounting standards provided pursuant to Section 13(a) of the Exchange Act. ☐
Indicate by check mark whether the registrant is a shell company (as defined in Rule 12b-2 of the Act). Yes ☐ No ☑
On October 23, 2024, 656.9 million shares of common stock were outstanding.
DEVON ENERGY CORPORATION
FORM 10-Q
TABLE OF CONTENTS
DEFINITIONS
Unless the context otherwise indicates, references to “us,” “we,” “our,” “ours,” “Devon,” the “Company” and “Registrant” refer to Devon Energy Corporation and its consolidated subsidiaries. All monetary values, other than per unit and per share amounts, are stated in millions of U.S. dollars unless otherwise specified. In addition, the following are other abbreviations and definitions of certain terms used within this Quarterly Report on Form 10-Q:
“2018 Senior Credit Facility” means Devon’s syndicated unsecured revolving line of credit, effective as of October 5, 2018.
“2023 Senior Credit Facility” means Devon’s syndicated unsecured revolving line of credit, effective as of March 24, 2023.
“ASU” means Accounting Standards Update.
“Bbl” or “Bbls” means barrel or barrels.
“Boe” means barrel of oil equivalent. Gas proved reserves and production are converted to Boe, at the pressure and temperature base standard of each respective state in which the gas is produced, at the rate of six Mcf of gas per Bbl of oil, based upon the approximate relative energy content of gas and oil. NGL proved reserves and production are converted to Boe on a one-to-one basis with oil.
“Btu” means British thermal units, a measure of heating value.
“Catalyst” means Catalyst Midstream Partners, LLC.
“CDM” means Cotton Draw Midstream, L.L.C.
“DD&A” means depreciation, depletion and amortization expenses.
“ESG” means environmental, social and governance.
“FASB” means Financial Accounting Standards Board.
“Fervo” means Fervo Energy Company.
“G&A” means general and administrative expenses.
“GAAP” means U.S. generally accepted accounting principles.
“Grayson Mill” means Grayson Mill Intermediate HoldCo II, LLC and Grayson Mill Intermediate HoldCo III, LLC.
“Inside FERC” refers to the publication Inside FERC’s Gas Market Report.
“LOE” means lease operating expenses.
“Matterhorn” refers to Matterhorn Express Pipeline, LLC and, as applicable, its direct parent, MXP Parent, LLC.
“MBbls” means thousand barrels.
“MBoe” means thousand Boe.
“Mcf” means thousand cubic feet.
“MMBoe” means million Boe.
“MMBtu” means million Btu.
“MMcf” means million cubic feet.
“N/M” means not meaningful.
“NCI” means noncontrolling interests.
“NGL” or “NGLs” means natural gas liquids.
“NYMEX” means New York Mercantile Exchange.
“SEC” means United States Securities and Exchange Commission.
"SOFR" means secured overnight financing rate.
“TSR” means total shareholder return.
“U.S.” means United States of America.
“VIE” means variable interest entity.
“Water JV” means NDB Midstream L.L.C.
“WTI” means West Texas Intermediate.
“/Bbl” means per barrel.
“/d” means per day.
“/MMBtu” means per MMBtu.
INFORMATION REGARDING FORWARD-LOOKING STATEMENTS
This report includes “forward-looking statements” as defined by the SEC. Such statements include those concerning strategic plans, our expectations and objectives for future operations, as well as other future events or conditions, and are often identified by use of the words and phrases “expects,” “believes,” “will,” “would,” “could,” “continue,” “may,” “aims,” “likely to be,” “intends,” “forecasts,” “projections,” “estimates,” “plans,” “expectations,” “targets,” “opportunities,” “potential,” “anticipates,” “outlook” and other similar terminology. All statements, other than statements of historical facts, included in this report that address activities, events or developments that Devon expects, believes or anticipates will or may occur in the future are forward-looking statements. Such statements are subject to a number of assumptions, risks and uncertainties, many of which are beyond our control. Consequently, actual future results could differ materially and adversely from our expectations due to a number of factors, including, but not limited to:
•the volatility of oil, gas and NGL prices;
•uncertainties inherent in estimating oil, gas and NGL reserves;
•the extent to which we are successful in acquiring and discovering additional reserves;
•the uncertainties, costs and risks involved in our operations;
•risks related to our hedging activities;
•our limited control over third parties who operate some of our oil and gas properties;
•midstream capacity constraints and potential interruptions in production, including from limits to the build out of midstream infrastructure;
•competition for assets, materials, people and capital;
•regulatory restrictions, compliance costs and other risks relating to governmental regulation, including with respect to federal lands, environmental matters and seismicity;
•climate change and risks related to regulatory, social and market efforts to address climate change;
•governmental interventions in energy markets;
•counterparty credit risks;
•risks relating to our indebtedness;
•risks relating to global pandemics;
•the extent to which insurance covers any losses we may experience;
•risks related to stockholder activism;
•our ability to successfully complete mergers, acquisitions and divestitures;
•our ability to pay dividends and make share repurchases; and
The forward-looking statements included in this filing speak only as of the date of this report, represent management’s current reasonable expectations as of the date of this filing and are subject to the risks and uncertainties identified above as well as those described elsewhere in this report and in other documents we file from time to time with the SEC. We cannot guarantee the accuracy of our forward-looking statements, and readers are urged to carefully review and consider the various disclosures made in this report and in other documents we file from time to time with the SEC. All subsequent written and oral forward-looking statements attributable to Devon, or persons acting on its behalf, are expressly qualified in their entirety by the cautionary statements above. We do not undertake, and expressly disclaim, any duty to update or revise our forward-looking statements based on new information, future events or otherwise.
Part I. Financial Information
Item 1. Financial Statements
DEVON ENERGY CORPORATION AND SUBSIDIARIES
CONSOLIDATED STATEMENTS OF COMPREHENSIVE EARNINGS
| | | | | | | | | | | | | | | | |
| | Three Months Ended September 30, | | | Nine Months Ended September 30, | |
| | 2024 | | | 2023 | | | 2024 | | | 2023 | |
| | (Unaudited) | |
Oil, gas and NGL sales | | $ | 2,665 | | | $ | 2,882 | | | $ | 8,090 | | | $ | 8,054 | |
Oil, gas and NGL derivatives | | | 227 | | | | (194 | ) | | | 105 | | | | (206 | ) |
Marketing and midstream revenues | | | 1,132 | | | | 1,148 | | | | 3,342 | | | | 3,265 | |
Total revenues | | | 4,024 | | | | 3,836 | | | | 11,537 | | | | 11,113 | |
Production expenses | | | 763 | | | | 757 | | | | 2,302 | | | | 2,169 | |
Exploration expenses | | | 4 | | | | 3 | | | | 16 | | | | 16 | |
Marketing and midstream expenses | | | 1,149 | | | | 1,160 | | | | 3,390 | | | | 3,316 | |
Depreciation, depletion and amortization | | | 794 | | | | 651 | | | | 2,284 | | | | 1,904 | |
Asset dispositions | | | — | | | | — | | | | 16 | | | | (41 | ) |
General and administrative expenses | | | 117 | | | | 99 | | | | 345 | | | | 297 | |
Financing costs, net | | | 88 | | | | 81 | | | | 240 | | | | 231 | |
Restructuring and transaction costs | | | 8 | | | | — | | | | 8 | | | | — | |
Other, net | | | 37 | | | | 13 | | | | 64 | | | | 28 | |
Total expenses | | | 2,960 | | | | 2,764 | | | | 8,665 | | | | 7,920 | |
Earnings before income taxes | | | 1,064 | | | | 1,072 | | | | 2,872 | | | | 3,193 | |
Income tax expense | | | 239 | | | | 152 | | | | 583 | | | | 572 | |
Net earnings | | | 825 | | | | 920 | | | | 2,289 | | | | 2,621 | |
Net earnings attributable to noncontrolling interests | | | 13 | | | | 10 | | | | 37 | | | | 26 | |
Net earnings attributable to Devon | | $ | 812 | | | $ | 910 | | | $ | 2,252 | | | $ | 2,595 | |
Net earnings per share: | | | | | | | | | | | | |
Basic net earnings per share | | $ | 1.31 | | | $ | 1.43 | | | $ | 3.60 | | | $ | 4.05 | |
Diluted net earnings per share | | $ | 1.30 | | | $ | 1.42 | | | $ | 3.59 | | | $ | 4.03 | |
Comprehensive earnings: | | | | | | | | | | | | |
Net earnings | | $ | 825 | | | $ | 920 | | | $ | 2,289 | | | $ | 2,621 | |
Other comprehensive earnings, net of tax: | | | | | | | | | | | | |
Pension and postretirement plans | | | 1 | | | | 1 | | | | 3 | | | | 3 | |
Other comprehensive earnings, net of tax | | | 1 | | | | 1 | | | | 3 | | | | 3 | |
Comprehensive earnings: | | | 826 | | | | 921 | | | | 2,292 | | | | 2,624 | |
Comprehensive earnings attributable to noncontrolling interests | | | 13 | | | | 10 | | | | 37 | | | | 26 | |
Comprehensive earnings attributable to Devon | | $ | 813 | | | $ | 911 | | | $ | 2,255 | | | $ | 2,598 | |
See accompanying notes to consolidated financial statements.
DEVON ENERGY CORPORATION AND SUBSIDIARIES
CONSOLIDATED BALANCE SHEETS
| | | | | | | | |
| | September 30, 2024 | | | December 31, 2023 | |
| | (Unaudited) | | | | |
ASSETS | | | | | | |
Current assets: | | | | | | |
Cash, cash equivalents and restricted cash | | $ | 676 | | | $ | 875 | |
Accounts receivable | | | 1,779 | | | | 1,573 | |
Inventory | | | 293 | | | | 249 | |
Other current assets | | | 484 | | | | 460 | |
Total current assets | | | 3,232 | | | | 3,157 | |
Oil and gas property and equipment, based on successful efforts accounting, net | | | 23,155 | | | | 17,825 | |
Other property and equipment, net ($164 million and $136 million related to CDM in
2024 and 2023, respectively) | | | 1,795 | | | | 1,503 | |
Total property and equipment, net | | | 24,950 | | | | 19,328 | |
Goodwill | | | 753 | | | | 753 | |
Right-of-use assets | | | 317 | | | | 267 | |
Investments | | | 718 | | | | 666 | |
Other long-term assets | | | 293 | | | | 319 | |
Total assets | | $ | 30,263 | | | $ | 24,490 | |
LIABILITIES AND EQUITY | | | | | | |
Current liabilities: | | | | | | |
Accounts payable | | $ | 995 | | | $ | 760 | |
Revenues and royalties payable | | | 1,423 | | | | 1,222 | |
Short-term debt | | | — | | | | 483 | |
Other current liabilities | | | 488 | | | | 484 | |
Total current liabilities | | | 2,906 | | | | 2,949 | |
Long-term debt | | | 8,884 | | | | 5,672 | |
Lease liabilities | | | 328 | | | | 295 | |
Asset retirement obligations | | | 765 | | | | 643 | |
Other long-term liabilities | | | 820 | | | | 876 | |
Deferred income taxes | | | 2,082 | | | | 1,838 | |
Stockholders' equity: | | | | | | |
Common stock, $0.10 par value. Authorized 1.0 billion shares; issued
658 million and 636 million shares in 2024 and 2023, respectively | | | 66 | | | | 64 | |
Additional paid-in capital | | | 6,662 | | | | 5,939 | |
Retained earnings | | | 7,670 | | | | 6,195 | |
Accumulated other comprehensive loss | | | (121 | ) | | | (124 | ) |
Treasury stock, at cost, 0.3 million shares in 2023 | | | — | | | | (13 | ) |
Total stockholders’ equity attributable to Devon | | | 14,277 | | | | 12,061 | |
Noncontrolling interests | | | 201 | | | | 156 | |
Total equity | | | 14,478 | | | | 12,217 | |
Total liabilities and equity | | $ | 30,263 | | | $ | 24,490 | |
See accompanying notes to consolidated financial statements.
DEVON ENERGY CORPORATION AND SUBSIDIARIES
CONSOLIDATED STATEMENTS OF CASH FLOWS
| | | | | | | | | | | | | | | | |
| | Three Months Ended September 30, | | | Nine Months Ended September 30, | |
| | 2024 | | | 2023 | | | 2024 | | | 2023 | |
| | (Unaudited) | |
Cash flows from operating activities: | | | | | | | | | | | | |
Net earnings | | $ | 825 | | | $ | 920 | | | $ | 2,289 | | | $ | 2,621 | |
Adjustments to reconcile net earnings to net cash from operating activities: | | | | | | | | | | | | |
Depreciation, depletion and amortization | | | 794 | | | | 651 | | | | 2,284 | | | | 1,904 | |
Leasehold impairments | | | 1 | | | | 1 | | | | 2 | | | | 4 | |
Accretion (amortization) of liabilities | | | 2 | | | | (2 | ) | | | 2 | | | | (17 | ) |
Total (gains) losses on commodity derivatives | | | (227 | ) | | | 194 | | | | (105 | ) | | | 206 | |
Cash settlements on commodity derivatives | | | 61 | | | | (11 | ) | | | 139 | | | | 39 | |
(Gains) losses on asset dispositions | | | — | | | | — | | | | 16 | | | | (41 | ) |
Deferred income tax expense | | | 164 | | | | 13 | | | | 243 | | | | 212 | |
Share-based compensation | | | 24 | | | | 22 | | | | 75 | | | | 70 | |
Other | | | 3 | | | | (2 | ) | | | 6 | | | | (2 | ) |
Changes in assets and liabilities, net | | | 16 | | | | (61 | ) | | | (15 | ) | | | (189 | ) |
Net cash from operating activities | | | 1,663 | | | | 1,725 | | | | 4,936 | | | | 4,807 | |
Cash flows from investing activities: | | | | | | | | | | | | |
Capital expenditures | | | (877 | ) | | | (882 | ) | | | (2,719 | ) | | | (2,973 | ) |
Acquisitions of property and equipment | | | (3,602 | ) | | | (23 | ) | | | (3,692 | ) | | | (54 | ) |
Divestitures of property and equipment | | | — | | | | 1 | | | | 18 | | | | 23 | |
Grayson Mill acquired cash | | | 147 | | | | — | | | | 147 | | | | — | |
Distributions from investments | | | 13 | | | | 7 | | | | 35 | | | | 24 | |
Contributions to investments and other | | | (30 | ) | | | — | | | | (78 | ) | | | (52 | ) |
Net cash from investing activities | | | (4,349 | ) | | | (897 | ) | | | (6,289 | ) | | | (3,032 | ) |
Cash flows from financing activities: | | | | | | | | | | | | |
Borrowings of long-term debt, net of issuance costs | | | 3,219 | | | | — | | | | 3,219 | | | | — | |
Repayments of long-term debt | | | (472 | ) | | | (242 | ) | | | (472 | ) | | | (242 | ) |
Repurchases of common stock | | | (295 | ) | | | — | | | | (756 | ) | | | (745 | ) |
Dividends paid on common stock | | | (272 | ) | | | (312 | ) | | | (794 | ) | | | (1,370 | ) |
Contributions from noncontrolling interests | | | 20 | | | | 10 | | | | 44 | | | | 18 | |
Distributions to noncontrolling interests | | | (10 | ) | | | (9 | ) | | | (36 | ) | | | (33 | ) |
Shares exchanged for tax withholdings and other | | | 2 | | | | — | | | | (49 | ) | | | (96 | ) |
Net cash from financing activities | | | 2,192 | | | | (553 | ) | | | 1,156 | | | | (2,468 | ) |
Effect of exchange rate changes on cash | | | 1 | | | | (2 | ) | | | (2 | ) | | | — | |
Net change in cash, cash equivalents and restricted cash | | | (493 | ) | | | 273 | | | | (199 | ) | | | (693 | ) |
Cash, cash equivalents and restricted cash at beginning of period | | | 1,169 | | | | 488 | | | | 875 | | | | 1,454 | |
Cash, cash equivalents and restricted cash at end of period | | $ | 676 | | | $ | 761 | | | $ | 676 | | | $ | 761 | |
| | | | | | | | | | | | |
Reconciliation of cash, cash equivalents and restricted cash: | | | | | | | | | | | | |
Cash and cash equivalents | | $ | 645 | | | $ | 654 | | | $ | 645 | | | $ | 654 | |
Restricted cash | | | 31 | | | | 107 | | | | 31 | | | | 107 | |
Total cash, cash equivalents and restricted cash | | $ | 676 | | | $ | 761 | | | $ | 676 | | | $ | 761 | |
See accompanying notes to consolidated financial statements.
DEVON ENERGY CORPORATION AND SUBSIDIARIES
CONSOLIDATED STATEMENTS OF EQUITY
| | | | | | | | | | | | | | | | | | | | | | | | | | | | | | | | |
| | | | | | | | | | | | | | Other | | | | | | | | | | |
| | | | | | | | Additional | | | | | | Comprehensive | | | | | | | | | | |
| | Common Stock | | | Paid-In | | | Retained | | | Earnings | | | Treasury | | | Noncontrolling | | | Total | |
| | Shares | | | Amount | | | Capital | | | Earnings | | | (Loss) | | | Stock | | | Interests | | | Equity | |
| | (Unaudited) | |
Three Months Ended September 30, 2024 | | | | | | | | | | | | | | | | | | | | | | | | |
Balance as of June 30, 2024 | | | 628 | | | $ | 63 | | | $ | 5,478 | | | $ | 7,132 | | | $ | (122 | ) | | $ | — | | | $ | 178 | | | $ | 12,729 | |
Net earnings | | | — | | | | — | | | | — | | | | 812 | | | | — | | | | — | | | | 13 | | | | 825 | |
Other comprehensive earnings, net of tax | | | — | | | | — | | | | — | | | | — | | | | 1 | | | | — | | | | — | | | | 1 | |
Common stock repurchased | | | — | | | | (1 | ) | | | 4 | | | | — | | | | — | | | | (295 | ) | | | — | | | | (292 | ) |
Common stock retired | | | (7 | ) | | | — | | | | (295 | ) | | | — | | | | — | | | | 295 | | | | — | | | | — | |
Common stock dividends | | | — | | | | — | | | | — | | | | (274 | ) | | | — | | | | — | | | | — | | | | (274 | ) |
Common stock issued | | | 37 | | | | 4 | | | | 1,451 | | | | — | | | | — | | | | — | | | | — | | | | 1,455 | |
Share-based compensation | | | — | | | | — | | | | 24 | | | | — | | | | — | | | | — | | | | — | | | | 24 | |
Contributions from noncontrolling interests | | | — | | | | — | | | | — | | | | — | | | | — | | | | — | | | | 20 | | | | 20 | |
Distributions to noncontrolling interests | | | — | | | | — | | | | — | | | | — | | | | — | | | | — | | | | (10 | ) | | | (10 | ) |
Balance as of September 30, 2024 | | | 658 | | | $ | 66 | | | $ | 6,662 | | | $ | 7,670 | | | $ | (121 | ) | | $ | — | | | $ | 201 | | | $ | 14,478 | |
Three Months Ended September 30, 2023 | | | | | | | | | | | | | | | | | | | | | | | | |
Balance as of June 30, 2023 | | | 641 | | | $ | 64 | | | $ | 6,131 | | | $ | 4,940 | | | $ | (114 | ) | | $ | — | | | $ | 129 | | | $ | 11,150 | |
Net earnings | | | — | | | | — | | | | — | | | | 910 | | | | — | | | | — | | | | 10 | | | | 920 | |
Other comprehensive earnings, net of tax | | | — | | | | — | | | | — | | | | — | | | | 1 | | | | — | | | | — | | | | 1 | |
Common stock dividends | | | — | | | | — | | | | — | | | | (315 | ) | | | — | | | | — | | | | — | | | | (315 | ) |
Share-based compensation | | | — | | | | — | | | | 22 | | | | — | | | | — | | | | — | | | | — | | | | 22 | |
Contributions from noncontrolling interests | | | — | | | | — | | | | — | | | | — | | | | — | | | | — | | | | 10 | | | | 10 | |
Distributions to noncontrolling interests | | | — | | | | — | | | | — | | | | — | | | | — | | | | — | | | | (9 | ) | | | (9 | ) |
Balance as of September 30, 2023 | | | 641 | | | $ | 64 | | | $ | 6,153 | | | $ | 5,535 | | | $ | (113 | ) | | $ | — | | | $ | 140 | | | $ | 11,779 | |
Nine Months Ended September 30, 2024 | | | | | | | | | | | | | | | | | | | | | | | | |
Balance as of December 31, 2023 | | | 636 | | | $ | 64 | | | $ | 5,939 | | | $ | 6,195 | | | $ | (124 | ) | | $ | (13 | ) | | $ | 156 | | | $ | 12,217 | |
Net earnings | | | — | | | | — | | | | — | | | | 2,252 | | | | — | | | | — | | | | 37 | | | | 2,289 | |
Other comprehensive earnings, net of tax | | | — | | | | — | | | | — | | | | — | | | | 3 | | | | — | | | | — | | | | 3 | |
Restricted stock grants, net of cancellations | | | 2 | | | | — | | | | — | | | | — | | | | — | | | | — | | | | — | | | | — | |
Common stock repurchased | | | — | | | | — | | | | — | | | | — | | | | — | | | | (792 | ) | | | — | | | | (792 | ) |
Common stock retired | | | (18 | ) | | | (2 | ) | | | (803 | ) | | | — | | | | — | | | | 805 | | | | — | | | | — | |
Common stock dividends | | | — | | | | — | | | | — | | | | (777 | ) | | | — | | | | — | | | | — | | | | (777 | ) |
Common stock issued | | | 37 | | | | 4 | | | | 1,451 | | | | — | | | | — | | | | — | | | | — | | | | 1,455 | |
Share-based compensation | | | 1 | | | | — | | | | 75 | | | | — | | | | — | | | | — | | | | — | | | | 75 | |
Contributions from noncontrolling interests | | | — | | | | — | | | | — | | | | — | | | | — | | | | — | | | | 44 | | | | 44 | |
Distributions to noncontrolling interests | | | — | | | | — | | | | — | | | | — | | | | — | | | | — | | | | (36 | ) | | | (36 | ) |
Balance as of September 30, 2024 | | | 658 | | | $ | 66 | | | $ | 6,662 | | | $ | 7,670 | | | $ | (121 | ) | | $ | — | | | $ | 201 | | | $ | 14,478 | |
Nine Months Ended September 30, 2023 | | | | | | | | | | | | | | | | | | | | | | | | |
Balance as of December 31, 2022 | | | 653 | | | $ | 65 | | | $ | 6,921 | | | $ | 4,297 | | | $ | (116 | ) | | $ | — | | | $ | 129 | | | $ | 11,296 | |
Net earnings | | | — | | | | — | | | | — | | | | 2,595 | | | | — | | | | — | | | | 26 | | | | 2,621 | |
Other comprehensive earnings, net of tax | | | — | | | | — | | | | — | | | | — | | | | 3 | | | | — | | | | — | | | | 3 | |
Restricted stock grants, net of cancellations | | | 2 | | | | — | | | | — | | | | — | | | | — | | | | — | | | | — | | | | — | |
Common stock repurchased | | | — | | | | — | | | | (6 | ) | | | — | | | | — | | | | (833 | ) | | | — | | | | (839 | ) |
Common stock retired | | | (15 | ) | | | (1 | ) | | | (832 | ) | | | — | | | | — | | | | 833 | | | | — | | | | — | |
Common stock dividends | | | — | | | | — | | | | — | | | | (1,357 | ) | | | — | | | | — | | | | — | | | | (1,357 | ) |
Share-based compensation | | | 1 | | | | — | | | | 70 | | | | — | | | | — | | | | — | | | | — | | | | 70 | |
Contributions from noncontrolling interests | | | — | | | | — | | | | — | | | | — | | | | — | | | | — | | | | 18 | | | | 18 | |
Distributions to noncontrolling interests | | | — | | | | — | | | | — | | | | — | | | | — | | | | — | | | | (33 | ) | | | (33 | ) |
Balance as of September 30, 2023 | | | 641 | | | $ | 64 | | | $ | 6,153 | | | $ | 5,535 | | | $ | (113 | ) | | $ | — | | | $ | 140 | | | $ | 11,779 | |
See accompanying notes to consolidated financial statements.
DEVON ENERGY CORPORATION AND SUBSIDIARIES
NOTES TO CONSOLIDATED FINANCIAL STATEMENTS
(Unaudited)
1.Summary of Significant Accounting Policies
The accompanying unaudited interim financial statements and notes of Devon have been prepared pursuant to the rules and regulations of the SEC. Pursuant to such rules and regulations, certain disclosures normally included in financial statements prepared in accordance with U.S. GAAP have been omitted. The accompanying unaudited interim financial statements and notes should be read in conjunction with the financial statements and notes included in Devon’s 2023 Annual Report on Form 10-K. The accompanying unaudited interim financial statements in this report reflect all adjustments that are, in the opinion of management, necessary for a fair statement of Devon’s results of operations and cash flows for the three-month and nine-month periods ended September 30, 2024 and 2023 and Devon’s financial position as of September 30, 2024.
On September 27, 2024, Devon acquired the Williston Basin business of Grayson Mill for total consideration of approximately $5.0 billion, consisting of $3.5 billion of cash and approximately 37.3 million shares of Devon common stock, including purchase price adjustments. The transaction has been accounted for using the acquisition method of accounting. See Note 2 for further discussion.
Variable Interest Entity
CDM is a joint venture entity formed by Devon and an affiliate of QL Capital Partners, LP. CDM provides gathering, compression and dehydration services for natural gas production in the Cotton Draw area of the Delaware Basin. Devon holds a controlling interest in CDM and the portions of CDM’s net earnings and equity not attributable to Devon’s controlling interest are shown separately as noncontrolling interests in the accompanying consolidated statements of comprehensive earnings and consolidated balance sheets. CDM is considered a VIE to Devon. The assets of CDM cannot be used by Devon for general corporate purposes and are included in, and disclosed parenthetically, on Devon's consolidated balance sheets. The carrying amount of liabilities related to CDM for which the creditors do not have recourse to Devon's assets are also included in, and disclosed parenthetically, if material, on Devon's consolidated balance sheets.
Investments
The following table presents Devon's investments.
| | | | | | | | | | |
| | | | Carrying Amount | |
Investments | | % Interest | | September 30, 2024 | | | December 31, 2023 | |
Catalyst | | 50% | | $ | 282 | | | $ | 311 | |
Water JV | | 30% | | | 216 | | | | 216 | |
Matterhorn | | 12.5% | | | 90 | | | | 90 | |
Fervo | | 14% | | | 77 | | | | — | |
Other | | Various | | | 53 | | | | 49 | |
Total | | | | $ | 718 | | | $ | 666 | |
Devon has an interest in Catalyst, which is a joint venture with an affiliate of Howard Energy Partners, LLC (“HEP”) and certain other investors, to develop oil gathering and natural gas processing infrastructure in the Stateline area of the Delaware Basin. Under the terms of the arrangement, Devon and a holding company owned by the other joint venture investors each have a 50% voting interest in the joint venture legal entity, and HEP serves as the operator. Through 2038, Devon’s production from 50,000 net acres in the Stateline area of the Delaware Basin has been dedicated to Catalyst subject to fixed-fee oil gathering and natural gas processing agreements. Devon accounts for the investment in Catalyst as an equity method investment. Devon's investment in Catalyst is shown within investments on the consolidated balance sheets and Devon's share of Catalyst earnings are reflected as a component of other, net in the accompanying consolidated statements of comprehensive earnings.
In the second quarter of 2023, Devon made an investment in the Water JV, a joint venture entity formed with an affiliate of WaterBridge NDB LLC (“WaterBridge”), for the purpose of providing increased capacity and flexibility in disposing of produced water in the Delaware Basin and Eagle Ford. Under terms of the arrangement, Devon contributed water infrastructure assets and committed to a water gathering and disposal dedication to the Water JV through 2038, in exchange for a 30% voting interest in the joint venture legal entity. WaterBridge contributed water infrastructure assets to the Water JV, in exchange for a 70% voting interest in the joint venture legal entity and will serve as the operator. In the second quarter of 2023, Devon recognized a $64 million gain in asset dispositions in the consolidated statements of comprehensive earnings, which represented the excess of the estimated fair value of Devon's interest in the Water JV over the carrying value of the water infrastructure assets Devon contributed to the Water JV.
DEVON ENERGY CORPORATION AND SUBSIDIARIES
NOTES TO CONSOLIDATED FINANCIAL STATEMENTS – (Continued)
(Unaudited)
Devon accounts for the investment in the Water JV as an equity method investment. Devon's investment in the Water JV is shown within investments on the consolidated balance sheets and Devon's share of the Water JV earnings are reflected as a component of other, net in the accompanying consolidated statements of comprehensive earnings.
Devon has an interest in Matterhorn, which is a joint venture in a natural gas pipeline which transports natural gas from the Permian Basin to the Katy, Texas area. Devon's investment in Matterhorn does not give it the ability to exercise significant influence over Matterhorn.
In the first quarter of 2024, Devon committed to invest approximately $100 million in Fervo, a company that generates energy from geothermal wells. As of September 30, 2024, Devon has funded approximately $78 million of the commitment and expects to fund the remaining $22 million commitment in the fourth quarter of 2024. The investment in Fervo allows Devon to exercise significant influence over Fervo, and the investment is accounted for under the equity method of accounting. Devon's investment in Fervo is shown within investments on the consolidated balance sheets and Devon's share of Fervo earnings are reflected as a component of other, net in the accompanying consolidated statements of comprehensive earnings.
Disaggregation of Revenue
The following table presents revenue from contracts with customers that are disaggregated based on the type of good or service.
| | | | | | | | | | | | | | | | |
| | Three Months Ended September 30, | | | Nine Months Ended September 30, | |
| | 2024 | | | 2023 | | | 2024 | | | 2023 | |
Oil | | $ | 2,273 | | | $ | 2,377 | | | $ | 6,875 | | | $ | 6,626 | |
Gas | | | 49 | | | | 189 | | | | 234 | | | | 524 | |
NGL | | | 343 | | | | 316 | | | | 981 | | | | 904 | |
Oil, gas and NGL sales | | | 2,665 | | | | 2,882 | | | | 8,090 | | | | 8,054 | |
| | | | | | | | | | | | |
Oil | | | 815 | | | | 795 | | | | 2,423 | | | | 2,260 | |
Gas | | | 105 | | | | 153 | | | | 326 | | | | 428 | |
NGL | | | 212 | | | | 200 | | | | 593 | | | | 577 | |
Marketing and midstream revenues | | | 1,132 | | | | 1,148 | | | | 3,342 | | | | 3,265 | |
Total revenues from contracts with customers | | $ | 3,797 | | | $ | 4,030 | | | $ | 11,432 | | | $ | 11,319 | |
Recently Issued Accounting Standards Not Yet Adopted
In December 2023, the FASB issued ASU 2023-09, Improvements to Income Tax Disclosures. ASU 2023-09 intends to provide investors with enhanced information about an entity’s income taxes by requiring disclosure of items such as disaggregation of the effective tax rate reconciliation as well as information regarding income taxes paid. This ASU will result in additional disclosures for annual reporting periods beginning after December 15, 2024, with early adoption permitted for annual financial statements that have not yet been issued.
In November 2023, the FASB issued ASU 2023-07, Improvements to Reportable Segments Disclosures. Under this ASU, the scope and frequency of segment disclosures is increased to provide investors with additional detail about information utilized by an entity’s “Chief Operating Decision Maker.” This ASU will result in additional disclosures for Devon beginning with our 2024 annual reporting and interim periods beginning in 2025.
2. Acquisitions and Divestitures
Acquisition
On September 27, 2024, Devon completed its acquisition of the Williston Basin business of Grayson Mill for total consideration of approximately $5.0 billion, consisting of $3.5 billion of cash and approximately 37.3 million shares of Devon common stock, including purchase price adjustments. Devon funded the cash portion of the purchase price through cash on hand and debt financing. For additional information regarding the debt financing, see Note 11.
DEVON ENERGY CORPORATION AND SUBSIDIARIES
NOTES TO CONSOLIDATED FINANCIAL STATEMENTS – (Continued)
(Unaudited)
Purchase Price Allocation
This transaction has been accounted for using the acquisition method of accounting. Under the acquisition method of accounting, the assets and liabilities of Grayson Mill and its subsidiaries have been recorded at their respective fair values as of the date of completion of the acquisition and added to Devon’s. The preliminary purchase price assessment remains an ongoing process and is subject to change for up to one year subsequent to the closing date of the acquisition. Determining the fair value of the assets and liabilities of Grayson Mill requires judgment and certain assumptions to be made, the most significant of these being related to the valuation of Grayson Mill’s oil and gas properties. The inputs and assumptions related to the oil and gas properties are categorized as level 3 in the fair value hierarchy.
The following table represents the preliminary allocation of the total purchase price of Grayson Mill to the identifiable assets acquired and the liabilities assumed based on the fair values as of the acquisition date.
| | | | |
| | Preliminary Purchase | |
| | Price Allocation | |
| | as of September 27, 2024 | |
Consideration: | | | |
Devon common stock issued | | | 37.3 | |
Devon closing price on September 27, 2024 | | $ | 38.96 | |
Total common equity consideration | | $ | 1,455 | |
Cash consideration | | | 3,567 | |
Total consideration | | $ | 5,022 | |
Assets acquired: | | | |
Cash, cash equivalents and restricted cash | | $ | 147 | |
Accounts receivable | | | 226 | |
Inventory | | | 38 | |
Other current assets | | | 9 | |
Proved oil and gas property and equipment | | | 2,931 | |
Unproved oil and gas property and equipment | | | 1,905 | |
Other property and equipment, net | | | 210 | |
Right-of-use assets | | | 29 | |
Total assets acquired | | $ | 5,495 | |
Liabilities assumed: | | | |
Accounts payable | | $ | 155 | |
Revenue and royalties payable | | | 209 | |
Other current liabilities | | | 16 | |
Asset retirement obligations | | | 75 | |
Lease liabilities | | | 18 | |
Total liabilities assumed | | | 473 | |
Net assets acquired | | $ | 5,022 | |
Grayson Mill Revenues and Earnings
From the date of the acquisition through September 30, 2024, revenues and net earnings included in Devon's consolidated statements of comprehensive earnings associated with these assets totaled $28 million and $4 million, respectively.
DEVON ENERGY CORPORATION AND SUBSIDIARIES
NOTES TO CONSOLIDATED FINANCIAL STATEMENTS – (Continued)
(Unaudited)
Pro Forma Financial Information
The following unaudited pro forma financial information is based on our historical consolidated financial statements adjusted to reflect as if the Grayson Mill acquisition had occurred on January 1, 2023. The information below reflects pro forma adjustments to conform Grayson Mill's historical financial information to Devon’s financial statement presentation. The unaudited pro forma financial information is not necessarily indicative of what would have occurred if the acquisition had been completed as of the beginning of the periods presented, nor is it indicative of future results.
| | | | | | | | | | | | | | | | |
| | Three Months Ended September 30, | | | Nine Months Ended September 30, | |
| | 2024 | | | 2023 | | | 2024 | | | 2023 | |
Total revenues | | $ | 4,691 | | | $ | 4,553 | | | $ | 13,563 | | | $ | 12,679 | |
Net earnings | | $ | 895 | | | $ | 1,044 | | | $ | 2,524 | | | $ | 2,827 | |
Contingent Earnout Payments
Devon is entitled to contingent earnout payments associated with the sale of its Barnett Shale assets in 2020 with upside participation beginning at a $2.75 Henry Hub natural gas price or a $50 WTI oil price. The contingent payment period commenced on January 1, 2021 and has a term of four years. Devon received $20 million in contingent earnout payments related to this transaction in the first quarter of 2024 and $65 million in the first quarter of 2023. Devon could also receive up to an additional $65 million in contingent earnout payments for the remaining performance period depending on future commodity prices. The valuation of the future contingent earnout payment included within other current assets in the September 30, 2024 consolidated balance sheet was approximately $20 million. This value was derived utilizing a Monte Carlo valuation model and qualifies as a level 3 fair value measurement.
Devon also received $4 million in contingent earnout payments in the first quarter of 2023 related to the sale of non-core assets in the Rockies.
3.Derivative Financial Instruments
Objectives and Strategies
Devon enters into derivative financial instruments with respect to a portion of its oil, gas and NGL production to hedge future prices received. Additionally, Devon periodically enters into derivative financial instruments with respect to a portion of its oil, gas and NGL marketing activities. These commodity derivative financial instruments include financial price swaps, basis swaps and costless price collars. Devon also periodically enters into interest rate swaps to manage its exposure to interest rate volatility. As of September 30, 2024, Devon did not have any open interest rate contracts.
Devon does not intend to hold or issue derivative financial instruments for speculative trading purposes and has elected not to designate any of its derivative instruments for hedge accounting treatment.
Counterparty Credit Risk
By using derivative financial instruments, Devon is exposed to credit risk. Credit risk is the failure of the counterparty to perform under the terms of the derivative contract. To mitigate this risk, the hedging instruments are placed with a number of counterparties whom Devon believes are acceptable credit risks. It is Devon’s policy to enter into derivative contracts only with investment-grade rated counterparties deemed by management to be competent and competitive market makers. Additionally, Devon’s derivative contracts generally contain provisions that provide for collateral payments if Devon’s or its counterparty’s credit rating falls below certain credit rating levels. As of September 30, 2024, Devon neither held cash collateral of its counterparties nor posted cash collateral to its counterparties.
DEVON ENERGY CORPORATION AND SUBSIDIARIES
NOTES TO CONSOLIDATED FINANCIAL STATEMENTS – (Continued)
(Unaudited)
Commodity Derivatives
As of September 30, 2024, Devon had the following open oil derivative positions. The first table presents Devon’s oil derivatives that settle against the average of the prompt month NYMEX WTI futures price. The second table presents Devon’s oil derivatives that settle against the respective indices noted within the table.
| | | | | | | | | | | | | | | | | | | | | |
| | Price Swaps | | | Price Collars | | |
Period | | Volume
(Bbls/d) | | | Weighted
Average
Price ($/Bbl) | | | Volume
(Bbls/d) | | | Weighted
Average Floor
Price ($/Bbl) | | | Weighted
Average
Ceiling Price
($/Bbl) | | |
Q4 2024 | | | 33,000 | | | $ | 78.38 | | | | 98,000 | | | $ | 68.64 | | | $ | 83.73 | | |
Q1-Q4 2025 | | | 8,468 | | | $ | 71.90 | | | | 26,992 | | | $ | 70.00 | | | $ | 76.58 | | |
| | | | | | | | | | |
| | Oil Basis Swaps | |
Period | | Index | | Volume
(Bbls/d) | | | Weighted Average
Differential to WTI
($/Bbl) | |
Q4 2024 | | Midland Sweet | | | 69,500 | | | $ | 1.17 | |
Q4 2024 | | NYMEX Roll | | | 26,000 | | | $ | 0.82 | |
Q1-Q4 2025 | | Midland Sweet | | | 63,000 | | | $ | 1.00 | |
Q1-Q4 2026 | | Midland Sweet | | | 18,000 | | | $ | 1.21 | |
As of September 30, 2024, Devon had the following open natural gas derivative positions. The first table presents Devon’s natural gas derivatives that settle against the Inside FERC first of the month Henry Hub index. The second table presents Devon’s natural gas derivatives that settle against the respective indices noted within the table.
| | | | | | | | | | | | | | | | | | | | |
| | Price Swaps | | | Price Collars | |
Period | | Volume (MMBtu/d) | | | Weighted Average Price ($/MMBtu) | | | Volume (MMBtu/d) | | | Weighted Average Floor Price ($/MMBtu) | | | Weighted Average
Ceiling Price ($/MMBtu) | |
Q4 2024 | | | 252,000 | | | $ | 3.16 | | | | 15,000 | | | $ | 3.00 | | | $ | 3.65 | |
Q1-Q4 2025 | | | 220,537 | | | $ | 3.34 | | | | 55,000 | | | $ | 3.00 | | | $ | 3.69 | |
Q1-Q4 2026 | | | 130,000 | | | $ | 3.78 | | | | 50,000 | | | $ | 3.25 | | | $ | 4.18 | |
| | | | | | | | | | |
| | Natural Gas Basis Swaps | |
Period | | Index | | Volume
(MMBtu/d) | | | Weighted Average
Differential to
Henry Hub
($/MMBtu) | |
Q4 2024 | | El Paso Natural Gas | | | 10,000 | | | $ | (1.00 | ) |
Q4 2024 | | Houston Ship Channel | | | 160,000 | | | $ | (0.28 | ) |
Q4 2024 | | WAHA | | | 80,000 | | | $ | (0.74 | ) |
Q1-Q4 2025 | | Houston Ship Channel | | | 170,000 | | | $ | (0.36 | ) |
Q1-Q4 2025 | | WAHA | | | 50,000 | | | $ | (1.04 | ) |
Q1-Q4 2026 | | Houston Ship Channel | | | 50,000 | | | $ | (0.29 | ) |
As of September 30, 2024, Devon had the following open NGL derivative positions. Devon's NGL positions settle against the average of the prompt month OPIS Mont Belvieu, Texas index.
| | | | | | | | | | |
| | | | Price Swaps | |
Period | | Product | | Volume (Bbls/d) | | | Weighted Average Price ($/Bbl) | |
Q4 2024 | | Natural Gasoline | | | 3,000 | | | $ | 69.11 | |
Q4 2024 | | Normal Butane | | | 3,350 | | | $ | 37.58 | |
Q4 2024 | | Propane | | | 5,250 | | | $ | 33.01 | |
DEVON ENERGY CORPORATION AND SUBSIDIARIES
NOTES TO CONSOLIDATED FINANCIAL STATEMENTS – (Continued)
(Unaudited)
Financial Statement Presentation
All derivative financial instruments are recognized at their current fair value as either assets or liabilities in the consolidated balance sheets. Amounts related to contracts allowed to be netted upon payment subject to a master netting arrangement with the same counterparty are reported on a net basis in the consolidated balance sheets. The table below presents a summary of these positions as of September 30, 2024 and December 31, 2023.
| | | | | | | | | | | | | | | | | | | |
| September 30, 2024 | | December 31, 2023 | | |
| Gross Fair Value | | Amounts Netted | | Net Fair Value | | Gross Fair Value | | Amounts Netted | | Net Fair Value | | Balance Sheet Classification |
Commodity derivatives: | | | | | | | | | | | | | |
Short-term derivative asset | $ | 153 | | $ | (12 | ) | $ | 141 | | $ | 213 | | $ | (5 | ) | $ | 208 | | Other current assets |
Long-term derivative asset | | 32 | | | (5 | ) | | 27 | | | — | | | — | | | — | | Other long-term assets |
Short-term derivative liability | | (14 | ) | | 12 | | | (2 | ) | | (7 | ) | | 5 | | | (2 | ) | Other current liabilities |
Long-term derivative liability | | (6 | ) | | 5 | | | (1 | ) | | (7 | ) | | — | | | (7 | ) | Other long-term liabilities |
Total derivative asset | $ | 165 | | $ | — | | $ | 165 | | $ | 199 | | $ | — | | $ | 199 | | |
4.Share-Based Compensation
The table below presents the share-based compensation expense included in Devon’s accompanying consolidated statements of comprehensive earnings.
| | | | | | | | |
| | Nine Months Ended September 30, | |
| | 2024 | | | 2023 | |
G&A | | $ | 74 | | | $ | 70 | |
Exploration expenses | | | 1 | | | | — | |
Total | | $ | 75 | | | $ | 70 | |
| | | | | | |
Related income tax benefit | | $ | 21 | | | $ | 31 | |
Under its approved long-term incentive plan, Devon grants share-based awards to its employees. The following table presents a summary of Devon’s unvested restricted stock awards and units and performance share units granted under the plan.
| | | | | | | | | | | | | | | | |
| | Restricted Stock Awards & Units | | | Performance Share Units | |
| | Awards/Units | | | Weighted
Average
Grant-Date
Fair Value | | | Units | | | Weighted
Average
Grant-Date
Fair Value | |
| | (Thousands, except fair value data) | |
Unvested at 12/31/23 | | | 4,033 | | | $ | 42.10 | | | | 1,547 | | | $ | 43.25 | |
Granted | | | 1,936 | | | $ | 42.53 | | | | 858 | | | $ | 40.41 | |
Vested | | | (1,805 | ) | | $ | 34.83 | | | | (1,226 | ) | | $ | 18.08 | |
Forfeited | | | (79 | ) | | $ | 45.44 | | | | — | | | $ | — | |
Unvested at 9/30/24 | | | 4,085 | | | $ | 45.45 | | | | 1,179 | | (1) | $ | 67.38 | |
(1)A maximum of 2.4 million common shares could be awarded based upon Devon’s final TSR ranking.
DEVON ENERGY CORPORATION AND SUBSIDIARIES
NOTES TO CONSOLIDATED FINANCIAL STATEMENTS – (Continued)
(Unaudited)
The following table presents the assumptions related to the performance share units granted in 2024, as indicated in the previous summary table. The grants in the previous summary table also include the impacts of performance share units granted in a prior year that vested higher than 100% of target due to Devon's TSR performance compared to our peers.
| | | | |
| | 2024 | |
Grant-date fair value | | $ | 56.99 | |
Risk-free interest rate | | | 4.28 | % |
Volatility factor | | | 46.03 | % |
Contractual term (years) | | | 2.89 | |
The following table presents a summary of the unrecognized compensation cost and the related weighted average recognition period associated with unvested awards and units as of September 30, 2024.
| | | | | | | | |
| | Restricted Stock | | | Performance | |
| | Awards/Units | | | Share Units | |
Unrecognized compensation cost | | $ | 116 | | | $ | 26 | |
Weighted average period for recognition (years) | | | 2.6 | | | | 1.7 | |
5. Income Taxes
The following table presents Devon’s total income tax expense and a reconciliation of its effective income tax rate to the U.S. statutory income tax rate.
| | | | | | | | | | | | | |
| | Three Months Ended September 30, | | Nine Months Ended September 30, | |
| | 2024 | | 2023 | | 2024 | | 2023 | |
Earnings before income taxes | | $ | 1,064 | | $ | 1,072 | | $ | 2,872 | | $ | 3,193 | |
| | | | | | | | | |
Current income tax expense | | $ | 75 | | $ | 139 | | $ | 340 | | $ | 360 | |
Deferred income tax expense | | | 164 | | | 13 | | | 243 | | | 212 | |
Total income tax expense | | $ | 239 | | $ | 152 | | $ | 583 | | $ | 572 | |
| | | | | | | | | |
U.S. statutory income tax rate | | | 21 | % | | 21 | % | | 21 | % | | 21 | % |
State income taxes | | | 3 | % | | 1 | % | | 2 | % | | 1 | % |
Income tax credits | | | (2 | %) | | (8 | %) | | (3 | %) | | (4 | %) |
Effective income tax rate | | | 22 | % | | 14 | % | | 20 | % | | 18 | % |
In the first nine months of 2024 and 2023, Devon recognized income tax credits associated with its qualified research activities.
DEVON ENERGY CORPORATION AND SUBSIDIARIES
NOTES TO CONSOLIDATED FINANCIAL STATEMENTS – (Continued)
(Unaudited)
The following table reconciles net earnings available to common shareholders and weighted-average common shares outstanding used in the calculations of basic and diluted net earnings per share.
| | | | | | | | | | | | | | | | |
| | Three Months Ended September 30, | | | Nine Months Ended September 30, | |
| | 2024 | | | 2023 | | | 2024 | | | 2023 | |
Net earnings available to common shareholders - basic and diluted | | $ | 812 | | | $ | 910 | | | $ | 2,252 | | | $ | 2,595 | |
Common shares: | | | | | | | | | | | | |
Average common shares outstanding - basic | | | 622 | | | | 637 | | | | 626 | | | | 640 | |
Dilutive effect of potential common shares issuable | | | 1 | | | | 2 | | | | 2 | | | | 3 | |
Average common shares outstanding - diluted | | | 623 | | | | 639 | | | | 628 | | | | 643 | |
Net earnings per share available to common shareholders: | | | | | | | | | | | | |
Basic | | $ | 1.31 | | | $ | 1.43 | | | $ | 3.60 | | | $ | 4.05 | |
Diluted | | $ | 1.30 | | | $ | 1.42 | | | $ | 3.59 | | | $ | 4.03 | |
7. Other Comprehensive Earnings (Loss)
Components of other comprehensive earnings (loss) consist of the following:
| | | | | | | | | | | | | | | | |
| | Three Months Ended September 30, | | | Nine Months Ended September 30, | |
| | 2024 | | | 2023 | | | 2024 | | | 2023 | |
Pension and postretirement benefit plans: | | | | | | | | | | | | |
Beginning accumulated pension and postretirement benefits | | $ | (122 | ) | | $ | (114 | ) | | $ | (124 | ) | | $ | (116 | ) |
Recognition of net actuarial loss and prior service cost in earnings (1) | | | 1 | | | | 1 | | | | 4 | | | | 4 | |
Income tax expense | | | — | | | | — | | | | (1 | ) | | | (1 | ) |
Accumulated other comprehensive loss, net of tax | | $ | (121 | ) | | $ | (113 | ) | | $ | (121 | ) | | $ | (113 | ) |
(1)Recognition of net actuarial loss and prior service cost are included in the computation of net periodic benefit cost, which is a component of other, net in the accompanying consolidated statements of comprehensive earnings.
8.Supplemental Information to Statements of Cash Flows
| | | | | | | | | | | | | | | | |
| | Three Months Ended September 30, | | | Nine Months Ended September 30, | |
| | 2024 | | | 2023 | | | 2024 | | | 2023 | |
Changes in assets and liabilities, net: | | | | | | | | | | | | |
Accounts receivable | | $ | 41 | | | $ | (334 | ) | | $ | 26 | | | $ | (86 | ) |
Other current assets | | | (13 | ) | | | 27 | | | | (120 | ) | | | 31 | |
Other long-term assets | | | (9 | ) | | | (31 | ) | | | 24 | | | | (13 | ) |
Accounts payable and revenues and royalties payable | | | (64 | ) | | | 194 | | | | 121 | | | | (36 | ) |
Other current liabilities | | | 57 | | | | 88 | | | | (51 | ) | | | (53 | ) |
Other long-term liabilities | | | 4 | | | | (5 | ) | | | (15 | ) | | | (32 | ) |
Total | | $ | 16 | | | $ | (61 | ) | | $ | (15 | ) | | $ | (189 | ) |
Supplementary cash flow data: | | | | | | | | | | | | |
Interest paid | | $ | 90 | | | $ | 77 | | | $ | 265 | | | $ | 266 | |
Income taxes paid | | $ | 92 | | | $ | 50 | | | $ | 476 | | | $ | 309 | |
Devon's non-cash investing activities for the nine months ended September 30, 2023, included approximately $150 million of contributions of other property and equipment for the formation of the Water JV.
DEVON ENERGY CORPORATION AND SUBSIDIARIES
NOTES TO CONSOLIDATED FINANCIAL STATEMENTS – (Continued)
(Unaudited)
Components of accounts receivable include the following:
| | | | | | | | |
| | September 30, 2024 | | | December 31, 2023 | |
Oil, gas and NGL sales | | $ | 989 | | | $ | 965 | |
Joint interest billings | | | 321 | | | | 251 | |
Marketing and midstream revenues | | | 442 | | | | 342 | |
Other | | | 34 | | | | 22 | |
Gross accounts receivable | | | 1,786 | | | | 1,580 | |
Allowance for doubtful accounts | | | (7 | ) | | | (7 | ) |
Net accounts receivable | | $ | 1,779 | | | $ | 1,573 | |
10. Property, Plant and Equipment
The following table presents the aggregate capitalized costs related to Devon’s oil and gas and non-oil and gas activities.
| | | | | | | | |
| | September 30, 2024 | | | December 31, 2023 | |
Property and equipment: | | | | | | |
Proved | | $ | 52,190 | | | $ | 46,659 | |
Unproved and properties under development | | | 3,286 | | | | 1,279 | |
Total oil and gas | | | 55,476 | | | | 47,938 | |
Less accumulated DD&A | | | (32,321 | ) | | | (30,113 | ) |
Oil and gas property and equipment, net | | | 23,155 | | | | 17,825 | |
Other property and equipment | | | 2,630 | | | | 2,289 | |
Less accumulated DD&A | | | (835 | ) | | | (786 | ) |
Other property and equipment, net (1) | | | 1,795 | | | | 1,503 | |
Property and equipment, net | | $ | 24,950 | | | $ | 19,328 | |
(1)$164 million and $136 million related to CDM in 2024 and 2023, respectively.
DEVON ENERGY CORPORATION AND SUBSIDIARIES
NOTES TO CONSOLIDATED FINANCIAL STATEMENTS – (Continued)
(Unaudited)
11.Debt and Related Expenses
See below for a summary of debt instruments and balances. The notes, debentures and Term Loan reflected below are senior, unsecured obligations of Devon.
| | | | | | | | |
| | September 30, 2024 | | | December 31, 2023 | |
5.25% due September 15, 2024 | | $ | — | | | $ | 472 | |
5.85% due December 15, 2025 | | | 485 | | | | 485 | |
7.50% due September 15, 2027 | | | 73 | | | | 73 | |
5.25% due October 15, 2027 | | | 390 | | | | 390 | |
5.875% due June 15, 2028 | | | 325 | | | | 325 | |
4.50% due January 15, 2030 | | | 585 | | | | 585 | |
7.875% due September 30, 2031 | | | 675 | | | | 675 | |
7.95% due April 15, 2032 | | | 366 | | | | 366 | |
5.20% due September 15, 2034 | | | 1,250 | | | | — | |
5.60% due July 15, 2041 | | | 1,250 | | | | 1,250 | |
4.75% due May 15, 2042 | | | 750 | | | | 750 | |
5.00% due June 15, 2045 | | | 750 | | | | 750 | |
5.75% due September 15, 2054 | | | 1,000 | | | | — | |
Term Loan due September 25, 2026 | | | 1,000 | | | | — | |
Net premium on debentures and notes | | | 41 | | | | 64 | |
Debt issuance costs | | | (56 | ) | | | (30 | ) |
Total debt | | $ | 8,884 | | | $ | 6,155 | |
Less amount classified as short-term debt | | | — | | | | 483 | |
Total long-term debt | | $ | 8,884 | | | $ | 5,672 | |
Credit Lines
In 2023, Devon amended and restated its 2018 Senior Credit Facility to provide for a new $3.0 billion revolving 2023 Senior Credit Facility. In the first quarter of 2024, Devon exercised its option to extend the 2023 Senior Credit Facility maturity date from March 24, 2028 to March 24, 2029. Devon has the option to extend the March 24, 2029 maturity date by two additional one-year periods subject to lender consent. As of September 30, 2024, Devon had no outstanding borrowings under the 2023 Senior Credit Facility and had issued $4 million in outstanding letters of credit under this facility. The 2023 Senior Credit Facility contains only one material financial covenant. This covenant requires Devon's ratio of total funded debt to total capitalization, as defined in the credit agreement, to be no greater than 65%. Under the terms of the credit agreement, total capitalization is adjusted to add back non-cash financial write-downs such as impairments. As of September 30, 2024, Devon was in compliance with this covenant with a debt-to-capitalization ratio of 26.7%
Term Loan Credit Agreement
On August 12, 2024, Devon entered into a delayed draw term loan credit agreement (the “Term Loan Credit Agreement”), providing for delayed draw term loans in an aggregate principal amount not to exceed $2.0 billion, including a 364-day tranche of $500 million and a two-year tranche of $1.5 billion. On September 27, 2024, Devon borrowed $1.0 billion on the two-year tranche (the “Term Loan”) to partially fund the closing of the Grayson Mill acquisition. In connection with the borrowing of the Term Loan, the undrawn commitments under the Term Loan Credit Agreement automatically terminated. The Term Loan bears interest at a rate based on term SOFR plus a spread adjustment that varies based on Devon's credit ratings. The interest rate on the Term Loan was 6.33% as of September 30, 2024.
The Term Loan Credit Agreement contains substantially the same financial covenant as the 2023 Senior Credit Facility. As of September 30, 2024, Devon was in compliance with this covenant with a debt-to-capitalization ratio of 26.7%.
Issuance of Senior Notes
On August 28, 2024, Devon issued $1.25 billion of 5.20% senior notes due 2034 and $1.0 billion of 5.75% senior notes due 2054. Devon used the net proceeds to partially fund the Grayson Mill acquisition. For additional information, see Note 2.
DEVON ENERGY CORPORATION AND SUBSIDIARIES
NOTES TO CONSOLIDATED FINANCIAL STATEMENTS – (Continued)
(Unaudited)
Retirement of Senior Notes
On September 15, 2024 and August 1, 2023, Devon repaid the $472 million of 5.25% senior notes and $242 million of 8.25% senior notes at maturity, respectively.
Net Financing Costs
The following schedule includes the components of net financing costs.
| | | | | | | | | | | | | | | | |
| | Three Months Ended September 30, | | | Nine Months Ended September 30, | |
| | 2024 | | | 2023 | | | 2024 | | | 2023 | |
Interest based on debt outstanding | | $ | 98 | | | $ | 93 | | | $ | 273 | | | $ | 282 | |
Interest income | | | (19 | ) | | | (11 | ) | | | (46 | ) | | | (43 | ) |
Other | | | 9 | | | | (1 | ) | | | 13 | | | | (8 | ) |
Total net financing costs | | $ | 88 | | | $ | 81 | | | $ | 240 | | | $ | 231 | |
12. Leases
The following table presents Devon’s right-of-use assets and lease liabilities as of September 30, 2024 and December 31, 2023.
| | | | | | | | | | | | | | | | | | | | | | | | |
| | September 30, 2024 | | | December 31, 2023 | |
| | Finance | | | Operating | | | Total | | | Finance | | | Operating | | | Total | |
Right-of-use assets | | $ | 257 | | | $ | 60 | | | $ | 317 | | | $ | 246 | | | $ | 21 | | | $ | 267 | |
Lease liabilities: | | | | | | | | | | | | | | | | | | |
Current lease liabilities (1) | | $ | 27 | | | $ | 30 | | | $ | 57 | | | $ | 21 | | | $ | 12 | | | $ | 33 | |
Long-term lease liabilities | | | 298 | | | | 30 | | | | 328 | | | | 286 | | | | 9 | | | | 295 | |
Total lease liabilities (2) | | $ | 325 | | | $ | 60 | | | $ | 385 | | | $ | 307 | | | $ | 21 | | | $ | 328 | |
(1)Current lease liabilities are included in other current liabilities on the consolidated balance sheets.
(2)Devon has entered into certain leases of equipment related to the exploration, development and production of oil and gas that had terms not yet commenced as of September 30, 2024 and are therefore excluded from the amounts shown above.
Devon’s operating lease right-of-use assets relate to real estate, drilling rigs and other equipment related to the exploration, development and production of oil and gas. Devon’s financing lease right-of-use assets primarily relate to real estate.
13.Asset Retirement Obligations
The following table presents the changes in Devon’s asset retirement obligations.
| | | | | | | | |
| | Nine Months Ended September 30, | |
| | 2024 | | | 2023 | |
Asset retirement obligations as of beginning of period | | $ | 665 | | | $ | 529 | |
Assumed Grayson Mill obligations | | | 75 | | | | — | |
Liabilities incurred | | | 21 | | | | 104 | |
Liabilities settled and divested | | | (25 | ) | | | (24 | ) |
Revision of estimated obligation | | | 35 | | | | 27 | |
Accretion expense on discounted obligation | | | 28 | | | | 21 | |
Asset retirement obligations as of end of period | | | 799 | | | | 657 | |
Less current portion | | | 34 | | | | 16 | |
Asset retirement obligations, long-term | | $ | 765 | | | $ | 641 | |
During the first nine months of 2024, Devon increased its asset retirement obligations by approximately $35 million primarily due to changes in current cost estimates and future retirement dates for its oil and gas assets. During the first nine months of 2023,
DEVON ENERGY CORPORATION AND SUBSIDIARIES
NOTES TO CONSOLIDATED FINANCIAL STATEMENTS – (Continued)
(Unaudited)
Devon increased its asset retirement obligations by approximately $27 million primarily due to inflation-driven increases in cost estimates.
Devon's asset retirement obligations recorded during the first nine months of 2023 included a potential obligation to decommission two California offshore oil and gas production platforms and related facilities pursuant to an order of the Department of the Interior, Bureau of Safety and Environmental Enforcement.
Share Issuance
On September 27, 2024, Devon completed its acquisition of the Williston Basin business of Grayson Mill for total consideration of approximately $5.0 billion. The transaction consisted of $3.5 billion of cash and approximately 37.3 million shares of Devon common stock at $38.96 per share for total equity consideration of approximately $1.5 billion, including purchase price adjustments.
Share Repurchases
In July 2024, Devon's Board of Directors authorized an expansion to the Company's share repurchase program from $3.0 billion to $5.0 billion and extended the expiration date from December 31, 2024 to June 30, 2026. The table below provides information regarding purchases of Devon’s common stock under the $5.0 billion share repurchase program (shares in thousands).
| | | | | | | | | | | | |
| | Total Number of
Shares Purchased | | | Dollar Value of
Shares Purchased | | | Average Price Paid
per Share | |
$5.0 Billion Plan | | | | | | | | | |
2021 | | | 13,983 | | | $ | 589 | | | $ | 42.15 | |
2022 | | | 11,708 | | | | 718 | | | $ | 61.36 | |
2023: | | | | | | | | | |
First quarter | | | 10,090 | | | | 545 | | | $ | 53.96 | |
Second quarter | | | 3,795 | | | | 200 | | | $ | 52.70 | |
Fourth quarter | | | 5,465 | | | | 247 | | | $ | 45.17 | |
2023 Total | | | 19,350 | | | | 992 | | | $ | 51.23 | |
2024: | | | | | | | | | |
First quarter | | | 4,428 | | | | 193 | | | $ | 43.47 | |
Second quarter | | | 5,188 | | | | 256 | | | $ | 49.40 | |
Third quarter | | | 6,675 | | | | 295 | | | $ | 44.23 | |
2024 Total | | | 16,291 | | | | 744 | | | $ | 45.67 | |
Total plan | | | 61,332 | | | $ | 3,043 | | | $ | 49.62 | |
DEVON ENERGY CORPORATION AND SUBSIDIARIES
NOTES TO CONSOLIDATED FINANCIAL STATEMENTS – (Continued)
(Unaudited)
Dividends
Devon pays a quarterly dividend which can be comprised of a fixed dividend and a variable dividend. The variable dividend is dependent on quarterly cash flows, among other factors. Devon has raised its fixed dividend multiple times over the past two calendar years and most recently raised it by 10% from $0.20 to $0.22 per share in the first quarter of 2024. The following table summarizes Devon’s dividends for the first nine months of 2024 and 2023, respectively.
| | | | | | | | | | | | | | | |
| Fixed | | | Variable | | | Total | | | Rate Per Share | |
2024: | | | | | | | | | | | |
First quarter | $ | 143 | | | $ | 156 | | | $ | 299 | | | $ | 0.44 | |
Second quarter | | 138 | | | | 85 | | | | 223 | | | $ | 0.35 | |
Third quarter | | 136 | | | | 136 | | | | 272 | | | $ | 0.44 | |
Total year-to-date | $ | 417 | | | $ | 377 | | | $ | 794 | | | | |
2023: | | | | | | | | | | | |
First quarter | $ | 133 | | | $ | 463 | | | $ | 596 | | | $ | 0.89 | |
Second quarter | | 128 | | | | 334 | | | | 462 | | | $ | 0.72 | |
Third quarter | | 127 | | | | 185 | | | | 312 | | | $ | 0.49 | |
Total year-to-date | $ | 388 | | | $ | 982 | | | $ | 1,370 | | | | |
In November 2024, Devon announced a fixed cash dividend in the amount of $0.22 per share for approximately $144 million payable in the fourth quarter of 2024.
Noncontrolling Interests
The noncontrolling interests’ share of CDM’s net earnings and the contributions from and distributions to the noncontrolling interests are presented as components of equity.
15.Commitments and Contingencies
Devon is party to various legal actions arising in connection with its business. Matters that are probable of unfavorable outcome to Devon and which can be reasonably estimated are accrued. Such accruals are based on information known about the matters, Devon’s estimates of the outcomes of such matters and its experience in contesting, litigating and settling similar matters. None of the actions are believed by management to likely involve future amounts that would be material to Devon’s financial position or results of operations after consideration of recorded accruals. Actual amounts could differ materially from management’s estimates.
Royalty Matters
Numerous oil and natural gas producers and related parties, including Devon, have been named in various lawsuits alleging royalty underpayments. Devon is currently named as a defendant in a number of such lawsuits, including some lawsuits in which the plaintiffs seek to certify classes of similarly situated plaintiffs. Among the allegations typically asserted in these suits are claims that Devon used below-market prices, made improper deductions, paid royalty proceeds in an untimely manner without including required interest, used improper measurement techniques and entered into gas purchase and processing arrangements with affiliates that resulted in underpayment of royalties in connection with oil, natural gas and NGLs produced and sold. Devon is also involved in governmental agency proceedings and royalty audits and is subject to related contracts and regulatory controls in the ordinary course of business, some that may lead to additional royalty claims. As of September 30, 2024, Devon has accrued approximately $60 million in other current liabilities pertaining to such royalty matters.
Environmental and Climate Change Matters
Devon’s business is subject to numerous federal, state, tribal and local laws and regulations governing the discharge of materials into the environment or otherwise relating to environmental protection. Failure to comply with these laws and regulations may result in the assessment of administrative, civil and criminal fines and penalties, as well as remediation costs. Although Devon believes that it is in substantial compliance with applicable environmental laws and regulations and that continued compliance with existing requirements will not have a material adverse impact on its business, there can be no assurance that this will continue in the future.
As previously disclosed, the Company received separate notices of violation (“NOV”) from the EPA alleging emissions and permitting violations relating to certain of our historic operations in North Dakota, western Texas and New Mexico, respectively. The
DEVON ENERGY CORPORATION AND SUBSIDIARIES
NOTES TO CONSOLIDATED FINANCIAL STATEMENTS – (Continued)
(Unaudited)
Company has been engaging with the EPA to resolve each of these matters, and Devon is actively negotiating a draft consent decree with the EPA and the Department of Justice with respect to the North Dakota NOV matter. If finalized, the consent decree may include monetary sanctions and obligations to complete mitigation projects and implement specific injunctive relief. Given that negotiations of the draft consent decree are ongoing and the uncertainty as to the ultimate result of the North Dakota NOV matter, we are currently unable to provide an estimate of potential loss; however, the costs associated with the resolution of the North Dakota NOV matter or any of the other NOV matters could be significant in amount and may include monetary penalties.
Beginning in 2013, various parishes in Louisiana filed suit against numerous oil and gas companies, including Devon, alleging that the companies’ operations and activities in certain fields violated the State and Local Coastal Resource Management Act of 1978, as amended, and caused substantial environmental contamination, subsidence and other environmental damages to land and water bodies located in the coastal zone of Louisiana. The plaintiffs’ claims against Devon relate primarily to the operations of several of Devon’s corporate predecessors. The plaintiffs seek, among other things, payment of the costs necessary to clear, re-vegetate and otherwise restore the allegedly impacted areas. Although Devon cannot predict the ultimate outcome of these matters, Devon denies the allegations in these lawsuits and intends to vigorously defend against these claims.
The State of Delaware has filed legal proceedings against numerous oil and gas companies, including Devon, seeking relief to abate alleged impacts of climate change. These proceedings include far-reaching claims for monetary damages and injunctive relief. Although Devon cannot predict the ultimate outcome of this matter, Devon denies the allegations asserted in this lawsuit and intends to vigorously defend against these claims.
Other Indemnifications and Legacy Matters
Pursuant to various sale agreements relating to divested businesses and assets, Devon has indemnified various purchasers against liabilities that they may incur with respect to the businesses and assets acquired from Devon. Additionally, federal, state and other laws in areas of former operations may require previous operators (including corporate successors of previous operators) to perform or make payments in certain circumstances where the current operator may no longer be able to satisfy the applicable obligation. Such obligations may include plugging and abandoning wells, removing production facilities, undertaking other restorative actions or performing requirements under surface agreements in existence at the time of disposition. For example, a predecessor entity of a Devon subsidiary previously sold certain private, state and federal oil and gas leases covering properties in shallow waters off the coast of Louisiana in the Gulf of Mexico. These assets are generally referred to as the East Bay Field. The current operator of the East Bay Field has filed for protection under Chapter 11 of the U.S. Bankruptcy Code and may be unable to satisfy the eventual decommissioning obligations associated with the East Bay Field. Other companies in the chain of title of the East Bay Field have also sought bankruptcy protection and may be similarly unable to satisfy the eventual decommissioning obligations associated with the East Bay Field. Depending upon the outcome of these bankruptcy proceedings, amounts available under decommissioning bonds and a cash security account and other factors, Devon may be required to perform or fund certain decommissioning obligations associated with the East Bay Field under state and federal regulations applicable to predecessor operators. As a result of these factors and uncertainties, we are currently unable to provide an estimate of potential loss.
DEVON ENERGY CORPORATION AND SUBSIDIARIES
NOTES TO CONSOLIDATED FINANCIAL STATEMENTS – (Continued)
(Unaudited)
16.Fair Value Measurements
The following table provides carrying value and fair value measurement information for certain of Devon’s financial assets and liabilities. The carrying values of cash, accounts receivable, other current receivables, accounts payable, other current payables, accrued expenses and lease liabilities included in the accompanying consolidated balance sheets approximated fair value at September 30, 2024 and December 31, 2023, as applicable. Therefore, such financial assets and liabilities are not presented in the following table.
| | | | | | | | | | | | | | | | | | | | |
| | | | | | | | Fair Value Measurements Using: | |
| | Carrying | | | Total Fair | | | Level 1 | | | Level 2 | | | Level 3 | |
| | Amount | | | Value | | | Inputs | | | Inputs | | | Inputs | |
September 30, 2024 assets (liabilities): | | | | | | | | | | | | | | | |
Cash equivalents | | $ | 164 | | | $ | 164 | | | $ | 164 | | | $ | — | | | $ | — | |
Commodity derivatives | | $ | 168 | | | $ | 168 | | | $ | — | | | $ | 168 | | | $ | — | |
Commodity derivatives | | $ | (3 | ) | | $ | (3 | ) | | $ | — | | | $ | (3 | ) | | $ | — | |
Debt | | $ | (8,884 | ) | | $ | (8,883 | ) | | $ | — | | | $ | (8,883 | ) | | $ | — | |
Contingent earnout payments | | $ | 20 | | | $ | 20 | | | $ | — | | | $ | — | | | $ | 20 | |
December 31, 2023 assets (liabilities): | | | | | | | | | | | | | | | |
Cash equivalents | | $ | 306 | | | $ | 306 | | | $ | 306 | | | $ | — | | | $ | — | |
Commodity derivatives | | $ | 208 | | | $ | 208 | | | $ | — | | | $ | 208 | | | $ | — | |
Commodity derivatives | | $ | (9 | ) | | $ | (9 | ) | | $ | — | | | $ | (9 | ) | | $ | — | |
Debt | | $ | (6,155 | ) | | $ | (6,090 | ) | | $ | — | | | $ | (6,090 | ) | | $ | — | |
Contingent earnout payments | | $ | 55 | | | $ | 55 | | | $ | — | | | $ | — | | | $ | 55 | |
The following methods and assumptions were used to estimate the fair values in the table above.
Level 1 Fair Value Measurements
Cash equivalents – Amounts consist primarily of money market investments and the fair value approximates the carrying value.
Level 2 Fair Value Measurements
Commodity derivatives – The fair value of commodity derivatives is estimated using internal discounted cash flow calculations based upon forward curves and data obtained from independent third parties for contracts with similar terms or data obtained from counterparties to the agreements.
Debt – Devon’s debt instruments do not consistently trade actively in an established market. The fair values of its debt are estimated based on rates available for debt with similar terms and maturity when active trading is not available. Our variable rate debt is non-public and consists of our Term Loan. The fair value of our variable rate debt approximates the carrying value as the underlying SOFR resets every month based on the prevailing market rate.
Level 3 Fair Value Measurements
Contingent Earnout Payments – Devon has the right to receive contingent consideration related to the Barnett asset divestiture based on future oil and gas prices. These values were derived using a Monte Carlo valuation model and qualify as a level 3 fair value measurement. For additional information, see Note 2.
Item 2. Management’s Discussion and Analysis of Financial Condition and Results of Operations
The following discussion and analysis addresses material changes in our results of operations for the three-month and nine-month periods ended September 30, 2024 compared to previous periods, and in our financial condition and liquidity since December 31, 2023. For information regarding our critical accounting policies and estimates, see our 2023 Annual Report on Form 10-K under “Item 7. Management’s Discussion and Analysis of Financial Condition and Results of Operations.”
Executive Overview
We are a leading independent oil and natural gas exploration and production company whose operations are focused onshore in the United States. Our operations are currently focused in five core areas: the Delaware Basin, Eagle Ford, Anadarko Basin, Williston Basin and Powder River Basin. Our asset base is underpinned by premium acreage in the economic core of the Delaware Basin and our diverse, top-tier resource plays, providing a deep inventory of opportunities for years to come.
On September 27, 2024, we acquired the Williston Basin business of Grayson Mill for total consideration of approximately $5.0 billion, consisting of $3.5 billion of cash and approximately 37.3 million shares of Devon common stock, including purchase price adjustments. The transaction is expected to increase our volumes in 2025 by approximately 100 MBoe/d. The acquisition will allow us to efficiently expand our oil production and operating scale, creating immediate and long-term, sustainable value to shareholders over time.
As evidenced by this acquisition, we remain focused on building economic value by executing on our strategic priorities of moderating production growth, emphasizing capital and operational efficiencies, optimizing reinvestment rates to maximize free cash flow, maintaining low leverage, delivering cash returns to our shareholders and pursuing ESG excellence. Our recent performance highlights for these priorities include the following items for the third quarter of 2024:
•Oil production totaled 335 MBbls/d, exceeding our plan by 4%.
•As of September 30, 2024, completed approximately 60% of our authorized $5.0 billion share repurchase program with approximately 61.3 million of our common shares purchased for approximately $3.0 billion, or $49.62 per share since inception of the plan.
•Exited with $3.7 billion of liquidity, including $0.7 billion of cash.
•Generated $1.7 billion of operating cash flow and $6.7 billion for the past twelve trailing months.
•Including variable dividends, paid dividends of $272 million and have declared approximately $144 million of dividends to be paid in the fourth quarter of 2024.
•Earnings attributable to Devon were $812 million, or $1.30 per diluted share.
•Core earnings (Non-GAAP) were $683 million, or $1.10 per diluted share.
We remain committed to capital discipline and delivering the objectives that underpin our current plan. Those objectives prioritize value creation through moderated capital investment and production growth, particularly with a view of the volatility in commodity prices, supply chain constraints and the economic uncertainty arising from inflation and geopolitical events. Our cash-return objectives remain focused on opportunistic share repurchases, funding our dividends, repaying debt at upcoming maturities and building cash balances.
Results of Operations
The following graphs, discussion and analysis are intended to provide an understanding of our results of operations and current financial condition. To facilitate the review, these numbers are being presented before consideration of noncontrolling interests.
Q3 2024 vs. Q2 2024
Our third quarter 2024 and second quarter 2024 net earnings were $825 million and $855 million, respectively. The graph below shows the change in net earnings from the second quarter of 2024 to the third quarter of 2024. The material changes are further discussed by category on the following pages.
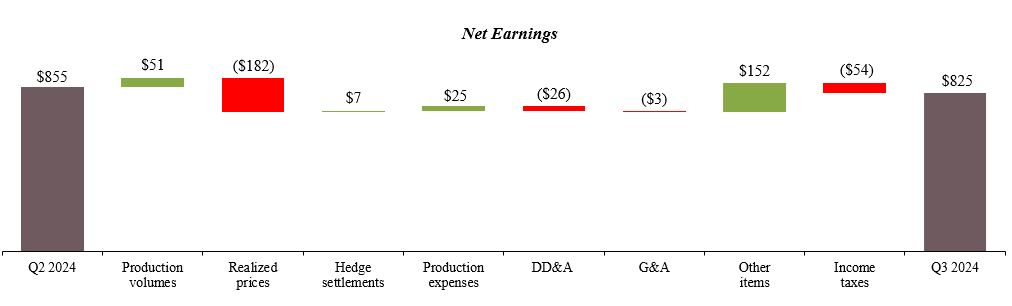
Production Volumes
| | | | | | | | | | | | | | | | |
| | Q3 2024 | | | % of Total | | | Q2 2024 | | | Change | |
Oil (MBbls/d) | | | | | | | | | | | | |
Delaware Basin | | | 227 | | | | 68 | % | | | 221 | | | | 2 | % |
Eagle Ford | | | 44 | | | | 13 | % | | | 46 | | | | -6 | % |
Anadarko Basin | | | 13 | | | | 4 | % | | | 14 | | | | -4 | % |
Williston Basin | | | 34 | | | | 10 | % | | | 37 | | | | -8 | % |
Powder River Basin | | | 14 | | | | 4 | % | | | 13 | | | | 5 | % |
Other | | | 3 | | | | 1 | % | | | 4 | | | | -3 | % |
Total | | | 335 | | | | 100 | % | | | 335 | | | | 0 | % |
| | | | | | | | | | | | | | | | |
| | Q3 2024 | | | % of Total | | | Q2 2024 | | | Change | |
Gas (MMcf/d) | | | | | | | | | | | | |
Delaware Basin | | | 764 | | | | 64 | % | | | 712 | | | | 7 | % |
Eagle Ford | | | 93 | | | | 8 | % | | | 92 | | | | 1 | % |
Anadarko Basin | | | 241 | | | | 20 | % | | | 244 | | | | -1 | % |
Williston Basin | | | 77 | | | | 6 | % | | | 71 | | | | 8 | % |
Powder River Basin | | | 19 | | | | 2 | % | | | 18 | | | | 2 | % |
Other | | | — | | | | 0 | % | | | — | | | N/M | |
Total | | | 1,194 | | | | 100 | % | | | 1,137 | | | | 5 | % |
| | | | | | | | | | | | | | | | |
| | Q3 2024 | | | % of Total | | | Q2 2024 | | | Change | |
NGLs (MBbls/d) | | | | | | | | | | | | |
Delaware Basin | | | 134 | | | | 69 | % | | | 121 | | | | 11 | % |
Eagle Ford | | | 16 | | | | 8 | % | | | 17 | | | | -7 | % |
Anadarko Basin | | | 29 | | | | 15 | % | | | 30 | | | | -4 | % |
Williston Basin | | | 13 | | | | 7 | % | | | 12 | | | | 10 | % |
Powder River Basin | | | 2 | | | | 1 | % | | | 2 | | | | 3 | % |
Other | | | — | | | | 0 | % | | | — | | | N/M | |
Total | | | 194 | | | | 100 | % | | | 182 | | | | 6 | % |
| | | | | | | | | | | | | | | | |
| | Q3 2024 | | | % of Total | | | Q2 2024 | | | Change | |
Combined (MBoe/d) | | | | | | | | | | | | |
Delaware Basin | | | 488 | | | | 67 | % | | | 461 | | | | 6 | % |
Eagle Ford | | | 75 | | | | 10 | % | | | 79 | | | | -5 | % |
Anadarko Basin | | | 82 | | | | 11 | % | | | 84 | | | | -3 | % |
Williston Basin | | | 60 | | | | 8 | % | | | 61 | | | | -2 | % |
Powder River Basin | | | 19 | | | | 3 | % | | | 18 | | | | 4 | % |
Other | | | 4 | | | | 1 | % | | | 4 | | | N/M | |
Total | | | 728 | | | | 100 | % | | | 707 | | | | 3 | % |
From the second quarter of 2024 to the third quarter of 2024, the change in volumes contributed to a $51 million increase in earnings. The increase in volumes was primarily due to new well activity in the Delaware Basin, which was partially offset by natural well declines in the Eagle Ford and Anadarko Basin. We expect volumes to increase approximately 110 MBoe/d in the fourth quarter of 2024 due to the Grayson Mill acquisition.
Realized Prices
| | | | | | | | | | | | | | |
| | Q3 2024 | | | Realization | | Q2 2024 | | | Change | |
Oil (per Bbl) | | | | | | | | | | | |
WTI index | | $ | 75.20 | | | | | $ | 80.62 | | | | -7 | % |
Realized price, unhedged | | $ | 73.74 | | | 98% | | $ | 79.10 | | | | -7 | % |
Cash settlements | | $ | 0.52 | | | | | $ | (0.15 | ) | | | |
Realized price, with hedges | | $ | 74.26 | | | 99% | | $ | 78.95 | | | | -6 | % |
| | | | | | | | | | | | | | |
| | Q3 2024 | | | Realization | | Q2 2024 | | | Change | |
Gas (per Mcf) | | | | | | | | | | | |
Henry Hub index | | $ | 2.15 | | | | | $ | 1.89 | | | | 14 | % |
Realized price, unhedged | | $ | 0.45 | | | 21% | | $ | 0.55 | | | | -19 | % |
Cash settlements | | $ | 0.39 | | | | | $ | 0.55 | | | | |
Realized price, with hedges | | $ | 0.84 | | | 39% | | $ | 1.10 | | | | -24 | % |
| | | | | | | | | | | | | | |
| | Q3 2024 | | | Realization | | Q2 2024 | | | Change | |
NGLs (per Bbl) | | | | | | | | | | | |
WTI index | | $ | 75.20 | | | | | $ | 80.62 | | | | -7 | % |
Realized price, unhedged | | $ | 19.25 | | | 26% | | $ | 19.60 | | | | -2 | % |
Cash settlements | | $ | 0.11 | | | | | $ | 0.11 | | | | |
Realized price, with hedges | | $ | 19.36 | | | 26% | | $ | 19.71 | | | | -2 | % |
| | | | | | | | | | | | |
| | Q3 2024 | | | Q2 2024 | | | Change | |
Combined (per Boe) | | | | | | | | | |
Realized price, unhedged | | $ | 39.80 | | | $ | 43.44 | | | | -8 | % |
Cash settlements | | $ | 0.91 | | | $ | 0.85 | | | | |
Realized price, with hedges | | $ | 40.71 | | | $ | 44.29 | | | | -8 | % |
From the second quarter of 2024 to the third quarter of 2024, realized prices contributed to a $182 million decrease in earnings. Unhedged oil and NGL prices decreased primarily due to lower WTI and Mont Belvieu index prices, respectively. Unhedged gas prices decreased primarily due to the expanded regional gas price differential in the Delaware Basin driven by infrastructure constraints. The decrease in unhedged prices was partially offset by hedge cash settlements across all commodities.
We currently have approximately 35% and 20% of our remaining anticipated 2024 oil and gas production hedged, respectively. For 2025, we currently have hedged approximately 10% and 20% of our anticipated oil and gas production, respectively.
Hedge Settlements
| | | | | | | | | | | | |
| | Q3 2024 | | | Q2 2024 | | | Change | |
| | Q | | | | | | | |
Oil | | $ | 16 | | | $ | (5 | ) | | N/M | |
Natural gas | | | 43 | | | | 57 | | | | -25 | % |
NGL | | | 2 | | | | 2 | | | N/M | |
Total cash settlements (1) | | $ | 61 | | | $ | 54 | | | | 13 | % |
(1)Included as a component of oil, gas and NGL derivatives on the consolidated statements of comprehensive earnings.
Cash settlements as presented in the tables above represent realized gains or losses related to the instruments described in Note 3 in “Part I. Financial Information – Item 1. Financial Statements” in this report.
Production Expenses
| | | | | | | | | | | | |
| | Q3 2024 | | | Q2 2024 | | | Change | |
LOE | | $ | 366 | | | $ | 383 | | | | -4 | % |
Gathering, processing & transportation | | | 200 | | | | 197 | | | | 2 | % |
Production taxes | | | 179 | | | | 188 | | | | -5 | % |
Property taxes | | | 18 | | | | 20 | | | | -10 | % |
Total | | $ | 763 | | | $ | 788 | | | | -3 | % |
Per Boe: | | | | | | | | | |
LOE | | $ | 5.46 | | | $ | 5.95 | | | | -8 | % |
Gathering, processing & transportation | | $ | 2.98 | | | $ | 3.07 | | | | -3 | % |
Percent of oil, gas and NGL sales: | | | | | | | | | |
Production taxes | | | 6.7 | % | | | 6.7 | % | | | 0 | % |
Production expenses decreased during the third quarter of 2024 primarily due to cost efficiencies, lower workover activity and lower production taxes resulting from decreased oil prices.
Field-Level Cash Margin
The table below presents the field-level cash margin for each of our operating areas. Field-level cash margin is computed as oil, gas and NGL sales less production expenses and is not a measure defined by GAAP. A reconciliation to the comparable GAAP measures is found in “Non-GAAP Measures” in this Item 2. The changes in production volumes, realized prices and production expenses, shown above, had the following impact on our field-level cash margins by asset.
| | | | | | | | | | | | | | | | |
| | Q3 2024 | | | $ per BOE | | | Q2 2024 | | | $ per BOE | |
Field-level cash margin (Non-GAAP) | | | | | | | | | | | | |
Delaware Basin | | $ | 1,317 | | | $ | 29.38 | | | $ | 1,346 | | | $ | 32.12 | |
Eagle Ford | | | 273 | | | $ | 39.51 | | | | 303 | | | $ | 42.15 | |
Anadarko Basin | | | 112 | | | $ | 14.82 | | | | 119 | | | $ | 15.48 | |
Williston Basin | | | 117 | | | $ | 21.16 | | | | 160 | | | $ | 28.62 | |
Powder River Basin | | | 68 | | | $ | 38.88 | | | | 65 | | | $ | 39.44 | |
Other | | | 15 | | | N/M | | | | 15 | | | N/M | |
Total | | $ | 1,902 | | | $ | 28.41 | | | $ | 2,008 | | | $ | 31.19 | |
DD&A
| | | | | | | | | | | | |
| | Q3 2024 | | | Q2 2024 | | | Change | |
Oil and gas per Boe | | $ | 11.51 | | | $ | 11.56 | | | | 0 | % |
| | | | | | | | | |
Oil and gas | | $ | 770 | | | $ | 744 | | | | 3 | % |
Other property and equipment | | | 24 | | | | 24 | | | | 3 | % |
Total | | $ | 794 | | | $ | 768 | | | | 3 | % |
DD&A increased in the third quarter of 2024 primarily due to higher volumes.
G&A
| | | | | | | | | | | | |
| | Q3 2024 | | | Q2 2024 | | | Change | |
G&A per Boe | | $ | 1.75 | | | $ | 1.77 | | | | -1 | % |
| | | | | | | | | |
Labor and benefits | | $ | 70 | | | $ | 62 | | | | 13 | % |
Non-labor | | | 47 | | | | 52 | | | | -10 | % |
Total | | $ | 117 | | | $ | 114 | | | | 3 | % |
Other Items
| | | | | | | | | | | | |
| | Q3 2024 | | | Q2 2024 | | | Change in earnings | |
Commodity hedge valuation changes (1) | | $ | 166 | | | $ | (31 | ) | | $ | 197 | |
Marketing and midstream operations | | | (17 | ) | | | (10 | ) | | | (7 | ) |
Exploration expenses | | | 4 | | | | 3 | | | | (1 | ) |
Asset dispositions | | | — | | | | 15 | | | | 15 | |
Net financing costs | | | 88 | | | | 76 | | | | (12 | ) |
Restructuring and transaction costs | | | 8 | | | | — | | | | (8 | ) |
Other, net | | | 37 | | | | 5 | | | | (32 | ) |
| | | | | | | | $ | 152 | |
(1)Included as a component of oil, gas and NGL derivatives on the consolidated statements of comprehensive earnings.
We recognize fair value changes on our oil, gas and NGL derivative instruments in each reporting period. The changes in fair value resulted from new positions and settlements that occurred during each period, as well as the relationship between contract prices and the associated forward curves. For additional information, see Note 3 in “Part I. Financial Information – Item 1. Financial Statements” in this report.
During the third quarter of 2024, we issued $3.25 billion of debt to partially fund the Grayson Mill acquisition. Additionally, we retired $472 million of debt in the third quarter of 2024. The net impact of this debt activity is expected to increase our annual net financing costs by approximately $180 million. For additional information, see Note 11 in "Part I. Financial Information - Item 1. Financial Statements" in this report.
Income Taxes
| | | | | | | | |
| | Q3 2024 | | | Q2 2024 | |
Current expense | | $ | 75 | | | $ | 146 | |
Deferred expense | | | 164 | | | | 39 | |
Total expense | | $ | 239 | | | $ | 185 | |
Current tax rate | | | 7 | % | | | 14 | % |
Deferred tax rate | | | 15 | % | | | 4 | % |
Effective income tax rate | | | 22 | % | | | 18 | % |
The current income tax rate decreased in the third quarter of 2024 primarily due to the impacts of the Grayson Mill acquisition. For additional discussion on income taxes, see Note 5 in “Part I. Financial Information – Item 1. Financial Statements” in this report.
September 30, 2024 YTD vs. September 30, 2023 YTD
Our nine months ended September 30, 2024 net earnings were $2.3 billion, compared to net earnings of $2.6 billion for the first nine months ended September 30, 2023. The graph below shows the change in net earnings from the nine months ended September 30, 2023 to the nine months ended September 30, 2024. The material changes are further discussed by category on the following pages.
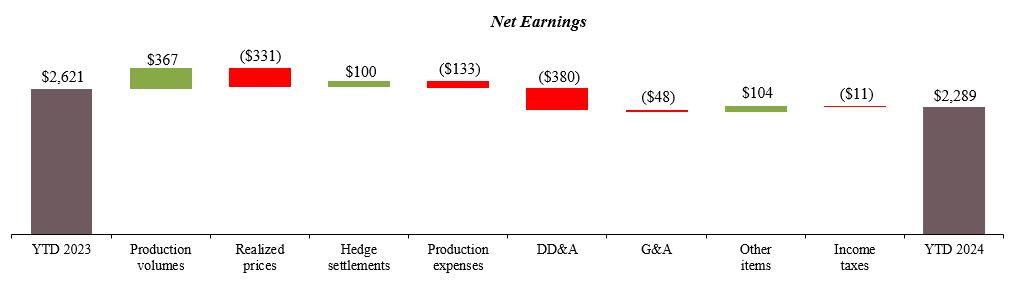
Production Volumes
| | | | | | | | | | | | | | | | |
| | Nine Months Ended September 30, | |
| | 2024 | | | % of Total | | | 2023 | | | Change | |
Oil (MBbls/d) | | | | | | | | | | | | |
Delaware Basin | | | 219 | | | | 67 | % | | | 211 | | | | 4 | % |
Eagle Ford | | | 44 | | | | 13 | % | | | 41 | | | | 6 | % |
Anadarko Basin | | | 13 | | | | 4 | % | | | 15 | | | | -14 | % |
Williston Basin | | | 37 | | | | 11 | % | | | 36 | | | | 4 | % |
Powder River Basin | | | 13 | | | | 4 | % | | | 14 | | | | -4 | % |
Other | | | 4 | | | | 1 | % | | | 4 | | | | -2 | % |
Total | | | 330 | | | | 100 | % | | | 321 | | | | 3 | % |
| | | | | | | | | | | | | | | | |
| | Nine Months Ended September 30, | |
| | 2024 | | | % of Total | | | 2023 | | | Change | |
Gas (MMcf/d) | | | | | | | | | | | | |
Delaware Basin | | | 724 | | | | 64 | % | | | 652 | | | | 11 | % |
Eagle Ford | | | 88 | | | | 8 | % | | | 82 | | | | 7 | % |
Anadarko Basin | | | 236 | | | | 20 | % | | | 242 | | | | -2 | % |
Williston Basin | | | 70 | | | | 6 | % | | | 57 | | | | 22 | % |
Powder River Basin | | | 18 | | | | 2 | % | | | 18 | | | | 5 | % |
Other | | | 1 | | | | 0 | % | | | 1 | | | N/M | |
Total | | | 1,137 | | | | 100 | % | | | 1,052 | | | | 8 | % |
| | | | | | | | | | | | | | | | |
| | Nine Months Ended September 30, | |
| | 2024 | | | % of Total | | | 2023 | | | Change | |
NGLs (MBbls/d) | | | | | | | | | | | | |
Delaware Basin | | | 122 | | | | 68 | % | | | 105 | | | | 17 | % |
Eagle Ford | | | 16 | | | | 9 | % | | | 15 | | | | 6 | % |
Anadarko Basin | | | 28 | | | | 16 | % | | | 28 | | | | -1 | % |
Williston Basin | | | 12 | | | | 6 | % | | | 9 | | | | 32 | % |
Powder River Basin | | | 2 | | | | 1 | % | | | 2 | | | | 1 | % |
Other | | | — | | | | 0 | % | | | 1 | | | N/M | |
Total | | | 180 | | | | 100 | % | | | 160 | | | | 13 | % |
| | | | | | | | | | | | | | | | |
| | Nine Months Ended September 30, | |
| | 2024 | | | % of Total | | | 2023 | | | Change | |
Combined (MBoe/d) | | | | | | | | | | | | |
Delaware Basin | | | 462 | | | | 66 | % | | | 425 | | | | 9 | % |
Eagle Ford | | | 75 | | | | 10 | % | | | 70 | | | | 7 | % |
Anadarko Basin | | | 80 | | | | 11 | % | | | 83 | | | | -4 | % |
Williston Basin | | | 61 | | | | 9 | % | | | 54 | | | | 12 | % |
Powder River Basin | | | 18 | | | | 3 | % | | | 19 | | | | -2 | % |
Other | | | 4 | | | | 1 | % | | | 5 | | | | -7 | % |
Total | | | 700 | | | | 100 | % | | | 656 | | | | 7 | % |
From the nine months ended September 30, 2023 to the nine months ended September 30, 2024, the change in volumes contributed to a $367 million increase in earnings. Volumes increased primarily due to new well activity in the Delaware Basin, Williston Basin and Eagle Ford, which was partially offset by natural well declines in the Anadarko Basin. We expect volumes to increase approximately 110 MBoe/d in the fourth quarter of 2024 due to the Grayson Mill acquisition.
Realized Prices
| | | | | | | | | | | | | | |
| | Nine Months Ended September 30, | |
| | 2024 | | | Realization | | 2023 | | | Change | |
Oil (per Bbl) | | | | | | | | | | | |
WTI index | | $ | 77.61 | | | | | $ | 77.33 | | | | 0 | % |
Realized price, unhedged | | $ | 76.08 | | | 98% | | $ | 75.53 | | | | 1 | % |
Cash settlements | | $ | 0.05 | | | | | $ | (0.26 | ) | | | |
Realized price, with hedges | | $ | 76.13 | | | 98% | | $ | 75.27 | | | | 1 | % |
| | | | | | | | | | | | | | |
| | Nine Months Ended September 30, | |
| | 2024 | | | Realization | | 2023 | | | Change | |
Gas (per Mcf) | | | | | | | | | | | |
Henry Hub index | | $ | 2.10 | | | | | $ | 2.69 | | | | -22 | % |
Realized price, unhedged | | $ | 0.75 | | | 36% | | $ | 1.82 | | | | -59 | % |
Cash settlements | | $ | 0.42 | | | | | $ | 0.22 | | | | |
Realized price, with hedges | | $ | 1.17 | | | 56% | | $ | 2.04 | | | | -43 | % |
| | | | | | | | | | | | | | |
| | Nine Months Ended September 30, | |
| | 2024 | | | Realization | | 2023 | | | Change | |
NGLs (per Bbl) | | | | | | | | | | | |
WTI index | | $ | 77.61 | | | | | $ | 77.33 | | | | 0 | % |
Realized price, unhedged | | $ | 19.84 | | | 26% | | $ | 20.76 | | | | -4 | % |
Cash settlements | | $ | 0.05 | | | | | $ | — | | | | |
Realized price, with hedges | | $ | 19.89 | | | 26% | | $ | 20.76 | | | | -4 | % |
| | | | | | | | | | | | |
| | Nine Months Ended September 30, | |
| | 2024 | | | 2023 | | | Change | |
Combined (per Boe) | | | | | | | | | |
Realized price, unhedged | | $ | 42.19 | | | $ | 44.96 | | | | -6 | % |
Cash settlements | | $ | 0.73 | | | $ | 0.22 | | | | |
Realized price, with hedges | | $ | 42.92 | | | $ | 45.18 | | | | -5 | % |
From the nine months ended September 30, 2023 to the nine months ended September 30, 2024, realized prices contributed to a $331 million decrease in earnings. This decrease was due to lower unhedged realized gas and NGL prices which decreased primarily due to lower Henry Hub and Mont Belvieu index prices. Additionally, gas prices were impacted by expanded regional gas price differentials in the Delaware Basin driven by infrastructure constraints. These decreases were partially offset by an increase in unhedged realized oil prices which was primarily due to slightly higher WTI index prices. Realized prices were strengthened by hedge cash settlements across all commodities.
Hedge Settlements
| | | | | | | | | | | | |
| | Nine Months Ended September 30, | |
| | 2024 | | | 2023 | | | Change | |
Oil | | $ | 4 | | | $ | (23 | ) | | | 117 | % |
Natural gas | | | 132 | | | | 62 | | | | 113 | % |
NGL | | | 3 | | | | — | | | N/M | |
Total cash settlements (1) | | $ | 139 | | | $ | 39 | | | | 256 | % |
(1)Included as a component of oil, gas and NGL derivatives on the consolidated statements of comprehensive earnings.
Cash settlements as presented in the tables above represent realized gains or losses related to the instruments described in Note 3 in “Part I. Financial Information – Item 1. Financial Statements” in this report.
Production Expenses
| | | | | | | | | | | | |
| | Nine Months Ended September 30, | |
| | 2024 | | | 2023 | | | Change | |
LOE | | $ | 1,129 | | | $ | 1,047 | | | | 8 | % |
Gathering, processing & transportation | | | 577 | | | | 521 | | | | 11 | % |
Production taxes | | | 542 | | | | 531 | | | | 2 | % |
Property taxes | | | 54 | | | | 70 | | | | -23 | % |
Total | | $ | 2,302 | | | $ | 2,169 | | | | 6 | % |
Per Boe: | | | | | | | | | |
LOE | | $ | 5.89 | | | $ | 5.84 | | | | 1 | % |
Gathering, processing & transportation | | $ | 3.01 | | | $ | 2.91 | | | | 3 | % |
Percent of oil, gas and NGL sales: | | | | | | | | | |
Production taxes | | | 6.7 | % | | | 6.6 | % | | | 2 | % |
LOE and gathering, processing and transportation expenses increased for the first nine months of 2024 primarily due to increased activity.
Field-Level Cash Margin
The table below presents the field-level cash margin for each of our operating areas. Field-level cash margin is computed as oil, gas and NGL sales less production expenses and is not a measure defined by GAAP. A reconciliation to the comparable GAAP measures is found in “Non-GAAP Measures” in this Item 2. The changes in production volumes, realized prices and production expenses, shown above, had the following impact on our field-level cash margins by asset.
| | | | | | | | | | | | | | | | |
| | Nine Months Ended September 30, | |
| | 2024 | | | $ per BOE | | | 2023 | | | $ per BOE | |
Field-level cash margin (Non-GAAP) | | | | | | | | | | | | |
Delaware Basin | | $ | 3,938 | | | $ | 31.13 | | | $ | 4,009 | | | $ | 34.54 | |
Eagle Ford | | | 842 | | | $ | 41.16 | | | | 789 | | | $ | 41.26 | |
Anadarko Basin | | | 329 | | | $ | 15.00 | | | | 390 | | | $ | 17.14 | |
Williston Basin | | | 441 | | | $ | 26.50 | | | | 445 | | | $ | 30.06 | |
Powder River Basin | | | 193 | | | $ | 38.12 | | | | 208 | | | $ | 40.41 | |
Other | | | 45 | | | N/M | | | | 44 | | | N/M | |
Total | | $ | 5,788 | | | $ | 30.19 | | | $ | 5,885 | | | $ | 32.86 | |
DD&A
| | | | | | | | | | | | |
| | Nine Months Ended September 30, | |
| | 2024 | | | 2023 | | | Change | |
Oil and gas per Boe | | $ | 11.54 | | | $ | 10.25 | | | | 13 | % |
| | | | | | | | | |
Oil and gas | | $ | 2,213 | | | $ | 1,836 | | | | 21 | % |
Other property and equipment | | | 71 | | | | 68 | | | | 5 | % |
Total | | $ | 2,284 | | | $ | 1,904 | | | | 20 | % |
DD&A increased in the first nine months of 2024 primarily due to an increase in the oil and gas DD&A rate. The largest contributor to the higher rate was our 2023 drilling and development activity. DD&A also increased in the first nine months of 2024 due to higher volumes.
G&A
| | | | | | | | | | | | |
| | Nine Months Ended September 30, | |
| | 2024 | | | 2023 | | | Change | |
G&A per Boe | | $ | 1.80 | | | $ | 1.66 | | | | 9 | % |
| | | | | | | | | |
Labor and benefits | | $ | 195 | | | $ | 157 | | | | 24 | % |
Non-labor | | | 150 | | | | 140 | | | | 7 | % |
Total | | $ | 345 | | | $ | 297 | | | | 16 | % |
G&A increased for the nine months ended 2024 primarily due to inflationary adjustments to our labor and benefits.
Other Items
| | | | | | | | | | | | |
| | Nine Months Ended September 30, | |
| | 2024 | | | 2023 | | | Change in earnings | |
Commodity hedge valuation changes (1) | | $ | (34 | ) | | $ | (245 | ) | | $ | 211 | |
Marketing and midstream operations | | | (48 | ) | | | (51 | ) | | | 3 | |
Exploration expenses | | | 16 | | | | 16 | | | | — | |
Asset dispositions | | | 16 | | | | (41 | ) | | | (57 | ) |
Net financing costs | | | 240 | | | | 231 | | | | (9 | ) |
Restructuring and transaction costs | | | 8 | | | | — | | | | (8 | ) |
Other, net | | | 64 | | | | 28 | | | | (36 | ) |
| | | | | | | | $ | 104 | |
(1)Included as a component of oil, gas and NGL derivatives on the consolidated statements of comprehensive earnings.
We recognize fair value changes on our oil, gas and NGL derivative instruments in each reporting period. The changes in fair value resulted from new positions and settlements that occurred during each period, as well as the relationship between contract prices and the associated forward curves. For additional information, see Note 3 in “Part I. Financial Information – Item 1. Financial Statements” in this report.
In the second quarter of 2023, we recorded a $64 million gain within asset dispositions related to the difference between the fair market value and book value of assets contributed to the Water JV. For additional information, see Note 1 in "Part I. Financial Information - Item 1. Financial Statements" in this report.
During the third quarter of 2024, we issued $3.25 billion of debt to partially fund the Grayson Mill acquisition. Additionally, we retired $472 million of debt in the third quarter of 2024. The net impact of this debt activity is expected to increase our annual net financing costs by approximately $180 million. For additional information, see Note 11 in "Part I. Financial Information - Item 1. Financial Statements" in this report.
Income Taxes
| | | | | | | | |
| | Nine Months Ended September 30, | |
| | 2024 | | | 2023 | |
Current expense | | $ | 340 | | | $ | 360 | |
Deferred expense | | | 243 | | | | 212 | |
Total expense | | $ | 583 | | | $ | 572 | |
Current tax rate | | | 12 | % | | | 11 | % |
Deferred tax rate | | | 8 | % | | | 7 | % |
Effective income tax rate | | | 20 | % | | | 18 | % |
For discussion on income taxes, see Note 5 in “Part I. Financial Information – Item 1. Financial Statements” in this report.
Capital Resources, Uses and Liquidity
Sources and Uses of Cash
The following table presents the major changes in cash and cash equivalents for the three and nine months ended September 30, 2024 and 2023.
| | | | | | | | | | | | | | | | |
| | Three Months Ended September 30, | | | Nine Months Ended September 30, | |
| | 2024 | | | 2023 | | | 2024 | | | 2023 | |
Operating cash flow | | $ | 1,663 | | | $ | 1,725 | | | $ | 4,936 | | | $ | 4,807 | |
Grayson Mill acquired cash | | | 147 | | | | — | | | | 147 | | | | — | |
Capital expenditures | | | (877 | ) | | | (882 | ) | | | (2,719 | ) | | | (2,973 | ) |
Acquisitions of property and equipment | | | (3,602 | ) | | | (23 | ) | | | (3,692 | ) | | | (54 | ) |
Divestitures of property and equipment | | | — | | | | 1 | | | | 18 | | | | 23 | |
Investment activity, net | | | (17 | ) | | | 7 | | | | (43 | ) | | | (28 | ) |
Debt activity, net | | | 2,747 | | | | (242 | ) | | | 2,747 | | | | (242 | ) |
Repurchases of common stock | | | (295 | ) | | | — | | | | (756 | ) | | | (745 | ) |
Common stock dividends | | | (272 | ) | | | (312 | ) | | | (794 | ) | | | (1,370 | ) |
Noncontrolling interest activity, net | | | 10 | | | | 1 | | | | 8 | | | | (15 | ) |
Other | | | 3 | | | | (2 | ) | | | (51 | ) | | | (96 | ) |
Net change in cash, cash equivalents and restricted cash | | $ | (493 | ) | | $ | 273 | | | $ | (199 | ) | | $ | (693 | ) |
Cash, cash equivalents and restricted cash at end of period | | $ | 676 | | | $ | 761 | | | $ | 676 | | | $ | 761 | |
Operating Cash Flow
As presented in the table above, net cash provided by operating activities continued to be a significant source of capital and liquidity. Operating cash flow funded all of our capital expenditures, and we continued to return value to our shareholders by utilizing cash flow and cash balances for dividends and share repurchases.
Capital Expenditures
The amounts in the table below reflect cash payments for capital expenditures, including cash paid for capital expenditures incurred in prior periods.
| | | | | | | | | | | | | | | | |
| | Three Months Ended September 30, | | | Nine Months Ended September 30, | |
| | 2024 | | | 2023 | | | 2024 | | | 2023 | |
Delaware Basin | | $ | 516 | | | $ | 507 | | | $ | 1,589 | | | $ | 1,735 | |
Eagle Ford | | | 177 | | | | 183 | | | | 536 | | | | 573 | |
Anadarko Basin | | | 55 | | | | 22 | | | | 174 | | | | 163 | |
Williston Basin | | | 33 | | | | 82 | | | | 117 | | | | 264 | |
Powder River Basin | | | 58 | | | | 46 | | | | 144 | | | | 125 | |
Other | | | 1 | | | | 2 | | | | 4 | | | | 4 | |
Total oil and gas | | | 840 | | | | 842 | | | | 2,564 | | | | 2,864 | |
Midstream | | | 12 | | | | 17 | | | | 79 | | | | 51 | |
Other | | | 25 | | | | 23 | | | | 76 | | | | 58 | |
Total capital expenditures | | $ | 877 | | | $ | 882 | | | $ | 2,719 | | | $ | 2,973 | |
Capital expenditures consist primarily of amounts related to our oil and gas exploration and development operations, midstream operations and other corporate activities. Our capital investment program is driven by a disciplined allocation process focused on moderating our production growth and maximizing our returns. As such, our capital expenditures for the first nine months of 2024 represented approximately 55% of our operating cash flow.
Acquisitions of Property and Equipment
During the third quarter of 2024, we acquired the Williston Basin business of Grayson Mill. The transaction consisted of $3.5 billion of cash and approximately 37.3 million shares of Devon common stock. For additional information, please see Note 2 in “Part I. Financial Information – Item 1. Financial Statements” in this report.
Divestitures of Property and Equipment
During the first nine months of 2024 and 2023, we received contingent earnout payments related to assets previously sold. For additional information, please see Note 2 in “Part I. Financial Information – Item 1. Financial Statements” in this report.
Investment Activity
During the first nine months of 2024 and 2023, Devon received distributions from our investments of $35 million and $24 million, respectively. Devon contributed $78 million and $52 million to our investments during the first nine months of 2024 and 2023, respectively.
Debt Activity
In the third quarter of 2024, Devon issued $1.25 billion of 5.20% senior notes due 2034 and $1.0 billion of 5.75% senior notes due 2054. Additionally, in the third quarter of 2024, Devon borrowed $1.0 billion on the Term Loan. These debt issuances helped fund the Grayson Mill acquisition. In the third quarter of 2024, Devon retired $472 million of debt. For additional information, see Note 11 in "Part I. Financial Information - Item 1. Financial Statements" in this report.
Shareholder Distributions and Stock Activity
We repurchased approximately 16.3 million shares of common stock for $744 million and approximately 13.9 million shares of common stock for $745 million under the share repurchase program authorized by our Board of Directors in the first nine months of 2024 and 2023, respectively. For additional information, see Note 14 in “Part I. Financial Information – Item 1. Financial Statements” in this report.
The following table summarizes our common stock dividends during the third quarter and total for the first nine months of 2024 and 2023. Devon has raised its fixed dividend multiple times over the past two calendar years and most recently raised it by 10% from $0.20 to $0.22 per share in the first quarter of 2024. In addition to the fixed quarterly dividend, we paid a variable dividend in the first, second and third quarters of 2024 and 2023.
| | | | | | | | | | | | | | | |
| Fixed | | | Variable | | | Total | | | Rate Per Share | |
2024: | | | | | | | | | | | |
First quarter | $ | 143 | | | $ | 156 | | | $ | 299 | | | $ | 0.44 | |
Second quarter | | 138 | | | | 85 | | | | 223 | | | $ | 0.35 | |
Third quarter | | 136 | | | | 136 | | | | 272 | | | $ | 0.44 | |
Total year-to-date | $ | 417 | | | $ | 377 | | | $ | 794 | | | | |
2023: | | | | | | | | | | | |
First quarter | $ | 133 | | | $ | 463 | | | $ | 596 | | | $ | 0.89 | |
Second quarter | | 128 | | | | 334 | | | | 462 | | | $ | 0.72 | |
Third quarter | | 127 | | | | 185 | | | | 312 | | | $ | 0.49 | |
Total year-to-date | $ | 388 | | | $ | 982 | | | $ | 1,370 | | | | |
Noncontrolling Interest Activity, net
During the first nine months of 2024 and 2023, we distributed $36 million and $33 million, respectively, to our noncontrolling interests in CDM. During the first nine months of 2024 and 2023, we received $44 million and $18 million, respectively, in contributions from our noncontrolling interests.
Liquidity
The business of exploring for, developing and producing oil and natural gas is capital intensive. Because oil, natural gas and NGL reserves are a depleting resource, we, like all upstream operators, must continually make capital investments to grow and even sustain production. Generally, our capital investments are focused on drilling and completing new wells and maintaining production from existing wells. At opportunistic times, we also acquire operations and properties from other operators or landowners to enhance our existing portfolio of assets.
On September 27, 2024, Devon acquired the Williston Basin business of Grayson Mill. This acquisition adds a high-margin production mix that enhances our position and efficiently expands our operating scale and production. The acquisition delivers sustainable accretion to earnings and free cash flow further supporting our cash-return business model, which moderates growth, emphasizes capital efficiencies and prioritizes cash returns to shareholders.
Historically, our primary sources of capital funding and liquidity have been our operating cash flow, cash on hand and asset divestiture proceeds. Additionally, we maintain a commercial paper program, supported by our revolving line of credit, which can be accessed as needed to supplement operating cash flow and cash balances. If needed, we can also issue debt and equity securities, including through transactions under our shelf registration statement filed with the SEC. We estimate the combination of our sources of capital will continue to be adequate to fund our planned capital requirements as discussed in this section as well as return cash to shareholders.
Operating Cash Flow
Key inputs into determining our planned capital investment are the amount of cash we hold and operating cash flow we expect to generate over the next one to three or more years. At the end of the third quarter of 2024, we held approximately $700 million of cash. Our operating cash flow forecasts are sensitive to many variables and include a measure of uncertainty as actual results may differ from our expectations.
Commodity Prices – The most uncertain and volatile variables for our operating cash flow are the prices of the oil, gas and NGLs we produce and sell. Prices are determined primarily by prevailing market conditions. Regional and worldwide economic activity, weather and other highly variable factors influence market conditions for these products. These factors, which are difficult to predict, create volatility in prices and are beyond our control.
To mitigate some of the risk inherent in prices, we utilize various derivative financial instruments to protect a portion of our production against downside price risk. The key terms to our oil, gas and NGL derivative financial instruments as of September 30, 2024 are presented in Note 3 in “Part I. Financial Information – Item 1. Financial Statements” of this report.
Further, when considering the current commodity price environment and our current hedge position, we expect to achieve our capital investment priorities. Additionally, we remain committed to capital discipline and focused on delivering the objectives that underpin our capital plan for 2024. The currently elevated level of cost inflation has eroded, and could continue to erode, our cost efficiencies gained over previous years and pressure our margins for the foreseeable future. Despite this, we expect to continue generating material amounts of free cash flow at current commodity price levels due to our strategy of spending within cash flow.
Operating Expenses – Commodity prices can also affect our operating cash flow through an indirect effect on operating expenses. Significant commodity price decreases can lead to a decrease in drilling and development activities. As a result, the demand and cost for people, services, equipment and materials may also decrease, causing a positive impact on our cash flow as the prices paid for services and equipment decline. However, the inverse is also generally true during periods of rising commodity prices. We expect to mitigate the impact of cost inflation through efficiencies gained from the scale of our operations as well as by leveraging our long-standing relationships with our suppliers.
Credit Losses – Our operating cash flow is also exposed to credit risk in a variety of ways. This includes the credit risk related to customers who purchase our oil, gas and NGL production, the collection of receivables from our joint interest owners for their proportionate share of expenditures made on projects we operate and counterparties to our derivative financial contracts. We utilize a
variety of mechanisms to limit our exposure to the credit risks of our customers, joint interest owners and counterparties. Such mechanisms include, under certain conditions, requiring letters of credit, prepayments or cash collateral postings.
Credit Availability
As of September 30, 2024, we had approximately $3.0 billion of available borrowing capacity under our 2023 Senior Credit Facility. This credit facility supports our $3.0 billion of short-term credit under our commercial paper program. At September 30, 2024, there were no borrowings under our commercial paper program, and we were in compliance with the Senior Credit Facility’s financial covenant.
Debt Ratings
We receive debt ratings from the major ratings agencies in the U.S. In determining our debt ratings, the agencies consider a number of qualitative and quantitative items including, but not limited to, commodity pricing levels, our liquidity, asset quality, reserve mix, debt levels, cost structure, planned asset sales and the size and scale of our production. Our credit rating from Standard and Poor’s Financial Services is BBB with a stable outlook. Our credit rating from Fitch is BBB+ with a stable outlook. Our credit rating from Moody’s Investor Service is Baa2 with a stable outlook. Any rating downgrades may result in additional letters of credit or cash collateral being posted under certain contractual arrangements.
There are no “rating triggers” in any of our contractual debt obligations that would accelerate scheduled maturities should our debt rating fall below a specified level. However, a downgrade could adversely impact our interest rate on our Term Loan or any credit facility borrowings and the ability to economically access debt markets in the future.
Cash Returns to Shareholders
We are committed to returning cash to shareholders through dividends and share repurchases. Our Board of Directors will consider a number of factors when setting the quarterly dividend, if any, including a general target of paying out approximately 10% of operating cash flow through the fixed dividend. In addition to the fixed quarterly dividend, we may pay a variable dividend or complete share repurchases. Each quarter’s free cash flow, which is a non-GAAP measure, is computed as operating cash flow (a GAAP measure) before balance sheet changes less capital expenditures. The declaration and payment of any future dividend, whether fixed or variable, will remain at the full discretion of our Board of Directors and will depend on our financial results, cash requirements, future prospects and other factors deemed relevant by the Board.
In November 2024, Devon announced a fixed cash dividend in the amount of $0.22 per share for approximately $144 million payable in the fourth quarter of 2024. Devon has elected not to declare a variable dividend to be paid in the fourth quarter of 2024.
Our Board of Directors has authorized a $5.0 billion share repurchase program that expires June 30, 2026. Through October 2024, we had executed $3.1 billion of the authorized program.
Capital Expenditures
Our capital expenditures budget for the remainder of 2024 is expected to be approximately $950 million, including $150 million of incremental capital expenditures related to the Grayson Mill acquisition.
Critical Accounting Estimates
Purchase Accounting
Periodically we acquire assets and assume liabilities in transactions accounted for as business combinations, such as the acquisition of the Williston Basin business of Grayson Mill. In connection with the acquisition, we allocated the $5.0 billion of purchase price consideration to the assets acquired and liabilities assumed based on estimated fair values as of the date of the acquisition. The preliminary purchase price assessment remains an ongoing process and is subject to change for up to one year subsequent to the closing date of the acquisition.
We made a number of assumptions in estimating the fair value of assets acquired and liabilities assumed in the acquisition. The most significant assumptions relate to the estimated fair values of proved and unproved oil and gas properties. Since sufficient market data was not available regarding the fair values of proved and unproved oil and gas properties, we prepared estimates and engaged third-party valuation experts. Significant judgments and assumptions are inherent in these estimates and include, among other things, estimates of reserve quantities, estimates of future commodity prices, drilling plans, expected development costs, lease operating costs, reserve risk adjustment factors and an estimate of an applicable market participant discount rate that reflects the risk of the underlying cash flow estimates.
Estimated fair values ascribed to assets acquired can have a significant impact on future results of operations presented in Devon’s financial statements. A higher fair value ascribed to a property results in higher DD&A expense, which results in lower net earnings. Fair values are based on estimates of future commodity prices, reserve quantities, development costs and operating costs. In the event that future commodity prices or reserve quantities are lower than those used as inputs to determine estimates of acquisition date fair values, the likelihood increases that certain costs may be determined to not be recoverable.
For additional information regarding our critical accounting policies and estimates, see our 2023 Annual Report on Form 10-K.
Non-GAAP Measures
We utilize “core earnings attributable to Devon” and “core earnings per share attributable to Devon” that are not required by or presented in accordance with GAAP. These non-GAAP measures are not alternatives to GAAP measures and should not be considered in isolation or as a substitute for analysis of our results reported under GAAP. Core earnings attributable to Devon, as well as the per share amount, represent net earnings excluding certain non-cash and other items that are typically excluded by securities analysts in their published estimates of our financial results. Our non-GAAP measures are typically used as a quarterly performance measure. Amounts excluded relate to asset dispositions, noncash asset impairments (including unproved asset impairments), deferred tax asset valuation allowance, fair value changes in derivative financial instruments and restructuring and transaction costs.
We believe these non-GAAP measures facilitate comparisons of our performance to earnings estimates published by securities analysts. We also believe these non-GAAP measures can facilitate comparisons of our performance between periods and to the performance of our peers.
Below are reconciliations of core earnings and core earnings per share attributable to Devon to comparable GAAP measures.
| | | | | | | | | | | | | | | | | | | | | | | | | | | | | | | |
| Three Months Ended September 30, | | | Nine Months Ended September 30, | |
| Before Tax | | | After Tax | | | After NCI | | | Per Diluted Share | | | Before Tax | | | After Tax | | | After NCI | | | Per Diluted Share | |
2024: | | | | | | | | | | | | | | | | | | | | | | | |
Earnings attributable to Devon (GAAP) | $ | 1,064 | | | $ | 825 | | | $ | 812 | | | $ | 1.30 | | | $ | 2,872 | | | $ | 2,289 | | | $ | 2,252 | | | $ | 3.59 | |
Adjustments: | | | | | | | | | | | | | | | | | | | | | | | |
Asset dispositions | | — | | | | — | | | | — | | | | — | | | | 16 | | | | 12 | | | | 12 | | | | 0.02 | |
Asset and exploration impairments | | 1 | | | | 1 | | | | 1 | | | | — | | | | 2 | | | | 2 | | | | 2 | | | | — | |
Deferred tax asset valuation allowance | | — | | | | (7 | ) | | | (7 | ) | | | (0.01 | ) | | | — | | | | (4 | ) | | | (4 | ) | | | (0.01 | ) |
Fair value changes in financial instruments | | (167 | ) | | | (129 | ) | | | (129 | ) | | | (0.20 | ) | | | 37 | | | | 30 | | | | 30 | | | | 0.05 | |
Restructuring and transaction costs | | 8 | | | | 6 | | | | 6 | | | | 0.01 | | | | 8 | | | | 6 | | | | 6 | | | | 0.01 | |
Core earnings attributable to Devon (Non-GAAP) | $ | 906 | | | $ | 696 | | | $ | 683 | | | $ | 1.10 | | | $ | 2,935 | | | $ | 2,335 | | | $ | 2,298 | | | $ | 3.66 | |
2023: | | | | | | | | | | | | | | | | | | | | | | | |
Earnings attributable to Devon (GAAP) | $ | 1,072 | | | $ | 920 | | | $ | 910 | | | $ | 1.42 | | | $ | 3,193 | | | $ | 2,621 | | | $ | 2,595 | | | $ | 4.03 | |
Adjustments: | | | | | | | | | | | | | | | | | | | | | | | |
Asset dispositions | | — | | | | — | | | | — | | | | — | | | | (41 | ) | | | (31 | ) | | | (31 | ) | | | (0.05 | ) |
Asset and exploration impairments | | — | | | | — | | | | — | | | | — | | | | 3 | | | | 2 | | | | 2 | | | | 0.01 | |
Deferred tax asset valuation allowance | | — | | | | 3 | | | | 3 | | | | — | | | | — | | | | 10 | | | | 10 | | | | 0.02 | |
Fair value changes in financial instruments | | 186 | | | | 145 | | | | 145 | | | | 0.23 | | | | 245 | | | | 189 | | | | 189 | | | | 0.29 | |
Core earnings attributable to Devon (Non-GAAP) | $ | 1,258 | | | $ | 1,068 | | | $ | 1,058 | | | $ | 1.65 | | | $ | 3,400 | | | $ | 2,791 | | | $ | 2,765 | | | $ | 4.30 | |
EBITDAX and Field-Level Cash Margin
To assess the performance of our assets, we use EBITDAX and Field-Level Cash Margin. We compute EBITDAX as net earnings before income tax expense; financing costs, net; exploration expenses; DD&A; asset impairments; asset disposition gains and losses; non-cash share-based compensation; non-cash valuation changes for derivatives and financial instruments; restructuring and transaction costs; accretion on discounted liabilities; and other items not related to our normal operations. Field-Level Cash Margin is computed as oil, gas and NGL sales less production expenses. Production expenses consist of lease operating, gathering, processing and transportation expenses, as well as production and property taxes.
We exclude financing costs from EBITDAX to assess our operating results without regard to our financing methods or capital structure. Exploration expenses and asset disposition gains and losses are excluded from EBITDAX because they generally are not indicators of operating efficiency for a given reporting period. DD&A and impairments are excluded from EBITDAX because capital expenditures are evaluated at the time capital costs are incurred. We exclude share-based compensation, valuation changes, restructuring and transaction costs, accretion on discounted liabilities and other items from EBITDAX because they are not considered a measure of asset operating performance.
We believe EBITDAX and Field-Level Cash Margin provide information useful in assessing our operating and financial performance across periods. EBITDAX and Field-Level Cash Margin as defined by Devon may not be comparable to similarly titled measures used by other companies and should be considered in conjunction with net earnings from operations.
Below are reconciliations of net earnings to EBITDAX and a further reconciliation to Field-Level Cash Margin.
| | | | | | | | | | | | | | | | |
| | Three Months Ended September 30, | | | Nine Months Ended September 30, | |
| | 2024 | | | 2023 | | | 2024 | | | 2023 | |
Net earnings (GAAP) | | $ | 825 | | | $ | 920 | | | $ | 2,289 | | | $ | 2,621 | |
Financing costs, net | | | 88 | | | | 81 | | | | 240 | | | | 231 | |
Income tax expense | | | 239 | | | | 152 | | | | 583 | | | | 572 | |
Exploration expenses | | | 4 | | | | 3 | | | | 16 | | | | 16 | |
Depreciation, depletion and amortization | | | 794 | | | | 651 | | | | 2,284 | | | | 1,904 | |
Asset dispositions | | | — | | | | — | | | | 16 | | | | (41 | ) |
Share-based compensation | | | 24 | | | | 22 | | | | 74 | | | | 70 | |
Derivative and financial instrument non-cash valuation changes | | | (166 | ) | | | 183 | | | | 34 | | | | 245 | |
Restructuring and transaction costs | | | 8 | | | | — | | | | 8 | | | | — | |
Accretion on discounted liabilities and other | | | 37 | | | | 13 | | | | 64 | | | | 28 | |
EBITDAX (Non-GAAP) | | | 1,853 | | | | 2,025 | | | | 5,608 | | | | 5,646 | |
Marketing and midstream revenues and expenses, net | | | 17 | | | | 12 | | | | 48 | | | | 51 | |
Commodity derivative cash settlements | | | (61 | ) | | | 11 | | | | (139 | ) | | | (39 | ) |
General and administrative expenses, cash-based | | | 93 | | | | 77 | | | | 271 | | | | 227 | |
Field-level cash margin (Non-GAAP) | | $ | 1,902 | | | $ | 2,125 | | | $ | 5,788 | | | $ | 5,885 | |
Item 3. Quantitative and Qualitative Disclosures About Market Risk
Commodity Price Risk
As of September 30, 2024, we have commodity derivatives that pertain to a portion of our estimated production for the last three months of 2024, as well as for 2025 and 2026. The key terms to our open oil, gas and NGL derivative financial instruments are presented in Note 3 in “Part I. Financial Information – Item 1. Financial Statements” in this report.
The fair values of our commodity derivatives are largely determined by the forward curves of the relevant price indices. At September 30, 2024, a 10% change in the forward curves associated with our commodity derivative instruments would have changed our net positions by approximately $195 million.
Interest Rate Risk
At September 30, 2024, we had total debt of $8.9 billion. $7.9 billion of this debt was comprised of debentures and notes that have fixed interest rates which average 5.7%. We also have a $1.0 billion Term Loan which has a variable interest rate that is adjusted monthly. The interest rate on the Term Loan was 6.33% at September 30, 2024.
Item 4. Controls and Procedures
Disclosure Controls and Procedures
We have established disclosure controls and procedures to ensure that material information relating to Devon, including its consolidated subsidiaries, is made known to the officers who certify Devon’s financial reports and to other members of senior management and the Board of Directors.
Based on their evaluation, our principal executive and principal financial officers have concluded that our disclosure controls and procedures (as defined in Rules 13a-15(e) and 15d-15(e) under the Securities Exchange Act of 1934) were effective as of September 30, 2024 to ensure that the information required to be disclosed by Devon in the reports that it files or submits under the Securities Exchange Act of 1934 is recorded, processed, summarized and reported within the time periods specified in the SEC rules and forms.
Changes in Internal Control Over Financial Reporting
There were no changes in our internal control over financial reporting that occurred during our most recent fiscal quarter that have materially affected, or are reasonably likely to materially affect, our internal control over financial reporting.
PART II. Other Information
Item 1. Legal Proceedings
We are involved in various legal proceedings incidental to our business. However, to our knowledge as of the date of this report and subject to the environmental matters noted in Part I, Item 3. Legal Proceedings of our 2023 Annual Report on Form 10-K and Part II, Item 1. Legal Proceedings of our Second Quarter 2024 Quarterly Report on Form 10-Q, as well as the discussion of the North Dakota NOV matter included in Note 15 in “Part I. Financial Information – Item 1. Financial Statements” of this report, there were no material pending legal proceedings to which we are a party or to which any of our property is subject. For more information on our legal contingencies, see Note 15 in “Part I. Financial Information – Item 1. Financial Statements” of this report.
Please see our 2023 Annual Report on Form 10-K and other SEC filings for additional information.
Item 1A. Risk Factors
There have been no material changes to the information included in Item 1A. “Risk Factors” in our 2023 Annual Report on Form 10-K.
Item 2. Unregistered Sales of Equity Securities and Use of Proceeds
The following table provides information regarding purchases of our common stock that were made by us during the third quarter of 2024 (shares in thousands).
| | | | | | | | | | | | | | | | |
Period | | Total Number of
Shares Purchased (1) | | | Average Price
Paid per Share | | | Total Number of Shares Purchased as Part of Publicly Announced Plans or Programs (2) | | | Maximum Dollar Value of Shares that May Yet Be Purchased Under the Plans or Programs (2) | |
July 1 - July 31 | | | 1,927 | | | $ | 46.98 | | | | 1,925 | | | $ | 2,162 | |
August 1 - August 31 | | | 3,058 | | | $ | 44.49 | | | | 3,056 | | | $ | 2,026 | |
September 1 - September 30 | | | 1,695 | | | $ | 40.64 | | | | 1,694 | | | $ | 1,957 | |
Total | | | 6,680 | | | $ | 44.23 | | | | 6,675 | | | | |
(1)In addition to shares purchased under the share repurchase program described below, these amounts include approximately four thousand shares received by us from employees for the payment of personal income tax withholdings on vesting transactions.
(2)On November 2, 2021, we announced a $1.0 billion share repurchase program that would expire on December 31, 2022. Through subsequent approvals, Devon's Board of Directors expanded the share repurchase program authorization to $3.0 billion, with a December 31, 2024 expiration date. In July 2024, Devon's Board of Directors further expanded the share repurchase program authorization to $5.0 billion, with a June 30, 2026 expiration date. In the third quarter of 2024, we repurchased 6.7 million common shares for $295 million, or $44.23 per share, under this share repurchase program. For additional information, see Note 14 in “Part I. Financial Information – Item 1. Financial Statements” in this report. Item 3. Defaults Upon Senior Securities
Not applicable.
Item 4. Mine Safety Disclosures
Not applicable.
Item 5. Other Information
During the three months ended September 30, 2024, none of the Company's directors or officers (as defined in Rule 16a-1(f) of the Securities Exchange Act of 1934) adopted, terminated or modified a Rule 10b5-1 trading arrangement or non-Rule 10b5-1 trading arrangement (as such terms are defined in Item 408 of Regulation S-K).
Item 6. Exhibits
| | |
Exhibit Number |
| Description |
| |
2.1 | Securities Purchase Agreement, dated July 8, 2024, by and among Grayson Mill Holdings II, LLC, Grayson Mill Holdings III, LLC, Grayson Mill Intermediate HoldCo II, LLC, Grayson Mill Intermediate HoldCo III, LLC, WPX Energy Williston, LLC and Devon Energy Corporation (incorporated by reference to Exhibit 2.1 to Registrant’s Form 8-K filed July 8, 2024; File No. 001-32318).* |
| |
2.2 | Amendment to Securities Purchase Agreement, dated September 27, 2024, by and among Grayson Mill Holdings II, LLC, Grayson Mill Holdings III, LLC, Grayson Mill Intermediate HoldCo II, LLC, Grayson Mill Intermediate HoldCo III, LLC, WPX Energy Williston, LLC and Devon Energy Corporation.* |
| |
4.1 | Indenture, dated as of August 28, 2024, by and between Devon Energy Corporation and U.S. Bank Trust Company, National Association (incorporated by reference to Exhibit 4.1 to Registrant’s Form 8-K filed August 28, 2024; File No. 001-32318). |
| |
4.2 | Supplemental Indenture No. 1, dated as of August 28, 2024, by and between Devon Energy Corporation and U.S. Bank Trust Company, National Association, relating to the 5.200% Senior Notes due 2034 (incorporated by reference to Exhibit 4.2 to Registrant’s Form 8-K filed August 28, 2024; File No. 001-32318). |
| |
4.3 | Supplemental Indenture No. 2, dated as of August 28, 2024, by and between Devon Energy Corporation and U.S. Bank Trust Company, National Association, relating to the 5.750% Senior Notes due 2054 (incorporated by reference to Exhibit 4.3 to Registrant’s Form 8-K filed August 28, 2024; File No. 001-32318). |
| |
4.4 | Registration Rights Agreement, dated as of September 27, 2024, by and among Devon Energy Corporation and the stockholders from time to time party thereto. |
| |
10.1 | Delayed Draw Term Loan Credit Agreement, dated August 12, 2024, by and among Devon Energy Corporation, each lender from time to time party thereto, and Bank of America, N.A., as Administrative Agent (incorporated by reference to Exhibit 10.1 to Registrant’s Form 8-K filed August 12, 2024; File No. 001-32318).* |
| |
31.1 | Certification of principal executive officer pursuant to Section 302 of the Sarbanes-Oxley Act of 2002. |
| |
31.2 | Certification of principal financial officer pursuant to Section 302 of the Sarbanes-Oxley Act of 2002. |
| |
32.1 | Certification of principal executive officer pursuant to Section 906 of the Sarbanes-Oxley Act of 2002. |
| |
32.2 | Certification of principal financial officer pursuant to Section 906 of the Sarbanes-Oxley Act of 2002. |
| |
101.INS | Inline XBRL Instance Document – the XBRL Instance Document does not appear in the Interactive Data File because its XBRL tags are embedded within the Inline XBRL document. |
| |
101.SCH | Inline XBRL Taxonomy Extension Schema Document. |
| |
101.CAL | XBRL Taxonomy Extension Calculation Linkbase Document. |
| |
101.DEF | XBRL Taxonomy Extension Definition Linkbase Document. |
| |
101.LAB | XBRL Taxonomy Extension Labels Linkbase Document. |
| |
101.PRE | XBRL Taxonomy Extension Presentation Linkbase Document. |
| |
104 | Cover Page Interactive Data File (formatted as Inline XBRL and contained in Exhibit 101). |
| |
| *Certain annexes, schedules and exhibits have been omitted pursuant to Item 601(a)(5) of Regulation S-K. The Registrant undertakes to furnish supplemental copies of any of the omitted annexes, schedules and exhibits to the U.S. Securities and Exchange Commission upon its request. |
SIGNATURES
Pursuant to the requirements of the Securities Exchange Act of 1934, the registrant has duly caused this report to be signed on its behalf by the undersigned thereunto duly authorized.
| | | | |
|
| |
| DEVON ENERGY CORPORATION |
| | |
Date: November 6, 2024 |
| |
| /s/ John B. Sherrer |
|
| |
| John B. Sherrer |
|
| |
| Vice President, Accounting and Controller |