February 16, 2021 Q4 2020 Earnings Presentation Exhibit 99.2
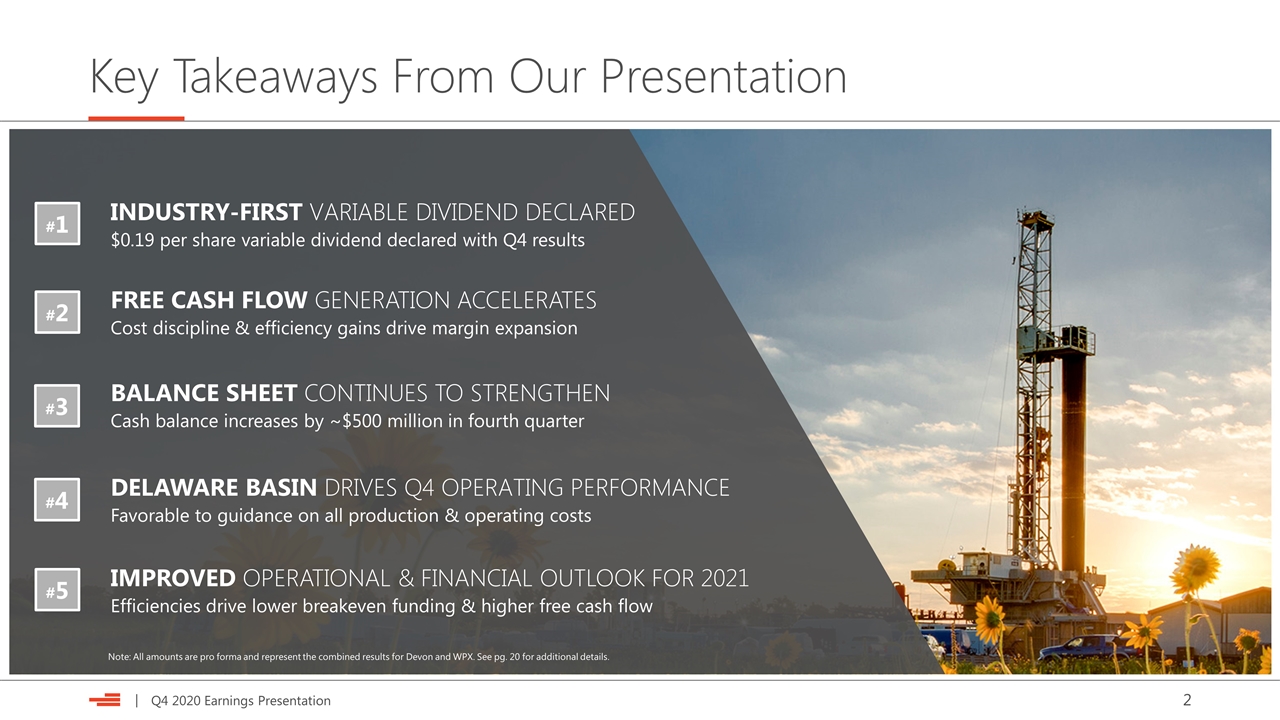
Key Takeaways From Our Presentation DELAWARE BASIN DRIVES Q4 OPERATING PERFORMANCE Favorable to guidance on all production & operating costs FREE CASH FLOW GENERATION ACCELERATES Cost discipline & efficiency gains drive margin expansion BALANCE SHEET CONTINUES TO STRENGTHEN Cash balance increases by ~$500 million in fourth quarter IMPROVED OPERATIONAL & FINANCIAL OUTLOOK FOR 2021 Efficiencies drive lower breakeven funding & higher free cash flow INDUSTRY-FIRST VARIABLE DIVIDEND DECLARED $0.19 per share variable dividend declared with Q4 results #1 #2 #3 #4 #5 Note: All amounts are pro forma and represent the combined results for Devon and WPX. See pg. 20 for additional details.
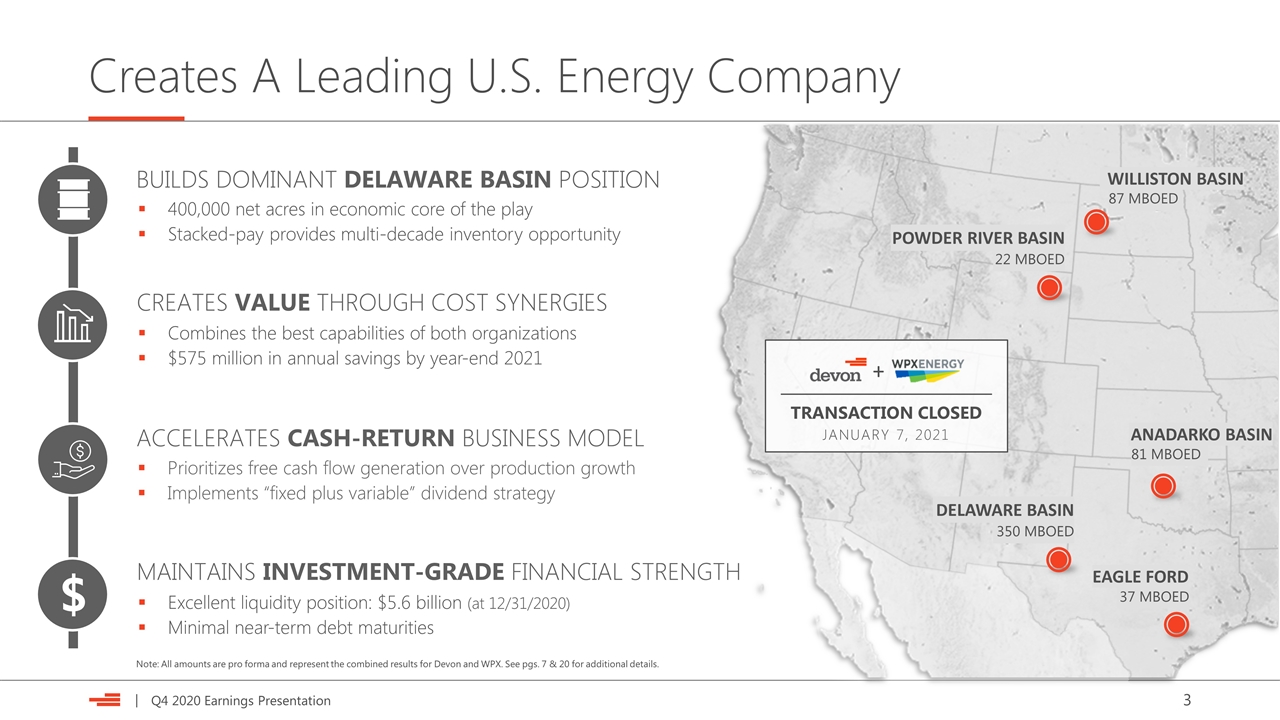
Creates A Leading U.S. Energy Company pro forma attributes POWDER RIVER BASIN ANADARKO BASIN EAGLE FORD 81 MBOED 37 MBOED 22 MBOED WILLISTON BASIN 87 MBOED BUILDS DOMINANT DELAWARE BASIN POSITION 400,000 net acres in economic core of the play Stacked-pay provides multi-decade inventory opportunity ACCELERATES CASH-RETURN BUSINESS MODEL Prioritizes free cash flow generation over production growth Implements “fixed plus variable” dividend strategy MAINTAINS INVESTMENT-GRADE FINANCIAL STRENGTH Excellent liquidity position: $5.6 billion (at 12/31/2020) Minimal near-term debt maturities $ DELAWARE BASIN 350 MBOED CREATES VALUE THROUGH COST SYNERGIES Combines the best capabilities of both organizations $575 million in annual savings by year-end 2021 + TRANSACTION CLOSED JANUARY 7, 2021 Note: All amounts are pro forma and represent the combined results for Devon and WPX. See pgs. 7 & 20 for additional details.
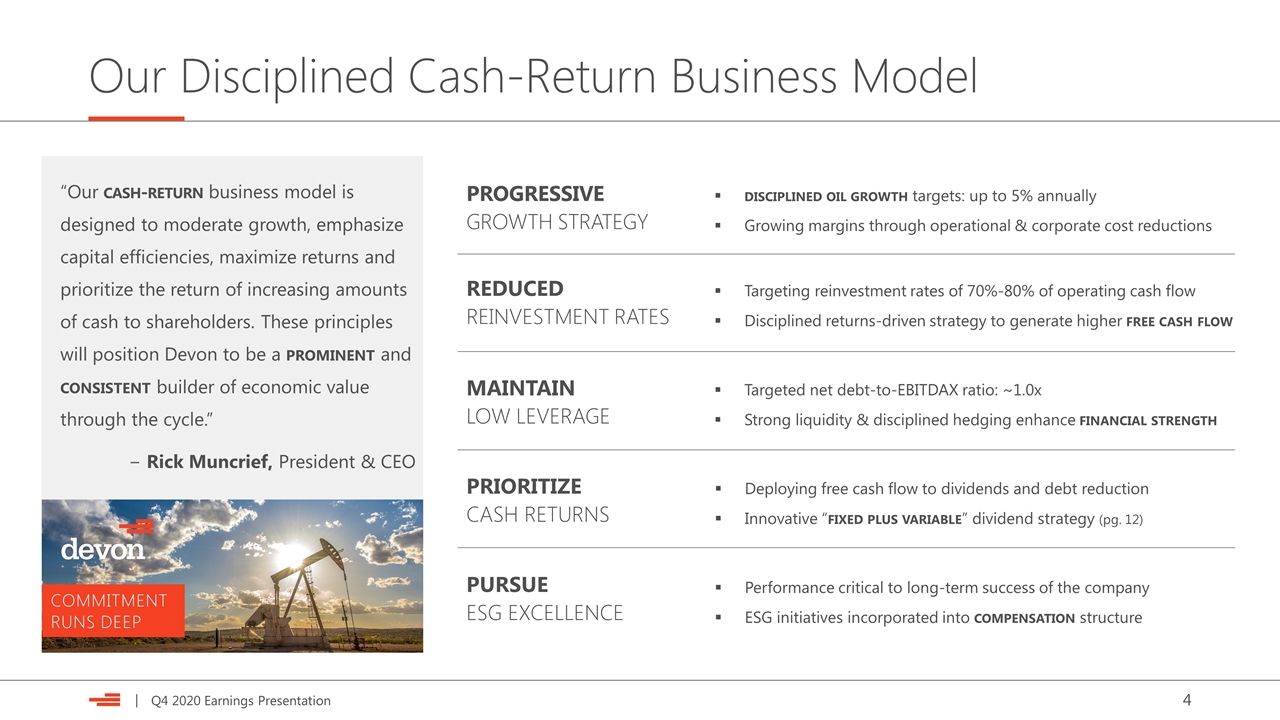
Our Disciplined Cash-Return Business Model PROGRESSIVE GROWTH STRATEGY disciplined oil growth targets: up to 5% annually Growing margins through operational & corporate cost reductions REDUCED REINVESTMENT RATES Targeting reinvestment rates of 70%-80% of operating cash flow Disciplined returns-driven strategy to generate higher free cash flow MAINTAIN LOW LEVERAGE Targeted net debt-to-EBITDAX ratio: ~1.0x Strong liquidity & disciplined hedging enhance financial strength PRIORITIZE CASH RETURNS Deploying free cash flow to dividends and debt reduction Innovative “fixed plus variable” dividend strategy (pg. 12) PURSUE ESG EXCELLENCE Performance critical to long-term success of the company ESG initiatives incorporated into compensation structure “Our cash-return business model is designed to moderate growth, emphasize capital efficiencies, maximize returns and prioritize the return of increasing amounts of cash to shareholders. These principles will position Devon to be a prominent and consistent builder of economic value through the cycle.” − Rick Muncrief, President & CEO COMMITMENT RUNS DEEP
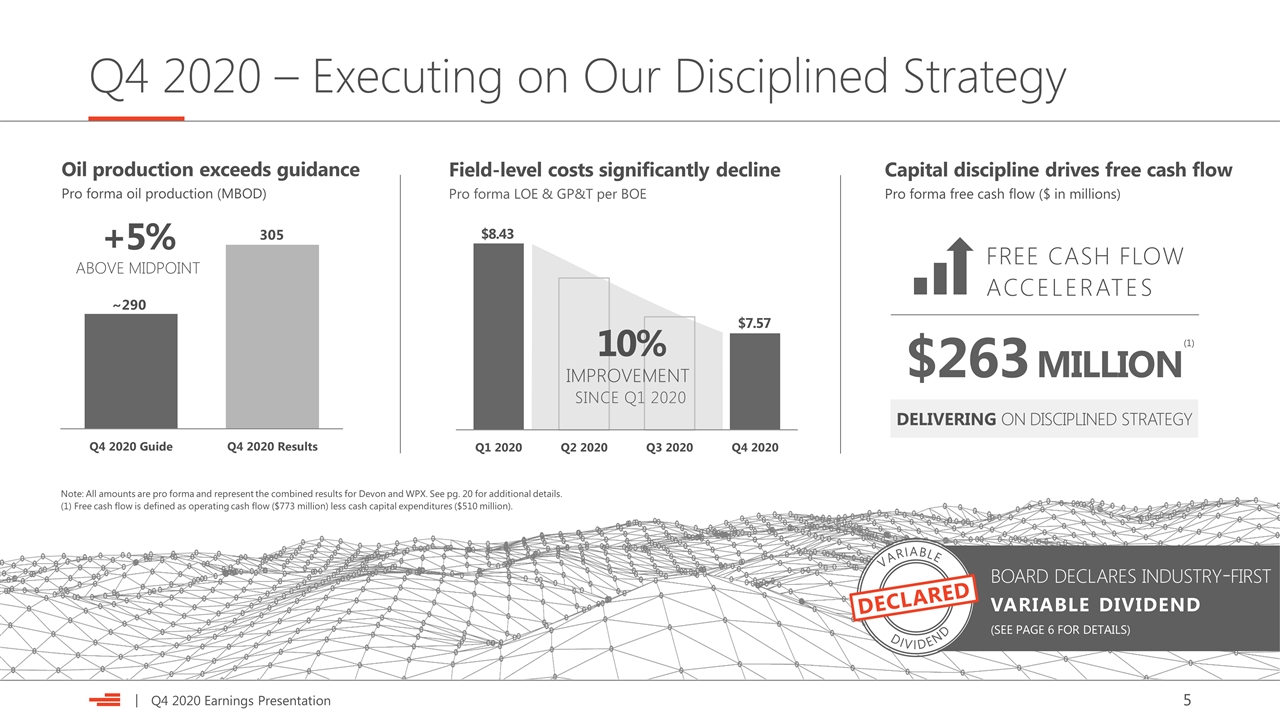
Q4 2020 – Executing on Our Disciplined Strategy Field-level costs significantly decline Pro forma LOE & GP&T per BOE $8.43 $7.57 Oil production exceeds guidance Pro forma oil production (MBOD) ~290 Capital discipline drives free cash flow Pro forma free cash flow ($ in millions) 10% SINCE Q1 2020 IMPROVEMENT $263 MILLION DELIVERING ON DISCIPLINED STRATEGY FREE CASH FLOW ACCELERATES 305 +5% ABOVE MIDPOINT Note: All amounts are pro forma and represent the combined results for Devon and WPX. See pg. 20 for additional details. board declares industry-first variable dividend (SEE PAGE 6 FOR DETAILS) DECLARED DIVIDEND VARIABLE (1) Free cash flow is defined as operating cash flow ($773 million) less cash capital expenditures ($510 million). (1)
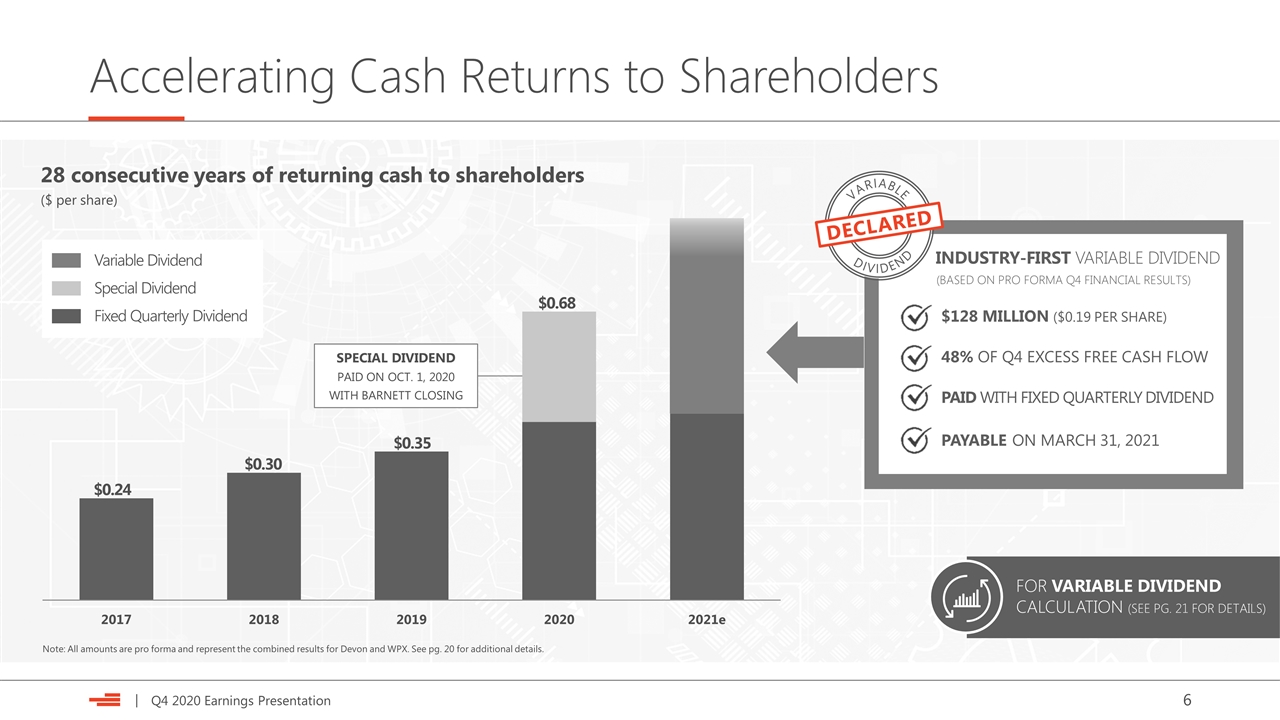
Accelerating Cash Returns to Shareholders 28 consecutive years of returning cash to shareholders ($ per share) $0.24 $128 MILLION ($0.19 PER SHARE) 48% OF Q4 EXCESS FREE CASH FLOW PAID WITH FIXED QUARTERLY DIVIDEND PAYABLE ON MARCH 31, 2021 INDUSTRY-FIRST VARIABLE DIVIDEND SPECIAL DIVIDEND PAID ON OCT. 1, 2020 WITH BARNETT CLOSING DECLARED DIVIDEND VARIABLE Note: All amounts are pro forma and represent the combined results for Devon and WPX. See pg. 20 for additional details. $0.30 $0.35 $0.68 FOR VARIABLE DIVIDEND CALCULATION (SEE PG. 21 FOR DETAILS) Special Dividend Fixed Quarterly Dividend Variable Dividend (BASED ON PRO FORMA Q4 FINANCIAL RESULTS)
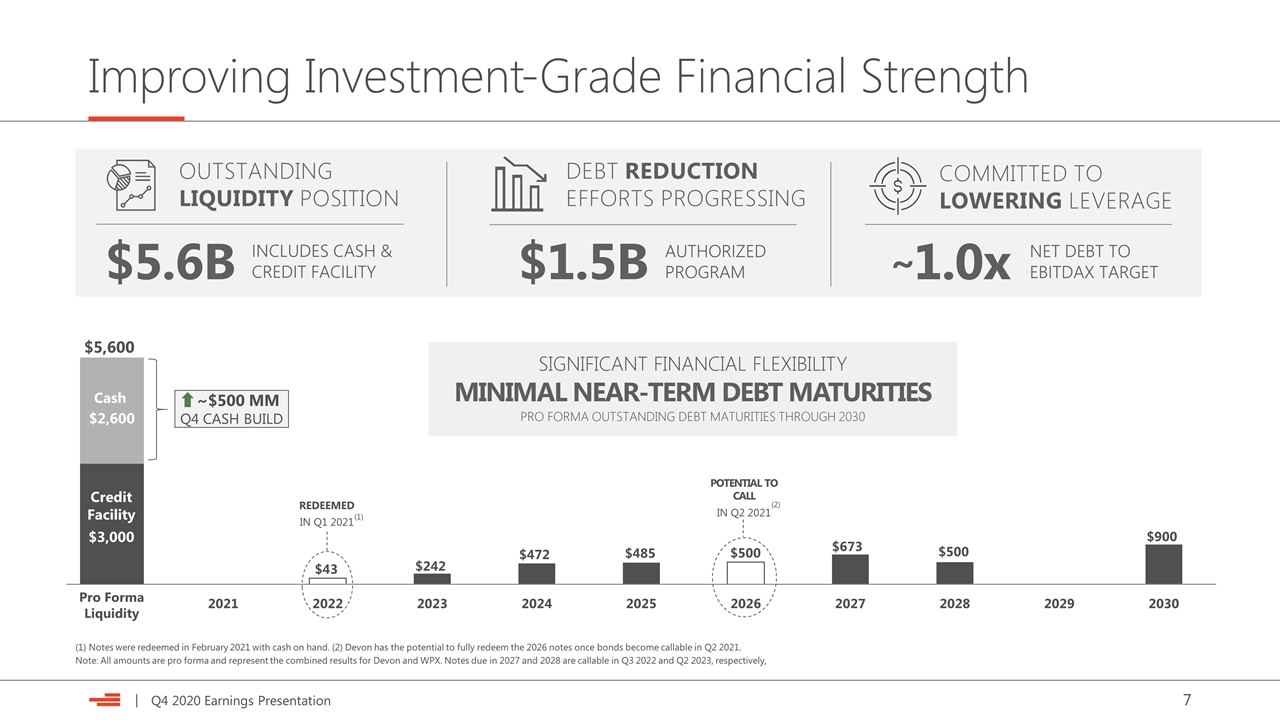
Improving Investment-Grade Financial Strength $5,600 Cash Credit Facility $2,600 $3,000 MINIMAL NEAR-TERM DEBT MATURITIES SIGNIFICANT FINANCIAL FLEXIBILITY ~$500 MM Q4 CASH BUILD OUTSTANDING LIQUIDITY POSITION $5.6B INCLUDES CASH & CREDIT FACILITY COMMITTED TO LOWERING LEVERAGE 1.0x NET DEBT TO EBITDAX TARGET DEBT REDUCTION EFFORTS PROGRESSING $1.5B AUTHORIZED PROGRAM REDEEMED IN Q1 2021 POTENTIAL TO CALL IN Q2 2021 Note: All amounts are pro forma and represent the combined results for Devon and WPX. Notes due in 2027 and 2028 are callable in Q3 2022 and Q2 2023, respectively, ~ (1) Notes were redeemed in February 2021 with cash on hand. (2) Devon has the potential to fully redeem the 2026 notes once bonds become callable in Q2 2021. (1) (2) PRO FORMA OUTSTANDING DEBT MATURITIES THROUGH 2030
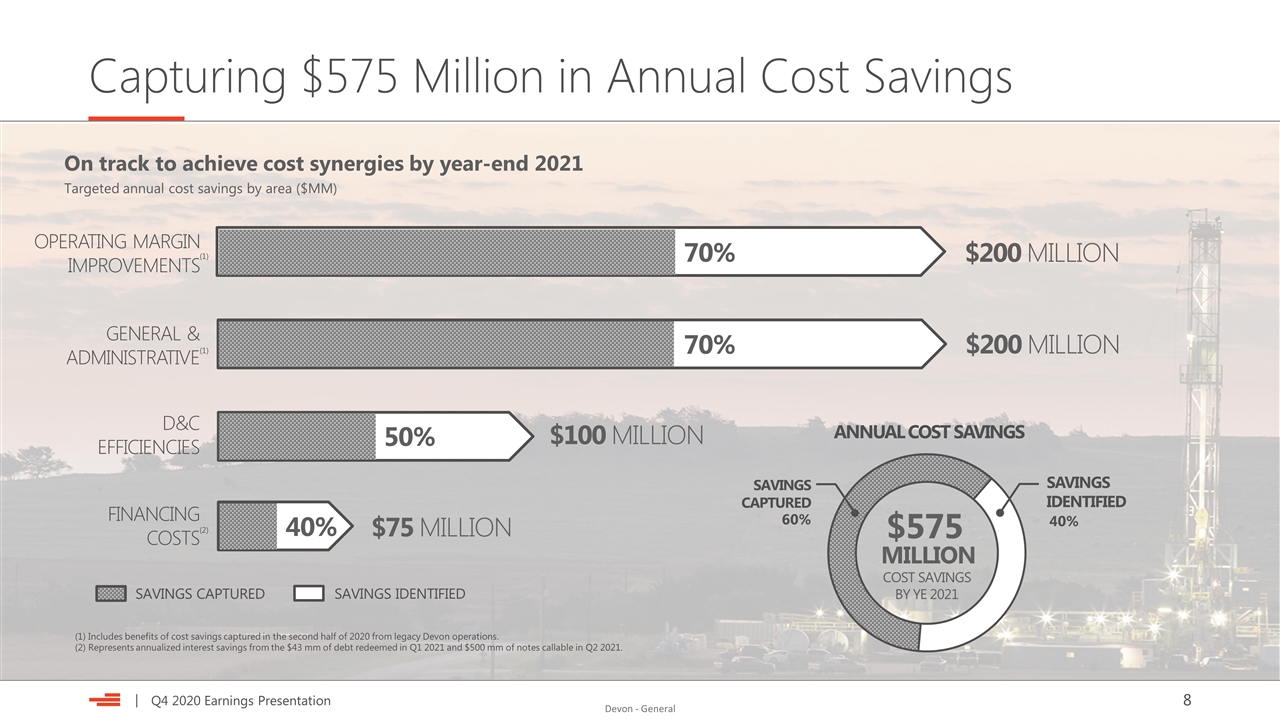
$200 MILLION Capturing $575 Million in Annual Cost Savings GENERAL & ADMINISTRATIVE $100 MILLION D&C EFFICIENCIES $75 MILLION OPERATING MARGIN IMPROVEMENTS SAVINGS CAPTURED SAVINGS IDENTIFIED $200 MILLION FINANCING COSTS 70% ANNUAL COST SAVINGS $575 COST SAVINGS BY YE 2021 MILLION SAVINGS CAPTURED SAVINGS IDENTIFIED 60% 40% 50% On track to achieve cost synergies by year-end 2021 Targeted annual cost savings by area ($MM) (1) Includes benefits of cost savings captured in the second half of 2020 from legacy Devon operations. (2) Represents annualized interest savings from the $43 mm of debt redeemed in Q1 2021 and $500 mm of notes callable in Q2 2021. (2) (1) (1) 40% 70%
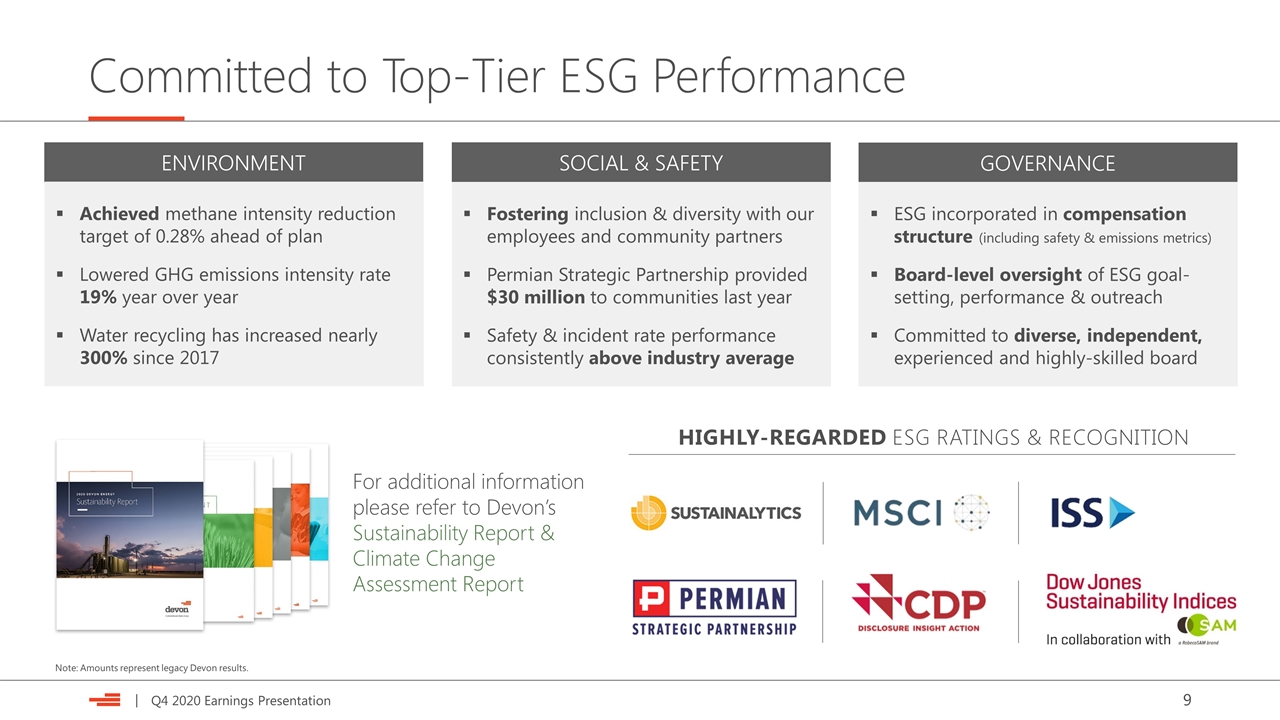
Committed to Top-Tier ESG Performance HIGHLY-REGARDED ESG RATINGS & RECOGNITION ENVIRONMENT SOCIAL & SAFETY GOVERNANCE Achieved methane intensity reduction target of 0.28% ahead of plan Lowered GHG emissions intensity rate 19% year over year Water recycling has increased nearly 300% since 2017 Fostering inclusion & diversity with our employees and community partners Permian Strategic Partnership provided $30 million to communities last year Safety & incident rate performance consistently above industry average ESG incorporated in compensation structure (including safety & emissions metrics) Board-level oversight of ESG goal-setting, performance & outreach Committed to diverse, independent, experienced and highly-skilled board Note: Amounts represent legacy Devon results. For additional information please refer to Devon’s Sustainability Report & Climate Change Assessment Report
Asset Overview 2021 Outlook
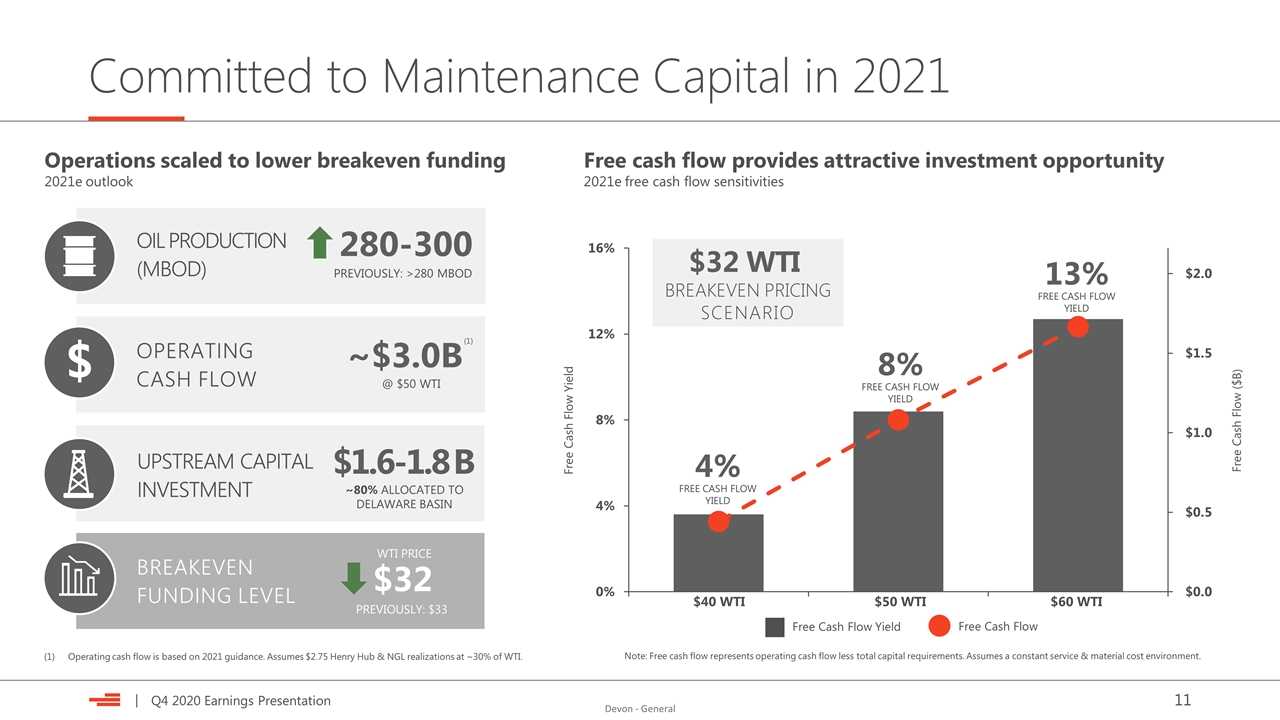
Committed to Maintenance Capital in 2021 OIL PRODUCTION (MBOD) BREAKEVEN FUNDING LEVEL 280-300 $32 OPERATING CASH FLOW ~$3.0B WTI PRICE UPSTREAM CAPITAL INVESTMENT $ $1.6-1.8 B Operations scaled to lower breakeven funding 2021e outlook Note: Free cash flow represents operating cash flow less total capital requirements. Assumes a constant service & material cost environment. $40 WTI $50 WTI Free cash flow provides attractive investment opportunity 2021e free cash flow sensitivities $60 WTI 4% FREE CASH FLOW YIELD 8% FREE CASH FLOW YIELD 13% FREE CASH FLOW YIELD Free Cash Flow Free Cash Flow Yield Free Cash Flow Yield Free Cash Flow ($B) BREAKEVEN PRICING SCENARIO $32 WTI Operating cash flow is based on 2021 guidance. Assumes $2.75 Henry Hub & NGL realizations at ~30% of WTI. @ $50 WTI PREVIOUSLY: >280 MBOD PREVIOUSLY: $33 ~80% ALLOCATED TO DELAWARE BASIN (1)
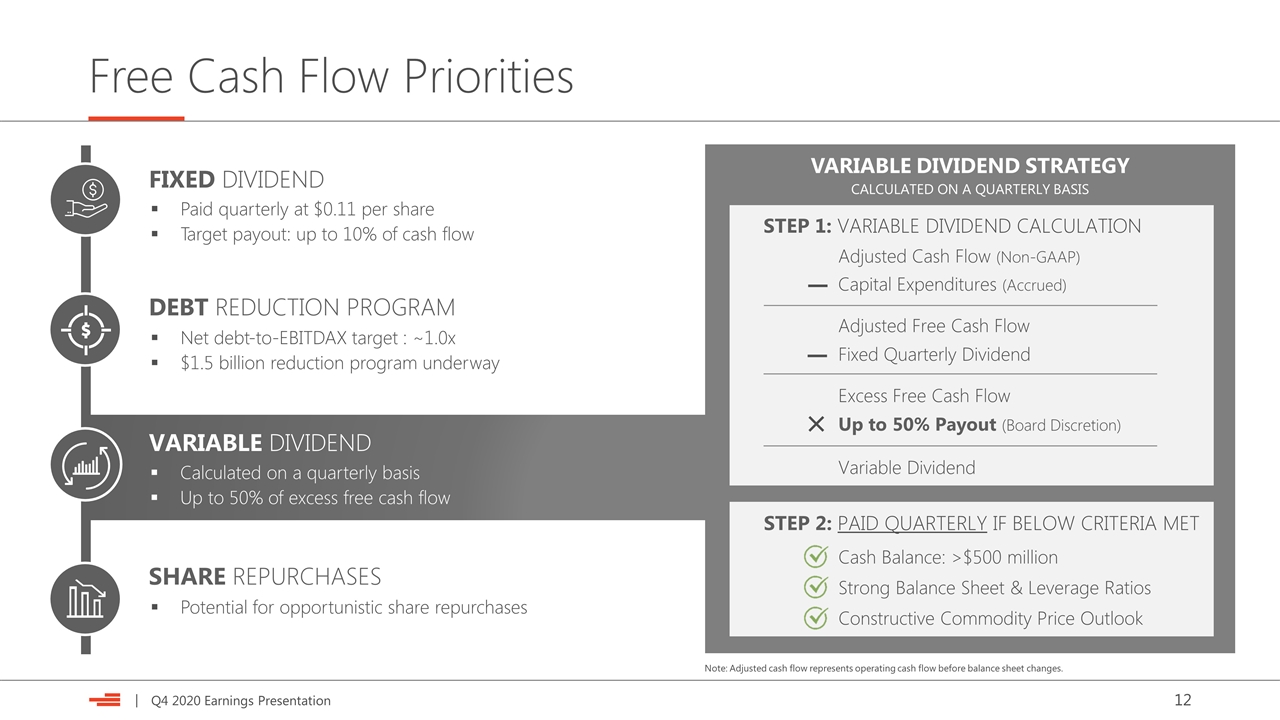
Free Cash Flow Priorities STEP 1: VARIABLE DIVIDEND CALCULATION Adjusted Cash Flow (Non-GAAP) − Capital Expenditures (Accrued) Adjusted Free Cash Flow − Fixed Quarterly Dividend Excess Free Cash Flow × Up to 50% Payout (Board Discretion) Variable Dividend STEP 2: PAID QUARTERLY IF BELOW CRITERIA MET Cash Balance: >$500 million Strong Balance Sheet & Leverage Ratios Constructive Commodity Price Outlook FIXED DIVIDEND Paid quarterly at $0.11 per share Target payout: up to 10% of cash flow VARIABLE DIVIDEND Calculated on a quarterly basis Up to 50% of excess free cash flow DEBT REDUCTION PROGRAM Net debt-to-EBITDAX target : ~1.0x $1.5 billion reduction program underway SHARE REPURCHASES Potential for opportunistic share repurchases VARIABLE DIVIDEND STRATEGY CALCULATED ON A QUARTERLY BASIS Note: Adjusted cash flow represents operating cash flow before balance sheet changes.
Asset Overview Operations Update
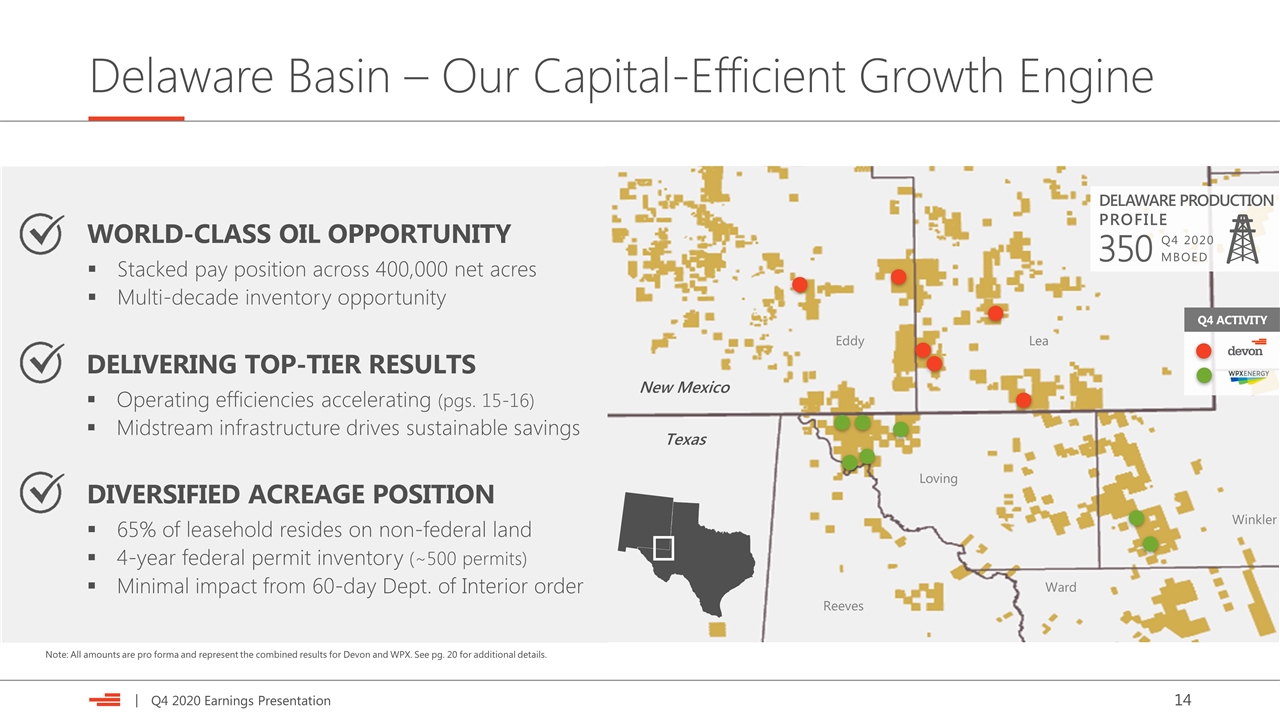
Delaware Basin – Our Capital-Efficient Growth Engine New Mexico Texas Loving Ward Reeves Winkler Eddy Note: All amounts are pro forma and represent the combined results for Devon and WPX. See pg. 20 for additional details. Lea Q4 ACTIVITY DELIVERING TOP-TIER RESULTS Operating efficiencies accelerating (pgs. 15-16) Midstream infrastructure drives sustainable savings DIVERSIFIED ACREAGE POSITION 65% of leasehold resides on non-federal land 4-year federal permit inventory (~500 permits) Minimal impact from 60-day Dept. of Interior order WORLD-CLASS OIL OPPORTUNITY Stacked pay position across 400,000 net acres Multi-decade inventory opportunity DELAWARE PRODUCTION PROFILE 350 MBOED Q4 2020
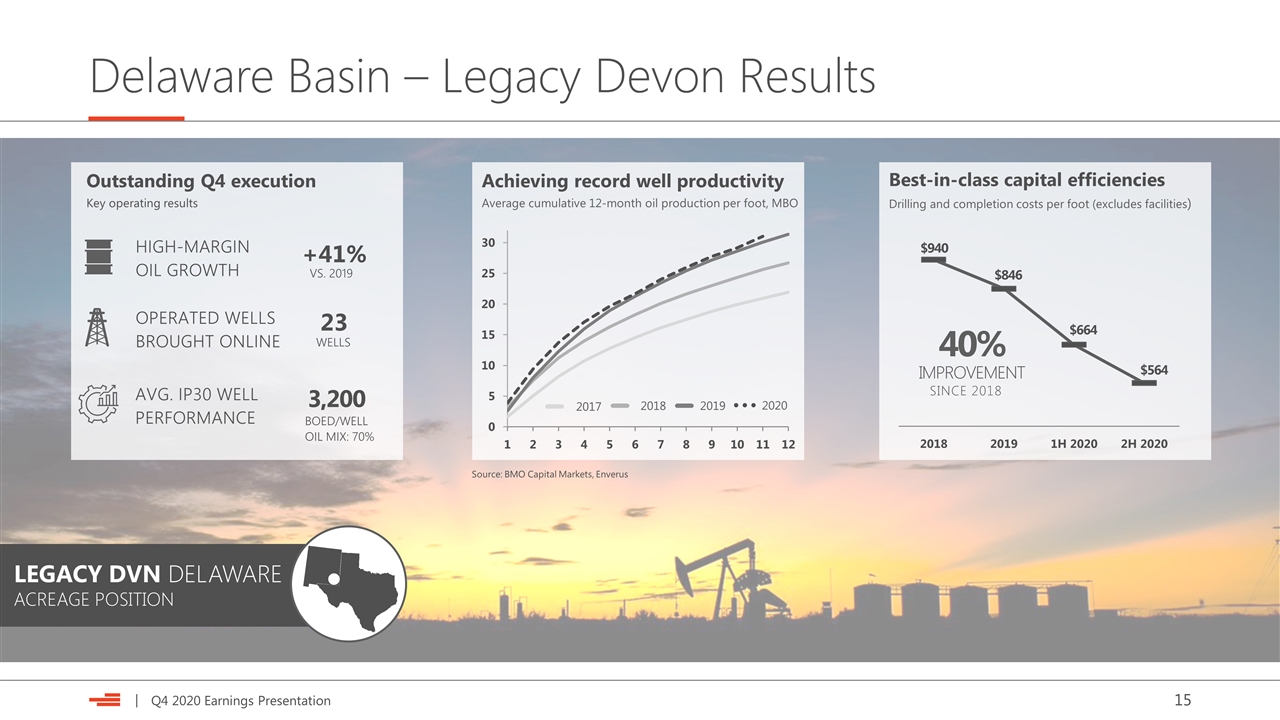
Delaware Basin – Legacy Devon Results LEGACY DVN DELAWARE ACREAGE POSITION Best-in-class capital efficiencies Drilling and completion costs per foot (excludes facilities) $940 $846 $664 $564 40% SINCE 2018 IMPROVEMENT Outstanding Q4 execution Key operating results HIGH-MARGIN OIL GROWTH +41% OPERATED WELLS BROUGHT ONLINE 23 WELLS VS. 2019 AVG. IP30 WELL PERFORMANCE 3,200 BOED/WELL OIL MIX: 70% Achieving record well productivity Average cumulative 12-month oil production per foot, MBO 2017 2018 2019 2020 Source: BMO Capital Markets, Enverus
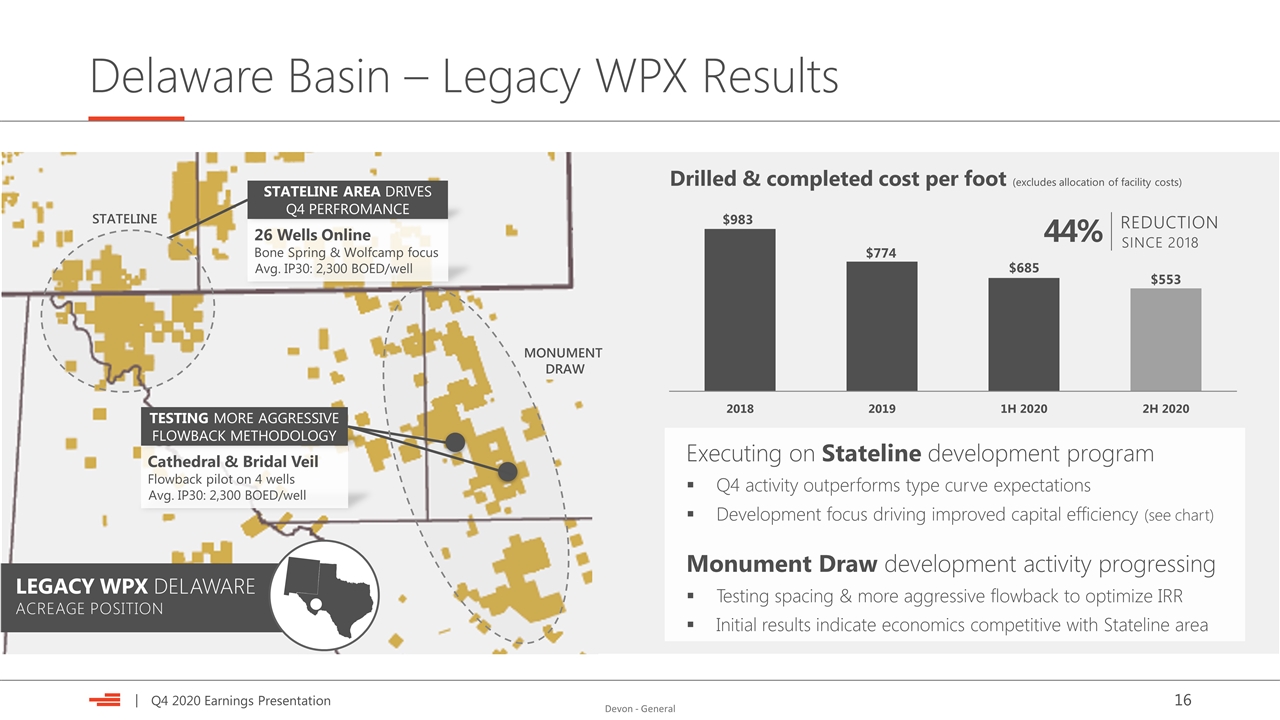
Delaware Basin – Legacy WPX Results $983 $774 $685 $553 Drilled & completed cost per foot (excludes allocation of facility costs) Cathedral & Bridal Veil Flowback pilot on 4 wells Avg. IP30: 2,300 BOED/well testing MORE AGGRESSIVE flowback methodology 26 Wells Online Bone Spring & Wolfcamp focus Avg. IP30: 2,300 BOED/well STATELINE AREA DRIVES Q4 PERFROMANCE STATELINE MONUMENT DRAW LEGACY WPX DELAWARE ACREAGE POSITION Executing on Stateline development program Q4 activity outperforms type curve expectations Development focus driving improved capital efficiency (see chart) Monument Draw development activity progressing Testing spacing & more aggressive flowback to optimize IRR Initial results indicate economics competitive with Stateline area 44% SINCE 2018 REDUCTION
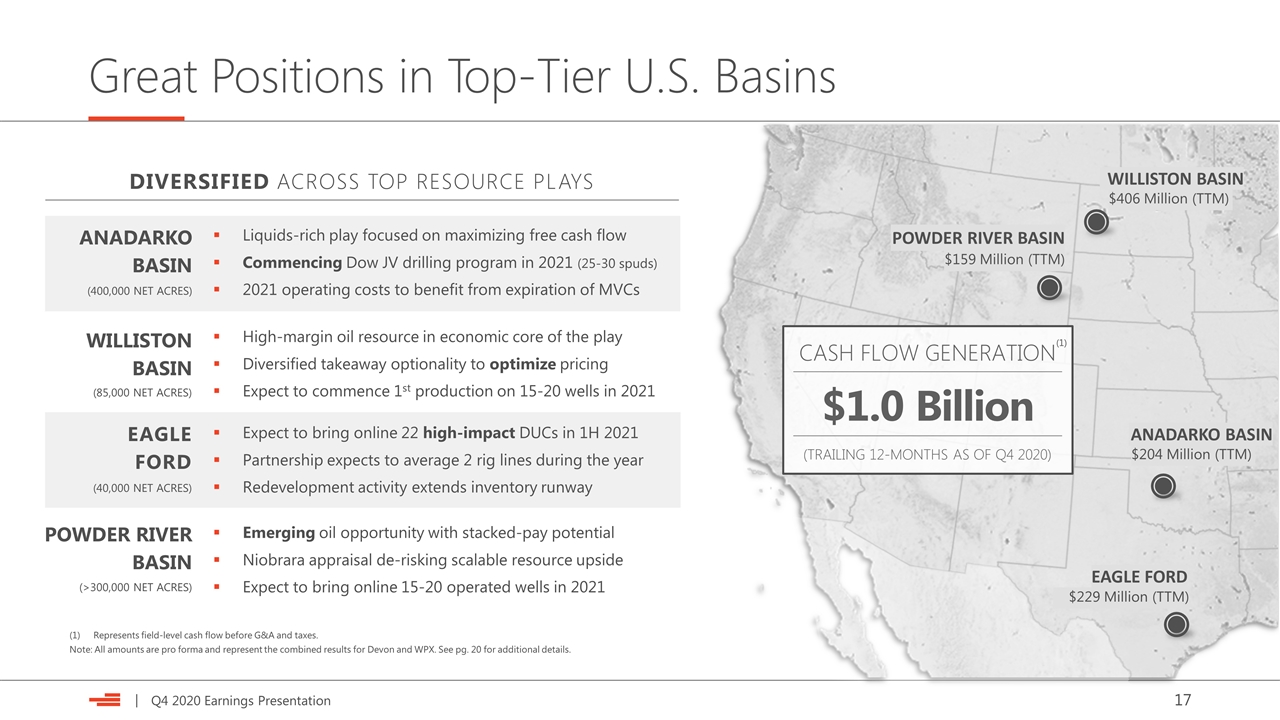
Great Positions in Top-Tier U.S. Basins WILLISTON BASIN POWDER RIVER BASIN DIVERSIFIED ACROSS TOP RESOURCE PLAYS ANADARKO BASIN High-margin oil resource in economic core of the play Diversified takeaway optionality to optimize pricing Expect to commence 1st production on 15-20 wells in 2021 Expect to bring online 22 high-impact DUCs in 1H 2021 Partnership expects to average 2 rig lines during the year Redevelopment activity extends inventory runway Liquids-rich play focused on maximizing free cash flow Commencing Dow JV drilling program in 2021 (25-30 spuds) 2021 operating costs to benefit from expiration of MVCs EAGLE FORD (400,000 NET ACRES) (85,000 NET ACRES) (40,000 NET ACRES) (>300,000 NET ACRES) Emerging oil opportunity with stacked-pay potential Niobrara appraisal de-risking scalable resource upside Expect to bring online 15-20 operated wells in 2021 POWDER RIVER BASIN ANADARKO BASIN EAGLE FORD $204 Million (TTM) $229 Million (TTM) $159 Million (TTM) WILLISTON BASIN $406 Million (TTM) CASH FLOW GENERATION $1.0 Billion (TRAILING 12-MONTHS AS OF Q4 2020) (1) Represents field-level cash flow before G&A and taxes. Note: All amounts are pro forma and represent the combined results for Devon and WPX. See pg. 20 for additional details.
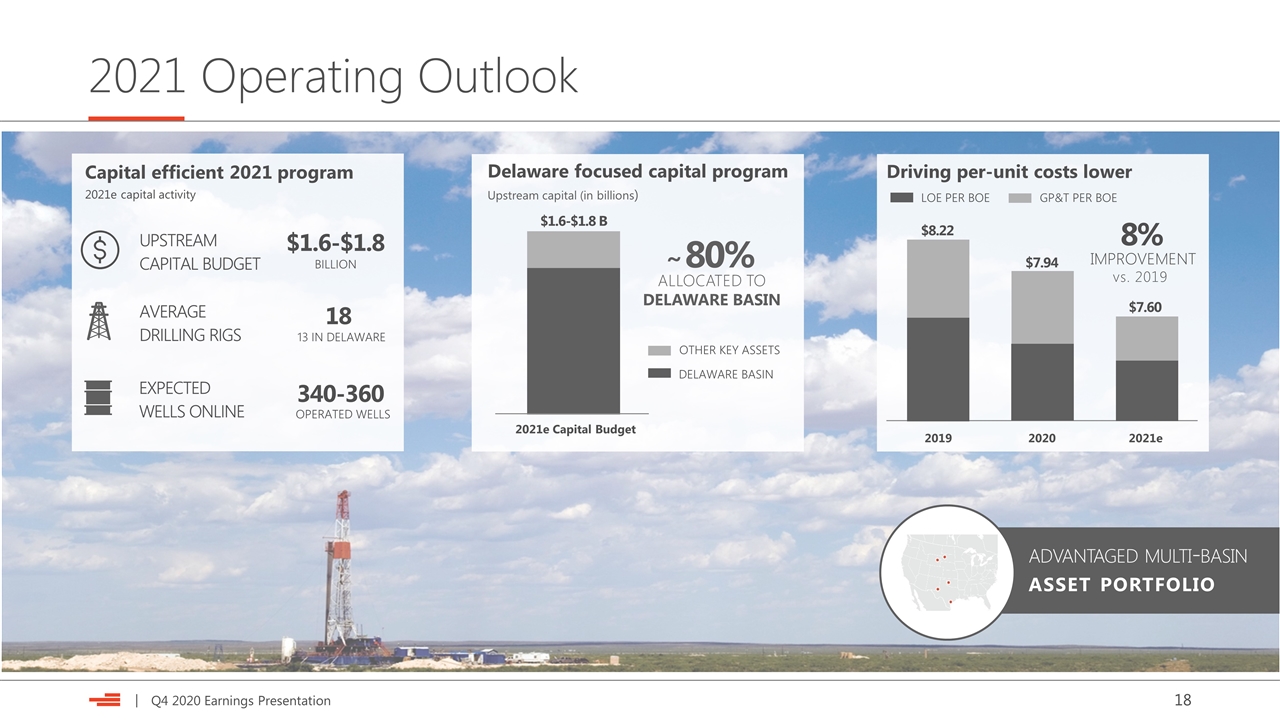
2021 Operating Outlook Driving per-unit costs lower Capital efficient 2021 program 2021e capital activity UPSTREAM CAPITAL BUDGET $1.6-$1.8 AVERAGE DRILLING RIGS BILLION EXPECTED WELLS ONLINE 18 13 IN DELAWARE Delaware focused capital program Upstream capital (in billions) 340-360 OPERATED WELLS ALLOCATED TO DELAWARE BASIN 80% DELAWARE BASIN OTHER KEY ASSETS ~ $1.6-$1.8 B 2021e Capital Budget advantaged multi-basin asset portfolio $8.22 8% vs. 2019 IMPROVEMENT $7.94 LOE PER BOE GP&T PER BOE $7.60
Asset Overview Appendix
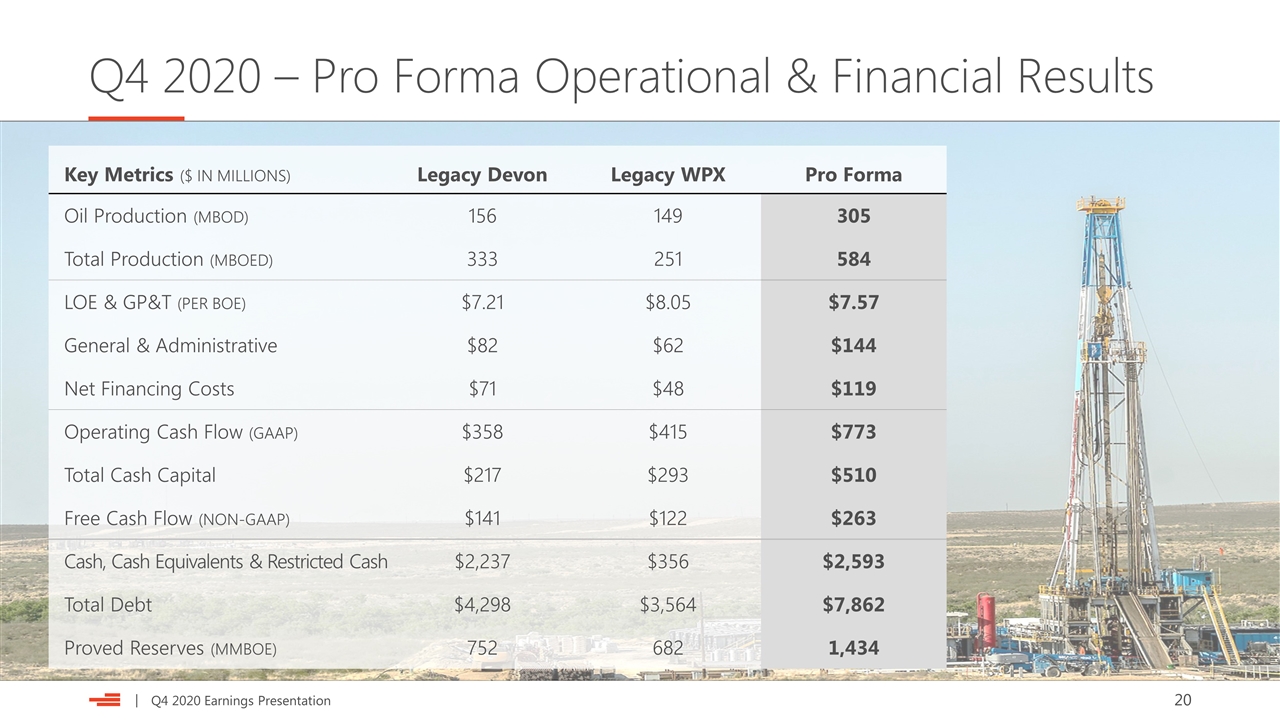
Q4 2020 – Pro Forma Operational & Financial Results Key Metrics ($ IN MILLIONS) Legacy Devon Legacy WPX Pro Forma Oil Production (MBOD) 156 149 305 Total Production (MBOED) 333 251 584 LOE & GP&T (PER BOE) $7.21 $8.05 $7.57 General & Administrative $82 $62 $144 Net Financing Costs $71 $48 $119 Operating Cash Flow (GAAP) $358 $415 $773 Total Cash Capital $217 $293 $510 Free Cash Flow (NON-GAAP) $141 $122 $263 Cash, Cash Equivalents & Restricted Cash $2,237 $356 $2,593 Total Debt $4,298 $3,564 $7,862 Proved Reserves (MMBOE) 752 682 1,434
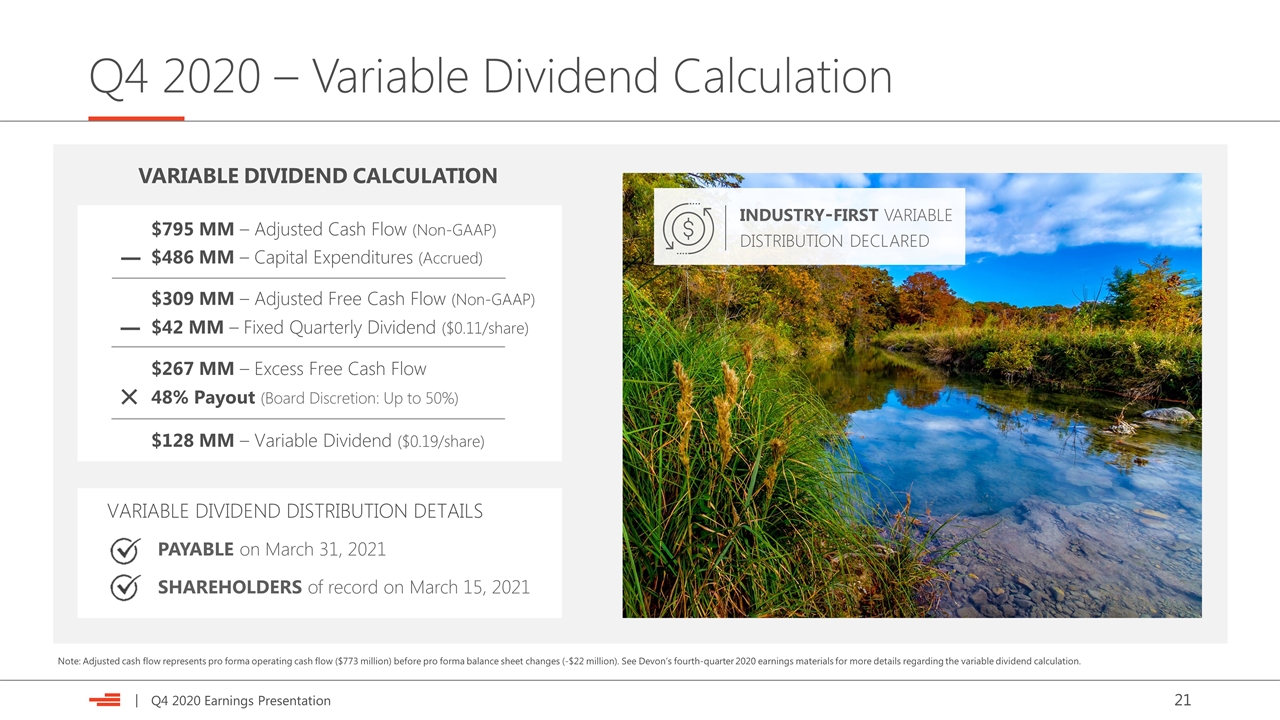
Q4 2020 – Variable Dividend Calculation VARIABLE DIVIDEND CALCULATION $795 MM – Adjusted Cash Flow (Non-GAAP) − $486 MM – Capital Expenditures (Accrued) $309 MM – Adjusted Free Cash Flow (Non-GAAP) − $42 MM – Fixed Quarterly Dividend ($0.11/share) $267 MM – Excess Free Cash Flow × 48% Payout (Board Discretion: Up to 50%) $128 MM – Variable Dividend ($0.19/share) VARIABLE DIVIDEND DISTRIBUTION DETAILS PAYABLE on March 31, 2021 SHAREHOLDERS of record on March 15, 2021 industry-first variable distribution declared Note: Adjusted cash flow represents pro forma operating cash flow ($773 million) before pro forma balance sheet changes (-$22 million). See Devon’s fourth-quarter 2020 earnings materials for more details regarding the variable dividend calculation.
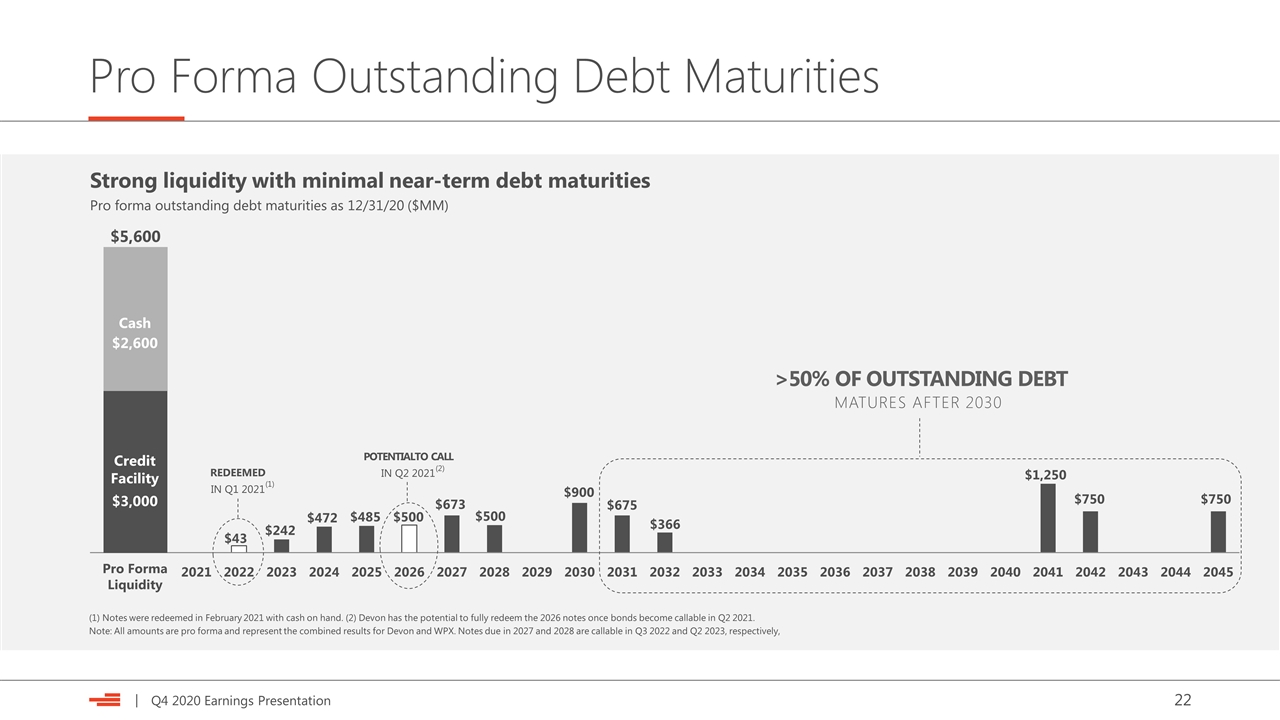
Pro Forma Outstanding Debt Maturities $5,600 Cash Credit Facility $2,600 Strong liquidity with minimal near-term debt maturities Pro forma outstanding debt maturities as 12/31/20 ($MM) $3,000 REDEEMED IN Q1 2021 (1) POTENTIALTO CALL IN Q2 2021 (2) Note: All amounts are pro forma and represent the combined results for Devon and WPX. Notes due in 2027 and 2028 are callable in Q3 2022 and Q2 2023, respectively, (1) Notes were redeemed in February 2021 with cash on hand. (2) Devon has the potential to fully redeem the 2026 notes once bonds become callable in Q2 2021. >50% OF OUTSTANDING DEBT MATURES AFTER 2030
Investor Contacts & Notices Forward-Looking Statements This communication includes “forward-looking statements” within the meaning of the federal securities laws. Such statements include those concerning strategic plans, our expectations and objectives for future operations, as well as other future events or conditions, and are often identified by use of the words and phrases “expects,” “believes,” “will,” “would,” “could,” “continue,” “may,” “aims,” “likely to be,” “intends,” “forecasts,” “projections,” “estimates,” “plans,” “expectations,” “targets,” “opportunities,” “potential,” “anticipates,” “outlook” and other similar terminology. All statements, other than statements of historical facts, included in this communication that address activities, events or developments that Devon expects, believes or anticipates will or may occur in the future are forward-looking statements. Such statements are subject to a number of assumptions, risks and uncertainties, many of which are beyond our control. Consequently, actual future results could differ materially and adversely from our expectations due to a number of factors, including, but not limited to: the volatility of oil, gas and NGL prices; risks relating to the COVID-19 pandemic or other future pandemics; uncertainties inherent in estimating oil, gas and NGL reserves; the extent to which we are successful in acquiring and discovering additional reserves; the uncertainties, costs and risks involved in our operations, including as a result of employee misconduct; regulatory Investor Notices restrictions, compliance costs and other risks relating to governmental regulation, including with respect to environmental matters; risks related to regulatory, social and market efforts to address climate change; risks related to our hedging activities; counterparty credit risks; risks relating to our indebtedness; cyberattack risks; our limited control over third parties who operate some of our oil and gas properties; midstream capacity constraints and potential interruptions in production; the extent to which insurance covers any losses we may experience; competition for assets, materials, people and capital; risks related to investors attempting to effect change; our ability to successfully complete mergers, acquisitions and divestitures; risks related to the recent merger with WPX, including the risk that we may not realize the anticipated benefits of the merger or successfully integrate the two legacy businesses; and any of the other risks and uncertainties discussed in Devon’s 2020 Annual Report on Form 10-K (the “2020 Form 10-K”) or other SEC filings. The forward-looking statements included in this communication speak only as of the date of this communication, represent current reasonable management’s expectations as of the date of this communication and are subject to the risks and uncertainties identified above as well as those described in the 2020 Form 10-K and in other documents we file from time to time with the SEC. We cannot guarantee the accuracy of our forward-looking statements, and readers are urged to carefully review and consider the various disclosures made in the 2020 Form 10-K and in other documents we file from time to time with the SEC. All subsequent written and oral forward-looking statements attributable to Devon, or persons acting on its behalf, are expressly qualified in their entirety by the cautionary statements above. We do not undertake, and expressly disclaim, any duty to update or revise our forward-looking statements based on new information, future events or otherwise. Use of Non-GAAP Information This presentation may include non-GAAP (generally accepted accounting principles) financial measures. Such non-GAAP measures are not alternatives to GAAP measures, and you should not consider these non-GAAP measures in isolation or as a substitute for analysis of our results as reported under GAAP. For additional disclosure regarding such non-GAAP measures, including reconciliations to their most directly comparable GAAP measure, please refer to Devon’s fourth-quarter 2020 earnings materials and related Form 10-K filed with the SEC. Investor Relations Contacts Scott CoodyChris Carr VP, Investor RelationsManager, Investor Relations 405-552-4735405-228-2496 Email: investor.relations@dvn.com


