Life is Complex.
Nuveen makes things e-simple.
It only takes a minute to sign up for e-Reports. Once enrolled, you’ll receive an e-mail as soon as your Nuveen Fund information is ready—no more waiting for delivery by regular mail. Just click on the link within the e-mail to see the report and save it on your computer if you wish.
Free e-Reports
right to your e-mail!
www.investordelivery.com
If you receive your Nuveen Fund
dividends and statements from your
financial professional or brokerage account.
or
www.nuveen.com/client-access
If you receive your Nuveen Fund
dividends and statements directly from
Nuveen.
NOT FDIC INSURED MAY LOSE
VALUE NO BANK GUARANTEE
| | |
| 4 |
| | |
| 5 |
| | |
| 12 |
| | |
| 14 |
| | |
| 17 |
| | |
| 27 |
| | |
| 28 |
| | |
| 29 |
| | |
| 157 |
| | |
| 158 |
| | |
| 159 |
| | |
| 161 |
| | |
| 162 |
| | |
| 170 |
| | |
| 187 |
| | |
| 207 |
| | |
| 208 |
| | |
| 210 |
| | |
| 225 |
3
Chair’s Letterto Shareholders Dear Shareholders,
As 2020 draws to a close, the concerns that dominated much of the year are beginning to show signs of easing. COVID-19 vaccines are being administered around the world, with several of the vaccine candidates announcing high efficacy rates during their phase 3 trials. Markets took a generally positive view of Joe Biden winning the Electoral College, with Congress’s final confirmation of the Electoral College vote anticipated on January 6, 2021. The U.S. economy has made a significant, although incomplete, turnaround from the depths of a historic recession. In December, Congress passed another $900 billion in aid to individuals and businesses, extending some of the programs enacted earlier in the crisis. The bill’s next step is the President’s review and his approval or disapproval. Ongoing fiscal and monetary stimulus along with widening vaccine distribution have bolstered confidence that a semblance of normalcy can return in 2021.
While the markets’ longer-term outlook has brightened, we expect intermittent bouts of volatility to continue into the new year. COVID-19 cases are still alarmingly high in some regions, and the renewed restrictions on social and business activity taken by local and, in some cases, national authorities will undoubtedly hinder the economy’s momentum. The pandemic’s course can still be unpredictable. The timeline of vaccine rollouts depends on many variables, public confidence can shift and real-world efficacy remains to be seen. Additionally, the outcome of the Senate majority – which determines whether the government will be under split control or a Democrat majority – rests with Georgia’s two run-off elections on January 5, 2021. Nevertheless, short-term market fluctuations can provide opportunities to invest in new ideas as well as upgrade existing positioning, within our goal of providing long-term value for our shareholders.
The new year can be an opportune time to assess your portfolio’s resilience and readiness for what may come next. We encourage you to review your time horizon, risk tolerance and investment goals with your financial professional. On behalf of the other members of the Nuveen Fund Board, we look forward to continuing to earn your trust in the months and years ahead.
Sincerely,
Terence J. Toth
Chair of the Board
December 22, 2020
4
Portfolio Managers’ CommentsNuveen AMT-Free Municipal Credit Income Fund (NVG)Nuveen Municipal Credit Income Fund (NZF)Nuveen Municipal High Income Opportunity Fund (NMZ)Nuveen Municipal Credit Opportunities Fund (NMCO)Nuveen Dynamic Municipal Opportunities Fund (NDMO) These Funds feature portfolio management by Nuveen Asset Management, LLC (NAM), an affiliate of Nuveen Fund Advisors, LLC, the Funds’ investment adviser. Portfolio managers John V. Miller, CFA, Steve M. Hlavin, Paul L. Brennan, CFA, Scott R. Romans, PhD and Timothy T. Ryan, CFA discuss U.S. economic and municipal market conditions, key investment strategies and the twelve-month performance of NVG, NZF, NMZ and NMCO and NDMO in the abbreviated reporting period since its inception on August 26, 2020. Paul has managed NVG since 2006, Scott assumed portfolio management responsibility for NZF in 2016, John has managed NMZ since its inception in 2003, John and Steve have managed NMCO since its inception in 2019 and John and Tim have managed NDMO since its inception in 2020.
During May and October 2019, the Board of Trustees and Shareholders approved the merger of the Nuveen Connecticut Quality Municipal Income Fund (NTC) to the acquiring Fund, the Nuveen AMT-Free Municipal Credit Income Fund (NVG). The merger was completed prior to the open of business on November 18, 2019.
What factors affected the U.S. economy and financial markets during the twelve-month reporting period ended October 31, 2020?
The U.S. economy rebounded more quickly than expected from the deep downturn caused by the COVID-19 crisis and containment measures. As business and social activities were drastically restricted in March and April 2020 to slow the spread of COVID-19, U.S. gross domestic product (GDP) shrank 31.4% on an annualized basis in the second quarter of 2020 (following a 5% decline in the first quarter), according to the Bureau of Economic Analysis (BEA) “third” estimate. GDP measures the value of goods and services produced by the nation’s economy less the value of the goods and services used up in production, adjusted for price changes. Government relief programs provided significant aid to individuals and businesses as the economy began reopening in May 2020, which helped the economy bounce back strongly over the summer months. GDP rose 33.1% in the third quarter of 2020, according to the BEA’s “second” estimate. While the third quarter gain was historic, the economy remained below pre-pandemic growth levels. GDP growth was 2.4% in the fourth quarter of 2019 and 2.2% for 2019 overall.
This material is not intended to be a recommendation or investment advice, does not constitute a solicitation to buy, sell or hold a security or an investment strategy and is not provided in a fiduciary capacity. The information provided does not take into account the specific objectives or circumstances of any particular investor, or suggest any specific course of action. Investment decisions should be made based on an investor’s objectives and circumstances and in consultation with his or her advisors.
Certain statements in this report are forward-looking statements. Discussions of specific investments are for illustration only and are not intended as recommendations of individual investments. The forward-looking statements and other views expressed herein are those of the portfolio managers as of the date of this report. Actual future results or occurrences may differ significantly from those anticipated in any forward-looking statements, and the views expressed herein are subject to change at any time, due to numerous market and other factors. The Funds disclaim any obligation to update publicly or revise any forward-looking statements or views expressed herein.
The ratings disclosed are the lowest rating given by one of the following national rating agencies: Standard & Poor’s Group (S&P), Moody’s Investors Service, Inc. (Moody’s) or Fitch, Inc. (Fitch). Credit ratings are subject to change. AAA, AA, A and BBB are investment grade ratings, while BB, B, CCC, CC, C and D are below investment grade ratings. Holdings designated N/R are not rated by these national rating agencies.
Bond insurance guarantees only the payment of principal and interest on the bond when due, and not the value of the bonds themselves, which will fluctuate with the bond market and the financial success of the issuer and the insurer. Insurance relates specifically to the bonds in the portfolio and not to the share prices of a Fund. No representation is made as to the insurers’ ability to meet their commitments.
Refer to the Glossary of Terms Used in this Report for further definition of the terms used within this section.
5
Portfolio Managers’ Comments (continued)
Consumer spending, the largest driver of the economy, was well supported earlier in this reporting period by low unemployment, wage gains and tax cuts. However, the COVID-19 crisis containment measures drove a significant drop in consumer spending and a sharp rise in unemployment starting in March 2020. The Bureau of Labor Statistics said the unemployment rate rose to 6.9% in October 2020 from 3.6% in October 2019. As of October 2020, slightly more than half of the 22 million jobs lost in March and April 2020 have been recovered. The average hourly earnings rate appeared to soar, growing at an annualized rate of 4.5% in October 2020, despite the spike in unemployment. Earnings data was skewed by the concentration of job losses in lower-wage work, which effectively eliminated most of the low-wage data, resulting in an average of mostly higher numbers. The overall trend of inflation remained muted, as decreases in gasoline, apparel and transportation prices offset an increase in food prices. The Bureau of Labor Statistics said the Consumer Price Index (CPI) increased 1.2% over the twelve-month reporting period ended October 31, 2020 before seasonal adjustment.
Prior to the COVID-19 crisis recession, the U.S. Federal Reserve (the Fed) had reduced its benchmark interest rate to support the economy’s slowing growth. The Fed also stopped shrinking its bond portfolio sooner than scheduled and began buying short-term Treasury bills to help money markets operate smoothly and maintain short-term borrowing rates at low levels.
As the health and economic crisis deepened, the Fed enacted an array of emergency measures in March 2020 to stabilize the financial system and support the markets, including cutting its main interest rate to near zero, offering lending programs to aid small and large companies and allowing unlimited bond purchases, known as quantitative easing. There were no policy changes at the Fed’s April, June and July 2020 meetings, where Chairman Powell reiterated a commitment to keep rates near zero until the economy recovers and maintained a cautious outlook for the U.S. economy. Also at the July 2020 meeting, the Fed extended some of its pandemic funding facilities by another three months to December 2020. At the annual Jackson Hole Economic Symposium, held virtually in August 2020, the Fed announced a change in inflation policy to average inflation targeting. Under this regime, the Fed will tolerate the inflation rate temporarily overshooting the target rate to offset periods of below-target inflation, so that inflation averages a 2% rate over time. The Fed provided further clarification of the new inflation policy and left the benchmark interest rate unchanged at its September 2020 meeting. (As expected, there were no policy changes at the Fed’s November 2020 meeting, which occurred after the close of this reporting period.)
In March and April 2020, the U.S. government approved three aid packages. These included $2 trillion allocated across direct payments to Americans, an expansion of unemployment insurance, loans to large and small businesses, funding to hospitals and health agencies and support to state and local governments, as well as more than $100 billion in funding to health agencies and employers offering paid leave. As some of these programs began to expire, additional relief measures were under discussion in Congress, but a final deal had not been reached as of the end of this reporting period. The election outcome, subsequent to the close of the reporting period, did not change expectations for a stimulus bill, but the timing and size remained uncertain.
The COVID-19 crisis rapidly dwarfed all other market concerns starting in late February 2020. Equity and commodity markets sold-off and safe-haven assets rallied in March 2020 as China, other countries and then the United States initiated quarantines, restricted travel and shuttered factories and businesses. The potential economic shock was particularly difficult to assess, which amplified market volatility. An ill-timed oil price war between the Organization of the Petroleum Exporting Countries (OPEC) and non-OPEC member Russia, which caused oil prices to plunge in March 2020, exacerbated the market sell-off.
Geopolitical uncertainty remained elevated with the U.S. presidential election, the Brexit transition period winding down and U.S.-China relations deteriorating. While markets remained concerned about the potential for a disputed outcome, the next round of fiscal stimulus was expected to follow the presidential election. In Europe, the EU and U.K. continued to negotiate, but had not yet reached, a final Brexit agreement after the U.K. formally exited at the end of January 2020 and triggered the one-year transition period (which ends on December 31, 2020). Although China and the U.S. signed a “phase one” trade deal in January 2020, tensions continued to flare over other trade and technology/security issues, Hong Kong’s sovereignty and the management of the COVID-19 crisis.
6
Despite the severe sell-off in March 2020, municipal bonds managed positive performance over the twelve-month reporting period. For most of the reporting period, a significant decline in interest rates drove municipal bond prices higher, with positive technical and fundamental conditions also supporting credit spread tightening. Prior to the emergence of the novel coronavirus, interest rates had been pressured lower by signs that the economy’s momentum was slowing, a more dovish central bank policy, geopolitical tensions (especially regarding trade) and bouts of equity market volatility. Then, from late February through March 2020, coronavirus risks permeated the markets, sending U.S. Treasury yields to historic lows. Rate volatility increased sharply in that six-week period. As liquidity became stressed, investors began to liquidate any asset possible, including municipal bonds. Municipal bond prices declined rapidly (and yields spiked higher), amid rampant selling across both the high grade and high yield segments that was exacerbated in some cases by exchange-traded fund and closed-end fund selling. Municipal bond prices became severely dislocated from Treasury prices. Credit spreads widened significantly during the March 2020 sell-off, ending the month above their long-term average. Monetary and fiscal interventions from the Fed and U.S. government helped the market recover in April and May, although spreads remain wider than average as of the end of the reporting period. The municipal yield curve steepened over this reporting period, with a pronounced drop in yields at the short end of the curve spearheading the steepening.
Prior to the market turmoil in March 2020, municipal bond gross issuance nationwide had been robust. The overall low level of interest rates encouraged issuers to continue to actively refund their outstanding debt. In these transactions the issuers are issuing new bonds and taking the bond proceeds and redeeming (calling) old bonds. These refunding transactions have ranged from 30% to 60% of total issuance over the past few years. Thus, the net issuance (all bonds issued less bonds redeemed) is actually much lower than the gross issuance. So, while gross issuance volume has been adequate, the net has not and this was an overall positive technical factor on municipal bond investment performance in recent years. Notably, taxable municipal bond issuance has increased meaningfully since the advent of the Tax Cut and Jobs Act of 2017, which prohibits municipal issuers from issuing new tax-exempt bonds to pre-refund existing tax-exempt bonds. However, municipalities have taken advantage of the low interest rate environment and the strong demand for yield to issue taxable municipal debt, enabling them to save on net interest costs while adding to the scarcity value of tax-exempt issues.
Municipal bond funds saw consistently positive cash flows throughout 2019 and into early 2020, then suffered significant outflows in March 2020, particularly from high yield municipal bond funds. After the market stabilized in April 2020, fund flows subsequently turned positive again, bringing year-to-date flows through October 2020 back into positive territory. Demand has been resilient even though municipal defaults, as expected, have increased somewhat in 2020. Notably, default activity has occurred mainly in sectors with greater COVID-19 risk exposure, such as senior living, corporate-backed and real estate-backed. Additionally, while municipal credit ratings remain under pressure given the uncertain economic outlook, a wave of downgrades has not materialized. With interest rates in the U.S. and globally remaining near all-time lows, the appetite for yield has continued to drive investors toward higher after-tax yielding assets, including U.S. municipal bonds. Additionally, as tax payers have adjusted to the 2017 tax law, which caps the state and local tax (SALT) deduction for individuals, there has been increased demand for tax-exempt municipal bonds, especially in states with high income taxes and/or property taxes.
What key strategies were used to manage the four Funds during the twelve-month reporting period and NDMO during the abbreviated reporting period ended October 31, 2020 and how did these strategies influence performance?
The Nuveen AMT-Free Municipal Credit Income Fund seeks to provide current income exempt from regular federal income tax and to enhance portfolio value relative to the municipal bond market by investing in tax-exempt municipal bonds that the Fund’s investment adviser believes are underrated or undervalued or that represent municipal market sectors that are undervalued. The Fund invests in municipal securities that are exempt from federal income taxes. The Fund uses leverage. By investment policy, the Fund may invest up to 55% of its managed assets in municipal securities rated at the time of investment Baa/BBB and below or judged to be of comparable quality by the Fund’s portfolio management team.
7
Portfolio Managers’ Comments (continued)
The Nuveen Municipal Credit Income Fund seeks to provide current income exempt from regular federal income tax by investing in an actively managed portfolio of tax-exempt municipal securities. Up to 55% of its managed assets may be in securities rated BBB and below at the time of purchase or, if unrated, judged to be of comparable quality by the Fund’s portfolio management team, and the Fund uses leverage.
The Nuveen Municipal High Income Opportunity Fund seeks to provide high current income exempt from regular federal income tax. Its secondary investment objective is to seek attractive total return consistent with its primary objective. The Fund invests in municipal securities that are exempt from federal income taxes; the Fund uses leverage. By investment policy, up to 75% of its managed assets may be invested in municipal securities rated, at the time of investment, Baa/BBB or lower by at least one nationally recognized statistical rating organization including below investment grade securities, or unrated securities judged by the manager to be of comparable quality. No more than 10% of the Fund’s managed assets may be invested in municipal securities rated below B3/B-, or that are unrated but judged to be of comparable quality by the Fund’s portfolio management team.
The Nuveen Municipal Credit Opportunities Fund seeks to provide a high level of current income exempt from regular U.S. federal income tax and secondarily, total return. The Fund invests primarily in high yielding, low- to medium-quality municipal securities that, at the time of investment, are rated Baa/BBB or lower or, if unrated, are judged to be of comparable quality by the Fund’s portfolio management team. No more than 30% of the Fund’s managed assets will be in municipal securities rated CCC+/Caa1 or lower at the time of investment or unrated but judged to be of comparable quality. No more than 10% of the Fund’s managed assets can be in defaulted securities or securities of issuers in bankruptcy or insolvency proceedings at the time of investment. The Fund uses leverage and has a 12-year term with the potential to convert to perpetual.
The Nuveen Dynamic Municipal Opportunities Fund seeks to provide a total return through income exempt from regular federal income taxes and capital appreciation. The Fund invests primarily in municipal securities, the income on which is exempt from regular U.S. federal income tax. The Fund may invest in municipal securities of any maturity and credit quality, without limit in below investment grade municipal securities rated BB+/Ba1 or lower at the time of investment or unrated but judged to be of comparable quality by the Fund’s portfolio management team, and without limit in municipal securities that generate income subject to the U.S. federal alternative minimum tax (“AMT Bonds”). No more than 20% of Managed Assets can be in taxable debt obligations, including taxable municipal securities, and no more than 10% of Managed Assets can be in defaulted securities or securities of issuers in bankruptcy or insolvency proceedings at the time of investment. The Fund uses leverage and has a 12-year term with the potential to convert to perpetual.
Despite historic volatility in the municipal market during March and April 2020, municipal bond performance was positive during the twelve-month reporting period overall. Municipal yields fell, in concert with a steep drop in Treasury yields as the U.S. economy fell into a deep recession amid the virus lockdown. The decline was more dramatic at the short end of the municipal yield curve, which steepened the yield curve over the reporting period. Demand for municipal bonds recovered after the March-April 2020 sell-off, with mutual fund inflows resuming a positive trend (although more so for high grade than high yield municipal funds) and the market absorbing significant supply. With demand normalizing, high grade municipal bonds have made a full recovery from the March-April 2020 COVID-19 crisis, while high yield credit spreads have narrowed meaningfully but remained wider than where they began during the reporting period.
We continued to take a bottom-up approach to discovering sectors that appeared undervalued as well as individual credits that we believed had the potential to perform well over the long term. Our trading activity continued to focus on pursuing the Funds’ investment objectives.
NVG’s trading activity was mainly driven by bonds rolling off the portfolio due to bond calls and maturities. One of the larger refundings during the reporting period was Buckeye Tobacco Settlement bonds, which the state of Ohio refunded in March 2020 and issued new replacement bonds. NVG, NZF, NMZ and NMCO owned the legacy bonds and bought some of the replacement bonds. NVG also held Los Angeles County tobacco bonds that were refunded during this reporting period. Early in the COVID-19 related
8
sell-off, we took some small precautionary steps to prepare for the possibility of deleveraging, including delaying the reinvestment of cash proceeds from called bonds and coupon income. However, market liquidity, although stressed, remained sufficient and deleveraging was not needed. After the sell-off, the market was favorable for executing tax-loss swaps. This strategy entailed selling depreciated bonds with lower yields and buying similarly structured but higher yielding bonds. This approach was implemented to enhance NVG’s income earning capability and seek to make the Fund more tax efficient. The portfolio’s overall positioning was relatively unchanged over the reporting period. We bought bonds across a range of sectors, including health care, transportation, tax-supported (such as Puerto Rico and Illinois debt) and housing, and across the credit quality spectrum, although there was a slight skew toward investment grade bonds.
In NZF, prior to the March-April 2020 sell-off, municipal yields were very low and credit spreads were tight, providing fewer attractive relative value opportunities. We worked to reinvest call and maturity proceeds into some A rated names we considered suitable long-term investments as well as some highly liquid, AA rated placeholder credits to keep the Fund fully invested until more attractive opportunities were available in the marketplace. NZF also held legacy Buckeye Tobacco bonds that were refunded, and reinvested some of proceeds into the new issue replacement bonds and rotated some into Puerto Rico sales tax revenue bonds (known as COFINAs), where longer-term fundamentals looked more attractive. After the COVID-19 crisis sell-off, we also took advantage of the favorable environment for tax loss swaps in NZF’s portfolio, which were implemented in three approaches: first, higher prevailing yields on AAA rated paper enabled us to swap out of high grade positions into other, relatively higher yielding high grade positions with similar risk characteristics; second, rotating some of the Fund’s high grade, lower yielding placeholder bonds into lower rated, higher yielding investments, as capital outflows from lower rated bonds provided attractive buying opportunities in airports and airline-related, health care, public transportation and certain Manhattan real estate redevelopment bonds; and third, making one-for-one exchanges within high yield positions, including COFINAs, health care, convention center related, airports and state of Illinois, to reset embedded yields higher. As the market stabilized and the high yield liquidity crisis abated, the tax loss swap opportunity waned and we refocused on credit fundamentals. NFZ bought primarily A rated debt in airports and health care, which were funded from the proceeds of called and maturating bonds.
For most of the reporting period, NMZ worked to reinvest coupon income, call proceeds, payments from sinking funds (a fund formed by periodically setting aside money for the gradual repayment of a debt) and capital inflows from secondary share marketing. Some of the larger refundings affecting NMZ during this reporting period were Buckeye Tobacco, high coupon toll roads and high coupon hospitals. We added to some high performing sectors, such as tobacco and COFINAs, in the secondary market. We also continued to invest in individual primary market opportunities, including land secured (Castle Oaks Metropolitan District in Denver), charter schools (Renaissance Charter School in Florida), single family housing (especially suburban areas), New York Metropolitan Transportation Authority and airline bonds backed by important airports (e.g., New York JFK International backed by American Airlines, Denver Special Facilities backed by United Airlines and Port of Seattle backed by Delta Air Lines). There were no material sells for credit or duration reasons.
NMCO’s invest-up period ended during the first half of the reporting period. By the March 2020 sell-off, the Fund had all of its cash invested but approximately 20% of the portfolio was held in mid-grade bonds, which served as temporary placeholders while we worked to source opportunities in higher yielding, lower rated bonds. The Fund was therefore well positioned to make advantageous relative value swaps in March 2020, when market weakness provided opportunity to buy into long-term high yield positions at attractive spreads. As a result, trading activity was elevated in March 2020 as we worked to set up the Fund for a high yield recovery. Industrial development revenue (IDR) bonds are NMCO’s largest sector exposure, which tend to be more economically sensitive and could benefit from further spread normalization.
Additionally, at the end of March 2020, NMCO delevered to help mitigate net asset value volatility and manage the leverage ratio within the stated target. These efforts influenced the timing and size of the Fund’s distribution cut. Under normal market conditions, portfolio managers would be able to take mitigating steps, through tax loss bond exchanges and other strategies, to offset the impact of unwinding leverage. However, due to the unprecedented velocity of the market’s sell-off and the compressed time period
9
Portfolio Managers’ Comments (continued)
in which it occurred, we believe it was in the best long-term interest of our shareholders to take these prudent actions in the short term. We believe this can ultimately help enhance earnings over the long run.
Also during this reporting period, NVG, NZF, NMZ and NMCO acquired shares in Energy Harbor when their holdings of certain municipal bonds issued by FirstEnergy Solutions were converted into Energy Harbor equity as part of FirstEnergy Solution’s emergence from bankruptcy protection. The share price appreciated strongly post its March 2020 issuance. In July 2020, the stock suffered a correction on negative headline news about the predecessor company and its former parent company. During the reporting period, the negative performance impact to NZF, NMZ and NMCO was relatively muted and the combined equity and debt position was a detractor for NVG. Over time, we expect to sell these shares and reinvest the proceeds into municipal bonds.
NDMO began operations in late August 2020 and since then we have worked to invest the portfolio in investment grade and high yield opportunities that support high income earnings and offer total return potential.
As of October 31, 2020, the Funds continued to use inverse floating rate securities. We employ inverse floaters for a variety of reasons, including duration management and income and total return enhancement.
How did the four Funds perform during the twelve-month reporting period and NDMO during the abbreviated reporting period ended October 31, 2020?
The tables in each Fund’s Performance Overview and Holding Summaries section of this report provide the Funds’ total returns at net asset value (NAV) for the period ended October 31, 2020. Each Fund’s total returns at NAV are compared with the performance of a corresponding market index.
For the twelve months ended October 31, 2020, the total returns at NAV for NVG, NZF and NMZ underperformed the return for the national S&P Municipal Bond Index. NVG and NZF underperformed the return for the secondary benchmark (composed of 60% S&P Municipal Bond Investment Grade Index and 40% S&P Municipal Bond High Yield Index), and NMZ and NMCO underperformed the return on the S&P Municipal Yield Index. For the abbreviated reporting period, the total returns at NAV for NDMO outperformed the return of the S&P Municipal Bond Index.
The main factors influencing the Funds’ relative performance in this reporting period were yield curve and duration positioning, credit quality allocation and sector allocation. In addition, the use of regulatory leverage was an important factor affecting performance of the Funds. Leverage is discussed in more detail later in the Fund Leverage section of this report.
The main drivers of NVG and NZF’s relative performance were yield curve and duration positioning, credit quality allocations and sector allocations. NVG and NZF were favorably positioned for the falling interest rate environment during this reporting period. The two Funds were positioned with longer durations than the benchmark, with overweights to longer duration bonds and underweights to shorter duration bonds, which was advantageous because longer bonds generally outperformed.
Credit ratings allocations detracted from NVG and NZF’s relative performance, offsetting the positive contribution of duration and yield curve positioning. The largest drag came from overweight allocations to bonds rated BBB and lower, which performed poorly during the March-April 2020 market weakness and hadn’t fully recovered by the end of the reporting period.
The volatility during the reporting period skewed performance at the sector level. Overall, sector allocations adversely affected NVG but were modestly beneficial for NZF. The tobacco sector performed strongly, largely due to the refundings and restructurings of some legacy tobacco issues (such as Buckeye Tobacco) that occurred during the reporting period. The defensively oriented tax-supported and utilities sectors also held up well, as did the pre-refunded sector, due to its high credit quality composition. Conversely, the weaker performers were more economically sensitive sectors and/or those with greater exposure to coronavirus impacts such as IDR, health care (especially senior living facilities), transportation and higher education.
NMZ’s performance, which is primarily compared to the S&P Municipal Yield Index, continued to be driven by our bottom-up credit selection. Within the high yield municipal market, there was a wide dispersion of returns by sector and individual security, resulting in a mix of very strong and very weak performers within NMZ’s portfolio. The best performing sectors were tobacco, Puerto Rico,
10
dedicated tax and land secured, while the weakest groups were senior living facilities and IDRs. Hospitals, airports and multi-family housing fell in the middle of the pack. NMZ holds underweight allocations relative to the benchmark’s much higher weightings in tobacco and Puerto Rico bonds, given our views about the risk-reward offered by these sectors, and this was the main detractor from relative performance.
Partially offsetting the relative weakness, however, were our relatively lower exposures to the two weakest performing sectors, IDRs and senior living facilities, as well as the Fund’s higher exposure to land secured debt, which performed well. Other notable detractors were individual securities that suffered from short-term, event-specific headwinds. For example, pandemic-related concerns drove valuations meaningfully lower for Brightline (formerly Virgin Trains USA), a South Florida high-speed passenger rail project, and American Dream, the retail and entertainment mega-plex at the Meadowlands, New Jersey. However, our research suggests these bonds are structured to weather short-term disruption and investors may be overlooking the longer-term potential for these projects. Overall, the underperformance of these and other laggards in NMZ’s portfolio has been perception-driven more than reality-driven, in our opinion. The default rate in the Fund has remained very low, and in most sectors, the technicals rather than fundamentals have exaggerated performance, whether to the upside or the downside.
NMCO’s performance is also primarily compared to the S&P Municipal Yield Index. The Fund’s performance was shaped by three major events during the reporting period. The first was the Fund’s invest-up period, which coincided with the first half of the reporting period. There was a natural drag on performance due to the Fund putting money to work during the strong performing market preceding the advent of the COVID-19 crisis. The second event was the March-April 2020 sell-off. The Fund underperformed significantly during the market panic, due to its leveraged duration and higher exposure to high yield bonds in general, where spreads widened sharply. However, the prevailing market also enabled us to make advantageous relative value swaps out of the placeholder investment grade bonds into longer-term high yield exposures that positioned the Fund for a high yield recovery. The third event, the municipal market’s stabilization and the high yield segment’s partial recovery over the summer months, benefited the Fund’s high yield positioning. Although NMCO’s overweight to the IDR sector, which hasn’t yet fully recovered, and underweights to the stronger performing dedicated tax and Puerto Rico sectors were all detractors from relative performance, the Fund benefited from an underweight to senior living facilities, the worst performing segment, and favorable security selection in the tobacco sector.
During the abbreviated reporting period, NDMO outperformed the benchmark S&P Municipal Bond Index, primarily due to strong security selection. Top performing positions included Southern Ohio Port Authority PureCycle, Chicago Transit Authority sales tax revenue, Delta Air Lines - LaGuardia Airport Terminal and Colorado International Metropolitan District Number 8. The weakest performing holdings included New York MTA, selected Puerto Rico general obligation bonds, Big River Steel and Talen Energy. The Fund’s longer duration positioning, partially managed with the use of inverse floaters, was somewhat disadvantageous as interest rates drifted higher in the abbreviated reporting period.
11
IMPACT OF THE FUNDS’ LEVERAGE STRATEGIES ON PERFORMANCE
One important factor impacting the returns of the Funds’ common shares relative to their comparative benchmarks was the Funds’ use of leverage through their issuance of preferred shares and/or investments in inverse floating rate securities, which represent leveraged investments in underlying bonds. The Funds use leverage because our research has shown that, over time, leveraging provides opportunities for additional income. The opportunity arises when short-term rates that a Fund pays on its leveraging instruments are lower than the interest a Fund earns on its portfolio of long-term bonds that it has bought with the proceeds of that leverage. This has been particularly true in the recent market environment where short-term rates have been low by historical standards.
However, use of leverage can expose Fund common shares to additional price volatility. When a Fund uses leverage, the Fund’s common shares will experience a greater increase in their net asset value if the municipal bonds acquired through the use of leverage increase in value, but will also experience a correspondingly larger decline in their net asset value if the bonds acquired through leverage decline in value. All this will make the shares’ total return performance more variable over time.
In addition, common share income in levered funds will typically decrease in comparison to unlevered funds when short-term interest rates increase and increase when short-term interest rates decrease. In recent quarters, fund leverage expenses have generally tracked the overall movement of short-term tax-exempt interest rates. While fund leverage expenses are somewhat higher than their recent lows, leverage nevertheless continues to provide the opportunity for incremental common share income, particularly over longer-term periods.
The use of leverage had a negative impact on the total return performance of NVG, NZF, NMZ and NMCO and a negligible impact on the total return performance of NDMO over the reporting period.
As of October 31, 2020, the Funds’ percentages of leverage are as shown in the accompanying table.
| | | | | | |
| NVG | NZF | NMZ | NMCO | NDMO |
Effective Leverage* | 38.00% | 38.09% | 35.25% | 40.88% | 14.54% |
Regulatory Leverage* | 35.04% | 37.62% | 7.35% | 39.73% | 0.00% |
* | Effective Leverage is a Fund’s effective economic leverage, and includes both regulatory leverage and the leverage effects of certain derivative and other investments in a Fund’s portfolio that increase the Fund’s investment exposure. Currently, the leverage effects of Tender Option Bond (TOB) inverse floater holdings are included in effective leverage values, in addition to any regulatory leverage. Regulatory leverage consists of preferred shares issued or borrowings of a Fund. Both of these are part of a Fund’s capital structure. A Fund, however, may from time to time borrow on a typically transient basis in connection with its day-to-day operations, primarily in connection with the need to settle portfolio trades. Such incidental borrowings are excluded from the calculation of a Fund’s effective leverage ratio. Regulatory leverage is subject to asset coverage limits set forth in the Investment Company Act of 1940. |
12
THE FUNDS’ REGULATORY LEVERAGE
As of October 31, 2020, the Funds have issued and outstanding preferred shares as shown in the accompanying table.
| | | | | | | | | | |
| | | | | Variable Rate | | | | |
| | Variable Rate | | | Remarketed | | | | |
| | Preferred* | | | Preferred** | | | | |
| | Shares Issued | | | Shares Issued at | | | | |
| | at Liquidation | | | at Liquidation | | | | |
| | Preference | | | Preference | | | Total | |
NVG | | $ | 317,400,000 | | | $ | 1,611,600,000 | | | $ | 1,929,000,000 | |
NZF | | $ | 1,172,000,000 | | | $ | 196,000,000 | | | $ | 1,368,000,000 | |
NMZ | | $ | 87,000,000 | | | $ | — | | | $ | 87,000,000 | |
NMCO | | $ | 350,000,000 | | | $ | 100,000,000 | | | $ | 450,000,000 | |
* | Preferred shares of the Fund featuring a floating rate dividend based on a predetermined formula or spread to an index rate. Includes the following preferred shares AMTP, iMTP, MFP-VRM and VRDP in Special Rate Mode, where applicable. See Notes to Financial Statements, Note 5 – Fund Shares for further details. |
** | Preferred shares of the Fund featuring floating rate dividends set by a remarketing agent via a regular remarketing. Includes the following preferred shares VRDP not in Special Rate Mode, MFP- VRRM and MFP-VRDM, where applicable. See Notes to Financial Statements, Note 5 – Fund Shares for further details. |
Refer to Notes to Financial Statements, Note 5 – Fund Shares for further details on preferred shares and each Funds’ respective transactions.
13
COMMON SHARE DISTRIBUTION INFORMATION
The following information regarding the Funds’ distributions is current as of October 31, 2020. Each Fund’s distribution levels may vary over time based on each Fund’s investment activity and portfolio investments value changes.
During the current reporting period, each Fund’s distributions to common shareholders were as shown in the accompanying table.
| | | | | | | | | | | | | | | | |
| | | Per Common Share Amounts | |
| Monthly Distributions (Ex-Dividend Date) | | NVG | | | NZF | | | NMZ | | | NMCO | | | NDMO | |
November 2019 | | $ | 0.0710 | | | $ | 0.0660 | | | $ | 0.0595 | | | $ | 0.0640 | | | $ | — | |
December | | | 0.0655 | | | | 0.0625 | | | | 0.0595 | | | | 0.0640 | | | | — | |
January | | | 0.0655 | | | | 0.0625 | | | | 0.0595 | | | | 0.0640 | | | | — | |
February | | | 0.0655 | | | | 0.0625 | | | | 0.0595 | | | | 0.0640 | | | | — | |
March | | | 0.0655 | | | | 0.0625 | | | | 0.0595 | | | | 0.0640 | | | | — | |
April | | | 0.0655 | | | | 0.0625 | | | | 0.0595 | | | | 0.0525 | | | | — | |
May | | | 0.0655 | | | | 0.0625 | | | | 0.0620 | | | | 0.0525 | | | | — | |
June | | | 0.0655 | | | | 0.0625 | | | | 0.0620 | | | | 0.0525 | | | | — | |
July | | | 0.0655 | | | | 0.0625 | | | | 0.0620 | | | | 0.0620 | | | | — | |
August | | | 0.0655 | | | | 0.0625 | | | | 0.0620 | | | | 0.0620 | | | | — | |
September | | | 0.0655 | | | | 0.0625 | | | | 0.0620 | | | | 0.0620 | | | | — | |
October 2020 | | | 0.0675 | | | | 0.0660 | | | | 0.0620 | | | | 0.0620 | | | | 0.0765 | |
| Total Distributions from Net Investment Income | | $ | 0.7935 | | | $ | 0.7570 | | | $ | 0.7290 | | | $ | 0.7255 | | | $ | 0.0765 | |
| Total Distributions from Long Term Capital Gains* | | $ | 0.0314 | | | $ | — | | | $ | — | | | $ | — | | | $ | — | |
| Total Distributions | | $ | 0.8249 | | | $ | 0.7570 | | | $ | 0.7290 | | | $ | 0.7255 | | | $ | 0.0765 | |
| | |
| Yields | | | | | | | | | | | | | | | | | | | | |
Market Yield** | | | 5.19 | % | | | 5.37 | % | | | 5.63 | % | | | 6.37 | % | | | 6.12 | % |
Taxable-Equivalent Yield** | | | 8.76 | % | | | 9.07 | % | | | 9.35 | % | | | 10.69 | % | | | 10.34 | % |
* | Distribution paid in December 2019. |
** | Market Yield is based on the Fund’s current annualized monthly dividend divided by the Fund’s current market price as of the end of the reporting period. Taxable-Equivalent Yield represents the yield that must be earned on a fully taxable investment in order to equal the yield of the Fund on an after-tax basis. It is based on an income tax rate of 40.8%. Your actual federal income tax rate may differ from the assumed rate. The Taxable-Equivalent Yield also takes into account the percentage of the Fund’s income generated and paid by the Fund (based on payments made during the previous calendar year) that was not exempt from federal income tax. Separately, if the comparison were instead to investments that generate qualified dividend income, which is taxable at a rate lower than an individual’s ordinary graduated tax rate, the fund’s Taxable-Equivalent Yield would be lower. |
Each Fund seeks to pay regular monthly dividends out of its net investment income at a rate that reflects its past and projected net income performance. To permit each Fund to maintain a more stable monthly dividend, the Fund may pay dividends at a rate that may be more or less than the amount of net income actually earned by the Fund during the period. Distributions to common shareholders are determined on a tax basis, which may differ from amounts recorded in the accounting records. In instances where the monthly dividend exceeds the earned net investment income, the Fund would report a negative undistributed net ordinary income. Refer to Note 6 — Income Tax Information for additional information regarding the amounts of undistributed net ordinary income and undistributed net long-term capital gains and the character of the actual distributions paid by the Fund during the period.
14
All monthly dividends paid by each Fund during the current reporting period were paid from net investment income. If a portion of the Fund’s monthly distributions is sourced or comprised of elements other than net investment income, including capital gains and/or a return of capital, shareholders will be notified of those sources. For financial reporting purposes, the per share amounts of each Fund’s distributions for the reporting period are presented in this report’s Financial Highlights. For income tax purposes, distribution information for each Fund as of its most recent tax year end is presented in Note 6 — Income Tax Information within the Notes to Financial Statements of this report.
NUVEEN CLOSED-END FUND DISTRIBUTION AMOUNTS
The Nuveen Closed-End Funds’ monthly and quarterly periodic distributions to shareholders are posted on www.nuveen.com and can be found on Nuveen’s enhanced closed-end fund resource page, which is at https://www.nuveen.com/resource-center-closedendfunds, along with other Nuveen closed-end fund product updates. To ensure timely access to the latest information, shareholders may use a subscribe function, which can be activated at this web page (https://www.nuveen.com/subscriptions).
COMMON SHARE EQUITY SHELF PROGRAM
During the current reporting period, NMZ was authorized by the Securities and Exchange Commission to issue additional common shares through an equity shelf program (Shelf Offering). Under this program, NMZ, subject to market conditions, may raise additional capital from time to time in varying amounts and offering methods at a net price at or above the Fund’s NAV per common share. The total amount of common shares authorized under this Shelf Offering, are as shown in the accompanying table.
| | |
| NMZ |
Additional authorized common shares | 19,500,000 |
During the current reporting period, NMZ sold common shares through its Shelf Offering at a weighted average premium to its NAV per common share as shown in the accompanying table.
| | | | |
| | NMZ | |
Common shares sold through shelf offering | | | 13,935,297 | |
Weighted average premium to NAV per common share sold | | | 1.38 | % |
Refer to Notes to Financial Statements, Note 5 – Fund Shares for further details on Shelf Offerings and the Fund’s transactions.
15
Common Share Information (continued)
COMMON SHARE REPURCHASES
During August 2020, the Funds’ Board of Trustees reauthorized an open-market share repurchase program, allowing NVG, NZF, NMZ and NMCO to repurchase an aggregate of up to approximately 10% of its outstanding common shares.
As of October 31, 2020, and since the inception of the Funds’ repurchase programs, the following Funds have cumulatively repurchased and retired their outstanding common shares as shown in the accompanying table.
| | | | | |
| NVG | NZF | NMZ | NMCO |
Common shares cumulatively repurchased and retired | 202,500 | 47,500 | — | — |
Common shares authorized for repurchase | 21,335,000 | 14,210,000 | 8,170,000 | 5,325,000 |
During the current reporting period, the Funds did not repurchase any of their outstanding common shares.
OTHER COMMON SHARE INFORMATION
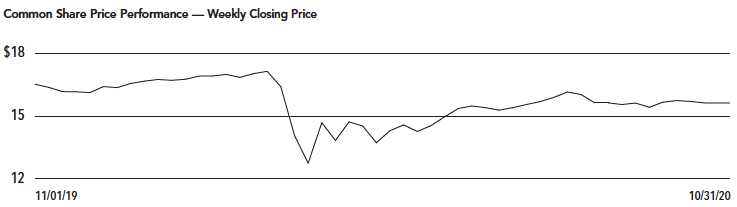
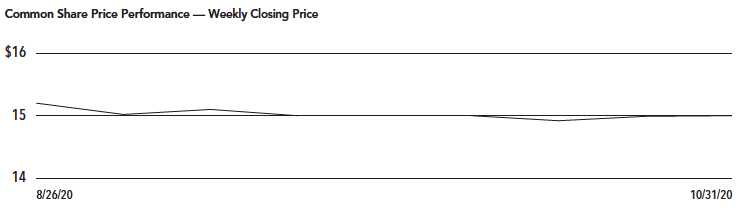
As of October 31, 2020, and during the current reporting period, the Funds’ common share prices were trading at a premium/(discount) to their common share NAVs as shown in the accompanying table.
| | | | | | | | | | | | | | | | |
| | NVG | | | NZF | | | NMZ | | | NMCO | | | NDMO | |
Common share NAV | | $ | 16.76 | | | $ | 15.96 | | | $ | 13.22 | | | $ | 12.81 | | | $ | 14.92 | |
Common share price | | $ | 15.62 | | | $ | 14.74 | | | $ | 13.22 | | | $ | 11.68 | | | $ | 15.00 | |
Premium/(Discount) to NAV | | | (6.80 | )% | | | (7.64 | )% | | | 0.00 | % | | | (8.82 | )% | | | 0.54 | % |
12-month average premium/(discount) to NAV | | | (6.73 | )% | | | (6.52 | )% | | | 0.17 | % | | | (1.83 | )% | | | 0.32 | % |
16
| | |
| Nuveen AMT-Free Municipal Credit Income Fund Performance Overview and Holding Summaries as of October 31, 2020 |
| | | | |
Refer to the Glossary of Terms Used in this Report for further definition of the terms used within this section. |
| Average Annual Total Returns as of October 31, 2020 |
|
| Average Annual |
| 1-Year | 5-Year | 10-Year |
NVG at Common Share NAV | 2.53% | 6.28% | 6.53% |
NVG at Common Share Price | 0.06% | 8.04% | 6.54% |
S&P Municipal Bond Index | 3.55% | 3.68% | 4.05% |
NVG Custom Blended Fund Performance Benchmark(1) | 3.32% | 4.44% | 4.43% |
Past performance is not predictive of future results. Current performance may be higher or lower than the data shown. Returns do not reflect the deduction of taxes that shareholders may have to pay on Fund distributions or upon the sale of Fund shares. Returns at NAV are net of Fund expenses, and assume reinvestment of distributions. Comparative index return information is provided for the Fund’s shares at NAV only. Indexes are not available for direct investment.
1 The Blended Index consists of the returns of the S&P Municipal Bond Investment Grade Index prior to 4/11/16 and thereafter: 1) 60% of the return of the S&P Municipal Bond Investment Grade Index and 2) 40% of the return of the S&P Municipal Bond High Yield Index.
17
| | |
| NVG | Performance Overview and Holding Summaries as of October 31, 2020 (continued) |
This data relates to the securities held in the Fund’s portfolio of investments as of the end of the reporting period. It should not be construed as a measure of performance for the Fund itself. Holdings are subject to change.
The ratings disclosed are the lowest rating given by one of the following national rating agencies: Standard & Poor’s Group, Moody’s Investors Service, Inc. or Fitch, Inc. Credit ratings are subject to change. AAA, AA, A and BBB are investment grade ratings; BB, B, CCC, CC, C and D are below-investment grade ratings. Holdings designated N/R are not rated by these national rating agencies.
| | |
| Fund Allocation | |
| (% of net assets) | |
Long-Term Municipal Bonds | 157.4% |
Common Stocks | 0.4% |
Other Assets Less Liabilities | 1.3% |
| Net Assets Plus Floating Rate Obligations, | |
| AMTP Shares, net of deferred offering | |
| costs, MFP Shares, net of deferred | |
| offering costs & VRDP Shares, | |
| net of deferred offering costs | 159.1% |
Floating Rate Obligations | (5.3)% |
AMTP Shares, net of deferred | |
offering costs | (3.1)% |
MFP Shares, net of deferred | |
offering costs | (11.3)% |
VRDP Shares, net of deferred | |
offering costs | (39.4)% |
| Net Assets | 100% |
|
| Portfolio Credit Quality | |
| (% of total investment exposure) | |
U.S. Guaranteed | 11.8% |
AAA | 2.7% |
AA | 12.0% |
A | 25.5% |
BBB | 19.7% |
BB or Lower | 15.1% |
N/R (not rated) | 13.0% |
N/A (not applicable) | 0.2% |
| Total | 100% |
| | |
| Portfolio Composition | |
| (% of total investments) | |
Health Care | 19.4% |
Tax Obligation/Limited | 17.9% |
Transportation | 11.2% |
U.S. Guaranteed | 10.9% |
Tax Obligation/General | 10.0% |
Education and Civic Organizations | 9.9% |
Utilities | 7.1% |
Consumer Staples | 5.5% |
Other | 8.1% |
| Total | 100% |
| | |
| States and Territories | |
| (% of total municipal bonds) | |
Illinois | 15.1% |
California | 9.1% |
Texas | 7.4% |
Colorado | 6.6% |
Ohio | 5.9% |
Connecticut | 4.2% |
New York | 4.0% |
Pennsylvania | 3.9% |
New Jersey | 3.6% |
Florida | 3.0% |
Wisconsin | 2.5% |
South Carolina | 2.0% |
Iowa | 2.0% |
Indiana | 1.9% |
Puerto Rico | 1.9% |
Georgia | 1.9% |
Massachusetts | 1.7% |
Arizona | 1.6% |
Missouri | 1.5% |
Virginia | 1.5% |
Other1 | 18.7% |
| Total | 100% |
1 See Portfolio of Investments for details on “other” States and Territories.
18
| | |
| NZF | Nuveen Municipal Credit Income Fund |
| Performance Overview and Holding Summaries as of October 31, 2020 |
| | | | |
Refer to the Glossary of Terms Used in this Report for further definition of the terms used within this section. |
| Average Annual Total Returns as of October 31, 2020 |
|
| Average Annual |
| 1-Year | 5-Year | 10-Year |
NZF at Common Share NAV | 0.58% | 5.60% | 6.40% |
NZF at Common Share Price | (3.34)% | 7.02% | 6.09% |
S&P Municipal Bond Index | 3.55% | 3.68% | 4.05% |
NZF Custom Blended Fund Performance Benchmark(1) | 3.32% | 4.44% | 4.43% |
Past performance is not predictive of future results. Current performance may be higher or lower than the data shown. Returns do not reflect the deduction of taxes that shareholders may have to pay on Fund distributions or upon the sale of Fund shares. Returns at NAV are net of Fund expenses, and assume reinvestment of distributions. Comparative index return information is provided for the Fund’s shares at NAV only. Indexes are not available for direct investment.
1 The Blended Index consists of the returns of the S&P Municipal Bond Investment Grade Index prior to 4/11/16 and thereafter: 1) 60% of the return of the S&P Municipal Bond Investment Grade Index and 2) 40% of the return of the S&P Municipal Bond High Yield Index.
19
| | |
| NZF | Performance Overview and Holding Summaries as of October 31, 2020 (continued) |
This data relates to the securities held in the Fund’s portfolio of investments as of the end of the reporting period. It should not be construed as a measure of performance for the Fund itself. Holdings are subject to change.
The ratings disclosed are the lowest rating given by one of the following national rating agencies: Standard & Poor’s Group, Moody’s Investors Service, Inc. or Fitch, Inc. Credit ratings are subject to change. AAA, AA, A and BBB are investment grade ratings; BB, B, CCC, CC, C and D are below-investment grade ratings. Holdings designated N/R are not rated by these national rating agencies.
| | |
| Fund Allocation | |
| (% of net assets) | |
Long-Term Municipal Bonds | 158.0% |
Common Stocks | 1.1% |
Investment Companies | 0.1% |
Corporate Bonds | 0.0% |
Other Assets Less Liabilities | 1.6% |
| Net Assets Plus Floating Rate | |
| Obligations, MFP Shares, net of | |
| deferred offering costs & VRDP | |
| Shares, net of deferred offering costs | 160.8% |
Floating Rate Obligations | (0.7)% |
MFP Shares, net of deferred | |
offering costs | (28.2)% |
VRDP Shares, net of deferred | |
offering costs | (31.9)% |
| Net Assets | 100% |
|
| Portfolio Credit Quality | |
| (% of total investment exposure) | |
U.S. Guaranteed | 8.8% |
AAA | 1.0% |
AA | 11.2% |
A | 25.8% |
BBB | 21.3% |
BB or Lower | 19.3% |
N/R (not rated) | 11.9% |
N/A (not applicable) | 0.7% |
| Total | 100% |
| | |
| Portfolio Composition | |
| (% of total investments) | |
Tax Obligation/Limited | 19.8% |
Transportation | 19.0% |
Health Care | 15.2% |
Tax Obligation/General | 14.8% |
U.S. Guaranteed | 8.9% |
Utilities | 6.6% |
Education and Civic Organizations | 4.9% |
Other | 10.8% |
| Total | 100% |
| | |
| States and Territories | |
| (% of total municipal bonds) | |
Illinois | 19.2% |
California | 14.0% |
New York | 11.0% |
Texas | 9.8% |
Florida | 4.7% |
Colorado | 4.0% |
New Jersey | 3.4% |
Pennsylvania | 3.4% |
Puerto Rico | 2.5% |
Missouri | 2.4% |
Indiana | 2.3% |
Ohio | 1.9% |
South Carolina | 1.9% |
Other1 | 19.5% |
| Total | 100% |
1 See Portfolio of Investments for details on “other” States and Territories.
20
| | |
| NMZ | Nuveen Municipal High Income Opportunity Fund Performance Overview and Holding Summaries as of October 31, 2020 |
| | | | |
Refer to the Glossary of Terms Used in this Report for further definition of the terms used within this section. |
| Average Annual Total Returns as of October 31, 2020 |
|
| Average Annual |
| 1-Year | 5-Year | 10-Year |
NMZ at Common Share NAV | (0.49)% | 5.27% | 7.65% |
NMZ at Common Share Price | (1.84)% | 5.16% | 6.99% |
S&P Municipal Yield Index | 2.59% | 5.58% | 6.00% |
S&P Municipal Bond High Yield Index | 2.88% | 5.77% | 6.34% |
S&P Municipal Bond Index | 3.55% | 3.68% | 4.05% |
Past performance is not predictive of future results. Current performance may be higher or lower than the data shown. Returns do not reflect the deduction of taxes that shareholders may have to pay on Fund distributions or upon the sale of Fund shares. Returns at NAV are net of Fund expenses, and assume reinvestment of distributions. Comparative index return information is provided for the Fund’s shares at NAV only. Indexes are not available for direct investment.
21
| | |
| NMZ | Performance Overview and Holding Summaries as of October 31, 2020 (continued) |
This data relates to the securities held in the Fund’s portfolio of investments as of the end of the reporting period. It should not be construed as a measure of performance for the Fund itself. Holdings are subject to change.
The ratings disclosed are the lowest rating given by one of the following national rating agencies: Standard & Poor’s Group, Moody’s Investors Service, Inc. or Fitch, Inc. Credit ratings are subject to change. AAA, AA, A and BBB are investment grade ratings; BB, B, CCC, CC, C and D are below-investment grade ratings. Holdings designated N/R are not rated by these national rating agencies.
| | |
| Fund Allocation | |
| (% of net assets) | |
Long-Term Municipal Bonds | 143.3% |
Common Stocks | 1.6% |
Corporate Bonds | 0.2% |
Other Assets Less Liabilities | 2.4% |
| Net Assets Plus Floating Rate | |
| Obligations & AMTP Shares, | |
| net of deferred offering costs | 147.5% |
Floating Rate Obligations | (39.6)% |
AMTP Shares, net of deferred | |
offering costs | (7.9)% |
| Net Assets | 100% |
| | |
| Portfolio Credit Quality | |
| (% of total investment exposure) | |
U.S. Guaranteed | 5.3% |
AA | 13.7% |
A | 9.0% |
BBB | 16.1% |
BB or Lower | 18.6% |
N/R (not rated) | 36.2% |
N/A (not applicable) | 1.1% |
| Total | 100% |
| | |
| Portfolio Composition | |
| (% of total investments) | |
Tax Obligation/Limited | 27.7% |
Health Care | 15.7% |
Transportation | 13.6% |
Education and Civic Organizations | 11.1% |
Tax Obligation/General | 6.9% |
Utilities | 5.3% |
Consumer Staples | 5.0% |
Other | 14.7% |
| Total | 100% |
| | |
| States and Territories | |
| (% of total municipal bonds) | |
Illinois | 18.4% |
California | 11.3% |
Florida | 9.5% |
New York | 6.6% |
Colorado | 5.7% |
Puerto Rico | 5.4% |
Ohio | 4.9% |
Wisconsin | 4.0% |
Kentucky | 4.0% |
New Jersey | 3.7% |
Texas | 2.7% |
Arizona | 2.0% |
South Carolina | 2.0% |
Other1 | 19.8% |
| Total | 100% |
1 See Portfolio of Investments for further details on “other” States and Territories.
22
| | |
| NMCO | Nuveen Municipal Credit Opportunities Fund |
| Performance Overview and Holding Summaries as of October 31, 2020 |
| | | |
Refer to the Glossary of Terms Used in this Report for further definition of the terms used within this section. |
| Average Annual Total Returns as of October 31, 2020 |
|
| Average Annual |
| | Since |
| 1-Year | Inception |
NMCO at Common Share NAV | (10.33)% | (8.82)% |
NMCO at Common Share Price | (19.78)% | (15.91)% |
S&P Municipal Yield Index | 2.59% | 3.08% |
Since inception returns are from 9/16/19. Past performance is not predictive of future results. Current performance may be higher or lower than the data shown. Returns do not reflect the deduction of taxes that shareholders may have to pay on Fund distributions or upon the sale of Fund shares. Returns at NAV are net of Fund expenses, and assume reinvestment of distributions. Comparative index return information is provided for the Fund’s shares at NAV only. Indexes are not available for direct investment.
23
| | |
| NMCO | Performance Overview and Holding Summaries as of October 31, 2020 (continued) |
This data relates to the securities held in the Fund’s portfolio of investments as of the end of the reporting period. It should not be construed as a measure of performance for the Fund itself. Holdings are subject to change.
The ratings disclosed are the lowest rating given by one of the following national rating agencies: Standard & Poor’s Group, Moody’s Investors Service, Inc. or Fitch, Inc. Credit ratings are subject to change. AAA, AA, A and BBB are investment grade ratings; BB, B, CCC, CC, C and D are below-investment grade ratings. Holdings designated N/R are not rated by these national rating agencies.
| | |
| Fund Allocation | |
| (% of net assets) | |
Long-Term Municipal Bonds | 159.1% |
Common Stocks | 2.5% |
Exchange-Traded Funds | 0.3% |
Short-Term Municipal Bonds | 2.2% |
Other Assets Less Liabilities | 4.9% |
| Net Assets Plus Floating | |
| Rate Obligations, MFP Shares, | |
| net of deferred offerings | 169.0% |
Floating Rate Obligations | (3.2)% |
MFP Shares, net of deferred | |
offerings | (65.8)% |
| Net Assets | 100% |
|
| Portfolio Credit Quality | |
| (% of total investment exposure) | |
AA | 3.3% |
A | 0.8% |
BBB | 9.3% |
BB or Lower | 36.0% |
N/R (not rated) | 48.9% |
N/A (not applicable) | 1.7% |
| Total | 100% |
| | |
| Portfolio Composition | |
| (% of total investments) | |
Tax Obligation/Limited | 20.3% |
Industrials | 15.4% |
Transportation | 12.0% |
Education and Civic Organizations | 11.2% |
Consumer Staples | 8.2% |
Health Care | 8.1% |
Tax Obligation/General | 7.5% |
Utilities | 6.6% |
Long-Term Care | 6.4% |
Other | 4.3% |
| Total | 100% |
| | |
| States and Territories | |
| (% of total municipal bonds) | |
Florida | 11.7% |
Illinois | 11.6% |
New York | 8.4% |
Ohio | 7.0% |
Puerto Rico | 6.4% |
Colorado | 6.2% |
Wisconsin | 5.2% |
California | 4.0% |
Pennsylvania | 4.0% |
Alabama | 3.8% |
Arizona | 3.1% |
Virgin Islands | 2.7% |
New Jersey | 2.6% |
Arkansas | 2.5% |
Iowa | 2.1% |
Other1 | 18.7% |
| Total | 100% |
1 See Portfolio of Investments for further details on “other” States and Territories.
24
| | |
| NDMO | Nuveen Dynamic Municipal Opportunities Fund |
| Performance Overview and Holding Summaries as of October 31, 2020 |
| | |
Refer to the Glossary of Terms Used in this Report for further definition of the terms used within this section. |
| Cumulative Total Returns as of October 31, 2020 |
|
| Since |
| Inception |
NDMO at Common Share NAV | (0.02)% |
NDMO at Common Share Price | 0.51% |
S&P Municipal Bond Index | (0.21)% |
Since inception returns are from 8/26/20. Past performance is not predictive of future results. Current performance may be higher or lower than the data shown. Returns do not reflect the deduction of taxes that shareholders may have to pay on Fund distributions or upon the sale of Fund shares. Returns at NAV are net of Fund expenses, and assume reinvestment of distributions. Comparative index return information is provided for the Fund’s shares at NAV only. Indexes are not available for direct investment.
25
| | |
| NDMO | Performance Overview and Holding Summaries as of October 31, 2020 (continued) |
This data relates to the securities held in the Fund’s portfolio of investments as of the end of the reporting period. It should not be construed as a measure of performance for the Fund itself. Holdings are subject to change.
The ratings disclosed are the lowest rating given by one of the following national rating agencies: Standard & Poor’s Group, Moody’s Investors Service, Inc. or Fitch, Inc. Credit ratings are subject to change. AAA, AA, A and BBB are investment grade ratings; BB, B, CCC, CC, C and D are below-investment grade ratings. Holdings designated N/R are not rated by these national rating agencies.
| | |
| Fund Allocation | |
| (% of net assets) | |
Long-Term Municipal Bonds | 105.8% |
Corporate Bonds | 0.1% |
Other Assets Less Liabilities | 11.1% |
| Net Assets Plus Floating | |
| Rate Obligations | 117.0% |
Floating Rate Obligations | (17.0)% |
| Net Assets | 100% |
|
| Portfolio Credit Quality | |
| (% of total investment exposure) | |
AA | 16.7% |
A | 25.8% |
BBB | 17.3% |
BB or Lower | 14.3% |
N/R (not rated) | 25.9% |
| Total | 100% |
| | |
| Portfolio Composition | |
| (% of total investments) | |
Tax Obligation/Limited | 23.4% |
Transportation | 20.5% |
Health Care | 17.6% |
Education and Civic Organizations | 15.4% |
Industrials | 6.4% |
Tax Obligation/General | 4.9% |
Other | 11.8% |
| Total | 100% |
| | |
| States and Territories | |
| (% of total municipal bonds) | |
New York | 18.8% |
California | 14.4% |
Florida | 9.4% |
Colorado | 9.0% |
Arizona | 6.1% |
Ohio | 6.0% |
Illinois | 5.6% |
Puerto Rico | 4.9% |
Missouri | 3.4% |
Texas | 3.1% |
Other1 | 19.3% |
| Total | 100% |
1 See Portfolio of Investments for further details on “other” States and Territories.
26
Shareholder Meeting Report
The annual meeting of shareholders was held on August 5, 2020 for NMZ, NVG and NZF. The meeting was held virtually due to public health concerns regarding the ongoing COVID-19 pandemic; at this meeting the shareholders were asked to elect Board members.
| | | | | | | |
| NMZ | NVG | NZF |
| Common and | | Common and | | Common and | |
| Preferred | | Preferred | Preferred | Preferred | Preferred |
| shares voting | | shares voting | shares voting | shares voting | shares voting |
| together | Preferred | together | together | together | together |
| as a class | Shares | as a class | as a class | as a class | as a class |
| Approval of the Board Members was reached as follows: | | | | | | |
John K. Nelson | | | | | | |
| For | 61,404,334 | — | 170,335,443 | — | 114,505,552 | — |
| Withhold | 1,775,687 | — | 6,595,221 | — | 3,655,195 | — |
| Total | 63,180,021 | — | 176,930,664 | — | 118,160,747 | — |
Terence J. Toth | | | | | | |
| For | 61,326,657 | — | 170,446,939 | — | 114,789,558 | — |
| Withhold | 1,853,364 | — | 6,483,725 | — | 3,371,189 | — |
| Total | 63,180,021 | — | 176,930,664 | — | 118,160,747 | — |
Robert L. Young | | | | | | |
| For | 61,400,374 | — | 170,817,454 | — | 115,137,619 | — |
| Withhold | 1,779,647 | — | 6,113,210 | — | 3,023,128 | — |
| Total | 63,180,021 | — | 176,930,664 | — | 118,160,747 | — |
William C. Hunter | | | | | | |
| For | — | 870 | — | 185,695 | — | 13,680 |
| Withhold | — | — | — | 21,320 | — | — |
| Total | — | 870 | — | 207,015 | — | 13,680 |
Albin F. Moschner | | | | | | |
| For | — | 870 | — | 207,015 | — | 13,680 |
| Withhold | — | — | — | — | — | — |
| Total | — | 870 | — | 207,015 | — | 13,680 |
27
Report of Independent Registered Public Accounting Firm
To the Shareholders and Board of Trustees
Nuveen AMT-Free Municipal Credit Income Fund
Nuveen Municipal Credit Income Fund
Nuveen Municipal High Income Opportunity Fund
Nuveen Municipal Credit Opportunities Fund
Nuveen Dynamic Municipal Opportunities Fund:
Opinion on the Financial Statements
We have audited the accompanying statements of assets and liabilities of Nuveen AMT-Free Municipal Credit Income Fund, Nuveen Municipal Credit Income Fund, Nuveen Municipal High Income Opportunity Fund, Nuveen Municipal Credit Opportunities Fund, and Nuveen Dynamic Municipal Opportunities Fund (the Funds), including the portfolios of investments, as of October 31, 2020, the related statements of operations and cash flows for the year then ended (the period from August 26, 2020 (commencement of operations) to October 31, 2020 for Nuveen Dynamic Municipal Opportunities Fund), the statements of changes in net assets for each of the years in the two-year period then ended (the year then ended and the period from September 16, 2019 (commencement of operations) to October 31, 2019 for Nuveen Municipal Credit Opportunities Fund and the period from August 26, 2020 to October 31, 2020 for Nuveen Dynamic Municipal Opportunities Fund), and the related notes (collectively, the financial statements) and the financial highlights for each of the years in the five-year period then ended (the year then ended and the period from September 16, 2019 to October 31, 2019 for Nuveen Municipal Credit Opportunities Fund and the period from August 26, 2020 to October 31, 2020 for Nuveen Dynamic Municipal Opportunities Fund). In our opinion, the financial statements and financial highlights present fairly, in all material respects, the financial position of the Funds as of October 31, 2020, the results of their operations and cash flows for the year then ended (the period from August 26, 2020 to October 31, 2020 for Nuveen Dynamic Municipal Opportunities Fund), the changes in their net assets for each of the years in the two year period then ended (the year then ended and the period from September 16, 2019 to October 31, 2019 for Nuveen Municipal Credit Opportunities Fund and the period from August 26, 2020 to October 31, 2020 for Nuveen Dynamic Municipal Opportunities Fund), and the financial highlights for each of the years in the five year period then ended (the year then ended and the period from September 16, 2019 to October 31, 2019 for Nuveen Municipal Credit Opportunities Fund and the period from August 26, 2020 to October 31, 2020 for Nuveen Dynamic Municipal Opportunities Fund), in conformity with U.S. generally accepted accounting principles.
Basis for Opinion
These financial statements and financial highlights are the responsibility of the Funds’ management. Our responsibility is to express an opinion on these financial statements and financial highlights based on our audits. We are a public accounting firm registered with the Public Company Accounting Oversight Board (United States) (PCAOB) and are required to be independent with respect to the Funds in accordance with the U.S. federal securities laws and the applicable rules and regulations of the Securities and Exchange Commission and the PCAOB.
We conducted our audits in accordance with the standards of the PCAOB. Those standards require that we plan and perform the audit to obtain reasonable assurance about whether the financial statements and financial highlights are free of material misstatement, whether due to error or fraud. Our audits included performing procedures to assess the risks of material misstatement of the financial statements and financial highlights, whether due to error or fraud, and performing procedures that respond to those risks. Such procedures included examining, on a test basis, evidence regarding the amounts and disclosures in the financial statements and financial highlights. Such procedures also included confirmation of securities owned as of October 31, 2020, by correspondence with custodians and brokers or other appropriate auditing procedures. Our audits also included evaluating the accounting principles used and significant estimates made by management, as well as evaluating the overall presentation of the financial statements and financial highlights. We believe that our audits provide a reasonable basis for our opinion.
/s/ KPMG LLP
We have served as the auditor of one or more Nuveen investment companies since 2014.
Chicago, Illinois
December 28, 2020
28
| | |
| Nuveen AMT-Free Municipal Credit Income Fund Portfolio of Investments October 31, 2020 |
| | | | | | |
| Principal | | | Optional Call | | |
| Amount (000) | | Description (1) | Provisions (2) | Ratings (3) | Value |
| | LONG-TERM INVESTMENTS – 157.8% (100.0% of Total Investments) | | | |
| | MUNICIPAL BONDS – 157.4% (99.8% of Total Investments) | | | |
| | Alabama – 2.0% (1.3% of Total Investments) | | | |
| $ 3,645 | | Alabama Private Colleges and University Facilities Authority, Limited Obligation Bonds, | 9/25 at 100.00 | N/R | $ 3,783,510 |
| | University of Mobile Project, Series 2015A, 6.000%, 9/01/45, 144A | | | |
| 5,000 | | Birmingham-Jefferson Civic Center Authority, Alabama, Special Tax Bonds, Series 2018A, | 7/28 at 100.00 | A– | 5,006,800 |
| | 4.000%, 7/01/43 | | | |
| 22,655 | | Lower Alabama Gas District, Alabama, Gas Project Revenue Bonds, Series 2016A, | No Opt. Call | A3 | 31,066,575 |
| | 5.000%, 9/01/46 | | | |
| 8,100 | | Mobile Spring Hill College Educational Building Authority, Alabama, Revenue Bonds, | 4/25 at 100.00 | N/R | 8,339,193 |
| | Spring Hill College Project, Series 2015, 5.875%, 4/15/45 | | | |
| | Opelika Utilities Board, Alabama, Utility Revenue Bonds, Series 2011B: | | | |
| 1,250 | | 4.000%, 6/01/29 (Pre-refunded 6/01/21) – AGM Insured | 6/21 at 100.00 | Aa3 (11) | 1,277,713 |
| 1,000 | | 4.250%, 6/01/31 (Pre-refunded 6/01/21) – AGM Insured | 6/21 at 100.00 | Aa3 (11) | 1,023,610 |
| | The Improvement District of the City of Mobile – McGowin Park Project, Alabama, Sales | | | |
| | Tax Revenue Bonds, Series 2016A: | | | |
| 1,000 | | 5.250%, 8/01/30 | 8/26 at 100.00 | N/R | 1,015,760 |
| 1,300 | | 5.500%, 8/01/35 | 8/26 at 100.00 | N/R | 1,311,713 |
| 5,970 | | Tuscaloosa County Industrial Development Authority, Alabama, Gulf Opportunity Zone | 5/29 at 100.00 | N/R | 6,557,030 |
| | Bonds, Hunt Refining Project, Refunding Series 2019A, 5.250%, 5/01/44, 144A | | | |
| 12,000 | | UAB Medicine Finance Authority, Alabama, Revenue Bonds, Series 2019B, 4.000%, 9/01/44 | 9/29 at 100.00 | AA– | 13,568,280 |
| 61,920 | | Total Alabama | | | 72,950,184 |
| | Alaska – 0.6% (0.4% of Total Investments) | | | |
| | Northern Tobacco Securitization Corporation, Alaska, Tobacco Settlement Asset-Backed | | | |
| | Bonds, Series 2006A: | | | |
| 7,010 | | 5.000%, 6/01/32 | 11/20 at 100.00 | B3 | 7,011,753 |
| 12,635 | | 5.000%, 6/01/46 | 11/20 at 100.00 | B3 | 12,688,572 |
| 19,645 | | Total Alaska | | | 19,700,325 |
| | Arizona – 2.4% (1.6% of Total Investments) | | | |
| 4,230 | | Apache County Industrial Development Authority, Arizona, Pollution Control Revenue | 3/22 at 100.00 | A– | 4,377,415 |
| | Bonds, Tucson Electric Power Company, Series 20102A, 4.500%, 3/01/30 | | | |
| 1,475 | | Arizona Industrial Development Authority, Arizona, Education Facility Revenue Bonds, | 7/27 at 100.00 | BB | 1,565,742 |
| | Basis Schools, Inc Projects, Series 2017D, 5.000%, 7/01/47, 144A | | | |
| 3,790 | | Arizona Industrial Development Authority, Arizona, Education Revenue Bonds, Academies of | 7/29 at 100.00 | BB | 3,979,955 |
| | Math & Science Projects, Series 2019, 5.000%, 7/01/54, 144A | | | |
| 3,260 | | Arizona Industrial Development Authority, Education Facility Revenue Bonds, Caurus | 6/28 at 100.00 | N/R | 3,584,989 |
| | Academy Project, Series 2018A, 6.375%, 6/01/39, 144A | | | |
| 10,000 | | Arizona Sports and Tourism Authority, Tax Revenue Bonds, Multipurpose Stadium Facility | 7/22 at 100.00 | A | 10,487,200 |
| | Project, Refunding Senior Series 2012A, 5.000%, 7/01/31 | | | |
| 3,325 | | Cahava Springs Revitalization District, Cave Creek, Arizona, Special Assessment Bonds, | 7/27 at 100.00 | N/R | 2,560,250 |
| | Series 2017A, 7.000%, 7/01/41, 144A (4) | | | |
| | Maricopa County Industrial Development Authority, Arizona, Education Revenue Bonds, | | | |
| | Legacy Traditional Schools Projects, Taxable Series 2019B: | | | |
| 1,730 | | 5.000%, 7/01/49, 144A | 7/29 at 100.00 | Ba2 | 1,843,748 |
| 1,975 | | 5.000%, 7/01/54, 144A | 7/29 at 100.00 | Ba2 | 2,098,062 |
| 800 | | Maricopa County Industrial Development Authority, Arizona, Education Revenue Bonds, Reid | 7/26 at 100.00 | Baa3 | 869,680 |
| | Traditional School Projects, Series 2016, 5.000%, 7/01/47 | | | |
29
| | |
| NVG | Nuveen AMT-Free Municipal Credit Income Fund Portfolio of Investments (continued) October 31, 2020 |
| | | | | | |
| Principal | | | Optional Call | | |
| Amount (000) | | Description (1) | Provisions (2) | Ratings (3) | Value |
| | Arizona (continued) | | | |
| | Phoenix Civic Improvement Corporation, Arizona, Revenue Bonds, Civic Plaza Expansion | | | |
| | Project, Series 2005B: | | | |
| $ 6,000 | | 5.500%, 7/01/37 – FGIC Insured | No Opt. Call | AA | $ 8,982,780 |
| 8,755 | | 5.500%, 7/01/39 – FGIC Insured | No Opt. Call | AA | 13,302,084 |
| | Phoenix Industrial Development Authority, Arizona, Education Facility Revenue Bonds, | | | |
| | Basis Schools, Inc Projects, Series 2016A: | | | |
| 620 | | 5.000%, 7/01/35, 144A | 7/25 at 100.00 | BB | 658,291 |
| 1,025 | | 5.000%, 7/01/46, 144A | 7/25 at 100.00 | BB | 1,071,248 |
| 2,045 | | Phoenix Industrial Development Authority, Arizona, Multifamily Housing Revenue Bonds, | 7/24 at 101.00 | N/R | 1,967,106 |
| | Deer Valley Veterans Assisted Living Project, Series 2016A, 5.125%, 7/01/36 | | | |
| | Pima County Industrial Development Authority, Arizona, Education Facility Revenue Bonds, | | | |
| | Edkey Charter Schools Project, Refunding Series 2013: | | | |
| 490 | | 6.000%, 7/01/33 | 11/20 at 102.00 | BB– | 500,437 |
| 610 | | 6.000%, 7/01/43 | 11/20 at 102.00 | BB– | 622,798 |
| 350 | | 6.000%, 7/01/48 | 11/20 at 102.00 | BB– | 357,329 |
| 1,425 | | Pima County Industrial Development Authority, Arizona, Education Facility Revenue Bonds, | 11/20 at 102.00 | BB– | 1,456,407 |
| | Edkey Charter Schools Project, Series 2014A, 7.375%, 7/01/49 | | | |
| | Pima County Industrial Development Authority, Arizona, Education Facility Revenue Bonds, | | | |
| | Edkey Charter Schools Project, Series 2016: | | | |
| 1,130 | | 5.250%, 7/01/36 | 7/26 at 100.00 | BB– | 1,171,132 |
| 1,850 | | 5.375%, 7/01/46 | 7/26 at 100.00 | BB– | 1,891,514 |
| 2,135 | | 5.500%, 7/01/51 | 7/26 at 100.00 | BB– | 2,187,542 |
| 2,920 | | Pima County Industrial Development Authority, Arizona, Education Facility Revenue Bonds, | 7/26 at 103.00 | N/R | 3,109,946 |
| | Edkey Charter Schools Project, Series 2019, 5.875%, 7/01/51, 144A | | | |
| 885 | | Pima County Industrial Development Authority, Arizona, Education Facility Revenue Bonds, | 2/24 at 100.00 | N/R | 922,338 |
| | San Tan Montessori School Project, Series 2016, 6.500%, 2/01/48, 144A | | | |
| 3,050 | | Pima County Industrial Development Authority, Arizona, Education Facility Revenue Bonds, | 2/28 at 100.00 | N/R | 3,353,262 |
| | San Tan Montessori School Project, Series 2017, 6.750%, 2/01/50, 144A | | | |
| 105 | | Pima County Industrial Development Authority, Arizona, Education Revenue Bonds, Noah | 11/20 at 102.00 | BB– | 107,325 |
| | Webster Schools ? Pima Project, Series 2014A, 7.250%, 7/01/39 | | | |
| | Salt Verde Financial Corporation, Arizona, Senior Gas Revenue Bonds, Citigroup Energy | | | |
| | Inc Prepay Contract Obligations, Series 2007: | | | |
| 6,820 | | 5.000%, 12/01/32 | No Opt. Call | BBB+ | 8,828,490 |
| 2,465 | | 5.000%, 12/01/37 | No Opt. Call | BBB+ | 3,296,864 |
| 2,000 | | Yavapai County Industrial Development Authority, Arizona, Hospital Revenue Bonds, | 8/23 at 100.00 | A2 | 2,192,800 |
| | Yavapai Regional Medical Center, Series 2013A, 5.250%, 8/01/33 | | | |
| 75,265 | | Total Arizona | | | 87,346,734 |
| | Arkansas – 0.3% (0.2% of Total Investments) | | | |
| | Arkansas Development Finance Authority, Tobacco Settlement Revenue Bonds, Arkansas | | | |
| | Cancer Research Center Project, Series 2006: | | | |
| 2,500 | | 0.000%, 7/01/36 – AMBAC Insured | No Opt. Call | Aa2 | 1,680,075 |
| 20,460 | | 0.000%, 7/01/46 – AMBAC Insured | No Opt. Call | Aa2 | 9,183,471 |
| 22,960 | | Total Arkansas | | | 10,863,546 |
| | California – 14.3% (9.1% of Total Investments) | | | |
| 6,135 | | Alhambra Unified School District, Los Angeles County, California, General Obligation | No Opt. Call | AA | 5,180,946 |
| | Bonds, Capital Appreciation Series 2009B, 0.000%, 8/01/30 – AGC Insured | | | |
| | Anaheim Public Financing Authority, California, Lease Revenue Bonds, Public Improvement | | | |
| | Project, Series 1997C: | | | |
| 5,785 | | 0.000%, 9/01/35 – AGM Insured | No Opt. Call | AA | 4,098,846 |
| 6,765 | | 0.000%, 9/01/35 – AGM Insured (ETM) | No Opt. Call | AA (11) | 5,240,101 |
| 4,100 | | Antelope Valley Healthcare District, California, Revenue Bonds, Series 2016A, | 3/26 at 100.00 | Ba3 | 4,121,279 |
| | 5.000%, 3/01/41 | | | |
30
| | | | | | |
| Principal | | | Optional Call | | |
| Amount (000) | | Description (1) | Provisions (2) | Ratings (3) | Value |
| | California (continued) | | | |
| $ 5,000 | | Bay Area Toll Authority, California, Revenue Bonds, San Francisco Bay Area Toll Bridge, | 4/23 at 100.00 | A1 (11) | $ 5,574,400 |
| | Series 2013S-4, 5.000%, 4/01/38 (Pre-refunded 4/01/23) | | | |
| 1,430 | | California County Tobacco Securitization Agency, Tobacco Settlement Asset-Backed Bonds, | 6/30 at 100.00 | BBB+ | 1,591,047 |
| | Los Angeles County Securitization Corporation, Series 2020A, 4.000%, 6/01/49 | | | |
| 580 | | California County Tobacco Securitization Agency, Tobacco Settlement Asset-Backed Bonds, | 6/30 at 100.00 | BBB– | 671,222 |
| | Los Angeles County Securitization Corporation, Series 2020B-1, 5.000%, 6/01/49 | | | |
| 50,460 | | California County Tobacco Securitization Agency, Tobacco Settlement Asset-Backed Bonds, | 6/30 at 26.72 | N/R | 9,002,569 |
| | Los Angeles County Securitization Corporation, Series 2020B-2, 0.000%, 6/01/55 | | | |
| 22,965 | | California Educational Facilities Authority, Revenue Bonds, Stanford University Series | No Opt. Call | AAA | 35,340,379 |
| | 2016U-7, 5.000%, 6/01/46 (UB) (5) | | | |
| 15,850 | | California Educational Facilities Authority, Revenue Bonds, Stanford University Series | No Opt. Call | AAA | 24,909,067 |
| | 2019V-1, 5.000%, 5/01/49 | | | |
| 10,000 | | California Health Facilities Financing Authority, Revenue Bonds, Lucile Salter Packard | 8/22 at 100.00 | A+ | 10,494,700 |
| | Children’s Hospital, Series 2012A, 5.000%, 8/15/51 | | | |
| 1,600 | | California Health Facilities Financing Authority, Revenue Bonds, Saint Joseph Health | 7/23 at 100.00 | AA– | 1,761,328 |
| | System, Series 2013A, 5.000%, 7/01/37 | | | |
| 6,665 | | California Health Facilities Financing Authority, Revenue Bonds, Stanford Hospitals and | 8/25 at 100.00 | AA– | 7,528,584 |
| | Clinics, Series 2015A, 5.000%, 8/15/54 (UB) (5) | | | |
| | California Health Facilities Financing Authority, Revenue Bonds, Stanford Hospitals and | | | |
| | Clinics, Tender Option Bond Trust 2015-XF0131: | | | |
| 1,555 | | 9.284%, 8/15/51, 144A (IF) (5) | 8/22 at 100.00 | AA | 1,752,096 |
| 1,650 | | 9.292%, 8/15/51, 144A (IF) (5) | 8/22 at 100.00 | AA | 1,859,336 |
| 4,075 | | 9.292%, 8/15/51, 144A (IF) (5) | 8/22 at 100.00 | AA | 4,591,995 |
| 5,000 | | California Health Facilities Financing Authority, Revenue Bonds, Sutter Health, Series | 8/23 at 100.00 | A+ (11) | 5,653,850 |
| | 2013A, 5.000%, 8/15/52 (Pre-refunded 8/15/23) | | | |
| | California Municipal Finance Authority, Charter School Revenue Bonds, Palmdale Aerospace | | | |
| | Academy Project, Series 2016A: | | | |
| 3,065 | | 5.000%, 7/01/31, 144A | 7/26 at 100.00 | BB | 3,331,931 |
| 1,000 | | 5.000%, 7/01/36, 144A | 7/26 at 100.00 | BB | 1,070,020 |
| 555 | | 5.000%, 7/01/41, 144A | 7/26 at 100.00 | BB | 588,028 |
| 195 | | 5.000%, 7/01/46, 144A | 7/26 at 100.00 | BB | 205,286 |
| | California Municipal Finance Authority, Education Revenue Bonds, American Heritage | | | |
| | Foundation Project, Series 2016A: | | | |
| 260 | | 5.000%, 6/01/36 | 6/26 at 100.00 | BBB– | 290,209 |
| 435 | | 5.000%, 6/01/46 | 6/26 at 100.00 | BBB– | 476,199 |
| 5,425 | | California Pollution Control Financing Authority, Water Furnishing Revenue Bonds, San | 1/29 at 100.00 | Baa3 | 6,179,780 |
| | Diego County Water Authority Desalination Project Pipeline, Refunding Series 2019, 5.000%, | | | |
| | 11/21/45, 144A | | | |
| 2,050 | | California Public Finance Authority, Revenue Bonds, Henry Mayo Newhall Hospital, Series | 10/26 at 100.00 | BBB– | 2,256,169 |
| | 2017, 5.000%, 10/15/47 | | | |
| 735 | | California School Finance Authority, Charter School Revenue Bonds, Downtown College Prep – | 6/26 at 100.00 | N/R | 772,522 |
| | Obligated Group, Series 2016, 5.000%, 6/01/46, 144A | | | |
| 715 | | California School Finance Authority, Charter School Revenue Bonds, Rocketship Education | 6/25 at 100.00 | N/R | 766,237 |
| | ? Obligated Group, Series 2016A, 5.000%, 6/01/36, 144A | | | |
| 570 | | California School Finance Authority, Charter School Revenue Bonds, Rocketship Education | 6/26 at 100.00 | N/R | 612,362 |
| | ? Obligated Group, Series 2017A, 5.125%, 6/01/47, 144A | | | |
| 80 | | California State, General Obligation Bonds, Series 2002, 5.000%, 10/01/32 – | 11/20 at 100.00 | AA– | 80,272 |
| | NPFG Insured | | | |
| 5 | | California State, General Obligation Bonds, Series 2004, 5.000%, 4/01/31 – | 11/20 at 100.00 | AA– | 5,017 |
| | AMBAC Insured | | | |
| 3,500 | | California State, General Obligation Bonds, Various Purpose Series 2010, 5.250%, 3/01/30 | 11/20 at 100.00 | AA– | 3,512,740 |
| 12,710 | | California Statewide Communities Development Authority, California, Revenue Bonds, Loma | 12/24 at 100.00 | BB– | 13,753,999 |
| | Linda University Medical Center, Series 2014A, 5.500%, 12/01/54 | | | |
31
| | |
| NVG | Nuveen AMT-Free Municipal Credit Income Fund Portfolio of Investments (continued) October 31, 2020 |
| | | | | | |
| Principal | | | Optional Call | | |
| Amount (000) | | Description (1) | Provisions (2) | Ratings (3) | Value |
| | California (continued) | | | |
| $ 65,505 | | California Statewide Communities Development Authority, California, Revenue Bonds, Loma | 6/26 at 100.00 | BB– | $ 72,076,462 |
| | Linda University Medical Center, Series 2016A, 5.250%, 12/01/56, 144A | | | |
| 10,130 | | California Statewide Communities Development Authority, California, Revenue Bonds, Loma | 6/28 at 100.00 | BB– | 11,455,511 |
| | Linda University Medical Center, Series 2018A, 5.500%, 12/01/58, 144A | | | |
| 4,000 | | California Statewide Communities Development Authority, Revenue Bonds, Huntington | 7/24 at 100.00 | A– | 4,249,440 |
| | Memorial Hospital, Refunding Series 2014B, 4.000%, 7/01/39 | | | |
| | California Statewide Community Development Authority, Revenue Bonds, Daughters of | | | |
| | Charity Health System, Series 2005A: | | | |
| 808 | | 5.750%, 7/01/30 (4) | 11/20 at 100.00 | N/R | 743,961 |
| 2,334 | | 5.750%, 7/01/35 (4) | 11/20 at 100.00 | N/R | 2,147,068 |
| 5,000 | | Clovis Unified School District, Fresno County, California, General Obligation Bonds, | No Opt. Call | Baa2 (11) | 4,873,700 |
| | Series 2001A, 0.000%, 8/01/25 – FGIC Insured (ETM) | | | |
| 3,400 | | Coachella Valley Unified School District, Riverside County, California, General | No Opt. Call | A2 | 2,617,728 |
| | Obligation Bonds, Election 2005 Series 2010C, 0.000%, 8/01/33 – AGM Insured | | | |
| 14,375 | | Corona-Norco Unified School District, Riverside County, California, General Obligation | No Opt. Call | Aa3 | 8,550,538 |
| | Bonds, Capital Appreciation, Election 2006 Refunding Series 2009C, 0.000%, 8/01/39 – | | | |
| | AGM Insured | | | |
| | El Rancho Unified School District, Los Angeles County, California, General Obligation | | | |
| | Bonds, Election 2010 Series 2011A: | | | |
| 2,615 | | 0.000%, 8/01/31 – AGM Insured (7) | 8/28 at 100.00 | A1 | 3,150,892 |
| 3,600 | | 0.000%, 8/01/34 – AGM Insured (7) | 8/28 at 100.00 | A1 | 4,295,232 |
| | Foothill/Eastern Transportation Corridor Agency, California, Toll Road Revenue Bonds, | | | |
| | Refunding Senior Lien Series 2015A: | | | |
| 3,960 | | 0.000%, 1/15/34 – AGM Insured | No Opt. Call | BBB | 2,941,528 |
| 5,000 | | 0.000%, 1/15/35 – AGM Insured | No Opt. Call | BBB | 3,597,200 |
| | Foothill/Eastern Transportation Corridor Agency, California, Toll Road Revenue Bonds, | | | |
| | Refunding Series 2013A: | | | |
| 910 | | 0.000%, 1/15/42 (7) | 1/31 at 100.00 | Baa2 | 1,027,254 |
| 3,610 | | 5.750%, 1/15/46 | 1/24 at 100.00 | Baa2 | 4,032,117 |
| 6,610 | | 6.000%, 1/15/49 (Pre-refunded 1/15/24) | 1/24 at 100.00 | Baa2 (11) | 7,811,301 |
| 4,445 | | Foothill/Eastern Transportation Corridor Agency, California, Toll Road Revenue Bonds, | 7/29 at 100.00 | Baa2 | 4,715,567 |
| | Refunding Term Rate Sub-Series 2013B-1, 3.500%, 1/15/53 | | | |
| | Golden State Tobacco Securitization Corporation, California, Tobacco Settlement | | | |
| | Asset-Backed Bonds, Series 2018A-1: | | | |
| 9,795 | | 5.000%, 6/01/47 | 6/22 at 100.00 | N/R | 10,075,333 |
| 6,240 | | 5.250%, 6/01/47 | 6/22 at 100.00 | N/R | 6,429,821 |
| 10,250 | | Golden State Tobacco Securitization Corporation, California, Tobacco Settlement | 6/22 at 100.00 | N/R | 10,543,355 |
| | Asset-Backed Bonds, Series 2018A-2, 5.000%, 6/01/47 | | | |
| | Kern Community College District, California, General Obligation Bonds, Safety, Repair & | | | |
| | Improvement, Election 2002 Series 2006: | | | |
| 5,600 | | 0.000%, 11/01/24 – AGM Insured | No Opt. Call | AA | 5,448,464 |
| 5,795 | | 0.000%, 11/01/25 – AGM Insured | No Opt. Call | AA | 5,564,127 |
| 1,160 | | Lincoln Public Financing Authority, Placer County, California, Twelve Bridges Limited | 9/21 at 100.00 | AA | 1,193,988 |
| | Obligation Revenue Bonds, Refunding Series 2011A, 4.375%, 9/02/25 – AGM Insured | | | |
| 7,575 | | Mount San Antonio Community College District, Los Angeles County, California, General | 8/35 at 100.00 | AA | 7,807,401 |
| | Obligation Bonds, Election of 2008, Series 2013A, 0.000%, 8/01/43 (7) | | | |
| 3,310 | | M-S-R Energy Authority, California, Gas Revenue Bonds, Citigroup Prepay Contracts, | No Opt. Call | BBB+ | 5,156,351 |
| | Series 2009B, 6.500%, 11/01/39 | | | |
32
| | | | | | |
| Principal | | | Optional Call | | |
| Amount (000) | | Description (1) | Provisions (2) | Ratings (3) | Value |
| | California (continued) | | | |
| | Oceanside Unified School District, San Diego County, California, General Obligation | | | |
| | Bonds, Capital Appreciation, 2008 Election Series 2009A: | | | |
| $ 530 | | 0.000%, 8/01/26 – AGC Insured (ETM) | No Opt. Call | Aa3 (11) | $ 510,607 |
| 605 | | 0.000%, 8/01/26 – AGC Insured (ETM) | No Opt. Call | Aa3 (11) | 582,863 |
| 4,770 | | 0.000%, 8/01/26 – AGC Insured | No Opt. Call | Aa3 | 4,480,270 |
| 225 | | 0.000%, 8/01/28 – AGC Insured (ETM) | No Opt. Call | Aa3 (11) | 211,509 |
| 1,995 | | 0.000%, 8/01/28 – AGC Insured | No Opt. Call | Aa3 | 1,786,423 |
| 1,020 | | Ontario Redevelopment Financing Authority, San Bernardino County, California, Revenue | 11/20 at 100.00 | N/R (11) | 1,086,769 |
| | Bonds, Redevelopment Project 1, Series 1993, 5.850%, 8/01/22 – NPFG Insured (ETM) | | | |
| 3,905 | | Orange County, California, Special Tax Bonds, Community Facilities District 2015-1 | 8/25 at 100.00 | N/R | 4,176,554 |
| | Esencia Village, Series 2015A, 4.250%, 8/15/38 | | | |
| 3,700 | | Palomar Pomerado Health, California, General Obligation Bonds, Capital Appreciation, | No Opt. Call | BBB– | 3,497,314 |
| | Election of 2004, Series 2007A, 0.000%, 8/01/25 – NPFG Insured | | | |
| 7,875 | | Palomar Pomerado Health, California, General Obligation Bonds, Series 2009A, 7.000%, | 8/29 at 100.00 | BBB– | 11,206,913 |
| | 8/01/38 – AGC Insured | | | |
| 9,145 | | Pittsburg Redevelopment Agency, California, Tax Allocation Bonds, Los Medanos Community | No Opt. Call | A | 7,641,288 |
| | Development Project, Series 1999, 0.000%, 8/01/30 – AMBAC Insured | | | |
| 4,150 | | Placentia-Yorba Linda Unified School District, Orange County, California, Certificates | 10/21 at 100.00 | A2 | 4,357,625 |
| | of Participation, Refunding Series 2011, 6.250%, 10/01/28 – AGM Insured | | | |
| 670 | | Riverside County Transportation Commission, California, Toll Revenue Senior Lien Bonds, | 6/23 at 100.00 | BBB+ | 723,620 |
| | Series 2013A, 5.750%, 6/01/48 | | | |
| | San Clemente, California, Special Tax Revenue Bonds, Community Facilities District | | | |
| | 2006-1 Marblehead Coastal, Series 2015: | | | |
| 485 | | 5.000%, 9/01/40 | 9/25 at 100.00 | N/R | 539,955 |
| 910 | | 5.000%, 9/01/46 | 9/25 at 100.00 | N/R | 1,003,311 |
| 4,000 | | San Francisco Airports Commission, California, Revenue Bonds, San Francisco | 5/23 at 100.00 | A | 4,367,120 |
| | International Airport, Governmental Purpose, Second Series 2013B, 5.000%, 5/01/43 | | | |
| 66,685 | | San Joaquin Hills Transportation Corridor Agency, Orange County, California, Senior Lien | No Opt. Call | AA+ (11) | 66,660,327 |
| | Toll Road Revenue Bonds, Series 1993, 0.000%, 1/01/21 (ETM) | | | |
| | San Joaquin Hills Transportation Corridor Agency, Orange County, California, Toll Road | | | |
| | Revenue Bonds, Refunding Senior Lien Series 2014A: | | | |
| 2,680 | | 5.000%, 1/15/44 | 1/25 at 100.00 | BBB | 2,946,955 |
| 8,275 | | 5.000%, 1/15/50 | 1/25 at 100.00 | BBB | 9,057,815 |
| 7,210 | | San Joaquin Hills Transportation Corridor Agency, Orange County, California, Toll Road | No Opt. Call | Baa2 | 6,914,823 |
| | Revenue Bonds, Refunding Series 1997A, 0.000%, 1/15/23 – NPFG Insured | | | |
| 3,250 | | San Mateo County Community College District, California, General Obligation Bonds, | No Opt. Call | AAA | 2,800,980 |
| | Series 2006C, 0.000%, 9/01/30 – NPFG Insured | | | |
| 4,325 | | San Ysidro School District, San Diego County, California, General Obligation Bonds, 1997 | No Opt. Call | AA | 3,200,543 |
| | Election Series 2012G, 0.000%, 8/01/34 – AGM Insured | | | |
| 5,690 | | San Ysidro School District, San Diego County, California, General Obligation Bonds, | 8/25 at 41.10 | A3 | 2,137,562 |
| | Refunding Series 2015, 0.000%, 8/01/42 | | | |
| | Santa Ana Financing Authority, California, Lease Revenue Bonds, Police Administration | | | |
| | and Housing Facility, Series 1994A: | | | |
| 4,630 | | 6.250%, 7/01/24 (ETM) | No Opt. Call | Baa2 (11) | 5,216,390 |
| 4,630 | | 6.250%, 7/01/24 | No Opt. Call | Baa2 | 5,231,946 |
| 3,500 | | Saugus Union School District, Los Angeles County, California, General Obligation Bonds, | No Opt. Call | A+ | 3,440,745 |
| | Series 2006, 0.000%, 8/01/23 – FGIC Insured | | | |
| 610 | | Temecula Public Financing Authority, California, Special Tax Bonds, Community Facilities | 9/27 at 100.00 | N/R | 648,448 |
| | District 16-01, Series 2017, 6.250%, 9/01/47, 144A | | | |
| | Tobacco Securitization Authority of Northern California, Tobacco Settlement Asset-Backed | | | |
| | Bonds, Series 2005A-1: | | | |
| 725 | | 4.750%, 6/01/23 | 11/20 at 100.00 | BBB | 726,008 |
| 1,600 | | 5.500%, 6/01/45 | 11/20 at 100.00 | B– | 1,607,984 |
| 524,737 | | Total California | | | 510,539,522 |
33
| | |
| NVG | Nuveen AMT-Free Municipal Credit Income Fund Portfolio of Investments (continued) October 31, 2020 |
| | | | | | |
| Principal | | | Optional Call | | |
| Amount (000) | | Description (1) | Provisions (2) | Ratings (3) | Value |
| | Colorado – 10.4% (6.6% of Total Investments) | | | |
| $ 850 | | Aviation Station North Metropolitan District 2, Denver County, Colorado, Limited Tax | 9/24 at 103.00 | N/R | $ 872,678 |
| | General Obligation Bonds, Refunding & Improvement Series 2019A, 5.000%, 12/01/39 | | | |
| | Base Village Metropolitan District 2, Colorado, General Obligation Bonds, Refunding | | | |
| | Series 2016A: | | | |
| 890 | | 5.500%, 12/01/36 | 12/21 at 103.00 | N/R | 922,788 |
| 1,175 | | 5.750%, 12/01/46 | 12/21 at 103.00 | N/R | 1,215,843 |
| 1,100 | | Belleview Station Metropolitan District 2, Denver City and County, Colorado, General | 12/21 at 103.00 | N/R | 1,119,690 |
| | Obligation Bonds, Limited Tax Convertible to Unlimited Tax Refunding & Improvement Series | | | |
| | 2017, 5.000%, 12/01/36 | | | |
| 700 | | Brighton Crossing Metropolitan District 4, Colorado, General Obligation Bonds, Limited | 12/22 at 103.00 | N/R | 717,619 |
| | Tax Convertible to Unlimited Tax, Series 2017A, 5.000%, 12/01/47 | | | |
| 3,410 | | Canyons Metropolitan District 5, Douglas County, Colorado, Limited Tax General Obligation | 12/22 at 103.00 | N/R | 3,561,370 |
| | and Special Revenue Bonds, Refunding & Improvement Series 2017A, 6.125%, 12/01/47 | | | |
| 1,690 | | Canyons Metropolitan District 6, Douglas County, Colorado, Limited Tax General Obligation | 12/22 at 103.00 | N/R | 1,765,019 |
| | and Special Revenue Bonds, Refunding & Improvement Series 2017A, 6.125%, 12/01/47 | | | |
| | Centerra Metropolitan District 1, Loveland, Colorado, Special Revenue Bonds, Refunding & | | | |
| | Improvement Series 2017: | | | |
| 1,140 | | 5.000%, 12/01/37, 144A | 12/22 at 103.00 | N/R | 1,178,110 |
| 5,465 | | 5.000%, 12/01/47, 144A | 12/22 at 103.00 | N/R | 5,587,853 |
| 1,475 | | Centerra Metropolitan District 1, Loveland, Colorado, Special Revenue Bonds, Refunding & | 12/25 at 103.00 | N/R | 1,509,382 |
| | Improvement Series 2020A, 5.000%, 12/01/51 | | | |
| 195 | | Central Platte Valley Metropolitan District, Colorado, General Obligation Bonds, | 12/23 at 100.00 | BB | 202,116 |
| | Refunding Series 2014, 5.000%, 12/01/43 | | | |
| 1,200 | | Clear Creek Station Metropolitan District 2, Adams County, Colorado, Limited Tax General | 12/22 at 103.00 | N/R | 1,222,752 |
| | Obligation Refunding & Improvement Series 2017A, 5.000%, 12/01/47 | | | |
| 930 | | Colorado Educational and Cultural Facilities Authority, Charter School Revenue Bonds, | 8/26 at 100.00 | A+ | 956,598 |
| | Flagstaff Academy Project, Refunding Series 2016, 3.625%, 8/01/46 | | | |
| 1,165 | | Colorado Educational and Cultural Facilities Authority, Charter School Revenue Bonds, | 12/24 at 100.00 | A+ | 1,290,459 |
| | The Classical Academy Project, Refunding Series 2015A, 5.000%, 12/01/38 | | | |
| 3,675 | | Colorado Educational and Cultural Facilities Authority, Charter School Revenue Bonds, | 6/26 at 100.00 | A+ | 3,799,252 |
| | Vanguard School Project, Refunding & Improvement Series 2016, 3.750%, 6/15/47 | | | |
| 1,750 | | Colorado Educational and Cultural Facilities Authority, Charter School Revenue Bonds, | 6/26 at 100.00 | A+ | 1,770,002 |
| | Weld County School District 6 – Frontier Academy, Refunding & Improvement Series 2016, | | | |
| | 3.250%, 6/01/46 | | | |
| | Colorado Health Facilities Authority, Colorado, Health Facilities Revenue Bonds, The | | | |
| | Evangelical Lutheran Good Samaritan Society Project, Refunding Series 2017: | | | |
| 2,460 | | 5.000%, 6/01/42 (Pre-refunded 6/01/27) | 6/27 at 100.00 | N/R (11) | 3,157,066 |
| 23,470 | | 5.000%, 6/01/47 (Pre-refunded 6/01/27) | 6/27 at 100.00 | N/R (11) | 30,120,459 |
| 3,000 | | Colorado Health Facilities Authority, Colorado, Revenue Bonds, Catholic Health | 2/21 at 100.00 | BBB+ (11) | 3,034,710 |
| | Initiatives, Series 2011A, 5.000%, 2/01/41 (Pre-refunded 2/01/21) | | | |
| 11,520 | | Colorado Health Facilities Authority, Colorado, Revenue Bonds, Catholic Health | 1/23 at 100.00 | BBB+ (11) | 12,718,310 |
| | Initiatives, Series 2013A, 5.250%, 1/01/45 (Pre-refunded 1/01/23) | | | |
| 3,005 | | Colorado Health Facilities Authority, Colorado, Revenue Bonds, CommonSpirit Health, | 8/29 at 100.00 | BBB+ | 3,236,926 |
| | Series 2019A-2, 4.000%, 8/01/49 | | | |
| 3,320 | | Colorado Health Facilities Authority, Colorado, Revenue Bonds, CommonSpirit Health, | 8/29 at 100.00 | BBB+ | 3,576,238 |
| | Series 2019A-2, 4.000%, 8/01/49, (UB) (5) | | | |
| 4,900 | | Colorado Health Facilities Authority, Colorado, Revenue Bonds, Covenant Living | 12/27 at 103.00 | A– | 5,209,239 |
| | Communities & Services, Series 2020A, 4.000%, 12/01/50 | | | |
| | Colorado Health Facilities Authority, Colorado, Revenue Bonds, Covenant Retirement | | | |
| | Communities Inc, Refunding Series 2012B: | | | |
| 1,640 | | 5.000%, 12/01/22 (ETM) | No Opt. Call | A– (11) | 1,797,374 |
| 2,895 | | 5.000%, 12/01/23 (Pre-refunded 12/01/22) | 12/22 at 100.00 | A– (11) | 3,172,804 |
| 4,200 | | 5.000%, 12/01/24 (Pre-refunded 12/01/22) | 12/22 at 100.00 | A– (11) | 4,603,032 |
34
| | | | | | |
| Principal | | | Optional Call | | |
| Amount (000) | | Description (1) | Provisions (2) | Ratings (3) | Value |
| | Colorado (continued) | | | |
| | Colorado Health Facilities Authority, Colorado, Revenue Bonds, Evangelical Lutheran Good | | | |
| | Samaritan Society Project, Series 2013: | | | |
| $ 765 | | 5.500%, 6/01/33 (Pre-refunded 6/01/23) | 6/23 at 100.00 | N/R (11) | $ 866,860 |
| 1,575 | | 5.625%, 6/01/43 (Pre-refunded 6/01/23) | 6/23 at 100.00 | N/R (11) | 1,789,751 |
| | Colorado Health Facilities Authority, Colorado, Revenue Bonds, Evangelical Lutheran Good | | | |
| | Samaritan Society Project, Series 2013A: | | | |
| 1,410 | | 5.000%, 6/01/32 (Pre-refunded 6/01/25) | 6/25 at 100.00 | N/R (11) | 1,706,777 |
| 2,000 | | 5.000%, 6/01/33 (Pre-refunded 6/01/25) | 6/25 at 100.00 | N/R (11) | 2,420,960 |
| 5,855 | | 5.000%, 6/01/40 (Pre-refunded 6/01/25) | 6/25 at 100.00 | N/R (11) | 7,087,360 |
| 6,820 | | 5.000%, 6/01/45 (Pre-refunded 6/01/25) | 6/25 at 100.00 | N/R (11) | 8,255,474 |
| 2,035 | | Colorado Health Facilities Authority, Colorado, Revenue Bonds, Frasier Meadows Project, | 5/27 at 100.00 | N/R | 2,316,440 |
| | Refunding & Improvement Series 2017A, 5.250%, 5/15/47 | | | |
| 4,105 | | Colorado International Center Metropolitan District 14, Denver, Colorado, Limited Tax | 12/23 at 103.00 | N/R | 4,333,731 |
| | General Obligation Bonds, Refunding & Improvement Series 2018, 5.875%, 12/01/46 | | | |
| 500 | | Copperleaf Metropolitan District 2, Arapahoe County, Colorado, Limited Tax General | 12/20 at 103.00 | N/R | 517,135 |
| | Obligation Bonds, Refunding Convertible to Unlimited Tax Series 2015, 5.750%, 12/01/45 | | | |
| 500 | | Copperleaf Metropolitan District 2, Arapahoe County, Colorado, Limited Tax General | 12/20 at 103.00 | N/R | 516,940 |
| | Obligation Bonds, Series 2006, 5.250%, 12/01/30 | | | |
| 600 | | Copperleaf Metropolitan District 4, Arapahoe County, Colorado, Limited Tax General | 3/25 at 103.00 | N/R | 607,458 |
| | Obligation Bonds, Convertible to Unlimited Tax Series 2020A, 5.000%, 12/01/49 | | | |
| 1,480 | | Cornerstar Metropolitan District, Arapahoe County, Colorado, General Obligation Bonds, | 12/22 at 103.00 | N/R | 1,509,570 |
| | Limited Tax Convertible to Unlimited Tax, Refunding Series 2017A, 5.250%, 12/01/47 | | | |
| 1,275 | | Cornerstar Metropolitan District, Arapahoe County, Colorado, General Obligation Bonds, | 12/22 at 103.00 | N/R | 1,298,804 |
| | Limited Tax Convertible to Unlimited Tax, Refunding Series 2017B, 5.250%, 12/01/47 | | | |
| 500 | | Crystal Crossing Metropolitan District, Colorado, General Obligation Limited Tax Bonds, | 12/25 at 100.00 | N/R | 515,850 |
| | Refunding Series 2016, 5.250%, 12/01/40 | | | |
| 10,640 | | Denver City and County, Colorado, Airport System Revenue Bonds, Subordinate Lien Series | 11/23 at 100.00 | A | 11,595,791 |
| | 2013B, 5.000%, 11/15/43 | | | |
| 505 | | Denver Connection West Metropolitan District, City and County of Denver, Colorado, Limited | 12/22 at 103.00 | N/R | 519,529 |
| | Tax General Obligation Bonds, Convertible to Unlimited Tax Series 2017A, 5.375%, 8/01/47 | | | |
| | Denver Urban Renewal Authority, Colorado, Tax Increment Revenue Bonds, 9th and Colorado | | | |
| | Urban Redevelopment Area, Series 2018A: | | | |
| 1,005 | | 5.250%, 12/01/39, 144A | 12/23 at 103.00 | N/R | 1,033,894 |
| 2,310 | | 5.250%, 12/01/39, 144A | 12/23 at 103.00 | N/R | 2,376,412 |
| 11,700 | | E-470 Public Highway Authority, Colorado, Senior Revenue Bonds, Capital Appreciation | No Opt. Call | A | 6,773,598 |
| | Series 2010A, 0.000%, 9/01/41 | | | |
| | E-470 Public Highway Authority, Colorado, Senior Revenue Bonds, Series 1997B: | | | |
| 35,995 | | 0.000%, 9/01/23 – NPFG Insured | No Opt. Call | A | 35,276,900 |
| 6,525 | | 0.000%, 9/01/26 – NPFG Insured | No Opt. Call | A | 6,128,671 |
| | E-470 Public Highway Authority, Colorado, Senior Revenue Bonds, Series 2000B: | | | |
| 17,030 | | 0.000%, 9/01/25 – NPFG Insured | No Opt. Call | A | 16,326,491 |
| 9,915 | | 0.000%, 9/01/32 – NPFG Insured | No Opt. Call | A | 7,874,096 |
| 43,090 | | 0.000%, 9/01/33 – NPFG Insured | No Opt. Call | A | 33,138,364 |
| | E-470 Public Highway Authority, Colorado, Toll Revenue Bonds, Series 2004A: | | | |
| 20,000 | | 0.000%, 9/01/27 – NPFG Insured | No Opt. Call | A | 18,367,600 |
| 1,150 | | 0.000%, 9/01/28 – NPFG Insured | No Opt. Call | A | 1,028,537 |
| 7,000 | | 0.000%, 9/01/34 – NPFG Insured | No Opt. Call | A | 5,225,570 |
| 500 | | Erie Highlands Metropolitan District No 1 (In the Town of Erie), Weld County, Colorado, | 12/20 at 103.00 | N/R | 512,070 |
| | General Obligation Limited Tax Bonds, Series 2015A, 5.750%, 12/01/45 | | | |
| 500 | | Flatiron Meadows Metropolitan District, Boulder County, Colorado, General Obligation | 12/21 at 103.00 | N/R | 507,785 |
| | Limited Tax Bonds, Series 2016, 5.125%, 12/01/46 | | | |
| 590 | | Foothills Metropolitan District, Fort Collins, Colorado, Special Revenue Bonds, Series | 12/24 at 100.00 | N/R | 607,051 |
| | 2014, 6.000%, 12/01/38 | | | |
35
| | |
| NVG | Nuveen AMT-Free Municipal Credit Income Fund Portfolio of Investments (continued) October 31, 2020 |
| | | | | | |
| Principal | | | Optional Call | | |
| Amount (000) | | Description (1) | Provisions (2) | Ratings (3) | Value |
| | Colorado (continued) | | | |
| $ 825 | | Forest Trace Metropolitan District 3, Aurora City, Arapahoe County, Colorado, General | 12/21 at 103.00 | N/R (11) | $ 891,553 |
| | Obligation Bonds, Limited Tax Convertible to Unlimited Tax, Series 2016A, 5.000%, 12/01/46 | | | |
| | (Pre-refunded 12/01/21) | | | |
| 1,355 | | Great Western Park Metropolitan District 2, Broomfield City and County, Colorado, | 12/21 at 100.00 | N/R | 1,371,382 |
| | General Obligation Bonds, Series 2016A, 5.000%, 12/01/46 | | | |
| 750 | | Green Gables Metropolitan District No 1, Jefferson County, Colorado, General Obligation | 12/21 at 103.00 | N/R (11) | 784,223 |
| | Bonds, Series 2016A, 5.300%, 12/01/46 (Pre-refunded 12/01/21) | | | |
| 700 | | Harmony Technology Park Metropolitan District 2, Fort Collins, Colorado, General | 12/22 at 103.00 | N/R | 713,160 |
| | Obligation Bonds, Limited Tax Convertible to Unlimited Tax Series 2017, 5.000%, 9/01/47 | | | |
| 500 | | Iron Mountain Metropolitan District 2, Windsor, Weld County, Colorado, Limited Tax | 12/24 at 103.00 | N/R | 491,890 |
| | General Obligation Bonds, Refunding & Improvement Series 2019A, 5.000%, 12/01/39 | | | |
| 3,740 | | Jefferson Center Metropolitan District 1, Arvada, Jefferson County, Colorado, Revenue | 12/20 at 103.00 | N/R (11) | 3,867,422 |
| | Bonds, Refunding Series 2015, 5.500%, 12/01/45 (Pre-refunded 12/01/20) | | | |
| | Johnstown Plaza Metropolitan District, Colorado, Special Revenue Bonds, Series 2016A: | | | |
| 2,325 | | 5.250%, 12/01/36 | 12/21 at 103.00 | N/R | 2,372,732 |
| 8,955 | | 5.375%, 12/01/46 | 12/21 at 103.00 | N/R | 9,120,041 |
| | Lambertson Farms Metropolitan District 1, Colorado, Revenue Bonds, Refunding & | | | |
| | Improvement Series 2015: | | | |
| 1,005 | | 5.750%, 12/15/46 | 12/23 at 100.00 | N/R | 789,498 |
| 5,355 | | 6.000%, 12/15/50 | 12/23 at 100.00 | N/R | 4,211,547 |
| 980 | | Leyden Rock Metropolitan District No 10, In the City of Arvada, Colorado, Limited Tax | 12/21 at 103.00 | N/R | 1,006,166 |
| | General Obligation Bonds, Refunding and Improvement Series 20016A, 5.000%, 12/01/45 | | | |
| 500 | | Littleton Village Metropolitan District No 2, Colorado, Limited Tax General Obligation | 12/20 at 103.00 | N/R | 509,915 |
| | and Special Revenue Bonds, Series 2015, 5.375%, 12/01/45 | | | |
| 860 | | Mountain Shadows Metropolitan District, Colorado, General Obligation Limited Tax Bonds, | 12/25 at 100.00 | N/R | 889,541 |
| | Refunding Series 2016, 5.000%, 12/01/35 | | | |
| 5,155 | | North Range Metropolitan District 1, Adams County, Colorado, General Obligation Bonds, | 12/25 at 100.00 | A2 | 5,361,870 |
| | Series 2016B, 3.500%, 12/01/45 | | | |
| | North Range Metropolitan District No 2 , In the City of Commerce City, Adams County, | | | |
| | Colorado , Limited Tax General Obligation and Special Revenue and Improvement Bonds, | | | |
| | Refunding Series 2017A: | | | |
| 1,000 | | 5.625%, 12/01/37 | 12/22 at 103.00 | N/R | 1,046,160 |
| 1,000 | | 5.750%, 12/01/47 | 12/22 at 103.00 | N/R | 1,041,120 |
| 585 | | Overlook Metropolitan District in the Town of Parker, Douglas County, Colorado, General | 12/21 at 103.00 | N/R | 597,367 |
| | Obligation Limited Tax Bonds, Series 2016A, 5.500%, 12/01/46 | | | |
| | Painted Prairie Public Improvement Authority, Aurora, Colorado, Special Revenue Bonds, | | | |
| | Series 2019: | | | |
| 3,380 | | 5.000%, 12/01/39 | 12/24 at 103.00 | N/R | 3,563,027 |
| 6,900 | | 5.000%, 12/01/49 | 12/24 at 103.00 | N/R | 7,178,967 |
| | Park 70 Metropolitan District, Aurora, Colorado, General Obligation Bonds, Limited Tax | | | |
| | Refunding & Improvement Series 2016: | | | |
| 660 | | 5.000%, 12/01/36 | 12/26 at 100.00 | Baa3 | 742,738 |
| 1,060 | | 5.000%, 12/01/46 | 12/26 at 100.00 | Baa3 | 1,178,116 |
| 660 | | Park Creek Metropolitan District, Colorado, Senior Limited Property Tax Supported | 12/25 at 100.00 | A | 756,862 |
| | Revenue Bonds, Refunding Series 2015A, 5.000%, 12/01/45 | | | |
| 880 | | Park Creek Metropolitan District, Colorado, Senior Limited Property Tax Supported Revenue | 12/20 at 100.00 | A2 (11) | 884,039 |
| | Refunding Bonds, Series 2011, 6.125%, 12/01/41 (Pre-refunded 12/01/20) – AGM Insured | | | |
| 5,435 | | Poudre Tech Metro District, Colorado, Unlimited Property Tax Supported Revenue Bonds, | 12/20 at 100.00 | AA | 5,455,273 |
| | Refunding & Improvement Series 2010A, 5.000%, 12/01/39 – AGM Insured | | | |
| 2,760 | | Prairie Center Metropolitan District No 3, In the City of Brighton, Adams County, | 12/26 at 100.00 | N/R | 2,819,616 |
| | Colorado, Limited Property Tax Supported Primary Improvements Revenue Bonds, Refunding | | | |
| | Series 2017A, 5.000%, 12/15/41, 144A | | | |
36
| | | | | | |
| Principal | | | Optional Call | | |
| Amount (000) | | Description (1) | Provisions (2) | Ratings (3) | Value |
| | Colorado (continued) | | | |
| | Reata South Metropolitan District, Douglas County, Colorado, Limited Tax General | | | |
| | Obligation Bonds, Refunding Series 2018: | | | |
| $ 1,310 | | 5.375%, 12/01/37 | 12/23 at 103.00 | N/R | $ 1,361,719 |
| 2,765 | | 5.500%, 12/01/47 | 12/23 at 103.00 | N/R | 2,858,512 |
| | Regional Transportation District, Colorado, Denver Transit Partners Eagle P3 Project | | | |
| | Private Activity Bonds, Series 2010: | | | |
| 6,500 | | 6.500%, 1/15/30 | 11/20 at 100.00 | Baa3 | 6,514,105 |
| 3,750 | | 6.000%, 1/15/41 | 11/20 at 100.00 | Baa3 | 3,756,750 |
| 1,280 | | Sierra Ridge Metropolitan District 2, Douglas County, Colorado, General Obligation | 12/21 at 103.00 | N/R | 1,320,166 |
| | Bonds, Limited Tax Series 2016A, 5.500%, 12/01/46 | | | |
| 930 | | SouthGlenn Metropolitan District, Colorado, Special Revenue Bonds, Refunding Series | 12/21 at 103.00 | N/R | 942,964 |
| | 2016, 5.000%, 12/01/46 | | | |
| 1,000 | | St Vrain Lakes Metropolitan District No 2, Weld County, Colorado, Limited Tax General | 12/22 at 103.00 | N/R | 1,025,220 |
| | Obligation Bonds, Series 2017A, 5.000%, 12/01/37 | | | |
| | STC Metropolitan District 2, Superior, Boulder County, Colorado, Limited Tax General | | | |
| | Obligation and Special Revenue Bonds, Refunding & improvement Series 2019A: | | | |
| 1,000 | | 5.000%, 12/01/38 | 12/24 at 103.00 | N/R | 1,026,300 |
| 570 | | 5.000%, 12/01/49 | 12/24 at 103.00 | N/R | 578,094 |
| | Sterling Ranch Community Authority Board, Douglas County, Colorado, Limited Tax | | | |
| | Supported Revenue Bonds, Senior Series 2015A: | | | |
| 500 | | 5.500%, 12/01/35 | 12/20 at 103.00 | N/R | 517,035 |
| 1,000 | | 5.750%, 12/01/45 | 12/20 at 103.00 | N/R | 1,034,270 |
| 765 | | Sterling Ranch Community Authority Board, Douglas County, Colorado, Supported Revenue | 12/25 at 102.00 | N/R | 785,196 |
| | Bonds, Limited Tax Refunding Improvement Senior Series 2020A, 4.250%, 12/01/50 (WI/DD, | | | |
| | Settling 11/05/20) | | | |
| 500 | | Table Mountain Metropolitan District, Jefferson County, Colorado, Limited Tax General | 12/21 at 103.00 | N/R | 512,265 |
| | Obligation Bonds, Series 2016A, 5.250%, 12/01/45 | | | |
| 500 | | The Village at Dry Creek Metropolitan District No 2, In the City of Thornton, Adams | 9/24 at 103.00 | N/R | 480,890 |
| | County, Colorado, Limited Tax General Obligation and Special Revenue Bonds, Series 2019, | | | |
| | 4.375%, 12/01/44 | | | |
| 8,500 | | University of Colorado Hospital Authority, Colorado, Revenue Bonds, Series 2012A, | 11/22 at 100.00 | Aa3 | 9,056,410 |
| | 5.000%, 11/15/42 | | | |
| 3,410 | | Vauxmont Metropolitan District, Arvada, Colorado, Limited Tax General Obligation and | 12/29 at 100.00 | AA | 4,120,542 |
| | Special Revenue Bonds, Convertible to Unlimited Tax Refunding Subordinate Series 2020, | | | |
| | 5.000%, 12/01/50 – AGM Insured | | | |
| 376,700 | | Total Colorado | | | 372,887,821 |
| | Connecticut – 6.6% (4.2% of Total Investments) | | | |
| | Bridgeport, Connecticut, General Obligation Bonds, Series 2014A: | | | |
| 2,345 | | 5.000%, 7/01/32 – AGM Insured | 7/24 at 100.00 | A2 | 2,621,757 |
| 1,600 | | 5.000%, 7/01/34 – AGM Insured | 7/24 at 100.00 | A2 | 1,781,792 |
| 2,800 | | Bridgeport, Connecticut, General Obligation Bonds, Series 2016D, 5.000%, 8/15/41 – | 8/26 at 100.00 | A2 | 3,241,476 |
| | AGM Insured | | | |
| | Bridgeport, Connecticut, General Obligation Bonds, Series 2017A: | | | |
| 1,470 | | 5.000%, 11/01/36 | 11/27 at 100.00 | Baa1 | 1,694,072 |
| 750 | | 5.000%, 11/01/37 | 11/27 at 100.00 | Baa1 | 862,035 |
| 5,500 | | Connecticut Health and Educational Facilities Authority Revenue Bonds, Hartford | 7/25 at 100.00 | A | 6,246,790 |
| | HealthCare, Series 2015F, 5.000%, 7/01/45 | | | |
| 4,250 | | Connecticut Health and Educational Facilities Authority, Revenue Bonds, Connecticut | 7/26 at 100.00 | A2 | 4,555,107 |
| | College, Refunding Series 2016L-1, 4.000%, 7/01/46 | | | |
| 1,150 | | Connecticut Health and Educational Facilities Authority, Revenue Bonds, Connecticut | 7/21 at 100.00 | A2 (11) | 1,186,214 |
| | College, Series 2011H, 5.000%, 7/01/41 (Pre-refunded 7/01/21) | | | |
| 1,100 | | Connecticut Health and Educational Facilities Authority, Revenue Bonds, Duncaster, Inc, | 8/24 at 100.00 | BBB | 1,142,493 |
| | Series 2014A, 5.000%, 8/01/44 | | | |
37
| | |
| NVG | Nuveen AMT-Free Municipal Credit Income Fund Portfolio of Investments (continued) October 31, 2020 |
| | | | | | |
| Principal | | | Optional Call | | |
| Amount (000) | | Description (1) | Provisions (2) | Ratings (3) | Value |
| | Connecticut (continued) | | | |
| $ 5,565 | | Connecticut Health and Educational Facilities Authority, Revenue Bonds, Fairfield | 7/26 at 100.00 | A– | $ 6,258,566 |
| | University, Series 2016Q-1, 5.000%, 7/01/46 | | | |
| 7,025 | | Connecticut Health and Educational Facilities Authority, Revenue Bonds, Hartford | 7/21 at 100.00 | A (11) | 7,241,440 |
| | HealthCare, Series 2011A, 5.000%, 7/01/41 (Pre-refunded 7/01/21) | | | |
| 500 | | Connecticut Health and Educational Facilities Authority, Revenue Bonds, Hartford | 7/24 at 100.00 | A | 556,700 |
| | HealthCare, Series 2014E, 5.000%, 7/01/42 | | | |
| | Connecticut Health and Educational Facilities Authority, Revenue Bonds, Healthcare | | | |
| | Facility Expansion Church Home of Hartford Inc Project, Series 2016A: | | | |
| 590 | | 5.000%, 9/01/46, 144A | 9/26 at 100.00 | BB | 604,632 |
| 740 | | 5.000%, 9/01/53, 144A | 9/26 at 100.00 | BB | 753,801 |
| 3,000 | | Connecticut Health and Educational Facilities Authority, Revenue Bonds, Mary Wade Home | 10/24 at 104.00 | BB | 3,005,700 |
| | Issue, Series 2019A-1, 5.000%, 10/01/54, 144A | | | |
| | Connecticut Health and Educational Facilities Authority, Revenue Bonds, Middlesex | | | |
| | Hospital, Series 2011N: | | | |
| 1,105 | | 5.000%, 7/01/25 (Pre-refunded 7/01/21) | 7/21 at 100.00 | A3 (11) | 1,139,796 |
| 400 | | 5.000%, 7/01/26 (Pre-refunded 7/01/21) | 7/21 at 100.00 | A3 (11) | 412,596 |
| 500 | | 5.000%, 7/01/27 (Pre-refunded 7/01/21) | 7/21 at 100.00 | A3 (11) | 515,745 |
| 1,915 | | Connecticut Health and Educational Facilities Authority, Revenue Bonds, Middlesex | 7/25 at 100.00 | A3 | 2,141,908 |
| | Hospital, Series 2015O, 5.000%, 7/01/36 | | | |
| 1,125 | | Connecticut Health and Educational Facilities Authority, Revenue Bonds, Norwich Free | 7/23 at 100.00 | A | 1,182,105 |
| | Academy, Series 2013B, 4.000%, 7/01/34 | | | |
| | Connecticut Health and Educational Facilities Authority, Revenue Bonds, Nuvance Health | | | |
| | Series 2019A: | | | |
| 1,000 | | 4.000%, 7/01/41 | 7/29 at 100.00 | Baa2 | 1,075,490 |
| 1,370 | | 4.000%, 7/01/49 | 7/29 at 100.00 | Baa2 | 1,451,364 |
| | Connecticut Health and Educational Facilities Authority, Revenue Bonds, Quinnipiac | | | |
| | University, Refunding Series 2015L: | | | |
| 10,105 | | 4.125%, 7/01/41 | 7/25 at 100.00 | A– | 10,821,444 |
| 7,030 | | 5.000%, 7/01/45 | 7/25 at 100.00 | A– | 7,831,701 |
| | Connecticut Health and Educational Facilities Authority, Revenue Bonds, Quinnipiac | | | |
| | University, Series 2016M: | | | |
| 500 | | 5.000%, 7/01/34 | 7/26 at 100.00 | A– | 580,475 |
| 1,250 | | 5.000%, 7/01/36 | 7/26 at 100.00 | A– | 1,443,675 |
| 250 | | Connecticut Health and Educational Facilities Authority, Revenue Bonds, Sacred Heart | 7/21 at 100.00 | A3 (11) | 258,080 |
| | University, Series 2011G, 5.125%, 7/01/26 (Pre-refunded 7/01/21) | | | |
| 6,145 | | Connecticut Health and Educational Facilities Authority, Revenue Bonds, Sacred Heart | 7/27 at 100.00 | A3 | 7,145,160 |
| | University, Series 2017I-1, 5.000%, 7/01/42 | | | |
| 1,275 | | Connecticut Health and Educational Facilities Authority, Revenue Bonds, Stamford | 7/21 at 100.00 | BBB+ | 1,301,699 |
| | Hospital, Series 2010-I, 5.000%, 7/01/30 | | | |
| | Connecticut Health and Educational Facilities Authority, Revenue Bonds, Stamford | | | |
| | Hospital, Series 2012J: | | | |
| 1,000 | | 5.000%, 7/01/37 | 7/22 at 100.00 | BBB+ | 1,041,530 |
| 8,055 | | 5.000%, 7/01/42 | 7/22 at 100.00 | BBB+ | 8,360,929 |
| 4,000 | | Connecticut Health and Educational Facilities Authority, Revenue Bonds, Stamford | 7/26 at 100.00 | BBB+ | 4,201,080 |
| | Hospital, Series 2016K, 4.000%, 7/01/46 | | | |
| | Connecticut Health and Educational Facilities Authority, Revenue Bonds, The Loomis | | | |
| | Chaffee School Issue, Series 2011-I: | | | |
| 560 | | 5.000%, 7/01/23 (Pre-refunded 7/01/21) – AGM Insured | 7/21 at 100.00 | A1 (11) | 577,634 |
| 225 | | 5.000%, 7/01/24 (Pre-refunded 7/01/21) – AGM Insured | 7/21 at 100.00 | A1 (11) | 232,085 |
| | Connecticut Health and Educational Facilities Authority, Revenue Bonds, Trinity Health | | | |
| | Credit Group, Series 2016CT: | | | |
| 2,650 | | 5.000%, 12/01/41 | 6/26 at 100.00 | AA– | 3,083,858 |
| 770 | | 5.000%, 12/01/45 | 6/26 at 100.00 | AA– | 890,028 |
38
| | | | | | |
| Principal | | | Optional Call | | |
| Amount (000) | | Description (1) | Provisions (2) | Ratings (3) | Value |
| | Connecticut (continued) | | | |
| $ 2,250 | | Connecticut Health and Educational Facilities Authority, Revenue Bonds, University of | 7/28 at 100.00 | BBB | $ 2,391,773 |
| | New Haven, Series 2018K-1, 5.000%, 7/01/38 | | | |
| 4,000 | | Connecticut Health and Educational Facilities Authority, Revenue Bonds, Western | 7/21 at 100.00 | A– (11) | 4,127,320 |
| | Connecticut Health, Series 2011N, 5.000%, 7/01/29 (Pre-refunded 7/01/21) | | | |
| | Connecticut Health and Educational Facilities Authority, Revenue Bonds, Yale-New Haven | | | |
| | Health Issue, Series 2014E: | | | |
| 2,610 | | 5.000%, 7/01/32 | 7/24 at 100.00 | AA– | 2,938,860 |
| 2,740 | | 5.000%, 7/01/33 | 7/24 at 100.00 | AA– | 3,077,568 |
| 900 | | 5.000%, 7/01/34 | 7/24 at 100.00 | AA– | 1,009,395 |
| 5,580 | | Connecticut Health and Educational Facilities Authority, Revenue Bonds, Connecticut | 11/23 at 100.00 | A | 6,211,433 |
| | State University System, Series 2013N, 5.000%, 11/01/31 | | | |
| 1,185 | | Connecticut Housing Finance Authority, State Supported Special Obligation Bonds, | 11/20 at 100.00 | A | 1,188,875 |
| | Refunding Series 2010-16, 5.000%, 6/15/30 | | | |
| | Connecticut Municipal Electric Energy Cooperative, Power Supply System Revenue Bonds, | | | |
| | Tender Option Bond Trust 2016-XG0059: | | | |
| 1,295 | | 16.944%, 1/01/32, 144A (IF) (5) | 1/23 at 100.00 | AA– | 1,768,271 |
| 410 | | 16.787%, 1/01/38, 144A (IF) (5) | 1/23 at 100.00 | AA– | 545,628 |
| 1,000 | | Connecticut State, General Obligation Bonds, Series 2011D, 5.000%, 11/01/31 | 11/21 at 100.00 | A | 1,039,380 |
| 3,500 | | Connecticut State, General Obligation Bonds, Series 2014F, 5.000%, 11/15/34 | 11/24 at 100.00 | A | 3,993,430 |
| 2,630 | | Connecticut State, General Obligation Bonds, Series 2015F, 5.000%, 11/15/34 | 11/25 at 100.00 | A | 3,088,146 |
| 3,730 | | Connecticut State, General Obligation Bonds, Series 2017A, 5.000%, 4/15/35 | 4/27 at 100.00 | A | 4,500,058 |
| | Connecticut State, General Obligation Bonds, Series 2018A: | | | |
| 3,500 | | 5.000%, 4/15/35 (UB) (5) | 4/28 at 100.00 | A | 4,273,115 |
| 5,000 | | 5.000%, 4/15/38 (UB) (5) | 4/28 at 100.00 | A | 6,046,500 |
| 3,855 | | Connecticut State, Special Tax Obligation Bonds, Transportation Infrastructure Purposes | 10/23 at 100.00 | A+ | 4,294,586 |
| | Series 2013A, 5.000%, 10/01/33 | | | |
| 1,380 | | Connecticut State, Special Tax Obligation Bonds, Transportation Infrastructure Purposes | 8/25 at 100.00 | A+ | 1,627,337 |
| | Series 2015A, 5.000%, 8/01/33 | | | |
| | Connecticut State, Special Tax Obligation Bonds, Transportation Infrastructure Purposes | | | |
| | Series 2016A: | | | |
| 5,300 | | 5.000%, 9/01/33 | 9/26 at 100.00 | A+ | 6,374,628 |
| 1,075 | | 5.000%, 9/01/34 | 9/26 at 100.00 | A+ | 1,290,957 |
| 3,500 | | Connecticut State, Special Tax Obligation Bonds, Transportation Infrastructure Purposes, | 9/24 at 100.00 | A+ | 4,025,280 |
| | Series 2014A, 5.000%, 9/01/33 | | | |
| | Connecticut Transmission Municipal Electric Energy Cooperative, Transmission System | | | |
| | Revenue Bonds, Series 2012A: | | | |
| 655 | | 5.000%, 1/01/31 | 1/22 at 100.00 | Aa3 | 688,503 |
| 500 | | 5.000%, 1/01/32 | 1/22 at 100.00 | Aa3 | 525,215 |
| 2,830 | | 5.000%, 1/01/42 | 1/22 at 100.00 | Aa3 | 2,956,501 |
| | Greater New Haven Water Pollution Control Authority, Connecticut, Regional Wastewater | | | |
| | System Revenue Bonds, Refunding Series 2014B: | | | |
| 500 | | 5.000%, 8/15/30 (Pre-refunded 8/15/24) | 8/24 at 100.00 | A1 (11) | 588,340 |
| 1,000 | | 5.000%, 8/15/31 (Pre-refunded 8/15/24) | 8/24 at 100.00 | A1 (11) | 1,176,680 |
| 55 | | Greater New Haven Water Pollution Control Authority, Connecticut, Regional Wastewater | 11/20 at 100.00 | A1 | 55,197 |
| | System Revenue Bonds, Series 2005A, 5.000%, 8/15/35 – NPFG Insured | | | |
| 225 | | Hamden, Connecticut, General Obligation Bonds, Series 2016, 5.000%, 8/15/32 – | 8/24 at 100.00 | AA | 251,975 |
| | BAM Insured | | | |
| 2,315 | | Harbor Point Infrastructure Improvement District, Connecticut, Special Obligation | 4/27 at 100.00 | N/R | 2,483,926 |
| | Revenue Bonds, Harbor Point Project, Refunding Series 2017, 5.000%, 4/01/39, 144A | | | |
| 10,015 | | Hartford County Metropolitan District, Connecticut, Clean Water Project Revenue Bonds, | 11/24 at 100.00 | AA– | 11,420,205 |
| | Refunding Green Bond Series 2014A, 5.000%, 11/01/42 | | | |
39
| | |
| NVG | Nuveen AMT-Free Municipal Credit Income Fund Portfolio of Investments (continued) October 31, 2020 |
| | | | | | |
| Principal | | | Optional Call | | |
| Amount (000) | | Description (1) | Provisions (2) | Ratings (3) | Value |
| | Connecticut (continued) | | | |
| | Hartford County Metropolitan District, Connecticut, Clean Water Project Revenue Bonds, | | | |
| | Series 2013A: | | | |
| $ 4,100 | | 5.000%, 4/01/36 (Pre-refunded 4/01/22) | 4/22 at 100.00 | AA– (11) | $ 4,375,356 |
| 2,500 | | 5.000%, 4/01/39 (Pre-refunded 4/01/22) | 4/22 at 100.00 | AA– (11) | 2,667,900 |
| 2,285 | | Hartford County Metropolitan District, Connecticut, General Obligation Bonds, Series | 7/28 at 100.00 | Aa3 | 2,809,225 |
| | 2018, 5.000%, 7/15/36 | | | |
| 870 | | Hartford, Connecticut, General Obligation Bonds, Series 2009A, 5.000%, 8/15/28 – | 11/20 at 100.00 | A2 | 872,697 |
| | AGC Insured | | | |
| | Milford, Connecticut, General Obligation Bonds, Series 2018: | | | |
| 1,055 | | 4.000%, 11/01/36 | 11/24 at 100.00 | AA+ | 1,161,101 |
| 1,055 | | 4.000%, 11/01/37 | 11/24 at 100.00 | AA+ | 1,159,192 |
| 1,550 | | New Haven, Connecticut, General Obligation Bonds, Refunding Series 2016A, 5.000%, | 8/26 at 100.00 | BBB | 1,813,733 |
| | 8/15/35 – AGM Insured | | | |
| 985 | | New Haven, Connecticut, General Obligation Bonds, Series 2014A, 5.000%, 8/01/33 – | 8/24 at 100.00 | BBB | 1,098,915 |
| | AGM Insured | | | |
| | New Haven, Connecticut, General Obligation Bonds, Series 2015: | | | |
| 790 | | 5.000%, 9/01/32 – AGM Insured | 9/25 at 100.00 | BBB | 910,491 |
| 1,620 | | 5.000%, 9/01/33 – AGM Insured | 9/25 at 100.00 | BBB | 1,861,412 |
| 500 | | 5.000%, 9/01/35 – AGM Insured | 9/25 at 100.00 | BBB | 572,515 |
| | New Haven, Connecticut, General Obligation Bonds, Series 2017A: | | | |
| 1,000 | | 5.000%, 8/01/35 | 8/27 at 100.00 | BBB | 1,125,630 |
| 1,425 | | 5.000%, 8/01/36 | 8/27 at 100.00 | BBB | 1,598,864 |
| 900 | | North Haven, Connecticut, General Obligation Bonds, Series 2006, 5.000%, 7/15/24 | No Opt. Call | Aa1 | 1,056,213 |
| 795 | | South Central Connecticut Regional Water Authority Water System Revenue Bonds, Thirtieth | 8/24 at 100.00 | AA– (11) | 934,022 |
| | Series 2014A, 5.000%, 8/01/44 (Pre-refunded 8/01/24) | | | |
| | South Central Connecticut Regional Water Authority, Water System Revenue Bonds, | | | |
| | Refunding Thirty-Second Series 2016B: | | | |
| 2,715 | | 4.000%, 8/01/36 | 8/26 at 100.00 | AA– | 3,017,831 |
| 2,220 | | 5.000%, 8/01/37 | 8/26 at 100.00 | AA– | 2,668,573 |
| 3,870 | | South Central Connecticut Regional Water Authority, Water System Revenue Bonds, | 8/21 at 100.00 | AA– (11) | 4,008,391 |
| | Twentieth-Sixth Series, 2011, 5.000%, 8/01/41 (Pre-refunded 8/01/21) | | | |
| 3,250 | | South Central Connecticut Regional Water Authority, Water System Revenue Bonds, | 8/22 at 100.00 | AA– (11) | 3,519,132 |
| | Twenty-Seventh Series 2012, 5.000%, 8/01/33 (Pre-refunded 8/01/22) | | | |
| 1,725 | | Stamford, Connecticut, Special Obligation Revenue Bonds, Mill River Corridor Project, | 4/21 at 100.00 | N/R (11) | 1,772,524 |
| | Series 2011aA, 7.000%, 4/01/41 (Pre-refunded 4/01/21) | | | |
| 500 | | Stamford, Connecticut, Water Pollution Control System and Facility Revenue Bonds, Series | 8/23 at 100.00 | Aa2 | 561,950 |
| | 2013A, 5.250%, 8/15/43 | | | |
| | Stamford, Connecticut, Water Pollution Control System and Facility Revenue Bonds, | | | |
| | Series 2019: | | | |
| 200 | | 4.000%, 4/01/37 | 4/29 at 100.00 | AA+ | 234,016 |
| 250 | | 4.000%, 4/01/38 | 4/29 at 100.00 | AA+ | 291,388 |
| 600 | | Stratford, Connecticut, General Obligation Bonds, Series 2014, 5.000%, 12/15/32 | 12/22 at 100.00 | A2 | 653,994 |
| 1,500 | | Stratford, Connecticut, General Obligation Bonds, Series 2017, 4.000%, 1/01/39 – | 1/27 at 100.00 | A2 | 1,675,290 |
| | BAM Insured | | | |
| 1,000 | | Town of Hamden, Connecticut, General Obligation Bonds, Refunding Series 2018A, 5.000%, | 8/28 at 100.00 | BBB | 1,222,860 |
| | 8/15/30 – BAM Insured | | | |
| 2,500 | | University of Connecticut, General Obligation Bonds, Series 2013A, 5.000%, 8/15/32 | 8/23 at 100.00 | A | 2,757,525 |
| 760 | | University of Connecticut, General Obligation Bonds, Series 2014A, 5.000%, 2/15/31 | 2/24 at 100.00 | A | 848,890 |
| 2,250 | | University of Connecticut, General Obligation Bonds, Series 2015A, 5.000%, 3/15/31 | 3/26 at 100.00 | A | 2,659,387 |
40
| | | | | | |
| Principal | | | Optional Call | | |
| Amount (000) | | Description (1) | Provisions (2) | Ratings (3) | Value |
| | Connecticut (continued) | | | |
| | Waterbury, Connecticut, General Obligation Bonds, Lot A Series 2015: | | | |
| $ 445 | | 5.000%, 8/01/30 – BAM Insured | 8/25 at 100.00 | AA– | $ 531,357 |
| 390 | | 5.000%, 8/01/31 – BAM Insured | 8/25 at 100.00 | AA– | 464,478 |
| 610 | | 5.000%, 8/01/32 – BAM Insured | 8/25 at 100.00 | AA– | 723,680 |
| 445 | | 5.000%, 8/01/33 – BAM Insured | 8/25 at 100.00 | AA– | 526,342 |
| 445 | | 5.000%, 8/01/34 – BAM Insured | 8/25 at 100.00 | AA– | 525,211 |
| 210,255 | | Total Connecticut | | | 234,080,124 |
| | Delaware – 0.2% (0.1% of Total Investments) | | | |
| 2,615 | | Delaware Economic Development Authority, Exempt Facility Revenue Bonds, Indian River | 11/20 at 100.00 | Baa2 | 2,621,459 |
| | Power LLC Project, Series 2010, 5.375%, 10/01/45 | | | |
| | Kent County, Delaware, Student Housing & Dining Facility Revenue Bonds, Collegiate | | | |
| | Housing Foundation – Dover LLC Delaware State University Project, Series 2018A: | | | |
| 2,585 | | 5.000%, 7/01/53 | 1/28 at 100.00 | BB+ | 2,449,649 |
| 1,000 | | 5.000%, 7/01/58 | 1/28 at 100.00 | BB+ | 937,330 |
| 6,200 | | Total Delaware | | | 6,008,438 |
| | District of Columbia – 1.3% (0.9% of Total Investments) | | | |
| 3,780 | | District of Columbia Student Dormitory Revenue Bonds, Provident Group – Howard | 10/22 at 100.00 | BB– | 3,501,490 |
| | Properties LLC Issue, Series 2013, 5.000%, 10/01/45 | | | |
| 3,990 | | District of Columbia Tobacco Settlement Corporation, Tobacco Settlement Asset-Backed | No Opt. Call | Baa1 | 4,373,798 |
| | Bonds, Series 2001, 6.500%, 5/15/33 | | | |
| 186,000 | | District of Columbia Tobacco Settlement Corporation, Tobacco Settlement Asset-Backed | 11/20 at 20.76 | N/R | 38,520,600 |
| | Bonds, Series 2006A, 0.000%, 6/15/46 | | | |
| 1,500 | | District of Columbia, Revenue Bonds, Ingleside at Rock Creek Project, Series 2017A, | 7/24 at 103.00 | N/R | 1,425,645 |
| | 5.000%, 7/01/42 | | | |
| 195,270 | | Total District of Columbia | | | 47,821,533 |
| | Florida – 4.7% (3.0% of Total Investments) | | | |
| 990 | | Bexley Community Development District, Pasco County, Florida, Special Assessment Revenue | 5/26 at 100.00 | N/R | 1,029,323 |
| | Bonds, Series 2016, 4.700%, 5/01/36 | | | |
| 1,000 | | Capital Trust Agency, Florida, Educational Facilities Lease Revenue Bonds, Franklin | 7/26 at 100.00 | N/R | 1,051,310 |
| | Academy Projects, Series 2020, 5.000%, 12/15/50, 144A | | | |
| | Capital Trust Agency, Florida, Revenue Bonds, Babcock Neighborhood School Inc, | | | |
| | Series 2018: | | | |
| 1,290 | | 6.100%, 8/15/38, 144A | 8/28 at 100.00 | N/R | 1,333,396 |
| 1,045 | | 6.200%, 8/15/48, 144A | 8/28 at 100.00 | N/R | 1,080,018 |
| | Capital Trust Agency, Florida, Revenue Bonds, Odyssey Charter School Project, | | | |
| | Series 2017A: | | | |
| 1,065 | | 5.375%, 7/01/37, 144A | 7/27 at 100.00 | Ba1 | 1,144,673 |
| 1,470 | | 5.500%, 7/01/47, 144A | 7/27 at 100.00 | Ba1 | 1,565,006 |
| 5,225 | | Capital Trust Agency, Florida, Revenue Bonds, Provision CARES Proton Therapy Center, | 6/28 at 100.00 | N/R | 1,985,500 |
| | Orlando Project, Series 2018, 7.500%, 6/01/48, 144A | | | |
| | Capital Trust Agency, Florida, Revenue Bonds, Renaissance Charter School Project, | | | |
| | Series 2017A: | | | |
| 6,050 | | 5.125%, 6/15/37, 144A | 6/27 at 100.00 | N/R | 6,478,037 |
| 1,885 | | 5.250%, 6/15/47, 144A | 6/27 at 100.00 | N/R | 2,008,656 |
| 880 | | Capital Trust Agency, Florida, Revenue Bonds, Viera Charter School Project, Series | 10/27 at 100.00 | Ba2 | 917,726 |
| | 2017A, 5.000%, 10/15/37, 144A | | | |
| 735 | | Capital Trust Agency, Florida, Revenue Bonds, Viera Charter School Project, Series | 10/27 at 100.00 | Ba2 | 752,743 |
| | 2019A, 5.000%, 10/15/49, 144A | | | |
| 4,670 | | City of Miami Beach, Florida, Stormwater Revenue Bonds, Series 2015, 5.000%, 9/01/41 | 9/25 at 100.00 | AA– | 5,517,745 |
| 1,025 | | Cityplace Community Development District, Florida, Special Assessment and Revenue | No Opt. Call | A | 1,171,770 |
| | Bonds, Refunding Series 2012, 5.000%, 5/01/26 | | | |
41
| | |
| NVG | Nuveen AMT-Free Municipal Credit Income Fund Portfolio of Investments (continued) October 31, 2020 |
| | | | | | |
| Principal | | | Optional Call | | |
| Amount (000) | | Description (1) | Provisions (2) | Ratings (3) | Value |
| | Florida (continued) | | | |
| $ 1,480 | | Collier County Educational Facilities Authority, Florida, Revenue Bonds, Hodges | 11/23 at 100.00 | BB+ | $ 1,539,111 |
| | University, Refunding Series 2013, 6.125%, 11/01/43 | | | |
| | Creekside at Twin Creeks Community Development District, Florida, Special Assessment | | | |
| | Bonds, Area 1 Project, Series 2016A-1: | | | |
| 240 | | 5.250%, 11/01/37 | 11/28 at 100.00 | N/R | 262,625 |
| 310 | | 5.600%, 11/01/46 | 11/28 at 100.00 | N/R | 342,789 |
| | Davie, Florida, Educational Facilities Revenue Bonds, Nova Southeastern University | | | |
| | Project, Series 2013A: | | | |
| 3,445 | | 6.000%, 4/01/42 (Pre-refunded 4/01/23) | 4/23 at 100.00 | Baa1 (11) | 3,911,901 |
| 1,720 | | 5.625%, 4/01/43 (Pre-refunded 4/01/23) | 4/23 at 100.00 | Baa1 (11) | 1,939,420 |
| 4,000 | | Davie, Florida, Water and Sewer Revenue Bonds, Series 2011, 5.000%, 10/01/41 | 10/21 at 100.00 | A1 (11) | 4,174,320 |
| | (Pre-refunded 10/01/21) – AGM Insured | | | |
| | Downtown Doral Community Development District, Florida, Special Assessment Bonds, | | | |
| | Series 2015: | | | |
| 280 | | 5.250%, 5/01/35 | 5/26 at 100.00 | N/R | 294,854 |
| 315 | | 5.300%, 5/01/36 | 5/26 at 100.00 | N/R | 331,686 |
| 475 | | 5.500%, 5/01/45 | 5/26 at 100.00 | N/R | 503,495 |
| 655 | | 5.500%, 5/01/46 | 5/26 at 100.00 | N/R | 693,953 |
| | Florida Development Finance Corporation, Educational Facilities Revenue Bonds, Classical | | | |
| | Preparatory Incorporated Project, Series 2017A: | | | |
| 255 | | 6.000%, 6/15/37, 144A | 6/26 at 100.00 | N/R | 267,847 |
| 665 | | 6.125%, 6/15/46, 144A | 6/26 at 100.00 | N/R | 694,253 |
| 415 | | Florida Development Finance Corporation, Educational Facilities Revenue Bonds, Classical | 6/26 at 100.00 | N/R | 435,908 |
| | Preparatory Incorporated Project, Series 2018A, 6.000%, 6/15/37, 144A | | | |
| | Florida Development Finance Corporation, Educational Facilities Revenue Bonds, Downtown | | | |
| | Doral Charter Upper School Project, Series 2017C: | | | |
| 2,375 | | 5.650%, 7/01/37, 144A | 7/27 at 101.00 | N/R | 2,562,957 |
| 3,735 | | 5.750%, 7/01/47, 144A | 7/27 at 101.00 | N/R | 3,982,145 |
| | Florida Development Finance Corporation, Educational Facilities Revenue Bonds, Florida | | | |
| | Charter Foundation Inc Projects, Series 2016A: | | | |
| 1,485 | | 6.250%, 6/15/36, 144A | 6/26 at 100.00 | N/R | 1,628,050 |
| 2,075 | | 4.750%, 7/15/36, 144A | 7/26 at 100.00 | N/R | 2,172,899 |
| 4,350 | | 6.375%, 6/15/46, 144A | 6/26 at 100.00 | N/R | 4,723,621 |
| 1,335 | | 5.000%, 7/15/46, 144A | 7/26 at 100.00 | N/R | 1,401,323 |
| | Florida Development Finance Corporation, Educational Facilities Revenue Bonds, Mater | | | |
| | Academy Projects, Series 2020A: | | | |
| 4,330 | | 5.000%, 6/15/50 | 6/27 at 100.00 | BBB | 4,804,308 |
| 3,405 | | 5.000%, 6/15/55 | 6/27 at 100.00 | BBB | 3,754,149 |
| | Florida Development Finance Corporation, Educational Facilities Revenue Bonds, | | | |
| | Renaissance Charter School Income Projects, Series 2015A: | | | |
| 3,090 | | 6.000%, 6/15/35, 144A | 6/25 at 100.00 | N/R | 3,448,625 |
| 3,450 | | 6.125%, 6/15/46, 144A | 6/25 at 100.00 | N/R | 3,810,042 |
| 550 | | Florida Development Finance Corporation, Educational Facilities Revenue Bonds, | 6/24 at 100.00 | N/R | 588,390 |
| | Renaissance Charter School, Inc Projects, Series 2014A, 6.125%, 6/15/44 | | | |
| 4,380 | | Florida Development Finance Corporation, Educational Facilities Revenue Bonds, Southwest | 6/27 at 100.00 | N/R | 4,534,702 |
| | Charter Foundation Inc Projects, Series 2017A, 6.125%, 6/15/47, 144A | | | |
| 1,435 | | Grand Bay at Doral Community Development District, Miami-Dade County, Florida, Special | 5/26 at 100.00 | N/R | 1,489,056 |
| | Assessment Bonds, South Parcel Assessment Area Project, Series 2016, 4.750%, 5/01/36 | | | |
| | Indian Trace Development District, Florida, Water Management Special Benefit Assessment | | | |
| | Bonds, Series 2005: | | | |
| 1,645 | | 5.000%, 5/01/25 – NPFG Insured | 12/20 at 100.00 | Baa2 | 1,649,261 |
| 1,830 | | 5.000%, 5/01/27 – NPFG Insured | 12/20 at 100.00 | Baa2 | 1,834,246 |
| 600 | | Jacksonville, Florida, Better Jacksonville Sales Tax Revenue Bonds, Refunding Series | 10/22 at 100.00 | A+ | 647,976 |
| | 2012, 5.000%, 10/01/30 | | | |
42
| | | | | | |
| Principal | | | Optional Call | | |
| Amount (000) | | Description (1) | Provisions (2) | Ratings (3) | Value |
| | Florida (continued) | | | |
| $ 2,215 | | Jacksonville, Florida, Educational Facilities Revenue Bonds, Jacksonville University | 6/28 at 100.00 | N/R | $ 2,193,802 |
| | Project, Series 2018B, 5.000%, 6/01/53, 144A | | | |
| 1,000 | | Lakeland, Florida, Hospital System Revenue Bonds, Lakeland Regional Health, Refunding | 11/21 at 100.00 | A2 | 1,041,620 |
| | Series 2011, 5.000%, 11/15/25 | | | |
| 625 | | Lakewood Ranch Stewardship District, Florida, Special Assessment Revenue Bonds, Del Webb | 5/27 at 100.00 | N/R | 669,663 |
| | Project, Series 2017, 5.000%, 5/01/37, 144A | | | |
| 4,125 | | Martin County Health Facilities Authority, Florida, Hospital Revenue Bonds, Martin | 11/24 at 100.00 | N/R (11) | 4,890,724 |
| | Memorial Medical Center, Series 2015, 5.000%, 11/15/45 (Pre-refunded 11/15/24) | | | |
| | Miami Dade County Industrial Development Authority, Florida, Educational Facilities | | | |
| | Revenue Bonds, South Florida Autism Charter School Project, Series 2017: | | | |
| 1,080 | | 5.875%, 7/01/37, 144A | 7/27 at 100.00 | N/R | 1,149,876 |
| 1,920 | | 6.000%, 7/01/47, 144A | 7/27 at 100.00 | N/R | 2,025,274 |
| 5,965 | | Miami Dade County, Florida, Rickenbacker Causeway Revenue Bonds, Series 2014, | 10/24 at 100.00 | BBB+ | 6,451,028 |
| | 5.000%, 10/01/43 | | | |
| 2,130 | | Miami Health Facilities Authority, Florida, Health Facilities Revenue Bonds, Miami | 7/27 at 100.00 | BB+ | 1,673,711 |
| | Jewish Health System Inc Project, Series 2017, 5.125%, 7/01/46 | | | |
| 1,545 | | Miami, Florida, Special Obligation Non-Ad Valorem Revenue Bonds, Refunding Series 2011A, | 2/21 at 100.00 | Aa3 (11) | 1,566,954 |
| | 6.000%, 2/01/31 (Pre-refunded 2/01/21) – AGM Insured | | | |
| 5,000 | | Miami-Dade County Expressway Authority, Florida, Toll System Revenue Bonds, Series | 7/24 at 100.00 | BBB+ | 5,498,950 |
| | 2014A, 5.000%, 7/01/44 | | | |
| 2,400 | | Miami-Dade County, Florida, Special Obligation Bonds, Refunding Subordinate Series | 10/22 at 100.00 | A2 | 2,582,544 |
| | 2012B, 5.000%, 10/01/37 | | | |
| 6,305 | | Miami-Dade County, Florida, Water and Sewer System Revenue Bonds, Series 2013A, 5.000%, | 10/22 at 100.00 | A+ (11) | 6,876,863 |
| | 10/01/42 (Pre-refunded 10/01/22) | | | |
| 4,785 | | Northern Palm Beach County Improvement District, Florida, Water Control and Improvement | 8/26 at 100.00 | N/R | 5,343,697 |
| | Bonds, Development Unit 53, Series 2015, 5.350%, 8/01/35 | | | |
| 4,270 | | Orange County Health Facilities Authority, Florida, Hospital Revenue Bonds, Orlando | 4/22 at 100.00 | A2 (11) | 4,550,496 |
| | Health, Inc, Series 2012A, 5.000%, 10/01/42 (Pre-refunded 4/01/22) | | | |
| | Osceola County, Florida, Transportation Revenue Bonds, Osceola Parkway, Refunding & | | | |
| | Improvement Series 2019A-1: | | | |
| 1,245 | | 5.000%, 10/01/44 | 10/29 at 100.00 | BBB– | 1,452,143 |
| 1,645 | | 5.000%, 10/01/49 | 10/29 at 100.00 | BBB– | 1,906,275 |
| 3,345 | | 4.000%, 10/01/54 | 10/29 at 100.00 | BBB– | 3,543,091 |
| 230 | | Palm Beach County Health Facilities Authority, Florida, Revenue Bonds, Sinai Residences | 6/22 at 102.00 | N/R | 250,875 |
| | of Boca Raton Project, Series 2014A, 7.250%, 6/01/34 | | | |
| 825 | | Reunion West Community Development District, Florida, Special Assessment Bonds, Area 3 | 11/26 at 100.00 | N/R | 870,309 |
| | Project, Series 2016, 5.000%, 11/01/46 | | | |
| | Six Mile Creek Community Development District, Florida, Capital Improvement Revenue | | | |
| | Bonds, Assessment Area 2, Series 2016: | | | |
| 225 | | 4.750%, 11/01/28 | 11/27 at 100.00 | N/R | 236,558 |
| 375 | | 5.375%, 11/01/36 | 11/27 at 100.00 | N/R | 402,169 |
| 920 | | South Fork III Community Development District, Florida, Special Assessment Revenue | 5/27 at 100.00 | N/R | 990,858 |
| | Bonds, Refunding Series 2016, 5.375%, 5/01/37 | | | |
| 1,200 | | St Lucie County, Florida, Utility System Revenue Refunding Bonds, Series 1993, 5.500%, | No Opt. Call | N/R (11) | 1,256,052 |
| | 10/01/21 – FGIC Insured (ETM) | | | |
| 4,100 | | Tampa, Florida, Health System Revenue Bonds, Baycare Health System, Series 2012A, | 5/22 at 100.00 | Aa2 | 4,325,705 |
| | 5.000%, 11/15/33 | | | |
| 760 | | Tampa, Florida, Healthcare System Revenue Bonds, Allegany Health System – St Joseph’s | 11/20 at 100.00 | N/R (11) | 797,118 |
| | Hospital, Series 1993, 5.125%, 12/01/23 – NPFG Insured (ETM) | | | |
| 1,735 | | Tampa, Florida, Revenue Bonds, H Lee Moffitt Cancer Center and Research Institute, | 7/30 at 100.00 | A– | 2,094,787 |
| | Series 2020B, 5.000%, 7/01/50 | | | |
| 10,095 | | Tampa-Hillsborough County Expressway Authority, Florida, Revenue Bonds, Refunding Series | 7/22 at 100.00 | A2 (11) | 10,882,309 |
| | 2012B, 5.000%, 7/01/42 (Pre-refunded 7/01/22) | | | |
43
| | |
| NVG | Nuveen AMT-Free Municipal Credit Income Fund Portfolio of Investments (continued) October 31, 2020 |
| | | | | | |
| Principal | | | Optional Call | | |
| Amount (000) | | Description (1) | Provisions (2) | Ratings (3) | Value |
| | Florida (continued) | | | |
| $ 2,000 | | Volusia County Educational Facilities Authority, Florida, Revenue Bonds, Embry-Riddle | 10/21 at 100.00 | A2 (11) | $ 2,088,900 |
| | Aeronautical University, Inc Project, Refunding Series 2011, 5.000%, 10/15/29 (Pre-refunded | | | |
| | 10/15/21) – AGM Insured | | | |
| 5,000 | | Volusia County Educational Facilities Authority, Florida, Revenue Bonds, Stetson | 6/25 at 100.00 | A– | 5,605,600 |
| | University Inc Project, Series 2015, 5.000%, 6/01/40 | | | |
| 158,720 | | Total Florida | | | 167,677,766 |
| | Georgia – 3.0% (1.9% of Total Investments) | | | |
| 5,715 | | Burke County Development Authority, Georgia, Pollution Control Revenue Bonds, Oglethorpe | 2/28 at 100.00 | BBB+ | 6,303,302 |
| | Power Corporation Vogtle Project, Series 2017C, 4.125%, 11/01/45 | | | |
| 11,255 | | Burke County Development Authority, Georgia, Pollution Control Revenue Bonds, Oglethorpe | 2/28 at 100.00 | BBB+ | 12,413,590 |
| | Power Corporation Vogtle Project, Series 2017D, 4.125%, 11/01/45 | | | |
| 2,000 | | Fairburn, Georgia, General Obligation Bonds, Series 2011, 5.750%, 12/01/31 (Pre-refunded | 12/21 at 100.00 | A2 (11) | 2,118,760 |
| | 12/01/21) – AGM Insured | | | |
| 10,000 | | Fulton County Development Authority, Georgia, Revenue Bonds, Piedmont Healthcare, Inc | 7/29 at 100.00 | A1 | 11,113,000 |
| | Project, Series 2019A, 4.000%, 7/01/49 | | | |
| 15,305 | | Gainesville and Hall County Hospital Authority, Georgia, Revenue Anticipation | 2/25 at 100.00 | AA– | 17,673,142 |
| | Certificates, Northeast Georgia Health Services Inc, Series 2014A, 5.500%, 8/15/54 | | | |
| | Georgia Housing and Finance Authority, Single Family Mortgage Bonds, Series 2018A: | | | |
| 4,515 | | 3.950%, 12/01/43 | 6/27 at 100.00 | AAA | 4,869,473 |
| 5,000 | | 4.000%, 12/01/48 | 6/27 at 100.00 | AAA | 5,339,400 |
| 1,300 | | Macon-Bibb County Urban Development Authority, Georgia, Revenue Bonds, Academy for | 6/27 at 100.00 | N/R | 1,349,088 |
| | Classical Education, Series 2017, 5.750%, 6/15/37, 144A | | | |
| 4,000 | | Marietta Development Authority, Georgia, University Facilities Revenue Bonds, Life | 11/27 at 100.00 | Ba3 | 4,101,960 |
| | University, Inc Project, Refunding Series 2017A, 5.000%, 11/01/47, 144A | | | |
| 10,825 | | Municipal Electric Authority of Georgia, Plant Vogtle Units 3 & 4 Project J Bonds, | 7/25 at 100.00 | Baa1 | 11,994,533 |
| | Series 2015A, 5.000%, 7/01/60 | | | |
| | Municipal Electric Authority of Georgia, Plant Vogtle Units 3 & 4 Project J Bonds, | | | |
| | Series 2019A: | | | |
| 8,680 | | 5.000%, 1/01/49 | 7/28 at 100.00 | Baa1 | 10,249,517 |
| 4,000 | | 5.000%, 1/01/59 | 7/28 at 100.00 | Baa1 | 4,669,640 |
| 1,000 | | Private Colleges and Universities Authority, Georgia, Revenue Bonds, Mercer University, | 10/22 at 100.00 | Baa1 | 1,055,590 |
| | Refunding Series 2012C, 5.250%, 10/01/27 | | | |
| 10,090 | | Private Colleges and Universities Authority, Georgia, Revenue Bonds, Mercer University, | 10/25 at 100.00 | Baa1 | 10,848,768 |
| | Series 2015, 5.000%, 10/01/40 | | | |
| 1,710 | | Valdosta and Lowndes County Hospital Authority, Georgia, Revenue Certificates, South | 10/21 at 100.00 | AA– (11) | 1,784,522 |
| | Georgia Medical Center Project, Series 2011B, 5.000%, 10/01/41 (Pre-refunded 10/01/21) | | | |
| 95,395 | | Total Georgia | | | 105,884,285 |
| | Guam – 0.5% (0.3% of Total Investments) | | | |
| 1,500 | | Government of Guam, Business Privilege Tax Bonds, Refunding Series 2015D, | 11/25 at 100.00 | BB | 1,644,180 |
| | 5.000%, 11/15/39 | | | |
| | Government of Guam, Business Privilege Tax Bonds, Series 2011A: | | | |
| 840 | | 5.250%, 1/01/36 | 1/22 at 100.00 | BB | 865,696 |
| 3,200 | | 5.125%, 1/01/42 | 1/22 at 100.00 | BB | 3,288,896 |
| | Guam Government Waterworks Authority, Water and Wastewater System Revenue Bonds, | | | |
| | Refunding Series 2017: | | | |
| 1,335 | | 5.000%, 7/01/36 | 7/27 at 100.00 | Baa2 | 1,549,801 |
| 890 | | 5.000%, 7/01/40 | 7/27 at 100.00 | Baa2 | 1,022,957 |
| 3,695 | | Guam Government Waterworks Authority, Water and Wastewater System Revenue Bonds, Series | 7/23 at 100.00 | Baa2 (11) | 4,197,520 |
| | 2013, 5.500%, 7/01/43 (Pre-refunded 7/01/23) | | | |
| 235 | | Guam Government Waterworks Authority, Water and Wastewater System Revenue Bonds, Series | 7/26 at 100.00 | Baa2 | 262,920 |
| | 2016, 5.000%, 1/01/46 | | | |
44
| | | | | | |
| Principal | | | Optional Call | | |
| Amount (000) | | Description (1) | Provisions (2) | Ratings (3) | Value |
| | Guam (continued) | | | |
| $ 4,770 | | Guam Government Waterworks Authority, Water and Wastewater System Revenue Bonds, Series | 7/30 at 100.00 | Baa2 | $ 5,708,116 |
| | 2020A, 5.000%, 1/01/50 | | | |
| 250 | | Guam Power Authority, Revenue Bonds, Series 2012A, 5.000%, 10/01/34 – AGM Insured | 10/22 at 100.00 | A2 | 268,100 |
| 16,715 | | Total Guam | | | 18,808,186 |
| | Hawaii – 0.4% (0.2% of Total Investments) | | | |
| 1,500 | | Hawaii Department of Budget and Finance, Special Purpose Revenue Bonds, Chaminade | 1/25 at 100.00 | Ba3 | 1,222,980 |
| | University of Honolulu, Series 2015A, 5.000%, 1/01/45, 144A | | | |
| 5,000 | | Hawaii Department of Budget and Finance, Special Purpose Revenue Bonds, Hawaii Pacific | 7/23 at 100.00 | A1 | 5,460,900 |
| | Health Obligated Group, Series 2013A, 5.500%, 7/01/43 | | | |
| 170 | | Hawaii Department of Budget and Finance, Special Purpose Revenue Bonds, Hawaii Pacific | 7/23 at 100.00 | BB | 174,597 |
| | University, Series 2013A, 6.875%, 7/01/43 | | | |
| 5,075 | | Hawaii Department of Budget and Finance, Special Purpose Revenue Bonds, Queens Health | 7/25 at 100.00 | A1 | 5,475,874 |
| | Systems, Series 2015A, 4.000%, 7/01/40 | | | |
| 11,745 | | Total Hawaii | | | 12,334,351 |
| | Idaho – 0.8% (0.5% of Total Investments) | | | |
| | Idaho Health Facilities Authority, Revenue Bonds, Kootenai Health Project, Series 2014: | | | |
| 3,300 | | 4.375%, 7/01/34, 144A | 7/24 at 100.00 | A | 3,559,512 |
| 12,495 | | 4.750%, 7/01/44, 144A | 7/24 at 100.00 | A | 13,442,870 |
| 1,250 | | Idaho Health Facilities Authority, Revenue Bonds, Madison Memorial Hospital Project, | 9/26 at 100.00 | BB+ | 1,389,125 |
| | Refunding Series 2016, 5.000%, 9/01/37 | | | |
| 8,730 | | Idaho Health Facilities Authority, Revenue Bonds, Saint Luke’s Health System Project, | 3/22 at 100.00 | A– | 8,998,535 |
| | Series 2012A, 5.000%, 3/01/47 | | | |
| 1,000 | | Idaho Health Facilities Authority, Revenue Bonds, Saint Luke’s Health System Project, | 3/24 at 100.00 | A– | 1,055,580 |
| | Series 2014A, 4.125%, 3/01/37 | | | |
| | Idaho Housing and Finance Association NonProfit Facilities Revenue Bonds, Gem Prep | | | |
| | Meridian North LLC, Series 2020A: | | | |
| 500 | | 5.000%, 7/01/40, 144A | 7/25 at 100.00 | N/R | 497,490 |
| 1,415 | | 5.250%, 7/01/55, 144A | 7/25 at 100.00 | N/R | 1,405,944 |
| 28,690 | | Total Idaho | | | 30,349,056 |
| | Illinois – 23.7% (15.1% of Total Investments) | | | |
| 675 | | Bolingbrook, Will and DuPage Counties, Illinois, General Obligation Bonds, Refunding | 7/23 at 100.00 | A2 (11) | 758,828 |
| | Series 2013A, 5.000%, 1/01/25 (Pre-refunded 7/01/23) | | | |
| 67,135 | | Chicago Board of Education, Illinois, Dedicated Capital Improvement Tax Revenue Bonds, | 4/27 at 100.00 | A– | 77,135,430 |
| | Series 2016, 6.000%, 4/01/46 | | | |
| 1,000 | | Chicago Board of Education, Illinois, Dedicated Capital Improvement Tax Revenue Bonds, | 4/27 at 100.00 | A– | 1,064,610 |
| | Series 2017, 5.000%, 4/01/46 | | | |
| | Chicago Board of Education, Illinois, General Obligation Bonds, Dedicated Revenues | | | |
| | Series 2011A: | | | |
| 6,210 | | 5.500%, 12/01/39 | 12/21 at 100.00 | B1 | 6,293,338 |
| 1,865 | | 5.000%, 12/01/41 | 12/21 at 100.00 | B1 | 1,879,342 |
| 5,205 | | Chicago Board of Education, Illinois, General Obligation Bonds, Dedicated Revenues | 12/22 at 100.00 | B1 | 5,270,323 |
| | Series 2012A, 5.000%, 12/01/42 | | | |
| 8,400 | | Chicago Board of Education, Illinois, General Obligation Bonds, Dedicated Revenues, | 12/27 at 100.00 | BB– | 10,443,468 |
| | Refunding Series 2017B, 7.000%, 12/01/42, 144A | | | |
| | Chicago Board of Education, Illinois, General Obligation Bonds, Dedicated Revenues, | | | |
| | Refunding Series 2017H: | | | |
| 5,835 | | 5.000%, 12/01/36 | 12/27 at 100.00 | BB– | 6,281,844 |
| 4,940 | | 5.000%, 12/01/46 | 12/27 at 100.00 | BB– | 5,207,847 |
| 6,055 | | Chicago Board of Education, Illinois, General Obligation Bonds, Dedicated Revenues, | 12/28 at 100.00 | BB– | 6,401,285 |
| | Refunding Series 2018D, 5.000%, 12/01/46 | | | |
45
| | |
| NVG | Nuveen AMT-Free Municipal Credit Income Fund Portfolio of Investments (continued) October 31, 2020 |
| | | | | | |
| Principal | | | Optional Call | | |
| Amount (000) | | Description (1) | Provisions (2) | Ratings (3) | Value |
| | Illinois (continued) | | | |
| $ 38,905 | | Chicago Board of Education, Illinois, General Obligation Bonds, Dedicated Revenues, | 12/25 at 100.00 | BB– | $ 45,854,989 |
| | Series 2016A, 7.000%, 12/01/44 | | | |
| 14,805 | | Chicago Board of Education, Illinois, General Obligation Bonds, Dedicated Revenues, | 12/26 at 100.00 | BB– | 17,300,531 |
| | Series 2016B, 6.500%, 12/01/46 | | | |
| 19,585 | | Chicago Board of Education, Illinois, General Obligation Bonds, Dedicated Revenues, | 12/27 at 100.00 | BB– | 24,208,627 |
| | Series 2017A, 7.000%, 12/01/46, 144A | | | |
| 1,345 | | Chicago Board of Education, Illinois, Unlimited Tax General Obligation Bonds, Dedicated | No Opt. Call | BB– | 955,797 |
| | Tax Revenues, Series 1998B-1, 0.000%, 12/01/30 – NPFG Insured | | | |
| 2,235 | | Chicago Transit Authority, Illinois, Capital Grant Receipts Revenue Bonds, Federal | 6/21 at 100.00 | A2 | 2,292,462 |
| | Transit Administration Section 5307 Urbanized Area Formula Funds, Refunding Series 2011, | | | |
| | 5.250%, 6/01/26 – AGM Insured | | | |
| | Chicago Transit Authority, Illinois, Sales Tax Receipts Revenue Bonds, Second Lien | | | |
| | Series 2020A: | | | |
| 1,405 | | 4.000%, 12/01/50 | 12/29 at 100.00 | A+ | 1,511,471 |
| 2,585 | | 5.000%, 12/01/55 | 12/29 at 100.00 | A+ | 3,018,298 |
| 1,100 | | Chicago Transit Authority, Illinois, Sales Tax Receipts Revenue Bonds, Series 2011, | 12/21 at 100.00 | A3 (11) | 1,159,400 |
| | 5.250%, 12/01/40 (Pre-refunded 12/01/21) | | | |
| 12,215 | | Chicago Transit Authority, Illinois, Sales Tax Receipts Revenue Bonds, Series 2014, | 12/24 at 100.00 | AA | 13,822,005 |
| | 5.250%, 12/01/49 | | | |
| | Chicago, Illinois, General Obligation Bonds, City Colleges, Series 1999: | | | |
| 1,500 | | 0.000%, 1/01/31 – NPFG Insured | No Opt. Call | BBB– | 1,069,680 |
| 32,670 | | 0.000%, 1/01/32 – FGIC Insured | No Opt. Call | BBB– | 22,257,744 |
| 12,360 | | 0.000%, 1/01/37 – FGIC Insured | No Opt. Call | BBB– | 6,663,523 |
| 2,500 | | Chicago, Illinois, General Obligation Bonds, Project & Refunding Series 2014A, | 1/24 at 100.00 | Ba1 | 2,569,650 |
| | 5.250%, 1/01/33 | | | |
| 17,605 | | Chicago, Illinois, General Obligation Bonds, Project & Refunding Series 2017A, | 1/27 at 100.00 | BBB– | 19,268,496 |
| | 6.000%, 1/01/38 | | | |
| 1,000 | | Chicago, Illinois, General Obligation Bonds, Project Series 2011A, 5.250%, 1/01/35 | 1/21 at 100.00 | Ba1 | 1,000,340 |
| 10,200 | | Chicago, Illinois, General Obligation Bonds, Project Series 2012A, 5.000%, 1/01/33 | 1/22 at 100.00 | Ba1 | 10,263,852 |
| 2,605 | | Chicago, Illinois, General Obligation Bonds, Refunding Series 2016C, 5.000%, 1/01/38 | 1/26 at 100.00 | BBB– | 2,667,859 |
| 3,000 | | Chicago, Illinois, Wastewater Transmission Revenue Bonds, Second Lien Series 2008C, | 1/25 at 100.00 | A– | 3,423,600 |
| | 5.000%, 1/01/39 | | | |
| 10,000 | | Cook County Community College District 508, Illinois, General Obligation Bonds, Chicago | 12/23 at 100.00 | BBB | 10,443,700 |
| | City Colleges, Series 2013, 5.250%, 12/01/43 | | | |
| | DeKalb, Kane, LaSalle, Lee, Ogle, Winnebago and Boone Counties Community College | | | |
| | District 523, Illinois, General Obligation Bonds, Kishwaukee Community College, Series 2011B: | | | |
| 2,500 | | 0.000%, 2/01/33 (Pre-refunded 2/01/21) | 2/21 at 44.26 | AA– (11) | 1,105,525 |
| 2,000 | | 0.000%, 2/01/34 (Pre-refunded 2/01/21) | 2/21 at 41.04 | AA– (11) | 820,120 |
| | Illinois Educational Facilities Authority, Revenue Bonds, Field Museum of Natural | | | |
| | History, Series 2002RMKT: | | | |
| 2,500 | | 4.450%, 11/01/36 | 11/25 at 102.00 | A2 | 2,810,475 |
| 3,400 | | 5.500%, 11/01/36 | 11/23 at 100.00 | A | 3,856,178 |
| 3,075 | | Illinois Educational Facilities Authority, Revenue Bonds, Robert Morris College, Series | 11/20 at 100.00 | Baa2 | 3,083,210 |
| | 2000, 5.800%, 6/01/30 – NPFG Insured | | | |
| | Illinois Finance Authority, Charter School Revenue Bonds, Intrinsic Charter Schools | | | |
| | Belmont School Project, Series 2015A: | | | |
| 1,700 | | 5.750%, 12/01/35, 144A | 12/25 at 100.00 | N/R | 1,811,316 |
| 115 | | 6.000%, 12/01/45, 144A | 12/25 at 100.00 | N/R | 123,395 |
| | Illinois Finance Authority, Health Services Facility Lease Revenue Bonds, Provident | | | |
| | Group – UIC Surgery Center, LLC – University of Illinois Health Services Facility Project, | | | |
| | Series 2020: | | | |
| 3,835 | | 4.000%, 10/01/50 | 10/30 at 100.00 | BBB+ | 4,091,600 |
| 1,335 | | 4.000%, 10/01/55 | 10/30 at 100.00 | BBB+ | 1,414,967 |
46
| | | | | | |
| Principal | | | Optional Call | | |
| Amount (000) | | Description (1) | Provisions (2) | Ratings (3) | Value |
| | Illinois (continued) | | | |
| | Illinois Finance Authority, Revenue Bonds, Ascension Health/fkaPresence Health Network, | | | |
| | Series 2016C: | | | |
| $ 80 | | 4.000%, 2/15/41 (Pre-refunded 2/15/27) | 2/27 at 100.00 | N/R (11) | $ 96,802 |
| 1,755 | | 4.000%, 2/15/41 (Pre-refunded 2/15/27) | 2/27 at 100.00 | N/R (11) | 2,123,603 |
| 37,840 | | 4.000%, 2/15/41 | 2/27 at 100.00 | Aa2 | 41,641,028 |
| 6,750 | | Illinois Finance Authority, Revenue Bonds, Centegra Health System, Series 2012, | 9/22 at 100.00 | AA+ | 7,191,720 |
| | 5.000%, 9/01/38 | | | |
| | Illinois Finance Authority, Revenue Bonds, Centegra Health System, Series 2014A: | | | |
| 1,485 | | 5.000%, 9/01/34 | 9/24 at 100.00 | AA+ | 1,670,803 |
| 19,025 | | 5.000%, 9/01/42 | 9/24 at 100.00 | AA+ | 21,078,749 |
| 1,750 | | Illinois Finance Authority, Revenue Bonds, Ingalls Health System, Series 2013, 4.250%, | 5/22 at 100.00 | A1 (11) | 1,843,748 |
| | 5/15/43 (Pre-refunded 5/15/22) | | | |
| 4,000 | | Illinois Finance Authority, Revenue Bonds, Lutheran Home and Services, Series 2019A, | 11/26 at 103.00 | N/R | 4,158,600 |
| | 5.000%, 11/01/49 | | | |
| 15,805 | | Illinois Finance Authority, Revenue Bonds, Mercy Health Corporation, Series 2016, | 6/26 at 100.00 | A3 | 17,717,563 |
| | 5.000%, 12/01/46 | | | |
| 1,630 | | Illinois Finance Authority, Revenue Bonds, Northwestern Memorial HealthCare, Series | 8/22 at 100.00 | Aa2 | 1,734,825 |
| | 2013, 5.000%, 8/15/37 | | | |
| 1,435 | | Illinois Finance Authority, Revenue Bonds, Rehabilitation Institute of Chicago, Series | 7/23 at 100.00 | A– | 1,577,553 |
| | 2013A, 6.000%, 7/01/43 | | | |
| | Illinois Finance Authority, Revenue Bonds, Rosalind Franklin University Research | | | |
| | Building Project, Series 2017C: | | | |
| 1,000 | | 5.000%, 8/01/42 | 8/27 at 100.00 | BBB+ | 1,088,170 |
| 1,000 | | 5.000%, 8/01/46 | 8/27 at 100.00 | BBB+ | 1,081,410 |
| 1,000 | | 5.000%, 8/01/47 | 8/27 at 100.00 | BBB+ | 1,080,570 |
| | Illinois Finance Authority, Revenue Bonds, Silver Cross Hospital and Medical Centers, | | | |
| | Refunding Series 2015C: | | | |
| 560 | | 5.000%, 8/15/35 | 8/25 at 100.00 | BBB+ | 630,941 |
| 6,140 | | 5.000%, 8/15/44 | 8/25 at 100.00 | BBB+ | 6,769,534 |
| 8,960 | | Illinois Finance Authority, Revenue Bonds, The Carle Foundation, Series 2011A, 6.000%, | 8/21 at 100.00 | A2 | 9,267,597 |
| | 8/15/41 – AGM Insured | | | |
| | Illinois Finance Authority, Revenue Bonds, The University of Chicago Medical Center, | | | |
| | Series 2011C: | | | |
| 1,150 | | Illinois Finance Authority, Revenue Bonds, The University of Chicago Medical Center, | 2/21 at 100.00 | AA– (11) | 1,166,882 |
| | Series 2011C, 5.500%, 8/15/41 (Pre-refunded 2/15/21) | | | |
| 4,500 | | Illinois Finance Authority, Revenue Bonds, The University of Chicago Medical Center, | 2/21 at 100.00 | AA– (11) | 4,566,060 |
| | Series 2011C, 5.500%, 8/15/41 (Pre-refunded 2/15/21) (UB) (5) | | | |
| 20,000 | | Illinois Finance Authority, Revenue Bonds, University of Chicago, Refunding Series | 10/25 at 100.00 | AA– | 22,894,400 |
| | 2015A, 5.000%, 10/01/46 (UB) (5) | | | |
| 19,975 | | Illinois Finance Authority, Revenue Bonds, University of Chicago, Series 2012A, | 10/21 at 100.00 | AA– | 20,664,337 |
| | 5.000%, 10/01/51 | | | |
| 3,665 | | Illinois Sports Facility Authority, State Tax Supported Bonds, Refunding Series 2014, | 6/24 at 100.00 | BB+ | 4,066,427 |
| | 5.250%, 6/15/31 – AGM Insured | | | |
| | Illinois State, General Obligation Bonds, December Series 2017A: | | | |
| 11,800 | | 5.000%, 12/01/38 | 12/27 at 100.00 | BBB– | 12,261,380 |
| 1,330 | | 5.000%, 12/01/39 | 12/27 at 100.00 | BBB– | 1,378,598 |
| | Illinois State, General Obligation Bonds, February Series 2014: | | | |
| 3,275 | | 5.000%, 2/01/24 | No Opt. Call | BBB– | 3,509,392 |
| 1,575 | | 5.250%, 2/01/34 | 2/24 at 100.00 | BBB– | 1,635,701 |
| 7,500 | | 5.000%, 2/01/39 | 2/24 at 100.00 | BBB– | 7,645,500 |
| 5,200 | | Illinois State, General Obligation Bonds, January Series 2016, 5.000%, 1/01/29 | 1/26 at 100.00 | BBB– | 5,552,560 |
| | Illinois State, General Obligation Bonds, May Series 2014: | | | |
| 510 | | 5.000%, 5/01/36 | 5/24 at 100.00 | BBB– | 523,214 |
| 1,915 | | 5.000%, 5/01/39 | 5/24 at 100.00 | BBB– | 1,953,702 |
47
| | |
| NVG | Nuveen AMT-Free Municipal Credit Income Fund Portfolio of Investments (continued) October 31, 2020 |
| | | | | | |
| Principal | | | Optional Call | | |
| Amount (000) | | Description (1) | Provisions (2) | Ratings (3) | Value |
| | Illinois (continued) | | | |
| $ 4,460 | | Illinois State, General Obligation Bonds, May Series 2020, 5.500%, 5/01/39 | 5/30 at 100.00 | BBB– | $ 4,921,521 |
| 13,200 | | Illinois State, General Obligation Bonds, November Series 2016, 5.000%, 11/01/41 | 11/26 at 100.00 | BBB– | 13,557,984 |
| 31,250 | | Illinois State, General Obligation Bonds, November Series 2017C, 5.000%, 11/01/29 | 11/27 at 100.00 | BBB– | 33,435,312 |
| 2,040 | | Illinois State, General Obligation Bonds, November Series 2017D, 5.000%, 11/01/27 | No Opt. Call | BBB– | 2,213,930 |
| 5,000 | | Illinois State, General Obligation Bonds, November Series 2019B, 4.000%, 11/01/35 | 11/29 at 100.00 | BBB– | 4,910,850 |
| 5,000 | | Illinois State, General Obligation Bonds, October Series 2016, 5.000%, 2/01/29 | 2/27 at 100.00 | BBB– | 5,399,700 |
| 2,625 | | Illinois State, General Obligation Bonds, Refunding Series 2010, 5.000%, 1/01/24 | 11/20 at 100.00 | BBB– | 2,631,221 |
| 1,190 | | Illinois State, General Obligation Bonds, Refunding Series 2012, 5.000%, 8/01/25 | 8/22 at 100.00 | BBB– | 1,234,101 |
| | Illinois State, General Obligation Bonds, Series 2013: | | | |
| 2,000 | | 5.250%, 7/01/31 | 7/23 at 100.00 | BBB– | 2,081,900 |
| 4,140 | | 5.500%, 7/01/38 | 7/23 at 100.00 | BBB– | 4,266,560 |
| 5,000 | | Illinois Toll Highway Authority, Toll Highway Revenue Bonds, Senior Lien Series 2013A, | 1/23 at 100.00 | A1 | 5,423,200 |
| | 5.000%, 1/01/35 | | | |
| 18,920 | | Illinois Toll Highway Authority, Toll Highway Revenue Bonds, Senior Lien Series 2015A, | 7/25 at 100.00 | A1 | 21,893,467 |
| | 5.000%, 1/01/40 | | | |
| 10,000 | | Illinois Toll Highway Authority, Toll Highway Revenue Bonds, Senior Lien Series 2019A, | 7/29 at 100.00 | A1 | 12,289,800 |
| | 5.000%, 1/01/44 | | | |
| 1,395 | | Illinois Toll Highway Authority, Toll Highway Revenue Bonds, Tender Option Bond Trust | 1/23 at 100.00 | AA– | 1,854,025 |
| | 2015-XF0051, 17.207%, 1/01/38, 144A (IF) | | | |
| 7,400 | | Macon County School District 61 Decatur, Illinois, General Obligation Bonds, Alternate | 1/21 at 100.00 | A2 | 7,460,014 |
| | Revenue Source Series 2011A, 5.250%, 1/01/37 – AGM Insured | | | |
| 17,500 | | Metropolitan Pier and Exposition Authority, Illinois, McCormick Place Expansion Project | 6/22 at 100.00 | BB+ | 17,880,275 |
| | Bonds, Refunding Series 2012B, 5.000%, 6/15/52 | | | |
| 540 | | Metropolitan Pier and Exposition Authority, Illinois, McCormick Place Expansion Project | 12/25 at 100.00 | BB+ | 572,557 |
| | Bonds, Refunding Series 2015B, 5.000%, 6/15/52 | | | |
| | Metropolitan Pier and Exposition Authority, Illinois, McCormick Place Expansion Project | | | |
| | Bonds, Refunding Series 2020A: | | | |
| 12,325 | | 4.000%, 6/15/50 | 12/29 at 100.00 | BB+ | 12,394,020 |
| 15,160 | | 5.000%, 6/15/50 | 12/29 at 100.00 | BB+ | 16,664,327 |
| | Metropolitan Pier and Exposition Authority, Illinois, McCormick Place Expansion Project | | | |
| | Bonds, Series 2015A: | | | |
| 2,890 | | 0.000%, 12/15/52 | No Opt. Call | BB+ | 677,358 |
| 5,185 | | 5.000%, 6/15/53 | 12/25 at 100.00 | BB+ | 5,495,115 |
| 5,700 | | 5.500%, 6/15/53 | 12/25 at 100.00 | BB+ | 6,172,587 |
| | Metropolitan Pier and Exposition Authority, Illinois, Revenue Bonds, McCormick Place | | | |
| | Expansion Project, Capital Appreciation Refunding Series 2010B-1: | | | |
| 25,000 | | 0.000%, 6/15/44 – AGM Insured | No Opt. Call | BB+ | 10,583,000 |
| 43,200 | | 0.000%, 6/15/45 – AGM Insured | No Opt. Call | BB+ | 17,446,752 |
| 10,000 | | 0.000%, 6/15/46 – AGM Insured | No Opt. Call | BB+ | 3,874,400 |
| 8,750 | | Metropolitan Pier and Exposition Authority, Illinois, Revenue Bonds, McCormick Place | No Opt. Call | BBB | 7,130,200 |
| | Expansion Project, Series 1994B, 0.000%, 6/15/28 – NPFG Insured | | | |
| | Metropolitan Pier and Exposition Authority, Illinois, Revenue Bonds, McCormick Place | | | |
| | Expansion Project, Series 2002A: | | | |
| 18,085 | | 0.000%, 12/15/24 – NPFG Insured | No Opt. Call | BB+ | 16,652,306 |
| 20,045 | | 0.000%, 12/15/35 – AGM Insured | No Opt. Call | BB+ | 12,435,116 |
| 9,000 | | 0.000%, 6/15/37 – NPFG Insured | No Opt. Call | BB+ | 4,950,360 |
| 465 | | Morton Grove, Illinois, Tax Increment Revenue Bonds, Sawmill Station Redevelopment | 1/26 at 100.00 | N/R | 443,094 |
| | Project, Senior Lien Series 2019, 5.000%, 1/01/39 | | | |
| 1,846 | | Plano, Illinois, Special Tax Bonds, Special Service Area 1 & 2 Lakewood Springs Project, | 3/24 at 100.00 | AA | 2,050,943 |
| | Refunding Series 2014, 5.000%, 3/01/34 – AGM Insured | | | |
| 2,600 | | Regional Transportation Authority, Cook, DuPage, Kane, Lake, McHenry and Will Counties, | No Opt. Call | A2 | 3,520,920 |
| | Illinois, General Obligation Bonds, Series 2000A, 6.500%, 7/01/30 – NPFG Insured | | | |
48
| | | | | | |
| Principal | | | Optional Call | | |
| Amount (000) | | Description (1) | Provisions (2) | Ratings (3) | Value |
| | Illinois (continued) | | | |
| $ 3,900 | | Rosemont Village, Illinois, General Obligation Bonds, Corporate Purpose Series 2011A, | 12/20 at 100.00 | A2 (11) | $ 3,916,536 |
| | 5.600%, 12/01/35 (Pre-refunded 12/01/20) – AGM Insured | | | |
| 7,025 | | Southwestern Illinois Development Authority, Health Facility Revenue Bonds, Memorial | 11/23 at 100.00 | N/R (11) | 8,513,176 |
| | Group, Inc, Series 2013, 7.625%, 11/01/48 (Pre-refunded 11/01/23) | | | |
| 4,000 | | Southwestern Illinois Development Authority, School Revenue Bonds, Triad School District | No Opt. Call | Baa2 | 3,779,000 |
| | 2, Madison County, Illinois, Series 2006, 0.000%, 10/01/25 – NPFG Insured | | | |
| 12,125 | | Springfield, Illinois, Electric Revenue Bonds, Senior Lien Series 2015, 5.000%, 3/01/40 – | 3/25 at 100.00 | A2 | 13,986,309 |
| | AGM Insured | | | |
| | Will County Community Unit School District 201U, Crete-Monee, Illinois, General | | | |
| | Obligation Bonds, Capital Appreciation Series 2004: | | | |
| 780 | | 0.000%, 11/01/22 – NPFG Insured (ETM) | No Opt. Call | Baa2 (11) | 771,194 |
| 2,550 | | 0.000%, 11/01/22 – NPFG Insured | No Opt. Call | Baa2 | 2,500,887 |
| 6,415 | | Will County School District 122, New Lenox, Illinois, General Obligation Bonds, Capital | No Opt. Call | Aa3 | 6,189,513 |
| | Appreciation School Series 2004D, 0.000%, 11/01/24 – AGM Insured | | | |
| | Williamson & Johnson Counties Community Unit School District 2, Marion, Illinois, | | | |
| | General Obligation Bonds, Series 2011: | | | |
| 930 | | 7.000%, 12/01/21 – AGM Insured | 12/20 at 100.00 | A2 | 934,855 |
| 1,035 | | 7.000%, 12/01/22 – AGM Insured | 12/20 at 100.00 | A2 | 1,040,403 |
| 1,155 | | 7.000%, 12/01/23 – AGM Insured | 12/20 at 100.00 | A2 | 1,161,029 |
| 1,065 | | 7.000%, 12/01/26 – AGM Insured | 12/20 at 100.00 | A2 | 1,070,559 |
| 2,085 | | 7.250%, 12/01/29 (Pre-refunded 12/01/20) – AGM Insured | 12/20 at 100.00 | A2 (11) | 2,096,280 |
| 2,295 | | 7.250%, 12/01/30 (Pre-refunded 12/01/20) – AGM Insured | 12/20 at 100.00 | A2 (11) | 2,307,416 |
| 865,281 | | Total Illinois | | | 848,960,566 |
| | Indiana – 3.0% (1.9% of Total Investments) | | | |
| | Allen County, Indiana, Economic Development Revenue Bonds, Fort Wayne Project, Senior | | | |
| | Series 2017A-1: | | | |
| 500 | | 6.625%, 1/15/34, 144A (4) | 1/24 at 104.00 | N/R | 491,645 |
| 675 | | 6.750%, 1/15/43, 144A (4) | 1/24 at 104.00 | N/R | 662,810 |
| 1,605 | | Chesterton, Indiana, Economic Development Revenue Bonds, Storypoint Chesterton Project, | 1/24 at 104.00 | N/R | 1,575,628 |
| | Series 2016, 6.250%, 1/15/43, 144A (4) | | | |
| 2,640 | | Crown Point Multi-School Building Corporation, Indiana, First Mortgage Bonds, Crown | No Opt. Call | Baa2 | 2,584,111 |
| | Point Community School Corporation, Series 2000, 0.000%, 1/15/24 – NPFG Insured | | | |
| 12,045 | | Indiana Finance Authority, Educational Facilities Revenue Bonds, Valparaiso University | 10/24 at 100.00 | Baa1 | 12,679,531 |
| | Project, Series 2014, 5.000%, 10/01/44 | | | |
| 10,425 | | Indiana Finance Authority, Hospital Revenue Bonds, Community Health Network Project, | 5/23 at 100.00 | A (11) | 11,625,126 |
| | Series 2012A, 5.000%, 5/01/42 (Pre-refunded 5/01/23) | | | |
| 10,000 | | Indiana Finance Authority, Hospital Revenue Bonds, Indiana University Health Obligation | 12/29 at 100.00 | AA | 11,355,000 |
| | Group, Fixed Rate Series 2019A, 4.000%, 12/01/49 | | | |
| 5,000 | | Indiana Finance Authority, Revenue Bonds, Trinity Health Care Group, Refunding Series | 12/20 at 100.00 | AA– (11) | 5,018,650 |
| | 2010B, 5.000%, 12/01/37 (Pre-refunded 12/01/20) | | | |
| 13,880 | | Indiana Finance Authority, Wastewater Utility Revenue Bonds, CWA Authority Project, | 10/21 at 100.00 | A1 | 14,354,418 |
| | Series 2011B, 5.000%, 10/01/41 | | | |
| 17,970 | | Indiana Finance Authority, Wastewater Utility Revenue Bonds, CWA Authority Project, | 10/24 at 100.00 | A+ | 20,478,792 |
| | Series 2014A, 5.000%, 10/01/44 | | | |
| | Indianapolis Local Public Improvement Bond Bank, Indiana, Series 1999E: | | | |
| 10,000 | | 0.000%, 2/01/26 – AMBAC Insured | No Opt. Call | AA– | 9,545,800 |
| 20,000 | | 0.000%, 2/01/28 – AMBAC Insured | No Opt. Call | AA– | 18,273,400 |
| 104,740 | | Total Indiana | | | 108,644,911 |
| | Iowa – 3.1% (2.0% of Total Investments) | | | |
| 10,000 | | Iowa Finance Authority, Health Facilities Revenue Bonds, UnityPoint Health Project, | 2/23 at 100.00 | A1 (11) | 11,135,200 |
| | Series 2013A, 5.250%, 2/15/44 (Pre-refunded 2/15/23) | | | |
49
| | |
| NVG | Nuveen AMT-Free Municipal Credit Income Fund Portfolio of Investments (continued) October 31, 2020 |
| | | | | | |
| Principal | | | Optional Call | | |
| Amount (000) | | Description (1) | Provisions (2) | Ratings (3) | Value |
| | Iowa (continued) | | | |
| $ 10,690 | | Iowa Finance Authority, Iowa, Midwestern Disaster Area Revenue Bonds, Iowa Fertilizer | 12/23 at 100.00 | B | $ 11,382,071 |
| | Company Project, Series 2013, 5.250%, 12/01/25 | | | |
| 18,290 | | Iowa Finance Authority, Iowa, Midwestern Disaster Area Revenue Bonds, Iowa Fertilizer | 11/20 at 104.00 | B | 19,041,170 |
| | Company Project, Series 2016, 5.875%, 12/01/27, 144A | | | |
| 21,280 | | Iowa Finance Authority, Iowa, Midwestern Disaster Area Revenue Bonds, Iowa Fertilizer | 12/22 at 105.00 | BB– | 22,435,291 |
| | Company Project, Series 2018B, 5.250%, 12/01/50 (Mandatory Put 12/01/37) | | | |
| 5,700 | | Iowa Finance Authority, Senior Housing Revenue Bonds, PHS Council Bluffs, Inc Project, | 8/23 at 102.00 | N/R | 5,882,856 |
| | Series 2018, 5.250%, 8/01/55 | | | |
| | Iowa Tobacco Settlement Authority, Asset Backed Settlement Revenue Bonds, Series 2005C: | | | |
| 8,285 | | 5.375%, 6/01/38 | 11/20 at 100.00 | B– | 8,398,422 |
| 2,200 | | 5.500%, 6/01/42 | 11/20 at 100.00 | B– | 2,230,118 |
| 21,420 | | 5.625%, 6/01/46 | 11/20 at 100.00 | B– | 21,713,240 |
| 8,400 | | Iowa Tobacco Settlement Authority, Tobacco Asset-Backed Revenue Bonds, Series 2005B, | 11/20 at 100.00 | B– | 8,514,996 |
| | 5.600%, 6/01/34 | | | |
| 106,265 | | Total Iowa | | | 110,733,364 |
| | Kansas – 0.3% (0.2% of Total Investments) | | | |
| 1,000 | | Lenexa, Kansas, Health Care Facilities Revenue Bonds, Lakeview Village Inc, Series | 5/27 at 100.00 | BB+ | 1,054,630 |
| | 2017A, 5.000%, 5/15/43 | | | |
| | Wyandotte County-Kansas City Unified Government, Kansas, Sales Tax Special Obligation | | | |
| | Bonds, Vacation Village Project Area 1 and 2A, Series 2015: | | | |
| 4,205 | | 5.000%, 9/01/27 | 9/25 at 100.00 | N/R | 4,051,602 |
| 2,380 | | 5.750%, 9/01/32 | 9/25 at 100.00 | N/R | 2,157,232 |
| 2,575 | | 6.000%, 9/01/35 | 9/25 at 100.00 | N/R | 2,331,765 |
| 10,160 | | Total Kansas | | | 9,595,229 |
| | Kentucky – 1.7% (1.1% of Total Investments) | | | |
| 4,565 | | Christian County, Kentucky, Hospital Revenue Bonds, Jennie Stuart Medical Center, Series | 2/26 at 100.00 | BB+ | 5,033,597 |
| | 2016, 5.500%, 2/01/44 | | | |
| 3,770 | | Kentucky Bond Development Corporation, Tax Increment Revenue Bonds, Summit Lexington | No Opt. Call | N/R | 3,687,098 |
| | Project, Series 2016A, 4.400%, 10/01/24 | | | |
| 10,000 | | Kentucky Economic Development Finance Authority, Hospital Revenue Bonds, Owensboro | 6/27 at 100.00 | BB+ | 10,980,200 |
| | Health, Refunding Series 2017A, 5.000%, 6/01/37 | | | |
| | Kentucky Economic Development Finance Authority, Revenue Bonds, Next Generation Kentucky | | | |
| | Information Highway Project, Senior Series 2015A: | | | |
| 4,345 | | 5.000%, 7/01/37 | 7/25 at 100.00 | Baa2 | 4,654,755 |
| 17,615 | | 5.000%, 1/01/45 | 7/25 at 100.00 | Baa2 | 18,634,909 |
| | Kentucky Public Transportation Infrastructure Authority, First Tier Toll Revenue Bonds, | | | |
| | Downtown Crossing Project, Convertible Capital Appreciation Series 2013C: | | | |
| 4,360 | | 0.000%, 7/01/43 (7) | 7/31 at 100.00 | Baa3 | 4,752,574 |
| 8,510 | | 0.000%, 7/01/46 (7) | 7/31 at 100.00 | Baa3 | 9,292,154 |
| | Kentucky Public Transportation Infrastructure Authority, First Tier Toll Revenue Bonds, | | | |
| | Downtown Crossing Project, Series 2013A: | | | |
| 2,390 | | 5.750%, 7/01/49 | 7/23 at 100.00 | Baa3 | 2,590,617 |
| 480 | | 6.000%, 7/01/53 | 7/23 at 100.00 | Baa3 | 522,715 |
| 56,035 | | Total Kentucky | | | 60,148,619 |
| | Louisiana – 1.3% (0.8% of Total Investments) | | | |
| 2,765 | | Ascension Parish Industrial development Board, Louisiana, Revenue Bonds, Impala | 7/23 at 100.00 | N/R | 2,855,830 |
| | Warehousing (US) LLC Project, Series 2013, 6.000%, 7/01/36 | | | |
| 4,330 | | Jefferson Parish Hospital District1, Louisiana, Hospital Revenue Bonds, West Jefferson | 1/21 at 100.00 | A2 (11) | 4,369,836 |
| | Medical Center, Refunding Series 2011A, 6.000%, 1/01/39 (Pre-refunded 1/01/21) – AGM Insured | | | |
50
| | | | | | |
| Principal | | | Optional Call | | |
| Amount (000) | | Description (1) | Provisions (2) | Ratings (3) | Value |
| | Louisiana (continued) | | | |
| | Louisiana Public Facilities Authority, Hospital Revenue Bonds, Franciscan Missionaries | | | |
| | of Our Lady Health System, Series 1998A: | | | |
| $ 135 | | 5.750%, 7/01/25 (ETM) (UB) | No Opt. Call | A2 (11) | $ 168,178 |
| 8,435 | | 5.750%, 7/01/25 (UB) | No Opt. Call | A2 | 9,528,935 |
| 5,080 | | Louisiana Public Facilities Authority, Hospital Revenue Bonds, Louisiana Children’s | 6/30 at 100.00 | A+ | 5,678,678 |
| | Medical Center Hospital, Series 2020A, 4.000%, 6/01/50 | | | |
| 11,000 | | Louisiana Public Facilities Authority, Revenue Bonds, Loyola University Project, | 10/33 at 100.00 | BBB | 10,374,540 |
| | Refunding Series 2017, 0.000%, 10/01/46 (7) | | | |
| | Louisiana Public Facilities Authority, Revenue Bonds, Ochsner Clinic Foundation Project, | | | |
| | Series 2015: | | | |
| 1,000 | | 4.250%, 5/15/40 | 5/25 at 100.00 | A3 | 1,081,170 |
| 6,970 | | 5.000%, 5/15/47 | 5/25 at 100.00 | A3 | 7,792,321 |
| 1,000 | | New Orleans, Louisiana, Sewerage Service Revenue Bonds, Refunding Series 2014, | 6/24 at 100.00 | BBB+ | 1,094,440 |
| | 4.250%, 6/01/34 | | | |
| 3,275 | | Saint James Parish, Louisiana, Revenue Bonds, NuStar Logistics, LP Project, Series | 6/30 at 100.00 | BB– | 3,882,250 |
| | 2010A, 6.350%, 10/01/40, 144A | | | |
| 43,990 | | Total Louisiana | | | 46,826,178 |
| | Maine – 1.5% (0.9% of Total Investments) | | | |
| 7,530 | | Maine Health and Higher Educational Facilities Authority Revenue Bonds, Eastern Maine | 7/23 at 100.00 | Ba1 | 7,818,474 |
| | Medical Center Obligated Group Issue, Series 2013, 5.000%, 7/01/43 | | | |
| | Maine Health and Higher Educational Facilities Authority Revenue Bonds, Eastern Maine | | | |
| | Medical Center Obligated Group Issue, Series 2016A: | | | |
| 5,450 | | 4.000%, 7/01/41 | 7/26 at 100.00 | Ba1 | 5,548,427 |
| 10,215 | | 4.000%, 7/01/46 | 7/26 at 100.00 | Ba1 | 10,293,655 |
| | Maine Health and Higher Educational Facilities Authority, Revenue Bonds, Maine General | | | |
| | Medical Center, Series 2011: | | | |
| 1,050 | | 6.750%, 7/01/41 | 7/21 at 100.00 | Ba3 | 1,071,746 |
| 1,000 | | 6.950%, 7/01/41 | 7/21 at 100.00 | Ba3 | 1,022,930 |
| 10,000 | | Maine Health and Higher Educational Facilities Authority, Revenue Bonds, Mainehealth | 7/24 at 100.00 | A+ | 11,010,400 |
| | Issue, Series 2015, 5.000%, 7/01/39 | | | |
| | Maine Health and Higher Educational Facilities Authority, Revenue Bonds, MaineHealth | | | |
| | Issue, Series 2020A: | | | |
| 2,745 | | 4.000%, 7/01/45 | 7/30 at 100.00 | A+ | 3,079,204 |
| 5,000 | | 4.000%, 7/01/50 | 7/30 at 100.00 | A+ | 5,575,100 |
| 6,695 | | Maine State Housing Authority, Single Family Mortgage Purchase Bonds, Series 2020D, | 5/29 at 100.00 | AA+ | 6,859,228 |
| | 2.800%, 11/15/45 | | | |
| 49,685 | | Total Maine | | | 52,279,164 |
| | Maryland – 1.4% (0.9% of Total Investments) | | | |
| | Baltimore, Maryland, Convention Center Hotel Revenue Bonds, Refunding Series 2017: | | | |
| 1,280 | | 5.000%, 9/01/33 | 9/27 at 100.00 | BB– | 1,136,230 |
| 3,050 | | 5.000%, 9/01/39 | 9/27 at 100.00 | BB– | 2,679,272 |
| 4,025 | | 5.000%, 9/01/46 | 9/27 at 100.00 | BB– | 3,505,091 |
| 1,000 | | Howard County, Maryland, Special Obligation Bonds, Downtown Columbia Project, Series | 2/26 at 100.00 | N/R | 1,010,990 |
| | 2017A, 4.375%, 2/15/39, 144A | | | |
| 2,500 | | Maryland Health and Higher Educational Facilities Authority, Revenue Bonds, Adventist | 1/22 at 100.00 | Baa3 | 2,621,700 |
| | Healthcare, Series 2011A, 6.000%, 1/01/26 | | | |
| 13,315 | | Maryland Health and Higher Educational Facilities Authority, Revenue Bonds, Adventist | 1/27 at 100.00 | Baa3 | 14,950,748 |
| | Healthcare, Series 2016A, 5.500%, 1/01/46 | | | |
| 10,000 | | Maryland Health and Higher Educational Facilities Authority, Revenue Bonds, LifeBridge | 7/25 at 100.00 | A+ | 11,149,300 |
| | Health System, Series 2015, 5.000%, 7/01/47 | | | |
| 1,500 | | Maryland Health and Higher Educational Facilities Authority, Revenue Bonds, Peninsula | 7/24 at 100.00 | A3 | 1,635,945 |
| | Regional Medical Center Issue, Refunding Series 2015, 5.000%, 7/01/45 | | | |
51
| | |
| NVG | Nuveen AMT-Free Municipal Credit Income Fund Portfolio of Investments (continued) October 31, 2020 |
| | | | | | |
| Principal | | | Optional Call | | |
| Amount (000) | | Description (1) | Provisions (2) | Ratings (3) | Value |
| | Maryland (continued) | | | |
| $ 3,010 | | Maryland Health and Higher Educational Facilities Authority, Revenue Bonds, University | 7/22 at 100.00 | A– (11) | $ 3,242,131 |
| | of Maryland Medical System Issue, Series 2013A, 5.000%, 7/01/43 (Pre-refunded 7/01/22) | | | |
| | Prince George’s County Revenue Authority, Maryland, Special Obligation Bonds, | | | |
| | Suitland-Naylor Road Project, Series 2016: | | | |
| 2,000 | | 4.750%, 7/01/36, 144A | 1/26 at 100.00 | N/R | 2,086,280 |
| 2,300 | | 5.000%, 7/01/46, 144A | 1/26 at 100.00 | N/R | 2,410,653 |
| | Rockville Mayor and Council, Maryland, Economic Development Revenue Bonds, Series 2017B: | | | |
| 1,335 | | 4.250%, 11/01/37 | 11/24 at 103.00 | B– | 1,216,973 |
| 1,250 | | 4.500%, 11/01/43 | 11/24 at 103.00 | B– | 1,131,850 |
| 2,650 | | 5.000%, 11/01/47 | 11/24 at 103.00 | B– | 2,543,868 |
| 49,215 | | Total Maryland | | | 51,321,031 |
| | Massachusetts – 2.7% (1.7% of Total Investments) | | | |
| | Massachusetts Development Finance Agency Revenue Bonds, Lawrence General Hospital Issue, | | | |
| | Series 2014A: | | | |
| 2,245 | | 5.250%, 7/01/34 | 7/24 at 100.00 | B | 2,160,049 |
| 6,195 | | 5.500%, 7/01/44 | 7/24 at 100.00 | B | 5,758,748 |
| | Massachusetts Development Finance Agency Revenue Refunding Bonds, NewBridge on the | | | |
| | Charles, Inc Issue, Series 2017: | | | |
| 8,200 | | 4.125%, 10/01/42, 144A | 10/22 at 105.00 | BB+ | 8,271,012 |
| 3,000 | | 5.000%, 10/01/57, 144A | 10/22 at 105.00 | BB+ | 3,183,210 |
| 10,000 | | Massachusetts Development Finance Agency, Revenue Bonds, CareGroup Issue, Series | 7/28 at 100.00 | A3 | 11,541,300 |
| | 2018J-2, 5.000%, 7/01/53 | | | |
| | Massachusetts Development Finance Agency, Revenue Bonds, Emerson College, Series 2015: | | | |
| 4,020 | | 4.500%, 1/01/45 | 1/25 at 100.00 | Baa2 | 4,221,402 |
| 2,950 | | 5.000%, 1/01/45 | 1/25 at 100.00 | Baa2 | 3,181,073 |
| 4,035 | | Massachusetts Development Finance Agency, Revenue Bonds, Emmanuel College, Series 2016A, | 10/26 at 100.00 | Baa2 | 4,157,180 |
| | 4.000%, 10/01/46 | | | |
| 16,280 | | Massachusetts Development Finance Agency, Revenue Bonds, Massachusetts Institute of | No Opt. Call | AAA | 25,773,682 |
| | Technology, Series 2020P, 5.000%, 7/01/50 | | | |
| 900 | | Massachusetts Development Finance Agency, Revenue Bonds, Milford Regional Medical Center | 7/30 at 100.00 | BB+ | 1,018,341 |
| | Issue, Series 2020G, 5.000%, 7/15/46, 144A | | | |
| 6,000 | | Massachusetts Development Finance Authority, Revenue Bonds, WGBH Educational Foundation, | No Opt. Call | AA– | 9,269,820 |
| | Series 2002A, 5.750%, 1/01/42 – AMBAC Insured | | | |
| 7,405 | | Massachusetts Health and Educational Facilities Authority, Revenue Bonds, Massachusetts | No Opt. Call | AAA | 10,786,789 |
| | Institute of Technology, Series 2002K, 5.500%, 7/01/32 (UB) (5) | | | |
| 2,800 | | Massachusetts Housing Finance Agency, Housing Bonds, Series 2014D, 3.875%, 12/01/39 | 6/24 at 100.00 | AA– | 2,967,076 |
| 4,560 | | Massachusetts School Building Authority, Dedicated Sales Tax Revenue Bonds, Senior | 5/23 at 100.00 | Aa2 (11) | 5,099,266 |
| | Series 2013A, 5.000%, 5/15/43 (Pre-refunded 5/15/23) | | | |
| 425 | | Massachusetts Water Pollution Abatement Trust, Revenue Bonds, MWRA Loan Program, | 11/20 at 100.00 | AAA | 426,692 |
| | Subordinate Series 1999A, 5.750%, 8/01/29 | | | |
| 79,015 | | Total Massachusetts | | | 97,815,640 |
| | Michigan – 2.2% (1.4% of Total Investments) | | | |
| 5,490 | | Detroit City School District, Wayne County, Michigan, Unlimited Tax School Building and | No Opt. Call | AA | 6,932,992 |
| | Site Improvement Bonds, Series 2001A, 6.000%, 5/01/29 – AGM Insured (UB) | | | |
| 3,665 | | Detroit Downtown Development Authority, Michigan, Tax Increment Revenue Bonds, Catalyst | 7/24 at 100.00 | AA | 4,070,349 |
| | Development Project, Series 2018A, 5.000%, 7/01/48 – AGM Insured | | | |
| 2,985 | | Detroit Water and Sewerage Department, Michigan, Sewage Disposal System Revenue Bonds, | 7/22 at 100.00 | A1 (11) | 3,232,755 |
| | Refunding Senior Lien Series 2012A, 5.250%, 7/01/39 (Pre-refunded 7/01/22) | | | |
| | Michigan Finance Authority, Hospital Revenue Bonds, Sparrow Obligated Group, Refunding | | | |
| | Series 2015: | | | |
| 4,495 | | 4.000%, 11/15/35 | 5/25 at 100.00 | A | 4,842,463 |
| 2,550 | | 4.000%, 11/15/36 | 5/25 at 100.00 | A | 2,740,817 |
52
| | | | | | |
| Principal | | | Optional Call | | |
| Amount (000) | | Description (1) | Provisions (2) | Ratings (3) | Value |
| | Michigan (continued) | | | |
| | Michigan Finance Authority, Michigan, Revenue Bonds, Trinity Health Credit Group, | | | |
| | Refunding Series 2016MI: | | | |
| $ 145 | | 5.000%, 12/01/45 (Pre-refunded 6/01/26) (UB) (5) | 6/26 at 100.00 | N/R (11) | $ 180,667 |
| 9,855 | | 5.000%, 12/01/45 (UB) | 6/26 at 100.00 | AA– | 11,391,197 |
| | Michigan Finance Authority, Revenue Bonds, Trinity Health Credit Group, Refunding | | | |
| | Series 2011MI: | | | |
| 10 | | 5.000%, 12/01/39 (Pre-refunded 12/01/21) | 12/21 at 100.00 | N/R (11) | 10,502 |
| 3,240 | | 5.000%, 12/01/39 (Pre-refunded 12/01/21) | 12/21 at 100.00 | AA– (11) | 3,406,277 |
| 2,705 | | Michigan Finance Authority, Tobacco Settlement Asset- Backed Bonds, 2006 Sold Tobacco | 12/30 at 100.00 | BBB | 3,074,097 |
| | Receipts Senior Current Interest Series 2020A-2, 5.000%, 6/01/40 | | | |
| 1,000 | | Michigan Finance Authority, Tobacco Settlement Asset- Backed Bonds, 2007 Sold Tobacco | 12/30 at 100.00 | BBB+ | 1,088,210 |
| | Receipts, Series 2020A-CL-1, 4.000%, 6/01/49 | | | |
| 4,000 | | Michigan Public Power Agency, AFEC Project Revenue Bonds, Series 2012A, 5.000%, 1/01/43 | 1/22 at 100.00 | BBB+ | 4,156,080 |
| | Michigan State Building Authority, Revenue Bonds, Facilities Program, Refunding Series | | | |
| | 2011-II-A: | | | |
| 2,750 | | 5.375%, 10/15/36 (Pre-refunded 10/15/21) | 10/21 at 100.00 | AA– (11) | 2,884,723 |
| 8,260 | | 5.375%, 10/15/41 (Pre-refunded 10/15/21) | 10/21 at 100.00 | AA– (11) | 8,664,657 |
| 13,855 | | Michigan State Hospital Finance Authority, Revenue Bonds, Trinity Health Care Group, | 6/22 at 100.00 | AA– (11) | 14,881,517 |
| | Series 2009C, 5.000%, 12/01/48 (Pre-refunded 6/01/22) | | | |
| | Wayne County Airport Authority, Michigan, Revenue Bonds, Detroit Metropolitan Wayne | | | |
| | County Airport, Series 2015D: | | | |
| 3,550 | | 5.000%, 12/01/40 | 12/25 at 100.00 | A– | 4,108,202 |
| 3,600 | | 5.000%, 12/01/45 | 12/25 at 100.00 | A– | 4,147,164 |
| 72,155 | | Total Michigan | | | 79,812,669 |
| | Minnesota – 1.7% (1.1% of Total Investments) | | | |
| | Baytown Township, Minnesota Charter School Lease Revenue Bonds, Saint Croix Preparatory | | | |
| | Academy, Refunding Series 2016A: | | | |
| 155 | | 4.000%, 8/01/36 | 8/26 at 100.00 | BB+ | 159,728 |
| 440 | | 4.000%, 8/01/41 | 8/26 at 100.00 | BB+ | 448,813 |
| 2,000 | | Brooklyn Park, Minnesota, Charter School Lease Revenue Bonds, Prairie Seeds Academy | 3/25 at 100.00 | BB– | 2,045,120 |
| | Project, Refunding Series 2015A, 5.000%, 3/01/34 | | | |
| 1,720 | | Deephaven, Minnesota, Charter School Lease Revenue Bonds, Eagle Ridge Academy Project, | 7/25 at 100.00 | BB+ | 1,867,456 |
| | Series 2015A, 5.500%, 7/01/50 | | | |
| | Duluth Economic Development Authority, Minnesota, Health Care Facilities Revenue Bonds, | | | |
| | Essentia Health Obligated Group, Series 2018A: | | | |
| 9,560 | | 4.250%, 2/15/43 | 2/28 at 100.00 | A– | 10,389,999 |
| 27,325 | | 4.250%, 2/15/48 | 2/28 at 100.00 | A– | 29,471,925 |
| 1,410 | | Minneapolis, Minnesota, Charter School Lease Revenue Bonds, Hiawatha Academies Project, | 7/24 at 102.00 | N/R | 1,460,478 |
| | Series 2016A, 5.000%, 7/01/47 | | | |
| 2,920 | | Minnesota Housing Finance Agency, Residential Housing Finance Bonds, Series 2020E, | 7/29 at 100.00 | AA+ | 2,957,201 |
| | 2.700%, 7/01/44 | | | |
| | Saint Cloud, Minnesota, Charter School Lease Revenue Bonds, Stride Academy Project, | | | |
| | Series 2016A: | | | |
| 405 | | 5.000%, 4/01/36 (4) | 4/26 at 100.00 | N/R | 275,400 |
| 605 | | 5.000%, 4/01/46 (4) | 4/26 at 100.00 | N/R | 411,400 |
| 2,500 | | Saint Paul Housing and Redevelopment Authority, Minnesota, Health Care Facility Revenue | 7/25 at 100.00 | A | 2,700,800 |
| | Bonds, HealthPartners Obligated Group, Refunding Series 2015A, 4.000%, 7/01/35 | | | |
| 145 | | Saint Paul Housing and Redevelopment Authority, Minnesota, Multifamily Housing Revenue | 4/23 at 100.00 | N/R | 148,876 |
| | Bonds, 2700 University at Westgate Station, Series 2015B, 4.250%, 4/01/25 | | | |
| | St Paul Housing and Redevelopment Authority, Minnesota, Hospital Revenue Bonds, | | | |
| | HealthEast Inc, Series 2015A: | | | |
| 2,785 | | 5.000%, 11/15/40 (Pre-refunded 11/15/25) | 11/25 at 100.00 | N/R (11) | 3,414,939 |
| 3,190 | | 5.000%, 11/15/44 (Pre-refunded 11/15/25) | 11/25 at 100.00 | N/R (11) | 3,911,546 |
| 55,160 | | Total Minnesota | | | 59,663,681 |
53
| | |
| NVG | Nuveen AMT-Free Municipal Credit Income Fund Portfolio of Investments (continued) October 31, 2020 |
| | | | | | |
| Principal | | | Optional Call | | |
| Amount (000) | | Description (1) | Provisions (2) | Ratings (3) | Value |
| | Mississippi – 0.2% (0.1% of Total Investments) | | | |
| $ 5,445 | | Mississippi Development Bank, Special Obligation Bonds, Gulfport Water and Sewer System | No Opt. Call | A2 (11) | $ 6,129,164 |
| | Project, Series 2005, 5.250%, 7/01/24 – AGM Insured (ETM) | | | |
| | Missouri – 2.3% (1.5% of Total Investments) | | | |
| 2,960 | | Chesterfield Valley Transportation Development District, Missouri, Transportation Sales | 5/23 at 100.00 | A– | 3,073,338 |
| | Tax Revenue Bonds, Series 2015, 3.625%, 5/15/31 | | | |
| | Kansas City Industrial Development Authority, Missouri, Sales Tax Revenue Bonds, Ward�� | | | |
| | Parkway Center Community Improvement District, Senior Refunding & Improvement Series 2016: | | | |
| 400 | | 5.000%, 4/01/36, 144A | 4/26 at 100.00 | N/R | 397,856 |
| 1,520 | | 5.000%, 4/01/46, 144A | 4/26 at 100.00 | N/R | 1,456,662 |
| 15,000 | | Kansas City Municipal Assistance Corporation, Missouri, Leasehold Revenue Bonds, Series | No Opt. Call | A1 | 13,414,200 |
| | 2004B-1, 0.000%, 4/15/28 – AMBAC Insured | | | |
| 4,345 | | Kirkwood Industrial Development Authority, Missouri, Retirement Community Revenue Bonds, | 5/27 at 100.00 | BB | 4,545,131 |
| | Aberdeen Heights Project, Refunding Series 2017A, 5.250%, 5/15/50 | | | |
| | Liberty, Missouri, Special Obligation Tax Increment and Special Districts Bonds, Liberty | | | |
| | Commons Project, Series 2015A: | | | |
| 1,575 | | 5.750%, 6/01/35, 144A | 6/25 at 100.00 | N/R | 1,520,710 |
| 1,055 | | 6.000%, 6/01/46, 144A | 6/25 at 100.00 | N/R | 1,021,483 |
| 2,460 | | Missouri Health and Educational Facilities Authority, Educational Facilities Revenue | 5/23 at 100.00 | BBB | 2,575,128 |
| | Bonds, Saint Louis College of Pharmacy, Series 2013, 5.500%, 5/01/43 | | | |
| | Missouri Health and Educational Facilities Authority, Educational Facilities Revenue | | | |
| | Bonds, Saint Louis College of Pharmacy, Series 2015B: | | | |
| 1,410 | | 5.000%, 5/01/40 | 11/23 at 100.00 | BBB | 1,465,145 |
| 2,000 | | 5.000%, 5/01/45 | 11/23 at 100.00 | BBB | 2,067,120 |
| 7,040 | | Missouri Health and Educational Facilities Authority, Health Facilities Revenue Bonds, | 11/23 at 100.00 | A2 | 7,615,379 |
| | CoxHealth, Series 2013A, 5.000%, 11/15/48 | | | |
| 2,250 | | Missouri Health and Educational Facilities Authority, Health Facilities Revenue Bonds, | 2/22 at 100.00 | A1 | 2,338,897 |
| | Heartland Regional Medical Center, Series 2012, 5.000%, 2/15/43 | | | |
| | Missouri Health and Educational Facilities Authority, Health Facilities Revenue Bonds, | | | |
| | Mosaic Health System, Series 2019A: | | | |
| 6,330 | | 4.000%, 2/15/44 | 2/29 at 100.00 | A1 | 7,076,434 |
| 13,545 | | 4.000%, 2/15/49 | 2/29 at 100.00 | A1 | 15,031,293 |
| 1,010 | | Plaza at Noah’s Ark Community Improvement District, Saint Charles, Missouri, Tax | 5/21 at 100.00 | N/R | 1,015,323 |
| | Increment and Improvement District Revenue Bonds, Series 2015, 5.000%, 5/01/30 | | | |
| 405 | | Saint Louis County Industrial Development Authority, Missouri, Revenue Bonds, Friendship | 9/23 at 100.00 | BB+ | 431,673 |
| | Village of Sunset Hills, Series 2013A, 5.875%, 9/01/43 | | | |
| | Saint Louis County Industrial Development Authority, Missouri, Revenue Bonds, Saint | | | |
| | Andrew’s Resources for Seniors, Series 2015A: | | | |
| 1,650 | | 5.000%, 12/01/35 | 12/25 at 100.00 | N/R | 1,619,112 |
| 455 | | 5.125%, 12/01/45 | 12/25 at 100.00 | N/R | 433,101 |
| 4,125 | | Saint Louis, Missouri, Airport Revenue Bonds, Lambert-St Louis International Airport, | No Opt. Call | A– | 5,365,965 |
| | Series 2005, 5.500%, 7/01/29 – NPFG Insured | | | |
| 15,350 | | Springfield Public Building Corporation, Missouri, Lease Revenue Bonds, Jordan Valley | No Opt. Call | N/R | 11,523,398 |
| | Park Projects, Series 2000A, 0.000%, 6/01/30 – AMBAC Insured | | | |
| 84,885 | | Total Missouri | | | 83,987,348 |
| | Montana – 0.1% (0.1% of Total Investments) | | | |
| | Kalispell, Montana, Housing and Healthcare Facilities Revenue Bonds, Immanuel Lutheran | | | |
| | Corporation, Series 2017A: | | | |
| 1,175 | | 5.250%, 5/15/37 | 5/25 at 102.00 | N/R | 1,186,609 |
| 375 | | 5.250%, 5/15/47 | 5/25 at 102.00 | N/R | 372,338 |
| 3,000 | | Montana Facility Finance Authority, Hospital Revenue Bonds, Benefis Health System | 1/21 at 100.00 | A2 (11) | 3,026,490 |
| | Obligated Group, Series 2011A, 5.750%, 1/01/31 (Pre-refunded 1/01/21) – AGM Insured | | | |
| 4,550 | | Total Montana | | | 4,585,437 |
54
| | | | | | |
| Principal | | | Optional Call | | |
| Amount (000) | | Description (1) | Provisions (2) | Ratings (3) | Value |
| | Nebraska – 1.4% (0.9% of Total Investments) | | | |
| $ 10,665 | | Central Plains Energy Project, Nebraska, Gas Project 3 Revenue Bonds, Refunding | No Opt. Call | BBB+ | $ 14,514,425 |
| | Crossover Series 2017A, 5.000%, 9/01/42 | | | |
| 4,435 | | Central Plains Energy Project, Nebraska, Gas Project 3 Revenue Bonds, Series 2012, | 9/22 at 100.00 | BBB+ | 4,752,102 |
| | 5.000%, 9/01/32 | | | |
| 1,330 | | Douglas County Hospital Authority 2, Nebraska, Health Facilities Revenue Bonds, Nebraska | 11/25 at 100.00 | A | 1,491,263 |
| | Methodist Health System, Refunding Series 2015, 5.000%, 11/01/45 | | | |
| | Douglas County Hospital Authority 3, Nebraska, Health Facilities Revenue Bonds, Nebraska | | | |
| | Methodist Health System, Refunding Series 2015: | | | |
| 2,090 | | 4.125%, 11/01/36 | 11/25 at 100.00 | A | 2,273,920 |
| 2,325 | | 5.000%, 11/01/48 | 11/25 at 100.00 | A | 2,602,233 |
| 4,010 | | Lincoln County Hospital Authority 1, Nebraska, Hospital Revenue and Refunding Bonds, | 11/21 at 100.00 | A (11) | 4,192,054 |
| | Great Plains Regional Medical Center Project, Series 2012, 5.000%, 11/01/42 | | | |
| | (Pre-refunded 11/01/21) | | | |
| 2,230 | | Nebraska Investment Finance Authority, Single Family Housing Revenue Bonds, Series | 9/27 at 100.00 | AA+ | 2,428,492 |
| | 2018C, 3.750%, 9/01/38 | | | |
| 9,160 | | Nebraska Investment Finance Authority, Single Family Housing Revenue Bonds, Series | 3/29 at 100.00 | AA+ | 9,308,209 |
| | 2020A, 2.700%, 9/01/43 | | | |
| 6,800 | | Scotts Bluff County Hospital Authority 1, Nebraska, Hospital Revenue Bonds, Regional | 2/27 at 100.00 | BB+ | 7,156,388 |
| | West Medical Center Project, Refunding & Improvement Series 2016A, 5.250%, 2/01/37 | | | |
| 43,045 | | Total Nebraska | | | 48,719,086 |
| | Nevada – 1.1% (0.7% of Total Investments) | | | |
| 410 | | Director of the State of Nevada Department of Business and Industry, Charter School | 12/25 at 100.00 | BB | 425,900 |
| | Lease Revenue Bonds, Somerset Academy, Series 2018A, 5.000%, 12/15/38, 144A | | | |
| 23,605 | | Las Vegas Convention and Visitors Authority, Nevada, Convention Center Expansion Revenue | 7/28 at 100.00 | A | 24,700,508 |
| | Bonds, Series 2018B, 4.000%, 7/01/49 | | | |
| 3,150 | | Las Vegas Convention and Visitors Authority, Nevada, Revenue Bonds, Refunding Series | 7/27 at 100.00 | A | 3,332,227 |
| | 2017B, 4.000%, 7/01/36 | | | |
| 1,000 | | Las Vegas, Nevada, Sales Tax Increment Revenue Bonds, Symphony Park Tourism Improvement | 6/21 at 100.00 | N/R | 978,190 |
| | District, Series 2016, 4.375%, 6/15/35, 144A | | | |
| 500 | | Nevada State Director of the Department of Business and Industry, Charter School Revenue | 7/25 at 100.00 | BB+ | 536,700 |
| | Bonds, Doral Academy of Nevada, Series 2017A, 5.000%, 7/15/37, 144A | | | |
| 4,000 | | Reno, Nevada, Subordinate Lien Sales Tax Revenue Refunding Bonds, ReTrac-Reno | 12/28 at 100.00 | A3 | 4,047,840 |
| | Transportation Rail Access Corridor Project, Series 2018A, 4.000%, 6/01/43 | | | |
| 4,500 | | Reno, Nevada, Subordinate Lien Sales Tax Revenue Refunding Capital Appreciation Bonds, | 7/38 at 31.26 | N/R | 618,930 |
| | ReTrac-Reno Transportation Rail Access Corridor Project, Series 2018C, 0.000%, 7/01/58, 144A | | | |
| 3,210 | | Tahoe-Douglas Visitors Authority, Nevada, Stateline Revenue Refunding Bonds, Series 2020, | 7/30 at 100.00 | N/R | 3,403,884 |
| | 5.000%, 7/01/51 (WI/DD, Settling 11/10/20) | | | |
| 40,375 | | Total Nevada | | | 38,044,179 |
| | New Hampshire – 0.2% (0.1% of Total Investments) | | | |
| 5,000 | | National Finance Authority, New Hampshire, Resource Recovery Revenue Bonds, Covanta | 7/23 at 100.00 | B | 5,053,950 |
| | Project, Refunding Series 2018B, 4.625%, 11/01/42, 144A | | | |
| 1,185 | | National Finance Authority, New Hampshire, Resource Recovery Revenue Bonds, Covanta | 7/25 at 100.00 | B | 1,170,330 |
| | Project, Refunding Series 2020A, 3.625%, 7/01/43 (Mandatory Put 7/02/40), 144A | | | |
| 500 | | New Hampshire Health and Education Facilities Authority, Revenue Bonds, Kendal at | 10/26 at 100.00 | BBB+ | 533,665 |
| | Hanover, Series 2016, 5.000%, 10/01/40 | | | |
| 6,685 | | Total New Hampshire | | | 6,757,945 |
| | New Jersey – 5.6% (3.5% of Total Investments) | | | |
| | New Jersey Economic Development Authority, School Facilities Construction Bonds, | | | |
| | Refunding Series 2016BBB: | | | |
| 34,310 | | 5.500%, 6/15/29 | 12/26 at 100.00 | BBB+ | 40,072,708 |
| 2,110 | | 5.500%, 6/15/30 | 12/26 at 100.00 | BBB+ | 2,466,084 |
55
| | |
| NVG | Nuveen AMT-Free Municipal Credit Income Fund Portfolio of Investments (continued) October 31, 2020 |
| | | | | | |
| Principal | | | Optional Call | | |
| Amount (000) | | Description (1) | Provisions (2) | Ratings (3) | Value |
| | New Jersey (continued) | | | |
| | New Jersey Economic Development Authority, School Facilities Construction Bonds, | | | |
| | Series 2005N-1: | | | |
| $ 6,835 | | 5.500%, 9/01/24 – AMBAC Insured | No Opt. Call | BBB+ | $ 7,811,243 |
| 5,000 | | 5.500%, 9/01/28 – NPFG Insured | No Opt. Call | BBB+ | 6,056,350 |
| | New Jersey Economic Development Authority, School Facilities Construction Bonds, | | | |
| | Series 2015WW: | | | |
| 655 | | 5.250%, 6/15/40 (Pre-refunded 6/15/25) | 6/25 at 100.00 | N/R (11) | 803,200 |
| 11,335 | | 5.250%, 6/15/40 | 6/25 at 100.00 | BBB+ | 12,390,062 |
| 600 | | New Jersey Health Care Facilities Financing Authority, New Jersey, Revenue Bonds, Saint | 7/21 at 100.00 | BB+ | 615,342 |
| | Peters University Hospital, Refunding Series 2011, 6.000%, 7/01/26 | | | |
| 1,500 | | New Jersey Health Care Facilities Financing Authority, New Jersey, Revenue Bonds, Saint | 11/20 at 100.00 | BB+ | 1,504,290 |
| | Peters University Hospital, Series 2007, 5.750%, 7/01/37 | | | |
| 3,310 | | New Jersey Health Care Facilities Financing Authority, Revenue Bonds, Barnabas Health, | 7/24 at 100.00 | A1 | 3,656,954 |
| | Refunding Series 2014A, 5.000%, 7/01/44 | | | |
| 2,015 | | New Jersey Transportation Trust Fund Authority, Transportation System Bonds, Capital | No Opt. Call | BBB+ | 1,714,221 |
| | Appreciation Series 2010A, 0.000%, 12/15/26 | | | |
| 2,150 | | New Jersey Transportation Trust Fund Authority, Transportation System Bonds, Refunding | No Opt. Call | BBB+ | 2,161,180 |
| | Series 2006A, 5.250%, 12/15/20 | | | |
| 20,000 | | New Jersey Transportation Trust Fund Authority, Transportation System Bonds, Refunding | No Opt. Call | BBB+ | 13,634,400 |
| | Series 2006C, 0.000%, 12/15/33 – AGM Insured | | | |
| 20,040 | | New Jersey Transportation Trust Fund Authority, Transportation System Bonds, Series | 6/24 at 100.00 | BBB+ | 21,526,968 |
| | 2014AA, 5.000%, 6/15/44 | | | |
| | New Jersey Transportation Trust Fund Authority, Transportation System Bonds, | | | |
| | Series 2015AA: | | | |
| 13,680 | | 4.750%, 6/15/38 | 6/25 at 100.00 | BBB+ | 14,575,082 |
| 8,230 | | 5.000%, 6/15/45 | 6/25 at 100.00 | BBB+ | 8,844,946 |
| 5,000 | | New Jersey Transportation Trust Fund Authority, Transportation System Bonds, Series | 12/28 at 100.00 | BBB+ | 5,679,600 |
| | 2019AA, 5.250%, 6/15/43 | | | |
| 33,200 | | New Jersey Turnpike Authority, Revenue Bonds, Refunding Series 2005D-1, 5.250%, 1/01/26 – | No Opt. Call | A2 | 40,707,516 |
| | AGM Insured | | | |
| 200 | | New Jersey Turnpike Authority, Revenue Bonds, Tender Option Bond Trust 2016-XF1057, | 7/22 at 100.00 | A | 256,198 |
| | 17.227%, 1/01/43, 144A (IF) (5) | | | |
| 1,135 | | Rutgers State University, New Jersey, Revenue Bonds, Refunding Series 2013L, 5.000%, | 5/23 at 100.00 | A+ (11) | 1,268,680 |
| | 5/01/43 (Pre-refunded 5/01/23) | | | |
| 5,000 | | South Jersey Transportation Authority, New Jersey, Transportation System Revenue Bonds, | 11/30 at 100.00 | Baa2 | 5,425,650 |
| | Series 2020A, 4.000%, 11/01/50 | | | |
| 3,000 | | Tobacco Settlement Financing Corporation, New Jersey, Tobacco Settlement Asset-Backed | 6/28 at 100.00 | BBB+ | 3,512,130 |
| | Bonds, Series 2018A, 5.250%, 6/01/46 | | | |
| 3,410 | | Tobacco Settlement Financing Corporation, New Jersey, Tobacco Settlement Asset-Backed | 6/28 at 100.00 | BB+ | 3,859,267 |
| | Bonds, Series 2018B, 5.000%, 6/01/46 | | | |
| 1,330 | | Washington Township Board of Education, Mercer County, New Jersey, General Obligation | No Opt. Call | A2 | 1,617,799 |
| | Bonds, Series 2005, 5.250%, 1/01/26 – AGM Insured | | | |
| 184,045 | | Total New Jersey | | | 200,159,870 |
| | New Mexico – 0.1% (0.0% of Total Investments) | | | |
| | Santa Fe, New Mexico, Retirement Facilities Revenue Bonds, EL Castillo Retirement | | | |
| | Residences Project, Series 2019A: | | | |
| 670 | | 5.000%, 5/15/44 | 5/26 at 103.00 | BB+ | 702,709 |
| 1,200 | | 5.000%, 5/15/49 | 5/26 at 103.00 | BB+ | 1,252,476 |
| 1,870 | | Total New Mexico | | | 1,955,185 |
| | New York – 6.4% (4.0% of Total Investments) | | | |
| 15,275 | | Build NYC Resource Corporation, New York, Revenue Bonds, Albert Einstein College of | 9/25 at 100.00 | N/R | 16,395,574 |
| | Medicine, Inc, Series 2015, 5.500%, 9/01/45, 144A | | | |
56
| | | | | | |
| Principal | | | Optional Call | | |
| Amount (000) | | Description (1) | Provisions (2) | Ratings (3) | Value |
| | New York (continued) | | | |
| $ 2,250 | | Dormitory Authority of the State of New York, Insured Revenue Bonds, Mount Sinai School | No Opt. Call | Baa2 | $ 2,508,053 |
| | of Medicine, Series 1994A, 5.150%, 7/01/24 – NPFG Insured | | | |
| 9,700 | | Dormitory Authority of the State of New York, Revenue Bonds, Columbia University, Series | No Opt. Call | AAA | 15,106,295 |
| | 2017A, 5.000%, 10/01/47 (UB) (5) | | | |
| 4,070 | | Dormitory Authority of the State of New York, Revenue Bonds, Icahn School of Medicine at | 7/25 at 100.00 | A– | 4,558,970 |
| | Mount Sinai, Refunding Series 2015A, 5.000%, 7/01/45 | | | |
| | Dormitory Authority of the State of New York, Revenue Bonds, Orange Regional Medical | | | |
| | Center Obligated Group, Series 2015: | | | |
| 2,700 | | 5.000%, 12/01/40, 144A | 6/25 at 100.00 | BBB– | 2,974,914 |
| 5,600 | | 5.000%, 12/01/45, 144A | 6/25 at 100.00 | BBB– | 6,123,320 |
| 7,500 | | Dormitory Authority of the State of New York, Revenue Bonds, Rockefeller University, | 7/29 at 100.00 | AA | 8,604,525 |
| | Series 2019C, 4.000%, 7/01/49 | | | |
| 2,120 | | Hempstead Town Local Development Corporation, New York, Education Revenue Bonds, The | 2/30 at 100.00 | N/R | 2,172,110 |
| | Academy Charter School Project, Refunding Series 2020B, 5.570%, 2/01/41 | | | |
| 2,695 | | Hempstead Town Local Development Corporation, New York, Education Revenue Bonds, The | 2/27 at 100.00 | N/R | 2,849,909 |
| | Academy Charter School Project, Series 2017A, 6.240%, 2/01/47 | | | |
| 2,965 | | Hempstead Town Local Development Corporation, New York, Education Revenue Bonds, The | 2/28 at 100.00 | N/R | 3,269,120 |
| | Academy Charter School Project, Series 2018A, 6.760%, 2/01/48 | | | |
| 1,270 | | Hempstead Town Local Development Corporation, New York, Education Revenue Bonds, The | 2/30 at 100.00 | N/R | 1,301,001 |
| | Academy Charter School Project, Series 2020A, 5.730%, 2/01/50 | | | |
| | Hudson Yards Infrastructure Corporation, New York, Revenue Bonds, Senior Fiscal 2012 | | | |
| | Series 2011A: | | | |
| 105 | | 5.250%, 2/15/47 (Pre-refunded 2/15/21) | 2/21 at 100.00 | Aa3 (11) | 106,507 |
| 2,295 | | 5.250%, 2/15/47 | 2/21 at 100.00 | AA– | 2,324,399 |
| 325 | | 5.750%, 2/15/47 | 2/21 at 100.00 | AA– | 329,729 |
| 525 | | 5.750%, 2/15/47 (Pre-refunded 2/15/21) | 2/21 at 100.00 | Aa3 (11) | 533,279 |
| 6,075 | | Long Island Power Authority, New York, Electric System Revenue Bonds, Series 2011A, | 5/21 at 100.00 | A2 (11) | 6,221,164 |
| | 5.000%, 5/01/36 (Pre-refunded 5/01/21) – AGM Insured | | | |
| | Long Island Power Authority, New York, Electric System Revenue Bonds, Series 2012A: | | | |
| 3,320 | | 5.000%, 9/01/42 (Pre-refunded 9/01/22) | 9/22 at 100.00 | N/R (11) | 3,609,936 |
| 6,680 | | 5.000%, 9/01/42 | 9/22 at 100.00 | A2 | 7,068,108 |
| 7,500 | | Metropolitan Transportation Authority, New York, Series 2020E, 4.000%, 11/15/45 (WI/DD, | 11/30 at 100.00 | BBB+ | 7,476,450 |
| | Settling 11/13/20) | | | |
| 7,150 | | Metropolitan Transportation Authority, New York, Transportation Revenue Bonds, Bond | No Opt. Call | N/R | 7,275,268 |
| | Anticipation Note Series 2020A-1, 5.000%, 2/01/23 | | | |
| | Metropolitan Transportation Authority, New York, Transportation Revenue Bonds, Green | | | |
| | Climate Bond Certified Series 2020C-1: | | | |
| 2,790 | | 5.000%, 11/15/50 | 5/30 at 100.00 | BBB+ | 3,020,817 |
| 3,155 | | 5.250%, 11/15/55 | 5/30 at 100.00 | BBB+ | 3,483,435 |
| 5,000 | | Metropolitan Transportation Authority, New York, Transportation Revenue Bonds, Green | 11/30 at 100.00 | BBB+ | 5,016,350 |
| | Climate Bond Certified Series 2020D-3, 4.000%, 11/15/49 | | | |
| 2,440 | | Metropolitan Transportation Authority, New York, Transportation Revenue Bonds, Refunding | No Opt. Call | BBB+ | 2,582,179 |
| | Green Climate Certified Series 2017C-1, 5.000%, 11/15/24 | | | |
| 11,790 | | Monroe County Industrial Development Corporation, New York, FHA Insured Mortgage Revenue | 2/21 at 100.00 | AA | 11,911,201 |
| | Bonds, Unity Hospital of Rochester Project, Series 2010, 5.500%, 8/15/40 | | | |
| 3,585 | | Monroe County Industrial Development Corporation, New York, Revenue Bonds, Saint Ann’s | 1/26 at 103.00 | N/R | 3,678,999 |
| | Community Project, Series 2019, 5.000%, 1/01/50 | | | |
| 1,000 | | Nassau County Local Economic Assistance Corporation, New York, Revenue Bonds, Catholic | 7/24 at 100.00 | A– | 1,113,770 |
| | Health Services of Long Island Obligated Group Project, Series 2014, 5.000%, 7/01/31 | | | |
| 15,000 | | New York City Housing Development Corporation, New York, Sustainable Impact Revenue | 2/28 at 100.00 | Aa2 | 15,199,500 |
| | Bonds, Williamsburg Housing Preservation LP, Series 2020A, 2.800%, 2/01/50 | | | |
| 11,570 | | New York City Municipal Water Finance Authority, New York, Water and Sewer System Second | 6/25 at 100.00 | AA+ | 13,457,298 |
| | General Resolution Revenue Bonds, Fiscal 2016 Series BB-1, 5.000%, 6/15/46 (UB) (5) | | | |
57
| | |
| NVG | Nuveen AMT-Free Municipal Credit Income Fund Portfolio of Investments (continued) October 31, 2020 |
| | | | | | |
| Principal | | | Optional Call | | |
| Amount (000) | | Description (1) | Provisions (2) | Ratings (3) | Value |
| | New York (continued) | | | |
| $ 5 | | New York City, New York, General Obligation Bonds, Fiscal Series 2005M, 5.000%, 4/01/26 – | 11/20 at 100.00 | AA | $ 5,018 |
| | FGIC Insured | | | |
| 28,615 | | New York Liberty Development Corporation, New York, Liberty Revenue Bonds, 3 World Trade | 11/24 at 100.00 | N/R | 29,317,212 |
| | Center Project, Class 1 Series 2014, 5.000%, 11/15/44, 144A | | | |
| 2,560 | | New York Liberty Development Corporation, New York, Liberty Revenue Bonds, Bank of | 3/29 at 100.00 | Baa2 | 2,443,699 |
| | America Tower at One Bryant Park Project, Second Priority Refunding Series 2019 Class 3, | | | |
| | 2.800%, 9/15/69 | | | |
| 3,500 | | New York State Housing Finance Agency, Affordable Housing Revenue Bonds, Climate Bond | 5/28 at 100.00 | Aa2 | 3,579,345 |
| | Certified/Sustainability Series 2019P, 3.050%, 11/01/49 | | | |
| 6,500 | | New York State Mortgage Agency, Homeowner Mortgage Revenue Bonds, Series 211, | 4/27 at 100.00 | Aa1 | 6,964,165 |
| | 3.750%, 10/01/43 | | | |
| 5,655 | | Onondaga Civic Development Corporation, New York, Revenue Bonds, Saint Joseph’s Hospital | 7/22 at 100.00 | N/R (11) | 6,094,054 |
| | Health Center Project, Series 2012, 5.000%, 7/01/42 (Pre-refunded 7/01/22) | | | |
| | Port Authority of New York and New Jersey, Special Project Bonds, JFK International Air | | | |
| | Terminal LLC Project, Eighth Series 2010: | | | |
| 8,550 | | 5.500%, 12/01/31 | 12/20 at 100.00 | BBB | 8,584,969 |
| 3,155 | | 6.000%, 12/01/36 | 12/20 at 100.00 | BBB | 3,167,904 |
| 7,110 | | TSASC Inc, New York, Tobacco Asset-Backed Bonds, Series 2006, 5.000%, 6/01/48 | 6/27 at 100.00 | N/R | 7,347,047 |
| 212,100 | | Total New York | | | 227,775,593 |
| | North Carolina – 0.7% (0.4% of Total Investments) | | | |
| 10,000 | | North Carolina Medical Care Commission, Health Care Facilities Revenue Bonds, Duke | 6/22 at 100.00 | AA (11) | 10,749,100 |
| | University Health System, Series 2012A, 5.000%, 6/01/42 (Pre-refunded 6/01/22) | | | |
| 4,715 | | North Carolina Medical Care Commission, Health Care Facilities Revenue Bonds, Vidant | 6/22 at 100.00 | A2 (11) | 5,064,334 |
| | Health, Refunding Series 2012A, 5.000%, 6/01/36 (Pre-refunded 6/01/22) | | | |
| 2,150 | | North Carolina Medical Care Commission, Health Care Facilities Revenue Bonds, WakeMed, | 10/22 at 100.00 | A2 | 2,268,013 |
| | Refunding Series 2012A, 5.000%, 10/01/38 | | | |
| 2,150 | | North Carolina Medical Care Commission, Retirement Facilities First Mortgage Revenue | 7/27 at 100.00 | N/R | 2,146,711 |
| | Bonds, Aldersgate United Retirement Community Inc, Refunding Series 2017A, 5.000%, 7/01/47 | | | |
| 1,690 | | North Carolina Turnpike Authority, Monroe Expressway Toll Revenue Bonds, Series 2017A, | 7/26 at 100.00 | Baa3 | 1,874,548 |
| | 5.000%, 7/01/54 | | | |
| 1,625 | | North Carolina Turnpike Authority, Triangle Expressway System Revenue Bonds, Senior Lien | 1/30 at 100.00 | BBB | 1,816,490 |
| | Series 2019, 4.000%, 1/01/55 – AGM Insured | | | |
| 22,330 | | Total North Carolina | | | 23,919,196 |
| | North Dakota – 2.1% (1.3% of Total Investments) | | | |
| 9,950 | | Cass County, North Dakota, Health Care Facilities Revenue Bonds, Essential Health | 2/28 at 100.00 | A– | 10,731,771 |
| | Obligated Group, Series 2018B, 4.250%, 2/15/48 | | | |
| | Grand Forks, North Dakota, Health Care System Revenue Bonds, Altru Health System | | | |
| | Obligated Group, Series 2012: | | | |
| 7,000 | | 5.000%, 12/01/29 | 12/21 at 100.00 | Baa2 | 7,185,640 |
| 6,650 | | 5.000%, 12/01/32 | 12/21 at 100.00 | Baa2 | 6,801,354 |
| 2,245 | | 5.000%, 12/01/35 | 12/21 at 100.00 | Baa2 | 2,291,472 |
| 4,525 | | Grand Forks, North Dakota, Health Care System Revenue Bonds, Altru Health System | 12/27 at 100.00 | Baa2 | 4,952,658 |
| | Obligated Group, Series 2017A, 5.000%, 12/01/42 | | | |
| 1,000 | | Grand Forks, North Dakota, Senior Housing & Nursing Facilities Revenue Bonds, Valley | 12/26 at 100.00 | N/R | 1,017,780 |
| | Homes and Services Obligated Group, Series 2017, 5.000%, 12/01/36 | | | |
| | Ward County Health Care, North Dakota, Revenue Bonds, Trinity Obligated Group, | | | |
| | Series 2017C: | | | |
| 10,000 | | 5.000%, 6/01/38 | 6/28 at 100.00 | BBB– | 11,095,000 |
| 28,000 | | 5.000%, 6/01/53 | 6/28 at 100.00 | BBB– | 30,302,160 |
| 545 | | Williston Parks and Recreation District, North Dakota, Sales Tax & Gross Revenue Bonds, | No Opt. Call | B | 543,474 |
| | Series 2012A, 5.000%, 3/01/21 | | | |
58
| | | | | | |
| Principal | | | Optional Call | | |
| Amount (000) | | Description (1) | Provisions (2) | Ratings (3) | Value |
| | North Dakota (continued) | | | |
| $ 2,535 | | Williston, North Dakota, Multifamily Housing Revenue Bonds, Eagle Crest Apartments LLC | 9/23 at 100.00 | N/R | $ 1,115,400 |
| | Project, Series 2013, 7.750%, 9/01/38 (4) | | | |
| 72,450 | | Total North Dakota | | | 76,036,709 |
| | Ohio – 9.2% (5.9% of Total Investments) | | | |
| 2,235 | | Akron, Bath and Copley Joint Township Hospital District, Ohio, Hospital Facilities | 11/30 at 100.00 | Baa2 | 2,207,644 |
| | Revenue Bonds, Summa Health Obligated Group, Refunding Series 2020, 3.000%, 11/15/40 | | | |
| 4,185 | | Akron, Bath and Copley Joint Township Hospital District, Ohio, Hospital Revenue Bonds, | 5/22 at 100.00 | A1 | 4,361,984 |
| | Children’s Hospital Medical Center, Improvement & Refunding Series 2012, 5.000%, 11/15/42 | | | |
| | Allen County, Ohio, Hospital Facilities Revenue Bonds, Catholic Health Partners, | | | |
| | Refunding and Improvement Series 2012A: | | | |
| 2,740 | | 4.000%, 5/01/33 (Pre-refunded 5/01/22) | 5/22 at 100.00 | A+ (11) | 2,889,796 |
| 1,930 | | 5.000%, 5/01/33 (Pre-refunded 5/01/22) | 5/22 at 100.00 | A+ (11) | 2,064,251 |
| 3,405 | | 5.000%, 5/01/42 (Pre-refunded 5/01/22) | 5/22 at 100.00 | A+ (11) | 3,641,852 |
| 70,220 | | Buckeye Tobacco Settlement Financing Authority, Ohio, Tobacco Settlement Asset-Backed | 6/30 at 22.36 | N/R | 9,950,876 |
| | Revenue Bonds, Refunding Senior Lien Capital Appreciation Series 2020B-3 Class 2, | | | |
| | 0.000%, 6/01/57 | | | |
| | Buckeye Tobacco Settlement Financing Authority, Ohio, Tobacco Settlement Asset-Backed | | | |
| | Revenue Bonds, Refunding Senior Lien Series 2020A-2 Class 1: | | | |
| 41,460 | | 3.000%, 6/01/48 | 6/30 at 100.00 | BBB+ | 39,726,972 |
| 7,535 | | 4.000%, 6/01/48 | 6/30 at 100.00 | BBB+ | 8,173,742 |
| 39,825 | | Buckeye Tobacco Settlement Financing Authority, Ohio, Tobacco Settlement Asset-Backed | 6/30 at 100.00 | N/R | 42,639,433 |
| | Revenue Bonds, Refunding Senior Lien Series 2020B-2 Class 2, 5.000%, 6/01/55 | | | |
| 10,000 | | Buckeye Tobacco Settlement Financing Authority, Ohio, Tobacco Settlement Asset-Backed | 6/22 at 100.00 | N/R (11) | 10,930,800 |
| | Revenue Bonds, Senior Lien Series 2007A-3, 6.250%, 6/01/37 (Pre-refunded 6/01/22) | | | |
| 1,000 | | Butler County Port Authority, Ohio, Revenue Bonds, StoryPoint Fairfield Project, Senior | 1/24 at 104.00 | N/R | 983,200 |
| | Series 2017A-1, 6.250%, 1/15/34, 144A (4) | | | |
| | Centerville, Ohio Health Care Improvement Revenue Bonds, Graceworks Lutheran Services, | | | |
| | Refunding & Improvement Series 2017: | | | |
| 2,750 | | 5.250%, 11/01/37 | 11/27 at 100.00 | N/R | 2,865,885 |
| 3,200 | | 5.250%, 11/01/47 | 11/27 at 100.00 | N/R | 3,277,056 |
| 3,345 | | Cleveland Heights-University Heights City School District, Ohio, General Obligation | 6/23 at 100.00 | A1 | 3,663,812 |
| | Bonds, School Improvement Series 2014, 5.000%, 12/01/51 | | | |
| 5,000 | | County of Lucas, Ohio, Hospital Revenue Bonds, ProMedica Healthcare Obligated Group, | 11/28 at 100.00 | Baa3 | 5,660,600 |
| | Series 2018A, 5.250%, 11/15/48 | | | |
| 37,150 | | Cuyahoga County, Ohio, Certificates of Participation, Convention Hotel Project, Series | 6/24 at 100.00 | A1 | 38,702,127 |
| | 2014, 4.375%, 12/01/44 (UB) (5) | | | |
| | Darke County, Ohio, Hospital Facilities Revenue Bonds, Wayne Healthcare Project, | | | |
| | Series 2019A: | | | |
| 1,165 | | 4.000%, 9/01/40 | 9/29 at 100.00 | BB+ | 1,211,239 |
| 1,750 | | 4.000%, 9/01/45 | 9/29 at 100.00 | BB+ | 1,811,355 |
| 2,000 | | 5.000%, 9/01/49 | 9/29 at 100.00 | BB+ | 2,097,140 |
| 6,840 | | Franklin County Convention Facilities Authority, Ohio, Hotel Project Revenue Bonds, | 12/29 at 100.00 | BBB– | 6,860,383 |
| | Greater Columbus Convention Center Hotel Expansion Project, Series 2019, 5.000%, 12/01/51 | | | |
| 7,870 | | Franklin County, Ohio, Hospital Revenue Bonds, Nationwide Children’s Hospital Project, | 5/22 at 100.00 | Aa2 | 8,204,160 |
| | Improvement Series 2012A, 5.000%, 11/01/42 | | | |
| 3,985 | | Franklin County, Ohio, Revenue Bonds, Trinity Health Credit Group, Series 2017A, | 12/27 at 100.00 | AA– | 4,161,575 |
| | 3.250%, 12/01/42 | | | |
| 6,425 | | JobsOhio Beverage System, Ohio, Statewide Liquor Profits Revenue Bonds, Senior Lien | 1/23 at 100.00 | Aa3 (11) | 7,080,864 |
| | Series 2013A, 5.000%, 1/01/38 (Pre-refunded 1/01/23) (UB) | | | |
59
| | |
| NVG | Nuveen AMT-Free Municipal Credit Income Fund Portfolio of Investments (continued) October 31, 2020 |
| | | | | | |
| Principal | | | Optional Call | | |
| Amount (000) | | Description (1) | Provisions (2) | Ratings (3) | Value |
| | Ohio (continued) | | | |
| | JobsOhio Beverage System, Ohio, Statewide Senior Lien Liquor Profits Revenue Bonds, | | | |
| | Tender Option Bond Trust 2016-XG0052: | | | |
| $ 390 | | 17.555%, 1/01/38, 144A (Pre-refunded 1/01/23) (IF) (5) | 1/23 at 100.00 | AA+ (11) | $ 548,028 |
| 1,750 | | 17.676%, 1/01/38, 144A (Pre-refunded 1/01/23) (IF) (5) | 1/23 at 100.00 | AA+ (11) | 2,464,158 |
| 625 | | 17.685%, 1/01/38, 144A (Pre-refunded 1/01/23) (IF) (5) | 1/23 at 100.00 | AA+ (11) | 880,200 |
| 1,250 | | 17.685%, 1/01/38, 144A (Pre-refunded 1/01/23) (IF) (5) | 1/23 at 100.00 | AA+ (11) | 1,760,400 |
| 1,725 | | 17.685%, 1/01/38, 144A (Pre-refunded 1/01/23) (IF) (5) | 1/23 at 100.00 | AA+ (11) | 2,429,352 |
| 2,000 | | 17.685%, 1/01/38, 144A (Pre-refunded 1/01/23) (IF) (5) | 1/23 at 100.00 | AA+ (11) | 2,816,640 |
| 2,885 | | Lucas County, Ohio, Hospital Revenue Bonds, ProMedica Healthcare Obligated Group, Series | 11/21 at 100.00 | Baa3 (11) | 3,054,840 |
| | 2011A, 6.000%, 11/15/41 (Pre-refunded 11/15/21) | | | |
| | Middletown City School District, Butler County, Ohio, General Obligation Bonds, | | | |
| | Refunding Series 2007: | | | |
| 4,380 | | 5.250%, 12/01/27 – AGM Insured | No Opt. Call | A2 | 5,645,470 |
| 6,000 | | 5.250%, 12/01/31 – AGM Insured | No Opt. Call | A2 | 8,135,280 |
| 12,000 | | Muskingum County, Ohio, Hospital Facilities Revenue Bonds, Genesis HealthCare System | 2/23 at 100.00 | Ba2 | 12,340,920 |
| | Obligated Group Project, Series 2013, 5.000%, 2/15/48 | | | |
| 8,500 | | Ohio Air Quality Development Authority, Ohio, Air Quality Development Revenue Bonds, | No Opt. Call | N/R | 10,625 |
| | FirstEnergy Generation Corporation Project, Series 2009A, 5.700%, 8/01/20 (4) | | | |
| 1,050 | | Ohio Air Quality Development Authority, Ohio, Pollution Control Revenue Bonds, | No Opt. Call | N/R | 1,313 |
| | FirstEnergy Generation Corporation Project, Refunding Series 2009B, 3.100%, 3/01/23 (4) | | | |
| 2,020 | | Ohio Air Quality Development Authority, Ohio, Pollution Control Revenue Bonds, | No Opt. Call | N/R | 2,525 |
| | FirstEnergy Nuclear Generation Corporation Project, Refunding Series 2010B, 3.750%, 6/01/33 (4) | | | |
| 1,000 | | Ohio Air Quality Development Authority, Ohio, Pollution Control Revenue Bonds, | No Opt. Call | N/R | 1,250 |
| | FirstEnergy Nuclear Generation Project, Refunding Series 2005B, 3.125%, 1/01/34 (4) | | | |
| 20,765 | | Ohio Air Quality Development Authority, Ohio, Pollution Control Revenue Bonds, | No Opt. Call | N/R | 20,920,737 |
| | FirstEnergy Nuclear Generation Project, Refunding Series 2009A, 4.375%, 6/01/33 (Mandatory | | | |
| | Put 6/01/22) | | | |
| 4,975 | | Ohio Turnpike Commission, Turnpike Revenue Bonds, Infrastructure Project, Junior Lien | 2/23 at 100.00 | A+ (11) | 5,505,434 |
| | Series 2013A-1, 5.000%, 2/15/48 (Pre-refunded 2/15/23) | | | |
| 1,240 | | Ohio Turnpike Commission, Turnpike Revenue Bonds, Infrastructure Projects, Junior Lien | 2/31 at 100.00 | A+ | 1,501,094 |
| | Convertible Series 2013A-3, 0.000%, 2/15/36 (7) | | | |
| 1,610 | | Ohio Water Development Authority, Pollution Control Revenue Bonds, FirstEnergy Nuclear | No Opt. Call | N/R | 2,012 |
| | Generating Corporation Project, Refunding Series 2010C, 4.000%, 6/01/33 (4) | | | |
| 1,130 | | Ohio Water Development Authority, Pollution Control Revenue Refunding Bonds, FirstEnergy | No Opt. Call | N/R | 1,413 |
| | Nuclear Generating Corporation Project, Series 2006B, 4.000%, 12/01/33 (4) | | | |
| 20,405 | | Ohio Water Development Authority, Pollution Control Revenue Refunding Bonds, FirstEnergy | No Opt. Call | N/R | 20,558,037 |
| | Nuclear Generating Corporation Project, Series 2009A, 4.375%, 6/01/33 (Mandatory Put 6/01/22) | | | |
| 20,480 | | Ohio Water Development Authority, Pollution Control Revenue Refunding Bonds, FirstEnergy | No Opt. Call | N/R | 20,633,600 |
| | Nuclear Generating Corporation Project, Series 2010B, 4.375%, 6/01/33 (Mandatory Put 6/01/22) | | | |
| 3,000 | | Port of Greater Cincinnati Development Authority, Ohio, Special Obligation Tax Increment | 11/30 at 100.00 | N/R | 2,697,900 |
| | Financing Revenue Bonds, Cooperative Township Public Parking Project, Gallery at Kenwood, | | | |
| | Senior Lien Series 2019A, 5.000%, 11/01/51 | | | |
| | Southeastern Ohio Port Authority, Hospital Facilities Revenue Bonds, Memorial Health | | | |
| | System Obligated Group Project, Refunding and Improvement Series 2012: | | | |
| 1,095 | | 5.750%, 12/01/32 | 12/22 at 100.00 | BB– | 1,145,085 |
| 870 | | 6.000%, 12/01/42 | 12/22 at 100.00 | BB– | 898,693 |
| 1,615 | | Toledo Lucas County Port Authority, Ohio, Revenue Bonds, StoryPoint Waterville Project, | 1/24 at 104.00 | N/R | 1,587,820 |
| | Series 2016A-1, 6.125%, 1/15/34, 144A (4) | | | |
| 1,330 | | Tuscarawas County Economic Development and Finance Alliance, Ohio, Higher Education | 3/25 at 100.00 | N/R | 1,389,172 |
| | Facilities Revenue Bonds, Ashland University, Refunding & Improvement Series 2015, | | | |
| | 6.000%, 3/01/45 | | | |
| 390,105 | | Total Ohio | | | 330,098,744 |
60
| | | | | | |
| Principal | | | Optional Call | | |
| Amount (000) | | Description (1) | Provisions (2) | Ratings (3) | Value |
| | Oklahoma – 0.7% (0.4% of Total Investments) | | | |
| $ 1,090 | | Fort Sill Apache Tribe of Oklahoma Economic Development Authority, Gaming Enterprise | 8/21 at 100.00 | N/R (11) | $ 1,160,676 |
| | Revenue Bonds, Fort Sill Apache Casino, Series 2011A, 8.500%, 8/25/26 (Pre-refunded | | | |
| | 8/25/21), 144A | | | |
| | Oklahoma City Water Utilities Trust, Oklahoma, Water and Sewer Revenue Bonds, | | | |
| | Series 2011: | | | |
| 1,500 | | 5.000%, 7/01/40 | 7/21 at 100.00 | AAA | 1,540,725 |
| 1,000 | | 5.375%, 7/01/40 | 7/21 at 100.00 | AAA | 1,030,300 |
| | Oklahoma Development Finance Authority, Health System Revenue Bonds, OU Medicine | | | |
| | Project, Series 2018B: | | | |
| 5,290 | | 5.500%, 8/15/52 | 8/28 at 100.00 | BB+ | 6,163,590 |
| 10,530 | | 5.500%, 8/15/57 | 8/28 at 100.00 | BB+ | 12,227,752 |
| 2,340 | | Tulsa County Industrial Authority, Oklahoma, Senior Living Community Revenue Bonds, | 11/25 at 102.00 | BBB– | 2,466,383 |
| | Montereau, Inc Project, Refunding Series 2017, 5.250%, 11/15/45 | | | |
| 21,750 | | Total Oklahoma | | | 24,589,426 |
| | Oregon – 0.2% (0.2% of Total Investments) | | | |
| | Clackamas County Hospital Facility Authority, Oregon, Revenue Bonds, Rose Villa Inc, | | | |
| | Series 2020A: | | | |
| 500 | | 5.125%, 11/15/40 | 11/25 at 102.00 | N/R | 529,465 |
| 220 | | 5.250%, 11/15/50 | 11/25 at 102.00 | N/R | 232,566 |
| 315 | | 5.375%, 11/15/55 | 11/25 at 102.00 | N/R | 334,379 |
| | Multnomah County Hospital Facilities Authority, Oregon, Revenue Bonds, Mirabella South | | | |
| | Waterfront, Refunding Series 2014A: | | | |
| 1,000 | | 5.400%, 10/01/44 | 10/24 at 100.00 | N/R | 1,039,900 |
| 800 | | 5.500%, 10/01/49 | 10/24 at 100.00 | N/R | 832,432 |
| | Oregon Department of Administrative Services, State Lottery Revenue Bonds, Series 2011A: | | | |
| 555 | | 5.250%, 4/01/31 | 4/21 at 100.00 | Aa2 | 565,556 |
| 3,445 | | 5.250%, 4/01/31 (Pre-refunded 4/01/21) | 4/21 at 100.00 | N/R (11) | 3,515,588 |
| 1,670 | | Oregon State, General Obligation Bonds, Oregon University System Projects, Series 2011G, | 8/21 at 100.00 | AA+ (11) | 1,729,953 |
| | 5.000%, 8/01/36 (Pre-refunded 8/02/21) | | | |
| 8,505 | | Total Oregon | | | 8,779,839 |
| | Pennsylvania – 6.1% (3.9% of Total Investments) | | | |
| 14,855 | | Allegheny County Hospital Development Authority, Pennsylvania, Revenue Bonds, Allegheny | 4/28 at 100.00 | A | 16,128,371 |
| | Health Network Obligated Group Issue, Series 2018A, 4.000%, 4/01/44 | | | |
| 3,335 | | Allegheny County Sanitary Authority, Pennsylvania, Sewer Revenue Bonds, Refunding Series | 12/20 at 100.00 | Aa3 | 3,347,440 |
| | 2010, 5.000%, 6/01/40 – AGM Insured | | | |
| 2,540 | | Allentown Neighborhood Improvement Zone Development Authority, Pennsylvania, Tax Revenue | 5/27 at 100.00 | Baa3 | 2,645,639 |
| | Bonds, City Center Refunding Project, Series 2017, 5.000%, 5/01/42, 144A | | | |
| | Beaver County Industrial Development Authority, Pennsylvania, Pollution Control Revenue | | | |
| | Bonds, FirstEnergy Generation Project, Refunding Series 2006A: | | | |
| 13,235 | | 4.375%, 1/01/35 (Mandatory Put 7/01/22) | No Opt. Call | N/R | 13,334,262 |
| 3,145 | | 3.500%, 4/01/41 (4) | No Opt. Call | N/R | 3,931 |
| 1,245 | | Beaver County Industrial Development Authority, Pennsylvania, Pollution Control Revenue | No Opt. Call | N/R | 1,556 |
| | Bonds, FirstEnergy Nuclear Generation Project, Refunding Series 2005A, 4.000%, 1/01/35 (4) | | | |
| 1,240 | | Beaver County Industrial Development Authority, Pennsylvania, Pollution Control Revenue | No Opt. Call | N/R | 1,550 |
| | Bonds, FirstEnergy Nuclear Generation Project, Series 2006B, 3.500%, 12/01/35 (4) | | | |
| 7,750 | | Beaver County Industrial Development Authority, Pennsylvania, Pollution Control Revenue | No Opt. Call | N/R | 7,808,125 |
| | Refunding Bonds, FirstEnergy Generation Project, Series 2008B, 4.250%, 10/01/47 (Mandatory | | | |
| | Put 4/01/21) | | | |
| 21,895 | | Berks County Industrial Development Authority, Pennsylvania, Health System Revenue | 11/27 at 100.00 | BB+ | 22,964,133 |
| | Bonds, Tower Health Project, Series 2017, 5.000%, 11/01/50 | | | |
61
| | |
| NVG | Nuveen AMT-Free Municipal Credit Income Fund Portfolio of Investments (continued) October 31, 2020 |
| | | | | | |
| Principal | | | Optional Call | | |
| Amount (000) | | Description (1) | Provisions (2) | Ratings (3) | Value |
| | Pennsylvania (continued) | | | |
| | Bucks County Industrial Development Authority, Pennsylvania, Revenue Bonds, School Lane | | | |
| | Charter School Project, Series 2016: | | | |
| $ 2,410 | | 5.125%, 3/15/36 | 3/27 at 100.00 | BBB– | $ 2,679,992 |
| 6,420 | | 5.125%, 3/15/46 | 3/27 at 100.00 | BBB– | 6,990,224 |
| 10,850 | | Commonwealth Financing Authority, Pennsylvania, State Appropriation Lease Bonds, Master | 6/28 at 100.00 | A1 | 12,244,117 |
| | Settlement, Series 2018, 4.000%, 6/01/39 – AGM Insured (UB) (5) | | | |
| 1,000 | | Cumberland County Municipal Authority, Pennsylvania, Revenue Bonds, Diakon Lutheran | 1/25 at 100.00 | BBB+ | 1,089,920 |
| | Social Ministries Project, Series 2015, 5.000%, 1/01/29 | | | |
| 7,665 | | Dauphin County General Authority, Pennsylvania, Health System Revenue Bonds, Pinnacle | 6/22 at 100.00 | A | 8,053,002 |
| | Health System Project, Series 2012A, 5.000%, 6/01/42 | | | |
| 3,000 | | Dubois Hospital Authority, Pennsylvania, Hospital Revenue Bonds, Penn Highlands | 1/28 at 100.00 | A– | 3,413,970 |
| | Healthcare, Series 2018, 5.000%, 7/15/48 | | | |
| 1,250 | | Lancaster County Hospital Authority, Pennsylvania, Revenue Bonds, Landis Homes | 7/25 at 100.00 | BBB– | 1,302,075 |
| | Retirement Community Project, Refunding Series 2015A, 5.000%, 7/01/45 | | | |
| | Lehigh County Authority, Pennsylvania, Water and Sewer Revenue Bonds, Allentown | | | |
| | Concession, Series 2013A: | | | |
| 695 | | 5.125%, 12/01/47 | 12/23 at 100.00 | A | 773,674 |
| 805 | | 5.125%, 12/01/47 (Pre-refunded 12/01/23) | 12/23 at 100.00 | N/R (11) | 921,765 |
| | Montgomery County Industrial Development Authority, Pennsylvania, Health System Revenue | | | |
| | Bonds, Albert Einstein Healthcare Network Issue, Series 2015A: | | | |
| 10,530 | | 5.250%, 1/15/45 | 1/25 at 100.00 | Ba1 | 10,998,585 |
| 1,200 | | 5.250%, 1/15/46 | 1/25 at 100.00 | Ba1 | 1,252,152 |
| 10,765 | | Pennsylvania Economic Development Financing Authority, Exempt Facilities Revenue | 9/25 at 100.00 | CCC+ | 8,890,275 |
| | Refunding Bonds, PPL Energy Supply, LLC Project, Series 2009A, 6.400%, 12/01/38 | | | |
| 3,500 | | Pennsylvania Housing Finance Agency, Single Family Mortgage Revenue Bonds, Series | 4/29 at 100.00 | Aa2 | 3,665,165 |
| | 2019-131A, 3.100%, 10/01/44 | | | |
| 13,500 | | Pennsylvania Turnpike Commission, Oil Franchise Tax Revenue Bonds, Senior Series 2018A, | 12/28 at 100.00 | Aa3 | 16,916,715 |
| | 5.250%, 12/01/44 | | | |
| 3,705 | | Pennsylvania Turnpike Commission, Turnpike Revenue Bonds, Series 2015A-1, | 6/25 at 100.00 | A+ | 4,194,097 |
| | 5.000%, 12/01/45 | | | |
| 6,450 | | Pennsylvania Turnpike Commission, Turnpike Revenue Bonds, Series 2018A-2, | 12/28 at 100.00 | A1 | 7,821,399 |
| | 5.000%, 12/01/43 | | | |
| 11,000 | | Pennsylvania Turnpike Commission, Turnpike Revenue Bonds, Subordinate Series 2009C, | 6/26 at 100.00 | A2 | 13,939,860 |
| | 6.250%, 6/01/33 – AGM Insured | | | |
| 15,000 | | Pennsylvania Turnpike Commission, Turnpike Revenue Bonds, Subordinate Series 2015B-1, | 12/25 at 100.00 | A3 | 17,030,550 |
| | 5.000%, 12/01/45 | | | |
| 5,000 | | Pennsylvania Turnpike Commission, Turnpike Revenue Bonds, Subordinate Series 2019A, | 12/29 at 100.00 | A3 | 5,496,950 |
| | 4.000%, 12/01/49 | | | |
| 10,305 | | Philadelphia Hospitals and Higher Education Facilities Authority, Pennsylvania, Hospital | 7/22 at 100.00 | Ba1 | 10,895,889 |
| | Revenue Bonds, Temple University Health System Obligated Group, Series 2012A, | | | |
| | 5.625%, 7/01/42 | | | |
| 7,055 | | Pittsburgh and Allegheny County Sports and Exhibition Authority, Pennsylvania, Hotel | 11/20 at 100.00 | A2 | 7,066,782 |
| | Room Excise Tax Revenue Bonds, Refunding Series 2010, 5.000%, 2/01/35 – AGM Insured | | | |
| | Scranton, Pennsylvania, Sewer Authority Revenue Bonds, Series 2011A: | | | |
| 1,125 | | 5.250%, 12/01/31 (Pre-refunded 12/01/21) – AGM Insured | 12/21 at 100.00 | AA (11) | 1,185,750 |
| 1,000 | | 5.500%, 12/01/35 (Pre-refunded 12/01/21) – AGM Insured | 12/21 at 100.00 | AA (11) | 1,056,690 |
| 5,790 | | Susquehanna Area Regional Airport Authority, Pennsylvania, Airport System Revenue Bonds, | 1/23 at 100.00 | Baa3 | 5,743,506 |
| | Series 2012B, 4.000%, 1/01/33 | | | |
| 209,260 | | Total Pennsylvania | | | 219,858,111 |
| | Puerto Rico – 3.0% (1.9% of Total Investments) | | | |
| 4,934 | | Puerto Rico Cofina Class 2 Trust Tax-Exempt Class 2047, 0.000%, 8/01/47 Puerto Rico Urgent | No Opt. Call | N/R | 1,369,564 |
| | Interest Fund Corp (COFINA), National Custodial Taxable Trust Unit, | | | |
62
| | | | | | |
| Principal | | | Optional Call | | |
| Amount (000) | | Description (1) | Provisions (2) | Ratings (3) | Value |
| | Puerto Rico (continued) | | | |
| $ 9,761 | | Puerto Rico Cofina Class 2 Trust Tax-Exempt Class 2054, Series 2007, 0.000%, 8/01/54 | No Opt. Call | N/R | $ 1,874,489 |
| | Puerto Rico Aqueduct and Sewerage Authority, Revenue Bonds, Senior Lien Series 2008A: | | | |
| | Series 2007 Sr. Bond: | | | |
| 1,727 | | 6.000%, 7/01/38 | 11/20 at 100.00 | CC | 1,752,905 |
| 9,425 | | 6.000%, 7/01/44 | 11/20 at 100.00 | CC | 9,566,375 |
| | Puerto Rico Aqueduct and Sewerage Authority, Revenue Bonds, Senior Lien Series 2012A: | | | |
| 2,200 | | 5.125%, 7/01/37 | 7/22 at 100.00 | CC | 2,271,500 |
| 8,040 | | 5.250%, 7/01/42 | 7/22 at 100.00 | CC | 8,301,300 |
| 8,315 | | 6.000%, 7/01/47 | 7/22 at 100.00 | CC | 8,720,356 |
| 590 | | Puerto Rico Highway and Transportation Authority, Highway Revenue Bonds, Series 2004J, | 11/20 at 100.00 | Baa2 | 594,112 |
| | 5.000%, 7/01/29 – NPFG Insured | | | |
| 1,500 | | Puerto Rico Municipal Finance Agency, Series 2002A, 5.250%, 8/01/21 – AGM Insured | 11/20 at 100.00 | A2 | 1,531,290 |
| 950 | | Puerto Rico Public Finance Corporation, Commonwealth Appropriation Bonds, Series 1998A, | No Opt. Call | AA+ | 1,028,641 |
| | 5.125%, 6/01/24 – AMBAC Insured | | | |
| | Puerto Rico Sales Tax Financing Corporation, Sales Tax Revenue Bonds, | | | |
| | Restructured 2018A-1: | | | |
| 3,000 | | 0.000%, 7/01/31 | 7/28 at 91.88 | N/R | 2,166,690 |
| 9,828 | | 0.000%, 7/01/33 | 7/28 at 86.06 | N/R | 6,458,961 |
| 255 | | 4.500%, 7/01/34 | 7/25 at 100.00 | N/R | 266,985 |
| 8,553 | | 0.000%, 7/01/51 | 7/28 at 30.01 | N/R | 1,782,189 |
| 17,852 | | 4.750%, 7/01/53 | 7/28 at 100.00 | N/R | 18,783,339 |
| 14,548 | | 5.000%, 7/01/58 | 7/28 at 100.00 | N/R | 15,498,712 |
| 723 | | Puerto Rico Sales Tax Financing Corporation, Sales Tax Revenue Bonds, Restructured | 7/28 at 100.00 | N/R | 750,590 |
| | Cofina Project Series 2019B-2, 4.536%, 7/01/53 | | | |
| | Puerto Rico Sales Tax Financing Corporation, Sales Tax Revenue Bonds, Taxable | | | |
| | Restructured Cofina Project Series 2019A-2: | | | |
| 8,239 | | 4.329%, 7/01/40 | 7/28 at 100.00 | N/R | 8,476,118 |
| 8,260 | | 4.329%, 7/01/40 | 7/28 at 100.00 | N/R | 8,497,723 |
| 6,206 | | 4.784%, 7/01/58 | 7/28 at 100.00 | N/R | 6,523,995 |
| 124,906 | | Total Puerto Rico | | | 106,215,834 |
| | Rhode Island – 1.5% (0.9% of Total Investments) | | | |
| 1,000 | | Rhode Island Health and Educational Building Corporation, Revenue Bonds, Care New | 9/23 at 100.00 | N/R (11) | 1,156,990 |
| | England Health System, Series 2013A, 6.000%, 9/01/33 (Pre-refunded 9/01/23) | | | |
| 5,650 | | Rhode Island Housing & Mortgage Finance Corporation, Homeownership Opportunity Bond | 4/29 at 100.00 | AA+ | 5,821,139 |
| | Program, 2019 Series 71, 3.100%, 10/01/44 | | | |
| 292,435 | | Rhode Island Tobacco Settlement Financing Corporation, Tobacco Settlement Asset-Backed | 11/20 at 15.49 | CCC– | 45,213,375 |
| | Bonds, Series 2007A, 0.000%, 6/01/52 | | | |
| 299,085 | | Total Rhode Island | | | 52,191,504 |
| | South Carolina – 3.1% (2.0% of Total Investments) | | | |
| 7,600 | | Piedmont Municipal Power Agency, South Carolina, Electric Revenue Bonds, Series 2004A-2, | No Opt. Call | A– | 6,299,640 |
| | 0.000%, 1/01/31 – AMBAC Insured | | | |
| 2,255 | | Saint Peters Parish/Jasper County Public Facilities Corporation, South Carolina, | 4/21 at 100.00 | A2 (11) | 2,301,678 |
| | Installment Purchase Revenue Bonds, County Office Building Projects, Series 2011A, 5.250%, | | | |
| | 4/01/44 (Pre-refunded 4/01/21) – AGC Insured | | | |
| | South Carolina Jobs-Economic Development Authority, Economic Development Revenue Bonds, | | | |
| | Bishop Gadsden Episcopal Retirement Community, Series 2019A: | | | |
| 890 | | 5.000%, 4/01/49 | 4/26 at 103.00 | BBB– | 969,059 |
| 1,165 | | 4.000%, 4/01/54 | 4/26 at 103.00 | BBB– | 1,158,581 |
| 1,630 | | 5.000%, 4/01/54 | 4/26 at 103.00 | BBB– | 1,770,571 |
| | South Carolina Jobs-Economic Development Authority, Economic Development Revenue Bonds, | | | |
| | Hilton Head Christian Academy, Series 2020: | | | |
| 405 | | 5.000%, 1/01/40, 144A | 1/30 at 100.00 | N/R | 375,957 |
| 1,000 | | 5.000%, 1/01/55, 144A | 1/30 at 100.00 | N/R | 903,420 |
63
| | |
| NVG | Nuveen AMT-Free Municipal Credit Income Fund Portfolio of Investments (continued) October 31, 2020 |
| | | | | | |
| Principal | | | Optional Call | | |
| Amount (000) | | Description (1) | Provisions (2) | Ratings (3) | Value |
| | South Carolina (continued) | | | |
| | South Carolina Jobs-Economic Development Authority, Health Facilities Revenue Bonds, | | | |
| | Lutheran Homes of South Carolina Inc, Refunding Series 2017B: | | | |
| $ 1,000 | | 5.000%, 5/01/37 | 5/23 at 104.00 | N/R | $ 976,950 |
| 750 | | 5.000%, 5/01/42 | 5/23 at 104.00 | N/R | 712,118 |
| 1,250 | | South Carolina Jobs-Economic Development Authority, Hospital Revenue Bonds, Palmetto | 8/21 at 100.00 | AA (11) | 1,307,675 |
| | Health, Refunding Series 2011A, 6.500%, 8/01/39 (Pre-refunded 8/01/21) – AGM Insured | | | |
| 4,000 | | South Carolina Jobs-Economic Development Authority, Hospital Revenue Bonds, Prisma | 5/28 at 100.00 | A3 | 4,581,960 |
| | Health Obligated Group, Series 2018A, 5.000%, 5/01/48 | | | |
| | South Carolina Public Service Authority, Santee Cooper Revenue Obligations, Refunding & | | | |
| | Improvement Series 2015A: | | | |
| 11,170 | | South Carolina Public Service Authority, Santee Cooper Revenue Obligations, Refunding & | 6/25 at 100.00 | A– | 12,624,446 |
| | Improvement Series 2015A, 5.000%, 12/01/50 | | | |
| 34,000 | | South Carolina Public Service Authority, Santee Cooper Revenue Obligations, Refunding & | 6/25 at 100.00 | A– | 38,427,140 |
| | Improvement Series 2015A, 5.000%, 12/01/50 (UB) (5) | | | |
| 8,630 | | South Carolina Public Service Authority, Santee Cooper Revenue Obligations, Refunding & | 12/30 at 100.00 | A– | 10,695,159 |
| | Improvement Series 2020A, 5.000%, 12/01/43 (WI/DD, Settling 11/05/20) | | | |
| 5,000 | | South Carolina Public Service Authority, Santee Cooper Revenue Obligations, Refunding | 12/24 at 100.00 | A– | 5,611,300 |
| | Series 2014C, 5.000%, 12/01/46 | | | |
| 1,310 | | South Carolina Public Service Authority, Santee Cooper Revenue Obligations, Series | 12/23 at 100.00 | A– | 1,442,245 |
| | 2013A, 5.125%, 12/01/43 | | | |
| 10,285 | | South Carolina Public Service Authority, Santee Cooper Revenue Obligations, Series | 6/24 at 100.00 | A– | 11,548,924 |
| | 2014A, 5.500%, 12/01/54 | | | |
| 10,250 | | Spartanburg Regional Health Services District, Inc, South Carolina, Hospital Revenue | 4/22 at 100.00 | A3 | 10,743,742 |
| | Bonds, Refunding Series 2012A, 5.000%, 4/15/32 | | | |
| 102,590 | | Total South Carolina | | | 112,450,565 |
| | South Dakota – 1.1% (0.7% of Total Investments) | | | |
| 15,000 | | South Dakota Health and Educational Facilities Authority, Revenue Bonds, Avera Health, | 7/27 at 100.00 | A1 | 17,420,850 |
| | Refunding Series 2017, 5.000%, 7/01/46 | | | |
| 12,400 | | South Dakota Health and Educational Facilities Authority, Revenue Bonds, Monument | 9/30 at 100.00 | A1 | 13,597,468 |
| | Health, Inc, Series 2020A, 4.000%, 9/01/50 | | | |
| 3,765 | | South Dakota Health and Educational Facilities Authority, Revenue Bonds, Regional | 9/27 at 100.00 | A1 | 4,452,489 |
| | Health, Refunding Series 2017, 5.000%, 9/01/40 | | | |
| 4,350 | | South Dakota Health and Educational Facilities Authority, Revenue Bonds, Avera Health, | 7/21 at 100.00 | A1 (11) | 4,485,502 |
| | Series 2012A, 5.000%, 7/01/42 (Pre-refunded 7/01/21) | | | |
| 35,515 | | Total South Dakota | | | 39,956,309 |
| | Tennessee – 0.8% (0.5% of Total Investments) | | | |
| 12,895 | | Chattanooga Health, Educational and Housing Facility Board, Tennessee, Revenue Bonds, | 1/23 at 100.00 | BBB+ (11) | 14,221,638 |
| | Catholic Health Initiatives, Series 2013A, 5.250%, 1/01/45 (Pre-refunded 1/01/23) | | | |
| 1,850 | | Chattanooga-Hamilton County Hospital Authority, Tennessee, Hospital Revenue Bonds, | 10/24 at 100.00 | Baa3 | 1,992,857 |
| | Erlanger Health System, Refunding Series 2014A, 5.000%, 10/01/39 | | | |
| 2,000 | | Knox County Health, Educational and Housing Facility Board, Tennessee, Hospital Revenue | 2/29 at 100.00 | A | 2,199,620 |
| | Bonds, East Tennessee Children’s Hospital, Series 2019, 4.000%, 11/15/48 | | | |
| 2,645 | | Memphis/Shelby County Economic Development Growth Engine Industrial Development Board, | 7/27 at 100.00 | N/R | 2,316,993 |
| | Tennessee, Tax Increment Revenue Bonds, Graceland Project, Senior Series 2017A, 5.500%, 7/01/37 | | | |
| 3,560 | | Metropolitan Government of Nashville-Davidson County Health and Educational Facilities | 6/27 at 100.00 | N/R | 2,136,000 |
| | Board, Tennessee, Revenue Bonds, Knowledge Academy Charter School, Series 2017A, 0.000%, | | | |
| | 6/15/37, 144A (4) | | | |
| 1,000 | | Tennessee Housing Development Agency, Residential Finance Program Bonds, Series 2020-3A, | 7/29 at 100.00 | AA+ | 1,016,890 |
| | 2.550%, 1/01/45 | | | |
64
| | | | | | |
| Principal | | | Optional Call | | |
| Amount (000) | | Description (1) | Provisions (2) | Ratings (3) | Value |
| | Tennessee (continued) | | | |
| $ 10,000 | | The Health and Educational Facilities Board of the City of Franklin, Tennessee, Revenue | 6/27 at 100.00 | N/R | $ 6,500,000 |
| | Bonds, Provision Cares Proton Therapy Center, Nashville Project, Series 2017A, 7.500%, | | | |
| | 6/01/47, 144A (4) | | | |
| 33,950 | | Total Tennessee | | | 30,383,998 |
| | Texas – 11.7% (7.4% of Total Investments) | | | |
| 735 | | Arlington Higher Education Finance Corporation, Texas, Education Revenue Bonds, Wayside | 8/21 at 100.00 | BB+ | 738,308 |
| | Schools, Series 2016A, 4.375%, 8/15/36 | | | |
| 3,580 | | Aubrey, Denton County, Texas, Special Assessment Revenue Bonds, Jackson Ridge Public | 9/23 at 103.00 | N/R | 3,824,979 |
| | Improvement District Phase 1 Project, Series 2015, 7.250%, 9/01/45 | | | |
| 3,045 | | Aubrey, Denton County, Texas, Special Assessment Revenue Bonds, Jackson Ridge Public | 9/23 at 103.00 | N/R | 3,244,996 |
| | Improvement District Phases 2-3 Major Improvements Project, Series 2015, 8.250%, 9/01/40 | | | |
| 5,480 | | Austin, Texas, Electric Utility System Revenue Bonds, Refunding Series 2015A, 5.000%, | 11/25 at 100.00 | Aa3 | 6,478,620 |
| | 11/15/45 (UB) (5) | | | |
| 2,500 | | Board of Managers, Joint Guadalupe County-Seguin City Hospital, Texas, Hospital Mortgage | 12/25 at 100.00 | BB | 2,569,825 |
| | Revenue Bonds, Refunding & Improvement Series 2015, 5.000%, 12/01/45 | | | |
| 2,340 | | Celina, Texas, Special Assessment Revenue Bonds, Sutton Fields II Public Improvement | 3/23 at 103.00 | N/R | 2,448,670 |
| | District Neighborhood Improvement Area 1 Project, Series 2015, 7.250%, 9/01/45 | | | |
| 4,145 | | Celina, Texas, Special Assessment Revenue Bonds, Sutton Fields II Public Improvement | 3/23 at 103.00 | N/R | 4,317,432 |
| | District Neighborhood Improvement Areas 2-5 Major Improvement Project, Series 2015, | | | |
| | 8.250%, 9/01/40 | | | |
| 390 | | Celina, Texas, Special Assessment Revenue Bonds, Wells South Public Improvement District | 9/24 at 100.00 | N/R | 406,758 |
| | Neighborhood Improvement Area 1 Project, Series 2015, 6.250%, 9/01/45 | | | |
| | Central Texas Regional Mobility Authority, Revenue Bonds, Senior Lien Series 2011: | | | |
| 1,500 | | 5.750%, 1/01/31 (Pre-refunded 1/01/21) | 1/21 at 100.00 | Baa1 (11) | 1,513,380 |
| 1,700 | | 6.250%, 1/01/46 (Pre-refunded 1/01/21) | 1/21 at 100.00 | Baa1 (11) | 1,716,473 |
| | Central Texas Regional Mobility Authority, Revenue Bonds, Senior Lien Series 2020A: | | | |
| 3,000 | | 5.000%, 1/01/44 | 1/30 at 100.00 | Baa1 | 3,644,820 |
| 3,940 | | 5.000%, 1/01/49 | 1/30 at 100.00 | Baa1 | 4,755,738 |
| 3,335 | | Central Texas Regional Mobility Authority, Revenue Bonds, Senior Lien Series 2020E, | 1/30 at 100.00 | Baa1 | 4,040,119 |
| | 5.000%, 1/01/45 (WI/DD, Settling 11/19/20) | | | |
| 13,685 | | Central Texas Regional Mobility Authority, Revenue Bonds, Senior Lien, Series 2015A, | 7/25 at 100.00 | Baa1 | 15,345,401 |
| | 5.000%, 1/01/45 | | | |
| 6,375 | | Central Texas Regional Mobility Authority, Revenue Bonds, Senior Lien, Series 2016, | 1/26 at 100.00 | Baa1 | 6,647,021 |
| | 3.375%, 1/01/41 | | | |
| 535 | | Clifton Higher Education Finance Corporation, Texas, Education Revenue Bonds, Idea | No Opt. Call | A– | 551,098 |
| | Public Schools, Series 2012, 3.750%, 8/15/22 | | | |
| | Clifton Higher Education Finance Corporation, Texas, Education Revenue Bonds, Uplift | | | |
| | Education Charter School, Series 2013A: | | | |
| 765 | | 4.350%, 12/01/42 | 12/22 at 100.00 | BBB– | 777,118 |
| 685 | | 4.400%, 12/01/47 | 12/22 at 100.00 | BBB– | 695,097 |
| 4,000 | | Clifton Higher Education Finance Corporation, Texas, Education Revenue Bonds, Uplift | 6/25 at 100.00 | BBB– | 4,262,160 |
| | Education Charter School, Series 2015A, 5.000%, 12/01/45 | | | |
| | Club Municipal Management District 1, Texas, Special Assessment Revenue Bonds, | | | |
| | Improvement Area 1 Project, Series 2016: | | | |
| 605 | | 5.750%, 9/01/28 | 9/23 at 103.00 | N/R | 668,543 |
| 770 | | 6.500%, 9/01/46 | 9/23 at 103.00 | N/R | 848,817 |
| 11,735 | | Dallas-Fort Worth International Airport, Texas, Joint Revenue Bonds, Refunding & | 11/21 at 100.00 | A | 12,178,114 |
| | Improvement Series 2012C, 5.000%, 11/01/45 | | | |
| 2,520 | | Decatur Hospital Authority, Texas, Revenue Bonds, Wise Regional Health System, Series | 9/23 at 100.00 | N/R | 2,694,182 |
| | 2013A, 6.375%, 9/01/42 | | | |
| 400 | | Decatur Hospital Authority, Texas, Revenue Bonds, Wise Regional Health System, Series | 9/24 at 100.00 | BBB– | 427,196 |
| | 2014A, 5.250%, 9/01/44 | | | |
65
| | |
| NVG | Nuveen AMT-Free Municipal Credit Income Fund Portfolio of Investments (continued) October 31, 2020 |
| | | | | | |
| Principal | | | Optional Call | | |
| Amount (000) | | Description (1) | Provisions (2) | Ratings (3) | Value |
| | Texas (continued) | | | |
| $ 1,255 | | Fort Bend County Industrial Development Corporation, Texas, Revenue Bonds, NRG Energy | 11/22 at 100.00 | Baa2 | $ 1,299,728 |
| | Inc Project, Series 2012A RMKT, 4.750%, 5/01/38 | | | |
| 8,920 | | Fort Bend County Industrial Development Corporation, Texas, Revenue Bonds, NRG Energy | 11/22 at 100.00 | Baa2 | 9,202,675 |
| | Inc Project, Series 2012B, 4.750%, 11/01/42 | | | |
| 6,660 | | Grand Parkway Transportation Corporation, Texas, System Toll Revenue Bonds, Refunding | 4/30 at 100.00 | A2 | 7,593,466 |
| | First Tier Series 2020C, 4.000%, 10/01/49 | | | |
| | Grand Parkway Transportation Corporation, Texas, System Toll Revenue Bonds, Subordinate | | | |
| | Lien Series 2013B: | | | |
| 20,000 | | 5.250%, 10/01/51 (Pre-refunded 10/01/23) | 10/23 at 100.00 | AA (11) | 22,886,200 |
| 10,000 | | 5.000%, 4/01/53 (Pre-refunded 10/01/23) (UB) (5) | 10/23 at 100.00 | AA (11) | 11,370,600 |
| 5,470 | | Grand Parkway Transportation Corporation, Texas, System Toll Revenue Bonds, Tender | 10/23 at 100.00 | AA+ (11) | 8,469,748 |
| | Option Bond Trust 2015-XF0228, 17.898%, 11/01/44, 144A (Pre-refunded 10/01/23) (IF) (5) | | | |
| 4,255 | | Harris County Cultural Education Facilities Finance Corporation, Texas, Revenue Bonds, | 6/25 at 100.00 | AA | 4,854,785 |
| | Houston Methodist Hospital System, Series 2015, 5.000%, 12/01/45 | | | |
| 1,545 | | Harris County Metropolitan Transit Authority, Texas, Sales and Use Tax Revenue Bonds, | 11/21 at 100.00 | AAA | 1,765,240 |
| | Tender Option Bond Trust 2016-XG0054, 13.452%, 11/01/41, 144A (Pre-refunded | | | |
| | 11/01/21) (IF) (5) | | | |
| 4,080 | | Harris County, Texas, General Obligation Toll Road Revenue Bonds, Tender Option Bond | No Opt. Call | AAA | 9,388,570 |
| | Trust 2015-XF0074, 14.243%, 8/15/32, 144A (IF) | | | |
| 6,000 | | Harris County-Houston Sports Authority, Texas, Revenue Bonds, Capital Appreciation | 11/31 at 44.13 | A2 | 1,796,040 |
| | Refunding Senior Lien Series 2014A, 0.000%, 11/15/48 | | | |
| 6,000 | | Harris County-Houston Sports Authority, Texas, Revenue Bonds, Refunding Senior Lien | 11/24 at 100.00 | BBB | 6,276,420 |
| | Series 2014A, 5.000%, 11/15/53 | | | |
| | Harris County-Houston Sports Authority, Texas, Revenue Bonds, Third Lien Series 2004A-3: | | | |
| 1,940 | | 0.000%, 11/15/34 (Pre-refunded 11/15/24) – NPFG Insured | 11/24 at 55.69 | Baa2 (11) | 1,052,081 |
| 14,055 | | 0.000%, 11/15/34 – NPFG Insured | 11/24 at 55.69 | BB | 6,900,302 |
| 5,000 | | Houston Higher Education Finance Corporation, Texas, Education Revenue Bonds, KIPP, Inc, | 8/25 at 100.00 | AAA | 5,431,650 |
| | Refunding Series 2015, 4.000%, 8/15/44 | | | |
| | Houston, Texas, Hotel Occupancy Tax and Special Revenue Bonds, Convention and | | | |
| | Entertainment Project, Series 2001B: | | | |
| 4,130 | | 0.000%, 9/01/26 – AMBAC Insured | No Opt. Call | A2 | 3,803,523 |
| 4,865 | | 0.000%, 9/01/27 – AGM Insured | No Opt. Call | A2 | 4,366,143 |
| 4,715 | | Houston, Texas, Hotel Occupancy Tax and Special Revenue Bonds, Refunding Series 2015, | 9/24 at 100.00 | A | 4,836,175 |
| | 5.000%, 9/01/40 | | | |
| 17,000 | | Houston, Texas, Water and Sewerage System Revenue Bonds, Refunding Junior Lien Series | No Opt. Call | A2 (11) | 25,502,550 |
| | 2002A, 5.750%, 12/01/32 – AGM Insured (ETM) | | | |
| 6,700 | | Hutto Independent School District, Williamson County, Texas, General Obligation Bonds, | 8/21 at 100.00 | A+ | 6,910,916 |
| | Refunding Series 2012A, 5.000%, 8/01/46 | | | |
| 940 | | Kerrville Health Facilities Development Corporation, Texas, Revenue Bonds, Sid Peterson | 8/25 at 100.00 | A– | 1,073,762 |
| | Memorial Hospital Project, Series 2015, 5.000%, 8/15/30 | | | |
| 1,000 | | Lower Colorado River Authority, Texas, Transmission Contract Revenue Bonds, LCRA | 5/25 at 100.00 | A | 1,146,740 |
| | Transmission Services Corporation Project, Refunding Series 2015, 5.000%, 5/15/45 | | | |
| | McCamey County Hospital District, Texas, General Obligation Bonds, Series 2013: | | | |
| 3,095 | | 5.750%, 12/01/33 | 12/25 at 100.00 | B1 | 3,391,996 |
| 3,125 | | 6.125%, 12/01/38 | 12/25 at 100.00 | B1 | 3,429,969 |
| | Montgomery County Toll Road Authority, Texas, Toll Road Revenue Bonds, Senior Lien | | | |
| | Series 2018: | | | |
| 1,900 | | 5.000%, 9/15/43 | 9/25 at 100.00 | BBB– | 2,067,694 |
| 1,785 | | 5.000%, 9/15/48 | 9/25 at 100.00 | BBB– | 1,933,084 |
| | New Hope Cultural Education Facilities Finance Corporation, Texas, Retirement Facility | | | |
| | Revenue Bonds, Legacy at Willow Bend Project, Series 2016: | | | |
| 2,335 | | 5.000%, 11/01/46 | 11/23 at 103.00 | BBB– | 2,441,896 |
| 6,015 | | 5.000%, 11/01/51 | 11/23 at 103.00 | BBB– | 6,257,946 |
66
| | | | | | |
| Principal | | | Optional Call | | |
| Amount (000) | | Description (1) | Provisions (2) | Ratings (3) | Value |
| | Texas (continued) | | | |
| $ 745 | | New Hope Cultural Education Facilities Finance Corporation, Texas, Retirement Facility | 1/25 at 100.00 | N/R | $ 766,106 |
| | Revenue Bonds, Wesleyan Homes, Inc Project, Series 2014, 5.500%, 1/01/43 | | | |
| 210 | | New Hope Cultural Education Facilities Finance Corporation, Texas, Student Housing | 4/26 at 100.00 | B | 188,124 |
| | Revenue Bonds, CHF-Collegiate Housing Corpus Christi II, LLC-Texas A&M University-Corpus | | | |
| | Christi Project, Series 2016A, 5.000%, 4/01/48 | | | |
| 4,530 | | New Hope Cultural Education Facilities Finance Corporation, Texas, Student Housing | 4/24 at 100.00 | A2 | 4,741,007 |
| | Revenue Bonds, CHF-Collegiate Housing Foundation – College Station I LLC – Texas A&M | | | |
| | University Project, Series 2014A, 4.100%, 4/01/34 – AGM Insured | | | |
| 820 | | New Hope Cultural Education Facilities Finance Corporation, Texas, Student Housing | 4/26 at 100.00 | BBB– | 794,400 |
| | Revenue Bonds, CHF-Collegiate Housing Foundation – San Antonio 1, LLC – Texas A&M | | | |
| | University – San Antonio Project,, 5.000%, 4/01/48 | | | |
| | New Hope Cultural Education Facilities Finance Corporation, Texas, Student Housing | | | |
| | Revenue Bonds, CHF-Collegiate Housing Foundation – Stephenville II, LLC – Tarleton State | | | |
| | University Project, Series 2014A: | | | |
| 1,000 | | 5.000%, 4/01/34 (Pre-refunded 4/01/24) | 4/24 at 100.00 | N/R (11) | 1,132,720 |
| 2,200 | | 5.000%, 4/01/39 (Pre-refunded 4/01/24) | 4/24 at 100.00 | N/R (11) | 2,491,984 |
| 1,600 | | 5.000%, 4/01/46 (Pre-refunded 4/01/24) | 4/24 at 100.00 | N/R (11) | 1,812,352 |
| 5,540 | | New Hope Cultural Education Facilities Finance Corporation, Texas, Student Housing | 4/24 at 100.00 | Baa3 | 5,540,554 |
| | Revenue Bonds, CHF-Collegiate Housing Galveston-Texas A&M University at Galveston Project, | | | |
| | Series 2014A, 5.000%, 4/01/39 | | | |
| 3,220 | | North Fort Bend Water Authority, Texas, Water System Revenue Bonds, Series 2011, 5.000%, | 12/21 at 100.00 | A2 | 3,379,197 |
| | 12/15/36 – AGM Insured | | | |
| | North Texas Tollway Authority, Special Projects System Revenue Bonds, Convertible | | | |
| | Capital Appreciation Series 2011C: | | | |
| 2,590 | | 0.000%, 9/01/43 (Pre-refunded 9/01/31) (7) | 9/31 at 100.00 | N/R (11) | 3,521,778 |
| 3,910 | | 0.000%, 9/01/45 (Pre-refunded 9/01/31) (7) | 9/31 at 100.00 | N/R (11) | 5,758,218 |
| 6,155 | | North Texas Tollway Authority, System Revenue Bonds, Refunding First Tier, Series 2015B, | 1/23 at 100.00 | A+ | 6,619,641 |
| | 5.000%, 1/01/40 | | | |
| 2,000 | | North Texas Tollway Authority, System Revenue Bonds, Refunding Second Tier, Series | 1/25 at 100.00 | A | 2,295,480 |
| | 2015A, 5.000%, 1/01/38 | | | |
| 610 | | Reagan Hospital District of Reagan County, Texas, Limited Tax Revenue Bonds, Series | 2/24 at 100.00 | Ba1 | 636,706 |
| | 2014A, 5.125%, 2/01/39 | | | |
| 1,000 | | Red River Education Finance Corporation, Texas, Higher Education Revenue Bonds, Saint | 6/26 at 100.00 | BBB | 1,015,520 |
| | Edward’s University Project, Series 2016, 4.000%, 6/01/41 | | | |
| 2,410 | | Tarrant County Cultural Education Facilities Finance Corporation, Texas, Hospital Revenue | 11/21 at 100.00 | AA– (11) | 2,526,258 |
| | Bonds, Baylor Health Care System, Series 2011A, 5.000%, 11/15/30 (Pre-refunded 11/15/21) | | | |
| 1,870 | | Tarrant County Cultural Education Facilities Finance Corporation, Texas, Hospital | 9/23 at 100.00 | A3 | 2,032,671 |
| | Revenue Bonds, Hendrick Medical Center, Refunding Series 2013, 5.500%, 9/01/43 | | | |
| 17,640 | | Tarrant County Cultural Education Facilities Finance Corporation, Texas, Hospital | 5/26 at 100.00 | AA– | 20,369,614 |
| | Revenue Bonds, Scott & White Healthcare Project, Series 2016A, 5.000%, 11/15/45 (UB) (5) | | | |
| 4,300 | | Texas City Industrial Development Corporation, Texas, Industrial Development Revenue | 2/25 at 100.00 | Baa2 | 4,472,473 |
| | Bonds, NRG Energy, inc Project, Fixed Rate Series 2012, 4.125%, 12/01/45 | | | |
| 4,000 | | Texas Department of Housing and Community Affairs, Single Family Mortgage Revenue Bonds, | 9/27 at 100.00 | AA+ | 4,454,440 |
| | Series 2018A, 4.250%, 9/01/43 | | | |
| | Texas Municipal Gas Acquisition and Supply Corporation III, Gas Supply Revenue Bonds, | | | |
| | Series 2012: | | | |
| 2,500 | | 5.000%, 12/15/26 | 12/22 at 100.00 | BBB+ | 2,697,900 |
| 2,500 | | 5.000%, 12/15/29 | 12/22 at 100.00 | BBB+ | 2,676,025 |
| 4,355 | | 5.000%, 12/15/30 | 12/22 at 100.00 | BBB+ | 4,652,316 |
| 2,975 | | 5.000%, 12/15/32 | 12/22 at 100.00 | BBB+ | 3,164,686 |
| | Texas Private Activity Bond Surface Transportation Corporation, Senior Lien Revenue | | | |
| | Bonds, LBJ Infrastructure Group LLC IH-635 Managed Lanes Project, Refunding Series 2020A: | | | |
| 5,810 | | 4.000%, 12/31/36 | 12/30 at 100.00 | BBB– | 6,559,955 |
| 2,735 | | 4.000%, 6/30/37 | 12/30 at 100.00 | BBB– | 3,071,870 |
67
| | |
| NVG | Nuveen AMT-Free Municipal Credit Income Fund Portfolio of Investments (continued) October 31, 2020 |
| | | | | | |
| Principal | | | Optional Call | | |
| Amount (000) | | Description (1) | Provisions (2) | Ratings (3) | Value |
| | Texas (continued) | | | |
| $ 3,150 | | Texas Transportation Commission, Central Texas Turnpike System Revenue Bonds, Refunding | 8/22 at 100.00 | A3 (11) | $ 3,416,648 |
| | First Tier Series 2012A, 5.000%, 8/15/41 (Pre-refunded 8/15/22) | | | |
| | Texas Transportation Commission, Central Texas Turnpike System Revenue Bonds, Refunding | | | |
| | First Tier Series 2015B: | | | |
| 11,280 | | 0.000%, 8/15/36 | 8/24 at 59.60 | A3 | 6,070,896 |
| 10,000 | | 0.000%, 8/15/37 | 8/24 at 56.94 | A3 | 5,135,900 |
| | Texas Transportation Commission, Central Texas Turnpike System Revenue Bonds, Refunding | | | |
| | Second Tier Series 2015C: | | | |
| 5,000 | | 5.000%, 8/15/37 | 8/24 at 100.00 | Baa1 | 5,628,000 |
| 31,810 | | 5.000%, 8/15/42 | 8/24 at 100.00 | Baa1 | 35,539,722 |
| 7,500 | | Texas Transportation Commission, State Highway 249 System Revenue Bonds, First Tier Toll | 2/29 at 100.00 | Baa3 | 8,513,325 |
| | Series 2019A, 5.000%, 8/01/57 | | | |
| 4,400 | | Texas Turnpike Authority, Central Texas Turnpike System Revenue Bonds, First Tier Series | No Opt. Call | A3 | 4,176,392 |
| | 2002A, 0.000%, 8/15/25 – AMBAC Insured | | | |
| 1,840 | | Ysleta Independent School District Public Facility Corporation, Texas, Lease Revenue | 5/21 at 100.00 | AA– | 1,889,220 |
| | Refunding Bonds, Series 2001, 5.375%, 11/15/24 – AMBAC Insured | | | |
| 392,755 | | Total Texas | | | 417,986,862 |
| | Virgin Islands – 0.1% (0.0% of Total Investments) | | | |
| 1,790 | | Virgin Islands Public Finance Authority, Gross Receipts Taxes Loan Note, Refunding | 10/22 at 100.00 | A2 | 1,914,047 |
| | Series 2012A, 5.000%, 10/01/32 – AGM Insured | | | |
| | Virginia – 2.3% (1.5% of Total Investments) | | | |
| | Embrey Mill Community Development Authority, Virginia, Special Assessment Revenue Bonds, | | | |
| | Series 2015: | | | |
| 1,200 | | 5.300%, 3/01/35, 144A | 3/25 at 100.00 | N/R | 1,236,336 |
| 1,085 | | 5.600%, 3/01/45, 144A | 3/25 at 100.00 | N/R | 1,119,503 |
| | Hampton Roads Transportation Accountability Commission, Virginia, Revenue Bonds, Senior | | | |
| | Lien Series 2020A: | | | |
| 5,000 | | 4.000%, 7/01/60 | 7/30 at 100.00 | AA | 5,673,400 |
| 5,500 | | 5.000%, 7/01/60 | 7/30 at 100.00 | AA | 6,786,450 |
| 11,380 | | Hampton Roads Transportation Accountability Commission, Virginia, Hampton Roads | 1/28 at 100.00 | AA | 14,095,496 |
| | Transportation Fund Revenue Bonds, Senior Lien Series 2018A, 5.500%, 7/01/57 | | | |
| 1,810 | | Metropolitan Washington Airports Authority, Virginia, Dulles Toll Road Revenue Bonds, | 10/29 at 100.00 | A2 | 1,979,217 |
| | Dulles Metrorail & Capital improvement Projects, Refunding & Subordinate Lien Series 2019B, | | | |
| | 4.000%, 10/01/53 – AGM Insured | | | |
| 3,000 | | Metropolitan Washington Airports Authority, Virginia, Dulles Toll Road Revenue Bonds, | 10/28 at 100.00 | A | 3,600,810 |
| | Dulles Metrorail & Capital Improvement Projects, Refunding First Senior Lien Series 2019A, | | | |
| | 5.000%, 10/01/44 | | | |
| 14,945 | | Metropolitan Washington Airports Authority, Virginia, Dulles Toll Road Revenue Bonds, | 4/22 at 100.00 | Baa1 | 15,570,448 |
| | Dulles Metrorail & Capital Improvement Projects, Refunding Second Senior Lien Series 2014A, | | | |
| | 5.000%, 10/01/53 | | | |
| 11,000 | | Metropolitan Washington Airports Authority, Virginia, Dulles Toll Road Revenue Bonds, | 10/26 at 100.00 | A3 | 13,744,830 |
| | Dulles Metrorail & Capital improvement Projects, Second Senior Lien Series 2009C, 6.500%, | | | |
| | 10/01/41 – AGC Insured | | | |
| 10,000 | | Metropolitan Washington Airports Authority, Virginia, Dulles Toll Road Revenue Bonds, | 10/28 at 100.00 | Baa1 | 12,892,200 |
| | Dulles Metrorail Capital Appreciation, Second Senior Lien Series 2010B, 6.500%, 10/01/44 | | | |
| 2,000 | | Peninsula Town Center Community Development Authority, Virginia, Special Obligation | 9/27 at 100.00 | N/R | 2,080,700 |
| | Bonds, Refunding Series 2018, 5.000%, 9/01/45, 144A | | | |
| 1,000 | | Virginia College Building Authority, Educational Facilities Revenue Bonds, Marymount | 7/25 at 100.00 | Ba2 | 1,027,350 |
| | University Project, Green Series 2015B, 5.250%, 7/01/35, 144A | | | |
| 2,030 | | Virginia Small Business Finance Authority, Tourism Development Financing Program Revenue | 4/28 at 112.76 | N/R | 2,116,011 |
| | Bonds, Downtown Norfolk and Virginia Beach Oceanfront Hotel Projects, Series 2018A, 8.375%, | | | |
| | 4/01/41, 144A | | | |
| 69,950 | | Total Virginia | | | 81,922,751 |
68
| | | | | | |
| Principal | | | Optional Call | | |
| Amount (000) | | Description (1) | Provisions (2) | Ratings (3) | Value |
| | Washington – 1.9% (1.2% of Total Investments) | | | |
| $ 5,000 | | Energy Northwest, Washington, Electric Revenue Bonds, Columbia Generating Station, | 7/25 at 100.00 | AA– | $ 5,857,200 |
| | Refunding Series 2015A, 5.000%, 7/01/38 (UB) (5) | | | |
| 5,750 | | Washington Health Care Facilities Authority, Revenue Bonds, Fred Hutchinson Cancer | 1/21 at 100.00 | A2 (11) | 5,799,622 |
| | Research Center, Series 2011A, 5.625%, 1/01/35 (Pre-refunded 1/01/21) | | | |
| 1,250 | | Washington Health Care Facilities Authority, Revenue Bonds, Providence Health & | 10/24 at 100.00 | AA– | 1,913,313 |
| | Services, Tender Option Bond Trust 2015-XF0132, 17.712%, 10/01/44, 144A (IF) (5) | | | |
| 16,550 | | Washington Health Care Facilities Authority, Revenue Bonds, Seattle Cancer Center | 9/30 at 100.00 | A2 | 19,854,207 |
| | Alliance, Series 2020, 5.000%, 9/01/55 | | | |
| 6,565 | | Washington Health Care Facilities Authority, Revenue Bonds, Seattle Children’s Hospital, | 10/22 at 100.00 | Aa2 | 6,976,232 |
| | Series 2012A, 5.000%, 10/01/42 | | | |
| | Washington State Housing Finance Commission, Non-profit Housing Revenue Bonds, | | | |
| | Presbyterian Retirement Communities Northwest Project, Refunding Series 2016A: | | | |
| 5,450 | | 5.000%, 1/01/46, 144A | 1/25 at 102.00 | BB | 5,577,203 |
| 3,650 | | 5.000%, 1/01/51, 144A | 1/25 at 102.00 | BB | 3,725,373 |
| 21,510 | | Washington State, Motor Vehicle Fuel Tax General Obligation Bonds, Series 2002-03C, | No Opt. Call | AA+ | 19,718,647 |
| | 0.000%, 6/01/28 – NPFG Insured (UB) (5) | | | |
| 65,725 | | Total Washington | | | 69,421,797 |
| | West Virginia – 1.3% (0.8% of Total Investments) | | | |
| 1,900 | | Monongalia County Commission, West Virginia, Special District Excise Tax Revenue, | 6/27 at 100.00 | N/R | 1,956,145 |
| | University Town Centre Economic Opportunity Development District, Refunding & Improvement | | | |
| | Series 2017A, 5.500%, 6/01/37, 144A | | | |
| 40,855 | | West Virginia Hospital Finance Authority, Hospital Revenue Bonds, West Virginia United | 6/23 at 100.00 | A | 44,213,281 |
| | Health System Obligated Group, Refunding & Improvement Series 2013A, 5.500%, 6/01/44 | | | |
| 42,755 | | Total West Virginia | | | 46,169,426 |
| | Wisconsin – 4.0% (2.5% of Total Investments) | | | |
| | Public Finance Authority of Wisconsin, Charter School Revenue Bonds, Cornerstone Charter | | | |
| | Academy, North Carolina, Series 2016A: | | | |
| 1,750 | | 5.000%, 2/01/36, 144A | 2/26 at 100.00 | N/R | 1,799,403 |
| 305 | | 5.125%, 2/01/46, 144A | 2/26 at 100.00 | N/R | 310,941 |
| 1,715 | | Public Finance Authority of Wisconsin, Charter School Revenue Bonds, Corvian Community | 6/26 at 100.00 | N/R | 1,737,518 |
| | School Bonds, North Carolina, Series 2019A, 5.000%, 6/15/49, 144A | | | |
| 500 | | Public Finance Authority of Wisconsin, Charter School Revenue Bonds, Corvian Community | 6/24 at 100.00 | N/R | 506,800 |
| | School, North Carolina, Series 2017A, 5.125%, 6/15/47, 144A | | | |
| 1,480 | | Public Finance Authority of Wisconsin, Charter School Revenue Bonds, Envision Science | 5/26 at 100.00 | N/R | 1,523,127 |
| | Academy Project, Series 2016A, 5.125%, 5/01/36, 144A | | | |
| 6,000 | | Public Finance Authority of Wisconsin, Charter School Revenue Bonds, Phoenix Academy | 6/24 at 100.00 | N/R | 5,945,280 |
| | Charter School, North Carolina, Series 2017A, 5.625%, 6/15/37, 144A | | | |
| | Public Finance Authority of Wisconsin, Charter School Revenue Bonds, Uwharrie Charter | | | |
| | Academy, North Carolina, Series 2017A: | | | |
| 1,000 | | 5.500%, 6/15/37, 144A | 6/27 at 100.00 | N/R | 961,510 |
| 1,790 | | 5.625%, 6/15/47, 144A | 6/27 at 100.00 | N/R | 1,747,649 |
| 35,100 | | Public Finance Authority of Wisconsin, Limited Obligation PILOT Revenue Bonds, American | 12/27 at 100.00 | N/R | 30,314,817 |
| | Dream @ Meadowlands Project, Series 2017, 7.000%, 12/01/50, 144A | | | |
| 1,700 | | Public Finance Authority of Wisconsin, Revenue Bonds, Alabama Proton Therapy Center, | 10/27 at 100.00 | N/R | 1,944,528 |
| | Senior Series 2017A, 7.000%, 10/01/47, 144A | | | |
| | Public Finance Authority of Wisconsin, Revenue Bonds, Prime Healthcare Foundation, Inc, | | | |
| | Series 2017A: | | | |
| 1,575 | | 5.000%, 12/01/27 | No Opt. Call | BBB– | 1,721,050 |
| 1,815 | | 5.200%, 12/01/37 | 12/27 at 100.00 | BBB– | 2,028,607 |
| | Public Finance Authority of Wisconsin, Revenue Bonds, Roseman University of Health | | | |
| | Sciences, Series 2020: | | | |
| 1,300 | | 5.000%, 4/01/40, 144A | 4/30 at 100.00 | BB | 1,391,598 |
| 4,765 | | 5.000%, 4/01/50, 144A | 4/30 at 100.00 | BB | 5,024,502 |
69
| | |
| NVG | Nuveen AMT-Free Municipal Credit Income Fund Portfolio of Investments (continued) October 31, 2020 |
| | | | | | |
| Principal | | | Optional Call | | |
| Amount (000) | | Description (1) | Provisions (2) | Ratings (3) | Value |
| | Wisconsin (continued) | | | |
| | Public Finance Authority, Wisconsin, Educational Revenue Bonds, Lake Norman Charter | | | |
| | School, Series 2018A: | | | |
| $ 4,050 | | 5.000%, 6/15/38, 144A | 6/26 at 100.00 | BBB– | $ 4,445,280 |
| 1,575 | | 5.000%, 6/15/48, 144A | 6/26 at 100.00 | BBB– | 1,702,512 |
| 2,500 | | Public Finance Authority, Wisconsin, Exempt Facilities Revenue Bonds, Celanese Project, | 5/26 at 100.00 | BBB– | 2,693,775 |
| | Refunding Series 2016C, 4.050%, 11/01/30 | | | |
| 8,460 | | Wisconsin Health and Educational Facilities Authority, Revenue Bonds, Aurora Health | 7/21 at 100.00 | Aa3 (11) | 8,745,102 |
| | Care, Inc, Series 2012A, 5.000%, 7/15/25 (Pre-refunded 7/15/21) | | | |
| 6,620 | | Wisconsin Health and Educational Facilities Authority, Revenue Bonds, Froedtert Health | 10/22 at 100.00 | AA | 7,017,928 |
| | Inc Obligated Group, Series 2012A, 5.000%, 4/01/42 | | | |
| | Wisconsin Health and Educational Facilities Authority, Revenue Bonds, Marshfield Clinic, | | | |
| | Series 2012B: | | | |
| 3,495 | | 4.500%, 2/15/40 | 2/22 at 100.00 | A– | 3,581,641 |
| 1,485 | | 5.000%, 2/15/40 | 2/22 at 100.00 | A– | 1,539,351 |
| | Wisconsin Health and Educational Facilities Authority, Revenue Bonds, Mercy Alliance, | | | |
| | Inc, Series 2012: | | | |
| 11,000 | | 5.000%, 6/01/32 | 6/22 at 100.00 | A3 | 11,496,650 |
| 1,500 | | 5.000%, 6/01/39 | 6/22 at 100.00 | A3 | 1,559,220 |
| 1,250 | | Wisconsin Health and Educational Facilities Authority, Revenue Bonds, Meriter Hospital, | 5/21 at 100.00 | N/R (11) | 1,284,200 |
| | Inc, Series 2011A, 5.750%, 5/01/35 (Pre-refunded 5/01/21) | | | |
| 1,450 | | Wisconsin Health and Educational Facilities Authority, Revenue Bonds, Rocket Education | 6/26 at 100.00 | N/R | 1,554,734 |
| | Obligated Group, Series 2017C, 5.250%, 6/01/40, 144A | | | |
| 16,190 | | Wisconsin Health and Educational Facilities Authority, Revenue Bonds, Gundersen | 10/21 at 100.00 | A1 | 16,675,051 |
| | Lutheran, Series 2011A, 5.250%, 10/15/39 | | | |
| 1,000 | | Wisconsin Health and Educational Facilities Authority, Wisconsin, Revenue Bonds, American | 8/24 at 103.00 | N/R | 954,070 |
| | Baptist Homes of the Midwest Obligated Group, Refunding Series 2017, 5.000%, 8/01/37 | | | |
| 2,500 | | Wisconsin Health and Educational Facilities Authority, Wisconsin, Revenue Bonds, Aurora | 4/23 at 100.00 | Aa3 (11) | 2,787,050 |
| | Health Care, Inc, Series 2013A, 5.125%, 4/15/31 (Pre-refunded 4/15/23) | | | |
| | Wisconsin Health and Educational Facilities Authority, Wisconsin, Revenue Bonds, Dickson | | | |
| | Hollow Project Series 2014: | | | |
| 1,000 | | 5.375%, 10/01/44 | 10/22 at 102.00 | N/R | 1,039,040 |
| 1,500 | | 5.500%, 10/01/49 | 10/22 at 102.00 | N/R | 1,561,410 |
| 1,000 | | Wisconsin Health and Educational Facilities Authority, Wisconsin, Revenue Bonds, Rogers | 7/24 at 100.00 | A | 1,116,250 |
| | Memorial Hospital, Inc, Series 2014A, 5.000%, 7/01/34 | | | |
| 1,850 | | Wisconsin Health and Educational Facilities Authority, Wisconsin, Revenue Bonds, Saint | 11/26 at 103.00 | N/R | 1,852,645 |
| | Camillus Health System Inc, Series 2019A, 5.000%, 11/01/54 | | | |
| | Wisconsin Health and Educational Facilities Authority, Wisconsin, Revenue Bonds, Saint | | | |
| | John’s Communities Inc, Series 2015B: | | | |
| 550 | | 5.000%, 9/15/37 | 9/22 at 100.00 | BBB– | 561,363 |
| 1,350 | | 5.000%, 9/15/45 | 9/22 at 100.00 | BBB– | 1,371,317 |
| 1,000 | | Wisconsin Health and Educational Facilities Authority, Wisconsin, Revenue Bonds, Three | 8/23 at 100.00 | A | 1,065,250 |
| | Pillars Senior Living Communities, Refunding Series 2013, 5.000%, 8/15/33 | | | |
| | Wisconsin Health and Educational Facilities Authority, Wisconsin, Revenue Bonds, | | | |
| | Woodland Hills Senior Housing Project, Series 2014: | | | |
| 2,565 | | 5.000%, 12/01/44 | 12/22 at 102.00 | N/R | 2,631,408 |
| 1,775 | | 5.250%, 12/01/49 | 12/22 at 102.00 | N/R | 1,832,705 |
| | Wisconsin Housing and Economic Development Authority, Housing Revenue Bonds, | | | |
| | Series 2019A: | | | |
| 2,800 | | 3.150%, 11/01/44 | 11/28 at 100.00 | Aa3 | 2,948,148 |
| 4,000 | | 3.200%, 11/01/49 | 11/28 at 100.00 | Aa3 | 4,200,680 |
| 143,260 | | Total Wisconsin | | | 143,174,110 |
70
| | | | | | |
| Principal | | | Optional Call | | |
| Amount (000) | | Description (1) | Provisions (2) | Ratings (3) | Value |
| | Wyoming – 0.1% (0.0% of Total Investments) | | | |
| | Teton County Hospital District, Wyoming, Hospital Revenue Bonds, St John’s Medical | | | |
| | Center Project, Series 2011B: | | | |
| $ 1,000 | | 5.500%, 12/01/27 (Pre-refunded 12/01/21) | 12/21 at 100.00 | N/R (11) | $ 1,055,010 |
| 1,000 | | 6.000%, 12/01/36 (Pre-refunded 12/01/21) | 12/21 at 100.00 | N/R (11) | 1,060,160 |
| 2,000 | | Total Wyoming | | | 2,115,170 |
| $ 5,917,599 | | Total Municipal Bonds (cost $5,154,889,505) | | | 5,628,351,128 |
|
| Shares | | Description (1) | | | Value |
| | COMMON STOCKS – 0.4% (0.2% of Total Investments) | | | |
| | Electric Utilities – 0.4% (0.2% of Total Investments) | | | |
| 676,308 | | Energy Harbor Corp (6), (12), (13) | | | $ 13,526,160 |
| | Total Common Stocks (cost $15,015,822) | | | 13,526,160 |
| | Total Long-Term Investments (cost $5,169,905,327) | | | 5,641,877,288 |
| | Floating Rate Obligations – (5.3)% | | | (191,075,000) |
| | Adjustable Rate MuniFund Term Preferred Shares, net of deferred offering costs – (3.1)% (8) | | | (111,913,155) |
| | MuniFund Term Preferred Shares, net of deferred offering costs – (11.3)% (9) | | | (403,997,740) |
| | Variable Rate Demand Preferred Shares, net of deferred offering costs – (39.4)% (10) | | | (1,408,052,524) |
| | Other Assets Less Liabilities – 1.3% | | | 49,516,699 |
| | Net Assets Applicable to Common Shares – 100% | | | $ 3,576,355,568 |
| | |
(1) | All percentages shown in the Portfolio of Investments are based on net assets applicable to common shares unless otherwise noted. |
(2) | Optional Call Provisions: Dates (month and year) and prices of the earliest optional call or redemption. There may be other call provisions at varying prices at later dates. Certain mortgage-backed securities may be subject to periodic principal paydowns. Optional Call Provisions are not covered by the report of independent registered public accounting firm. |
(3) | The ratings disclosed are the lowest of Standard & Poor’s Group (“Standard & Poor’s”), Moody’s Investors Service, Inc. (“Moody’s”) or Fitch, Inc. (“Fitch”) rating. Ratings below BBB by Standard & Poor’s, Baa by Moody’s or BBB by Fitch are considered to be below investment grade. Holdings designated N/R are not rated by any of these national rating agencies. Ratings are not covered by the report of independent registered public accounting firm. |
(4) | Defaulted security. A security whose issuer has failed to fully pay principal and/or interest when due, or is under the protection of bankruptcy. |
(5) | Investment, or portion of investment, has been pledged to collateralize the net payment obligations for investments in inverse floating rate transactions. |
(6) | For fair value measurement disclosure purposes, investment classified as Level 2. See Notes to Financial Statements, Note 3 – Investment Valuation and Fair Value Measurements for more information. |
(7) | Step-up coupon bond, a bond with a coupon that increases (“steps up”), usually at regular intervals, while the bond is outstanding. The rate shown is the coupon as of the end of the reporting period. |
(8) | Adjustable Rate MuniFund Term Preferred Shares, net of deferred offering costs as a percentage of Total Investments is 2.0%. |
(9) | MuniFund Term Preferred Shares, net of deferred offering costs as a percentage of Total Investments is 7.2%. |
(10) | Variable Rate Demand Preferred Shares, net of deferred offering costs as a percentage of Total Investments is 25.0%. |
(11) | Backed by an escrow or trust containing sufficient U.S. Government or U.S. Government agency securities, which ensure the timely payment of principal and interest. |
(12) | Common Stock received as part of the bankruptcy settlements for Beaver County Industrial Development Authority, Pennsylvania, Pollution Control Revenue Bonds, FirstEnergy Nuclear Generation Project, Refunding Series 2005A, 4.000%, 1/01/35, Beaver County Industrial Development Authority, Pennsylvania, Pollution Control Revenue Refunding Bonds, FirstEnergy Nuclear Generation Project, Series 2006A, 3.500%, 4/01/41, Beaver County Industrial Development Authority, Pennsylvania, Pollution Control Revenue Refunding Bonds, FirstEnergy Nuclear Generation Project, Series 2006B, 3.500%, 12/01/35, Ohio Air Quality Development Authority, Ohio, Air Quality Development Revenue Bonds, FirstEnergy Generation Corporation Project, Series 2009A, 5.700%, 8/01/20, Ohio Air Quality Development Authority, Ohio, Pollution Control Revenue Bonds, FirstEnergy Generation Corporation Project, Refunding Series 2009B, 3.100%, 3/01/23, Ohio Air Quality Development Authority, Ohio, Pollution Control Revenue Bonds, FirstEnergy Nuclear Generation Corporation Project, Refunding Series 2010B, 3.750%, 6/01/33, Ohio Air Quality Development Authority, Ohio, Pollution Control Revenue Bonds, FirstEnergy Nuclear Generation Project, Refunding Series 2006B, 3.125%, 1/01/34, Ohio Water Development Authority, Pollution Control Revenue Refunding Bonds, FirstEnergy Nuclear Generating Corporation Project, Series 2006B, 4.000%, 12/01/33, Ohio Water Development Authority, Pollution Control Revenue Refunding Bonds, FirstEnergy Nuclear Generating Corporation Project, Series 2010C, 4.000%, 6/01/33. |
(13) | Non-income producing; issuer has not declared a dividend within the past twelve months. |
144A | Investment is exempt from registration under Rule 144A of the Securities Act of 1933, as amended. These investments may only be resold in transactions exempt from registration, which are normally those transactions with qualified institutional buyers. |
|
ETM | Escrowed to maturity. |
IF | Inverse floating rate security issued by a tender option bond (“TOB”) trust, the interest rate on which varies inversely with the Securities Industry Financial Markets Association (SIFMA) short-term rate, which resets weekly, or a similar short-term rate, and is reduced by the expenses related to the TOB trust. |
|
UB | Underlying bond of an inverse floating rate trust reflected as a financing transaction. See Notes to Financial Statements, Note 4 – Portfolio Securities and Investments in Derivatives for more information. |
WI/DD | Purchased on a when-issued or delayed delivery basis. |
| See accompanying notes to financial statements. |
71
| | |
| NZF | Nuveen Municipal Credit Income Fund Portfolio of Investments October 31, 2020 |
| | | | | | |
| Principal | | | Optional Call | | |
| Amount (000) | | Description (1) | Provisions (2) | Ratings (3) | Value |
| | LONG-TERM INVESTMENTS – 159.2% (100.0% of Total Investments) | | | |
| | MUNICIPAL BONDS – 158.0% (99.3% of Total Investments) | | | |
| | Alabama – 1.0% (0.6% of Total Investments) | | | |
| $ 8,585 | | Alabama Private Colleges and University Facilities Authority, Limited Obligation Bonds, | 9/25 at 100.00 | N/R | $ 8,911,230 |
| | University of Mobile Project, Series 2015A, 6.000%, 9/01/45, 144A | | | |
| 5,250 | | Alabama Special Care Facilities Financing Authority, Birmingham, Hospital Revenue Bonds, | 11/20 at 100.00 | N/R (12) | 5,608,680 |
| | Daughters of Charity National Health System – Providence Hospital and St Vincent’s Hospital, | | | |
| | Series 1995, 5.000%, 11/01/25 (ETM) | | | |
| 5,835 | | Lower Alabama Gas District, Alabama, Gas Project Revenue Bonds, Series 2016A, | No Opt. Call | A3 | 8,001,477 |
| | 5.000%, 9/01/46 | | | |
| 19,670 | | Total Alabama | | | 22,521,387 |
| | Alaska – 0.3% (0.2% of Total Investments) | | | |
| | Alaska Industrial Development and Export Authority, Power Revenue Bonds, Snettisham | | | |
| | Hydroelectric Project, Refunding Series 2015: | | | |
| 1,000 | | 5.000%, 1/01/31 (AMT) | 7/25 at 100.00 | Baa2 | 1,104,900 |
| 2,950 | | 5.000%, 1/01/33 (AMT) | 7/25 at 100.00 | Baa2 | 3,239,218 |
| 2,900 | | 5.000%, 1/01/34 (AMT) | 7/25 at 100.00 | Baa2 | 3,173,702 |
| 70 | | Northern Tobacco Securitization Corporation, Alaska, Tobacco Settlement Asset-Backed | 11/20 at 100.00 | A1 | 70,018 |
| | Bonds, Series 2006A, 4.625%, 6/01/23 | | | |
| 6,920 | | Total Alaska | | | 7,587,838 |
| | Arizona – 2.1% (1.3% of Total Investments) | | | |
| 1,300 | | Apache County Industrial Development Authority, Arizona, Pollution Control Revenue | 3/22 at 100.00 | A– | 1,345,305 |
| | Bonds, Tucson Electric Power Company, Series 20102A, 4.500%, 3/01/30 | | | |
| 2,820 | | Arizona Health Facilities Authority, Revenue Bonds, Scottsdale Lincoln Hospitals | 12/24 at 100.00 | A2 | 3,198,980 |
| | Project, Refunding Series 2014A, 5.000%, 12/01/39 | | | |
| 10,450 | | Arizona Sports and Tourism Authority, Tax Revenue Bonds, Multipurpose Stadium Facility | 7/22 at 100.00 | A | 10,973,127 |
| | Project, Refunding Senior Series 2012A, 5.000%, 7/01/30 | | | |
| 2,255 | | Cahava Springs Revitalization District, Cave Creek, Arizona, Special Assessment Bonds, | 7/27 at 100.00 | N/R | 1,736,350 |
| | Series 2017A, 7.000%, 7/01/41, 144A (4) | | | |
| 3,185 | | Eastmark Community Facilities District 1, Mesa, Arizona, General Obligation Bonds, | 7/25 at 100.00 | N/R | 3,383,425 |
| | Series 2015, 5.000%, 7/15/39, 144A | | | |
| 1,750 | | Maricopa County Industrial Development Authority, Arizona, Hospital Revenue Bonds, | 9/28 at 100.00 | A2 | 2,079,437 |
| | HonorHealth, Series 2019A, 5.000%, 9/01/42 | | | |
| | Phoenix Mesa Gateway Airport Authority, Arizona, Special Facility Revenue Bonds, Mesa | | | |
| | Project, Series 2012: | | | |
| 400 | | 5.000%, 7/01/27 (AMT) | 7/22 at 100.00 | A1 | 424,976 |
| 950 | | 5.000%, 7/01/32 (AMT) | 7/22 at 100.00 | A1 | 1,008,662 |
| | Pima County Industrial Development Authority, Arizona, Education Facility Revenue Bonds, | | | |
| | Edkey Charter Schools Project, Refunding Series 2013: | | | |
| 335 | | 6.000%, 7/01/33 | 11/20 at 102.00 | BB– | 342,136 |
| 365 | | 6.000%, 7/01/43 | 11/20 at 102.00 | BB– | 372,658 |
| 205 | | 6.000%, 7/01/48 | 11/20 at 102.00 | BB– | 209,293 |
| 1,390 | | Pima County Industrial Development Authority, Arizona, Education Facility Revenue Bonds, | 11/20 at 102.00 | BB– | 1,420,636 |
| | Edkey Charter Schools Project, Series 2014A, 7.375%, 7/01/49 | | | |
| | Pima County Industrial Development Authority, Arizona, Education Facility Revenue Bonds, | | | |
| | Edkey Charter Schools Project, Series 2016: | | | |
| 1,790 | | 5.375%, 7/01/46 | 7/26 at 100.00 | BB– | 1,830,168 |
| 2,140 | | 5.500%, 7/01/51 | 7/26 at 100.00 | BB– | 2,192,665 |
| 595 | | Pima County Industrial Development Authority, Arizona, Education Facility Revenue Bonds, | 2/24 at 100.00 | N/R | 620,103 |
| | San Tan Montessori School Project, Series 2016, 6.500%, 2/01/48, 144A | | | |
72
| | | | | |
| Principal | | Optional Call | | |
| Amount (000) | Description (1) | Provisions (2) | Ratings (3) | Value |
| Arizona (continued) | | | |
| $ 2,060 | Pima County Industrial Development Authority, Arizona, Education Facility Revenue Bonds, | 2/28 at 100.00 | N/R | $ 2,264,826 |
| San Tan Montessori School Project, Series 2017, 6.750%, 2/01/50, 144A | | | |
| 865 | Pima County Industrial Development Authority, Arizona, Education Revenue Bonds, Noah | 11/20 at 102.00 | BB– | 884,151 |
| Webster Schools Pima Project, Series 2014A, 7.250%, 7/01/39 | | | |
| 3,710 | Pinal County Electrical District 3, Arizona, Electric System Revenue Bonds, Refunding | 7/21 at 100.00 | A+ (12) | 3,834,211 |
| Series 2011, 5.250%, 7/01/41 (Pre-refunded 7/01/21) | | | |
| 7,235 | Salt Verde Financial Corporation, Arizona, Senior Gas Revenue Bonds, Citigroup Energy | No Opt. Call | BBB+ | 9,676,595 |
| Inc Prepay Contract Obligations, Series 2007, 5.000%, 12/01/37 | | | |
| 43,800 | Total Arizona | | | 47,797,704 |
| California – 22.1% (13.9% of Total Investments) | | | |
| 2,000 | ABC Unified School District, Los Angeles County, California, General Obligation Bonds, | No Opt. Call | AA– | 1,966,140 |
| Series 2000B, 0.000%, 8/01/23 – FGIC Insured | | | |
| 4,225 | Alameda Unified School District, Alameda County, California, General Obligation Bonds, | No Opt. Call | AA | 3,830,132 |
| Series 2005B, 0.000%, 8/01/28 – AGM Insured | | | |
| 535 | Antelope Valley Healthcare District, California, Revenue Bonds, Series 2016A, | 3/26 at 100.00 | Ba3 | 537,777 |
| 5.000%, 3/01/41 | | | |
| 1,900 | Blythe Redevelopment Agency Successor Agency, California, Tax Allocation Bonds, | 11/25 at 100.00 | N/R | 2,126,670 |
| Redevelopment Project 1, Refunding Series 2015, 5.000%, 5/01/38 | | | |
| Calexico Unified School District, Imperial County, California, General Obligation Bonds, | | | |
| Series 2005B: | | | |
| 4,070 | 0.000%, 8/01/32 – FGIC Insured | No Opt. Call | A3 | 3,214,038 |
| 6,410 | 0.000%, 8/01/34 – FGIC Insured | No Opt. Call | A3 | 4,749,938 |
| 1,515 | California Community Housing Agency, California, Essential Housing Revenue Bonds, | 8/29 at 100.00 | N/R | 1,681,938 |
| Verdant at Green Valley Apartments, Series 2019A, 5.000%, 8/01/49, 144A | | | |
| 1,295 | California County Tobacco Securitization Agency, Tobacco Settlement Asset-Backed Bonds, | 11/20 at 100.00 | N/R | 1,295,155 |
| Golden Gate Tobacco Funding Corporation, Turbo, Series 2007A, 5.000%, 6/01/36 | | | |
| California Health Facilities Financing Authority, Revenue Bonds, Saint Joseph Health | | | |
| System, Series 2013A: | | | |
| 3,840 | 5.000%, 7/01/33 | 7/23 at 100.00 | AA– | 4,242,662 |
| 710 | 5.000%, 7/01/37 | 7/23 at 100.00 | AA– | 781,589 |
| 825 | California Municipal Finance Authority, Charter School Lease Revenue Bonds, Santa Rosa | 7/25 at 100.00 | BB+ | 875,639 |
| Academy Project, Series 2015, 5.375%, 7/01/45, 144A | | | |
| 1,795 | California Pollution Control Financing Authority, Water Furnishing Revenue Bonds, San | 1/29 at 100.00 | Baa3 | 2,072,758 |
| Diego County Water Authority Desalination Project Pipeline, Refunding Series 2019, 5.000%, | | | |
| 7/01/39, 144A | | | |
| 2,000 | California School Finance Authority, Charter School Revenue Bonds, Downtown College Prep – | 6/26 at 100.00 | N/R | 2,097,000 |
| Obligated Group, Series 2016, 5.000%, 6/01/51, 144A | | | |
| 2,000 | California State Public Works Board, Lease Revenue Bonds, Judicial Council of | 3/23 at 100.00 | A+ | 2,194,280 |
| California, Various Projects Series 2013A, 5.000%, 3/01/38 | | | |
| 4,500 | California State Public Works Board, Lease Revenue Bonds, Various Capital Projects, | 10/21 at 100.00 | A+ | 4,688,955 |
| Series 2011A, 5.125%, 10/01/31 | | | |
| 3,000 | California State, General Obligation Bonds, Various Purpose Series 2011, 5.250%, 10/01/32 | 10/21 at 100.00 | AA– | 3,131,340 |
| 10,000 | California Statewide Communities Development Authority, California, Revenue Bonds, Loma | 12/24 at 100.00 | BB– | 10,821,400 |
| Linda University Medical Center, Series 2014A, 5.500%, 12/01/54 | | | |
| California Statewide Communities Development Authority, California, Revenue Bonds, Loma | | | |
| Linda University Medical Center, Series 2016A: | | | |
| 2,250 | 5.000%, 12/01/41, 144A | 6/26 at 100.00 | BB– | 2,458,575 |
| 17,155 | 5.000%, 12/01/46, 144A | 6/26 at 100.00 | BB– | 18,564,283 |
| 7,335 | 5.250%, 12/01/56, 144A | 6/26 at 100.00 | BB– | 8,070,847 |
| 27,545 | California Statewide Communities Development Authority, California, Revenue Bonds, Loma | 6/28 at 100.00 | BB– | 31,149,263 |
| Linda University Medical Center, Series 2018A, 5.500%, 12/01/58, 144A | | | |
73
| | |
| NZF | Nuveen Municipal Credit Income Fund Portfolio of Investments (continued) October 31, 2020 |
| | | | | | |
| Principal | | | Optional Call | | |
| Amount (000) | | Description (1) | Provisions (2) | Ratings (3) | Value |
| | California (continued) | | | |
| $ 527 | | California Statewide Community Development Authority, Revenue Bonds, Daughters of | 11/20 at 100.00 | N/R | $ 484,665 |
| | Charity Health System, Series 2005A, 5.500%, 7/01/39 (4) | | | |
| 355 | | California Statewide Community Development Authority, Revenue Bonds, Daughters of | 11/20 at 100.00 | N/R | 327,149 |
| | Charity Health System, Series 2005H, 5.750%, 7/01/25 (4) | | | |
| 9,955 | | Capistrano Unified School District, Orange County, California, Special Tax Bonds, | No Opt. Call | Baa2 | 7,948,570 |
| | Community Facilities District 98-2, Series 2005, 0.000%, 9/01/31 – FGIC Insured | | | |
| | Clovis Unified School District, Fresno County, California, General Obligation Bonds, | | | |
| | Election 2012 Series 2013B: | | | |
| 1,135 | | 5.000%, 8/01/38 (Pre-refunded 8/01/23) | 8/23 at 100.00 | AA (12) | 1,283,027 |
| 1,865 | | 5.000%, 8/01/38 (Pre-refunded 8/01/23) | 8/23 at 100.00 | N/R (12) | 2,105,492 |
| 4,000 | | Coast Community College District, Orange County, California, General Obligation Bonds, | No Opt. Call | AA+ | 3,967,840 |
| | Series 2005, 0.000%, 8/01/22 – NPFG Insured | | | |
| 3,795 | | Colton Joint Unified School District, San Bernardino County, California, General | No Opt. Call | A+ | 2,513,163 |
| | Obligation Bonds, Series 2006C, 0.000%, 2/01/37 – FGIC Insured | | | |
| 1,365 | | Contra Costa County, California, GNMA Mortgage-Backed Securities Program Home Mortgage | No Opt. Call | AA+ (12) | 1,437,563 |
| | Revenue Bonds, Series 1989, 7.750%, 5/01/22 (AMT) (ETM) | | | |
| 1,320 | | Davis, California, Special Tax Bonds, Community Facilities District 2015-1 Series 2015, | 9/25 at 100.00 | N/R | 1,470,203 |
| | 5.000%, 9/01/40 | | | |
| 5,000 | | Escondido Union School District, San Diego County, California, General Obligation Bonds, | 8/27 at 100.00 | Aa2 | 5,668,050 |
| | Election 2014 Series 2018B, 4.000%, 8/01/47 | | | |
| 2,510 | | Folsom Cordova Unified School District, Sacramento County, California, General | No Opt. Call | AA– | 2,252,800 |
| | Obligation Bonds, School Facilities Improvement District 1, Series 2004B, 0.000%, 10/01/28 – | | | |
| | NPFG Insured | | | |
| 3,360 | | Folsom Cordova Unified School District, Sacramento County, California, General | No Opt. Call | AA– | 3,124,901 |
| | Obligation Bonds, School Facilities Improvement District 2, Series 2002A, 0.000%, 7/01/27 – | | | |
| | NPFG Insured | | | |
| 3,725 | | Foothill/Eastern Transportation Corridor Agency, California, Toll Road Revenue Bonds, | No Opt. Call | BBB | 2,766,967 |
| | Refunding Senior Lien Series 2015A, 0.000%, 1/15/34 – AGM Insured | | | |
| | Foothill/Eastern Transportation Corridor Agency, California, Toll Road Revenue Bonds, | | | |
| | Refunding Series 2013A: | | | |
| 3,000 | | 0.000%, 1/15/26 (6) | No Opt. Call | Baa2 | 3,024,960 |
| 1,560 | | 5.750%, 1/15/46 | 1/24 at 100.00 | Baa2 | 1,742,411 |
| 3,560 | | 6.000%, 1/15/49 (Pre-refunded 1/15/24) | 1/24 at 100.00 | Baa2 (12) | 4,206,994 |
| 4,505 | | Foothill-De Anza Community College District, Santa Clara County, California, Election of | No Opt. Call | AAA | 3,882,454 |
| | 1999 General Obligation Bonds, Series A, 0.000%, 8/01/30 – NPFG Insured | | | |
| 5,855 | | Fremont Union High School District, Santa Clara County, California, General Obligation | 8/27 at 100.00 | AAA | 6,678,564 |
| | Bonds, Refunding Series 2017A, 4.000%, 8/01/46 | | | |
| 2,315 | | Gateway Unified School District, California, General Obligation Bonds, Series 2004B, | No Opt. Call | A+ | 1,828,132 |
| | 0.000%, 8/01/32 – FGIC Insured | | | |
| 1,000 | | Gavilan Joint Community College District, Santa Clara and San Benito Counties, | 8/21 at 100.00 | Aa3 (12) | 1,041,650 |
| | California, General Obligation Bonds, Election of 2004 Series 2011D, 5.750%, 8/01/35 | | | |
| | (Pre-refunded 8/01/21) | | | |
| 8,495 | | Golden State Tobacco Securitization Corporation, California, Enhanced Tobacco Settlement | 6/25 at 100.00 | A+ | 9,714,033 |
| | Asset-Backed Revenue Bonds, Refunding Series 2015A, 5.000%, 6/01/45 | | | |
| 3,170 | | Golden State Tobacco Securitization Corporation, California, Enhanced Tobacco Settlement | No Opt. Call | Aa3 | 2,997,552 |
| | Asset-Backed Revenue Bonds, Series 2005A, 0.000%, 6/01/26 – AGM Insured | | | |
| 8,550 | | Golden State Tobacco Securitization Corporation, California, Tobacco Settlement | 6/22 at 100.00 | N/R | 8,810,091 |
| | Asset-Backed Bonds, Series 2018A-1, 5.250%, 6/01/47 | | | |
| 500 | | Golden State Tobacco Securitization Corporation, California, Tobacco Settlement | 6/22 at 100.00 | N/R | 514,310 |
| | Asset-Backed Bonds, Series 2018A-2, 5.000%, 6/01/47 | | | |
| 7,150 | | Grossmont Healthcare District, California, General Obligation Bonds, Series 2011B, | 7/21 at 100.00 | Aaa (12) | 7,448,227 |
| | 6.125%, 7/15/40 (Pre-refunded 7/15/21) | | | |
74
| | | | | | |
| Principal | | | Optional Call | | |
| Amount (000) | | Description (1) | Provisions (2) | Ratings (3) | Value |
| | California (continued) | | | |
| $ 3,190 | | Hillsborough City School District, San Mateo County, California, General Obligation | No Opt. Call | AAA | $ 2,985,872 |
| | Bonds, Series 2006B, 0.000%, 9/01/27 | | | |
| 5,000 | | Huntington Beach Union High School District, Orange County, California, General | No Opt. Call | Aa2 | 4,092,500 |
| | Obligation Bonds, Series 2005, 0.000%, 8/01/31 – NPFG Insured | | | |
| 2,500 | | Huntington Beach Union High School District, Orange County, California, General | No Opt. Call | AA– | 1,981,125 |
| | Obligation Bonds, Series 2007, 0.000%, 8/01/32 – FGIC Insured | | | |
| 14,565 | | Los Angeles Department of Airports, California, Revenue Bonds, Los Angeles International | 5/28 at 100.00 | A+ | 17,094,795 |
| | Airport, Subordinate Lien Series 2018A, 5.000%, 5/15/44 (AMT) | | | |
| 2,750 | | Los Angeles Regional Airports Improvement Corporation, California, Lease Revenue Bonds, | 1/22 at 100.00 | A– | 2,824,828 |
| | LAXFUEL Corporation at Los Angeles International Airport, Refunding Series 2012, 4.500%, | | | |
| | 1/01/27 (AMT) | | | |
| 2,000 | | Martinez Unified School District, Contra Costa County, California, General Obligation | 8/24 at 100.00 | AA (12) | 2,417,340 |
| | Bonds, Series 2011, 5.875%, 8/01/31 (Pre-refunded 8/01/24) | | | |
| 1,000 | | Mendocino-Lake Community College District, Mendocino and Lake Counties, California, | 8/26 at 100.00 | A1 | 1,260,370 |
| | General Obligation Bonds, Election 2006, Series 2011B, 5.600%, 8/01/31 – AGM Insured | | | |
| 10,000 | | Milpitas Municipal Financing Authority, California, Wastewater Revenue Bonds, Series | 11/29 at 100.00 | AA+ | 11,449,700 |
| | 2019, 4.000%, 11/01/49 | | | |
| 2,335 | | Morongo Band of Mission Indians, California, Enterprise Revenue Bonds, Series 2018A, | 10/28 at 100.00 | BBB– | 2,548,162 |
| | 5.000%, 10/01/42, 144A | | | |
| | Mount San Antonio Community College District, Los Angeles County, California, General | | | |
| | Obligation Bonds, Election of 2008, Series 2013A: | | | |
| 1,030 | | 0.000%, 8/01/28 (6) | 2/28 at 100.00 | AA | 1,191,813 |
| 2,320 | | 0.000%, 8/01/43 (6) | 8/35 at 100.00 | AA | 2,391,178 |
| 5,420 | | M-S-R Energy Authority, California, Gas Revenue Bonds, Citigroup Prepay Contracts, | No Opt. Call | BBB+ | 8,443,330 |
| | Series 2009B, 6.500%, 11/01/39 | | | |
| | M-S-R Energy Authority, California, Gas Revenue Bonds, Citigroup Prepay Contracts, | | | |
| | Series 2009C: | | | |
| 2,700 | | 7.000%, 11/01/34 | No Opt. Call | BBB+ | 4,135,239 |
| 2,200 | | 6.500%, 11/01/39 | No Opt. Call | BBB+ | 3,427,182 |
| | North Orange County Community College District, California, General Obligation Bonds, | | | |
| | Election of 2002 Series 2003B: | | | |
| 7,735 | | 0.000%, 8/01/25 – FGIC Insured | No Opt. Call | AA+ | 7,503,646 |
| 4,180 | | 0.000%, 8/01/26 – FGIC Insured | No Opt. Call | AA+ | 3,978,064 |
| 10,885 | | Norwalk La Mirada Unified School District, Los Angeles County, California, General | No Opt. Call | A+ | 10,465,057 |
| | Obligation Bonds, Election 2002 Series 2005B, 0.000%, 8/01/25 – FGIC Insured | | | |
| 6,000 | | Palomar Pomerado Health, California, General Obligation Bonds, Capital Appreciation, | No Opt. Call | BBB– | 5,760,240 |
| | Election of 2004, Series 2007A, 0.000%, 8/01/24 – NPFG Insured | | | |
| 12,210 | | Palomar Pomerado Health, California, General Obligation Bonds, Convertible Capital | 8/30 at 100.00 | BBB– | 16,928,188 |
| | Appreciation, Election 2004 Series 2010A, 6.750%, 8/01/40 | | | |
| 5,000 | | Palomar Pomerado Health, California, General Obligation Bonds, Series 2009A, 7.000%, | 8/29 at 100.00 | BBB– | 7,115,500 |
| | 8/01/38 – AGC Insured | | | |
| 1,750 | | Paramount Unified School District, Los Angeles County, California, General Obligation | No Opt. Call | Aa3 | 1,718,483 |
| | Bonds, Series 2001B, 0.000%, 9/01/23 – AGM Insured | | | |
| 9,315 | | Perris, California, GNMA Mortgage-Backed Securities Program Single Family Mortgage | No Opt. Call | AA+ (12) | 10,673,593 |
| | Revenue Bonds, Series 1989A, 7.600%, 1/01/23 (AMT) (ETM) | | | |
| 2,500 | | Petaluma, Sonoma County, California, Wastewater Revenue Bonds, Refunding Series 2011, | 5/21 at 100.00 | AA+ (12) | 2,561,400 |
| | 5.500%, 5/01/32 (Pre-refunded 5/01/21) | | | |
| 3,850 | | Placentia-Yorba Linda Unified School District, Orange County, California, Certificates | 10/21 at 100.00 | A2 | 4,042,616 |
| | of Participation, Refunding Series 2011, 6.250%, 10/01/28 – AGM Insured | | | |
| 3,200 | | Redlands Unified School District, San Bernardino County, California, General Obligation | No Opt. Call | A2 | 2,944,736 |
| | Bonds, Series 2003, 0.000%, 7/01/27 – AGM Insured | | | |
| 205 | | Riverside County Transportation Commission, California, Toll Revenue Senior Lien Bonds, | 6/23 at 100.00 | BBB+ | 221,841 |
| | Series 2013A, 5.750%, 6/01/44 | | | |
75
| | |
| NZF | Nuveen Municipal Credit Income Fund Portfolio of Investments (continued) October 31, 2020 |
| | | | | | |
| Principal | | | Optional Call | | |
| Amount (000) | | Description (1) | Provisions (2) | Ratings (3) | Value |
| | California (continued) | | | |
| $ 2,755 | | Sacramento City Unified School District, Sacramento County, California, General | No Opt. Call | BBB+ | $ 2,609,646 |
| | Obligation Bonds, Series 2007, 0.000%, 7/01/25 – AGM Insured | | | |
| 3,550 | | San Buenaventura, California, Revenue Bonds, Community Memorial Health System, Series | 12/21 at 100.00 | BB | 3,707,514 |
| | 2011, 7.500%, 12/01/41 | | | |
| 165 | | San Clemente, California, Special Tax Revenue Bonds, Community Facilities District | 9/25 at 100.00 | N/R | 183,696 |
| | 2006-1 Marblehead Coastal, Series 2015, 5.000%, 9/01/40 | | | |
| 3,000 | | San Diego Community College District, California, General Obligation Bonds, Tender | 8/21 at 100.00 | Aaa | 3,324,630 |
| | Option Bond Trust 2016-XG0053, 13.665%, 8/01/41, 144A (Pre-refunded 8/01/21) (IF) (7) | | | |
| 50,510 | | San Francisco Airports Commission, California, Revenue Bonds, San Francisco | 5/28 at 100.00 | A | 58,486,539 |
| | International Airport, Second Series 2018D, 5.000%, 5/01/48 (AMT) | | | |
| | San Francisco Airports Commission, California, Revenue Bonds, San Francisco | | | |
| | International Airport, Second Series 2019A: | | | |
| 1,000 | | 5.000%, 5/01/44 (AMT) | 5/29 at 100.00 | A | 1,185,360 |
| 22,975 | | 5.000%, 5/01/49 (AMT) | 5/29 at 100.00 | A | 27,045,481 |
| 2,700 | | San Joaquin Hills Transportation Corridor Agency, Orange County, California, Toll Road | 1/25 at 100.00 | BBB– | 2,975,292 |
| | Revenue Bonds, Refunding Junior Lien Series 2014B, 5.250%, 1/15/44 | | | |
| | San Joaquin Hills Transportation Corridor Agency, Orange County, California, Toll Road | | | |
| | Revenue Bonds, Refunding Senior Lien Series 2014A: | | | |
| 6,630 | | 5.000%, 1/15/44 | 1/25 at 100.00 | BBB | 7,290,414 |
| 3,160 | | 5.000%, 1/15/50 | 1/25 at 100.00 | BBB | 3,458,936 |
| 7,205 | | San Joaquin Hills Transportation Corridor Agency, Orange County, California, Toll Road | No Opt. Call | Baa2 | 6,910,027 |
| | Revenue Bonds, Refunding Series 1997A, 0.000%, 1/15/23 – NPFG Insured | | | |
| 9,750 | | San Luis Obispo County Community College District, California, General Obligation Bonds, | 8/28 at 100.00 | AA– | 11,270,318 |
| | Election of 2014 Series 2018B, 4.000%, 8/01/43 | | | |
| 5,760 | | San Ysidro School District, San Diego County, California, General Obligation Bonds, | 8/25 at 34.92 | A3 | 1,831,046 |
| | Refunding Series 2015, 0.000%, 8/01/45 | | | |
| 5,520 | | Silicon Valley Clean Water, Mateo County, California, Wastewater Revenue Bonds, Series | 2/28 at 100.00 | AA | 6,261,336 |
| | 2018, 4.000%, 8/01/42 | | | |
| | Silicon Valley Tobacco Securitization Authority, California, Tobacco Settlement | | | |
| | Asset-Backed Bonds, Santa Clara County Tobacco Securitization Corporation, Series 2007A: | | | |
| 7,500 | | 0.000%, 6/01/36 | 11/20 at 42.32 | N/R | 3,161,325 |
| 37,555 | | 0.000%, 6/01/47 | 11/20 at 22.55 | N/R | 8,433,726 |
| 1,820 | | Southwestern Community College District, San Diego County, California, General | 8/27 at 100.00 | AA– | 2,079,514 |
| | Obligation Bonds, Election of 2016, Series 2017A, 4.000%, 8/01/42 | | | |
| 1,800 | | Walnut Valley Unified School District, Los Angeles County, California, General | No Opt. Call | AA– | 1,678,212 |
| | Obligation Bonds, Election 2000 Series 2003D, 0.000%, 8/01/27 – FGIC Insured | | | |
| | Wiseburn School District, Los Angeles County, California, General Obligation Bonds, | | | |
| | Series 2011B: | | | |
| 4,005 | | 0.000%, 8/01/36 – AGM Insured (6) | 8/31 at 100.00 | AA | 4,456,323 |
| 3,900 | | 5.625%, 5/01/41 (Pre-refunded 8/01/21) – AGM Insured | 8/21 at 100.00 | AA (12) | 4,058,808 |
| 3,000 | | Yuba Community College District, California, General Obligation Bonds, Election 2006 | 8/21 at 100.00 | Aa2 (12) | 3,113,790 |
| | Series 2011C, 5.250%, 8/01/47 (Pre-refunded 8/01/21) | | | |
| 501,577 | | Total California | | | 501,468,878 |
| | Colorado – 6.3% (4.0% of Total Investments) | | | |
| 1,250 | | Adams County School District 1, Mapleton Public Schools, Colorado, General Obligation | 12/20 at 100.00 | Aa2 (12) | 1,255,900 |
| | Bonds, Series 2010, 6.250%, 12/01/35 (Pre-refunded 12/01/20) | | | |
| 1,500 | | Anthem West Metropolitan District, Colorado, General Obligation Bonds, Refunding Series | 12/25 at 100.00 | A1 | 1,788,135 |
| | 2015, 5.000%, 12/01/35 – BAM Insured | | | |
| 1,215 | | Base Village Metropolitan District 2, Colorado, General Obligation Bonds, Refunding | 12/21 at 103.00 | N/R | 1,259,761 |
| | Series 2016A, 5.500%, 12/01/36 | | | |
76
| | | | | | |
| Principal | | | Optional Call | | |
| Amount (000) | | Description (1) | Provisions (2) | Ratings (3) | Value |
| | Colorado (continued) | | | |
| | Canyons Metropolitan District 5, Douglas County, Colorado, Limited Tax General | | | |
| | Obligation and Special Revenue Bonds, Refunding & Improvement Series 2017A: | | | |
| $ 775 | | 6.000%, 12/01/37 | 12/22 at 103.00 | N/R | $ 808,635 |
| 2,320 | | 6.125%, 12/01/47 | 12/22 at 103.00 | N/R | 2,422,985 |
| 685 | | Canyons Metropolitan District 6, Douglas County, Colorado, Limited Tax General Obligation | 12/22 at 103.00 | N/R | 715,407 |
| | and Special Revenue Bonds, Refunding & Improvement Series 2017A, 6.125%, 12/01/47 | | | |
| 500 | | Castle Oaks Metropolitan District 3, Castle Rock, Douglas County, Colorado, General | 12/20 at 103.00 | N/R (12) | 516,830 |
| | Obligation Limited Tax Bonds, Series 2016, 5.500%, 12/01/45 (Pre-refunded 12/01/20) | | | |
| | Centerra Metropolitan District 1, Loveland, Colorado, Special Revenue Bonds, Refunding & | | | |
| | Improvement Series 2017: | | | |
| 770 | | 5.000%, 12/01/37, 144A | 12/22 at 103.00 | N/R | 795,741 |
| 2,210 | | 5.000%, 12/01/47, 144A | 12/22 at 103.00 | N/R | 2,259,681 |
| 625 | | Central Platte Valley Metropolitan District, Colorado, General Obligation Bonds, | 12/23 at 100.00 | BBB– | 678,900 |
| | Refunding Series 2013A, 6.000%, 12/01/38 | | | |
| 1,000 | | Cherry Creek Corporate Center Metropolitan District, Arapahoe County, Colorado, Revenue | 12/25 at 100.00 | N/R | 1,021,530 |
| | Bonds, Refunding Senior Lien Series 2015A, 5.000%, 6/01/37 | | | |
| 1,000 | | Colorado Educational and Cultural Facilities Authority, Charter School Revenue Bonds, | 11/20 at 100.00 | AA– | 1,001,510 |
| | Pinnacle Charter School, Inc High School Project, Series 2010, 5.000%, 12/01/29 | | | |
| 9,335 | | Colorado Health Facilities Authority, Colorado, Revenue Bonds, Catholic Health | 1/23 at 100.00 | BBB+ (12) | 10,306,027 |
| | Initiatives, Series 2013A, 5.250%, 1/01/45 (Pre-refunded 1/01/23) | | | |
| 2,000 | | Colorado Health Facilities Authority, Colorado, Revenue Bonds, Children’s Hospital | 12/23 at 100.00 | A+ | 2,190,380 |
| | Colorado Project, Series 2013A, 5.000%, 12/01/36 | | | |
| | Colorado Health Facilities Authority, Colorado, Revenue Bonds, CommonSpirit Health, | | | |
| | Series 2019A-2: | | | |
| 4,000 | | 5.000%, 8/01/37 | 8/29 at 100.00 | BBB+ | 4,859,640 |
| 8,335 | | 5.000%, 8/01/38 | 8/29 at 100.00 | BBB+ | 10,094,685 |
| 6,500 | | 5.000%, 8/01/39 | 8/29 at 100.00 | BBB+ | 7,848,555 |
| 2,000 | | Colorado Health Facilities Authority, Colorado, Revenue Bonds, Craig Hospital Project, | 12/22 at 100.00 | A+ | 2,066,040 |
| | Series 2012, 4.000%, 12/01/42 | | | |
| 585 | | Colorado Health Facilities Authority, Colorado, Revenue Bonds, Evangelical Lutheran Good | 6/23 at 100.00 | N/R (12) | 664,765 |
| | Samaritan Society Project, Series 2013, 5.625%, 6/01/43 (Pre-refunded 6/01/23) | | | |
| 3,655 | | Colorado Health Facilities Authority, Colorado, Revenue Bonds, Evangelical Lutheran Good | 6/25 at 100.00 | N/R (12) | 4,424,304 |
| | Samaritan Society Project, Series 2013A, 5.000%, 6/01/45 (Pre-refunded 6/01/25) | | | |
| 2,105 | | Colorado International Center Metropolitan District 14, Denver, Colorado, Limited Tax | 12/23 at 103.00 | N/R | 2,222,291 |
| | General Obligation Bonds, Refunding & Improvement Series 2018, 5.875%, 12/01/46 | | | |
| 2,250 | | Colorado Springs, Colorado, Utilities System Revenue Bonds, Improvement Series 2013B-1, | 11/23 at 100.00 | Aa2 | 2,528,595 |
| | 5.000%, 11/15/38 | | | |
| 1,000 | | Concord Metropolitan District, Douglas County, Colorado, General Obligation Bonds, | 12/20 at 100.00 | BBB+ (12) | 1,003,820 |
| | Refunding Series 2010, 5.375%, 12/01/40 (Pre-refunded 12/01/20) | | | |
| 500 | | Copperleaf Metropolitan District 2, Arapahoe County, Colorado, Limited Tax General | 12/20 at 103.00 | N/R | 516,940 |
| | Obligation Bonds, Series 2006, 5.250%, 12/01/30 | | | |
| 2,200 | | Denver City and County, Colorado, Airport System Revenue Bonds, Series 2012B, 5.000%, | 11/22 at 100.00 | A+ (12) | 2,409,440 |
| | 11/15/32 (Pre-refunded 11/15/22) | | | |
| 3,870 | | Denver City and County, Colorado, Airport System Revenue Bonds, Subordinate Lien Series | 11/23 at 100.00 | A | 4,217,642 |
| | 2013B, 5.000%, 11/15/43 | | | |
| | Denver Urban Renewal Authority, Colorado, Tax Increment Revenue Bonds, 9th and Colorado | | | |
| | Urban Redevelopment Area, Series 2018A: | | | |
| 835 | | 5.250%, 12/01/39, 144A | 12/23 at 103.00 | N/R | 859,006 |
| 1,310 | | 5.250%, 12/01/39, 144A | 12/23 at 103.00 | N/R | 1,347,662 |
| 10,000 | | E-470 Public Highway Authority, Colorado, Senior Revenue Bonds, Capital Appreciation | No Opt. Call | A | 5,789,400 |
| | Series 2010A, 0.000%, 9/01/41 | | | |
| 8,845 | | E-470 Public Highway Authority, Colorado, Senior Revenue Bonds, Series 1997B, 0.000%, | No Opt. Call | A | 8,307,755 |
| | 9/01/26 – NPFG Insured | | | |
77
| | |
| NZF | Nuveen Municipal Credit Income Fund Portfolio of Investments (continued) October 31, 2020 |
| | | | | | |
| Principal | | | Optional Call | | |
| Amount (000) | | Description (1) | Provisions (2) | Ratings (3) | Value |
| | Colorado (continued) | | | |
| | E-470 Public Highway Authority, Colorado, Senior Revenue Bonds, Series 2000B: | | | |
| $ 7,550 | | 0.000%, 9/01/29 – NPFG Insured | No Opt. Call | A | $ 6,557,552 |
| 11,100 | | 0.000%, 9/01/31 – NPFG Insured | No Opt. Call | A | 9,103,665 |
| 10,000 | | 0.000%, 9/01/32 – NPFG Insured | No Opt. Call | A | 7,941,600 |
| | Eaton Area Park and Recreation District, Colorado, General Obligation Limited Tax Bonds, | | | |
| | Series 2015: | | | |
| 475 | | 5.500%, 12/01/30 | 12/22 at 100.00 | N/R | 491,739 |
| 180 | | 5.250%, 12/01/34 | 12/22 at 100.00 | N/R | 184,250 |
| 500 | | Erie Highlands Metropolitan District No 1 (In the Town of Erie), Weld County, Colorado, | 12/20 at 103.00 | N/R | 512,070 |
| | General Obligation Limited Tax Bonds, Series 2015A, 5.750%, 12/01/45 | | | |
| 922 | | Flatiron Meadows Metropolitan District, Boulder County, Colorado, General Obligation | 12/21 at 103.00 | N/R | 936,356 |
| | Limited Tax Bonds, Series 2016, 5.125%, 12/01/46 | | | |
| | Foothills Metropolitan District, Fort Collins, Colorado, Special Revenue Bonds, | | | |
| | Series 2014: | | | |
| 1,125 | | 5.750%, 12/01/30 | 12/24 at 100.00 | N/R | 1,171,834 |
| 1,000 | | 6.000%, 12/01/38 | 12/24 at 100.00 | N/R | 1,028,900 |
| 770 | | Great Western Park Metropolitan District 2, Broomfield City and County, Colorado, | 12/21 at 100.00 | N/R | 779,309 |
| | General Obligation Bonds, Series 2016A, 5.000%, 12/01/46 | | | |
| | Johnstown Plaza Metropolitan District, Colorado, Special Revenue Bonds, Series 2016A: | | | |
| 1,590 | | 5.250%, 12/01/36 | 12/21 at 103.00 | N/R | 1,622,643 |
| 6,130 | | 5.375%, 12/01/46 | 12/21 at 103.00 | N/R | 6,242,976 |
| 1,000 | | Meridian Metropolitan District, Douglas County, Colorado, General Obligation Refunding | 12/21 at 100.00 | A– (12) | 1,049,080 |
| | Bonds, Series 2011A, 5.000%, 12/01/41 (Pre-refunded 12/01/21) | | | |
| 825 | | North Range Metropolitan District No 2 , In the City of Commerce City, Adams County, | 12/22 at 103.00 | N/R | 858,924 |
| | Colorado , Limited Tax General Obligation and Special Revenue and Improvement Bonds, | | | |
| | Refunding Series 2017A, 5.750%, 12/01/47 | | | |
| 4,310 | | Painted Prairie Public Improvement Authority, Aurora, Colorado, Special Revenue Bonds, | 12/24 at 103.00 | N/R | 4,543,386 |
| | Series 2019, 5.000%, 12/01/39 | | | |
| 1,870 | | Park Creek Metropolitan District, Colorado, Senior Limited Property Tax Supported | 12/25 at 100.00 | A | 2,144,441 |
| | Revenue Bonds, Refunding Series 2015A, 5.000%, 12/01/45 | | | |
| 3,015 | | Park Creek Metropolitan District, Colorado, Senior Limited Property Tax Supported Revenue | 12/20 at 100.00 | A2 (12) | 3,028,839 |
| | Refunding Bonds, Series 2011, 6.125%, 12/01/41 (Pre-refunded 12/01/20) – AGM Insured | | | |
| 500 | | Parker Automotive Metropolitan District (In the Town of Parker, Colorado), General | 12/26 at 100.00 | N/R | 513,950 |
| | Obligation Bonds, Refunding Series 2016, 5.000%, 12/01/45 | | | |
| | Regional Transportation District, Colorado, Denver Transit Partners Eagle P3 Project | | | |
| | Private Activity Bonds, Series 2010: | | | |
| 4,355 | | 6.000%, 1/15/34 | 11/20 at 100.00 | Baa3 | 4,362,839 |
| 2,365 | | 6.000%, 1/15/41 | 11/20 at 100.00 | Baa3 | 2,369,257 |
| 1,006 | | Reserve Metropolitan District 2, Mount Crested Butte, Colorado, Limited Tax General | 12/26 at 100.00 | N/R | 1,030,838 |
| | Obligation Bonds, Refunding Series 2016A, 5.000%, 12/01/45 | | | |
| 525 | | Sierra Ridge Metropolitan District 2, Douglas County, Colorado, General Obligation | 12/21 at 103.00 | N/R | 541,475 |
| | Bonds, Limited Tax Series 2016A, 5.500%, 12/01/46 | | | |
| 640 | | Thompson Crossing Metropolitan District 6, Johnstown, Larimer County, Colorado, General | 12/20 at 103.00 | N/R | 658,387 |
| | Obligation Limited Tax Bonds Series 2015A, 6.000%, 12/01/44 | | | |
| 55 | | Water Valley Metropolitan District 1, Colorado, General Obligation Bonds, Refunding | 12/26 at 100.00 | N/R | 57,527 |
| | Series 2016, 5.250%, 12/01/40 | | | |
| 105 | | Water Valley Metropolitan District 2, Windsor, Colorado, General Obligation Bonds, | 12/26 at 100.00 | N/R | 110,110 |
| | Refunding Series 2016, 5.250%, 12/01/40 | | | |
| 145,088 | | Total Colorado | | | 144,023,909 |
| | Connecticut – 0.3% (0.2% of Total Investments) | | | |
| 1,500 | | Connecticut Health and Educational Facilities Authority, Revenue Bonds, Hartford | 7/21 at 100.00 | A (12) | 1,546,215 |
| | HealthCare, Series 2011A, 5.000%, 7/01/41 (Pre-refunded 7/01/21) | | | |
78
| | | | | | |
| Principal | | | Optional Call | | |
| Amount (000) | | Description (1) | Provisions (2) | Ratings (3) | Value |
| | Connecticut (continued) | | | |
| $ 5,000 | | Connecticut Health and Educational Facilities Authority, Revenue Bonds, Trinity Health | 6/26 at 100.00 | AA– | $ 5,779,400 |
| | Credit Group, Series 2016CT, 5.000%, 12/01/45 | | | |
| 6,500 | | Total Connecticut | | | 7,325,615 |
| | Florida – 7.4% (4.7% of Total Investments) | | | |
| | Bay County, Florida, Educational Facilities Revenue Refunding Bonds, Bay Haven Charter | | | |
| | Academy, Inc Project, Series 2013A: | | | |
| 1,005 | | 5.000%, 9/01/43 | 9/23 at 100.00 | BBB | 1,057,019 |
| 865 | | 5.000%, 9/01/45 | 9/23 at 100.00 | BBB | 908,086 |
| 625 | | Belmont Community Development District, Florida, Capital Improvement Revenue Bonds, | 11/27 at 100.00 | N/R | 683,081 |
| | Series 2016A, 5.375%, 11/01/36 | | | |
| 665 | | Bexley Community Development District, Pasco County, Florida, Special Assessment Revenue | 5/26 at 100.00 | N/R | 691,414 |
| | Bonds, Series 2016, 4.700%, 5/01/36 | | | |
| 3,430 | | Broward County, Florida, Airport Facility Revenue Bonds, Learjet Inc, Series 2000, | 10/20 at 100.00 | Caa3 | 3,430,000 |
| | 7.500%, 11/01/20 (AMT) | | | |
| 1,480 | | Broward County, Florida, Fuel System Revenue Bonds, Fort Lauderdale Fuel Facilities LLC | 4/23 at 100.00 | AA | 1,622,139 |
| | Project, Series 2013A, 5.000%, 4/01/33 – AGM Insured (AMT) | | | |
| 4,390 | | Capital Trust Agency, Florida, Multifamily Housing Revenue Bonds, The Gardens Apartments | 7/25 at 100.00 | CCC+ | 3,006,360 |
| | Project, Series 2015A, 5.000%, 7/01/50 | | | |
| | Creekside at Twin Creeks Community Development District, Florida, Special Assessment | | | |
| | Bonds, Area 1 Project, Series 2016A-1: | | | |
| 120 | | 5.250%, 11/01/37 | 11/28 at 100.00 | N/R | 131,312 |
| 155 | | 5.600%, 11/01/46 | 11/28 at 100.00 | N/R | 171,394 |
| | Downtown Doral Community Development District, Florida, Special Assessment Bonds, | | | |
| | Series 2015: | | | |
| 555 | | 5.250%, 5/01/35 | 5/26 at 100.00 | N/R | 584,443 |
| 615 | | 5.300%, 5/01/36 | 5/26 at 100.00 | N/R | 647,577 |
| 955 | | 5.500%, 5/01/45 | 5/26 at 100.00 | N/R | 1,012,290 |
| 1,305 | | 5.500%, 5/01/46 | 5/26 at 100.00 | N/R | 1,382,608 |
| | Florida Development Finance Corporation, Educational Facilities Revenue Bonds, Downtown | | | |
| | Doral Charter Upper School Project, Series 2017C: | | | |
| 1,115 | | 5.650%, 7/01/37, 144A | 7/27 at 101.00 | N/R | 1,203,241 |
| 3,385 | | 5.750%, 7/01/47, 144A | 7/27 at 101.00 | N/R | 3,608,986 |
| | Florida Development Finance Corporation, Educational Facilities Revenue Bonds, Florida | | | |
| | Charter Foundation Inc Projects, Series 2016A: | | | |
| 1,015 | | 6.250%, 6/15/36, 144A | 6/26 at 100.00 | N/R | 1,112,775 |
| 1,420 | | 4.750%, 7/15/36, 144A | 7/26 at 100.00 | N/R | 1,486,996 |
| 2,475 | | 6.375%, 6/15/46, 144A | 6/26 at 100.00 | N/R | 2,687,578 |
| 1,465 | | 5.000%, 7/15/46, 144A | 7/26 at 100.00 | N/R | 1,537,781 |
| | Florida Development Finance Corporation, Educational Facilities Revenue Bonds, Pepin | | | |
| | Academies Inc, Series 2016A: | | | |
| 1,000 | | 5.000%, 7/01/36 | 7/26 at 100.00 | N/R | 982,890 |
| 6,785 | | 5.125%, 7/01/46 | 7/26 at 100.00 | N/R | 6,526,967 |
| | Florida Development Finance Corporation, Educational Facilities Revenue Bonds, | | | |
| | Renaissance Charter School Income Projects, Series 2015A: | | | |
| 900 | | 6.000%, 6/15/35, 144A | 6/25 at 100.00 | N/R | 1,004,454 |
| 560 | | 6.125%, 6/15/46, 144A | 6/25 at 100.00 | N/R | 618,442 |
| 120 | | Florida Development Finance Corporation, Educational Facilities Revenue Bonds, | 9/27 at 100.00 | N/R | 127,879 |
| | Renaissance Charter School, Inc Projects, Series 2020C, 5.000%, 9/15/40, 144A | | | |
| | Florida Development Finance Corporation, Florida, Surface Transportation Facility | | | |
| | Revenue Bonds, Virgin Trains USA Passenger Rail Project , Series 2019A: | | | |
| 30,000 | | 6.250%, 1/01/49 (AMT) (Mandatory Put 1/01/24), 144A | 11/20 at 104.00 | N/R | 26,087,100 |
| 10,000 | | 6.375%, 1/01/49 (AMT) (Mandatory Put 1/01/26), 144A | 11/20 at 105.00 | N/R | 8,585,600 |
| 10,000 | | 6.500%, 1/01/49 (AMT) (Mandatory Put 1/01/29), 144A | 11/20 at 105.00 | N/R | 8,568,100 |
79
| | |
| NZF | Nuveen Municipal Credit Income Fund Portfolio of Investments (continued) October 31, 2020 |
| | | | | | |
| Principal | | | Optional Call | | |
| Amount (000) | | Description (1) | Provisions (2) | Ratings (3) | Value |
| | Florida (continued) | | | |
| $ 1,100 | | Florida Higher Educational Facilities Financing Authority, Revenue Bonds, Nova | 4/21 at 100.00 | Baa1 (12) | $ 1,127,291 |
| | Southeastern University, Refunding Series 2011, 6.375%, 4/01/31 (Pre-refunded 4/01/21) | | | |
| 320 | | Grand Bay at Doral Community Development District, Miami-Dade County, Florida, Special | 5/26 at 100.00 | N/R | 332,054 |
| | Assessment Bonds, South Parcel Assessment Area Project, Series 2016, 4.750%, 5/01/36 | | | |
| 14,505 | | Greater Orlando Aviation Authority, Florida, Airport Facilities Revenue Bonds, Series | 10/29 at 100.00 | AA– | 16,092,572 |
| | 2019A, 4.000%, 10/01/44 (AMT) | | | |
| 5,000 | | Greater Orlando Aviation Authority, Florida, Orlando Airport Facilities Revenue Bonds, | 10/27 at 100.00 | A+ | 5,719,400 |
| | Priority Subordinated Series 2017, 5.000%, 10/01/47 (AMT) | | | |
| 14,375 | | Halifax Hospital Medical Center, Daytona Beach, Florida, Hospital Revenue Bonds, | 6/26 at 100.00 | A– | 16,485,538 |
| | Refunding & Improvement Series 2016, 5.000%, 6/01/36 | | | |
| 1,750 | | Hillsborough County Aviation Authority, Florida, Revenue Bonds, Tampa International | 10/24 at 100.00 | A | 1,960,140 |
| | Airport, Subordinate Lien Series 2015B, 5.000%, 10/01/40 (AMT) | | | |
| 4,695 | | Hillsborough County Aviation Authority, Florida, Tampa International Airport Customer | 10/24 at 100.00 | BBB+ | 5,178,350 |
| | Facility Charge Revenue Bonds, Series 2015A, 5.000%, 10/01/44 | | | |
| 2,490 | | Miami-Dade County, Florida, Special Obligation Bonds, Refunding Subordinate Series | 10/22 at 100.00 | A2 | 2,679,389 |
| | 2012B, 5.000%, 10/01/37 | | | |
| 7,045 | | Miami-Dade County, Florida, Water and Sewer System Revenue Bonds, Series 2013A, 5.000%, | 10/22 at 100.00 | A+ (12) | 7,683,982 |
| | 10/01/42 (Pre-refunded 10/01/22) | | | |
| 2,140 | | Northern Palm Beach County Improvement District, Florida, Water Control and Improvement | 8/26 at 100.00 | N/R | 2,389,866 |
| | Bonds, Development Unit 53, Series 2015, 5.350%, 8/01/35 | | | |
| 2,185 | | Orange County Health Facilities Authority, Florida, Hospital Revenue Bonds, Orlando | 4/22 at 100.00 | A2 (12) | 2,328,533 |
| | Health, Inc, Series 2012A, 5.000%, 10/01/42 (Pre-refunded 4/01/22) | | | |
| 2,335 | | Orlando, Florida, Capital Improvement Special Revenue Bonds, Series 2014B, | 10/24 at 100.00 | Aa2 | 2,700,544 |
| | 5.000%, 10/01/46 | | | |
| 13,080 | | Palm Beach County Health Facilities Authority, Florida, Hospital Revenue Bonds, Baptist | 8/29 at 100.00 | A1 | 14,552,154 |
| | Health Systems of South Florida Obligated Group, Series 2019, 4.000%, 8/15/49 | | | |
| 85 | | Palm Beach County Health Facilities Authority, Florida, Revenue Bonds, Sinai Residences | 6/22 at 102.00 | N/R | 92,715 |
| | of Boca Raton Project, Series 2014A, 7.250%, 6/01/34 | | | |
| 1,745 | | Palm Beach County, Florida, Revenue Bonds, Provident Group – PBAU Properties LLC – Palm | 4/29 at 100.00 | Ba1 | 1,742,836 |
| | Beach Atlantic University Housing Project, Series 2019A, 5.000%, 4/01/39, 144A | | | |
| 545 | | Reunion West Community Development District, Florida, Special Assessment Bonds, Area 3 | 11/26 at 100.00 | N/R | 574,931 |
| | Project, Series 2016, 5.000%, 11/01/46 | | | |
| | Six Mile Creek Community Development District, Florida, Capital Improvement Revenue | | | |
| | Bonds, Assessment Area 2, Series 2016: | | | |
| 160 | | 4.750%, 11/01/28 | 11/27 at 100.00 | N/R | 168,219 |
| 265 | | 5.375%, 11/01/36 | 11/27 at 100.00 | N/R | 284,199 |
| 375 | | South Village Community Development District, Clay County, Florida, Capital Improvement | 5/26 at 100.00 | A | 392,040 |
| | Revenue Bonds, Refunding Series 2016A1, 3.625%, 5/01/35 | | | |
| | South Village Community Development District, Clay County, Florida, Capital Improvement | | | |
| | Revenue Bonds, Refunding Series 2016A2: | | | |
| 120 | | 4.350%, 5/01/26 | No Opt. Call | N/R | 125,359 |
| 100 | | 4.875%, 5/01/35 | 5/26 at 100.00 | N/R | 107,113 |
| 1,350 | | Sumter County Industrial Development Authority, Florida, Hospital Revenue Bonds, Central | 1/24 at 100.00 | A– | 1,482,935 |
| | Florida Health Alliance Projects, Series 2014A, 5.125%, 7/01/34 | | | |
| 3,300 | | Tampa, Florida, Health System Revenue Bonds, Baycare Health System, Series 2012A, | 5/22 at 100.00 | Aa2 | 3,481,665 |
| | 5.000%, 11/15/33 | | | |
| 85 | | Tolomato Community Development District, Florida, Special Assessment Bonds, Convertible, | 5/22 at 100.00 | N/R | 66,786 |
| | Capital Appreciation, Series 2012A-4, 0.000%, 5/01/40 (6) | | | |
| 110 | | Tolomato Community Development District, Florida, Special Assessment Bonds, Hope Note, | 11/20 at 100.00 | N/R | 1 |
| | Series 2007-3, 6.650%, 5/01/40 (4) | | | |
| 295 | | Tolomato Community Development District, Florida, Special Assessment Bonds, Refunding | 11/20 at 100.00 | N/R | 268,901 |
| | Series 2015-1, 0.000%, 5/01/40 (6) | | | |
80
| | | | | | |
| Principal | | | Optional Call | | |
| Amount (000) | | Description (1) | Provisions (2) | Ratings (3) | Value |
| | Florida (continued) | | | |
| $ 180 | | Tolomato Community Development District, Florida, Special Assessment Bonds, Refunding | 11/20 at 100.00 | N/R | $ 126,421 |
| | Series 2015-2, 0.000%, 5/01/40 (6) | | | |
| 195 | | Tolomato Community Development District, Florida, Special Assessment Bonds, Refunding | 11/20 at 100.00 | N/R | 2 |
| | Series 2015-3, 6.610%, 5/01/40 (4) | | | |
| 300 | | Union Park Community Development District, Florida, Capital Improvement Revenue Bonds, | 11/27 at 100.00 | N/R | 326,478 |
| | Series 2016A-1, 5.375%, 11/01/37 | | | |
| 166,635 | | Total Florida | | | 167,936,926 |
| | Georgia – 1.5% (0.9% of Total Investments) | | | |
| 2,725 | | Atlanta Development Authority, Georgia, Revenue Bonds, New Downtown Atlanta Stadium | 7/25 at 100.00 | A+ | 2,982,676 |
| | Project, Senior Lien Series 2015A-1, 5.250%, 7/01/40 | | | |
| 15,000 | | Atlanta, Georgia, Airport General Revenue Bonds, Refunding Series 2010C, 5.250%, 1/01/30 | 1/21 at 100.00 | Aa3 | 15,121,650 |
| 3,010 | | Atlanta, Georgia, Water and Wastewater Revenue Bonds, Series 1999A, 5.500%, 11/01/22 – | No Opt. Call | AA– | 3,172,871 |
| | FGIC Insured | | | |
| 840 | | Macon-Bibb County Urban Development Authority, Georgia, Revenue Bonds, Academy for | 6/27 at 100.00 | N/R | 870,391 |
| | Classical Education, Series 2017, 5.875%, 6/15/47, 144A | | | |
| 1,070 | | Main Street Natural Gas Inc, Georgia, Gas Supply Revenue Bonds, Series 2019A, | 5/29 at 100.00 | A3 | 1,250,680 |
| | 5.000%, 5/15/43 | | | |
| 3,000 | | Marietta Development Authority, Georgia, University Facilities Revenue Bonds, Life | 11/27 at 100.00 | Ba3 | 3,076,470 |
| | University, Inc Project, Refunding Series 2017A, 5.000%, 11/01/47, 144A | | | |
| 2,750 | | Monroe County Development Authority, Georgia, Pollution Control Revenue Bonds, Georgia | 6/24 at 100.00 | Baa1 | 2,827,495 |
| | Power Company – Scherer Plant, First Series 1995, 2.250%, 7/01/25 | | | |
| 4,010 | | Municipal Electric Authority of Georgia, Plant Vogtle Units 3 & 4 Project J Bonds, | 7/25 at 100.00 | Baa1 | 4,443,241 |
| | Series 2015A, 5.000%, 7/01/60 | | | |
| 32,405 | | Total Georgia | | | 33,745,474 |
| | Guam – 0.0% (0.0% of Total Investments) | | | |
| 810 | | Guam Government Waterworks Authority, Water and Wastewater System Revenue Bonds, Series | 7/23 at 100.00 | Baa2 (12) | 920,160 |
| | 2013, 5.500%, 7/01/43 (Pre-refunded 7/01/23) | | | |
| | Hawaii – 0.2% (0.1% of Total Investments) | | | |
| 3,000 | | Hawaii Department of Budget and Finance, Special Purpose Revenue Bonds, Hawaii Pacific | 7/23 at 100.00 | A1 | 3,276,540 |
| | Health Obligated Group, Series 2013A, 5.500%, 7/01/43 | | | |
| 1,175 | | Hawaii Department of Budget and Finance, Special Purpose Revenue Bonds, Hawaii Pacific | 7/23 at 100.00 | BB | 1,211,590 |
| | University, Series 2013A, 6.625%, 7/01/33 | | | |
| 4,175 | | Total Hawaii | | | 4,488,130 |
| | Idaho – 0.1% (0.1% of Total Investments) | | | |
| 1,175 | | Idaho Health Facilities Authority, Revenue Bonds, Madison Memorial Hospital Project, | 9/26 at 100.00 | BB+ | 1,305,777 |
| | Refunding Series 2016, 5.000%, 9/01/37 | | | |
| 595 | | Idaho Water Resource Board, Water Resource Loan Program Revenue, Ground Water Rights | 9/22 at 100.00 | A3 | 641,214 |
| | Mitigation Series 2012A, 5.000%, 9/01/32 | | | |
| 1,770 | | Total Idaho | | | 1,946,991 |
| | Illinois – 30.4% (19.1% of Total Investments) | | | |
| 50,000 | | Chicago Board of Education, Illinois, Dedicated Capital Improvement Tax Revenue Bonds, | 4/27 at 100.00 | A– | 57,448,000 |
| | Series 2016, 6.000%, 4/01/46 | | | |
| 1,000 | | Chicago Board of Education, Illinois, General Obligation Bonds, Dedicated Revenues | 12/21 at 100.00 | B1 | 1,013,420 |
| | Series 2011A, 5.500%, 12/01/39 | | | |
| 8,500 | | Chicago Board of Education, Illinois, General Obligation Bonds, Dedicated Revenues, | 12/22 at 100.00 | B1 | 8,714,965 |
| | Refunding Series 2012B, 5.000%, 12/01/33 | | | |
| 8,400 | | Chicago Board of Education, Illinois, General Obligation Bonds, Dedicated Revenues, | 12/27 at 100.00 | BB– | 10,443,468 |
| | Refunding Series 2017B, 7.000%, 12/01/42, 144A | | | |
81
| | |
| NZF | Nuveen Municipal Credit Income Fund Portfolio of Investments (continued) October 31, 2020 |
| | | | | | |
| Principal | | | Optional Call | | |
| Amount (000) | | Description (1) | Provisions (2) | Ratings (3) | Value |
| | Illinois (continued) | | | |
| | Chicago Board of Education, Illinois, General Obligation Bonds, Dedicated Revenues, | | | |
| | Series 2016A: | | | |
| $ 1,800 | | 7.000%, 12/01/26 | 12/25 at 100.00 | BB– | $ 2,184,516 |
| 51,780 | | 7.000%, 12/01/44 | 12/25 at 100.00 | BB– | 61,029,979 |
| 6,210 | | Chicago Board of Education, Illinois, General Obligation Bonds, Dedicated Revenues, | 12/27 at 100.00 | BB– | 7,676,057 |
| | Series 2017A, 7.000%, 12/01/46, 144A | | | |
| 450 | | Chicago Board of Education, Illinois, General Obligation Bonds, Series 1999A, 0.000%, | No Opt. Call | BB– | 379,670 |
| | 12/01/26 – NPFG Insured | | | |
| | Chicago Board of Education, Illinois, Unlimited Tax General Obligation Bonds, Dedicated | | | |
| | Tax Revenues, Series 1998B-1: | | | |
| 1,715 | | 0.000%, 12/01/26 – NPFG Insured | No Opt. Call | BB– | 1,446,963 |
| 1,765 | | 0.000%, 12/01/30 – NPFG Insured | No Opt. Call | BB– | 1,254,262 |
| | Chicago Board of Education, Illinois, Unlimited Tax General Obligation Bonds, Dedicated | | | |
| | Tax Revenues, Series 1999A: | | | |
| 2,585 | | 0.000%, 12/01/27 – NPFG Insured | No Opt. Call | BB– | 2,096,719 |
| 8,565 | | 0.000%, 12/01/31 – NPFG Insured | No Opt. Call | BB– | 5,824,971 |
| 2,430 | | Chicago Transit Authority, Illinois, Sales Tax Receipts Revenue Bonds, Second Lien | 12/29 at 100.00 | A+ | 2,868,736 |
| | Series 2020A, 5.000%, 12/01/45 | | | |
| 4,300 | | Chicago Transit Authority, Illinois, Sales Tax Receipts Revenue Bonds, Series 2011, | 12/21 at 100.00 | A3 (12) | 4,532,200 |
| | 5.250%, 12/01/40 (Pre-refunded 12/01/21) | | | |
| 15,000 | | Chicago Transit Authority, Illinois, Sales Tax Receipts Revenue Bonds, Series 2014, | 12/24 at 100.00 | AA | 16,973,400 |
| | 5.250%, 12/01/49 | | | |
| | Chicago, Illinois, General Obligation Bonds, City Colleges, Series 1999: | | | |
| 25,755 | | 0.000%, 1/01/29 – NPFG Insured | No Opt. Call | BBB– | 20,002,106 |
| 8,765 | | 0.000%, 1/01/34 – FGIC Insured | No Opt. Call | BBB– | 5,428,340 |
| 17,310 | | 0.000%, 1/01/37 – FGIC Insured | No Opt. Call | BBB– | 9,332,167 |
| 670 | | Chicago, Illinois, General Obligation Bonds, Neighborhoods Alive 21 Program, Series | 1/25 at 100.00 | Ba1 | 707,433 |
| | 2002B, 5.500%, 1/01/31 | | | |
| 2,695 | | Chicago, Illinois, General Obligation Bonds, Project & Refunding Series 2014A, | 1/24 at 100.00 | Ba1 | 2,742,324 |
| | 5.000%, 1/01/35 | | | |
| 27,095 | | Chicago, Illinois, General Obligation Bonds, Project & Refunding Series 2017A, | 1/27 at 100.00 | BBB– | 29,655,207 |
| | 6.000%, 1/01/38 | | | |
| 2,000 | | Chicago, Illinois, General Obligation Bonds, Project and Refunding Series 2005D, | 1/25 at 100.00 | Ba1 | 2,076,420 |
| | 5.500%, 1/01/40 | | | |
| 4,930 | | Chicago, Illinois, General Obligation Bonds, Project Series 2011A, 5.250%, 1/01/35 | 1/21 at 100.00 | Ba1 | 4,931,676 |
| 550 | | Chicago, Illinois, General Obligation Bonds, Project Series 2012A, 5.000%, 1/01/34 | 1/22 at 100.00 | Ba1 | 553,041 |
| | Chicago, Illinois, General Obligation Bonds, Refunding Series 2007E: | | | |
| 10,115 | | 5.500%, 1/01/35 | 1/25 at 100.00 | Ba1 | 10,571,996 |
| 5,890 | | 5.500%, 1/01/42 | 1/25 at 100.00 | Ba1 | 6,107,577 |
| 765 | | Chicago, Illinois, General Obligation Bonds, Refunding Series 2016C, 5.000%, 1/01/35 | 1/26 at 100.00 | BBB– | 785,877 |
| 1,610 | | Chicago, Illinois, General Obligation Bonds, Series 1999, 0.000%, 1/01/30 | No Opt. Call | A2 | 1,271,175 |
| | Chicago, Illinois, General Obligation Bonds, Series 2015A: | | | |
| 1,000 | | 5.500%, 1/01/35 | 1/25 at 100.00 | BBB– | 1,045,180 |
| 9,800 | | 5.500%, 1/01/39 | 1/25 at 100.00 | BBB– | 10,189,158 |
| 5,630 | | Chicago, Illinois, Sales Tax Revenue Bonds, Series 2011A, 5.250%, 1/01/38 | 1/22 at 100.00 | N/R (12) | 5,957,497 |
| | (Pre-refunded 1/01/22) | | | |
| 3,095 | | Cook County Forest Preserve District, Illinois, General Obligation Bonds, Personal | 6/22 at 100.00 | A2 | 3,291,409 |
| | Property Replacement Tax Alternate Source, Series 2012C, 5.000%, 12/15/37 – AGM Insured | | | |
| 25,375 | | Cook County, Illinois, General Obligation Bonds, Refunding Series 2010A, | 11/20 at 100.00 | A2 | 25,437,676 |
| | 5.250%, 11/15/33 | | | |
| 800 | | Illinois Finance Authority, Charter School Revenue Bonds, Intrinsic Charter Schools | 12/25 at 100.00 | N/R | 853,488 |
| | Belmont School Project, Series 2015A, 5.500%, 12/01/30, 144A | | | |
82
| | | | | | |
| Principal | | | Optional Call | | |
| Amount (000) | | Description (1) | Provisions (2) | Ratings (3) | Value |
| | Illinois (continued) | | | |
| | Illinois Finance Authority, Charter School Revenue Bonds, Uno Charter School Network, | | | |
| | Refunding and Improvement Series 2011A: | | | |
| $ 1,300 | | 6.875%, 10/01/31 | 10/21 at 100.00 | BB+ | $ 1,344,304 |
| 2,535 | | 7.125%, 10/01/41 | 10/21 at 100.00 | BB+ | 2,613,357 |
| 2,675 | | Illinois Finance Authority, Revenue Bonds, Columbia College Chicago, Series 2015A, | 12/25 at 100.00 | BBB+ | 2,875,571 |
| | 5.000%, 12/01/37 | | | |
| 5,220 | | Illinois Finance Authority, Revenue Bonds, DePaul University, Series 2011A, 5.750%, | 4/21 at 100.00 | A (12) | 5,339,851 |
| | 10/01/27 (Pre-refunded 4/01/21) | | | |
| 845 | | Illinois Finance Authority, Revenue Bonds, Illinois Wesleyan University, Refunding | 9/26 at 100.00 | Baa2 | 909,490 |
| | Series 2016, 5.000%, 9/01/46 | | | |
| 5,015 | | Illinois Finance Authority, Revenue Bonds, Ingalls Health System, Series 2013, 5.000%, | 5/22 at 100.00 | A1 (12) | 5,340,925 |
| | 5/15/43 (Pre-refunded 5/15/22) | | | |
| 20,000 | | Illinois Finance Authority, Revenue Bonds, Northwestern Memorial Healthcare, Series | 1/28 at 100.00 | Aa2 | 23,963,400 |
| | 2017A, 5.000%, 7/15/42 | | | |
| | Illinois Finance Authority, Revenue Bonds, Rehabilitation Institute of Chicago, | | | |
| | Series 2013A: | | | |
| 415 | | 5.500%, 7/01/28 | 7/23 at 100.00 | A– | 454,475 |
| 905 | | 6.000%, 7/01/43 | 7/23 at 100.00 | A– | 994,903 |
| 1,050 | | Illinois Finance Authority, Revenue Bonds, Silver Cross Hospital and Medical Centers, | 8/25 at 100.00 | BBB+ | 1,157,656 |
| | Refunding Series 2015C, 5.000%, 8/15/44 | | | |
| 2,500 | | Illinois Finance Authority, Revenue Bonds, The University of Chicago Medical Center, | 2/21 at 100.00 | AA– (12) | 2,536,700 |
| | Series 2011C, 5.500%, 8/15/41 (Pre-refunded 2/15/21) (UB) (7) | | | |
| 3,000 | | Illinois Finance Authority, Revenue Bonds, University of Chicago, Refunding Series | 10/25 at 100.00 | AA– | 3,434,160 |
| | 2015A, 5.000%, 10/01/46 (UB) (7) | | | |
| 4,125 | | Illinois Finance Authority, Revenue Bonds, University of Chicago, Series 2012A, | 10/21 at 100.00 | AA– | 4,267,354 |
| | 5.000%, 10/01/51 | | | |
| | Illinois State, General Obligation Bonds, April Series 2014: | | | |
| 6,165 | | 5.000%, 4/01/38 | 4/24 at 100.00 | BBB– | 6,296,438 |
| 5,000 | | 5.000%, 4/01/39 | 4/24 at 100.00 | BBB– | 5,100,200 |
| | Illinois State, General Obligation Bonds, February Series 2014: | | | |
| 4,100 | | 5.250%, 2/01/31 | 2/24 at 100.00 | BBB– | 4,296,226 |
| 2,200 | | 5.250%, 2/01/32 | 2/24 at 100.00 | BBB– | 2,295,018 |
| 2,435 | | 5.250%, 2/01/33 | 2/24 at 100.00 | BBB– | 2,534,494 |
| 6,000 | | 5.000%, 2/01/39 | 2/24 at 100.00 | BBB– | 6,116,400 |
| 1,785 | | Illinois State, General Obligation Bonds, May Series 2020, 5.500%, 5/01/39 | 5/30 at 100.00 | BBB– | 1,969,712 |
| | Illinois State, General Obligation Bonds, November Series 2016: | | | |
| 3,100 | | 5.000%, 11/01/35 | 11/26 at 100.00 | BBB– | 3,229,952 |
| 3,000 | | 5.000%, 11/01/37 | 11/26 at 100.00 | BBB– | 3,109,200 |
| 2,400 | | 5.000%, 11/01/40 | 11/26 at 100.00 | BBB– | 2,471,304 |
| 5,795 | | Illinois State, General Obligation Bonds, November Series 2017C, 5.000%, 11/01/29 | 11/27 at 100.00 | BBB– | 6,200,244 |
| 3,800 | | Illinois State, General Obligation Bonds, November Series 2017D, 5.000%, 11/01/27 | No Opt. Call | BBB– | 4,123,988 |
| 5,000 | | Illinois State, General Obligation Bonds, October Series 2016, 5.000%, 2/01/27 | No Opt. Call | BBB– | 5,470,100 |
| 5,350 | | Illinois State, General Obligation Bonds, Refunding April Series 2019B, 5.125%, 9/01/26 | No Opt. Call | BBB– | 5,881,415 |
| 27,215 | | Illinois State, General Obligation Bonds, Series 2013, 5.500%, 7/01/38 | 7/23 at 100.00 | BBB– | 28,046,963 |
| 7,250 | | Illinois Toll Highway Authority, Toll Highway Revenue Bonds, Senior Lien Series 2013A, | 1/23 at 100.00 | A1 | 7,845,805 |
| | 5.000%, 1/01/38 | | | |
| 2,755 | | Illinois Toll Highway Authority, Toll Highway Revenue Bonds, Senior Lien Series 2015A, | 7/25 at 100.00 | A1 | 3,187,976 |
| | 5.000%, 1/01/40 | | | |
| 560 | | Illinois Toll Highway Authority, Toll Highway Revenue Bonds, Tender Option Bond Trust | 1/23 at 100.00 | AA– | 744,268 |
| | 2015-XF0051, 17.207%, 1/01/38, 144A (IF) | | | |
| 2,500 | | Kane & DeKalb Counties Community Unit School District 301, Illinois, General Obligation | No Opt. Call | Aa2 | 2,436,550 |
| | Bonds, Series 2006, 0.000%, 12/01/23 – NPFG Insured | | | |
83
| | |
| NZF | Nuveen Municipal Credit Income Fund Portfolio of Investments (continued) October 31, 2020 |
| | | | | | |
| Principal | | | Optional Call | | |
| Amount (000) | | Description (1) | Provisions (2) | Ratings (3) | Value |
| | Illinois (continued) | | | |
| | McHenry and Kane Counties Community Consolidated School District 158, Huntley, Illinois, | | | |
| | General Obligation Bonds, Series 2003: | | | |
| $ 570 | | 0.000%, 1/01/21 – FGIC Insured | No Opt. Call | N/R | $ 569,230 |
| 745 | | 0.000%, 1/01/21 (ETM) | No Opt. Call | N/R (12) | 744,613 |
| 13,785 | | Metropolitan Pier and Exposition Authority, Illinois, McCormick Place Expansion Project | 6/22 at 100.00 | BB+ | 14,124,662 |
| | Bonds, Refunding Series 2012A, 5.000%, 6/15/42 – NPFG Insured | | | |
| 2,500 | | Metropolitan Pier and Exposition Authority, Illinois, McCormick Place Expansion Project | 6/22 at 100.00 | BB+ | 2,554,325 |
| | Bonds, Refunding Series 2012B, 5.000%, 6/15/52 | | | |
| 5,400 | | Metropolitan Pier and Exposition Authority, Illinois, McCormick Place Expansion Project | 12/25 at 100.00 | BB+ | 5,725,566 |
| | Bonds, Refunding Series 2015B, 5.000%, 6/15/52 | | | |
| | Metropolitan Pier and Exposition Authority, Illinois, McCormick Place Expansion Project | | | |
| | Bonds, Refunding Series 2020A: | | | |
| 15,000 | | 4.000%, 6/15/50 | 12/29 at 100.00 | BB+ | 15,084,000 |
| 7,945 | | 5.000%, 6/15/50 | 12/29 at 100.00 | BB+ | 8,733,382 |
| | Metropolitan Pier and Exposition Authority, Illinois, McCormick Place Expansion Project | | | |
| | Bonds, Series 2015A: | | | |
| 23,110 | | 0.000%, 12/15/52 | No Opt. Call | BB+ | 5,416,522 |
| 2,455 | | 5.000%, 6/15/53 | 12/25 at 100.00 | BB+ | 2,601,834 |
| 45,000 | | Metropolitan Pier and Exposition Authority, Illinois, Revenue Bonds, McCormick Place | No Opt. Call | BB+ | 19,913,850 |
| | Expansion Project, Capital Appreciation Refunding Series 2010B-1, 0.000%, 6/15/43 – AGM Insured | | | |
| | Metropolitan Pier and Exposition Authority, Illinois, Revenue Bonds, McCormick Place | | | |
| | Expansion Project, Refunding Series 1998A: | | | |
| 145 | | 5.500%, 6/15/29 – NPFG Insured (ETM) | No Opt. Call | Baa2 (12) | 171,734 |
| 2,680 | | 5.500%, 6/15/29 – NPFG Insured | No Opt. Call | BBB | 3,077,364 |
| 1,165 | | Metropolitan Pier and Exposition Authority, Illinois, Revenue Bonds, McCormick Place | No Opt. Call | Baa2 (12) | 1,161,633 |
| | Expansion Project, Series 1993A, 0.000%, 6/15/21 – FGIC Insured (ETM) | | | |
| | Metropolitan Pier and Exposition Authority, Illinois, Revenue Bonds, McCormick Place | | | |
| | Expansion Project, Series 2002A: | | | |
| 2,195 | | 5.700%, 6/15/24 (Pre-refunded 6/15/22) | 6/22 at 101.00 | N/R (12) | 2,402,581 |
| 7,305 | | 5.700%, 6/15/24 | 6/22 at 101.00 | BB+ | 7,803,493 |
| 8,400 | | 0.000%, 12/15/30 – NPFG Insured | No Opt. Call | BB+ | 6,127,884 |
| 7,940 | | 0.000%, 6/15/33 – NPFG Insured | No Opt. Call | BB+ | 5,160,841 |
| 450 | | 0.000%, 12/15/34 – NPFG Insured | No Opt. Call | BB+ | 275,441 |
| 12,500 | | 0.000%, 6/15/35 – NPFG Insured | No Opt. Call | BB+ | 7,489,000 |
| 10,620 | | 0.000%, 12/15/35 – NPFG Insured | No Opt. Call | BB+ | 6,226,400 |
| 11,505 | | 0.000%, 12/15/36 – NPFG Insured | No Opt. Call | BB+ | 6,455,571 |
| 65,000 | | 0.000%, 12/15/38 – NPFG Insured | No Opt. Call | BB+ | 33,489,950 |
| 38,040 | | 0.000%, 6/15/40 – NPFG Insured | No Opt. Call | BB+ | 18,335,280 |
| 3,720 | | 0.000%, 6/15/41 – NPFG Insured | No Opt. Call | BB+ | 1,708,112 |
| | Quad Cities Regional Economic Development Authority, Illinois, Revenue Bonds, Augustana | | | |
| | College, Series 2012: | | | |
| 480 | | 5.000%, 10/01/25 | 10/22 at 100.00 | Baa1 | 504,821 |
| 400 | | 5.000%, 10/01/26 | 10/22 at 100.00 | Baa1 | 418,828 |
| 780 | | Railsplitter Tobacco Settlement Authority, Illinois, Tobacco Settlement Revenue Bonds, | No Opt. Call | A | 801,575 |
| | Series 2010, 5.250%, 6/01/21 | | | |
| 965 | | Regional Transportation Authority, Cook, DuPage, Kane, Lake, McHenry and Will Counties, | No Opt. Call | A2 | 965,000 |
| | Illinois, General Obligation Bonds, Series 1990A, 7.200%, 11/01/20 – AMBAC Insured | | | |
| 11,690 | | Sales Tax Securitization Corporation, Illinois, Sales Tax Securitization Bonds, Series | 1/28 at 100.00 | AA– | 13,487,571 |
| | 2018A, 5.000%, 1/01/37 | | | |
| 3,815 | | Southwestern Illinois Development Authority, Environmental Improvement Revenue Bonds, US | 8/22 at 100.00 | Caa2 | 3,438,841 |
| | Steel Corporation Project, Series 2012, 5.750%, 8/01/42 (AMT) | | | |
| 1,580 | | University of Illinois, Health Services Facilities System Revenue Bonds, Series 2013, | 10/23 at 100.00 | Baa1 | 1,753,768 |
| | 6.000%, 10/01/32 | | | |
| 11,350 | | Will County Community High School District 210 Lincoln-Way, Illinois, General Obligation | No Opt. Call | A2 | 10,908,598 |
| | Bonds, Series 2006, 0.000%, 1/01/24 – AGM Insured | | | |
| 783,580 | | Total Illinois | | | 689,047,742 |
84
| | | | | | |
| Principal | | | Optional Call | | |
| Amount (000) | | Description (1) | Provisions (2) | Ratings (3) | Value |
| | Indiana – 3.6% (2.2% of Total Investments) | | | |
| | Carmel Redevelopment Authority, Indiana, Lease Rent Revenue Bonds, Series 2005: | | | |
| $ 1,950 | | 0.000%, 2/01/24 | No Opt. Call | Aa3 | $ 1,886,644 |
| 2,705 | | 0.000%, 2/01/25 | No Opt. Call | Aa3 | 2,576,269 |
| 4,400 | | Crown Point Multi-School Building Corporation, Indiana, First Mortgage Bonds, Crown | No Opt. Call | Baa2 | 4,306,852 |
| | Point Community School Corporation, Series 2000, 0.000%, 1/15/24 – NPFG Insured | | | |
| 680 | | Indiana Finance Authority, Educational Facilities Revenue Bonds, Butler University | 2/22 at 100.00 | A– | 706,194 |
| | Project, Refunding Series 2012B, 5.000%, 2/01/29 | | | |
| 1,050 | | Indiana Finance Authority, Educational Facilities Revenue Bonds, Drexel Foundation For | 11/20 at 100.00 | B | 1,051,585 |
| | Educational Excellence, Inc, Series 2009A, 7.000%, 10/01/39 | | | |
| 1,230 | | Indiana Finance Authority, Environmental Improvement Revenue Bonds, United States Steel | 8/22 at 100.00 | Caa2 | 1,108,722 |
| | Corporation Project, Series 2012, 5.750%, 8/01/42 (AMT) | | | |
| 1,815 | | Indiana Finance Authority, Hospital Revenue Bonds, Community Health Network Project, | 5/23 at 100.00 | A (12) | 2,023,943 |
| | Series 2012A, 5.000%, 5/01/42 (Pre-refunded 5/01/23) | | | |
| 9,300 | | Indiana Finance Authority, Hospital Revenue Bonds, Major Hospital Project, Series 2014A, | 10/23 at 100.00 | Baa3 | 9,781,368 |
| | 5.000%, 10/01/44 | | | |
| | Indiana Finance Authority, Private Activity Bonds, Ohio River Bridges East End Crossing | | | |
| | Project, Series 2013A: | | | |
| 5,380 | | 5.000%, 7/01/44 (AMT) | 7/23 at 100.00 | BBB+ | 5,707,588 |
| 5,100 | | 5.000%, 7/01/48 (AMT) | 7/23 at 100.00 | BBB+ | 5,399,829 |
| 5,370 | | 5.250%, 1/01/51 (AMT) | 7/23 at 100.00 | BBB+ | 5,713,573 |
| 6,700 | | Indiana Finance Authority, Wastewater Utility Revenue Bonds, CWA Authority Project, | 10/21 at 100.00 | A1 | 6,929,006 |
| | Series 2011B, 5.000%, 10/01/41 | | | |
| 13,000 | | Indiana Finance Authority, Water Utility Revenue Bonds, Citizens Energy Group Project, | 10/24 at 100.00 | A+ | 14,814,930 |
| | First Lien Series 2014A, 5.000%, 10/01/44 | | | |
| 5,100 | | Indianapolis Local Public Improvement Bond Bank, Indiana, Airport Authority Project | 1/30 at 100.00 | A | 6,172,836 |
| | Revenue Bonds, Series 2019I-1, 5.000%, 1/01/44 | | | |
| 10,000 | | Indianapolis Local Public Improvement Bond Bank, Indiana, Series 1999E, 0.000%, 2/01/26 – | No Opt. Call | AA– | 9,545,800 |
| | AMBAC Insured | | | |
| 1,000 | | Merrillville, Indiana, Economic Development Revenue Bonds, Belvedere Housing Project, | 4/24 at 102.00 | N/R | 1,021,350 |
| | Series 2016, 5.750%, 4/01/36 | | | |
| 1,250 | | Shoals, Indiana, Exempt Facilities Revenue Bonds, National Gypsum Company Project, | 11/23 at 100.00 | N/R | 1,316,675 |
| | Series 2013, 7.250%, 11/01/43 (AMT) | | | |
| 830 | | Valparaiso, Indiana, Exempt Facilities Revenue Bonds, Pratt Paper LLC Project, Series | 1/24 at 100.00 | N/R | 930,704 |
| | 2013, 7.000%, 1/01/44 (AMT) | | | |
| 76,860 | | Total Indiana | | | 80,993,868 |
| | Iowa – 1.2% (0.8% of Total Investments) | | | |
| 1,255 | | Iowa Finance Authority, Iowa, Midwestern Disaster Area Revenue Bonds, Iowa Fertilizer | 12/23 at 100.00 | B | 1,336,249 |
| | Company Project, Series 2013, 5.250%, 12/01/25 | | | |
| 1,470 | | Iowa Finance Authority, Iowa, Midwestern Disaster Area Revenue Bonds, Iowa Fertilizer | 11/20 at 104.00 | B | 1,530,373 |
| | Company Project, Series 2016, 5.875%, 12/01/27, 144A | | | |
| 1,710 | | Iowa Finance Authority, Iowa, Midwestern Disaster Area Revenue Bonds, Iowa Fertilizer | 12/22 at 103.00 | BB– | 1,779,375 |
| | Company Project, Series 2018A, 5.250%, 12/01/50 (Mandatory Put 12/01/33) | | | |
| 1,630 | | Iowa Higher Education Loan Authority, Private College Facility Revenue Bonds, University | 10/21 at 100.00 | BBB | 1,668,582 |
| | of Dubuque Project, Refunding Series 2011, 6.000%, 10/01/31 | | | |
| 1,900 | | Iowa Higher Education Loan Authority, Private College Facility Revenue Bonds, Upper Iowa | 9/23 at 100.00 | N/R (12) | 2,152,985 |
| | University Project, Series 2012, 5.000%, 9/01/43 (Pre-refunded 9/01/23) | | | |
| | Iowa Tobacco Settlement Authority, Asset Backed Settlement Revenue Bonds, Series 2005C: | | | |
| 6,425 | | 5.375%, 6/01/38 | 11/20 at 100.00 | B– | 6,512,958 |
| 525 | | 5.500%, 6/01/42 | 11/20 at 100.00 | B– | 532,187 |
| 5,045 | | 5.625%, 6/01/46 | 11/20 at 100.00 | B– | 5,114,066 |
| 6,590 | | Iowa Tobacco Settlement Authority, Tobacco Asset-Backed Revenue Bonds, Series 2005B, | 11/20 at 100.00 | B– | 6,680,217 |
| | 5.600%, 6/01/34 | | | |
| 26,550 | | Total Iowa | | | 27,306,992 |
85
| | |
| NZF | Nuveen Municipal Credit Income Fund Portfolio of Investments (continued) October 31, 2020 |
| | | | | | |
| Principal | | | Optional Call | | |
| Amount (000) | | Description (1) | Provisions (2) | Ratings (3) | Value |
| | Kansas – 0.3% (0.2% of Total Investments) | | | |
| | Johnson/Miami County Unified School District 230 Spring Hill, Kansas, General Obligation | | | |
| | Bonds, Series 2011A: | | | |
| $ 2,000 | | 5.000%, 9/01/26 | 9/21 at 100.00 | Aa3 | $ 2,076,800 |
| 1,000 | | 5.000%, 9/01/27 | 9/21 at 100.00 | Aa3 | 1,038,400 |
| 2,000 | | Kansas Development Finance Authority, Hospital Revenue Bonds, Adventist Health | 5/22 at 100.00 | AA | 2,125,640 |
| | System/Sunbelt Obligated Group, Series 2012A, 5.000%, 11/15/28 | | | |
| 1,485 | | Kansas State Power Pool, Electric Utility Revenue Bonds, Dogwood Energy Facility, Series | 12/20 at 100.00 | A3 (12) | 1,490,480 |
| | 2012A, 5.000%, 12/01/31 (Pre-refunded 12/01/20) | | | |
| 370 | | Overland Park Transportation Development District, Kansas, Sales Tax Revenue Bonds, Oak | 11/20 at 100.00 | BBB | 369,985 |
| | Park Mall Project, Series 2010, 5.900%, 4/01/32 | | | |
| 6,855 | | Total Kansas | | | 7,101,305 |
| | Kentucky – 2.5% (1.5% of Total Investments) | | | |
| | Christian County, Kentucky, Hospital Revenue Bonds, Jennie Stuart Medical Center, | | | |
| | Series 2016: | | | |
| 5,000 | | 5.375%, 2/01/36 | 2/26 at 100.00 | BB+ | 5,566,800 |
| 435 | | 5.500%, 2/01/44 | 2/26 at 100.00 | BB+ | 479,653 |
| | Kentucky Economic Development Finance Authority, Kentucky, Healthcare Facilities Revenue | | | |
| | Bonds, Rosedale Green Project, Refunding Series 2015: | | | |
| 500 | | 5.750%, 11/15/45 | 11/25 at 100.00 | N/R | 463,210 |
| 2,250 | | 5.750%, 11/15/50 | 11/25 at 100.00 | N/R | 2,055,870 |
| 19,575 | | Kentucky Economic Development Finance Authority, Revenue Bonds, CommonSpirit Health, | 8/29 at 100.00 | BBB+ | 23,010,217 |
| | Series 2019A-2, 5.000%, 8/01/49 | | | |
| 5,070 | | Kentucky Economic Development Finance Authority, Revenue Bonds, Next Generation Kentucky | 7/25 at 100.00 | Baa2 | 5,363,553 |
| | Information Highway Project, Senior Series 2015A, 5.000%, 1/01/45 | | | |
| | Kentucky Public Transportation Infrastructure Authority, First Tier Toll Revenue Bonds, | | | |
| | Downtown Crossing Project, Convertible Capital Appreciation Series 2013C: | | | |
| 1,335 | | 0.000%, 7/01/43 (6) | 7/31 at 100.00 | Baa3 | 1,455,203 |
| 2,295 | | 0.000%, 7/01/46 (6) | 7/31 at 100.00 | Baa3 | 2,505,933 |
| | Kentucky Public Transportation Infrastructure Authority, First Tier Toll Revenue Bonds, | | | |
| | Downtown Crossing Project, Series 2013A: | | | |
| 3,080 | | 5.750%, 7/01/49 | 7/23 at 100.00 | Baa3 | 3,338,535 |
| 615 | | 6.000%, 7/01/53 | 7/23 at 100.00 | Baa3 | 669,729 |
| 5,400 | | Lexington-Fayette Urban County Government Public Facilities Corporation, Kentucky State | 6/21 at 100.00 | A– | 5,518,746 |
| | Lease Revenue Bonds, Eastern State Hospital Project, Series 2011A, 5.250%, 6/01/29 | | | |
| | Pikeville, Kentucky, Hospital Revenue Bonds, Pikeville Medical Center, Inc Project, | | | |
| | Improvement and Refunding Series 2011: | | | |
| 500 | | 6.250%, 3/01/31 (Pre-refunded 3/01/21) | 3/21 at 100.00 | Baa2 (12) | 509,770 |
| 4,500 | | 6.250%, 3/01/31 (Pre-refunded 3/01/21) | 3/21 at 100.00 | Baa2 (12) | 4,587,930 |
| 215 | | Warren County, Kentucky, Hospital Revenue Bonds, Bowling Green-Warren County Community | 10/22 at 100.00 | A+ | 225,159 |
| | Hospital Corporation, Series 2012A, 4.000%, 10/01/29 | | | |
| 50,770 | | Total Kentucky | | | 55,750,308 |
| | Louisiana – 1.5% (0.9% of Total Investments) | | | |
| 2,000 | | Jefferson Parish Hospital Service District 2, Louisiana, Hospital Revenue Bonds, East | 7/21 at 100.00 | N/R (12) | 2,079,500 |
| | Jefferson General Hospital, Refunding Series 2011, 6.375%, 7/01/41 (Pre-refunded 7/01/21) | | | |
| 5,000 | | Louisiana Public Facilities Authority, Louisiana, Revenue Bonds, Ochsner Clinic | 5/27 at 100.00 | A3 | 5,803,050 |
| | Foundation Project, Refunding Series 2017, 5.000%, 5/15/46 | | | |
| 6,625 | | Louisiana Public Facilities Authority, Dock and Wharf Revenue Bonds, Impala Warehousing | 7/23 at 100.00 | N/R | 6,916,169 |
| | (US) LLC Project, Series 2013, 6.500%, 7/01/36 (AMT), 144A | | | |
| | Louisiana Public Facilities Authority, Hospital Revenue Bonds, Franciscan Missionaries | | | |
| | of Our Lady Health System, Refunding Series 2015A: | | | |
| 10 | | 5.000%, 7/01/39 (Pre-refunded 7/01/25) | 7/25 at 100.00 | N/R (12) | 12,112 |
| 1,450 | | 5.000%, 7/01/39 | 7/25 at 100.00 | A | 1,627,770 |
86
| | | | | | |
| Principal | | | Optional Call | | |
| Amount (000) | | Description (1) | Provisions (2) | Ratings (3) | Value |
| | Louisiana (continued) | | | |
| $ 4,425 | | Louisiana Public Facilities Authority, Revenue Bonds, Ochsner Clinic Foundation Project, | 5/21 at 100.00 | A3 (12) | $ 4,577,972 |
| | Series 2011, 6.750%, 5/15/41 (Pre-refunded 5/15/21) | | | |
| 1,060 | | Louisiana Public Facilities Authority, Revenue Bonds, Southwest Louisiana Charter | 12/23 at 100.00 | N/R | 1,113,011 |
| | Academy Foundation Project, Series 2013A, 8.375%, 12/15/43 | | | |
| 2,235 | | Louisiana Stadium and Exposition District, Revenue Refunding Bonds, Senior Lien Series | 7/23 at 100.00 | A2 | 2,398,602 |
| | 2013A, 5.000%, 7/01/36 | | | |
| 5,100 | | New Orleans Aviation Board, Louisiana, General Airport Revenue Bonds, North Terminal | 1/25 at 100.00 | A– | 5,654,523 |
| | Project, Series 2015B, 5.000%, 1/01/45 (AMT) | | | |
| 2,560 | | New Orleans, Louisiana, Sewerage Service Revenue Bonds, Refunding Series 2014, | 6/24 at 100.00 | BBB+ | 2,862,259 |
| | 5.000%, 6/01/44 | | | |
| 30,465 | | Total Louisiana | | | 33,044,968 |
| | Maine – 0.5% (0.3% of Total Investments) | | | |
| 4,965 | | Maine Health and Higher Educational Facilities Authority Revenue Bonds, Eastern Maine | 7/26 at 100.00 | Ba1 | 5,300,485 |
| | Medical Center Obligated Group Issue, Series 2016A, 5.000%, 7/01/46 | | | |
| 2,750 | | Maine Health and Higher Educational Facilities Authority Revenue Bonds, MaineHealth | 7/28 at 100.00 | A+ | 3,273,297 |
| | Issue, Series 2018A, 5.000%, 7/01/43 | | | |
| | Maine Health and Higher Educational Facilities Authority, Revenue Bonds, Maine General | | | |
| | Medical Center, Series 2011: | | | |
| 2,000 | | 6.750%, 7/01/36 | 7/21 at 100.00 | Ba3 | 2,044,860 |
| 1,050 | | 6.750%, 7/01/41 | 7/21 at 100.00 | Ba3 | 1,071,746 |
| 10,765 | | Total Maine | | | 11,690,388 |
| | Maryland – 0.5% (0.3% of Total Investments) | | | |
| 2,000 | | Maryland Economic Development Corporation, Revenue Bonds, Chesapeake Bay Hyatt | 11/20 at 100.00 | N/R | 1,200,000 |
| | Conference Center, Series 2006A, 0.000%, 12/01/31 (4) | | | |
| 7,145 | | Maryland Health and Higher Educational Facilities Authority, Revenue Bonds, Adventist | 1/27 at 100.00 | Baa3 | 8,022,763 |
| | Healthcare, Series 2016A, 5.500%, 1/01/46 | | | |
| 555 | | Maryland Health and Higher Educational Facilities Authority, Revenue Bonds, Mercy Ridge | 11/20 at 100.00 | A | 555,272 |
| | Retirement Community, Series 2007, 4.750%, 7/01/34 | | | |
| 2,000 | | Maryland Health and Higher Educational Facilities Authority, Revenue Bonds, Peninsula | 7/24 at 100.00 | A3 | 2,181,260 |
| | Regional Medical Center Issue, Refunding Series 2015, 5.000%, 7/01/45 | | | |
| 355 | | Prince George’s County Revenue Authority, Maryland, Special Obligation Bonds, | 1/26 at 100.00 | N/R | 372,079 |
| | Suitland-Naylor Road Project, Series 2016, 5.000%, 7/01/46, 144A | | | |
| 12,055 | | Total Maryland | | | 12,331,374 |
| | Massachusetts – 1.6% (1.0% of Total Investments) | | | |
| 475 | | Massachusetts Development Finance Agency, Revenue Bonds, Boston Medical Center Issue, | 7/25 at 100.00 | BBB | 523,953 |
| | Green Bonds, Series 2015D, 5.000%, 7/01/44 | | | |
| 1,525 | | Massachusetts Development Finance Agency, Revenue Bonds, Emerson College, Series 2015, | 1/25 at 100.00 | Baa2 | 1,601,402 |
| | 4.500%, 1/01/45 | | | |
| 20,450 | | Massachusetts Educational Financing Authority, Education Loan Revenue Bonds, Series | 7/24 at 100.00 | A | 20,669,224 |
| | 2016J, 3.500%, 7/01/33 (AMT) | | | |
| 400 | | Massachusetts Port Authority, Special Facilities Revenue Bonds, ConRac Project, Series | 7/21 at 100.00 | BBB+ (12) | 412,928 |
| | 2011A, 5.125%, 7/01/41 (Pre-refunded 7/01/21) | | | |
| 4,560 | | Massachusetts School Building Authority, Dedicated Sales Tax Revenue Bonds, Senior | 5/23 at 100.00 | Aa2 (12) | 5,099,266 |
| | Series 2013A, 5.000%, 5/15/43 (Pre-refunded 5/15/23) | | | |
| 7,175 | | Metropolitan Boston Transit Parking Corporation, Massachusetts, Systemwide Parking | 7/21 at 100.00 | A– | 7,344,115 |
| | Revenue Bonds, Senior Lien Series 2011, 5.000%, 7/01/41 | | | |
| 34,585 | | Total Massachusetts | | | 35,650,888 |
87
| | |
| NZF | Nuveen Municipal Credit Income Fund Portfolio of Investments (continued) October 31, 2020 |
| | | | | | |
| Principal | | | Optional Call | | |
| Amount (000) | | Description (1) | Provisions (2) | Ratings (3) | Value |
| | Michigan – 2.1% (1.3% of Total Investments) | | | |
| | Detroit Academy of Arts and Sciences, Michigan, Public School Academy Revenue Bonds, | | | |
| | Refunding Series 2013: | | | |
| $ 840 | | 6.000%, 10/01/33 | 10/23 at 100.00 | N/R | $ 850,433 |
| 1,250 | | 6.000%, 10/01/43 | 10/23 at 100.00 | N/R | 1,252,225 |
| 15,000 | | Detroit City School District, Wayne County, Michigan, Unlimited Tax School Building and | No Opt. Call | AA | 18,942,600 |
| | Site Improvement Bonds, Series 2001A, 6.000%, 5/01/29 – AGM Insured (UB) | | | |
| 1,930 | | Detroit Water and Sewerage Department, Michigan, Sewage Disposal System Revenue Bonds, | 7/22 at 100.00 | A1 (12) | 2,090,190 |
| | Refunding Senior Lien Series 2012A, 5.250%, 7/01/39 (Pre-refunded 7/01/22) | | | |
| 5 | | Detroit, Michigan, Second Lien Sewerage Disposal System Revenue Bonds, Series 2005A, | 11/20 at 100.00 | A2 | 5,015 |
| | 4.500%, 7/01/35 – NPFG Insured | | | |
| 3,000 | | Detroit, Michigan, Senior Lien Sewerage Disposal System Revenue Bonds, Series 2001B, | No Opt. Call | A2 | 3,769,320 |
| | 5.500%, 7/01/29 – NPFG Insured | | | |
| 5 | | Detroit, Michigan, Sewer Disposal System Revenue Bonds, Second Lien, Series 2006B, | 11/20 at 100.00 | A2 | 5,016 |
| | 5.000%, 7/01/36 – FGIC Insured | | | |
| 2,000 | | Detroit, Michigan, Water Supply System Revenue Bonds, Senior Lien Series 2011A, 5.250%, | 7/21 at 100.00 | A1 (12) | 2,066,960 |
| | 7/01/41 (Pre-refunded 7/01/21) | | | |
| 2,000 | | Grand Traverse County Hospital Finance Authority, Michigan, Revenue Bonds, Munson | 7/24 at 100.00 | A1 | 2,188,520 |
| | Healthcare, Series 2014A, 5.000%, 7/01/47 | | | |
| 3,580 | | Lansing Board of Water and Light, Michigan, Utility System Revenue Bonds, Series 2011A, | 7/21 at 100.00 | AA– (12) | 3,705,765 |
| | 5.500%, 7/01/41 (Pre-refunded 7/01/21) | | | |
| 1,000 | | Michigan Finance Authority, Local Government Loan Program Revenue Bonds, Detroit Water & | 7/24 at 100.00 | A2 | 1,135,690 |
| | Sewerage Department Water Supply System Local Project, Series 2014D-6, 5.000%, 7/01/36 – | | | |
| | NPFG Insured | | | |
| | Michigan Finance Authority, Revenue Bonds, Trinity Health Credit Group, Refunding | | | |
| | Series 2011MI: | | | |
| 20 | | 5.000%, 12/01/39 (Pre-refunded 12/01/21) | 12/21 at 100.00 | N/R (12) | 21,004 |
| 4,980 | | 5.000%, 12/01/39 (Pre-refunded 12/01/21) | 12/21 at 100.00 | AA– (12) | 5,235,574 |
| 1,350 | | Michigan Finance Authority, Tobacco Settlement Asset- Backed Bonds, 2006 Sold Tobacco | 12/30 at 100.00 | BBB | 1,534,208 |
| | Receipts Senior Current Interest Series 2020A-2, 5.000%, 6/01/40 | | | |
| 2,250 | | Michigan State Building Authority, Revenue Bonds, Facilities Program, Refunding Series | 10/21 at 100.00 | AA– (12) | 2,360,227 |
| | 2011-I-A, 5.375%, 10/15/41 (Pre-refunded 10/15/21) | | | |
| 2,000 | | Wayne County Airport Authority, Michigan, Revenue Bonds, Detroit Metropolitan Wayne | 12/22 at 100.00 | A– | 2,144,000 |
| | County Airport, Series 2012A, 5.000%, 12/01/37 | | | |
| 41,210 | | Total Michigan | | | 47,306,747 |
| | Minnesota – 0.8% (0.5% of Total Investments) | | | |
| 700 | | City of Ham Lake, Minnesota, Charter School Lease Revenue Bonds, DaVinci Academy | 7/24 at 102.00 | N/R | 735,112 |
| | Project, Series 2016A, 5.000%, 7/01/47 | | | |
| 1,500 | | Forest Lake, Minnesota, Charter School Lease Revenue Bonds, Lakes International Language | 8/22 at 102.00 | BB+ | 1,589,265 |
| | Academy, Series 2014A, 5.750%, 8/01/44 | | | |
| 795 | | Minneapolis, Minnesota, Charter School Lease Revenue Bonds, Hiawatha Academies Project, | 7/24 at 102.00 | N/R | 832,826 |
| | Series 2016A, 5.000%, 7/01/36 | | | |
| | Saint Paul Housing & Redevelopment Authority, Minnesota, Charter School Lease Revenue | | | |
| | Bonds, Hmong College Prep Academy Project, Series 2016A: | | | |
| 750 | | 5.750%, 9/01/46 | 9/26 at 100.00 | BB+ | 853,042 |
| 4,000 | | 6.000%, 9/01/51 | 9/26 at 100.00 | BB+ | 4,590,960 |
| 5,265 | | Saint Paul Housing and Redevelopment Authority, Minnesota, Health Care Facility Revenue | 7/25 at 100.00 | A | 6,005,628 |
| | Bonds, HealthPartners Obligated Group, Refunding Series 2015A, 5.000%, 7/01/33 | | | |
| 4,250 | | Saint Paul Port Authority, Minnesota, Lease Revenue Bonds, Regions Hospital Parking Ramp | 11/20 at 100.00 | N/R | 4,252,890 |
| | Project, Series 2007-1, 5.000%, 8/01/36 | | | |
| 17,260 | | Total Minnesota | | | 18,859,723 |
88
| | | | | | |
| Principal | | | Optional Call | | |
| Amount (000) | | Description (1) | Provisions (2) | Ratings (3) | Value |
| | Missouri – 3.8% (2.4% of Total Investments) | | | |
| $ 1,400 | | Bi-State Development Agency of the Missouri-Illinois Metropolitan District, Mass Transit | 10/22 at 100.00 | AA– (12) | $ 1,526,980 |
| | Sales Tax Appropriation Bonds, Refunding Combined Lien Series 2013A, 5.000%, 10/01/44 | | | |
| | (Pre-refunded 10/01/22) | | | |
| 1,085 | | Cape Girardeau County Industrial Development Authority, Missouri, Health Facilities | 3/23 at 103.00 | Ba1 | 1,205,652 |
| | Revenue Bonds, Southeasthealth, Series 2016A, 6.000%, 3/01/33 | | | |
| 655 | | Hanley Road Corridor Transportation Development District, Brentwood and Maplewood, | 11/20 at 100.00 | A– | 656,375 |
| | Missouri, Transportation Sales Revenue Bonds, Refunding Series 2009A, 5.875%, 10/01/36 | | | |
| | Kansas City Industrial Development Authority, Missouri, Airport Special Obligation | | | |
| | Bonds, Kansas City International Airport Terminal Modernization Project, Series 2019B: | | | |
| 19,950 | | 5.000%, 3/01/46 (AMT) | 3/29 at 100.00 | A– | 22,961,253 |
| 13,000 | | 5.000%, 3/01/54 (AMT) | 3/29 at 100.00 | A– | 14,860,820 |
| 135 | | Kansas City Industrial Development Authority, Missouri, Sales Tax Revenue Bonds, Ward | 4/26 at 100.00 | N/R | 129,375 |
| | Parkway Center Community Improvement District, Senior Refunding & Improvement Series 2016, | | | |
| | 5.000%, 4/01/46, 144A | | | |
| 12,005 | | Kansas City Municipal Assistance Corporation, Missouri, Leasehold Revenue Bonds, Series | No Opt. Call | A1 | 10,416,138 |
| | 2004B-1, 0.000%, 4/15/29 – AMBAC Insured | | | |
| 650 | | Land Clearance for Redevelopment Authority of Kansas City, Missouri, Project Revenue | 2/28 at 100.00 | N/R | 670,657 |
| | Bonds, Convention Center Hotel Project – TIF Financing, Series 2018B, 5.000%, 2/01/40, 144A | | | |
| 1,000 | | Liberty Public School District 53, Clay County, Missouri, Lease Participation | 4/22 at 100.00 | AA– | 1,057,130 |
| | Certificates, School Boards Association, Series 2014, 5.000%, 4/01/31 | | | |
| | Liberty, Missouri, Special Obligation Tax Increment and Special Districts Bonds, Liberty | | | |
| | Commons Project, Series 2015A: | | | |
| 1,430 | | 5.125%, 6/01/25, 144A | No Opt. Call | N/R | 1,423,894 |
| 3,810 | | 5.750%, 6/01/35, 144A | 6/25 at 100.00 | N/R | 3,678,669 |
| 3,695 | | 6.000%, 6/01/46, 144A | 6/25 at 100.00 | N/R | 3,577,610 |
| | Missouri Health and Educational Facilities Authority, Educational Facilities Revenue | | | |
| | Bonds, Kansas City University of Medicine and Biosciences, Series 2013A: | | | |
| 1,590 | | 5.000%, 6/01/30 | 6/23 at 100.00 | A1 | 1,755,344 |
| 2,700 | | 5.000%, 6/01/33 | 6/23 at 100.00 | A1 | 2,968,245 |
| 665 | | Missouri Health and Educational Facilities Authority, Educational Facilities Revenue | 5/23 at 100.00 | BBB | 696,528 |
| | Bonds, Saint Louis College of Pharmacy, Series 2013, 5.250%, 5/01/33 | | | |
| 505 | | Missouri Health and Educational Facilities Authority, Educational Facilities Revenue | 10/23 at 100.00 | A+ | 560,530 |
| | Bonds, University of Central Missouri, Series 2013C-2, 5.000%, 10/01/34 | | | |
| | Missouri Health and Educational Facilities Authority, Health Facilities Revenue Bonds, | | | |
| | CoxHealth, Series 2013A: | | | |
| 50 | | 5.000%, 11/15/44 | 11/23 at 100.00 | A2 | 54,194 |
| 6,930 | | 5.000%, 11/15/48 | 11/23 at 100.00 | A2 | 7,496,389 |
| 2,000 | | Missouri Health and Educational Facilities Authority, Health Facilities Revenue Bonds, | 11/24 at 100.00 | A+ | 2,207,720 |
| | Mercy Health, Series 2014F, 5.000%, 11/15/45 | | | |
| 2,500 | | Missouri Health and Educational Facilities Authority, Revenue Bonds, Washington | 11/21 at 100.00 | AA+ (12) | 2,623,275 |
| | University, Series 2011B, 5.000%, 11/15/37 (Pre-refunded 11/15/21) | | | |
| | Saint Louis County Industrial Development Authority, Missouri, Health Facilities Revenue | | | |
| | Bonds, Ranken-Jordan Project, Refunding & Improvement Series 2016: | | | |
| 1,275 | | 5.000%, 11/15/41 | 11/25 at 100.00 | N/R | 1,310,343 |
| 1,105 | | 5.000%, 11/15/46 | 11/25 at 100.00 | N/R | 1,129,619 |
| 430 | | Saint Louis County Industrial Development Authority, Missouri, Revenue Bonds, Friendship | 9/23 at 100.00 | BB+ | 458,320 |
| | Village of Sunset Hills, Series 2013A, 5.875%, 9/01/43 | | | |
| | Saint Louis County Industrial Development Authority, Missouri, Revenue Bonds, Saint | | | |
| | Andrew’s Resources for Seniors, Series 2015A: | | | |
| 450 | | 5.000%, 12/01/35 | 12/25 at 100.00 | N/R | 441,576 |
| 130 | | 5.125%, 12/01/45 | 12/25 at 100.00 | N/R | 123,743 |
| 925 | | Stoddard County Industrial Development Authority, Missouri, Health Facility Revenue | 3/23 at 103.00 | Ba1 | 1,015,289 |
| | Bonds, Southeasthealth, Series 2016B, 6.000%, 3/01/37 | | | |
89
| | |
| NZF | Nuveen Municipal Credit Income Fund Portfolio of Investments (continued) October 31, 2020 |
| | | | | | |
| Principal | | | Optional Call | | |
| Amount (000) | | Description (1) | Provisions (2) | Ratings (3) | Value |
| | Missouri (continued) | | | |
| $ 700 | | The Industrial Development Authority of the City of Saint Louis, Missouri, Development | 11/26 at 100.00 | N/R | $ 615,839 |
| | Financing Revenue Bonds, Ballpark Village Development Project, Series 2017A, 4.750%, 11/15/47 | | | |
| 80,770 | | Total Missouri | | | 85,621,507 |
| | Nebraska – 0.6% (0.4% of Total Investments) | | | |
| 580 | | Douglas County Hospital Authority 2, Nebraska, Health Facilities Revenue Bonds, Nebraska | 11/25 at 100.00 | A | 650,325 |
| | Methodist Health System, Refunding Series 2015, 5.000%, 11/01/45 | | | |
| | Douglas County Hospital Authority 2, Nebraska, Hospital Revenue Bonds, Madonna | | | |
| | Rehabilitation Hospital Project, Series 2014: | | | |
| 1,930 | | 5.000%, 5/15/27 | 5/24 at 100.00 | A– | 2,165,325 |
| 3,000 | | 5.000%, 5/15/36 | 5/24 at 100.00 | A– | 3,281,160 |
| | Douglas County Hospital Authority 3, Nebraska, Health Facilities Revenue Bonds, Nebraska | | | |
| | Methodist Health System, Refunding Series 2015: | | | |
| 4,070 | | 5.000%, 11/01/45 | 11/25 at 100.00 | A | 4,563,488 |
| 2,110 | | 5.000%, 11/01/48 | 11/25 at 100.00 | A | 2,361,596 |
| 500 | | Lincoln County Hospital Authority 1, Nebraska, Hospital Revenue and Refunding Bonds, | 11/21 at 100.00 | A (12) | 522,700 |
| | Great Plains Regional Medical Center Project, Series 2012, 5.000%, 11/01/42 | | | |
| | (Pre-refunded 11/01/21) | | | |
| 12,190 | | Total Nebraska | | | 13,544,594 |
| | Nevada – 0.7% (0.4% of Total Investments) | | | |
| 10,000 | | Las Vegas Valley Water District, Nevada, General Obligation Bonds, Refunding Series | 6/21 at 100.00 | AA | 10,229,200 |
| | 2011C, 5.000%, 6/01/38 | | | |
| 4,000 | | Las Vegas Valley Water District, Nevada, General Obligation Bonds, Refunding Series | 12/24 at 100.00 | AA | 4,611,280 |
| | 2015, 5.000%, 6/01/39 | | | |
| 14,000 | | Total Nevada | | | 14,840,480 |
| | New Jersey – 5.5% (3.4% of Total Investments) | | | |
| 520 | | Gloucester County Pollution Control Financing Authority, New Jersey, Pollution Control | No Opt. Call | Ba1 | 543,145 |
| | Revenue Bonds, Logan Project, Refunding Series 2014A, 5.000%, 12/01/24 (AMT) | | | |
| 1,100 | | New Jersey Economic Development Authority, Private Activity Bonds, The Goethals Bridge | 1/24 at 100.00 | BBB+ | 1,212,948 |
| | Replacement Project, Series 2013, 5.125%, 7/01/42 – AGM Insured (AMT) | | | |
| 17,580 | | New Jersey Economic Development Authority, School Facilities Construction Bonds, | 12/26 at 100.00 | BBB+ | 20,461,010 |
| | Refunding Series 2016BBB, 5.500%, 6/15/31 | | | |
| | New Jersey Economic Development Authority, School Facilities Construction Bonds, | | | |
| | Series 2016AAA: | | | |
| 1,000 | | 5.000%, 6/15/36 | 12/26 at 100.00 | BBB+ | 1,114,410 |
| 10,000 | | 5.000%, 6/15/41 | 12/26 at 100.00 | BBB+ | 11,051,400 |
| 2,000 | | New Jersey Economic Development Authority, School Facilities Construction Bonds, Series | 6/27 at 100.00 | BBB+ | 2,244,880 |
| | 2017DDD, 5.000%, 6/15/35 | | | |
| 15,040 | | New Jersey Economic Development Authority, School Facilities Construction Bonds, Series | 12/28 at 100.00 | BBB+ | 16,725,984 |
| | 2018EEE, 5.000%, 6/15/48 | | | |
| 3,050 | | New Jersey Economic Development Authority, School Facilities Construction Financing | 3/21 at 100.00 | BBB+ | 3,092,426 |
| | Program Bonds, Refunding Series 2011GG, 5.000%, 9/01/24 | | | |
| 1,120 | | New Jersey Educational Facilities Authority, Revenue Bonds, Seton Hall University, | 7/23 at 100.00 | BBB+ | 1,176,638 |
| | Series 2013D, 5.000%, 7/01/33 | | | |
| 600 | | New Jersey Health Care Facilities Financing Authority, New Jersey, Revenue Bonds, Saint | 7/21 at 100.00 | BB+ | 615,342 |
| | Peters University Hospital, Refunding Series 2011, 6.000%, 7/01/26 | | | |
| 405 | | New Jersey Health Care Facilities Financing Authority, Revenue Bonds, University | 7/25 at 100.00 | BB– | 445,549 |
| | Hospital Issue, Refunding Series 2015A, 5.000%, 7/01/46 – AGM Insured | | | |
90
| | | | | | |
| Principal | | | Optional Call | | |
| Amount (000) | | Description (1) | Provisions (2) | Ratings (3) | Value |
| | New Jersey (continued) | | | |
| | New Jersey Transportation Trust Fund Authority, Transportation System Bonds, Capital | | | |
| | Appreciation Series 2010A: | | | |
| $ 3,130 | | 0.000%, 12/15/28 | No Opt. Call | BBB+ | $ 2,466,565 |
| 3,000 | | 0.000%, 12/15/31 | No Opt. Call | BBB+ | 2,084,010 |
| 12,715 | | 0.000%, 12/15/33 | No Opt. Call | BBB+ | 8,094,750 |
| 610 | | 0.000%, 12/15/34 | No Opt. Call | BBB+ | 372,856 |
| 2,480 | | 0.000%, 12/15/40 | No Opt. Call | BBB+ | 1,150,125 |
| 10,000 | | New Jersey Transportation Trust Fund Authority, Transportation System Bonds, Refunding | No Opt. Call | BBB+ | 6,817,200 |
| | Series 2006C, 0.000%, 12/15/33 – AGM Insured | | | |
| 19,175 | | New Jersey Transportation Trust Fund Authority, Transportation System Bonds, Series | No Opt. Call | BBB+ | 11,208,746 |
| | 2008A, 0.000%, 12/15/35 | | | |
| 15,000 | | New Jersey Transportation Trust Fund Authority, Transportation System Bonds, Series | No Opt. Call | BBB+ | 7,297,200 |
| | 2009A, 0.000%, 12/15/39 | | | |
| 5,000 | | New Jersey Transportation Trust Fund Authority, Transportation System Bonds, Series | 12/24 at 100.00 | BBB+ | 5,515,800 |
| | 2009C, 5.250%, 6/15/32 | | | |
| 6,305 | | New Jersey Transportation Trust Fund Authority, Transportation System Bonds, Series | 6/25 at 100.00 | BBB+ | 6,776,110 |
| | 2015AA, 5.000%, 6/15/45 | | | |
| 1,595 | | Tobacco Settlement Financing Corporation, New Jersey, Tobacco Settlement Asset-Backed | 6/28 at 100.00 | BBB+ | 1,840,120 |
| | Bonds, Series 2018A, 5.000%, 6/01/46 | | | |
| 10,000 | | Tobacco Settlement Financing Corporation, New Jersey, Tobacco Settlement Asset-Backed | 6/28 at 100.00 | BB+ | 11,317,500 |
| | Bonds, Series 2018B, 5.000%, 6/01/46 | | | |
| 141,425 | | Total New Jersey | | | 123,624,714 |
| | New Mexico – 0.4% (0.3% of Total Investments) | | | |
| 4,185 | | New Mexico Hospital Equipment Loan Council, Hospital Revenue Bonds, Presbyterian | 8/29 at 100.00 | Aa3 | 5,105,575 |
| | Healthcare Services, Series 2019A, 5.000%, 8/01/44 | | | |
| 4,180 | | Winrock Town Center Tax Increment Development District, Albuquerque, New Mexico, Gross | 11/20 at 103.00 | N/R | 4,220,504 |
| | Receipts Tax Increment Bonds, Senior Lien Series 2015, 5.750%, 5/01/30, 144A | | | |
| 8,365 | | Total New Mexico | | | 9,326,079 |
| | New York – 17.4% (10.9% of Total Investments) | | | |
| 1,755 | | Albany Industrial Development Agency, New York, Revenue Bonds, Brighter Choice Charter | 12/20 at 100.00 | BB | 1,756,895 |
| | Schools, Series 2007A, 5.000%, 4/01/32 | | | |
| | Brooklyn Arena Local Development Corporation, New York, Payment in Lieu of Taxes Revenue | | | |
| | Bonds, Barclays Center Project, Series 2009: | | | |
| 3,400 | | 0.000%, 7/15/44 | No Opt. Call | Ba1 | 1,249,126 |
| 12,020 | | 0.000%, 7/15/46 | No Opt. Call | Ba1 | 4,007,468 |
| 450 | | Buffalo and Erie County Industrial Land Development Corporation, New York, Revenue | 7/25 at 100.00 | BBB | 509,238 |
| | Bonds, Catholic Health System, Inc Project, Series 2015, 5.250%, 7/01/35 | | | |
| 200 | | Build New York City Resource Corporation, New York, Revenue Bonds, Metropolitan College | 11/24 at 100.00 | BB | 207,840 |
| | of New York, Series 2014, 5.000%, 11/01/39 | | | |
| 3,170 | | Dormitory Authority of the State of New York, Revenue Bonds, New School University, | 7/25 at 100.00 | A– | 3,476,602 |
| | Series 2015A, 5.000%, 7/01/50 | | | |
| 15,270 | | Dormitory Authority of the State of New York, Revenue Bonds, Vaughn College of | 12/26 at 100.00 | BB– | 15,061,106 |
| | Aeronautics & Technology, Series 2016A, 5.500%, 12/01/46, 144A | | | |
| 4,675 | | Dormitory Authority of the State of New York, State Personal Income Tax Revenue Bonds, | 3/21 at 100.00 | Aa2 | 4,745,125 |
| | General Purpose Series 2011C, 5.000%, 3/15/41 | | | |
| 81,270 | | Erie County Tobacco Asset Securitization Corporation, New York, Tobacco Settlement | 11/20 at 15.70 | N/R | 8,930,760 |
| | Asset-Backed Bonds, Series 2005C, 0.000%, 6/01/50, 144A | | | |
| | Hudson Yards Infrastructure Corporation, New York, Revenue Bonds, Senior Fiscal 2012 | | | |
| | Series 2011A: | | | |
| 270 | | 5.250%, 2/15/47 (Pre-refunded 2/15/21) | 2/21 at 100.00 | Aa3 (12) | 273,875 |
| 5,890 | | 5.250%, 2/15/47 | 2/21 at 100.00 | AA– | 5,965,451 |
| 800 | | 5.750%, 2/15/47 | 2/21 at 100.00 | AA– | 811,640 |
| 1,300 | | 5.750%, 2/15/47 (Pre-refunded 2/15/21) | 2/21 at 100.00 | Aa3 (12) | 1,320,501 |
91
| | |
| NZF | Nuveen Municipal Credit Income Fund Portfolio of Investments (continued) October 31, 2020 |
| | | | | | |
| Principal | | | Optional Call | | |
| Amount (000) | | Description (1) | Provisions (2) | Ratings (3) | Value |
| | New York (continued) | | | |
| $ 3,000 | | Long Island Power Authority, New York, Electric System General Revenue Bonds, Series | 9/24 at 100.00 | A | $ 3,424,710 |
| | 2014A, 5.000%, 9/01/39 | | | |
| 1,200 | | Long Island Power Authority, New York, Electric System Revenue Bonds, Series 2011A, | 5/21 at 100.00 | A2 (12) | 1,228,872 |
| | 5.000%, 5/01/36 (Pre-refunded 5/01/21) – AGM Insured | | | |
| | Long Island Power Authority, New York, Electric System Revenue Bonds, Series 2012A: | | | |
| 1,990 | | 5.000%, 9/01/42 (Pre-refunded 9/01/22) | 9/22 at 100.00 | N/R (12) | 2,163,787 |
| 4,010 | | 5.000%, 9/01/42 | 9/22 at 100.00 | A2 | 4,242,981 |
| 6,280 | | Metropolitan Transportation Authority, New York, Transportation Revenue Bonds, Green | 5/30 at 100.00 | BBB+ | 6,933,748 |
| | Climate Bond Certified Series 2020C-1, 5.250%, 11/15/55 | | | |
| 4,210 | | Metropolitan Transportation Authority, New York, Transportation Revenue Bonds, Refunding | 11/26 at 100.00 | BBB+ | 4,470,725 |
| | Green Series 2016B, 5.000%, 11/15/34 | | | |
| 1,000 | | Metropolitan Transportation Authority, New York, Transportation Revenue Bonds, Refunding | 11/25 at 100.00 | BBB+ | 1,050,280 |
| | Series 2015F, 5.000%, 11/15/35 | | | |
| 5,000 | | Metropolitan Transportation Authority, New York, Transportation Revenue Bonds, Refunding | 5/28 at 100.00 | BBB+ | 5,415,050 |
| | Series 2017D, 5.000%, 11/15/32 | | | |
| | Metropolitan Transportation Authority, New York, Transportation Revenue Bonds, | | | |
| | Series 2011A: | | | |
| 285 | | 5.000%, 11/15/41 (Pre-refunded 11/15/21) | 11/21 at 100.00 | N/R (12) | 299,145 |
| 465 | | 5.000%, 11/15/41 (Pre-refunded 11/15/21) | 11/21 at 100.00 | BBB+ (12) | 488,078 |
| 2,500 | | Metropolitan Transportation Authority, New York, Transportation Revenue Bonds, Series | 5/23 at 100.00 | BBB+ | 2,563,275 |
| | 2013A, 5.000%, 11/15/38 | | | |
| 6,095 | | Metropolitan Transportation Authority, New York, Transportation Revenue Bonds, Series | 11/23 at 100.00 | BBB+ | 6,277,911 |
| | 2013D, 5.000%, 11/15/38 | | | |
| 16,290 | | New York City Industrial Development Agency, New York, PILOT Payment in Lieu of Taxes | 11/20 at 100.00 | BB+ | 15,833,065 |
| | Revenue Bonds, Queens Baseball Stadium Project, Series 2006, 5.000%, 1/01/46 – AMBAC Insured | | | |
| | New York City Municipal Water Finance Authority, New York, Water and Sewer System | | | |
| | Revenue Bonds, Second Generation Resolution, Fiscal 2011 Series EE: | | | |
| 1,480 | | 5.375%, 6/15/43 | 12/20 at 100.00 | AA+ | 1,488,984 |
| 2,895 | | 5.375%, 6/15/43 (Pre-refunded 12/15/20) | 12/20 at 100.00 | N/R (12) | 2,912,573 |
| 4,400 | | New York City Municipal Water Finance Authority, New York, Water and Sewer System Second | 6/30 at 100.00 | AA+ | 5,588,660 |
| | General Resolution Revenue Bonds, Fiscal 2020 Series FF, 5.000%, 6/15/41 | | | |
| | New York City Municipal Water Finance Authority, New York, Water and Sewer System Second | | | |
| | General Resolution Revenue Bonds, Fiscal 2020 Series GG-1: | | | |
| 11,000 | | 4.000%, 6/15/50 | 6/30 at 100.00 | AA+ | 12,592,360 |
| 9,925 | | 5.000%, 6/15/50 | 6/30 at 100.00 | AA+ | 12,397,417 |
| 5,000 | | New York City Transitional Finance Authority, New York, Building Aid Revenue Bonds, | 7/28 at 100.00 | Aa3 | 5,990,500 |
| | Fiscal 2019 Subseries S-1, 5.000%, 7/15/45 | | | |
| 4,440 | | New York City Transitional Finance Authority, New York, Building Aid Revenue Bonds, | 7/28 at 100.00 | Aa3 | 5,451,476 |
| | Fiscal 2019 Subseries S-3A, 5.000%, 7/15/36 | | | |
| 10,000 | | New York City Transitional Finance Authority, New York, Future Tax Secured Bonds, | 5/23 at 100.00 | Aa1 | 11,069,000 |
| | Subordinate Fiscal 2013 Series I, 5.000%, 5/01/38 | | | |
| 19,305 | | New York City Municipal Water Finance Authority, Water and Sewer System Second General | 12/29 at 100.00 | AA+ | 23,912,910 |
| | Resolution Revenue Bonds, Fiscal 2020 Series BB-1, 5.000%, 6/15/49 | | | |
| 63,090 | | New York Liberty Development Corporation, New York, Liberty Revenue Bonds, 3 World Trade | 11/24 at 100.00 | N/R | 64,638,229 |
| | Center Project, Class 1 Series 2014, 5.000%, 11/15/44, 144A | | | |
| 5,200 | | New York Liberty Development Corporation, New York, Liberty Revenue Bonds, 3 World Trade | 11/24 at 100.00 | N/R | 5,399,056 |
| | Center Project, Class 2 Series 2014, 5.150%, 11/15/34, 144A | | | |
| | New York Liberty Development Corporation, New York, Liberty Revenue Bonds, 4 World Trade | | | |
| | Center Project, Series 2011: | | | |
| 1,870 | | 5.000%, 11/15/44 | 11/21 at 100.00 | A | 1,945,099 |
| 2,000 | | 5.750%, 11/15/51 | 11/21 at 100.00 | A | 2,100,380 |
| 3,000 | | New York State Power Authority, General Revenue Bonds, Series 2011A, 5.000%, 11/15/38 | 11/21 at 100.00 | AA | 3,140,220 |
92
| | | | | | |
| Principal | | | Optional Call | | |
| Amount (000) | | Description (1) | Provisions (2) | Ratings (3) | Value |
| | New York (continued) | | | |
| $ 5,000 | | New York State Thruway Authority, General Revenue Junior Indebtedness Obligations, | 1/26 at 100.00 | A– | $ 5,719,000 |
| | Series 2016A, 5.000%, 1/01/51 | | | |
| | New York Transportation Development Corporation, New York, Special Facilities Bonds, | | | |
| | LaGuardia Airport Terminal B Redevelopment Project, Series 2016A: | | | |
| 1,800 | | 4.000%, 7/01/41 (AMT) | 7/24 at 100.00 | Baa3 | 1,849,122 |
| 10,680 | | 5.000%, 7/01/41 (AMT) | 7/24 at 100.00 | Baa3 | 11,478,971 |
| 16,810 | | 5.000%, 7/01/46 (AMT) | 7/24 at 100.00 | Baa3 | 18,005,191 |
| 29,150 | | 5.250%, 1/01/50 (AMT) | 7/24 at 100.00 | Baa3 | 31,421,659 |
| | New York Transportation Development Corporation, New York, Special Facility Revenue | | | |
| | Bonds, American Airlines, Inc John F Kennedy International Airport Project, Refunding | | | |
| | Series 2016: | | | |
| 2,565 | | 5.000%, 8/01/26 (AMT) | 8/21 at 100.00 | B– | 2,575,183 |
| 16,200 | | 5.000%, 8/01/31 (AMT) | 8/21 at 100.00 | B– | 16,138,602 |
| 4,825 | | New York Transportation Development Corporation, New York, Special Facility Revenue | 8/30 at 100.00 | B– | 4,973,079 |
| | Bonds, American Airlines, Inc John F Kennedy International Airport Project, Series 2020, | | | |
| | 5.250%, 8/01/31 (AMT) | | | |
| 4,350 | | New York Transportation Development Corporation, Special Facility Revenue Bonds, Delta | 1/28 at 100.00 | BB+ | 4,708,397 |
| | Air Lines, Inc – LaGuardia Airport Terminals C&D Redevelopment Project, Series 2018, 5.000%, | | | |
| | 1/01/31 (AMT) | | | |
| 2,100 | | New York Transportation Development Corporation, Special Facility Revenue Bonds, Delta | 10/30 at 100.00 | BB+ | 2,293,725 |
| | Air Lines, Inc – LaGuardia Airport Terminals C&D Redevelopment Project, Series 2020, 5.000%, | | | |
| | 10/01/35 (AMT) | | | |
| 10,000 | | Port Authority of New York and New Jersey, Consolidated Revenue Bonds, Two Hundred | 4/27 at 100.00 | A+ | 11,793,400 |
| | Series 2017, 5.250%, 10/15/57 | | | |
| | Port Authority of New York and New Jersey, Special Project Bonds, JFK International Air | | | |
| | Terminal LLC Project, Eighth Series 2010: | | | |
| 6,065 | | 6.500%, 12/01/28 | 11/20 at 100.00 | BBB | 6,143,057 |
| 3,430 | | 6.000%, 12/01/36 | 12/20 at 100.00 | BBB | 3,444,029 |
| 795 | | 6.000%, 12/01/42 | 12/20 at 100.00 | BBB | 798,236 |
| 2,500 | | Triborough Bridge and Tunnel Authority, New York, General Purpose Revenue Bonds, | 5/25 at 100.00 | AA– | 2,842,200 |
| | Refunding Series 2015A, 5.000%, 11/15/50 | | | |
| 6,945 | | Triborough Bridge and Tunnel Authority, New York, General Revenue Bonds, MTA Bridges & | 11/30 at 100.00 | AA– | 8,578,533 |
| | Tunnels, Series 2020A, 5.000%, 11/15/49 | | | |
| 449,615 | | Total New York | | | 394,096,502 |
| | North Carolina – 0.2% (0.1% of Total Investments) | | | |
| 3,300 | | North Carolina Medical Care Commission, Health Care Facilities Revenue Bonds, WakeMed, | 10/22 at 100.00 | A2 | 3,506,052 |
| | Refunding Series 2012A, 5.000%, 10/01/31 | | | |
| | North Dakota – 2.3% (1.5% of Total Investments) | | | |
| 1,000 | | Burleigh County, North Dakota, Health Care Revenue Bonds, Saint Alexius Medical Center | 7/21 at 100.00 | N/R (12) | 1,029,120 |
| | Project, Series 2014A, 5.000%, 7/01/35 (Pre-refunded 7/01/21) | | | |
| | Fargo, North Dakota, Health System Revenue Bonds, Sanford Health, Refunding | | | |
| | Series 2011: | | | |
| 1,500 | | 6.000%, 11/01/28 (Pre-refunded 11/01/21) | 11/21 at 100.00 | A+ (12) | 1,583,445 |
| 2,190 | | 6.250%, 11/01/31 (Pre-refunded 11/01/21) | 11/21 at 100.00 | A+ (12) | 2,317,239 |
| | Grand Forks, North Dakota, Health Care System Revenue Bonds, Altru Health System | | | |
| | Obligated Group, Series 2012: | | | |
| 3,000 | | 5.000%, 12/01/29 | 12/21 at 100.00 | Baa2 | 3,079,560 |
| 1,875 | | 5.000%, 12/01/32 | 12/21 at 100.00 | Baa2 | 1,917,675 |
| 39,670 | | Ward County Health Care, North Dakota, Revenue Bonds, Trinity Obligated Group, Series | 6/28 at 100.00 | BBB– | 42,931,667 |
| | 2017C, 5.000%, 6/01/53 | | | |
| 49,235 | | Total North Dakota | | | 52,858,706 |
93
| | |
| NZF | Nuveen Municipal Credit Income Fund Portfolio of Investments (continued) October 31, 2020 |
| | | | | | |
| Principal | | | Optional Call | | |
| Amount (000) | | Description (1) | Provisions (2) | Ratings (3) | Value |
| | Ohio – 3.0% (1.9% of Total Investments) | | | |
| $ 800 | | Allen County, Ohio, Hospital Facilities Revenue Bonds, Catholic Health Partners, | 5/22 at 100.00 | A+ (12) | $ 855,648 |
| | Refunding and Improvement Series 2012A, 5.000%, 5/01/42 (Pre-refunded 5/01/22) | | | |
| 8,015 | | Buckeye Tobacco Settlement Financing Authority, Ohio, Tobacco Settlement Asset-Backed | 6/30 at 100.00 | BBB+ | 8,694,432 |
| | Revenue Bonds, Refunding Senior Lien Series 2020A-2 Class 1, 4.000%, 6/01/48 | | | |
| 20,305 | | Buckeye Tobacco Settlement Financing Authority, Ohio, Tobacco Settlement Asset-Backed | 6/30 at 100.00 | N/R | 21,739,954 |
| | Revenue Bonds, Refunding Senior Lien Series 2020B-2 Class 2, 5.000%, 6/01/55 | | | |
| 5,800 | | Franklin County, Ohio, Hospital Revenue Bonds, OhioHealth Corporation, Series 2011A, | 11/21 at 100.00 | Aa2 (12) | 6,085,998 |
| | 5.000%, 11/15/41 (Pre-refunded 11/15/21) | | | |
| 4,615 | | Lucas County, Ohio, Hospital Revenue Bonds, ProMedica Healthcare Obligated Group, Series | 11/21 at 100.00 | Baa3 (12) | 4,886,685 |
| | 2011A, 6.000%, 11/15/41 (Pre-refunded 11/15/21) | | | |
| 1,000 | | Ohio Air Quality Development Authority, Ohio, Pollution Control Revenue Bonds, | No Opt. Call | N/R | 1,250 |
| | FirstEnergy Nuclear Generation Project, Refunding Series 2008C, 3.950%, 11/01/32 (4) | | | |
| 10 | | Ohio Air Quality Development Authority, Ohio, Revenue Bonds, AK Steel Holding | 2/22 at 100.00 | CCC | 9,747 |
| | Corporation, Refunding Series 2012A, 6.750%, 6/01/24 (AMT) | | | |
| 6,945 | | Ohio State, Hospital Revenue Bonds, University Hospitals Health System, Inc, Series | 1/30 at 100.00 | A | 8,353,377 |
| | 2020A, 5.000%, 1/15/50 | | | |
| 2,000 | | Ohio Turnpike Commission, Turnpike Revenue Bonds, Infrastructure Project, Junior Lien | 2/23 at 100.00 | A+ | 2,179,980 |
| | Series 2013A-1, 5.250%, 2/15/33 | | | |
| 330 | | Ohio Water Development Authority, Ohio, Environmental Improvement Bonds, United States | 11/21 at 100.00 | Caa2 | 316,064 |
| | Steel Corporation Project, Refunding Series 2011, 6.600%, 5/01/29 | | | |
| 3,000 | | Ohio Water Development Authority, Pollution Control Revenue Bonds, FirstEnergy Nuclear | No Opt. Call | N/R | 3,750 |
| | Generating Corporation Project, Refunding Series 2008C, 3.950%, 11/01/32 (4) | | | |
| 13,350 | | Ohio Water Development Authority, Pollution Control Revenue Refunding Bonds, FirstEnergy | No Opt. Call | N/R | 13,450,125 |
| | Nuclear Generating Corporation Project, Series 2009A, 4.375%, 6/01/33 (Mandatory Put 6/01/22) | | | |
| 2,500 | | Ohio Water Development Authority, Pollution Control Revenue Refunding Bonds, FirstEnergy | No Opt. Call | N/R | 2,518,750 |
| | Nuclear Generating Corporation Project, Series 2010B, 4.375%, 6/01/33 (Mandatory Put 6/01/22) | | | |
| 68,670 | | Total Ohio | | | 69,095,760 |
| | Oklahoma – 2.6% (1.6% of Total Investments) | | | |
| 1,555 | | Fort Sill Apache Tribe of Oklahoma Economic Development Authority, Gaming Enterprise | 8/21 at 100.00 | N/R (12) | 1,655,826 |
| | Revenue Bonds, Fort Sill Apache Casino, Series 2011A, 8.500%, 8/25/26 (Pre-refunded | | | |
| | 8/25/21), 144A | | | |
| | Oklahoma Development Finance Authority, Health System Revenue Bonds, OU Medicine | | | |
| | Project, Series 2018B: | | | |
| 3,515 | | 5.250%, 8/15/43 | 8/28 at 100.00 | BB+ | 4,091,425 |
| 11,870 | | 5.250%, 8/15/48 | 8/28 at 100.00 | BB+ | 13,714,717 |
| 10,570 | | 5.500%, 8/15/52 | 8/28 at 100.00 | BB+ | 12,315,530 |
| 21,360 | | 5.500%, 8/15/57 | 8/28 at 100.00 | BB+ | 24,803,873 |
| 2,055 | | Tulsa Airports Improvement Trust, Oklahoma, General Airport Revenue Bonds, Series 2013A, | 6/23 at 100.00 | Baa1 | 2,265,370 |
| | 5.375%, 6/01/33 (AMT) | | | |
| 50,925 | | Total Oklahoma | | | 58,846,741 |
| | Oregon – 0.1% (0.0% of Total Investments) | | | |
| 1,270 | | Forest Grove, Oregon, Campus Improvement Revenue Bonds, Pacific University Project, | 5/22 at 100.00 | BBB | 1,297,686 |
| | Refunding Series 2014A, 5.000%, 5/01/40 | | | |
| | Pennsylvania – 5.4% (3.4% of Total Investments) | | | |
| 380 | | Allegheny Country Industrial Development Authority, Pennsylvania, Environmental | 8/22 at 100.00 | Caa2 | 342,532 |
| | Improvement Revenue Bonds, United States Steel Corporation Project, Series 2012, 5.750%, | | | |
| | 8/01/42 (AMT) | | | |
| 1,355 | | Allentown Neighborhood Improvement Zone Development Authority, Pennsylvania, Tax Revenue | 5/27 at 100.00 | Baa3 | 1,411,354 |
| | Bonds, City Center Refunding Project, Series 2017, 5.000%, 5/01/42, 144A | | | |
| 10,650 | | Beaver County Industrial Development Authority, Pennsylvania, Pollution Control Revenue | No Opt. Call | N/R | 10,729,875 |
| | Bonds, FirstEnergy Generation Project, Refunding Series 2006A, 4.375%, 1/01/35 (Mandatory | | | |
| | Put 7/01/22) | | | |
94
| | | | | | |
| Principal | | | Optional Call | | |
| Amount (000) | | Description (1) | Provisions (2) | Ratings (3) | Value |
| | Pennsylvania (continued) | | | |
| $ 32,785 | | Beaver County Industrial Development Authority, Pennsylvania, Pollution Control Revenue | No Opt. Call | N/R | $ 40,981 |
| | Bonds, FirstEnergy Nuclear Generation Project, Series 2006B, 3.500%, 12/01/35 (4) | | | |
| 23,670 | | Berks County Industrial Development Authority, Pennsylvania, Health System Revenue | 11/27 at 100.00 | BB+ | 24,825,806 |
| | Bonds, Tower Health Project, Series 2017, 5.000%, 11/01/50 | | | |
| 2,950 | | Commonwealth Financing Authority, Pennsylvania, State Appropriation Lease Bonds, Master | 6/28 at 100.00 | A | 3,640,949 |
| | Settlement, Series 2018, 5.000%, 6/01/35 | | | |
| 2,080 | | Cumberland County Municipal Authority, Pennsylvania, Revenue Bonds, Diakon Lutheran | 1/25 at 100.00 | BBB+ | 2,214,680 |
| | Social Ministries Project, Series 2015, 5.000%, 1/01/38 | | | |
| 6,335 | | Geisinger Authority, Montour County, Pennsylvania, Health System Revenue Bonds, | 2/27 at 100.00 | A1 | 7,436,530 |
| | Geisinger Health System, Series 2017A-1, 5.000%, 2/15/45 | | | |
| 22,875 | | Geisinger Authority, Montour County, Pennsylvania, Health System Revenue Bonds, | 4/30 at 100.00 | A1 | 26,219,096 |
| | Geisinger Health System, Series 2020A, 4.000%, 4/01/39 | | | |
| | Montgomery County Industrial Development Authority, Pennsylvania, Health System Revenue | | | |
| | Bonds, Albert Einstein Healthcare Network Issue, Series 2015A: | | | |
| 6,190 | | 5.250%, 1/15/36 | 1/25 at 100.00 | Ba1 | 6,540,416 |
| 3,535 | | 5.250%, 1/15/45 | 1/25 at 100.00 | Ba1 | 3,692,307 |
| 2,206 | | Northampton County Industrial Development Authority, Pennsylvania, Recovery Revenue | 11/20 at 100.00 | N/R | 551,431 |
| | Bonds, Northampton Generating Project, Senior Lien Series 2013A0 & AE2, 1.250%, 12/31/23 | | | |
| 672 | | Northampton County Industrial Development Authority, Pennsylvania, Recovery Revenue | No Opt. Call | N/R | 168,002 |
| | Bonds, Northampton Generating Project, Senior Lien Taxable Series 2013B, 1.250%, 12/31/23 | | | |
| | (cash 5.000%, PIK 5.000%) | | | |
| 4,135 | | Pennsylvania Economic Development Financing Authority, Exempt Facilities Revenue Bonds, | 11/24 at 100.00 | N/R | 4,242,096 |
| | National Gypsum Company, Refunding Series 2014, 5.500%, 11/01/44 (AMT) | | | |
| 11,750 | | Pennsylvania Economic Development Financing Authority, Exempt Facilities Revenue | 9/25 at 100.00 | CCC+ | 9,703,737 |
| | Refunding Bonds, PPL Energy Supply, LLC Project, Series 2009A, 6.400%, 12/01/38 | | | |
| 1,085 | | Pennsylvania Economic Development Financing Authority, Private Activity Revenue Bonds, | 6/26 at 100.00 | BBB | 1,227,515 |
| | Pennsylvania Rapid Bridge Replacement Project, Series 2015, 5.000%, 12/31/38 (AMT) | | | |
| | Pennsylvania Turnpike Commission, Motor License Fund-Enhanced Turnpike Special Revenue | | | |
| | Bonds, Subordinate Series 2010A1&2: | | | |
| 315 | | 5.500%, 12/01/34 (Pre-refunded 12/01/20) | 12/20 at 100.00 | N/R (12) | 316,298 |
| 1,435 | | 5.500%, 12/01/34 (Pre-refunded 12/01/20) | 12/20 at 100.00 | A (12) | 1,440,970 |
| 5,140 | | Pennsylvania Turnpike Commission, Motor License Fund-Enhanced Turnpike Special Revenue | 12/21 at 100.00 | A2 (12) | 5,403,785 |
| | Bonds, Subordinate Series 2011B, 5.000%, 12/01/34 (Pre-refunded 12/01/21) | | | |
| 5,660 | | Pennsylvania Turnpike Commission, Turnpike Revenue Bonds, Series 2015A-1, | 6/25 at 100.00 | A+ | 6,407,177 |
| | 5.000%, 12/01/45 | | | |
| 3,170 | | Pennsylvania Turnpike Commission, Turnpike Revenue Bonds, Subordinate Series 2016A-1, | 12/25 at 100.00 | A3 | 3,611,930 |
| | 5.000%, 12/01/46 | | | |
| | The Redevelopment Authority of the City of Scranton, Lackawanna county, Pennsylvania, | | | |
| | Guaranteed Lease Revenue Bonds, Series 2016A: | | | |
| 220 | | 5.000%, 11/15/21 | No Opt. Call | BB+ | 220,282 |
| 1,255 | | 5.000%, 11/15/28 | 5/24 at 100.00 | BB+ | 1,221,015 |
| 149,848 | | Total Pennsylvania | | | 121,608,764 |
| | Puerto Rico – 3.9% (2.5% of Total Investments) | | | |
| 1,805 | | Puerto Rico Cofina Class 2 Trust Tax-Exempt Class 2054 Unit Exchanged From Cusip | No Opt. Call | N/R | 346,560 |
| | 74529JAP0, 0.000%, 8/01/54 | | | |
| 3,325 | | Puerto Rico Aqueduct and Sewerage Authority, Revenue Bonds, Senior Lien Series 2008A, | 11/20 at 100.00 | CC | 3,374,875 |
| | 6.000%, 7/01/44 | | | |
| | Puerto Rico Aqueduct and Sewerage Authority, Revenue Bonds, Senior Lien Series 2012A: | | | |
| 1,800 | | 5.500%, 7/01/28 | 7/22 at 100.00 | CC | 1,887,750 |
| 6,640 | | 5.750%, 7/01/37 | 7/22 at 100.00 | CC | 6,930,500 |
| 5,425 | | 6.000%, 7/01/47 | 7/22 at 100.00 | CC | 5,689,469 |
| 215 | | Puerto Rico Highway and Transportation Authority, Highway Revenue Bonds, Series 2007N, | No Opt. Call | C | 236,717 |
| | 5.500%, 7/01/29 – AMBAC Insured | | | |
95
| | |
| NZF | Nuveen Municipal Credit Income Fund Portfolio of Investments (continued) October 31, 2020 |
| | | | | | |
| Principal | | | Optional Call | | |
| Amount (000) | | Description (1) | Provisions (2) | Ratings (3) | Value |
| | Puerto Rico (continued) | | | |
| | Puerto Rico Sales Tax Financing Corporation, Sales Tax Revenue Bonds, | | | |
| | Restructured 2018A-1: | | | |
| $ 10,685 | | 0.000%, 7/01/46 | 7/28 at 41.38 | N/R | $ 3,087,431 |
| 62,339 | | 5.000%, 7/01/58 | 7/28 at 100.00 | N/R | 66,412,853 |
| 493 | | Puerto Rico Sales Tax Financing Corporation, Sales Tax Revenue Bonds, Taxable | 7/28 at 100.00 | N/R | 511,813 |
| | Restructured Cofina Project Series 2019A-2, 4.536%, 7/01/53 | | | |
| 92,727 | | Total Puerto Rico | | | 88,477,968 |
| | Rhode Island – 0.1% (0.1% of Total Investments) | | | |
| 21,570 | | Rhode Island Tobacco Settlement Financing Corporation, Tobacco Settlement Asset-Backed | 11/20 at 15.49 | CCC– | 3,334,938 |
| | Bonds, Series 2007A, 0.000%, 6/01/52 | | | |
| | South Carolina – 2.9% (1.9% of Total Investments) | | | |
| 5,000 | | Piedmont Municipal Power Agency, South Carolina, Electric Revenue Bonds, Refunding | No Opt. Call | A– | 5,048,200 |
| | Series 1991, 6.250%, 1/01/21 – FGIC Insured | | | |
| | Piedmont Municipal Power Agency, South Carolina, Electric Revenue Bonds, Series 2004A-2: | | | |
| 1,220 | | 0.000%, 1/01/23 – FGIC Insured | No Opt. Call | A– | 1,199,931 |
| 21,570 | | 0.000%, 1/01/30 – AMBAC Insured | No Opt. Call | A– | 18,394,249 |
| 5,560 | | 0.000%, 1/01/31 – AGC Insured | No Opt. Call | A3 | 4,655,332 |
| 10,000 | | South Carolina Public Service Authority, Santee Cooper Revenue Obligations, Refunding & | 6/25 at 100.00 | A– | 11,302,100 |
| | Improvement Series 2015A, 5.000%, 12/01/50 | | | |
| 7,110 | | South Carolina Public Service Authority, Santee Cooper Revenue Obligations, Refunding & | 12/30 at 100.00 | A– | 8,098,930 |
| | Improvement Series 2020A, 4.000%, 12/01/40 (WI/DD, Settling 11/05/20) | | | |
| 6,930 | | South Carolina Public Service Authority, Santee Cooper Revenue Obligations, Refunding | 12/24 at 100.00 | A– | 7,846,631 |
| | Series 2014C, 5.000%, 12/01/39 | | | |
| 9,155 | | South Carolina Public Service Authority, Santee Cooper Revenue Obligations, Series | 6/24 at 100.00 | A– | 10,280,058 |
| | 2014A, 5.500%, 12/01/54 | | | |
| 66,545 | | Total South Carolina | | | 66,825,431 |
| | South Dakota – 0.2% (0.1% of Total Investments) | | | |
| 4,455 | | South Dakota Health and Educational Facilities Authority, Revenue Bonds, Sanford Health, | 11/24 at 100.00 | A+ | 5,002,430 |
| | Series 2014B, 5.000%, 11/01/44 | | | |
| | Tennessee – 1.2% (0.8% of Total Investments) | | | |
| 8,890 | | Chattanooga Health, Educational and Housing Facility Board, Tennessee, Revenue Bonds, | 1/23 at 100.00 | BBB+ (12) | 9,804,603 |
| | Catholic Health Initiatives, Series 2013A, 5.250%, 1/01/45 (Pre-refunded 1/01/23) | | | |
| 4,000 | | Chattanooga Health, Educational and Housing Facility Board, Tennessee, Revenue Bonds, | 8/29 at 100.00 | BBB+ | 4,338,120 |
| | CommonSpirit Health, Series 2019A-1, 4.000%, 8/01/44 | | | |
| 1,665 | | Chattanooga Health, Educational and Housing Facility Board, Tennessee, Revenue Bonds, | 8/29 at 100.00 | BBB+ | 1,970,228 |
| | CommonSpirit Health, Series 2019A-2, 5.000%, 8/01/44 | | | |
| 2,395 | | Chattanooga-Hamilton County Hospital Authority, Tennessee, Hospital Revenue Bonds, | 10/24 at 100.00 | Baa3 | 2,559,058 |
| | Erlanger Health System, Refunding Series 2014A, 5.000%, 10/01/44 | | | |
| 2,540 | | Metropolitan Government of Nashville-Davidson County Health and Educational Facilities | 6/27 at 100.00 | N/R | 1,524,000 |
| | Board, Tennessee, Revenue Bonds, Knowledge Academy Charter School, Series 2017A, 0.000%, | | | |
| | 6/15/37, 144A (4) | | | |
| 5,830 | | Metropolitan Nashville Airport Authority, Tennessee, Airport Revenue Bonds, Subordinate | 7/30 at 100.00 | A2 | 6,874,211 |
| | Series 2019A, 5.000%, 7/01/54 | | | |
| 25,320 | | Total Tennessee | | | 27,070,220 |
| | Texas – 15.5% (9.7% of Total Investments) | | | |
| | Arlington Higher Education Finance Corporation, Texas, Education Revenue Bonds, Uplift | | | |
| | Education, Series 2016A: | | | |
| 165 | | 5.000%, 12/01/36 | 12/26 at 100.00 | BBB– | 182,569 |
| 130 | | 5.000%, 12/01/46 | 12/26 at 100.00 | BBB– | 141,023 |
| 760 | | 5.000%, 12/01/51 | 12/26 at 100.00 | BBB– | 822,411 |
96
| | | | | | |
| Principal | | | Optional Call | | |
| Amount (000) | | Description (1) | Provisions (2) | Ratings (3) | Value |
| | Texas (continued) | | | |
| $ 495 | | Arlington Higher Education Finance Corporation, Texas, Education Revenue Bonds, Wayside | 8/21 at 100.00 | BB+ | $ 497,228 |
| | Schools, Series 2016A, 4.375%, 8/15/36 | | | |
| 900 | | Aubrey, Denton County, Texas, Special Assessment Revenue Bonds, Jackson Ridge Public | 9/23 at 103.00 | N/R | 961,587 |
| | Improvement District Phase 1 Project, Series 2015, 7.250%, 9/01/45 | | | |
| 765 | | Aubrey, Denton County, Texas, Special Assessment Revenue Bonds, Jackson Ridge Public | 9/23 at 103.00 | N/R | 815,245 |
| | Improvement District Phases 2-3 Major Improvements Project, Series 2015, 8.250%, 9/01/40 | | | �� |
| | Board of Managers, Joint Guadalupe County-Seguin City Hospital, Texas, Hospital Mortgage | | | |
| | Revenue Bonds, Refunding & Improvement Series 2015: | | | |
| 3,135 | | 5.250%, 12/01/35 | 12/25 at 100.00 | BB | 3,430,662 |
| 3,340 | | 5.000%, 12/01/40 | 12/25 at 100.00 | BB | 3,500,721 |
| 1,030 | | Celina, Texas, Special Assessment Revenue Bonds, Sutton Fields II Public Improvement | 3/23 at 103.00 | N/R | 1,077,833 |
| | District Neighborhood Improvement Area 1 Project, Series 2015, 7.250%, 9/01/45 | | | |
| 1,815 | | Celina, Texas, Special Assessment Revenue Bonds, Sutton Fields II Public Improvement | 3/23 at 103.00 | N/R | 1,890,504 |
| | District Neighborhood Improvement Areas 2-5 Major Improvement Project, Series 2015, | | | |
| | 8.250%, 9/01/40 | | | |
| | Central Texas Regional Mobility Authority, Revenue Bonds, Senior Lien Series 2011: | | | |
| 3,250 | | 6.000%, 1/01/41 (Pre-refunded 1/01/21) | 1/21 at 100.00 | Baa1 (12) | 3,280,192 |
| 2,700 | | 6.250%, 1/01/46 (Pre-refunded 1/01/21) | 1/21 at 100.00 | Baa1 (12) | 2,726,163 |
| | Central Texas Regional Mobility Authority, Revenue Bonds, Senior Lien, Series 2015A: | | | |
| 2,000 | | 5.000%, 1/01/40 | 7/25 at 100.00 | Baa1 | 2,257,460 |
| 3,625 | | 5.000%, 1/01/45 | 7/25 at 100.00 | Baa1 | 4,064,821 |
| | Club Municipal Management District 1, Texas, Special Assessment Revenue Bonds, | | | |
| | Improvement Area 1 Project, Series 2016: | | | |
| 550 | | 6.250%, 9/01/35 | 9/23 at 103.00 | N/R | 606,732 |
| 520 | | 6.500%, 9/01/46 | 9/23 at 103.00 | N/R | 573,227 |
| 4,500 | | Colorado River Municipal Water District, Texas, Water System Revenue Bonds, Series 2011, | 1/21 at 100.00 | AA– (12) | 4,535,055 |
| | 5.000%, 1/01/36 (Pre-refunded 1/01/21) | | | |
| 4,000 | | Dallas-Fort Worth International Airport, Texas, Joint Revenue Bonds, Improvement Series | 11/22 at 100.00 | A | 4,259,600 |
| | 2013C, 5.000%, 11/01/38 (AMT) | | | |
| 2,600 | | Dallas-Fort Worth International Airport, Texas, Joint Revenue Bonds, Refunding & | 11/21 at 100.00 | A | 2,698,176 |
| | Improvement Series 2012C, 5.000%, 11/01/45 | | | |
| 1,000 | | Fort Bend County Industrial Development Corporation, Texas, Revenue Bonds, NRG Energy | 11/22 at 100.00 | Baa2 | 1,035,640 |
| | Inc Project, Series 2012A RMKT, 4.750%, 5/01/38 | | | |
| 2,335 | | Grand Parkway Transportation Corporation, Texas, System Toll Revenue Bonds, First Tier | 10/23 at 100.00 | BBB | 2,485,981 |
| | Series 2013A, 5.125%, 10/01/43 | | | |
| 17,000 | | Grand Parkway Transportation Corporation, Texas, System Toll Revenue Bonds, Subordinate | 10/23 at 100.00 | AA (12) | 19,453,270 |
| | Lien Series 2013B, 5.250%, 10/01/51 (Pre-refunded 10/01/23) | | | |
| 4,410 | | Grand Parkway Transportation Corporation, Texas, System Toll Revenue Bonds, Subordinate | 4/28 at 100.00 | AA | 5,378,833 |
| | Lien Series 2018A Tela Supported, 5.000%, 10/01/48 | | | |
| 1,140 | | Grand Parkway Transportation Corporation, Texas, System Toll Revenue Bonds, Tender | 10/23 at 100.00 | AA+ (12) | 1,765,176 |
| | Option Bond Trust 2015-XF0228, 17.898%, 11/01/44, 144A (Pre-refunded 10/01/23) (IF) (7) | | | |
| 10,000 | | Gulf Coast Industrial Development Authority, Texas, Solid Waste Disposal Revenue Bonds, | 11/20 at 100.00 | B3 | 10,005,000 |
| | Citgo Petroleum Corporation Project, Series 1998, 8.000%, 4/01/28 (AMT) | | | |
| 3,480 | | Harris County Cultural Education Facilities Finance Corporation, Texas, Revenue Bonds, | 6/25 at 100.00 | AA | 3,970,541 |
| | Houston Methodist Hospital System, Series 2015, 5.000%, 12/01/45 | | | |
| | Harris County-Houston Sports Authority, Texas, Revenue Bonds, Capital Appreciation | | | |
| | Refunding Senior Lien Series 2014A: | | | |
| 295 | | 0.000%, 11/15/41 – AGM Insured | 11/31 at 62.66 | A2 | 129,493 |
| 590 | | 0.000%, 11/15/42 – AGM Insured | 11/31 at 59.73 | A2 | 245,859 |
| 1,000 | | 0.000%, 11/15/43 – AGM Insured | 11/31 at 56.93 | A2 | 395,450 |
| 2,000 | | 0.000%, 11/15/44 – AGM Insured | 11/31 at 54.25 | A2 | 749,640 |
| 2,600 | | 0.000%, 11/15/45 – AGM Insured | 11/31 at 51.48 | A2 | 919,698 |
| 4,180 | | 0.000%, 11/15/53 – AGM Insured | 11/31 at 33.96 | A2 | 950,532 |
97
| | |
| NZF | Nuveen Municipal Credit Income Fund Portfolio of Investments (continued) October 31, 2020 |
| | | | | | |
| Principal | | | Optional Call | | |
| Amount (000) | | Description (1) | Provisions (2) | Ratings (3) | Value |
| | Texas (continued) | | | |
| $ 6,170 | | Harris County-Houston Sports Authority, Texas, Revenue Bonds, Junior Lien Series 2001H, | 11/31 at 69.08 | BB+ | $ 2,805,190 |
| | 0.000%, 11/15/37 – NPFG Insured | | | |
| 4,565 | | Harris County-Houston Sports Authority, Texas, Revenue Bonds, Third Lien Series 2004A-3, | 11/24 at 52.47 | BB | 2,108,984 |
| | 0.000%, 11/15/35 – NPFG Insured | | | |
| 40,500 | | Harris County-Houston Sports Authority, Texas, Special Revenue Bonds, Refunding Senior | 11/30 at 54.04 | A2 | 15,991,425 |
| | Lien Series 2001A, 0.000%, 11/15/40 – NPFG Insured | | | |
| 3,855 | | Houston, Texas, Airport System Revenue Bonds, Refunding Subordinate Lien Series | 7/22 at 100.00 | A (12) | 4,138,921 |
| | 2012A, 5.000%, 7/01/32 (Pre-refunded 7/01/22) (AMT) | | | |
| 2,000 | | Houston, Texas, Airport System Special Facilities Revenue Bonds, United Airlines Inc | 7/25 at 100.00 | B | 2,021,000 |
| | Terminal Improvement Project, Refunding Series 2015B-1, 5.000%, 7/15/35 (AMT) | | | |
| 235 | | Houston, Texas, Airport System Special Facilities Revenue Bonds, United Airlines, Inc | 7/24 at 100.00 | B | 240,565 |
| | Terminal E Project, Refunding Series 2014, 5.000%, 7/01/29 (AMT) | | | |
| 2,845 | | Houston, Texas, Airport System Special Facilities Revenue Bonds, United Airlines, Inc | No Opt. Call | BB– | 2,983,182 |
| | Terminal E Project, Refunding Series 2020A, 5.000%, 7/01/27 (AMT) | | | |
| 3,750 | | Houston, Texas, Airport System Special Facilities Revenue Bonds, United Airlines, Inc | No Opt. Call | BB– | 3,932,025 |
| | Terminal Improvements Project, Refunding Series 2020B-2, 5.000%, 7/15/27 (AMT) | | | |
| 10,000 | | Houston, Texas, Combined Utility System Revenue Bonds, First Lien Series 2011D, 5.000%, | 11/21 at 100.00 | AA (12) | 10,493,100 |
| | 11/15/40 (Pre-refunded 11/15/21) | | | |
| 5,000 | | Houston, Texas, Combined Utility System Revenue Bonds, Refunding First Lien Series | 11/30 at 100.00 | Aa2 | 5,924,900 |
| | 2020C, 4.000%, 11/15/43 | | | |
| 5,335 | | Houston, Texas, General Obligation Bonds, Refunding Public Improvement Series 2019A, | 3/29 at 100.00 | Aa3 | 6,872,013 |
| | 5.000%, 3/01/32 | | | |
| | Houston, Texas, Hotel Occupancy Tax and Special Revenue Bonds, Convention and | | | |
| | Entertainment Project, Series 2001B: | | | |
| 28,305 | | 0.000%, 9/01/28 – AMBAC Insured | No Opt. Call | A | 23,755,537 |
| 5,000 | | 0.000%, 9/01/30 – AMBAC Insured | No Opt. Call | A | 3,890,750 |
| 5,765 | | 0.000%, 9/01/31 – AMBAC Insured | No Opt. Call | A | 4,316,832 |
| 6,000 | | Houston, Texas, Water and Sewerage System Revenue Bonds, Refunding Junior Lien Series | No Opt. Call | AA+ (12) | 7,763,640 |
| | 2001B, 5.500%, 12/01/29 – NPFG Insured (ETM) | | | |
| 7,500 | | Houston, Texas, Water and Sewerage System Revenue Bonds, Refunding Junior Lien Series | No Opt. Call | A2 (12) | 11,251,125 |
| | 2002A, 5.750%, 12/01/32 – AGM Insured (ETM) | | | |
| 720 | | Kerrville Health Facilities Development Corporation, Texas, Revenue Bonds, Sid Peterson | 8/25 at 100.00 | A– | 809,122 |
| | Memorial Hospital Project, Series 2015, 5.000%, 8/15/35 | | | |
| 2,750 | | Lower Colorado River Authority, Texas, Transmission Contract Revenue Bonds, LCRA | 5/25 at 100.00 | A | 3,178,285 |
| | Transmission Services Corporation Project, Refunding Series 2015, 5.000%, 5/15/40 | | | |
| 1,750 | | Martin County Hospital District, Texas, Combination Limited Tax and Revenue Bonds, | 4/21 at 100.00 | BBB | 1,776,075 |
| | Series 2011A, 7.250%, 4/01/36 | | | |
| 2,505 | | Matagorda County Navigation District 1, Texas, Collateralized Revenue Refunding Bonds, | No Opt. Call | A | 3,137,112 |
| | Houston Light and Power Company, Series 1997, 5.125%, 11/01/28 – AMBAC Insured (AMT) | | | |
| 8,630 | | Mission Economic Development Corporation, Texas, Revenue Bonds, Natgasoline Project, | 10/21 at 105.00 | BB– | 9,144,693 |
| | Senior Lien Series 2018, 4.625%, 10/01/31 (AMT), 144A | | | |
| 15,600 | | Mission Economic Development Corporation, Texas, Water Supply Revenue Bonds, Enviro | 1/26 at 102.00 | N/R | 1,086,852 |
| | Water Minerals Project, Green Bonds, Series 2015, 7.750%, 1/01/45 (AMT), 144A (4), (5) | | | |
| 150 | | New Hope Cultural Education Facilities Finance Corporation, Texas, Student Housing | 4/26 at 100.00 | B | 134,375 |
| | Revenue Bonds, CHF-Collegiate Housing Corpus Christi II, LLC-Texas A&M University-Corpus | | | |
| | Christi Project, Series 2016A, 5.000%, 4/01/48 | | | |
| 565 | | New Hope Cultural Education Facilities Finance Corporation, Texas, Student Housing | 4/26 at 100.00 | BBB– | 547,361 |
| | Revenue Bonds, CHF-Collegiate Housing Foundation – San Antonio 1, LLC – Texas A&M | | | |
| | University – San Antonio Project,, 5.000%, 4/01/48 | | | |
| | North Texas Tollway Authority, Special Projects System Revenue Bonds, Convertible | | | |
| | Capital Appreciation Series 2011C: | | | |
| 6,330 | | 0.000%, 9/01/43 (Pre-refunded 9/01/31) (6) | 9/31 at 100.00 | N/R (12) | 8,607,281 |
| 9,130 | | 0.000%, 9/01/45 (Pre-refunded 9/01/31) (6) | 9/31 at 100.00 | N/R (12) | 13,445,660 |
98
| | | | | | |
| Principal | | | Optional Call | | |
| Amount (000) | | Description (1) | Provisions (2) | Ratings (3) | Value |
| | Texas (continued) | | | |
| | North Texas Tollway Authority, System Revenue Bonds, Refunding First Tier Capital | | | |
| | Appreciation Series 2008I: | | | |
| $ 2,555 | | 6.200%, 1/01/42 – AGC Insured | 1/25 at 100.00 | A1 | $ 3,048,141 |
| 7,000 | | 6.500%, 1/01/43 | 1/25 at 100.00 | A+ | 8,410,500 |
| 10,000 | | North Texas Tollway Authority, System Revenue Bonds, Refunding First Tier, Series 2008D, | No Opt. Call | A1 | 9,055,600 |
| | 0.000%, 1/01/28 – AGC Insured | | | |
| | North Texas Tollway Authority, System Revenue Bonds, Refunding First Tier, Series 2015B: | | | |
| 2,870 | | 5.000%, 1/01/40 | 1/23 at 100.00 | A+ | 3,086,656 |
| 4,880 | | 5.000%, 1/01/45 | 1/25 at 100.00 | A+ | 5,554,270 |
| | North Texas Tollway Authority, System Revenue Bonds, Refunding Second Tier, | | | |
| | Series 2015A: | | | |
| 7,855 | | 5.000%, 1/01/33 | 1/25 at 100.00 | A | 9,094,990 |
| 2,205 | | 5.000%, 1/01/34 | 1/25 at 100.00 | A | 2,547,238 |
| 1,000 | | 5.000%, 1/01/35 | 1/25 at 100.00 | A | 1,153,450 |
| 2,345 | | 5.000%, 1/01/38 | 1/25 at 100.00 | A | 2,691,450 |
| 1,570 | | Reagan Hospital District of Reagan County, Texas, Limited Tax Revenue Bonds, Series | 2/24 at 100.00 | Ba1 | 1,644,182 |
| | 2014A, 5.000%, 2/01/34 | | | |
| 1,680 | | Texas Municipal Gas Acquisition and Supply Corporation I, Gas Supply Revenue Bonds, | No Opt. Call | A– | 1,967,482 |
| | Senior Lien Series 2008D, 6.250%, 12/15/26 | | | |
| | Texas Municipal Gas Acquisition and Supply Corporation III, Gas Supply Revenue Bonds, | | | |
| | Series 2012: | | | |
| 2,500 | | 5.000%, 12/15/27 | 12/22 at 100.00 | BBB+ | 2,691,125 |
| 4,835 | | 5.000%, 12/15/28 | 12/22 at 100.00 | BBB+ | 5,189,696 |
| 13,235 | | 5.000%, 12/15/29 | 12/22 at 100.00 | BBB+ | 14,166,876 |
| 435 | | 5.000%, 12/15/32 | 12/22 at 100.00 | BBB+ | 462,736 |
| 2,000 | | Texas Private Activity Bond Surface Transportation Corporation, Senior Lien Revenue | 9/23 at 100.00 | Baa3 | 2,278,260 |
| | Bonds, NTE Mobility Partners Segments 3 LLC Segments 3A & 3B Facility, Series 2013, 7.000%, | | | |
| | 12/31/38 (AMT) | | | |
| 5,355 | | Texas Transportation Commission, Central Texas Turnpike System Revenue Bonds, Refunding | 8/22 at 100.00 | A3 (12) | 5,808,301 |
| | First Tier Series 2012A, 5.000%, 8/15/41 (Pre-refunded 8/15/22) | | | |
| 13,000 | | Texas Transportation Commission, Central Texas Turnpike System Revenue Bonds, Refunding | 8/30 at 100.00 | A3 | 16,580,070 |
| | First Tier Series 2020A, 5.000%, 8/15/39 | | | |
| | Texas Transportation Commission, Central Texas Turnpike System Revenue Bonds, Refunding | | | |
| | Second Tier Series 2015C: | | | |
| 4,000 | | 5.000%, 8/15/32 | 8/24 at 100.00 | Baa1 | 4,543,920 |
| 1,875 | | 5.000%, 8/15/37 | 8/24 at 100.00 | Baa1 | 2,110,500 |
| | Texas Turnpike Authority, Central Texas Turnpike System Revenue Bonds, First Tier | | | |
| | Series 2002A: | | | |
| 300 | | 0.000%, 8/15/21 – AMBAC Insured (ETM) | No Opt. Call | A3 (12) | 299,295 |
| 1,020 | | 0.000%, 8/15/21 – AMBAC Insured | No Opt. Call | A3 | 1,014,431 |
| 3,600 | | 0.000%, 8/15/25 – AMBAC Insured | No Opt. Call | A3 | 3,417,048 |
| 5,000 | | Texas Water Development Board, State Water Implementation Revenue Fund Bonds, Master | 10/27 at 100.00 | AAA | 5,856,400 |
| | Trust Series 2017A, 4.000%, 10/15/37 | | | |
| 2,400 | | Travis County Health Facilities Development Corporation, Texas, Hospital Revenue Bonds, | 11/20 at 100.00 | N/R (12) | 2,421,048 |
| | Daughters of Charity National Health System, Series 1993B, 6.000%, 11/15/22 (ETM) | | | |
| 374,780 | | Total Texas | | | 351,255,992 |
| | Utah – 0.3% (0.2% of Total Investments) | | | |
| 2,030 | | Box Elder County, Utah, Solid Waste Disposal Revenue Bonds, Promontory Point Res, LLC, | 12/27 at 100.00 | N/R | 1,626,456 |
| | Senior Series 2017A, 8.000%, 12/01/39 (AMT), 144A (4) | | | |
| 3,000 | | Salt Lake City, Utah, Airport Revenue Bonds, International Airport Series 2018A, 5.000%, | 7/28 at 100.00 | A2 | 3,466,860 |
| | 7/01/48 (AMT) | | | |
| 1,555 | | Utah Charter School Finance Authority, Charter School Revenue Bonds, Paradigm High | 11/20 at 100.00 | BB | 1,557,877 |
| | School, Series 2010A, 6.375%, 7/15/40 | | | |
| 6,585 | | Total Utah | | | 6,651,193 |
99
| | |
| NZF | Nuveen Municipal Credit Income Fund Portfolio of Investments (continued) October 31, 2020 |
| | | | | | |
| Principal | | | Optional Call | | |
| Amount (000) | | Description (1) | Provisions (2) | Ratings (3) | Value |
| | Virginia – 1.2% (0.8% of Total Investments) | | | |
| $ 540 | | Embrey Mill Community Development Authority, Virginia, Special Assessment Revenue Bonds, | 3/25 at 100.00 | N/R | $ 557,172 |
| | Series 2015, 5.600%, 3/01/45, 144A | | | |
| 1,800 | | Henrico County Economic Development Authority, Virginia, Revenue Bonds, Bon Secours | 11/22 at 100.00 | N/R (12) | 1,964,322 |
| | Health System Obligated Group, Series 2013, 5.000%, 11/01/30 (Pre-refunded 11/01/22) | | | |
| 10,935 | | Metropolitan Washington DC Airports Authority, Virginia, Airport System Revenue Bonds, | 10/27 at 100.00 | A+ | 12,680,117 |
| | Refunding Series 2017, 5.000%, 10/01/47 (AMT) | | | |
| 1,810 | | Virginia Small Business Financing Authority, Senior Lien Revenue Bonds, 95 Express Lanes | 1/22 at 100.00 | BBB– | 1,871,305 |
| | LLC Project, Series 2012, 5.000%, 1/01/40 (AMT) | | | |
| | Virginia Small Business Financing Authority, Senior Lien Revenue Bonds, Elizabeth River | | | |
| | Crossing, Opco LLC Project, Series 2012: | | | |
| 1,885 | | 5.250%, 1/01/32 (AMT) | 7/22 at 100.00 | BBB– | 1,976,912 |
| 4,480 | | 6.000%, 1/01/37 (AMT) | 7/22 at 100.00 | BBB– | 4,769,677 |
| 3,810 | | 5.500%, 1/01/42 (AMT) | 7/22 at 100.00 | BBB– | 3,978,707 |
| 25,260 | | Total Virginia | | | 27,798,212 |
| | Washington – 2.3% (1.5% of Total Investments) | | | |
| 1,260 | | Central Puget Sound Regional Transit Authority, Washington, Sales Tax and Motor Vehicle | 11/20 at 100.00 | AAA | 1,406,437 |
| | Excise Tax Bonds, Series 1999, 4.750%, 2/01/28 – FGIC Insured | | | |
| 6,000 | | Energy Northwest, Washington, Electric Revenue Bonds, Columbia Generating Station, | 7/25 at 100.00 | AA– | 7,028,640 |
| | Refunding Series 2015A, 5.000%, 7/01/38 (UB) (7) | | | |
| 10,000 | | Washington Health Care Facilities Authority, Revenue Bonds, Catholic Health, Series | 2/21 at 100.00 | BBB+ (12) | 10,114,500 |
| | 2011A, 5.000%, 2/01/41 (Pre-refunded 2/01/21) | | | |
| 6,065 | | Washington Health Care Facilities Authority, Revenue Bonds, Central Washington Health | 7/25 at 100.00 | Baa1 | 6,352,724 |
| | Services Association, Refunding Series 2015, 4.000%, 7/01/36 | | | |
| 7,190 | | Washington Health Care Facilities Authority, Revenue Bonds, Fred Hutchinson Cancer | 1/21 at 100.00 | A2 (12) | 7,252,050 |
| | Research Center, Series 2011A, 5.625%, 1/01/35 (Pre-refunded 1/01/21) | | | |
| 2,940 | | Washington Health Care Facilities Authority, Revenue Bonds, Kadlec Regional Medical | 12/20 at 100.00 | N/R (12) | 2,952,113 |
| | Center, Series 2010, 5.500%, 12/01/39 (Pre-refunded 12/01/20) | | | |
| 3,300 | | Washington Health Care Facilities Authority, Revenue Bonds, Seattle Cancer Center | 9/30 at 100.00 | A2 | 3,974,883 |
| | Alliance, Series 2020, 5.000%, 9/01/50 | | | |
| 2,185 | | Washington Health Care Facilities Authority, Revenue Bonds, Seattle Children’s Hospital, | 10/22 at 100.00 | Aa2 | 2,321,868 |
| | Series 2012A, 5.000%, 10/01/42 | | | |
| 8,780 | | Washington State Convention Center Public Facilities District, Lodging Tax Revenue | 7/28 at 100.00 | BBB | 9,702,339 |
| | Bonds, Series 2018, 5.000%, 7/01/43 | | | |
| 1,410 | | Washington State, Motor Vehicle Fuel Tax General Obligation Bonds, Series 2003F, 0.000%, | No Opt. Call | AA+ | 1,377,499 |
| | 12/01/24 – NPFG Insured | | | |
| 49,130 | | Total Washington | | | 52,483,053 |
| | West Virginia – 0.6% (0.4% of Total Investments) | | | |
| 2,950 | | West Virginia Economic Development Authority, Solid Waste Disposal Facilities Revenue | 12/20 at 100.00 | Baa1 | 2,960,738 |
| | Bonds, Appalachian Power Company – Amos Project, Series 2010, 5.375%, 12/01/38 | | | |
| 5,160 | | West Virginia Hospital Finance Authority, Hospital Revenue Bonds, West Virginia United | 6/23 at 100.00 | A | 5,584,152 |
| | Health System Obligated Group, Refunding & Improvement Series 2013A, 5.500%, 6/01/44 | | | |
| 5,000 | | West Virginia Hospital Finance Authority, Revenue Bonds, West Virginia University Health | 6/27 at 100.00 | A | 5,826,750 |
| | System Obligated Group, Improvement Series 2017A, 5.000%, 6/01/47 | | | |
| 13,110 | | Total West Virginia | | | 14,371,640 |
| | Wisconsin – 1.5% (0.9% of Total Investments) | | | |
| 1,000 | | Public Finance Authority of Wisconsin, Charter School Revenue Bonds, Envision Science | 5/26 at 100.00 | N/R | 1,029,140 |
| | Academy Project, Series 2016A, 5.125%, 5/01/36, 144A | | | |
| | Public Finance Authority of Wisconsin, Charter School Revenue Bonds, North Carolina | | | |
| | Charter Educational Foundation Project, Series 2016A: | | | |
| 5,375 | | 5.000%, 6/15/36, 144A | 6/26 at 100.00 | N/R | 5,413,915 |
| 4,430 | | 5.000%, 6/15/46, 144A | 6/26 at 100.00 | N/R | 4,329,616 |
100
| | | | | | |
| Principal | | | Optional Call | | |
| Amount (000) | | Description (1) | Provisions (2) | Ratings (3) | Value |
| | Wisconsin (continued) | | | |
| | Public Finance Authority of Wisconsin, Conference Center and Hotel Revenue Bonds, | | | |
| | Lombard Public Facilities Corporation, First Tier Series 2018A-1: | | | |
| $ 80 | | 0.000%, 1/01/47, 144A (4) | No Opt. Call | N/R | $ 1,911 |
| 70 | | 0.000%, 1/01/48, 144A (4) | No Opt. Call | N/R | 1,641 |
| 69 | | 0.000%, 1/01/49, 144A (4) | No Opt. Call | N/R | 1,576 |
| 66 | | 0.000%, 1/01/50, 144A (4) | No Opt. Call | N/R | 1,461 |
| 65 | | 0.000%, 1/01/51, 144A (4) | No Opt. Call | N/R | 1,407 |
| 85 | | 0.000%, 1/01/52, 144A (4) | No Opt. Call | N/R | 1,752 |
| 84 | | 0.000%, 1/01/53, 144A (4) | No Opt. Call | N/R | 1,691 |
| 81 | | 0.000%, 1/01/54, 144A (4) | No Opt. Call | N/R | 1,586 |
| 79 | | 0.000%, 1/01/55, 144A (4) | No Opt. Call | N/R | 1,515 |
| 77 | | 0.000%, 1/01/56, 144A (4) | No Opt. Call | N/R | 1,454 |
| 4,002 | | 5.500%, 7/01/56, 144A (4) | 3/28 at 100.00 | N/R | 2,882,211 |
| 86 | | 0.000%, 1/01/57, 144A (4) | No Opt. Call | N/R | 1,561 |
| 84 | | 0.000%, 1/01/58, 144A (4) | No Opt. Call | N/R | 1,481 |
| 81 | | 0.000%, 1/01/59, 144A (4) | No Opt. Call | N/R | 1,411 |
| 80 | | 0.000%, 1/01/60, 144A (4) | No Opt. Call | N/R | 1,333 |
| 79 | | 0.000%, 1/01/61, 144A (4) | No Opt. Call | N/R | 1,272 |
| 76 | | 0.000%, 1/01/62, 144A (4) | No Opt. Call | N/R | 1,202 |
| 75 | | 0.000%, 1/01/63, 144A (4) | No Opt. Call | N/R | 1,147 |
| 73 | | 0.000%, 1/01/64, 144A (4) | No Opt. Call | N/R | 1,098 |
| 72 | | 0.000%, 1/01/65, 144A (4) | No Opt. Call | N/R | 1,042 |
| 78 | | 0.000%, 1/01/66, 144A (4) | No Opt. Call | N/R | 1,064 |
| 935 | | 0.000%, 1/01/67, 144A (4) | No Opt. Call | N/R | 11,873 |
| 1,200 | | Public Finance Authority of Wisconsin, Exempt Facilities Revenue Bonds, National Gypsum | 8/26 at 100.00 | N/R | 1,143,252 |
| | Company Project, Refunding Series 2016, 4.000%, 8/01/35 (AMT) | | | |
| 1,000 | | Public Finance Authority, Wisconsin, Exempt Facilities Revenue Bonds, Celanese Project, | 5/26 at 100.00 | BBB– | 1,090,260 |
| | Refunding Series 2016C, 4.300%, 11/01/30 (AMT) | | | |
| 1,250 | | Wisconsin Health and Educational Facilities Authority, Revenue Bonds, Marshfield Clinic, | 2/22 at 100.00 | A– | 1,302,287 |
| | Series 2012B, 5.000%, 2/15/32 | | | |
| | Wisconsin Health and Educational Facilities Authority, Revenue Bonds, Mercy Alliance, | | | |
| | Inc, Series 2012: | | | |
| 2,105 | | 5.000%, 6/01/32 | 6/22 at 100.00 | A3 | 2,200,041 |
| 2,500 | | 5.000%, 6/01/39 | 6/22 at 100.00 | A3 | 2,598,700 |
| 1,120 | | Wisconsin Health and Educational Facilities Authority, Wisconsin, Revenue Bonds, Dickson | 10/22 at 102.00 | N/R | 1,163,501 |
| | Hollow Project Series 2014, 5.250%, 10/01/39 | | | |
| 4,000 | | Wisconsin Health and Educational Facilities Authority, Wisconsin, Revenue Bonds, | 8/24 at 100.00 | A+ | 4,472,000 |
| | ProHealth Care, Inc Obligated Group, Refunding Series 2015, 5.000%, 8/15/39 | | | |
| | Wisconsin Health and Educational Facilities Authority, Wisconsin, Revenue Bonds, Rogers | | | |
| | Memorial Hospital, Inc, Series 2014A: | | | |
| 1,415 | | 5.000%, 7/01/27 | 7/24 at 100.00 | A | 1,612,916 |
| 1,310 | | 5.000%, 7/01/29 | 7/24 at 100.00 | A | 1,481,099 |
| 3,000 | | Wisconsin Health and Educational Facilities Authority, Wisconsin, Revenue Bonds, Rogers | 7/24 at 100.00 | A | 3,299,940 |
| | Memorial Hospital, Inc, Series 2014B, 5.000%, 7/01/44 | | | |
| 36,182 | | Total Wisconsin | | | 34,059,356 |
| $ 3,765,582 | | Total Municipal Bonds (cost $3,280,647,204) | | | 3,584,445,333 |
|
| Shares | | Description (1) | | | Value |
| | COMMON STOCKS – 1.1% (0.7% of Total Investments) | | | |
| | Electric Utilities – 1.1% (0.7% of Total Investments) | | | |
| 1,189,215 | | Energy Harbor Corp (8), (13), (14) | | | $ 23,784,300 |
| | Total Common Stocks (cost $33,900,553) | | | 23,784,300 |
101
| NZF | Nuveen Municipal Credit Income Fund Portfolio of Investments (continued) October 31, 2020 |
| | | | | | | |
| Shares | | Description (1), (9) | | | | Value |
| | INVESTMENT COMPANIES – 0.1% (0.0% of Total Investments) | | | | |
| 6,266 | | BlackRock MuniHoldings Fund Inc | | | | $ 94,115 |
| 26,880 | | BNY Mellon Strategic Municipals Inc | | | | 218,534 |
| 30,000 | | Invesco Municipal Opportunity Trust | | | | 368,400 |
| 43,020 | | Invesco Trust for Investment Grade Municipals | | | | 533,448 |
| 43,420 | | PIMCO Municipal Income Fund II | | | | 571,842 |
| | Total Investment Companies (cost $1,790,280) | | | | 1,786,339 |
| Principal | | | | | | |
| Amount (000) | | Description (1) | Coupon | Maturity | Ratings (3) | Value |
| | CORPORATE BONDS – 0.0% (0.0% of Total Investments) | | | | |
| | Industrials – 0.0% (0.0% of Total Investments) | | | | |
| $ 3,135 | | EWM P1 LLC (cash 13.750%, PIK 1.250%) (4), (5) | 15.000% | 9/01/28 | N/R | $ 32 |
| 2,335 | | EWM P1 LLC (4), (5) | 15.000%�� | 9/01/28 | N/R | 23 |
| 546 | | EWM P1 LLC | 15.000% | 9/01/28 | N/R | 545,456 |
| $ 6,016 | | Total Corporate Bonds (cost $5,649,547) | | | | 545,511 |
| | Total Long-Term Investments (cost $3,321,987,584) | | | | 3,610,561,483 |
| | Floating Rate Obligations – (0.7)% | | | | (16,275,000) |
| | MuniFund Preferred Shares, net of deferred offering costs – (28.2)% (10) | | | | (640,010,468) |
| | Variable Rate Demand Preferred Shares, net of deferred offering costs – (31.9)% (11) | | | | (722,526,702) |
| | Other Assets Less Liabilities – 1.6% | | | | 36,216,168 |
| | Net Assets Applicable to Common Shares – 100% | | | | $ 2,267,965,481 |
102
| | |
(1) | All percentages shown in the Portfolio of Investments are based on net assets applicable to common shares unless otherwise noted. |
(2)
| Optional Call Provisions: Dates (month and year) and prices of the earliest optional call or redemption. There may be other call provisions at varying prices at later dates. Certain mortgage-backed securities may be subject to periodic principal paydowns. Optional Call Provisions are not covered by the report of independent registered public accounting firm. |
(3) | The ratings disclosed are the lowest of Standard & Poor’s Group (“Standard & Poor’s”), Moody’s Investors Service, Inc. (“Moody’s”) or Fitch, Inc. (“Fitch”) rating. Ratings below BBB by Standard & Poor’s, Baa by Moody’s or BBB by Fitch are considered to be below investment grade. Holdings designated N/R are not rated by any of these national rating agencies. Ratings are not covered by the report of independent registered public accounting firm. |
(4) | Defaulted security. A security whose issuer has failed to fully pay principal and/or interest when due, or is under the protection of bankruptcy. |
(5)
| Investment valued at fair value using methods determined in good faith by, or at the discretion of, the Board. For fair value measurement disclosure purposes, investment classified as Level 3. See Notes to Financial Statements, Note 3 - Investment Valuation and Fair Value Measurements for more information. |
(6)
| Step-up coupon bond, a bond with a coupon that increases (“steps up”), usually at regular intervals, while the bond is outstanding. The rate shown is the coupon as of the end of the reporting period. |
(7) | Investment, or portion of investment, has been pledged to collateralize the net payment obligations for investments in inverse floating rate transactions. |
(8)
| For fair value measurement disclosure purposes, investment classified as Level 2. See Notes to Financial Statements, Note 3 – Investment Valuation and Fair Value Measurements for more information. |
(9)
| A copy of the most recent financial statements for these investment companies can be obtained directly from the Securities and Exchange Commission on its website at http://www.sec.gov. |
(10) | MuniFund Term Preferred Shares, net of deferred offering costs as a percentage of Total Investments is 17.7%. |
(11) | Variable Rate Demand Preferred Shares, net of deferred offering costs as a percentage of Total Investments is 20.0%. |
(12) | Backed by an escrow or trust containing sufficient U.S. Government or U.S. Government agency securities, which ensure the timely payment of principal and interest. |
(13)
| Common Stock received as part of the bankruptcy settlements for Beaver County Industrial Development Authority, Pennsylvania, Pollution Control Revenue Refunding Bonds, FirstEnergy Nuclear Generation Project, Series 2006B, 3.500%, 12/01/35, Ohio Air Quality Development Authority, Ohio, Pollution Control Revenue Bonds, FirstEnergy Nuclear Generation Project, Refunding Series 2008C, 3.950%, 11/01/32, Ohio Water Development Authority, Pollution Control Revenue Refunding Bonds, FirstEnergy Nuclear Generating Corporation Project, Series 2008C, 3.950%, 11/01/32. |
(14) | Non-income producing; issuer has not declared a dividend within the past twelve months. |
144A | Investment is exempt from registration under Rule 144A of the Securities Act of 1933, as amended. These investments may only be resold in transactions exempt from registration, which are normally those transactions with qualified institutional buyers. |
AMT | Alternative Minimum Tax. |
ETM | Escrowed to maturity. |
IF | Inverse floating rate security issued by a tender option bond (“TOB”) trust, the interest rate on which varies inversely with the Securities Industry Financial Markets Association (SIFMA) short-term rate, which resets weekly, or a similar short-term rate, and is reduced by the expenses related to the TOB trust.
|
PIK | Payment-in-kind (“PIK”) security. Depending on the terms of the security, income may be received in the form of cash, securities, or a combination of both. The PIK rate shown, where applicable, represents the annualized rate of the last PIK payment made by the issuer as of the end of the reporting period.
|
UB | Underlying bond of an inverse floating rate trust reflected as a financing transaction. See Notes to Financial Statements, Note 4 – Portfolio Securities and Investments in Derivatives for more information.
|
WI/DD | Purchased on a when-issued or delayed delivery basis. |
| See accompanying notes to financial statements. |
103
| | |
| NMZ | Nuveen Municipal High Income Opportunity Fund Portfolio of Investments October 31, 2020 |
| | | | | | |
| Principal | | | Optional Call | | |
| Amount (000) | | Description (1) | Provisions (2) | Ratings (3) | Value |
| | LONG-TERM INVESTMENTS – 145.1% (100.0% of Total Investments) | | | |
| | MUNICIPAL BONDS – 143.3% (98.7% of Total Investments) | | | |
| | Alabama – 2.0% (1.4% of Total Investments) | | | |
| $ 182 | | Adamsville Solid Waste Disposal Authority, Alabama, Solid Waste Disposal Revenue Bonds, | 11/20 at 100.00 | N/R | $ 2 |
| | Big Sky Environmental LLC Project, Refunding Taxable Series 2017C, 1.000%, 9/01/37, 144A (4) | | | |
| 1,000 | | Adamsville Solid Waste Disposal Authority, Alabama, Solid Waste Disposal Revenue Bonds, | 9/27 at 100.00 | N/R | 700,000 |
| | Big Sky Environmental LLC Project, Series 2017A, 6.750%, 9/01/37, 144A (4) | | | |
| 213 | | Adamsville Solid Waste Disposal Authority, Alabama, Solid Waste Disposal Revenue Bonds, | 9/27 at 100.00 | N/R | 148,646 |
| | Big Sky Environmental LLC Project, Taxable Series 2017B, 6.750%, 9/01/37, 144A (4) | | | |
| 1,000 | | Alabama Industrial Development Authority, Solid Waste Disposal Revenue Bonds, Pine City | 11/20 at 100.00 | B1 | 999,960 |
| | Fiber Co Project, Series 1993, 6.450%, 12/01/23 (AMT) | | | |
| 2,000 | | Alabama Private Colleges and University Facilities Authority, Limited Obligation Bonds, | 9/25 at 100.00 | N/R | 2,076,000 |
| | University of Mobile Project, Series 2015A, 6.000%, 9/01/45, 144A | | | |
| 10,765 | | Hoover Industrial Development Board, Alabama, Environmental Improvement Revenue Bonds, | 10/29 at 100.00 | Caa2 | 9,502,158 |
| | United States Steel Corporation Project, Series 2019, 5.750%, 10/01/49 (AMT) | | | |
| 5,000 | | Jefferson County, Alabama, Sewer Revenue Warrants, Capital Appreciation Subordinate Lien | 10/23 at 105.00 | BB | 4,980,800 |
| | Series 2013F, 0.000%, 10/01/50 (5) | | | |
| 1,000 | | Jefferson County, Alabama, Sewer Revenue Warrants, Senior Lien Series 2013C, 0.000%, | 10/23 at 105.00 | BB+ | 989,890 |
| | 10/01/38 – AGM Insured (5) | | | |
| 2,000 | | Mobile County, Alabama, Limited Obligation Warrants, Gomesa Projects, Series 2020, | 11/29 at 100.00 | N/R | 1,996,860 |
| | 4.000%, 11/01/45, 144A | | | |
| 1,000 | | Tuscaloosa County Industrial Development Authority, Alabama, Gulf Opportunity Zone | 5/29 at 100.00 | N/R | 1,098,330 |
| | Bonds, Hunt Refining Project, Refunding Series 2019A, 5.250%, 5/01/44, 144A | | | |
| 24,160 | | Total Alabama | | | 22,492,646 |
| | Arizona – 2.9% (2.0% of Total Investments) | | | |
| | Arizona Industrial Development Authority, Arizona, Education Revenue Bonds, Arizona | | | |
| | Christian University Project, Series 2019A: | | | |
| 400 | | 5.500%, 10/01/40, 144A | 10/26 at 103.00 | N/R | 402,496 |
| 800 | | 5.625%, 10/01/49, 144A | 10/26 at 103.00 | N/R | 800,784 |
| 5,000 | | Arizona Industrial Development Authority, Arizona, Education Revenue Bonds, Pinecrest | 9/23 at 105.00 | BB+ | 5,553,600 |
| | Academy of Nevada ? Sloan Canyon Campus Project, Series 2020A-2, 6.150%, 9/15/53, 144A | | | |
| 1,000 | | Arizona Industrial Development Authority, Education Facility Revenue Bonds, Caurus | 6/28 at 100.00 | N/R | 1,090,970 |
| | Academy Project, Series 2018A, 6.500%, 6/01/50, 144A | | | |
| 1,000 | | Maricopa County Industrial Development Authority, Arizona, Education Revenue Bonds, | 1/30 at 100.00 | N/R | 1,006,280 |
| | Gateway Academy Project, Series 2019A, 5.750%, 1/01/50, 144A | | | |
| 3,000 | | Phoenix Industrial Development Authority, Arizona, Lease Revenue Bonds, Rowan University | 6/22 at 100.00 | N/R | 3,387,030 |
| | Project, Tender Option Bond Trust 2016-XF2337, 17.301%, 6/01/42, 144A (IF) (6) | | | |
| 435 | | Phoenix Industrial Development Authority, Arizona, Multifamily Housing Revenue Bonds, | 7/24 at 101.00 | N/R | 418,431 |
| | Deer Valley Veterans Assisted Living Project, Series 2016A, 5.125%, 7/01/36 | | | |
| 1,000 | | Pima County Industrial Development Authority, Arizona, Charter School Revenue Bonds, | 5/24 at 100.00 | N/R | 1,087,670 |
| | Desert Heights Charter School, Series 2014, 7.250%, 5/01/44 | | | |
| | Pima County Industrial Development Authority, Arizona, Education Facility Revenue Bonds, | | | |
| | Edkey Charter Schools Project, Refunding Series 2013: | | | |
| 500 | | 6.000%, 7/01/33 | 11/20 at 102.00 | BB– | 510,650 |
| 1,000 | | 6.000%, 7/01/48 | 11/20 at 102.00 | BB– | 1,020,940 |
| 3,000 | | Pima County Industrial Development Authority, Arizona, Education Facility Revenue Bonds, | 7/26 at 103.00 | N/R | 3,006,300 |
| | Edkey Charter Schools Project, Refunding Series 2020, 5.000%, 7/01/49, 144A (WI/DD, | | | |
| | Settling 11/18/20) | | | |
104
| | | | | | |
| Principal | | | Optional Call | | |
| Amount (000) | | Description (1) | Provisions (2) | Ratings (3) | Value |
| | Arizona (continued) | | | |
| $ 100 | | Pima County Industrial Development Authority, Arizona, Education Facility Revenue Bonds, | 11/20 at 102.00 | BB– | $ 102,211 |
| | Edkey Charter Schools Project, Series 2014A, 6.875%, 7/01/34 | | | |
| | Pima County Industrial Development Authority, Arizona, Education Facility Revenue Bonds, | | | |
| | Edkey Charter Schools Project, Series 2016: | | | |
| 245 | | 5.250%, 7/01/36 | 7/26 at 100.00 | BB– | 253,918 |
| 400 | | 5.375%, 7/01/46 | 7/26 at 100.00 | BB– | 408,976 |
| 475 | | 5.500%, 7/01/51 | 7/26 at 100.00 | BB– | 486,690 |
| 1,000 | | Pima County Industrial Development Authority, Arizona, Education Facility Revenue Bonds, | 7/26 at 103.00 | N/R | 1,065,050 |
| | Edkey Charter Schools Project, Series 2019, 5.875%, 7/01/51, 144A | | | |
| 2,000 | | Pima County Industrial Development Authority, Arizona, Education Facility Revenue Bonds, | 2/24 at 100.00 | N/R | 2,275,760 |
| | San Tan Montessori School Project, Series 2014A, 9.000%, 2/01/44 | | | |
| 365 | | Pima County Industrial Development Authority, Arizona, Education Facility Revenue Bonds, | 6/28 at 100.00 | N/R | 370,055 |
| | Synergy Public Charter School Project, Series 2020, 5.000%, 6/15/35, 144A | | | |
| 100 | | Pima County Industrial Development Authority, Arizona, Education Facility Revenue Bonds, | 7/25 at 100.00 | N/R | 100,921 |
| | The Paideia Academies Project, 2019, 5.125%, 7/01/39 | | | |
| 2,500 | | Pima County Industrial Development Authority, Arizona, Education Revenue Bonds, Carden | 1/22 at 100.00 | B– | 2,447,800 |
| | Traditional Schools Project, Series 2012, 7.500%, 1/01/42 | | | |
| 605 | | Pinal County Industrial Development Authority, Arizona, Correctional Facilities Contract | 11/20 at 100.00 | BBB– | 605,702 |
| | Revenue Bonds, Florence West Prison LLC, Series 2002A, 5.250%, 10/01/22 – ACA Insured | | | |
| 1,295 | | Quechan Indian Tribe of the Fort Yuma Reservation, Arizona, Tribal Economic Development | 5/22 at 100.00 | BB– | 1,361,537 |
| | Bonds, Series 2012A, 9.750%, 5/01/25 | | | |
| 2,500 | | Salt Verde Financial Corporation, Arizona, Senior Gas Revenue Bonds, Citigroup Energy | No Opt. Call | Ba3 | 3,524,400 |
| | Inc Prepay Contract Obligations, Series 2007, 5.500%, 12/01/37, 144A | | | |
| 945 | | Yuma County Industrial Development Authority, Arizona, Exempt Revenue Bonds, Far West | 12/20 at 100.00 | N/R | 880,286 |
| | Water & Sewer Inc Refunding, Series 2007A, 6.375%, 12/01/37 (AMT) | | | |
| 29,665 | | Total Arizona | | | 32,168,457 |
| | Arkansas – 0.4% (0.3% of Total Investments) | | | |
| 4,000 | | Arkansas Development Finance Authority, Industrial Development Revenue Bonds, Big River | 9/26 at 103.00 | B | 4,009,960 |
| | Steel Project, Series 2019, 4.500%, 9/01/49 (AMT), 144A | | | |
| | California – 16.2% (11.2% of Total Investments) | | | |
| 18,875 | | Alameda Corridor Transportation Authority, California, Revenue Bonds, Refunding Second | 10/26 at 100.00 | Baa2 | 21,718,141 |
| | Subordinate Lien Series 2016B, 5.000%, 10/01/37 (UB) (6) | | | |
| 2,250 | | California Enterprise Development Authority, Charter School Revenue Bonds, Norton | 7/27 at 102.00 | N/R | 2,308,725 |
| | Science and Language Academy Project, Series 2020, 6.250%, 7/01/58, 144A | | | |
| 1,000 | | California Enterprise Development Authority, Recovery Zone Facility Revenue Bonds, | 4/21 at 100.00 | N/R | 1,007,690 |
| | SunPower Corporation – Headquarters Project, Series 2010, 8.500%, 4/01/31 | | | |
| | California Health Facilities Financing Authority, Refunding Revenue Bonds, Stanford | | | |
| | Hospital and Clinics, Tender Option Bond Trust 2016-XF2353, Formerly Tender Option Bond | | | |
| | Trust 3267: | | | |
| 1,250 | | 18.763%, 11/15/40, 144A (Pre-refunded 11/15/21) (IF) (6) | 11/21 at 100.00 | AA– (7) | 1,511,588 |
| 1,875 | | 19.753%, 11/15/40, 144A (Pre-refunded 11/15/21) (IF) (6) | 11/21 at 100.00 | N/R (7) | 2,286,731 |
| | California Health Facilities Financing Authority, Revenue Bonds, Children’s Hospital Los | | | |
| | Angeles, Series 2017A: | | | |
| 5,165 | | 5.000%, 8/15/42 (UB) (6) | 8/27 at 100.00 | Baa2 | 5,948,221 |
| 22,115 | | 5.000%, 8/15/47 (UB) (6) | 8/27 at 100.00 | Baa2 | 25,275,012 |
| 12,500 | | California Health Facilities Financing Authority, Revenue Bonds, Kaiser Permanente | 11/27 at 100.00 | AA– | 13,927,125 |
| | System, Series 2017A-2, 4.000%, 11/01/44 (UB) (6) | | | |
| | California Health Facilities Financing Authority, Revenue Bonds, Stanford Hospitals and | | | |
| | Clinics, Tender Option Bond Trust 2015-XF0131: | | | |
| 1,000 | | 17.834%, 8/15/51, 144A (IF) (6) | 8/22 at 100.00 | AA | 1,253,660 |
| 250 | | 17.839%, 8/15/51, 144A (IF) (6) | 8/22 at 100.00 | AA | 313,433 |
105
| | |
| NMZ | Nuveen Municipal High Income Opportunity Fund Portfolio of Investments (continued) October 31, 2020 |
| | | | | | |
| Principal | | | Optional Call | | |
| Amount (000) | | Description (1) | Provisions (2) | Ratings (3) | Value |
| | California (continued) | | | |
| $ 1,020 | | California Municipal Finance Authority, Mobile Home Park Revenue Bonds, Caritas | 8/24 at 100.00 | N/R | $ 1,102,079 |
| | Affordable Housing Inc Projects, Series 2014B, 5.875%, 8/15/49 | | | |
| 500 | | California Municipal Finance Authority, Revenue Bonds, California Baptist University, | 11/26 at 100.00 | N/R | 530,795 |
| | Series 2016A, 5.000%, 11/01/36, 144A | | | |
| 7,430 | | California Municipal Finance Authority, Revenue Bonds, Eisenhower Medical Center, | 7/27 at 100.00 | BBB– | 7,881,893 |
| | Refunding Series 2017B, 4.000%, 7/01/42 (UB) (6) | | | |
| 20,925 | | California Municipal Finance Authority, Revenue Bonds, Linxs APM Project, Senior Lien | 6/28 at 100.00 | BBB– | 22,086,965 |
| | Series 2018A, 4.000%, 12/31/47 (AMT) (UB) (6) | | | |
| 2,000 | | California Municipal Finance Authority, Special Facility Revenue Bonds, United Airlines, | No Opt. Call | B+ | 1,991,180 |
| | Inc Los Angeles International Airport Project, Series 2019, 4.000%, 7/15/29 (AMT) | | | |
| 400 | | California Pollution Control Financing Authority, Solid Waste Disposal Revenue Bonds, | No Opt. Call | N/R | 120,000 |
| | Aemerge Redpak Services Southern California, LLC Project, Subordinate Series 2017, 8.000%, | | | |
| | 12/01/27 (AMT), 144A (4) | | | |
| 1,000 | | California Public Finance Authority, Charter School Lease Revenue Bonds, California | 7/28 at 100.00 | N/R | 1,000,000 |
| | Crosspoint Academy Project, Series 2020A, 5.125%, 7/01/55, 144A (WI/DD, Settling 11/10/20) | | | |
| 1,000 | | California School Finance Authority, California, Charter School Revenue Bonds, Alta | 6/28 at 102.00 | N/R | 1,046,640 |
| | Public Schools – Obligated Group, Series 2020A, 6.000%, 6/01/59, 144A | | | |
| | California Statewide Communities Development Authority, California, Revenue Bonds, Loma | | | |
| | Linda University Medical Center, Series 2014A: | | | |
| 800 | | 5.250%, 12/01/44 | 12/24 at 100.00 | BB– | 859,968 |
| 1,000 | | 5.500%, 12/01/54 | 12/24 at 100.00 | BB– | 1,082,140 |
| 6,940 | | California Statewide Communities Development Authority, California, Revenue Bonds, Loma | 6/26 at 100.00 | BB– | 7,636,221 |
| | Linda University Medical Center, Series 2016A, 5.250%, 12/01/56, 144A | | | |
| 500 | | California Statewide Communities Development Authority, Revenue Bonds, Lancer | 6/26 at 100.00 | N/R | 510,955 |
| | Educational Student Housing Project, Refunding Series 2016A, 5.000%, 6/01/46, 144A | | | |
| 1,000 | | California Statewide Communities Development Authority, Special Tax Bonds, Community | 9/22 at 100.00 | N/R | 1,053,050 |
| | Facilities District 2012-01, Fancher Creek, Series 2013A, 5.700%, 9/01/43 | | | |
| 1,530 | | California Statewide Communities Development Authority, Statewide Community | 9/21 at 100.00 | N/R | 1,469,993 |
| | Infrastructure Program Revenue Bonds, Series 2011A, 8.000%, 9/02/41 | | | |
| 500 | | California Statewide Community Development Authority, Revenue Bonds, California Baptist | 11/21 at 100.00 | N/R (7) | 535,405 |
| | University, Series 2011A, 7.500%, 11/01/41 (Pre-refunded 11/01/21) | | | |
| 790 | | California Statewide Community Development Authority, Revenue Bonds, Daughters of | 11/20 at 100.00 | N/R | 726,998 |
| | Charity Health System, Series 2005A, 5.500%, 7/01/39 (4) | | | |
| 1,800 | | Daly City Housing Development Finance Agency, California, Mobile Home Park Revenue Bonds, | 11/20 at 100.00 | N/R | 1,802,214 |
| | Franciscan Mobile Home Park Project, Refunding Third Tier Series 2007C, 6.500%, 12/15/47 | | | |
| 2,000 | | Daly City Housing Development Finance Agency, California, Mobile Home Park Revenue | 11/20 at 100.00 | A+ | 2,005,340 |
| | Bonds, Franciscan Mobile Home Park, Refunding Series 2007A, 5.000%, 12/15/37 | | | |
| | Golden State Tobacco Securitization Corporation, California, Enhanced Tobacco Settlement | | | |
| | Asset-Backed Revenue Bonds, Refunding Series 2015A: | | | |
| 2,000 | | 5.000%, 6/01/40 (UB) (6) | 6/25 at 100.00 | A+ | 2,305,340 |
| 2,000 | | 5.000%, 6/01/45 (UB) (6) | 6/25 at 100.00 | A+ | 2,287,000 |
| 3,500 | | Golden State Tobacco Securitization Corporation, California, Tobacco Settlement | 6/22 at 100.00 | B– | 3,609,445 |
| | Asset-Backed Bonds, Senior Convertible Series 2007A-2, 5.300%, 6/01/37 | | | |
| 5,960 | | Golden State Tobacco Securitization Corporation, California, Tobacco Settlement | 6/22 at 100.00 | N/R | 6,130,575 |
| | Asset-Backed Bonds, Series 2018A-1, 5.000%, 6/01/47 | | | |
| 5,000 | | Golden State Tobacco Securitization Corporation, California, Tobacco Settlement | 6/22 at 100.00 | N/R | 5,143,100 |
| | Asset-Backed Bonds, Series 2018A-2, 5.000%, 6/01/47 | | | |
| 860 | | Golden State Tobacco Securitization Corporation, California, Tobacco Settlement | 6/25 at 100.00 | Aa1 | 1,353,365 |
| | Asset-Backed Bonds, Tender Option Bond Trust 2015-XF1038, 17.278%, 6/01/45, 144A (IF) (6) | | | |
| 1,500 | | Grossmont Healthcare District, California, General Obligation Bonds, Tender Option Bond | 7/21 at 100.00 | N/R | 1,750,275 |
| | Trust 3253, 22.290%, 7/15/40, 144A (IF) (6) | | | |
106
| | | | | | |
| Principal | | | Optional Call | | |
| Amount (000) | | Description (1) | Provisions (2) | Ratings (3) | Value |
| | California (continued) | | | |
| | Hercules Redevelopment Agency, California, Tax Allocation Bonds, Merged Project Area, | | | |
| | Series 2005: | | | |
| $ 1,000 | | 5.000%, 8/01/25 – AMBAC Insured | 11/20 at 100.00 | N/R | $ 1,002,900 |
| 1,000 | | 5.000%, 8/01/35 – AMBAC Insured | 11/20 at 100.00 | N/R | 1,000,690 |
| 390 | | Lee Lake Public Financing Authority, California, Junior Lien Revenue Bonds, Series | 9/23 at 100.00 | N/R | 422,561 |
| | 2013B, 5.250%, 9/01/32 | | | |
| 850 | | Los Angeles County, California, Community Development Commission Headquarters Office | No Opt. Call | N/R | 961,138 |
| | Building, Lease Revenue Bonds, Community Development Properties Los Angeles County Inc, | | | |
| | Tender Option Bond Trust, 18.389%, 9/01/42, 144A (IF) (6) | | | |
| 1,000 | | Lynwood Redevelopment Agency, California, Tax Allocation Revenue Bonds, Project Area A, | 9/21 at 100.00 | A | 1,042,590 |
| | Subordinate Lien Series 2011A, 7.000%, 9/01/31 | | | |
| 1,500 | | March Joint Powers Redevelopment Agency, California, Tax Allocation Revenue Bonds, March | 8/21 at 100.00 | N/R (7) | 1,579,890 |
| | Air Force Base Redevelopment Project, Series 2011A, 7.500%, 8/01/41 (Pre-refunded 8/01/21) | | | |
| 500 | | National City Community Development Commission, California, Tax Allocation Bonds, | 8/21 at 100.00 | A (7) | 525,060 |
| | National City Redevelopment Project, Series 2011, 7.000%, 8/01/32 (Pre-refunded 8/01/21) | | | |
| 330 | | Novato Redevelopment Agency, California, Tax Allocation Bonds, Hamilton Field | 9/21 at 100.00 | A– (7) | 347,698 |
| | Redevelopment Project, Series 2011, 6.750%, 9/01/40 (Pre-refunded 9/01/21) | | | |
| 1,200 | | Riverside County Redevelopment Agency, California, Tax Allocation Bonds, Jurupa Valley | 10/21 at 100.00 | A | 1,270,704 |
| | Project Area, Series 2011B, 6.750%, 10/01/30 | | | |
| 2,015 | | Sacramento City Financing Authority California, Lease Revenue Bonds, Master Lease | No Opt. Call | AA– | 5,187,819 |
| | Program Facilities Projects, Tender Option Bond Trust 2016-XG0100, 18.172%, | | | |
| | 12/01/33, 144A (IF) (6) | | | |
| 750 | | Sacramento City Financing Authority, California, Master Lease Program Facilities | No Opt. Call | AA– | 1,731,030 |
| | Revenue Bonds, Tender Option Bond Trust 2016-XG0067, 18.382%, 12/01/30, 144A (IF) (6) | | | |
| | San Buenaventura, California, Revenue Bonds, Community Memorial Health System, | | | |
| | Series 2011: | | | |
| 960 | | 8.000%, 12/01/26 | 12/21 at 100.00 | BB | 1,020,067 |
| 1,000 | | 8.000%, 12/01/31 | 12/21 at 100.00 | BB | 1,055,230 |
| 4,095 | | San Francisco City and County Redevelopment Agency Successor Agency, California, Tax | 8/21 at 61.78 | N/R | 2,470,964 |
| | Allocation Bonds, Mission Bay South Redevelopment Project, Subordinate Series 2016D, 0.000%, | | | |
| | 8/01/31, 144A | | | |
| 960 | | Santa Margarita Water District, California, Special Tax Bonds, Community Facilities | 9/23 at 100.00 | N/R | 1,043,750 |
| | District 2013-1 Village of Sendero, Series 2013, 5.625%, 9/01/43 | | | |
| 1,065 | | Temecula Public Financing Authority, California, Special Tax Bonds, Community Facilities | 9/27 at 100.00 | N/R | 1,132,127 |
| | District 16-01, Series 2017, 6.250%, 9/01/47, 144A | | | |
| 1,890 | | Tobacco Securitization Authority of Northern California, Tobacco Settlement Asset-Backed | 11/20 at 100.00 | B– | 1,899,431 |
| | Bonds, Series 2005A-1, 5.500%, 6/01/45 | | | |
| 650 | | Twentynine Palms Redevelopment Agency, California, Tax Allocation Bonds, Four Corners | 9/21 at 100.00 | BBB+ (7) | 689,241 |
| | Project Area, Series 2011A, 7.650%, 9/01/42 (Pre-refunded 9/01/21) | | | |
| 1,250 | | University of California, General Revenue Bonds, Tender Option Bond Trust 2016-XL0001, | 5/23 at 100.00 | N/R | 1,770,050 |
| | 17.810%, 5/15/39, 144A (IF) (6) | | | |
| 160,640 | | Total California | | | 177,724,202 |
| | Colorado – 8.1% (5.6% of Total Investments) | | | |
| 500 | | Aviation Station North Metropolitan District 2, Denver County, Colorado, Limited Tax | 9/24 at 103.00 | N/R | 509,985 |
| | General Obligation Bonds, Subordinate Series 2019B, 7.750%, 12/15/48 | | | |
| 1,500 | | Belford North Metropolitan District, Douglas County, Colorado, General Obligation | 12/25 at 103.00 | N/R | 1,502,925 |
| | Limited Tax Bonds, Series 2020A, 5.500%, 12/01/50 | | | |
| 3,275 | | Castle Oaks Metropolitan District 3, Castle Rock, Douglas County, Colorado, General | 12/20 at 103.00 | N/R | 3,385,302 |
| | Obligation Limited Tax Bonds, Refunding Series 2017, 5.000%, 12/01/37 | | | |
| 500 | | Cherry Creek Corporate Center Metropolitan District, Arapahoe County, Colorado, Revenue | 12/21 at 103.00 | N/R | 505,210 |
| | Bonds, Refunding Subordinate Lien Series 2016B, 8.000%, 6/15/37 | | | |
107
| | |
| NMZ | Nuveen Municipal High Income Opportunity Fund Portfolio of Investments (continued) October 31, 2020 |
| | | | | | |
| Principal | | | Optional Call | | |
| Amount (000) | | Description (1) | Provisions (2) | Ratings (3) | Value |
| | Colorado (continued) | | | |
| $ 685 | | Colorado Educational and Cultural Facilities Authority, Charter School Revenue Bonds, | 11/20 at 100.00 | BB+ | $ 686,617 |
| | Community Leadership Academy Project, Series 2008, 6.250%, 7/01/28 | | | |
| 2,140 | | Colorado Educational and Cultural Facilities Authority, Charter School Revenue Bonds, | 10/22 at 100.00 | N/R | 2,220,507 |
| | Mountain Phoenix Community School, Series 2012, 7.000%, 10/01/42 | | | |
| 560 | | Colorado Educational and Cultural Facilities Authority, Charter School Revenue Bonds, | 7/24 at 100.00 | BB | 571,598 |
| | Skyview Academy Project, Series 2014, 5.375%, 7/01/44, 144A | | | |
| 2,500 | | Colorado Health Facilities Authority, Colorado, Revenue Bonds, American Baptist Homes of | 2/24 at 100.00 | N/R | 2,649,600 |
| | the Midwest Obligated Group, Series 2013, 8.000%, 8/01/43 | | | |
| 1,000 | | Colorado Health Facilities Authority, Colorado, Revenue Bonds, American Baptist Homes | 2/26 at 100.00 | N/R | 977,910 |
| | Project, Series 2016, 6.125%, 2/01/46, 144A | | | |
| 1,285 | | Colorado Health Facilities Authority, Colorado, Revenue Bonds, Craig Hospital Project, | 12/22 at 100.00 | A+ | 1,368,512 |
| | Series 2012, 5.000%, 12/01/32 (UB) (6) | | | |
| 518 | | Colorado Housing and Finance Authority, Revenue Bonds, Confluence Energy LLC Project, | No Opt. Call | N/R | 5 |
| | Series 2007, 5.000%, 3/01/21 (4), (8) | | | |
| | Colorado Housing and Finance Authority, Revenue Bonds, Confluence Energy LLC Project, | | | |
| | Series 2017: | | | |
| 4,831 | | 0.000%, 4/01/27 (AMT) (4), (8) | No Opt. Call | N/R | 66,666 |
| 2,130 | | 0.000%, 10/01/27 (AMT) (4), (8) | No Opt. Call | N/R | 29,388 |
| 3,144 | | Colorado International Center Metropolitan District 8, Adams County, Colorado, Limited | 9/25 at 103.00 | N/R | 3,165,411 |
| | Tax General Obligation Bonds, Series 2020, 6.500%, 12/01/50 | | | |
| 2,000 | | Compark Business Campus Metropolitan District, Douglas County, Colorado, General | 12/22 at 100.00 | N/R (7) | 2,256,260 |
| | Obligation Bonds, Series 2012A, 6.750%, 12/01/39 (Pre-refunded 12/01/22) | | | |
| | Confluence Metropolitan District, Colorado, General Obligation Limited Tax Bonds, | | | |
| | Series 2007: | | | |
| 1,000 | | 5.400%, 12/01/27 (4) | 11/20 at 100.00 | N/R | 800,000 |
| 1,500 | | 5.450%, 12/01/34 (4) | 11/20 at 100.00 | N/R | 1,200,000 |
| 1,000 | | Crowfoot Valley Ranch Metropolitan District No 2, Douglas County, Colorado, Limited Tax | 12/23 at 103.00 | N/R | 1,063,200 |
| | General Obligation Bonds, Series 2018A, 5.625%, 12/01/38 | | | |
| 1,000 | | Dacono Urban Renewal Authority, Weld County, Colorado, Tax Increment Revenue Bonds, | 12/25 at 103.00 | N/R | 1,002,350 |
| | Series 2020, 6.250%, 12/01/39 | | | |
| 10,000 | | Denver City and County, Colorado, Airport System Revenue Bonds, Subordinate Lien Series | 12/28 at 100.00 | A | 10,779,300 |
| | 2018A, 4.000%, 12/01/48 (AMT) (UB) (6) | | | |
| 3,000 | | Denver City and County, Colorado, Special Facilities Airport Revenue Bonds, United | 10/23 at 100.00 | B | 3,040,530 |
| | Airlines, Inc Project, Refunding Series 2017, 5.000%, 10/01/32 (AMT) | | | |
| 500 | | Dinosaur Ridge Metropolitan District, Golden, Jefferson County, Colorado, Special | 6/24 at 103.00 | N/R | 505,845 |
| | Revenue Refunding and Improvement Bonds, Series 2019A, 5.000%, 6/01/49 | | | |
| 708 | | Erie Highlands Metropolitan District No 1 (In the Town of Erie), Weld County, Colorado, | 12/20 at 103.00 | N/R | 719,116 |
| | General Obligation Limited Tax Bonds, Series 2015B, 7.750%, 12/15/45 | | | |
| | Foothills Metropolitan District, Fort Collins, Colorado, Special Revenue Bonds, | | | |
| | Series 2014: | | | |
| 1,000 | | 5.750%, 12/01/30 | 12/24 at 100.00 | N/R | 1,041,630 |
| 2,080 | | 6.000%, 12/01/38 | 12/24 at 100.00 | N/R | 2,140,112 |
| 500 | | Fourth Street Crossing Business Improvement District, Silverthorne, Summit County, Colorado, | 6/24 at 103.00 | N/R | 511,865 |
| | Special Revenue and Tax Supported Bonds, Senior Series 2019A, 5.375%, 12/01/49, 144A | | | |
| 1,989 | | Great Western Metropolitan District 5, Colorado, General Obligation Limited Tax Revenue | 11/20 at 100.00 | N/R | 1,656,817 |
| | Bonds, Series 2009A-1, 9.000%, 8/01/39 (4) | | | |
| 2,000 | | Heritage Todd Creek Metropolitan District, Colorado, General Obligation Bonds Limited | 12/24 at 100.00 | N/R | 2,104,560 |
| | Tax, Refunding & Improvement Series 2015, 6.125%, 12/01/44 | | | |
| 993 | | Iliff Commons Metropolitan District 2, Aurora, Arapahoe County, Colorado, General | 12/20 at 103.00 | N/R (7) | 1,027,149 |
| | Obligation Bonds, Limited Tax Convertible to Unlimited Tax Series 2015, 6.250%, 12/01/44 | | | |
| | (Pre-refunded 12/01/20) | | | |
108
| | | | | | |
| Principal | | | Optional Call | | |
| Amount (000) | | Description (1) | Provisions (2) | Ratings (3) | Value |
| | Colorado (continued) | | | |
| $ 305 | | Iliff Commons Metropolitan District 2, Aurora, Arapahoe County, Colorado, General | 12/21 at 103.00 | N/R | $ 311,432 |
| | Obligation Bonds, Subordinated Limited Tax Convertible to Unlimited Tax Series 2016B, | | | |
| | 8.000%, 12/15/46 | | | |
| 2,000 | | Jefferson Center Metropolitan District 1, Arvada, Jefferson County, Colorado, Revenue | 12/20 at 103.00 | N/R (7) | 2,068,140 |
| | Bonds, Refunding Series 2015, 5.500%, 12/01/45 (Pre-refunded 12/01/20) | | | |
| 810 | | Jefferson Center Metropolitan District 1, Arvada, Jefferson County, Colorado, Special | 12/23 at 103.00 | N/R | 828,427 |
| | Revenue Bonds, Subordinate Series 2020B, 5.750%, 12/15/50 | | | |
| | Johnstown Plaza Metropolitan District, Colorado, Special Revenue Bonds, Series 2016A: | | | |
| 675 | | 5.250%, 12/01/36 | 12/21 at 103.00 | N/R | 688,858 |
| 1,265 | | 5.375%, 12/01/46 | 12/21 at 103.00 | N/R | 1,288,314 |
| 1,000 | | Johnstown Village Metropolitan District 2, Weld County, own of Johnstown, Colorado, | 9/25 at 103.00 | N/R | 1,007,340 |
| | General Obligation Limited Tax Bonds, Series 2020A, 5.000%, 12/01/50 | | | |
| 1,700 | | Jones District Community Authority Board, Centennial, Colorado, Special Revenue | 12/25 at 103.00 | N/R | 1,286,543 |
| | Convertible Capital Appreciation Bonds, Series 2020A, 0.000%, 12/01/50 | | | |
| 2,810 | | Kit Carson County Health Service District, Colorado, Health Care Facility Revenue Bonds, | 11/20 at 100.00 | N/R | 2,809,887 |
| | Series 2007, 6.750%, 1/01/34 | | | |
| 500 | | Lanterns Metropolitan District 1, Castle Rock, Douglas County, Colorado, Limited Tax | 9/24 at 103.00 | N/R | 510,065 |
| | General Obligation Bonds, Series 2019A, 5.000%, 12/01/49 | | | |
| 500 | | Larkridge Metropolitan District No 2, In the City of Thornton, Adams County, Colorado, | 12/23 at 103.00 | N/R | 515,170 |
| | General Obligation, Limited Tax Convertible to Unlimited Tax, Improvement Bonds, Refunding | | | |
| | Series 2019, 5.250%, 12/01/48 | | | |
| 1,250 | | Lewis Pointe Metropolitan District, Thornton, Colorado, Limited Tax Convertible to | 12/20 at 100.00 | N/R | 1,250,912 |
| | Unlimited Tax General Obligation Bonds, Series 2015A, 6.000%, 12/01/44 | | | |
| 500 | | Leyden Rock Metropolitan District No 10, In the City of Arvada, Colorado, Limited Tax | 12/21 at 103.00 | N/R | 513,350 |
| | General Obligation Bonds, Refunding and Improvement Series 20016A, 5.000%, 12/01/45 | | | |
| 500 | | Leyden Rock Metropolitan District No 10, In the City of Arvada, Colorado, Limited Tax | 12/21 at 103.00 | N/R | 512,735 |
| | General Obligation Bonds, Refunding and Improvement Series 20016B, 7.250%, 12/15/45 | | | |
| 500 | | Midcities Metropolitan District No 2, In the City and County of Broomfield, Colorado, | 12/21 at 103.00 | N/R | 509,540 |
| | Subordinate Special Revenue Refunding Bonds, Series 2016B, 7.750%, 12/15/46 | | | |
| 2,000 | | Murphy Creek Metropolitan District 3, Aurora, Colorado, General Obligation Bonds, | 11/20 at 100.00 | N/R | 2,000,000 |
| | Refunding & Improvement Series 2006, 6.125%, 12/01/35 (4) | | | |
| 1,000 | | North Range Metropolitan District No 3, 5.250%, 12/01/50 | 12/25 at 103.00 | N/R | 1,000,000 |
| 1,535 | | North Vista Highlands Metropolitan District 3, Pueblo County, Colorado, Limited Tax | 3/25 at 103.00 | N/R | 1,560,665 |
| | General Obligation Bonds, Series 2020, 5.125%, 12/01/49 | | | |
| | Painted Prairie Public Improvement Authority, Aurora, Colorado, Special Revenue Bonds, | | | |
| | Series 2019: | | | |
| 1,500 | | 5.000%, 12/01/39 | 12/24 at 103.00 | N/R | 1,581,225 |
| 5,000 | | 5.000%, 12/01/49 | 12/24 at 103.00 | N/R | 5,202,150 |
| 500 | | Palisade Park West Metropolitan District, Broomfield County, Colorado, Limited Tax | 6/24 at 103.00 | N/R | 509,335 |
| | General Obligation Bonds, Convertible to Unlimited Tax, Series 2019A, 5.125%, 12/01/49 | | | |
| 500 | | Parkdale Community Authority, Erie, Colorado, Limited Tax Supported Revenue Bonds, | 9/25 at 103.00 | N/R | 506,475 |
| | District 1, Series 2020A, 5.250%, 12/01/50 | | | |
| 1,080 | | Promenade at Castle Rock Metropolitan District 1, Colorado, General Obligation Bonds, | 12/20 at 103.00 | N/R | 1,113,577 |
| | Limited Tax Series 2015A, 5.750%, 12/01/39 | | | |
| 500 | | Raindance Metropolitan District 1, Acting by and through its Water Activity Enterprise | 12/25 at 103.00 | N/R | 504,230 |
| | In the Town of Windsor, Weld County, Colorado, Non-Potable Water Enterprise Revenue Bonds, | | | |
| | Series 2020, 5.250%, 12/01/50 | | | |
| | Regional Transportation District, Colorado, Denver Transit Partners Eagle P3 Project | | | |
| | Private Activity Bonds, Series 2010: | | | |
| 1,000 | | 6.500%, 1/15/30 | 11/20 at 100.00 | Baa3 | 1,002,170 |
| 1,000 | | 6.000%, 1/15/41 | 11/20 at 100.00 | Baa3 | 1,001,800 |
| 500 | | Ritoro Metropolitan District In the Town of Elizabeth, Elbert County, Colorado, Limited | 6/24 at 103.00 | N/R | 511,510 |
| | Tax , Convertible to Unlimited Tax, General Obligation Bonds, Series 2019A, 5.000%, 12/01/49 | | | |
109
| | |
| NMZ | Nuveen Municipal High Income Opportunity Fund Portfolio of Investments (continued) October 31, 2020 |
| | | | | | |
| Principal | | | Optional Call | | |
| Amount (000) | | Description (1) | Provisions (2) | Ratings (3) | Value |
| | Colorado (continued) | | | |
| $ 500 | | Riverdale Ranch Metropolitan District, Thornton City, Adams County, Colorado, Limited | 9/24 at 103.00 | N/R | $ 505,730 |
| | Tax General Obligation Bonds, Convertible to Unlimited Tax Series 2019A, 5.000%, 12/01/49 | | | |
| 1,000 | | South Aurora Regional Improvement Authority, Aurora, Colorado, Special Revenue Bonds, | 12/23 at 103.00 | N/R | 1,025,940 |
| | Series 2018, 6.250%, 12/01/57 | | | |
| 3,000 | | Stone Ridge Metropolitan District 2, Colorado, General Obligation Bonds, Limited Tax | 11/20 at 100.00 | N/R | 480,000 |
| | Convertible to Unlimited, Series 2007, 0.000%, 12/01/31 (4) | | | |
| 1,815 | | Three Springs Metropolitan District 3, Durango, La Plata County, Colorado, Property Tax | 12/20 at 100.00 | N/R | 1,816,942 |
| | Supported Revenue Bonds, Series 2010, 7.750%, 12/01/39 | | | |
| 965 | | VDW Metropolitan District 2, Larimer County, Colorado, General Obligation Bonds, | 12/21 at 103.00 | N/R | 994,346 |
| | Refunding Limited Tax Series 2016B, 7.250%, 12/15/45 | | | |
| 1,000 | | Velocity Metropolitan District 3, In the City of Aurora, Colorado, Limited Tax General | 12/23 at 103.00 | N/R | 1,042,320 |
| | Obligation Bonds, Series 2019, 5.375%, 12/01/39 | | | |
| 1,500 | | Velocity Metropolitan District 5, In the City of Aurora, Colorado, Limited Tax General | 12/23 at 81.31 | N/R | 988,560 |
| | Obligation Bonds, Convertible Capital Appreciation Series 2020A-2, 0.000%, 12/01/50 | | | |
| 1,570 | | Velocity Metropolitan District 5, In the City of Aurora, Colorado, Limited Tax General | 12/23 at 103.00 | N/R | 1,548,036 |
| | Obligation Bonds, Series 2020A-1, 5.375%, 12/01/50 | | | |
| 500 | | Village East Community Metropolitan District, Frederick, Weld County, Colorado, Limited | 9/25 at 103.00 | N/R | 509,600 |
| | Tax General Obligation Bonds, Series 2020A, 5.250%, 12/01/50 | | | |
| 1,100 | | Village Metropolitan District In the Town of Avon, Eagle County, Colorado, Special Revenue | 12/25 at 103.00 | N/R | 1,145,947 |
| | and Limited Property Tax Bonds, Refunding & Improvement Series 2020, 5.000%, 12/01/40 | | | |
| 705 | | Windsor Highlands Metropolitan District 9, Windsor, Larimer County, Colorado, Limited | 9/24 at 103.00 | N/R | 710,612 |
| | Tax Supported Revenue Bonds, Series 2019, 5.000%, 12/01/49 | | | |
| 97,923 | | Total Colorado | | | 88,850,253 |
| | Connecticut – 0.1% (0.1% of Total Investments) | | | |
| 500 | | Great Pond Improvement District, Connecticut, Special Obligation Revenue Bonds, Great | 10/26 at 102.00 | N/R | 484,935 |
| | Pond Phase 1 Project, Series 20019, 4.750%, 10/01/48, 144A | | | |
| 6,267 | | Mashantucket Western Pequot Tribe, Connecticut, Special Revenue Bonds, Subordinate | No Opt. Call | N/R | 407,326 |
| | Series 2013A, 0.070%, 7/01/31 (cash 4.000%, PIK 2.050%) (4) | | | |
| 6,767 | | Total Connecticut | | | 892,261 |
| | Delaware – 0.2% (0.2% of Total Investments) | | | |
| 2,500 | | Delaware Economic Development Authority, Revenue Bonds, Odyssey Charter School Inc | 3/25 at 100.00 | N/R | 2,678,150 |
| | Project, Series 2015A, 7.000%, 9/01/45, 144A | | | |
| | District of Columbia – 0.5% (0.3% of Total Investments) | | | |
| 105 | | District of Columbia Tobacco Settlement Corporation, Tobacco Settlement Asset-Backed | No Opt. Call | Baa1 | 115,100 |
| | Bonds, Series 2001, 6.500%, 5/15/33 | | | |
| 2,500 | | District of Columbia, Revenue Bonds, Howard University, Tender Option Bond Trust | 4/21 at 100.00 | A1 (7) | 2,752,000 |
| | 2016-XG0094, 22.661%, 10/01/37, 144A (Pre-refunded 4/01/21) (IF) (6) | | | |
| 250 | | District of Columbia, Revenue Bonds, KIPP DC Issue, Series 2013A, 6.000%, 7/01/33 | 7/23 at 100.00 | N/R (7) | 287,380 |
| | (Pre-refunded 7/01/23) | | | |
| 2,000 | | District of Columbia, Revenue Bonds, Saint Paul on Fourth Street, Inc, Series 2019A, | 5/30 at 100.00 | N/R | 1,809,200 |
| | 5.250%, 5/15/55, 144A | | | |
| 4,855 | | Total District of Columbia | | | 4,963,680 |
| | Florida – 13.7% (9.4% of Total Investments) | | | |
| 500 | | Academical Village Community Development District, Davie, Florida, Special Assessment | 5/30 at 100.00 | N/R | 506,985 |
| | Revenue Bonds, Series 2020, 4.000%, 5/01/51 | | | |
| 1,500 | | Alachua County Health Facilities Authority, Florida, Health Facilities Revenue Bonds, | 11/21 at 100.00 | N/R | 1,467,420 |
| | Terraces at Bonita Springs Project, Series 2011A, 8.125%, 11/15/46 | | | |
| 1,775 | | Ave Maria Stewardship Community District, Florida, Capital Improvement Revenue Bonds, | 5/22 at 100.00 | N/R | 1,865,383 |
| | Series 2012, 6.700%, 5/01/42 | | | |
110
| | | | | | |
| Principal | | | Optional Call | | |
| Amount (000) | | Description (1) | Provisions (2) | Ratings (3) | Value |
| | Florida (continued) | | | |
| $ 1,735 | | Ave Maria Stewardship Community District, Florida, Capital Improvement Revenue Bonds, | 5/25 at 100.00 | N/R | $ 1,786,200 |
| | Series 2015, 5.375%, 5/01/45 | | | |
| 995 | | Babcock Ranch Community Independent Special District, Charlotte County, Florida, Special | 11/25 at 100.00 | N/R | 1,056,819 |
| | Assessment Bonds, Series 2015, 5.250%, 11/01/46 | | | |
| 905 | | Belmont Community Development District, Florida, Capital Improvement Revenue Bonds, | No Opt. Call | N/R | 1,074,968 |
| | Phase 1 Project, Series 2013A, 6.125%, 11/01/33 | | | |
| 1,750 | | Boggy Creek Improvement District, Orlando, Florida, Special Assessment Revenue Bonds, | 5/23 at 100.00 | N/R | 1,796,708 |
| | Refunding Series 2013, 5.125%, 5/01/43 | | | |
| 700 | | Broward County, Florida, Airport Facility Revenue Bonds, Learjet Inc, Series 2000, | 10/20 at 100.00 | Caa3 | 700,000 |
| | 7.500%, 11/01/20 (AMT) | | | |
| 2,500 | | Capital Trust Agency, Florida, Educational Facilities Revenue Bonds, LLT Academy South | 6/25 at 105.00 | N/R | 2,571,525 |
| | Bay Project, Series 2020A, 6.000%, 6/15/55, 144A | | | |
| 3,135 | | Capital Trust Agency, Florida, Revenue Bonds, Provision CARES Proton Therapy Center, | 6/28 at 100.00 | N/R | 1,191,300 |
| | Orlando Project, Series 2018, 7.500%, 6/01/48, 144A | | | |
| 830 | | Capital Trust Agency, Florida, Revenue Bonds, Renaissance Charter School Project, Series | 6/26 at 100.00 | N/R | 876,903 |
| | 2019A, 5.000%, 6/15/39, 144A | | | |
| 1,000 | | Capital Trust Agency, Florida, Revenue Bonds, Tuscan Gardens of Palm Coast Project, | 4/24 at 103.00 | N/R | 547,050 |
| | Series 2017A, 7.000%, 10/01/49, 144A | | | |
| 1,000 | | Capital Trust Agency, Florida, Senior Living Facilities Revenue Bonds, Elim Senior | 8/24 at 103.00 | N/R | 746,360 |
| | Housing, Inc Project, Series 2017, 5.875%, 8/01/52, 144A | | | |
| 955 | | Celebration Pointe Community Development District 1, Alachua County, Florida, Special | 5/24 at 100.00 | N/R | 987,508 |
| | Assessment Revenue Bonds, Series 2014, 5.125%, 5/01/45 | | | |
| 500 | | Charlotte County Industrial Development Authority, Florida, Utility System Revenue | 10/27 at 100.00 | N/R | 545,595 |
| | Bonds, Town & Country Utilities Project, Series 2019, 5.000%, 10/01/49 (AMT), 144A | | | |
| 2,000 | | Collier County Industrial Development Authority, Florida, Continuing Care Community | 5/24 at 100.00 | N/R | 1,547,500 |
| | Revenue Bonds, Arlington of Naples Project, Series 2014A, 0.000%, 5/15/35, 144A (4) | | | |
| 865 | | Cordoba Ranch Community Development District, Hillsborough County, Florida, Special | 11/20 at 100.00 | N/R | 859,282 |
| | Assessment Revenue Bonds, Series 2006, 5.550%, 5/01/37 | | | |
| 1,000 | | Cross Creek North Community Development District, Clay County, Florida, Special | 11/29 at 100.00 | N/R | 1,091,480 |
| | Assessment Bonds, Series 2018, 5.375%, 11/01/50, 144A | | | |
| 1,605 | | Cypress Mill Community Development District, Hillsborough County, Florida, Special | 6/30 at 100.00 | N/R | 1,641,000 |
| | Assessment Bonds, Assessment Area 2, Series 2020, 4.000%, 6/15/40 | | | |
| 700 | | Fishhawk Community Development District IV, Hillsborough County, Florida, Special | 5/23 at 100.00 | N/R | 773,213 |
| | Assessment Revenue Bonds, Series 2013A, 7.000%, 5/01/33 | | | |
| 1,850 | | Florida Development Finance Corporation, Educational Facilities Revenue Bonds, Downtown | 7/24 at 100.00 | N/R | 1,968,974 |
| | Doral Charter Elementary School Project, Series 2014A, 6.500%, 7/01/44 | | | |
| 1,000 | | Florida Development Finance Corporation, Educational Facilities Revenue Bonds, Downtown | 7/27 at 100.00 | N/R | 1,042,840 |
| | Doral Charter Elementary School Project, Series 2017A, 5.750%, 7/01/44, 144A | | | |
| 565 | | Florida Development Finance Corporation, Educational Facilities Revenue Bonds, Florida | 7/26 at 100.00 | N/R | 593,069 |
| | Charter Foundation Inc Projects, Series 2016A, 5.000%, 7/15/46, 144A | | | |
| 1,000 | | Florida Development Finance Corporation, Educational Facilities Revenue Bonds, Miami | 6/24 at 100.00 | N/R | 893,620 |
| | Arts Charter School Projects, Series 2014, 6.000%, 6/15/44, 144A | | | |
| 655 | | Florida Development Finance Corporation, Educational Facilities Revenue Bonds, Pepin | 1/27 at 100.00 | N/R | 659,788 |
| | Academies of Pasco County Inc, Series 2020A, 5.000%, 1/01/50, 144A | | | |
| 2,000 | | Florida Development Finance Corporation, Educational Facilities Revenue Bonds, | 6/21 at 100.00 | N/R (7) | 2,090,960 |
| | Renaissance Charter School, Inc Projects, Series 2011A, 7.625%, 6/15/41 (Pre-refunded 6/15/21) | | | |
| 5,000 | | Florida Development Finance Corporation, Educational Facilities Revenue Bonds, | 6/23 at 100.00 | N/R | 5,611,800 |
| | Renaissance Charter School, Inc Projects, Series 2013A, 8.500%, 6/15/44 | | | |
| 120 | | Florida Development Finance Corporation, Educational Facilities Revenue Bonds, | 9/27 at 100.00 | N/R | 126,916 |
| | Renaissance Charter School, Inc Projects, Series 2020C, 5.000%, 9/15/50, 144A | | | |
111
| | |
| NMZ | Nuveen Municipal High Income Opportunity Fund Portfolio of Investments (continued) October 31, 2020 |
| | | | | | |
| Principal | | | Optional Call | | |
| Amount (000) | | Description (1) | Provisions (2) | Ratings (3) | Value |
| | Florida (continued) | | | |
| | Florida Development Finance Corporation, Florida, Surface Transportation Facility | | | |
| | Revenue Bonds, Virgin Trains USA Passenger Rail Project , Series 2019A: | | | |
| $ 6,405 | | 6.250%, 1/01/49 (AMT) (Mandatory Put 1/01/24), 144A | 11/20 at 104.00 | N/R | $ 5,569,596 |
| 31,170 | | 6.375%, 1/01/49 (AMT) (Mandatory Put 1/01/26), 144A | 11/20 at 105.00 | N/R | 26,761,315 |
| 7,705 | | 6.500%, 1/01/49 (AMT) (Mandatory Put 1/01/29), 144A | 11/20 at 105.00 | N/R | 6,601,721 |
| | FRERC Community Development District, Ocoee, Florida, Special Assessment Bonds, | | | |
| | Series 2020: | | | |
| 2,750 | | 5.375%, 11/01/40 | 11/29 at 100.00 | N/R | 2,800,023 |
| 2,000 | | 5.500%, 11/01/50 | 11/29 at 100.00 | N/R | 2,039,780 |
| 2,500 | | Grand Bay at Doral Community Development District, Miami-Dade County, Florida, Special | 11/22 at 100.00 | N/R | 2,616,150 |
| | Assessment Bonds, Doral Breeze Project Series 2012, 5.500%, 11/01/32 | | | |
| 1,000 | | Grand Bay at Doral Community Development District, Miami-Dade County, Florida, Special | 5/24 at 100.00 | N/R | 1,102,710 |
| | Assessment Improvement Bonds, Assessment Area Two Project, Refunding Series 2014A-2, | | | |
| | 6.500%, 5/01/39 | | | |
| 200 | | Gulfstream Polo Community Development District, Palm Beach County, Florida, Special | 11/29 at 100.00 | N/R | 209,078 |
| | Assessment Bonds, Phase 2 Project, Series 2019, 4.375%, 11/01/49 | | | |
| 1,915 | | Harmony Community Development District, Florida, Capital Improvement Revenue Bonds, | 5/24 at 100.00 | N/R | 1,995,507 |
| | Special Assessment, Refunding Series 2014, 5.250%, 5/01/32 | | | |
| 200 | | Hawkstone Community Development District, Florida, Special Assessment Revenue Bonds, | 11/29 at 100.00 | N/R | 203,818 |
| | Assessment Area 2, Series 2019, 4.000%, 11/01/39 | | | |
| 1,000 | | Lakes by the Bay South Community Development District, Florida, Special Assessment | 11/22 at 100.00 | N/R | 1,050,710 |
| | Bonds, Series 2012, 5.750%, 11/01/42 | | | |
| 625 | | Lakewood Ranch Stewardship District, Florida, Special Assessment Revenue Bonds, Lakewood | 5/25 at 100.00 | N/R | 654,131 |
| | Centre North Project, Series 2015, 4.875%, 5/01/45 | | | |
| 2,000 | | Lee County Industrial Development Authority, Florida, Charter School Revenue Bonds, Lee | 11/20 at 100.00 | BB– | 2,000,780 |
| | County Community Charter Schools, Series 2007A, 5.375%, 6/15/37 | | | |
| 630 | | Lee County Industrial Development Authority, Florida, Healthcare Facilities Revenue | 12/22 at 105.00 | N/R | 624,494 |
| | Bonds, Preserve Project, Series 2017A, 5.750%, 12/01/52, 144A | | | |
| 1,000 | | Magic Place Community Development District, Osceola County, Florida, Special Assessment | 5/30 at 100.00 | N/R | 1,053,640 |
| | Revenue Bonds, Series 2019, 4.500%, 5/01/51 | | | |
| 12,190 | | Miami Beach, Florida, Resort Tax Revenue Bonds, Series 2015, 5.000%, 9/01/45 (UB) (6) | 9/25 at 100.00 | AA– | 13,541,871 |
| 750 | | Miami Dade County Industrial Development Authority, Florida, Educational Facilities Revenue | 7/27 at 100.00 | N/R | 791,123 |
| | Bonds, South Florida Autism Charter School Project, Series 2017, 6.000%, 7/01/47, 144A | | | |
| 2,085 | | Miami World Center Community Development District, Miami-Dade County, Florida, Special | 11/27 at 100.00 | N/R | 2,259,848 |
| | Assessment Bonds, Series 2017, 5.250%, 11/01/49 | | | |
| 1,750 | | Miami-Dade County Industrial Development Authority, Florida, Revenue Bonds, Youth Co-Op | 9/25 at 100.00 | N/R | 1,831,568 |
| | Charter Schools Project, Series 2015A, 6.000%, 9/15/45, 144A | | | |
| 505 | | Mirada Community Development District, Pasco County, Florida, Bond Anticipation Note, | 11/20 at 100.00 | N/R | 505,444 |
| | Assessment Area 3, Series 2019, 4.500%, 5/01/24 | | | |
| 400 | | North Park Isle Community Development District, Plant City, Florida, Special Assessment | 5/29 at 100.00 | N/R | 416,056 |
| | Revenue Bonds, Assessment Area 1, Series 2019, 4.750%, 5/01/50 | | | |
| 930 | | Northern Palm Beach County Improvement District, Florida, Water Control and Improvement | 8/26 at 100.00 | N/R | 1,025,399 |
| | Bonds, Development Unit 53, Series 2015, 5.500%, 8/01/46 | | | |
| | Palm Beach County Health Facilities Authority, Florida, Revenue Bonds, Sinai Residences | | | |
| | of Boca Raton Project, Series 2014A: | | | |
| 620 | | 7.000%, 6/01/29 | 6/22 at 102.00 | N/R | 676,432 |
| 3,110 | | 7.500%, 6/01/49 | 6/22 at 102.00 | N/R | 3,391,455 |
| 500 | | Palm Beach County, Florida, Revenue Bonds, Provident Group – PBAU Properties LLC – Palm | 4/29 at 100.00 | Ba1 | 481,090 |
| | Beach Atlantic University Housing Project, Series 2019A, 5.000%, 4/01/51, 144A | | | |
| 3,385 | | Pine Island Community Development District, Florida, Special Assessment Bonds, Bella | 11/20 at 100.00 | N/R | 3,388,182 |
| | Collina, Series 2004, 5.750%, 5/01/35 | | | |
| 500 | | Portico Community Development District, Lee County, Florida, Special Assessment, | 5/30 at 100.00 | N/R | 500,385 |
| | Improvement Series 2020-2, 4.000%, 5/01/50 | | | |
112
| | | | | | |
| Principal | | | Optional Call | | |
| Amount (000) | | Description (1) | Provisions (2) | Ratings (3) | Value |
| | Florida (continued) | | | |
| $ 1,605 | | Reunion West Community Development District, Florida, Special Assessment Bonds, Series | 5/22 at 100.00 | N/R | $ 1,669,922 |
| | 2004A-1, 6.250%, 5/01/36 | | | |
| 2,500 | | Rolling Oaks Community Development District, Florida, Special Assessment Bonds, Series | 11/27 at 100.00 | N/R | 2,856,475 |
| | 2016, 6.000%, 11/01/47 | | | |
| 1,000 | | Saddle Creek Preserve of Polk County Community Development District, Florida, Special | 6/30 at 100.00 | N/R | 1,016,760 |
| | Assessment Bonds, Series 2020, 4.000%, 6/15/50 | | | |
| 990 | | Shingle Creek Community Development District, Osceola County, Florida, Special | 11/25 at 100.00 | N/R | 1,082,624 |
| | Assessment Revenue Bonds, Series 2015, 5.400%, 11/01/45 | | | |
| 1,540 | | Tolomato Community Development District, Florida, Special Assessment Bonds, Convertible, | 5/22 at 100.00 | N/R | 1,210,009 |
| | Capital Appreciation, Series 2012A-4, 0.000%, 5/01/40 (5) | | | |
| | Tolomato Community Development District, Florida, Special Assessment Bonds, Hope Note, | | | |
| | Series 2007-3: | | | |
| 120 | | 6.375%, 5/01/20 (4) | No Opt. Call | N/R | 1 |
| 1,360 | | 6.650%, 5/01/40 (4) | 11/20 at 100.00 | N/R | 14 |
| 2,845 | | Tolomato Community Development District, Florida, Special Assessment Bonds, Hope Note, | 11/20 at 100.00 | N/R | 28 |
| | Series 2007A-2, 5.250%, 5/01/39 (4) | | | |
| 3,740 | | Tolomato Community Development District, Florida, Special Assessment Bonds, Refunding | 11/20 at 100.00 | N/R | 3,409,122 |
| | Series 2015-1, 0.000%, 5/01/40 (5) | | | |
| 2,300 | | Tolomato Community Development District, Florida, Special Assessment Bonds, Refunding | 11/20 at 100.00 | N/R | 1,615,382 |
| | Series 2015-2, 0.000%, 5/01/40 (5) | | | |
| 2,505 | | Tolomato Community Development District, Florida, Special Assessment Bonds, Refunding | 11/20 at 100.00 | N/R | 25 |
| | Series 2015-3, 6.610%, 5/01/40 (4) | | | |
| 1,230 | | Touchstone Community Development District, Hillsborough County, Florida, Special | 12/29 at 100.00 | N/R | 1,290,467 |
| | Assessment Bonds, 2019 Project, Series 2019, 4.000%, 12/15/40 | | | |
| | Turtle Run Community Development District, Florida, Special Assessment Benefit Tax | | | |
| | Bonds, Series 2017-2: | | | |
| 1,000 | | 5.000%, 5/01/37 | 5/28 at 100.00 | A2 | 1,140,950 |
| 2,020 | | 5.000%, 5/01/47 | 5/28 at 100.00 | A2 | 2,286,842 |
| 2,260 | | Tuscaloosa County Industrial Development Authority, Alabama, Gulf Opportunity Zone | 5/29 at 100.00 | N/R | 2,414,539 |
| | Bonds, Hunt Refining Project, Refunding Series 2019A, 4.500%, 5/01/32, 144A | | | |
| 1,960 | | Twin Creeks North Community Development District, Florida, Special Assessment Bonds, | 11/31 at 100.00 | N/R | 2,191,084 |
| | Master Infrastructure Improvements, Series 2016A-1, 6.375%, 11/01/47 | | | |
| 3,645 | | Twin Creeks North Community Development District, Florida, Special Assessment Bonds, | 11/31 at 100.00 | N/R | 4,074,746 |
| | Master Infrastructure Improvements, Series 2016A-2, 6.375%, 11/01/47 | | | |
| 500 | | Two Lakes Community Development District, Hialeah, Florida, Special Assessment Bonds, | 12/29 at 100.00 | N/R | 512,670 |
| | Expansion Area Project, Series 2019, 4.000%, 12/15/49 | | | |
| 1,000 | | Venetian Parc Community Development District, Miami-Dade County, Florida, Special | 11/28 at 100.00 | N/R | 1,295,790 |
| | Assessment Bonds, Area One Project, Series 2013, 6.500%, 11/01/43 | | | |
| 975 | | Waterset North Community Development District, Hillsborough County, Florida, Special | 11/24 at 100.00 | N/R | 1,031,813 |
| | Assessment Revenue Bonds, Series 2014, 5.500%, 11/01/45 | | | |
| 161,060 | | Total Florida | | | 149,812,735 |
| | Georgia – 0.7% (0.5% of Total Investments) | | | |
| 1,000 | | Atlanta Urban Residential Finance Authority, Georgia, Multifamily Housing Revenue Bonds, | 11/23 at 100.00 | BB+ | 985,180 |
| | Testletree Village Apartments, Series 2013A, 5.000%, 11/01/48 | | | |
| 1,167 | | Clayton County Development Authority, Georgia, Special Facilities Revenue Bonds, Delta | 11/20 at 100.00 | B+ | 1,170,993 |
| | Air Lines, Inc Project, Series 2009A, 8.750%, 6/01/29 | | | |
| 1,880 | | Douglas County Development Authority, Georgia, Charter School Revenue Bonds, Brighten | 10/23 at 100.00 | N/R | 1,989,999 |
| | Academy Project, Series 2013A, 7.125%, 10/01/43 | | | |
| 1,000 | | Fulton County Development Authority, Georgia, Revenue Bonds, Amana Academy Project, | 4/23 at 100.00 | N/R (7) | 1,142,570 |
| | Series 2013A, 6.500%, 4/01/43 (Pre-refunded 4/01/23) | | | |
113
| | |
| NMZ | Nuveen Municipal High Income Opportunity Fund Portfolio of Investments (continued) October 31, 2020 |
| | | | | | |
| Principal | | | Optional Call | | |
| Amount (000) | | Description (1) | Provisions (2) | Ratings (3) | Value |
| | Georgia (continued) | | | |
| | Liberty County Industrial Authority, Georgia, Revenue Bonds, Series 2014: | | | |
| $ 250 | | 5.500%, 7/15/23 (Pre-refunded 7/15/21) | 7/21 at 100.00 | N/R (7) | $ 257,593 |
| 767 | | 5.500%, 7/15/30 (Pre-refunded 7/15/21) | 7/21 at 100.00 | N/R (7) | 794,627 |
| 841 | | 5.500%, 1/15/36 (Pre-refunded 7/15/21) | 7/21 at 100.00 | N/R (7) | 872,362 |
| 6,905 | | Total Georgia | | | 7,213,324 |
| | Guam – 0.0% (0.0% of Total Investments) | | | |
| 330 | | Guam International Airport Authority, Revenue Bonds, Series 2013C, 6.375%, | 10/23 at 100.00 | BB+ | 354,272 |
| | 10/01/43 (AMT) | | | |
| | Idaho – 0.1% (0.1% of Total Investments) | | | |
| 500 | | Idaho Health Facilities Authority, Revenue Bonds, Saint Luke’s Health System Project, | 3/22 at 100.00 | AA– | 561,515 |
| | Tender Option Bond Trust 2016-XG0066, 16.697%, 3/01/47, 144A (IF) (6) | | | |
| 565 | | Idaho Housing and Finance Association NonProfit Facilities Revenue Bonds, Gem Prep | 7/25 at 100.00 | N/R | 561,384 |
| | Meridian North LLC, Series 2020A, 5.250%, 7/01/55, 144A | | | |
| 1,065 | | Total Idaho | | | 1,122,899 |
| | Illinois – 26.3% (18.1% of Total Investments) | | | |
| 536 | | Bolingbrook, Illinois, Sales Tax Revenue Bonds, Series 2005, 6.250%, 1/01/24 | 11/20 at 100.00 | N/R | 503,417 |
| 10,670 | | Chicago Board of Education, Illinois, Dedicated Capital Improvement Tax Revenue Bonds, | 4/27 at 100.00 | A– | 12,259,403 |
| | Series 2016, 6.000%, 4/01/46 (UB) (6) | | | |
| 1,500 | | Chicago Board of Education, Illinois, General Obligation Bonds, Dedicated Revenues, | 12/24 at 100.00 | BB– | 1,579,575 |
| | Project Series 2015C, 5.250%, 12/01/39 | | | |
| 1,000 | | Chicago Board of Education, Illinois, General Obligation Bonds, Dedicated Revenues, | 12/20 at 100.00 | B1 | 1,001,100 |
| | Refunding Series 2010F, 5.000%, 12/01/31 | | | |
| 15,385 | | Chicago Board of Education, Illinois, General Obligation Bonds, Dedicated Revenues, | 12/25 at 100.00 | BB– | 18,133,376 |
| | Series 2016A, 7.000%, 12/01/44 | | | |
| 2,025 | | Chicago Board of Education, Illinois, General Obligation Bonds, Dedicated Revenues, | 12/26 at 100.00 | BB– | 2,366,334 |
| | Series 2016B, 6.500%, 12/01/46 | | | |
| 9,910 | | Chicago Board of Education, Illinois, General Obligation Bonds, Dedicated Revenues, | 12/27 at 100.00 | BB– | 12,249,553 |
| | Series 2017A, 7.000%, 12/01/46, 144A | | | |
| 3,000 | | Chicago Greater Metropolitan Water Reclamation District, Illinois, General Obligation | 12/24 at 100.00 | AA+ | 3,422,400 |
| | Bonds, Capital Improvement, Green 2014 Series 2015A, 5.000%, 12/01/44 (UB) (6) | | | |
| 7,500 | | Chicago Transit Authority, Illinois, Sales Tax Receipts Revenue Bonds, Series 2011, | 12/21 at 100.00 | A3 (7) | 7,905,000 |
| | 5.250%, 12/01/40 (Pre-refunded 12/01/21) (UB) (6) | | | |
| 1,413 | | Chicago, Illinois, Certificates of Participation Tax Increment Bonds, 35th and State | 11/20 at 100.00 | N/R | 1,412,889 |
| | Redevelopment Project, Series 2012, 6.100%, 1/15/29 | | | |
| 2,274 | | Chicago, Illinois, Certificates of Participation, Tax Increment Allocation Revenue | 11/20 at 100.00 | N/R | 1,635,096 |
| | Bonds, Diversey-Narragansett Project, Series 2006, 7.460%, 2/15/26 (4) | | | |
| 5,000 | | Chicago, Illinois, General Airport Revenue Bonds, O’Hare International Airport, | 1/29 at 100.00 | A | 5,422,050 |
| | Refunding Senior Lien Series 2018A, 4.000%, 1/01/43 (AMT) (UB) (6) | | | |
| 30,500 | | Chicago, Illinois, General Airport Revenue Bonds, O’Hare International Airport, Senior | 1/29 at 100.00 | A | 35,735,630 |
| | Lien Series 2018B, 5.000%, 1/01/48 (UB) (6) | | | |
| 2,000 | | Chicago, Illinois, General Obligation Bonds, Project & Refunding Series 2014A, | 1/24 at 100.00 | Ba1 | 2,070,740 |
| | 5.250%, 1/01/30 | | | |
| 9,400 | | Chicago, Illinois, General Obligation Bonds, Project & Refunding Series 2017A, | 1/27 at 100.00 | BBB– | 10,288,206 |
| | 6.000%, 1/01/38 | | | |
| 1,000 | | Chicago, Illinois, General Obligation Bonds, Project and Refunding Series 2005D, | 1/25 at 100.00 | Ba1 | 1,040,890 |
| | 5.500%, 1/01/37 | | | |
| 130 | | Chicago, Illinois, General Obligation Bonds, Refunding Series 2016C, 5.000%, 1/01/38 | 1/26 at 100.00 | BBB– | 133,137 |
| | Chicago, Illinois, General Obligation Bonds, Series 2019A: | | | |
| 7,500 | | 5.000%, 1/01/44 (UB) (6) | 1/29 at 100.00 | BBB– | 7,579,650 |
| 8,000 | | 5.500%, 1/01/49 (UB) (6) | 1/29 at 100.00 | BBB– | 8,472,400 |
114
| | | | | | |
| Principal | | | Optional Call | | |
| Amount (000) | | Description (1) | Provisions (2) | Ratings (3) | Value |
| | Illinois (continued) | | | |
| $ 1,500 | | Chicago, Illinois, General Obligation Bonds, Variable Rate Demand Series 2007F, | 1/25 at 100.00 | Ba1 | $ 1,555,410 |
| | 5.500%, 1/01/42 | | | |
| 5,000 | | Illinois Finance Authority Revenue Bonds, Ness Healthcare NFP, Series 2016A, 6.375%, | 11/26 at 100.00 | N/R | 3,724,950 |
| | 11/01/46, 144A (4) | | | |
| | Illinois Finance Authority, Revenue Bonds, Ascension Health/fkaPresence Health Network, | | | |
| | Series 2016C: | | | |
| 25 | | 4.000%, 2/15/41 (Pre-refunded 2/15/27) (UB) | 2/27 at 100.00 | N/R (7) | 30,251 |
| 495 | | 4.000%, 2/15/41 (Pre-refunded 2/15/27) (UB) | 2/27 at 100.00 | N/R (7) | 598,965 |
| 10,655 | | 4.000%, 2/15/41 (UB) | 2/27 at 100.00 | Aa2 | 11,725,295 |
| 1,000 | | Illinois Finance Authority, Revenue Bonds, Lake Forest College, Series 2012A, | 10/22 at 100.00 | BBB– | 1,030,310 |
| | 6.000%, 10/01/48 | | | |
| 5,000 | | Illinois Finance Authority, Revenue Bonds, Northwestern Memorial Healthcare, Series | 1/28 at 100.00 | Aa2 | 5,498,050 |
| | 2017A, 4.000%, 7/15/47 (UB) (6) | | | |
| 2,000 | | Illinois Finance Authority, Revenue Bonds, Roosevelt University, Series 2018B, 6.125%, | 10/28 at 100.50 | N/R | 2,032,020 |
| | 4/01/58, 144A | | | |
| | Illinois Finance Authority, Revenue Bonds, The Carle Foundation, Tender Option Bond | | | |
| | Trust 2015-XF0121: | | | |
| 1,685 | | 21.494%, 8/15/41, 144A (IF) (6) | 8/21 at 100.00 | AA | 1,916,233 |
| 250 | | 21.509%, 8/15/41, 144A (IF) (6) | 8/21 at 100.00 | AA | 284,332 |
| 5,000 | | Illinois Finance Authority, Revenue Bonds, The University of Chicago Medical Center, | 2/27 at 100.00 | AA– | 5,476,300 |
| | Series 2016B, 4.000%, 8/15/41 (UB) (6) | | | |
| 1,715 | | Illinois State, General Obligation Bonds, May Series 2020, 5.750%, 5/01/45 | 5/30 at 100.00 | BBB– | 1,900,512 |
| | Illinois State, General Obligation Bonds, November Series 2016: | | | |
| 1,000 | | 5.000%, 11/01/35 | 11/26 at 100.00 | BBB– | 1,041,920 |
| 1,000 | | 5.000%, 11/01/37 | 11/26 at 100.00 | BBB– | 1,036,400 |
| 9,945 | | Illinois State, General Obligation Bonds, November Series 2017D, 5.000%, | No Opt. Call | BBB– | 10,792,911 |
| | 11/01/27 (UB) (6) | | | |
| 630 | | Illinois State, General Obligation Bonds, Series 2012A, 5.000%, 3/01/36 | 3/22 at 100.00 | BBB– | 639,292 |
| 5,445 | | Illinois State, Sales Tax Revenue Bonds, Build Illinois, Refunding Junior Obligation | 6/26 at 100.00 | BBB | 5,705,434 |
| | September Series 2016C, 4.000%, 6/15/31 (UB) (6) | | | |
| 2,000 | | Lombard Public Facilities Corporation, Illinois, Conference Center and Hotel Revenue | 3/28 at 100.00 | N/R | 1,862,980 |
| | Bonds, First Tier Series 2005A-2, 5.500%, 1/01/36, 144A (4) | | | |
| | Metropolitan Pier and Exposition Authority, Illinois, McCormick Place Expansion Project | | | |
| | Bonds, Refunding Series 2020A: | | | |
| 16,000 | | 4.000%, 6/15/50 | 12/29 at 100.00 | BB+ | 16,089,600 |
| 45,550 | | 4.000%, 6/15/50 (UB) (6) | 12/29 at 100.00 | BB+ | 45,805,080 |
| 2,500 | | 5.000%, 6/15/50 | 12/29 at 100.00 | BB+ | 2,748,075 |
| 800 | | Railsplitter Tobacco Settlement Authority, Illinois, Tobacco Settlement Revenue Bonds, | 6/21 at 100.00 | N/R (7) | 826,632 |
| | Series 2010, 6.000%, 6/01/28 (Pre-refunded 6/01/21) | | | |
| 870 | | Rantoul, Champaign County, Illinois, Tax Increment Revenue Bonds, Evans Road Series | 12/23 at 100.00 | N/R | 879,004 |
| | 2013B, 7.000%, 12/01/33 | | | |
| | Sales Tax Securitization Corporation, Illinois, Sales Tax Securitization Bonds, | | | |
| | Series 2018C: | | | |
| 9,875 | | 5.000%, 1/01/36 (UB) (6) | 1/29 at 100.00 | AA– | 11,626,430 |
| 17,750 | | 5.250%, 1/01/48 (UB) (6) | 1/29 at 100.00 | AA– | 20,611,655 |
| 895 | | Yorkville United City Business District, Illinois, Storm Water and Water Improvement | 11/20 at 100.00 | N/R | 366,950 |
| | Project Revenue Bonds, Series 2007, 4.800%, 1/01/26 (4) | | | |
| 267,328 | | Total Illinois | | | 289,015,837 |
| | Indiana – 1.2% (0.8% of Total Investments) | | | |
| 2,810 | | Carmel Redevelopment District, Indiana, Tax Increment Revenue Bonds, Series 2004A, | 11/20 at 100.00 | N/R | 2,833,969 |
| | 6.650%, 7/15/24 | | | |
| 1,000 | | Indiana Bond Bank, Special Program Bonds, Hendricks Regional Health Project, Tender | No Opt. Call | AA | 2,358,070 |
| | Option Bond Trust 2016-XL0019, 18.286%, 4/01/30, 144A (IF) (6) | | | |
115
| | |
| NMZ | Nuveen Municipal High Income Opportunity Fund Portfolio of Investments (continued) October 31, 2020 |
| | | | | | |
| Principal | | | Optional Call | | |
| Amount (000) | | Description (1) | Provisions (2) | Ratings (3) | Value |
| | Indiana (continued) | | | |
| $ 1,000 | | Indiana Finance Authority, Educational Facilities Revenue Bonds, Discovery Charter | 12/25 at 100.00 | BB– | $ 1,080,230 |
| | School Project, Series 2015A, 7.250%, 12/01/45 | | | |
| 2,000 | | Indiana Finance Authority, Environmental Improvement Revenue Bonds, United States Steel | 8/22 at 100.00 | Caa2 | 1,802,800 |
| | Corporation Project, Series 2012, 5.750%, 8/01/42 (AMT) | | | |
| 500 | | Indiana Finance Authority, Hospital Revenue Bonds, King’s Daughters’ Hospital and Health | 11/20 at 100.00 | Baa2 | 500,860 |
| | Services, Series 2010, 5.500%, 8/15/45 | | | |
| 1,290 | | Indiana Finance Authority, Revenue Bonds, Trinity Health Care Group Revenue Bonds, Tender | 12/20 at 100.00 | AA– (7) | 1,309,247 |
| | Option Bond Trust 2015-XF0106, 17.528%, 12/01/37, 144A (Pre-refunded 12/01/20) (IF) (6) | | | |
| 895 | | Saint Joseph County, Indiana, Economic Development Revenue Bonds, Chicago Trail Village | 11/20 at 100.00 | N/R | 897,846 |
| | Apartments, Series 2005A, 7.500%, 7/01/35 | | | |
| 1,000 | | Shoals, Indiana, Exempt Facilities Revenue Bonds, National Gypsum Company Project, | 11/23 at 100.00 | N/R | 1,053,340 |
| | Series 2013, 7.250%, 11/01/43 (AMT) | | | |
| 1,375 | | Terre Haute, Indiana, Economic Development Solid Waste Facility Revenue Bonds, Pyrolyx | No Opt. Call | N/R | 1,244,485 |
| | USA Indiana, LLC Project, Series 2017A, 7.250%, 12/01/28 (AMT) | | | |
| 11,870 | | Total Indiana | | | 13,080,847 |
| | Iowa – 0.6% (0.4% of Total Investments) | | | |
| 1,030 | | Iowa Finance Authority, Iowa, Midwestern Disaster Area Revenue Bonds, Alcoa Inc Project, | 8/22 at 100.00 | Ba3 | 1,048,756 |
| | Series 2012, 4.750%, 8/01/42 | | | |
| 2,000 | | Iowa Finance Authority, Iowa, Midwestern Disaster Area Revenue Bonds, Iowa Fertilizer | 12/23 at 100.00 | B | 2,129,480 |
| | Company Project, Series 2013, 5.250%, 12/01/25 | | | |
| | Iowa Tobacco Settlement Authority, Asset Backed Settlement Revenue Bonds, Series 2005C: | | | |
| 1,000 | | 5.375%, 6/01/38 | 11/20 at 100.00 | B– | 1,013,690 |
| 2,900 | | 5.625%, 6/01/46 | 11/20 at 100.00 | B– | 2,939,701 |
| 6,930 | | Total Iowa | | | 7,131,627 |
| | Kansas – 0.6% (0.4% of Total Investments) | | | |
| 5,305 | | University of Kansas Hospital Authority, Health Facilities Revenue Bonds, KU Health | 9/25 at 100.00 | AA– | 6,032,846 |
| | System, Refunding & Improvement Series 2015, 5.000%, 9/01/45 (UB) (6) | | | |
| 1,000 | | Wyandotte County-Kansas City Unified Government, Kansas, Sales Tax Special Obligation | 9/25 at 100.00 | N/R | 906,400 |
| | Bonds, Vacation Village Project Area 1 and 2A, Series 2015, 5.750%, 9/01/32 | | | |
| 6,305 | | Total Kansas | | | 6,939,246 |
| | Kentucky – 5.7% (3.9% of Total Investments) | | | |
| | Kentucky Economic Development Finance Authority, Hospital Revenue Bonds, Owensboro | | | |
| | Health, Refunding Series 2017A: | | | |
| 5,450 | | 5.000%, 6/01/41 | 6/27 at 100.00 | BB+ | 5,936,794 |
| 3,300 | | 5.000%, 6/01/45 | 6/27 at 100.00 | BB+ | 3,543,144 |
| 12,665 | | 5.000%, 6/01/45 (UB) (6) | 6/27 at 100.00 | BB+ | 13,598,157 |
| | Kentucky Economic Development Finance Authority, Revenue Bonds, Next Generation Kentucky | | | |
| | Information Highway Project, Senior Series 2015A: | | | |
| 11,000 | | 5.000%, 7/01/37 (UB) | 7/25 at 100.00 | Baa2 | 11,784,190 |
| 9,295 | | 5.000%, 7/01/40 (UB) | 7/25 at 100.00 | Baa2 | 9,905,775 |
| 16,800 | | 5.000%, 1/01/45 (UB) | 7/25 at 100.00 | Baa2 | 17,772,720 |
| 58,510 | | Total Kentucky | | | 62,540,780 |
| | Louisiana – 1.1% (0.7% of Total Investments) | | | |
| 2,050 | | Ascension Parish Industrial development Board, Louisiana, Revenue Bonds, Impala | 7/23 at 100.00 | N/R | 2,117,342 |
| | Warehousing (US) LLC Project, Series 2013, 6.000%, 7/01/36 | | | |
| 500 | | Louisiana Public Facilities Authority, Louisiana, Revenue Bonds, Lake Charles College | 6/27 at 100.00 | N/R | 496,625 |
| | Prep Project, Series 2019A, 5.000%, 6/01/58, 144A | | | |
| 500 | | Louisiana Public Facilities Authority, Louisiana, Revenue Bonds, Young Audiences Charter | 4/27 at 100.00 | N/R | 481,345 |
| | School, Series 2019A, 5.000%, 4/01/57, 144A | | | |
| 1,910 | | Louisiana Public Facilities Authority, Dock and Wharf Revenue Bonds, Impala Warehousing | 7/23 at 100.00 | N/R | 1,993,945 |
| | (US) LLC Project, Series 2013, 6.500%, 7/01/36 (AMT), 144A | | | |
116
| | | | | | |
| Principal | | | Optional Call | | |
| Amount (000) | | Description (1) | Provisions (2) | Ratings (3) | Value |
| | Louisiana (continued) | | | |
| $ 1,660 | | Louisiana Public Facilities Authority, Revenue Bonds, Lake Charles Charter Academy | 12/21 at 100.00 | N/R | $ 1,733,704 |
| | Foundation Project, Series 2011A, 7.750%, 12/15/31 | | | |
| 2,000 | | Louisiana Public Facilities Authority, Revenue Bonds, Loyola University Project, | No Opt. Call | BBB | 1,933,440 |
| | Refunding Series 2017, 0.000%, 10/01/33 (5) | | | |
| 2,110 | | Louisiana Public Facilities Authority, Revenue Bonds, Southwest Louisiana Charter | 12/23 at 100.00 | N/R | 2,252,594 |
| | Academy Foundation Project, Series 2013A, 8.125%, 12/15/33 | | | |
| 2,000 | | Louisiana Public Facilities Authority, Solid Waste Disposal Facility Revenue Bonds, | No Opt. Call | N/R | 20 |
| | Louisiana Pellets Inc Project, Series 2015, 7.000%, 7/01/24 (AMT), 144A (4) | | | |
| 540 | | Saint James Parish, Louisiana, Revenue Bonds, NuStar Logistics, LP Project, Series 2010, | 6/30 at 100.00 | BB– | 640,127 |
| | 6.350%, 7/01/40, 144A | | | |
| 13,270 | | Total Louisiana | | | 11,649,142 |
| | Maryland – 0.6% (0.4% of Total Investments) | | | |
| 3,000 | | Maryland Economic Development Corporation, Port Facilities Revenue Bonds, CNX Marine | 11/20 at 100.00 | BB– | 3,007,590 |
| | Terminals Inc Port of Baltimore Facility, Refunding Series 2010, 5.750%, 9/01/25 | | | |
| 4,000 | | Maryland Economic Development Corporation, Revenue Bonds, Chesapeake Bay Hyatt | 11/20 at 100.00 | N/R | 2,400,000 |
| | Conference Center, Series 2006A, 0.000%, 12/01/31 (4) | | | |
| 2,500 | | Maryland Economic Development Corporation, Revenue Bonds, Chesapeake Bay Hyatt | 11/20 at 100.00 | N/R | 1,500,000 |
| | Conference Center, Series 2006B, 0.000%, 12/01/31 (4) | | | |
| 9,500 | | Total Maryland | | | 6,907,590 |
| | Massachusetts – 1.4% (0.9% of Total Investments) | | | |
| 5,735 | | Massachusetts Educational Financing Authority, Education Loan Revenue Bonds, Issue K, | 7/26 at 100.00 | A | 5,978,967 |
| | Series 2017B, 4.250%, 7/01/46 (AMT) (UB) (6) | | | |
| 5,000 | | Massachusetts State, General Obligation Bonds, Consolidated Loan, Series 2016A, 5.000%, | 3/24 at 100.00 | AA | 5,663,050 |
| | 3/01/46 (UB) (6) | | | |
| 2,985 | | Massachusetts State, General Obligation Bonds, Consolidated Loan, Series 2016E, 4.000%, | 4/25 at 100.00 | AA | 3,374,572 |
| | 4/01/33 (UB) (6) | | | |
| 13,720 | | Total Massachusetts | | | 15,016,589 |
| | Michigan – 1.7% (1.2% of Total Investments) | | | |
| | Detroit Local Development Finance Authority, Michigan, Tax Increment Bonds, | | | |
| | Series 1998A: | | | |
| 5 | | 5.500%, 5/01/21 – ACA Insured | 11/20 at 100.00 | B– | 5,007 |
| 170 | | 5.500%, 5/01/21 | 11/20 at 100.00 | B– | 168,133 |
| 88 | | Detroit, Michigan, General Obligation Bonds, Series 2003A, 5.250%, 4/01/22 | 11/20 at 100.00 | N/R | 87,710 |
| 900 | | Michigan Finance Authority, Public School Academy Limited Obligation Revenue Bonds, Hope | 4/21 at 100.00 | B | 816,912 |
| | Academy Project, Series 2011, 8.125%, 4/01/41 | | | |
| 1,235 | | Michigan Finance Authority, Public School Academy Limited Obligation Revenue Bonds, | 7/27 at 100.00 | N/R | 1,063,446 |
| | Voyageur Academy Project, Refunding Series 2017 Private Placement of 2017, 5.900%, | | | |
| | 7/15/46, 144A | | | |
| | Michigan Housing Development Authority, Rental Housing Revenue Bonds, Series 2015A: | | | |
| 2,225 | | 4.350%, 10/01/45 (UB) (6) | 10/24 at 100.00 | AA | 2,357,276 |
| 4,500 | | 4.600%, 4/01/52 (UB) (6) | 10/24 at 100.00 | AA | 4,794,255 |
| 1,565 | | Michigan Public Educational Facilities Authority, Charter School Revenue Bonds, American | 11/20 at 100.00 | N/R | 1,566,456 |
| | Montessori Academy, Series 2007, 6.500%, 12/01/37 | | | |
| 1,000 | | Michigan Public Educational Facilities Authority, Limited Obligation Revenue Bonds, | 11/20 at 100.00 | BBB– | 1,001,800 |
| | Chandler Park Academy Project, Series 2008, 6.500%, 11/01/35 | | | |
| 1,000 | | Michigan Public Educational Facilities Authority, Limited Obligation Revenue Bonds, | 11/20 at 100.00 | BBB– | 1,000,490 |
| | Richfield Public School Academy, Series 2007, 5.000%, 9/01/36 | | | |
| 775 | | Michigan Public Educational Facilities Authority, Limited Obligation Revenue Bonds, | 11/20 at 100.00 | N/R | 775,178 |
| | David Ellis Academy-West Charter School Project, Series 2007, 5.875%, 6/01/37 | | | |
| 100,000 | | Michigan Tobacco Settlement Finance Authority, Tobacco Settlement Asset-Backed Revenue | 6/33 at 11.41 | N/R | 4,650,000 |
| | Bonds, Capital Appreciation Turbo Term Series 2008C, 0.000%, 6/01/58 | | | |
117
| | |
| NMZ | Nuveen Municipal High Income Opportunity Fund Portfolio of Investments (continued) October 31, 2020 |
| | | | | | |
| Principal | | | Optional Call | | |
| Amount (000) | | Description (1) | Provisions (2) | Ratings (3) | Value |
| | Michigan (continued) | | | |
| $ 500 | | Summit Academy, Michigan, Revenue Bonds, Public School Academy Series 2005, | 11/20 at 100.00 | B+ | $ 500,335 |
| | 6.375%, 11/01/35 | | | |
| 113,963 | | Total Michigan | | | 18,786,998 |
| | Minnesota – 0.7% (0.5% of Total Investments) | | | |
| 665 | | Brooklyn Park, Minnesota, Charter School Lease Revenue Bonds, Athlos Leadership Academy | 7/25 at 100.00 | N/R | 693,774 |
| | Project, Series 2015A, 5.500%, 7/01/35 | | | |
| 1,000 | | Columbus, Minnesota, Charter School Lease Revenue Bonds, New Millennium Academy Project, | 7/25 at 100.00 | B | 989,750 |
| | Series 2015A, 6.000%, 7/01/45 | | | |
| 505 | | Greenwood, Minnesota, Charter School Lease Revenue Bonds, Main Street School of | 7/26 at 100.00 | N/R | 512,671 |
| | Performing Arts Project, Series 2016A, 5.000%, 7/01/47 | | | |
| 100 | | Minneapolis, Minnesota, Charter School Lease Revenue Bonds, Northeast College Prep | 7/30 at 100.00 | N/R | 102,224 |
| | Project, Series 2020A, 5.000%, 7/01/55 | | | |
| 2,000 | | Saint Paul Housing & Redevelopment Authority, Minnesota, Charter School Lease Revenue | 7/26 at 100.00 | N/R | 2,119,480 |
| | Bonds, Community School of Excellence, Series 2016A, 5.750%, 7/01/47, 144A | | | |
| 3,000 | | Saint Paul Port Authority, Minnesota, Solid Waste Disposal Revenue Bonds, Gerdau Saint | 10/22 at 100.00 | Ba1 | 3,020,640 |
| | Paul Steel Mill Project, Series 2012-7, 4.500%, 10/01/37 (AMT), 144A | | | |
| 7,270 | | Total Minnesota | | | 7,438,539 |
| | Mississippi – 0.1% (0.1% of Total Investments) | | | |
| 500 | | Mississippi Business Finance Corporation, Gulf Opportunity Zone Revenue Bonds, King | 10/26 at 100.00 | N/R | 437,755 |
| | Edward Mixed-Use Project, Refunding Series 2019A, 4.250%, 10/15/49 (Mandatory Put | | | |
| | 10/15/39), 144A | | | |
| 582 | | Mississippi Home Corporation, Multifamily Housing Revenue Bonds, Tupelo Personal Care | 12/20 at 100.00 | N/R | 560,376 |
| | Apartments, Series 2004-2, 6.125%, 9/01/34 (AMT) | | | |
| 1,082 | | Total Mississippi | | | 998,131 |
| | Missouri – 1.5% (1.1% of Total Investments) | | | |
| 655 | | Hanley Road Corridor Transportation Development District, Brentwood and Maplewood, | 11/20 at 100.00 | A– | 656,375 |
| | Missouri, Transportation Sales Revenue Bonds, Refunding Series 2009A, 5.875%, 10/01/36 | | | |
| 655 | | Kansas City Industrial Development Authority, Missouri, Sales Tax Revenue Bonds, Ward | 4/26 at 100.00 | N/R | 627,706 |
| | Parkway Center Community Improvement District, Senior Refunding & Improvement Series 2016, | | | |
| | 5.000%, 4/01/46, 144A | | | |
| 2,000 | | Liberty, Missouri, Special Obligation Tax Increment and Special Districts Bonds, Liberty | 6/25 at 100.00 | N/R | 1,957,780 |
| | Commons Project, Subordinate Lien Series 2015B, 8.500%, 6/15/46, 144A | | | |
| 10,000 | | Missouri Health and Educational Facilities Authority, Health Facilities Revenue Bonds, | 11/27 at 100.00 | AA– | 10,986,100 |
| | Mercy Health, Series 2017C, 4.000%, 11/15/49 (UB) (6) | | | |
| 1,100 | | Saint Louis Industrial Development Authority, Missouri, Confluence Academy Project, | 11/20 at 100.00 | N/R | 1,054,020 |
| | Series 2007A, 5.350%, 6/15/32 | | | |
| 1,353 | | Saint Louis, Missouri, Tax Increment Financing Revenue Bonds, Fashion Square | 3/21 at 100.00 | N/R | 1,347,656 |
| | Redevelopment Project, Series 2008A, 6.300%, 8/22/26 | | | |
| 732 | | Saint Louis, Missouri, Tax Increment Financing Revenue Bonds, Grace Lofts Redevelopment | No Opt. Call | N/R | 183,000 |
| | Projects, Series 2007A, 6.000%, 12/31/26 | | | |
| 16,495 | | Total Missouri | | | 16,812,637 |
| | Nevada – 1.3% (0.9% of Total Investments) | | | |
| 1,000 | | City of Henderson, Nevada, Local Improvement District No T-20 Rainbow Canyon, Local | 9/28 at 100.00 | N/R | 1,063,650 |
| | Improvement Bonds, Series 2018, 5.375%, 9/01/48 | | | |
| 2,000 | | Director of Nevada State Department of Business & Industry, Environmental Improvement | 8/29 at 100.00 | N/R | 1,814,560 |
| | Revenue Bonds, Fulcrum Sierra Holdings LLC, Green Series 2019, 5.750%, 2/15/38 (AMT), 144A | | | |
| 10,000 | | Las Vegas Convention and Visitors Authority, Nevada, Convention Center Expansion Revenue | 7/28 at 100.00 | A | 10,464,100 |
| | Bonds, Series 2018B, 4.000%, 7/01/49 (UB) (6) | | | |
| 575 | | North Las Vegas, Nevada, Local Improvement Bonds, Special Improvement District 64 Valley | 12/28 at 100.00 | N/R | 588,012 |
| | Vista, Series 2019, 4.625%, 6/01/49 | | | |
| 13,575 | | Total Nevada | | | 13,930,322 |
118
| | | | | | |
| Principal | | | Optional Call | | |
| Amount (000) | | Description (1) | Provisions (2) | Ratings (3) | Value |
| | New Jersey – 5.2% (3.6% of Total Investments) | | | |
| $ 2,500 | | New Jersey Economic Development Authority, Lease Revenue Bonds, State Government | 12/27 at 100.00 | BBB+ | $ 2,770,275 |
| | Buildings-Health Department & Taxation Division Office Project, Series 2018A, 5.000%, | | | |
| | 6/15/47 (UB) (6) | | | |
| 5,000 | | New Jersey Economic Development Authority, Lease Revenue Bonds, State Government | 12/27 at 100.00 | BBB+ | 5,540,550 |
| | Buildings-Juvenile Justice Commission Facilities Project, Series 2018C, 5.000%, 6/15/47 (UB) (6) | | | |
| 9,500 | | New Jersey Economic Development Authority, School Facilities Construction Bonds, Series | 6/27 at 100.00 | BBB+ | 10,538,825 |
| | 2017DDD, 5.000%, 6/15/42 (UB) (6) | | | |
| 4,100 | | New Jersey Economic Development Authority, Special Facilities Revenue Bonds, Continental | 8/22 at 101.00 | B+ | 4,189,134 |
| | Airlines Inc, Series 1999, 5.250%, 9/15/29 (AMT) | | | |
| 2,080 | | New Jersey Economic Development Authority, Special Facilities Revenue Bonds, Continental | 3/24 at 101.00 | B+ | 2,161,515 |
| | Airlines Inc, Series 2000A & 2000B, 5.625%, 11/15/30 (AMT) | | | |
| 5,200 | | New Jersey Health Care Facilities Financing Authority, New Jersey, Revenue Bonds, Saint | 11/20 at 100.00 | BB+ | 5,214,872 |
| | Peters University Hospital, Series 2007, 5.750%, 7/01/37 | | | |
| 40,000 | | New Jersey Transportation Trust Fund Authority, Transportation System Bonds, Refunding | No Opt. Call | BBB+ | 22,874,800 |
| | Series 2006C, 0.000%, 12/15/36 – AMBAC Insured (UB) (6) | | | |
| 1,750 | | New Jersey Transportation Trust Fund Authority, Transportation System Bonds, Series | 12/28 at 100.00 | BBB+ | 1,791,843 |
| | 2019BB, 4.000%, 6/15/50 | | | |
| 2,200 | | Tobacco Settlement Financing Corporation, New Jersey, Tobacco Settlement Asset-Backed | 6/28 at 100.00 | BB+ | 2,489,850 |
| | Bonds, Series 2018B, 5.000%, 6/01/46 | | | |
| 72,330 | | Total New Jersey | | | 57,571,664 |
| | New Mexico – 0.5% (0.4% of Total Investments) | | | |
| 320 | | Mariposa East Public Improvement District, New Mexico, Revenue Bonds, Capital | 3/21 at 58.09 | N/R | 147,290 |
| | Appreciation Taxable Series 2015D, 0.000%, 3/01/32 | | | |
| 50 | | Mariposa East Public Improvement District, New Mexico, Special Levy Revenue Bonds, | 9/25 at 100.00 | N/R | 49,827 |
| | Series 2015A, 5.900%, 9/01/32 | | | |
| 215 | | Mariposa East Public Improvement District, New Mexico, Special Levy Revenue Bonds, | 9/25 at 100.00 | N/R | 214,256 |
| | Series 2015B, 5.900%, 9/01/32 | | | |
| 375 | | Mariposa East Public Improvement District, New Mexico, Special Levy Revenue Bonds, | No Opt. Call | N/R | 365,936 |
| | Series 2015C, 5.900%, 9/01/32 | | | |
| 1,210 | | Mesa Del Sol Public Improvement District 1, Albuquerque, New Mexico, Special Levy | 10/23 at 100.00 | N/R | 1,235,217 |
| | Revenue Bonds, Series 2013, 7.250%, 10/01/43 | | | |
| 1,020 | | Volterra Public Improvement District, Albuquerque, New Mexico, Special Levy Revenue | 10/24 at 100.00 | N/R | 1,029,302 |
| | Bonds, Series 2014, 6.750%, 10/01/33 | | | |
| 1,500 | | Winrock Town Center Tax Increment Development District 1, Albuquerque, New Mexico, Gross | 11/23 at 103.00 | N/R | 1,449,825 |
| | Receipts Tax Increment Bonds, Subordinate Lien Series 2020, 8.000%, 5/01/40, 144A (WI/DD, | | | |
| | Settling 11/17/20) | | | |
| 1,452 | | Winrock Town Center Tax Increment Development District, Albuquerque, New Mexico, Gross | 11/20 at 103.00 | N/R | 1,459,318 |
| | Receipts Tax Increment Bonds, Senior Lien Series 2015, 6.000%, 5/01/40, 144A | | | |
| 6,142 | | Total New Mexico | | | 5,950,971 |
| | New York – 9.5% (6.5% of Total Investments) | | | |
| 2,455 | | Build NYC Resource Corporation, New York, Revenue Bonds, Albert Einstein College of | 9/25 at 100.00 | N/R | 2,635,099 |
| | Medicine, Inc, Series 2015, 5.500%, 9/01/45, 144A | | | |
| 10,000 | | Dormitory Authority of the State of New York, Revenue Bonds, Montefiore Obligated Group, | 3/30 at 100.00 | A2 | 9,931,100 |
| | Series 2020A, 3.000%, 9/01/50 – AGM Insured (UB) (6) | | | |
| 200 | | Dormitory Authority of the State of New York, Revenue Bonds, Orange Regional Medical | 6/27 at 100.00 | BBB– | 227,602 |
| | Center Obligated Group, Series 2017, 5.000%, 12/01/36, 144A | | | |
| 1,000 | | Hempstead Town Local Development Corporation, New York, Education Revenue Bonds, The | 2/30 at 100.00 | N/R | 1,024,410 |
| | Academy Charter School Project, Series 2020A, 5.730%, 2/01/50 | | | |
| 1,000 | | Madison County Capital Resource Corporation, New York, Revenue Bonds, Cazenovia College | 6/22 at 100.00 | N/R | 992,730 |
| | Project, Series 2019A, 5.500%, 9/01/22 | | | |
119
| | |
| NMZ | Nuveen Municipal High Income Opportunity Fund Portfolio of Investments (continued) October 31, 2020 |
| | | | | | |
| Principal | | | Optional Call | | |
| Amount (000) | | Description (1) | Provisions (2) | Ratings (3) | Value |
| | New York (continued) | | | |
| $ 1,000 | | Metropolitan Transportation Authority, New York, Transportation Revenue Bonds, Green | 11/30 at 100.00 | BBB+ | $ 1,088,000 |
| | Climate Bond Certified Series 2020D-1, 5.000%, 11/15/43 (UB) (6) | | | |
| 1,000 | | Metropolitan Transportation Authority, New York, Transportation Revenue Bonds, Green | 11/30 at 100.00 | BBB+ | 1,003,270 |
| | Climate Bond Certified Series 2020D-3, 4.000%, 11/15/49 (UB) (6) | | | |
| 10,000 | | Metropolitan Transportation Authority, New York, Transportation Revenue Bonds, Series | 11/26 at 100.00 | BBB+ | 10,526,700 |
| | 2016C-1, 5.000%, 11/15/56 (UB) (6) | | | |
| 14,260 | | New York City Housing Development Corporation, New York, Multifamily Housing Revenue | 9/26 at 100.00 | Aa2 | 15,302,834 |
| | Bonds, Sustainable Neighborhood Series 2018K, 4.125%, 11/01/53 (UB) (6) | | | |
| | New York City Industrial Development Agency, New York, Civic Facility Revenue Bonds, | | | |
| | Bronx Parking Development Company, LLC Project, Series 2007: | | | |
| 1,500 | | 0.000%, 10/01/37 (4) | 11/20 at 100.00 | N/R | 1,155,000 |
| 5,000 | | 0.000%, 10/01/46 (4) | 11/20 at 100.00 | N/R | 3,850,000 |
| 320 | | New York City Industrial Development Agency, New York, Civic Facility Revenue Bonds, | 11/20 at 100.00 | N/R | 301,734 |
| | Special Needs Facilities Pooled Program, Series 2008A-1, 5.800%, 7/01/23 | | | |
| 7,075 | | New York City, New York, General Obligation Bonds, Fiscal 2017 Series A-1, 5.000%, | 8/26 at 100.00 | AA | 8,261,407 |
| | 8/01/38 (UB) (6) | | | |
| 2,000 | | New York Counties Tobacco Trust IV, Tobacco Settlement Pass-Through Bonds, Turbo Term | 11/20 at 100.00 | B– | 2,021,380 |
| | Series 2005A, 5.000%, 6/01/42 | | | |
| 500 | | New York Liberty Development Corporation, Liberty Revenue Bonds, Secured by Port | 12/21 at 100.00 | AA– | 587,170 |
| | Authority Consolidated Bonds, Tender Option Bonds Trust 2016-XG0062, 17.785%, | | | |
| | 12/15/41, 144A (IF) (6) | | | |
| 1,000 | | New York Liberty Development Corporation, New York, Liberty Revenue Bonds, 3 World Trade | 11/24 at 100.00 | N/R | 1,024,540 |
| | Center Project, Class 1 Series 2014, 5.000%, 11/15/44, 144A | | | |
| 3,250 | | New York Liberty Development Corporation, New York, Liberty Revenue Bonds, 3 World Trade | 11/24 at 100.00 | N/R | 3,374,410 |
| | Center Project, Class 2 Series 2014, 5.150%, 11/15/34, 144A | | | |
| 6,000 | | New York Liberty Development Corporation, New York, Liberty Revenue Bonds, 3 World Trade | 11/24 at 100.00 | N/R | 6,223,740 |
| | Center Project, Class 3 Series 2014, 7.250%, 11/15/44, 144A | | | |
| 10,000 | | New York Transportation Development Corporation, New York, Special Facility Revenue | 8/21 at 100.00 | B– | 9,962,100 |
| | Bonds, American Airlines, Inc John F Kennedy International Airport Project, Refunding Series | | | |
| | 2016, 5.000%, 8/01/31 (AMT) | | | |
| 3,070 | | New York Transportation Development Corporation, New York, Special Facility Revenue | 8/30 at 100.00 | B– | 3,181,656 |
| | Bonds, American Airlines, Inc John F Kennedy International Airport Project, Series 2020, | | | |
| | 5.375%, 8/01/36 (AMT) | | | |
| 4,985 | | New York Transportation Development Corporation, Special Facilities Bonds, LaGuardia | 7/24 at 100.00 | A2 | 5,461,018 |
| | Airport Terminal B Redevelopment Project, Series 2016A, 5.000%, 7/01/46 – AGM Insured | | | |
| | (AMT) (UB) (6) | | | |
| 3,265 | | Port Authority of New York and New Jersey, Consolidated Revenue Bonds, Two Hundred | 4/27 at 100.00 | AA– | 3,780,543 |
| | Series 2017, 5.000%, 4/15/57 (UB) (6) | | | |
| 530 | | Port Authority of New York and New Jersey, Special Project Bonds, JFK International Air | 12/20 at 100.00 | BBB | 532,157 |
| | Terminal LLC Project, Eighth Series 2010, 6.000%, 12/01/42 | | | |
| 805 | | Suffolk County Industrial Development Agency, New York, Revenue Bonds, Nissequogue | 11/20 at 100.00 | N/R | 811,867 |
| | Cogeneration Partners Facility, Series 1998, 5.500%, 1/01/23 (AMT) | | | |
| 9,975 | | Westchester County Local Development Corporation, New York, Revenue Bonds, Westchester | 11/25 at 100.00 | BBB– | 10,835,942 |
| | Medical Center Obligated Group Project, Refunding Series 2016, 5.000%, 11/01/46 (UB) (6) | | | |
| 100,190 | | Total New York | | | 104,096,409 |
| | North Carolina – 0.1% (0.1% of Total Investments) | | | |
| 940 | | Charlotte-Mecklenberg Hospital Authority, North Carolina, Health Care Revenue Bonds, DBA | 1/21 at 100.00 | AA– | 964,384 |
| | Carolinas HealthCare System, Tender Option Bond Trust 2016-XF2222, Formerly Tender Option | | | |
| | Bond Trust 11963, 18.543%, 1/15/42, 144A (IF) | | | |
| | North Dakota – 0.1% (0.1% of Total Investments) | | | |
| 2,000 | | Williston, North Dakota, Multifamily Housing Revenue Bonds, Eagle Crest Apartments LLC | 9/23 at 100.00 | N/R | 880,000 |
| | Project, Series 2013, 7.750%, 9/01/38 (4) | | | |
120
| | | | | |
| Principal | | Optional Call | | |
| Amount (000) | Description (1) | Provisions (2) | Ratings (3) | Value |
| Ohio – 7.0% (4.8% of Total Investments) | | | |
| $ 81,601 | Buckeye Tobacco Settlement Financing Authority, Ohio, Tobacco Settlement Asset-Backed | 6/30 at 22.36 | N/R | $ 11,637,225 |
| Revenue Bonds, Refunding Senior Lien Capital Appreciation Series 2020B-3 Class 2, | | | |
| 0.000%, 6/01/57 | | | |
| 32,045 | Buckeye Tobacco Settlement Financing Authority, Ohio, Tobacco Settlement Asset-Backed | 6/30 at 100.00 | N/R | 34,309,620 |
| Revenue Bonds, Refunding Senior Lien Series 2020B-2 Class 2, 5.000%, 6/01/55 | | | |
| 5,455 | Buckeye Tobacco Settlement Financing Authority, Ohio, Tobacco Settlement Asset-Backed | 6/22 at 100.00 | N/R (7) | 5,962,751 |
| Revenue Bonds, Senior Lien Series 2007A-3, 6.250%, 6/01/37 (Pre-refunded 6/01/22) | | | |
| 1,500 | Butler County Port Authority, Ohio, Public Infrastructure Revenue Bonds, Liberty Center | 12/22 at 100.00 | N/R | 1,485,135 |
| Project, Liberty Community Authority, Series 2014C, 6.000%, 12/01/43 | | | |
| 340 | Evans Farm New Community Authority, Ohio, Community Development Charge Revenue Bonds, | 6/29 at 100.00 | N/R | 313,283 |
| Evans Farm Mixed-Use Project, Series 2020, 4.000%, 12/01/46 | | | |
| 1,270 | Medina County Port Authority, Ohio, Development Revenue Bond, Fiber Network Project, | 12/20 at 100.00 | AA– | 1,275,702 |
| Series 2010B, 6.000%, 12/01/30 | | | |
| 11,160 | Montgomery County, Ohio, Hospital Facilities Revenue Bonds, Kettering Health Network | 8/26 at 100.00 | A2 | 12,062,063 |
| Obligated Group, Series 2016, 4.000%, 8/01/47 (UB) (6) | | | |
| 2,800 | Ohio Air Quality Development Authority, Ohio, Air Quality Development Revenue Bonds, | No Opt. Call | N/R | 3,500 |
| FirstEnergy Generation Corporation Project, Series 2009A, 5.700%, 8/01/20 (4) | | | |
| 3,310 | Ohio Air Quality Development Authority, Ohio, Exempt Facilities Revenue Bonds, AMG | 7/29 at 100.00 | B3 | 3,375,042 |
| Vanadium Project, Series 2019, 5.000%, 7/01/49 (AMT), 144A | | | |
| 365 | Ohio Air Quality Development Authority, Ohio, Pollution Control Revenue Bonds, | No Opt. Call | N/R | 456 |
| FirstEnergy Generation Corporation Project, Refunding Series 2009B, 3.100%, 3/01/23 (4) | | | |
| 4,750 | Ohio Air Quality Development Authority, Ohio, Pollution Control Revenue Bonds, | No Opt. Call | N/R | 5,938 |
| FirstEnergy Nuclear Generation Project, Refunding Series 2008C, 3.950%, 11/01/32 (4) | | | |
| 3,085 | Ohio Water Development Authority, Pollution Control Revenue Bonds, FirstEnergy | No Opt. Call | N/R | 3,856 |
| Generating Corporation Project, Refunding Series 2006A, 3.000%, 5/15/20 (4) | | | |
| 3,000 | Ohio Water Development Authority, Pollution Control Revenue Bonds, FirstEnergy Nuclear | No Opt. Call | N/R | 3,750 |
| Generating Corporation Project, Refunding Series 2005B, 4.000%, 1/01/34 (4) | | | |
| 255 | Ohio Water Development Authority, Pollution Control Revenue Bonds, FirstEnergy Nuclear | No Opt. Call | N/R | 319 |
| Generating Corporation Project, Refunding Series 2008B, 3.625%, 10/01/33 (4) | | | |
| 1,015 | Ohio Water Development Authority, Pollution Control Revenue Bonds, FirstEnergy Nuclear | No Opt. Call | N/R | 1,269 |
| Generating Corporation Project, Refunding Series 2008C, 3.950%, 11/01/32 (4) | | | |
| 2,725 | Ohio Water Development Authority, Pollution Control Revenue Bonds, FirstEnergy Nuclear | No Opt. Call | N/R | 3,406 |
| Generating Corporation Project, Refunding Series 2010A, 3.750%, 7/01/33 (4) | | | |
| 3,000 | Ohio Water Development Authority, Pollution Control Revenue Refunding Bonds, FirstEnergy | No Opt. Call | N/R | 3,022,500 |
| Nuclear Generating Corporation Project, Series 2010B, 4.375%, 6/01/33 (Mandatory Put 6/01/22) | | | |
| 1,000 | Port of Greater Cincinnati Development Authority, Ohio, Special Obligation Tax Increment | 11/30 at 100.00 | N/R | 899,300 |
| Financing Revenue Bonds, Cooperative Township Public Parking Project, Gallery at Kenwood, | | | |
| Senior Lien Series 2019A, 5.000%, 11/01/51 | | | |
| 2,000 | Tuscarawas County Economic Development and Finance Alliance, Ohio, Higher Education | 3/25 at 100.00 | N/R | 2,088,980 |
| Facilities Revenue Bonds, Ashland University, Refunding & Improvement Series 2015, | | | |
| 6.000%, 3/01/45 | | | |
| 160,676 | Total Ohio | | | 76,454,095 |
| Oklahoma – 1.8% (1.2% of Total Investments) | | | |
| 1,550 | Fort Sill Apache Tribe of Oklahoma Economic Development Authority, Gaming Enterprise | 8/21 at 100.00 | N/R (7) | 1,650,502 |
| Revenue Bonds, Fort Sill Apache Casino, Series 2011A, 8.500%, 8/25/26 (Pre-refunded | | | |
| 8/25/21), 144A | | | |
| 15,000 | Tulsa Municipal Airport Trust, Oklahoma, Revenue Bonds, American Airlines Inc, Refunding | 6/23 at 100.00 | N/R | 15,309,450 |
| Series 2000B, 5.500%, 6/01/35 (AMT) | | | |
| 2,600 | Tulsa Municipal Airport Trust, Oklahoma, Revenue Bonds, American Airlines Inc, Refunding | 6/23 at 100.00 | N/R | 2,653,638 |
| Series 2001B, 5.500%, 12/01/35 (AMT) | | | |
| 19,150 | Total Oklahoma | | | 19,613,590 |
121
| | |
| NMZ | Nuveen Municipal High Income Opportunity Fund Portfolio of Investments (continued) October 31, 2020 |
| | | | | | |
| Principal | | | Optional Call | | |
| Amount (000) | | Description (1) | Provisions (2) | Ratings (3) | Value |
| | Oregon – 0.1% (0.1% of Total Investments) | | | |
| | Clackamas and Washington Counties School District 3JT, Oregon, General Obligation Bonds, | | | |
| | Series 2020A: | | | |
| $ 1,750 | | 0.000%, 6/15/49 | 6/30 at 57.54 | Aa1 | $ 767,918 |
| 2,000 | | 0.000%, 6/15/50 | 6/30 at 55.67 | Aa1 | 847,180 |
| 3,750 | | Total Oregon | | | 1,615,098 |
| | Pennsylvania – 1.6% (1.1% of Total Investments) | | | |
| 1,250 | | Allentown Neighborhood Improvement Zone Development Authority, Pennsylvania, Tax Revenue | 5/28 at 100.00 | N/R | 1,313,338 |
| | Bonds, City Center Project, Subordinate Lien, Series 2018, 5.125%, 5/01/32, 144A | | | |
| 2,500 | | Beaver County Industrial Development Authority, Pennsylvania, Pollution Control Revenue | No Opt. Call | N/R | 3,125 |
| | Bonds, FirstEnergy Generation Project, Refunding Series 2006A, 3.500%, 4/01/41 (4) | | | |
| 2,715 | | Beaver County Industrial Development Authority, Pennsylvania, Pollution Control Revenue | No Opt. Call | N/R | 3,394 |
| | Bonds, FirstEnergy Nuclear Generation Project, Series 2006B, 3.500%, 12/01/35 (4) | | | |
| 290 | | Berks County Municipal Authority, Pennsylvania, Revenue Bonds, Alvernia University | 10/29 at 100.00 | BB+ | 283,481 |
| | Project, Series 2020, 5.000%, 10/01/49 | | | |
| 1,720 | | Pennsylvania Economic Development Financing Authority, Exempt Facilities Revenue Bonds, | 6/30 at 100.00 | N/R | 1,802,766 |
| | KDC Agribusiness Fairless Hills LLC Project, Series 2020A-1, 10.000%, 12/01/40, 144A | | | |
| 1,720 | | Pennsylvania Economic Development Financing Authority, Exempt Facilities Revenue Bonds, | 6/30 at 100.00 | N/R | 1,802,766 |
| | KDC Agribusiness Fairless Hills LLC Project, Series 2020A-2, 10.000%, 12/01/40 (AMT), 144A | | | |
| 5 | | Pennsylvania Economic Development Financing Authority, Exempt Facilities Revenue Bonds, | No Opt. Call | N/R | 6 |
| | Shippingport Project, First Energy Guarantor, Series 2006A, 2.550%, 11/01/41 (4) | | | |
| 6,650 | | Pennsylvania Economic Development Financing Authority, Exempt Facilities Revenue | 9/25 at 100.00 | CCC+ | 5,491,902 |
| | Refunding Bonds, PPL Energy Supply, LLC Project, Series 2009A, 6.400%, 12/01/38 | | | |
| 1,000 | | Philadelphia Authority for Industrial Development, Pennsylvania, Revenue Bonds, Mariana | 12/27 at 100.00 | N/R | 1,017,670 |
| | Bracetti Academy Project, Series 2020A, 5.375%, 6/15/50, 144A | | | |
| | Philadelphia Authority for Industrial Development, Pennsylvania, Revenue Bonds, Mariana | | | |
| | Bracetti Academy Project, Taxable Series 2020B: | | | |
| 1,000 | | 6.875%, 12/15/35, 144A | 12/27 at 100.00 | N/R | 988,500 |
| 1,000 | | 7.125%, 12/15/44, 144A | 12/27 at 100.00 | N/R | 988,280 |
| 2,500 | | Philadelphia Authority for Industrial Development, Pennsylvania, Revenue Bonds, Nueva | 1/23 at 100.00 | N/R | 2,722,750 |
| | Esperanza, Inc – Esperanza Academy Charter School, Series 2013, 8.000%, 1/01/33 | | | |
| 510 | | Philadelphia Hospitals and Higher Education Facilities Authority, Pennsylvania, Hospital | 7/22 at 100.00 | Ba1 | 541,477 |
| | Revenue Bonds, Temple University Health System Obligated Group, Series 2012A, 5.625%, 7/01/36 | | | |
| 180 | | The Redevelopment Authority of the City of Scranton, Lackawanna county, Pennsylvania, | 5/24 at 100.00 | BB+ | 175,126 |
| | Guaranteed Lease Revenue Bonds, Series 2016A, 5.000%, 11/15/28 | | | |
| 23,040 | | Total Pennsylvania | | | 17,134,581 |
| | Puerto Rico – 7.7% (5.3% of Total Investments) | | | |
| | Puerto Rico Aqueduct and Sewerage Authority, Revenue Bonds, Senior Lien Series 2008A: | | | |
| 5,260 | | 6.000%, 7/01/38 | 11/20 at 100.00 | CC | 5,338,900 |
| 3,125 | | 6.000%, 7/01/44 | 11/20 at 100.00 | CC | 3,171,875 |
| | Puerto Rico Aqueduct and Sewerage Authority, Revenue Bonds, Senior Lien Series 2012A: | | | |
| 4,870 | | 5.125%, 7/01/37 | 7/22 at 100.00 | CC | 5,028,275 |
| 1,000 | | 5.250%, 7/01/42 | 7/22 at 100.00 | CC | 1,032,500 |
| 2,000 | | 6.000%, 7/01/47 | 7/22 at 100.00 | CC | 2,097,500 |
| 8,625 | | Puerto Rico Electric Power Authority, Power Revenue Bonds, Federally Taxable Build | 11/20 at 100.00 | D | 6,026,719 |
| | America Bonds, Series 2010YY, 4.050%, 7/01/40 (4) | | | |
| | Puerto Rico Electric Power Authority, Power Revenue Bonds, Refunding Series 2012A: | | | |
| 4,835 | | 3.957%, 7/01/42 (4) | 7/22 at 100.00 | D | 3,360,325 |
| 185 | | 3.961%, 7/01/42 (4) | 7/22 at 100.00 | D | 128,575 |
| 2,000 | | Puerto Rico Electric Power Authority, Power Revenue Bonds, Series 2003NN, | No Opt. Call | D | 1,392,500 |
| | 3.999%, 7/01/20 (4) | | | |
| 1,025 | | Puerto Rico Electric Power Authority, Power Revenue Bonds, Series 2007TT, | 11/20 at 100.00 | D | 712,375 |
| | 3.957%, 7/01/37 (4) | | | |
122
| | | | | | |
| Principal | | | Optional Call | | |
| Amount (000) | | Description (1) | Provisions (2) | Ratings (3) | Value |
| | Puerto Rico (continued) | | | |
| | Puerto Rico Electric Power Authority, Power Revenue Bonds, Series 2010AAA: | | | |
| $ 5,690 | | 3.978%, 7/01/22 (4) | 11/20 at 100.00 | D | $ 3,961,662 |
| 1,186 | | 3.978%, 7/01/28 (4) | 11/20 at 100.00 | D | 825,752 |
| 890 | | 3.978%, 7/01/29 (4) | 11/20 at 100.00 | D | 619,663 |
| 658 | | 3.978%, 7/01/31 (4) | 11/20 at 100.00 | D | 458,133 |
| 405 | | Puerto Rico Electric Power Authority, Power Revenue Bonds, Series 2010CCC, | 11/20 at 100.00 | D | 281,475 |
| | 3.957%, 7/01/28 (4) | | | |
| 1,350 | | Puerto Rico Electric Power Authority, Power Revenue Bonds, Series 2010XX, | 11/20 at 100.00 | D | 939,937 |
| | 3.978%, 7/01/40 (4) | | | |
| 3,000 | | Puerto Rico Electric Power Authority, Power Revenue Bonds, Series 2010ZZ, | 11/20 at 100.00 | D | 2,088,750 |
| | 3.978%, 7/01/25 (4) | | | |
| 1,000 | | Puerto Rico Electric Power Authority, Power Revenue Bonds, Series 2013A, | 7/23 at 100.00 | D | 715,000 |
| | 4.102%, 7/01/36 (4) | | | |
| | Puerto Rico Electric Power Authority, Power Revenue Bonds, Series WW: | | | |
| 360 | | 3.988%, 7/01/22 (4) | 11/20 at 100.00 | D | 251,100 |
| 710 | | 3.988%, 7/01/23 (4) | 11/20 at 100.00 | D | 495,225 |
| 375 | | 5.250%, 7/01/33 (4) | 11/20 at 100.00 | D | 261,094 |
| 5,500 | | Puerto Rico Electric Power Authority, Power Revenue Bonds, Taxable Build America Bond | 11/20 at 100.00 | D | 3,836,250 |
| | Series 2010EE, 4.044%, 7/01/32 (4) | | | |
| | Puerto Rico Sales Tax Financing Corporation, Sales Tax Revenue Bonds, | | | |
| | Restructured 2018A-1: | | | |
| 57,000 | | 0.000%, 7/01/46 | 7/28 at 41.38 | N/R | 16,470,150 |
| 76,600 | | 0.000%, 7/01/51 | 7/28 at 30.01 | N/R | 15,961,142 |
| 6,000 | | 5.000%, 7/01/58 | 7/28 at 100.00 | N/R | 6,392,100 |
| 4,500 | | Puerto Rico, General Obligation Bonds, Public Improvement, Series 2014A, | 11/20 at 100.00 | D | 2,700,000 |
| | 3.180%, 7/01/35 (4) | | | |
| 198,149 | | Total Puerto Rico | | | 84,546,977 |
| | Rhode Island – 0.3% (0.2% of Total Investments) | | | |
| 18,260 | | Rhode Island Tobacco Settlement Financing Corporation, Tobacco Settlement Asset-Backed | 11/20 at 15.49 | CCC– | 2,823,179 |
| | Bonds, Series 2007A, 0.000%, 6/01/52 | | | |
| | South Carolina – 2.9% (2.0% of Total Investments) | | | |
| 4,000 | | Lancaster County, South Carolina, Special Assessment Bonds, Edgewater II Improvement | 11/20 at 100.00 | N/R | 840,000 |
| | District, Series 2007A, 7.750%, 11/01/39 (4) | | | |
| 3,477 | | Lancaster County, South Carolina, Special Assessment Bonds, Edgewater II Improvement | No Opt. Call | N/R | 730,170 |
| | District, Series 2007B, 7.700%, 11/01/21 (4) | | | |
| 5,000 | | South Carolina Jobs-Economic Development Authority, Economic Development Revenue Bonds, | 8/26 at 100.00 | Baa1 (7) | 6,242,150 |
| | Custodial Receipts CR-086, 5.000%, 8/15/36 (Pre-refunded 8/15/26), 144A | | | |
| 400 | | South Carolina Jobs-Economic Development Authority, Economic Development Revenue Bonds, | 1/30 at 100.00 | N/R | 361,368 |
| | Hilton Head Christian Academy, Series 2020, 5.000%, 1/01/55, 144A | | | |
| 980 | | South Carolina Jobs-Economic Development Authority, Economic Development Revenue Bonds, | 11/24 at 100.00 | N/R | 1,086,741 |
| | Midland Valley Preparatory School Project, Series 2014, 7.750%, 11/15/45, 144A | | | |
| 4,215 | | South Carolina Jobs-Economic Development Authority, Educational Facilities Revenue | 12/29 at 100.00 | Baa3 | 4,653,023 |
| | Bonds, Lowcountry Leadership Charter School Project, Series 2019A, 5.000%, 12/01/49, 144A | | | |
| 1,250 | | South Carolina Jobs-Economic Development Authority, Hospital Revenue Bonds, Palmetto | 8/21 at 100.00 | AA (7) | 1,307,675 |
| | Health, Refunding Series 2011A, 6.500%, 8/01/39 (Pre-refunded 8/01/21) – AGM Insured | | | |
| 3,000 | | South Carolina Public Service Authority Santee Cooper Revenue Obligations, Refunding | 12/26 at 100.00 | A– | 3,502,980 |
| | Series 2016B, 5.000%, 12/01/46 (UB) (6) | | | |
| 11,615 | | South Carolina Public Service Authority, Santee Cooper Revenue Obligations, Series | 6/24 at 100.00 | A– | 12,848,281 |
| | 2014A, 5.000%, 12/01/49 (UB) (6) | | | |
| 33,937 | | Total South Carolina | | | 31,572,388 |
123
| | |
| NMZ | Nuveen Municipal High Income Opportunity Fund Portfolio of Investments (continued) October 31, 2020 |
| | | | | | |
| Principal | | | Optional Call | | |
| Amount (000) | | Description (1) | Provisions (2) | Ratings (3) | Value |
| | Tennessee – 2.8% (1.9% of Total Investments) | | | |
| $ 1,000 | | Memphis/Shelby County Economic Development Growth Engine Industrial Development Board, | 7/27 at 100.00 | N/R | $ 849,050 |
| | Tennessee, Tax Increment Revenue Bonds, Graceland Project, Senior Series 2017A, 5.625%, 1/01/46 | | | |
| | Metropolitan Government of Nashville-Davidson County Health and Educational Facilities | | | |
| | Board, Tennessee, Revenue Bonds, Vanderbilt University Medical Center, Series 2016A: | | | |
| 11,095 | | 5.000%, 7/01/40 (UB) | 7/26 at 100.00 | Aa1 | 12,812,062 |
| 5,240 | | 5.000%, 7/01/46 (UB) (6) | 7/26 at 100.00 | Aa1 | 5,987,853 |
| 5,000 | | The Health and Educational Facilities Board of the City of Franklin, Tennessee, Revenue | 6/27 at 100.00 | N/R | 3,250,000 |
| | Bonds, Provision Cares Proton Therapy Center, Nashville Project, Series 2017A, 7.500%, | | | |
| | 6/01/47, 144A (4) | | | |
| 6,024 | | The Tennessee Energy Acquisition Corporation, Gas Revenue Bonds, Series 2006B, | No Opt. Call | BBB | 7,319,943 |
| | 5.625%, 9/01/26 | | | |
| 930 | | Wilson County Health and Educational Facilities Board, Tennessee, Senior Living Revenue | 11/20 at 100.00 | N/R | 724,247 |
| | Bonds, Rutland Place Inc Project, Series 2015A, 5.500%, 1/01/46 | | | |
| 29,289 | | Total Tennessee | | | 30,943,155 |
| | Texas – 3.8% (2.6% of Total Investments) | | | |
| 500 | | Celina, Texas, Special Assessment Revenue Bonds, Celina Sutton Fields II Public | 9/29 at 100.00 | N/R | 521,580 |
| | Improvement District Neighborhood Improvement Areas 2-3 Project, Series 2019, 4.250%, | | | |
| | 9/01/49, 144A | | | |
| 1,000 | | Celina, Texas, Special Assessment Revenue Bonds, Creeks of Legacy Public Improvement | 9/22 at 103.00 | N/R | 1,051,190 |
| | District Phase 1 Project, Series 2014, 7.000%, 9/01/40 | | | |
| | Central Texas Regional Mobility Authority, Revenue Bonds, Senior Lien Series 2011: | | | |
| 250 | | 6.000%, 1/01/41 (Pre-refunded 1/01/21) | 1/21 at 100.00 | Baa1 (7) | 252,322 |
| 1,000 | | 6.750%, 1/01/41 (Pre-refunded 1/01/21) | 1/21 at 100.00 | Baa2 (7) | 1,010,310 |
| 4,165 | | Dallas Area Rapid Transit, Texas, Sales Tax Revenue Bonds, Refunding Series 2016A, | 12/25 at 100.00 | Aa2 | 4,953,684 |
| | 5.000%, 12/01/48 (UB) (6) | | | |
| | Decatur Hospital Authority, Texas, Revenue Bonds, Wise Regional Health System, | | | |
| | Series 2013A: | | | |
| 365 | | 6.625%, 9/01/31 | 9/23 at 100.00 | N/R | 398,423 |
| 1,000 | | 6.375%, 9/01/42 | 9/23 at 100.00 | N/R | 1,069,120 |
| 165 | | Fate, Rockwall County, Texas, Special Assessment Revenue Bonds, Williamsburg Public | 8/27 at 100.00 | N/R | 173,425 |
| | Improvement District 1 Phase 2B, 2C & 3A1, Series 2019, 4.250%, 8/15/49, 144A | | | |
| 1,500 | | Fort Bend County Industrial Development Corporation, Texas, Revenue Bonds, NRG Energy | 11/22 at 100.00 | Baa2 | 1,553,460 |
| | Inc Project, Series 2012A RMKT, 4.750%, 5/01/38 | | | |
| 1,000 | | Gulf Coast Industrial Development Authority, Texas, Solid Waste Disposal Revenue Bonds, | 11/20 at 100.00 | B3 | 1,000,500 |
| | Citgo Petroleum Corporation Project, Series 1998, 8.000%, 4/01/28 (AMT) | | | |
| 125 | | Haslett, Texas, Special Assessment Revenue Bonds, Haslet Public Improvement District 5 | 9/29 at 100.00 | N/R | 132,404 |
| | Improvement Area 1 Project, Series 2019, 4.375%, 9/01/49, 144A | | | |
| 805 | | Heart of Texas Education Finance Corporation, Texas, Gateway Charter Academy, Series | 11/20 at 100.00 | N/R | 804,936 |
| | 2006A, 6.000%, 2/15/36 | | | |
| 1,000 | | Houston, Texas, Airport System Special Facilities Revenue Bonds, Continental Airlines | 7/21 at 100.00 | B | 1,014,740 |
| | Inc – Terminal Improvement Project, Refunding Series 2011, 6.625%, 7/15/38 (AMT) | | | |
| 3,165 | | Jefferson County Industrial Development Corporation, Texas, Hurricane Ike Disaster Area | 7/22 at 100.00 | N/R (7) | 3,545,465 |
| | Revenue Bonds, Port of Beaumont Petroleum Transload Terminal, LLC Project, Series 2012, | | | |
| | 8.250%, 7/01/32 (Pre-refunded 7/01/22) | | | |
| 1,170 | | McLendon-Chisholm, Texas, Special Assessment Revenue Bonds, Sonoma Public Improvement | 9/29 at 100.00 | N/R | 1,268,853 |
| | District Improvement Area 2 Project, Series 2019, 4.250%, 9/15/39, 144A | | | |
| | Mesquite, Texas, Special Assessment Bonds, Iron Horse Public Improvement District | | | |
| | Project, Series 2019: | | | |
| 300 | | 5.750%, 9/15/39, 144A | 9/29 at 100.00 | N/R | 323,286 |
| 500 | | 6.000%, 9/15/49, 144A | 9/29 at 100.00 | N/R | 538,020 |
| 2,000 | | Mission Economic Development Corporation, Texas, Water Supply Revenue Bonds, Enviro | 1/26 at 102.00 | N/R | 139,340 |
| | Water Minerals Project, Green Bonds, Series 2015, 7.750%, 1/01/45 (AMT), 144A (4), (8) | | | |
124
| | | | | | |
| Principal | | | Optional Call | | |
| Amount (000) | | Description (1) | Provisions (2) | Ratings (3) | Value |
| | Texas (continued) | | | |
| $ 1,000 | | New Hope Cultural Education Facilities Finance Corporation, Texas, Student Housing | 4/24 at 100.00 | B– | $ 869,390 |
| | Revenue Bonds, CHF-Collegiate Housing Corpus Christi I, LLC-Texas A&M University-Corpus | | | |
| | Christi Project, Series 2014A, 5.000%, 4/01/44 | | | |
| 1,000 | | New Hope Cultural Education Facilities Finance Corporation, Texas, Student Housing | 4/26 at 100.00 | BBB– | 968,780 |
| | Revenue Bonds, CHF-Collegiate Housing Foundation – San Antonio 1, LLC – Texas A&M University – | | | |
| | San Antonio Project,, 5.000%, 4/01/48 | | | |
| 1,000 | | New Hope Cultural Education Facilities Finance Corporation, Texas, Student Housing | 4/24 at 100.00 | Baa3 | 980,420 |
| | Revenue Bonds, CHF-Collegiate Housing Galveston-Texas A&M University at Galveston Project, | | | |
| | Series 2014A, 5.000%, 4/01/44 | | | |
| | New Hope Cultural Education Facilities Finance Corporation, Texas, Student Housing | | | |
| | Revenue Bonds, NCCD – College Station Properties LLC – Texas A&M University Project, | | | |
| | Series 2015A: | | | |
| 1,250 | | 5.000%, 7/01/35 | 7/25 at 100.00 | CCC | 1,037,500 |
| 2,445 | | 5.000%, 7/01/47 | 7/25 at 100.00 | CCC | 2,029,350 |
| 2,250 | | North Texas Tollway Authority, Special Projects System Revenue Bonds, Tender Option Bond | 9/21 at 100.00 | N/R (7) | 2,640,442 |
| | Trust 2016-XG0036, Formerly Tender Option Bond Trust 11946, 19.661%, 9/01/41, 144A | | | |
| | (Pre-refunded 9/01/21) (IF) | | | |
| 1,070 | | Oak Point, Denton County, Texas, Special Assessment Revenue Bonds, Oak Point Public | 9/30 at 100.00 | N/R | 1,073,413 |
| | Improvement District 2 Project, Series 2020, 4.000%, 9/01/50, 144A (WI/DD, Settling 11/16/20) | | | |
| 440 | | Port Beaumont Navigation District, Jefferson County, Texas, Dock and Wharf Facility | 1/22 at 103.00 | N/R | 440,317 |
| | Revenue Bonds, Jefferson Gulf Coast Energy Project, Series 2020, 4.000%, 1/01/50 (AMT), 144A | | | |
| 205 | | Princeton, Texas, Special Assessment Revenue Bonds, Whitewing Trails Public Improvement | 9/29 at 100.00 | N/R | 216,956 |
| | District 2 Phase 1 Project, Series 2019, 4.750%, 9/01/49, 144A | | | |
| 185 | | Princeton, Texas, Special Assessment Revenue Bonds, Whitewing Trails Public Improvement | 9/29 at 100.00 | N/R | 202,433 |
| | District 2 Phase 2-6 Major Improvement Project, Series 2019, 5.500%, 9/01/39, 144A | | | |
| 2,000 | | Red River Health Facilities Development Corporation, Texas, First Mortgage Revenue | 12/21 at 100.00 | N/R | 1,325,000 |
| | Bonds, Eden Home Inc, Series 2012, 0.000%, 12/15/32 (4) | | | |
| 160 | | Rowlett, Texas, Special Assessment Revenue Bonds, Bayside Public Improvement District | 3/24 at 102.00 | N/R | 162,624 |
| | North Improvement Area, Series 2016, 5.750%, 9/15/36 | | | |
| 5,000 | | Texas Department of Housing and Community Affairs, Single Family Mortgage Revenue Bonds, | 9/27 at 100.00 | AA+ | 5,481,250 |
| | Series 2018A, 4.250%, 9/01/48 (UB) (6) | | | |
| 785 | | Texas Public Finance Authority Charter School Finance Corporation, Charter School | 11/20 at 100.00 | BB– | 786,758 |
| | Revenue Bonds, School of Excellence Education Project, Series 2004A, 7.000%, 12/01/34 | | | |
| 2,040 | | Texas State Affordable Housing Corporation Multifamily Housing Revenue Bonds, Peoples El | 1/34 at 100.00 | N/R | 2,148,452 |
| | Shaddai Village and St James Manor Apartments Project, Series 2016, 4.850%, 12/01/56, 144A | | | |
| 1,653 | | Viridian Municipal Management District, Texas, Assessment Revenue Bonds, Series 2017, | 12/25 at 100.00 | N/R | 1,752,015 |
| | 4.250%, 12/01/44 | | | |
| 42,493 | | Total Texas | | | 41,866,158 |
|
| Utah – 0.2% (0.1% of Total Investments)
| | | |
| 1,980 | | Utah Charter School Finance Authority, Charter School Revenue Bonds, Summit Academy High | 5/21 at 100.00 | N/R (7) | 2,061,952 |
| | School, Series 2011A, 8.125%, 5/15/31 (Pre-refunded 5/15/21) | | | |
| | Vermont – 0.5% (0.3% of Total Investments) | | | |
| 3,400 | | Vermont Educational and Health Buildings Financing Agency, Revenue Bonds, University of | 6/26 at 100.00 | A | 3,854,784 |
| | Vermont Medical Center Project, Green Series 2016B, 5.000%, 12/01/46 (UB) (6) | | | |
| 1,155 | | Vermont Educational and Health Buildings Financing Agency, Revenue Bonds, Vermont Law | 1/21 at 100.00 | N/R (7) | 1,165,903 |
| | School Project, Series 2011A, 6.250%, 1/01/41 (Pre-refunded 1/01/21) | | | |
| 4,555 | | Total Vermont | | | 5,020,687 |
| | Virgin Islands – 0.9% (0.6% of Total Investments) | | | |
| | Virgin Islands Public Finance Authority, Gross Receipts Taxes Loan Note, Refunding | | | |
| | Series 2014C: | | | |
| 1,000 | | 5.000%, 10/01/30 | 10/24 at 100.00 | N/R | 942,160 |
| 5,000 | | 5.000%, 10/01/39 | 10/24 at 100.00 | N/R | 4,537,850 |
125
| | |
| NMZ | Nuveen Municipal High Income Opportunity Fund Portfolio of Investments (continued) October 31, 2020 |
| | | | | | |
| Principal | | | Optional Call | | |
| Amount (000) | | Description (1) | Provisions (2) | Ratings (3) | Value |
| | Virgin Islands (continued) | | | |
| $ 1,000 | | Virgin Islands Public Finance Authority, Matching Fund Revenue Loan Note – Diageo | 11/20 at 100.00 | Caa3 | $ 1,003,740 |
| | Project, Series 2009A, 6.750%, 10/01/37 | | | |
| 3,270 | | Virgin Islands Water and Power Authority, Electric System Revenue Bonds, Bond | No Opt. Call | N/R | 3,269,416 |
| | Anticipation Notes, Series 2020A, 7.500%, 7/01/22, 144A | | | |
| 10,270 | | Total Virgin Islands | | | 9,753,166 |
| | Virginia – 2.5% (1.7% of Total Investments) | | | |
| 762 | | Celebrate Virginia North Community Development Authority, Special Assessment Revenue | No Opt. Call | N/R | 457,200 |
| | Bonds, Series 2003B, 4.125%, 3/01/21 (4) | | | |
| 10,000 | | Industrial Development Authority of the City of Newport News, Virginia, Health System | 7/27 at 100.00 | N/R | 11,112,000 |
| | Revenue Bonds, Riverside Health System, Series 2017A, 5.000%, 7/01/46, 144A | | | |
| 1,000 | | Tobacco Settlement Financing Corporation of Virginia, Tobacco Settlement Asset Backed | 11/20 at 100.00 | B– | 1,004,230 |
| | Bonds, Series 2007B1, 5.000%, 6/01/47 | | | |
| 7,000 | | Virginia Small Business Finance Authority, Educational Facilities Revenue Bonds, | 7/34 at 100.00 | N/R | 7,258,580 |
| | Provident Resource Group – Rixey Student Housing Project, Series 2019A, 5.500%, 7/01/54, 144A | | | |
| 7,000 | | Virginia Small Business Finance Authority, Educational Facilities Revenue Bonds, | No Opt. Call | N/R | 7,032,760 |
| | Provident Resource Group – Rixey Student Housing Project, Series 2019B, 7.500%, 7/01/52, 144A | | | |
| | Virginia Small Business Financing Authority, Senior Lien Revenue Bonds, Elizabeth River | | | |
| | Crossing, Opco LLC Project, Series 2012: | | | |
| 80 | | 6.000%, 1/01/37 (AMT) | 7/22 at 100.00 | BBB– | 85,173 |
| 130 | | 5.500%, 1/01/42 (AMT) | 7/22 at 100.00 | BBB– | 135,756 |
| 25,972 | | Total Virginia | | | 27,085,699 |
| | Washington – 2.2% (1.5% of Total Investments) | | | |
| 1,000 | | King County Public Hospital District 4, Washington, Hospital Revenue Bonds, Snoqualmie | 12/25 at 100.00 | N/R | 1,077,680 |
| | Valley Hospital, Series 2015A, 6.250%, 12/01/45 | | | |
| 1,000 | | Kitsap County Consolidated Housing Authority, Washington, Pooled Tax Credit Housing | 11/20 at 100.00 | N/R | 1,000,840 |
| | Revenue Bonds, Series 2007, 5.600%, 6/01/37 (AMT) | | | |
| 1,300 | | Port of Seattle Industrial Development Corporation, Washington, Special Facilities | 4/23 at 100.00 | BB | 1,333,605 |
| | Revenue Refunding Bonds, Delta Air Lines, Inc Project, Series 2012, 5.000%, 4/01/30 (AMT) | | | |
| 195 | | Tacoma Consolidated Local Improvement District 65, Washington, Special Assessment Bonds, | 11/20 at 100.00 | N/R | 195,082 |
| | Series 2013, 5.750%, 4/01/43 | | | |
| 3,065 | | Washington Economic Development Finance Authority, Environmental Facilities Revenue | 1/28 at 100.00 | N/R | 2,298,750 |
| | Bonds, Columbia Pulp I, LLC Project, Series 2017A, 7.500%, 1/01/32 (AMT), 144A | | | |
| 545 | | Washington Economic Development Finance Authority, Environmental Facilities Revenue | 1/28 at 100.00 | N/R | 408,750 |
| | Bonds, Columbia Pulp I, LLC Project, Series 2018, 7.250%, 1/01/32 (AMT), 144A | | | |
| 1,565 | | Washington Economic Development Finance Authority, Environmental Facilities Revenue | 1/28 at 100.00 | N/R | 1,173,750 |
| | Bonds, Columbia Pulp I, LLC Project, Series 2019A, 7.500%, 1/01/32 (AMT), 144A | | | |
| 7,330 | | Washington Health Care Facilities Authority, Revenue Bonds, Virginia Mason Medical | 8/27 at 100.00 | BBB– | 7,607,294 |
| | Center, Series 2017, 4.000%, 8/15/42 (UB) | | | |
| 8,525 | | Washington State Higher Education Facilities Authority Revenue Bonds, Gonzaga University | 10/29 at 100.00 | A2 | 8,215,798 |
| | Project, Series 2019A, 3.000%, 4/01/49 (UB) (6) | | | |
| 1,000 | | Washington State Housing Finance Commission, Non-Profit Housing Revenue Bonds, Mirabella | 10/22 at 100.00 | N/R | 1,022,680 |
| | Project, Series 2012A, 6.750%, 10/01/47, 144A | | | |
| 25,525 | | Total Washington | | | 24,334,229 |
| | West Virginia – 0.2% (0.2% of Total Investments) | | | |
| 1,361 | | Berkeley, Hardy and Jefferson Counties, West Virginia, as Joint Issuers, Commercial | 12/23 at 100.00 | N/R | 1,391,160 |
| | Development Revenue Bonds, Scattered Site Housing Projects, Series 2010, 5.750%, 12/01/44 | | | |
| 1,125 | | Monongalia County Commission, West Virginia, Special District Excise Tax Revenue, | 6/27 at 100.00 | N/R | 1,160,944 |
| | University Town Centre Economic Opportunity Development District, Refunding & Improvement | | | |
| | Series 2017A, 5.750%, 6/01/43, 144A | | | |
| 2,486 | | Total West Virginia | | | 2,552,104 |
126
| | | | | | |
| Principal | | | Optional Call | | |
| Amount (000) | | Description (1) | Provisions (2) | Ratings (3) | Value |
| | Wisconsin – 5.7% (3.9% of Total Investments) | | | |
| $ 2,000 | | Lac Courte Oreilles Band of Lake Superior Chippewa Indians, Wisconsin, General Revenue | 12/27 at 100.00 | N/R | $ 1,999,860 |
| | Bonds, Refunding Series 2017, 6.750%, 6/01/32 | | | |
| 150 | | Public Finance Authority of Wisconsin, Charter School Revenue Bonds, Founders Academy of | 7/28 at 100.00 | BB– | 154,315 |
| | Las Vegas, Series 2020A, 5.000%, 7/01/55 | | | |
| 4,985 | | Public Finance Authority of Wisconsin, Charter School Revenue Bonds, North Carolina | 6/26 at 100.00 | N/R | 4,872,040 |
| | Charter Educational Foundation Project, Series 2016A, 5.000%, 6/15/46, 144A | | | |
| 500 | | Public Finance Authority of Wisconsin, Charter School Revenue Bonds, Point College | 6/27 at 103.00 | N/R | 496,710 |
| | Preparatory, Series 2020A, 5.000%, 6/15/55, 144A | | | |
| | Public Finance Authority of Wisconsin, Conference Center and Hotel Revenue Bonds, | | | |
| | Lombard Public Facilities Corporation, First Tier Series 2018A-1: | | | |
| 13 | | 0.000%, 1/01/47, 144A (4) | No Opt. Call | N/R | 302 |
| 11 | | 0.000%, 1/01/48, 144A (4) | No Opt. Call | N/R | 259 |
| 11 | | 0.000%, 1/01/49, 144A (4) | No Opt. Call | N/R | 249 |
| 10 | | 0.000%, 1/01/50, 144A (4) | No Opt. Call | N/R | 231 |
| 10 | | 0.000%, 1/01/51, 144A (4) | No Opt. Call | N/R | 222 |
| 13 | | 0.000%, 1/01/52, 144A (4) | No Opt. Call | N/R | 277 |
| 13 | | 0.000%, 1/01/53, 144A (4) | No Opt. Call | N/R | 267 |
| 13 | | 0.000%, 1/01/54, 144A (4) | No Opt. Call | N/R | 250 |
| 12 | | 0.000%, 1/01/55, 144A (4) | No Opt. Call | N/R | 239 |
| 12 | | 0.000%, 1/01/56, 144A (4) | No Opt. Call�� | N/R | 229 |
| 632 | | 5.500%, 7/01/56, 144A (4) | 3/28 at 100.00 | N/R | 454,976 |
| 14 | | 0.000%, 1/01/57, 144A (4) | No Opt. Call | N/R | 246 |
| 13 | | 0.000%, 1/01/58, 144A (4) | No Opt. Call | N/R | 234 |
| 13 | | 0.000%, 1/01/59, 144A (4) | No Opt. Call | N/R | 223 |
| 13 | | 0.000%, 1/01/60, 144A (4) | No Opt. Call | N/R | 210 |
| 12 | | 0.000%, 1/01/61, 144A (4) | No Opt. Call | N/R | 201 |
| 12 | | 0.000%, 1/01/62, 144A (4) | No Opt. Call | N/R | 190 |
| 12 | | 0.000%, 1/01/63, 144A (4) | No Opt. Call | N/R | 181 |
| 12 | | 0.000%, 1/01/64, 144A (4) | No Opt. Call | N/R | 173 |
| 11 | | 0.000%, 1/01/65, 144A (4) | No Opt. Call | N/R | 164 |
| 12 | | 0.000%, 1/01/66, 144A (4) | No Opt. Call | N/R | 168 |
| 148 | | 0.000%, 1/01/67, 144A (4) | No Opt. Call | N/R | 1,874 |
| | Public Finance Authority of Wisconsin, Conference Center and Hotel Revenue Bonds, | | | |
| | Lombard Public Facilities Corporation, Second Tier Series 2018B: | | | |
| 24 | | 0.000%, 1/01/46, 144A (4) | No Opt. Call | N/R | 601 |
| 24 | | 0.000%, 1/01/47, 144A (4) | No Opt. Call | N/R | 569 |
| 24 | | 0.000%, 1/01/48, 144A (4) | No Opt. Call | N/R | 555 |
| 23 | | 0.000%, 1/01/49, 144A (4) | No Opt. Call | N/R | 538 |
| 23 | | 0.000%, 1/01/50, 144A (4) | No Opt. Call | N/R | 508 |
| 25 | | 0.000%, 1/01/51, 144A (4) | No Opt. Call | N/R | 545 |
| 652 | | 0.000%, 7/01/51, 144A (4) | 3/28 at 100.00 | N/R | 410,235 |
| 25 | | 0.000%, 1/01/52, 144A (4) | No Opt. Call | N/R | 519 |
| 25 | | 0.000%, 1/01/53, 144A (4) | No Opt. Call | N/R | 501 |
| 25 | | 0.000%, 1/01/54, 144A (4) | No Opt. Call | N/R | 482 |
| 24 | | 0.000%, 1/01/55, 144A (4) | No Opt. Call | N/R | 464 |
| 24 | | 0.000%, 1/01/56, 144A (4) | No Opt. Call | N/R | 449 |
| 24 | | 0.000%, 1/01/57, 144A (4) | No Opt. Call | N/R | 432 |
| 23 | | 0.000%, 1/01/58, 144A (4) | No Opt. Call | N/R | 414 |
| 23 | | 0.000%, 1/01/59, 144A (4) | No Opt. Call | N/R | 403 |
| 23 | | 0.000%, 1/01/60, 144A (4) | No Opt. Call | N/R | 385 |
| 23 | | 0.000%, 1/01/61, 144A (4) | No Opt. Call | N/R | 368 |
| 23 | | 0.000%, 1/01/62, 144A (4) | No Opt. Call | N/R | 355 |
| 22 | | 0.000%, 1/01/63, 144A (4) | No Opt. Call | N/R | 341 |
| 22 | | 0.000%, 1/01/64, 144A (4) | No Opt. Call | N/R | 331 |
| 22 | | 0.000%, 1/01/65, 144A (4) | No Opt. Call | N/R | 317 |
| 22 | | 0.000%, 1/01/66, 144A (4) | No Opt. Call | N/R | 296 |
| 281 | | 0.000%, 1/01/67, 144A (4) | No Opt. Call | N/R | 3,568 |
| 4,700 | | Public Finance Authority of Wisconsin, Contract Revenue Bonds, Mercer Crossing Public | 3/27 at 100.00 | N/R | 5,205,438 |
| | Improvement District Project, Series 2017, 7.000%, 3/01/47, 144A | | | |
127
| | |
| NMZ | Nuveen Municipal High Income Opportunity Fund Portfolio of Investments (continued) October 31, 2020 |
| | | | | | |
| Principal | | | Optional Call | | |
| Amount (000) | | Description (1) | Provisions (2) | Ratings (3) | Value |
| | Wisconsin (continued) | | | |
| $ 1,500 | | Public Finance Authority of Wisconsin, Education Revenue Bonds, Pioneer Springs | 6/27 at 100.00 | N/R | $ 1,525,830 |
| | Community School, Series 2020A, 6.250%, 6/15/40, 144A | | | |
| 2,000 | | Public Finance Authority of Wisconsin, Educational Facilities Revenue Bonds, Lake Erie | 10/29 at 100.00 | N/R | 1,995,500 |
| | College, Series 2019A, 5.875%, 10/01/54, 144A | | | |
| 830 | | Public Finance Authority of Wisconsin, Educational Facility Revenue Bonds, Cottonwood | 12/22 at 100.00 | N/R (7) | 930,364 |
| | Classical Preparatory School in Albuquerque, New Mexico, Series 2012A, 6.250%, 12/01/42 | | | |
| | (Pre-refunded 12/01/22) | | | |
| 335 | | Public Finance Authority of Wisconsin, Exempt Facilities Revenue Bonds, National Gypsum | 8/26 at 100.00 | N/R | 319,158 |
| | Company Project, Refunding Series 2016, 4.000%, 8/01/35 (AMT) | | | |
| | Public Finance Authority of Wisconsin, Limited Obligation Grant Revenue Bonds, American | | | |
| | Dream @ Meadowlands Project, Series 2017A: | | | |
| 1,665 | | 6.250%, 8/01/27, 144A | No Opt. Call | N/R | 1,432,399 |
| 1,000 | | 6.750%, 8/01/31, 144A | No Opt. Call | N/R | 814,800 |
| | Public Finance Authority of Wisconsin, Limited Obligation PILOT Revenue Bonds, American | | | |
| | Dream @ Meadowlands Project, Series 2017: | | | |
| 2,000 | | 6.750%, 12/01/42, 144A | 12/27 at 100.00 | N/R | 1,715,160 |
| 17,335 | | 7.000%, 12/01/50, 144A | 12/27 at 100.00 | N/R | 14,971,719 |
| 400 | | Public Finance Authority of Wisconsin, Retirement Facility Revenue Bonds, Shalom Park | No Opt. Call | N/R | 244,276 |
| | Development Project, Series 2019, 0.000%, 12/31/24, 144A | | | |
| 3,500 | | Public Finance Authority of Wisconsin, Revenue Bonds, Alabama Gulf Coast Zoo, Series | 9/28 at 100.00 | N/R | 3,096,695 |
| | 2018A, 6.500%, 9/01/48 | | | |
| 500 | | Public Finance Authority of Wisconsin, Revenue Bonds, Alabama Proton Therapy Center, | 10/27 at 100.00 | N/R | 571,920 |
| | Senior Series 2017A, 7.000%, 10/01/47, 144A | | | |
| | Public Finance Authority of Wisconsin, Revenue Bonds, Procure Proton Therapy Center, | | | |
| | Senior Series 2018A: | | | |
| 2,415 | | 6.950%, 7/01/38, 144A | 7/28 at 100.00 | N/R | 2,575,114 |
| 4,585 | | 7.000%, 7/01/48, 144A | 7/28 at 100.00 | N/R | 4,888,160 |
| 1,060 | | Public Finance Authority of Wisconsin, Revenue Bonds, Roseman University of Health | 4/25 at 100.00 | BB | 1,139,161 |
| | Sciences, Series 2015, 5.875%, 4/01/45 | | | |
| 1,000 | | Public Finance Authority of Wisconsin, Revenue Bonds, SearStone Continuing Care | 6/25 at 104.00 | N/R | 1,004,600 |
| | Retirement Community, Series 2020, 6.000%, 6/01/53, 144A | | | |
| 1,000 | | Public Finance Authority of Wisconsin, Revenue Bonds, SearStone Retirement Community of | 6/22 at 104.00 | N/R | 1,020,230 |
| | Cary North Carolina, Series 2016, 6.000%, 6/01/49, 144A | | | |
| | Public Finance Authority of Wisconsin, Senior Revenue Bonds, Maryland Proton Treatment | | | |
| | Center, Series 2018A-1: | | | |
| 1,000 | | 6.125%, 1/01/33, 144A | 1/28 at 100.00 | N/R | 848,130 |
| 2,000 | | 6.250%, 1/01/38, 144A | 1/28 at 100.00 | N/R | 1,624,080 |
| 3,500 | | 6.375%, 1/01/48, 144A | 1/28 at 100.00 | N/R | 2,760,275 |
| 91 | | Public Finance Authority, Wisconsin, Revenue Bonds, Minnesota College of Osteopathic | 12/28 at 100.00 | N/R | 45,647 |
| | Medicine, Senior Series 2019A-1, 0.000%, 12/01/48, 144A (4) | | | |
| | Wisconsin Health and Educational Facilities Authority, Wisconsin, Revenue Bonds, | | | |
| | Ascension Health Alliance Senior Credit Group, Series 2016A: | | | |
| 1,400 | | 4.000%, 11/15/46 (Pre-refunded 5/15/26) (UB) (6) | 5/26 at 100.00 | N/R (7) | 1,666,238 |
| 3,600 | | 4.000%, 11/15/46 (UB) (6) | 5/26 at 100.00 | AA+ | 3,969,216 |
| 67,499 | | Total Wisconsin | | | 62,771,576 |
| $ 1,888,321 | | Total Municipal Bonds (cost $1,547,683,381) | | | 1,572,143,186 |
128
| | | | | | | |
| Shares | | Description (1) | | | | Value |
| | COMMON STOCKS – 1.6% (1.1% of Total Investments) | | | | |
| | Airlines –0.2% (0.2% of Total Investments) | | | | |
| 227,514 | | American Airlines Group Inc (9) | | | | $ 2,566,358 |
| | Electric Utilities – 1.4% (0.9% of Total Investments) | | | | |
| 750,823 | | Energy Harbor Corp (10), (11), (12) | | | | 15,016,460 |
| | Total Common Stocks (cost $27,440,408) | | | | 17,582,818 |
|
| Principal | | | | | | |
| Amount (000) | | Description (1) | Coupon | Maturity | Ratings (3) | Value |
| | CORPORATE BONDS – 0.2% (0.2% of Total Investments) | | | | |
| | Consumer Discretionary – 0.2% (0.2% of Total Investments) | | | | |
| $ 15,000 | | Mashantucket Western Pequot Tribe, Corporate High Yield Bond | 7.350% | 7/01/26 | N/R | $ 2,475,000 |
| | (cash 6.350%, PIK 1.000%) (4) | | | | |
| | Industrials – 0.0% (0.0% of Total Investments) | | | | |
| 402 | | EWM P1 LLC (cash 13.750%, PIK 1.250%) (4), (8) | 15.000% | 9/01/28 | N/R | 4 |
| 299 | | EWM P1 LLC (4), (8) | 15.000% | 9/01/28 | N/R | 3 |
| 70 | | EWM P1 LLC (11) | 15.000% | 9/01/28 | N/R | 69,928 |
| 771 | | Total Industrials | | | | 69,935 |
| | Real Estate – 0.0% (0.0% of Total Investments) | | | | |
| 300 | | Zilkha Biomass Selma LLC (4), (8) | 5.000% | 8/01/28 | N/R | 204,084 |
| 3,170 | | Zilkha Biomass Selma LLC (4), (8) | 10.000% | 8/01/38 | N/R | 31 |
| 3,470 | | Total Real Estate | | | | 204,115 |
| $ 19,241 | | Total Corporate Bonds (cost $7,269,543) | | | | 2,749,050 |
| | Total Long-Term Investments (cost $1,582,393,332) | | | | 1,592,475,054 |
| | Floating Rate Obligations – (39.6)% | | | | (434,051,000) |
| | Adjustable Rate MuniFund Term Preferred Shares, net of deferred offering costs – (7.9)% (13) | | | (86,882,357) |
| | Other Assets Less Liabilities – 2.4% | | | | 25,876,103 |
| | Net Assets Applicable to Common Shares – 100% | | | | $ 1,097,417,800 |
129
| | |
| NMZ | Nuveen Municipal High Income Opportunity Fund Portfolio of Investments (continued) October 31, 2020 |
| | |
(1) | All percentages shown in the Portfolio of Investments are based on net assets applicable to common shares unless otherwise noted. |
(2)
| Optional Call Provisions: Dates (month and year) and prices of the earliest optional call or redemption. There may be other call provisions at varying prices at later dates. Certain mortgage-backed securities may be subject to periodic principal paydowns. Optional Call Provisions are not covered by the report of independent registered public accounting firm. |
(3)
| The ratings disclosed are the lowest of Standard & Poor’s Group (“Standard & Poor’s”), Moody’s Investors Service, Inc. (“Moody’s”) or Fitch, Inc. (“Fitch”) rating. Ratings below BBB by Standard & Poor’s, Baa by Moody’s or BBB by Fitch are considered to be below investment grade. Holdings designated N/R are not rated by any of these national rating agencies. Ratings are not covered by the report of independent registered public accounting firm. |
(4) | Defaulted security. A security whose issuer has failed to fully pay principal and/or interest when due, or is under the protection of bankruptcy. |
(5)
| Step-up coupon bond, a bond with a coupon that increases (“steps up”), usually at regular intervals, while the bond is outstanding. The rate shown is the coupon as of the end of the reporting period. |
(6) | Investment, or portion of investment, has been pledged to collateralize the net payment obligations for investments in inverse floating rate transactions. |
(7) | Backed by an escrow or trust containing sufficient U.S. Government or U.S. Government agency securities, which ensure the timely payment of principal and interest. |
(8) | Investment valued at fair value using methods determined in good faith by, or at the discretion of, the Board. For fair value measurement disclosure purposes, investment classified as Level 3. See Notes to Financial Statements, Note 3 – Investment Valuation and Fair Value Measurements for more information. |
(9)
| On November 28, 2011, AMR Corp. (“AMR”), the parent company of American Airlines Group, Inc. (“AAL”) filed for federal bankruptcy protection. On December 9, 2013, AMR emerged from federal bankruptcy with the acceptance of its reorganization plan by the bankruptcy court. Under the settlement agreement established to meet AMR’s unsecured bond obligations, the bondholders, including the Fund, received a distribution of AAL preferred stock which was converted to AAL common stock over a 120-day period. Every 30 days, a quarter of the preferred stock was converted to AAL common stock based on the 5-day volume-weighted average price and the amount of preferred shares tendered during the optional preferred conversion period. |
(10)
| Common Stock received as part of the bankruptcy settlements for Beaver County Industrial Development Authority, Pennsylvania, Pollution Control Revenue Refunding Bonds, FirstEnergy Nuclear Generation Project, Series 2006A, 3.500%, 4/01/41, Beaver County Industrial Development Authority, Pennsylvania, Pollution Control Revenue Refunding Bonds, FirstEnergy Nuclear Generation Project, Series 2006B, 3.500%, 12/01/35, Ohio Air Quality Development Authority, Ohio, Air Quality Development Revenue Bonds, FirstEnergy Generation Corporation Project, Series 2009A, 5.700%, 8/01/20, Ohio Air Quality Development Authority, Ohio, Pollution Control Revenue Bonds, FirstEnergy Generation Corporation Project, Refunding Series 2009B, 3.100%, 3/01/23, Ohio Air Quality Development Authority, Ohio, Pollution Control Revenue Bonds, FirstEnergy Nuclear Generation Project, Refunding Series 2008C, 3.950%, 11/01/32, Ohio Water Development Authority, Pollution Control Revenue Refunding Bonds, FirstEnergy Nuclear Generating Corporation Project, Series 2005B, 4.000%, 1/01/34, Ohio Water Development Authority, Pollution Control Revenue Refunding Bonds, FirstEnergy Nuclear Generating Corporation Project, Series 2006A, 3.000%, 5/15/20, Ohio Water Development Authority, Pollution Control Revenue Refunding Bonds, FirstEnergy Nuclear Generating Corporation Project, Series 2008B, 3.625%, 10/01/33, Ohio Water Development Authority, Pollution Control Revenue Refunding Bonds, FirstEnergy Nuclear Generating Corporation Project, Series 2008C, 3.950%, 11/01/32, Ohio Water Development Authority, Pollution Control Revenue Refunding Bonds, FirstEnergy Nuclear Generating Corporation Project, Series 2010A, 3.750%, 7/01/33, Pennsylvania Economic Development Financing Authority, Exempt Facilities Revenue Bonds, Shippingport Project, First Energy Guarantor, Series 2006A, 2.550%, 11/01/41. |
|
(11) | For fair value measurement disclosure purposes, investment classified as Level 2. See Notes to Financial Statements, Note 3 – Investment Valuation and Fair Value Measurements for more information.
|
(12) | Non-income producing; issuer has not declared a dividend within the past twelve months. |
(13) | Adjustable Rate MuniFund Term Preferred Shares, net of deferred offering costs as a percentage of Total Investments is 5.5%. |
144A | Investment is exempt from registration under Rule 144A of the Securities Act of 1933, as amended. These investments may only be resold in transactions exempt from registration, which are normally those transactions with qualified institutional buyers.
|
AMT | Alternative Minimum Tax. |
IF | Inverse floating rate security issued by a tender option bond (“TOB”) trust, the interest rate on which varies inversely with the Securities Industry Financial Markets Association (SIFMA) short-term rate, which resets weekly, or a similar short-term rate, and is reduced by the expenses related to the TOB trust.
|
PIK | Payment-in-kind (“PIK”) security. Depending on the terms of the security, income may be received in the form of cash, securities, or a combination of both. The PIK rate shown, where applicable, represents the annualized rate of the last PIK payment made by the issuer as of the end of the reporting period.
|
UB | Underlying bond of an inverse floating rate trust reflected as a financing transaction. See Notes to Financial Statements, Note 4 – Portfolio Securities and Investments in Derivatives for more information.
|
WI/DD | Purchased on a when-issued or delayed delivery basis. |
| See accompanying notes to financial statements. |
130
| | |
| NMCO | Nuveen Municipal Credit Opportunities Fund Portfolio of Investments October 31, 2020 |
| | | | | | |
| Principal | | | Optional Call | | |
| Amount (000) | | Description (1) | Provisions (2) | Ratings (3) | Value |
| | LONG-TERM INVESTMENTS – 161.9% (98.6% of Total Investments) | | | |
| | MUNICIPAL BONDS – 159.1% (96.9% of Total Investments) | | | |
| | Alabama – 6.2% (3.8% of Total Investments) | | | |
| $ 43,450 | | Hoover Industrial Development Board, Alabama, Environmental Improvement Revenue Bonds, | 10/29 at 100.00 | Caa2 | $ 38,352,880 |
| | United States Steel Corporation Project, Series 2019, 5.750%, 10/01/49 (AMT) | | | |
| 3,500 | | Tuscaloosa County Industrial Development Authority, Alabama, Gulf Opportunity Zone | 5/29 at 100.00 | N/R | 3,844,155 |
| | Bonds, Hunt Refining Project, Refunding Series 2019A, 5.250%, 5/01/44, 144A | | | |
| 46,950 | | Total Alabama | | | 42,197,035 |
| | Alaska – 1.0% (0.6% of Total Investments) | | | |
| | Northern Tobacco Securitization Corporation, Alaska, Tobacco Settlement Asset-Backed | | | |
| | Bonds, Series 2006A: | | | |
| 1,510 | | 5.000%, 6/01/32 | 11/20 at 100.00 | B3 | 1,510,377 |
| 5,195 | | 5.000%, 6/01/46 | 11/20 at 100.00 | B3 | 5,217,027 |
| 6,705 | | Total Alaska | | | 6,727,404 |
| | Arizona – 5.1% (3.1% of Total Investments) | | | |
| 4,000 | | Arizona Industrial Development Authority, Arizona, Education Facility Revenue Bonds, Leman | 7/24 at 101.00 | N/R | 4,126,560 |
| | Academy of Excellence ? East Tucson & Central Tucson Projects, Series 2019A, 5.000%, | | | |
| | 7/01/49, 144A | | | |
| | Arizona Industrial Development Authority, Arizona, Education Revenue Bonds, Academies of | | | |
| | Math & Science Projects, Series 2019: | | | |
| 1,860 | | 5.000%, 7/01/49, 144A | 7/29 at 100.00 | BB | 1,961,482 |
| 1,500 | | 5.000%, 7/01/54, 144A | 7/29 at 100.00 | BB | 1,575,180 |
| 340 | | Arizona Industrial Development Authority, Arizona, Education Revenue Bonds, Pinecrest | 7/28 at 100.00 | BB+ | 339,524 |
| | Academy-Cadence Campus Project, Series 2020A, 4.000%, 7/15/40, 144A | | | |
| 1,000 | | Maricopa County Industrial Development Authority, Arizona, Education Revenue Bonds, | 1/30 at 100.00 | N/R | 1,006,280 |
| | Gateway Academy Project, Series 2019A, 5.750%, 1/01/50, 144A | | | |
| | Maricopa County Industrial Development Authority, Arizona, Education Revenue Bonds, | | | |
| | Legacy Traditional Schools Projects, Taxable Series 2019B: | | | |
| 2,000 | | 5.000%, 7/01/39, 144A | 7/29 at 100.00 | Ba2 | 2,164,420 |
| 5,355 | | 5.000%, 7/01/49, 144A | 7/29 at 100.00 | Ba2 | 5,707,091 |
| 1,525 | | 5.000%, 7/01/54, 144A | 7/29 at 100.00 | Ba2 | 1,620,023 |
| 600 | | Phoenix Industrial Development Authority, Arizona, Education Facility Revenue Bonds, | 7/25 at 100.00 | BB | 637,056 |
| | Basis Schools, Inc Projects, Series 2016A, 5.000%, 7/01/35, 144A | | | |
| 280 | | Phoenix Industrial Development Authority, Arizona, Education Facility Revenue Bonds, | 9/30 at 100.00 | Ba2 | 288,758 |
| | Northwest Christian School Project, Series 2020A, 5.000%, 9/01/55, 144A | | | |
| 2,700 | | Phoenix Industrial Development Authority, Arizona, Lease Revenue Bonds, Guam Facilities | 2/24 at 100.00 | B+ | 2,749,761 |
| | Foundation, Inc Project, Series 2014, 5.375%, 2/01/41 | | | |
| 3,540 | | Pima County Industrial Development Authority, Arizona, Education Facility Revenue Bonds, | 6/22 at 100.00 | N/R | 3,562,727 |
| | American Leadership Academy Project, Series 2017, 5.000%, 6/15/52, 144A | | | |
| 500 | | Pima County Industrial Development Authority, Arizona, Education Facility Revenue Bonds, | 6/25 at 100.00 | N/R | 508,625 |
| | American Leadership Academy Project, Series 2019, 5.000%, 6/15/52, 144A | | | |
| | Pima County Industrial Development Authority, Arizona, Education Facility Revenue Bonds, | | | |
| | Edkey Charter Schools Project, Refunding Series 2013: | | | |
| 1,005 | | 6.000%, 7/01/43 | 11/20 at 102.00 | BB– | 1,026,085 |
| 1,000 | | 6.000%, 7/01/48 | 11/20 at 102.00 | BB– | 1,020,940 |
| 1,000 | | Pima County Industrial Development Authority, Arizona, Education Facility Revenue Bonds, | 7/26 at 103.00 | N/R | 1,065,050 |
| | Edkey Charter Schools Project, Series 2019, 5.875%, 7/01/51, 144A | | | |
| 50 | | Pima County Industrial Development Authority, Arizona, Education Facility Revenue Bonds, | 7/26 at 100.00 | N/R | 50,884 |
| | Imagine East Mesa Charter Schools Project, Series 2019, 5.000%, 7/01/49, 144A | | | |
| 380 | | Pima County Industrial Development Authority, Arizona, Education Facility Revenue Bonds, | 6/28 at 100.00 | N/R | 381,634 |
| | Synergy Public Charter School Project, Series 2020, 5.250%, 6/15/50, 144A | | | |
131
| | |
| NMCO | Nuveen Municipal Credit Opportunities Fund Portfolio of Investments (continued) October 31, 2020 |
| | | | | | |
| Principal | | | Optional Call | | |
| Amount (000) | | Description (1) | Provisions (2) | Ratings (3) | Value |
| | Arizona (continued) | | | |
| | Tempe Industrial Development Authority, Arizona, Revenue Bonds, Mirabella at ASU | | | |
| | Project, Series 2017A: | | | |
| $ 2,205 | | 6.000%, 10/01/37, 144A | 10/27 at 100.00 | N/R | $ 2,290,642 |
| 2,350 | | 6.125%, 10/01/52, 144A | 10/27 at 100.00 | N/R | 2,410,301 |
| 33,190 | | Total Arizona | | | 34,493,023 |
| | Arkansas – 4.0% (2.4% of Total Investments) | | | |
| 27,050 | | Arkansas Development Finance Authority, Industrial Development Revenue Bonds, Big River | 9/26 at 103.00 | B | 27,117,354 |
| | Steel Project, Series 2019, 4.500%, 9/01/49 (AMT), 144A | | | |
| | California – 6.4% (3.9% of Total Investments) | | | |
| 2,500 | | California Community Housing Agency, California, Essential Housing Revenue Bonds, | 2/30 at 100.00 | N/R | 2,788,900 |
| | Serenity at Larkspur Apartments, Series 2020A, 5.000%, 2/01/50, 144A | | | |
| 1,555 | | California County Tobacco Securitization Agency, Tobacco Settlement Asset-Backed Bonds, | 6/30 at 26.72 | N/R | 277,427 |
| | Los Angeles County Securitization Corporation, Series 2020B-2, 0.000%, 6/01/55 | | | |
| 1,530 | | California Enterprise Development Authority, Charter School Revenue Bonds, Norton | 7/27 at 102.00 | N/R | 1,569,933 |
| | Science and Language Academy Project, Series 2020, 6.250%, 7/01/58, 144A | | | |
| 2,500 | | California Municipal Finance Authority, Special Facility Revenue Bonds, United Airlines, | No Opt. Call | B+ | 2,488,975 |
| | Inc Los Angeles International Airport Project, Series 2019, 4.000%, 7/15/29 (AMT) | | | |
| 1,385 | | California Public Finance Authority, Charter School Lease Revenue Bonds, California | 7/28 at 100.00 | N/R | 1,385,000 |
| | Crosspoint Academy Project, Series 2020A, 5.125%, 7/01/55, 144A (WI/DD, Settling 11/10/20) | | | |
| | California School Finance Authority, California, Charter School Revenue Bonds, Encore | | | |
| | Education Obligated Group, Series 2016A: | | | |
| 4,020 | | 5.000%, 6/01/42, 144A | 6/26 at 100.00 | N/R | 3,758,097 |
| 4,380 | | 5.000%, 6/01/52, 144A | 6/26 at 100.00 | N/R | 3,950,804 |
| | California School Finance Authority, Charter School Revenue Bonds, Arts in Action | | | |
| | Charter Schools – Obligated Group, Series 2020A: | | | |
| 1,410 | | 5.000%, 6/01/50, 144A | 6/27 at 100.00 | N/R | 1,490,793 |
| 700 | | 5.000%, 6/01/59, 144A | 6/27 at 100.00 | N/R | 736,393 |
| 2,065 | | California Statewide Communities Development Authority, California, Revenue Bonds, Loma | 12/24 at 100.00 | BB– | 2,234,619 |
| | Linda University Medical Center, Series 2014A, 5.500%, 12/01/54 | | | |
| | California Statewide Communities Development Authority, California, Revenue Bonds, Loma | | | |
| | Linda University Medical Center, Series 2016A: | | | |
| 1,480 | | 5.000%, 12/01/41, 144A | 6/26 at 100.00 | BB– | 1,617,196 |
| 10,090 | | 5.250%, 12/01/56, 144A | 6/26 at 100.00 | BB– | 11,102,229 |
| 1,095 | | California Statewide Communities Development Authority, California, Revenue Bonds, Loma | 6/28 at 100.00 | BB– | 1,238,281 |
| | Linda University Medical Center, Series 2018A, 5.500%, 12/01/58, 144A | | | |
| | California Statewide Community Development Authority, Revenue Bonds, Daughters of | | | |
| | Charity Health System, Series 2005A: | | | |
| 1,665 | | 5.750%, 7/01/24 (4) | 11/20 at 100.00 | N/R | 1,531,543 |
| 21 | | 5.750%, 7/01/30 (4) | 11/20 at 100.00 | N/R | 19,387 |
| 798 | | 5.750%, 7/01/35 (4) | 11/20 at 100.00 | N/R | 734,268 |
| 1,307 | | California Statewide Community Development Authority, Revenue Bonds, Daughters of | 11/20 at 100.00 | N/R | 1,201,970 |
| | Charity Health System, Series 2005G, 5.500%, 7/01/22 (4) | | | |
| 595 | | California Statewide Community Development Authority, Revenue Bonds, Daughters of | 11/20 at 100.00 | N/R | 547,672 |
| | Charity Health System, Series 2005H, 5.750%, 7/01/25 (4) | | | |
| 25,000 | | California Statewide Financing Authority, Tobacco Settlement Asset-Backed Bonds, Pooled | 11/20 at 20.76 | N/R | 5,180,250 |
| | Tobacco Securitization Program, Series 2006A, 0.000%, 6/01/46 | | | |
| 64,096 | | Total California | | | 43,853,737 |
| | Colorado – 10.0% (6.1% of Total Investments) | | | |
| 1,000 | | Broadway Station Metropolitan District 3, Denver City and County, Colorado, General | 6/24 at 103.00 | N/R | 1,033,060 |
| | Obligation Limited Tax Bonds, Convertible to Unlimited Series 2019A, 5.000%, 12/01/49 | | | |
| 1,000 | | Broadway Station Metropolitan District 3, Denver City and County, Colorado, General | 6/24 at 79.97 | N/R | 607,880 |
| | Obligation Limited Tax Bonds, Subordinate Convertible to Senior Capital Appreciation Series | | | |
| | 2019B, 0.000%, 12/01/49 | | | |
132
| | | | | | |
| Principal | | | Optional Call | | |
| Amount (000) | | Description (1) | Provisions (2) | Ratings (3) | Value |
| | Colorado (continued) | | | |
| $ 500 | | Colorado Educational and Cultural Facilities Authority, Charter School Revenue Bonds | 10/27 at 100.00 | N/R | $ 506,160 |
| | World Compass Academy Project, Series 2017, 5.375%, 10/01/37 | | | |
| | Colorado Educational and Cultural Facilities Authority, Charter School Revenue Bonds, | | | |
| | Loveland Classical Schools Project, Series 2016: | | | |
| 530 | | 3.750%, 7/01/26, 144A | No Opt. Call | BB | 534,039 |
| 500 | | 5.000%, 7/01/36, 144A | 7/26 at 100.00 | BB | 511,090 |
| 10,170 | | Colorado Educational and Cultural Facilities Authority, Revenue Bonds, Rocky Mountain | 10/27 at 100.00 | Ba1 | 10,471,235 |
| | Classical Academy Project, Refunding Series 2019, 5.000%, 10/01/59, 144A | | | |
| 12,485 | | Colorado Health Facilities Authority, Colorado, Revenue Bonds, CommonSpirit Health, | 8/29 at 100.00 | BBB+ | 12,053,768 |
| | Series 2019A-2, 3.250%, 8/01/49 | | | |
| 1,000 | | Copper Ridge Metropolitan District, Colorado Springs, Colorado, Tax Increment and Sales | 12/24 at 103.00 | N/R | 942,460 |
| | Tax Supported Revenue Bonds, Series 2019, 5.000%, 12/01/39 | | | |
| | Denver International Business Center Metropolitan District 1, Colorado, General | | | |
| | Obligation Bonds, Limited Tax Convertible to Unlimited Tax, Refunding Series 2010: | | | |
| 345 | | 5.000%, 12/01/30 | 12/20 at 100.00 | BBB– | 346,273 |
| 215 | | 5.375%, 12/01/35 | 12/20 at 100.00 | BBB– | 215,856 |
| 14,000 | | Hess Ranch Metropolitan District 6, Parker, Colorado, Limited Tax General Obligation | 3/25 at 93.28 | N/R | 10,088,820 |
| | Bonds, Convertible Capital Appreciation Series 2020A-2, 0.000%, 12/01/49 (5) | | | |
| 5,500 | | Hess Ranch Metropolitan District 6, Parker, Colorado, Limited Tax General Obligation | 3/25 at 103.00 | N/R | 5,698,990 |
| | Bonds, Series 2020A-1, 5.000%, 12/01/49 | | | |
| 1,075 | | Indy Oak Tod Metropolitan District, Lakewood, Jefferson County, Colorado, Limited Tax | 6/25 at 103.00 | N/R | 1,133,459 |
| | General Obligation Bonds, Convertible to Unlimited Tax Series 2020A, 5.500%, 12/01/50, 144A | | | |
| 500 | | Iron Mountain Metropolitan District 2, Windsor, Weld County, Colorado, Limited Tax | 12/24 at 103.00 | N/R | 477,860 |
| | General Obligation Bonds, Refunding & Improvement Series 2019A, 5.000%, 12/01/49 | | | |
| 500 | | Mountain Shadows Metropolitan District, Colorado, General Obligation Limited Tax Bonds, | 12/25 at 100.00 | N/R | 510,045 |
| | Refunding Series 2016, 4.000%, 12/01/26 | | | |
| 1,000 | | North Range Metropolitan District No 3, 5.250%, 12/01/50 | 12/25 at 103.00 | N/R | 1,000,000 |
| 515 | | North Vista Highlands Metropolitan District 3, Pueblo County, Colorado, Limited Tax | 3/25 at 103.00 | N/R | 523,611 |
| | General Obligation Bonds, Series 2020, 5.125%, 12/01/49 | | | |
| | Painted Prairie Public Improvement Authority, Aurora, Colorado, Special Revenue Bonds, | | | |
| | Series 2019: | | | |
| 5,000 | | 5.000%, 12/01/39 | 12/24 at 103.00 | N/R | 5,270,750 |
| 5,000 | | 5.000%, 12/01/49 | 12/24 at 103.00 | N/R | 5,202,150 |
| 1,000 | | Palisade Metropolitan District 2, Broomfield County, Colorado, General Obligation | 12/24 at 103.00 | N/R | 1,008,890 |
| | Limited Tax Bonds, Subordinate Series 2019, 7.250%, 12/15/49 | | | |
| 705 | | Penrith Park Metropolitan District, Adams County, Colorado, General Obligation Limited | 12/24 at 103.00 | N/R | 714,482 |
| | Tax Bonds, Series 2019A, 5.000%, 12/01/49 | | | |
| 1,200 | | Sky Ranch Community Authority Board, Arapahoe County, Colorado, Limited Tax Supported | 12/24 at 102.00 | N/R | 1,222,608 |
| | District 1 Revenue Bonds, Senior Series 2019A, 5.000%, 12/01/49 | | | |
| 880 | | Sky Ranch Community Authority Board, Arapahoe County, Colorado, Limited Tax Supported | 12/24 at 102.00 | N/R | 891,343 |
| | District 1 Revenue Bonds, Subordinate Series 2019B, 7.625%, 12/15/49 | | | |
| 500 | | STC Metropolitan District 2, Superior, Boulder County, Colorado, Limited Tax General Obligation | 12/24 at 103.00 | N/R | 507,100 |
| | and Special Revenue Bonds, Refunding & improvement Series 2019A, 5.000%, 12/01/49 | | | |
| 760 | | Talon Pointe Metropolitan District, Adams County, Colorado, Limited Tax General Obligation | 12/25 at 103.00 | N/R | 778,331 |
| | Bonds, Convertible to Unlimited Tax Refunding & Improvement Series 2019A, 5.250%, 12/01/51 | | | |
| | Thompson Crossing Metropolitan District 4, Johnstown, Larimer County, Colorado, General | | | |
| | Obligation Bonds, Limited Tax Convertible to Unlimited Tax, Refunding & Improvement Series 2019: | | | |
| 1,400 | | 5.000%, 12/01/39 | 9/24 at 103.00 | N/R | 1,470,042 |
| 2,125 | | 5.000%, 12/01/49 | 9/24 at 103.00 | N/R | 2,170,432 |
| 1,000 | | Ward TOD Metropolitan District 1, Wheat Ridge, Jefferson County, Colorado, Limited Tax | 12/24 at 103.00 | N/R | 1,009,450 |
| | General Obligation Bonds, Convertible to Unlimited Tax Series 2019A, 5.000%, 12/01/49 | | | |
| 1,000 | | Willow Bend Metropolitan District, City of Thornton, Adams County, Colorado, Limited Tax | 9/24 at 103.00 | N/R | 1,020,800 |
| | General Obligation Bonds, Convertible to Unlimited Tax Series 2019A, 5.000%, 12/01/49 | | | |
| 71,405 | | Total Colorado | | | 67,920,984 |
133
| | |
| NMCO | Nuveen Municipal Credit Opportunities Fund Portfolio of Investments (continued) October 31, 2020 |
| | | | | | |
| Principal | | | Optional Call | | |
| Amount (000) | | Description (1) | Provisions (2) | Ratings (3) | Value |
| | Connecticut – 0.1% (0.1% of Total Investments) | | | |
| $ 12,252 | | Mashantucket Western Pequot Tribe, Connecticut, Special Revenue Bonds, Subordinate | No Opt. Call | N/R | $ 796,410 |
| | Series 2013A, 0.070%, 7/01/31 (cash 4.000%, PIK 2.050%) (4) | | | |
| | Delaware – 0.2% (0.1% of Total Investments) | | | |
| 1,500 | | Delaware Economic Development Authority, Exempt Facility Revenue Bonds, Indian River | 11/20 at 100.00 | Baa2 | 1,503,705 |
| | Power LLC Project, Series 2010, 5.375%, 10/01/45 | | | |
| | District of Columbia – 2.9% (1.8% of Total Investments) | | | |
| 87,000 | | District of Columbia Tobacco Settlement Corporation, Tobacco Settlement Asset-Backed | 11/20 at 20.76 | N/R | 18,017,700 |
| | Bonds, Series 2006A, 0.000%, 6/15/46 | | | |
| 2,000 | | District of Columbia, Revenue Bonds, Saint Paul on Fourth Street, Inc, Series 2019A, | 5/30 at 100.00 | N/R | 1,809,200 |
| | 5.250%, 5/15/55, 144A | | | |
| 89,000 | | Total District of Columbia | | | 19,826,900 |
| | Florida – 18.9% (11.5% of Total Investments) | | | |
| | Academical Village Community Development District, Davie, Florida, Special Assessment | | | |
| | Revenue Bonds, Series 2020: | | | |
| 2,000 | | 3.625%, 5/01/40 | 5/30 at 100.00 | N/R | 2,009,180 |
| 1,000 | | 4.000%, 5/01/51 | 5/30 at 100.00 | N/R | 1,013,970 |
| | Cape Coral Health Facilities Authority, Florida, Senior Housing Revenue Bonds, Gulf Care | | | |
| | Inc Project, Series 2015: | | | |
| 4,370 | | 5.875%, 7/01/40, 144A | 7/25 at 100.00 | N/R | 4,346,926 |
| 2,500 | | 6.000%, 7/01/45, 144A | 7/25 at 100.00 | N/R | 2,490,200 |
| | Capital Trust Agency, Florida, Educational Facilities Lease Revenue Bonds, Franklin | | | |
| | Academy Projects, Series 2020: | | | |
| 140 | | 5.000%, 12/15/35, 144A | 7/26 at 100.00 | N/R | 150,213 |
| 100 | | 5.000%, 12/15/50, 144A | 7/26 at 100.00 | N/R | 105,131 |
| 100 | | Capital Trust Agency, Florida, Educational Facilities Revenue Bonds, Imagine School at | 12/30 at 100.00 | Ba1 | 105,186 |
| | Land O’Lakes Project, Series 2020A, 5.000%, 12/15/49, 144A | | | |
| 1,950 | | Capital Trust Agency, Florida, Educational Facilities Revenue Bonds, Pineapple Cove | 1/29 at 100.00 | N/R | 2,043,210 |
| | Classical Academy, Series 2019A, 5.125%, 7/01/39, 144A | | | |
| 1,000 | | Capital Trust Agency, Florida, Revenue Bonds, Tuscan Gardens Senior Living Community | 4/22 at 103.00 | N/R | 648,250 |
| | Project, Series 2015A, 7.000%, 4/01/49 | | | |
| | Capital Trust Agency, Florida, Senior Living Facilities Revenue Bonds, Elim Senior | | | |
| | Housing, Inc Project, Series 2017: | | | |
| 1,490 | | 5.625%, 8/01/37, 144A | 8/24 at 103.00 | N/R | 1,201,596 |
| 3,735 | | 5.875%, 8/01/52, 144A | 8/24 at 103.00 | N/R | 2,787,655 |
| 170 | | Cypress Preserve Community Development District, Pasco County, Florida, Special | 11/29 at 100.00 | N/R | 172,737 |
| | Assessment Bonds, Assessment Area 2, Series 2019, 4.125%, 11/01/50 | | | |
| | Epperson North Community Development District, Florida, Capital Improvement Revenue | | | |
| | Bonds, Assessment Area 1, Series 2018A-1: | | | |
| 1,000 | | 5.500%, 11/01/39, 144A | 11/29 at 100.00 | N/R | 1,120,400 |
| 1,000 | | 5.750%, 11/01/49, 144A | 11/29 at 100.00 | N/R | 1,124,120 |
| | Florida Development Finance Corporation, Educational Facilities Revenue Bonds, Miami | | | |
| | Arts Charter School Projects, Series 2014: | | | |
| 165 | | 5.000%, 6/15/24, 144A | No Opt. Call | N/R | 160,373 |
| 2,500 | | 5.875%, 6/15/34, 144A | 6/24 at 100.00 | N/R | 2,334,350 |
| 5,795 | | 6.000%, 6/15/44, 144A | 6/24 at 100.00 | N/R | 5,178,528 |
| | Florida Development Finance Corporation, Educational Facilities Revenue Bonds, Pepin | | | |
| | Academies of Pasco County Inc, Series 2020A: | | | |
| 2,435 | | 5.000%, 1/01/40, 144A | 1/27 at 100.00 | N/R | 2,478,757 |
| 500 | | 5.000%, 1/01/50, 144A | 1/27 at 100.00 | N/R | 503,655 |
| 3,000 | | Florida Development Finance Corporation, Educational Facilities Revenue Bonds, | 6/23 at 100.00 | N/R | 3,367,080 |
| | Renaissance Charter School, Inc Projects, Series 2013A, 8.500%, 6/15/44 | | | |
| 1,575 | | Florida Development Finance Corporation, Educational Facilities Revenue Bonds, Southwest | 6/27 at 100.00 | N/R | 1,646,473 |
| | Charter Foundation Inc Projects, Series 2017A, 6.000%, 6/15/37, 144A | | | |
134
| | | | | | |
| Principal | | | Optional Call | | |
| Amount (000) | | Description (1) | Provisions (2) | Ratings (3) | Value |
| | Florida (continued) | | | |
| | Florida Development Finance Corporation, Florida, Surface Transportation Facility | | | |
| | Revenue Bonds, Virgin Trains USA Passenger Rail Project , Series 2019A: | | | |
| $ 11,795 | | 6.250%, 1/01/49 (AMT) (Mandatory Put 1/01/24), 144A | 11/20 at 104.00 | N/R | $ 10,256,578 |
| 3,200 | | 6.375%, 1/01/49 (AMT) (Mandatory Put 1/01/26), 144A | 11/20 at 105.00 | N/R | 2,747,392 |
| 47,815 | | 6.500%, 1/01/49 (AMT) (Mandatory Put 1/01/29), 144A | 11/20 at 105.00 | N/R | 40,968,370 |
| 7,000 | | Florida Development Finance Corporation, Student Housing Revenue Bonds, Midtown Campus | 12/23 at 105.00 | N/R | 6,440,000 |
| | Properties LLC Project, Series 2019, 6.875%, 12/01/38, 144A (4) | | | |
| | Greater Orlando Aviation Authority, Florida, Special Purpose Airport Facilities Revenue | | | |
| | Bonds, JetBlue Airways Corporation, Series 2013: | | | |
| 2,500 | | 5.000%, 11/15/26 (AMT) | 5/23 at 100.00 | N/R | 2,563,525 |
| 1,740 | | 5.000%, 11/15/36 (AMT) | 5/23 at 100.00 | N/R | 1,759,592 |
| 1,570 | | Lee County Industrial Development Authority, Florida, Charter School Revenue Bonds, Lee | 11/20 at 100.00 | BB– | 1,571,225 |
| | County Community Charter Schools, Series 2007A, 5.250%, 6/15/27 | | | |
| | Lee County Industrial Development Authority, Florida, Healthcare Facilities Revenue | | | |
| | Bonds, Preserve Project, Series 2017A: | | | |
| 1,000 | | 5.375%, 12/01/32, 144A | 12/22 at 105.00 | N/R | 1,011,980 |
| 1,100 | | 5.625%, 12/01/37, 144A | 12/22 at 105.00 | N/R | 1,109,845 |
| 1,300 | | 5.750%, 12/01/52, 144A | 12/22 at 105.00 | N/R | 1,288,638 |
| 690 | | LT Ranch Community Development District, Sarasota County, Florida, Capital Improvement | 5/30 at 100.00 | N/R | 707,560 |
| | Revenue Bonds, Series 2019, 4.000%, 5/01/40 | | | |
| | Miami Health Facilities Authority, Florida, Health Facilities Revenue Bonds, Miami | | | |
| | Jewish Health System Inc Project, Series 2017: | | | |
| 1,260 | | 5.000%, 7/01/26 | No Opt. Call | BB+ | 1,199,003 |
| 1,000 | | 5.000%, 7/01/27 | No Opt. Call | BB+ | 940,440 |
| 1,410 | | Miami World Center Community Development District, Miami-Dade County, Florida, Special | 11/27 at 100.00 | N/R | 1,531,923 |
| | Assessment Bonds, Series 2017, 5.125%, 11/01/39 | | | |
| 4,935 | | North Springs Improvement District, Broward County, Florida, Special Assessment Bonds, | 5/28 at 100.00 | N/R | 5,402,789 |
| | Area C, Series 2017, 5.000%, 5/01/38 | | | |
| 500 | | Osceola County, Florida, Transportation Revenue Bonds, Osceola Parkway, Refunding & | 10/29 at 40.38 | BBB– | 146,930 |
| | Improvement Capital Appreciation Series 2019A-2, 0.000%, 10/01/54 | | | |
| 100 | | Parker Road Community Development District, Florida, Capital Improvement Revenue Bonds, | 5/30 at 100.00 | N/R | 100,789 |
| | Refunding Series 2020, 3.875%, 5/01/40 | | | |
| 125 | | Portico Community Development District, Lee County, Florida, Special Assessment, | 5/30 at 100.00 | N/R | 123,003 |
| | Refunding Improvement Series 2020-1, 3.500%, 5/01/37 | | | |
| | Seminole County Industrial Development Authority, Florida, Retirement Facility Revenue | | | |
| | Bonds, Legacy Pointe At UCF Project, Series 2019A: | | | |
| 3,970 | | 5.500%, 11/15/49 | 11/26 at 103.00 | N/R | 3,602,735 |
| 2,440 | | 5.750%, 11/15/54 | 11/26 at 103.00 | N/R | 2,240,018 |
| 2,550 | | Three Rivers Community Development District, Florida, Special Assessment Revenue Bonds, | 5/29 at 100.00 | N/R | 2,652,561 |
| | Series 2019A-1, 4.750%, 5/01/50 | | | |
| 1,560 | | Three Rivers Community Development District, Florida, Special Assessment Revenue Bonds, | No Opt. Call | N/R | 1,602,370 |
| | Series 2019A-2, 4.750%, 5/01/29 | | | |
| 500 | | Tuscaloosa County Industrial Development Authority, Alabama, Gulf Opportunity Zone | 5/29 at 100.00 | N/R | 534,190 |
| | Bonds, Hunt Refining Project, Refunding Series 2019A, 4.500%, 5/01/32, 144A | | | |
| 1,960 | | Twin Creeks North Community Development District, Florida, Special Assessment Bonds, | 11/31 at 100.00 | N/R | 2,191,084 |
| | Master Infrastructure Improvements, Series 2016A-1, 6.375%, 11/01/47 | | | |
| 500 | | West Villages Improvement District, Florida, Special Assessment Revenue Bonds, Unit of | No Opt. Call | N/R | 509,865 |
| | Development 1, Series 2017, 4.000%, 5/01/27 | | | |
| 900 | | Westside Community Development District, Florida, Special Assessment Revenue Bonds, | 5/29 at 100.00 | N/R | 934,983 |
| | Refunding Series 2019, 4.125%, 5/01/38, 144A | | | |
| 139,945 | | Total Florida | | | 129,125,378 |
135
| | |
| NMCO | Nuveen Municipal Credit Opportunities Fund Portfolio of Investments (continued) October 31, 2020 |
| | | | | | |
| Principal | | | Optional Call | | |
| Amount (000) | | Description (1) | Provisions (2) | Ratings (3) | Value |
| | Georgia – 3.2% (2.0% of Total Investments) | | | |
| | Atlanta Development Authority, Georgia, Senior Health Care Facilities Revenue Bonds, | | | |
| | Georgia Proton Treatment Center Project, Current Interest Series 2017A-1: | | | |
| $ 1,250 | | 6.500%, 1/01/29 | 1/28 at 100.00 | N/R | $ 813,975 |
| 7,030 | | 6.750%, 1/01/35 | 1/28 at 100.00 | N/R | 4,575,405 |
| 16,765 | | 7.000%, 1/01/40 | 1/28 at 100.00 | N/R | 10,909,656 |
| 4,504 | | Clayton County Development Authority, Georgia, Special Facilities Revenue Bonds, Delta | 11/20 at 100.00 | B+ | 4,520,035 |
| | Air Lines, Inc Project, Series 2009A, 8.750%, 6/01/29 | | | |
| 441 | | Georgia Local Governments, Certificates of Participation, Georgia Municipal Association, | No Opt. Call | Baa2 | 494,837 |
| | Series 1998A, 4.750%, 6/01/28 – NPFG Insured | | | |
| 850 | | White County Development Authority, Georgia, Revenue Bonds Truett McConnell University, | 10/26 at 103.00 | N/R | 853,885 |
| | Series 2019, 5.125%, 10/01/39 | | | |
| 30,840 | | Total Georgia | | | 22,167,793 |
| | Guam – 0.8% (0.5% of Total Investments) | | | |
| 980 | | Government of Guam, Hotel Occupancy Tax Revenue Bonds, Series 2011A, 5.750%, 11/01/21 | 5/21 at 100.00 | BB | 988,163 |
| 4,150 | | Guam Government, General Obligation Bonds, Series 2019, 5.000%, 11/15/31 (AMT) | 5/29 at 100.00 | BB– | 4,415,725 |
| 5,130 | | Total Guam | | | 5,403,888 |
| | Hawaii – 0.7% (0.5% of Total Investments) | | | |
| 1,150 | | Hawaii Department of Budget and Finance, Special Purpose Revenue Bonds, Chaminade | 1/25 at 100.00 | Ba3 | 937,618 |
| | University of Honolulu, Series 2015A, 5.000%, 1/01/45, 144A | | | |
| 4,090 | | Hawaii State Department of Transportation, Special Facility Revenue Bonds, Continental | 11/20 at 100.00 | B+ | 4,094,376 |
| | Airlines Inc, Series 1997, 5.625%, 11/15/27 (AMT) | | | |
| 5,240 | | Total Hawaii | | | 5,031,994 |
| | Illinois – 18.6% (11.4% of Total Investments) | | | |
| 1,305 | | Chicago Board of Education, Illinois, General Obligation Bonds, Dedicated Revenues, | 12/20 at 100.00 | B1 | 1,306,436 |
| | Refunding Series 2010F, 5.000%, 12/01/31 | | | |
| | Chicago, Illinois, General Obligation Bonds, Project Series 2011A: | | | |
| 5,575 | | 5.250%, 1/01/35 | 1/21 at 100.00 | Ba1 | 5,576,895 |
| 2,500 | | 5.000%, 1/01/40 | 1/21 at 100.00 | Ba1 | 2,499,700 |
| 2,800 | | Chicago, Illinois, General Obligation Bonds, Refunding Series 2016C, 5.000%, 1/01/38 | 1/26 at 100.00 | BBB– | 2,867,564 |
| | Chicago, Illinois, General Obligation Bonds, Series 2019A: | | | |
| 4,485 | | 5.000%, 1/01/44 | 1/29 at 100.00 | BBB– | 4,532,631 |
| 9,475 | | 5.500%, 1/01/49 | 1/29 at 100.00 | BBB– | 10,034,499 |
| 3,965 | | Chicago, Illinois, General Obligation Bonds, Variable Rate Demand Series 2007F, | 1/25 at 100.00 | Ba1 | 4,111,467 |
| | 5.500%, 1/01/42 | | | |
| 345 | | Evergreen Park, Cook County, Illinois, Sales Tax Revenue Bonds, Evergreen Plaza | 12/29 at 100.00 | N/R | 318,846 |
| | Development Project, Senior Lien Series 2019A, 4.375%, 12/01/36, 144A | | | |
| 11,850 | | Illinois Finance Authority, Revenue Bonds, Admiral at the Lake Project, Refunding Series | 5/24 at 103.00 | N/R | 10,063,612 |
| | 2017, 5.250%, 5/15/54 | | | |
| 5,000 | | Illinois Finance Authority, Student Housing Revenue Bonds, CHF-Collegiate Housing | 7/25 at 100.00 | B– | 4,176,800 |
| | Foundation – Cook LLC Northeastern Illinois University Project, Series 2015A, | | | |
| | 5.000%, 7/01/47 | | | |
| 1,000 | | Illinois State, General Obligation Bonds, June Series 2016, 4.000%, 6/01/34 | 6/26 at 100.00 | BBB– | 984,520 |
| 4,840 | | Illinois State, General Obligation Bonds, May Series 2018A, 5.000%, 5/01/32 | 5/28 at 100.00 | BBB– | 5,152,954 |
| 890 | | Illinois State, General Obligation Bonds, May Series 2020, 5.500%, 5/01/39 | 5/30 at 100.00 | BBB– | 982,097 |
| | Illinois State, General Obligation Bonds, November Series 2017D: | | | |
| 4,600 | | 5.000%, 11/01/28 | 11/27 at 100.00 | BBB– | 4,956,316 |
| 10,000 | | 5.000%, 11/01/28 (UB) (6) | 11/27 at 100.00 | BBB– | 10,774,600 |
| | Illinois State, General Obligation Bonds, November Series 2019C: | | | |
| 15,000 | | 4.000%, 11/01/43 | 11/29 at 100.00 | BBB– | 14,220,750 |
| 4,000 | | 4.000%, 11/01/44 | 11/29 at 100.00 | BBB– | 3,775,680 |
136
| | | | | | |
| Principal | | | Optional Call | | |
| Amount (000) | | Description (1) | Provisions (2) | Ratings (3) | Value |
| | Illinois (continued) | | | |
| $ 3,700 | | Metropolitan Pier and Exposition Authority, Illinois, McCormick Place Expansion Project | 6/22 at 100.00 | BB+ | $ 3,791,168 |
| | Bonds, Refunding Series 2012A, 5.000%, 6/15/42 – NPFG Insured | | | |
| | Metropolitan Pier and Exposition Authority, Illinois, McCormick Place Expansion Project | | | |
| | Bonds, Refunding Series 2012B: | | | |
| 3,135 | | 0.000%, 12/15/50 | No Opt. Call | BB+ | 809,018 |
| 2,500 | | 0.000%, 12/15/51 | No Opt. Call | BB+ | 614,900 |
| | Metropolitan Pier and Exposition Authority, Illinois, McCormick Place Expansion Project | | | |
| | Bonds, Refunding Series 2020A: | | | |
| 6,025 | | 4.000%, 6/15/50 | 12/29 at 100.00 | BB+ | 6,058,740 |
| 7,935 | | 5.000%, 6/15/50 | 12/29 at 100.00 | BB+ | 8,722,390 |
| | Metropolitan Pier and Exposition Authority, Illinois, McCormick Place Expansion Project | | | |
| | Bonds, Series 2017A: | | | |
| 22,000 | | 0.000%, 12/15/56 – BAM Insured | No Opt. Call | AA | 5,515,620 |
| 22,500 | | 0.000%, 12/15/56 – AGM Insured | No Opt. Call | A2 | 5,640,975 |
| 4,565 | | 5.000%, 6/15/57 | 12/27 at 100.00 | BB+ | 4,924,494 |
| 10,000 | | Metropolitan Pier and Exposition Authority, Illinois, McCormick Place Expansion Project | No Opt. Call | BB+ | 2,507,100 |
| | Bonds, Series 2017B, 0.000%, 12/15/56 – AGM Insured | | | |
| 500 | | Morton Grove, Illinois, Tax Increment Revenue Bonds, Sawmill Station Redevelopment | 1/26 at 100.00 | N/R | 476,445 |
| | Project, Senior Lien Series 2019, 5.000%, 1/01/39 | | | |
| | Sales Tax Securitization Corporation, Illinois, Sales Tax Securitization Bonds, Second | | | |
| | Lien Series 2020A: | | | |
| 150 | | 4.000%, 1/01/38 | 1/30 at 100.00 | AA– | 162,639 |
| 120 | | 4.000%, 1/01/39 | 1/30 at 100.00 | AA– | 129,688 |
| 1,000 | | Yorkville United City Business District, Illinois, Storm Water and Water Improvement | 11/20 at 100.00 | N/R | 410,000 |
| | Project Revenue Bonds, Series 2007, 4.800%, 1/01/26 (4) | | | |
| 1,000 | | Yorkville, Illinois, Special Tax Bonds, Special Service Area 2006-113 Cannoball & | 11/20 at 100.00 | N/R | 1,000,450 |
| | Beecher, Series 2007, 5.750%, 3/01/28 | | | |
| 172,760 | | Total Illinois | | | 127,098,994 |
| | Indiana – 0.9% (0.5% of Total Investments) | | | |
| 140 | | Anderson, Indiana, Multifamily Housing Revenue Bonds, Sweet Galilee at the Wigwam | 1/27 at 102.00 | N/R | 141,417 |
| | Project, Series 2020A, 5.375%, 1/01/40 | | | |
| 3,105 | | Indiana Finance Authority, Educational Facilities Revenue Bonds, Earlham College, | 10/23 at 100.00 | N/R | 3,157,444 |
| | Refunding Series 2013, 5.000%, 10/01/32 | | | |
| 2,325 | | Valparaiso, Indiana, Exempt Facilities Revenue Bonds, Pratt Paper LLC Project, Series | 1/24 at 100.00 | N/R | 2,607,092 |
| | 2013, 7.000%, 1/01/44 (AMT) | | | |
| 5,570 | | Total Indiana | | | 5,905,953 |
| | Iowa – 3.4% (2.1% of Total Investments) | | | |
| 8,540 | | Iowa Finance Authority, Iowa, Midwestern Disaster Area Revenue Bonds, Alcoa Inc Project, | 8/22 at 100.00 | Ba3 | 8,695,513 |
| | Series 2012, 4.750%, 8/01/42 | | | |
| 1,320 | | Iowa Finance Authority, Iowa, Midwestern Disaster Area Revenue Bonds, Iowa Fertilizer | 12/23 at 100.00 | B | 1,405,457 |
| | Company Project, Series 2013, 5.250%, 12/01/25 | | | |
| 2,500 | | Iowa Finance Authority, Iowa, Midwestern Disaster Area Revenue Bonds, Iowa Fertilizer | 11/20 at 104.00 | B | 2,602,900 |
| | Company Project, Series 2016, 5.875%, 12/01/26, 144A | | | |
| 4,125 | | Iowa Finance Authority, Iowa, Midwestern Disaster Area Revenue Bonds, Iowa Fertilizer | 12/22 at 103.00 | BB– | 4,292,351 |
| | Company Project, Series 2018A, 5.250%, 12/01/50 (Mandatory Put 12/01/33) | | | |
| 750 | | Iowa Finance Authority, Iowa, Midwestern Disaster Area Revenue Bonds, Iowa Fertilizer | 12/22 at 105.00 | BB– | 790,718 |
| | Company Project, Series 2018B, 5.250%, 12/01/50 (Mandatory Put 12/01/37) | | | |
| 1,500 | | Iowa Tobacco Settlement Authority, Asset Backed Settlement Revenue Bonds, Series 2005C, | 11/20 at 100.00 | B– | 1,520,535 |
| | 5.375%, 6/01/38 | | | |
| 4,125 | | Iowa Tobacco Settlement Authority, Tobacco Asset-Backed Revenue Bonds, Series 2005B, | 11/20 at 100.00 | B– | 4,181,471 |
| | 5.600%, 6/01/34 | | | |
| 22,860 | | Total Iowa | | | 23,488,945 |
137
| | |
| NMCO | Nuveen Municipal Credit Opportunities Fund Portfolio of Investments (continued) October 31, 2020 |
| | | | | | |
| Principal | | | Optional Call | | |
| Amount (000) | | Description (1) | Provisions (2) | Ratings (3) | Value |
| | Kansas – 0.5% (0.3% of Total Investments) | | | |
| $ 1,930 | | Overland Park Transportation Development District, Kansas, Sales Tax Revenue Bonds, Oak | 11/20 at 100.00 | BBB | $ 1,929,923 |
| | Park Mall Project, Series 2010, 5.900%, 4/01/32 | | | |
| 1,365 | | Wyandotte County-Kansas City Unified Government, Kansas, Sales Tax Special Obligation | 9/25 at 100.00 | N/R | 1,237,236 |
| | Bonds, Vacation Village Project Area 1 and 2A, Series 2015, 5.750%, 9/01/32 | | | |
| 3,295 | | Total Kansas | | | 3,167,159 |
| | Louisiana – 2.0% (1.2% of Total Investments) | | | |
| 7,140 | | Louisiana Local Government Environmental Facilities and Community Development Authority, | 11/29 at 100.00 | N/R | 7,129,076 |
| | Louisiana, Revenue Bonds, Jefferson Parish GOMESA Project, Series 2019, 4.000%, | | | |
| | 11/01/44, 144A | | | |
| 375 | | Louisiana Local Government Environmental Facilities and Community Development Authority, | 12/22 at 105.00 | BB | 324,007 |
| | Multifamily Housing Revenue Bonds, Cove at Nola Apartments, Series 2017A, 4.000%, 12/01/27 | | | |
| 260 | | Louisiana Public Facilities Authority, Louisiana, Revenue Bonds, Lake Charles College | 6/27 at 100.00 | N/R | 258,245 |
| | Prep Project, Series 2019A, 5.000%, 6/01/58, 144A | | | |
| 200 | | Saint James Parish, Louisiana, Revenue Bonds, NuStar Logistics, LP Project, Series 2008, | No Opt. Call | BB– | 235,756 |
| | 6.100%, 6/01/38 (Mandatory Put 6/01/30), 144A | | | |
| 1,235 | | Saint James Parish, Louisiana, Revenue Bonds, NuStar Logistics, LP Project, Series 2010, | 6/30 at 100.00 | BB– | 1,463,994 |
| | 6.350%, 7/01/40, 144A | | | |
| 800 | | Saint James Parish, Louisiana, Revenue Bonds, NuStar Logistics, LP Project, Series | 6/30 at 100.00 | BB– | 948,336 |
| | 2010A, 6.350%, 10/01/40, 144A | | | |
| 695 | | Saint James Parish, Louisiana, Revenue Bonds, NuStar Logistics, LP Project, Series | No Opt. Call | BB– | 819,252 |
| | 2010B, 6.100%, 12/01/40 (Mandatory Put 6/01/30), 144A | | | |
| 1,085 | | Saint James Parish, Louisiana, Revenue Bonds, NuStar Logistics, LP Project, Series 2011, | No Opt. Call | BB– | 1,184,755 |
| | 5.850%, 8/01/41 (Mandatory Put 6/01/25), 144A | | | |
| 975 | | Saint John the Baptist Parish, Louisiana, Revenue Bonds, Marathon Oil Corporation | No Opt. Call | BBB– | 977,506 |
| | Project, Refunding Series 2017A-1, 2.000%, 6/01/37 (Mandatory Put 4/01/23) | | | |
| 12,765 | | Total Louisiana | | | 13,340,927 |
| | Maryland – 1.0% (0.6% of Total Investments) | | | |
| | Baltimore, Maryland, Convention Center Hotel Revenue Bonds, Refunding Series 2017: | | | |
| 1,480 | | 5.000%, 9/01/24 | No Opt. Call | BB– | 1,377,066 |
| 1,000 | | 5.000%, 9/01/39 | 9/27 at 100.00 | BB– | 878,450 |
| 680 | | 5.000%, 9/01/46 | 9/27 at 100.00 | BB– | 592,164 |
| 2,000 | | Maryland Economic Development Corporation, Private Activity Revenue Bonds FCP, Purple | 11/21 at 100.00 | CCC | 1,983,500 |
| | Line Light Rail Project, Green Bonds, Series 2016B, 5.000%, 9/30/26 (AMT) | | | |
| 2,000 | | Maryland Economic Development Corporation, Private Activity Revenue Bonds RSA, Purple | 11/21 at 100.00 | CCC | 1,988,160 |
| | Line Light Rail Project, Green Bonds, Series 2016A, 5.000%, 3/31/24 (AMT) | | | |
| 7,160 | | Total Maryland | | | 6,819,340 |
| | Massachusetts – 2.1% (1.3% of Total Investments) | | | |
| 1,620 | | Lowell, Massachusetts, Collegiate Charter School Revenue Bonds, Series 2019, | 6/26 at 100.00 | N/R | 1,690,762 |
| | 5.000%, 6/15/54 | | | |
| | Massachusetts Development Finance Agency Revenue Bonds, Lawrence General Hospital Issue, | | | |
| | Series 2017: | | | |
| 1,000 | | 5.000%, 7/01/37 | 7/27 at 100.00 | B | 913,480 |
| 3,900 | | 5.000%, 7/01/42 | 7/27 at 100.00 | B | 3,473,613 |
| 9,500 | | 5.000%, 7/01/47 | 7/27 at 100.00 | B | 8,357,625 |
| 16,020 | | Total Massachusetts | | | 14,435,480 |
| | Michigan – 1.2% (0.7% of Total Investments) | | | |
| 40 | | Advanced Technology Academy, Michigan, Public School Academy Revenue Bonds, Refunding | 11/27 at 102.00 | BB | 40,842 |
| | Series 2019, 5.000%, 11/01/44 | | | |
| 174,130 | | Michigan Tobacco Settlement Finance Authority, Tobacco Settlement Asset-Backed Revenue | 6/33 at 11.41 | N/R | 8,097,045 |
| | Bonds, Capital Appreciation Turbo Term Series 2008C, 0.000%, 6/01/58 | | | |
| 174,170 | | Total Michigan | | | 8,137,887 |
138
| | | | | | |
| Principal | | | Optional Call | | |
| Amount (000) | | Description (1) | Provisions (2) | Ratings (3) | Value |
| | Minnesota – 0.8% (0.5% of Total Investments) | | | |
| $ 500 | | Bethel, Minnesota Charter School Lease Revenue Bonds, Partnership Academy Project, | 7/26 at 102.00 | N/R | $ 515,365 |
| | Series 2018A, 5.000%, 7/01/53 | | | |
| 1,300 | | Brooklyn Park, Minnesota, Charter School Lease Revenue Bonds, Athlos Leadership Academy | 7/25 at 100.00 | N/R | 1,366,976 |
| | Project, Series 2015A, 5.750%, 7/01/46 | | | |
| 2,440 | | Columbia Heights, Minnesota, Charter School Lease Revenue Bonds, Prodeo Academy Project, | 7/27 at 102.00 | N/R | 2,487,092 |
| | Series 2019A, 5.000%, 7/01/54 | | | |
| 130 | | Minneapolis, Minnesota, Charter School Lease Revenue Bonds, Friendship Academy of the | 12/27 at 100.00 | N/R | 133,784 |
| | Arts Project, Series 2019A, 5.250%, 12/01/52, 144A | | | |
| 30 | | Minneapolis, Minnesota, Charter School Lease Revenue Bonds, Northeast College Prep | 7/30 at 100.00 | N/R | 31,259 |
| | Project, Series 2020A, 5.000%, 7/01/40 | | | |
| 1,000 | | Scanlon, Minnesota, Health Care Facilities Revenue Bonds, Duluth Health Services | 3/25 at 101.00 | N/R | 829,910 |
| | Project, Refunding Series 2020, 3.950%, 3/01/50 | | | |
| 5,400 | | Total Minnesota | | | 5,364,386 |
| | Missouri – 0.0% (0.0% of Total Investments) | | | |
| 315 | | Boone County, Missouri, Hospital Revenue Bonds, Boone Hospital Center, Refunding Series | 8/26 at 100.00 | Ba1 | 321,171 |
| | 2016, 4.000%, 8/01/38 | | | |
| | Nevada – 3.3% (2.0% of Total Investments) | | | |
| 9,385 | | Director of Nevada State Department of Business & Industry, Environmental Improvement | 8/28 at 100.00 | N/R | 9,546,891 |
| | Revenue Bonds, Fulcrum Sierra BioFuels LLC Project, Green Series 2018, 6.950%, | | | |
| | 2/15/38 (AMT), 144A | | | |
| | Director of Nevada State Department of Business & Industry, Environmental Improvement | | | |
| | Revenue Bonds, Fulcrum Sierra BioFuels LLC Project, Series 2017: | | | |
| 2,400 | | 5.875%, 12/15/27 (AMT), 144A | No Opt. Call | N/R | 2,394,984 |
| 340 | | 6.250%, 12/15/37 (AMT), 144A | 12/27 at 100.00 | N/R | 328,886 |
| 2,750 | | Director of Nevada State Department of Business & Industry, Environmental Improvement | 8/29 at 100.00 | N/R | 2,495,020 |
| | Revenue Bonds, Fulcrum Sierra Holdings LLC, Green Series 2019, 5.750%, 2/15/38 (AMT), 144A | | | |
| 56,000 | | Reno, Nevada, Subordinate Lien Sales Tax Revenue Refunding Capital Appreciation Bonds, | 7/38 at 31.26 | N/R | 7,702,240 |
| | ReTrac-Reno Transportation Rail Access Corridor Project, Series 2018C, 0.000%, 7/01/58, 144A | | | |
| 70,875 | | Total Nevada | | | 22,468,021 |
| | New Hampshire – 0.1% (0.0% of Total Investments) | | | |
| 470 | | National Finance Authority, New Hampshire, Resource Recovery Revenue Bonds, Covanta | 7/23 at 100.00 | B | 478,004 |
| | Project, Refunding Series 2018C, 4.875%, 11/01/42 (AMT), 144A | | | |
| | New Jersey – 4.1% (2.5% of Total Investments) | | | |
| 4,000 | | New Jersey Economic Development Authority Revenue Bonds, Black Horse EHT Urban Renewal | 10/27 at 102.00 | N/R | 3,829,960 |
| | LLC Project, Series 2019A, 5.000%, 10/01/39, 144A | | | |
| 5,475 | | New Jersey Economic Development Authority, Revenue Bonds, White Horse HMT Urban Renewal | 1/28 at 102.00 | N/R | 5,206,397 |
| | LLC Project, Series 2020, 5.000%, 1/01/40, 144A | | | |
| 7,500 | | New Jersey Economic Development Authority, Special Facilities Revenue Bonds, Continental | 9/22 at 100.00 | B | 7,403,175 |
| | Airlines Inc, Refunding Series 2012, 5.750%, 9/15/27 (AMT) | | | |
| 2,500 | | New Jersey Economic Development Authority, Special Facilities Revenue Bonds, Continental | 8/22 at 101.00 | B+ | 2,554,350 |
| | Airlines Inc, Series 1999, 5.250%, 9/15/29 (AMT) | | | |
| 15,000 | | New Jersey Transportation Trust Fund Authority, Transportation System Bonds, Series | No Opt. Call | BBB+ | 7,297,200 |
| | 2009A, 0.000%, 12/15/39 (UB) (6) | | | |
| | South Jersey Port Corporation, New Jersey, Marine Terminal Revenue Bonds, Subordinate | | | |
| | Series 2017B: | | | |
| 1,260 | | 5.000%, 1/01/37 (AMT) | 1/28 at 100.00 | Baa1 | 1,385,672 |
| 500 | | 5.000%, 1/01/42 (AMT) | 1/28 at 100.00 | Baa1 | 542,695 |
| 36,235 | | Total New Jersey | | | 28,219,449 |
| | New Mexico – 1.5% (0.9% of Total Investments) | | | |
| 9,500 | | New Mexico Hospital Equipment Loan Council, Hospital Revenue Bonds, Presbyterian | 8/29 at 100.00 | Aa3 | 9,723,915 |
| | Healthcare Services, Series 2019A, 3.000%, 8/01/48 (6) | | | |
139
| | |
| NMCO | Nuveen Municipal Credit Opportunities Fund Portfolio of Investments (continued) October 31, 2020 |
| | | | | | |
| Principal | | | Optional Call | | |
| Amount (000) | | Description (1) | Provisions (2) | Ratings (3) | Value |
| | New Mexico (continued) | | | |
| $ 825 | | Winrock Town Center Tax Increment Development District 1, Albuquerque, New Mexico, Gross | 11/23 at 103.00 | N/R | $ 797,404 |
| | Receipts Tax Increment Bonds, Subordinate Lien Series 2020, 8.000%, 5/01/40, 144A (WI/DD, | | | |
| | Settling 11/17/20) | | | |
| 10,325 | | Total New Mexico | | | 10,521,319 |
| | New York – 11.4% (6.9% of Total Investments) | | | |
| 950 | | Build New York City Resource Corporation, New York, Revenue Bonds, Metropolitan College | 11/24 at 100.00 | BB | 1,003,846 |
| | of New York, Series 2014, 5.250%, 11/01/34 | | | |
| 450 | | Dormitory Authority of the State of New York, Revenue Bonds, Montefiore Obligated Group, | 8/28 at 100.00 | Baa3 | 490,676 |
| | Series 2018A, 4.000%, 8/01/38 | | | |
| 36,150 | | Erie County Tobacco Asset Securitization Corporation, New York, Tobacco Settlement | 11/20 at 5.15 | N/R | 1,639,764 |
| | Asset-Backed Bonds, Series 2006A, 0.000%, 6/01/60 | | | |
| 650 | | Hempstead Town Local Development Corporation, New York, Education Revenue Bonds, | 2/30 at 100.00 | N/R | 665,866 |
| | The Academy Charter School Project, Series 2020A, 5.730%, 2/01/50 | | | |
| 1,570 | | Metropolitan Transportation Authority, New York, Transportation Revenue Bonds, Green | 5/30 at 100.00 | BBB+ | 1,733,437 |
| | Climate Bond Certified Series 2020C-1, 5.250%, 11/15/55 | | | |
| 5,000 | | Metropolitan Transportation Authority, New York, Transportation Revenue Bonds, Series | 11/23 at 100.00 | BBB+ | 5,192,700 |
| | 2014A-1, 5.250%, 11/15/39 (UB) (6) | | | |
| 5,900 | | New York City, New York, General Obligation Bonds, Fiscal 2021 Series C, | 8/30 at 100.00 | AA | 6,737,859 |
| | 4.000%, 8/01/39 (UB) (6) | | | |
| 12,500 | | New York Liberty Development Corporation, New York, Liberty Revenue Bonds, 3 World Trade | 11/24 at 100.00 | N/R | 12,806,750 |
| | Center Project, Class 1 Series 2014, 5.000%, 11/15/44, 144A | | | |
| | New York Liberty Development Corporation, New York, Liberty Revenue Bonds, 3 World Trade | | | |
| | Center Project, Class 2 Series 2014: | | | |
| 3,235 | | 5.150%, 11/15/34, 144A | 11/24 at 100.00 | N/R | 3,358,836 |
| 6,960 | | 5.375%, 11/15/40, 144A | 11/24 at 100.00 | N/R | 7,202,974 |
| | New York Transportation Development Corporation, New York, Special Facility Revenue Bonds, | | | |
| | American Airlines, Inc John F Kennedy International Airport Project, Refunding Series 2016: | | | |
| 2,410 | | 5.000%, 8/01/21 (AMT) | No Opt. Call | B– | 2,425,062 |
| 8,170 | | 5.000%, 8/01/26 (AMT) | 8/21 at 100.00 | B– | 8,202,435 |
| 3,000 | | 5.000%, 8/01/31 (AMT) | 8/21 at 100.00 | B– | 2,988,630 |
| 875 | | New York Transportation Development Corporation, New York, Special Facility Revenue | 8/30 at 100.00 | B– | 906,824 |
| | Bonds, American Airlines, Inc John F Kennedy International Airport Project, Series 2020, | | | |
| | 5.375%, 8/01/36 (AMT) | | | |
| | New York Transportation Development Corporation, Special Facility Revenue Bonds, Delta | | | �� |
| | Air Lines, Inc – LaGuardia Airport Terminals C&D Redevelopment Project, Series 2020: | | | |
| 2,450 | | 5.000%, 10/01/40 (AMT) | 10/30 at 100.00 | BB+ | 2,628,776 |
| 2,775 | | 4.375%, 10/01/45 (AMT) | 10/30 at 100.00 | BB+ | 2,811,713 |
| 1,000 | | Port Authority of New York and New Jersey, Special Project Bonds, JFK International Air | 12/20 at 100.00 | BBB | 1,004,090 |
| | Terminal LLC Project, Eighth Series 2010, 6.000%, 12/01/36 | | | |
| 2,950 | | Syracuse Industrial Development Authority, New York, PILOT Revenue Bonds, Carousel | 1/26 at 100.00 | B1 | 2,559,951 |
| | Center Project, Refunding Series 2016A, 5.000%, 1/01/32 (AMT) | | | |
| 12,700 | | TSASC Inc, New York, Tobacco Asset-Backed Bonds, Series 2006, 5.000%, 6/01/48 | 6/27 at 100.00 | N/R | 13,123,418 |
| 109,695 | | Total New York | | | 77,483,607 |
| | Ohio – 11.2% (6.8% of Total Investments) | | | |
| 89,235 | | Buckeye Tobacco Settlement Financing Authority, Ohio, Tobacco Settlement Asset-Backed | 6/30 at 22.36 | N/R | 12,645,492 |
| | Revenue Bonds, Refunding Senior Lien Capital Appreciation Series 2020B-3 Class 2, | | | |
| | 0.000%, 6/01/57 | | | |
| 325 | | Buckeye Tobacco Settlement Financing Authority, Ohio, Tobacco Settlement Asset-Backed | 6/30 at 100.00 | BBB+ | 311,415 |
| | Revenue Bonds, Refunding Senior Lien Series 2020A-2 Class 1, 3.000%, 6/01/48 | | | |
| 19,185 | | Buckeye Tobacco Settlement Financing Authority, Ohio, Tobacco Settlement Asset-Backed | 6/30 at 100.00 | N/R | 20,540,804 |
| | Revenue Bonds, Refunding Senior Lien Series 2020B-2 Class 2, 5.000%, 6/01/55 | | | |
140
| | | | | | |
| Principal | | | Optional Call | | |
| Amount (000) | | Description (1) | Provisions (2) | Ratings (3) | Value |
| | Ohio (continued) | | | |
| | Butler County Port Authority, Ohio, Public Infrastructure Revenue Bonds, Liberty Center | | | |
| | Project, Liberty Community Authority, Series 2014C: | | | |
| $ 655 | | 5.000%, 12/01/24 | 12/22 at 100.00 | N/R | $ 659,932 |
| 1,000 | | 5.750%, 12/01/34 | 12/22 at 100.00 | N/R | 990,440 |
| 1,000 | | 6.000%, 12/01/43 | 12/22 at 100.00 | N/R | 990,090 |
| 7,610 | | Cleveland, Ohio, Airport Special Revenue Bonds, Continental Airlines Inc Project, Series | 11/20 at 100.00 | B | 7,616,849 |
| | 1998, 5.375%, 9/15/27 (AMT) | | | |
| | Evans Farm New Community Authority, Ohio, Community Development Charge Revenue Bonds, | | | |
| | Evans Farm Mixed-Use Project, Series 2020: | | | |
| 2,170 | | 3.750%, 12/01/38 | 6/29 at 100.00 | N/R | 2,052,277 |
| 140 | | 4.000%, 12/01/46 | 6/29 at 100.00 | N/R | 128,999 |
| 5,000 | | Franklin County Convention Facilities Authority, Ohio, Hotel Project Revenue Bonds, | 12/29 at 100.00 | BBB– | 5,014,900 |
| | Greater Columbus Convention Center Hotel Expansion Project, Series 2019, 5.000%, 12/01/51 | | | |
| 940 | | Hilliard Hickory Chase Community Authority, Ohio, Infrastructure Improvement Revenue | 12/29 at 100.00 | N/R | 953,997 |
| | Bonds, Hickory Chase Project, Senior Series 2019A, 5.000%, 12/01/40, 144A | | | |
| 5,020 | | Ohio Air Quality Development Authority, Ohio, Air Quality Development Revenue Bonds, | No Opt. Call | N/R | 6,275 |
| | FirstEnergy Generation Corporation Project, Series 2009A, 5.700%, 8/01/20 (4) | | | |
| 14,950 | | Ohio Air Quality Development Authority, Ohio, Exempt Facilities Revenue Bonds, AMG | 7/29 at 100.00 | B3 | 15,243,767 |
| | Vanadium Project, Series 2019, 5.000%, 7/01/49 (AMT), 144A | | | |
| 2,085 | | Ohio Air Quality Development Authority, Ohio, Pollution Control Revenue Bonds, | No Opt. Call | N/R | 2,606 |
| | FirstEnergy Generation Corporation Project, Refunding Series 2009B, 3.100%, 3/01/23 (4) | | | |
| 4,140 | | Ohio Air Quality Development Authority, Ohio, Pollution Control Revenue Bonds, | No Opt. Call | N/R | 5,175 |
| | FirstEnergy Generation Project, Refunding Series 2006A, 3.750%, 12/01/23 (4) | | | |
| 2,895 | | Ohio Air Quality Development Authority, Ohio, Pollution Control Revenue Bonds, | No Opt. Call | N/R | 2,916,712 |
| | FirstEnergy Nuclear Generation Project, Refunding Series 2009A, 4.375%, 6/01/33 | | | |
| | (Mandatory Put 6/01/22) | | | |
| 2,000 | | Ohio Air Quality Development Authority, Ohio, Revenue Bonds, AK Steel Holding | 2/22 at 100.00 | CCC | 1,949,440 |
| | Corporation, Refunding Series 2012A, 6.750%, 6/01/24 (AMT) | | | |
| 2,470 | | Ohio Water Development Authority, Pollution Control Revenue Bonds, FirstEnergy | No Opt. Call | N/R | 3,088 |
| | Generating Corporation Project, Refunding Series 2006A, 3.000%, 5/15/20 (4) | | | |
| 2,000 | | Ohio Water Development Authority, Pollution Control Revenue Bonds, FirstEnergy Nuclear | No Opt. Call | N/R | 2,500 |
| | Generating Corporation Project, Refunding Series 2010C, 4.000%, 6/01/33 (4) | | | |
| 2,510 | | Ohio Water Development Authority, Pollution Control Revenue Refunding Bonds, FirstEnergy | No Opt. Call | N/R | 3,138 |
| | Nuclear Generating Corporation Project, Series 2006B, 4.000%, 12/01/33 (4) | | | |
| 2,015 | | Ohio Water Development Authority, Pollution Control Revenue Refunding Bonds, FirstEnergy | No Opt. Call | N/R | 2,030,113 |
| | Nuclear Generating Corporation Project, Series 2010B, 4.375%, 6/01/33 (Mandatory Put 6/01/22) | | | |
| 1,000 | | Port of Greater Cincinnati Development Authority, Ohio, Special Obligation Tax Increment | 11/30 at 100.00 | N/R | 899,300 |
| | Financing Revenue Bonds, Cooperative Township Public Parking Project, Gallery at Kenwood, | | | |
| | Senior Lien Series 2019A, 5.000%, 11/01/51 | | | |
| 1,500 | | Toledo Lucas County Port Authority, Ohio, Revenue Bonds, StoryPoint Waterville Project, | 1/24 at 104.00 | N/R | 1,471,515 |
| | Series 2016A-1, 6.375%, 1/15/51, 144A (4) | | | |
| 169,845 | | Total Ohio | | | 76,438,824 |
| | Oklahoma – 1.0% (0.6% of Total Investments) | | | |
| 2,475 | | Tulsa Municipal Airport Trust, Oklahoma, Revenue Bonds, American Airlines Inc, Refunding | 6/23 at 100.00 | N/R | 2,526,059 |
| | Series 2000B, 5.500%, 6/01/35 (AMT) | | | |
| 860 | | Tulsa Municipal Airport Trust, Oklahoma, Revenue Bonds, American Airlines Inc, Refunding | 6/23 at 100.00 | N/R | 877,742 |
| | Series 2001B, 5.500%, 12/01/35 (AMT) | | | |
| 3,475 | | Tulsa Municipal Airport Trust, Oklahoma, Revenue Bonds, American Airlines Inc, Refunding | 6/25 at 100.00 | B– | 3,517,360 |
| | Series 2015, 5.000%, 6/01/35 (AMT) (Mandatory Put 6/01/25) | | | |
| 6,810 | | Total Oklahoma | | | 6,921,161 |
| | Oregon – 0.0% (0.0% of Total Investments) | | | |
| 100 | | Oregon Facilities Authority, Revenue Bonds, Metro East Web Academy Project, Series | 6/27 at 102.00 | N/R | 101,041 |
| | 2019A, 5.000%, 6/15/49, 144A | | | |
141
| | |
| NMCO | Nuveen Municipal Credit Opportunities Fund Portfolio of Investments (continued) October 31, 2020 |
| | | | | | |
| Principal | | | Optional Call | | |
| Amount (000) | | Description (1) | Provisions (2) | Ratings (3) | Value |
| | Pennsylvania – 6.4% (3.9% of Total Investments) | | | |
| $ 600 | | Allegheny Country Industrial Development Authority, Pennsylvania, Environmental | 12/21 at 100.00 | Caa2 | $ 588,468 |
| | Improvement Revenue Bonds, United States Steel Corporation Project, Refunding Series 2011, | | | |
| | 6.750%, 12/01/27 | | | |
| 1,125 | | Allegheny Country Industrial Development Authority, Pennsylvania, Environmental | 8/22 at 100.00 | Caa2 | 1,014,075 |
| | Improvement Revenue Bonds, United States Steel Corporation Project, Series 2012, 5.750%, | | | |
| | 8/01/42 (AMT) | | | |
| | Allegheny County Industrial Development Authority, Pennsylvania, Environmental | | | |
| | Improvement Revenue Bonds, United States Steel Corp, Refunding Series 2019: | | | |
| 5,970 | | 4.875%, 11/01/24 | No Opt. Call | Caa2 | 5,680,694 |
| 6,995 | | 5.125%, 5/01/30 | No Opt. Call | Caa2 | 6,331,734 |
| | Beaver County Industrial Development Authority, Pennsylvania, Pollution Control Revenue | | | |
| | Bonds, FirstEnergy Generation Project, Refunding Series 2006A: | | | |
| 3,300 | | 4.375%, 1/01/35 (Mandatory Put 7/01/22) | No Opt. Call | N/R | 3,324,750 |
| 560 | | 3.500%, 4/01/41 (4) | No Opt. Call | N/R | 700 |
| 1,440 | | Beaver County Industrial Development Authority, Pennsylvania, Pollution Control Revenue | No Opt. Call | N/R | 1,800 |
| | Bonds, FirstEnergy Nuclear Generation Project, Refunding Series 2005A, 4.000%, 1/01/35 (4) | | | |
| 1,025 | | Beaver County Industrial Development Authority, Pennsylvania, Pollution Control Revenue | No Opt. Call | N/R | 1,281 |
| | Bonds, FirstEnergy Nuclear Generation Project, Refunding Series 2008A, 2.700%, 4/01/35 (4) | | | |
| 5,355 | | Beaver County Industrial Development Authority, Pennsylvania, Pollution Control Revenue | No Opt. Call | N/R | 6,694 |
| | Bonds, FirstEnergy Nuclear Generation Project, Series 2006B, 3.500%, 12/01/35 (4) | | | |
| 1,280 | | Beaver County Industrial Development Authority, Pennsylvania, Pollution Control Revenue | No Opt. Call | N/R | 1,289,600 |
| | Refunding Bonds, FirstEnergy Generation Project, Series 2008B, 4.250%, 10/01/47 (Mandatory | | | |
| | Put 4/01/21) | | | |
| 2,565 | | Berks County Municipal Authority, Pennsylvania, Revenue Bonds, Alvernia University | 10/29 at 100.00 | BB+ | 2,507,339 |
| | Project, Series 2020, 5.000%, 10/01/49 | | | |
| 1,000 | | Chester County Health and Education Facilities Authority, Pennsylvania, Revenue Bonds, | 12/25 at 100.00 | N/R | 1,033,900 |
| | Simpson Senior Services Project, Series 2015A, 5.000%, 12/01/30 | | | |
| | Chester County Industrial Development Authority, Pennsylvania, Revenue Bonds, Collegium | | | |
| | Charter School Project, Series 2017A: | | | |
| 1,825 | | 5.125%, 10/15/37 | 4/27 at 100.00 | BB | 1,946,016 |
| 3,250 | | 5.250%, 10/15/47 | 4/27 at 100.00 | BB | 3,433,852 |
| | Cumberland County Municipal Authority, Pennsylvania, Revenue Bonds, Asbury Pennsylvania | | | |
| | Obligated Group, Refunding Series 2019: | | | |
| 2,160 | | 5.000%, 1/01/39 | 1/25 at 104.00 | N/R | 2,124,425 |
| 1,240 | | 5.000%, 1/01/45 | 1/25 at 104.00 | N/R | 1,194,455 |
| 1,720 | | Pennsylvania Economic Development Financing Authority, Exempt Facilities Revenue Bonds, | 6/30 at 100.00 | N/R | 1,802,766 |
| | KDC Agribusiness Fairless Hills LLC Project, Series 2020A-1, 10.000%, 12/01/40, 144A | | | |
| 1,720 | | Pennsylvania Economic Development Financing Authority, Exempt Facilities Revenue Bonds, | 6/30 at 100.00 | N/R | 1,802,766 |
| | KDC Agribusiness Fairless Hills LLC Project, Series 2020A-2, 10.000%, 12/01/40 (AMT), 144A | | | |
| 9,220 | | Pennsylvania Economic Development Financing Authority, Exempt Facilities Revenue | 9/25 at 100.00 | CCC+ | 7,614,337 |
| | Refunding Bonds, PPL Energy Supply, LLC Project, Series 2009A, 6.400%, 12/01/38 | | | |
| 1,025 | | Pennsylvania Higher Educational Facilities Authority, Revenue Bonds, University of the | 11/25 at 100.00 | Baa1 | 1,112,494 |
| | Sciences in Philadelphia, Series 2015A, 5.000%, 11/01/27 | | | |
| 545 | | Philadelphia Authority for Industrial Development, Pennsylvania, Revenue Bonds, Mariana | 12/27 at 100.00 | N/R | 554,630 |
| | Bracetti Academy Project, Series 2020A, 5.375%, 6/15/50, 144A | | | |
| 53,920 | | Total Pennsylvania | | | 43,366,776 |
| | Puerto Rico – 10.4% (6.3% of Total Investments) | | | |
| 9,040 | | Puerto Rico Aqueduct and Sewerage Authority, Revenue Bonds, Senior Lien Series 2008A, | 11/20 at 100.00 | CC | 9,175,600 |
| | 6.000%, 7/01/38 | | | |
| | Puerto Rico Aqueduct and Sewerage Authority, Revenue Bonds, Senior Lien Series 2012A: | | | |
| 405 | | 5.000%, 7/01/21 | No Opt. Call | CC | 413,100 |
| 2,415 | | 5.000%, 7/01/33 | 7/22 at 100.00 | CC | 2,493,487 |
| 2,085 | | 6.000%, 7/01/47 | 7/22 at 100.00 | CC | 2,186,644 |
142
| | | | | | |
| Principal | | | Optional Call | | |
| Amount (000) | | Description (1) | Provisions (2) | Ratings (3) | Value |
| | Puerto Rico (continued) | | | |
| | Puerto Rico Electric Power Authority, Power Revenue Bonds, Refunding Series 2012A: | | | |
| $ 2,070 | | 3.957%, 7/01/29 (4) | 7/22 at 100.00 | D | $ 1,438,650 |
| 3,170 | | 3.957%, 7/01/42 (4) | 7/22 at 100.00 | D | 2,203,150 |
| 1,000 | | 3.961%, 7/01/42 (4) | 7/22 at 100.00 | D | 695,000 |
| | Puerto Rico Electric Power Authority, Power Revenue Bonds, Series 2007TT: | | | |
| 25 | | 3.957%, 7/01/21 (4) | 11/20 at 100.00 | D | 17,375 |
| 3,750 | | 3.957%, 7/01/26 (4) | 11/20 at 100.00 | D | 2,606,250 |
| 3,795 | | 3.957%, 7/01/32 (4) | 11/20 at 100.00 | D | 2,637,525 |
| 1,860 | | 3.957%, 7/01/37 (4) | 11/20 at 100.00 | D | 1,292,700 |
| 1,750 | | Puerto Rico Electric Power Authority, Power Revenue Bonds, Series 2007VV, 5.250%, | No Opt. Call | D | 1,823,605 |
| | 7/01/32 – NPFG Insured | | | |
| | Puerto Rico Electric Power Authority, Power Revenue Bonds, Series 2010AAA: | | | |
| 1,124 | | 3.978%, 7/01/28 (4) | 11/20 at 100.00 | D | 782,585 |
| 468 | | 3.978%, 7/01/29 (4) | 11/20 at 100.00 | D | 325,845 |
| 346 | | 3.978%, 7/01/31 (4) | 11/20 at 100.00 | D | 240,903 |
| | Puerto Rico Electric Power Authority, Power Revenue Bonds, Series 2010CCC: | | | |
| 2,995 | | 3.957%, 7/01/28 (4) | 11/20 at 100.00 | D | 2,081,525 |
| 500 | | 3.978%, 7/01/28 (4) | 11/20 at 100.00 | D | 348,125 |
| | Puerto Rico Electric Power Authority, Power Revenue Bonds, Series 2010XX: | | | |
| 100 | | 3.978%, 7/01/27 (4) | 11/20 at 100.00 | D | 69,625 |
| 4,000 | | 3.978%, 7/01/35 (4) | 11/20 at 100.00 | D | 2,785,000 |
| 8,555 | | 3.978%, 7/01/40 (4) | 11/20 at 100.00 | D | 5,956,419 |
| 400 | | Puerto Rico Electric Power Authority, Power Revenue Bonds, Series 2010ZZ, 3.978%, | 11/20 at 100.00 | D | 278,500 |
| | 7/01/24 (4) | | | |
| | Puerto Rico Electric Power Authority, Power Revenue Bonds, Series 2013A: | | | |
| 5,000 | | 4.123%, 7/01/33 (4) | 7/23 at 100.00 | D | 3,606,250 |
| 10,000 | | 4.102%, 7/01/36 (4) | 7/23 at 100.00 | D | 7,150,000 |
| 1,000 | | Puerto Rico Electric Power Authority, Power Revenue Bonds, Series 2016A-4-RSA-1, | No Opt. Call | N/R | 771,250 |
| | 4.371%, 7/01/20 (4) | | | |
| | Puerto Rico Electric Power Authority, Power Revenue Bonds, Series WW: | | | |
| 190 | | 3.988%, 7/01/22 (4) | 11/20 at 100.00 | D | 132,525 |
| 373 | | 3.988%, 7/01/23 (4) | 11/20 at 100.00 | D | 260,167 |
| 25 | | 5.250%, 7/01/33 (4) | 11/20 at 100.00 | D | 17,406 |
| 3,000 | | Puerto Rico Highway and Transportation Authority, Highway Revenue Bonds, Series 2007N, | No Opt. Call | A3 | 3,464,550 |
| | 5.250%, 7/01/36 – AGC Insured | | | |
| | Puerto Rico Sales Tax Financing Corporation, Sales Tax Revenue Bonds, Restructured 2018A-1: | | | |
| 22,095 | | 0.000%, 7/01/46 | 7/28 at 41.38 | N/R | 6,384,364 |
| 34,582 | | 0.000%, 7/01/51 | 7/28 at 30.01 | N/R | 7,205,922 |
| - 0 | | 5.000%, 7/01/58 | 7/28 at 100.00 | N/R | 83 |
| 2,500 | | Puerto Rico, General Obligation Bonds, Public Improvement, Series 2014A, 3.180%, 7/01/35 (4) | 11/20 at 100.00 | D | 1,500,000 |
| 500 | | University of Puerto Rico, University System Revenue Bonds, Series 2006Q, 5.000%, 6/01/24 | 11/20 at 100.00 | C | 487,500 |
| 129,118 | | Total Puerto Rico | | | 70,831,630 |
| | South Carolina – 0.1% (0.1% of Total Investments) | | | |
| 430 | | Berkeley County, South Carolina, Special Assessment Revenue Bonds, Nexton Improvement | 11/29 at 100.00 | N/R | 435,268 |
| | District, Series 2019, 4.375%, 11/01/49 | | | |
| 400 | | South Carolina Jobs-Economic Development Authority, Economic Development Revenue Bonds, | 1/30 at 100.00 | N/R | 361,368 |
| | Hilton Head Christian Academy, Series 2020, 5.000%, 1/01/55, 144A | | | |
| 830 | | Total South Carolina | | | 796,636 |
| | Tennessee – 1.8% (1.1% of Total Investments) | | | |
| 1,000 | | Bristol Industrial Development Board, Tennessee, State Sales Tax Revenue Bonds, Pinnacle | No Opt. Call | N/R | 549,320 |
| | Project, Capital Appreciation Series 2016B, 0.000%, 12/01/31, 144A | | | |
143
| | |
| NMCO | Nuveen Municipal Credit Opportunities Fund Portfolio of Investments (continued) October 31, 2020 |
| | | | | | |
| Principal | | | Optional Call | | |
| Amount (000) | | Description (1) | Provisions (2) | Ratings (3) | Value |
| | Tennessee (continued) | | | |
| $ 4,000 | | Bristol Industrial Development Board, Tennessee, State Sales Tax Revenue Bonds, Pinnacle | 12/26 at 100.00 | N/R | $ 3,779,280 |
| | Project, Series 2016A, 5.125%, 12/01/42, 144A | | | |
| 2,000 | | Knox County Health, Educational, and Housing Facilities Board, Tennessee, Revenue Bonds, | 11/24 at 100.00 | N/R | 1,600,000 |
| | Provision Center for Proton Therapy Project, Series 2014, 5.250%, 5/01/25, 144A (4) | | | |
| 1,000 | | Memphis/Shelby County Economic Development Growth Engine Industrial Development Board, | 7/27 at 100.00 | N/R | 849,050 |
| | Tennessee, Tax Increment Revenue Bonds, Graceland Project, Senior Series 2017A, 5.625%, 1/01/46 | | | |
| 5,965 | | Memphis-Shelby County Sports Authority, Tennessee, Revenue Bonds, Memphis Arena Project, | 11/20 at 52.70 | N/R | 3,050,978 |
| | Junior Subordinate Lien Series 2002D, 0.000%, 10/01/31 | | | |
| 3,285 | | Memphis-Shelby County Sports Authority, Tennessee, Revenue Bonds, Memphis Arena Project, | 11/20 at 45.46 | N/R | 1,385,843 |
| | Junior Subordinate Lien Series 2002E, 0.000%, 4/01/34 | | | |
| 1,500 | | The Health and Educational Facilities Board of the City of Franklin, Tennessee, Revenue | No Opt. Call | N/R | 975,000 |
| | Bonds, Provision Cares Proton Therapy Center, Nashville Project, Series 2017A, 6.500%, | | | |
| | 6/01/27, 144A (4) | | | |
| 18,750 | | Total Tennessee | | | 12,189,471 |
| | Texas – 2.5% (1.5% of Total Investments) | | | |
| | Austin Convention Enterprises Inc, Texas, Convention Center Hotel Revenue Bonds, | | | |
| | Refunding First Tier Series 2017A: | | | |
| 500 | | 5.000%, 1/01/31 | 1/27 at 100.00 | BBB– | 508,570 |
| 500 | | 5.000%, 1/01/32 | 1/27 at 100.00 | BBB– | 508,495 |
| | Austin Convention Enterprises Inc, Texas, Convention Center Hotel Revenue Bonds, | | | |
| | Refunding Second Tier Series 2017B: | | | |
| 540 | | 5.000%, 1/01/25 | No Opt. Call | BB– | 524,626 |
| 475 | | 5.000%, 1/01/29 | 1/27 at 100.00 | BB– | 458,256 |
| 850 | | 5.000%, 1/01/34 | 1/27 at 100.00 | BB– | 815,583 |
| 4,665 | | Houston, Texas, Airport System Special Facilities Revenue Bonds, Continental Airlines | 7/21 at 100.00 | B | 4,744,771 |
| | Inc – Terminal Improvement Project, Refunding Series 2011, 6.500%, 7/15/30 (AMT) | | | |
| 650 | | Houston, Texas, Airport System Special Facilities Revenue Bonds, United Airlines, Inc | 7/24 at 100.00 | B | 665,392 |
| | Terminal E Project, Refunding Series 2014, 5.000%, 7/01/29 (AMT) | | | |
| 250 | | Leander, Texas, Special Assessment Revenue Bonds, Deerbrooke Public Improvement District | 9/26 at 100.00 | N/R | 253,158 |
| | Southern Improvement Area Project, Series 2017, 4.750%, 9/01/37, 144A | | | |
| 200 | | Manor, Texas, Special Assessment Revenue Bonds, Lagos Public Improvement District Major | 9/30 at 100.00 | N/R | 213,802 |
| | Improvement Area Project, Series 2020, 4.625%, 9/15/49, 144A | | | |
| 520 | | New Hope Cultural Education Facilities Finance Corporation, Texas, Education Revenue | 8/24 at 100.00 | N/R | 534,347 |
| | Bonds, Beta Academy, Series 2019A, 5.000%, 8/15/49, 144A | | | |
| 625 | | New Hope Cultural Education Facilities Finance Corporation, Texas, Student Housing | 4/26 at 100.00 | B | 559,894 |
| | Revenue Bonds, CHF-Collegiate Housing Corpus Christi II, LLC-Texas A&M University-Corpus | | | |
| | Christi Project, Series 2016A, 5.000%, 4/01/48 | | | |
| 400 | | New Hope Cultural Education Facilities Finance Corporation, Texas, Student Housing | 4/24 at 100.00 | Baa3 | 409,080 |
| | Revenue Bonds, CHF-Collegiate Housing Galveston-Texas A&M University at Galveston Project, | | | |
| | Series 2014A, 5.000%, 4/01/29 | | | |
| 2,100 | | New Hope Cultural Education Facilities Finance Corporation, Texas, Student Housing | No Opt. Call | CCC | 2,006,277 |
| | Revenue Bonds, NCCD – College Station Properties LLC – Texas A&M University Project, Series | | | |
| | 2015B, 4.375%, 7/01/21 | | | |
| 110 | | North Richland Hills, Texas, Special Assessment Revenue Bonds, City Point Public | 9/30 at 100.00 | N/R | 115,078 |
| | Improvement District Zone B Project, Series 2019, 5.375%, 9/01/50, 144A | | | |
| 145 | | Royse CIty, Rockwall County, Texas, Special Assessment Revenue Bonds, Waterscape Public | 9/27 at 100.00 | N/R | 155,424 |
| | improvement District Improvement Area 2 Project, Series 2019, 4.750%, 9/15/49, 144A | | | |
| | Tarrant County Cultural Education Facilities Finance Corporation, Texas, Retirement | | | |
| | Facility Revenue Bonds, CC Young Memorial Home Project, Series 2016A: | | | |
| 1,000 | | 6.375%, 2/15/41 (4) | 2/27 at 100.00 | N/R | 790,430 |
| 4,575 | | 6.375%, 2/15/48 (4) | 2/27 at 100.00 | N/R | 3,613,289 |
| 18,105 | | Total Texas | | | 16,876,472 |
144
| | | | | | |
| Principal | | | Optional Call | | |
| Amount (000) | | Description (1) | Provisions (2) | Ratings (3) | Value |
| | Utah – 0.2% (0.1% of Total Investments) | | | |
| $ 1,000 | | Utah Charter School Finance Authority, Charter School Revenue Bonds, Leadership Learning | 6/27 at 102.00 | N/R | $ 1,033,170 |
| | Academy Project, Series 2019A, 5.000%, 6/15/50, 144A | | | |
| | Virgin Islands – 4.4% (2.7% of Total Investments) | | | |
| 710 | | Virgin Islands Public Finance Authority, Gross Receipts Taxes Loan Note, Refunding | 10/22 at 100.00 | N/R | 662,153 |
| | Series 2012A, 5.000%, 10/01/32 | | | |
| 16,000 | | Virgin Islands Public Finance Authority, Gross Receipts Taxes Loan Note, Refunding | 10/24 at 100.00 | N/R | 15,074,560 |
| | Series 2014C, 5.000%, 10/01/30 | | | |
| 570 | | Virgin Islands Public Finance Authority, Gross Receipts Taxes Loan Note, Working Capital | No Opt. Call | N/R | 553,008 |
| | Series 2014A, 5.000%, 10/01/24 | | | |
| 1,000 | | Virgin Islands Public Finance Authority, Matching Fund Loan Notes Revenue Bonds, | 11/20 at 100.00 | Caa3 | 983,210 |
| | Subordinate Lien Series 2010B, 5.250%, 10/01/29 | | | |
| 12,735 | | Virgin Islands Public Finance Authority, Matching Fund Revenue Loan Note – Diageo | 11/20 at 100.00 | Caa3 | 12,786,832 |
| | Project, Series 2009A, 6.625%, 10/01/29 | | | |
| 31,015 | | Total Virgin Islands | | | 30,059,763 |
| | Virginia – 1.5% (0.9% of Total Investments) | | | |
| | Roanoke Economic Development Authority, Virginia Residential Care Facility Revenue | | | |
| | Bonds, Richfield Living, Series 2020: | | | |
| 5,870 | | 5.000%, 9/01/50 | 9/27 at 103.00 | N/R | 5,245,138 |
| 4,840 | | 5.125%, 9/01/55 | 9/27 at 103.00 | N/R | 4,316,796 |
| 500 | | Virginia Small Business Finance Authority, Educational Facilities Revenue Bonds, | No Opt. Call | N/R | 502,340 |
| | Provident Resource Group – Rixey Student Housing Project, Series 2019B, 7.500%, 7/01/52, 144A | | | |
| 11,210 | | Total Virginia | | | 10,064,274 |
| | Washington – 0.3% (0.2% of Total Investments) | | | |
| 1,125 | | Port of Seattle Industrial Development Corporation, Washington, Special Facilities | 4/23 at 100.00 | BB | 1,154,081 |
| | Revenue Refunding Bonds, Delta Air Lines, Inc Project, Series 2012, 5.000%, 4/01/30 (AMT) | | | |
| 1,000 | | Washington State Housing Finance Commission, Nonprofit Housing Revenue Bonds, Rockwood | 1/26 at 103.00 | N/R | 974,100 |
| | Retirement Communities Project, Series 2020A, 5.000%, 1/01/51 | | | |
| 2,125 | | Total Washington | | | 2,128,181 |
| | West Virginia – 0.5% (0.3% of Total Investments) | | | |
| | Monongalia County Commission, West Virginia, Special District Excise Tax Revenue, | | | |
| | University Town Centre Economic Opportunity Development District, Refunding & Improvement | | | |
| | Series 2017A: | | | |
| 3,000 | | 5.500%, 6/01/37, 144A | 6/27 at 100.00 | N/R | 3,088,650 |
| 625 | | 5.750%, 6/01/43, 144A | 6/27 at 100.00 | N/R | 644,969 |
| 3,625 | | Total West Virginia | | | 3,733,619 |
| | Wisconsin – 8.4% (5.1% of Total Investments) | | | |
| | Public Finance Authority of Wisconsin, Charter School Revenue Bonds, 21st Century Public | | | |
| | Academy Project, Series 2020A: | | | |
| 750 | | 5.000%, 6/01/40, 144A | 6/28 at 102.00 | N/R | 758,505 |
| 1,340 | | 5.000%, 6/01/49, 144A | 6/28 at 102.00 | N/R | 1,319,900 |
| 365 | | Public Finance Authority of Wisconsin, Charter School Revenue Bonds, Corvian Community | 6/26 at 100.00 | N/R | 369,792 |
| | School Bonds, North Carolina, Series 2019A, 5.000%, 6/15/49, 144A | | | |
| | Public Finance Authority of Wisconsin, Charter School Revenue Bonds, North Carolina | | | |
| | Charter Educational Foundation Project, Series 2016A: | | | |
| 3,000 | | 5.000%, 6/15/36, 144A | 6/26 at 100.00 | N/R | 3,021,720 |
| 4,240 | | 5.000%, 6/15/46, 144A | 6/26 at 100.00 | N/R | 4,143,922 |
| 2,000 | | Public Finance Authority of Wisconsin, Educational Facilities Revenue Bonds, Lake Erie | 10/29 at 100.00 | N/R | 1,995,500 |
| | College, Series 2019A, 5.875%, 10/01/54, 144A | | | |
| | Public Finance Authority of Wisconsin, Limited Obligation Grant Revenue Bonds, American | | | |
| | Dream @ Meadowlands Project, Series 2017A: | | | |
| 12,695 | | 6.250%, 8/01/27, 144A | No Opt. Call | N/R | 10,921,509 |
| 2,750 | | 6.750%, 8/01/31, 144A | No Opt. Call | N/R | 2,240,700 |
145
| | |
| NMCO | Nuveen Municipal Credit Opportunities Fund Portfolio of Investments (continued) October 31, 2020 |
| | | | | | |
| Principal | | | Optional Call | | |
| Amount (000) | | Description (1) | Provisions (2) | Ratings (3) | Value |
| | Wisconsin (continued) | | | |
| | Public Finance Authority of Wisconsin, Limited Obligation PILOT Revenue Bonds, American | | | |
| | Dream @ Meadowlands Project, Series 2017: | | | |
| $ 555 | | 6.500%, 12/01/37, 144A | 12/27 at 100.00 | N/R | $ 478,149 |
| 13,915 | | 7.000%, 12/01/50, 144A | 12/27 at 100.00 | N/R | 12,017,968 |
| 215 | | Public Finance Authority of Wisconsin, Retirement Facility Revenue Bonds, Shalom Park | No Opt. Call | N/R | 131,298 |
| | Development Project, Series 2019, 0.000%, 12/31/24, 144A | | | |
| | Public Finance Authority of Wisconsin, Revenue Bonds, Prime Healthcare Foundation, Inc, | | | |
| | Series 2017A: | | | |
| 285 | | 5.000%, 12/01/27 | No Opt. Call | BBB– | 311,428 |
| 1,765 | | 5.200%, 12/01/37 | 12/27 at 100.00 | BBB– | 1,972,723 |
| 2,000 | | Public Finance Authority of Wisconsin, Revenue Bonds, Procure Proton Therapy Center, | 7/28 at 100.00 | N/R | 2,132,240 |
| | Senior Series 2018A, 7.000%, 7/01/48, 144A | | | |
| 635 | | Public Finance Authority of Wisconsin, Revenue Bonds, Roseman University of Health | 4/30 at 100.00 | BB | 669,582 |
| | Sciences, Series 2020, 5.000%, 4/01/50, 144A | | | |
| | Public Finance Authority of Wisconsin, Senior Revenue Bonds, Maryland Proton Treatment | | | |
| | Center, Series 2018A-1: | | | |
| 5,885 | | 6.125%, 1/01/33, 144A | 1/28 at 100.00 | N/R | 4,991,245 |
| 250 | | 6.250%, 1/01/38, 144A | 1/28 at 100.00 | N/R | 203,010 |
| 8,735 | | 6.375%, 1/01/48, 144A | 1/28 at 100.00 | N/R | 6,888,858 |
| 3,000 | | Wisconsin Health and Educational Facilities Authority, Wisconsin, Revenue Bonds, Saint | 11/26 at 103.00 | N/R | 3,004,290 |
| | Camillus Health System Inc, Series 2019A, 5.000%, 11/01/54 | | | |
| 64,380 | | Total Wisconsin | | | 57,572,339 |
| $ 1,692,051 | | Total Municipal Bonds (cost $1,119,975,429) | | | 1,085,529,604 |
| Shares | | Description (1) | | | Value |
| | COMMON STOCKS – 2.5% (1.5% of Total Investments) | | | |
| | Electric Utilities – 2.5% (1.5% of Total Investments) | | | |
| 859,113 | | Energy Harbor Corp (7), (8), (11) | | | $ 17,182,260 |
| | Total Common Stocks (cost $24,407,228) | | | 17,182,260 |
| Shares | | Description (1), (9) | | | Value |
| | EXCHANGE-TRADED FUNDS – 0.3% (0.2% of Total Investments) | | | |
| 32 | | VanEck Vectors High Yield Muni ETF | | | $ 1,902,400 |
| | Total Exchange-Traded Funds (cost $2,058,659) | | | 1,902,400 |
| | Total Long-Term Investments (cost $1,146,441,316) | | | 1,104,614,264 |
| Principal | | | Optional Call | | |
| Amount (000) | | Description (1) | Provisions (2) | Ratings (3) | Value |
| | SHORT-TERM INVESTMENTS – 2.2% (1.4% of Total Investments) | | | |
| | MUNICIPAL BONDS – 2.2% (1.4% of Total Investments) | | | |
| | Illinois – 0.1% (0.1% of Total Investments) | | | |
| $ 985 | | Yorkville United City, Kendall County, Illinois, Sales Tax Revenue Bonds, Variable Rate Demand | 11/20 at 100.00 | N/R | $ 817,850 |
| | Obligations, Kendall Marketplace Project, Series 2007, 6.000%, 1/01/26 (4), (10) | | | |
| | New York – 2.1% (1.3% of Total Investments) | | | |
| 14,450 | | Dormitory Authority of the State of New York, Revenue Bonds, Variable Rate Demand Obligations, | 10/20 at 100.00 | AA | 14,450,000 |
| | Rockefeller University, Series 2002A-2, 0.100%, 7/01/32 (10) | | | |
| $ 15,435 | | Total Short-Term Investments (cost $15,267,850) | | | 15,267,850 |
| | Total Investments (cost $1,161,709,166) – 164.1% | | | 1,119,882,114 |
| | Floating Rate Obligations – (3.2)% | | | (21,923,000) |
| | MuniFund Term Preferred Shares, net of deferred offering costs – (65.8)% (12) | | | (448,842,816) |
| | Other Assets Less Liabilities – 4.9% | | | 33,394,075 |
| | Net Assets Applicable to Common Shares – 100% | | | $ 682,510,373 |
146
(1) | All percentages shown in the Portfolio of Investments are based on net assets applicable to common shares unless otherwise noted. |
(2) | Optional Call Provisions: Dates (month and year) and prices of the earliest optional call or redemption. There may be other call provisions at varying prices at later dates. |
| Certain mortgage-backed securities may be subject to periodic principal paydowns. Optional Call Provisions are not covered by the report of independent registered public |
| accounting firm. |
(3) | The ratings disclosed are the lowest of Standard & Poor’s Group (“Standard & Poor’s”), Moody’s Investors Service, Inc. (“Moody’s”) or Fitch, Inc. (“Fitch”) rating. Ratings below |
| BBB by Standard & Poor’s, Baa by Moody’s or BBB by Fitch are considered to be below investment grade. Holdings designated N/R are not rated by any of these national |
| rating agencies. Ratings are not covered by the report of independent registered public accounting firm. |
(4) | Defaulted security. A security whose issuer has failed to fully pay principal and/or interest when due, or is under the protection of bankruptcy. |
(5) | Step-up coupon bond, a bond with a coupon that increases (“steps up”), usually at regular intervals, while the bond is outstanding. The rate shown is the coupon as of the |
| end of the reporting period. |
(6) | Investment, or portion of investment, has been pledged to collateralize the net payment obligations for investments in inverse floating rate transactions. |
(7) | Common Stock received as part of the bankruptcy settlements for Beaver County Industrial Development Authority, Pennsylvania, Pollution Control Revenue Bonds, |
| FirstEnergy Nuclear Generation Project, Refunding Series 2005A, 4.000%, 1/01/35, Beaver County Industrial Development Authority, Pennsylvania, Pollution Control Revenue |
| Refunding Bonds, FirstEnergy Nuclear Generation Project, Series 2006A, 3.500%, 4/01/41, Beaver County Industrial Development Authority, Pennsylvania, Pollution Control |
| Revenue Refunding Bonds, FirstEnergy Nuclear Generation Project, Series 2006B, 3.500%, 12/01/35, Beaver County Industrial Development Authority, Pennsylvania, Pollution |
| Control Revenue Refunding Bonds, FirstEnergy Nuclear Generation Project, Series 2008A, 2.700%, 4/01/35, Ohio Air Quality Development Authority, Ohio, Air Quality |
| Development Revenue Bonds, FirstEnergy Generation Corporation Project, Series 2009A, 5.700%, 8/01/20, Ohio Air Quality Development Authority, Ohio, Pollution Control |
| Revenue Bonds, FirstEnergy Generation Corporation Project, Refunding Series 2009B, 3.100%, 3/01/23, Ohio Air Quality Development Authority, Ohio, Pollution Control |
| Revenue Bonds, FirstEnergy Generation Project, Refunding Series 2006A, 3.750%, 12/01/23, Ohio Water Development Authority, Pollution Control Revenue Refunding Bonds, |
| FirstEnergy Nuclear Generating Corporation Project, Series 2006A, 3.000%, 5/15/20, Ohio Water Development Authority, Pollution Control Revenue Refunding Bonds, |
| FirstEnergy Nuclear Generating Corporation Project, Series 2006B, 4.000%, 12/01/33, Ohio Water Development Authority, Pollution Control Revenue Refunding Bonds, |
| FirstEnergy Nuclear Generating Corporation Project, Series 2010C, 4.000%, 6/01/33. |
(8) | For fair value measurement disclosure purposes, investment classified as Level 2. See Notes to Financial Statements, Note 3 – Investment Valuation and Fair Value |
| Measurements for more information. |
(9) | A copy of the most recent financial statements for the exchange-traded funds in which the Fund invests can be obtained directly from the Securities and Exchange Commission |
| on its website at http://www.sec.gov. |
(10) | Investment has a maturity of greater than one year, but has variable rate and/or demand features which qualify it as a short-term investment. The rate disclosed, as well as |
| the reference rate and spread, where applicable, is that in effect as of the end of the reporting period. This rate changes periodically based on market conditions or a specified |
| market index. |
(11) | Non-income producing; issuer has not declared a dividend within the past twelve months. |
(12) | MuniFund Term Preferred Shares, net of deferred offering costs as a percentage of Total Investments is 40.1%. |
144A | Investment is exempt from registration under Rule 144A of the Securities Act of 1933, as amended. These investments may only be resold in transactions exempt from registration, |
| which are normally those transactions with qualified institutional buyers. |
AMT | Alternative Minimum Tax. |
ETF | Exchange-Traded Fund. |
| PIK | Payment-in-kind (“PIK”) security. Depending on the terms of the security, income may be received in the form of cash, securities, or a combination of both. The PIK rate shown, |
| where applicable, represents the annualized rate of the last PIK payment made by the issuer as of the end of the reporting period. |
| UB | Underlying bond of an inverse floating rate trust reflected as a financing transaction. See Notes to Financial Statements, Note 4 – Portfolio Securities and Investments in |
| Derivatives for more information. |
WI/DD | Purchased on when-issued or delayed delivery basis. |
| See accompanying notes to financial statements. |
147
| | |
| NDMO | Nuveen Dynamic Municipal Opportunities Fund Portfolio of Investments October 31, 2020 |
| | | | | | |
| Principal | | | Optional Call | | |
| Amount (000) | | Description (1) | Provisions (2) | Ratings (3) | Value |
| | LONG-TERM INVESTMENTS – 105.9% (100.0% of Total Investments) | | | |
| | MUNICIPAL BONDS – 105.8% (99.9% of Total Investments) | | | |
| | Alabama – 2.2% (2.0% of Total Investments) | | | |
| | Huntsville Healthcare Authority, Alabama, Revenue Bonds, Series 2020B: | | | |
| $ 1,500 | | 3.000%, 6/01/50 – AGM Insured | 6/30 at 100.00 | A1 | $ 1,490,730 |
| 11,920 | | 3.000%, 6/01/50 – AGM Insured (UB) (4) | 6/30 at 100.00 | A1 | 11,846,334 |
| 5,000 | | Mobile County, Alabama, Limited Obligation Warrants, Gomesa Projects, Series 2020, | 11/29 at 100.00 | N/R | 4,992,150 |
| | 4.000%, 11/01/45, 144A | | | |
| 18,420 | | Total Alabama | | | 18,329,214 |
| | Alaska – 0.2% (0.1% of Total Investments) | | | |
| 1,000 | | Alaska Municipal Bond Bank, General Obligation Bonds, Refunding One Series 2020, | No Opt. Call | A+ | 1,306,760 |
| | 5.000%, 12/01/30 | | | |
| | Arizona – 6.4% (6.1% of Total Investments) | | | |
| | Arizona Industrial Development Authority, Arizona, Education Revenue Bonds, Mater | | | |
| | Academy of Nevada – Bonanza Campus Project, Series 2020A: | | | |
| 920 | | 5.000%, 12/15/40, 144A | 12/28 at 100.00 | BB | 985,826 |
| 1,500 | | 5.000%, 12/15/50, 144A | 12/28 at 100.00 | BB | 1,580,685 |
| 1,500 | | Arizona Industrial Development Authority, Arizona, Education Revenue Bonds, Social Bonds, | 7/28 at 100.00 | BB– | 1,517,024 |
| | Pensar Academy Project, Series 2020, 5.000%, 7/01/55, 144A | | | |
| | Arizona Industrial Development Authority, Arizona, Lease Revenue Bonds, Children’s | | | |
| | National Prince County Regional Medical Center, Series 2020A: | | | |
| 2,500 | | 4.000%, 9/01/46 | 9/30 at 100.00 | A1 | 2,758,750 |
| 2,500 | | 3.000%, 9/01/50 | 9/30 at 100.00 | A1 | 2,497,400 |
| 15,000 | | Maricopa County Industrial Development Authority, Arizona, Revenue Bonds, Banner Health, | 7/30 at 100.00 | AA– | 15,123,450 |
| | Series 2019E, 3.000%, 1/01/49 (UB) (4) | | | |
| | Phoenix Civic Improvement Corporation, Arizona, Rental Car Facility Charge Revenue | | | |
| | Bonds, Series 2019A: | | | |
| 5,895 | | 5.000%, 7/01/34 | 7/29 at 100.00 | BBB+ | 6,668,070 |
| 2,500 | | 5.000%, 7/01/39 | 7/29 at 100.00 | BBB+ | 2,764,925 |
| 3,405 | | Phoenix Industrial Development Authority, Arizona, Education Facility Revenue Bonds, | 9/30 at 100.00 | Ba2 | 3,511,509 |
| | Northwest Christian School Project, Series 2020A, 5.000%, 9/01/55, 144A | | | |
| | Pima County Industrial Development Authority, Arizona, Education Facility Revenue Bonds, | | | |
| | Edkey Charter Schools Project, Refunding Series 2020: | | | |
| 5,265 | | 5.000%, 7/01/35, 144A (WI/DD, Settling 11/18/20) | 7/26 at 103.00 | N/R | 5,464,280 |
| 6,800 | | 5.000%, 7/01/40, 144A (WI/DD, Settling 11/18/20) | 7/26 at 103.00 | N/R | 6,934,572 |
| 4,580 | | Pima County Industrial Development Authority, Arizona, Education Facility Revenue Bonds, | 6/28 at 100.00 | N/R | 4,585,496 |
| | Synergy Public Charter School Project, Series 2020-1, 5.000%, 6/15/50, 144A | | | |
| 52,365 | | Total Arizona | | | 54,391,987 |
| | Arkansas – 2.3% (2.2% of Total Investments) | | | |
| 3,000 | | Arkansas Development Finance Authority, Industrial Development Revenue Bonds, Big River | 9/26 at 103.00 | B | 3,007,470 |
| | Steel Project, Series 2019, 4.500%, 9/01/49 (AMT), 144A | | | |
| 17,000 | | Arkansas Development Finance Authority, Industrial Development Revenue Bonds, Big River | 9/27 at 103.00 | Caa1 | 16,921,630 |
| | Steel Project, Series 2020A, 4.750%, 9/01/49 (AMT), 144A | | | |
| 20,000 | | Total Arkansas | | | 19,929,100 |
| | California – 15.2% (14.4% of Total Investments) | | | |
| 10,000 | | California County Tobacco Securitization Agency, Tobacco Settlement Asset-Backed Bonds, | 12/30 at 34.02 | N/R | 2,175,700 |
| | Sonoma County Tobacco Securitization Corporation, Series 2020B-2, 0.000%, 6/01/55 | | | |
148
| | | | | | |
| Principal | | | Optional Call | | |
| Amount (000) | | Description (1) | Provisions (2) | Ratings (3) | Value |
| | California (continued) | | | |
| | California Health Facilities Financing Authority, Revenue Bonds, CommonSpirit Health, | | | |
| | Series 2020A: | | | |
| $ 8,000 | | 4.000%, 4/01/45 (UB) (4) | 4/30 at 100.00 | BBB+ | $ 8,816,400 |
| 1,820 | | 4.000%, 4/01/49 | 4/30 at 100.00 | BBB+ | 1,998,742 |
| | California Health Facilities Financing Authority, Revenue Bonds, PIH Health, Series 2020A: | | | |
| 7,020 | | 3.000%, 6/01/47 | 6/30 at 100.00 | A | 7,096,729 |
| 6,120 | | 4.000%, 6/01/50 | 6/30 at 100.00 | A | 6,852,258 |
| | California Infrastructure and Economic Development Bank, Revenue Bonds, Los Angeles | | | |
| | County Museum of Natural History Foundation, Series 2020: | | | |
| 15,500 | | 3.000%, 7/01/50 (UB) (4) | 7/30 at 100.00 | A2 | 15,638,725 |
| 2,000 | | 4.000%, 7/01/50 | 7/30 at 100.00 | A2 | 2,233,660 |
| 2,000 | | California Municipal Finance Authority, Revenue Bonds, University of the Pacific, | 11/30 at 100.00 | A2 | 1,970,120 |
| | Refunding Series 2020A, 3.000%, 11/01/48 (WI/DD, Settling 11/12/20) | | | |
| 5,000 | | California Municipal Finance Authority, Special Facility Revenue Bonds, United Airlines, | No Opt. Call | B+ | 4,977,950 |
| | Inc Los Angeles International Airport Project, Series 2019, 4.000%, 7/15/29 (AMT) | | | |
| 5,000 | | California Public Finance Authority, Charter School Lease Revenue Bonds, California | 7/28 at 100.00 | N/R | 5,000,000 |
| | Crosspoint Academy Project, Series 2020A, 5.125%, 7/01/55, 144A (WI/DD, Settling 11/10/20) | | | |
| 4,250 | | California State, General Obligation Bonds, Refunding Various Purpose Series 2020, | 11/30 at 100.00 | AA– | 4,703,645 |
| | 3.000%, 11/01/35 | | | |
| | California State, General Obligation Bonds, Various Purpose Series 2020: | | | |
| 3,000 | | 4.000%, 11/01/34 (4) | 11/30 at 100.00 | AA– | 3,659,220 |
| 2,715 | | 4.000%, 11/01/35 | 11/30 at 100.00 | AA– | 3,296,010 |
| 9,750 | | California Statewide Communities Development Authority, California, Revenue Bonds, Loma | 12/24 at 100.00 | BB– | 10,550,865 |
| | Linda University Medical Center, Series 2014A, 5.500%, 12/01/54 | | | |
| | Glendale Community College District, Los Angeles County, California, General Obligation | | | |
| | Bonds, Election 2016 Taxable Refunding Series 2020B: | | | |
| 1,250 | | 0.000%, 8/01/33 | 2/30 at 91.42 | AA– | 926,488 |
| 2,950 | | 0.000%, 8/01/34 | 2/30 at 88.79 | AA– | 2,108,040 |
| 2,250 | | 0.000%, 8/01/35 | 2/30 at 86.15 | AA– | 1,548,608 |
| 1,370 | | 0.000%, 8/01/36 | 2/30 at 83.57 | AA– | 907,639 |
| 6,650 | | Golden State Tobacco Securitization Corporation, California, Tobacco Settlement | 6/22 at 100.00 | N/R | 6,840,323 |
| | Asset-Backed Bonds, Series 2018A-1, 5.000%, 6/01/47 | | | |
| 6,300 | | Golden State Tobacco Securitization Corporation, California, Tobacco Settlement | 6/22 at 100.00 | N/R | 6,480,306 |
| | Asset-Backed Bonds, Series 2018A-2, 5.000%, 6/01/47 | | | |
| 4,250 | | Los Angeles Department of Water and Power, California, Power System Revenue Bonds, | 7/30 at 100.00 | AA– | 5,447,225 |
| | Series 2020B, 5.000%, 7/01/45 | | | |
| 1,000 | | Northstar Community Services District, California, Special Tax Bonds, Community Facilities | 3/21 at 100.00 | N/R | 550,000 |
| | District 1, Series 2006, 5.000%, 9/01/37 | | | |
| | San Francisco City and County Public Utilities Commission, California, Water Revenue | | | |
| | Bonds, Local Water Series 2020C: | | | |
| 3,080 | | 4.000%, 11/01/45 | 11/30 at 100.00 | AA– | 3,645,088 |
| 4,040 | | 4.000%, 11/01/50 | 11/30 at 100.00 | AA– | 4,745,707 |
| | San Francisco City and County Public Utilities Commission, California, Water Revenue | | | |
| | Bonds, WSIP Green Series 2020A: | | | |
| 1,490 | | 5.000%, 11/01/45 | 11/30 at 100.00 | AA– | 1,919,820 |
| 3,335 | | 4.000%, 11/01/50 | 11/30 at 100.00 | AA– | 3,917,558 |
| 4,645 | | Santa Clara Valley Water District, California, Water System Refunding Revenue Bonds, | 6/30 at 100.00 | Aa1 | 4,619,220 |
| | Taxable Series 2020B, 2.967%, 6/01/50 | | | |
| | Santa Clara Valley Water District, California, Revenue Certificates of Participation, | | | |
| | Water Utility System Improvement Projects, Series 2020C: | | | |
| 1,270 | | 5.000%, 6/01/39 | 6/30 at 100.00 | Aa1 | 1,656,867 |
| 855 | | 5.000%, 6/01/41 | 6/30 at 100.00 | Aa1 | 1,108,738 |
| | Santa Clara Valley Water District, California, Water System Revenue Bonds, Refunding | | | |
| | Series 2020A: | | | |
| 1,445 | | 5.000%, 6/01/45 | 6/30 at 100.00 | Aa1 | 1,850,698 |
| 1,325 | | 5.000%, 6/01/50 | 6/30 at 100.00 | Aa1 | 1,689,547 |
| 129,680 | | Total California | | | 128,931,896 |
149
| | |
| NDMO | Nuveen Dynamic Municipal Opportunities Fund Portfolio of Investments (continued) October 31, 2020 |
| | | | | | |
| Principal | | | Optional Call | | |
| Amount (000) | | Description (1) | Provisions (2) | Ratings (3) | Value |
| | Colorado – 9.6% (9.0% of Total Investments) | | | |
| $ 2,370 | | 64th Avenue ARI Authority, Adams County, Colorado, Special Revenue Bonds, Series 2020, | 12/25 at 103.00 | N/R | $ 2,426,572 |
| | 6.500%, 12/01/43 | | | |
| 1,240 | | Arista Metropolitan District, Broomfield County, Colorado, General Obligation Limited Tax | 12/23 at 103.00 | N/R | 1,301,777 |
| | Bonds, Refunding & Improvement Convertible to Unlimited Tax Series 2018A, 5.000%, 12/01/38 | | | |
| 1,060 | | Aurora Crossroads Metropolitan District 2, Colorado, Limited Tax General Obligation | 9/25 at 103.00 | N/R | 1,074,639 |
| | Bonds, Series 2020A, 5.000%, 12/01/50 | | | |
| 2,285 | | Aurora Crossroads Metropolitan District 2, Colorado, Limited Tax General Obligation | 9/25 at 103.00 | N/R | 2,294,803 |
| | Bonds, Subordinate Series 2020B, 7.750%, 12/15/50 | | | |
| 500 | | Aviation Station North Metropolitan District 2, Denver County, Colorado, Limited Tax | 9/24 at 103.00 | N/R | 503,640 |
| | General Obligation Bonds, Refunding & Improvement Series 2019A, 4.000%, 12/01/29 | | | |
| 1,725 | | Belford North Metropolitan District, Douglas County, Colorado, General Obligation | 12/25 at 103.00 | N/R | 1,728,364 |
| | Limited Tax Bonds, Series 2020A, 5.500%, 12/01/50 | | | |
| 500 | | Broadway Park North Metropolitan District 2, Denver, Colorado, Limited Tax General | 12/25 at 103.00 | N/R | 516,755 |
| | Obligation Bonds, Refunding & Improvement Series 2020, 5.000%, 12/01/40, 144A | | | |
| 500 | | Centerra Metropolitan District 1, Loveland, Colorado, Special Revenue Bonds, Refunding & | No Opt. Call | N/R | 517,735 |
| | Improvement Series 2017, 5.000%, 12/01/22, 144A | | | |
| 2,755 | | Centerra Metropolitan District 1, Loveland, Colorado, Special Revenue Bonds, Refunding & | 12/25 at 103.00 | N/R | 2,819,219 |
| | Improvement Series 2020A, 5.000%, 12/01/51 | | | |
| 2,700 | | Colorado Bridge Enterprise, Revenue Bonds, Central 70 Project, Senior Series 2017, | 12/27 at 100.00 | A– | 2,911,734 |
| | 4.000%, 6/30/51 (AMT) | | | |
| 5,000 | | Colorado Health Facilities Authority, Colorado, Revenue Bonds, CommonSpirit Health, | 8/29 at 100.00 | BBB+ | 5,422,650 |
| | Series 2019A-1, 4.000%, 8/01/44 | | | |
| 16,000 | | Colorado International Center Metropolitan District 8, Adams County, Colorado, Limited | 9/25 at 103.00 | N/R | 16,108,960 |
| | Tax General Obligation Bonds, Series 2020, 6.500%, 12/01/50 | | | |
| 6,500 | | Crystal Valley Metropolitan District 2, Douglas County, Colorado, Limited Tax General Obligation | 12/30 at 100.00 | A2 | 6,587,750 |
| | Bonds, Refunding & Improvement Series 2020A, 3.000%, 12/01/49 – AGM Insured (UB) (4) | | | |
| 1,000 | | Dacono Urban Renewal Authority, Weld County, Colorado, Tax Increment Revenue Bonds, | 12/25 at 103.00 | N/R | 1,002,350 |
| | Series 2020, 6.250%, 12/01/39 | | | |
| 1,000 | | Foothills Metropolitan District, Fort Collins, Colorado, Special Revenue Bonds, Series | 12/24 at 100.00 | N/R | 1,028,900 |
| | 2014, 6.000%, 12/01/38 | | | |
| 5,250 | | Jefferson Center Metropolitan District 1, Arvada, Jefferson County, Colorado, Special | 12/23 at 103.00 | N/R | 5,369,437 |
| | Revenue Bonds, Subordinate Series 2020B, 5.750%, 12/15/50 | | | |
| 2,000 | | Jones District Community Authority Board, Centennial, Colorado, Special Revenue | 12/25 at 103.00 | N/R | 1,513,580 |
| | Convertible Capital Appreciation Bonds, Series 2020A, 0.000%, 12/01/50 | | | |
| 1,380 | | Lanterns Metropolitan District 1, Castle Rock, Douglas County, Colorado, Limited Tax | 9/24 at 103.00 | N/R | 1,428,217 |
| | General Obligation Bonds, Series 2019A, 5.000%, 12/01/39 | | | |
| 1,000 | | North Range Metropolitan District No 3, 5.250%, 12/01/50 | 12/25 at 103.00 | N/R | 1,000,000 |
| 925 | | Pinon Pines Metropolitan District 2, El Paso County, Colorado, General Obligation | 9/25 at 103.00 | N/R | 955,793 |
| | Limited Tax Bonds, Series 2020, 5.000%, 12/01/40 | | | |
| 5,350 | | Rampart Range Metropolitan District 1, Lone Tree, Colorado, Limited Tax Supported and | 12/27 at 100.00 | A2 | 6,367,035 |
| | Special Revenue Bonds, Refunding & Improvement Series 2017, 5.000%, 12/01/47 | | | |
| 1,055 | | Sabell Metropolitan District, Arvada, Colorado, Limited Tax General Obligation Bonds, | 3/25 at 103.00 | N/R | 1,087,557 |
| | Convertible to Unlimited Tax Series 2020A, 5.000%, 12/01/50, 144A | | | |
| 1,000 | | Sterling Ranch Community Authority Board, Douglas County, Colorado, Supported Revenue | 12/25 at 102.00 | N/R | 1,001,830 |
| | Bonds, Limited Tax Refunding Improvement Senior Series 2020A, 3.750%, 12/01/40 (WI/DD, | | | |
| | Settling 11/05/20) | | | |
| 750 | | Sterling Ranch Community Authority Board, Douglas County, Colorado, Supported Revenue | 12/25 at 102.00 | N/R | 751,163 |
| | Bonds, Limited Tax Refunding Improvement Senior Series 2020B, 7.125%, 12/15/50 (WI/DD, | | | |
| | Settling 11/05/20) | | | |
| 2,175 | | Sunlight Metropolitan District Colorado, General Obligation Limited Tax Bonds, Series 2020, | 12/25 at 103.00 | N/R | 2,179,219 |
| | 5.000%, 12/01/50 | | | |
| 5,000 | | Velocity Metropolitan District 5, In the City of Aurora, Colorado, Limited Tax General | 12/23 at 81.31 | N/R | 3,295,200 |
| | Obligation Bonds, Convertible Capital Appreciation Series 2020A-2, 0.000%, 12/01/50 | | | |
| 10,000 | | Velocity Metropolitan District 5, In the City of Aurora, Colorado, Limited Tax General | 12/23 at 103.00 | N/R | 9,860,100 |
| | Obligation Bonds, Series 2020A-1, 5.375%, 12/01/50 | | | |
| 81,020 | | Total Colorado | | | 81,054,979 |
150
| | | | | | |
| Principal | | | Optional Call | | |
| Amount (000) | | Description (1) | Provisions (2) | Ratings (3) | Value |
| | Florida – 10.0% (9.4% of Total Investments) | | | |
| $ 1,500 | | Belmont II Community Development District, Hillsborough County, Florida, Special | 12/30 at 100.00 | N/R | $ 1,512,345 |
| | Assessment Revenue Bonds, 2020 Assessment Area, Series 2020, 4.000%, 12/15/50, 144A | | | |
| | (WI/DD, Settling 11/23/20) | | | |
| | Broward County, Florida, Port Facilities Revenue Bonds, Series 2019B: | | | |
| 7,500 | | 4.000%, 9/01/37 (AMT) | 9/29 at 100.00 | A | 8,157,075 |
| 2,500 | | 4.000%, 9/01/39 (AMT) (UB) (WI/DD, Settling 11/12/20) | 9/29 at 100.00 | A | 2,691,900 |
| | Capital Trust Agency, Florida, Educational Facilities Lease Revenue Bonds, South Tech | | | |
| | Schools Project, Series 2020A: | | | |
| 1,235 | | 5.000%, 6/15/40, 144A | 6/27 at 100.00 | N/R | 1,268,518 |
| 1,260 | | 5.000%, 6/15/55, 144A | 6/27 at 100.00 | N/R | 1,276,216 |
| 6,500 | | Currents Community Development District, Collier County, Florida, Capital Improvement | No Opt. Call | N/R | 6,491,420 |
| | Revenue Bonds, Series 2020B, 4.250%, 5/01/41, 144A | | | |
| 1,500 | | Cypress Park Estates Community Development District, Florida, Special Assessment Revenue | 5/32 at 100.00 | N/R | 1,474,020 |
| | Bonds, Assessment Area 1 Project, Series 2020, 4.000%, 5/01/51, 144A (WI/DD, Settling 11/12/20) | | | |
| 2,500 | | Cypress Preserve Community Development District, Pasco County, Florida, Special | 11/29 at 100.00 | N/R | 2,540,250 |
| | Assessment Bonds, Assessment Area 2, Series 2019, 4.125%, 11/01/50 | | | |
| 10,000 | | Florida Development Finance Corporation, Educational Facilities Revenue Bonds, Discovery | 6/29 at 100.00 | N/R | 10,202,300 |
| | High School Project, Series 2020A, 5.000%, 6/01/55, 144A | | | |
| 1,100 | | Florida Development Finance Corporation, Educational Facilities Revenue Bonds, Mater | 6/27 at 100.00 | BBB | 1,220,494 |
| | Academy Projects, Series 2020A, 5.000%, 6/15/50 | | | |
| 7,000 | | Florida Development Finance Corporation, Florida, Surface Transportation Facility Revenue | 11/20 at 105.00 | N/R | 5,997,670 |
| | Bonds, Virgin Trains USA Passenger Rail Project , Series 2019A, 6.500%, 1/01/49 (AMT) | | | |
| | (Mandatory Put 1/01/29), 144A | | | |
| 11,180 | | Florida Higher Educational Facilities Financing Authority, Revenue Bonds, Rollins | 12/30 at 100.00 | A2 | 10,970,710 |
| | College Project, Refunding Series 2020A, 3.000%, 12/01/48 (UB) (4) | | | |
| 1,000 | | Forest Lake Community Development District, Polk County, Florida, Special Assessment | 5/30 at 100.00 | N/R | 1,003,140 |
| | Bonds, Assessment Area One Project, Series 2020, 4.000%, 5/01/51, 144A | | | |
| | Grand Oaks Community Development District, Saint Johns County, Florida, Special | | | |
| | Assessment Bonds, Assessment Area 2, Series 2020: | | | |
| 1,100 | | 4.250%, 5/01/40 | 5/31 at 100.00 | N/R | 1,097,107 |
| 1,500 | | 4.500%, 5/01/52 | 5/31 at 100.00 | N/R | 1,503,765 |
| 1,000 | | Hammock Reserve Community Development District, Haines City, Florida, Special Assessment | 5/30 at 100.00 | N/R | 999,970 |
| | Revenue Bonds, Area1 Project, Series 2020, 4.000%, 5/01/51 | | | |
| 10,000 | | Hillsborough County Industrial Development Authority, Florida, Hospital Revenue Bonds, Florida | 2/31 at 100.00 | A | 9,870,800 |
| | Health Sciences Center Inc D/B/A Tampa General Hospital, Series 2020, 4.000%, 8/01/55 (UB) (4) | | | |
| 3,550 | | Hillsborough County Industrial Development Authority, Florida, Hospital Revenue Bonds, | 2/31 at 100.00 | Baa1 | 3,844,295 |
| | Florida Health Sciences Center Inc D/B/A Tampa General Hospital, Series 2020A, 4.000%, 8/01/45 | | | |
| 1,250 | | Lakewood Ranch Stewardship District, Florida, Special Assessment Revenue Bonds, | 5/30 at 100.00 | N/R | 1,255,888 |
| | Northeast Sector Project, Phase 2B, Series 2020, 4.000%, 5/01/50, 144A | | | |
| 1,225 | | Miami Dade County Industrial Development Authority, Florida, Educational Facilities | 6/26 at 103.00 | N/R | 1,209,908 |
| | Revenue Bonds, Miami Community Charter School Inc Project, Series 2020A, 5.000%, 6/01/47 | | | |
| | (WI/DD, Settling 11/23/20) | | | |
| 8,000 | | Miami-Dade County Expressway Authority, Florida, Toll System Revenue Bonds, Series | 7/24 at 100.00 | BBB+ | 8,798,320 |
| | 2014A, 5.000%, 7/01/44 | | | |
| 1,010 | | Windward Community Development District, Florida, Special Assessment Bonds, Series | No Opt. Call | N/R | 1,014,414 |
| | 2020A-2, 4.400%, 11/01/35 | | | |
| 83,410 | | Total Florida | | | 84,400,525 |
| | Illinois – 5.9% (5.6% of Total Investments) | | | |
| | Chicago Transit Authority, Illinois, Sales Tax Receipts Revenue Bonds, Series 2014: | | | |
| 5,000 | | 5.250%, 12/01/49 (UB) (4) | 12/24 at 100.00 | AA | 5,657,800 |
| 10,000 | | 5.250%, 12/01/49 | 12/24 at 100.00 | AA | 11,315,600 |
| | Chicago, Illinois, General Airport Revenue Bonds, O’Hare International Airport, | | | |
| | Refunding Senior Lien Series 2020A: | | | |
| 3,305 | | 4.000%, 1/01/35 | 1/30 at 100.00 | A | 3,743,243 |
| 3,145 | | 4.000%, 1/01/37 | 1/30 at 100.00 | A | 3,531,898 |
151
| | |
| NDMO | Nuveen Dynamic Municipal Opportunities Fund Portfolio of Investments (continued) October 31, 2020 |
| | | | | | |
| Principal | | | Optional Call | | |
| Amount (000) | | Description (1) | Provisions (2) | Ratings (3) | Value |
| | Illinois (continued) | | | |
| $ 2,000 | | Chicago, Illinois, General Obligation Bonds, Project Series 2011A, 5.000%, 1/01/40 | 1/21 at 100.00 | Ba1 | $ 1,999,760 |
| 5,085 | | DuPage County, Illinois, Revenue Bonds, Morton Arboretum Project, Green Series 2020, | 5/30 at 100.00 | A1 | 5,022,556 |
| | 3.000%, 5/15/47 | | | |
| 10,000 | | Illinois Finance Authority, 3.000%, 5/15/50 (UB) (4) | 11/30 at 100.00 | A3 | 9,692,100 |
| 3,300 | | Metropolitan Pier and Exposition Authority, Illinois, McCormick Place Expansion Project | 12/30 at 100.00 | BB+ | 3,706,032 |
| | Bonds, Series 2020B, 5.000%, 6/15/42 | | | |
| 5,190 | | Romeoville, Illinois, Revenue Bonds, Lewis University Project, Series 2015, 5.000%, 10/01/35 | 4/25 at 100.00 | BBB | 5,590,824 |
| 47,025 | | Total Illinois | | | 50,259,813 |
| | Indiana – 0.6% (0.6% of Total Investments) | | | |
| 1,415 | | Gary Local Public Improvement Bond Bank, Indiana, Economic Development Revenue Bonds, | 6/30 at 100.00 | N/R | 1,415,000 |
| | Drexel Foundation for Educational Excellence Project, Refunding Series 2020A, 5.875%, | | | |
| | 6/01/55, 144A (WI/DD, Settling 11/10/20) | | | |
| 3,445 | | Indiana Finance Authority, Educational Facilities Revenue Bonds, Rose Hulman Institute | 12/28 at 100.00 | A2 | 4,064,997 |
| | Of Technology Project, Series 2018, 5.000%, 6/01/39 | | | |
| 4,860 | | Total Indiana | | | 5,479,997 |
| | Louisiana – 1.2% (1.1% of Total Investments) | | | |
| | Louisiana Public Facilities Authority, Louisiana, Revenue Bonds, Ochsner Clinic | | | |
| | Foundation Project, Series 2020A: | | | |
| 5,355 | | 3.000%, 5/15/47 (UB) (4) | 5/30 at 100.00 | A3 | 5,192,422 |
| 2,145 | | 4.000%, 5/15/49 (UB) (4) | 5/30 at 100.00 | A3 | 2,340,860 |
| 2,000 | | Saint James Parish, Louisiana, Revenue Bonds, NuStar Logistics, LP Project, Series 2010, | 6/30 at 100.00 | BB– | 2,370,840 |
| | 6.350%, 7/01/40, 144A | | | |
| 9,500 | | Total Louisiana | | | 9,904,122 |
| | Maryland – 0.9% (0.9% of Total Investments) | | | |
| 2,200 | | Frederick County, Maryland, Special Obligation Bonds, Urbana Community Development | 7/30 at 100.00 | N/R | 2,164,228 |
| | Authority, Refunding Series 2020C, 4.000%, 7/01/50 (WI/DD, Settling 11/12/20) | | | |
| 5,515 | | Frederick County, Maryland, Special Tax Limited Obligation Bonds, Jefferson Technology | 7/30 at 102.00 | N/R | 5,529,118 |
| | Park Project, Refunding Series 2020A, 5.000%, 7/01/43, 144A | | | |
| 7,715 | | Total Maryland | | | 7,693,346 |
| | Massachusetts – 0.7% (0.7% of Total Investments) | | | |
| 5,000 | | Massachusetts Bay Transportation Authority, Sales Tax Revenue Bonds, Subordinated Series | 7/28 at 100.00 | Aa3 | 6,084,750 |
| | 2020B-1, 5.000%, 7/01/45 | | | |
| | Michigan – 0.4% (0.4% of Total Investments) | | | |
| 1,500 | | Detroit, Michigan, General Obligation Bonds, Unlimited Tax Series 2020, 5.500%, 4/01/45 | 4/30 at 100.00 | BB– | 1,679,835 |
| 16,110 | | Michigan Finance Authority, Tobacco Settlement Asset- Backed Bonds, 2007 Sold Tobacco | 12/30 at 18.38 | N/R | 1,836,057 |
| | Receipts, Series 2020B2-CL2, 0.000%, 6/01/65 | | | |
| 17,610 | | Total Michigan | | | 3,515,892 |
| | Missouri – 3.6% (3.4% of Total Investments) | | | |
| 5,315 | | Kansas City Industrial Development Authority, Missouri, Airport Special Obligation | 3/29 at 100.00 | A– | 6,151,634 |
| | Bonds, Kansas City International Airport Terminal Modernization Project, Series 2019A, | | | |
| | 5.000%, 3/01/44 (AMT) | | | |
| 3,835 | | Kansas City Industrial Development Authority, Missouri, Airport Special Obligation | 3/29 at 100.00 | A– | 4,413,855 |
| | Bonds, Kansas City International Airport Terminal Modernization Project, Series 2019B, | | | |
| | 5.000%, 3/01/46 (AMT) | | | |
| | Missouri Health and Educational Facilities Authority, Health Facilities Revenue Bonds, | | | |
| | Mercy Health, Series 2020: | | | |
| 1,250 | | 4.000%, 6/01/50 | 6/30 at 100.00 | A+ | 1,389,475 |
| 4,940 | | 3.000%, 6/01/53 (UB) (4) | 6/30 at 100.00 | A+ | 4,835,815 |
| 1,250 | | 4.000%, 6/01/53 | 6/30 at 100.00 | A+ | 1,380,400 |
| 3,155 | | Saint Louis Municipal Finance Corporation, Missouri, Leasehold Revenue Bonds, Convention | 10/30 at 100.00 | A2 | 3,753,156 |
| | Center, Expansion & Improvement Projects Series 2020, 5.000%, 10/01/45 – AGM | | | |
| | Insured (UB) (4) | | | |
152
| | | | | | |
| Principal | | | Optional Call | | |
| Amount (000) | | Description (1) | Provisions (2) | Ratings (3) | Value |
| | Missouri (continued) | | | |
| | Southeast Missouri State University, System Facilities Revenue Bonds, Refunding Series 2020: | | | |
| $ 2,500 | | 5.000%, 4/01/28 | No Opt. Call | A | $ 3,019,825 |
| 2,905 | | 5.000%, 4/01/29 | No Opt. Call | A | 3,545,872 |
| 1,470 | | 5.000%, 4/01/30 | No Opt. Call | A | 1,811,702 |
| 26,620 | | Total Missouri | | | 30,301,734 |
| | Nevada – 0.9% (0.9% of Total Investments) | | | |
| 5,920 | | Clark County School District, Nevada, General Obligation Bonds, Limited Tax Building | 6/30 at 100.00 | A1 | 6,237,371 |
| | Series 2020B, 3.000%, 6/15/38 – BAM Insured (WI/DD, Settling 11/03/20) | | | |
| | Las Vegas, Nevada, Local Improvement Bonds, Special Improvement District 611 Sunstone | | | |
| | Phase I and II, Series 2020: | | | |
| 450 | | 4.000%, 6/01/40 | 6/30 at 100.00 | N/R | 452,840 |
| 1,150 | | 4.125%, 6/01/50 | 6/30 at 100.00 | N/R | 1,147,044 |
| 7,520 | | Total Nevada | | | 7,837,255 |
| | New Hampshire – 0.1% (0.1% of Total Investments) | | | |
| 1,250 | | New Hampshire Health and Education Facilities Authority, Revenue Bonds, Catholic Medical | 7/27 at 100.00 | Baa2 | 1,276,825 |
| | Center, Series 2017, 3.750%, 7/01/40 | | | |
| | New Jersey – 0.7% (0.6% of Total Investments) | | | |
| | South Jersey Transportation Authority, New Jersey, Transportation System Revenue Bonds, | | | |
| | Series 2020A: | | | |
| 1,000 | | 5.000%, 11/01/45 | 11/30 at 100.00 | Baa2 | 1,196,540 |
| 3,125 | | 4.000%, 11/01/50 | 11/30 at 100.00 | Baa2 | 3,391,031 |
| 1,100 | | South Jersey Transportation Authority, New Jersey, Transportation System Revenue Bonds, | 11/30 at 100.00 | Baa3 | 1,201,585 |
| | Subordinate Series 2020A, 4.000%, 11/01/50 – BAM Insured | | | |
| 5,225 | | Total New Jersey | | | 5,789,156 |
| | New Mexico – 0.8% (0.7% of Total Investments) | | | |
| 7,000 | | Winrock Town Center Tax Increment Development District 1, Albuquerque, New Mexico, Gross | 11/23 at 103.00 | N/R | 6,765,850 |
| | Receipts Tax Increment Bonds, Subordinate Lien Series 2020, 8.000%, 5/01/40, 144A (WI/DD, | | | |
| | Settling 11/17/20) | | | |
| | New York – 19.9% (18.8% of Total Investments) | | | |
| 4,000 | | Build NYC Resource Corporation, New York, Revenue Bonds, Albert Einstein College of | 9/25 at 100.00 | N/R | 4,293,440 |
| | Medicine, Inc, Series 2015, 5.500%, 9/01/45, 144A | | | |
| 10,000 | | Dormitory Authority of the State of New York, Revenue Bonds, Catholic Health System | 7/29 at 100.00 | BBB | 10,648,500 |
| | Obligated Group Series 2019A, 4.000%, 7/01/45 (UB) (WI/DD, Settling 11/03/20) (4) | | | |
| 20,000 | | Dormitory Authority of the State of New York, State Personal Income Tax Revenue Bonds, | 9/30 at 100.00 | Aa2 | 20,292,600 |
| | General Purpose, Series 2020A Bidding Group 1 thru 5, 3.000%, 3/15/50 (UB) (4) | | | |
| 7,695 | | Dormitory Authority of the State of New York, State Sales Tax Revenue Bonds, Series | 9/28 at 100.00 | AA+ | 9,299,023 |
| | 2018E Group 4, 5.000%, 3/15/48 | | | |
| 12,360 | | Metropolitan Transportation Authority, New York, Transportation Revenue Bonds, Refunding | 11/26 at 100.00 | BBB+ | 13,057,228 |
| | Green Series 2016B, 5.000%, 11/15/37 | | | |
| 2,640 | | Metropolitan Transportation Authority, New York, Transportation Revenue Bonds, Refunding | 5/28 at 100.00 | BBB+ | 2,645,069 |
| | Series 2017D, 4.000%, 11/15/42 | | | |
| 10,000 | | Metropolitan Transportation Authority, New York, Transportation Revenue Bonds, Series | 11/24 at 100.00 | BBB+ | 10,505,100 |
| | 2014D-1, 5.250%, 11/15/44 (UB) (4) | | | |
| | Monroe County Industrial Development Corporation, New York, Revenue Bonds, Rochester | | | |
| | Regional Health Project, Series 2020A: | | | |
| 715 | | 3.000%, 12/01/37 (WI/DD, Settling 11/17/20) | 12/30 at 100.00 | BBB+ | 710,274 |
| 2,200 | | 3.000%, 12/01/40 (WI/DD, Settling 11/17/20) | 12/30 at 100.00 | BBB+ | 2,178,902 |
| 1,000 | | 4.000%, 12/01/46 (WI/DD, Settling 11/17/20) | 12/30 at 100.00 | BBB+ | 1,089,610 |
| | New York City Industrial Development Agency, New York, PILOT Payment in Lieu of Taxes | | | |
| | Revenue Bonds, Yankee Stadium Project, Series 2020A: | | | |
| 5,385 | | 3.000%, 3/01/39 – AGM Insured (UB) (4) | 9/30 at 100.00 | Baa1 | 5,564,644 |
| 3,845 | | 3.000%, 3/01/40 – AGM Insured (UB) (4) | 9/30 at 100.00 | Baa1 | 3,969,616 |
| 2,275 | | 3.000%, 3/01/49 (UB) (4) | 9/30 at 100.00 | BBB+ | 2,222,220 |
153
| | |
| NDMO | Nuveen Dynamic Municipal Opportunities Fund Portfolio of Investments (continued) October 31, 2020 |
| | | | | | |
| Principal | | | Optional Call | | |
| Amount (000) | | Description (1) | Provisions (2) | Ratings (3) | Value |
| | New York (continued) | | | |
| | New York City, New York, General Obligation Bonds, Fiscal 2021 Series C: | | | |
| $ 1,695 | | 4.000%, 8/01/36 | 8/30 at 100.00 | AA | $ 1,958,284 |
| 1,250 | | 4.000%, 8/01/39 | 8/30 at 100.00 | AA | 1,427,513 |
| 2,650 | | 4.000%, 8/01/40 | 8/30 at 100.00 | AA | 3,016,336 |
| 4,000 | | New York Counties Tobacco Trust IV, Tobacco Settlement Pass-Through Bonds, Turbo Term | 11/20 at 100.00 | B– | 4,042,760 |
| | Series 2005A, 5.000%, 6/01/42 | | | |
| 3,000 | | New York Liberty Development Corporation, New York, Liberty Revenue Bonds, 3 World Trade | 11/24 at 100.00 | N/R | 3,073,620 |
| | Center Project, Class 1 Series 2014, 5.000%, 11/15/44, 144A | | | |
| 9,000 | | New York State Thruway Authority, General Revenue Bonds, Series 2020N, 4.000%, 1/01/41 | 1/30 at 100.00 | A | 10,234,440 |
| 10,615 | | New York State Urban Development Corporation, State Personal Income Tax Revenue Bonds, | 9/30 at 100.00 | Aa2 | 13,195,400 |
| | Series 2020C, 5.000%, 3/15/43 | | | |
| | New York Transportation Development Corporation, New York, Special Facility Revenue | | | |
| | Bonds, American Airlines, Inc John F Kennedy International Airport Project, Series 2020: | | | |
| 13,000 | | 5.250%, 8/01/31 (AMT) | 8/30 at 100.00 | B– | 13,398,970 |
| 3,400 | | 5.375%, 8/01/36 (AMT) | 8/30 at 100.00 | B– | 3,523,658 |
| | New York Transportation Development Corporation, Special Facility Revenue Bonds, Delta | | | |
| | Air Lines, Inc – LaGuardia Airport Terminals C&D Redevelopment Project, Series 2020: | | | |
| 1,000 | | 4.000%, 10/01/30 (AMT) | No Opt. Call | BB+ | 1,027,190 |
| 4,000 | | 5.000%, 10/01/35 (AMT) | 10/30 at 100.00 | BB+ | 4,369,000 |
| 6,000 | | 5.000%, 10/01/40 (AMT) | 10/30 at 100.00 | BB+ | 6,437,820 |
| 6,250 | | 4.375%, 10/01/45 (AMT) | 10/30 at 100.00 | BB+ | 6,332,687 |
| | Port Authority of New York and New Jersey, Consolidated Revenue Bonds, Two Hundred | | | |
| | Twenty-one Series 2020: | | | |
| 2,000 | | 4.000%, 7/15/36 (AMT) | 7/30 at 100.00 | A+ | 2,279,860 |
| 2,000 | | 4.000%, 7/15/37 (AMT) | 7/30 at 100.00 | A+ | 2,269,180 |
| 5,000 | | 4.000%, 7/15/39 (AMT) | 7/30 at 100.00 | A+ | 5,634,050 |
| 156,975 | | Total New York | | | 168,696,994 |
| | North Carolina – 1.3% (1.3% of Total Investments) | | | |
| | Western Carolina University, North Carolina, General Revenue Bonds, Series 2020B: | | | |
| 2,090 | | 4.000%, 4/01/45 | 4/30 at 100.00 | Aa3 | 2,398,442 |
| 7,910 | | 4.000%, 4/01/50 | 4/30 at 100.00 | Aa3 | 9,020,881 |
| 10,000 | | Total North Carolina | | | 11,419,323 |
| | Ohio – 6.4% (6.0% of Total Investments) | | | |
| | Akron, Bath and Copley Joint Township Hospital District, Ohio, Hospital Facilities | | | |
| | Revenue Bonds, Summa Health Obligated Group, Refunding Series 2020: | | | |
| 220 | | 4.000%, 11/15/36 (UB) (4) | 11/30 at 100.00 | Baa2 | 244,904 |
| 1,500 | | 4.000%, 11/15/38 (UB) (4) | 11/30 at 100.00 | Baa2 | 1,657,770 |
| 10,325 | | 3.000%, 11/15/40 (UB) (4) | 11/30 at 100.00 | Baa2 | 10,198,621 |
| 9,950 | | Buckeye Tobacco Settlement Financing Authority, Ohio, Tobacco Settlement Asset-Backed | 6/30 at 100.00 | BBB+ | 9,534,090 |
| | Revenue Bonds, Refunding Senior Lien Series 2020A-2 Class 1, 3.000%, 6/01/48 | | | |
| 9,180 | | Buckeye Tobacco Settlement Financing Authority, Ohio, Tobacco Settlement Asset-Backed | 6/30 at 100.00 | N/R | 9,828,751 |
| | Revenue Bonds, Refunding Senior Lien Series 2020B-2 Class 2, 5.000%, 6/01/55 | | | |
| 2,500 | | Ohio Air Quality Development Authority, Ohio, Exempt Facilities Revenue Bonds, AMG | 7/29 at 100.00 | B3 | 2,549,125 |
| | Vanadium Project, Series 2019, 5.000%, 7/01/49 (AMT), 144A | | | |
| 20,000 | | Southern Ohio Port Authority, Ohio, Facility Revenue Bonds, Purecycle Project, Series | 12/27 at 103.00 | N/R | 20,055,600 |
| | 2020A, 7.000%, 12/01/42 (AMT) | | | |
| 53,675 | | Total Ohio | | | 54,068,861 |
| | Oregon – 1.6% (1.5% of Total Investments) | | | |
| | Port of Portland, Oregon, International Airport Revenue Bonds, Series 2020-27A: | | | |
| 5,625 | | 4.000%, 7/01/39 (AMT) | 7/30 at 100.00 | A+ | 6,234,750 |
| 6,625 | | 4.000%, 7/01/50 (AMT) | 7/30 at 100.00 | A+ | 7,163,679 |
| 12,250 | | Total Oregon | | | 13,398,429 |
154
| | | | | | |
| Principal | | | Optional Call | | |
| Amount (000) | | Description (1) | Provisions (2) | Ratings (3) | Value |
| | Pennsylvania – 1.9% (1.8% of Total Investments) | | | |
| $ 5,000 | | Allegheny County Industrial Development Authority, Pennsylvania, Environmental Improvement | No Opt. Call | Caa2 | $ 4,525,900 |
| | Revenue Bonds, United States Steel Corp, Refunding Series 2019, 5.125%, 5/01/30 | | | |
| | Philadelphia Gas Works, Pennsylvania, Revenue Bonds, 1998 General Ordinance, Refunding | | | |
| | Sixteenth Series 2020B: | | | |
| 1,000 | | 4.000%, 8/01/36 – AGM Insured | 8/30 at 100.00 | BBB+ | 1,170,620 |
| 1,500 | | 4.000%, 8/01/37 – AGM Insured | 8/30 at 100.00 | BBB+ | 1,750,590 |
| 2,705 | | 4.000%, 8/01/38 – AGM Insured | 8/30 at 100.00 | BBB+ | 3,145,753 |
| 650 | | 4.000%, 8/01/39 – AGM Insured | 8/30 at 100.00 | BBB+ | 753,344 |
| | Philadelphia Gas Works, Pennsylvania, Revenue Bonds, 1998 General Ordinance, Sixteenth | | | |
| | Series 2020A: | | | |
| 1,665 | | 5.000%, 8/01/39 – AGM Insured | 8/30 at 100.00 | BBB+ | 2,103,544 |
| 1,000 | | 4.000%, 8/01/45 – AGM Insured | 8/30 at 100.00 | BBB+ | 1,135,360 |
| 1,000 | | 5.000%, 8/01/50 – AGM Insured | 8/30 at 100.00 | BBB+ | 1,233,090 |
| 14,520 | | Total Pennsylvania | | | 15,818,201 |
| | Puerto Rico – 5.2% (4.9% of Total Investments) | | | |
| | Puerto Rico Aqueduct and Sewerage Authority, Revenue Bonds, Senior Lien Series 2012A: | | | |
| 7,450 | | 5.000%, 7/01/23 | 11/20 at 100.00 | CC | 7,431,375 |
| 5,020 | | 5.125%, 7/01/37 | 7/22 at 100.00 | CC | 5,183,150 |
| 2,000 | | 6.000%, 7/01/47 | 7/22 at 100.00 | CC | 2,097,500 |
| | Puerto Rico Sales Tax Financing Corporation, Sales Tax Revenue Bonds, Restructured 2018A-1: | | | |
| 20,000 | | 0.000%, 7/01/46 | 7/28 at 41.38 | N/R | 5,779,000 |
| 35,000 | | 0.000%, 7/01/51 | 7/28 at 30.01 | N/R | 7,292,950 |
| 4,514 | | 4.750%, 7/01/53 | 7/28 at 100.00 | N/R | 4,749,495 |
| 2,500 | | 5.000%, 7/01/58 | 7/28 at 100.00 | N/R | 2,663,375 |
| 15,000 | | Puerto Rico, General Obligation Bonds, Public Improvement, Series 2014A, 3.180%, 7/01/35 (5) | 11/20 at 100.00 | D | 9,000,000 |
| 91,484 | | Total Puerto Rico | | | 44,196,845 |
| | South Carolina – 0.6% (0.6% of Total Investments) | | | |
| 5,000 | | South Carolina Jobs-Economic Development Authority, Hospital Revenue Bonds, Conway | 1/30 at 100.00 | A | 5,049,700 |
| | Hospital, Inc, Taxable Series 2020, 2.729%, 7/01/30 – AGM Insured | | | |
| | South Dakota – 0.5% (0.5% of Total Investments) | | | |
| | South Dakota Health and Educational Facilities Authority, Revenue Bonds, Monument | | | |
| | Health, Inc, Series 2020A: | | | |
| 2,145 | | 3.000%, 9/01/45 (UB) (4) | 9/30 at 100.00 | A1 | 2,128,697 |
| 1,800 | | 4.000%, 9/01/50 (UB) (4) | 9/30 at 100.00 | A1 | 1,973,826 |
| 3,945 | | Total South Dakota | | | 4,102,523 |
| | Tennessee – 0.4% (0.4% of Total Investments) | | | |
| 2,555 | | Memphis, Tennessee, Sanitary Sewerage System Revenue Bonds, Refunding Series 2020B, | 10/30 at 100.00 | Aa2 | 3,295,107 |
| | 5.000%, 10/01/45 | | | |
| | Texas – 3.2% (3.1% of Total Investments) | | | |
| 750 | | Austin Convention Enterprises Inc, Texas, Convention Center Hotel Revenue Bonds, | 1/27 at 100.00 | BBB– | 768,720 |
| | Refunding First Tier Series 2017A, 5.000%, 1/01/28 | | | |
| 1,200 | | Hays County, Texas, Special Assessment Revenue Bonds, La Cima Public Improvement | 9/30 at 100.00 | N/R | 1,203,828 |
| | District Neighbor Improvement Areas 1-2 Project, Series 2020, 4.000%, 9/15/50, 144A | | | |
| | (WI/DD, Settling 11/12/20) | | | |
| 4,750 | | Houston, Texas, Airport System Revenue Bonds, Refunding Subordinate Lien Series 2020A, | 7/30 at 100.00 | A | 5,212,650 |
| | 4.000%, 7/01/47 (AMT) | | | |
| 4,175 | | New Hope Cultural Education Facilities Finance Corporation, Texas, Education Revenue | 8/25 at 103.00 | BB+ | 4,460,278 |
| | Bonds, Southwest Preparatory School, Series 2020A, 5.000%, 8/15/50, 144A | | | |
| 2,035 | | Sachse, Texas, Special Assessment Bonds, Sachse Public Improvement District 1 Major | 9/30 at 100.00 | N/R | 2,039,477 |
| | Improvement Area Project, Series 2020, 5.375%, 9/15/40, 144A (WI/DD, Settling 11/10/20) | | | |
| 3,810 | | Texas Private Activity Bond Surface Transportation Corporation, Senior Lien Revenue Bonds, NTE | 6/29 at 100.00 | Baa3 | 4,340,352 |
| | Mobility Partners Segments 3 LLC Segments 3C Project, Series 2019, 5.000%, 6/30/58 (AMT) | | | |
155
| | |
| NDMO | Nuveen Dynamic Municipal Opportunities Fund Portfolio of Investments (continued) October 31, 2020 |
| | | | | | | |
| Principal | | | | Optional Call | | |
| Amount (000) | | Description (1) | | Provisions (2) | Ratings (3) | Value |
| | Texas (continued) | | | | |
| | Texas Private Activity Bond Surface Transportation Corporation, Senior Lien Revenue | | | | |
| | Bonds, LBJ Infrastructure Group LLC IH-635 Managed Lanes Project, Refunding Series 2020A: | | | |
| $ 2,630 | | 4.000%, 6/30/35 | | 12/30 at 100.00 | BBB– | $ 2,990,073 |
| 1,540 | | 4.000%, 6/30/36 | | 12/30 at 100.00 | BBB– | 1,742,603 |
| 2,195 | | 4.000%, 12/31/37 | | 12/30 at 100.00 | BBB– | 2,467,070 |
| 2,000 | | 4.000%, 6/30/40 | | 12/30 at 100.00 | BBB– | 2,228,360 |
| 25,085 | | Total Texas | | | | 27,453,411 |
| | Virginia – 0.9% (0.8% of Total Investments) | | | | |
| 3,000 | | Virginia Small Business Financing Authority, Private Activity Revenue Bonds, Transform | | 6/27 at 100.00 | Baa3 | 3,351,870 |
| | 66 P3 Project, Senior Lien Series 2017, 5.000%, 12/31/49 (AMT) | | | | |
| | Virginia Small Business Financing Authority, Revenue Bonds, National Senior Campuses Inc | | | | |
| | Obligated Group, Series 2020A: | | | | |
| 1,280 | | 4.000%, 1/01/45 | | 7/27 at 103.00 | A | 1,370,713 |
| 2,380 | | 4.000%, 1/01/51 | | 7/27 at 103.00 | A | 2,533,177 |
| 6,660 | | Total Virginia | | | | 7,255,760 |
| | Wisconsin – 2.2% (2.0% of Total Investments) | | | | |
| 6,350 | | Public Finance Authority of Wisconsin, Charter School Revenue Bonds, Freedom Classical | | 1/28 at 100.00 | N/R | 6,391,339 |
| | Academy Inc, Series 2020A, 5.000%, 1/01/56, 144A | | | | |
| | Public Finance Authority of Wisconsin, Hospital Revenue Bonds, Renown Regional Medical | | | | |
| | Center Project, Refunding Series 2020A: | | | | |
| 2,035 | | 3.000%, 6/01/45 (UB) (4) | | 6/30 at 100.00 | A+ | 2,029,322 |
| 5,415 | | 3.000%, 6/01/45 – AGM Insured (UB) (4) | | 6/30 at 100.00 | A+ | 5,520,863 |
| 5,000 | | Public Finance Authority of Wisconsin, Limited Obligation PILOT Revenue Bonds, American | | 12/27 at 100.00 | N/R | 4,318,350 |
| | Dream @ Meadowlands Project, Series 2017, 7.000%, 12/01/50, 144A | | | | |
| 18,800 | | Total Wisconsin | | | | 18,259,874 |
| $ 926,169 | | Total Municipal Bonds (cost $897,448,026) | | | | 896,268,229 |
| Principal | | | | | | |
| Amount (000) | | Description (1) | Coupon | Maturity | Ratings (3) | Value |
| | CORPORATE BONDS – 0.1% (0.1% of Total Investments) | | | | |
| | Utilities – 0.1% (0.1% of Total Investments) | | | | |
| $ 1,500 | | Talen Energy Supply LLC | 6.000% | 12/15/36 | B | $ 638,250 |
| $ 1,500 | | Total Corporate Bonds (cost $752,112) | | | | 638,250 |
| | Total Long-Term Investments (cost $898,200,138) | | | | 896,906,479 |
| | Floating Rate Obligations – (17.0)% | | | | (144,090,000) |
| | Other Assets Less Liabilities – 11.1% | | | | 93,973,633 |
| | Net Assets Applicable to Common Shares – 100% | | | | $ 846,790,112 |
| | |
(1) | All percentages shown in the Portfolio of Investments are based on net assets applicable to common shares unless otherwise noted. |
(2) | Optional Call Provisions: Dates (month and year) and prices of the earliest optional call or redemption. There may be other call provisions at varying prices at later dates. |
| Certain mortgage-backed securities may be subject to periodic principal paydowns. Optional Call Provisions are not covered by the report of independent registered public |
| accounting firm. |
(3) | The ratings disclosed are the lowest of Standard & Poor’s Group (“Standard & Poor’s”), Moody’s Investors Service, Inc. (“Moody’s”) or Fitch, Inc. (“Fitch”) rating. Ratings below |
| BBB by Standard & Poor’s, Baa by Moody’s or BBB by Fitch are considered to be below investment grade. Holdings designated N/R are not rated by any of these national |
| rating agencies. Ratings are not covered by the report of independent registered public accounting firm. |
(4) | Investment, or portion of investment, has been pledged to collateralize the net payment obligations for investments in inverse floating rate transactions. |
(5) | Defaulted security. A security whose issuer has failed to fully pay principal and/or interest when due, or is under the protection of bankruptcy. |
144A | Investment is exempt from registration under Rule 144A of the Securities Act of 1933, as amended. These investments may only be resold in transactions exempt from registration, |
| which are normally those transactions with qualified institutional buyers. |
AMT | Alternative Minimum Tax. |
UB | Underlying bond of an inverse floating rate trust reflected as a financing transaction. See Notes to Financial Statements, Note 4 – Portfolio Securities and Investments in |
| Derivatives for more information. |
WI/DD | Purchased on a when-issued or delayed delivery basis. |
| See accompanying notes to financial statements. |
156
Statement of Assets and Liabilities
October 31, 2020
| | | | NVG | | | NZF | | | NMZ | | | NMCO | | | NDMO | |
| Assets | | | | | | | | | | | | | | | | |
Long-term investments, at value (cost $5,169,905,327, | | | | | | | | | | | | | | | | |
| $3,321,987,584, $1,582,393,332, $1,146,441,316 | | | | | | | | | | | | | | | | |
and $898,200,138, respectively) | | | $ | 5,641,877,288 | | | $ | 3,610,561,483 | | | $ | 1,592,475,054 | | | $ | 1,104,614,264 | | | $ | 896,906,479 | |
Short-term investments, at value (cost approximates value) | | | | — | | | | — | | | | — | | | | 15,267,850 | | | | — | |
Cash | | | | 1,463,587 | | | | — | | | | 7,447,518 | | | | 17,480,636 | | | | 129,861,979 | |
Receivable for: | | | | | | | | | | | | | | | | | | | | | |
| Dividends and interest | | | | 73,508,094 | | | | 48,844,035 | | | | 28,607,818 | | | | 18,850,357 | | | | 6,463,500 | |
| Investments sold | | | | 17,342,145 | | | | 7,499,507 | | | | 5,943,411 | | | | 4,660,000 | | | | 26,330,436 | |
Deferred offering costs | | | | — | | | | — | | | | 235,997 | | | | — | | | | — | |
Other assets | | | | 1,903,186 | | | | 819,463 | | | | 112,790 | | | | 80,827 | | | | 840 | |
Total assets | | | | 5,736,094,300 | | | | 3,667,724,488 | | | | 1,634,822,588 | | | | 1,160,953,934 | | | | 1,059,563,234 | |
| Liabilities | | | | | | | | | | | | | | | | | | | | | |
Cash overdraft | | | | — | | | | 1,018,115 | | | | — | | | | — | | | | — | |
Floating rate obligations | | | | 191,075,000 | | | | 16,275,000 | | | | 434,051,000 | | | | 21,923,000 | | | | 144,090,000 | |
Payable for: | | | | | | | | | | | | | | | | | | | | | |
| Dividends | | | | 13,634,616 | | | | 8,899,771 | | | | 5,061,851 | | | | 3,191,075 | | | | 3,823,967 | |
| Interest | | | | 438,111 | | | | 44,684 | | | | 1,033,090 | | | | 52,581 | | | | 48,111 | |
| Investments purchased – regular settlement | | | | — | | | | — | | | | 2,500,000 | | | | 1,249,022 | | | | 11,030,676 | |
| Investments purchased – when-issued/ | | | | | | | | | | | | | | | | | | | | | |
| delayed-delivery settlement | | | | 26,278,371 | | | | 8,054,279 | | | | 6,515,670 | | | | 2,180,119 | | | | 53,100,098 | |
Adjustable Rate MuniFund Term Preferred (“AMTP”) Shares, | | | | | | | | | | | | | | | | | | | | | |
| net of deferred offering costs (liquidation preference | | | | | | | | | | | | | | | | | | | | | |
| $112,000,000, $—, $87,000,000, $— and | | | | | | | | | | | | | | | | | | | | | |
| $—, respectively) | | | | 111,913,155 | | | | — | | | | 86,882,357 | | | | — | | | | — | |
MuniFund Term Preferred (“MFP”) Shares, net of deferred | | | | | | | | | | | | | | | | | | | | | |
| offering costs (liquidation preference $405,400,000, | | | | | | | | | | | | | | | | | | | | | |
| $641,000,000, $—, $450,000,000 and $—, respectively) | | | | 403,997,740 | | | | 640,010,468 | | | | — | | | | 448,842,816 | | | | — | |
Variable Rate Demand Preferred (“VRDP”) Shares, net | | | | | | | | | | | | | | | | | | | | | |
| of deferred offering costs (liquidation preference | | | | | | | | | | | | | | | | | | | | | |
| $1,411,600,000, $727,000,000, $—, $— and | | | | | | | | | | | | | | | | | | | | | |
| $—, respectively) | | | | 1,408,052,524 | | | | 722,526,702 | | | | — | | | | — | | | | — | |
Accrued expenses: | | | | | | | | | | | | | | | | | | | | | |
| Management fees | | | | 2,900,671 | | | | 1,871,384 | | | | 899,379 | | | | 844,501 | | | | 579,833 | |
| Trustees fees | | | | 988,665 | | | | 650,358 | | | | 102,379 | | | | 8,544 | | | | 2,282 | |
| Shelf offering costs | | | | — | | | | — | | | | 190,998 | | | | — | | | | — | |
| Other | | | | 459,879 | | | | 408,246 | | | | 168,064 | | | | 151,903 | | | | 98,155 | |
| Total liabilities | | | | 2,159,738,732 | | | | 1,399,759,007 | | | | 537,404,788 | | | | 478,443,561 | | | | 212,773,122 | |
Net assets applicable to common shares | | | $ | 3,576,355,568 | | | $ | 2,267,965,481 | | | $ | 1,097,417,800 | | | $ | 682,510,373 | | | $ | 846,790,112 | |
Common shares outstanding | | | | 213,370,544 | | | | 142,125,906 | | | | 83,009,376 | | | | 53,276,080 | | | | 56,756,667 | |
Net asset value (“NAV”) per common share outstanding | | | $ | 16.76 | | | $ | 15.96 | | | $ | 13.22 | | | $ | 12.81 | | | $ | 14.92 | |
| Net assets applicable to common shares consist of: | | | | | | | | | | | | | | | | | | | | | |
Common shares, $0.01 par value per share | | | $ | 2,133,705 | | | $ | 1,421,259 | | | $ | 830,094 | | | $ | 532,761 | | | $ | 567,567 | |
Paid-in surplus | | | | 3,083,333,610 | | | | 2,008,061,870 | | | | 1,077,216,322 | | | | 798,499,176 | | | | 850,782,438 | |
Total distributable earnings | | | | 490,888,253 | | | | 258,482,352 | | | | 19,371,384 | | | | (116,521,564 | ) | | | (4,559,893 | ) |
Net assets applicable to common shares | | | $ | 3,576,355,568 | | | $ | 2,267,965,481 | | | $ | 1,097,417,800 | | | $ | 682,510,373 | | | $ | 846,790,112 | |
Authorized shares: | | | | | | | | | | | | | | | | | | | | | |
| Common | | | Unlimited | | | Unlimited | | | Unlimited | | | Unlimited | | | Unlimited | |
| Preferred | | | Unlimited | | | Unlimited | | | Unlimited | | | Unlimited | | | Unlimited | |
See accompanying notes to financial statements.
157
Year Ended October 31, 2020
| | | | | | | | | | | | | | | | |
| | NVG | | | NZF | | | NMZ | | | NMCO | | | NDMO* | |
| Investment Income | | $ | 245,135,521 | | | $ | 160,368,981 | | | $ | 72,552,074 | | | $ | 55,248,643 | | | $ | 2,803,041 | |
| Expenses | | | | | | | | | | | | | | | | | | | | |
Management fees | | | 33,656,813 | | | | 22,163,781 | | | | 10,226,367 | | | | 9,784,807 | | | | 1,133,137 | |
Interest expense and amortization of offering costs | | | 22,323,140 | | | | 21,424,891 | | | | 6,946,717 | | | | 6,415,513 | | | | 48,111 | |
Liquidity fees | | | 10,357,686 | | | | 1,541,556 | | | | — | | | | 734,170 | | | | — | |
Remarketing fees | | | 1,858,840 | | | | 108,345 | | | | — | | | | 96,112 | | | | — | |
Custodian fees | | | 453,491 | | | | 326,578 | | | | 141,255 | | | | 81,008 | | | | 14,130 | |
Trustees fees | | | 138,330 | | | | 92,105 | | | | 29,310 | | | | 29,102 | | | | 5,736 | |
Professional fees | | | 303,749 | | | | 427,902 | | | | 106,420 | | | | 83,444 | | | | 8,155 | |
Shareholder reporting expenses | | | 272,272 | | | | 176,026 | | | | 92,147 | | | | 51,342 | | | | 41,091 | |
Shareholder servicing agent fees | | | 95,087 | | | | 48,242 | | | | 14,656 | | | | 983 | | | | 25 | |
Stock exchange listing fees | | | 57,890 | | | | 38,900 | | | | 49,020 | | | | 12,081 | | | | — | |
Investor relations expenses | | | 299,232 | | | | 200,358 | | | | 64,021 | | | | 66,718 | | | | 10,596 | |
Merger expenses | | | 506,816 | | | | — | | | | — | | | | — | | | | — | |
Other | | | 264,999 | | | | 241,804 | | | | 60,762 | | | | 57,401 | | | | 16,461 | |
Total expenses | | | 70,588,345 | | | | 46,790,488 | | | | 17,730,675 | | | | 17,412,681 | | | | 1,277,442 | |
Net investment income (loss) | | | 174,547,176 | | | | 113,578,493 | | | | 54,821,399 | | | | 37,835,962 | | | | 1,525,599 | |
| Realized and Unrealized Gain (Loss) | | | | | | | | | | | | | | | | | | | | |
Net realized gain (loss) from investments | | | 20,352,040 | | | | (13,050,569 | ) | | | 1,845,773 | | | | (76,019,228 | ) | | | (449,948 | ) |
Change in net unrealized appreciation (depreciation) | | | | | | | | | | | | | | | | | | | | |
| of Investments | | | (104,484,643 | ) | | | (88,994,829 | ) | | | (64,189,142 | ) | | | (43,965,731 | ) | | | (1,293,659 | ) |
Net realized and unrealized gain (loss) | | | (84,132,603 | ) | | | (102,045,398 | ) | | | (62,343,369 | ) | | | (119,984,959 | ) | | | (1,743,607 | ) |
Net increase (decrease) in net assets applicable to | | | | | | | | | | | | | | | | | | | | |
| common shares from operations | | $ | 90,414,573 | | | $ | 11,533,095 | | | $ | (7,521,970 | ) | | $ | (82,148,997 | ) | | $ | (218,008 | ) |
* For the period August 26, 2020 (commencement of operations) through October 31, 2020.
See accompanying notes to financial statements.
158
Statement of Changes in Net Assets
| | NVG | | | NZF | |
| | Year Ended | | | Year Ended | | | Year Ended | | | Year Ended | |
| | 10/31/20 | | | 10/31/19 | | | 10/31/20 | | | 10/31/19 | |
| Operations | | | | | | | | | | | | |
Net investment income (loss) | | $ | 174,547,176 | | | $ | 160,212,808 | | | $ | 113,578,493 | | | $ | 106,791,813 | |
Net realized gain (loss) from: | | | | | | | | | | | | | | | | |
| Investments | | | 20,352,040 | | | | 8,920,660 | | | | (13,050,569 | ) | | | 12,807,388 | |
| Swaps | | | — | | | | (80,409 | ) | | | — | | | | — | |
Change in net unrealized appreciation (depreciation) of: | | | | | | | | | | | | | | | | |
| Investments | | | (104,484,643 | ) | | | 339,640,998 | | | | (88,994,829 | ) | | | 215,305,771 | |
| Swaps | | | — | | | | (1,924,823 | ) | | | — | | | | — | |
Net increase (decrease) in net assets applicable to | | | | | | | | | | | | | | | | |
| common shares from operations | | | 90,414,573 | | | | 506,769,234 | | | | 11,533,095 | | | | 334,904,972 | |
| Distributions to Common Shareholders | | | | | | | | | | | | | | | | |
Dividends | | | (175,828,479 | ) | | | (164,776,774 | ) | | | (107,589,117 | ) | | | (112,563,715 | ) |
Decrease in net assets applicable to common shares from | | | | | | | | | | | | | | | | |
| distributions to common shareholders | | | (175,828,479 | ) | | | (164,776,774 | ) | | | (107,589,117 | ) | | | (112,563,715 | ) |
| Capital Share Transactions | | | | | | | | | | | | | | | | |
Common shares: | | | | | | | | | | | | | | | | |
| Proceeds from sale of shares, net of offering costs | | | — | | | | — | | | | — | | | | — | |
| Proceeds from shelf offering, net of offering costs | | | — | | | | — | | | | — | | | | — | |
| Net proceeds from shares issued to shareholders | | | | | | | | | | | | | | | | |
| due to reinvestment of distributions | | | — | | | | — | | | | — | | | | — | |
| Issued in the Merger | | | 184,807,196 | | | | — | | | | — | | | | — | |
Net increase (decrease) in net assets applicable to | | | | | | | | | | | | | | | | |
| common shares from capital share transactions | | | 184,807,196 | | | | — | | | | — | | | | — | |
Net increase (decrease) in net assets applicable to | | | | | | | | | | | | | | | | |
| common shares | | | 99,393,290 | | | | 341,992,460 | | | | (96,056,022 | ) | | | 222,341,257 | |
Net assets applicable to common shares at the | | | | | | | | | | | | | | | | |
| beginning of period | | | 3,476,962,278 | | | | 3,134,969,818 | | | | 2,364,021,503 | | | | 2,141,680,246 | |
Net assets applicable to common shares at the end | | | | | | | | | | | | | | | | |
| of period | | $ | 3,576,355,568 | | | $ | 3,476,962,278 | | | $ | 2,267,965,481 | | | $ | 2,364,021,503 | |
See accompanying notes to financial statements.
159
Statement of Changes in Net Assets (continued)
| | NMZ
| | | NMCO | | | NDMO | |
| | | | | | | | | | | For the period | | | For the period | |
| | | | | | | | | | | 9/16/19 | | | 8/26/20 | |
| | | | | | | | | | | (commencement | | | (commencement | |
| | Year Ended | | | Year Ended | | | Year Ended | | | of operations) | | | of operations) | |
| | 10/31/20 | | | 10/31/19 | | | 10/31/20 | | | through 10/31/19 | | | through 10/31/20 | |
| Operations | | | | | | | | | | | | | | | |
Net investment income (loss) | | $ | 54,821,399 | | | $ | 49,736,206 | | | $ | 37,835,962 | | | $ | 2,339,067 | | | $ | 1,525,599 | |
Net realized gain (loss) from: | | | | | | | | | | | | | | | | | | | | |
| Investments | | | 1,845,773 | | | | 2,231,652 | | | | (76,019,228 | ) | | | (282,042 | ) | | | (449,948 | ) |
| Swaps | | | — | | | | — | | | | — | | | | — | | | | — | |
Change in net unrealized appreciation (depreciation) of: | | | | | | | | | | | | | | | | | | | | |
| Investments | | | (64,189,142 | ) | | | 74,265,476 | | | | (43,965,731 | ) | | | 2,138,679 | | | | (1,293,659 | ) |
| Swaps | | | — | | | | — | | | | — | | | | — | | | | — | |
Net increase (decrease) in net assets applicable to | | | | | | | | | | | | | | | | | | | | |
common shares from operations | | | (7,521,970 | ) | | | 126,233,334 | | | | (82,148,997 | ) | | | 4,195,704 | | | | (218,008 | ) |
| Distributions to Common Shareholders | | | | | | | | | | | | | | | | | | | | |
Dividends | | | (57,470,993 | ) | | | (45,460,832 | ) | | | (38,645,307 | ) | | | — | | | | (4,341,885 | ) |
Decrease in net assets applicable to common shares from | | | | | | | | | | | | | | | | | | | | |
| distributions to common shareholders | | | (57,470,993 | ) | | | (45,460,832 | ) | | | (38,645,307 | ) | | | — | | | | (4,341,885 | ) |
| Capital Share Transactions | | | | | | | | | | | | | | | | | | | | |
Common shares: | | | | | | | | | | | | | | | | | | | | |
| Proceeds from sale of shares, net of offering costs | | | — | | | | — | | | | — | | | | 798,750,000 | | | | 851,250,000 | |
| Proceeds from shelf offering, net of offering costs | | | 192,765,554 | | | | 69,515,572 | | | | — | | | | — | | | | — | |
| Net proceeds from shares issued to shareholders | | | | | | | | | | | | | | | | | | | | |
| due to reinvestment of distributions | | | 576,782 | | | | 341,504 | | | | 258,968 | | | | — | | | | — | |
| Issued in the Merger | | | — | | | | — | | | | — | | | | — | | | | — | |
Net increase (decrease) in net assets applicable to | | | | | | | | | | | | | | | | | | | | |
| common shares from capital share transactions | | | 193,342,336 | | | | 69,857,076 | | | | 258,968 | | | | 798,750,000 | | | | 851,250,000 | |
Net increase (decrease) in net assets applicable to | | | | | | | | | | | | | | | | | | | | |
| common shares | | | 128,349,373 | | | | 150,629,578 | | | | (120,535,336 | ) | | | 802,945,704 | | | | 846,690,107 | |
Net assets applicable to common shares at the | | | | | | | | | | | | | | | | | | | | |
| beginning of period | | | 969,068,427 | | | | 818,438,849 | | | | 803,045,709 | | | | 100,005 | | | | 100,005 | |
Net assets applicable to common shares at the end | | | | | | | | | | | | | | | | | | | | |
| of period | | $ | 1,097,417,800 | | | $ | 969,068,427 | | | $ | 682,510,373 | | | $ | 803,045,709 | | | $ | 846,790,112 | |
See accompanying notes to financial statements.
160
Year Ended October 31, 2020
| | | | | | | | | | | | | | | | |
| | NVG | | | NZF | | | NMZ | | | NMCO | | | NDMO* | |
| Cash Flows from Operating Activities: | | | | | | | | | | | | | | | |
| Net Increase (Decrease) in Net Assets Applicable to | | | | | | | | | | | | | | | |
| Common Shares from Operations | | $ | 90,414,573 | | | $ | 11,533,095 | | | $ | (7,521,970 | ) | | $ | (82,148,997 | ) | | $ | (218,008 | ) |
Adjustments to reconcile the net increase (decrease) in | | | | | | | | | | | | | | | | | | | | |
| net assets applicable to common shares from operations | | | | | | | | | | | | | | | | | | | | |
| to net cash provided by (used in) operating activities: | | | | | | | | | | | | | | | | | | | | |
Purchases of investments | | | (873,349,609 | ) | | | (748,232,607 | ) | | | (434,829,616 | ) | | | (1,214,878,901 | ) | | | (919,671,478 | ) |
Proceeds from sales and maturities of investments | | | 854,486,379 | | | | 749,365,978 | | | | 159,702,130 | | | | 726,832,297 | | | | 20,638,670 | |
Proceeds from (Purchases of) short-term investments, net | | | — | | | | — | | | | 17,885,000 | | | | 79,052,150 | | | | — | |
Payment-in-kind distributions | | | — | | | | (265,117 | ) | | | (37,031 | ) | | | (8,699 | ) | | | — | |
Taxes paid | | | (338,678 | ) | | | (114,404 | ) | | | (22,477 | ) | | | — | | | | — | |
Amortization (Accretion) of premiums and discounts, net | | | (12,667,563 | ) | | | (12,166,719 | ) | | | (51,741 | ) | | | (4,902,456 | ) | | | 382,722 | |
Amortization of deferred offering costs | | | 284,548 | | | | 267,352 | | | | 16,086 | | | | 77,035 | | | | — | |
(Increase) Decrease in: | | | | | | | | | | | | | | | | | | | | |
| Receivable for dividends and interest | | | 8,762,419 | | | | 3,577,465 | | | | (3,592,097 | ) | | | (11,407,569 | ) | | | (6,463,500 | ) |
| Receivable for investments sold | | | 16,790,298 | | | | 3,603,426 | | | | 10,196,061 | | | | (4,640,000 | ) | | | (26,330,436 | ) |
| Other assets | | | 53,928 | | | | (47,383 | ) | | | (13,873 | ) | | | (80,129 | ) | | | (840 | ) |
Increase (Decrease) in: | | | | | | | | | | | | | | | | | | | | |
| Payable for interest | | | (822,753 | ) | | | (140,472 | ) | | | (1,650,930 | ) | | | 7,168 | | | | 48,111 | |
| Payable for investments purchased – regular settlement | | | (327,497 | ) | | | (68,182 | ) | | | 1,965,755 | | | | (10,667,326 | ) | | | 11,030,676 | |
| Payable for investments purchased – when- | | | | | | | | | | | | | | | | | | | | |
| issued/delayed-delivery settlement | | | 12,151,641 | | | | 8,054,279 | | | | 6,515,670 | | | | 1,406,447 | | | | 53,100,098 | |
| Payable for offering costs | | | (26,001 | ) | | | — | | | | — | | | | — | | | | — | |
| Accrued management fees | | | 94,650 | | | | (58,840 | ) | | | 110,483 | | | | 260,185 | | | | 579,833 | |
| Accrued Trustees fees | | | 25,830 | | | | 3,742 | | | | (889 | ) | | | 4,115 | | | | 2,282 | |
| Accrued other expenses | | | (610,658 | ) | | | (4,912 | ) | | | 11,409 | | | | 75,737 | | | | 98,155 | |
Net realized (gain) loss from: | | | | | | | | | | | | | | | | | | | | |
| Investments | | | (20,352,040 | ) | | | 13,050,569 | | | | (1,845,773 | ) | | | 76,019,228 | | | | 449,948 | |
| Paydowns | | | (16,662 | ) | | | (232,152 | ) | | | 4,411,429 | | | | (9,990 | ) | | | — | |
Change in net unrealized (appreciation) depreciation | | | | | | | | | | | | | | | | | | | | |
| of investments | | | 104,484,643 | | | | 88,994,829 | | | | 64,189,142 | | | | 43,965,731 | | | | 1,293,659 | |
Net cash provided by (used in) operating activities | | | 179,037,448 | | | | 117,119,947 | | | | (184,563,232 | ) | | | (401,043,974 | ) | | | (865,060,108 | ) |
| Cash Flows from Financing Activities: | | | | | | | | | | | | | | | | | | | | |
Proceeds from borrowings | | | 129,400,000 | | | | 175,406,792 | | | | 23,200,000 | | | | — | | | | — | |
(Repayments of) borrowings | | | (129,400,000 | ) | | | (175,406,792 | ) | | | (23,200,000 | ) | | | — | | | | — | |
Proceeds from MFP Shares issued, at liquidation preference | | | — | | | | — | | | | — | | | | 450,000,000 | | | | — | |
Proceeds from shelf offering, net of offering costs | | | — | | | | — | | | | 192,529,557 | | | | — | | | | — | |
(Payments for) deferred offering costs | | | — | | | | — | | | | — | | | | (1,234,219 | ) | | | — | |
Increase (Decrease) in: | | | | | | | | | | | | | | | | | | | | |
| Cash overdraft | | | (7,772,606 | ) | | | (2,196,064 | ) | | | — | | | | — | | | | — | |
| Accrued shelf offering costs | | | — | | | | — | | | | 190,998 | | | | — | | | | — | |
Proceeds from floating rate obligations | | | 435,000 | | | | — | | | | 50,689,000 | | | | 52,648,000 | | | | 144,090,000 | |
(Repayments of) floating rate obligations | | | (715,000 | ) | | | (7,345,000 | ) | | | — | | | | (59,225,000 | ) | | | — | |
Proceeds from sale of shares | | | — | | | | — | | | | 3,972,476 | | | | — | | | | 851,350,005 | |
Cash distribution paid to common shareholders | | | (174,700,395 | ) | | | (107,578,883 | ) | | | (55,810,159 | ) | | | (35,195,264 | ) | | | (517,918 | ) |
Net cash provided by (used in) financing activities | | | (182,753,001 | ) | | | (117,119,947 | ) | | | 191,571,872 | | | | 406,993,517 | | | | 994,922,087 | |
| Net Increase (Decrease) in Cash | | | (3,715,553 | ) | | | — | | | | 7,008,640 | | | | 5,949,543 | | | | 129,861,979 | |
Cash at the beginning of period | | | — | | | | — | | | | 438,878 | | | | 11,531,093 | | | | — | |
Cash acquired in connection with the Merger | | | 5,179,140 | | | | — | | | | — | | | | — | | | | — | |
Cash at the end of period | | $ | 1,463,587 | | | $ | — | | | $ | 7,447,518 | | | $ | 17,480,636 | | | $ | 129,861,979 | |
Supplemental Disclosure of Cash Flow Information(1) | | | | | | | | | | | | | | | | | | | | |
Cash paid for interest on borrowings (excluding borrowing | | | | | | | | | | | | | | | | | | | | |
| and amortization of offering costs) | | $ | 22,788,023 | | | $ | 21,298,011 | | | $ | 8,581,561 | | | $ | 6,331,309 | | | $ | — | |
Non-cash financing activities not included herein consists | | | | | | | | | | | | | | | | | | | | |
| of reinvestments of common share distributions | | | — | | | | — | | | | 576,782 | | | | 258,968 | | | | — | |
* | For the period August 26, 2020 (commencement of operations) through October 31, 2020. |
(1) | See Notes to Financial Statements, Note 1 – General Information and Significant Accounting Policies, Fund Reorganizations for more information of the non-cash activities related to NVG’s Reorganization. |
See accompanying notes to financial statements.
161
Selected data for a common share outstanding throughout each period:
| | | | | | | | | | | | | | Less Distributions to | | | | | | | |
| | | | | Investment Operations | | | | | | Common Shareholders | | | Common Share | |
| | | | | | | | | | | | | | | | | From | | | | | | | | | | |
| | Beginning | | | Net | | | Net | | | | | | From | | | Accumulated | | | | | | | | | | |
| | Common | | | Investment | | | Realized/ | | | | | | Net | | | Net | | | | | | | | | Ending | |
| | Share | | | Income | | | Unrealized | | | | | | Investment | | | Realized | | | | | | Ending | | | Share | |
| | NAV | | | (Loss) | | | Gain (Loss) | | | Total | | | Income | | | Gains | | | Total | | | NAV | | | Price | |
| NVG | | | | | | | | | | | | | | | | | | | | | | | | | | | |
Year Ended 10/31: | | | | | | | | | | | | | | | | | | | | | | | | | | | |
2020 | | $ | 17.17 | | | $ | 0.82 | | | $ | (0.41 | ) | | $ | 0.41 | | | $ | (0.79 | ) | | $ | (0.03 | ) | | $ | (0.82 | ) | | $ | 16.76 | | | $ | 15.62 | |
2019 | | | 15.48 | | | | 0.79 | | | | 1.72 | | | | 2.51 | | | | (0.79 | ) | | | (0.03 | ) | | | (0.82 | ) | | | 17.17 | | | | 16.45 | |
2018 | | | 16.39 | | | | 0.81 | | | | (0.88 | ) | | | (0.07 | ) | | | (0.84 | ) | | | — | | | | (0.84 | ) | | | 15.48 | | | | 13.40 | |
2017 | | | 16.64 | | | | 0.84 | | | | (0.19 | ) | | | 0.65 | | | | (0.87 | ) | | | (0.03 | ) | | | (0.90 | ) | | | 16.39 | | | | 15.17 | |
2016 | | | 16.03 | | | | 0.73 | | | | 0.77 | | | | 1.50 | | | | (0.86 | ) | | | (0.03 | ) | | | (0.89 | ) | | | 16.64 | | | | 15.05 | |
| NZF | | | | | | | | | | | | | | | | | | | | | | | | | | | | | | | | | | | | |
Year Ended 10/31: | | | | | | | | | | | | | | | | | | | | | | | | | | | | | | | | | | | | |
2020 | | | 16.63 | | | | 0.80 | | | | (0.71 | ) | | | 0.09 | | | | (0.76 | ) | | | — | | | | (0.76 | ) | | | 15.96 | | | | 14.74 | |
2019 | | | 15.07 | | | | 0.75 | | | | 1.60 | | | | 2.35 | | | | (0.79 | ) | | | — | | | | (0.79 | ) | | | 16.63 | | | | 16.03 | |
2018 | | | 16.03 | | | | 0.81 | | | | (0.94 | ) | | | (0.13 | ) | | | (0.83 | ) | | | — | | | | (0.83 | ) | | | 15.07 | | | | 13.29 | |
2017 | | | 16.34 | | | | 0.87 | | | | (0.29 | ) | | | 0.58 | | | | (0.89 | ) | | | — | * | | | (0.89 | ) | | | 16.03 | | | | 15.01 | |
2016 | | | 15.75 | | | | 0.72 | | | | 0.74 | | | | 1.46 | | | | (0.87 | ) | | | — | | | | (0.87 | ) | | | 16.34 | | | | 14.82 | |
| | |
(a) | Total Return Based on Common Share NAV is the combination of changes in common share NAV, reinvested dividend income at NAV and reinvested capital gains distributions at |
| NAV, if any. The last dividend declared in the period, which is typically paid on the first business day of the following month, is assumed to be reinvested at the ending NAV. The |
| actual reinvest price for the last dividend declared in the period may often be based on the Fund’s market price (and not its NAV), and therefore may be different from the price |
| used in the calculation. Total returns are not annualized. |
| | |
| Total Return Based on Common Share Price is the combination of changes in the market price per share and the effect of reinvested dividend income and reinvested capital gains |
| distributions, if any, at the average price paid per share at the time of reinvestment. The last dividend declared in the period, which is typically paid on the first business day of the |
| following month, is assumed to be reinvested at the ending market price. The actual reinvestment for the last dividend declared in the period may take place over several days, and |
| in some instances may not be based on the market price, so the actual reinvestment price may be different from the price used in the calculation. Total returns are not annualized. |
162
| | | | | | | Common Share Supplemental Data/ | |
| | | | | | | Ratios Applicable to Common Shares | |
| Common Share | | | | | | Ratios to Average Net Assets | | | Ratio to Average Net Assets | | | | |
| Total Returns | | | | | | Before Reimbursement(b) | | | After Reimbursement(b) | | | | |
| | | | Based | | | Ending | | | | | | | | | | | | | | | | |
| Based | | | on | | | Net | | | | | | Net | | | | | | Net | | | Portfolio | |
| on | | | Share | | | Assets | | | | | | Investment | | | | | | Investment | | | Turnover | |
| NAV(a) | | | Price(a) | | | | (000 | ) | | Expenses | | | Income (Loss) | | | Expenses | | | Income (Loss) | | | Rate(c) | |
| | 2.53 | % | | | 0.06 | % | | $ | 3,576,356 | | | | 1.98 | % | | | 4.89 | % | | | N/A | | | | N/A | | | | 15 | % |
| | 16.52 | | | | 29.47 | | | | 3,476,962 | | | | 2.49 | | | | 4.82 | | | | N/A | | | | N/A | | | | 6 | |
| | (0.50 | ) | | | (6.49 | ) | | | 3,134,970 | | | | 2.40 | | | | 5.02 | | | | N/A | | | | N/A | | | | 15 | |
| | 4.25 | | | | 7.10 | | | | 3,319,775 | | | | 2.05 | | | | 5.26 | | | | 2.04 | %(d) | | | 5.27 | %(d) | | | 18 | |
| | 9.40 | | | | 13.46 | | | | 3,370,157 | | | | 1.81 | | | | 4.87 | | | | 1.75(d | ) | | | 4.93(d | ) | | | 21 | |
| | 0.58 | | | | (3.34 | ) | | | 2,267,965 | | | | 2.04 | | | | 4.95 | | | | N/A | | | | N/A | | | | 21 | |
| | 15.90 | | | | 27.08 | | | | 2,364,022 | | | | 2.60 | | | | 4.68 | | | | N/A | | | | N/A | | | | 12 | |
| | (0.85 | ) | | | (6.21 | ) | | | 2,141,680 | | | | 2.43 | | | | 5.17 | | | | N/A | | | | N/A | | | | 25 | |
| | 3.88 | | | | 7.61 | | | | 2,278,904 | | | | 2.12 | | | | 5.58 | | | | 2.11(d | ) | | | 5.59(d | ) | | | 21 | |
| | 9.36 | | | | 13.26 | | | | 2,321,756 | | | | 1.86 | | | | 5.03 | | | | 1.81(d | ) | | | 5.08(d | ) | | | 20 | |
(b) | • Net Investment Income (Loss) ratios reflect income earned and expenses incurred on assets attributable to preferred shares issued by the Fund. |
| • The expense ratios reflect, among other things, all interest expense and other costs related to preferred shares (as described in Note 5 – Fund Shares) and/or the interest |
| expense deemed to have been paid by the Fund on the floating rate certificates issued by the special purpose trusts for the self-deposited inverse floaters held by the |
| Fund (as described in Note 4 – Portfolio Securities and Investments in Derivatives), where applicable, as follows: |
| NVG | | | NZF | |
Year Ended 10/31: | | | Year Ended 10/31: | |
2020 | 0.97% | | 2020 | 1.01% |
2019 | 1.47 | | 2019 | 1.55 |
2018 | 1.37 | | 2018 | 1.38 |
2017 | 1.02 | | 2017 | 1.09 |
2016 | 0.78 | | 2016 | 0.84 |
(c) | Portfolio Turnover Rate is calculated based on the lesser of long-term purchases or sales (as disclosed in Note 4 – Portfolio Securities and Investments in Derivatives) |
| divided by the average long-term market value during the period. |
(d) | During the fiscal years ended October 31, 2017 and October 31, 2016, the Adviser voluntarily reimbursed the Fund for certain expenses incurred in connection with its |
| reorganization. |
N/A | Fund does not have or no longer has a contractual reimbursement with the Adviser. |
* | Rounds to less than $0.01 per share. |
See accompanying notes to financial statements.
163
Financial Highlights (continued)
Selected data for a common share outstanding throughout each period:
| | | | | | | | | | | | | | Less Distributions to | | | | | | | | | | | | | |
| | | | | Investment Operations | | | Common Shareholders | | | Common Share | |
| | | | | | | | | | | | | | | | | | | | | | | Premium | | | | | | | | | | |
| | | | | | | | | | | | | | | | | | | | | | | Per | | | | | | | | | | |
| | | | | | | | | | | | | | | | | From | | | | | | Share | | | | | | | | | | |
| | Beginning | | | Net | | | Net | | | | | | From
| | | Accumulated
| | | | | | Sold | | | | | | | | | | |
| | Common | | | Investment | | | Realized/ | | | | | | Net | | | Net | | | | | | through | | | Shelf | | | | | | Ending | |
| | Share | | | Income | | | Unrealized | | | | | | Investment | | | Realized | | | | | | Shelf | | | Offering | | | Ending | | | Share | |
| | NAV | | | (Loss)
| | | Gain (Loss)
| | | Total | | | Income | | | Gains | | | Total | | | Offering | | | Costs | | | NAV | | | Price | |
| NMZ | | | | | | | | | | | | | | | | | | | | | | | | | | | | | | | | | |
Year Ended 10/31: | | | | | | | | | | | | | | | | | | | | | | | | | | | | | | | | | |
2020 | | $ | 14.04 | | | $ | 0.70 | | | $ | (0.82 | ) | | $ | (0.12 | ) | | $ | (0.73 | ) | | $ | — | | | $ | (0.73 | ) | | $ | 0.03 | | | $ | — | * | | $ | 13.22 | | | $ | 13.22 | |
2019 | | | 12.77 | | | | 0.76 | | | | 1.20 | | | | 1.96 | | | | (0.70 | ) | | | — | | | | (0.70 | ) | | | 0.01 | | | | — | | | | 14.04 | | | | 14.22 | |
2018 | | | 13.47 | | | | 0.82 | | | | (0.78 | ) | | | 0.04 | | | | (0.74 | ) | | | — | | | | (0.74 | ) | | | — | * | | | — | | | | 12.77 | | | | 11.76 | |
2017 | | | 13.68 | | | | 0.80 | | | | (0.22 | ) | | | 0.58 | | | | (0.81 | ) | | | — | | | | (0.81 | ) | | | 0.02 | | | | — | | | | 13.47 | | | | 13.53 | |
2016 | | | 13.66 | | | | 0.86 | | | | 0.04 | | | | 0.90 | | | | (0.91 | ) | | | — | | | | (0.91 | ) | | | 0.03 | | | | — | | | | 13.68 | | | | 13.32 | |
| NMCO | | | | | | | | | | | | | | | | | | | | | | | | | | | | | | | | | | | | | | | | | | | | |
Year Ended 10/31: | | | | | | | | | | | | | | | | | | | | | | | | | | | | | | | | | | | | | | | | | | | | |
2020 | | | 15.08 | | | | 0.71 | | | | (2.25 | ) | | | (1.54 | ) | | | (0.73 | ) | | | — | | | | (0.73 | ) | | | — | | | | — | | | | 12.81 | | | | 11.68 | |
2019(d) | | | 15.00 | | | | 0.04 | | | | 0.04 | | | | 0.08 | | | | — | | | | — | | | | — | | | | — | | | | — | | | | 15.08 | | | | 15.39 | |
(a) | Total Return Based on Common Share NAV is the combination of changes in common share NAV, reinvested dividend income at NAV and reinvested capital gains distributions at |
| NAV, if any. The last dividend declared in the period, which is typically paid on the first business day of the following month, is assumed to be reinvested at the ending NAV. The |
| actual reinvest price for the last dividend declared in the period may often be based on the Fund’s market price (and not its NAV), and therefore may be different from the price |
| used in the calculation. Total returns are not annualized. |
| | |
| Total Return Based on Common Share Price is the combination of changes in the market price per share and the effect of reinvested dividend income and reinvested capital gains |
| distributions, if any, at the average price paid per share at the time of reinvestment. The last dividend declared in the period, which is typically paid on the first business day of the |
| following month, is assumed to be reinvested at the ending market price. The actual reinvestment for the last dividend declared in the period may take place over several days, and |
| in some instances may not be based on the market price, so the actual reinvestment price may be different from the price used in the calculation. Total returns are not annualized. |
164
| | | | | | | Common Share Supplemental Data/ | |
| | | | | | | Ratios Applicable to Common Shares | |
| Common Share | | | | | | | | | | | | | |
| Total Returns | | | | | | Ratios to Average Net Assets(b) | | | | |
| | | | Based | | | Ending | | | | | | | | | | |
| Based | | | on | | | Net | | | | | | Net | | | Portfolio | |
| on | | | Share | | | Assets | | | | | | Investment | | | Turnover | |
| NAV(a) | | | Price(a) | | | | (000 | ) | | Expenses | | | Income (Loss) | | | Rate(c) | |
| | (0.49 | )% | | | (1.84 | )% | | $ | 1,097,418 | | | | 1.68 | % | | | 5.19 | % | | | 10 | % |
| | 15.75 | | | | 27.45 | | | | 969,068 | | | | 2.20 | | | | 5.67 | | | | 15 | |
| | 0.25 | | | | (7.93 | ) | | | 818,439 | | | | 1.95 | | | | 6.17 | | | | 11 | |
| | 4.73 | | | | 8.04 | | | | 853,745 | | | | 1.54 | | | | 6.14 | | | | 10 | |
| | 6.91 | | | | 3.34 | | | | 788,577 | | | | 1.28 | | | | 6.27 | | | | 11 | |
| | (10.33 | ) | | | (19.78 | ) | | | 682,510 | | | | 2.41 | | | | 5.24 | | | | 70 | |
| | 0.53 | | | | 2.60 | | | | 803,046 | | | | 1.01 | ** | | | 2.58 | ** | | | 8 | |
| | |
(b) | • Net Investment Income (Loss) ratios reflect income earned and expenses incurred on assets attributable to preferred shares issued by the Fund. |
| • The expense ratios reflect, among other things, all interest expense and other costs related to preferred shares (as described in Note 5 – Fund Shares) and/or the interest |
| expense deemed to have been paid by the Fund on the floating rate certificates issued by the special purpose trusts for the self-deposited inverse floaters held by the |
| Fund (as described in Note 4 – Portfolio Securities and Investments in Derivatives), where applicable, as follows: |
| | | | | |
| NMZ | | | NMCO | |
Year Ended 10/31: | | | Year Ended 10/31: | |
2020 | 0.66% | | 2020 | 1.00% |
2019 | 1.16 | | 2019(d) | 0.05** |
2018 | 0.91 | | | |
2017 | 0.49 | | | |
2016 | 0.24 | | | |
(c) | Portfolio Turnover Rate is calculated based on the lesser of long-term purchases or sales (as disclosed in Note 4 – Portfolio Securities and Investments in Derivatives) divided |
| by the average long-term market value during the period. |
(d) | For the period September 16, 2019 (commencement of operations) through October 31, 2019. |
* | Rounds to less than $0.01 per share. |
** | Annualized. |
See accompanying notes to financial statements.
165
Financial Highlights (continued)
Selected data for a common share outstanding throughout each period:
| | | | | | Less Distributions to | | | |
| | Investment Operations | | Common Shareholders | | Common Share |
| | | | | | | From | | | | |
| Beginning | Net | Net | | | From | Accumulated | | | | |
| Common | Investment | Realized/ | | | Net | Net | | | | Ending |
| Share | Income | Unrealized | | | Investment | Realized | | | Ending | Share |
| NAV | (Loss) | Gain (Loss) | Total | | Income | Gains | Total | | NAV | Price |
| NDMO | | | | | | | | | | | |
Year Ended 10/31: | | | | | | | | | | | |
2020(d) | $15.00 | $0.03 | $(0.03) | $ — | | $(0.08) | $ — | $(0.08) | | $14.92 | $15.00 |
(a) | Total Return Based on Common Share NAV is the combination of changes in common share NAV, reinvested dividend income at NAV and reinvested capital gains distributions at |
| NAV, if any. The last dividend declared in the period, which is typically paid on the first business day of the following month, is assumed to be reinvested at the ending NAV. The |
| actual reinvest price for the last dividend declared in the period may often be based on the Fund’s market price (and not its NAV), and therefore may be different from the price |
| used in the calculation. Total returns are not annualized. |
| | |
| Total Return Based on Common Share Price is the combination of changes in the market price per share and the effect of reinvested dividend income and reinvested capital gains |
| distributions, if any, at the average price paid per share at the time of reinvestment. The last dividend declared in the period, which is typically paid on the first business day of the |
| following month, is assumed to be reinvested at the ending market price. The actual reinvestment for the last dividend declared in the period may take place over several days, and |
| in some instances may not be based on the market price, so the actual reinvestment price may be different from the price used in the calculation. Total returns are not annualized. |
166
| | | Common Share Supplemental Data/ | |
| | | Ratios Applicable to Common Shares | |
| Common Share | | | | |
| Total Returns | | Ratios to Average Net Assets | |
| | Based | Ending | | | |
| Based | on | Net | | Net | Portfolio |
| on | Share | Assets | | Investment | Turnover |
| NAV(a) | Price(a) | (000) | Expenses(b) | Income (Loss) | Rate(c) |
| (0.02)% | 0.51% | $846,790 | 0.89%* | 1.06%* | 4% |
(b) | • The expense ratios reflect, among other things, all interest expense deemed to have been paid by the Fund on the floating rate certificates issued by the special purpose |
| trusts for the self-deposited inverse floaters held by the Fund (as described in Note 4 – Portfolio Securities and Investments in Derivatives), where applicable, as follows: |
| NDMO | |
Year Ended 10/31: | |
2020(d) | 0.03%* |
(c) | Portfolio Turnover Rate is calculated based on the lesser of long-term purchases or sales (as disclosed in Note 4 – Portfolio Securities and Investments in Derivatives) divided |
| by the average long-term market value during the period. |
(d) | For the period August 26, 2020 (commencement of operations) through October 31, 2020. |
* | Annualized. |
See accompanying notes to financial statements.
167
Financial Highlights (continued)
| | | | | | | | | | | | |
| | | | | | | | | | | AMTP, iMTP, |
| | | | | | | | | | | MFP, VMTP |
| | | | | | | | | | | and /or |
| | | | | | | | | | | VRDP Shares |
| AMTP Shares | iMTP Shares | MFP Shares | VMTP Shares | VRDP Shares | at the End |
| at the End of Period | at the End of Period | at the End of Period | at the End of Period | at the End of Period | of the Period |
| | | | | | | | | | | Asset |
| Aggregate | Asset | Aggregate | Asset | Aggregate | Asset | Aggregate | Asset | Aggregate | Asset | Coverage |
| Amount | Coverage | Amount | Coverage | Amount | Coverage | Amount | Coverage | Amount | Coverage | Per $1 |
| Outstanding
| Per $100,000
| Outstanding | Per $5,000 | Outstanding
| Per $100,000
| Outstanding
| Per $100,000
| Outstanding
| Per $100,000
| Liquidation |
| (000) | Share | (000) | Share | (000) | Share(a) | (000) | Share | (000) | Share | Preference |
| NVG | | | | | | | | | | | |
Year Ended 10/31: | | | | | | | | | | |
2020 | $112,000 | $285,399 | $ — | $ — | $405,400 | $285,399 | $ — | $ — | $1,411,600 | $285,399 | $2.85 |
2019 | — | — | — | — | 405,400 | 291,357 | — | — | 1,411,600 | 291,357 | 2.91 |
2018 | — | — | — | — | 405,400 | 272,535 | — | — | 1,411,600 | 272,535 | 2.73 |
2017 | — | — | — | — | — | — | 240,400 | 300,955 | 1,411,600 | 300,955 | 3.01 |
2016 | — | — | — | — | — | — | 240,400 | 304,005 | 1,411,600 | 304,005 | 3.04 |
| NZF | | | | | | | | | | | |
Year Ended 10/31: | | | | | | | | | | |
2020 | — | — | — | — | 641,000 | 265,787 | — | — | 727,000 | 265,787 | 2.66 |
2019 | — | — | — | — | 641,000 | 272,809 | — | — | 727,000 | 272,809 | 2.73 |
2018 | — | — | — | — | 641,000 | 256,556 | — | — | 727,000 | 256,556 | 2.57 |
2017 | — | — | — | — | 150,000 | 287,873 | 336,000 | 287,873 | 727,000 | 287,873 | 2.88 |
2016 | — | — | 150,000 | 14,570 | — | — | 336,000 | 291,406 | 727,000 | 291,406 | 2.91 |
(a) | NVG’s Series B MFP Shares have a $1,000 liquidation preference per share, while all other MFP Shares have a $100,000 liquidation preference per share. The asset coverage per |
| $1,000 share for NVG’s Series B MFP Shares were as follows: |
| | |
| Asset |
| Coverage |
| Per $1,000 |
| NVG | Share |
| Series B | |
Year Ended 10/31: | |
2020 | $2,854 |
2019 | 2,914 |
2018 | — |
2017 | — |
2016 | — |
See accompanying notes to financial statements.
168
| AMTP Shares | MFP Shares | VMTP Shares
|
| at the End of Period | at the End of Period | at the End of Period |
| Aggregate | Asset | Aggregate | Asset | Aggregate | Asset |
| Amount | Coverage | Amount | Coverage | Amount | Coverage |
| Outstanding | Per $100,000 | Outstanding | Per $100,000 | Outstanding | Per $100,000 |
| (000) | Share | (000) | Share | (000) | Share |
| NMZ | | | | | | |
Year Ended 10/31: | | | | | |
2020 | $87,000 | $1,361,400 | $ — | $ — | $ — | $ — |
2019 | 87,000 | 1,213,872 | — | — | — | — |
2018 | 87,000 | 1,040,734 | — | — | — | — |
2017 | — | — | — | — | 87,000 | 1,081,317 |
2016 | — | — | — | — | 87,000 | 1,006,411 |
| NMCO | | | | | | |
Year Ended 10/31: | | | | | |
2020 | — | — | 450,000 | 251,669 | — | — |
2019(b) | — | — | — | — | — | — |
| | |
(b) | For the period September 16, 2019 (commencement of operations) through October 31, 2019. |
See accompanying notes to financial statements.
169
Notes toFinancial Statements 1. General Information
Fund Information
The funds covered in this report and their corresponding New York Stock Exchange (“NYSE”) symbols are as follows (each a “Fund” and collectively, the “Funds”):
| • | Nuveen AMT-Free Municipal Credit Income Fund (NVG) |
| • | Nuveen Municipal Credit Income Fund (NZF) |
| • | Nuveen Municipal High Income Opportunity Fund (NMZ) |
| • | Nuveen Municipal Credit Opportunities Fund (NMCO) |
| • | Nuveen Dynamic Municipal Opportunities Fund (NDMO) |
The Funds are registered under the Investment Company Act of 1940 (the “1940 Act”), as amended, as diversified closed-end management investment companies. NVG, NZF, NMZ, NMCO and NDMO were organized as Massachusetts business trusts on July 12, 1999, March 21, 2001, October 8, 2003, April 18, 2019 and November 4, 2019, respectively.
The end of the reporting period for the Funds is October 31, 2020. The period covered by these Notes to Financial Statements for NVG, NZF, NMZ, and NMCO is the fiscal year ended October 31, 2020, while the reporting period for NDMO is the period August 26, 2020 (commencement of operations) through October 31, 2020 (collectively the “current fiscal period”).
Investment Adviser and Sub-Adviser
The Funds’ investment adviser is Nuveen Fund Advisors, LLC (the “Adviser”), a subsidiary of Nuveen, LLC (“Nuveen”). Nuveen is the investment management arm of Teachers Insurance and Annuity Association of America (TIAA). The Adviser has overall responsibility for management of the Funds, oversees the management of the Funds’ portfolios, manages the Funds’ business affairs and provides certain clerical, bookkeeping and other administrative services, and, if necessary, asset allocation decisions. The Adviser has entered into sub-advisory agreements with Nuveen Asset Management, LLC (the “Sub-Adviser”), a subsidiary of the Adviser, under which the Sub-Adviser manages the investment portfolios of the Funds.
Fund Merger
Effective prior to the opening of business on November 18, 2019, Nuveen Connecticut Quality Municipal Income Fund (NTC) (the “Target Fund”) was merged into NVG (the “Acquiring Fund”) (the “Merger”).
For accounting and performance reporting purposes, the Acquiring Fund is the survivor.
Upon the closing of the Merger, the Target Fund transferred its assets to the Acquiring Fund in exchange for common and preferred shares of the Acquiring Fund and the assumption by the Acquiring Fund of the liabilities of the Target Fund. The Target Fund was then liquidated, dissolved and terminated in accordance with its Declaration of Trust. Shareholders of the Target Fund became shareholders of the Acquiring Fund. Holders of common shares of the Target Fund received newly issued common shares of the Acquiring Fund, the aggregate net asset value (“NAV”) of which was equal to the aggregate NAV of the common shares of the Target Fund held immediately prior to the Merger (including for this purpose fractional Acquiring Fund shares to which shareholders were entitled). Holders of preferred shares of the Target Fund receive on a one-for-one basis newly issued preferred shares of the Acquiring Fund, in exchange for preferred shares of the Target Fund held immediately prior to the Merger. Details of the Merger are further described in Note 9 – Fund Merger.
Other Matters
The outbreak of the novel coronavirus (“COVID-19”) and subsequent global pandemic began significantly impacting the U.S. and global financial markets and economies during the calendar quarter ended March 31, 2020. The worldwide spread of COVID-19 has created significant uncertainty in the global economy. The duration and extent of COVID-19 over the long-term cannot be reasonably estimated at this time. The ultimate impact of COVID-19 and the extent to which COVID-19 impacts the Funds’ normal course of business, results of operations, investments, and cash flows will depend on future developments, which are highly uncertain and difficult to predict. Management continues to monitor and evaluate this situation.
170
2. Significant Accounting Policies
The accompanying financial statements were prepared in accordance with accounting principles generally accepted in the United States of America (“U.S. GAAP”), which may require the use of estimates made by management and the evaluation of subsequent events. Actual results may differ from those estimates. Each Fund is an investment company and follows the accounting guidance in the Financial Accounting Standards Board (“FASB”) Accounting Standards Codification 946, Financial Services—Investment Companies. The NAV for financial reporting purposes may differ from the NAV for processing security and common share transactions. The NAV for financial reporting purposes includes security and common share transactions through the date of the report. Total return is computed based on the NAV used for processing security and common share transactions. The following is a summary of the significant accounting policies consistently followed by the Funds.
Compensation
The Funds pay no compensation directly to those of its trustees who are affiliated with the Adviser or to its officers, all of whom receive remuneration for their services to the Funds from the Adviser or its affiliates. The Funds’ Board of Trustees (the “Board”) has adopted a deferred compensation plan for independent trustees that enables trustees to elect to defer receipt of all or a portion of the annual compensation they are entitled to receive from certain Nuveen-advised funds. Under the plan, deferred amounts are treated as though equal dollar amounts had been invested in shares of select Nuveen-advised funds.
Distributions to Common Shareholders
Distributions to common shareholders are recorded on the ex-dividend date. The amount, character and timing of distributions are determined in accordance with federal income tax regulations, which may differ from U.S. GAAP.
Indemnifications
Under the Funds’ organizational documents, their officers and trustees are indemnified against certain liabilities arising out of the performance of their duties to the Funds. In addition, in the normal course of business, the Funds enter into contracts that provide general indemnifications to other parties. The Funds’ maximum exposure under these arrangements is unknown as this would involve future claims that may be made against the Funds that have not yet occurred. However, the Funds have not had prior claims or losses pursuant to these contracts and expect the risk of loss to be remote.
Investments and Investment Income
Securities transactions are accounted for as of the trade date for financial reporting purposes. Realized gains and losses on securities transactions are based upon the specific identification method. Investment income is comprised of interest income, which is recorded on an accrual basis and includes accretion of discounts and amortization of premiums for financial reporting purposes. Investment income also reflects payment-in-kind (“PIK”) interest and paydown gains and losses, if any. PIK interest represents income received in the form of securities in lieu of cash. Investment income also reflects dividend income, which is recorded on the ex-dividend date.
Netting Agreements
In the ordinary course of business, the Funds may enter into transactions subject to enforceable International Swaps and Derivative Association, Inc. (ISDA) master agreements or other similar arrangements (“netting agreements”). Generally, the right to offset in netting agreements allows each Fund to offset certain securities and derivatives with a specific counterparty, when applicable, as well as any collateral received or delivered to that counterparty based on the terms of the agreements. Generally, each Fund manages its cash collateral and securities collateral on a counterparty basis.
The Funds’ investments subject to netting agreements as of the end of the reporting period, if any, are further described in Note 4 – Portfolio Securities and Investments in Derivatives.
Organizational Expenses
Prior to the commencement of operations for NDMO on August 26, 2020, the Fund had no operations other than those related to organizational matters, the Fund’s initial contribution of $100,005, by the Adviser.
New Accounting Pronouncements and Rule Issuances
FASB Accounting Standards Update (“ASU”) 2017-08 (“ASU 2017-08”) Premium Amortization on Purchased Callable Debt Securities
The FASB has issued ASU 2017-08, which shortens the premium amortization period for purchased non-contingently callable debt securities. ASU 2017-08 specifies that the premium amortization period ends at the earliest call date, for purchased non-contingently callable debt securities. ASU 2017-08 is effective for fiscal years, and interim periods within those fiscal years, beginning after December 15, 2018. During the current fiscal period, ASU 2017-08 became effective for the Funds and it did not have a material impact on the Funds’ financial statements.
171
Notes to Financial Statements (continued)
Reference Rate Reform
In March 2020, FASB issued ASU 2020-04, Reference Rate Reform: Facilitation of the Effects of Reference Rate Reform on Financial Reporting. The main objective of the new guidance is to provide relief to companies that will be impacted by the expected change in benchmark interest rates at the end of 2021, when participating banks will no longer be required to submit London Interbank Offered Rate (LIBOR) quotes by the UK Financial Conduct Authority (FCA). The new guidance allows companies to, provided the only change to existing contracts are a change to an approved benchmark interest rate, account for modifications as a continuance of the existing contract without additional analysis. For new and existing contracts, the Funds may elect to apply the optional expedients as of March 12, 2020 through December 31, 2022. Management has not yet elected to apply the optional expedients, but is currently assessing the impact of the ASU’s adoption to the Funds’ financial statements and various filings.
3. Investment Valuation and Fair Value Measurements
The Funds’ investments in securities are recorded at their estimated fair value utilizing valuation methods approved by the Board. Fair value is defined as the price that would be received upon selling an investment or transferring a liability in an orderly transaction to an independent buyer in the principal or most advantageous market for the investment. U.S. GAAP establishes the three-tier hierarchy which is used to maximize the use of observable market data and minimize the use of unobservable inputs and to establish classification of fair value measurements for disclosure purposes. Observable inputs reflect the assumptions market participants would use in pricing the asset or liability. Observable inputs are based on market data obtained from sources independent of the reporting entity. Unobservable inputs reflect management’s assumptions about the assumptions market participants would use in pricing the asset or liability. Unobservable inputs are based on the best information available in the circumstances. The following is a summary of the three-tiered hierarchy of valuation input levels.
Level 1 – Inputs are unadjusted and prices are determined using quoted prices in active markets for identical securities.
Level 2 – Prices are determined using other significant observable inputs (including quoted prices for similar securities, interest rates, credit spreads, etc.).
Level 3 – Prices are determined using significant unobservable inputs (including management’s assumptions in determining the fair value of investments).
A description of the valuation techniques applied to the Funds’ major classifications of assets and liabilities measured at fair value follows:
Prices of fixed-income securities are generally provided by an independent pricing service (“pricing service”) approved by the Board. The pricing service establishes a security’s fair value using methods that may include consideration of the following: yields or prices of investments of comparable quality, type of issue, coupon, maturity and rating, market quotes or indications of value from security dealers, evaluations of anticipated cash flows or collateral, general market conditions and other information and analysis, including the obligor’s credit characteristics considered relevant. In pricing certain securities, particularly less liquid and lower quality securities, the pricing service may consider information about a security, its issuer or market activity, provided by the Adviser. These securities are generally classified as Level 2.
Investments in investment companies are valued at their respective NAVs on the valuation date and are generally classified as Level 1.
Equity securities and exchange-traded funds listed or traded on a national market or exchange are valued based on their sale price at the official close of business of such market or exchange on the valuation date. Foreign equity securities are valued at the last sale price or official closing price reported on the exchange where traded and converted to U.S. dollars at the prevailing rates of exchange on the date of valuation. To the extent these securities are actively traded and that valuation adjustments are not applied, they are generally classified as Level 1. If there is no official close of business, then the latest available sale price is utilized. If no sales are reported, then the mean of the latest available bid and ask prices is utilized and are generally classified as Level 2.
Any portfolio security or derivative for which market quotations are not readily available or for which the above valuation procedures are deemed not to reflect fair value are valued at fair value, as determined in good faith using procedures approved by the Board. As a general principle, the fair value of a security would appear to be the amount that the owner might reasonably expect to receive for it in a current sale. A variety of factors may be considered in determining the fair value of such securities, which may include consideration of the following: yields or prices of investments of comparable quality, type of issue, coupon, maturity and rating, market quotes or indications of value from security dealers, evaluations of anticipated cash flows or collateral, general market conditions and other information and analysis, including the obligor’s credit characteristics considered relevant. To the extent the inputs are observable and timely, the values would be classified as Level 2 of the fair value hierarchy; otherwise they would be classified as Level 3.
172
The following table summarizes the market value of the Funds’ investments as of the end of the reporting period, based on the inputs used to value them:
| NVG | | Level 1 | | | Level 2 | | | Level 3 | | | Total | |
Long-Term Investments: | | | | | | | | | | | | |
| Municipal Bonds* | | $ | — | | | $ | 5,628,351,128 | | | $ | — | | | $ | 5,628,351,128 | |
| Common Stock** | | | — | | | | 13,526,160 | **** | | | — | | | | 13,526,160 | |
Total | | $ | — | | | $ | 5,641,877,288 | | | $ | — | | | $ | 5,641,877,288 | |
| NZF | | | | | | | | | | | | | | | | |
Long-Term Investments: | | | | | | | | | | | | | | | | |
| Municipal Bonds* | | $ | — | | | $ | 3,583,358,481 | | | $ | 1,086,852 | *** | | $ | 3,584,445,333 | |
| Common Stock** | | | — | | | | 23,784,300 | **** | | | — | | | | 23,784,300 | |
| Investment Companies | | | 1,786,339 | | | | — | | | | — | | | | 1,786,339 | |
| Corporate Bonds** | | | — | | | | 545,456 | | | | 55 | *** | | | 545,511 | |
Total | | $ | 1,786,339 | | | $ | 3,607,688,237 | | | $ | 1,086,907 | | | $ | 3,610,561,483 | |
| NMZ | | | | | | | | | | | | | | | | |
Long-Term Investments: | | | | | | | | | | | | | | | | |
| Municipal Bonds* | | $ | — | | | $ | 1,571,907,787 | | | $ | 235,399 | *** | | $ | 1,572,143,186 | |
| Common Stock** | | | 2,566,358 | | | | 15,016,460 | **** | | | — | | | | 17,582,818 | |
| Corporate Bonds** | | | — | | | | 2,544,928 | | | | 204,122 | *** | | | 2,749,050 | |
Total | | $ | 2,566,358 | | | $ | 1,589,469,175 | | | $ | 439,521 | | | $ | 1,592,475,054 | |
| NMCO | | | | | | | | | | | | | | | | |
Long-Term Investments: | | | | | | | | | | | | | | | | |
| Municipal Bonds* | | $ | — | | | $ | 1,085,529,604 | | | $ | — | | | $ | 1,085,529,604 | |
| Common Stock** | | | — | | | | 17,182,260 | **** | | | — | | | | 17,182,260 | |
| Exchange-Traded Funds | | | 1,902,400 | | | | — | | | | — | | | | 1,902,400 | |
Short-Term Investments: | | | | | | | | | | | | | | | | |
| Municipal Bonds* | | | — | | | | 15,267,850 | | | | — | | | | 15,267,850 | |
Total | | $ | 1,902,400 | | | $ | 1,117,979,714 | | | $ | — | | | $ | 1,119,882,114 | |
| NDMO | | | | | | | | | | | | | | | | |
Long-Term Investments: | | | | | | | | | | | | | | | | |
| Municipal Bonds* | | $ | — | | | $ | 896,268,229 | | | $ | — | | | $ | 896,268,229 | |
| Corporate Bonds** | | | — | | | | 638,250 | | | | — | | | | 638,250 | |
Total | | $ | — | | | $ | 896,906,479 | | | $ | — | | | $ | 896,906,479 | |
* | Refer to the Fund’s Portfolio of Investments for state classifications. |
** | Refer to the Fund’s Portfolio of Investments for industry classifications. |
*** | Refer to the Fund’s Portfolio of Investments for securities classified as Level 3. |
**** | Refer to the Fund’s Portfolio of Investments for securities classified as Level 2. |
4. Portfolio Securities and Investments in Derivatives
Portfolio Securities
Inverse Floating Rate Securities
Each Fund is authorized to invest in inverse floating rate securities. An inverse floating rate security is created by depositing a municipal bond (referred to as an “Underlying Bond”), typically with a fixed interest rate, into a special purpose tender option bond (“TOB”) trust (referred to as the “TOB Trust”) created by or at the direction of one or more Funds. In turn, the TOB Trust issues (a) floating rate certificates (referred to as “Floaters”) in face amounts equal to some fraction of the Underlying Bond’s par amount or market value, and (b) an inverse floating rate certificate (referred to as an “Inverse Floater”) that represents all remaining or residual interest in the TOB Trust. Floaters typically pay short-term tax-exempt interest rates to third parties who are also provided a right to tender their certificate and receive its par value, which may be paid from the proceeds of a remarketing of the Floaters, by a loan to the TOB Trust from a third party liquidity provider (“Liquidity Provider”), or by the sale of assets from the TOB Trust. The Inverse Floater is issued to a long term investor, such as one or more of the Funds. The income received by the Inverse Floater holder varies inversely with the short-term rate paid to holders of the Floaters, and in most circumstances the Inverse Floater holder bears substantially all of the Underlying Bond’s downside investment risk and also benefits disproportionately from any potential appreciation of the Underlying Bond’s value. The value of an Inverse Floater will be more volatile than that of the Underlying Bond because the interest rate is dependent on not only the fixed coupon rate of the Underlying Bond but also on the short-term interest paid on the Floaters, and because the Inverse Floater essentially bears the risk of loss (and possible gain) of the greater face value of the Underlying Bond.
173
Notes to Financial Statements (continued)
The Inverse Floater held by a Fund gives the Fund the right to (a) cause the holders of the Floaters to tender their certificates at par (or slightly more than par in certain circumstances), and (b) have the trustee of the TOB Trust (the “Trustee”) transfer the Underlying Bond held by the TOB Trust to the Fund, thereby collapsing the TOB Trust.
The Fund may acquire an Inverse Floater in a transaction where it (a) transfers an Underlying Bond that it owns to a TOB Trust created by a third party or (b) transfers an Underlying Bond that it owns, or that it has purchased in a secondary market transaction for the purpose of creating an Inverse Floater, to a TOB Trust created at its direction, and in return receives the Inverse Floater of the TOB Trust (referred to as a “self-deposited Inverse Floater”). A Fund may also purchase an Inverse Floater in a secondary market transaction from a third party creator of the TOB Trust without first owning the Underlying Bond (referred to as an “externally-deposited Inverse Floater”).
An investment in a self-deposited Inverse Floater is accounted for as a “financing” transaction (i.e., a secured borrowing). For a self-deposited Inverse Floater, the Underlying Bond deposited into the TOB Trust is identified in the Fund’s Portfolio of Investments as “(UB) – Underlying bond of an inverse floating rate trust reflected as a financing transaction,” with the Fund recognizing as liabilities, labeled “Floating rate obligations” on the Statement of Assets and Liabilities, (a) the liquidation value of Floaters issued by the TOB Trust, and (b) the amount of any borrowings by the TOB Trust from a Liquidity Provider to enable the TOB Trust to purchase outstanding Floaters in lieu of a remarketing. In addition, the Fund recognizes in “Investment Income” the entire earnings of the Underlying Bond, and recognizes (a) the interest paid to the holders of the Floaters or on the TOB Trust’s borrowings, and (b) other expenses related to remarketing, administration, trustee, liquidity and other services to a TOB Trust, as a component of “Interest expense and amortization of offering costs” on the Statement of Operations. Earnings due from the Underlying Bond and interest due to the holders of the Floaters as of the end of the reporting period are recognized as components of “Receivable for interest” and “Payable for interest” on the Statement of Assets and Liabilities, respectively.
In contrast, an investment in an externally-deposited Inverse Floater is accounted for as a purchase of the Inverse Floater and is identified in the Fund’s Portfolio of Investments as “(IF) – Inverse floating rate investment.” For an externally-deposited Inverse Floater, a Fund’s Statement of Assets and Liabilities recognizes the Inverse Floater and not the Underlying Bond as an asset, and the Fund does not recognize the Floaters, or any related borrowings from a Liquidity Provider, as a liability. Additionally, the Fund reflects in “Investment Income” only the net amount of earnings on the Inverse Floater (net of the interest paid to the holders of the Floaters or the Liquidity Provider as lender, and the expenses of the Trust), and does not show the amount of that interest paid or the expenses of the TOB Trust as described above as interest expense on the Statement of Operations.
Fees paid upon the creation of a TOB Trust for self-deposited Inverse Floaters and externally-deposited Inverse Floaters are recognized as part of the cost basis of the Inverse Floater and are capitalized over the term of the TOB Trust.
As of the end of the reporting period, the aggregate value of Floaters issued by each Fund’s TOB Trust for self-deposited Inverse Floaters and externally-deposited Inverse Floaters was as follows:
| Floating Rate Obligations Outstanding | | NVG | | | NZF | | | NMZ | | | NMCO | | | NDMO | |
Floating rate obligations: self-deposited Inverse Floaters | | $ | 191,075,000 | | | $ | 16,275,000 | | | $ | 434,051,000 | | | $ | 21,923,000 | | | $ | 144,090,000 | |
Floating rate obligations: externally-deposited Inverse Floaters | | | 71,775,000 | | | | 11,095,000 | | | | 76,510,000 | | | | — | | | | — | |
Total | | $ | 262,850,000 | | | $ | 27,370,000 | | | $ | 510,561,000 | | | $ | 21,923,000 | | | $ | 144,090,000 | |
During the current fiscal period, the average amount of Floaters (including any borrowings from a Liquidity Provider) outstanding, and the average annual interest rate and fees related to self-deposited Inverse Floaters, were as follows:
| Self-Deposited Inverse Floaters | | NVG | | | NZF | | | NMZ | | | NMCO | | | NDMO | |
Average floating rate obligations outstanding | | $ | 191,403,470 | | | $ | 16,897,117 | | | $ | 415,544,743 | | | $ | 24,500,046 | | | $ | 6,441,995 | |
Average annual interest rate and fees | | | 1.29 | % | | | 1.37 | % | | | 1.33 | % | | | 1.74 | % | | | 0.75 | % |
TOB Trusts are supported by a liquidity facility provided by a Liquidity Provider pursuant to which the Liquidity Provider agrees, in the event that Floaters are (a) tendered to the Trustee for remarketing and the remarketing does not occur, or (b) subject to mandatory tender pursuant to the terms of the TOB Trust agreement, to either purchase Floaters or to provide the Trustee with an advance from a loan facility to fund the purchase of Floaters by the TOB Trust. In certain circumstances, the Liquidity Provider may otherwise elect to have the Trustee sell the Underlying Bond to retire the Floaters that were tendered and not remarketed prior to providing such a loan. In these circumstances, the Liquidity Provider remains obligated to provide a loan to the extent that the proceeds of the sale of the Underlying Bond is not sufficient to pay the purchase price of the Floaters.
The size of the commitment under the loan facility for a given TOB Trust is at least equal to the balance of that TOB Trust’s outstanding Floaters plus any accrued interest. In consideration of the loan facility, fee schedules are in place and are charged by the Liquidity Provider(s). Any loans made by the Liquidity Provider will be secured by the purchased Floaters held by the TOB Trust. Interest paid on any outstanding loan balances will be effectively borne by the Fund that owns the Inverse Floaters of the TOB Trust that has incurred the borrowing and may be at a rate that is greater than the rate that would have been paid had the Floaters been successfully remarketed.
174
As described above, any amounts outstanding under a liquidity facility are recognized as a component of “Floating rate obligations” on the Statement of Assets and Liabilities by the Fund holding the corresponding Inverse Floaters issued by the borrowing TOB Trust. As of the end of the reporting there were no loans outstanding under any such facility.
Each Fund may also enter into shortfall and forbearance agreements (sometimes referred to as a “recourse arrangement”) (TOB Trusts involving such agreements are referred to herein as “Recourse Trusts”), under which a Fund agrees to reimburse the Liquidity Provider for the Trust’s Floaters, in certain circumstances, for the amount (if any) by which the liquidation value of the Underlying Bond held by the TOB Trust may fall short of the sum of the liquidation value of the Floaters issued by the TOB Trust plus any amounts borrowed by the TOB Trust from the Liquidity Provider, plus any shortfalls in interest cash flows. Under these agreements, a Fund’s potential exposure to losses related to or on an Inverse Floater may increase beyond the value of the Inverse Floater as a Fund may potentially be liable to fulfill all amounts owed to holders of the Floaters or the Liquidity Provider. Any such shortfall amount in the aggregate is recognized as “Unrealized depreciation on Recourse Trusts” on the Statement of Assets and Liabilities.
As of the end of the reporting period, each Fund’s maximum exposure to the Floaters issued by Recourse Trusts for self-deposited Inverse Floaters and externally-deposited Inverse Floaters was as follows:
| Floating Rate Obligations – Recourse Trusts | | NVG | | | NZF | | | NMZ | | | NMCO | | | NDMO | |
Maximum exposure to Recourse Trusts: self-deposited Inverse Floaters | | $ | 183,330,000.00 | | | $ | 8,775,000 | | | $ | 409,271,000 | | | $ | 21,923,000 | | | $ | 144,090,000 | |
Maximum exposure to Recourse Trusts: externally-deposited Inverse Floaters | | | 59,420,000 | | | | 9,420,000 | | | | 76,510,000 | | | | — | | | | — | |
Total | | $ | 242,750,000 | | | $ | 18,195,000 | | | $ | 485,781,000 | | | $ | 21,923,000 | | | $ | 144,090,000 | |
Zero Coupon Securities
A zero coupon security does not pay a regular interest coupon to its holders during the life of the security. Income to the holder of the security comes from accretion of the difference between the original purchase price of the security at issuance and the par value of the security at maturity and is effectively paid at maturity. The market prices of zero coupon securities generally are more volatile than the market prices of securities that pay interest periodically.
Investment Transactions
Long-term purchases and sales (including maturities) during the current fiscal period were as follows:
| | NVG | | | NZF | | | NMZ | | | NMCO | | | NDMO | |
Purchases | | $ | 873,349,609 | | | $ | 748,232,607 | | | $ | 434,829,616 | | | $ | 1,214,878,901 | | | $ | 919,671,478 | |
Sales and maturities | | | 854,486,379 | | | | 749,365,978 | | | | 159,702,130 | | | | 726,832,297 | | | | 20,638,670 | |
The Funds may purchase securities on a when-issued or delayed-delivery basis. Securities purchased on a when-issued or delayed-delivery basis may have extended settlement periods; interest income is not accrued until settlement date. Any securities so purchased are subject to market fluctuation during this period. The Funds have earmarked securities in their portfolios with a current value at least equal to the amount of the when-issued/delayed delivery purchase commitments. If a Fund has outstanding when-issued/delayed-delivery purchases commitments as of the end of the reporting period, such amounts are recognized on the Statement of Assets and Liabilities.
Investments in Derivatives
In addition to the inverse floating rate securities in which each Fund may invest, which are considered portfolio securities for financial reporting purposes, each Fund is authorized to invest in certain other derivative instruments such as futures, options and swap contracts. Each Fund limits its investments in futures, options on futures and swap contracts to the extent necessary for the Adviser to claim the exclusion from registration by the Commodity Futures Trading Commission as a commodity pool operator with respect to the Fund. The Funds record derivative instruments at fair value, with changes in fair value recognized on the Statement of Operations, when applicable. Even though the Funds’ investments in derivatives may represent economic hedges, they are not considered to be hedge transactions for financial reporting purposes.
Although the Funds are authorized to invest in derivative instruments, and may do so in the future, they did not make any such investments during the current fiscal period.
Market and Counterparty Credit Risk
In the normal course of business each Fund may invest in financial instruments and enter into financial transactions where risk of potential loss exists due to changes in the market (market risk) or failure of the other party to the transaction to perform (counterparty credit risk). The potential loss could exceed the value of the financial assets recorded on the financial statements. Financial assets, which potentially expose each Fund to counterparty credit risk, consist principally of cash due from counterparties on forward, option and swap transactions, when applicable. The extent of each Fund’s exposure to counterparty credit risk in respect to these financial assets approximates their carrying value as recorded on the Statement of Assets and Liabilities.
175
Notes to Financial Statements (continued)
Each Fund helps manage counterparty credit risk by entering into agreements only with counterparties the Adviser believes have the financial resources to honor their obligations and by having the Adviser monitor the financial stability of the counterparties. Additionally, counterparties may be required to pledge collateral daily (based on the daily valuation of the financial asset) on behalf of each Fund with a value approximately equal to the amount of any unrealized gain above a pre-determined threshold. Reciprocally, when each Fund has an unrealized loss, the Funds have instructed the custodian to pledge assets of the Funds as collateral with a value approximately equal to the amount of the unrealized loss above a pre-determined threshold. Collateral pledges are monitored and subsequently adjusted if and when the valuations fluctuate, either up or down, by at least the pre-determined threshold amount.
5. Fund Shares
Common Shares
Common Shares Equity Shelf Programs and Offering Costs
NMZ has filed a registration statement with the Securities and Exchange Commission (“SEC”) authorizing the Fund to issue additional common shares through one or more equity shelf programs (“Shelf Offering”), which became effective with the SEC during a prior fiscal period.
Under this Shelf Offering, the Fund, subject to market conditions, may raise additional equity capital by issuing additional common shares from time to time in varying amounts and by different offering methods at a net price at or above the Fund’s NAV per common share. In the event the Fund’s Shelf Offering registration statement is no longer current, the Fund may not issue additional common shares until a post-effective amendment to the registration statement has been filed with the SEC.
Additional authorized common shares, common shares sold and offering proceeds, net of offering costs under the Fund’s Shelf Offering during the Fund’s current and prior fiscal period were as follows:
| |
| Year | Year |
| Ended | Ended |
| 10/31/20 | 10/31/19 |
Additional authorized common shares | 19,500,000 | 15,700,000* |
Common shares sold | 13,935,297 | 4,928,383 |
Offering proceeds, net of offering costs | $192,765,554 | $69,515,572 |
* Represents additional authorized common shares for the period April 11, 2019 through October 31, 2019.
Costs incurred by the Fund in connection with its initial shelf registration are recorded as a prepaid expense and recognized as “Deferred offering costs” on the Statement of Assets and Liabilities. These costs are amortized pro rata as common shares are sold and are recognized as a component of “Proceeds from shelf offering, net of offering costs” on the Statement of Changes in Net Assets. Any deferred offering costs remaining one year after effectiveness of the initial shelf registration will be expensed. Costs incurred by the Funds to keep the shelf registration current are expensed as incurred and recognized as a component of “Other expenses” on the Statement of Operations.
Common Share Transactions
Transactions in common shares for the Funds during the Funds’ current and prior fiscal period, where applicable, were as follows:
| NVG
|
| Year | Year |
| Ended | Ended |
| 10/31/20 | 10/31/19 |
Common shares: | | |
| Issued in the Merger | 10,817,649 | — |
| NMZ
|
| Year | Year |
| Ended | Ended |
| 10/31/20 | 10/31/19 |
Common shares: | | |
| Issued to shareholders due to reinvestment of distributions | 42,176 | 24,585 |
| Sold through shelf offering | 13,935,297 | 4,928,383 |
Weighted average common share: | | |
| Premium to NAV per shelf offering share sold | 1.38% | 1.26% |
176
| NMCO* | NDMO* |
| | For the | For the |
| | period 9/16/19 | period 8/26/20 |
| | (commencement | (commencement
|
| Year | of operations) | of operations) |
| Ended | through | through |
| 10/31/20 | 10/31/19 | 10/31/20 |
Common shares: | | | |
| Issued to shareholders due to reinvestment of distributions | 19,413 | — | — |
| Sold | — | 53,250,000 | 56,750,000 |
* Prior to the commencement of operations, the Adviser purchased 6,667 shares, which are still held as of the end of the reporting period.
Preferred Shares
Adjustable Rate MuniFund Term Preferred Shares
The following Funds have issued and have outstanding Adjustable Rate MuniFund Term Preferred (“AMTP”) Shares, with a $100,000 liquidation preference per share. AMTP Shares are issued via private placement and are not publicly available.
The details of each Fund’s AMTP Shares outstanding as of the end of the reporting period, were as follows:
| | | | Liquidation |
| | | | Preference, |
| | Shares | Liquidation | Net of Deferred |
| Fund | Series | Outstanding | Preference | Offering Costs |
| NVG | 2028* | 1,120 | $112,000,000 | $111,913,155 |
| NMZ | 2028 | 870 | $87,000,000 | $86,882,357 |
* AMTP Shares issued in connection with the Merger.
Each Fund is obligated to redeem its AMTP Shares by the date as specified in its offering document (“Term Redemption Date”), unless earlier redeemed by the Fund. AMTP Shares are subject to optional and mandatory redemption in certain circumstances. The AMTP Shares may be redeemed at the option of the Fund, subject to payment of premium for approximately six months following the date of issuance (“Premium Expiration Date”), and at the redemption price per share thereafter. The redemption price per share is equal to the sum of the liquidation preference per share plus any accumulated but unpaid dividends.
AMTP Shares are short-term or short/intermediate-term instruments that pay a variable dividend rate tied to a short-term index, plus an additional fixed “spread” amount which is initially established at the time of issuance and may be adjusted in the future based upon a mutual agreement between the majority owner and the Fund. From time-to-time the majority owner may propose to the Fund an adjustment to the dividend rate. Should the majority owner and the Fund fail to agree upon an adjusted dividend rate, and such proposed dividend rate adjustment is not withdrawn, the Fund will be required to redeem all outstanding shares upon the end of a notice period.
In addition, the Funds may be obligated to redeem a certain amount of the AMTP Shares if the Funds fails to maintain certain asset coverage and leverage ratio requirements and such failures are not cured by the applicable cure date. The Term Redemption Date and Premium Expiration Date for each Fund’s AMTP Shares are as follows:
| Notice | | Term | Premium |
| Fund | Period | Series | Redemption Date | Expiration Date |
| NVG | 540-day | 2028 | December 1, 2028** | February 13, 2019 |
| NMZ | 360-day | 2028 | March 1, 2028** | August 31, 2018 |
** Subject to early termination by either the Fund or the holder.
The average liquidation preference of AMTP Shares outstanding and annualized dividend rate for each Fund during the current fiscal period were as follows:
| NVG*** | NMZ |
Average liquidation preference of AMTP Shares outstanding | $112,000,000 | $87,000,000 |
Annualized dividend rate | 1.55% | 1.59% |
*** For the period November 18, 2019 (Merger date) through October 31, 2020.
177
Notes to Financial Statements (continued)
AMTP Shares are subject to restrictions on transfer, generally do not trade, and market quotations are generally not available. The fair value of AMTP Shares is expected to be approximately their liquidation preference so long as the fixed “spread” on the AMTP Shares remains roughly in line with the “spread” being demanded by investors on instruments having similar terms in the current market environment. In present market conditions, the Funds’ Adviser has determined that the fair value of AMTP Shares is approximately their liquidation preference, but their fair value could vary if market conditions change materially. For financial reporting purposes, the liquidation preference of AMTP Shares is a liability and is recognized as a component of “Adjustable Rate MuniFund Term Preferred (“AMTP”) Shares, net of deferred offering costs” on the Statement of Assets and Liabilities.
AMTP Share dividends are treated as interest payments for financial reporting purposes. Unpaid dividends on AMTP Shares are recognized as a component of “Interest payable” on the Statement of Assets and Liabilities. Dividends accrued on AMTP Shares are recognized as a component of “Interest expense and amortization of offering costs” on the Statement of Operations.
Costs incurred in connection with each Fund’s offering of AMTP Shares were recorded as deferred charges, which are amortized over the life of the shares and are recognized as components of “Adjustable Rate MuniFund Term Preferred (“AMTP”) Shares, net of deferred offering costs” on the Statement of Assets and Liabilities and “Interest expense and amortization of offering costs” on the Statement of Operations.
MuniFund Preferred Shares
The following Funds have issued and have outstanding MuniFund Preferred (“MFP”) Shares, with a $100,000 ($1,000 for NVG’s Series B) liquidation preference per share. These MFP Shares were issued via private placement and are not publically available.
The Funds are obligated to redeem their MFP Shares by the date as specified in its offering documents (“Term Redemption Date”), unless earlier redeemed by the Funds. MFP Shares are initially issued in a pre-specified mode, however, MFP Shares can be subsequently designated as an alternative mode at a later date at the discretion of the Funds. The modes within MFP Shares detail the dividend mechanics and are described as follows. At a subsequent date, the Fund may establish additional mode structures with the MFP Share.
| • | Variable Rate Remarketed Mode (“VRRM”) – Dividends for MFP Shares within this mode will be established by a remarketing agent; therefore, the market value of the MFP Shares is expected to approximate its liquidation preference. Shareholders have the ability to request a best-efforts tender of their shares upon seven days notice. If the remarketing agent is unable to identify an alternative purchaser, the shares will be retained by the shareholder requesting tender and the subsequent dividend rate will increase to its step-up dividend rate. If after one consecutive year of unsuccess- ful remarketing attempts, the Fund will be required to designate an alternative mode or redeem the shares.
Each Fund will pay a remarketing fee on the aggregate principal amount of all MFP Shares while designated in VRRM. Payments made by the Fund to the remarketing agent are recognized as “Remarketing fees” on the Statement of Operations. |
| • | Variable Rate Mode (“VRM”) – Dividends for MFP Shares designated in this mode are based upon a short-term index plus an additional fixed “spread” amount established at the time of issuance or renewal / conversion of its mode. At the end of the period of the mode, the Fund will be required to either extend the term of the mode, designate an alternative mode or redeem the MFP Shares.
The fair value of MFP Shares while in VRM are expected to approximate their liquidation preference so long as the fixed “spread” on the shares remains roughly in line with the “spread” being demanded by investors on instruments having similar terms in the current market. In current market conditions, the Adviser has determined that the fair value of the shares are approximately their liquidation preference, but their fair value could vary if market conditions change materially. |
| • | Variable Rate Demand Mode (“VRDM”) – Dividends for MFP Shares designated in this mode will be established by a remarketing agent; therefore, the market value of the MFP Shares is expected to approximate its liquidation preference. While in this mode, shares will have an unconditional liquidity feature that enables its shareholders to require a liquidity provider, with which the Fund has entered into a contractual agreement, to purchase shares in the event that the shares are not able to be successfully remarketed. In the event that shares within this mode are unable to be successfully remarketed and are purchased by the liquidity provider, the dividend rate will be the maximum rate which is designed to escalate according to a specified schedule in order to enhance the remarketing agent’s ability to successfully remarket the shares. Each Fund is required to redeem any shares that are still owned by a liquidity provider after six months of continuous, unsuccessful remarketing. |
The Fund will pay a liquidity and remarketing fee on the aggregate principal amount of all MFP shares while within VRDM. Payments made by the Fund to the liquidity provider and remarketing agent are recognized as “Liquidity fees” and “Remarketing fees”, respectively, on the Statement of Operations.
For financial reporting purposes, the liquidation preference of MFP Shares is recorded as a liability and is recognized as a component of “MuniFund Preferred (“MFP”) Shares, net of deferred offering costs” on the Statement of Assets and Liabilities. Dividends on the MFP shares are treated as interest payments for financial reporting purposes. Unpaid dividends on MFP shares are recognized as a component on “Interest payable” on the Statement of Assets and Liabilities. Dividends accrued on MFP Shares are recognized as a component of “Interest expense and amortization of offering costs” on the Statement of Operations.
178
Subject to certain conditions, MFP Shares may be redeemed, in whole or in part, at any time at the option of the Fund. The Fund may also be required to redeem certain MFP shares if the Fund fails to maintain certain asset coverage requirements and such failures are not cured by the applicable cure date. The redemption price per share in all circumstances is equal to the liquidation preference per share plus any accumulated but unpaid dividends.
NMCO incurred offering costs of $1,234,219 in connection with its offering of MFP Shares, which were recorded as a deferred charge and are being amortized over the life of the shares. These offering costs are recognized as a component of “MuniFund Preferred (“MFP”) Shares, net of deferred offering costs” on the Statement of Assets and Liabilities and “Interest expense and amortization of offering costs” on the Statement of Operations.
As of the end of the reporting period, NVG, NZF and NMCO had $403,997,740, $640,010,468 and $448,842,816 of MFP Shares at liquidation preference, net of deferred offering costs, respectively. Further details of each Fund’s MFP Shares outstanding as of the end of the reporting period, were as follows:
| | | | | | Mode |
| | Shares | Liquidation | Term | | Termination |
| Fund | Series | Outstanding | Preference | Redemption Date | Mode | Date |
| NVG | A | 2,054 | $205,400,000 | January 3, 2028 | VRM | January 3, 2028* |
| B | 200,000 | 200,000,000 | March 1, 2029 | VRRM | N/A |
| NZF | A | 1,500 | $150,000,000 | May 1, 2047 | VRM | May 5, 2021 |
| B | 1,550 | 155,000,000 | February 3, 2048 | VRM | February 3, 2048* |
| C | 3,360 | 336,000,000 | June 1, 2048 | VRM | June 21, 2023 |
| NMCO | A | 1,000 | $100,000,000 | October 1, 2031 | VRDM | N/A |
| B | 2,250 | 225,000,000 | October 1, 2031 | VRM | December 28, 2022 |
| C | 1,250 | 125,000,000 | October 1, 2031 | VRM | December 16, 2022 |
* Subject to earlier termination by either the Fund or the holder.
The average liquidation preference of MFP Shares outstanding and annualized dividend rate for the Funds during the current fiscal period were as follows:
| NVG | NZF | NMCO** |
Average liquidation preference of MFP Shares outstanding | $405,400,000 | $641,000,000 | $391,835,260 |
Annualized dividend rate | 1.38% | 1.69% | 1.59% |
** For the period November 21, 2019 (first issuance of shares) through October 31, 2020.
Variable Rate Demand Preferred Shares
The following Funds have issued and have outstanding Variable Rate Demand Preferred (“VRDP”) Shares, with a $100,000 liquidation preference per share. VRDP Shares are issued via private placement and are not publicly available.
As of the end of the reporting period, NVG and NZF had $1,408,052,524 and $722,526,702 of VRDP Shares at liquidation preference, net of deferred offering costs, respectively. Further details of the Funds’ VRDP Shares outstanding as of the end of the reporting period, were as follows:
| | Shares | Remarketing | Liquidation | |
| Fund | Series | Outstanding | Fees* | Preference | Maturity |
| NVG | 1 | 1,790 | 0.10% | $179,000,000 | December 1, 2043 |
| 2 | 3,854 | 0.10 | $385,400,000 | December 1, 2040 |
| 4 | 1,800 | 0.10 | $180,000,000 | June 1, 2046 |
| 5 | 3,405 | 0.10 | $340,500,000 | December 1, 2040 |
| 6 | 3,267 | 0.10 | $326,700,000 | December 1, 2040 |
| NZF | 1 | 2,688 | N/A | $268,800,000 | March 1, 2040 |
| 2 | 2,622 | N/A | $262,200,000 | March 1, 2040 |
| 3 | 1,960 | 0.05 | $196,000,000 | June 1, 2040 |
* Remarketing fees as a percentage of aggregate principal amount of all VRDP Shares outstanding of each series.
N/A Not applicable. Series is considered to be Special Rate VRDP and therefore does not pay a remarketing fee.
VRDP Shares include a liquidity feature that allows VRDP shareholders to have their shares purchased by a liquidity provider with whom each Fund has contracted in the event that the VRDP Shares are not able to be successfully remarketed. Each Fund is required to redeem any VRDP Shares that are still owned by the liquidity provider after six months of continuous, unsuccessful remarketing. Each Fund pays an annual remarketing fee on the aggregate principal amount of all VRDP Shares outstanding. Each Fund’s VRDP Shares have successfully remarketed since issuance.
179
Notes to Financial Statements (continued)
NZF’s Series 1 and Series 2 VRDP Shares are considered to be Special Rate VRDP, which are sold to institutional investors. The special rate period will expire on March 1, 2040 for the Fund’s Series 1 and 2 VRDP Shares, but is subject to earlier termination by either the Fund or the holder. During the special rate period, the VRDP Shares will not be remarketed by a remarketing agent, be subject to optional or mandatory tender events, or be supported by a liquidity provider and are not subject to remarketing fees or liquidity fees. During the special rate period, VRDP dividends will be set monthly as a floating rate based on the predetermined formula. Following the initial special rate period, Special Rate Period VRDP Shares may transition to traditional VRDP Shares with dividends set at weekly remarketings, and be supported by a designated liquidity provider, or the Board may approve a subsequent special rate period.
Dividends on the VRDP Shares (which are treated as interest payments for financial reporting purposes) are set at a rate established by a remarketing agent; therefore, the market value of the VRDP Shares is expected to approximate its liquidation preference. In the event that VRDP Shares are unable to be successfully remarketed, the dividend rate will be the maximum rate which is designed to escalate according to a specified schedule in order to enhance the remarketing agent’s ability to successfully remarket the VRDP Shares.
Subject to certain conditions, VRDP Shares may be redeemed, in whole or in part, at any time at the option of each Fund. Each Fund may also redeem certain of the VRDP Shares if the Fund fails to maintain certain asset coverage requirements and such failures are not cured by the applicable cure date. The redemption price per share is equal to the sum of the liquidation preference per share plus any accumulated but unpaid dividends.
The average liquidation preference of VRDP Shares outstanding and annualized dividend rate for each Fund during the current fiscal period were as follows:
| NVG | NZF |
Average liquidation preference of VRDP Shares outstanding | $1,411,600,000 | $727,000,000 |
Annualized dividend rate | 0.83% | 1.38% |
For financial reporting purposes, the liquidation preference of VRDP Shares is a liability and is recognized as a component of “Variable Rate Demand Preferred (“VRDP”) Shares, net of deferred offering costs” on the Statement of Assets and Liabilities. Unpaid dividends on VRDP Shares are recognized as a component of “Interest payable” on the Statement of Assets and Liabilities, when applicable. Dividends accrued on VRDP Shares are recognized as a component of “Interest expense and amortization of offering costs” on the Statement of Operations. Costs incurred by the Funds in connection with their offerings of VRDP Shares were recorded as a deferred charge, which are amortized over the life of the shares and are recognized as a component of “Variable Rate Demand Preferred (“VRDP”) Shares, net of deferred offering costs” on the Statement of Assets and Liabilities and “Interest expense and amortization of offerings costs” on the Statement of Operations. In addition to interest expense, each Fund also pays a per annum liquidity fee to the liquidity provider, as well as a remarketing fee, which are recognized as “Liquidity fees” and “Remarketing fees,” respectively, on the Statement of Operations.
Preferred Share Transactions
Transactions in preferred shares for the Funds during the Funds’ current and prior fiscal period, where applicable, are noted in the following tables.
Transactions in AMTP Shares for the Funds, where applicable, were as follows:
| Year Ended |
| October 31, 2020 |
| NVG | Series | Shares | Amount |
AMTP Shares issued in connection with the Merger | 2028 | 1,120 | $112,000,000 |
Transactions in MFP Shares for the Funds, where applicable, were as follows:
| Year Ended
|
| October 31, 2019
|
| NVG | Series | Shares | Amount |
MFP Shares issued | B | 200,000 | $ 200,000,000 |
MFP Shares redeemed | A | (2,000) | (200,000,000) |
Net increase (decrease) | | 198,000 | $ — |
| Year Ended |
| October 31, 2020
|
| NMCO | Series | Shares | Amount |
| MFP Shares issued | A | 1,000 | $100,000,000 |
| B | 2,250 | 225,000,000 |
| C | 1,250 | 125,000,000 |
Total | | 4,500 | $450,000,000 |
180
6. Income Tax Information
Each Fund is a separate taxpayer for federal income tax purposes. Each Fund intends to distribute substantially all of its net investment income and net capital gains to shareholders and to otherwise comply with the requirements of Subchapter M of the Internal Revenue Code applicable to regulated investment companies. Therefore, no federal income tax provision is required. Furthermore, each Fund intends to satisfy conditions that will enable interest from municipal securities, which is exempt from regular federal income tax, to retain such tax-exempt status when distributed to shareholders of the Funds. Net realized capital gains and ordinary income distributions paid by the Funds are subject to federal taxation.
For all open tax years and all major taxing jurisdictions, management of the Funds has concluded that there are no significant uncertain tax positions that would require recognition in the financial statements. Open tax years are those that are open for examination by taxing authorities (i.e., generally the last four tax year ends and the interim tax period since then). Furthermore, management of the Funds is also not aware of any tax positions for which it is reasonably possible that the total amounts of unrecognized tax benefits will significantly change in the next twelve months.
The following information is presented on an income tax basis. Differences between amounts for financial statement and federal income tax purposes are primarily due to timing differences in recognizing taxable market discount, timing differences in recognizing certain gains and losses on investment transactions and the treatment of investments in inverse floating rate securities reflected as financing transactions, if any. To the extent that differences arise that are permanent in nature, such amounts are reclassified within the capital accounts as detailed below. Temporary differences do not require reclassification. Temporary and permanent differences do not impact the NAVs of the Funds.
The table below presents the cost and unrealized appreciation (depreciation) of each Fund’s investment portfolio, as determined on a federal income tax basis, as of October 31, 2020.
| NVG | NZF | NMZ | NMCO | NDMO |
Tax cost of investments | $4,972,676,377 | $3,302,664,674 | $1,144,332,602 | $1,146,754,347 | $754,073,261 |
Gross unrealized: | | | | | |
| Appreciation | 515,002,769 | 345,214,201 | 89,927,840 | 28,469,197 | 3,439,771 |
| Depreciation | (36,875,488) | (53,592,476) | (75,837,644) | (77,264,431) | (4,696,239) |
Net unrealized appreciation (depreciation) of investments | $ 478,127,281 | $ 291,621,725 | $ 14,090,196 | $ (48,795,234) | $ (1,256,468) |
Permanent differences, primarily due to federal taxes paid, nondeductible offering costs, taxable market discount, nondeductible reorganization expenses, reorganization adjustments, paydowns, and treatment of notional principal contracts, resulted in reclassifications among the Funds’ components of common share net assets as of October 31, 2020, the Funds’ tax year end.
The tax components of undistributed net tax-exempt income, net ordinary income and net long-term capital gains as of October 31, 2020, the Funds’ tax year end, were as follows:
| NVG | NZF | NMZ | NMCO | NDMO |
Undistributed net tax-exempt income1 | $ 7,215,271 | $5,518,539 | $10,923,431 | $3,254,558 | $1,447,380 |
Undistributed net ordinary income2 | 2,620,185 | 891,633 | 1,999,315 | 364,252 | 41,844 |
Undistributed net long-term capital gains | 20,803,556 | — | — | — | — |
1 | Undistributed net tax-exempt income (on a tax basis) has not been reduced for the dividend declared on October 1, 2020 and paid on November 2, 2020. |
2 | Net ordinary income consists of taxable market discount income and net short-term capital gains, if any. |
The tax character of distributions paid during the Funds’ tax years ended October 31, 2020 and October 31, 2019 was designated for purposes of the dividends paid deduction as follows:
| 2020 | NVG | NZF | NMZ | NMCO | NDMO4 |
Distributions from net tax-exempt income3 | $188,593,024 | $128,462,681 | $57,189,031 | $44,454,196 | $4,341,885 |
Distributions from net ordinary income2 | 578,198 | 52,126 | 1,828,548 | 104,004 | — |
Distributions from net long-term capital gains5 | 6,121,637 | — | — | — | — |
| 2019 | | NVG | NZF | NMZ | NMCO6 |
Distributions from net tax-exempt income | | $190,221,672 | $143,023,900 | $45,872,276 | $ — |
Distributions from net ordinary income2 | | 2,107,685 | 2,380,321 | 1,266,915 | — |
Distributions from net long-term capital gains | | 5,573,838 | — | — | — |
2 | Net ordinary income consists of taxable market discount income and net short-term capital gains, if any |
3 | The Funds hereby designate these amounts paid during the fiscal year ended October 31, 2020, as Exempt Interest Dividends. |
4 | For the period August 26, 2020 (commencement of operations) through October 31, 2020. |
5 | The Funds hereby designate as long-term capital gain dividends, pursuant to the Internal Revenue Code Section 852(b)(3), the amount necessary to reduce earnings and profits of the Funds related to net capital gain to zero for the tax year ended October 31, 2020. |
6 | For the period September 16, 2019 (commencement of operations) through October 31, 2019. |
181
Notes to Financial Statements (continued)
As of October 31, 2020, the Funds’ tax year end, the Funds had unused capital losses carrying forward available for federal income tax purposes to be applied against future capital gains, if any. The capital losses are not subject to expiration.
| NVG7 | NZF | NMZ | NMCO | NDMO |
Not subject to expiration: | | | | | |
| Short-term | $1,434,595 | $30,169,235 | $2,509,306 | $68,035,418 | $449,926 |
| Long-term | 2,040,935 | — | — | — | — |
Total | $3,475,530 | $30,169,235 | $2,509,306 | $68,035,418 | $449,926 |
7 A portion of NVG’s capital loss carryforward is subject to an annual limitation under the Internal Revenue Code and related regulations.
During the Funds’ tax year ended October 31, 2020, the following Fund utilized capital loss carryforwards as follows:
| NVG |
Utilized capital loss carryforwards | $4,625,194 |
7. Management Fees and Other Transactions with Affiliates
Management Fees
Each Fund’s management fee compensates the Adviser for overall investment advisory and administrative services and general office facilities. The Sub-Adviser is compensated for its services to the Funds from the management fees paid to the Adviser.
Each Fund’s management fee consists of two components – a fund-level fee, based only on the amount of assets within each individual Fund, and a complex-level fee, based on the aggregate amount of all eligible fund assets managed by the Adviser. This pricing structure enables Fund shareholders to benefit from growth in the assets within their respective Fund as well as from growth in the amount of complex-wide assets managed by the Adviser.
The annual fund-level fee, payable monthly, for each Fund is calculated according to the following schedules:
| NVG |
| NZF |
| Average Daily Managed Assets* | Fund-Level Fee Rate |
For the first $125 million | 0.5000% |
For the next $125 million | 0.4875
|
For the next $250 million | 0.4750
|
For the next $500 million | 0.4625
|
For the next $1 billion | 0.4500
|
For the next $3 billion | 0.4250
|
For managed assets over $5 billion | 0.4125
|
| NMZ |
| Average Daily Managed Assets* | Fund-Level Fee Rate |
For the first $125 million | 0.5500% |
For the next $125 million | 0.5375
|
For the next $250 million | 0.5250
|
For the next $500 million | 0.5125
|
For the next $1 billion | 0.5000
|
For the next $3 billion | 0.4750
|
For managed assets over $5 billion | 0.4625
|
| NMCO |
| Average Daily Managed Assets* | Fund-Level Fee Rate |
For the first $125 million | 0.7500% |
For the next $125 million | 0.7375
|
For the next $250 million | 0.7250
|
For the next $500 million | 0.7125
|
For the next $1 billion | 0.7000
|
For the next $3 billion | 0.6750
|
For managed assets over $5 billion | 0.6625
|
182
| NDMO |
| Average Daily Managed Assets* | Fund-Level Fee Rate |
For the first $125 million | 0.7000% |
For the next $125 million | 0.6875
|
For the next $250 million | 0.6750
|
For the next $500 million | 0.6625
|
For the next $1 billion | 0.6500
|
For the next $3 billion | 0.6250
|
For managed assets over $5 billion | 0.6125
|
The annual complex-level fee, payable monthly, for each Fund is calculated by multiplying the current complex-wide fee rate, determined according to the following schedule by the Funds’ daily managed assets:
| Complex-Level Eligible Asset Breakpoint Level* | Effective Complex-Level Fee Rate at Breakpoint Level |
$55 billion | 0.2000% |
$56 billion | 0.1996
|
$57 billion | 0.1989
|
$60 billion | 0.1961
|
$63 billion | 0.1931
|
$66 billion | 0.1900
|
$71 billion | 0.1851
|
$76 billion | 0.1806
|
$80 billion | 0.1773
|
$91 billion | 0.1691
|
$125 billion | 0.1599
|
$200 billion | 0.1505
|
$250 billion | 0.1469
|
$300 billion | 0.1445
|
* | For the complex-level fees, managed assets include closed-end fund assets managed by the Adviser that are attributable to certain types of leverage. For these purposes, leverage includes the funds’ use of preferred stock and borrowings and certain investments in the residual interest certificates (also called inverse floating rate securities) in tender option bond (TOB) trusts, including the portion of assets held by a TOB trust that has been effectively financed by the trust’s issuance of floating rate securities, subject to an agreement by the Adviser as to certain funds to limit the amount of such assets for determining managed assets in certain circumstances. The complex-level fee is calculated based upon the aggregate daily managed assets of all Nuveen open-end and closed-end funds that constitute “eligible assets.” Eligible assets do not include assets attributable to investments in other Nuveen funds or assets in excess of a determined amount (originally $2 billion) added to the Nuveen fund complex in connection with the Adviser’s assumption of the management of the former First American Funds effective January 1, 2011, but do not include certain Nuveen funds that were reorganized into funds advised by an affiliate of the Adviser during the 2019 calendar year. As of October 31, 2020, the complex-level fee for each Fund was 0.1572%. |
Other Transactions with Affiliates
Each Fund is permitted to purchase or sell securities from or to certain other funds or accounts managed by the Sub-Adviser (“Affiliated Entity”) under specified conditions outlined in procedures adopted by the Board (“cross-trade”). These procedures have been designed to ensure that any cross-trade of securities by the Fund from or to an Affiliated Entity by virtue of having a common investment adviser (or affiliated investment adviser), common officer and/or common trustee complies with Rule 17a-7 under the 1940 Act. These transactions are effected at the current market price (as provided by an independent pricing service) without incurring broker commissions.
During the current fiscal period, the following Funds engaged in cross-trades pursuant to these procedures as follows:
| Cross-Trades | NVG | NZF | NMZ | NMCO |
Purchases | $31,100,000 | $30,995,280 | $65,049,238 | $ 89,145,588 |
Sales | 65,400,000 | 58,930,316 | — | 114,648,724 |
8. Borrowing Arrangements
Committed Line of Credit
NVG, NZF, NMZ and NMCO, along with certain other funds managed by the Adviser (“Participating Funds”), have established a 364-day, $2.405 billion standby credit facility with a group of lenders, under which the Participating Funds may borrow for various purposes other than leveraging for investment purposes. Each Participating Fund is allocated a designated proportion of the facility’s capacity (and its associated costs, as described below) based upon a multi-factor assessment of the likelihood and frequency of its need to draw on the facility, the size of the Fund and its anticipated
183
Notes to Financial Statements (continued)
draws, and the potential importance of such draws to the operations and well-being of the Fund, relative to those of the other Funds. A Fund may effect draws on the facility in excess of its designated capacity if and to the extent that other Participating Funds have undrawn capacity. The credit facility expires in June 2021 unless extended or renewed.
The credit facility has the following terms: a 0.10% upfront fee, 0.15% per annum on unused commitment amounts and a drawn interest rate equal to the higher of (a) one-month LIBOR (London Inter-Bank Offered Rate) plus 1.25% (1.00% prior to June 24, 2020) per annum or (b) the Fed Funds rate plus 1.25% (1.00% prior to June 24, 2020) per annum on amounts borrowed. Participating Funds paid administration, legal and arrangement fees, which are recognized as a component of “Other expenses” on the Statement of Operations, and along with commitment fees, have been allocated among such Participating Funds based upon the relative proportions of the facility’s aggregate capacity reserved for them and other factors deemed relevant by the Adviser and the Board of each Participating Fund.
During the current fiscal period, the following Funds utilized this facility. Each Fund’s maximum outstanding balance during the utilization period was as follows:
| NVG | NZF | NMZ |
Maximum outstanding balance | $75,100,000 | $52,200,000 | $23,200,000 |
During each Fund’s utilization period(s) during the current fiscal period, the average daily balance outstanding and average annual interest rate on the Borrowings were as follows:
| NVG | NZF | NMZ |
Utilization period (days outstanding) | 30 | 65 | 1 |
Average daily balance outstanding | $23,020,000 | $14,267,901 | $23,200,000 |
Average annual interest rate | 2.75% | 2.54% | 1.86% |
Borrowings outstanding as of the end of the reporting period, if any, are recognized as “Borrowings” on the Statement of Assets and Liabilities, where applicable.
Inter-Fund Borrowing and Lending
The SEC has granted an exemptive order permitting registered open-end and closed-end Nuveen funds to participate in an inter-fund lending facility whereby the Nuveen funds may directly lend to and borrow money from each other for temporary purposes (e.g., to satisfy redemption requests or when a sale of securities “fails,” resulting in an unanticipated cash shortfall) (the “Inter-Fund Program”). The closed-end Nuveen funds, including the Funds covered by this shareholder report, will participate only as lenders, and not as borrowers, in the Inter-Fund Program because such closed-end funds rarely, if ever, need to borrow cash to meet redemptions. The Inter-Fund Program is subject to a number of conditions, including, among other things, the requirements that (1) no fund may borrow or lend money through the Inter-Fund Program unless it receives a more favorable interest rate than is typically available from a bank or other financial institution for a comparable transaction; (2) no fund may borrow on an unsecured basis through the Inter-Fund Program unless the fund’s outstanding borrowings from all sources immediately after the inter-fund borrowing total 10% or less of its total assets; provided that if the borrowing fund has a secured borrowing outstanding from any other lender, including but not limited to another fund, the inter-fund loan must be secured on at least an equal priority basis with at least an equivalent percentage of collateral to loan value; (3) if a fund’s total outstanding borrowings immediately after an inter-fund borrowing would be greater than 10% of its total assets, the fund may borrow through the inter-fund loan on a secured basis only; (4) no fund may lend money if the loan would cause its aggregate outstanding loans through the Inter-Fund Program to exceed 15% of its net assets at the time of the loan; (5) a fund’s inter-fund loans to any one fund shall not exceed 5% of the lending fund’s net assets; (6) the duration of inter-fund loans will be limited to the time required to receive payment for securities sold, but in no event more than seven days; and (7) each inter-fund loan may be called on one business day’s notice by a lending fund and may be repaid on any day by a borrowing fund. In addition, a Nuveen fund may participate in the Inter-Fund Program only if and to the extent that such participation is consistent with the fund’s investment objective and investment policies. The Board is responsible for overseeing the Inter-Fund Program.
The limitations detailed above and the other conditions of the SEC exemptive order permitting the Inter-Fund Program are designed to minimize the risks associated with Inter-Fund Program for both the lending fund and the borrowing fund. However, no borrowing or lending activity is without risk. When a fund borrows money from another fund, there is a risk that the loan could be called on one day’s notice or not renewed, in which case the fund may have to borrow from a bank at a higher rate or take other actions to payoff such loan if an inter-fund loan is not available from another fund. Any delay in repayment to a lending fund could result in a lost investment opportunity or additional borrowing costs.
During the current reporting period, none of the Funds covered by this shareholder report have entered into any inter-fund loan activity.
184
9. Fund Merger
The Merger as previously described in Note 1 — General Information was structured to qualify as a tax-free merger under the Internal Revenue Code for federal income tax purposes, and the Target Fund’s shareholders recognized no gain or loss for federal income tax purposes as a result. Prior to the closing of the Merger, the Target Fund distributed all of its net investment income and capital gains, if any. Such a distribution may be taxable to the Target Fund’s shareholders for federal income tax purposes.
Investments
The cost, fair value and net unrealized appreciation (depreciation) of the investments (including investments in derivatives) of the Target Fund as of the date of the Merger, were as follows:
| NTC |
Cost of investments | $278,923,665 |
Fair value of investments | 294,696,476 |
Net unrealized appreciation (depreciation) of investments | 15,772,811 |
For financial reporting purposes, assets received and shares issued by the Acquiring Fund were recorded at fair value; however, the cost basis of the investments received from the Target Fund were carried forward to align ongoing reporting of the Acquiring Fund’s realized and unrealized gains and losses with amounts distributable to shareholders for tax purposes.
Common Shares
The common shares outstanding, net assets applicable to common shares and NAV per common share outstanding immediately before and after the Merger were as follows:
| Target Fund – Prior to Merger | NTC |
Common shares outstanding | 14,328,976 |
Net assets applicable to common shares | $184,807,196 |
NAV per common share outstanding | $ 12.90 |
| Acquiring Fund – Prior to Merger | NVG |
Common shares outstanding | 202,552,895 |
Net assets applicable to common shares | $3,460,366,031 |
NAV per common share outstanding | $ 17.08 |
| Acquiring Fund – Post Merger | NVG |
Common shares outstanding | 213,370,544 |
Net assets applicable to common shares | $3,645,173,227 |
NAV per common share outstanding | $ 17.08 |
Pro Forma Results of Operations (Unaudited)
The beginning of the Target Fund’s current fiscal period was June 1, 2019. Assuming the Merger had been completed on November 1, 2019, the beginning of the Acquiring Fund’s current fiscal period, the pro forma results of operations for the current fiscal period, are as follows:
| Acquiring Fund – Pro Forma Results from Operations | NVG |
Net investment income (loss) | $174,822,720 |
Net realized and unrealized gains (losses) | (83,738,038) |
Change in net assets resulting from operations | 91,084,682 |
Because the combined investment portfolios of the Acquiring Fund have been managed as a single integrated portfolio since the Merger was completed, it is not practicable to separate the amounts of revenue and earnings of the Target Fund that have been included in the Statement of Operations of the Acquiring Fund since the Merger was consummated.
Cost and Expenses
In connection with the Merger, the Acquiring Fund incurred certain associated costs and expenses. Such amounts were included as components of “Accrued other expenses” on the Statement of Assets and Liabilities and “Merger expenses” on the Statement of Operations.
185
Notes to Financial Statements (continued)
10. Subsequent Events
Committed Line of Credit
During November 2020, NDMO entered into a $215 million committed line of credit (“Borrowings”) agreement with its custodian bank, as a means of leverage. The credit agreement expires in November 2021 unless extended or renewed.
Interest is charged on the Borrowings drawn amount for a Base Rate Loan at a rate per annum equal to the higher of (a) one-month LIBOR rate plus 0.75% or (b) the Federal Funds Rate plus 0.85% or for a LIBOR Loan at a rate per annum equal to the LIBOR Offered Rate plus 0.75%. NDMO also accrues a 0.15% per annum commitment fee on the undrawn balance based on the maximum commitment amount of the Borrowings to the extent the unused portion of the Borrowings is less than 25% of the maximum commitment amount, otherwise the per annum commitment fee is 0.25%. NDMO also incurred a 0.05% upfront fee.
186
Shareholder Update
(Unaudited)
Current Investment Objectives, Investment Policies and Principal Risks of the Funds
NUVEEN AMT-FREE MUNICIPAL CREDIT INCOME FUND (NVG)
Investment Objectives
The Fund’s investment objectives are to provide current income exempt from regular federal income tax and federal alternative minimum tax applicable to individuals, and to enhance portfolio value relative to the municipal bond market by investing in tax-exempt municipal bonds that the Fund’s investment adviser believes are underrated or undervalued or that represent municipal market sectors that are undervalued.
Investment Policies
Under normal circumstances, the Fund will invest at least 80% of its Assets (as defined below) in municipal securities and other related investments, the income from which is exempt from regular federal income taxes.
As a non-fundamental policy, under normal circumstances, the Fund will invest 100% of its Managed Assets (as defined below) and at least 80% of its Assets in municipal securities and other related investments, the income from which is also exempt from the federal alternative minimum tax applicable to individuals at the time of purchase.
The Fund generally invests in municipal securities with long-term maturities in order to maintain an average effective maturity of 15 to 30 years, including the effects of leverage, but the average effective maturity of obligations held by the Fund may be lengthened or shortened as a result of portfolio transactions effected by the Fund’s investment adviser and/or the Fund’s sub-adviser, depending on market conditions and on an assessment by the portfolio manager of which segments of the municipal securities markets offer the most favorable relative investment values and opportunities for tax-exempt income and total return.
“Assets” mean the net assets of the Fund plus the amount of any borrowings for investment purposes. “Managed Assets” mean the total assets of the Fund, minus the sum of its accrued liabilities (other than Fund liabilities incurred for the express purpose of creating leverage). Total assets for this purpose shall include assets attributable to the Fund’s use of leverage (whether or not those assets are reflected in the Fund’s financial statements for purposes of generally accepted accounting principles), and derivatives will be valued at their market value.
Under normal circumstances:
| • | The Fund may invest up to 55% of its Managed Assets in securities that, at the time of investment, are rated below the three highest grades (Baa or BBB or lower) by at least one nationally recognized statistical rating organization (“NRSRO”) or are unrated but judged to be of comparable quality by the Fund’s sub-adviser. |
| • | The Fund may invest up to 15% of its Managed Assets in inverse floating rate securities. |
| • | The Fund may not enter into a futures contract or related options or forward contracts if more than 30% of the Fund’s Managed Assets would be represented by futures contracts or more than 5% of the Fund’s Managed Assets would be committed to initial margin deposits and premiums on futures contracts or related options. |
Approving Changes in Investment Policies
The Board of Trustees of the Fund may change a policy without a shareholder vote. However, with respect to the Fund’s policy of investing at least 80% of its Assets in municipal securities and other related investments that pay interest exempt from both regular federal income tax and the federal alternative minimum tax applicable to individuals at the time of purchase, such policy may not be changed without 60 days’ prior written notice and the approval of the holders of a majority of the outstanding common shares and preferred shares voting together as a single class, and the approval of the holders of a majority of the outstanding preferred shares, voting separately as a single class.
Portfolio Contents
The Fund generally invests in municipal securities. Municipal securities include municipal bonds, notes, securities issued to finance and refinance public projects, certificates of participation, variable rate demand obligations, lease obligations, municipal notes, pre-refunded municipal bonds, private activity bonds, securities issued by tender option bond trusts (“TOB Trusts”), including inverse floating rate securities, and other forms of municipal bonds and securities, and other related instruments that create exposure to municipal bonds, notes and securities that provide for the payment of interest income that is exempt from regular U.S. federal income tax.
Municipal securities are debt obligations generally issued by states, cities and local authorities and certain possessions and territories of the United States (such as Puerto Rico and Guam) to finance or refinance public purpose projects such as roads, schools, and water supply systems.
The Fund may invest in municipal securities that represent lease obligations and certificates of participation in such leases. A municipal lease is an obligation in the form of a lease or installment purchase that is issued by a state or local government to acquire equipment and facilities. Income from such obligations generally is exempt from state and local taxes in the state of issuance. A certificate of participation represents an undivided interest in
187
Shareholder Update (Unaudited) (continued)
an unmanaged pool of municipal leases, an installment purchase agreement or other instruments. The certificates typically are issued by a municipal agency, a trust or other entity that has received an assignment of the payments to be made by the state or political subdivision under such leases or installment purchase agreements. Such certificates provide the Fund with the right to a pro rata undivided interest in the underlying municipal securities. In addition, such participations generally provide the Fund with the right to demand payment, on not more than seven days’ notice, of all or any part of the Fund’s participation interest in the underlying municipal securities, plus accrued interest.
The Fund may invest in “tobacco settlement bonds.” Tobacco settlement bonds are municipal securities that are secured or payable solely from the collateralization of the proceeds from class action or other litigation against the tobacco industry.
The Fund may invest in inverse floating rate securities issued by a TOB trust, the interest rate on which varies inversely with the Securities Industry Financial Markets Association short-term rate, which resets weekly, or a similar short-term rate, and is reduced by the expenses related to the TOB trust. Typically, inverse floating rate securities represent beneficial interests in a special purpose trust (sometimes called a TOB trust) formed by a third party sponsor for the purpose of holding municipal bonds. Inverse floating rate securities may increase or decrease in value at a greater rate than the underlying interest rate on the municipal bond held by the TOB trust, which effectively leverages the Fund’s investment.
The Fund may invest in zero coupon bonds. A zero coupon bond is a bond that typically does not pay interest for the entire life of the obligation or for an initial period after the issuance of the obligation.
The Fund may invest in illiquid securities (i.e., securities that are not readily marketable), including, but not limited to, restricted securities (securities the disposition of which is restricted under the federal securities laws), securities that may be resold only pursuant to Rule 144A under the Securities Act of 1933, as amended (the “1933 Act”), and repurchase agreements with maturities in excess of seven days.
The Fund may enter into certain derivative instruments in pursuit of its investment objectives, including to seek to enhance return, to hedge certain risks of its investments in fixed-income securities or as a substitute for a position in the underlying asset. Such instruments include financial futures contracts, swap contracts (including interest rate and credit default swaps), options on financial futures, options on swap contracts or other derivative instruments.
The Fund may also invest in securities of other open- or closed-end investment companies (including exchange-traded funds (“ETFs”)) that invest primarily in municipal securities of the types in which the Fund may invest directly, to the extent permitted by the Investment Company Act of 1940, as amended (the “1940 Act”), the rules and regulations issued thereunder and applicable exemptive orders issued by the Securities and Exchange Commission (“SEC”).
Use of Leverage
The Fund uses leverage to pursue its investment objectives. The Fund may use leverage to the extent permitted by the 1940 Act. The Fund may source leverage through a number of methods including the issuance of preferred shares of beneficial interest (“Preferred Shares”), entering into reverse repurchase agreements (effectively a secured borrowing) and borrowings (for defensive purposes only). In addition, the Fund may also use certain derivatives that have the economic effect of leverage by creating additional investment exposure. The amount and sources of leverage will vary depending on market conditions.
Temporary Defensive Periods
During temporary defensive periods (e.g., times when, in the Fund’s investment adviser’s and/or the Fund’s sub-adviser’s opinion, temporary imbalances of supply and demand or other temporary dislocations in the tax-exempt bond market adversely affect the price at which long-term or intermediate-term municipal securities are available), and in order to keep the Fund’s cash fully invested, the Fund may invest any percentage of its Managed Assets in short-term investments including high quality, short-term debt securities that may be either tax-exempt or taxable. The Fund may not achieve its investment objectives during such periods.
NUVEEN MUNICIPAL CREDIT INCOME FUND (NZF)
Investment Objectives
The Fund’s investment objectives are to provide current income exempt from regular federal income tax and to enhance portfolio value relative to the municipal bond market by investing in tax-exempt municipal bonds that the Fund’s investment adviser believes are underrated or undervalued or that represent municipal market sectors that are undervalued.
Investment Policies
Under normal circumstances, the Fund will invest at least 80% of its Assets (as defined below) in municipal securities and other related investments, the income from which is exempt from regular federal income taxes.
As a non-fundamental policy, under normal circumstances, the Fund may invest up to 55% of its Managed Assets (as defined below) in securities that, at the time of investment, are rated below the three highest grades (Baa or BBB or lower) by at least one NRSRO or are unrated but judged to be of comparable quality by the Fund’s sub-adviser.
188
The Fund generally invests in municipal securities with long-term maturities in order to maintain an average effective maturity of 15 to 30 years, including the effects of leverage, but the average effective maturity of obligations held by the Fund may be lengthened or shortened as a result of portfolio transactions effected by the Fund’s investment adviser and/or the Fund’s sub-adviser, depending on market conditions and on an assessment by the portfolio manager of which segments of the municipal securities markets offer the most favorable relative investment values and opportunities for tax-exempt income and total return.
“Assets” mean the net assets of the Fund plus the amount of any borrowings for investment purposes. “Managed Assets” mean the total assets of the Fund, minus the sum of its accrued liabilities (other than Fund liabilities incurred for the express purpose of creating leverage). Total assets for this purpose shall include assets attributable to the Fund’s use of leverage (whether or not those assets are reflected in the Fund’s financial statements for purposes of generally accepted accounting principles), and derivatives will be valued at their market value.
Under normal circumstances:
| • | The Fund may invest up to 20% of its Managed Assets in municipal securities that pay interest that is taxable under the federal alternative minimum tax. |
| • | The Fund may invest up to 15% of its Managed Assets in inverse floating rate securities. |
| • | The Fund may not enter into a futures contract or related options or forward contracts if more than 30% of the Fund’s Managed Assets would be represented by futures contracts or more than 5% of the Fund’s Managed Assets would be committed to initial margin deposits and premiums on futures contracts or related options. |
Approving Changes in Investment Policies
The Board of Trustees of the Fund may change a policy without a shareholder vote. However, with respect to the Fund’s policy of investing at least 80% of its Assets in municipal securities and other related investments, the income from which is exempt from regular federal income taxes, such policy may not be changed without 60 days’ prior written notice and the approval of the holders of a majority of the outstanding common shares and preferred shares voting together as a single class, and the approval of the holders of a majority of the outstanding preferred shares, voting separately as a single class.
Portfolio Contents
The Fund generally invests in municipal securities. Municipal securities include municipal bonds, notes, securities issued to finance and refinance public projects, certificates of participation, variable rate demand obligations, lease obligations, municipal notes, pre-refunded municipal bonds, private activity bonds, securities issued by TOB Trusts, including inverse floating rate securities, and other forms of municipal bonds and securities, and other related instruments that create exposure to municipal bonds, notes and securities that provide for the payment of interest income that is exempt from regular U.S. federal income tax.
Municipal securities are debt obligations generally issued by states, cities and local authorities and certain possessions and territories of the United States (such as Puerto Rico and Guam) to finance or refinance public purpose projects such as roads, schools, and water supply systems.
The Fund may also invest in municipal securities that pay interest that is taxable under the federal alternative minimum tax applicable to noncorporate taxpayers (“AMT Bonds”). AMT Bonds may trigger adverse tax consequences for Fund shareholders who are subject to the federal alternative minimum tax.
The Fund may invest in municipal securities that represent lease obligations and certificates of participation in such leases. A municipal lease is an obligation in the form of a lease or installment purchase that is issued by a state or local government to acquire equipment and facilities. Income from such obligations generally is exempt from state and local taxes in the state of issuance. A certificate of participation represents an undivided interest in an unmanaged pool of municipal leases, an installment purchase agreement or other instruments. The certificates typically are issued by a municipal agency, a trust or other entity that has received an assignment of the payments to be made by the state or political subdivision under such leases or installment purchase agreements. Such certificates provide the Fund with the right to a pro rata undivided interest in the underlying municipal securities. In addition, such participations generally provide the Fund with the right to demand payment, on not more than seven days’ notice, of all or any part of the Fund’s participation interest in the underlying municipal securities, plus accrued interest.
The Fund may invest in “tobacco settlement bonds.” Tobacco settlement bonds are municipal securities that are secured or payable solely from the collateralization of the proceeds from class action or other litigation against the tobacco industry.
The Fund may invest in inverse floating rate securities issued by a TOB trust, the interest rate on which varies inversely with the Securities Industry Financial Markets Association short-term rate, which resets weekly, or a similar short-term rate, and is reduced by the expenses related to the TOB trust. Typically, inverse floating rate securities represent beneficial interests in a special purpose trust (sometimes called a TOB trust) formed by a third party sponsor for the purpose of holding municipal bonds. Inverse floating rate securities may increase or decrease in value at a greater rate than the underlying interest rate on the municipal bond held by the TOB trust, which effectively leverages the Fund’s investment.
189
Shareholder Update (Unaudited) (continued)
The Fund may invest in zero coupon bonds. A zero coupon bond is a bond that typically does not pay interest for the entire life of the obligation or for an initial period after the issuance of the obligation.
The Fund may invest in illiquid securities (i.e., securities that are not readily marketable), including, but not limited to, restricted securities (securities the disposition of which is restricted under the federal securities laws), securities that may be resold only pursuant to Rule 144A under the 1933 Act, and repurchase agreements with maturities in excess of seven days.
The Fund may enter into certain derivative instruments in pursuit of its investment objectives, including to seek to enhance return, to hedge certain risks of its investments in fixed-income securities or as a substitute for a position in the underlying asset. Such instruments include financial futures contracts, swap contracts (including interest rate and credit default swaps), options on financial futures, options on swap contracts or other derivative instruments.
The Fund may also invest in securities of other open- or closed-end investment companies (including ETFs) that invest primarily in municipal securities of the types in which the Fund may invest directly, to the extent permitted by the 1940 Act, the rules and regulations issued thereunder and applicable exemptive orders issued by the SEC. In addition, the Fund may invest a portion of its Managed Assets in pooled investment vehicles (other than investment companies) that invest primarily in municipal securities of the types in which the Fund may invest directly.
Use of Leverage
The Fund uses leverage to pursue its investment objectives. The Fund may use leverage to the extent permitted by the 1940 Act. The Fund may source leverage through a number of methods including the issuance of Preferred Shares, investments in inverse floating rate securities and borrowings. In addition, the Fund may also use certain derivatives that have the economic effect of leverage by creating additional investment exposure. The amount and sources of leverage will vary depending on market conditions.
Temporary Defensive Periods
During temporary defensive periods (e.g., times when, in the Fund’s investment adviser’s and/or the Fund’s sub-adviser’s opinion, temporary imbalances of supply and demand or other temporary dislocations in the tax-exempt bond market adversely affect the price at which long-term or intermediate-term municipal securities are available), and in order to keep the Fund’s cash fully invested, the Fund may invest any percentage of its Managed Assets in short-term investments including high quality, short-term debt securities that may be either tax-exempt or taxable. The Fund may not achieve its investment objectives during such periods.
NUVEEN MUNICIPAL HIGH INCOME OPPORTUNITY FUND (NMZ)
Investment Objectives
The Fund’s primary investment objective is to provide high current income exempt from regular federal income tax. The Fund’s secondary investment objective is to seek attractive total return consistent with its primary objective.
Investment Policies
Under normal circumstances, the Fund will invest at least 80% of its Assets (as defined below) in municipal securities and other related investments, the income from which is exempt from regular federal income taxes.
The Fund generally invests in municipal securities with long-term maturities in order to maintain an average effective maturity of 15 to 30 years, including the effects of leverage, but the average effective maturity of obligations held by the Fund may be lengthened or shortened as a result of portfolio transactions effected by the Fund’s investment adviser and/or the Fund’s sub-adviser, depending on market conditions and on an assessment by the portfolio manager of which segments of the municipal securities markets offer the most favorable relative investment values and opportunities for tax-exempt income and total return.
“Assets” mean the net assets of the Fund plus the amount of any borrowings for investment purposes. “Managed Assets” mean the total assets of the Fund, minus the sum of its accrued liabilities (other than Fund liabilities incurred for the express purpose of creating leverage). Total assets for this purpose shall include assets attributable to the Fund’s use of leverage (whether or not those assets are reflected in the Fund’s financial statements for purposes of generally accepted accounting principles), and derivatives will be valued at their market value.
Under normal circumstances:
| • | The Fund may invest up to 20% of its Managed Assets in municipal securities that pay interest that is taxable under the federal alternative minimum tax. |
| • | The Fund may invest up to 75% of its Managed Assets in municipal securities that, at the time of investment, are rated Baa/BBB or lower by at least one NRSRO or are unrated but judged to be of comparable quality by the Fund’s sub-adviser. |
| • | The Fund may not invest more than 10% of its Managed Assets in municipal securities rated below B3/B- by any NRSROs that rate the security or that are unrated by all NRSROs but judged to be of comparable quality by the Fund’s sub-adviser. |
190
| • | The Fund may invest up to 25% of its Managed Assets in municipal securities in any one industry or in any one state of origin. |
| • | The Fund may invest up to 15% of its Managed Assets in inverse floating rate securities. |
Approving Changes in Investment Policies
The Board of Trustees of the Fund may change a policy without a shareholder vote. However, with respect to the Fund’s policy of investing at least 80% of its Assets in municipal securities and other related investments, the income from which is exempt from regular federal income taxes, such policy may not be changed without 60 days’ prior written notice and the approval of the holders of a majority of the outstanding common shares and preferred shares voting together as a single class, and the approval of the holders of a majority of the outstanding preferred shares, voting separately as a single class.
Portfolio Contents
The Fund generally invests in municipal securities. Municipal securities include municipal bonds, notes, securities issued to finance and refinance public projects, certificates of participation, variable rate demand obligations, lease obligations, municipal notes, pre-refunded municipal bonds, private activity bonds, securities issued by TOB Trusts, including inverse floating rate securities, and other forms of municipal bonds and securities, and other related instruments that create exposure to municipal bonds, notes and securities that provide for the payment of interest income that is exempt from regular U.S. federal income tax.
Municipal securities are debt obligations generally issued by states, cities and local authorities and certain possessions and territories of the United States (such as Puerto Rico and Guam) to finance or refinance public purpose projects such as roads, schools, and water supply systems.
The Fund may invest in municipal securities that are additionally secured by insurance, bank credit agreements or escrow accounts.
The Fund may also invest in AMT Bonds. AMT Bonds may trigger adverse tax consequences for Fund shareholders who are subject to the federal alternative minimum tax.
The Fund may invest a significant portion of its Managed Assets in certain sectors of the municipal securities market, such as hospitals and other health care facilities, charter schools and other private educational facilities, special taxing districts and start-up utility districts, and private activity bonds including industrial development bonds on behalf of transportation companies such as airline companies, whose credit quality and performance may be more susceptible to economic, business, political, regulatory and other developments than other sectors of municipal issuers.
The Fund may invest in municipal securities that represent lease obligations and certificates of participation in such leases. A municipal lease is an obligation in the form of a lease or installment purchase that is issued by a state or local government to acquire equipment and facilities. Income from such obligations generally is exempt from state and local taxes in the state of issuance. A certificate of participation represents an undivided interest in an unmanaged pool of municipal leases, an installment purchase agreement or other instruments. The certificates typically are issued by a municipal agency, a trust or other entity that has received an assignment of the payments to be made by the state or political subdivision under such leases or installment purchase agreements. Such certificates provide the Fund with the right to a pro rata undivided interest in the underlying municipal securities. In addition, such participations generally provide the Fund with the right to demand payment, on not more than seven days’ notice, of all or any part of the Fund’s participation interest in the underlying municipal securities, plus accrued interest.
The Fund may invest in “tobacco settlement bonds.” Tobacco settlement bonds are municipal securities that are secured or payable solely from the collateralization of the proceeds from class action or other litigation against the tobacco industry.
The Fund may invest in inverse floating rate securities issued by a TOB trust, the interest rate on which varies inversely with the Securities Industry Financial Markets Association short-term rate, which resets weekly, or a similar short-term rate, and is reduced by the expenses related to the TOB trust. Typically, inverse floating rate securities represent beneficial interests in a special purpose trust (sometimes called a TOB trust) formed by a third party sponsor for the purpose of holding municipal bonds. Inverse floating rate securities may increase or decrease in value at a greater rate than the underlying interest rate on the municipal bond held by the TOB trust, which effectively leverages the Fund’s investment.
The Fund may invest in zero coupon bonds. A zero coupon bond is a bond that typically does not pay interest for the entire life of the obligation or for an initial period after the issuance of the obligation.
The Fund may invest in illiquid securities (i.e., securities that are not readily marketable), including, but not limited to, restricted securities (securities the disposition of which is restricted under the federal securities laws), securities that may be resold only pursuant to Rule 144A under the 1933 Act, and repurchase agreements with maturities in excess of seven days.
The Fund may enter into certain derivative instruments in pursuit of its investment objective, including to seek to enhance return, to hedge certain risks of its investments in municipal securities or as a substitute for a position in the underlying asset. Such instruments include financial futures contracts, swap contracts (including interest rate and credit default swaps), options on financial futures, options on swap contracts, or other derivative instruments.
191
Shareholder Update (Unaudited) (continued)
The Fund may also invest in securities of other open- or closed-end investment companies (including ETFs) that invest primarily in municipal securities of the types in which the Fund may invest directly, to the extent permitted by the 1940 Act, the rules and regulations issued thereunder and applicable exemptive orders issued by the SEC.
Use of Leverage
The Fund uses leverage to pursue its investment objectives. The Fund may use leverage to the extent permitted by the 1940 Act. The Fund may source leverage through a number of methods including the issuance of Preferred Shares, investments in inverse floating rate securities, entering into reverse repurchase agreements (effectively a secured borrowing) and borrowings (subject to certain investment restrictions). In addition, the Fund may also use certain derivatives that have the economic effect of leverage by creating additional investment exposure. The amount and sources of leverage will vary depending on market conditions.
Temporary Defensive Periods
During temporary defensive periods (e.g., times when, in the Fund’s investment adviser’s and/or the Fund’s sub-adviser’s opinion, temporary imbalances of supply and demand or other temporary dislocations in the tax-exempt bond market adversely affect the price at which long-term or intermediate-term municipal securities are available), and in order to keep the Fund’s cash fully invested, the Fund may invest any percentage of its Managed Assets in short-term investments including high quality, short-term debt securities that may be either tax-exempt or taxable. The Fund may not achieve its investment objectives during such periods.
NUVEEN MUNICIPAL CREDIT OPPORTUNITIES FUND (NMCO)
Investment Objectives
The Fund’s primary investment objective is to provide a high level of current income exempt from regular U.S. federal income tax. The Fund’s secondary investment objective is to seek total return.
Investment Policies
Under normal circumstances, the Fund will invest at least 80% of its Assets (as defined below) in municipal securities, the income from which is exempt from regular federal income taxes.
“Assets” mean the net assets of the Fund plus the amount of any borrowings for investment purposes. “Managed Assets” mean the total assets of the Fund, minus the sum of its accrued liabilities (other than Fund liabilities incurred for the express purpose of creating leverage). Total assets for this purpose shall include assets attributable to the Fund’s use of leverage (whether or not those assets are reflected in the Fund’s financial statements for purposes of generally accepted accounting principles), and derivatives will be valued at their market value.
Under normal circumstances:
| • | The Fund may invest without limit in high yielding, low- to medium-quality municipal securities (low- to medium-quality municipal securities are municipal securities rated Baa/BBB or lower) rated by at least one NRSRO at the time of investment or are unrated but judged by the Fund’s sub-adviser to be of comparable quality. |
| • | The Fund may invest no more than 30% of its Managed Assets in municipal securities that, at the time of investment, either are rated CCC+/Caa1 or lower, or are unrated but judged by the Fund’s sub-adviser to be of comparable quality. |
| • | The Fund may invest no more than 10% of its Managed Assets in defaulted securities or in the securities of an issuer that is in bankruptcy or insolvency proceedings. |
Approving Changes in Investment Policies
The Board of Trustees of the Fund may change a policy without a shareholder vote. However, with respect to the Fund’s policy of investing at least 80% of its Assets in municipal securities, the income from which is exempt from regular federal income taxes, such policy may not be changed without 60 days’ prior written notice and the approval of the holders of a majority of the outstanding common shares and preferred shares voting together as a single class, and the approval of the holders of a majority of the outstanding preferred shares, voting separately as a single class.
Portfolio Contents
The Fund generally invests in municipal securities. Municipal securities include municipal bonds, notes, securities issued to finance and refinance public projects, certificates of participation, variable rate demand obligations, lease obligations, municipal notes, pre-refunded municipal bonds, private activity bonds, securities issued by TOB Trusts, including inverse floating rate securities, and other forms of municipal bonds and securities, and other related instruments that create exposure to municipal bonds, notes and securities that provide for the payment of interest income that is exempt from regular U.S. federal income tax.
192
Municipal securities are debt obligations generally issued by states, cities and local authorities and certain possessions and territories of the United States (such as Puerto Rico and Guam) to finance or refinance public purpose projects such as roads, schools, and water supply systems.
The Fund may invest in municipal securities that are additionally secured by insurance, bank credit agreements or escrow accounts.
The Fund may invest in municipal securities that represent lease obligations and certificates of participation in such leases. A municipal lease is an obligation in the form of a lease or installment purchase that is issued by a state or local government to acquire equipment and facilities. Income from such obligations generally is exempt from state and local taxes in the state of issuance. A certificate of participation represents an undivided interest in an unmanaged pool of municipal leases, an installment purchase agreement or other instruments. The certificates typically are issued by a municipal agency, a trust or other entity that has received an assignment of the payments to be made by the state or political subdivision under such leases or installment purchase agreements. Such certificates provide the Fund with the right to a pro rata undivided interest in the underlying municipal securities. In addition, such participations generally provide the Fund with the right to demand payment, on not more than seven days’ notice, of all or any part of the Fund’s participation interest in the underlying municipal securities, plus accrued interest.
The Fund may invest in “tobacco settlement bonds.” Tobacco settlement bonds are municipal securities that are secured or payable solely from the collateralization of the proceeds from class action or other litigation against the tobacco industry.
The Fund may invest in inverse floating rate securities issued by a TOB trust, the interest rate on which varies inversely with the Securities Industry Financial Markets Association short-term rate, which resets weekly, or a similar short-term rate, and is reduced by the expenses related to the TOB trust. Typically, inverse floating rate securities represent beneficial interests in a special purpose trust (sometimes called a TOB trust) formed by a third party sponsor for the purpose of holding municipal bonds. Inverse floating rate securities may increase or decrease in value at a greater rate than the underlying interest rate on the municipal bond held by the TOB trust, which effectively leverages the Fund’s investment.
The Fund may invest in zero coupon bonds. A zero coupon bond is a bond that typically does not pay interest for the entire life of the obligation or for an initial period after the issuance of the obligation.
The Fund may invest in illiquid securities (i.e., securities that are not readily marketable), including, but not limited to, restricted securities (securities the disposition of which is restricted under the federal securities laws), securities that may be resold only pursuant to Rule 144A under the 1933 Act, and repurchase agreements with maturities in excess of seven days.
The Fund may enter into certain derivative instruments in pursuit of its investment objectives, including to seek to enhance return, to hedge certain risks of its investments in fixed-income securities or as a substitute for a position in the underlying asset. Such instruments include financial futures contracts, swap contracts (including interest rate and credit default swaps), options on financial futures, options on swap contracts or other derivative instruments.
The Fund may also invest in securities of other open- or closed-end investment companies (including ETFs) that invest primarily in municipal securities of the types in which the Fund may invest directly, to the extent permitted by the 1940 Act, the rules and regulations issued thereunder and applicable exemptive orders issued by the SEC.
Use of Leverage
The Fund uses leverage to pursue its investment objectives. The Fund may use leverage to the extent permitted by the 1940 Act. The Fund may source leverage through a number of methods including the issuance of Preferred Shares, investments in inverse floating rate securities, entering into reverse repurchase agreements (effectively a secured borrowing), or a combination of both. In addition, the Fund may also use certain derivatives that have the economic effect of leverage by creating additional investment exposure. The amount and sources of leverage will vary depending on market conditions.
Temporary Defensive Periods
During temporary defensive periods (e.g., times when, in the Fund’s investment adviser’s and/or the Fund’s sub-adviser’s opinion, temporary imbalances of supply and demand or other temporary dislocations in the tax-exempt bond market adversely affect the price at which long-term or intermediate-term municipal securities are available), and in order to keep the Fund’s cash fully invested, the Fund may invest any percentage of its Managed Assets in short-term investments including high quality, short-term debt securities that may be either tax-exempt or taxable. The Fund may not achieve its investment objectives during such periods.
NUVEEN DYNAMIC MUNICIPAL OPPORTUNITIES FUND (NDMO)
Investment Objective
The Fund’s investment objective is to seek total return through income exempt from regular federal income taxes and capital appreciation.
193
Shareholder Update (Unaudited) (continued)
Investment Policies
Under normal circumstances, the Fund will invest at least 80% of its Assets (as defined below) in municipal securities, the income from which is exempt from regular federal income taxes.
“Assets” means net assets of the Fund plus the amount of any borrowings for investment purposes. “Managed Assets” means the total assets of the Fund, minus the sum of its accrued liabilities (other than Fund liabilities incurred for the express purpose of creating leverage). Total assets for this purpose shall include assets attributable to the Fund’s use of leverage (whether or not those assets are reflected in the Fund’s financial statements for purposes of generally accepted accounting principles), and derivatives will be valued at their market value.
Under normal circumstances:
| • | The Fund may invest in municipal securities of any credit quality and without limit in below investment grade municipal securities (municipal securities rated BB+/Ba1 or lower) rated by at least one NRSRO at the time of investment or are unrated but judged by the Fund’s sub-adviser to be of comparable quality. |
| • | The Fund may invest up to 20% of its Managed Assets in taxable debt obligations, including taxable municipal securities. |
| • | The Fund may invest no more than 10% of its Managed Assets in defaulted securities or in the securities of an issuer that is in bankruptcy or insolvency proceedings. This policy does not apply in connection with any workout of an issuer of a debt security that the Fund already owns. |
Approving Changes in Investment Policies
The Board of Trustees of the Fund may change a policy without a shareholder vote. However, with respect to the Fund’s fundamental policy of investing at least 80% of its Assets in municipal securities, the income from which is exempt from regular federal income taxes, such policy may not be changed without 60 days’ prior written notice and the approval of the holders of a majority of the outstanding common shares and preferred shares voting together as a single class, and the approval of the holders of a majority of the outstanding preferred shares, voting separately as a single class.
Portfolio Contents
The Fund generally invests its assets in a portfolio of municipal securities of any credit quality and maturity. Municipal securities include municipal bonds, notes, securities issued to finance and refinance public projects, certificates of participation, variable rate demand obligations, lease obligations, municipal notes, pre-refunded municipal bonds, private activity bonds, securities issued by TOB Trusts, including inverse floating rate securities, and other forms of municipal bonds and securities, and other related instruments that create exposure to municipal bonds, notes and securities that provide for the payment of interest income that is exempt from regular U.S. federal income tax.
Municipal securities are debt obligations generally issued by states, cities and local authorities and certain possessions and territories of the United States (such as Puerto Rico and Guam) to finance or refinance public purpose projects such as roads, schools, and water supply systems.
The Fund may invest in municipal securities that are additionally secured by insurance, bank credit agreements or escrow accounts.
The Fund may also invest in AMT Bonds. AMT Bonds may trigger adverse tax consequences for Fund shareholders who are subject to the federal alternative minimum tax.
The Fund may invest in municipal securities that represent lease obligations and certificates of participation in such leases. A municipal lease is an obligation in the form of a lease or installment purchase that is issued by a state or local government to acquire equipment and facilities. Income from such obligations generally is exempt from state and local taxes in the state of issuance. A certificate of participation represents an undivided interest in an unmanaged pool of municipal leases, an installment purchase agreement or other instruments. The certificates typically are issued by a municipal agency, a trust or other entity that has received an assignment of the payments to be made by the state or political subdivision under such leases or installment purchase agreements. Such certificates provide the Fund with the right to a pro rata undivided interest in the underlying municipal securities. In addition, such participations generally provide the Fund with the right to demand payment, on not more than seven days’ notice, of all or any part of the Fund’s participation interest in the underlying municipal securities, plus accrued interest.
The Fund may invest in “tobacco settlement bonds.” Tobacco settlement bonds are municipal securities that are secured or payable solely from the collateralization of the proceeds from class action or other litigation against the tobacco industry.
The Fund may invest in inverse floating rate securities issued by a TOB trust, the interest rate on which varies inversely with the Securities Industry Financial Markets Association short-term rate, which resets weekly, or a similar short-term rate, and is reduced by the expenses related to the TOB trust. Typically, inverse floating rate securities represent beneficial interests in a special purpose trust (sometimes called a TOB trust) formed by a third party sponsor for the purpose of holding municipal bonds. Inverse floating rate securities may increase or decrease in value at a greater rate than the underlying interest rate on the municipal bond held by the TOB trust, which effectively leverages the Fund’s investment.
194
The Fund may invest in zero coupon bonds. A zero coupon bond is a bond that typically does not pay interest for the entire life of the obligation or for an initial period after the issuance of the obligation.
The Fund may invest in illiquid securities (i.e., securities that are not readily marketable), including, but not limited to, restricted securities (securities the disposition of which is restricted under the federal securities laws), securities that may be resold only pursuant to Rule 144A under the 1933 Act, and repurchase agreements with maturities in excess of seven days.
The Fund may invest without limitation in credit default swaps, and may enter into credit default swaps as either a buyer or a seller. The credit default swaps in which the Fund may invest (or sell) include those in which the underlying reference instrument is the debt obligation of a single reference issuer (“single-name CDS”). Unlike other types of credit default swaps, single-name CDS do not have the benefit of diversification across many issuers.
In addition to credit default swaps, the Fund may enter into certain derivative instruments in pursuit of its investment objective, including to seek to enhance return, to hedge certain risks of its investments in fixed-income securities, to attempt to manage the effective maturity or duration of securities in the Fund’s portfolio or as a substitute for a position in the underlying asset. Such instruments include financial futures contracts, swap contracts (including interest rate and credit default swaps), options on financial futures, options on swap contracts or other derivative instruments.
The Fund may also invest in securities of other open- or closed-end investment companies (including ETFs) that invest primarily in municipal securities of the types in which the Fund may invest directly, to the extent permitted by the 1940 Act, the rules and regulations issued thereunder and applicable exemptive orders issued by the SEC.
Use of Leverage
The Fund uses leverage to pursue its investment objective. The Fund may use leverage to the extent permitted by the 1940 Act. The Fund may source leverage through a number of methods including through borrowings, issuing Preferred Shares, the issuance of debt securities, entering into reverse repurchase agreements (effectively a borrowing), and investments in inverse floating rate securities. In addition, the Fund may also use certain derivatives that have the economic effect of leverage by creating additional investment exposure. The amount and sources of leverage will vary depending on market conditions.
Temporary Defensive Periods
During temporary defensive periods or in order to help keep the Fund’s assets fully invested, including during the period within which the net proceeds of an offering of Securities are first being invested, the Fund may deviate from its investment policies and objectives. During such periods, the Fund may invest any percentage of its Managed Assets in short-term investments, including high quality, short-term debt securities that may be either tax-exempt or taxable. The Fund may not achieve its investment objectives during such periods.
195
Shareholder Update (Unaudited) (continued)
PRINCIPAL RISKS OF THE FUNDS
The factors that are most likely to have a material effect on a particular Fund’s portfolio as a whole are called “principal risks.” Each Fund is subject to the principal risks indicated below, whether through direct investment or derivative positions. Each Fund may be subject to additional risks other than those identified and described below because the types of investments made by a Fund can change over time.
| | | | Nuveen Municipal | Nuveen Dynamic |
| Nuveen AMT-Free | Nuveen Municipal | Nuveen Municipal | Credit | Municipal |
| Municipal Credit | Credit Income | High Income | Opportunities | Opportunities |
| Income Fund | Fund | Opportunity Fund | Fund | Fund |
| Risk | (NVG) | (NZF) | (NMZ) | (NMCO) | (NDMO) |
| Portfolio Level Risks | | | | | |
Alternative Minimum Tax Risk | — | X | X | X | X |
Below Investment Grade Risk | X | X | X | X | X |
Call Risk | X | X | X | X | X |
Credit Risk | X | X | X | X | X |
Credit Spread Risk | X | X | X | X | X |
Defaulted and Distressed Securities Risk | — | — | X | X | X |
Deflation Risk | X | X | X | X | X |
Derivatives Risk | X | X | X | X | X |
Distressed Securities Risk | X | X | — | — | — |
Duration Risk | X | X | X | X | X |
Economic Sector Risk | X | X | X | X | X |
Financial Futures and Options Risk | X | X | X | X | X |
Hedging Risk | X | X | X | X | X |
Illiquid Investments Risk | X | X | X | X | X |
Income Risk | X | X | X | X | X |
Inflation Risk | X | X | X | X | X |
Insurance Risk | X | X | X | X | X |
Interest Rate Risk | X | X | X | X | X |
Inverse Floating Rate Securities Risk | X | X | X | X | X |
Municipal Securities Market Liquidity Risk | X | X | X | X | X |
Municipal Securities Market Risk | X | X | X | X | X |
Other Investment Companies Risk | X | X | X | X | X |
Puerto Rico Municipal Securities Market Risk | X | X | X | X | X |
Reinvestment Risk | X | X | X | X | X |
Sector and Industry Risk | X | X | X | X | X |
Sector Focus Risk | X | X | X | X | X |
Special Risks Related to Certain Municipal Obligations | X | X | X | X | X |
Swap Transactions Risk | X | X | X | X | X |
Tax Risk | X | X | X | X | X |
Taxability Risk | X | X | X | X | X |
Tobacco Settlement Bond Risk | X | X | X | X | X |
Valuation Risk | X | X | X | X | X |
Zero Coupon Bonds Risk | X | X | X | X | X |
196
| | | | | | |
| | | | Nuveen Municipal | Nuveen Dynamic |
| Nuveen AMT-Free | Nuveen Municipal | Nuveen Municipal | Credit | Municipal |
| Municipal Credit | Credit Income | High Income | Opportunities | Opportunities |
| Income Fund | Fund | Opportunity Fund | Fund | Fund |
| Risk | (NVG) | (NZF) | (NMZ) | (NMCO) | (NDMO) |
| Fund Level and Other Risks | | | | | |
Anti-Takeover Provisions | X | X | X | X | X |
Counterparty Risk | X | X | X | X | X |
Cybersecurity Risk | X | X | X | X | X |
Economic and Political Events Risk | X | X | X | X | X |
Global Economic Risk | X | X | X | X | X |
Investment and Market Risk | X | X | X | X | X |
Legislation and Regulatory Risk | X | X | X | X | X |
Leverage Risk | X | X | X | X | X |
Limited Term and Tender Offer Risks | — | — | — | X | X |
Market Discount from Net Asset Value | X | X | X | X | X |
Recent Market Conditions | X | X | X | X | X |
Reverse Repurchase Agreement Risk | X | X | X | X | X |
Portfolio Level Risks:
Alternative Minimum Tax Risk. The Fund may invest in AMT Bonds. Therefore, a portion of the Fund’s otherwise exempt-interest dividends may be taxable to those shareholders subject to the federal alternative minimum tax.
Below Investment Grade Risk. Municipal securities of below investment grade quality are regarded as having speculative characteristics with respect to the issuer’s capacity to pay interest and repay principal, and may be subject to higher price volatility and default risk than investment grade municipal securities of comparable terms and duration. Issuers of lower grade municipal securities may be highly leveraged and may not have available to them more traditional methods of financing. The prices of these lower grade securities are typically more sensitive to negative developments, such as a decline in the issuer’s revenues or a general economic downturn. The secondary market for lower rated municipal securities may not be as liquid as the secondary market for more highly rated municipal securities, a factor which may have an adverse effect on the Fund’s ability to dispose of a particular municipal security. If a below investment grade municipal security goes into default, or its issuer enters bankruptcy, it might be difficult to sell that security in a timely manner at a reasonable price.
Call Risk. The Fund may invest in municipal securities that are subject to call risk. Such municipal securities may be redeemed at the option of the issuer, or “called,” before their stated maturity or redemption date. In general, an issuer will call its instruments if they can be refinanced by issuing new instruments that bear a lower interest rate. The Fund is subject to the possibility that during periods of falling interest rates, an issuer will call its high yielding municipal securities. The Fund would then be forced to invest the unanticipated proceeds at lower interest rates, resulting in a decline in the Fund’s income.
Credit Risk. Issuers of municipal securities in which the Fund may invest may default on their obligations to pay principal or interest when due. This non-payment would result in a reduction of income to the Fund, a reduction in the value of a municipal security experiencing non-payment and potentially a decrease in the net asset value (“NAV”) of the Fund. To the extent that the credit rating assigned to a municipal security in the Fund’s portfolio is downgraded, the market price and liquidity of such security may be adversely affected.
Credit Spread Risk. Credit spread risk is the risk that credit spreads (i.e., the difference in yield between securities that is due to differences in their credit quality) may increase when the market believes that municipal securities generally have a greater risk of default. Increasing credit spreads may reduce the market values of the Fund’s securities. Credit spreads often increase more for lower rated and unrated securities than for investment grade securities. In addition, when credit spreads increase, reductions in market value will generally be greater for longer-maturity securities.
Defaulted and Distressed Securities Risk. The Fund may invest in securities of an issuer that is in default or that is in bankruptcy or insolvency proceedings at the time of purchase. In addition, the Fund may hold investments that at the time of purchase are not in default or involved in bankruptcy or insolvency proceedings, but may later become so. Moreover, the Fund may invest in low-rated securities that, although not in default, may be “distressed,” meaning that the issuer is experiencing financial difficulties or distress at the time of acquisition. Such securities would present a substantial risk of future default which may cause the Fund to incur losses, including additional expenses, to the extent it is required to seek recovery upon a default in the payment of principal or interest on those securities. In any reorganization or liquidation proceeding relating to a portfolio security, the Fund may lose its entire investment or may be required to accept cash or securities with a value less than its original investment. Defaulted or distressed securities may be subject to restrictions on resale.
197
Shareholder Update (Unaudited) (continued)
Deflation Risk. Deflation risk is the risk that prices throughout the economy decline over time. Deflation may have an adverse effect on the creditworthiness of issuers and may make issuer default more likely, which may result in a decline in the value of the Fund’s portfolio.
Derivatives Risk. The use of derivatives involves additional risks and transaction costs which could leave the Fund in a worse position than if it had not used these instruments. Derivative instruments can be used to acquire or to transfer the risk and returns of a municipal security or other asset without buying or selling the municipal security or asset. These instruments may entail investment exposures that are greater than their cost would suggest. As a result, a small investment in derivatives can result in losses that greatly exceed the original investment. Derivatives can be highly volatile, illiquid and difficult to value. An over-the-counter derivative transaction between the Fund and a counterparty that is not cleared through a central counterparty also involves the risk that a loss may be sustained as a result of the failure of the counterparty to the contract to make required payments. The payment obligation for a cleared derivative transaction is guaranteed by a central counterparty, which exposes the Fund to the creditworthiness of the central counterparty.
It is possible that developments in the derivatives market, including changes in government regulation, could adversely impact the Fund’s ability to invest in certain derivatives.
Distressed Securities Risk. The Fund may invest in low-rated securities or securities unrated but judged by the sub-adviser to be of comparable quality. Some or many of these low-rated securities, although not in default, may be “distressed,” meaning that the issuer is experiencing financial difficulties or distress at the time of acquisition. Such securities would present a substantial risk of future default which may cause the Fund to incur losses, including additional expenses, to the extent it is required to seek recovery upon a default in the payment of principal or interest on those securities. In any reorganization or liquidation proceeding relating to a portfolio security, the Fund may lose its entire investment or may be required to accept cash or securities with a value less than its original investment. Distressed securities may be subject to restrictions on resale.
Duration Risk. Duration is the sensitivity, expressed in years, of the price of a fixed-income security to changes in the general level of interest rates (or yields). Securities with longer durations tend to be more sensitive to interest rate (or yield) changes, which typically corresponds to increased volatility and risk, than securities with shorter durations. For example, if a security or portfolio has a duration of three years and interest rates increase by 1%, then the security or portfolio would decline in value by approximately 3%. Duration differs from maturity in that it considers potential changes to interest rates, and a security’s coupon payments, yield, price and par value and call features, in addition to the amount of time until the security matures. The duration of a security will be expected to change over time with changes in market factors and time to maturity.
Economic Sector Risk. The Fund may invest a significant amount of its total assets in municipal securities in the same economic sector. This may make the Fund more susceptible to adverse economic, political or regulatory occurrences affecting an economic sector. As concentration increases, so does the potential for fluctuation in the value of the Fund’s assets. In addition, the Fund may invest a significant portion of its assets in certain sectors of the municipal securities market, such as health care facilities, private educational facilities, special taxing districts and start-up utility districts, and private activity bonds including industrial development bonds on behalf of transportation companies, whose credit quality and performance may be more susceptible to economic, business, political, regulatory and other developments than other sectors of municipal issuers. If the Fund invests a significant portion of its assets in the sectors noted above, the Fund’s performance may be subject to additional risk and variability.
Financial Futures and Options Transactions Risk. The Fund may use certain transactions for hedging the portfolio’s exposure to credit risk and the risk of increases in interest rates, which could result in poorer overall performance for the Fund. There may be an imperfect correlation between price movements of the futures and options and price movements of the portfolio securities being hedged.
If the Fund engages in futures transactions or in the writing of options on futures, it will be required to maintain initial margin and maintenance margin and may be required to make daily variation margin payments in accordance with applicable rules of the exchanges and the Commodity Futures Trading Commission (“CFTC”). If the Fund purchases a financial futures contract or a call option or writes a put option in order to hedge the anticipated purchase of municipal securities, and if the Fund fails to complete the anticipated purchase transaction, the Fund may have a loss or a gain on the futures or options transaction that will not be offset by price movements in the municipal securities that were the subject of the anticipatory hedge. There can be no assurance that a liquid market will exist at a time when the Fund seeks to close out a derivatives or futures or a futures option position, and the Fund would remain obligated to meet margin requirements until the position is closed.
Hedging Risk. The Fund’s use of derivatives or other transactions to reduce risk involves costs and will be subject to the investment adviser’s and/or the sub-adviser’s ability to predict correctly changes in the relationships of such hedge instruments to the Fund’s portfolio holdings or other factors. No assurance can be given that the investment adviser’s and/or the sub-adviser’s judgment in this respect will be correct, and no assurance can be given that the Fund will enter into hedging or other transactions at times or under circumstances in which it may be advisable to do so. Hedging activities may reduce the Fund’s opportunities for gain by offsetting the positive effects of favorable price movements and may result in net losses.
Illiquid Investments Risk. Illiquid investments are investments that are not readily marketable and may include restricted securities, which are securities that may not be resold unless they have been registered under the 1933 Act or that can be sold in a private transaction pursuant to an available exemption from such registration. Illiquid investments involve the risk that the investments will not be able to be sold at the time desired by the Fund or at prices approximating the value at which the Fund is carrying the investments on its books from time to time.
198
Income Risk. The Fund’s income could decline due to falling market interest rates. This is because, in a falling interest rate environment, the Fund generally will have to invest the proceeds from maturing portfolio securities in lower-yielding securities.
Inflation Risk. Inflation risk is the risk that the value of assets or income from investments will be worth less in the future as inflation decreases the value of money. As inflation increases, the real value of the common shares and distributions can decline.
Insurance Risk. The Fund may purchase municipal securities that are secured by insurance, bank credit agreements or escrow accounts. The credit quality of the companies that provide such credit enhancements will affect the value of those securities. Certain significant providers of insurance for municipal securities have incurred significant losses as a result of exposure to sub-prime mortgages and other lower credit quality investments. As a result, such losses reduced the insurers’ capital and called into question their continued ability to perform their obligations under such insurance if they are called upon to do so in the future. While an insured municipal security will typically be deemed to have the rating of its insurer, if the insurer of a municipal security suffers a downgrade in its credit rating or the market discounts the value of the insurance provided by the insurer, the value of the municipal security would more closely, if not entirely, reflect such rating. In such a case, the value of insurance associated with a municipal security may not add any value. The insurance feature of a municipal security does not guarantee the full payment of principal and interest through the life of an insured obligation, the market value of the insured obligation or the NAV of the common shares represented by such insured obligation.
Interest Rate Risk. Interest rate risk is the risk that municipal securities in the Fund’s portfolio will decline in value because of changes in market interest rates. Generally, when market interest rates rise, the market value of such securities will fall, and vice versa. As interest rates decline, issuers of municipal securities may prepay principal earlier than scheduled, forcing the Fund to reinvest in lower-yielding securities and potentially reducing the Fund’s income. As interest rates increase, slower than expected principal payments may extend the average life of municipal securities, potentially locking in a below-market interest rate and reducing the Fund’s value. In typical market interest rate environments, the prices of longer-term municipal securities generally fluctuate more than prices of shorter-term municipal securities as interest rates change.
Inverse Floating Rate Securities Risk. The Fund may invest in inverse floating rate securities. In general, income on inverse floating rate securities will decrease when short-term interest rates increase and increase when short-term interest rates decrease. Investments in inverse floating rate securities may subject the Fund to the risks of reduced or eliminated interest payments and losses of principal. In addition, inverse floating rate securities may increase or decrease in value at a greater rate than the underlying interest rate, which effectively leverages the Fund’s investment. As a result, the market value of such securities generally will be more volatile than that of fixed rate securities.
The Fund may invest in inverse floating rate securities issued by special purpose trusts that have recourse to the Fund. In such instances, the Fund may be at risk of loss that exceeds its investment in the inverse floating rate securities.
The Fund may be required to sell its inverse floating rate securities at less than favorable prices, or liquidate other Fund portfolio holdings in certain circumstances, including, but not limited to, the following:
| • | If the Fund has a need for cash and the securities in a special purpose trust are not actively trading due to adverse market conditions; |
| • | If special purpose trust sponsors (as a collective group or individually) experience financial hardship and consequently seek to terminate their respective outstanding special purpose trusts; and |
| • | If the value of an underlying security declines significantly and if additional collateral has not been posted by the Fund. |
Municipal Securities Market Liquidity Risk. Inventories of municipal securities held by brokers and dealers have decreased in recent years, lessening their ability to make a market in these securities. This reduction in market making capacity has the potential to decrease the Fund’s ability to buy or sell municipal securities at attractive prices, and increase municipal security price volatility and trading costs, particularly during periods of economic or market stress. In addition, recent federal banking regulations may cause certain dealers to reduce their inventories of municipal securities, which may further decrease the Fund’s ability to buy or sell municipal securities. As a result, the Fund may be forced to accept a lower price to sell a security, to sell other securities to raise cash, or to give up an investment opportunity, any of which could have a negative effect on performance. If the Fund needed to sell large blocks of municipal securities to raise cash to meet its obligations, those sales could further reduce the municipal securities’ prices and hurt performance.
Municipal Securities Market Risk. The amount of public information available about the municipal securities in the Fund’s portfolio is generally less than that for corporate equities or bonds, and the investment performance of the Fund may therefore be more dependent on the analytical abilities of the sub-adviser than if the Fund were a stock fund or taxable bond fund. The secondary market for municipal securities, particularly below investment grade municipal securities, also tends to be less well-developed or liquid than many other securities markets, which may adversely affect the Fund’s ability to sell its municipal securities at attractive prices.
Other Investment Companies Risk. The Fund may invest in the securities of other investment companies, including ETFs. Investing in an investment company exposes the Fund to all of the risks of that investment company’s investments. The Fund, as a holder of the securities of other investment companies, will bear its pro rata portion of the other investment companies’ expenses, including advisory fees. These expenses are in addition to the direct expenses of the Fund’s own operations. As a result, the cost of investing in investment company shares may exceed the costs of investing directly
199
Shareholder Update (Unaudited) (continued)
in its underlying investments. In addition, securities of other investment companies may be leveraged. As a result, the Fund may be indirectly exposed to leverage through an investment in such securities and therefore magnify the Fund’s leverage risk.
With respect to ETF’s, an ETF that is based on a specific index may not be able to replicate and maintain exactly the composition and relative weighting of securities in the index. The value of an ETF based on a specific index is subject to change as the values of its respective component assets fluctuate according to market volatility. ETFs typically rely on a limited pool of authorized participants to create and redeem shares, and an active trading market for ETF shares may not develop or be maintained. The market value of shares of ETFs and closed-end funds may differ from their NAV.
Puerto Rico Municipal Securities Market Risk. To the extent that the Fund invests a significant portion of its assets in the securities issued by the Commonwealth of Puerto Rico or its political subdivisions, agencies, instrumentalities, or public corporations (collectively referred to as “Puerto Rico” or the “Commonwealth”), it will be disproportionally affected by political, social and economic conditions and developments in the Commonwealth. In addition, economic, political or regulatory changes in that territory could adversely affect the value of the Fund’s investment portfolio.
Puerto Rico currently is experiencing significant fiscal and economic challenges, including substantial debt service obligations, high levels of unemployment, underfunded public retirement systems, and persistent government budget deficits. These challenges may negatively affect the value of the Fund’s investments in Puerto Rican municipal securities. Several major ratings agencies have downgraded the general obligation debt of Puerto Rico to below investment grade and continue to maintain a negative outlook for this debt, which increases the likelihood that the rating will be lowered further. Puerto Rico recently defaulted on its debt by failing to make full payment due on its outstanding bonds, and there can be no assurance that Puerto Rico will be able to satisfy its future debt obligations. Further downgrades or defaults may place additional strain on the Puerto Rico economy and may negatively affect the value, liquidity, and volatility of the Fund’s investments in Puerto Rican municipal securities. Additionally, numerous issuers have entered Title III of the Puerto Rico Oversite, Management and Economic Stability Act (“PROMESA”), which is similar to bankruptcy protection, through which the Commonwealth of Puerto Rico can restructure its debt. However, Puerto Rico’s case is the first ever heard under PROMESA and there is no existing case precedent to guide the proceedings. Accordingly, Puerto Rico’s debt restructuring process could take significantly longer than traditional municipal bankruptcy proceedings. Further, it is not clear whether a debt restructuring process will ultimately be approved or, if so, the extent to which it will apply to Puerto Rico municipal securities sold by an issuer other than the territory. A debt restructuring could reduce the principal amount due, the interest rate, the maturity, and other terms of Puerto Rico municipal securities, which could adversely affect the value of Puerto Rican municipal securities. Legislation that would allow Puerto Rico to restructure its municipal debt obligations, thus increasing the risk that Puerto Rico may never pay off municipal indebtedness, or may pay only a small fraction of the amount owed, could also impact the value of the Fund’s investments in Puerto Rican municipal securities.
These challenges and uncertainties have been exacerbated by multiple hurricanes and the resulting natural disasters that have stuck Puerto Rico since 2017. The full extent of the natural disasters’ impact on Puerto Rico’s economy and foreign investment in Puerto Rico is difficult to estimate.
Reinvestment Risk. Reinvestment risk is the risk that income from the Fund’s portfolio will decline if and when the Fund invests the proceeds from matured, traded or called municipal securities at market interest rates that are below the portfolio’s current earnings rate. A decline in income could affect the common shares’ market price, NAV and/or a common shareholder’s overall returns.
Sector and Industry Risk. Subject to the concentration limits of the Fund’s investment policies and guidelines, a Fund may invest a significant portion of its net assets in certain sectors of the municipal securities market, such as hospitals and other health care facilities, charter schools and other private educational facilities, special taxing districts and start-up utility districts, and private activity bonds including industrial development bonds on behalf of transportation companies such as airline companies, whose credit quality and performance may be more susceptible to economic, business, political, regulatory and other developments than other sectors of municipal issuers. If the Fund invests a significant portion of its net assets in the sectors noted above, the Fund’s performance may be subject to additional risk and variability.
Sector Focus Risk. At times, the Fund may focus its investments (i.e., overweight its investments relative to the overall municipal securities market) in one or more particular sectors, which may subject the Fund to additional risk and variability. Securities issued in the same sector may be similarly affected by economic or market events, making the Fund more vulnerable to unfavorable developments in that sector than funds that invest more broadly. As the percentage of the Fund’s Managed Assets invested in a particular sector increases, so does the potential for fluctuation in the NAV of the Fund’s common shares.
Special Risks Related to Certain Municipal Obligations. Municipal leases and certificates of participation involve special risks not normally associated with general obligations or revenue bonds. Leases and installment purchase or conditional sale contracts (which normally provide for title to the leased asset to pass eventually to the governmental issuer) have evolved as a means for governmental issuers to acquire property and equipment without meeting the constitutional and statutory requirements for the issuance of debt. The debt issuance limitations are deemed to be inapplicable because of the inclusion in many leases or contracts of “non-appropriation” clauses that relieve the governmental issuer of any obligation to make future payments under the lease or contract unless money is appropriated for such purpose by the appropriate legislative body. In addition, such leases or contracts may be subject to the temporary abatement of payments in the event that the governmental issuer is prevented from maintaining occupancy of the leased premises or utilizing the leased equipment. Although the obligations may be secured by the leased equipment or facilities, the disposition of the property in the event of non-appropriation or foreclosure might prove difficult, time consuming and costly, and may result in a delay in recovering or
200
the failure to fully recover the Fund’s original investment. In the event of non-appropriation, the issuer would be in default and taking ownership of the assets may be a remedy available to the Fund, although the Fund does not anticipate that such a remedy would normally be pursued.
Certificates of participation involve the same risks as the underlying municipal leases. In addition, the Fund may be dependent upon the municipal authority issuing the certificates of participation to exercise remedies with respect to the underlying securities. Certificates of participation also entail a risk of default or bankruptcy, both of the issuer of the municipal lease and also the municipal agency issuing the certificate of participation.
Swap Transactions Risk. The Fund may enter into debt-related derivative instruments such as credit default swap contracts and interest rate swaps. Like most derivative instruments, the use of swaps is a highly specialized activity that involves investment techniques and risks different from those associated with ordinary portfolio securities transactions. In addition, the use of swaps requires an understanding by the adviser and/or the sub-adviser of not only the referenced asset, rate or index, but also of the swap itself. If the investment adviser and/or the sub-adviser is incorrect in its forecasts of default risks, market spreads or other applicable factors or events, the investment performance of the Fund would diminish compared with what it would have been if these techniques were not used.
Tax Risk. The value of the Fund’s investments and its NAV may be adversely affected by changes in tax rates, rules and policies. Because interest income from municipal securities is normally not subject to regular federal income taxation, the attractiveness of municipal securities in relation to other investment alternatives is affected by changes in federal income tax rates or changes in the tax exempt status of interest income from municipal securities. Additionally, the Fund is not a suitable investment for individual retirement accounts, for other tax exempt or tax-deferred accounts, for investors who are not sensitive to the federal income tax consequences of their investments.
Taxability Risk. The Fund will invest in municipal securities in reliance at the time of purchase on an opinion of bond counsel to the issuer that the interest paid on those securities will be excludable from gross income for regular federal income tax purposes, and the sub-adviser will not independently verify that opinion. Subsequent to the Fund’s acquisition of such a municipal security, however, the security may be determined to pay, or to have paid, taxable income. As a result, the treatment of dividends previously paid or to be paid by the Fund as “exempt-interest dividends” could be adversely affected, subjecting the Fund’s shareholders to increased federal income tax liabilities. Certain other investments made by the Fund, including derivatives transactions, may result in the receipt of taxable income or gains by the Fund.
Tobacco Settlement Bond Risk. The Fund may invest in tobacco settlement bonds. Tobacco settlement bonds are municipal securities that are backed solely by expected revenues to be derived from lawsuits involving tobacco related deaths and illnesses which were settled between certain states and American tobacco companies. Tobacco settlement bonds are secured by an issuing state’s proportionate share in the Master Settlement Agreement, an agreement between 46 states and nearly all of the U.S. tobacco manufacturers (the “MSA”). Under the terms of the MSA, the actual amount of future settlement payments by tobacco-manufacturers is dependent on many factors, including, among other things, reduced cigarette consumption. Payments made by tobacco manufacturers could be negatively impacted if the decrease in tobacco consumption is significantly greater than the forecasted decline.
Valuation Risk. The municipal securities in which the Fund invests typically are valued by a pricing service utilizing a range of market-based inputs and assumptions, including readily available market quotations obtained from broker-dealers making markets in such instruments, cash flows and transactions for comparable instruments. There is no assurance that the Fund will be able to sell a portfolio security at the price established by the pricing service, which could result in a loss to the Fund. Pricing services generally price municipal securities assuming orderly transactions of an institutional “round lot” size, but some trades may occur in smaller, “odd lot” sizes, often at lower prices than institutional round lot trades. Different pricing services may incorporate different assumptions and inputs into their valuation methodologies, potentially resulting in different values for the same securities. As a result, if the Fund were to change pricing services, or if the Fund’s pricing service were to change its valuation methodology, there could be a material impact, either positive or negative, on the Fund’s NAV.
Zero Coupon Bonds Risk. Because interest on zero coupon bonds is not paid on a current basis, the values of zero coupon bonds will be more volatile in response to interest rate changes than the values of bonds that distribute income regularly. Although zero coupon bonds generate income for accounting purposes, they do not produce cash flow, and thus the Fund could be forced to liquidate securities at an inopportune time in order to generate cash to distribute to shareholders as required by tax laws.
Fund Level and Other Risks:
Anti-Takeover Provisions. The Fund’s organizational documents include provisions that could limit the ability of other entities or persons to acquire control of the Fund or convert the Fund to open-end status. These provisions could have the effect of depriving the common shareholders of opportunities to sell their common shares at a premium over the then-current market price of the common shares.
Counterparty Risk. Changes in the credit quality of the companies that serve as the Fund’s counterparties with respect to derivatives or other transactions supported by another party’s credit will affect the value of those instruments. Certain entities that have served as counterparties in the markets for these transactions have incurred or may incur in the future significant financial hardships including bankruptcy and losses as a result of exposure to sub-prime mortgages and other lower-quality credit investments. As a result, such hardships have reduced these entities’ capital and called into question their continued ability to perform their obligations under such transactions. By using such derivatives or other transactions, the Fund
201
Shareholder Update (Unaudited) (continued)
assumes the risk that its counterparties could experience similar financial hardships. In the event of the insolvency of a counterparty, the Fund may sustain losses or be unable to liquidate a derivatives position.
Cybersecurity Risk. The Fund and its service providers are susceptible to operational and information security risk resulting from cyber incidents. Cyber incidents refer to both intentional attacks and unintentional events including: processing errors, human errors, technical errors including computer glitches and system malfunctions, inadequate or failed internal or external processes, market-wide technical-related disruptions, unauthorized access to digital systems (through “hacking” or malicious software coding), computer viruses, and cyber-attacks which shut down, disable, slow or otherwise disrupt operations, business processes or website access or functionality (including denial of service attacks). Cyber incidents could adversely impact the Fund and cause the Fund to incur financial loss and expense, as well as face exposure to regulatory penalties, reputational damage, and additional compliance costs associated with corrective measures. In addition, substantial costs may be incurred in order to prevent any cyber incidents in the future. Furthermore, the Fund cannot control the cybersecurity plans and systems put in place by its service providers or any other third parties whose operations may affect the Fund.
Economic and Political Events Risk. The Fund may be more sensitive to adverse economic, business or political developments if it invests a substantial portion of its assets in the municipal securities of similar projects (such as those relating to the education, health care, housing, transportation, or utilities industries), industrial development bonds, or in particular types of municipal securities (such as general obligation bonds, private activity bonds or moral obligation bonds). Such developments may adversely affect a specific industry or local political and economic conditions, and thus may lead to declines in the creditworthiness and value of such municipal securities.
Global Economic Risk. National and regional economies and financial markets are becoming increasingly interconnected, which increases the possibilities that conditions in one country, region or market might adversely impact issuers in a different country, region or market. Changes in legal, political, regulatory, tax and economic conditions may cause fluctuations in markets and securities prices around the world, which could negatively impact the value of the Fund’s investments. Major economic or political disruptions, particularly in large economies like China’s, may have global negative economic and market repercussions. Additionally, events such as war, terrorism, natural and environmental disasters and the spread of infectious illnesses or other public health emergencies may adversely affect the global economy and the markets and issuers in which the Fund invests. Recent examples of such events include the outbreak of a novel coronavirus known as COVID-19 that was first detected in China in December 2019 and heightened concerns regarding North Korea’s nuclear weapons and long-range ballistic missile programs. These events could reduce consumer demand or economic output, result in market closure, travel restrictions or quarantines, and generally have a significant impact on the economy. These events could also impair the information technology and other operational systems upon which the Fund’s service providers, including the investment adviser and sub-adviser, rely, and could otherwise disrupt the ability of employees of the Fund’s service providers to perform essential tasks on behalf of the Fund. Governmental and quasi-governmental authorities and regulators throughout the world have in the past responded to major economic disruptions with a variety of significant fiscal and monetary policy changes, including but not limited to, direct capital infusions into companies, new monetary programs and dramatically lower interest rates. An unexpected or quick reversal of these policies, or the ineffectiveness of these policies, could increase volatility in securities markets, which could adversely affect the Fund’s investments.
Investment and Market Risk. An investment in common shares is subject to investment risk, including the possible loss of the entire principal amount that you invest. Common shares frequently trade at a discount to their NAV. An investment in common shares represents an indirect investment in the securities owned by the Fund. Common shares at any point in time may be worth less than your original investment, even after taking into account the reinvestment of Fund dividends and distributions.
Legislation and Regulatory Risk. At any time after the date of this report, legislation or additional regulations may be enacted that could negatively affect the assets of the Fund, securities held by the Fund or the issuers of such securities. Fund shareholders may incur increased costs resulting from such legislation or additional regulation. There can be no assurance that future legislation, regulation or deregulation will not have a material adverse effect on the Fund or will not impair the ability of the Fund to achieve its investment objectives.
The SEC recently adopted rules governing the use of derivatives by registered investment companies, which could affect the nature and extent of derivatives used by the Fund. The full impact of such rules is uncertain at this time. It is possible that such rules, as interpreted, applied and enforced by the SEC, could limit the implementation of the Fund’s use of derivatives, which could have an adverse impact on the Fund.
Leverage Risk. The use of leverage creates special risks for common shareholders, including potential interest rate risks and the likelihood of greater volatility of NAV and market price of, and distributions on, the common shares. The use of leverage in a declining market will likely cause a greater decline in the Fund’s NAV, which may result at a greater decline of the common share price, than if the Fund were not to have used leverage.
The Fund will pay (and common shareholders will bear) any costs and expenses relating to the Fund’s use of leverage, which will result in a reduction in the Fund’s NAV. The investment adviser may, based on its assessment of market conditions and composition of the Fund’s holdings, increase or decrease the amount of leverage. Such changes may impact the Fund’s distributions and the price of the common shares in the secondary market.
The Fund may seek to refinance its leverage over time, in the ordinary course, as current forms of leverage mature or it is otherwise desirable to refinance; however, the form that such leverage will take cannot be predicted at this time. If the Fund is unable to replace existing leverage on
202
comparable terms, its costs of leverage will increase. Accordingly, there is no assurance that the use of leverage may result in a higher yield or return to common shareholders.
The amount of fees paid to the investment adviser and the sub-advisor for investment advisory services will be higher if the Fund uses leverage because the fees will be calculated based on the Fund’s Managed Assets - this may create an incentive for the investment adviser and the sub-advisor to leverage the Fund or increase the Fund’s leverage.
Limited Term and Tender Offer Risks. Because the assets of the Fund will be liquidated in connection with its termination or to pay for Common Shares tendered in an Eligible Tender Offer, the Fund may be required to sell portfolio securities when it otherwise would not, including at times when market conditions are not favorable, or at a time when a particular security is in default or bankruptcy, or otherwise in severe distress, which may cause the Fund to lose money.
The Fund may be required to dispose of portfolio investments in connection with any reduction in its outstanding leverage necessary in order to maintain its desired leverage ratios following an Eligible Tender Offer. It is likely that during the pendency of an Eligible Tender Offer, and possibly for a time thereafter, the Fund will hold a greater than normal percentage of its total assets in money market mutual funds, cash, cash equivalents, securities issued or guaranteed by the U.S. government or its instrumentalities or agencies, high quality, short-term money market instruments, short-term debt securities, certificates of deposit, bankers’ acceptances and other bank obligations, commercial paper or other liquid debt securities, which may adversely affect the Fund’s investment performance. If the tax basis for the portfolio investments sold is less than the sale proceeds, the Fund will recognize capital gains, which it will be required to distribute to Common Shareholders. In addition, the Fund’s purchase of tendered Common Shares pursuant to an Eligible Tender Offer will have tax consequences for tendering Common Shareholders and may have tax consequences for non-tendering Common Shareholders. All Common Shareholders remaining after an Eligible Tender Offer will be subject to proportionately higher expenses due to the reduction in the Fund’s total assets resulting from payment for the tendered Common Shares. Such reduction in the Fund’s total assets also may result in less investment flexibility, reduced diversification and greater volatility for the Fund, and may have an adverse effect on the Fund’s investment performance.
If the Fund conducts an Eligible Tender Offer, there can be no assurance that the number of tendered Common Shares would not result in the Fund’s net assets totaling less than the Termination Threshold, in which case the Eligible Tender Offer will be terminated, no Common Shares will be repurchased pursuant to the Eligible Tender Offer and the Fund will terminate on the Termination Date. The investment adviser may have a conflict of interest in recommending to the Board of Trustees that the Fund have a continued existence without limitation of time. The Fund is not required to conduct additional tender offers following an Eligible Tender Offer and conversion to a continued existence without limitation of time. Therefore, remaining Common Shareholders may not have another opportunity to participate in a tender offer.
A Fund portfolio holding default may significantly reduce net investment income and, therefore, Common Share dividends; and may prevent or inhibit the Fund from fully being able to liquidate its portfolio at or prior to the Termination Date.
Market Discount from Net Asset Value. Shares of closed-end investment companies like the Fund frequently trade at prices lower than their NAV. This characteristic is a risk separate and distinct from the risk that the Fund’s NAV could decrease as a result of investment activities. Whether investors will realize gains or losses upon the sale of the common shares will depend not upon the Fund’s NAV but entirely upon whether the market price of the common shares at the time of sale is above or below the investor’s purchase price for the common shares. Furthermore, management may have difficulty meeting the Fund’s investment objectives and managing its portfolio when the underlying securities are redeemed or sold during periods of market turmoil and as investors’ perceptions regarding closed-end funds or their underlying investments change. Because the market price of the common shares will be determined by factors such as relative supply of and demand for the common shares in the market, general market and economic circumstances, and other factors beyond the control of the Fund, the Fund cannot predict whether the common shares will trade at, below or above NAV. The common shares are designed primarily for long-term investors, and you should not view the Fund as a vehicle for short-term trading purposes.
Recent Market Conditions. In response to the financial crisis and recent market events, policy and legislative changes by the United States government and the Federal Reserve to assist in the ongoing support of financial markets, both domestically and in other countries, are changing many aspects of financial regulation. The impact of these changes on the markets, and the practical implications for market participants, may not be fully known for some time. Withdrawal of government support, failure of efforts in response to the crisis, or investor perception that such efforts are not succeeding, could adversely impact the value and liquidity of certain securities. The severity or duration of adverse economic conditions may also be affected by policy changes made by governments or quasi-governmental organizations, including changes in tax laws and the imposition of trade barriers. The impact of new financial regulation legislation on the markets and the practical implications for market participants may not be fully known for some time. Changes to the Federal Reserve policy may affect the value, volatility and liquidity of dividend and interest paying securities. In addition, the contentious domestic political environment, as well as political and diplomatic events within the United States and abroad, such as the U.S. government’s inability at times to agree on a long-term budget and deficit reduction plan, the threat of a federal government shutdown and threats not to increase the federal government’s debt limit, may affect investor and consumer confidence and may adversely impact financial markets and the broader economy, perhaps suddenly and to a significant degree.
203
Shareholder Update (Unaudited) (continued)
Interest rates have been unusually low in recent years in the United States and abroad but there is consensus that interest rates will increase during the life of the Fund, which could negatively impact the price of debt securities. Because there is little precedent for this situation, it is difficult to predict the impact of a significant rate increase on various markets.
The current political climate has intensified concerns about a potential trade war between China and the United States, as each country has recently imposed tariffs on the other country’s products. These actions may trigger a significant reduction in international trade, the oversupply of certain manufactured goods, substantial price reductions of goods and possible failure of individual companies and/or large segments of China’s export industry, which could have a negative impact on the Fund’s performance.
The impact of these developments in the near- and long-term is unknown and could have additional adverse effects on economies, financial markets and asset valuations around the world.
Reverse Repurchase Agreement Risk. A reverse repurchase agreement, in economic essence, constitutes a securitized borrowing by the Fund from the security purchaser. The Fund may enter into reverse repurchase agreements for the purpose of creating a leveraged investment exposure and, as such, their usage involves essentially the same risks associated with a leveraging strategy generally since the proceeds from these agreements may be invested in additional portfolio securities. Reverse repurchase agreements tend to be short-term in tenor, and there can be no assurances that the purchaser (lender) will commit to extend or “roll” a given agreement upon its agreed-upon repurchase date or an alternative purchaser can be identified on similar terms. Reverse repurchase agreements also involve the risk that the purchaser fails to return the securities as agreed upon, files for bankruptcy or becomes insolvent. The Fund may be restricted from taking normal portfolio actions during such time, could be subject to loss to the extent that the proceeds of the agreement are less than the value of securities subject to the agreement and may experience adverse tax consequences.
EFFECTS OF LEVERAGE
The following table is furnished in response to requirements of the SEC. It is designed to illustrate the effects of leverage through the use of senior securities, as that term is defined under Section 18 of the 1940 Act, as well as certain other forms of leverage, such as reverse repurchase agreements, on common share total return, assuming investment portfolio total returns (consisting of income and changes in the value of investments held in a Fund’s portfolio) of -10%, -5%, 0%, 5% and 10%. The table below reflects each Fund’s (i) continued use of leverage as of October 31, 2020 as a percentage of Managed Assets (including assets attributable to such leverage), (ii) the estimated annual effective interest expense rate payable by the Fund on such instruments (based on actual leverage costs incurred during the fiscal year ended October 31, 2020) as set forth in the table, and (iii) the annual return that the Fund’s portfolio must experience (net of expenses) in order to cover such costs of leverage based on such estimated annual effective interest expense rate. The information below does not reflect any Fund’s use of certain other forms of economic leverage achieved through the use of other instruments or transactions not considered to be senior securities under the 1940 Act, such as certain derivative instruments.
The numbers are merely estimates, used for illustration. The costs of leverage may vary frequently and may be significantly higher or lower than the estimated rate. The assumed investment portfolio returns in the table below are hypothetical figures and are not necessarily indicative of the investment portfolio returns experienced or expected to be experienced by the Fund. Your actual returns may be greater or less than those appearing below.
| | | | Nuveen Municipal | Nuveen Dynamic |
| Nuveen AMT-Free | Nuveen Municipal | Nuveen Municipal | Credit | Municipal |
| Municipal Credit | Credit Income | High Income | Opportunities | Opportunities |
| Income Fund | Fund | Opportunity Fund | Fund | Fund |
| (NVG) | (NZF) | (NMZ) | (NMCO) | (NDMO) |
Estimated Leverage as a Percentage of Managed Assets | | | | | |
(Including Assets Attributable to Leverage) | 38.00% | 38.09% | 35.25% | 40.88% | 14.35% |
Estimated Annual Effective Leverage Expense Rate Payable | | | | | |
by Fund on Leverage | 1.63% | 1.67% | 1.38% | 1.74% | 0.75% |
Annual Return Fund Portfolio Must Experience (net of expenses) | | | | | |
to Cover Estimated Annual Effective Interest Expense Rate on | | | | | |
Leverage | 0.62% | 0.64% | 0.49% | 0.71% | 0.11% |
Common Share Total Return for (10.00)% Assumed Portfolio | | | | | |
Total Return | -17.13% | -17.18% | -16.20% | -18.12% | -11.80% |
Common Share Total Return for (5.00)% Assumed Portfolio | | | | | |
Total Return | -9.06% | -9.10% | -8.47% | -9.66% | -5.96% |
Common Share Total Return for 0.00% Assumed Portfolio | | | | | |
Total Return | -1.00% | -1.03% | -0.75% | -1.20% | -0.13% |
Common Share Total Return for 5.00% Assumed Portfolio | | | | | |
Total Return | 7.07% | 7.05% | 6.97% | 7.25% | 5.71% |
Common Share Total Return for 10.00% Assumed Portfolio | | | | | |
Total Return | 15.13% | 15.13% | 14.69% | 15.71% | 11.55% |
204
Common Share total return is composed of two elements — the distributions paid by a Fund to holders of common shares (the amount of which is largely determined by the net investment income of the Fund after paying dividend payments on any preferred shares issued by the Fund and expenses on any forms of leverage outstanding) and gains or losses on the value of the securities and other instruments the Fund owns. As required by SEC rules, the table assumes that a Fund is more likely to suffer capital losses than to enjoy capital appreciation. For example, to assume a total return of 0%, a Fund must assume that the income it receives on its investments is entirely offset by losses in the value of those investments. This table reflects hypothetical performance of a Fund’s portfolio and not the actual performance of the Fund’s common shares, the value of which is determined by market forces and other factors. Should a Fund elect to add additional leverage to its portfolio, any benefits of such additional leverage cannot be fully achieved until the proceeds resulting from the use of such leverage have been received by the Fund and invested in accordance with the Fund’s investment objectives and policies. As noted above, a Fund’s willingness to use additional leverage, and the extent to which leverage is used at any time, will depend on many factors.
DIVIDEND REINVESTMENT PLAN
Nuveen Closed-End Funds Automatic Reinvestment Plan
Nuveen Closed-End Fund allows you to conveniently reinvest distributions in additional Fund shares. By choosing to reinvest, you’ll be able to invest money regularly and automatically, and watch your investment grow through the power of compounding. Just like distributions in cash, there may be times when income or capital gains taxes may be payable on distributions that are reinvested. It is important to note that an automatic reinvestment plan does not ensure a profit, nor does it protect you against loss in a declining market.
Easy and convenient
To make recordkeeping easy and convenient, each month you’ll receive a statement showing your total distributions, the date of investment, the shares acquired and the price per share, and the total number of shares you own.
How shares are purchased
The shares you acquire by reinvesting will either be purchased on the open market or newly issued by the Fund. If the shares are trading at or above NAV at the time of valuation, the Fund will issue new shares at the greater of the NAV or 95% of the then-current market price. If the shares are trading at less than NAV, shares for your account will be purchased on the open market. If Computershare Trust Company, N.A. (the “Plan Agent”) begins purchasing Fund shares on the open market while shares are trading below NAV, but the Fund’s shares subsequently trade at or above their NAV before the Plan Agent is able to complete its purchases, the Plan Agent may cease open-market purchases and may invest the uninvested portion of the distribution in newly-issued Fund shares at a price equal to the greater of the shares’ NAV or 95% of the shares’ market value on the last business day immediately prior to the purchase date. Distributions received to purchase shares in the open market will normally be invested shortly after the distribution payment date. No interest will be paid on distributions awaiting reinvestment. Because the market price of the shares may increase before purchases are completed, the average purchase price per share may exceed the market price at the time of valuation, resulting in the acquisition of fewer shares than if the distribution had been paid in shares issued by the Fund. A pro rata portion of any applicable brokerage commissions on open market purchases will be paid by Dividend Reinvestment Plan (the “Plan”) participants. These commissions usually will be lower than those charged on individual transactions.
Flexible
You may change your distribution option or withdraw from the Plan at any time, should your needs or situation change. You can reinvest whether your shares are registered in your name, or in the name of a brokerage firm, bank, or other nominee. Ask your investment advisor if his or her firm will participate on your behalf. Participants whose shares are registered in the name of one firm may not be able to transfer the shares to another firm and continue to participate in the Plan. The Fund reserves the right to amend or terminate the Plan at any time. Although the Fund reserves the right to amend the Plan to include a service charge payable by the participants, there is no direct service charge to participants in the Plan at this time.
Call today to start reinvesting distributions
For more information on the Nuveen Automatic Reinvestment Plan or to enroll in or withdraw from the Plan, speak with your financial professional or call us at (800) 257-8787.
CHANGES OCCURRING DURING THE PRIOR FISCAL YEAR
The following information in this annual report is a summary of certain changes during the most recent fiscal year. This information may not reflect all of the changes that have occurred since you purchased shares of a Fund.
During the most recent fiscal year, there have been no changes to: (i) the Funds’ investment objectives and principal investment policies that have not been approved by shareholders, (ii) the principal risks of the Fund, (iii) the portfolio managers of the Funds; (iv) a Fund’s charter or by-laws that would delay or prevent a change of control of the Fund that have not been approved by shareholders except as follows:
205
Shareholder Update (Unaudited) (continued)
Amended and Restated By-Laws
On October 5, 2020, after a rigorous and deliberative review, and consistent with the interests of the Nuveen AMT-Free Municipal Credit Income Fund, Nuveen Municipal Credit Income Fund, Nuveen Municipal High Income Opportunity Fund, Nuveen Municipal Credit Opportunities Fund and the Nuveen Dynamic Municipal Opportunities Fund (each a “Fund” and collectively the “Funds”) long-term shareholders, the Board of Trustees of each Fund adopted Amended and Restated By-Laws.
Among other changes, the Amended and Restated By-Laws require compliance with certain amended deadlines and procedural and informational requirements in connection with advance notice of shareholder proposals or nominations, including certain information about the proponent and the proposal, or in the case of a nomination, the nominee. Any shareholder considering making a nomination or other proposal should carefully review and comply with those provisions of the Amended and Restated By-Laws.
The Amended and Restated By-Laws also include provisions (the “Control Share By-Law”) pursuant to which, in summary, a shareholder who obtains beneficial ownership of common shares of a Fund in a “Control Share Acquisition” may exercise voting rights with respect to such shares only to the extent the authorization of such voting rights is approved by other shareholders of the Fund. The Control Share By-Law is primarily intended to protect the interests of the Fund and its long-term shareholders by limiting the risk that the Fund will become subject to undue influence by opportunistic traders pursuing short-term agendas adverse to the best interests of the Fund and its long-term shareholders. The Control Share By-Law does not eliminate voting rights for common shares acquired in Control Share Acquisitions, but rather entrusts the Fund’s other “non-interested” shareholders with determining whether to approve the authorization of the voting rights of the person acquiring such shares.
Subject to various conditions and exceptions, the Control Share By-Law defines a “Control Share Acquisition” to include an acquisition of common shares that, but for the Control Share By-Law, would give the beneficial owner, upon the acquisition of such shares, the ability to exercise voting power in the election of Trustees of a Fund in any of the following ranges:
(i) one-tenth or more, but less than one-fifth of all voting power;
(ii) one-fifth or more, but less than one-third of all voting power;
(iii) one-third or more, but less than a majority of all voting power; or
(iv) a majority or more of all voting power.
The Control Share By-Law generally excludes certain acquisitions of common shares from the definition of a Control Share Acquisition, including acquisitions of common shares that occurred prior to October 5, 2020, though such shares are included in assessing whether any subsequent share acquisition exceeds one of the enumerated thresholds.
Subject to certain conditions and procedural requirements set forth in the Control Share By-Law, including the delivery of a “Control Share Acquisition Statement” to the Funds’ Secretary setting forth certain required information, a shareholder who obtains or proposes to obtain beneficial ownership of common shares in a Control Share Acquisition generally may demand a special meeting of shareholders for the purpose of considering whether the voting rights of such acquiring person with respect to such shares shall be authorized.
This discussion is only a high-level summary of certain aspects of the Amended and Restated By-Laws, and is qualified in its entirety by reference to the Amended and Restated By-Laws. Shareholders should refer to the Amended and Restated By-Laws for more information. A copy of the Amended and Restated By-Laws can be found in the Current Report on Form 8-K filed by the Funds with the Securities and Exchange Commission on October 6, 2020, which is available at www.sec.gov, and may also be obtained by writing to the Secretary of the Funds at 333 West Wacker Drive, Chicago, Illinois 60606.
206
Additional Fund Information
(Unaudited)
| | | | | | | |
| Board of Trustees | | | | | | |
Jack B. Evans | William C. Hunter | Albin F. Moschner | John K. Nelson | Judith M. Stockdale | Carole E. Stone |
Mathew Thornton III* | Margaret L. Wolff | Robert L. Young | | | | |
* Effective November 16, 2020. | | | | | | |
|
| Investment Adviser | Custodian | Legal Counsel | Independent Registered | Transfer Agent and |
Nuveen Fund Advisors, LLC | State Street Bank | Chapman and Cutler LLP | Public Accounting Firm | Shareholder Services |
333 West Wacker Drive | and Trust Company | Chicago, IL 60603 | KPMG LLP | | Computershare Trust |
Chicago, IL 60606 | One Lincoln Street | | 200 East | | Company, N.A. |
| Boston, MA 02111 | | Randolph Street | 150 Royall Street |
| | | Chicago, IL 60601 | Canton, MA 02021 |
| | | | | (800) 257-8787 |
Portfolio of Investments Information
Each Fund is required to file its complete schedule of portfolio holdings with the Securities and Exchange Commission (SEC) for the first and third quarters of each fiscal year as an exhibit to its report on Form N-PORT. You may obtain this information on the SEC’s website at http://www.sec.gov.
Nuveen Funds’ Proxy Voting Information
You may obtain (i) information regarding how each fund voted proxies relating to portfolio securities held during the most recent twelve-month period ended June 30, without charge, upon request, by calling Nuveen toll-free at (800) 257-8787 or on Nuveen’s website at www.nuveen.com and (ii) a description of the policies and procedures that each fund used to determine how to vote proxies relating to portfolio securities without charge, upon request, by calling Nuveen toll free at (800) 257-8787. You may also obtain this information directly from the SEC. Visit the SEC on-line at http://www.sec.gov.
CEO Certification Disclosure
Each Fund’s Chief Executive Officer (CEO) has submitted to the New York Stock Exchange (NYSE) the annual CEO certification as required by Section 303A.12(a) of the NYSE Listed Company Manual. Each Fund has filed with the SEC the certification of its CEO and Chief Financial Officer required by Section 302 of the Sarbanes-Oxley Act.
Common Share Repurchases
NVG, NZF, NMZ and NMCO intend to repurchase, through their open-market share repurchase program, shares of their own common stock at such times and in such amounts as is deemed advisable. During the period covered by this report, each Fund repurchased shares of its common stock as shown in the accompanying table. Any future repurchases will be reported to shareholders in the next annual or semi-annual report.
| NVG | NZF | NMZ | NMCO |
Common shares repurchased | — | — | — | — |
FINRA BrokerCheck
The Financial Industry Regulatory Authority (FINRA) provides information regarding the disciplinary history of FINRA member firms and associated investment professionals. This information as well as an investor brochure describing FINRA BrokerCheck is available to the public by calling the FINRA BrokerCheck Hotline number at (800) 289-9999 or by visiting www.FINRA.org.
207
Glossary of Terms Used in this Report
(Unaudited)
■ Average Annual Total Return: This is a commonly used method to express an investment’s performance over a particular, usually multi-year time period. It expresses the return that would have been necessary each year to equal the investment’s actual cumulative performance (including change in NAV or market price and reinvested dividends and capital gains distributions, if any) over the time period being considered.
■ Duration: Duration is a measure of the expected period over which a bond’s principal and interest will be paid, and consequently is a measure of the sensitivity of a bond’s or bond fund’s value to changes when market interest rates change. Generally, the longer a bond’s or fund’s duration, the more the price of the bond or fund will change as interest rates change.
■ Effective Leverage: Effective leverage is a fund’s effective economic leverage, and includes both regulatory leverage (see leverage) and the leverage effects of certain derivative investments in the fund’s portfolio. Currently, the leverage effects of Tender Option Bond (TOB) inverse floater holdings are included in effective leverage values, in addition to any regulatory leverage.
■ Gross Domestic Product (GDP): The total market value of all final goods and services produced in a country/region in a given year, equal to total consumer, investment and government spending, plus the value of exports, minus the value of imports.
■ Industrial Development Revenue Bond (IDR): A unique type of revenue bond issued by a state or local government agency on behalf of a private sector company and intended to build or acquire factories or other heavy equipment and tools.
■ Inverse Floating Rate Securities: Inverse floating rate securities, also known as inverse floaters or tender option bonds (TOBs), are created by depositing a municipal bond, typically with a fixed interest rate, into a special purpose trust. This trust, in turn, (a) issues floating rate certificates typically paying short-term tax-exempt interest rates to third parties in amounts equal to some fraction of the deposited bond’s par amount or market value, and (b) issues an inverse floating rate certificate (sometimes referred to as an “inverse floater”) to an investor (such as a fund) interested in gaining investment exposure to a long-term municipal bond. The income received by the holder of the inverse floater varies inversely with the short-term rate paid to the floating rate certificates’ holders, and in most circumstances the holder of the inverse floater bears substantially all of the underlying bond’s downside investment risk. The holder of the inverse floater typically also benefits disproportionately from any potential appreciation of the underlying bond’s value. Hence, an inverse floater essentially represents an investment in the underlying bond on a leveraged basis.
■ Leverage: Leverage is created whenever a fund has investment exposure (both reward and/or risk) equivalent to more than 100% of the investment capital.
■ NVG and NZF Custom Blended Fund Performance Benchmark: The Fund Performance Benchmark is an unleveraged index consisting of the returns of the S&P Municipal Bond Index prior to 4/11/16 and thereafter the returns of an 60%/40% blend of the S&P Municipal Bond Investment Grade Index and the S&P Municipal Bond High Yield Index, respectively. The S&P Municipal Bond Index is an unmanaged, market value-weighted index designed to measure the performance of tax-exempt municipal bonds. The S&P Municipal Bond Investment Grade Index is an unmanaged, market value-weighted index designed to measure the performance of tax-exempt municipal bonds rated investment grade by Standard & Poor’s, Moody’s and/or Fitch. The S&P Municipal Bond High Yield Index is an unmanaged, market value-weighted index designed to measure the performance of the tax-exempt, high yield municipal bonds. Index returns assume compounding and do not include the effects of any fees or expenses.
208
■ Net Asset Value (NAV) Per Share: A fund’s Net Assets is equal to its total assets (securities, cash, accrued earnings and receivables) less its total liabilities. NAV per share is equal to the fund’s Net Assets divided by its number of shares outstanding.
■ Pre-Refunding: Pre-Refunding, also known as advanced refundings or refinancings, is a procedure used by state and local governments to refinance municipal bonds to lower interest expenses. The issuer sells new bonds with a lower yield and uses the proceeds to buy U.S. Treasury securities, the interest from which is used to make payments on the higher-yielding bonds. Because of this collateral, pre-refunding generally raises a bond’s credit rating and thus its value.
■ Regulatory Leverage: Regulatory leverage consists of preferred shares issued by or borrowings of a fund. Both of these are part of a fund’s capital structure. Regulatory leverage is subject to asset coverage limits set in the Investment Company Act of 1940.
■ S&P Municipal Bond High Yield Index: An unleveraged, market value-weighted index designed to measure the performance of the tax-exempt, investment grade U.S. high yield municipal bond market. Index returns assume reinvestment of distributions, but do not reflect any applicable sales charges or management fees.
■ S&P Municipal Bond Index: An unleveraged, market value-weighted index designed to measure the performance of the tax-exempt, investment-grade U.S. municipal bond market. Index returns assume reinvestment of distributions, but do not reflect any applicable sales charges or management fees.
■ S&P Municipal Yield Index: An unleveraged, market value-weighted index containing all bonds in the S&P Municipal Bond Index that are non-rated bonds or whose ratings are BB+ by S&P and BA-1 by Moody’s Investors Service, Inc. or lower. This index does not contain bonds that are pre-refunded or escrowed to maturity. Index returns assume reinvestment of distributions, but do not reflect any applicable sales charges or management fees.
■ Total Investment Exposure: Total investment exposure is a fund’s assets managed by the Adviser that are attributable to financial leverage. For these purposes, financial leverage includes a fund’s use of preferred stock and borrowings and investments in the residual interest certificates (also called inverse floating rate securities) in tender option bond (TOB) trusts, including the portion of assets held by a TOB trust that has been effectively financed by the trust’s issuance of floating rate securities.
■ Zero Coupon Bond: A zero coupon bond does not pay a regular interest coupon to its holders during the life of the bond. Income to the holder of the bond comes from accretion of the difference between the original purchase price of the bond at issuance and the par value of the bond at maturity and is effectively paid at maturity. The market prices of zero coupon bonds generally are more volatile than the market prices of bonds that pay interest periodically.
209
Annual Investment Management
Agreement Approval Process (Unaudited)
The Approval Process
The Boards of Trustees (collectively, the “Board” and each Trustee, a “Board Member”) of the Funds, including the Board Members who are not “interested persons” (as defined under the Investment Company Act of 1940 (the “1940 Act”)) (the “Independent Board Members”), are responsible for determining whether to initially approve or, after an initial term, to renew, the advisory arrangements of their respective Funds. A discussion of the Board’s most recent approval of the renewal of the advisory arrangements for Nuveen AMT-Free Municipal Credit Income Fund (the “AMT-Free Municipal Credit Income Fund”), Nuveen Municipal Credit Income Fund (the “Municipal Credit Income Fund”), and Nuveen Municipal High Income Opportunity Fund (the “Municipal High Income Opportunity Fund”) is set forth in Part I below. The advisory arrangements for Nuveen Municipal Credit Opportunities Fund (the “Municipal Credit Opportunities Fund”) and Nuveen Dynamic Municipal Opportunities Fund (the “Dynamic Municipal Opportunities Fund”) have not yet been up for renewal. A discussion of the Board’s initial approval of the advisory arrangements for the Municipal Credit Opportunities Fund is set forth in such Fund’s annual report for the period ended October 31, 2019. A discussion of the Board’s initial approval of the advisory arrangements for the Dynamic Municipal Opportunities Fund is set forth in Part II below.
PART I
Nuveen AMT-Free Municipal Credit Income Fund
Nuveen Municipal Credit Income Fund
Nuveen Municipal High Income Opportunity Fund
At a meeting held on May 19-21, 2020 (the “May Meeting”), the Board (which is comprised entirely of Independent Board Members) approved, for its respective Fund (as defined below), the renewal of the management agreement (for purposes of this Part I, each, an “Investment Management Agreement”) with Nuveen Fund Advisors, LLC (the “Adviser”) pursuant to which the Adviser serves as investment adviser to such Fund and the sub-advisory agreement (for purposes of this Part I, each, a “Sub-Advisory Agreement”) with Nuveen Asset Management, LLC (the “Sub-Adviser”) pursuant to which the Sub-Adviser serves as the investment sub-adviser to such Fund. For purposes of this Part I, the AMT-Free Municipal Credit Income Fund, Municipal Credit Income Fund and Municipal High Income Opportunity Fund are the “Funds” and each, a “Fund.” Although the 1940 Act requires that continuances of the Advisory Agreements (as defined below) be approved by the in-person vote of a majority of the Independent Board Members, the May Meeting was held virtually through the internet in view of the health risks associated with holding an in-person meeting during the COVID-19 pandemic and governmental restrictions on gatherings. The May Meeting was held in reliance on an order issued by the Securities and Exchange Commission on March 13, 2020, as extended on March 25, 2020, which provided registered investment companies temporary relief from the in-person voting requirements of the 1940 Act with respect to the approval of a fund’s advisory agreement in response to the challenges arising in connection with the COVID-19 pandemic.
Following up to an initial two-year period, the Board considers the renewal of each Investment Management Agreement and Sub-Advisory Agreement on behalf of the applicable Fund on an annual basis. For purposes of this Part I, the Investment Management Agreements and Sub-Advisory Agreements are collectively referred to as the “Advisory Agreements” and the Adviser and the Sub-Adviser are collectively, the “Fund Advisers” and each, a “Fund Adviser.” Throughout the year, the Board and its committees meet regularly and, at these meetings, review an extensive array of topics and information that are relevant to its annual consideration of the renewal of the advisory agreements for the Nuveen funds. Such information may address, among other things, fund performance; the Adviser’s strategic plans; the review of the funds and investment teams; compliance, regulatory and risk management matters; the trading practices of the various sub-advisers to the funds; valuation of securities; fund expenses; overall market and regulatory developments; the management of leverage financing; and the secondary market trading of the closed-end funds and any actions to address discounts.
210
In addition to the information and materials received during the year, the Board, in response to a request made on its behalf by independent legal counsel, received extensive materials and information prepared specifically for its annual consideration of the renewal of the advisory agreements for the Nuveen funds by the Adviser and by Broadridge Financial Solutions, Inc. (“Broadridge”), an independent provider of investment company data. The materials cover a wide range of topics including, but not limited to, a description of the nature, extent and quality of services provided by the Fund Advisers; a review of each sub-adviser to the Nuveen funds and the applicable investment teams; an analysis of fund performance in absolute terms and as compared to the performance of certain peer funds and benchmarks with a focus on any performance outliers; an analysis of the fees and expense ratios of the Nuveen funds in absolute terms and as compared to those of certain peer funds with a focus on any expense outliers; a description of portfolio manager compensation; a review of the secondary market trading of shares of the Nuveen closed-end funds (including, among other things, an analysis of performance, distribution and valuation and capital raising trends in the broader closed-end fund market and in particular with respect to Nuveen closed-end funds; a review of the leverage management actions taken on behalf of the Nuveen closed-end funds and their resulting impact on performance; and a description of the distribution management process and any capital management activities); a review of the performance of various service providers; a description of various initiatives Nuveen had undertaken or continued during the year for the benefit of particular fund(s) and/or the complex; a description of the profitability or financial data of Nuveen and the sub-advisers to the Nuveen funds; and a description of indirect benefits received by the Adviser and the sub-advisers as a result of their relationships with the Nuveen funds.
In continuing its practice, the Board met prior to the May Meeting to begin its considerations of the renewal of the Advisory Agreements. Accordingly, on April 27-28, 2020 (the “April Meeting”), the Board met to review and discuss, in part, the performance of the Nuveen funds and the Adviser’s evaluation of each sub-adviser to the Nuveen funds. In its review, the Board recognized the volatile market conditions occurring during the first half of 2020 arising, in part, from the public health crisis caused by the novel coronavirus known as COVID-19 and the resulting impact on fund performance. Accordingly, the Board reviewed, among other things, fund performance reflecting the more volatile periods, including for various time periods ended the first quarter of 2020 and for various time periods ended April 17, 2020. At the April Meeting, the Board Members asked questions and requested additional information that was provided for the May Meeting. In continuing its review of the Nuveen funds in light of the extraordinary market conditions experienced in early 2020, the Board received updated fund performance data reflecting various time periods ended May 8, 2020 for its May Meeting. The Board also continued its practice of seeking to meet periodically with the various sub-advisers to the Nuveen funds and their investment teams, when feasible.
The Independent Board Members considered the review of the advisory agreements for the Nuveen funds to be an ongoing process and employed the accumulated information, knowledge, and experience the Board Members had gained during their tenure on the boards governing the Nuveen funds and working with the Adviser and sub-advisers in their review of the advisory agreements. The contractual arrangements are a result of multiple years of review, negotiation and information provided in connection with the boards’ annual review of the Nuveen funds’ advisory arrangements and oversight of the Nuveen funds.
The Independent Board Members were advised by independent legal counsel during the annual review process as well as throughout the year, including meeting in executive sessions with such counsel at which no representatives from the Adviser or the Sub-Adviser were present. In connection with their annual review, the Independent Board Members also received a memorandum from independent legal counsel outlining their fiduciary duties and legal standards in reviewing the Advisory Agreements.
The Board’s decision to renew the Advisory Agreements was not based on a single identified factor, but rather the decision reflected the comprehensive consideration of all the information provided throughout the year and at the April and May Meetings, and each Board Member may have attributed different levels of importance to the various factors and information considered in connection with the approval process. The following summarizes the principal factors and information, but not all the factors, the Board considered in deciding to renew the Advisory Agreements and its conclusions.
211
Annual Investment Management Agreement Approval Process (Unaudited) (continued)
A. Nature, Extent and Quality of Services
In evaluating the renewal of the Advisory Agreements, the Independent Board Members received and considered information regarding the nature, extent and quality of the applicable Fund Adviser’s services provided to the respective Fund with particular focus on the services and enhancements to such services provided during the last year. The Independent Board Members considered the Investment Management Agreements and the Sub-Advisory Agreements separately in the course of their review. With this approach, they considered the respective roles of the Adviser and the Sub-Adviser in providing services to the Funds.
With respect to the Adviser, the Board recognized that the Adviser has provided a vast array of services the scope of which has expanded over the years in light of regulatory, market and other developments, such as the development of expanded compliance programs for the Nuveen funds. The Board also noted the extensive resources, tools and capabilities the Adviser and its affiliates devoted to the various operations of the Nuveen funds. These services include, but are not limited to: investment oversight, risk management and securities valuation services (such as analyzing investment performance and risk data; overseeing and reviewing the various sub-advisers to the Nuveen funds and their investment teams; overseeing trade execution, soft dollar practices and securities lending activities; providing daily valuation services and developing related valuation policies, procedures and methodologies; overseeing risk disclosure; periodic testing of investment and liquidity risks; participating in financial statement and marketing disclosures; participating in product development; and participating in leverage management and liquidity monitoring); product management (such as analyzing a fund’s position in the marketplace, setting dividends, preparing shareholder and intermediary communications and other due diligence support); fund administration (such as preparing fund tax returns and other tax compliance services, overseeing the funds’ independent public accountants and other service providers; managing fund budgets and expenses; and helping to fulfill the funds’ regulatory filing requirements); oversight of shareholder services and transfer agency functions (such as overseeing transfer agent service providers which include registered shareholder customer service and transaction processing; and overseeing proxy solicitation and tabulation services); Board relations services (such as organizing and administering Board and committee meetings, preparing various reports to the Board and committees and providing other support services); compliance and regulatory oversight services (such as devising compliance programs; managing compliance policies; monitoring compliance with applicable fund policies and laws and regulations; and evaluating the compliance programs of the various sub-advisers to the Nuveen funds and certain other service providers); legal support and oversight of outside law firms (such as helping to prepare and file registration statements and proxy statements; overseeing fund activities and providing legal interpretations regarding such activities; and negotiating agreements with other fund service providers); and providing leverage, capital and distribution management services.
The Board also recognized that the Adviser and its affiliates have undertaken a number of initiatives over the previous year that benefited the complex and/or particular Nuveen funds including, but not limited to:
• Fund Improvements and Product Management Initiatives – continuing to proactively manage the Nuveen fund complex as a whole and at the individual fund level with an aim to enhance the shareholder outcomes through, among other things, rationalizing the product line and gaining efficiencies through mergers, repositionings and liquidations; reviewing and updating investment policies and benchmarks; and integrating certain investment teams and changing the portfolio managers serving various funds;
• Capital Initiatives – continuing to invest capital to support new Nuveen funds with initial capital as well as to facilitate modifications to the strategies or structure of existing funds;
• Compliance Program Initiatives – continuing efforts to mitigate compliance risk, increase operating efficiencies, strengthen key compliance program elements and support international business growth and other objectives through, among other things, integrating various investment teams across affiliates, consolidating marketing review functions, enhancing compliance related technologies and establishing and maintaining shared broad-based compliance policies throughout the organization and its affiliates;
212
• Risk Management and Valuation Services - continuing efforts to provide Nuveen with a more disciplined and consistent approach to identifying and mitigating the firm’s operational risks through, among other things, enhancing the interaction and reporting between the investment risk management team and various affiliates and adopting a risk operational framework across the complex;
• Regulatory Matters – continuing efforts to monitor regulatory trends and advocate on behalf of the Nuveen funds, to implement and comply with new or revised rules and mandates and to respond to regulatory inquiries and exams;
• Government Relations – continuing efforts of various Nuveen teams and affiliates to develop policy positions on a broad range of issues that may impact the Nuveen funds, advocate and communicate these positions to lawmakers and other regulatory authorities and work with trade associations to ensure these positions are represented;
• Business Continuity, Disaster Recovery and Information Services – continuing to periodically test business continuity and disaster recovery plans, maintain an information security program designed to identify and manage information security risks, and provide reports to the Board, at least annually, addressing, among other things, management’s security risk assessment, cyber risk profile, potential impact of new or revised laws and regulations, incident tracking and other relevant information technology risk-related reports;
• Expanded Dividend Management Services – continuing to manage the dividends among the varying types of Nuveen funds within the Nuveen complex to be consistent with the respective fund’s product design and investing resources to develop systems to assist in the process for newer products such as target term funds; and
• with respect specifically to closed-end funds, such initiatives also included:
•• Leverage Management Services – continuing to actively manage leverage including developing new leverage instruments, managing leverage exposure and costs through various providers, and managing and adapting tender option bond structures to comply with regulations and developing further relationships with leverage providers;
•• Capital Management, Market Intelligence and Secondary Market Services – ongoing capital management efforts through shelf offerings, share repurchases as appropriate to address discounts, tender offers and capital return programs as well as providing market data analysis to help understand closed-end fund ownership cycles and their impact on secondary market trading as well as to improve proxy solicitation efforts; and
•• Closed-end Fund Investor Relations Program – maintaining the closed-end fund investor relations program which, among other things, raises awareness, provides educational materials and cultivates advocacy for closed-end funds and the Nuveen closed-end fund product line.
The Board also noted the benefits to shareholders of investing in a Nuveen fund, as each Nuveen fund is a part of a large fund complex with a variety of investment disciplines, capabilities, expertise and resources available to navigate and support the funds including during stressed times as occurred in the market in the first half of 2020. In addition to the services provided by the Adviser, the Board also considered the risks borne by the Adviser and its affiliates in managing the Nuveen funds, including entrepreneurial, operational, reputational, regulatory and litigation risks.
The Board further considered the division of responsibilities between the Adviser and the Sub-Adviser and recognized that the Sub-Adviser and its investment personnel generally are responsible for the management of each Fund’s portfolio under the oversight of the Adviser and the Board. The Board considered an analysis of the Sub-Adviser provided by the Adviser which included, among other things, the Sub-Adviser’s assets under management and changes thereto, a summary of the applicable investment team and changes thereto, the investment approach of the team and the performance of the funds sub-advised by the Sub-Adviser over various periods. The Board further considered at the May Meeting or prior meetings evaluations of the Sub-Adviser’s compliance program and trade execution. The Board also considered the structure of investment personnel
213
Annual Investment Management Agreement Approval Process (Unaudited) (continued)
compensation programs and whether this structure provides appropriate incentives to act in the best interests of the respective Nuveen funds. The Board noted that the Adviser recommended the renewal of the Sub-Advisory Agreements.
Based on its review, the Board determined, in the exercise of its reasonable business judgment, that it was satisfied with the nature, extent and quality of services provided to the respective Funds under each applicable Advisory Agreement.
B. The Investment Performance of the Funds and Fund Advisers
In evaluating the quality of the services provided by the Fund Advisers, the Board also received and considered a variety of investment performance data of the Nuveen funds they advise. In this regard, the Board reviewed, among other things, Fund performance over the quarter, one-, three- and five-year periods ending December 31, 2019. Unless otherwise indicated, the performance data referenced below reflects the periods ended December 31, 2019. In general, the year 2019 was a period of strong market performance. However, as noted above, the Board recognized the unprecedented market volatility and decline that occurred in early 2020 and the significant impact it would have on fund performance. As a result, the Board reviewed performance data capturing more recent time periods, including performance data reflecting the first quarter of 2020 as well as performance data for various periods ended April 17, 2020 for its April Meeting and May 8, 2020 for its May Meeting.
The Board reviewed both absolute and relative fund performance during the annual review over the various time periods. With respect to the latter, the Board considered fund performance in comparison to the performance of peer funds (the “Performance Peer Group”) and recognized and/or customized benchmarks (i.e., generally benchmarks derived from multiple recognized benchmarks). For funds that had changes in portfolio managers, the Board considered performance data of such funds before and after such changes. In considering performance data, the Board is aware of certain inherent limitations with such data, including that differences between the objective(s), strategies and other characteristics of the Nuveen funds compared to the respective Performance Peer Group and/or benchmark(s) (such as differences in the use of leverage) as well as differences in the composition of the Performance Peer Group over time will necessarily contribute to differences in performance results and limit the value of the comparative information. To assist the Board in its review of the comparability of the relative performance, the Adviser has ranked the relevancy of the peer group to the funds as low, medium or high.
As noted above, the Board reviewed fund performance over various periods ended December 31, 2019 as well as the first quarter of 2020 and various time periods ended April 17, 2020 and May 8, 2020. In light of the significant market decline in the early part of 2020, the Board noted that a shorter period of underperformance may significantly impact longer term performance. Further, the Board recognized that performance data may differ significantly depending on the ending date selected and accordingly, performance results for periods ended at the year-end of 2019 may vary significantly from performance results for periods ended in the first quarter of 2020, particularly given the extraordinary market conditions at that time as the impact of COVID-19 and other market developments unfolded. The Board considered a fund’s performance in light of the overall financial market conditions. In addition, the Board recognized that shareholders may evaluate performance based on their own holding periods which may differ from the periods reviewed by the Board and lead to differing results.
The secondary market trading of shares of the Nuveen closed-end funds continues to be a priority for the Board given its importance to shareholders, and therefore data reflecting the premiums and discounts at which the shares of the closed-end funds trade is reviewed by the Board during its annual review and by the Board and/or its Closed-end Fund committee during its respective quarterly meetings throughout the year.
In addition to the performance data prepared in connection with the annual review of the advisory agreements of the Nuveen funds, the Board reviewed fund performance throughout the year at its quarterly meetings representing differing time periods and took into account the discussions that occurred at these Board meetings in evaluating a fund’s overall performance. The Board also considered, among other things, the Adviser’s analysis of each Nuveen fund’s performance, with particular focus on funds that were considered performance outliers (both overperformance and underperformance), the factors contributing to the performance and any steps taken to address any performance concerns. Given the volatile market conditions of early 2020, the Board considered the Adviser’s analysis of the impact of such conditions on the Nuveen funds’ performance.
214
The Board evaluated performance in light of various factors, including general market conditions, issuer-specific information, asset class information, fund cash flows and other factors. Accordingly, depending on the facts and circumstances, the Board may be satisfied with a fund’s performance notwithstanding that its performance may be below its benchmark or peer group for certain periods. However, with respect to any Nuveen funds for which the Board had identified performance issues, the Board monitors such funds closely until performance improves, discusses with the Adviser the reasons for such results, considers whether any steps are necessary or appropriate to address such issues, and reviews the results of any efforts undertaken.
The Board’s determinations with respect to each Fund are summarized below.
For the AMT-Free Municipal Credit Income Fund, the Board noted that the Fund outperformed its blended benchmark and ranked in the first quartile of its Performance Peer Group for the one-, three- and five-year periods ended December 31, 2019. With the market decline in the first quarter of 2020, the Fund still outperformed its blended benchmark and ranked in the first quartile of its Performance Peer Group for the one-, three- and five-year periods ended March 31, 2020. In its review, the Board, however, noted that the Performance Peer Group was classified as low for relevancy. The Board was satisfied with the Fund’s overall performance.
For the Municipal Credit Income Fund, the Board noted that the Fund outperformed its blended benchmark and ranked in the first quartile of its Performance Peer Group for the one-, three- and five-year periods ended December 31, 2019. With the market decline in the first quarter of 2020, although the Fund’s performance was below the performance of its blended benchmark for the one-year period ended March 31, 2020, the Fund outperformed its blended benchmark for the three- and five-year periods ended March 31, 2020. Further, although the Fund ranked in the third quartile of its Performance Peer Group for the one-year period ended March 31, 2020, the Fund ranked in the first quartile for the three- and five-year periods ended March 31, 2020. In its review, the Board, however, noted that the Performance Peer Group was classified as low for relevancy. The Board was satisfied with the Fund’s overall performance.
For the Municipal High Income Opportunity Fund, the Board noted that the Fund outperformed its benchmark and ranked in the first quartile of its Performance Peer Group for the one-, three- and five-year periods ended December 31, 2019. With the market decline in the first quarter of 2020, although the Fund’s performance was below the performance of its benchmark for the one- and five-year periods ended March 31, 2020, the Fund outperformed its benchmark for the three-year period ended March 31, 2020. Further, although the Fund ranked in the third quartile of its Performance Peer Group for the one-year period ended March 31, 2020, the Fund ranked in the first quartile for the three- and five-year periods ended March 31, 2020. The Board was satisfied with the Fund’s overall performance.
C. Fees, Expenses and Profitability
1. Fees and Expenses
As part of its annual review, the Board considered the contractual management fee and net management fee (the management fee after taking into consideration fee waivers and/or expense reimbursements, if any) paid by a Nuveen fund to the Adviser in light of the nature, extent and quality of the services provided. The Board also considered the total operating expense ratio of each Nuveen fund before and after any fee waivers and/or expense reimbursements. More specifically, the Independent Board Members reviewed, among other things, each fund’s gross and net management fee rates (i.e., before and after expense reimbursements and/or fee waivers, if any) and net total expense ratio in relation to those of a comparable universe of funds (the “Peer Universe”) established by Broadridge. The Independent Board Members reviewed the methodology Broadridge employed to establish its Peer Universe and recognized that differences between the applicable fund and its respective Peer Universe as well as changes to the composition of the Peer Universe from year to year may limit some of the value of the comparative data. The Independent Board Members also considered a fund’s operating expense ratio as it more directly reflected the shareholder’s costs in investing in the respective fund.
215
Annual Investment Management Agreement Approval Process (Unaudited) (continued)
In their review, the Independent Board Members considered, in particular, each Nuveen fund with a net expense ratio (excluding investment-related costs of leverage) of six basis points or higher compared to that of its peer average (each, an “Expense Outlier Fund”), including the Municipal Credit Income Fund, and an analysis as to the factors contributing to each such fund’s higher relative net expense ratio. In addition, although the Board reviewed a fund’s total net expenses both including and excluding investment-related expenses (i.e., leverage costs) and taxes for certain of the closed-end funds, the Board recognized that leverage expenses will vary across funds and in comparison to peers because of differences in the forms and terms of leverage employed by the respective fund. Accordingly, in reviewing the comparative data between a fund and its peers, the Board generally considered the fund’s net expense ratio and fees (excluding leverage costs and leveraged assets) to be higher if they were over 10 basis points higher, slightly higher if they were 6 to 10 basis points higher, in line if they were within approximately 5 basis points higher than the peer average and below if they were below the peer average of the Peer Universe. The Independent Board Members also considered, in relevant part, a fund’s net management fee and net total expense ratio in light of its performance history.
In their review of the fee arrangements for the Nuveen funds, the Independent Board Members considered the management fee schedules, including the complex-wide and fund-level breakpoint schedules. The Board noted that across the Nuveen fund complex, the complex-wide fee breakpoints reduced fees by $56.6 million and fund-level breakpoints reduced fees by $66.8 million in 2019.
With respect to the Sub-Adviser, the Board also considered the sub-advisory fee schedule paid to the Sub-Adviser in light of the sub-advisory services provided to the respective Fund, the breakpoint schedule and comparative data of the fees the Sub-Adviser charges to other clients, if any. In its review, the Board recognized that the compensation paid to the Sub-Adviser is the responsibility of the Adviser, not the Funds.
The Independent Board Members noted that (a) the AMT-Free Municipal Credit Income Fund had a net management fee that was higher than its peer average, but a net expense ratio that was in line with its peer average; (b) the Municipal High Income Opportunity Fund had a net management fee that was in line with its peer average and a net expense ratio that was below its peer average; and (c) the Municipal Credit Income Fund had a net management fee that was higher than its peer average and a net expense ratio that was slightly higher than its peer average. The Independent Board Members noted that the Municipal Credit Income Fund’s net expense ratio was slightly higher than its peer average due, in part, to such Fund’s larger allocation to non-investment grade securities compared to the peers.
Based on its review of the information provided, the Board determined that each Fund’s management fees (as applicable) to a Fund Adviser were reasonable in light of the nature, extent and quality of services provided to the Fund.
2. Comparisons with the Fees of Other Clients
In determining the appropriateness of fees, the Board also considered information regarding the fee rates the respective Fund Advisers charged to certain other types of clients and the type of services provided to these other clients. With respect to the Adviser and/or the Sub-Adviser, such other clients may include retail and institutional managed accounts, passively managed exchange-traded funds (“ETFs”) sub-advised by the Sub-Adviser but that are offered by another fund complex and municipal managed accounts offered by an unaffiliated adviser. With respect to the Sub-Adviser, the Board reviewed, among other things, the fee range and average fee of municipal retail wrap accounts and municipal institutional accounts.
In considering the fee data of other clients, the Board considered, among other things, the differences in the amount, type and level of services provided to the Nuveen funds relative to other clients as well as the differences in portfolio investment policies, investor profiles, account sizes and regulatory requirements, all of which contribute to the variations in the fee schedules. The Board recognized the complexity and myriad of services the Adviser had provided to the Nuveen funds compared to the other types of clients as the Adviser is principally responsible for all aspects of operating the funds, including complying with the increased regulatory requirements required when managing the funds as well as the increased entrepreneurial, legal and regu-
216
latory risks that the Adviser incurs in sponsoring and managing the funds. Further, with respect to ETFs, the Board considered that Nuveen ETFs are passively managed compared to the active management of the other Nuveen funds which contributed to the differences in fee levels between the Nuveen ETFs and other Nuveen funds. In general, higher fee levels reflect higher levels of service provided by the Adviser, increased investment management complexity, greater product management requirements, and higher levels of business risk or some combination of these factors. The Board further considered that the Sub-Adviser’s fee is essentially for portfolio management services and therefore more comparable to the fees it receives for retail wrap accounts and other external sub-advisory mandates. The Board concluded the varying levels of fees were justified given, among other things, the inherent differences in the products and the level of services provided to the Nuveen funds versus other clients, the differing regulatory requirements and legal liabilities and the entrepreneurial, legal and regulatory risks incurred in sponsoring and advising a registered investment company.
3. Profitability of Fund Advisers
In their review, the Independent Board Members considered information regarding Nuveen’s level of profitability for its advisory services to the Nuveen funds for the calendar years 2019 and 2018. The Board reviewed, among other things, Nuveen’s net margins (pre-tax) (both including and excluding distribution expenses); gross and net revenue margins (pre- and post-tax); revenues, expenses, and net income (pre-tax and after-tax and before distribution) of Nuveen for fund advisory services; and comparative profitability data comparing the margins of Nuveen compared to the adjusted margins of certain peers with publicly available data and with the most comparable assets under management (based on asset size and asset composition) for each of the last two calendar years. The Board also reviewed the revenues and expenses the Adviser derived from its ETF product line for the 2018 and 2019 calendar years.
In reviewing the profitability data, the Independent Board Members recognized the subjective nature of calculating profitability as the information is not audited and is dependent on cost allocation methodologies to allocate expenses of Nuveen and its affiliates between the fund and non-fund businesses. The expenses to be allocated include direct expenses in servicing the Nuveen funds as well as indirect and/or shared costs (such as overhead, legal and compliance) some of which are attributed to the Nuveen funds pursuant to the cost allocation methodologies. The Independent Board Members reviewed a description of the cost allocation methodologies employed to develop the financial information and a summary of the history of changes to the methodology over the eleven-year period from 2008 to 2019. The Board had also appointed three Independent Board Members, along with the assistance of independent counsel, to serve as the Board’s liaisons to review the development of the profitability data and any proposed changes to the cost allocation methodology prior to incorporating any such changes and to report to the full Board. The Board recognized that other reasonable and valid allocation methodologies could be employed and could lead to significantly different results. Based on the data, the Independent Board Members noted that Nuveen’s net margins were higher in 2019 than the previous year and considered the key drivers behind the revenue and expense changes that impacted Nuveen’s net margins between the years. The Board also noted the reinvestments of some of the profits into the business through, among other things, the investment of seed capital in certain funds and continued investments in enhancements to information technology, internal infrastructure and data management improvements and global investment and innovation projects.
As noted above, the Independent Board Members also considered Nuveen’s margins from its relationship to the Nuveen funds compared to the adjusted margins of certain peers with publicly available data and with the most comparable assets under management (based on asset size and asset composition) to Nuveen for the calendar years 2019 and 2018. The Independent Board Members noted that Nuveen’s margins from its relationships with the Nuveen funds were on the low range compared to the adjusted margins of the peers. The Independent Board Members, however, recognized that it is difficult to make comparisons of profitability with other investment adviser peers given that comparative data is not generally public and the calculation of profitability is subjective and affected by numerous factors (such as types of funds a peer manages, its business mix, its cost of capital, the numerous assumptions underlying the methodology used to allocate expenses and other factors) which can have a significant impact on the results.
217
Annual Investment Management Agreement Approval Process (Unaudited) (continued)
Aside from Nuveen’s profitability, the Board recognized that the Adviser is a subsidiary of Nuveen, LLC, the investment management arm of Teachers Insurance and Annuity Association of America (“TIAA”). As such, the Board also reviewed a balance sheet for TIAA reflecting its assets, liabilities and capital and contingency reserves for the 2019 and 2018 calendar years to consider the financial strength of TIAA. The Board recognized the benefit of having an investment adviser and its parent with significant resources, particularly during periods of market stress.
In addition to Nuveen, the Independent Board Members also considered the profitability of the Sub-Adviser from its relationships with the Nuveen funds. In this regard, the Independent Board Members reviewed, among other things, the Sub-Adviser’s revenues, expenses and net revenue margins (pre- and post-tax) for its advisory activities for the calendar year ended December 31, 2019 as well as its pre-tax and after-tax net revenue margins for 2019 compared to such margins for 2018. The Independent Board Members also reviewed a profitability analysis reflecting the revenues, expenses and revenue margin (pre- and post-tax) by asset type for the Sub-Adviser for the calendar year ended December 31, 2019 and the pre- and post-tax revenue margins from 2019 and 2018.
In evaluating the reasonableness of the compensation, the Independent Board Members also considered any other ancillary benefits derived by the respective Fund Adviser from its relationship with the Nuveen funds as discussed in further detail below.
Based on a consideration of all the information provided, the Board noted that Nuveen’s and the Sub-Adviser’s level of profitability was acceptable and not unreasonable in light of the services provided.
D. Economies of Scale and Whether Fee Levels Reflect These Economies of Scale
The Board considered whether there have been economies of scale with respect to the management of the Nuveen funds and whether these economies of scale have been appropriately shared with the funds. The Board recognized that although economies of scale are difficult to measure, there are several methods to help share the benefits of economies of scale, including breakpoints in the management fee schedule, fee waivers and/or expense limitations, the pricing of Nuveen funds at scale at inception and investments in Nuveen’s business which can enhance the services provided to the funds for the fees paid. The Board noted that Nuveen generally has employed these various methods. In this regard, the Board noted that the management fee of the Adviser is generally comprised of a fund-level component and a complex-level component each with its own breakpoint schedule, subject to certain exceptions. The Board reviewed the fund-level and complex-level fee schedules. The Board considered that the fund-level breakpoint schedules are designed to share economies of scale with shareholders if the particular fund grows, and the complex-level breakpoint schedule is designed to deliver the benefits of economies of scale to shareholders when the eligible assets in the complex pass certain thresholds even if the assets of a particular fund are unchanged or have declined. With respect to the Nuveen closed-end funds, the Board noted that, although such funds may from time to time make additional share offerings, the growth of their assets would occur primarily through the appreciation of such funds’ investment portfolios. Further, in the calculation of the complex-level component, the Board noted that it had approved the acquisition of several Nuveen funds by similar TIAA-CREF funds in 2019. However, to mitigate the loss of the assets of these Nuveen funds deemed eligible to be included in the calculation of the complex-wide fee when these Nuveen funds left the complex upon acquisition, Nuveen agreed to credit approximately $460 million to assets under management to the Nuveen complex in calculating the complex-wide component.
The Independent Board Members also recognized the Adviser’s continued reinvestment in its business through, among other things, investments in its business infrastructure and information technology, portfolio accounting system and other systems and platforms that will, among other things, support growth, simplify and enhance information sharing, and enhance the investment process to the benefit of all of the Nuveen funds.
Based on its review, the Board concluded that the current fee arrangements together with the Adviser’s reinvestment in its business appropriately shared any economies of scale with shareholders.
218
E. Indirect Benefits
The Independent Board Members received and considered information regarding other benefits the respective Fund Adviser or its affiliates may receive as a result of their relationship with the Nuveen funds. The Board considered the compensation that an affiliate of the Adviser received for serving as co-manager in the initial public offerings of new closed-end funds and for serving as an underwriter on shelf offerings of existing closed-end funds. In addition, the Independent Board Members also noted that various sub-advisers (including the Sub-Adviser) may engage in soft dollar transactions pursuant to which they may receive the benefit of research products and other services provided by broker-dealers executing portfolio transactions on behalf of the applicable Nuveen funds, although the Board recognized that certain sub-advisers may be phasing out the use of soft dollars over time.
The Board, however, noted that the benefits for the Sub-Adviser when transacting in fixed-income securities may be more limited as such securities generally trade on a principal basis and therefore do not generate brokerage commissions. Further, the Board considered that although the Sub-Adviser may benefit from the receipt of research and other services that it may otherwise have to pay for out of its own resources, the research may also benefit the Nuveen funds to the extent it enhances the ability of the Sub-Adviser to manage such funds or is acquired through the commissions paid on portfolio transactions of other clients.
Based on its review, the Board concluded that any indirect benefits received by a Fund Adviser as a result of its relationship with the Funds were reasonable and within acceptable parameters.
F. Other Considerations
The Board Members did not identify any single factor discussed previously as all-important or controlling. The Board Members, including the Independent Board Members, concluded that the terms of each Advisory Agreement were fair and reasonable, that the respective Fund Adviser’s fees were reasonable in light of the services provided to each Fund and that the Advisory Agreements be renewed.
PART II
Nuveen Dynamic Municipal Opportunities Fund
At a meeting held on January 23, 2020 (the “Meeting”), the Board Members, including the Independent Board Members, considered and approved the investment management agreement (for purposes of this Part II, the “Investment Management Agreement”) pursuant to which Nuveen Fund Advisors, LLC (the “Adviser”) serves as investment adviser to Nuveen Dynamic Municipal Opportunities Fund (for purposes of this Part II, the “Fund”) and the investment sub-advisory agreement (for purposes of this Part II, the “Sub-Advisory Agreement”) pursuant to which Nuveen Asset Management, LLC (the “Sub-Adviser”) serves as investment sub-adviser to the Fund. For purposes of this Part II, the Adviser and the Sub-Adviser are each hereafter a “Fund Adviser.” In addition, for purposes of this Part II, the Investment Management Agreement and the Sub-Advisory Agreement are each hereafter an “Advisory Agreement” and collectively, the “Advisory Agreements.”
To assist the Board in its evaluation of an Advisory Agreement with a Fund Adviser at the Meeting, the Independent Board Members had received, in adequate time in advance of the Meeting or at prior meetings, materials which outlined, among other things:
| • | the nature, extent and quality of the services expected to be provided by the Fund Adviser; |
| • | the organization of the Fund Adviser, including the responsibilities of various departments and key personnel; |
| • | the expertise and background of the Fund Adviser with respect to the Fund’s investment strategy; |
| • | certain performance-related information (as described below); |
| • | the profitability of Nuveen and its affiliates for their advisory activities; |
219
Annual Investment Management Agreement Approval Process (Unaudited) (continued)
| • | the proposed management fees of the Fund Adviser, including comparisons of such fees with the management fees of comparable funds; |
| • | the expected expenses of the Fund, including comparisons of the Fund’s expected expense ratio with the expense ratios of comparable funds; and |
| • | the soft dollar practices of the Fund Adviser, if any. |
At the Meeting and/or prior meetings, the Adviser made presentations to and responded to questions from the Board. During the Meeting and/or prior meetings, the Independent Board Members also met privately with their legal counsel to, among other things, review the Board’s duties under the 1940 Act, the general principles of state law in reviewing and approving advisory contracts, the standards used by courts in determining whether investment company boards of directors have fulfilled their duties, factors to be considered in voting on advisory contracts and an adviser’s fiduciary duty with respect to advisory agreements and compensation. It is with this background that the Independent Board Members considered the Advisory Agreements. As outlined in more detail below, the Independent Board Members considered various factors they believed relevant with respect to the Fund, including, among other things: (a) the nature, extent and quality of the services expected to be provided by the Fund Advisers; (b) investment performance, as described below; (c) the advisory fees and costs of the services expected to be provided to the Fund and the profitability of the Fund Advisers; (d) the extent of any anticipated economies of scale; (e) any benefits expected to be derived by the Fund Advisers from their relationships with the Fund; and (f) other factors. Each Board Member may have accorded different weight to the various factors in reaching his or her conclusions with respect to the Fund’s Advisory Agreements.
A. Nature, Extent and Quality of Services
The Independent Board Members considered the nature, extent and quality of the respective Fund Adviser’s services, including portfolio management services and administrative services. Given that the Adviser and the Sub-Adviser already serve as adviser and sub-adviser, respectively, to other Nuveen funds overseen by the Board Members, the Board has a good understanding of each such Fund Adviser’s organization, operations, personnel and services. As the Independent Board Members meet regularly throughout the year to oversee the Nuveen funds, including funds currently advised by the Fund Advisers, the Independent Board Members have relied upon their knowledge from their meetings and any other interactions throughout the year with the respective Fund Adviser in evaluating the Advisory Agreements.
At the Meeting and/or at prior meetings, the Independent Board Members reviewed materials outlining, among other things, the respective Fund Adviser’s organization and business; the types of services that such Fund Adviser or its affiliates provide to the Nuveen funds (as applicable) and are expected to provide to the Fund; and the experience of the respective Fund Adviser with applicable investment strategies. Further, at the Meeting and/or at prior meetings, the Independent Board Members have evaluated the background and experience of the relevant investment personnel.
With respect to services, the Board noted that the Fund would be a registered investment company that would operate in a regulated industry. In considering the services that were expected to be provided by the Fund Advisers, at the Meeting and/or at prior meetings, the Board has recognized the comprehensive set of services the Adviser provides to operate the Nuveen funds in a highly regulated industry. Some of the functions for which the Adviser is responsible include, but are not limited to: product management; investment oversight; securities valuation services; risk management; fund administration; oversight of shareholder services and transfer agency functions; board relations services; compliance and regulatory oversight services; legal support and oversight of outside law firms; and leverage, capital and distribution management services. In addition to the services provided by the Adviser, the Board has also considered the risks borne by the Adviser and its affiliates in managing the Nuveen funds, including entrepreneurial, operational, reputational, regulatory and litigation risks.
220
The Independent Board Members noted that the Adviser would oversee the Sub-Adviser and recognized that the Sub-Adviser and its investment personnel generally would be responsible for the management of the Fund’s portfolio. In this regard, the Board Members recognized the Sub-Adviser’s relevant experience and expertise.
Based on their review, the Independent Board Members found that, overall, the nature, extent and quality of services expected to be provided to the Fund under each Advisory Agreement were satisfactory.
B. Investment Performance
The Fund was new and, therefore, did not have its own performance history. The Independent Board Members noted, however, that the Fund’s investment strategy was expected to be substantially similar to that of the Nuveen Strategic Municipal Opportunities Fund (the “Strategic Fund”), a Nuveen open-end fund which had an inception date of December 16, 2014. In this regard, the Independent Board Members reviewed certain performance information relating to the Strategic Fund, including performance history information for the one-year, three-year and five-year periods as of December 31, 2019.
C. Fees, Expenses and Profitability
1. Fees and Expenses
In evaluating the management fees and expenses that the Fund was expected to bear, the Independent Board Members considered, among other things, the Fund’s proposed management fee structure and its expected expense ratio in absolute terms as well as compared with the fees and expense ratios of comparable funds. Accordingly, the Independent Board Members reviewed, among other things, the proposed advisory fee and estimated net total expense ratio for the Fund (based on both common assets and total managed assets), as well as comparative fee and expense data pertaining to the Fund’s peers in the Lipper category in which the Fund is expected to be classified. In considering the Fund’s advisory fees, the Board also considered the differences between the investment strategy of the Fund and the investment strategies of the Strategic Fund, certain other Nuveen municipal closed-end funds and certain funds in the Fund’s expected Lipper category. Further, the Independent Board Members took into account the proposed sub-advisory fee for the Fund.
The Independent Board Members recognized that assets attributable to the Fund’s use of leverage would be included in the amount of assets upon which the advisory fee is calculated. In this regard, the Independent Board Members noted that the advisory fee is based on a percentage of average daily “Managed Assets.” “Managed Assets” generally means the total assets of the Fund, minus the sum of its accrued liabilities (other than Fund liabilities incurred for the express purpose of creating leverage). “Total assets” for this purpose includes assets attributable to the Fund’s use of leverage (whether or not those assets are reflected in the Fund’s financial statements for purposes of generally accepted accounting principles), and derivatives will be valued at their market value. The Independent Board Members recognized that the fact that a decision to employ or increase the Fund’s leverage will have the effect, all other things being equal, of increasing Managed Assets (and, in turn, increasing the Adviser’s and the Sub-Adviser’s management fees), means that the Adviser and the Sub-Adviser may have a conflict of interest in determining whether to use or increase leverage. The Independent Board Members noted, however, that the Adviser and the Sub-Adviser would seek to manage that potential conflict by recommending to the Board to leverage the Fund (or increase such leverage) when they determine that such action would be in the best interests of the Fund and its common shareholders, and by periodically reviewing with the Board the Fund’s performance and the impact of the use of leverage on that performance.
The Independent Board Members considered the proposed management fee rate as a percentage of Managed Assets before any fund-level and complex-wide breakpoints. Based on their review of the fee and expense information provided, the Independent Board Members determined that the Fund’s management fees (as applicable) to a Fund Adviser were reasonable in light of the nature, extent and quality of services to be provided to the Fund.
221
Annual Investment Management Agreement Approval Process (Unaudited) (continued)
2. Comparisons with the Fees of Other Clients
At the Meeting and/or at prior meetings, the Board has reviewed information regarding the fee rates that the Fund Advisers charge for certain other types of clients and the type of services provided to these other clients. In conjunction with municipal funds, with respect to the Adviser and/or the Sub-Adviser, such other clients may include retail and institutional managed accounts, passively managed exchange-traded funds sub-advised by the Sub-Adviser but that are offered by another fund complex and municipal managed accounts offered by an unaffiliated adviser. With respect to the Sub-Adviser, the Board has previously reviewed, among other things, the fee range and average fee of municipal retail wrap accounts and municipal institutional accounts.
In addition to the comparative fee data, the Board has also reviewed, among other things, a description of the different levels of services provided to certain other clients compared to the services provided to the Nuveen funds as well as the differences in portfolio investment policies, investor profiles, account sizes and regulatory requirements, all of which contribute to the variations in the fee schedules. The Board has previously noted, among other things, the wide range of services in addition to investment management services provided to the Nuveen funds when the Adviser is principally responsible for all aspects of operating the funds, including the increased regulatory requirements that must be met in managing the funds, the larger account sizes of managed accounts and the increased entrepreneurial, legal and regulatory risks that the Adviser incurs in sponsoring and managing the Nuveen funds. In general, higher fee levels reflect higher levels of service provided by the Adviser, increased investment management complexity, greater product management requirements, and higher levels of business risk or some combination of these factors. Further, the Board has considered that the Sub-Adviser’s fee is essentially for portfolio management services and therefore more comparable to the fees it receives for retail wrap accounts and other external sub-advisory mandates. The Board has previously concluded that the varying levels of fees were justified given, among other things, the inherent differences in the products and the level of services provided to the Nuveen funds versus other clients, the differing regulatory requirements and legal liabilities and the entrepreneurial, legal and regulatory risks incurred in sponsoring and advising a registered investment company.
3. Profitability of Fund Advisers
In conjunction with their review of fees, at the Meeting and/or at prior meetings, the Independent Board Members have considered information regarding Nuveen’s level of profitability for its advisory services to the Nuveen funds for the calendar years 2018 and 2017. The Board has previously reviewed, among other things, Nuveen’s net margins (pre-tax) (both including and excluding distribution expenses); gross and net revenue margins (pre- and post-tax); revenues, expenses, and net income (pre-tax and after-tax and before distribution) of Nuveen for fund advisory services; and comparative profitability data comparing the margins of Nuveen compared to the adjusted margins of certain peers with publicly available data and with the most comparable assets under management (based on asset size and asset composition) for the 2018 and 2017 calendar years. The Board has also reviewed the revenues and expenses the Adviser derived from its exchange-traded fund product line that was launched in 2016. The Independent Board Members have noted that Nuveen’s net margins were higher in 2018 than the previous year and considered the key drivers behind the revenue and expense changes that impacted Nuveen’s net margins between the years. The Board has considered the costs of investments in the Nuveen business, including the investment of seed capital in certain Nuveen funds and additional investments in infrastructure and technology. The Independent Board Members have also noted that Nuveen’s margins from its relationships with the Nuveen funds were on the low range compared to the adjusted margins of the peers; however, the Independent Board Members have recognized the inherent limitations of the comparative data of other publicly traded peers given that the calculation of profitability is rather subjective and numerous factors (such as types of funds, business mix, cost of capital, methodology to allocate expenses and other factors) can have a significant impact on the results.
Aside from Nuveen’s profitability, the Board has recognized that the Adviser is a subsidiary of Nuveen, LLC, the investment management arm of Teachers Insurance and Annuity Association of America (“TIAA”). As such, the Board has also reviewed a balance sheet for TIAA reflecting its assets, liabilities and capital and contingency reserves for the 2018 and 2017 calendar years to consider the financial strength of TIAA having recognized the importance of having an adviser with significant resources.
222
In addition, the Independent Board Members have reviewed the Sub-Adviser’s revenues, expenses and revenue margins (pre-and post-tax) for its advisory activities for the calendar year ended December 31, 2018. The Independent Board Members have also reviewed a profitability analysis reflecting the revenues, expenses and revenue margin (pre- and post-tax) by asset type for the Sub-Adviser for the calendar year ending December 31, 2018 and the pre- and post-tax revenue margin from 2018 and 2017.
In evaluating the reasonableness of the compensation, the Independent Board Members have also considered any other ancillary benefits derived by the respective Fund Adviser from its relationship with the Nuveen funds as discussed in further detail below.
Based on a consideration of all the information provided, the Board has noted that Nuveen’s and the Sub-Adviser’s level of profitability was acceptable and not unreasonable in light of the services provided.
D. Economies of Scale and Whether Fee Levels Reflect These Economies of Scale
The Independent Board Members considered whether the Fund could be expected to benefit from any economies of scale. Although the Board has recognized that economies of scale are difficult to measure, the Independent Board Members have noted that economies of scale may be shared in various ways, including through breakpoints in the management fee schedule and through the Adviser’s investment in its business, which can enhance the services provided to the Nuveen funds. With respect to breakpoint schedules, because the Board has previously recognized that economies of scale may occur not only when the assets of a particular Nuveen fund grow, but also when the assets in the complex grow, the Nuveen funds generally pay the Adviser a management fee comprised of a fund-level component and a complex-level component, each with its own breakpoint schedule, subject to certain exceptions. In general terms, the breakpoint schedule at the fund level reduces fees as assets in the particular fund pass certain thresholds and the breakpoint schedule at the complex level reduces fees on the Nuveen funds as the eligible assets in the complex pass certain thresholds. Accordingly, the Independent Board Members reviewed and considered the proposed management fees for the Fund, taking into account the fund-level and complex-level breakpoint schedules. In this regard, however, the Fund is a closed-end fund and the Independent Board Members have recognized that although closed-end funds may from time to time make additional share offerings, the growth of their assets would occur primarily through the appreciation of such funds’ investment portfolios. In addition, the Independent Board Members have recognized the Adviser’s continued reinvestment in its business through, among other things, investments in its business infrastructure and information technology, portfolio accounting system as well as other systems and platforms that will, among other things, support growth, simplify and enhance information sharing, and enhance the investment process to the benefit of all of the Nuveen funds.
Based on their review, the Independent Board Members concluded that the proposed fee structure was acceptable and reflected economies of scale to be shared with the Fund’s shareholders when assets under management increase.
E. Indirect Benefits
The Independent Board Members received and considered information at the Meeting and/or at prior meetings regarding other benefits that a Fund Adviser or its affiliates may receive as a result of their relationship with the Nuveen funds. With respect to closed-end funds, the Independent Board Members have considered that an affiliate of the Adviser serves as co-manager in the initial public offerings of new closed-end funds for which it may receive revenue and serves as an underwriter on shelf offerings of existing closed-end funds for which it receives compensation.
In addition to the above, at the Meeting and/or at prior meetings, the Independent Board Members have noted that the Sub-Adviser engages in soft dollar transactions pursuant to which it may receive the benefit of research products and other services provided by broker-dealers executing portfolio transactions on behalf of the applicable Nuveen funds. The Board, however, has noted that the benefits for sub-advisers transacting in fixed-income securities may be more limited as such securities generally trade on a principal basis and therefore do not generate brokerage commissions. Further, the Board has noted that although the Sub-Adviser may benefit from the receipt of research and other services that it may otherwise have to pay for out of its own
223
Annual Investment Management Agreement Approval Process (Unaudited) (continued)
resources, the research may also benefit a Nuveen fund to the extent it enhances the ability of the Sub-Adviser to manage such fund or is acquired through the commissions paid on portfolio transactions of other clients.
Based on their review, the Independent Board Members concluded that any indirect benefits expected to be received by a Fund Adviser as a result of its relationship with the Fund were reasonable and within acceptable parameters.
F. Approval
The Independent Board Members did not identify any single factor discussed previously as all-important or controlling. The Board Members, including a majority of the Independent Board Members, concluded that the terms of the Investment Management Agreement and the Sub-Advisory Agreement were fair and reasonable, that the respective Fund Adviser’s fees were reasonable in light of the services to be provided to the Fund and that the Investment Management Agreement and Sub-Advisory Agreement should be and were approved on behalf of the Fund.
224
Board Members &Officers (Unaudited) The management of the Funds, including general supervision of the duties performed for the Funds by the Adviser, is the responsibility of the Board of Trustees of the Funds. None of the trustees who are not “interested” persons of the Funds (referred to herein as “independent board members”) has ever been a director or employee of, or consultant to, Nuveen or its affiliates. The names and business addresses of the trustees and officers of the Funds, their principal occupations and other affiliations during the past five years, the number of portfolios each Trustee oversees and other directorships they hold are set forth below.
| | | | | |
| Name, | Position(s) Held | Year First | Principal | Number |
| Year of Birth | with the Funds | Elected or | Occupation(s) | of Portfolios |
| & Address | | Appointed | Including other | in Fund Complex |
| | and Term(1) | Directorships | Overseen by |
| | | During Past 5 Years | Board Member |
|
Independent Board Members: | | | | |
|
| ■ TERENCE J. TOTH | | | Formerly, a Co-Founding Partner, Promus Capital (investment advisory | |
| 1959 | | | firm) (2008-2017); Director, Quality Control Corporation (manufacturing) | |
| 333 W. Wacker Drive | Chairman and | 2008 | (since 2012); member: Catalyst Schools of Chicago Board (since 2008) | 150 |
| Chicago, IL 6o6o6 | Board Member | Class II | and Mather Foundation Board (philanthropy) (since 2012), and chair of | |
| | | its Investment Committee; formerly, Director, Fulcrum IT Services LLC | |
| | | (information technology services firm to government entities) (2010-2019); | |
| | | formerly, Director, Legal & General Investment Management America, Inc. | |
| | | (asset management) (2008-2013); formerly, CEO and President, Northern | |
| | | Trust Global Investments (financial services) (2004-2007): Executive Vice | |
| | | President, Quantitative Management & Securities Lending (2000-2004); | |
| | | prior thereto, various positions with Northern Trust Company (financial | |
| | | services) (since 1994); formerly, Member, Northern Trust Mutual Funds | |
| | | Board (2005-2007), Northern Trust Global Investments Board (2004-2007), | |
| | | Northern Trust Japan Board (2004-2007), Northern Trust Securities Inc. | |
| | | Board (2003-2007) and Northern Trust Hong Kong Board (1997-2004). | |
|
■ JACK B. EVANS | | | Chairman (since 2019), formerly, President (1996-2019), The Hall-Perrine | |
| 1948 | | | Foundation, (private philanthropic corporation); Director and Chairman, | |
| 333 W. Wacker Drive | Board Member | 1999 | United Fire Group, a publicly held company; Director, Public Member, | 150 |
| Chicago, IL 6o6o6 | | Class III | American Board of Orthopaedic Surgery (since 2015); Life Trustee of Coe | |
| | | College and the Iowa College Foundation; formerly, President Pro-Tem of | |
| | | the Board of Regents for the State of Iowa University System; formerly, | |
| | | Director, Alliant Energy and The Gazette Company (media and publishing); | |
| | | formerly, Director, Federal Reserve Bank of Chicago; formerly, President | |
| | | and Chief Operating Officer, SCI Financial Group, Inc., (regional financial | |
| | | services firm). | |
|
| ■ WILLIAM C. HUNTER | | | Dean Emeritus, formerly, Dean, Tippie College of Business, University of | |
| 1948 | | | Iowa (2006-2012); Director of Wellmark, Inc. (since 2009); past Director | |
| 333 W. Wacker Drive | Board Member | 2003 | (2005-2015), and past President (2010-2014) Beta Gamma Sigma, Inc., | 150 |
| Chicago, IL 6o6o6 | | Class I | The International Business Honor Society; formerly, Director (2004-2018) | |
| | | of Xerox Corporation; Dean and Distinguished Professor of Finance, | |
| | | School of Business at the University of Connecticut (2003-2006); | |
| | | previously, Senior Vice President and Director of Research at the Federal | |
| | | Reserve Bank of Chicago (1995-2003); formerly, Director (1997-2007), | |
| | | Credit Research Center at Georgetown University. | |
225
Board Members & Officers (Unaudited) (continued)
| | | | | |
| Name, | Position(s) Held | Year First | Principal | Number |
| Year of Birth | with the Funds | Elected or | Occupation(s) | of Portfolios |
| & Address | | Appointed | Including other | in Fund Complex |
| | and Term(1) | Directorships | Overseen by |
| | | During Past 5 Years | Board Member |
|
Independent Board Members (continued): | | | |
|
| ■ ALBIN F. MOSCHNER | | | Founder and Chief Executive Officer, Northcroft Partners, LLC, | |
| 1952 | | | (management consulting) (since 2012); formerly, Chairman (2019), and | |
| 333 W. Wacker Drive | Board Member | 2016 | Director (2012-2019), USA Technologies, Inc., (provider of solutions | 150 |
| Chicago, IL 6o6o6 | | Class III | and services to facilitate electronic payment transactions); formerly, | |
| | | Director, Wintrust Financial Corporation (1996-2016); previously, held | |
| | | positions at Leap Wireless International, Inc., (telecommunication | |
| | | services) including Consultant (2011-2012), Chief Operating Officer | |
| | | (2008-2011), and Chief Marketing Officer (2004-2008); formerly, | |
| | | President, Verizon Card Services division of Verizon Communications, | |
| | | Inc. (2000-2003); formerly, President, One Point Services at One Point | |
| | | Communications (telecommunication services) (1999- 2000); formerly, | |
| | | Vice Chairman of the Board, Diba, Incorporated (internet technology | |
| | | provider) (1996-1997); formerly, various executive positions (1991-1996) | |
| | | and Chief Executive Officer (1995-1996) of Zenith Electronics Corporation | |
| | | (consumer electronics). | |
|
| ■ JOHN K. NELSON | | | Member of Board of Directors of Core12 LLC. (private firm which | |
| 1962 | | | develops branding, marketing and communications strategies for | |
| 333 W. Wacker Drive | Board Member | 2013 | clients) (since 2008); served on The President’s Council of Fordham | 150 |
| Chicago, IL 6o6o6 | | Class II | University (2010-2019) and previously a Director of the Curran Center | |
| | | for Catholic American Studies (2009- 2018); formerly, senior external | |
| | | advisor to the Financial Services practice of Deloitte Consulting LLP. | |
| | | (2012-2014); former Chair of the Board of Trustees of Marian University | |
| | | (2010-2014 as trustee, 2011-2014 as Chair); formerly Chief Executive | |
| | | Officer of ABN AMRO Bank N.V., North America, and Global Head of | |
| | | the Financial Markets Division (2007-2008), with various executive | |
| | | leadership roles in ABN AMRO Bank N.V. between 1996 and 2007. | |
|
| ■ JUDITH M. STOCKDALE | | | Board Member, Land Trust Alliance (national public charity addressing | |
| 1947 | | | natural land and water conservation in the U.S.) (since 2013); formerly, | |
| 333 W. Wacker Drive | Board Member | 1997 | Board Member, U.S. Endowment for Forestry and Communities (national | 150 |
| Chicago, IL 6o6o6 | | Class I | endowment addressing forest health, sustainable forest production and | |
| | | markets, and economic health of forest-reliant communities in the U.S.) | |
| | | (2013-2019); formerly, Executive Director (1994-2012), Gaylord and Dorothy | |
| | | Donnelley Foundation (private foundation endowed to support both natural | |
| | | land conservation and artistic vitality); prior thereto, Executive Director, | |
| | | Great Lakes Protection Fund (1990-1994). | |
|
| ■ CAROLE E. STONE | | | Former Director, Chicago Board Options Exchange, Inc. (2006-2017); | |
| 1947 | | | and C2 Options Exchange, Incorporated (2009-2017); former Director, | |
| 333 W. Wacker Drive | Board Member | 2007 | Cboe, Global Markets, Inc., formerly, CBOE Holdings, Inc. (2010-May | 150 |
| Chicago, IL 6o6o6 | | Class I | 2020); formerly, Commissioner, New York State Commission on | |
| | | Public Authority Reform (2005-2010). | |
|
■ MATTHEW THORNTON III | | | Formerly, Executive Vice President and Chief Operating Officer | |
| 1958 | | | (2018-2019), FedEx Freight Corporation, a subsidiary of FedEx Corporation | |
| 333 West Wacker Drive | Board Member | 2020 | (“FedEx”) (provider of transportation, e-commerce and business services | 150 |
| Chicago, IL 60606 | | Class III | through its portfolio of companies); formerly, Senior Vice President, U.S. | |
| | | Operations (2006-2018), Federal Express Corporation, a subsidiary of | |
| | | FedEx; formerly, Member of the Board of Directors (2012-2018), Safe Kids | |
| | | Worldwide® (a non-profit organization dedicated to preventing childhood | |
| | | injuries). Member of the Board of Directors (since 2014), The Sherwin-Williams |
| | | Company (develops, manufactures, distributes and sells paints, coatings and | |
| | | related products); Director (since November 2020), Crown Castle International |
| | | Corp. (owns, operates and leases cell towers and fiber routes supporting small |
| | | cells and fiber solutions). | |
226
| | | | | |
| Name, | Position(s) Held | Year First | Principal | Number |
| Year of Birth | with the Funds | Elected or | Occupation(s) | of Portfolios |
| & Address | | Appointed | Including other | in Fund Complex |
| | and Term(1) | Directorships | Overseen by |
| | | During Past 5 Years | Board Member |
|
Independent Board Members (continued): | | | |
|
| ■ MARGARET L. WOLFF | | | Formerly, member of the Board of Directors (2013-2017) of Travelers | |
| 1955 | | | Insurance Company of Canada and The Dominion of Canada General | |
| 333 W. Wacker Drive | Board Member | 2016 | Insurance Company (each, a part of Travelers Canada, the Canadian | |
| Chicago, IL 6o6o6 | | Class I | operation of The Travelers Companies, Inc.); formerly, Of Counsel, | 150 |
| | | Skadden, Arps, Slate, Meagher & Flom LLP (legal services, Mergers & | |
| | | Acquisitions Group) (2005-2014); Member of the Board of Trustees | |
| | | of New York-Presbyterian Hospital (since 2005); Member (since 2004) | |
| | | and Chair (since 2015) of the Board of Trustees of The John A. Hartford | |
| | | Foundation (philanthropy dedicated to improving the care of older | |
| | | adults); formerly, Member (2005-2015) and Vice Chair (2011-2015) of | |
| | | the Board of Trustees of Mt. Holyoke College. | |
|
| ■ ROBERT L. YOUNG | | | Formerly, Chief Operating Officer and Director, J.P.Morgan Investment | |
| 1963 | | | Management Inc. (financial services) (2010-2016); formerly, President | |
| 333 W. Wacker Drive | Board Member | 2017 | and Principal Executive Officer (2013-2016), and Senior Vice President | 150 |
| Chicago, IL 6o6o6 | | Class II | and Chief Operating Officer (2005-2010), of J.P.Morgan Funds; formerly, | |
| | | Director and various officer positions for J.P.Morgan Investment | |
| | | Management Inc. (formerly, JPMorgan Funds Management, Inc. and | |
| | | formerly, One Group Administrative Services) and JPMorgan Distribution | |
| | | Services, Inc. (financial services) (formerly, One Group Dealer Services, | |
| | | Inc.) (1999-2017). | |
227
Board Members & Officers (Unaudited) (continued)
| | | | |
| Name, | Position(s) Held | Year First | Principal |
| Year of Birth | with the Funds | Elected or | Occupation(s) |
| & Address | | Appointed(2) | During Past 5 Years |
|
Officers of the Funds: | | | |
|
| ■ DAVID J. LAMB | | | Managing Director of Nuveen Fund Advisors, LLC (since 2020); Managing Director (since 2017), |
| 1963 | Chief | | formerly, Senior Vice President of Nuveen (since 2006), Vice President prior to 2006. |
| 333 W. Wacker Drive | Administrative | 2015 | |
| Chicago, IL 6o6o6 | Officer | | |
|
| ■ MARK J. CZARNIECKI | | | Vice President and Assistant Secretary of Nuveen Securities, LLC (since 2016) and Nuveen Fund |
| 1979 | Vice President | | Advisors (since 2017); Vice President and Associate General Counsel of Nuveen (since 2013) and |
| 901 Marquette Avenue | and Assistant | 2013 | Vice President, Assistant Secretary and Associate General Counsel of Nuveen Asset Management |
| Minneapolis, MN 55402 | Secretary | | (since 2018). |
|
| ■ DIANA R. GONZALEZ | | | Vice President and Assistant Secretary of Nuveen Fund Advisors, LLC (since 2017); Vice |
| 1978 | Vice President | | President and Associate General Counsel of Nuveen (since 2017); Associate General Counsel |
| 333 W. Wacker Drive | and Assistant | 2017 | of Jackson National Asset Management (2012-2017). |
| Chicago, IL 6o6o6 | Secretary | | |
|
| ■ NATHANIEL T. JONES | | | Managing Director (since 2017), formerly, Senior Vice President (2016-2017), formerly, Vice |
| 1979 | | | President (2011-2016) of Nuveen; Managing Director (since 2015) of Nuveen Fund Advisors, LLC; |
| 333 W. Wacker Drive | Vice President | | Chartered Financial Analyst. |
| Chicago, IL 6o6o6 | and Treasurer | 2016 | |
|
| ■ TINA M. LAZAR | | | Managing Director (since 2017), formerly, Senior Vice President (2014-2017) of Nuveen |
| 1961 | | | Securities, LLC. |
| 333 W. Wacker Drive | Vice President | 2002 | |
| Chicago, IL 6o6o6 | | | |
|
| ■ BRIAN J. LOCKHART | | | Managing Director (since 2019) of Nuveen Fund Advisors, LLC; Managing Director (since 2017), |
| 1974 | | | formerly, Vice President (2010-2017) of Nuveen; Head of Investment Oversight (since 2017), |
| 333 W. Wacker Drive | Vice President | 2019 | formerly, Team Leader of Manager Oversight (2015-2017); Chartered Financial Analyst and Certified |
| Chicago, IL 6o6o6 | | | Financial Risk Manager. |
|
| ■ JACQUES M. LONGERSTAEY | | | Senior Managing Director, Chief Risk Officer, Nuveen, LLC (since May 2019); Senior Managing |
| 1963 | | | Director (since May 2019) of Nuveen Fund Advisors, LLC; formerly, Chief Investment and Model |
| 8500 Andrew | Vice President | 2019 | Risk Officer, Wealth & Investment Management Division, Wells Fargo Bank (NA) (from 2013-2019). |
| Carnegie Blvd. | | | |
| Charlotte, NC 28262 | | | |
|
| ■ KEVIN J. MCCARTHY | | | Senior Managing Director (since 2017) and Secretary and General Counsel (since 2016) of Nuveen |
| 1966 | Vice President | | Investments, Inc., formerly, Executive Vice President (2016-2017) and Managing Director and |
| 333 W. Wacker Drive | and Assistant | 2007 | Assistant Secretary (2008-2016); Senior Managing Director (since 2017) and Assistant Secretary |
| Chicago, IL 6o6o6 | Secretary | | (since 2008) of Nuveen Securities, LLC, formerly Executive Vice President (2016-2017) and |
| | | Managing Director (2008-2016); Senior Managing Director (since 2017), and Secretary (since 2016) |
| | | of Nuveen Fund Advisors, LLC, formerly, Co-General Counsel (2011-2020), Executive Vice President |
| | | (2016-2017), Managing Director (2008-2016) and Assistant Secretary (2007-2016); Senior |
| | | Managing Director (since 2017), Secretary (since 2016) of Nuveen Asset Management, LLC, |
| | | formerly, Associate General Counsel (2011-2020), Executive Vice President (2016-2017) and |
| | | Managing Director and Assistant Secretary (2011- 2016); Senior Managing Director (since 2017) |
| | | and Secretary (since 2016) of Nuveen Investments Advisers, LLC, formerly Executive Vice President |
| | | (2016- 2017); Vice President (since 2007) and Secretary (since 2016), formerly, Assistant Secretary, |
| | | of NWQ Investment Management Company, LLC, Symphony Asset Management LLC, Santa |
| | | Barbara Asset Management, LLC and Winslow Capital Management, LLC (since 2010). Senior |
| | | Managing Director (since 2017) and Secretary (since 2016) of Nuveen Alternative Investments, LLC. |
|
| ■ JON SCOTT MEISSNER | | | Managing Director of Mutual Fund Tax and Financial Reporting groups at Nuveen (since 2017); |
| 1973 | | | Managing Director of Nuveen Fund Advisors, LLC (since 2019); Senior Director of Teachers |
| 8500 Andrew | Vice President | 2019 | Advisors, LLC and TIAA-CREF Investment Management, LLC (since 2016); Senior Director (since |
| Carnegie Blvd. | | | 2015) Mutual Fund Taxation to the TIAA-CREF Funds, the TIAA-CREF Life Funds, the TIAA Separate |
| Charlotte, NC 28262 | | | Account VA-1 and the CREF Accounts; has held various positions with TIAA since 2004. |
228
| | | | |
| Name, | Position(s) Held | Year First | Principal |
| Year of Birth | with the Funds | Elected or | Occupation(s) |
| & Address | | Appointed(2) | During Past 5 Years |
|
Officers of the Funds (continued): | | |
|
| ■ DEANN D. MORGAN | | | President, Nuveen Fund Advisors, LLC (since November 2020); Executive Vice President, Global |
| 1969 | | | Head of Product at Nuveen (since 2019); Co-Chief Executive Officer of Nuveen Securities, LLC |
| 730 Third Avenue | Vice President | 2020 | since March 2020); Managing Member MDR Collaboratory LLC (since 2018); Managing Director, |
| New York, NY 10017 | | | (Head of Wealth Management Product Structuring & COO Multi Asset Investing. The Blackstone |
| | | Group (2013-2017) |
|
| ■ CHRISTOPHER M. ROHRBACHER | | | Managing Director (since 2017) and Assistant Secretary of Nuveen Securities, LLC; Managing |
| 1971 | Vice President | | Director (since 2017), formerly, Senior Vice President (2016-2017), General Counsel (since 2020), |
| 333 W. Wacker Drive | and Assistant | 2008 | formerly, Co-General Counsel (2019-2020) and Assistant Secretary (since 2016) of Nuveen |
| Chicago, IL 6o6o6 | Secretary | | Fund Advisors, LLC; Managing Director, Associate General Counsel and Assistant Secretary of |
| | | Nuveen Asset Management, LLC (since 2020); Managing Director (since 2017), formerly, Senior |
| | | Vice President (2012-2017) and Associate General Counsel (since 2016), formerly, Assistant General |
| | | Counsel (2008-2016) of Nuveen. |
|
| ■ WILLIAM A. SIFFERMANN | | | Managing Director (since 2017), formerly Senior Vice President (2016-2017) and Vice President |
| 1975 | | | (2011-2016) of Nuveen. |
| 333 W. Wacker Drive | Vice President | 2017 | |
| Chicago, IL 6o6o6 | | | |
|
| ■ E. SCOTT WICKERHAM | | | Senior Managing Director, Head of Fund Administration at Nuveen, LLC (since 2019), formerly, |
| 1973 | Vice President | | Managing Director; Senior Managing Director (since 2019), Nuveen Fund Advisers, LLC; Principal |
| 8500 Andrew | and Controller | 2019 | Financial Officer, Principal Accounting Officer and Treasurer (since 2017) to the TIAA-CREF Funds, |
| Carnegie Blvd. | | | the TIAA-CREF Life Funds, the TIAA Separate Account VA-1 and the Treasurer (since 2017) to the |
| Charlotte, NC 28262 | | | CREF Accounts; Senior Director, TIAA-CREF Fund Administration (2014-2015); has held various |
| | | positions with TIAA since 2006. |
|
| ■ MARK L. WINGET | | | Vice President and Assistant Secretary of Nuveen Securities, LLC (since 2008), and Nuveen Fund |
| 1968 | Vice President | | Advisors, LLC (since 2009); Vice President, Associate General Counsel and Assistant Secretary of |
| 333 W. Wacker Drive | and Secretary | 2008 | Nuveen Asset Management, LLC (since 2020); Vice President (since 2010) and Associate General |
| Chicago, IL 60606 | | | Counsel (since 2016), formerly, Assistant General Counsel (2008-2016) of Nuveen. |
|
| ■ GIFFORD R. ZIMMERMAN | | | Formerly: Managing Director (2002-2020) and Assistant Secretary of Nuveen Securities, LLC; |
| 1956 | Vice President | | Managing Director (2002-2020), Assistant Secretary (1997-2020) and Co-General Counsel (2011- |
| 333 W. Wacker Drive | and Chief | 1988 | 2020) of Nuveen Fund Advisors, LLC; Managing Director (2004-2020) and Assistant Secretary |
| Chicago, IL 60606 | Compliance Officer | | (1994-2020) of Nuveen Investments, Inc.; Managing Director, Assistant Secretary and Associate |
| | | General Counsel of Nuveen Asset Management, LLC (2011-2020); Vice President (2017-2020) |
| | | Managing Director (2003-2017) and Assistant Secretary (2003-2020) of Symphony Asset |
| | | Management LLC; Vice President and Assistant Secretary of NWQ Investment Management |
| | | Company, LLC, Santa Barbara Asset Management, LLC (2006-2020) and of Winslow Capital |
| | | Management, LLC (2010-2020); Chartered Financial Analyst. |
(1) | The Board of Trustees is divided into three classes, Class I, Class II, and Class III, with each being elected to serve until the third succeeding annual shareholders’ meeting subsequent to its election or thereafter in each case when its respective successors are duly elected or appointed, except two board members are elected by the holders of Preferred Shares, when applicable, to serve until the next annual shareholders’ meeting subsequent to its election or thereafter in each case when its respective successors are duly elected or appointed. The year first elected or appointed represents the year in which the board member was first elected or appointed to any fund in the Nuveen complex. |
(2) | Officers serve one year terms through August of each year. The year first elected or appointed represents the year in which the Officer was first elected or appointed to any fund in the Nuveen complex. |
229
Notes
230
Notes
231
Nuveen:
Serving Investors for Generations
Since 1898, financial professionals and their clients have relied on Nuveen to provide dependable investment solutions through continued adherence to proven, long-term investing principles. Today, we offer a range of high quality solutions designed to be integral components of a well-diversified core portfolio.
Focused on meeting investor needs.
Nuveen is the investment manager of TIAA. We have grown into one of the world’s premier global asset managers, with specialist knowledge across all major asset classes and particular strength in solutions that provide income for investors and that draw on our expertise in alternatives and responsible investing. Nuveen is driven not only by the independent investment processes across the firm, but also the insights, risk management, analytics and other tools and resources that a truly world-class platform provides. As a global asset manager, our mission is to work in partnership with our clients to create solutions which help them secure their financial future.
Find out how we can help you.
To learn more about how the products and services of Nuveen may be able to help you meet your financial goals, talk to your financial professional, or call us at (800) 257-8787. Please read the information provided carefully before you invest. Investors should consider the investment objective and policies, risk considerations, charges and expenses of any investment carefully. Where applicable, be sure to obtain a prospectus, which contains this and other relevant information. To obtain a prospectus, please contact your securities representative or Nuveen, 333 W. Wacker Dr., Chicago, IL 60606. Please read the prospectus carefully before you invest or send money.
Learn more about Nuveen Funds at: www.nuveen.com/closed-end-funds
Nuveen Securities, LLC, member FINRA and SIPC | 333 West Wacker Drive Chicago, IL 60606 | www.nuveen.com
EAN-C-1020D 1434972-INV-Y-12/21