UNITED STATES
SECURITIES AND EXCHANGE COMMISSION
Washington, D.C. 20549
Form N-CSR
CERTIFIED SHAREHOLDER REPORT OF
REGISTERED MANAGEMENT INVESTMENT COMPANIES
Investment Company Act file number: 811-09477
Voya Variable Insurance Trust
(Exact name of registrant as specified in charter)
| 7337 East Doubletree Ranch Road, Suite 100, Scottsdale, AZ | 85258 | |
| (Address of principal executive offices) | (Zip code) |
The Corporation Trust Company, 1209 Orange Street, Wilmington, DE 19801
(Name and address of agent for service)
Registrant’s telephone number, including area code: 1-800-992-0180
Date of fiscal year end: December 31
Date of reporting period: January 1, 2024 to June 30, 2024
Item 1. Reports to Stockholders.
(a) The following is a copy of the report transmitted to stockholders pursuant to Rule 30e-1 under the Act (17 CFR 270.30e-1):

This semi-annual shareholder report contains important information about VY® BrandywineGLOBAL- Bond Portfolio for the period of January 1, 2024 to June 30, 2024. You can find additional information about the Fund at https://individuals.voya.com/product/mutual-fund/prospectuses-reports. You can also request this information by contacting us at 1-800-992-0180.
What were the Fund’s costs for the last period? (based on a hypothetical $10,000 investment)
| Class Name | Costs of $10K investment | Costs paid as % of $10K investment |
|---|---|---|
| Portfolio | $28 | 0.56% |
Fund Statistics
- Total Net Assets$209,108,935
- # of Portfolio Holdings25
- Portfolio Turnover Rate48%
What did the Fund invest in?
The tables below reflect the investment makeup of the Fund, excluding derivatives unless otherwise noted, shown as percentage of Fund net assets. Portfolio holdings are subject to change daily.
Top 10 Holdings
| United States Treasury Notes, 3.875%, 08/15/33 | 30.2% |
| United States Treasury Bonds, 3.000%, 08/15/52 | 14.9% |
| Federal Home Loan Banks, 4.875%, 09/13/24 | 7.2% |
| Uniform Mortgage-Backed Securities, 4.000%, 06/01/52 | 6.3% |
| Uniform Mortgage-Backed Securities, 4.500%, 09/01/52 | 4.5% |
| Uniform Mortgage-Backed Securities, 5.000%, 11/01/52 | 3.6% |
| Ginnie Mae, 5.500%, 05/20/53 | 3.0% |
| Ginnie Mae, 5.500%, 10/20/53 | 3.0% |
| Ginnie Mae, 5.500%, 09/20/53 | 2.7% |
| Uniform Mortgage-Backed Securities, 5.000%, 02/01/53 | 2.7% |
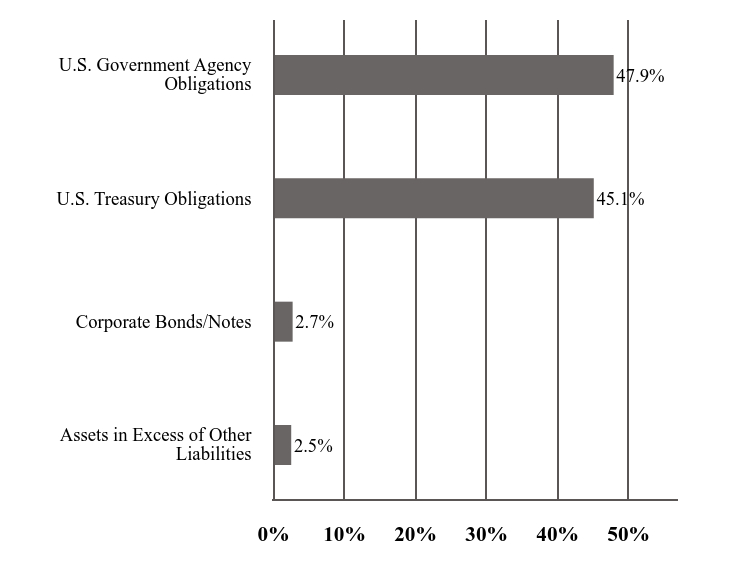
Investment Type Allocation
| Value | Value |
|---|---|
| Assets in Excess of Other Liabilities | 2.5% |
| Corporate Bonds/Notes | 2.7% |
| U.S. Treasury Obligations | 45.1% |
| U.S. Government Agency Obligations | 47.9% |
Availability of Additional Information
For additional information about the Fund, including its prospectus, financial information, holdings & proxy voting, scan the below QR code, visit https://individuals.voya.com/product/mutual-fund/prospectuses-reports or call us at 1-800-992-0180.
VY® BrandywineGLOBAL- Bond Portfolio

Portfolio: VGSBX
92913J309-SAR
(b) Not applicable.
Item 2. Code of Ethics.
Not required for semi-annual filing.
Item 3. Audit Committee Financial Expert.
Not required for semi-annual filing.
Item 4. Principal Accountant Fees and Services.
Not required for semi-annual filing.
Item 5. Audit Committee of Listed Registrants.
Not required for semi-annual filing.
Item 6. Schedule of Investments.
(a) Schedule is included as part of the report to shareholders filed under Item 7 of this Form.
(b) Not applicable.
Item 7. Financial Statements and Financial Highlights for Open-End Management Investment Companies.
The semi-annual financial statements, the Financial Highlights, and the Items 8-11 are attached herewith.

Semi-Annual Financial Statements and Other Information
June 30, 2024
Voya Investors Trust
| ■ | VY® BlackRock Inflation Protected Bond Portfolio Classes ADV, I and S |
Voya Variable Insurance Trust
| ■ | VY® BrandywineGLOBAL – Bond Portfolio |
This report is submitted for general information to shareholders of the Voya mutual funds. It is not authorized for distribution to prospective shareholders unless accompanied or preceded by a prospectus which includes details regarding the funds’ investment objectives, risks, charges, expenses and other information. This information should be read carefully.
 | E-Delivery Sign-up – details inside |
| INVESTMENT MANAGEMENT |
|
| voyainvestments.com |

[This Page Intentionally Left Blank]
TABLE OF CONTENTS
| Statements of Assets and Liabilities | 1 |
| Statements of Operations | 3 |
| Statements of Changes in Net Assets | 4 |
| Financial Highlights | 5 |
| Notes to Financial Statements | 6 |
| Portfolios of Investments | 20 |
Go Paperless with E-Delivery!
Sign up now for on-line prospectuses, tailored shareholder reports, and proxy statements.
Just go to individuals.voya.com/page/e-delivery, follow the directions and complete the quick 5 Steps to Enroll.
You will be notified by e-mail when these communications become available on the internet. |
|---|
PROXY VOTING INFORMATION
A description of the policies and procedures that the Portfolios use to determine how to vote proxies related to portfolio securities is available: (1) without charge, upon request, by calling Shareholder Services toll-free at (800) 992-0180; (2) on the Portfolios’ website at www.voyainvestments.com; and (3) on the U.S. Securities and Exchange Commission’s (“SEC’s”) website at www.sec.gov. Information regarding how the Portfolios voted proxies related to portfolio securities during the most recent 12-month period ended June 30 is available without charge on the Portfolios’ website at www. voyainvestments.com and on the SEC’s website at www.sec.gov.
QUARTERLY PORTFOLIO HOLDINGS
The Portfolios file their complete schedule of portfolio holdings with the SEC for the first and third quarters of each fiscal year on Form NPORT-P. The Portfolios’ Forms NPORT-P are available on the SEC’s website at www.sec.gov. Each Portfolio’s complete schedule of portfolio holdings is available at: https://individuals.voya.com/product/mutual-fund/prospectuses-reports and without charge upon request from the Portfolio by calling Shareholder Services toll-free at (800) 992-0180.
STATEMENTS OF ASSETS AND LIABILITIES as of June 30, 2024 (Unaudited)
| VY® BlackRock Inflation Protected Bond Portfolio | VY® Brandywine GLOBAL — Bond Portfolio | ||||||||
| ASSETS: | |||||||||
| Investments in securities at fair value* | $ | 212,729,593 | $ | 200,147,309 | |||||
| Short-term investments at fair value† | 539,337 | 3,773,901 | |||||||
| Cash collateral for futures contracts | 226,821 | 3,265,303 | |||||||
| Cash pledged for centrally cleared swaps (Note 2) | 3,364,000 | – | |||||||
| Foreign currencies at value‡ | 376,956 | – | |||||||
| Receivables: | |||||||||
| Investment securities sold | 2,962,775 | – | |||||||
| Investment securities sold on a delayed-delivery or when-issued basis | 2,107,453 | – | |||||||
| Fund shares sold | 726,084 | 50,886 | |||||||
| Dividends | 1,303 | 11,411 | |||||||
| Interest | 1,306,529 | 2,050,927 | |||||||
| Variation margin on centrally cleared swaps | 19,335 | – | |||||||
| Unrealized appreciation on forward foreign currency contracts | 105,729 | – | |||||||
| Unrealized appreciation on OTC swap agreements | 13 | – | |||||||
| Prepaid expenses | 1,064 | 1,101 | |||||||
| Other assets | 19,587 | 7,366 | |||||||
| Total assets | 224,486,579 | 209,308,204 | |||||||
| LIABILITIES: | |||||||||
| Income distribution payable | 711,245 | – | |||||||
| Payable for investment securities purchased | 5,238,332 | – | |||||||
| Payable for investment securities purchased on a delayed-delivery or when-issued basis | 6,660,107 | – | |||||||
| Payable for fund shares redeemed | 98,632 | 52,579 | |||||||
| Sales commitments^^^ | 2,150,965 | – | |||||||
| Unrealized depreciation on forward foreign currency contracts | 10,337 | – | |||||||
| Upfront payments received on OTC swap agreements | 24,980 | – | |||||||
| Unrealized depreciation on OTC swap agreements | 996 | – | |||||||
| Variation margin payable on futures contracts | 38,025 | – | |||||||
| Cash received as collateral for OTC derivatives (Note 2) | 80,000 | – | |||||||
| Payable for investment management fees | 85,219 | 84,423 | |||||||
| Payable for distribution and shareholder service fees | 39,152 | – | |||||||
| Payable to trustees under the deferred compensation plan (Note 6) | 19,587 | 7,366 | |||||||
| Payable for trustee fees | 1,719 | 167 | |||||||
| Other accrued expenses and liabilities | 112,077 | 54,734 | |||||||
| Written options, at fair value^ | 188,907 | – | |||||||
| Total liabilities | 15,460,280 | 199,269 | |||||||
| NET ASSETS | $ | 209,026,299 | $ | 209,108,935 | |||||
| NET ASSETS WERE COMPRISED OF: | |||||||||
| Paid-in capital | $ | 299,231,257 | $ | 239,325,598 | |||||
| Total distributable loss | (90,204,958 | ) | (30,216,663 | ) | |||||
| NET ASSETS | $ | 209,026,299 | $ | 209,108,935 | |||||
| * | Cost of investments in securities | $ | 226,666,505 | $ | 203,613,448 | ||||
| † | Cost of short-term investments | $ | 539,337 | $ | 3,773,901 | ||||
| ‡ | Cost of foreign currencies | $ | 376,798 | $ | — | ||||
| ^ | Premiums received on written options | $ | 265,489 | $ | — | ||||
| ^^^ | Proceeds receivable from sales commitments | $ | 2,150,430 | $ | — | ||||
See Accompanying Notes to Financial Statements
1
STATEMENTS OF ASSETS AND LIABILITIES as of June 30, 2024 (Unaudited) (continued)
| VY® BlackRock Inflation Protected Bond Portfolio | VY® Brandywine GLOBAL — Bond Portfolio | |||||||
| Class ADV | ||||||||
| Net assets | $ | 35,737,132 | n/a | |||||
| Shares authorized | unlimited | n/a | ||||||
| Par value | $ | 0.001 | n/a | |||||
| Shares outstanding | 4,111,103 | n/a | ||||||
| Net asset value and redemption price per share | $ | 8.69 | n/a | |||||
| Class I | ||||||||
| Net assets | $ | 69,717,591 | n/a | |||||
| Shares authorized | unlimited | n/a | ||||||
| Par value | $ | 0.001 | n/a | |||||
| Shares outstanding | 7,685,320 | n/a | ||||||
| Net asset value and redemption price per share | $ | 9.07 | n/a | |||||
| Class S | ||||||||
| Net assets | $ | 103,571,576 | n/a | |||||
| Shares authorized | unlimited | n/a | ||||||
| Par value | $ | 0.001 | n/a | |||||
| Shares outstanding | 11,512,801 | n/a | ||||||
| Net asset value and redemption price per share | $ | 9.00 | n/a | |||||
| Portfolio(1) | ||||||||
| Net assets | n/a | $ | 209,108,935 | |||||
| Shares authorized | n/a | unlimited | ||||||
| Par value | n/a | $ | 0.001 | |||||
| Shares outstanding | n/a | 22,320,216 | ||||||
| Net asset value and redemption price per share | n/a | $ | 9.37 | |||||
| (1) Portfolio does not have a share class designation. |
See Accompanying Notes to Financial Statements
2
STATEMENTS OF OPERATIONS for the six months ended June 30, 2024 (Unaudited)
| VY® BlackRock Inflation Protected Bond Portfolio | VY® Brandywine GLOBAL — Bond Portfolio | |||||||
| INVESTMENT INCOME: | ||||||||
| Dividends | $ | 27,892 | $ | 118,954 | ||||
| Interest, net of foreign taxes withheld* | 5,461,644 | (1) | 5,183,608 | |||||
| Other | 680 | 703 | ||||||
| Total investment income | 5,490,216 | 5,303,265 | ||||||
| EXPENSES: | ||||||||
| Investment management fees | 580,029 | 548,293 | ||||||
| Distribution and shareholder service fees | ||||||||
| Class ADV | 110,823 | — | ||||||
| Class S | 133,020 | — | ||||||
| Transfer agent fees | 221 | |||||||
| Class ADV | 5,579 | — | ||||||
| Class I | 10,384 | — | ||||||
| Class S | 16,070 | — | ||||||
| Shareholder reporting expense | 3,167 | 2,751 | ||||||
| Professional fees | 23,652 | 40,277 | ||||||
| Custody and accounting expense | 73,906 | 8,329 | ||||||
| Trustee fees | 4,131 | 3,645 | ||||||
| Miscellaneous expense | 7,948 | 6,786 | ||||||
| Interest expense | 1,790 | — | ||||||
| Total expenses | 970,499 | 610,302 | ||||||
| Waived and reimbursed fees | (53,369 | ) | — | |||||
| Net expenses | 917,130 | 610,302 | ||||||
| Net investment income | 4,573,086 | 4,692,963 | ||||||
| REALIZED AND UNREALIZED GAIN (LOSS): | ||||||||
| Net realized gain (loss) on: | ||||||||
| Investments | (4,086,694 | ) | (1,684,968 | ) | ||||
| Forward foreign currency contracts | 129,654 | — | ||||||
| Foreign currency related transactions | 10,930 | — | ||||||
| Futures | (292,551 | ) | (2,574,834 | ) | ||||
| Swaps | 469,536 | — | ||||||
| Written options | 288,530 | — | ||||||
| Net realized loss | (3,480,595 | ) | (4,259,802 | ) | ||||
| Net change in unrealized appreciation (depreciation) on: | ||||||||
| Investments | (2,632,346 | ) | (4,387,097 | ) | ||||
| Forward foreign currency contracts | 94,107 | — | ||||||
| Foreign currency related transactions | (3,076 | ) | — | |||||
| Futures | 2,097,538 | (2,159,120 | ) | |||||
| Swaps | 706,365 | — | ||||||
| Written options | 145,879 | — | ||||||
| Sales commitments | 42,030 | — | ||||||
| Net change in unrealized appreciation (depreciation) | 450,497 | (6,546,217 | ) | |||||
| Net realized and unrealized loss | (3,030,098 | ) | (10,806,019 | ) | ||||
| Increase (decrease) in net assets resulting from operations | $ | 1,542,988 | $ | (6,113,056 | ) | |||
| * Foreign taxes withheld | $ | 1,090 | $ | — | ||||
| (1) | Includes net inflationary and deflationary adjustments. See Note 2 of the Notes to Financial Statements. |
See Accompanying Notes to Financial Statements
3
STATEMENTS OF CHANGES IN NET ASSETS
| VY® BlackRock Inflation Protected Bond Portfolio | VY® BrandywineGLOBAL — Bond Portfolio | |||||||||||||||
| Six Months Ended June 30, 2024 (Unaudited) | Year Ended December 31, 2023 | Six Months Ended June 30, 2024 (Unaudited) | Year Ended December 31, 2023 | |||||||||||||
| FROM OPERATIONS: | ||||||||||||||||
| Net investment income | $ | 4,573,086 | $ | 8,204,919 | $ | 4,692,963 | $ | 9,400,149 | ||||||||
| Net realized loss | (3,480,595 | ) | (12,757,946 | ) | (4,259,802 | ) | (21,227,486 | ) | ||||||||
| Net change in unrealized appreciation (depreciation) | 450,497 | 14,068,815 | (6,546,217 | ) | 25,940,584 | |||||||||||
| Increase (decrease) in net assets resulting from operations | 1,542,988 | 9,515,788 | (6,113,056 | ) | 14,113,247 | |||||||||||
| FROM DISTRIBUTIONS TO SHAREHOLDERS: | ||||||||||||||||
| Total distributions (excluding return of capital): | — | — | — | (5,046,842 | ) | |||||||||||
| Class ADV | (727,614 | ) | (1,253,985 | ) | — | — | ||||||||||
| Class I | (1,516,449 | ) | (2,616,072 | ) | — | — | ||||||||||
| Class S | (2,202,627 | ) | (4,021,674 | ) | — | — | ||||||||||
| Total distributions | (4,446,690 | ) | (7,891,731 | ) | — | (5,046,842 | ) | |||||||||
| FROM CAPITAL SHARE TRANSACTIONS: | ||||||||||||||||
| Net proceeds from sale of shares | 7,277,541 | 21,083,454 | 30,863,930 | 52,927,045 | ||||||||||||
| Reinvestment of distributions | 4,446,629 | 7,891,731 | — | 5,046,842 | ||||||||||||
| 11,724,170 | 28,975,185 | 30,863,930 | 57,973,887 | |||||||||||||
| Cost of shares redeemed | (19,256,973 | ) | (65,352,589 | ) | (44,113,192 | ) | (104,883,514 | ) | ||||||||
| Net decrease in net assets resulting from capital share transactions | (7,532,803 | ) | (36,377,404 | ) | (13,249,262 | ) | (46,909,627 | ) | ||||||||
| Net decrease in net assets | (10,436,505 | ) | (34,753,347 | ) | (19,362,318 | ) | (37,843,222 | ) | ||||||||
| NET ASSETS: | ||||||||||||||||
| Beginning of year or period | 219,462,804 | 254,216,151 | 228,471,253 | 266,314,475 | ||||||||||||
| End of year or period | $ | 209,026,299 | $ | 219,462,804 | $ | 209,108,935 | $ | 228,471,253 | ||||||||
See Accompanying Notes to Financial Statements
4
FINANCIAL HIGHLIGHTS
Selected data for a share of beneficial interest outstanding throughout each year or period.
| Income (loss) from investment operations | Less Distributions | Ratios to average net assets | Supplemental Data | |||||||||||||||||||||||||||||||||||||||||||||||||
| Net asset value, beginning of year or period | Net investment income (loss) | Net realized and unrealized gain (loss) | Total from investment operations | From net investment income | From net realized gains | From return of capital | Total distributions | Payment by affiliate | Net asset value, end of year or period | Total Return(1) | Expenses before reductions/ additions (2)(3)(4) | Expenses net of fee waivers and/or recoupments if any (2)(3)(4) | Expenses net of all reductions/ additions (2)(3)(4) | Net investment income (loss)(2)(3) | Net assets, end of year or period | Portfolio turnover rate | ||||||||||||||||||||||||||||||||||||
| Year or period ended | ($) | ($) | ($) | ($) | ($) | ($) | ($) | ($) | ($) | ($) | (%) | (%) | (%) | (%) | (%) | ($000’s) | (%) | |||||||||||||||||||||||||||||||||||
| VY® BlackRock Inflation Protected Bond Portfolio | ||||||||||||||||||||||||||||||||||||||||||||||||||||
| Class ADV | ||||||||||||||||||||||||||||||||||||||||||||||||||||
| 06-30-24+ | 8.82 | 0.17 | • | (0.13 | ) | 0.04 | 0.17 | — | — | 0.17 | — | 8.69 | 0.52 | 1.29 | 1.23 | 1.23 | 3.92 | 35,737 | 153 | |||||||||||||||||||||||||||||||||
| 12-31-23 | 8.76 | 0.27 | • | 0.06 | 0.33 | 0.27 | — | — | 0.27 | — | 8.82 | 3.83 | 1.27 | 1.22 | 1.22 | 3.09 | 38,745 | 297 | ||||||||||||||||||||||||||||||||||
| 12-31-22 | 10.51 | 0.35 | • | (1.73 | ) | (1.38 | ) | 0.32 | — | 0.05 | 0.37 | — | 8.76 | (13.34 | ) | 1.23 | 1.18 | 1.18 | 3.70 | 43,212 | 231 | |||||||||||||||||||||||||||||||
| 12-31-21 | 10.28 | 0.22 | • | 0.24 | 0.46 | 0.23 | — | — | 0.23 | — | 10.51 | 4.54 | 1.22 | 1.18 | 1.18 | 2.14 | 56,857 | 156 | ||||||||||||||||||||||||||||||||||
| 12-31-20 | 9.42 | 0.05 | 0.95 | 1.00 | 0.08 | — | 0.06 | 0.14 | — | 10.28 | 10.65 | 1.26 | 1.22 | 1.22 | 0.52 | 47,352 | 87 | |||||||||||||||||||||||||||||||||||
| 12-31-19 | 8.93 | 0.11 | 0.56 | 0.67 | 0.18 | — | — | 0.18 | — | 9.42 | 7.53 | 1.20 | 1.16 | 1.16 | 1.23 | 44,885 | 72 | |||||||||||||||||||||||||||||||||||
| Class I | ||||||||||||||||||||||||||||||||||||||||||||||||||||
| 06-30-24+ | 9.19 | 0.21 | • | (0.13 | ) | 0.08 | 0.20 | — | — | 0.20 | — | 9.07 | 0.89 | 0.69 | 0.63 | 0.63 | 4.58 | 69,718 | 153 | |||||||||||||||||||||||||||||||||
| 12-31-23 | 9.13 | 0.34 | • | 0.05 | 0.39 | 0.33 | — | — | 0.33 | — | 9.19 | 4.30 | 0.67 | 0.62 | 0.62 | 3.70 | 69,071 | 297 | ||||||||||||||||||||||||||||||||||
| 12-31-22 | 10.94 | 0.42 | • | (1.79 | ) | (1.37 | ) | 0.39 | — | 0.05 | 0.44 | — | 9.13 | (12.74 | ) | 0.63 | 0.58 | 0.58 | 4.27 | 77,275 | 231 | |||||||||||||||||||||||||||||||
| 12-31-21 | 10.68 | 0.30 | • | 0.25 | 0.55 | 0.29 | — | — | 0.29 | — | 10.94 | 5.25 | 0.62 | 0.58 | 0.58 | 2.75 | 94,962 | 156 | ||||||||||||||||||||||||||||||||||
| 12-31-20 | 9.78 | 0.12 | 0.97 | 1.09 | 0.13 | — | 0.06 | 0.19 | — | 10.68 | 11.15 | 0.66 | 0.62 | 0.62 | 1.11 | 92,767 | 87 | |||||||||||||||||||||||||||||||||||
| 12-31-19 | 9.26 | 0.18 | 0.57 | 0.75 | 0.23 | — | — | 0.23 | — | 9.78 | 8.21 | 0.60 | 0.56 | 0.56 | 1.98 | 88,759 | 72 | |||||||||||||||||||||||||||||||||||
| Class S | ||||||||||||||||||||||||||||||||||||||||||||||||||||
| 06-30-24+ | 9.12 | 0.19 | • | (0.12 | ) | 0.07 | 0.19 | — | — | 0.19 | — | 9.00 | 0.77 | 0.94 | 0.88 | 0.88 | 4.27 | 103,572 | 153 | |||||||||||||||||||||||||||||||||
| 12-31-23 | 9.05 | 0.31 | • | 0.06 | 0.37 | 0.30 | — | — | 0.30 | — | 9.12 | 4.17 | 0.92 | 0.87 | 0.87 | 3.43 | 111,647 | 297 | ||||||||||||||||||||||||||||||||||
| 12-31-22 | 10.85 | 0.40 | • | (1.79 | ) | (1.39 | ) | 0.36 | — | 0.05 | 0.41 | — | 9.05 | (13.03 | ) | 0.88 | 0.83 | 0.83 | 4.06 | 133,729 | 231 | |||||||||||||||||||||||||||||||
| 12-31-21 | 10.60 | 0.26 | • | 0.26 | 0.52 | 0.27 | — | — | 0.27 | — | 10.85 | 4.94 | 0.87 | 0.83 | 0.83 | 2.48 | 172,822 | 156 | ||||||||||||||||||||||||||||||||||
| 12-31-20 | 9.70 | 0.09 | 0.97 | 1.06 | 0.10 | — | 0.06 | 0.16 | — | 10.60 | 10.95 | 0.91 | 0.87 | 0.87 | 0.86 | 159,383 | 87 | |||||||||||||||||||||||||||||||||||
| 12-31-19 | 9.18 | 0.15 | 0.58 | 0.73 | 0.21 | — | — | 0.21 | — | 9.70 | 8.01 | 0.85 | 0.81 | 0.81 | 1.57 | 144,313 | 72 | |||||||||||||||||||||||||||||||||||
| VY® BrandywineGLOBAL- Bond Portfolio | ||||||||||||||||||||||||||||||||||||||||||||||||||||
| 06-30-24+ | 9.59 | 0.20 | • | (0.42 | ) | (0.22 | ) | — | — | — | — | — | 9.37 | (2.29 | ) | 0.56 | 0.56 | 0.56 | 4.28 | 209,109 | 48 | |||||||||||||||||||||||||||||||
| 12-31-23 | 9.29 | 0.38 | • | 0.13 | 0.51 | 0.21 | — | — | 0.21 | — | 9.59 | 5.53 | 0.55 | 0.55 | 0.55 | 4.01 | 228,471 | 126 | ||||||||||||||||||||||||||||||||||
| 12-31-22 | 11.22 | 0.16 | • | (1.45 | ) | (1.29 | ) | 0.11 | 0.53 | — | 0.64 | — | 9.29 | (11.89 | ) | 0.55 | 0.56 | 0.56 | 1.60 | 266,314 | 184 | |||||||||||||||||||||||||||||||
| 12-31-21 | 12.03 | 0.10 | • | 0.04 | 0.14 | 0.19 | 0.76 | — | 0.95 | — | 11.22 | 1.15 | 0.54 | 0.58 | 0.58 | 0.84 | 343,329 | 57 | ||||||||||||||||||||||||||||||||||
| 12-31-20 | 10.51 | 0.22 | • | 1.59 | 1.81 | 0.21 | 0.08 | — | 0.29 | — | 12.03 | 17.47 | 0.56 | 0.58 | 0.58 | 1.92 | 318,665 | 134 | ||||||||||||||||||||||||||||||||||
| 12-31-19 | 9.73 | 0.25 | • | 0.73 | 0.98 | 0.20 | — | — | 0.20 | — | 10.51 | 10.12 | 0.61 | 0.58 | 0.58 | 2.48 | 182,892 | 449 | ||||||||||||||||||||||||||||||||||
| (1) | Total return is calculated assuming reinvestment of all dividends, capital gain distributions and return of capital distributions, if any, at net asset value and does not reflect the effect of insurance contract charges. Total return for periods less than one year is not annualized. |
| (2) | Annualized for periods less than one year. |
| (3) | Ratios reflect operating expenses of a Portfolio. Expenses before reductions/additions do not reflect amounts reimbursed or recouped by the Investment Adviser and/or Distributor or reductions from brokerage service arrangements or other expense offset arrangements and do not represent the amount paid by a Portfolio during periods when reimbursements or reductions occur. Expenses net of fee waivers reflect expenses after reimbursement by the Investment Adviser and/or Distributor or recoupment of previously reimbursed fees by the Investment Adviser, but prior to reductions from brokerage service arrangements or other expense offset arrangements. Expenses net of all reductions/additions represent the net expenses paid by a Portfolio. Net investment income (loss) is net of all such additions or reductions. |
| (4) | Ratios do not include fees and expenses charged under the variable annuity contract or variable life insurance policy. |
| + | Unaudited. |
| • | Calculated using average number of shares outstanding throughout the year or period. |
See Accompanying Notes to Financial Statements
5
NOTES TO FINANCIAL STATEMENTS as of June 30, 2024 (Unaudited)
NOTE 1 — ORGANIZATION
Voya Investors Trust is registered under the Investment Company Act of 1940, as amended (the “1940 Act”), as an open-end management investment company and was organized as a Massachusetts business trust on August 3, 1988. Voya Investors Trust currently consists of twenty-two active separate investment series. The one series included in this report is: VY® BlackRock Inflation Protected Bond Portfolio (“BlackRock Inflation Protected Bond”), a diversified series of Voya Investors Trust.
Voya Variable Insurance Trust is registered under the 1940 Act as an open-end management investment company and was organized as a Delaware statutory trust on July 15, 1999. Voya Variable Insurance Trust consists of one active investment series which is included in this report: VY® BrandywineGLOBAL — Bond Portfolio (“Bond Portfolio”), a diversified series of Voya Variable Insurance Trust.
Voya Investors Trust and Voya Variable Insurance Trust are collectively referred to as the “Trusts.” BlackRock Inflation Protected Bond and Bond Portfolio are each, a “Portfolio” and together, the “Portfolios.” The investment objective of the Portfolios is described in each Portfolio’s Prospectus.
The classes of shares included in this report for BlackRock Inflation Protected Bond are: Adviser (“Class ADV”), Institutional (“Class I”), and Service (“Class S”). With the exception of class specific matters, each class has equal voting rights as to voting privileges. For class specific proposals, only the applicable class would have voting privileges. The classes differ principally in the applicable distribution and shareholder service fees, as well as differences in the amount of waiver of fees and reimbursement of expenses, if any. Generally, shareholders of each class also bear certain expenses that pertain to that particular class. All shareholders are allocated the common expenses of a portfolio and earn income and realized gains/ losses from a portfolio pro rata based on the daily ending net assets of each class, without distinction between share classes. Expenses that are specific to a portfolio or a class are charged directly to that portfolio or class. Other operating expenses shared by several portfolios are generally allocated among those portfolios based on average net assets. Distributions are determined separately for each class based on income and expenses allocated to each class. Realized gain distributions are allocated to each class pro rata based on the shares outstanding of each class on the date of distribution. Differences in per share dividend rates generally result from differences in separate class expenses, including distribution and shareholder service fees, if any, as well as differences in the amount of waiver of fees and reimbursement of expenses between the separate classes, if any. Bond Portfolio does not have a share class designation.
Voya Investments, LLC (“Voya Investments” or the “Investment Adviser”), an Arizona limited liability company, serves as the Investment Adviser to the Portfolios. Voya Investments Distributor, LLC (“VID” or the “Distributor”), a Delaware limited liability company, serves as the principal underwriter to the Portfolios.
NOTE 2 — SIGNIFICANT ACCOUNTING POLICIES
The Portfolios are investment companies and accordingly follow the investment company accounting and reporting guidance of the Financial Accounting Standards Board ("FASB") Accounting Standards Board Codification Topic 946 Financial Services - Investment Companies.
The following significant accounting policies are consistently followed by the Portfolios in the preparation of their financial statements. Each Portfolio is considered an investment company under U.S. generally accepted accounting principles (“GAAP”) and follows the accounting and reporting guidance applicable to investment companies.
A. Security Valuation. Each Portfolio is open for business every day the New York Stock Exchange (“NYSE”) opens for regular trading (each such day, a “Business Day”). The net asset value (“NAV”) per share for each class of each Portfolio is determined each Business Day as of the close of the regular trading session (“Market Close”), as determined by the Consolidated Tape Association (“CTA”), the central distributor of transaction prices for exchange-traded securities (normally 4:00 p.m. Eastern Time unless otherwise designated by the CTA). The NAV per share of each class of each Portfolio is calculated by taking the value of the Portfolio’s assets attributable to that class, subtracting the Portfolio’s liabilities attributable to that class, and dividing by the number of shares of that class that are outstanding. On days when a Portfolio is closed for business, Portfolio shares will not be priced and a Portfolio does not transact purchase and redemption orders. To the extent a Portfolio’s assets are traded in other markets on days when a Portfolio does not price its shares, the value of a Portfolio’s assets will likely change and you will not be able to purchase or redeem shares of a Portfolio.
Portfolio securities for which market quotations are readily available are valued at market value. Investments in open-end registered investment companies that do not trade on an exchange are valued at the end of day NAV per share. The prospectuses of the open-end registered investment companies in which each Portfolio may invest explain the circumstances under which they will use fair value pricing and the effects of using fair value pricing. Foreign securities’ prices are converted into U.S. dollar amounts using the applicable exchange rates as of Market Close.
When a market quotation for a portfolio security is not readily available or is deemed unreliable (for example when
6
NOTES TO FINANCIAL STATEMENTS as of June 30, 2024 (Unaudited) (continued)
NOTE 2 — SIGNIFICANT ACCOUNTING POLICIES (continued)
trading has been halted or there are unexpected market closures or other material events that would suggest that the market quotation is unreliable) and for purposes of determining the value of other Portfolio assets, the asset is priced at its fair value. The Board has designated the Investment Adviser, as the valuation designee, to make fair value determinations in good faith. In determining the fair value of each Portfolio’s assets, the Investment Adviser, pursuant to its fair valuation policy, may consider inputs from pricing service providers, broker-dealers, or each Portfolio’s sub-adviser(s). Issuer specific events, transaction price, position size, nature and duration of restrictions on disposition of the security, market trends, bid/ask quotes of brokers and other market data may be reviewed in the course of making a good faith determination of an asset’s fair value. Because trading hours for certain foreign securities end before Market Close, closing market quotations may become unreliable. The prices of foreign securities will generally be adjusted based on inputs from an independent pricing service that are intended to reflect valuation changes through the NYSE close. Because of the inherent uncertainties of fair valuation, the values used to determine each Portfolio’s NAV may materially differ from the value received upon actual sale of those investments. Thus, fair valuation may have an unintended dilutive or accretive effect on the value of shareholders’ investments in each Portfolio.
The Portfolios’ financial instruments are valued at the close of the NYSE and are reported at fair value, which GAAP defines as the price that would be received to sell an asset or paid to transfer a liability in an orderly transaction between market participants at the measurement date.
Various valuation techniques and inputs are used to determine the fair value of financial instruments. GAAP establishes the following fair value hierarchy that categorizes the inputs used to measure fair value:
Level 1 — quoted prices (unadjusted) in active markets for identical financial instruments that the portfolio can access at the reporting date.
Level 2 — inputs other than Level 1 quoted prices that are observable, either directly or indirectly (including, but not limited to, quoted prices for similar financial instruments in active markets, quoted prices for identical or similar financial instruments in inactive markets, interest rates and yield curves, implied volatilities, and credit spreads).
Level 3 — unobservable inputs (including the portfolio’s own assumptions in determining fair value).
Observable inputs are developed using market data, such as publicly available information about actual events or
transactions, and reflect the assumptions that market participants would use to price the financial instrument. Unobservable inputs are those for which market data are not available and are developed using the best information available about the assumptions that market participants would use to price the financial instrument. GAAP requires valuation techniques to maximize the use of relevant observable inputs and minimize the use of unobservable inputs. When multiple inputs are used to derive fair value, the financial instrument is assigned to the level within the fair value hierarchy based on the lowest-level input that is significant to the fair value of the financial instrument. Input levels are not necessarily an indication of the risk or liquidity associated with financial instruments at that level but rather the degree of judgment used in determining those values.
A table summarizing each Portfolio’s investments under these levels of classification is included within each Portfolio of Investments.
Each investment asset or liability of the Portfolios is assigned a level at measurement date based on the significance and source of the inputs to its valuation. Quoted prices in active markets for identical securities are classified as “Level 1,” inputs other than quoted prices for an asset or liability that are observable are classified as “Level 2” and significant unobservable inputs, including the sub-advisers’ or Pricing Committee’s judgment about the assumptions that a market participant would use in pricing an asset or liability are classified as “Level 3.” The inputs used for valuing securities are not necessarily an indication of the risks associated with investing in those securities. Short-term securities of sufficient credit quality are generally considered to be Level 2 securities under applicable accounting rules. A table summarizing each Portfolio’s investments under these levels of classification is included within the Portfolio of Investments.
GAAP requires a reconciliation of the beginning to ending balances for reported fair values that presents changes attributable to total realized and unrealized gains or losses, purchases and sales, and transfers in or out of the Level 3 category during the period. A reconciliation of Level 3 investments within the Portfolio of Investments is presented only when a Portfolio has a significant amount of Level 3 investments.
B. Securities Transactions and Revenue Recognition. Securities transactions are accounted for on the trade date. Realized gains and losses are reported on the basis of identified cost of securities sold. Interest income is recorded on an accrual basis. Dividend income is recorded on the ex-dividend date, or for certain foreign securities, when the information becomes available to the Portfolios. Premium amortization and discount accretion are determined by the effective yield method.
7
NOTES TO FINANCIAL STATEMENTS as of June 30, 2024 (Unaudited) (continued)
NOTE 2 — SIGNIFICANT ACCOUNTING POLICIES (continued)
C. Foreign Currency Translation. The books and records of the Portfolios are maintained in U.S. dollars. Any foreign currency amounts are translated into U.S. dollars on the following basis:
| (1) | Market value of investment securities, other assets and liabilities — at the exchange rates prevailing at Market Close. |
| (2) | Purchases and sales of investment securities, income and expenses — at the rates of exchange prevailing on the respective dates of such transactions. |
Although the net assets and the market values are presented at the foreign exchange rates at Market Close, the Portfolios do not isolate the portion of their results of operations resulting from changes in foreign exchange rates on investments from the fluctuations arising from changes in market prices of securities held. Such fluctuations are included with the net realized and unrealized gains or losses from investments. For securities, which are subject to foreign withholding tax upon disposition, liabilities are recorded on the Statements of Assets and Liabilities for the estimated tax withholding based on the securities’ current market value. Upon disposition, realized gains or losses on such securities are recorded net of foreign withholding tax.
Reported net realized foreign exchange gains or losses arise from sales of foreign currencies, currency gains or losses realized between the trade and settlement dates on securities transactions, the difference between the amounts of dividends, interest, and foreign withholding tax reclaims recorded on the Portfolios’ books, and the U.S. dollar equivalent of the amounts actually received or paid. Net unrealized foreign exchange gains and losses arise from changes in the value of assets and liabilities other than investments in securities, resulting from changes in the exchange rate. Foreign security and currency transactions may involve certain considerations and risks not typically associated with investing in U.S. companies and U.S. government securities. These risks include, but are not limited to, revaluation of currencies and future adverse political and economic developments which could cause securities and their markets to be less liquid, and prices more volatile than those of comparable U.S. companies and U.S. government securities. The foregoing risks are even greater with respect to securities of issuers in emerging markets.
D. Distributions to Shareholders. Net investment income dividends and net capital gain distributions, if any, for Bond Portfolio are declared and paid annually. For BlackRock Inflation Protected Bond, dividends from net investment income, if any, are declared and paid
monthly and distributions of net capital gains, if any, are declared and paid annually. The Portfolios may make distributions on a more frequent basis to comply with the distribution requirements of the Internal Revenue Code. The characteristics of income and gains to be distributed are determined in accordance with income tax regulations, which may differ from GAAP for investment companies.
E. Federal Income Taxes. It is the policy of each Portfolio to comply with the requirements of subchapter M of the Internal Revenue Code that are applicable to regulated investment companies and to distribute substantially all of its net investment income and any net realized capital gains to its shareholders. Therefore, a federal income tax or excise tax provision is not required. Management has considered the sustainability of the Portfolios’ tax positions taken on federal income tax returns for all open tax years in making this determination. No capital gain distributions shall be made until the capital loss carryforwards have been fully utilized.
The Portfolios may utilize equalization accounting for tax purposes, whereby a portion of redemption payments are treated as distributions of income or gain.
F. Use of Estimates. The preparation of financial statements in conformity with GAAP requires management to make estimates and assumptions that affect the reported amounts of assets and liabilities and disclosure of contingent assets and liabilities at the date of the financial statements and the reported amounts of increases and decreases in net assets from operations during the reporting period. Actual results could differ from those estimates.
G. Risk Exposures and the Use of Derivative Instruments. The Portfolios’ investment strategies permit the Portfolios to enter into various types of derivatives contracts, including, but not limited to, futures contracts, forward foreign currency exchange contracts, credit default swaps, interest rate swaps, total return swaps, and purchased and written options. In doing so, a Portfolio will employ strategies in differing combinations to permit it to increase or decrease the level of risk, or change the level or types of exposure to risk factors. This may allow a Portfolio to pursue its objectives more quickly and efficiently than if it were to make direct purchases or sales of securities capable of affecting a similar response to market or credit factors.
In pursuit of its investment objectives, a Portfolio may seek to increase or decrease its exposure to the following market or credit risk factors:
Credit Risk. The price of a bond or other debt instrument is likely to fall if the issuer’s actual or perceived financial health deteriorates, whether because of broad economic or issuer-specific reasons. In certain cases, the issuer could
8
NOTES TO FINANCIAL STATEMENTS as of June 30, 2024 (Unaudited) (continued)
NOTE 2 — SIGNIFICANT ACCOUNTING POLICIES (continued)
be late in paying interest or principal, or could fail to pay its financial obligations altogether.
Equity Risk. Stock prices may be volatile or have reduced liquidity in response to real or perceived impacts of factors including, but not limited to, economic conditions, changes in market interest rates, and political events. Stock markets tend to be cyclical, with periods when stock prices generally rise and periods when stock prices generally decline. Any given stock market segment may remain out of favor with investors for a short or long period of time, and stocks as an asset class may underperform bonds or other asset classes during some periods. Additionally, legislative, regulatory or tax policies or developments in these areas may adversely impact the investment techniques available to a manager, add to costs and impair the ability of a Portfolio to achieve its investment objectives.
Foreign Exchange Rate Risk. To the extent that a Portfolio invests directly in foreign (non-U.S.) currencies or in securities denominated in, or that trade in, foreign (non-U.S.) currencies, it is subject to the risk that those foreign (non-U.S.) currencies will decline in value relative to the U.S. dollar or, in the case of hedging positions, that the U.S. dollar will decline in value relative to the currency being hedged by a Portfolio through foreign currency exchange transactions.
Currency rates may fluctuate significantly over short periods of time. Currency rates may be affected by changes in market interest rates, intervention (or the failure to intervene) by U.S. or foreign governments, central banks or supranational entities such as the International Monetary Fund, by the imposition of currency controls, or other political or economic developments in the United States or abroad.
Interest Rate Risk. A rise in market interest rates generally results in a fall in the value of bonds and other debt instruments; conversely, values generally rise as market interest rates fall. Interest rate risk is generally greater for debt instruments than floating-rate instruments. The higher the credit quality of the instrument, and the longer its maturity or duration, the more sensitive it is to changes in market interest rates. Duration is a measure of sensitivity of the price of a debt instrument to a change in interest rate. The U.S. has recently experienced a rising market interest rate environment, which may increase the Portfolios’ exposure to risks associated with rising market interest rates. Rising market interest rates have unpredictable effects on the markets and may expose debt and related markets to heightened volatility. To the extent that a mutual fund invests in debt instruments, an increase in market interest rates may lead to increased redemptions and
increased portfolio turnover, which could reduce liquidity for certain investments, adversely affect values, and increase costs. Increased redemptions may cause a fund to liquidate portfolio positions when it may not be advantageous to do so and may lower returns. If dealer capacity in debt markets is insufficient for market conditions, it may further inhibit liquidity and increase volatility in debt markets. Further, recent and potential future changes in government policy may affect interest rates. Negative or very low interest rates could magnify the risks associated with changes in interest rates. In general, changing interest rates, including rates that fall below zero, could have unpredictable effects on markets and may expose debt and related markets to heightened volatility. Changes to monetary policy by the U.S. Federal Reserve Board or other regulatory actions could expose debt and related markets to heightened volatility, interest rate sensitivity, and reduced liquidity, which may impact operations and return potential.
Risks of Investing in Derivatives. A Portfolio’s use of derivatives can result in losses due to unanticipated changes in the market or credit risk factors and the overall market. In instances where a Portfolio is using derivatives to decrease, or hedge, exposures to market or credit risk factors for securities held by a Portfolio, there are also risks that those derivatives may not perform as expected resulting in losses for the combined or hedged positions.
Derivative instruments are subject to a number of risks, including the risk of changes in the market price of the underlying securities, credit risk with respect to the counterparty, risk of loss due to changes in market interest rates and liquidity and volatility risk. The amounts required to purchase certain derivatives may be small relative to the magnitude of exposure assumed by a Portfolio. Therefore, the purchase of certain derivatives may have an economic leveraging effect on a Portfolio and exaggerate any increase or decrease in the NAV. Derivatives may not perform as expected, so a Portfolio may not realize the intended benefits. When used for hedging purposes, the change in value of a derivative may not correlate as expected with the currency, security or other risk being hedged. When used as an alternative or substitute for direct cash investments, the return provided by the derivative may not provide the same return as direct cash investment. In addition, given their complexity, derivatives expose a Portfolio to the risk of improper valuation.
Generally, derivatives are sophisticated financial instruments whose performance is derived, at least in part, from the performance of an underlying asset or assets. Derivatives include, among other things, swap agreements, options, forwards and futures. Investments in derivatives are generally negotiated over-the-counter (“OTC”) with a single counterparty and as a result are subject to credit risks related to the counterparty’s ability
9
NOTES TO FINANCIAL STATEMENTS as of June 30, 2024 (Unaudited) (continued)
NOTE 2 — SIGNIFICANT ACCOUNTING POLICIES (continued)
or willingness to perform its obligations; any deterioration in the counterparty’s creditworthiness could adversely affect the value of the derivative. In addition, derivatives and their underlying securities may experience periods of illiquidity which could cause a Portfolio to hold a security it might otherwise sell, or to sell a security it otherwise might hold at inopportune times or at an unanticipated price. A manager might imperfectly judge the direction of the market. For instance, if a derivative is used as a hedge to offset investment risk in another security, the hedge might not correlate to the market’s movements and may have unexpected or undesired results such as a loss or a reduction in gains.
Counterparty Credit Risk and Credit Related Contingent Features. Certain derivative positions are subject to counterparty credit risk, which is the risk that the counterparty will not fulfill its obligation to a Portfolio. Each Portfolio’s derivative counterparties are financial institutions who are subject to market conditions that may weaken their financial position. A Portfolio intends to enter into financial transactions with counterparties that it believes to be creditworthy at the time of the transaction. To reduce this risk, a Portfolio has entered into master netting arrangements, established within each Portfolio’s International Swap and Derivatives Association, Inc. (“ISDA”) Master Agreements (“Master Agreements”). These Master Agreements are with select counterparties and they govern transactions, including certain OTC derivative and forward foreign currency contracts, entered into by a Portfolio and the counterparty. The Master Agreements maintain provisions for general obligations, representations, agreements, collateral, and events of default or termination. The occurrence of a specified event of termination may give a counterparty the right to terminate all of its contracts and affect settlement of all outstanding transactions under the applicable Master Agreement.
A Portfolio may also enter into collateral agreements with certain counterparties to further mitigate counterparty credit risk on OTC derivative and forward foreign currency contracts. Subject to established minimum levels, collateral is generally determined based on the net aggregate unrealized gain or loss on contracts with a certain counterparty. Collateral pledged to or from a Portfolio is held in a segregated account by a third-party agent and can be in the form of cash or debt securities issued by the U.S. government or related agencies.
At June 30, 2024, the maximum amount of loss that BlackRock Inflation Protected Bond would incur if the counterparties to its derivative transactions failed to perform would be $288,451 which represents the gross payments
to be received by the Portfolio on OTC purchased options and forward foreign currency contracts were they to be unwound as of June 30, 2024. At June 30, 2024, BlackRock Inflation Protected Bond had received $80,000 in cash collateral from certain counterparties.
Each Portfolio has credit related contingent features that if triggered would allow its derivative counterparties to close out and demand payment or additional collateral to cover their exposure from a Portfolio. Credit related contingent features are established between a Portfolio and its derivatives counterparties to reduce the risk that a Portfolio will not fulfill its payment obligations to its counterparties. These triggering features include, but are not limited to, a percentage decrease in a Portfolio’s net assets and/or a percentage decrease in a Portfolio’s NAV, which could cause a Portfolio to accelerate payment of any net liability owed to the counterparty. The contingent features are established within each Portfolio’s Master Agreements.
At June 30, 2024, BlackRock Inflation Protected Bond had a liability position of $225,207 on forward foreign currency contracts, OTC credit default swaps, and OTC written options with credit related contingent features. If a contingent feature would have been triggered as of June 30, 2024, the Portfolio could have been required to pay this amount in cash to its counterparties. At June 30, 2024, BlackRock Inflation Protected Bond had not pledged any cash collateral for its open OTC derivative transactions.
H. Forward Foreign Currency Contracts. A Portfolio may enter into forward foreign currency contracts primarily to hedge against foreign currency exchange rate risk on its non-U.S. dollar denominated investment securities. When entering into a forward foreign currency contract, a Portfolio agrees to receive or deliver a fixed quantity of foreign currency for an agreed-upon price on an agreed future date. These contracts are valued daily and a Portfolio’s net equity therein, representing unrealized gain or loss on the contracts as measured by the difference between the forward foreign exchange rates at the dates of entry into the contracts and the forward rates at the reporting date, is included in the Statements of Assets and Liabilities. Realized and unrealized gains and losses are included in the Statements of Operations. These instruments involve market and/or credit risk in excess of the amount recognized in the Statements of Assets and Liabilities. Risks arise from the possible inability of counterparties to meet the terms of their contracts and from movement in currency and securities values and interest rates. Open forward foreign currency contracts are presented within the Portfolio of Investments.
For the period ended June 30, 2024, BlackRock Inflation Protected Bond had entered into forward foreign currency contracts with the obligation to buy and sell specified foreign
10
NOTES TO FINANCIAL STATEMENTS as of June 30, 2024 (Unaudited) (continued)
NOTE 2 — SIGNIFICANT ACCOUNTING POLICIES (continued)
currencies in the future at a currently negotiated forward rate in order to increase or decrease exposure to foreign exchange rate risk. The Portfolio uses forward foreign currency contracts primarily to protect any non-U.S. dollar-denominated holdings from adverse currency movements and to gain exposure to currencies for the purposes of risk management or enhanced return.
During the period ended June 30, 2024, BlackRock Inflation Protected Bond had average contract amounts of $2,995,814 and $6,508,264 on forward foreign currency contracts purchased and sold, respectively. Please refer to the tables within the Portfolio of Investments for open forward foreign currency contracts at June 30, 2024.
I. Futures Contracts. Each Portfolio may enter into futures contracts involving foreign currency, interest rates, securities and security indices. A futures contract is a commitment to buy or sell a specific amount of a financial instrument at a negotiated price on a stipulated future date. Each Portfolio may buy and sell futures contracts. Futures contracts traded on a commodities or futures exchange will be valued at the final settlement price or official closing price on the principal exchange as reported by such principal exchange at its trading session ending at, or most recently prior to, the time when a Portfolio’s assets are valued.
Upon entering into a futures contract, a Portfolio is required to deposit either cash or securities (initial margin) in an amount equal to a certain percentage of the contract value. Subsequent payments (variation margin) are made or received by a Portfolio each day. The variation margin payments are equal to the daily changes in the contract value and are recorded as unrealized gains and losses and included within Cash collateral for futures contracts on the Statement of Assets and Liabilities. Open futures contracts are reported on a table within the Portfolio of Investments. Securities held in collateralized accounts to cover initial margin requirements on open futures contracts are footnoted in the Portfolio of Investments. Cash collateral held by the broker to cover initial margin requirements on open futures contracts are noted in the Statements of Assets and Liabilities. The net change in unrealized appreciation and depreciation is reported in the Statements of Operations. Realized gains (losses) are reported in the Statements of Operations at the closing or expiration of futures contracts.
Futures contracts are exposed to the market risk factor of the underlying financial instrument. Additional associated risks of entering into futures contracts include the possibility that there may be an illiquid market where a Portfolio is unable to liquidate the contract or enter into an offsetting position and, if used for hedging purposes, the risk that
the price of the contract will correlate imperfectly with the prices of a Portfolio’s securities. With futures, there is minimal counterparty credit risk to a Portfolio since futures are exchange traded and the exchange’s clearinghouse, as counterparty to all exchange traded futures, guarantees the futures against default. During the period ended June 30, 2024, BlackRock Inflation Protected Bond and Bond Portfolio had purchased and sold futures contracts on various bonds and notes as part of their duration strategy. During the period ended June 30, 2024, the following Portfolios had average notional values on futures contracts purchased and sold as disclosed below:
| Purchased | Sold | |||||||
| BlackRock Inflation Protected Bond | $ | 36,169,998 | $ | 51,784,356 | ||||
| Bond Portfolio | 148,638,852 | — | ||||||
Please refer to the tables within Portfolio of Investments for open futures contracts for BlackRock Inflation Protected Bond and Bond Portfolio at June 30, 2024.
At June 30, 2024, BlackRock Inflation Protected Bond had pledged U.S. Treasuries with an original par value of $980,000 as collateral for open futures contracts.
J. Options Contracts. The Portfolios may purchase put and call options and may write (sell) put options and covered call options. The Portfolios may engage in option transactions as a hedge against adverse movements in the value of portfolio holdings or to increase market exposure. Option contracts are valued daily and unrealized gains or losses are recorded based upon the last sales price on the principal exchange on which the options are traded. An amount equal to the premium received by the Portfolios upon the writing of a put or call option is included in the Statements of Assets and Liabilities as a liability which is subsequently marked-to-market until it is exercised or closed, or it expires. The Portfolios will realize a gain or loss upon the expiration or closing of the option contract. When an option is exercised, the proceeds on sales of the underlying security for a written call option, the purchase cost of the security for a written put option, or the cost of the security for a purchased put or call option is adjusted by the amount of premium received or paid. Realized and unrealized gains or losses on option contracts are reflected in the accompanying financial statements. The risk in writing a covered call option is that a Portfolio gives up the opportunity for profit if the market price of the security increases and the option is exercised. The risk in writing a put option is that a Portfolio may incur a loss if the market price of the security decreases and the option is exercised. The risk in buying an option is that a Portfolio pays a premium whether or not the option is exercised. Risks may also arise from an illiquid secondary market or from the inability of counterparties to meet the terms of the contract.
11
NOTES TO FINANCIAL STATEMENTS as of June 30, 2024 (Unaudited) (continued)
NOTE 2 — SIGNIFICANT ACCOUNTING POLICIES (continued)
During the period ended June 30, 2024, BlackRock Inflation Protected Bond had purchased and written options on exchange-traded futures contracts to manage its duration strategy and to generate income. BlackRock Inflation Protected Bond had average notional values of $53,232,888 and $26,735,800, respectively, on purchased and written exchange-traded futures contracts. There were no open purchased and written options on exchange-traded futures contracts at June 30, 2024.
During the period ended June 30, 2024, BlackRock Inflation Protected Bond had purchased and written interest rate swap options (“swaptions”) to manage its duration strategy and to generate income. BlackRock Inflation Protected Bond had average notional values of $30,835,644 and $53,078,676, respectively, on purchased and written interest rate swaptions. Please refer to the tables within the Portfolio of Investments for open purchased and written interest rate swaptions at June 30, 2024.
During the period ended June 30, 2024, BlackRock Inflation Protected Bond had purchased foreign currency options to manage its foreign exchange exposure. BlackRock Inflation Protected Bond had an average notional value of $5,978,000 on purchased foreign currency options. Please refer to the tables within the Portfolio of investments for open purchased foreign currency options at June 30, 2024.
K. Swap Agreements. The Portfolios may enter into swap agreements. A swap is an agreement between two parties pursuant to which each party agrees to make one or more payments to the other at specified future intervals based on the return of an asset (such as a stock, bond or currency) or non-asset reference (such as an interest rate or index). Swap agreements are privately negotiated in the OTC market and may be executed in a multilateral or other trade facility platform, such as a registered commodities exchange (“centrally cleared swaps”).
The swap agreement will specify the “notional” amount of the asset or non-asset reference to which the contract relates. Subsequent changes in market value, if any, are calculated based upon changes in the performance of the asset or non-asset reference multiplied by the notional value of the contract. The Portfolios may enter into credit default, interest rate, total return and currency swaps to manage its exposure to credit, currency and interest rate risk. All outstanding swap agreements are reported within the Portfolio of Investments.
Swaps are marked to market daily using quotations primarily from third party pricing services, counterparties or brokers. The value of the swap contract is recorded on the Statements of Assets and Liabilities. During the term
of the swap, changes in the value of the swap, if any, are recorded as unrealized gains or losses on the Statements of Operations. Upfront payments paid or received by a Portfolio when entering into the agreements are reported on the Statements of Assets and Liabilities and as a component of the changes in unrealized gains or losses on the Statements of Operations. These upfront payments represent the amounts paid or received when initially entering into the swap agreement to compensate for differences between the stated terms of the swap agreement and the prevailing market conditions. The upfront payments are included as a component in the realized gains or losses on the Statements of Operations upon termination or maturity of the swap. A Portfolio also records net periodic payments paid or received on the swap contract as a realized gain or loss on the Statements of Operations.
In a centrally cleared swap, immediately following execution of the swap agreement, the swap agreement is novated to a central counterparty (the “CCP”) and a Portfolio’s counterparty on the swap agreement becomes the CCP. A Portfolio is required to interface with the CCP through a broker. Upon entering into a centrally cleared swap, a Portfolio is required to deposit initial margin with the broker in the form of cash or securities in an amount that varies depending on the size and risk profile of the particular swap. Securities deposited as initial margin are footnoted as pledged on the Portfolio of Investments and cash deposited is recorded on the Statements of Assets and Liabilities as cash pledged for centrally cleared swaps. The daily change in valuation of centrally cleared swaps is recorded as a receivable or payable for variation margin in the Statements of Assets and Liabilities. Payments received from (paid to) the counterparty, including at termination, are recorded as realized gain (loss) on the Statements of Operations.
Entering into swap agreements involves the risk that the maximum potential loss of an investment exceeds the current value of the investment as reported on the Statements of Assets and Liabilities. Other risks involve the possibility that the counterparty to the agreements may default on its obligation to perform, that there will be no liquid market for these investments and that unfavorable changes in the market will have a negative impact on the value of the index or securities underlying the respective swap agreement.
Credit Default Swap Contracts. A credit default swap is a bilateral agreement between counterparties in which the buyer of the protection agrees to make a stream of periodic payments to the seller of protection in exchange for the right to receive a specified return in the event of a default or other credit event for a referenced entity, obligation or index. As a seller of protection on credit default swaps, a Portfolio will generally receive from the buyer a fixed payment stream based on the notional amount of the swap contract. This
12
NOTES TO FINANCIAL STATEMENTS as of June 30, 2024 (Unaudited) (continued)
NOTE 2 — SIGNIFICANT ACCOUNTING POLICIES (continued)
fixed payment stream will continue until the swap contract expires or a defined credit event occurs.
A Portfolio is subject to credit risk in the normal course of pursuing its investment objectives. As a seller of protection in a credit default swap, a Portfolio may execute these contracts to manage its exposure to the market or certain sectors of the market. Certain Portfolios may also enter into credit default swaps to speculate on changes in an issuer’s credit quality, to take advantage of perceived spread advantages, or to offset an existing short equivalent (i.e. buying protection on an equivalent reference entity).
Certain Portfolios may sell credit default swaps which expose these Portfolios to the risk of loss from credit risk-related events specified in the contract. Although contract specific, credit events are generally defined as bankruptcy, failure to pay, restructuring, obligation acceleration, obligation default or repudiation/moratorium. If a Portfolio is a seller of protection, and a credit event occurs, as defined under the terms of that particular swap agreement, a Portfolio will generally either (i) pay to the buyer an amount equal to the notional amount of the swap and take delivery of the referenced obligation, other deliverable obligations, or underlying securities comprising a referenced index or (ii) pay a net settlement amount in the form of cash or securities equal to the notional amount of the swap less the recovery value of the referenced obligation or underlying securities comprising a referenced index. If a Portfolio is a buyer of protection and a credit event occurs, as defined under the terms of that particular swap agreement, a Portfolio will either (i) receive from the seller of protection an amount equal to the notional amount of the swap and deliver the referenced obligation, other deliverable obligations or underlying securities comprising the referenced index or (ii) receive a net settlement amount in the form of cash or securities equal to the notional amount of the swap less the recovery value of the referenced obligation or underlying securities comprising the referenced index. Recovery values are assumed by market makers considering either industry standard recovery rates or entity specific factors and considerations until a credit event occurs. If a credit event has occurred, the recovery value is determined by a facilitated auction whereby a minimum number of allowable broker bids, together with a specified valuation method, are used to calculate the settlement value.
Implied credit spreads, represented in absolute terms, utilized in determining the fair value of credit default swap agreements on corporate issues or sovereign issues are disclosed in each Portfolio’s Portfolio of Investments and serve as an indicator of the current status of the payment/performance risk and represent the likelihood or risk of
default for the credit derivative. The implied credit spread of a particular referenced entity reflects the cost of buying/ selling protection and may include upfront payments required to be made to enter into the agreement. For credit default swaps on asset-backed securities or credit indices, the quoted market prices and resulting fair values serve as the indicator of the current status of the payment/ performance risk. Wider credit spreads and increasing fair values, in absolute terms when compared to the notional amount of the swap, represent a deterioration of the referenced entity’s credit soundness and a greater likelihood or risk of default or other credit event occurring as defined under the terms of the agreement.
The maximum amount of future payments (undiscounted) that a Portfolio as seller of protection could be required to make under a credit default swap agreement would be an amount equal to the notional amount of the agreement. These potential amounts would be partially offset by any recovery values of the respective referenced obligations, upfront payments received upon entering into the agreements, or net amounts received from the settlement of buy protection credit default swap agreements entered into by a Portfolio for the same referenced entity or entities.
During the period ended June 30, 2024, BlackRock Inflation Protected Bond bought credit protection on certain single-name issuers (corporate or sovereign) with an average notional amount of $964,000 to reduce risk exposure to defaults of corporate and/or sovereign issuers or to create exposure to corporate and/or sovereign issuers to which the Portfolio is not otherwise exposed.
During the period ended June 30, 2024, BlackRock Inflation Protected Bond sold credit protection on credit default swap indices (“CDX”) with an average notional amount of $4,573,950 to gain additional exposure to the various sectors of the credit market. A CDX is a basket of credit instruments or exposures designed to be representative of some part of the credit market as a whole.
Please refer to the tables within the Portfolio of Investments for open credit default swaps to buy and sell protection at June 30, 2024.
Interest Rate Swap Contracts. An interest rate swap involves the agreement between counterparties to exchange periodic payments based on interest rates. One payment will be based on a floating rate of a specified interest rate while the other will be a fixed rate. Risks involve the future fluctuations of interest rates in which a Portfolio may make payments that are greater than what a Portfolio received from the counterparty. Other risks include credit, liquidity and market risk.
For the period ended June 30, 2024, BlackRock Inflation Protected Bond had entered into interest rate swaps in
13
NOTES TO FINANCIAL STATEMENTS as of June 30, 2024 (Unaudited) (continued)
NOTE 2 — SIGNIFICANT ACCOUNTING POLICIES (continued)
which they pay a floating interest rate and receive a fixed interest rate (“Long interest rate swap”) in order to increase exposure to interest rate risk. Average notional amount on long interest rate swaps for BlackRock Inflation Protected Bond was $154,798,036.
For the period ended June 30, 2024, BlackRock Inflation Protected Bond had entered into interest rate swaps in which they pay a fixed interest rate and receives a floating interest rate (“Short interest rate swap”) in order to decrease exposure to interest rate risk. Average notional amount on short interest rate swaps for BlackRock Inflation Protected Bond was $16,366,803.
The Portfolios enter into interest rate swaps to adjust interest rate and yield curve exposures and to substitute for physical fixed-income securities. Please refer to the tables within the Portfolio of Investments for BlackRock Inflation Protected Bond for open interest rate swaps at June 30, 2024.
Inflation-linked Swap Contracts. In an inflation-linked swap, one party pays a fixed interest rate on a notional amount while the other party pays a floating rate linked to an inflation index on that same notional amount. The party paying the floating rate pays the inflation adjusted rate multiplied by the notional amount.
For the period ended June 30, 2024, BlackRock Inflation Protected Bond had entered into inflation-linked swaps in which they pay a floating rate linked to an inflation index and receive a fixed interest rate (“long inflation-linked swap”). Average notional amount on long inflation-linked swaps for BlackRock Inflation Protected Bond was $3,100,213.
For the period ended June 30, 2024, BlackRock Inflation Protected Bond had entered into inflation-linked swaps in which it pays a fixed interest rate and receives a floating rate linked to an inflation index (“short inflation-linked swap”). Average notional amount on short inflation linked-bonds was $109,044,386.
BlackRock Inflation Protected Bond used inflation-linked swaps as part of their inflation strategy. Please refer to the tables within the Portfolio of Investments for BlackRock Inflation Protected Bond for open inflation-linked swaps at June 30, 2024.
At June 30, 2024, BlackRock Inflation Protected Bond pledged $3,364,000 in cash collateral for open centrally cleared swaps.
L. Inflation-Indexed Bonds. Inflation-indexed bonds are fixed income securities whose principal value is periodically adjusted according to the rate of inflation. If the index measuring inflation rises or falls, the principal
value of inflation-indexed bonds will be adjusted upward or downward, and consequently the interest payable on these securities (calculated with respect to a larger or smaller principal amount) will be increased or reduced, respectively. Any upward or downward adjustment in the principal amount of an inflation-indexed bond will be included in interest income in the Statement of Operations, even though investors do not receive their principal until maturity. Repayment of the original bond principal upon maturity (as adjusted for inflation) is guaranteed in the case of US Treasury inflation-indexed bonds. For bonds that do not provide a similar guarantee, the adjusted principal value of the bond repaid at maturity may be less than the original principal.
M. Securities Lending. Each Portfolio may temporarily loan up to 33⅓% of its total assets to brokers, dealers or other financial institutions in exchange for a negotiated lender’s fee. Securities lending involves two primary risks: “investment risk” and “borrower default risk.” When lending securities, the Portfolios will receive cash or U.S. government securities as collateral. Investment risk is the risk that the Portfolios will lose money from the investment of the cash collateral received from the borrower. Borrower default risk is the risk that the Portfolios will lose money due to the failure of a borrower to return a borrowed security. Loans are subject to termination at the option of the borrower or the Portfolios. Securities lending may result in leverage. The use of leverage may exaggerate any increase or decrease in the NAV, causing the Portfolios to be more volatile. The use of leverage may increase expenses and increase the impact of the Portfolios’ other risks.
N. Sales Commitments. Sales commitments involve commitments to sell fixed income securities where the unit price and the estimated principal amount are established upon entering into the contract, with the actual principal amount being within a specified range of the estimate. A Portfolio will enter into sale commitments to hedge its portfolio positions or to sell mortgage-backed securities it owns under delayed delivery arrangements. Proceeds of sale commitments are not received until the contractual settlement date. During the time a sale commitment is outstanding, except for delayed delivery transactions, the Portfolio will maintain, in a segregated account, cash or marketable securities in an amount sufficient to meet the purchase price. Unsettled sale commitments are valued at current market value of the underlying securities. If the sale commitment is closed through the acquisition of an offsetting purchase commitment, the Portfolio realizes a gain or loss on the commitment without regard to any unrealized gain or loss on the underlying security. If the Portfolio delivers securities under the commitment, the Portfolio realizes a gain or loss from the sale of the securities, based upon
14
NOTES TO FINANCIAL STATEMENTS as of June 30, 2024 (Unaudited) (continued)
NOTE 2 — SIGNIFICANT ACCOUNTING POLICIES (continued)
the unit price established at the date the commitment was entered into. Please refer to the table following the Portfolio of Investments for open sales commitments held by BlackRock Inflation Protected Bond at June 30, 2024.
O. Indemnifications. In the normal course of business, the Portfolios may enter into contracts that provide certain indemnifications. The Trusts’ maximum exposure under these arrangements is dependent on future claims that may be made against the Portfolios and, therefore, cannot be estimated; however, based on experience, management considers the risk of loss from such claims remote.
NOTE 3 — INVESTMENT TRANSACTIONS
For the period ended June 30, 2024, the cost of purchases and the proceeds from the sales of securities, excluding U.S. government and short-term securities, were as follows:
| Purchases | Sales | |||||||
| BlackRock Inflation Protected Bond | $ | 192,651,449 | $ | 189,871,752 | ||||
| Bond Portfolio | — | 6,746,985 | ||||||
U.S. government securities not included above were as follows:
| Purchases | Sales | |||||||
| BlackRock Inflation Protected Bond | $ | 143,824,089 | $ | 164,824,526 | ||||
| Bond Portfolio | 100,600,742 | 106,183,208 | ||||||
NOTE 4 — INVESTMENT MANAGEMENT FEES
The Portfolios have entered into investment management agreements (“Management Agreements”) with the Investment Adviser. The Investment Adviser has overall responsibility for the management of the Portfolios. The Investment Adviser oversees all investment management and portfolio management services for the Portfolios and assists in managing and supervising all aspects of the general day-to-day business activities and operations of the Portfolios, including custodial, transfer agency, dividend disbursing, accounting, auditing, compliance and related services. Each Management Agreement compensates the Investment Adviser with a management fee, computed daily and payable monthly, based on the average daily net assets of each Portfolio, at the following annual rates:
| Portfolio | Fee | |
| BlackRock Inflation Protected | 0.55% on the first $200 million; | |
| Bond(1) | 0.50% on the next $800 million; and | |
| 0.40% thereafter | ||
| Bond Portfolio | 0.50% on the first $750 million; and | |
| 0.48% thereafter |
| (1) | The Investment Adviser has contractually agreed to waive 0.05% of the management fee. Any fees waived or reimbursed are not eligible for recoupment. Termination or modification of this obligation requires approval by the Board. |
The Investment Adviser has entered into sub-advisory agreements with each sub-adviser. These sub-advisers provide investment advice for the Portfolios and are paid by the Investment Adviser based on the average daily net assets of each Portfolio. Subject to such policies as the Board or the Investment Adviser may determine, the sub-advisers manage each Portfolio’s assets in accordance with that Portfolio’s investment objectives, policies, and limitations.
| Portfolio | Sub-Adviser | |
| BlackRock Inflation Protected Bond | BlackRock Financial Management, Inc. | |
| Bond Portfolio | Brandywine Global Investment Management, LLC |
NOTE 5 — DISTRIBUTION AND SERVICE FEES
Voya Investors Trust has entered into a shareholder service plan (the “Plan”) for the Class S shares of BlackRock Inflation Protected Bond. The Plan compensates the Distributor for the provision of shareholder services and/or account maintenance services to direct or indirect beneficial owners of Class S shares. Under the Plan, the Portfolio makes payments to the Distributor at an annual rate of 0.25% of the Portfolio’s average daily net assets attributable to Class S shares.
Class ADV shares of BlackRock Inflation Protected Bond have a shareholder service and distribution plan. The Portfolio pays the Distributor a shareholder service fee of 0.25% and a distribution fee of 0.35% of the Portfolio’s average daily net assets attributable to Class ADV shares.
NOTE 6 — OTHER TRANSACTIONS WITH AFFILIATES AND RELATED PARTIES
At June 30, 2024, the following direct or indirect, wholly-owned subsidiaries of Voya Financial, Inc. or affiliated investment companies owned more than 5% of the following Portfolios:
| Subsidiary/Affiliated Investment | ||||
| Company | Portfolio | Percentage | ||
| Voya Institutional Trust Company | BlackRock | |||
| Inflation Protected | ||||
| Bond | 18.53% | |||
| Voya Solution 2025 Portfolio | Bond Portfolio | 12.53 | ||
| Voya Solution 2035 Portfolio | Bond Portfolio | 11.30 | ||
| Voya Solution Income Portfolio | Bond Portfolio | 8.19 | ||
| Voya Solution Moderately Aggressive | ||||
| Portfolio | Bond Portfolio | 8.99 | ||
15
NOTES TO FINANCIAL STATEMENTS as of June 30, 2024 (Unaudited) (continued)
NOTE 6 — OTHER TRANSACTIONS WITH AFFILIATES AND RELATED PARTIES (continued)
The Portfolios have adopted a deferred compensation plan (the “DC Plan”), which allows eligible independent trustees, as described in the DC Plan, to defer the receipt of all or a portion of the trustees’ fees that they are entitled to receive from the Portfolios. For purposes of determining the amount owed to the trustee under the DC Plan, the amounts deferred are invested in shares of the funds selected by the trustee (the “Notional Funds”). When the Portfolios purchase shares of the Notional Funds, which are all advised by Voya Investments, in amounts equal to the trustees’ deferred fees, this results in a Portfolio asset equal to the deferred compensation liability. Such assets, if applicable, are included as a component of “Other assets” on the accompanying Statements of Assets and Liabilities. Deferral of trustees’ fees under the DC Plan will not affect net assets of the Portfolios, and will not materially affect a Portfolio’s assets, liabilities or net investment income per share. Amounts will be deferred until distributed in accordance with the DC Plan.
The Portfolios may pay per account fees to affiliates of Voya Investments for recordkeeping services provided on certain assets. For the period ended June 30, 2024, the per account fees for affiliated recordkeeping services paid by each Portfolio were as follows:
| Portfolio | Amount | |
| BlackRock Inflation Protected Bond | $31,819 | |
NOTE 7 — EXPENSE LIMITATION AGREEMENTS
The Investment Adviser has entered into written expense limitation agreements (“Expense Limitation Agreements”) with the below Portfolios, whereby the Investment Adviser has agreed to limit expenses, excluding interest, taxes, investment-related costs, leverage expenses, extraordinary expenses, and acquired fund fees and expenses to the levels listed below:
| Portfolio | Maximum Operating Expense Limit (as a percentage of net assets) | |
| BlackRock Inflation Protected | Class ADV: 1.23% | |
| Bond | Class I: 0.63% | |
| Class S: 0.88% | ||
| Bond Portfolio | 0.58% |
With the exception of the non-recoupable management fee waiver for BlackRock Inflation Protected Bond, the Investment Adviser may, at a later date, recoup from a Portfolio for fees waived and/or other expenses reimbursed by the Investment Adviser during the previous 36 months, but only if, after such recoupment, a Portfolio’s expense ratio does not exceed the percentage described above. Waived and reimbursed fees net of any recoupment by the Investment Adviser of such waived and reimbursed fees are
reflected on the accompanying Statements of Operations. Amounts payable by the Investment Adviser are reflected on the accompanying Statements of Assets and Liabilities.
The amount of class specific fees waived or reimbursed that are subject to possible recoupment by the Investment Adviser, and the related expiration dates, as of June 30, 2024, are as follows:
| June 30, | ||||||||||||||||
| 2025 | 2026 | 2027 | Total | |||||||||||||
| BlackRock Inflation Protected Bond | ||||||||||||||||
| Class ADV | $ | — | $ | — | $ | 91 | $ | 91 | ||||||||
| Class I | — | — | 27 | 27 | ||||||||||||
| Class S | — | — | 221 | 221 | ||||||||||||
The Expense Limitation Agreements are contractual through May 1, 2025 and shall renew automatically for one-year terms. Termination or modification of these obligations requires approval by the Board.
NOTE 8 — LINE OF CREDIT
Effective June 10, 2024, the Portfolios, in addition to certain other funds managed by the Investment Adviser, entered into a 364-day unsecured committed revolving line of credit agreement (the “Credit Agreement”) with The Bank of New York Mellon (“BNY”) for an aggregate amount of $400,000,000 through June 9, 2025. The proceeds may be used only to finance temporarily: (1) the purchase or sale of investment securities; or (2) the repurchase or redemption of shares of the Portfolio or certain other funds managed by the Investment Adviser. The funds to which the line of credit is available pay a commitment fee equal to 0.15% per annum on the daily unused portion of the committed line amount payable quarterly in arrears. Prior to June 10, 2024, the predecessor line of credit was for an aggregate amount of $400,000,000 and the funds to which the line of credit was available paid a commitment fee equal to 0.15% per annum on the daily unused portion of the committed line amount through June 10, 2024.
Borrowings under the Credit Agreement accrue interest at the federal funds rate plus a specified margin. Repayments generally must be made within 60 days after the date of a revolving credit advance.
The following Portfolio utilized the line of credit during the period ended June 30, 2024:
| Portfolio | Days Utilized | Approximate Average Daily Balance For Days Utilized | Approximate Weighted Average Interest Rate For Days Utilized | |||||||||
| BlackRock Inflation Protected Bond | 1 | $ | 10,179,000 | 6.33% | ||||||||
16
NOTES TO FINANCIAL STATEMENTS as of June 30, 2024 (Unaudited) (continued)
NOTE 9 — CAPITAL SHARES
Transactions in capital shares and dollars were as follows:
| Shares sold | Shares issued in merger | Reinvestment of distributions | Shares redeemed | Shares converted | Net increase (decrease) in shares outstanding | Shares sold | Proceeds from shares issued in merger | Reinvestment of distributions | Shares redeemed | Shares converted | Net increase (decrease) | |||||||||||||||||||||||||||||||||||||
| Year or | ||||||||||||||||||||||||||||||||||||||||||||||||
| period ended | # | # | # | # | # | # | ($) | ($) | ($) | ($) | ($) | ($) | ||||||||||||||||||||||||||||||||||||
| BlackRock Inflation Protected Bond | ||||||||||||||||||||||||||||||||||||||||||||||||
| Class ADV | ||||||||||||||||||||||||||||||||||||||||||||||||
| 6/30/2024 | 72,522 | — | 83,804 | (439,277 | ) | — | (282,951 | ) | 636,510 | — | 727,614 | (3,839,547 | ) | — | (2,475,423 | ) | ||||||||||||||||||||||||||||||||
| 12/31/2023 | 300,597 | — | 142,664 | (980,003 | ) | — | (536,742 | ) | 2,682,282 | — | 1,253,985 | (8,599,596 | ) | — | (4,663,329 | ) | ||||||||||||||||||||||||||||||||
| Class I | ||||||||||||||||||||||||||||||||||||||||||||||||
| 6/30/2024 | 571,113 | — | 167,354 | (567,026 | ) | — | 171,441 | 5,227,632 | — | 1,516,388 | (5,171,123 | ) | — | 1,572,897 | ||||||||||||||||||||||||||||||||||
| 12/31/2023 | 1,705,465 | — | 285,505 | (2,945,229 | ) | — | (954,259 | ) | 15,616,749 | — | 2,616,072 | (26,971,145 | ) | — | (8,738,324 | ) | ||||||||||||||||||||||||||||||||
| Class S | ||||||||||||||||||||||||||||||||||||||||||||||||
| 6/30/2024 | 156,101 | — | 245,027 | (1,132,934 | ) | — | (731,806 | ) | 1,413,399 | — | 2,202,627 | (10,246,303 | ) | — | (6,630,277 | ) | ||||||||||||||||||||||||||||||||
| 12/31/2023 | 304,172 | — | 442,310 | (3,274,121 | ) | — | (2,527,639 | ) | 2,784,423 | — | 4,021,674 | (29,781,848 | ) | — | (22,975,751 | ) | ||||||||||||||||||||||||||||||||
| Bond Portfolio | ||||||||||||||||||||||||||||||||||||||||||||||||
| 6/30/2024 | 3,280,491 | — | — | (4,771,936 | ) | — | (1,491,445 | ) | 30,863,930 | — | — | (44,113,192 | ) | — | (13,249,262 | ) | ||||||||||||||||||||||||||||||||
| 12/31/2023 | 5,634,277 | — | 535,758 | (11,014,776 | ) | — | (4,844,741 | ) | 52,927,045 | — | 5,046,842 | (104,883,514 | ) | — | (46,909,627 | ) | ||||||||||||||||||||||||||||||||
NOTE 10 — SECURITIES LENDING
Under an agreement with BNY, the Portfolios can lend its securities to approved brokers, dealers and other financial institutions. Loans are collateralized by cash and U.S. government securities. The collateral must be equal to at least 105% of the market value of non-U.S. securities loaned and 102% of the market value of U.S. securities loaned. The market value of the loaned securities is determined at Market Close of a Portfolio at their last sale price or official closing price on the principal exchange or system on which they are traded and any additional collateral is delivered to a Portfolio on the next business day. The cash collateral received is invested in approved investments as defined in the Securities Lending Agreement with BNY (the “Agreement”). The Portfolios bear the risk of loss with respect to the investment of collateral with the following exception: BNY provides the Portfolios indemnification from loss with respect to the investment of collateral to the extent the cash collateral is invested in overnight repurchase agreements.
Cash collateral received in connection with securities lending is invested in cash equivalents, money market funds, repurchase agreements with maturities of not more than 99 days that are collateralized with U.S. Government securities, or certain short-term investments that have a remaining maturity of 190 days or less (“Permitted Investments”). Short-term investments include: securities, units, shares or other participations in short-term investment funds, pools or trusts; commercial paper, notes, bonds or other debt obligations, certificates of deposit, time deposits and other bank obligations and asset-backed commercial paper backed by diversified receivables and repurchase-backed programs. Permitted Investments are subject to
certain guidelines established by the Adviser regarding liquidity, diversification, credit quality and average credit life/duration requirements. The securities purchased with cash collateral received are reflected in the Portfolio of Investments under Short-Term Investments.
Generally, in the event of counterparty default, a Portfolio has the right to use the collateral to offset losses incurred. The Agreement contains certain guarantees by BNY in the event of counterparty default and/or a borrower’s failure to return a loaned security; however, there would be a potential loss to a Portfolio in the event a Portfolio is delayed or prevented from exercising its right to dispose of the collateral. Engaging in securities lending could have a leveraging effect, which may intensify the credit, market and other risks associated with investing in a portfolio.
At June 30, 2024, the Portfolios did not have any outstanding securities on loan.
17
NOTES TO FINANCIAL STATEMENTS as of June 30, 2024 (Unaudited) (continued)
NOTE 11 — FEDERAL INCOME TAXES
The amount of distributions from net investment income and net realized capital gains are determined in accordance with U.S. federal income tax regulations, which may differ from GAAP for investment companies. These book/tax differences may be either temporary or permanent. Permanent differences are reclassified within the capital accounts based on their federal tax-basis treatment; temporary differences are not reclassified. Key differences include the treatment of foreign currency transactions, futures contracts, paydowns, straddle loss deferrals, swaps and wash sale deferrals. Distributions in excess of net investment income and/or net realized capital gains for tax purposes are reported as return of capital.
Dividends paid by the Portfolios from net investment income and distributions of net realized short-term capital gains are, for federal income tax purposes, taxable as ordinary income to shareholders.
The tax composition of dividends and distributions to shareholders was as follows:
| Year Ended December 31, 2023 | Year Ended December 31, 2022 | |||||||||||||||
| Ordinary Income | Ordinary Income | Long-term Capital Gains | Return of Capital | |||||||||||||
| BlackRock Inflation Protected Bond | $ | 7,891,731 | $ | 10,633,925 | $ | — | $ | 1,431,581 | ||||||||
| Bond Portfolio | 5,046,842 | 11,934,135 | 5,177,646 | — | ||||||||||||
The tax-basis components of distributable earnings and the capital loss carryforwards which may be used to offset future realized capital gains for federal income tax purposes as of December 31, 2023 were:
| Undistributed Ordinary | Unrealized Appreciation/ | Capital Loss Carryforwards | Total Distributable | ||||||||||||||||
| Income | (Depreciation) | Amount | Character | Earnings/(Loss) | |||||||||||||||
| BlackRock Inflation Protected Bond | $ | 79,598 | $ | (15,331,247 | ) | $ | (10,849,324 | ) | Short-term | $ | (87,301,256 | ) | |||||||
| (61,200,283 | ) | Long-term | |||||||||||||||||
| $ | (72,049,607 | ) | |||||||||||||||||
| Bond Portfolio | 9,402,332 | 176,932 | (26,875,666 | ) | Short-term | (24,103,607 | ) | ||||||||||||
| (6,807,205 | ) | Long-term | |||||||||||||||||
| $ | (33,682,871 | ) | |||||||||||||||||
The Portfolios’ major tax jurisdictions are U.S. federal, Arizona state, and Massachusetts state (BlackRock Inflation Protected Bond).
As of June 30, 2024, no provision for income tax is required in the Portfolios’ financial statements as a result of tax positions taken on federal and state income tax returns for open tax years. The Portfolios’ federal and state income and federal excise tax returns for tax years for which the applicable statutes of limitations have not expired are subject to examination by the Internal Revenue Service and state department of revenue. Generally, the preceding four tax years remain subject to examination by these jurisdictions.
NOTE 12 — LONDON INTERBANK OFFERED RATE (“LIBOR”)
The London Interbank Offered Rate (“LIBOR”) was the offered rate for short-term Eurodollar deposits between major international banks. The terms of investments, financings or other transactions (including certain derivatives transactions) to which the Portfolio may be a party have historically been tied to LIBOR. In connection with the global transition away from LIBOR led by regulators and market participants, LIBOR was last published on a representative basis at the end of June 2023. Alternative reference rates
to LIBOR have been established in most major currencies and markets in these new rates are continuing to develop. The transition away from LIBOR to the use of replacement rates has gone relatively smoothly on the Portfolio and the financial instruments in which it invests; however, longer-term impacts are still uncertain.
In addition, interest rates or other types of rates and indices which are classed as “benchmarks” have been the subject of ongoing national and international regulatory reform, including under the European Union regulation on indices used as benchmarks in financial instruments and financial
18
NOTES TO FINANCIAL STATEMENTS as of June 30, 2024 (Unaudited) (continued)
NOTE 12 — LONDON INTERBANK OFFERED RATE (“LIBOR”) (continued)
contracts (known as the “Benchmarks Regulation”). The Benchmarks Regulation has been enacted into United Kingdom law by virtue of the European Union (Withdrawal) Act 2018 (as amended), subject to amendments made by the Benchmarks (Amendment and Transitional Provision) (EU Exit) Regulations 2019 (SI 2019/657) and other statutory instruments. Following the implementation of these reforms, the manner of administration of benchmarks has changed and may further change in the future, with the result that relevant benchmarks may perform differently than in the past, the use of benchmarks that are not compliant with the new standards by certain supervised entities may be restricted, and certain benchmarks may be eliminated entirely. Such changes could cause increased market volatility and disruptions in liquidity for instruments that rely on or are impacted by such benchmarks. Additionally, there could be other consequences which cannot be predicted.
NOTE 13 — MARKET DISRUPTION AND GEOPOLITICAL RISK
A Portfolio is subject to the risk that geopolitical events will disrupt securities markets and adversely affect global economies and markets. Due to the increasing interdependence among global economies and markets, conditions in one country, market, or region might adversely impact markets, issuers and/or foreign exchange rates in other countries, including the United States. Wars, terrorism, global health crises and pandemics, and other geopolitical events that have led, and may continue to lead, to increased market volatility and may have adverse short- or long-term effects on U.S. and global economies and markets, generally. For example, the COVID-19 pandemic resulted in significant market volatility, exchange suspensions and closures, declines in global financial markets, higher default rates, supply chain disruptions, and a substantial economic downturn in economies throughout the world. The economic impacts of COVID-19 have created a unique challenge for real estate markets. Many businesses have either partially or fully transitioned to a remote-working environment and this transition may negatively impact the occupancy rates of commercial real estate over time. Natural and environmental disasters and systemic market dislocations are also highly disruptive to economies and markets. In addition, military action by
Russia in Ukraine has, and may continue to, adversely affect global energy and financial markets and therefore could affect the value of investments, including beyond the direct exposure to Russian issuers or nearby geographic regions. The extent and duration of the military action, sanctions, and resulting market disruptions are impossible to predict and could be substantial. A number of U.S. domestic banks and foreign (non-U.S.) banks have recently experienced financial difficulties and, in some cases, failures. There can be no certainty that the actions taken by regulators to limit the effect of those financial difficulties and failures on other banks or other financial institutions or on the U.S. or foreign (non-U.S.) economies generally will be successful. It is possible that more banks or other financial institutions will experience financial difficulties or fail, which may affect adversely other U.S. or foreign (non-U.S.) financial institutions and economies. These events as well as other changes in foreign (non-U.S.) and domestic economic, social, and political conditions also could adversely affect individual issuers or related groups of issuers, securities markets, interest rates, credit ratings, inflation, investor sentiment, and other factors affecting the value of a Portfolio's investments. Any of these occurrences could disrupt the operations of a Portfolio and of a Portfolio's service providers.
NOTE 14 — SUBSEQUENT EVENTS
Dividends: Subsequent to June 30, 2024, the Portfolios paid dividends from net investment income of:
| Per Share | Record | |||||||||
| Amount | Payable Date | Date | ||||||||
| BlackRock Inflation Protected Bond | ||||||||||
| Class ADV | $0.0290 | August 1, 2024 | July 30, 2024 | |||||||
| Class I | $0.0338 | August 1, 2024 | July 30, 2024 | |||||||
| Class S | $0.0317 | August 1, 2024 | July 30, 2024 | |||||||
| Bond Portfolio | ||||||||||
| $0.4216 | July 16, 2024 | July 12, 2024 | ||||||||
The Portfolios have evaluated events occurring after the Statements of Assets and Liabilities date through the date that the financial statements were issued (“subsequent events”), to determine whether any subsequent events necessitated adjustment to or disclosure in the financial statements. Other than the above, no such subsequent events were identified.
19
| VY® BlackRock Inflation | PORTFOLIO OF INVESTMENTS |
| Protected Bond Portfolio | as of June 30, 2024 (Unaudited) |
| Principal Amount† | Value | Percentage of Net Assets | ||||||||||
| U.S. TREASURY OBLIGATIONS: 49.2% | ||||||||||||
| United States Treasury Bonds: 0.2% | ||||||||||||
| 455,000 | 3.000%, 02/15/2049 | $ | 344,734 | 0.2 | ||||||||
| United States Treasury Inflation Indexed Bonds: 19.4% | ||||||||||||
| 1,506,934 | 0.125%, 01/15/2030 | 1,466,751 | 0.7 | |||||||||
| 2,697,699 | 0.125%, 02/15/2051 | 1,562,119 | 0.7 | |||||||||
| 3,086,199 | 0.125%, 02/15/2052 | 1,754,925 | 0.8 | |||||||||
| 2,615,999 | 0.250%, 02/15/2050 | 1,599,232 | 0.8 | |||||||||
| 2,693,466 | 0.625%, 02/15/2043 | 2,024,699 | 1.0 | |||||||||
| 3,364,562 | 0.750%, 02/15/2042 | 2,631,244 | 1.3 | |||||||||
| 4,054,478 (1) | 0.750%, 02/15/2045 | 3,040,434 | 1.5 | |||||||||
| 2,714,722 | 0.875%, 02/15/2047 | 2,040,714 | 1.0 | |||||||||
| 2,090,814 | 1.000%, 02/15/2046 | 1,633,270 | 0.8 | |||||||||
| 1,767,385 | 1.000%, 02/15/2048 | 1,354,679 | 0.6 | |||||||||
| 1,227,349 | 1.000%, 02/15/2049 | 933,306 | 0.4 | |||||||||
| 3,565,204 | 1.375%, 02/15/2044 | 3,058,603 | 1.5 | |||||||||
| 2,797,910 | 1.500%, 02/15/2053 | 2,353,079 | 1.1 | |||||||||
| 724,388 (1) | 1.750%, 01/15/2028 | 713,048 | 0.3 | |||||||||
| 1,155,169 | 2.125%, 02/15/2040 | 1,144,405 | 0.5 | |||||||||
| 2,226,418 | 2.125%, 02/15/2041 | 2,209,526 | 1.1 | |||||||||
| 1,678,835 | 2.375%, 10/15/2028 | 1,701,236 | 0.8 | |||||||||
| 1,752,480 | 2.500%, 01/15/2029 | 1,783,690 | 0.9 | |||||||||
| 1,157,038 | 3.375%, 04/15/2032 | 1,263,714 | 0.6 | |||||||||
| 2,593,833 | 3.625%, 04/15/2028 | 2,726,728 | 1.3 | |||||||||
| 3,219,522 | 3.875%, 04/15/2029 | 3,478,615 | 1.7 | |||||||||
| 40,474,017 | 19.4 | |||||||||||
| United States Treasury Inflation Indexed Notes: 29.6% | ||||||||||||
| 138,814 | 0.125%, 04/15/2027 | 130,636 | 0.1 | |||||||||
| 591,065 | 0.125%, 01/15/2030 | 532,156 | 0.2 | |||||||||
| 3,149,045 | 0.125%, 07/15/2030 | 2,818,790 | 1.3 | |||||||||
| 4,167,535 | 0.125%, 01/15/2031 | 3,680,148 | 1.8 | |||||||||
| 6,627,257 | 0.125%, 07/15/2031 | 5,822,015 | 2.8 | |||||||||
| 7,623,681 (1) | 0.125%, 01/15/2032 | 6,603,303 | 3.1 | |||||||||
| 1,287,069 | 0.250%, 07/15/2029 | 1,182,231 | 0.6 | |||||||||
| 1,993,168 | 0.375%, 07/15/2027 | 1,891,859 | 0.9 | |||||||||
| 8,347,303 | 0.625%, 07/15/2032 | 7,488,377 | 3.6 | |||||||||
| 587,082 | 0.750%, 07/15/2028 | 558,026 | 0.3 | |||||||||
| 7,810,366 | 1.125%, 01/15/2033 | 7,229,611 | 3.4 | |||||||||
| 8,019,167 | 1.375%, 07/15/2033 | 7,575,826 | 3.6 | |||||||||
| 2,525,298 | 1.625%, 10/15/2027 | 2,484,680 | 1.2 | |||||||||
| 7,905,233 | 1.750%, 01/15/2034 | 7,674,664 | 3.7 | |||||||||
| 6,249,522 | 2.125%, 04/15/2029 | 6,258,716 | 3.0 | |||||||||
| 61,931,038 | 29.6 | |||||||||||
| Total U.S. Treasury Obligations | ||||||||||||
| (Cost $112,161,555) | 102,749,789 | 49.2 | ||||||||||
| CORPORATE BONDS/NOTES: 25.1% | ||||||||||||
| Basic Materials: 0.7% | ||||||||||||
| 400,000 (2) | Anglo American Capital PLC, 2.625%, 09/10/2030 | 342,875 | 0.2 | |||||||||
| 467,000 (2) | Anglo American Capital PLC, 4.500%, 03/15/2028 | 454,155 | 0.2 | |||||||||
| 200,000 (2) | Anglo American Capital PLC, 5.625%, 04/01/2030 | 201,878 | 0.1 | |||||||||
| Principal Amount† | Value | Percentage of Net Assets | ||||||||||
| CORPORATE BONDS/NOTES: (continued) | ||||||||||||
| Basic Materials: (continued) | ||||||||||||
| 65,000 (2) | Glencore Funding LLC, 3.875%, 10/27/2027 | $ | 62,044 | 0.0 | ||||||||
| 314,000 (2) | Glencore Funding LLC, 5.371%, 04/04/2029 | 312,644 | 0.2 | |||||||||
| 43,000 (2) | Glencore Funding LLC, 6.125%, 10/06/2028 | 44,034 | 0.0 | |||||||||
| 63,000 (2) | Glencore Funding LLC, 6.375%, 10/06/2030 | 65,699 | 0.0 | |||||||||
| 66,000 | Newmont Corp., 2.600%, 07/15/2032 | 55,037 | 0.0 | |||||||||
| 1,538,366 | 0.7 | |||||||||||
| Communications: 1.7% | ||||||||||||
| 345,000 | AT&T, Inc., 3.650%, 09/15/2059 | 231,553 | 0.1 | |||||||||
| 102,000 | AT&T, Inc., 3.850%, 06/01/2060 | 71,201 | 0.0 | |||||||||
| 175,000 | AT&T, Inc., 4.500%, 03/09/2048 | 144,429 | 0.1 | |||||||||
| 198,000 | AT&T, Inc., 5.700%, 03/01/2057 | 192,055 | 0.1 | |||||||||
| 43,000 | Charter Communications Operating LLC / Charter Communications Operating Capital, 3.850%, 04/01/2061 | 25,135 | 0.0 | |||||||||
| 129,000 | Charter Communications Operating LLC / Charter Communications Operating Capital, 3.900%, 06/01/2052 | 80,970 | 0.0 | |||||||||
| 88,000 | Charter Communications Operating LLC / Charter Communications Operating Capital, 3.950%, 06/30/2062 | 52,185 | 0.0 | |||||||||
| 137,000 | Comcast Corp., 2.937%, 11/01/2056 | 82,711 | 0.0 | |||||||||
| 164,000 | Comcast Corp., 2.987%, 11/01/2063 | 96,339 | 0.1 | |||||||||
| 231,000 | Meta Platforms, Inc., 5.750%, 05/15/2063 | 237,529 | 0.1 | |||||||||
| 21,000 | Motorola Solutions, Inc., 5.600%, 06/01/2032 | 21,245 | 0.0 | |||||||||
| 16,000 | Paramount Global, 4.950%, 05/19/2050 | 11,154 | 0.0 | |||||||||
| 21,000 | Paramount Global, 5.250%, 04/01/2044 | 15,347 | 0.0 | |||||||||
| 110,000 | Rogers Communications, Inc., 5.300%, 02/15/2034 | 107,978 | 0.1 | |||||||||
| 750,000 | Sprint LLC, 7.625%, 03/01/2026 | 771,330 | 0.4 | |||||||||
| 258,000 | T-Mobile USA, Inc., 3.750%, 04/15/2027 | 248,031 | 0.1 | |||||||||
| 206,000 | T-Mobile USA, Inc., 4.800%, 07/15/2028 | 203,261 | 0.1 | |||||||||
See Accompanying Notes to Financial Statements
20
| VY® BlackRock Inflation | PORTFOLIO OF INVESTMENTS |
| Protected Bond Portfolio | as of June 30, 2024 (Unaudited) (continued) |
| Principal Amount† | Value | Percentage of Net Assets | ||||||||||
| CORPORATE BONDS/NOTES: (continued) | ||||||||||||
| Communications: (continued) | ||||||||||||
| 279,000 | T-Mobile USA, Inc., 5.050%, 07/15/2033 | $ | 273,061 | 0.1 | ||||||||
| 75,000 | Verizon Communications, Inc., 1.750%, 01/20/2031 | 60,717 | 0.0 | |||||||||
| 145,000 | Verizon Communications, Inc., 2.100%, 03/22/2028 | 130,434 | 0.1 | |||||||||
| 29,000 | Verizon Communications, Inc., 4.016%, 12/03/2029 | 27,417 | 0.0 | |||||||||
| 98,000 | Verizon Communications, Inc., 4.272%, 01/15/2036 | 88,835 | 0.1 | |||||||||
| 17,000 | Verizon Communications, Inc., 4.329%, 09/21/2028 | 16,533 | 0.0 | |||||||||
| 421,000 | Verizon Communications, Inc., 5.050%, 05/09/2033 | 415,212 | 0.2 | |||||||||
| 3,604,662 | 1.7 | |||||||||||
| Consumer, Cyclical: 0.5% | ||||||||||||
| 200,000 | Ford Motor Credit Co. LLC, 6.125%, 03/08/2034 | 197,961 | 0.1 | |||||||||
| 60,000 | General Motors Financial Co., Inc., 5.600%, 06/18/2031 | 59,572 | 0.0 | |||||||||
| 24,000 | General Motors Financial Co., Inc., 5.750%, 02/08/2031 | 24,072 | 0.0 | |||||||||
| 137,000 | General Motors Financial Co., Inc., 5.950%, 04/04/2034 | 137,171 | 0.1 | |||||||||
| 26,000 | Las Vegas Sands Corp., 5.900%, 06/01/2027 | 26,147 | 0.0 | |||||||||
| 525,000 | Lowe’s Cos., Inc., 1.700%, 09/15/2028 | 458,918 | 0.2 | |||||||||
| 91,000 | Lowe’s Cos., Inc., 1.700%, 10/15/2030 | 74,328 | 0.1 | |||||||||
| 39,000 | Marriott International, Inc., 5.300%, 05/15/2034 | 38,306 | 0.0 | |||||||||
| 1,016,475 | 0.5 | |||||||||||
| Consumer, Non-cyclical: 3.5% | ||||||||||||
| 398,000 | AbbVie, Inc., 4.500%, 05/14/2035 | 375,585 | 0.2 | |||||||||
| 109,000 | AbbVie, Inc., 5.050%, 03/15/2034 | 108,722 | 0.1 | |||||||||
| 209,000 | Altria Group, Inc., 3.700%, 02/04/2051 | 141,382 | 0.1 | |||||||||
| 110,000 | Altria Group, Inc., 4.800%, 02/14/2029 | 108,238 | 0.1 | |||||||||
| 160,000 | Altria Group, Inc., 6.200%, 11/01/2028 | 166,011 | 0.1 | |||||||||
| 140,000 | Altria Group, Inc., 6.875%, 11/01/2033 | 151,411 | 0.1 | |||||||||
| Principal Amount† | Value | Percentage of Net Assets | ||||||||||
| CORPORATE BONDS/NOTES: (continued) | ||||||||||||
| Consumer, Non-cyclical: (continued) | ||||||||||||
| 97,000 | Amgen, Inc., 2.770%, 09/01/2053 | $ | 58,127 | 0.0 | ||||||||
| 100,000 | Amgen, Inc., 4.200%, 02/22/2052 | 79,134 | 0.0 | |||||||||
| 453,000 | Amgen, Inc., 5.150%, 03/02/2028 | 453,016 | 0.2 | |||||||||
| 154,000 | Amgen, Inc., 5.750%, 03/02/2063 | 150,947 | 0.1 | |||||||||
| 101,000 | BAT Capital Corp., 2.259%, 03/25/2028 | 90,522 | 0.0 | |||||||||
| 206,000 | BAT Capital Corp., 4.540%, 08/15/2047 | 158,774 | 0.1 | |||||||||
| 33,000 | BAT Capital Corp., 4.758%, 09/06/2049 | 26,013 | 0.0 | |||||||||
| 14,000 | BAT Capital Corp., 5.650%, 03/16/2052 | 12,517 | 0.0 | |||||||||
| 297,000 | BAT Capital Corp., 7.081%, 08/02/2053 | 316,047 | 0.2 | |||||||||
| 463,000 | BAT International Finance PLC, 4.448%, 03/16/2028 | 448,387 | 0.2 | |||||||||
| 120,000 | Becton Dickinson & Co., 4.693%, 02/13/2028 | 118,325 | 0.1 | |||||||||
| 150,000 | BHSH System Obligated Group 19A, 3.487%, 07/15/2049 | 112,750 | 0.1 | |||||||||
| 80,000 | Bristol-Myers Squibb Co., 5.100%, 02/22/2031 | 80,329 | 0.0 | |||||||||
| 225,000 | CommonSpirit Health, 2.782%, 10/01/2030 | 195,078 | 0.1 | |||||||||
| 150,000 | CommonSpirit Health, 3.817%, 10/01/2049 | 114,217 | 0.1 | |||||||||
| 212,000 | CVS Health Corp., 5.000%, 01/30/2029 | 209,895 | 0.1 | |||||||||
| 83,000 | CVS Health Corp., 5.125%, 02/21/2030 | 82,125 | 0.0 | |||||||||
| 64,000 | CVS Health Corp., 5.400%, 06/01/2029 | 64,099 | 0.0 | |||||||||
| 1,000 | Elevance Health, Inc., 5.650%, 06/15/2054 | 990 | 0.0 | |||||||||
| 71,000 | Elevance Health, Inc., 6.100%, 10/15/2052 | 74,483 | 0.0 | |||||||||
| 300,000 | Franciscan Missionaries of Our Lady Health System, Inc. B, 3.914%, 07/01/2049 | 230,712 | 0.1 | |||||||||
| 576,000 (2) | Gartner, Inc., 4.500%, 07/01/2028 | 555,642 | 0.3 | |||||||||
| 387,000 | Gilead Sciences, Inc., 1.650%, 10/01/2030 | 318,998 | 0.2 | |||||||||
| 23,000 | Global Payments, Inc., 3.200%, 08/15/2029 | 20,673 | 0.0 | |||||||||
| 59,000 | Global Payments, Inc., 4.950%, 08/15/2027 | 58,435 | 0.0 | |||||||||
| 104,000 | HCA, Inc., 3.500%, 09/01/2030 | 93,840 | 0.0 | |||||||||
| 675,000 | HCA, Inc., 5.200%, 06/01/2028 | 672,502 | 0.3 | |||||||||
See Accompanying Notes to Financial Statements
21
| VY® BlackRock Inflation | PORTFOLIO OF INVESTMENTS |
| Protected Bond Portfolio | as of June 30, 2024 (Unaudited) (continued) |
| Principal Amount† | Value | Percentage of Net Assets | ||||||||||
| CORPORATE BONDS/NOTES: (continued) | ||||||||||||
| Consumer, Non-cyclical: (continued) | ||||||||||||
| 112,000 | HCA, Inc., 5.450%, 04/01/2031 | $ | 111,951 | 0.1 | ||||||||
| 199,000 | Humana, Inc., 1.350%, 02/03/2027 | 180,360 | 0.1 | |||||||||
| 19,000 | Humana, Inc., 3.950%, 03/15/2027 | 18,375 | 0.0 | |||||||||
| 150,000 | Kaiser Foundation Hospitals 2021, 3.002%, 06/01/2051 | 100,073 | 0.1 | |||||||||
| 70,000 | Moody’s Corp., 4.250%, 02/01/2029 | 68,123 | 0.0 | |||||||||
| 175,000 | Mount Nittany Medical Center Obligated Group 2022, 3.799%, 11/15/2052 | 135,658 | 0.1 | |||||||||
| 26,000 | Pfizer Investment Enterprises Pte Ltd., 4.750%, 05/19/2033 | 25,344 | 0.0 | |||||||||
| 131,000 | Pfizer, Inc., 2.700%, 05/28/2050 | 84,226 | 0.0 | |||||||||
| 48,000 | Philip Morris International, Inc., 4.875%, 02/13/2029 | 47,483 | 0.0 | |||||||||
| 12,000 | RELX Capital, Inc., 4.000%, 03/18/2029 | 11,540 | 0.0 | |||||||||
| 206,000 | Shire Acquisitions Investments Ireland DAC, 3.200%, 09/23/2026 | 197,598 | 0.1 | |||||||||
| 157,000 (2) | Solventum Corp., 5.450%, 02/25/2027 | 156,880 | 0.1 | |||||||||
| 64,000 (2) | Solventum Corp., 6.000%, 05/15/2064 | 60,792 | 0.0 | |||||||||
| 63,000 | Thermo Fisher Scientific, Inc., 5.086%, 08/10/2033 | 62,862 | 0.0 | |||||||||
| 65,000 | UnitedHealth Group, Inc., 5.050%, 04/15/2053 | 60,250 | 0.0 | |||||||||
| 84,000 | UnitedHealth Group, Inc., 5.500%, 04/15/2064 | 81,398 | 0.0 | |||||||||
| 7,250,839 | 3.5 | |||||||||||
| Energy: 5.7% | ||||||||||||
| 274,000 | Apache Corp., 4.250%, 01/15/2030 | 255,840 | 0.1 | |||||||||
| 19,000 | BP Capital Markets America, Inc., 2.772%, 11/10/2050 | 11,687 | 0.0 | |||||||||
| 37,000 | BP Capital Markets America, Inc., 3.379%, 02/08/2061 | 24,314 | 0.0 | |||||||||
| 102,000 | BP Capital Markets America, Inc., 4.989%, 04/10/2034 | 99,825 | 0.1 | |||||||||
| 85,000 (2) | Cameron LNG LLC, 3.302%, 01/15/2035 | 70,024 | 0.0 | |||||||||
| 288,000 (2) | Cameron LNG LLC, 3.402%, 01/15/2038 | 233,028 | 0.1 | |||||||||
| Principal Amount† | Value | Percentage of Net Assets | ||||||||||
| CORPORATE BONDS/NOTES: (continued) | ||||||||||||
| Energy: (continued) | ||||||||||||
| 46,000 | Cheniere Corpus Christi Holdings LLC, 3.700%, 11/15/2029 | $ | 42,523 | 0.0 | ||||||||
| 893,000 | Cheniere Corpus Christi Holdings LLC, 5.125%, 06/30/2027 | 891,819 | 0.4 | |||||||||
| 163,000 | Cheniere Energy Partners L.P., 4.000%, 03/01/2031 | 148,334 | 0.1 | |||||||||
| 108,000 | Cheniere Energy Partners L.P., 4.500%, 10/01/2029 | 102,953 | 0.1 | |||||||||
| 218,000 | Cheniere Energy Partners L.P., 5.950%, 06/30/2033 | 221,176 | 0.1 | |||||||||
| 302,000 (2) | Cheniere Energy, Inc., 5.650%, 04/15/2034 | 302,427 | 0.2 | |||||||||
| 27,000 | Chevron Corp., 3.078%, 05/11/2050 | 18,444 | 0.0 | |||||||||
| 64,000 | Devon Energy Corp., 4.500%, 01/15/2030 | 61,614 | 0.0 | |||||||||
| 24,000 | Devon Energy Corp., 5.250%, 10/15/2027 | 23,940 | 0.0 | |||||||||
| 1,143,000 | Diamondback Energy, Inc., 3.125%, 03/24/2031 | 1,005,148 | 0.5 | |||||||||
| 615,000 | Diamondback Energy, Inc., 3.250%, 12/01/2026 | 587,878 | 0.3 | |||||||||
| 1,397,000 | Diamondback Energy, Inc., 3.500%, 12/01/2029 | 1,288,887 | 0.6 | |||||||||
| 142,000 | Diamondback Energy, Inc., 5.150%, 01/30/2030 | 141,438 | 0.1 | |||||||||
| 152,000 | Diamondback Energy, Inc., 5.900%, 04/18/2064 | 146,834 | 0.1 | |||||||||
| 37,000 | Energy Transfer L.P., 4.950%, 05/15/2028 | 36,452 | 0.0 | |||||||||
| 101,000 | Energy Transfer L.P., 5.000%, 05/15/2050 | 85,805 | 0.0 | |||||||||
| 265,000 | Energy Transfer L.P., 5.500%, 06/01/2027 | 265,832 | 0.1 | |||||||||
| 162,000 | Energy Transfer L.P., 6.050%, 09/01/2054 | 159,850 | 0.1 | |||||||||
| 106,000 | Energy Transfer L.P., 6.250%, 04/15/2049 | 105,541 | 0.1 | |||||||||
| 96,000 | Energy Transfer L.P., 6.400%, 12/01/2030 | 101,006 | 0.1 | |||||||||
| 30,000 | Energy Transfer L.P., 6.550%, 12/01/2033 | 31,812 | 0.0 | |||||||||
| 105,000 | EnLink Midstream Partners L.P., 5.450%, 06/01/2047 | 91,175 | 0.1 | |||||||||
| 194,000 (2) | EQT Corp., 3.625%, 05/15/2031 | 171,267 | 0.1 | |||||||||
| 935,000 | EQT Corp., 3.900%, 10/01/2027 | 894,366 | 0.4 | |||||||||
See Accompanying Notes to Financial Statements
22
| VY® BlackRock Inflation | PORTFOLIO OF INVESTMENTS |
| Protected Bond Portfolio | as of June 30, 2024 (Unaudited) (continued) |
| Principal Amount† | Value | Percentage of Net Assets | ||||||||||
| CORPORATE BONDS/NOTES: (continued) | ||||||||||||
| Energy: (continued) | ||||||||||||
| 235,000 | EQT Corp., 5.700%, 04/01/2028 | $ | 237,463 | 0.1 | ||||||||
| 8,000 | EQT Corp., 7.000%, 02/01/2030 | 8,495 | 0.0 | |||||||||
| 45,000 | Exxon Mobil Corp., 3.452%, 04/15/2051 | 32,501 | 0.0 | |||||||||
| 43,000 | Kinder Morgan, Inc., 3.250%, 08/01/2050 | 27,456 | 0.0 | |||||||||
| 201,000 | Kinder Morgan, Inc., 5.000%, 02/01/2029 | 198,813 | 0.1 | |||||||||
| 19,000 | Kinder Morgan, Inc., 5.300%, 12/01/2034 | 18,424 | 0.0 | |||||||||
| 106,000 (2) | NGPL PipeCo LLC, 3.250%, 07/15/2031 | 90,643 | 0.1 | |||||||||
| 497,000 (2) | NGPL PipeCo LLC, 4.875%, 08/15/2027 | 486,385 | 0.2 | |||||||||
| 478,000 | Northwest Pipeline LLC, 4.000%, 04/01/2027 | 463,329 | 0.2 | |||||||||
| 52,000 | Ovintiv, Inc., 6.250%, 07/15/2033 | 53,636 | 0.0 | |||||||||
| 52,000 | Ovintiv, Inc., 7.100%, 07/15/2053 | 57,098 | 0.0 | |||||||||
| 200,000 | Project Grange, 6.500%, 03/20/2045 | 200,000 | 0.1 | |||||||||
| 908,000 | Sabine Pass Liquefaction LLC, 4.200%, 03/15/2028 | 876,326 | 0.4 | |||||||||
| 390,000 | Sabine Pass Liquefaction LLC, 5.000%, 03/15/2027 | 386,833 | 0.2 | |||||||||
| 24,000 | Targa Resources Corp., 4.950%, 04/15/2052 | 20,467 | 0.0 | |||||||||
| 209,000 | Targa Resources Corp., 5.200%, 07/01/2027 | 208,666 | 0.1 | |||||||||
| 30,000 | Targa Resources Corp., 6.500%, 02/15/2053 | 31,545 | 0.0 | |||||||||
| 29,000 | Targa Resources Partners L.P. / Targa Resources Partners Finance Corp., 4.000%, 01/15/2032 | 26,145 | 0.0 | |||||||||
| 153,000 | Targa Resources Partners L.P. / Targa Resources Partners Finance Corp., 4.875%, 02/01/2031 | 146,096 | 0.1 | |||||||||
| 222,000 | Targa Resources Partners L.P. / Targa Resources Partners Finance Corp., 5.000%, 01/15/2028 | 217,592 | 0.1 | |||||||||
| 34,000 (2) | Texas Eastern Transmission L.P., 3.500%, 01/15/2028 | 32,100 | 0.0 | |||||||||
| 103,000 | Transcontinental Gas Pipe Line Co. LLC, 3.950%, 05/15/2050 | 78,096 | 0.0 | |||||||||
| 277,000 | Transcontinental Gas Pipe Line Co. LLC, 4.000%, 03/15/2028 | 265,632 | 0.1 | |||||||||
| Principal Amount† | Value | Percentage of Net Assets | ||||||||||
| CORPORATE BONDS/NOTES: (continued) | ||||||||||||
| Energy: (continued) | ||||||||||||
| 230,000 | Transcontinental Gas Pipe Line Co. LLC, 7.850%, 02/01/2026 | $ | 236,742 | 0.1 | ||||||||
| 12,021,722 | 5.7 | |||||||||||
| Financial: 7.2% | ||||||||||||
| 17,000 | American International Group, Inc., 4.375%, 06/30/2050 | 14,094 | 0.0 | |||||||||
| 92,000 | American Tower Corp., 2.300%, 09/15/2031 | 75,098 | 0.0 | |||||||||
| 268,000 | American Tower Corp., 3.550%, 07/15/2027 | 254,385 | 0.1 | |||||||||
| 219,000 | American Tower Corp., 3.800%, 08/15/2029 | 203,636 | 0.1 | |||||||||
| 23,000 | American Tower Corp., 4.050%, 03/15/2032 | 21,038 | 0.0 | |||||||||
| 110,000 | American Tower Corp., 5.200%, 02/15/2029 | 109,660 | 0.1 | |||||||||
| 18,000 | American Tower Corp., 5.800%, 11/15/2028 | 18,356 | 0.0 | |||||||||
| 501,000 (3) | Bank of America Corp., 5.468%, 01/23/2035 | 500,678 | 0.2 | |||||||||
| 570,000 (3) | Bank of America Corp., 5.819%, 09/15/2029 | 582,040 | 0.3 | |||||||||
| 59,000 (3) | Bank of America Corp., MTN, 2.676%, 06/19/2041 | 41,247 | 0.0 | |||||||||
| 109,000 (3) | Bank of America Corp., MTN, 2.831%, 10/24/2051 | 69,000 | 0.0 | |||||||||
| 378,000 (3) | Bank of America Corp., MTN, 2.972%, 02/04/2033 | 320,014 | 0.2 | |||||||||
| 36,000 (3) | Citigroup, Inc., 2.520%, 11/03/2032 | 29,591 | 0.0 | |||||||||
| 104,000 (3) | Citigroup, Inc., 2.666%, 01/29/2031 | 90,600 | 0.0 | |||||||||
| 120,000 (3) | Citigroup, Inc., 3.980%, 03/20/2030 | 113,308 | 0.1 | |||||||||
| 56,000 (3) | Citigroup, Inc., 4.910%, 05/24/2033 | 53,794 | 0.0 | |||||||||
| 145,000 (3) | Citigroup, Inc., 5.449%, 06/11/2035 | 143,919 | 0.1 | |||||||||
| 181,000 (3) | Citigroup, Inc. VAR, 3.070%, 02/24/2028 | 170,850 | 0.1 | |||||||||
| 500,000 | Credit Suisse AG/ New York NY, 5.000%, 07/09/2027 | 496,038 | 0.2 | |||||||||
| 29,000 | Crown Castle, Inc., 2.100%, 04/01/2031 | 23,495 | 0.0 | |||||||||
| 183,000 | Crown Castle, Inc., 2.250%, 01/15/2031 | 150,571 | 0.1 | |||||||||
| 37,000 | Crown Castle, Inc., 2.500%, 07/15/2031 | 30,585 | 0.0 | |||||||||
| 80,000 | Crown Castle, Inc., 2.900%, 03/15/2027 | 75,114 | 0.0 | |||||||||
| 91,000 | Crown Castle, Inc., 3.650%, 09/01/2027 | 86,523 | 0.0 | |||||||||
See Accompanying Notes to Financial Statements
23
| VY® BlackRock Inflation | PORTFOLIO OF INVESTMENTS |
| Protected Bond Portfolio | as of June 30, 2024 (Unaudited) (continued) |
| Principal Amount† | Value | Percentage of Net Assets | ||||||||||
| CORPORATE BONDS/NOTES: (continued) | ||||||||||||
| Financial: (continued) | ||||||||||||
| 221,000 | Equinix, Inc., 2.000%, 05/15/2028 | $ | 195,818 | 0.1 | ||||||||
| 127,000 | Equinix, Inc., 2.150%, 07/15/2030 | 106,531 | 0.1 | |||||||||
| 36,000 | Equinix, Inc., 2.500%, 05/15/2031 | 30,174 | 0.0 | |||||||||
| 218,000 | Equinix, Inc., 3.200%, 11/18/2029 | 196,498 | 0.1 | |||||||||
| 132,000 | Equinix, Inc., 3.900%, 04/15/2032 | 120,077 | 0.1 | |||||||||
| 394,000 | GLP Capital L.P. / GLP Financing II, Inc., 3.250%, 01/15/2032 | 331,497 | 0.2 | |||||||||
| 588,000 | GLP Capital L.P. / GLP Financing II, Inc., 5.300%, 01/15/2029 | 579,776 | 0.3 | |||||||||
| 338,000 (3) | Goldman Sachs Group, Inc., 1.948%, 10/21/2027 | 312,189 | 0.2 | |||||||||
| 390,000 (3) | Goldman Sachs Group, Inc., 2.650%, 10/21/2032 | 324,380 | 0.2 | |||||||||
| 477,000 (3) | Goldman Sachs Group, Inc., 3.102%, 02/24/2033 | 407,537 | 0.2 | |||||||||
| 750,000 (3) | Goldman Sachs Group, Inc., 5.727%, 04/25/2030 | 763,486 | 0.4 | |||||||||
| 415,000 (3) | Goldman Sachs Group, Inc., 5.851%, 04/25/2035 | 425,263 | 0.2 | |||||||||
| 91,000 (3) | Goldman Sachs Group, Inc., 6.484%, 10/24/2029 | 95,026 | 0.1 | |||||||||
| 335,000 (3) | JPMorgan Chase & Co., 1.953%, 02/04/2032 | 272,605 | 0.1 | |||||||||
| 51,000 (3) | JPMorgan Chase & Co., 2.522%, 04/22/2031 | 44,097 | 0.0 | |||||||||
| 230,000 (3) | JPMorgan Chase & Co., 5.012%, 01/23/2030 | 228,282 | 0.1 | |||||||||
| 105,000 (3) | JPMorgan Chase & Co., 5.336%, 01/23/2035 | 104,417 | 0.1 | |||||||||
| 164,000 (3) | JPMorgan Chase & Co., 5.571%, 04/22/2028 | 165,363 | 0.1 | |||||||||
| 198,000 (3) | JPMorgan Chase & Co., 5.766%, 04/22/2035 | 203,225 | 0.1 | |||||||||
| 294,000 (3) | JPMorgan Chase & Co., 6.087%, 10/23/2029 | 303,848 | 0.2 | |||||||||
| 93,000 | Marsh & McLennan Cos., Inc., 2.250%, 11/15/2030 | 79,274 | 0.0 | |||||||||
| 548,000 (3) | Morgan Stanley, 2.943%, 01/21/2033 | 465,958 | 0.2 | |||||||||
| 70,000 (3) | Morgan Stanley, 5.173%, 01/16/2030 | 69,840 | 0.0 | |||||||||
| 266,000 (3) | Morgan Stanley, 5.449%, 07/20/2029 | 267,689 | 0.1 | |||||||||
| 160,000 (3) | Morgan Stanley, 5.656%, 04/18/2030 | 162,748 | 0.1 | |||||||||
| Principal Amount† | Value | Percentage of Net Assets | ||||||||||
| CORPORATE BONDS/NOTES: (continued) | ||||||||||||
| Financial: (continued) | ||||||||||||
| 655,000 (3) | Morgan Stanley, 5.831%, 04/19/2035 | $ | 671,674 | 0.3 | ||||||||
| 622,000 (3) | Morgan Stanley, 6.407%, 11/01/2029 | 649,135 | 0.3 | |||||||||
| 60,000 (3) | Morgan Stanley, GMTN, 2.239%, 07/21/2032 | 49,035 | 0.0 | |||||||||
| 26,000 (3) | Morgan Stanley, MTN, 1.794%, 02/13/2032 | 20,876 | 0.0 | |||||||||
| 52,000 (3) | Morgan Stanley, MTN, 2.511%, 10/20/2032 | 42,998 | 0.0 | |||||||||
| 245,000 (3) | Morgan Stanley, MTN, 3.622%, 04/01/2031 | 224,900 | 0.1 | |||||||||
| 693,000 (3) | Morgan Stanley, MTN, 5.164%, 04/20/2029 | 690,907 | 0.3 | |||||||||
| 83,000 | National Retail Properties, Inc., 3.000%, 04/15/2052 | 51,765 | 0.0 | |||||||||
| 200,000 (2)(3) | UBS Group AG, 5.699%, 02/08/2035 | 199,877 | 0.1 | |||||||||
| 689,000 | VICI Properties L.P., 4.750%, 02/15/2028 | 673,557 | 0.3 | |||||||||
| 206,000 (2) | VICI Properties L.P. / VICI Note Co., Inc., 3.750%, 02/15/2027 | 195,832 | 0.1 | |||||||||
| 194,000 (2) | VICI Properties L.P. / VICI Note Co., Inc., 3.875%, 02/15/2029 | 179,528 | 0.1 | |||||||||
| 180,000 (2) | VICI Properties L.P. / VICI Note Co., Inc., 4.125%, 08/15/2030 | 163,846 | 0.1 | |||||||||
| 190,000 (2) | VICI Properties L.P. / VICI Note Co., Inc., 4.250%, 12/01/2026 | 183,391 | 0.1 | |||||||||
| 442,000 (2) | VICI Properties L.P. / VICI Note Co., Inc., 4.500%, 09/01/2026 | 430,754 | 0.2 | |||||||||
| 28,000 (2) | VICI Properties L.P. / VICI Note Co., Inc., 4.625%, 12/01/2029 | 26,520 | 0.0 | |||||||||
| 160,000 (2) | VICI Properties L.P. / VICI Note Co., Inc., 5.750%, 02/01/2027 | 160,124 | 0.1 | |||||||||
| 247,000 (3) | Wells Fargo & Co., 5.499%, 01/23/2035 | 246,234 | 0.1 | |||||||||
| 24,000 (3) | Wells Fargo & Co., 6.491%, 10/23/2034 | 25,595 | 0.0 | |||||||||
| 55,000 (3) | Wells Fargo & Co., MTN, 4.611%, 04/25/2053 | 47,040 | 0.0 | |||||||||
| 197,000 (3) | Wells Fargo & Co., MTN, 5.574%, 07/25/2029 | 198,823 | 0.1 | |||||||||
| 15,061,643 | 7.2 | |||||||||||
| Industrial: 1.6% | ||||||||||||
| 652,000 (2) | BAE Systems Holdings, Inc., 3.850%, 12/15/2025 | 636,114 | 0.3 | |||||||||
| 13,000 | Berry Global, Inc., 5.500%, 04/15/2028 | 12,979 | 0.0 | |||||||||
See Accompanying Notes to Financial Statements
24
| VY® BlackRock Inflation | PORTFOLIO OF INVESTMENTS |
| Protected Bond Portfolio | as of June 30, 2024 (Unaudited) (continued) |
| Principal Amount† | Value | Percentage of Net Assets | ||||||||||
| CORPORATE BONDS/NOTES: (continued) | ||||||||||||
| Industrial: (continued) | ||||||||||||
| 9,000 | Boeing Co., 5.930%, 05/01/2060 | $ | 8,052 | 0.0 | ||||||||
| 42,000 (2) | Boeing Co., 6.858%, 05/01/2054 | 43,134 | 0.0 | |||||||||
| 27,000 (2) | Boeing Co., 7.008%, 05/01/2064 | 27,665 | 0.0 | |||||||||
| 176,000 | Burlington Northern Santa Fe LLC, 3.300%, 09/15/2051 | 122,542 | 0.1 | |||||||||
| 25,000 | Burlington Northern Santa Fe LLC, 5.500%, 03/15/2055 | 25,064 | 0.0 | |||||||||
| 20,000 | CNH Industrial Capital LLC, 5.100%, 04/20/2029 | 19,926 | 0.0 | |||||||||
| 41,000 | Huntington Ingalls Industries, Inc., 3.483%, 12/01/2027 | 38,645 | 0.0 | |||||||||
| 244,000 | L3Harris Technologies, Inc., 3.850%, 12/15/2026 | 235,871 | 0.1 | |||||||||
| 309,000 | L3Harris Technologies, Inc., 5.050%, 06/01/2029 | 306,934 | 0.2 | |||||||||
| 180,000 | L3Harris Technologies, Inc., 5.250%, 06/01/2031 | 179,480 | 0.1 | |||||||||
| 302,000 | L3Harris Technologies, Inc., 5.400%, 01/15/2027 | 303,309 | 0.2 | |||||||||
| 26,000 | L3Harris Technologies, Inc., 5.600%, 07/31/2053 | 25,809 | 0.0 | |||||||||
| 70,000 | Lockheed Martin Corp., 4.450%, 05/15/2028 | 68,966 | 0.0 | |||||||||
| 36,000 | Norfolk Southern Corp., 3.050%, 05/15/2050 | 23,431 | 0.0 | |||||||||
| 156,000 | Norfolk Southern Corp., 3.155%, 05/15/2055 | 99,046 | 0.1 | |||||||||
| 134,000 | Northrop Grumman Corp., 4.700%, 03/15/2033 | 129,347 | 0.1 | |||||||||
| 44,000 | Northrop Grumman Corp., 5.200%, 06/01/2054 | 41,233 | 0.0 | |||||||||
| 21,000 | Raytheon Technologies Corp., 2.820%, 09/01/2051 | 12,802 | 0.0 | |||||||||
| 37,000 | Raytheon Technologies Corp., 3.125%, 07/01/2050 | 24,324 | 0.0 | |||||||||
| 32,000 | RTX Corp., 5.400%, 05/01/2035 | 32,156 | 0.0 | |||||||||
| 212,000 | RTX Corp., 5.750%, 01/15/2029 | 217,738 | 0.1 | |||||||||
| 424,000 | RTX Corp., 6.100%, 03/15/2034 | 446,532 | 0.2 | |||||||||
| 34,000 | Textron, Inc., 3.900%, 09/17/2029 | 31,911 | 0.0 | |||||||||
| Principal Amount† | Value | Percentage of Net Assets | ||||||||||
| CORPORATE BONDS/NOTES: (continued) | ||||||||||||
| Industrial: (continued) | ||||||||||||
| 28,000 | Union Pacific Corp., 2.950%, 03/10/2052 | $ | 18,038 | 0.0 | ||||||||
| 168,000 | Union Pacific Corp., 4.500%, 01/20/2033 | 161,915 | 0.1 | |||||||||
| 3,292,963 | 1.6 | |||||||||||
| Technology: 0.9% | ||||||||||||
| 164,000 | Broadcom Corp. / Broadcom Cayman Finance Ltd., 3.500%, 01/15/2028 | 155,233 | 0.1 | |||||||||
| 13,000 (2) | Broadcom, Inc., 2.600%, 02/15/2033 | 10,540 | 0.0 | |||||||||
| 173,000 (2) | Broadcom, Inc., 3.137%, 11/15/2035 | 138,600 | 0.1 | |||||||||
| 28,000 (2) | Broadcom, Inc., 3.187%, 11/15/2036 | 22,169 | 0.0 | |||||||||
| 62,000 | Broadcom, Inc., 4.150%, 11/15/2030 | 58,582 | 0.1 | |||||||||
| 38,000 | Dell International LLC / EMC Corp., 3.450%, 12/15/2051 | 25,772 | 0.0 | |||||||||
| 200,000 (2) | Foundry JV Holdco LLC, 6.150%, 01/25/2032 | 204,054 | 0.1 | |||||||||
| 50,000 | Hewlett Packard Enterprise Co., 5.250%, 07/01/2028 | 50,310 | 0.0 | |||||||||
| 32,000 | Intel Corp., 3.200%, 08/12/2061 | 19,754 | 0.0 | |||||||||
| 163,000 | KLA Corp., 4.100%, 03/15/2029 | 158,373 | 0.1 | |||||||||
| 43,000 | KLA Corp., 5.250%, 07/15/2062 | 41,098 | 0.0 | |||||||||
| 269,000 (2) | MSCI, Inc., 3.625%, 09/01/2030 | 241,723 | 0.1 | |||||||||
| 20,000 (2) | MSCI, Inc., 3.625%, 11/01/2031 | 17,568 | 0.0 | |||||||||
| 23,000 (2) | MSCI, Inc., 3.875%, 02/15/2031 | 20,735 | 0.0 | |||||||||
| 55,000 | NXP BV / NXP Funding LLC / NXP USA, Inc., 2.500%, 05/11/2031 | 46,143 | 0.0 | |||||||||
| 138,000 | Oracle Corp., 3.850%, 07/15/2036 | 116,414 | 0.1 | |||||||||
| 36,000 | Oracle Corp., 3.850%, 04/01/2060 | 24,772 | 0.0 | |||||||||
| 27,000 | Oracle Corp., 4.100%, 03/25/2061 | 19,366 | 0.0 | |||||||||
| 304,000 | Oracle Corp., 4.375%, 05/15/2055 | 237,556 | 0.1 | |||||||||
| 13,000 | Texas Instruments, Inc., 4.100%, 08/16/2052 | 10,664 | 0.0 | |||||||||
| 28,000 | Texas Instruments, Inc., 5.050%, 05/18/2063 | 26,042 | 0.0 | |||||||||
| 200,000 | TSMC Arizona Corp., 4.250%, 04/22/2032 | 193,625 | 0.1 | |||||||||
| 1,839,093 | 0.9 | |||||||||||
See Accompanying Notes to Financial Statements
25
| VY® BlackRock Inflation | PORTFOLIO OF INVESTMENTS |
| Protected Bond Portfolio | as of June 30, 2024 (Unaudited) (continued) |
| Principal Amount† | Value | Percentage of Net Assets | ||||||||||
| CORPORATE BONDS/NOTES: (continued) | ||||||||||||
| Utilities: 3.3% | ||||||||||||
| 17,000 | AEP Texas, Inc., 3.450%, 05/15/2051 | $ | 11,198 | 0.0 | ||||||||
| 82,000 | AEP Texas, Inc., 5.250%, 05/15/2052 | 73,345 | 0.0 | |||||||||
| 274,000 | AEP Texas, Inc., 5.400%, 06/01/2033 | 266,965 | 0.1 | |||||||||
| 157,000 | AEP Transmission Co. LLC, 5.150%, 04/01/2034 | 153,559 | 0.1 | |||||||||
| 318,000 | AEP Transmission Co. LLC N, 2.750%, 08/15/2051 | 190,766 | 0.1 | |||||||||
| 48,000 | Alabama Power Co., 3.000%, 03/15/2052 | 31,134 | 0.0 | |||||||||
| 146,000 | Alabama Power Co., 3.125%, 07/15/2051 | 96,788 | 0.1 | |||||||||
| 136,000 | Baltimore Gas and Electric Co., 4.550%, 06/01/2052 | 113,511 | 0.1 | |||||||||
| 70,000 | CenterPoint Energy Houston Electric LLC AH, 3.600%, 03/01/2052 | 50,761 | 0.0 | |||||||||
| 13,000 | CenterPoint Energy Resources Corp., 1.750%, 10/01/2030 | 10,611 | 0.0 | |||||||||
| 10,000 | CenterPoint Energy Resources Corp., 5.250%, 03/01/2028 | 10,041 | 0.0 | |||||||||
| 30,000 | CenterPoint Energy Resources Corp., 5.400%, 07/01/2034 | 29,717 | 0.0 | |||||||||
| 34,000 | Consolidated Edison Co. of New York, Inc., 5.700%, 05/15/2054 | 33,944 | 0.0 | |||||||||
| 172,000 | Consumers Energy Co., 2.650%, 08/15/2052 | 105,971 | 0.1 | |||||||||
| 20,000 | Dominion Energy South Carolina, Inc., 6.250%, 10/15/2053 | 21,570 | 0.0 | |||||||||
| 64,000 | Duke Energy Carolinas LLC, 2.450%, 02/01/2030 | 56,079 | 0.0 | |||||||||
| 45,000 | Duke Energy Carolinas LLC, 3.200%, 08/15/2049 | 30,218 | 0.0 | |||||||||
| 71,000 | Duke Energy Carolinas LLC, 3.450%, 04/15/2051 | 49,740 | 0.0 | |||||||||
| 202,000 | Duke Energy Carolinas LLC, 4.950%, 01/15/2033 | 198,662 | 0.1 | |||||||||
| 90,000 | Duke Energy Carolinas LLC, 5.350%, 01/15/2053 | 85,576 | 0.0 | |||||||||
| 173,000 | Duke Energy Florida LLC, 1.750%, 06/15/2030 | 143,632 | 0.1 | |||||||||
| Principal Amount† | Value | Percentage of Net Assets | ||||||||||
| CORPORATE BONDS/NOTES: (continued) | ||||||||||||
| Utilities: (continued) | ||||||||||||
| 316,000 | Duke Energy Florida LLC, 2.500%, 12/01/2029 | $ | 278,910 | 0.1 | ||||||||
| 14,000 | Duke Energy Florida LLC, 3.400%, 10/01/2046 | 9,870 | 0.0 | |||||||||
| 188,000 | Duke Energy Florida LLC, 3.800%, 07/15/2028 | 179,688 | 0.1 | |||||||||
| 60,000 | Duke Energy Florida LLC, 5.950%, 11/15/2052 | 61,171 | 0.0 | |||||||||
| 74,000 | Duke Energy Ohio, Inc., 3.650%, 02/01/2029 | 69,887 | 0.0 | |||||||||
| 191,000 | Duke Energy Progress LLC, 2.900%, 08/15/2051 | 118,573 | 0.1 | |||||||||
| 105,000 | Duke Energy Progress LLC, 5.100%, 03/15/2034 | 104,215 | 0.1 | |||||||||
| 90,000 | Duke Energy Progress LLC, 5.250%, 03/15/2033 | 89,833 | 0.1 | |||||||||
| 19,000 | Edison International, 5.250%, 11/15/2028 | 18,842 | 0.0 | |||||||||
| 170,000 | Edison International, 5.750%, 06/15/2027 | 171,564 | 0.1 | |||||||||
| 222,000 | Edison International, 6.950%, 11/15/2029 | 236,142 | 0.1 | |||||||||
| 154,000 | Eversource Energy, 5.450%, 03/01/2028 | 154,520 | 0.1 | |||||||||
| 12,000 | Exelon Corp., 5.150%, 03/15/2028 | 11,977 | 0.0 | |||||||||
| 378,000 | FirstEnergy Corp. B, 4.150%, 07/15/2027 | 362,978 | 0.2 | |||||||||
| 67,000 | FirstEnergy Corp. C, 3.400%, 03/01/2050 | 44,889 | 0.0 | |||||||||
| 231,000 (2) | FirstEnergy Transmission LLC, 4.550%, 04/01/2049 | 191,230 | 0.1 | |||||||||
| 224,000 | Florida Power & Light Co., 2.875%, 12/04/2051 | 142,391 | 0.1 | |||||||||
| 35,000 | Florida Power & Light Co., 3.150%, 10/01/2049 | 23,848 | 0.0 | |||||||||
| 30,000 | Florida Power & Light Co., 3.950%, 03/01/2048 | 23,600 | 0.0 | |||||||||
| 100,000 | Florida Power & Light Co., 5.600%, 06/15/2054 | 101,089 | 0.1 | |||||||||
| 88,000 | Georgia Power Co., 4.950%, 05/17/2033 | 85,853 | 0.0 | |||||||||
| 2,000 | Georgia Power Co., 5.250%, 03/15/2034 | 1,994 | 0.0 | |||||||||
| 138,000 | MidAmerican Energy Co., 5.300%, 02/01/2055 | 131,523 | 0.1 | |||||||||
See Accompanying Notes to Financial Statements
26
| VY® BlackRock Inflation | PORTFOLIO OF INVESTMENTS |
| Protected Bond Portfolio | as of June 30, 2024 (Unaudited) (continued) |
| Principal Amount† | Value | Percentage of Net Assets | ||||||||||
| CORPORATE BONDS/NOTES: (continued) | ||||||||||||
| Utilities: (continued) | ||||||||||||
| 110,000 | MidAmerican Energy Co., 5.850%, 09/15/2054 | $ | 112,779 | 0.1 | ||||||||
| 75,000 | NiSource, Inc., 1.700%, 02/15/2031 | 59,675 | 0.0 | |||||||||
| 86,000 | NiSource, Inc., 5.250%, 03/30/2028 | 85,935 | 0.1 | |||||||||
| 48,000 | Northern States Power Co., 5.400%, 03/15/2054 | 46,320 | 0.0 | |||||||||
| 263,000 | Ohio Power Co., 5.000%, 06/01/2033 | 253,468 | 0.1 | |||||||||
| 63,000 | Ohio Power Co. R, 2.900%, 10/01/2051 | 38,564 | 0.0 | |||||||||
| 32,000 | ONE Gas, Inc., 2.000%, 05/15/2030 | 27,122 | 0.0 | |||||||||
| 100,000 | Pacific Gas and Electric Co., 3.950%, 12/01/2047 | 71,701 | 0.0 | |||||||||
| 36,000 | Pacific Gas and Electric Co., 5.800%, 05/15/2034 | 35,789 | 0.0 | |||||||||
| 334,000 | Pacific Gas and Electric Co., 6.400%, 06/15/2033 | 345,204 | 0.2 | |||||||||
| 53,000 | Pacific Gas and Electric Co., 6.750%, 01/15/2053 | 55,061 | 0.0 | |||||||||
| 192,000 | PECO Energy Co., 2.850%, 09/15/2051 | 118,814 | 0.1 | |||||||||
| 37,000 | PECO Energy Co., 4.375%, 08/15/2052 | 30,476 | 0.0 | |||||||||
| 67,000 | Piedmont Natural Gas Co., Inc., 3.500%, 06/01/2029 | 61,920 | 0.0 | |||||||||
| 63,000 | Public Service Electric and Gas Co., MTN, 2.050%, 08/01/2050 | 34,122 | 0.0 | |||||||||
| 34,000 | Public Service Electric and Gas Co., MTN, 4.900%, 12/15/2032 | 33,484 | 0.0 | |||||||||
| 76,000 | San Diego Gas & Electric Co. UUU, 3.320%, 04/15/2050 | 51,781 | 0.0 | |||||||||
| 20,000 | Southern California Edison Co., 3.650%, 02/01/2050 | 14,232 | 0.0 | |||||||||
| 32,000 | Southern California Edison Co., 5.150%, 06/01/2029 | 31,982 | 0.0 | |||||||||
| 26,000 | Southern California Edison Co., 5.300%, 03/01/2028 | 26,059 | 0.0 | |||||||||
| 305,000 | Southern California Edison Co., 5.650%, 10/01/2028 | 310,385 | 0.2 | |||||||||
| 87,000 | Southern California Edison Co., 5.875%, 12/01/2053 | 86,927 | 0.1 | |||||||||
| Principal Amount† | Value | Percentage of Net Assets | ||||||||||
| CORPORATE BONDS/NOTES: (continued) | ||||||||||||
| Utilities: (continued) | ||||||||||||
| 139,000 | Southern California Edison Co., 5.950%, 11/01/2032 | $ | 143,730 | 0.1 | ||||||||
| 73,000 | Southwest Gas Corp., 5.450%, 03/23/2028 | 73,585 | 0.0 | |||||||||
| 20,000 | Spire Missouri, Inc., 4.800%, 02/15/2033 | 19,457 | 0.0 | |||||||||
| 4,000 | Union Electric Co., 3.900%, 04/01/2052 | 3,065 | 0.0 | |||||||||
| 7,000 | Union Electric Co., 5.250%, 01/15/2054 | 6,540 | 0.0 | |||||||||
| 5,000 | Virginia Electric and Power Co., 5.350%, 01/15/2054 | 4,724 | 0.0 | |||||||||
| 76,000 | Virginia Electric and Power Co., 5.700%, 08/15/2053 | 75,759 | 0.0 | |||||||||
| 191,000 (2) | Vistra Operations Co. LLC, 6.000%, 04/15/2034 | 191,585 | 0.1 | |||||||||
| 12,000 | Wisconsin Power and Light Co., 4.950%, 04/01/2033 | 11,621 | 0.0 | |||||||||
| 6,840,241 | 3.3 | |||||||||||
| Total Corporate Bonds/Notes | ||||||||||||
| (Cost $53,294,501) | 52,466,004 | 25.1 | ||||||||||
| U.S. GOVERNMENT AGENCY OBLIGATIONS: 14.1% | ||||||||||||
| Government National Mortgage Association: 2.3% | ||||||||||||
| 88,195 | 2.000%, 11/20/2050 | 71,524 | 0.0 | |||||||||
| 659,972 | 2.000%, 12/20/2050 | 535,096 | 0.2 | |||||||||
| 180,765 | 2.000%, 01/20/2051 | 146,520 | 0.1 | |||||||||
| 132,912 | 2.000%, 02/20/2051 | 107,681 | 0.0 | |||||||||
| 590,561 | 2.500%, 06/20/2052 | 496,672 | 0.2 | |||||||||
| 329,561 | 2.500%, 07/20/2052 | 277,469 | 0.1 | |||||||||
| 146,400 (4) | 2.500%, 07/15/2054 | 123,085 | 0.1 | |||||||||
| 405,586 | 3.000%, 08/20/2051 | 354,111 | 0.2 | |||||||||
| 107,568 | 3.000%, 12/20/2051 | 93,839 | 0.0 | |||||||||
| 271,000 (4) | 3.000%, 07/15/2054 | 236,151 | 0.1 | |||||||||
| 484,967 | 3.500%, 05/20/2047 | 440,956 | 0.2 | |||||||||
| 131,000 (4) | 3.500%, 07/15/2054 | 117,634 | 0.1 | |||||||||
| 201,164 | 4.000%, 09/20/2048 | 188,140 | 0.1 | |||||||||
| 199,000 (4) | 4.000%, 07/15/2054 | 183,912 | 0.1 | |||||||||
| 149,878 | 4.500%, 08/20/2048 | 144,261 | 0.1 | |||||||||
| 203,000 (4) | 4.500%, 07/15/2054 | 193,007 | 0.1 | |||||||||
| 345,000 (4) | 5.000%, 07/15/2054 | 335,965 | 0.2 | |||||||||
| 340,000 (4) | 5.500%, 07/15/2054 | 337,367 | 0.2 | |||||||||
| 250,000 (4) | 6.000%, 07/15/2054 | 251,077 | 0.1 | |||||||||
| 200,000 (4) | 6.500%, 07/15/2054 | 202,881 | 0.1 | |||||||||
| 4,837,348 | 2.3 | |||||||||||
| Uniform Mortgage-Backed Securities: 11.8% | ||||||||||||
| 150,807 | 1.500%, 04/01/2036 | 130,591 | 0.1 | |||||||||
| 51,816 | 1.500%, 05/01/2036 | 44,710 | 0.0 | |||||||||
| 110,349 | 1.500%, 06/01/2036 | 95,014 | 0.1 | |||||||||
| 500,990 | 1.500%, 11/01/2041 | 404,079 | 0.2 | |||||||||
| 296,142 | 1.500%, 12/01/2041 | 238,856 | 0.1 | |||||||||
| 51,278 | 1.500%, 10/01/2050 | 38,518 | 0.0 | |||||||||
See Accompanying Notes to Financial Statements
27
| VY® BlackRock Inflation | PORTFOLIO OF INVESTMENTS |
| Protected Bond Portfolio | as of June 30, 2024 (Unaudited) (continued) |
| Principal Amount† | Value | Percentage of Net Assets | ||||||||||
| U.S. GOVERNMENT AGENCY OBLIGATIONS: (continued) | ||||||||||||
| Uniform Mortgage-Backed Securities (continued) | ||||||||||||
| 59,529 | 1.500%, 10/01/2050 | $ | 44,675 | 0.0 | ||||||||
| 46,548 | 1.500%, 11/01/2050 | 34,937 | 0.0 | |||||||||
| 61,296 | 1.500%, 03/01/2051 | 45,856 | 0.0 | |||||||||
| 77,351 | 1.500%, 03/01/2051 | 58,115 | 0.0 | |||||||||
| 9,958 | 1.500%, 05/01/2051 | 7,479 | 0.0 | |||||||||
| 7,552 | 1.500%, 06/01/2051 | 5,640 | 0.0 | |||||||||
| 40,837 | 1.500%, 10/01/2051 | 30,612 | 0.0 | |||||||||
| 9,504 | 1.500%, 11/01/2051 | 7,125 | 0.0 | |||||||||
| 33,850 | 2.000%, 09/01/2035 | 29,996 | 0.0 | |||||||||
| 71,455 | 2.000%, 01/01/2036 | 63,370 | 0.0 | |||||||||
| 21,242 | 2.000%, 02/01/2036 | 18,818 | 0.0 | |||||||||
| 56,833 | 2.000%, 02/01/2036 | 50,349 | 0.0 | |||||||||
| 34,698 | 2.000%, 03/01/2036 | 30,738 | 0.0 | |||||||||
| 27,572 | 2.000%, 04/01/2036 | 24,506 | 0.0 | |||||||||
| 84,160 | 2.000%, 05/01/2036 | 74,802 | 0.0 | |||||||||
| 175,116 | 2.000%, 05/01/2036 | 155,643 | 0.1 | |||||||||
| 31,448 | 2.000%, 07/01/2036 | 27,859 | 0.0 | |||||||||
| 43,703 | 2.000%, 11/01/2036 | 38,811 | 0.0 | |||||||||
| 86,327 | 2.000%, 02/01/2037 | 76,309 | 0.0 | |||||||||
| 74,430 | 2.000%, 03/01/2037 | 65,839 | 0.0 | |||||||||
| 91,774 | 2.000%, 03/01/2037 | 81,518 | 0.0 | |||||||||
| 109,902 | 2.000%, 03/01/2037 | 97,333 | 0.1 | |||||||||
| 61,720 | 2.000%, 04/01/2037 | 54,594 | 0.0 | |||||||||
| 484,981 | 2.000%, 02/01/2042 | 405,722 | 0.2 | |||||||||
| 128,858 | 2.000%, 09/01/2050 | 101,842 | 0.1 | |||||||||
| 232,426 | 2.000%, 10/01/2050 | 183,600 | 0.1 | |||||||||
| 1,398,588 | 2.000%, 01/01/2051 | 1,107,376 | 0.5 | |||||||||
| 286,626 | 2.000%, 02/01/2051 | 226,234 | 0.1 | |||||||||
| 257,843 | 2.000%, 03/01/2051 | 202,650 | 0.1 | |||||||||
| 88,084 | 2.000%, 04/01/2051 | 70,197 | 0.0 | |||||||||
| 128,460 | 2.000%, 04/01/2051 | 102,370 | 0.1 | |||||||||
| 207,289 | 2.000%, 04/01/2051 | 165,365 | 0.1 | |||||||||
| 36,928 | 2.000%, 10/01/2051 | 28,978 | 0.0 | |||||||||
| 48,862 | 2.000%, 11/01/2051 | 39,011 | 0.0 | |||||||||
| 126,119 | 2.000%, 11/01/2051 | 100,779 | 0.1 | |||||||||
| 146,453 | 2.000%, 11/01/2051 | 115,314 | 0.1 | |||||||||
| 228,179 | 2.000%, 11/01/2051 | 182,140 | 0.1 | |||||||||
| 259,448 | 2.000%, 11/01/2051 | 206,722 | 0.1 | |||||||||
| 55,615 | 2.000%, 12/01/2051 | 43,639 | 0.0 | |||||||||
| 421,992 | 2.000%, 01/01/2052 | 336,239 | 0.2 | |||||||||
| 165,513 | 2.000%, 03/01/2052 | 131,874 | 0.1 | |||||||||
| 237,567 | 2.000%, 03/01/2052 | 189,085 | 0.1 | |||||||||
| 435,022 | 2.000%, 03/01/2052 | 344,748 | 0.2 | |||||||||
| 525,672 | 2.500%, 10/01/2036 | 477,122 | 0.2 | |||||||||
| 18,799 | 2.500%, 07/01/2050 | 15,639 | 0.0 | |||||||||
| 63,096 | 2.500%, 07/01/2050 | 52,827 | 0.0 | |||||||||
| 121,590 | 2.500%, 07/01/2050 | 101,245 | 0.1 | |||||||||
| 123,390 | 2.500%, 07/01/2050 | 102,743 | 0.1 | |||||||||
| 124,569 | 2.500%, 07/01/2050 | 103,725 | 0.1 | |||||||||
| 31,321 | 2.500%, 08/01/2050 | 26,080 | 0.0 | |||||||||
| 102,154 | 2.500%, 08/01/2050 | 85,061 | 0.1 | |||||||||
| 123,613 | 2.500%, 08/01/2050 | 102,929 | 0.1 | |||||||||
| 71,439 | 2.500%, 11/01/2050 | 60,004 | 0.0 | |||||||||
| 19,892 | 2.500%, 01/01/2051 | 16,559 | 0.0 | |||||||||
| 63,902 | 2.500%, 02/01/2051 | 53,129 | 0.0 | |||||||||
| 106,121 | 2.500%, 02/01/2051 | 88,787 | 0.1 | |||||||||
| 10,139 | 2.500%, 03/01/2051 | 8,423 | 0.0 | |||||||||
| 5,578 | 2.500%, 04/01/2051 | 4,637 | 0.0 | |||||||||
| 11,142 | 2.500%, 04/01/2051 | 9,258 | 0.0 | |||||||||
| Principal Amount† | Value | Percentage of Net Assets | ||||||||||
| U.S. GOVERNMENT AGENCY OBLIGATIONS: (continued) | ||||||||||||
| Uniform Mortgage-Backed Securities (continued) | ||||||||||||
| 2,931 | 2.500%, 05/01/2051 | $ | 2,438 | 0.0 | ||||||||
| 5,978 | 2.500%, 05/01/2051 | 4,968 | 0.0 | |||||||||
| 86,417 | 2.500%, 05/01/2051 | 72,841 | 0.0 | |||||||||
| 100,533 | 2.500%, 05/01/2051 | 83,607 | 0.1 | |||||||||
| 9,382 | 2.500%, 07/01/2051 | 7,798 | 0.0 | |||||||||
| 3,354 | 2.500%, 10/01/2051 | 2,786 | 0.0 | |||||||||
| 34,320 | 2.500%, 10/01/2051 | 28,414 | 0.0 | |||||||||
| 84,579 | 2.500%, 11/01/2051 | 70,800 | 0.0 | |||||||||
| 1,002,441 | 2.500%, 11/01/2051 | 835,634 | 0.4 | |||||||||
| 26,345 | 2.500%, 12/01/2051 | 21,843 | 0.0 | |||||||||
| 260,987 | 2.500%, 01/01/2052 | 216,127 | 0.1 | |||||||||
| 1,038,541 | 2.500%, 01/01/2052 | 863,239 | 0.4 | |||||||||
| 283,821 | 3.000%, 01/01/2036 | 263,427 | 0.1 | |||||||||
| 229,814 | 3.000%, 09/01/2050 | 200,219 | 0.1 | |||||||||
| 52,267 | 3.000%, 07/01/2051 | 45,270 | 0.0 | |||||||||
| 220,624 | 3.000%, 09/01/2051 | 190,152 | 0.1 | |||||||||
| 66,773 | 3.000%, 10/01/2051 | 57,544 | 0.0 | |||||||||
| 119,871 | 3.000%, 11/01/2051 | 102,844 | 0.1 | |||||||||
| 53,096 | 3.000%, 12/01/2051 | 45,774 | 0.0 | |||||||||
| 6,966 | 3.000%, 01/01/2052 | 5,978 | 0.0 | |||||||||
| 25,699 | 3.000%, 01/01/2052 | 22,055 | 0.0 | |||||||||
| 38,397 | 3.000%, 02/01/2052 | 33,403 | 0.0 | |||||||||
| 894,067 | 3.000%, 03/01/2052 | 774,075 | 0.4 | |||||||||
| 34,567 | 3.000%, 04/01/2052 | 29,917 | 0.0 | |||||||||
| 55,835 | 3.000%, 05/01/2052 | 48,090 | 0.0 | |||||||||
| 223,298 | 3.000%, 08/01/2052 | 192,416 | 0.1 | |||||||||
| 118,655 | 3.500%, 05/01/2036 | 112,792 | 0.1 | |||||||||
| 991,138 | 3.500%, 09/01/2051 | 890,781 | 0.4 | |||||||||
| 27,643 | 3.500%, 05/01/2052 | 24,816 | 0.0 | |||||||||
| 19,503 | 3.500%, 06/01/2052 | 17,356 | 0.0 | |||||||||
| 51,428 | 3.500%, 06/01/2052 | 46,045 | 0.0 | |||||||||
| 53,144 | 3.500%, 06/01/2052 | 47,293 | 0.0 | |||||||||
| 30,954 | 3.500%, 07/01/2052 | 27,717 | 0.0 | |||||||||
| 22,238 | 3.500%, 08/01/2052 | 19,963 | 0.0 | |||||||||
| 5,256 | 3.500%, 09/01/2052 | 4,706 | 0.0 | |||||||||
| 14,591 | 3.500%, 09/01/2052 | 13,049 | 0.0 | |||||||||
| 19,285 | 3.500%, 09/01/2052 | 17,167 | 0.0 | |||||||||
| 22,742 | 3.500%, 09/01/2052 | 20,240 | 0.0 | |||||||||
| 35,000 (4) | 4.000%, 07/01/2039 | 33,655 | 0.0 | |||||||||
| 13,452 | 4.000%, 01/01/2048 | 12,549 | 0.0 | |||||||||
| 8,159 | 4.000%, 04/01/2048 | 7,599 | 0.0 | |||||||||
| 8,496 | 4.000%, 08/01/2048 | 7,900 | 0.0 | |||||||||
| 12,352 | 4.000%, 09/01/2048 | 11,512 | 0.0 | |||||||||
| 106,588 | 4.000%, 03/01/2050 | 98,974 | 0.1 | |||||||||
| 608,045 | 4.000%, 04/01/2050 | 563,822 | 0.3 | |||||||||
| 26,278 | 4.000%, 07/01/2050 | 24,447 | 0.0 | |||||||||
| 62,063 | 4.000%, 07/01/2050 | 57,692 | 0.0 | |||||||||
| 204,222 | 4.000%, 05/01/2051 | 189,920 | 0.1 | |||||||||
| 36,706 | 4.000%, 04/01/2052 | 34,084 | 0.0 | |||||||||
| 223,182 | 4.000%, 05/01/2052 | 207,471 | 0.1 | |||||||||
| 26,252 | 4.000%, 06/01/2052 | 24,413 | 0.0 | |||||||||
| 74,000 (4) | 4.500%, 07/15/2039 | 72,393 | 0.0 | |||||||||
| 435,836 | 4.500%, 03/01/2048 | 419,235 | 0.2 | |||||||||
| 56,412 | 4.500%, 03/01/2050 | 53,982 | 0.0 | |||||||||
| 17,768 | 4.500%, 07/01/2052 | 16,781 | 0.0 | |||||||||
| 18,772 | 4.500%, 07/01/2052 | 17,730 | 0.0 | |||||||||
| 106,217 | 4.500%, 07/01/2052 | 100,318 | 0.1 | |||||||||
| 34,863 | 4.500%, 08/01/2052 | 32,913 | 0.0 | |||||||||
| 80,417 | 4.500%, 08/01/2052 | 76,516 | 0.0 | |||||||||
See Accompanying Notes to Financial Statements
28
| VY® BlackRock Inflation | PORTFOLIO OF INVESTMENTS |
| Protected Bond Portfolio | as of June 30, 2024 (Unaudited) (continued) |
| Principal Amount† | Value | Percentage of Net Assets | ||||||||||
| U.S. GOVERNMENT AGENCY OBLIGATIONS: (continued) | ||||||||||||
| Uniform Mortgage-Backed Securities (continued) | ||||||||||||
| 67,942 | 4.500%, 11/01/2052 | $ | 64,155 | 0.0 | ||||||||
| 4,720 | 5.000%, 07/01/2052 | 4,596 | 0.0 | |||||||||
| 185,451 | 5.000%, 07/01/2052 | 181,885 | 0.1 | |||||||||
| 13,564 | 5.000%, 08/01/2052 | 13,206 | 0.0 | |||||||||
| 900 | 5.000%, 09/01/2052 | 876 | 0.0 | |||||||||
| 1,609 | 5.000%, 10/01/2052 | 1,564 | 0.0 | |||||||||
| 39,901 | 5.000%, 11/01/2052 | 38,662 | 0.0 | |||||||||
| 43,531 | 5.000%, 12/01/2052 | 42,179 | 0.0 | |||||||||
| 47,750 | 5.000%, 12/01/2052 | 46,288 | 0.0 | |||||||||
| 50,444 | 5.000%, 12/01/2052 | 48,908 | 0.0 | |||||||||
| 82,160 | 5.000%, 12/01/2052 | 79,609 | 0.0 | |||||||||
| 23,664 | 5.000%, 01/01/2053 | 22,929 | 0.0 | |||||||||
| 52,715 | 5.000%, 01/01/2053 | 51,076 | 0.0 | |||||||||
| 143,827 | 5.000%, 01/01/2053 | 139,264 | 0.1 | |||||||||
| 25,546 | 5.000%, 02/01/2053 | 24,746 | 0.0 | |||||||||
| 79,500 | 5.000%, 04/01/2053 | 77,273 | 0.0 | |||||||||
| 4,487,242 (4) | 5.000%, 07/01/2054 | 4,337,200 | 2.1 | |||||||||
| 63,228 | 5.500%, 01/01/2053 | 62,585 | 0.0 | |||||||||
| 85,460 | 5.500%, 01/01/2053 | 84,602 | 0.1 | |||||||||
| 96,650 | 5.500%, 01/01/2053 | 95,625 | 0.1 | |||||||||
| 87,331 | 5.500%, 03/01/2053 | 86,396 | 0.1 | |||||||||
| 34,599 | 5.500%, 05/01/2053 | 34,234 | 0.0 | |||||||||
| 82,443 | 5.500%, 05/01/2053 | 81,585 | 0.1 | |||||||||
| 87,228 | 5.500%, 05/01/2053 | 86,276 | 0.1 | |||||||||
| 99,366 | 5.500%, 05/01/2053 | 98,332 | 0.1 | |||||||||
| 99,898 | 5.500%, 05/01/2053 | 98,858 | 0.1 | |||||||||
| 74,105 | 5.500%, 06/01/2053 | 73,334 | 0.0 | |||||||||
| 2,211,672 (4) | 5.500%, 07/01/2054 | 2,181,521 | 1.1 | |||||||||
| 44,314 | 6.000%, 10/01/2052 | 44,664 | 0.0 | |||||||||
| 54,739 | 6.000%, 01/01/2053 | 55,060 | 0.0 | |||||||||
| 76,011 | 6.000%, 01/01/2053 | 76,482 | 0.0 | |||||||||
| 47,058 | 6.000%, 02/01/2053 | 47,323 | 0.0 | |||||||||
| 40,741 | 6.000%, 04/01/2053 | 41,008 | 0.0 | |||||||||
| 64,839 | 6.000%, 04/01/2053 | 65,317 | 0.0 | |||||||||
| 46,489 | 6.000%, 05/01/2053 | 46,831 | 0.0 | |||||||||
| 54,441 | 6.000%, 05/01/2053 | 54,815 | 0.0 | |||||||||
| 84,228 | 6.000%, 05/01/2053 | 84,850 | 0.1 | |||||||||
| 85,454 | 6.000%, 05/01/2053 | 85,985 | 0.1 | |||||||||
| 65,293 | 6.000%, 06/01/2053 | 65,775 | 0.0 | |||||||||
| 104,031 | 6.000%, 07/01/2053 | 104,798 | 0.1 | |||||||||
| 109,830 | 6.500%, 08/01/2053 | 112,368 | 0.1 | |||||||||
| 21,005 | 6.500%, 09/01/2053 | 21,526 | 0.0 | |||||||||
| 59,751 | 6.500%, 10/01/2053 | 61,132 | 0.0 | |||||||||
| 34,101 | 6.500%, 11/01/2053 | 34,889 | 0.0 | |||||||||
| 137,399 | 6.500%, 02/01/2054 | 140,579 | 0.1 | |||||||||
| 191,700 (4) | 6.500%, 07/15/2054 | 195,130 | 0.1 | |||||||||
| 24,692,531 | 11.8 | |||||||||||
| Total U.S. Government Agency Obligations | ||||||||||||
| (Cost $31,565,890) | 29,529,879 | 14.1 | ||||||||||
| COMMERCIAL MORTGAGE-BACKED SECURITIES: 5.5% | ||||||||||||
| 270,000 (2)(3) | AREIT Ltd. 2024-CRE9 A, 7.015%, (TSFR1M + 1.686%), 05/17/2041 | 270,574 | 0.1 | |||||||||
| 366,000 | BANK 2019-BN23 A3, 2.920%, 12/15/2052 | 324,074 | 0.2 | |||||||||
| 280,000 (3) | BANK 2022-BNK42 A5, 4.493%, 06/15/2055 | 264,548 | 0.1 | |||||||||
| Principal Amount† | Value | Percentage of Net Assets | ||||||||||
| COMMERCIAL MORTGAGE-BACKED SECURITIES: (continued) | ||||||||||||
| 300,000 | Barclays Commercial Mortgage Trust 2019-C3 B, 4.096%, 05/15/2052 | $ | 270,916 | 0.1 | ||||||||
| 280,000 | Barclays Commercial Mortgage Trust 2019-C4 B, 3.322%, 08/15/2052 | 235,868 | 0.1 | |||||||||
| 240,000 (3) | BBCMS Mortgage Trust 2022-C16 A5, 4.600%, 06/15/2055 | 229,731 | 0.1 | |||||||||
| 65,000 | BFLD Mortgage Trust 2024-VICT, 7.190%, 07/15/2041 | 64,835 | 0.0 | |||||||||
| 210,000 (2)(3) | BX Commercial Mortgage Trust 2024-KING A, 6.870%, (TSFR1M + 1.541%), 05/15/2034 | 210,466 | 0.1 | |||||||||
| 230,000 (2)(3) | BX Commercial Mortgage Trust 2024-MDHS A, 6.970%, (TSFR1M + 1.641%), 05/15/2041 | 229,834 | 0.1 | |||||||||
| 118,195 (2)(3) | BX Commercial Mortgage Trust 2024-XL4 D, 8.468%, (TSFR1M + 3.140%), 02/15/2039 | 118,255 | 0.1 | |||||||||
| 800,000 (2)(3) | BX Trust 2021-ARIA A, 6.343%, (TSFR1M + 1.014%), 10/15/2036 | 790,668 | 0.4 | |||||||||
| 210,000 (2)(3) | BX Trust 2024-VLT4 A, 6.811%, (TSFR1M + 1.491%), 07/15/2029 | 210,077 | 0.1 | |||||||||
| 410,000 | CD Mortgage Trust 2017-CD3 A4, 3.631%, 02/10/2050 | 380,792 | 0.2 | |||||||||
| 500,000 | CD Mortgage Trust 2017-CD6 A5, 3.456%, 11/13/2050 | 468,884 | 0.2 | |||||||||
| 90,000 (2)(3) | COMM MORTGAGE TRUST 2024-WCL1 A, 7.141%, (TSFR1M + 1.841%), 06/15/2041 | 89,859 | 0.0 | |||||||||
| 205,000 | CSAIL Commercial Mortgage Trust 2015-C3 A4, 3.718%, 08/15/2048 | 199,609 | 0.1 | |||||||||
| 80,000 (2) | ELM Trust 2024-ELM A10, 5.801%, 06/10/2039 | 80,139 | 0.0 | |||||||||
| 80,000 (2) | ELM Trust 2024-ELM A15, 5.801%, 06/10/2039 | 80,139 | 0.0 | |||||||||
| 549,361 (2)(3) | ELP Commercial Mortgage Trust 2021- ELP A, 6.144%, (TSFR1M + 0.815%), 11/15/2038 | 543,243 | 0.3 | |||||||||
See Accompanying Notes to Financial Statements
29
| VY® BlackRock Inflation | PORTFOLIO OF INVESTMENTS |
| Protected Bond Portfolio | as of June 30, 2024 (Unaudited) (continued) |
| Principal Amount† | Value | Percentage of Net Assets | ||||||||||
| COMMERCIAL MORTGAGE-BACKED SECURITIES: (continued) | ||||||||||||
| 354,040 (2)(3) | Extended Stay America Trust 2021-ESH A, 6.523%, (TSFR1M + 1.194%), 07/15/2038 | $ | 352,945 | 0.2 | ||||||||
| 980,000 (3) | Fannie Mae-Aces 2022-M10 A2, 2.002%, 01/25/2032 | 802,748 | 0.4 | |||||||||
| 1,760,000 | Freddie Mac Multifamily WI Certificates Series WI-K146 K146 A2, 2.920%, 07/25/2032 | 1,546,099 | 0.7 | |||||||||
| 1,000,000 | GS Mortgage Securities Trust 2016-GS2 A4, 3.050%, 05/10/2049 | 954,432 | 0.5 | |||||||||
| 100,000 (2)(3) | GWT 2024-WLF2 A, 7.020%, (TSFR1M + 1.691%), 05/15/2041 | 100,116 | 0.1 | |||||||||
| 600,000 (2)(3) | JP Morgan Chase Commercial Mortgage Securities Trust 2021- NYAH A, 6.453%, (TSFR1M + 0.874%), 06/15/2038 | 591,540 | 0.3 | |||||||||
| 140,000 (2)(3) | LBA Trust 2024-BOLT A, 6.920%, (TSFR1M + 1.591%), 06/15/2026 | 139,596 | 0.1 | |||||||||
| 378,185 (2)(3) | Med Trust 2021-MDLN A, 6.393%, (TSFR1M + 1.064%), 11/15/2038 | 377,600 | 0.2 | |||||||||
| 100,000 (2)(3) | MF1 2021-W10 A, 6.399%, (TSFR1M + 1.070%), 12/15/2034 | 99,216 | 0.0 | |||||||||
| 215,000 (2)(3) | MTN Commercial Mortgage Trust 2022-LPFL A, 6.727%, (TSFR1M + 1.397%), 03/15/2039 | 212,626 | 0.1 | |||||||||
| 250,000 (2)(3) | Taubman Centers Commercial Mortgage Trust 2022-DPM A, 7.515%, (TSFR1M + 2.186%), 05/15/2037 | 251,574 | 0.1 | |||||||||
| 422,500 | Wells Fargo Commercial Mortgage Trust 2015-C26 B, 3.783%, 02/15/2048 | 411,540 | 0.2 | |||||||||
| 700,000 | Wells Fargo Commercial Mortgage Trust 2017-C39 A5, 3.418%, 09/15/2050 | 656,128 | 0.3 | |||||||||
| Total Commercial Mortgage-Backed Securities | ||||||||||||
| (Cost $12,239,296) | 11,558,671 | 5.5 | ||||||||||
| SOVEREIGN BONDS: 4.4% | ||||||||||||
| BRL1,500,000 | Brazil Notas do Tesouro Nacional Serie F NTNF, 10.000%, 01/01/2029 | 249,045 | 0.1 | |||||||||
| Principal Amount† | Value | Percentage of Net Assets | ||||||||||
| SOVEREIGN BONDS: (continued) | ||||||||||||
| BRL8,800,000 | Brazil Notas do Tesouro Nacional Serie F NTNF, 10.000%, 01/01/2035 | $ | 1,375,172 | 0.7 | ||||||||
| 550,000 | Brazilian Government International Bond, 6.125%, 03/15/2034 | 529,650 | 0.3 | |||||||||
| 250,000 | Chile Government International Bond, 2.550%, 07/27/2033 | 203,563 | 0.1 | |||||||||
| EUR170,000 | European Union NGEU, 2.500%, 10/04/2052 | 149,723 | 0.1 | |||||||||
| EUR826,074 | European Union NGEU, 3.000%, 03/04/2053 | 804,415 | 0.4 | |||||||||
| EUR477,980 (2) | French Republic Government Bond OAT OAT, 3.000%, 05/25/2054 | 445,783 | 0.2 | |||||||||
| 200,000 | Indonesia Government International Bond, 5.650%, 01/11/2053 | 203,312 | 0.1 | |||||||||
| 204,000 | Israel Government International Bond, 5.750%, 03/12/2054 | 185,003 | 0.1 | |||||||||
| JPY91,600,000 | Japan Government Thirty Year Bond 82, 1.800%, 03/20/2054 | 525,130 | 0.2 | |||||||||
| EUR932,980 (2) | Kingdom of Belgium Government Bond 98, 3.300%, 06/22/2054 | 940,444 | 0.4 | |||||||||
| MXN6,600,000 | Mexican Bonos M, 7.750%, 11/23/2034 | 310,925 | 0.1 | |||||||||
| MXN4,500,000 | Mexican Bonos M, 8.500%, 03/01/2029 | 231,595 | 0.1 | |||||||||
| MXN9,000,000 | Mexican Bonos M, 8.500%, 05/31/2029 | 463,959 | 0.2 | |||||||||
| 660,000 | Mexico Government International Bond, 3.500%, 02/12/2034 | 538,560 | 0.3 | |||||||||
| 300,000 | Mexico Government International Bond, 4.600%, 02/10/2048 | 230,250 | 0.1 | |||||||||
| 250,000 | Mexico Government International Bond, 4.875%, 05/19/2033 | 231,125 | 0.1 | |||||||||
| 440,000 | Mexico Government International Bond, 6.350%, 02/09/2035 | 443,520 | 0.2 | |||||||||
| 200,000 | Panama Government International Bond, 3.298%, 01/19/2033 | 156,250 | 0.1 | |||||||||
| 200,000 | Panama Government International Bond, 4.500%, 04/01/2056 | 130,450 | 0.1 | |||||||||
| 200,000 | Peruvian Government International Bond, 2.783%, 01/23/2031 | 171,800 | 0.1 | |||||||||
| 53,000 | Peruvian Government International Bond, 3.300%, 03/11/2041 | 39,502 | 0.0 | |||||||||
See Accompanying Notes to Financial Statements
30
| VY® BlackRock Inflation | PORTFOLIO OF INVESTMENTS |
| Protected Bond Portfolio | as of June 30, 2024 (Unaudited) (continued) |
| Principal Amount† | Value | Percentage of Net Assets | ||||||||||
| SOVEREIGN BONDS: (continued) | ||||||||||||
| 200,000 | Philippine Government International Bond, 3.700%, 02/02/2042 | $ | 162,187 | 0.1 | ||||||||
| GBP414,000 | United Kingdom Gilt, 4.375%, 07/31/2054 | 499,105 | 0.2 | |||||||||
| 45,049 | Uruguay Government International Bond, 5.100%, 06/18/2050 | 42,656 | 0.0 | |||||||||
| Total Sovereign Bonds | ||||||||||||
| (Cost $9,888,551) | 9,263,124 | 4.4 | ||||||||||
| COLLATERALIZED MORTGAGE OBLIGATIONS: 1.8% | ||||||||||||
| 257,799 (2)(3) | BRAVO Residential Funding Trust 2023-NQM3 A1, 4.850%, 09/25/2062 | 251,406 | 0.1 | |||||||||
| 256,599 (2)(3) | CSMC Trust 2022-NQM4 A1A, 4.819%, 06/25/2067 | 251,904 | 0.1 | |||||||||
| 480,300 (2)(3) | CSMC Trust 2022-NQM5 A1, 5.169%, 05/25/2067 | 475,536 | 0.2 | |||||||||
| 326,607 (2)(3) | Ellington Financial Mortgage Trust 2021-3 A1, 1.241%, 09/25/2066 | 260,693 | 0.1 | |||||||||
| 809,392 (2)(3) | J.P. Morgan Mortgage Trust 2022-INV3 A3B, 3.000%, 09/25/2052 | 670,134 | 0.3 | |||||||||
| 139,931 (2)(3) | J.P. Morgan Mortgage Trust 2023-DSC1 A1, 4.625%, 07/25/2063 | 133,656 | 0.1 | |||||||||
| 968,630 (2)(3) | Mello Mortgage Capital Acceptance 2022-INV2 A3, 3.000%, 04/25/2052 | 801,395 | 0.4 | |||||||||
| 85,353 (2)(3) | PRKCM Trust 2022-AFC2 A1, 5.335%, 08/25/2057 | 84,016 | 0.0 | |||||||||
| 370,928 (2)(3) | SG Residential Mortgage Trust 2021-1 A1, 1.160%, 07/25/2061 | 297,515 | 0.1 | |||||||||
| 120,378 (2)(3) | SG Residential Mortgage Trust 2022-2 A1, 5.353%, 08/25/2062 | 118,789 | 0.1 | |||||||||
| 343,232 (2)(3) | Verus Securitization Trust 2022-7 A1, 5.152%, 07/25/2067 | 339,373 | 0.2 | |||||||||
| 92,279 (2)(3) | Verus Securitization Trust 2022-INV2 A1, 6.790%, 10/25/2067 | 92,674 | 0.1 | |||||||||
| Total Collateralized Mortgage Obligations | ||||||||||||
| (Cost $3,992,575) | 3,777,091 | 1.8 | ||||||||||
| ASSET-BACKED SECURITIES: 1.5% | ||||||||||||
| Other Asset-Backed Securities: 0.8% | ||||||||||||
| 401,000 (2) | AMSR Trust 2022-SFR3 D, 4.000%, 10/17/2039 | 375,035 | 0.2 | |||||||||
| Principal Amount† | Value | Percentage of Net Assets | ||||||||||
| ASSET-BACKED SECURITIES: (continued) | ||||||||||||
| Other Asset-Backed Securities: (continued) | ||||||||||||
| 97,190 (2) | GoodLeap Sustainable Home Solutions Trust 2022-1GS A, 2.700%, 01/20/2049 | $ | 80,242 | 0.0 | ||||||||
| 400,000 (2) | New Residential Mortgage Loan Trust 2022-SFR2 D, 4.000%, 09/04/2039 | 370,126 | 0.2 | |||||||||
| 395,000 (2) | Progress Residential Trust 2022-SFR6 D, 6.035%, 07/20/2039 | 391,217 | 0.2 | |||||||||
| 525,000 (2) | Progress Residential Trust 2022-SFR7 D, 5.500%, 10/27/2039 | 511,803 | 0.2 | |||||||||
| 1,728,423 | 0.8 | |||||||||||
| Student Loan Asset-Backed Securities: 0.7% | ||||||||||||
| 114,686 (2) | College Ave Student Loans LLC 2021-B A2, 1.760%, 06/25/2052 | 101,862 | 0.1 | |||||||||
| 100,380 (2) | Navient Student Loan Trust 2019-BA A2A, 3.390%, 12/15/2059 | 96,441 | 0.0 | |||||||||
| 463,185 (2)(3) | Nelnet Student Loan Trust 2021-BA AFL, 6.233%, (TSFR1M + 0.894%), 04/20/2062 | 459,990 | 0.2 | |||||||||
| 400,107 (3) | SLM Private Credit Student Loan Trust 2005-A A4, 5.911%, (TSFR3M + 0.572%), 12/15/2038 | 394,139 | 0.2 | |||||||||
| 305,218 (2) | SMB Private Education Loan Trust 2021- D A1A, 1.340%, 03/17/2053 | 276,316 | 0.1 | |||||||||
| 149,130 (2) | Sofi Professional Loan Program Trust 2018-C A2FX, 3.590%, 01/25/2048 | 145,142 | 0.1 | |||||||||
| 1,473,890 | 0.7 | |||||||||||
| Total Asset-Backed Securities | ||||||||||||
| (Cost $3,254,544) | 3,202,313 | 1.5 | ||||||||||
| PURCHASED OPTIONS(5): 0.1% | ||||||||||||
| Total Purchased Options | ||||||||||||
| (Cost $269,593) | 182,722 | 0.1 | ||||||||||
| Total Long-Term Investments | ||||||||||||
| (Cost $226,666,505) | 212,729,593 | 101.7 | ||||||||||
See Accompanying Notes to Financial Statements
31
| VY® BlackRock Inflation | PORTFOLIO OF INVESTMENTS |
| Protected Bond Portfolio | as of June 30, 2024 (Unaudited) (continued) |
| Shares | Value | Percentage of Net Assets | ||||||||||
| SHORT-TERM INVESTMENTS: 0.3% | ||||||||||||
| Mutual Funds: 0.3% | ||||||||||||
| 539,337 (6) | BlackRock Liquidity Funds, FedFund, Institutional Class, 5.124% (Cost $539,337) | $ | 539,337 | 0.3 | ||||||||
| Total Short-Term Investments | ||||||||||||
| (Cost $539,337) | $ | 539,337 | 0.3 | |||||||||
| Total Investments in Securities | ||||||||||||
| (Cost $227,205,842) | $ | 213,268,930 | 102.0 | |||||||||
| Liabilities in Excess of Other Assets | (4,242,631) | (2.0 | ) | |||||||||
| Net Assets | $ | 209,026,299 | 100.0 | |||||||||
| † | Unless otherwise indicated, principal amount is shown in USD. |
| (1) | All or a portion of this security has been pledged as collateral in connection with open futures contracts. Please refer to Note 2 for additional details. |
| (2) | Securities with purchases pursuant to Rule 144A or section 4(a)(2), under the Securities Act of 1933 and may not be resold subject to that rule except to qualified institutional buyers. |
| (3) | Variable rate security. Rate shown is the rate in effect as of June 30, 2024. |
| (4) | Represents or includes a TBA transaction. |
| (5) | The tables within the Portfolio of Investments detail open purchased options which are non-income producing securities. |
| (6) | Rate shown is the 7-day yield as of June 30, 2024. |
Currency Abbreviations:
| BRL | Brazilian Real |
| EUR | EU Euro |
| GBP | British Pound |
| JPY | Japanese Yen |
| MXN | Mexican Peso |
Reference Rate Abbreviations:
| TSFR1M | 1-month CME Term Secured Overnight Financing Rate |
| TSFR3M | 3-month CME Term Secured Overnight Financing Rate |
See Accompanying Notes to Financial Statements
32
| VY® BlackRock Inflation Protected Bond Portfolio | PORTFOLIO OF INVESTMENTS |
| as of June 30, 2024 (Unaudited) (continued) |
Fair Value Measurements^
The following is a summary of the fair valuations according to the inputs used as of June 30, 2024 in valuing the assets and liabilities:
| Quoted Prices in Active Markets for Identical Investments (Level 1) | Significant Other Observable Inputs (Level 2) | Significant Unobservable Inputs (Level 3) | Fair Value at June 30, 2024 | |||||||||||||
| Asset Table | ||||||||||||||||
| Investments, at fair value | ||||||||||||||||
| U.S. Treasury Obligations | $ | — | $ | 102,749,789 | $ | — | $ | 102,749,789 | ||||||||
| Corporate Bonds/Notes | — | 52,466,004 | — | 52,466,004 | ||||||||||||
| U.S. Government Agency Obligations | — | 29,529,879 | — | 29,529,879 | ||||||||||||
| Commercial Mortgage-Backed Securities | — | 11,558,671 | — | 11,558,671 | ||||||||||||
| Sovereign Bonds | — | 9,263,124 | — | 9,263,124 | ||||||||||||
| Collateralized Mortgage Obligations | — | 3,777,091 | — | 3,777,091 | ||||||||||||
| Asset-Backed Securities | — | 3,202,313 | — | 3,202,313 | ||||||||||||
| Purchased Options | — | 182,722 | — | 182,722 | ||||||||||||
| Short-Term Investments | 539,337 | — | — | 539,337 | ||||||||||||
| Total Investments, at fair value | $ | 539,337 | $ | 212,729,593 | $ | — | $ | 213,268,930 | ||||||||
| Other Financial Instruments+ | ||||||||||||||||
| Centrally Cleared Inflation-Linked Swaps | — | 825,301 | — | 825,301 | ||||||||||||
| Centrally Cleared Interest Rate Swaps | — | 71,175 | — | 71,175 | ||||||||||||
| Forward Foreign Currency Contracts | — | 105,729 | — | 105,729 | ||||||||||||
| Futures | 62,015 | — | — | 62,015 | ||||||||||||
| Total Assets | $ | 601,352 | $ | 213,731,798 | $ | — | $ | 214,333,150 | ||||||||
| Liabilities Table | ||||||||||||||||
| Other Financial Instruments | ||||||||||||||||
| Centrally Cleared Credit Default Swaps | $ | — | $ | (18,978 | ) | $ | — | $ | (18,978 | ) | ||||||
| Centrally Cleared Inflation-Linked Swaps | — | (70,927 | ) | — | (70,927 | ) | ||||||||||
| Centrally Cleared Interest Rate Swaps | — | (126,145 | ) | — | (126,145 | ) | ||||||||||
| Forward Foreign Currency Contracts | — | (10,337 | ) | — | (10,337 | ) | ||||||||||
| Futures | (149,944 | ) | — | — | (149,944 | ) | ||||||||||
| OTC Credit Default Swaps | — | (25,962 | ) | — | (25,962 | ) | ||||||||||
| Sales Commitments | — | (2,150,965 | ) | — | (2,150,965 | ) | ||||||||||
| Written Options | — | (188,907 | ) | — | (188,907 | ) | ||||||||||
| Total Liabilities | $ | (149,944 | ) | $ | (2,592,221 | ) | $ | — | $ | (2,742,165 | ) | |||||
| ^ | See Note 2, “Significant Accounting Policies” in the Notes to Financial Statements for additional information. |
| + | Other Financial Instruments may include open forward foreign currency contracts, futures, centrally cleared swaps, OTC swaps and written options. Forward foreign currency contracts, futures and centrally cleared swaps are fair valued at the unrealized appreciation (depreciation) on the instrument. OTC swaps and written options are valued at the fair value of the instrument. |
At June 30, 2024, the following forward foreign currency contracts were outstanding for VY® BlackRock Inflation Protected Bond Portfolio:
| Currency Purchased | Currency Sold | Counterparty | Settlement Date | Unrealized Appreciation (Depreciation) | ||||||||
| USD | 94,387 | JPY | 14,878,000 | Bank of America N.A. | 07/02/24 | $ | 1,914 | |||||
| USD | 75,149 | EUR | 70,000 | Bank of America N.A. | 07/02/24 | 182 | ||||||
| GBP | 409,000 | USD | 517,768 | Bank of America N.A. | 07/02/24 | (754 | ) | |||||
| JPY | 83,047,000 | USD | 517,569 | Bank of America N.A. | 07/02/24 | (1,396 | ) | |||||
| USD | 520,003 | JPY | 83,047,000 | Bank of America N.A. | 08/02/24 | 1,309 | ||||||
| USD | 517,857 | GBP | 409,000 | Bank of America N.A. | 08/02/24 | 740 | ||||||
| USD | 186,262 | BRL | 1,018,308 | Bank of America N.A. | 09/18/24 | 5,720 | ||||||
| USD | 39,996 | EUR | 37,000 | Barclays Bank PLC | 07/02/24 | 370 | ||||||
| USD | 51,447 | EUR | 48,000 | Barclays Bank PLC | 07/02/24 | 42 | ||||||
| USD | 1,600,839 | BRL | 8,736,802 | Barclays Bank PLC | 09/18/24 | 51,836 | ||||||
| USD | 432,464 | JPY | 68,169,000 | BNP Paribas | 07/02/24 | 8,765 | ||||||
| USD | 152,738 | MXN | 2,914,168 | Citibank N.A. | 09/18/24 | (4,589 | ) | |||||
| USD | 521,718 | GBP | 410,000 | Deutsche Bank AG | 07/02/24 | 3,439 | ||||||
| USD | 87,098 | EUR | 80,000 | Deutsche Bank AG | 07/02/24 | 1,421 | ||||||
| USD | 14,127 | EUR | 13,000 | Deutsche Bank AG | 07/02/24 | 205 | ||||||
See Accompanying Notes to Financial Statements
33
| VY® BlackRock Inflation Protected Bond Portfolio | PORTFOLIO OF INVESTMENTS |
| as of June 30, 2024 (Unaudited) (continued) |
| Currency Purchased | Currency Sold | Counterparty | Settlement Date | Unrealized Appreciation (Depreciation) | ||||||||
| USD | 43,633 | EUR | 40,000 | JPMorgan Chase Bank N.A. | 07/02/24 | $ | 795 | |||||
| EUR | 2,153,000 | USD | 2,308,960 | Nomura Securities International, Inc. | 07/02/24 | (3,203 | ) | |||||
| USD | 2,312,342 | EUR | 2,153,000 | Nomura Securities International, Inc. | 08/02/24 | 3,104 | ||||||
| USD | 2,079,715 | EUR | 1,918,000 | Standard Chartered Bank | 07/02/24 | 25,632 | ||||||
| USD | 99,853 | EUR | 93,000 | Standard Chartered Bank | 07/02/24 | 255 | ||||||
| EUR | 63,000 | USD | 67,865 | Westpac Banking Corp. | 07/02/24 | (395 | ) | |||||
| $ | 95,392 | |||||||||||
At June 30, 2024, the following futures contracts were outstanding for VY® BlackRock Inflation Protected Bond Portfolio:
| Description | Number of Contracts | Expiration Date | Notional Amount | Unrealized Appreciation/ (Depreciation) | |||||||||
| Long Contracts: | |||||||||||||
| U.S. Treasury 2-Year Note | 121 | 09/30/24 | $ | 24,710,469 | $ | (22,930 | ) | ||||||
| U.S. Treasury 5-Year Note | 156 | 09/30/24 | 16,626,187 | 45,302 | |||||||||
| $ | 41,336,656 | $ | 22,372 | ||||||||||
| Short Contracts: | |||||||||||||
| 3-month SOFR | (1 | ) | 12/17/24 | (237,125 | ) | 2,161 | |||||||
| Canada 10-Year Bond | (23 | ) | 09/18/24 | (2,018,647 | ) | 13,620 | |||||||
| Euro-Buxl 30-year German Government Bond | (3 | ) | 09/06/24 | (418,442 | ) | (9,484 | ) | ||||||
| U.S. Treasury 10-Year Note | (38 | ) | 09/19/24 | (4,179,406 | ) | (8,012 | ) | ||||||
| U.S. Treasury Long Bond | (50 | ) | 09/19/24 | (5,915,625 | ) | (45,478 | ) | ||||||
| U.S. Treasury Ultra 10-Year Note | (140 | ) | 09/19/24 | (15,894,375 | ) | 932 | |||||||
| U.S. Treasury Ultra Long Bond | (70 | ) | 09/19/24 | (8,774,062 | ) | (64,040 | ) | ||||||
| $ | (37,437,682 | ) | $ | (110,301 | ) | ||||||||
At June 30, 2024, the following over-the-counter credit default swaps were outstanding for VY® BlackRock Inflation Protected Bond Portfolio:
OTC Credit Default Swaps on Securities - Buy Protection(1)
| Counterparty | Reference Entity/ Obligation(2) | Buy/Sell Protection | (Pay)/ Receive Financing Rate (%) | Termination Date | Notional Amount(3) | Fair Value(4) | Upfront Payments Paid/ (Received) | Unrealized Appreciation/ (Depreciation) | |||||||||||||||||
| Goldman Sachs International | American Electric Power Company Inc. | Buy | (1.000) | 06/20/29 | USD | 102,522 | $ | (2,803 | ) | $ | (2,806 | ) | $ | 3 | |||||||||||
| Goldman Sachs International | American Electric Power Company Inc. | Buy | (1.000) | 06/20/29 | USD | 128,478 | (3,512 | ) | (3,516 | ) | 3 | ||||||||||||||
| Goldman Sachs International | American Electric Power Company Inc. | Buy | (1.000) | 06/20/29 | USD | 250,000 | (6,835 | ) | (6,842 | ) | 7 | ||||||||||||||
| Goldman Sachs International | American Express Co. | Buy | (1.000) | 06/20/29 | USD | 250,000 | (7,454 | ) | (7,297 | ) | (157 | ) | |||||||||||||
| Goldman Sachs International | Dominion Energy, Co. | Buy | (1.000) | 06/20/29 | USD | 233,000 | (5,358 | ) | (4,519 | ) | (839 | ) | |||||||||||||
| $ | (25,962 | ) | $ | (24,980 | ) | $ | (983 | ) | |||||||||||||||||
| (1) | If a Portfolio is a buyer of protection and a credit event occurs, as defined under the terms of that particular swap agreement, a Portfolio will either i) receive from the seller of protection an amount equal to the notional amount of the swap and deliver the referenced obligation, other deliverable obligations or underlying securities comprising the referenced index or ii) receive a net settlement amount in the form of cash or securities equal to the notional amount of the swap less the recovery value of the referenced obligation or underlying securities comprising the referenced index. |
| (2) | Payments made quarterly. |
| (3) | The maximum amount of future payments (undiscounted) that a Portfolio as seller of protection could be required to make or receive as a buyer of credit protection under a credit default swap agreement would be an amount equal to the notional amount of the agreement. |
| (4) | The fair values for credit default swap agreements serve as an indicator of the current status of the payment/performance risk and represent the likelihood or risk of default for the credit derivative. Increasing fair values, in absolute terms, when compared to the notional amount of the agreement, represent a deterioration of the referenced obligation’s credit soundness and a greater likelihood or risk of default or other credit event occurring. |
See Accompanying Notes to Financial Statements
34
| VY® BlackRock Inflation Protected Bond Portfolio | PORTFOLIO OF INVESTMENTS |
| as of June 30, 2024 (Unaudited) (continued) |
At June 30, 2024, the following centrally cleared credit default swaps were outstanding for VY® BlackRock Inflation Protected Bond Portfolio:
Centrally Cleared Credit Default Swaps on Credit Indices - Sell Protection(1)
| Reference Entity/Obligation | Buy/Sell Protection | (Pay)/ Receive Financing Rate (%)(2) | Termination Date | Notional Amount(3) | Fair Value(4) | Unrealized Appreciation/ (Depreciation) | |||||||||||||
| CDX North American High Yield Series 42, Version 1 | Sell | 5.000 | 06/20/29 | USD | 5,316,300 | $ | 331,899 | $ | (18,978 | ) | |||||||||
| $ | 331,899 | $ | (18,978 | ) | |||||||||||||||
| (1) | If the Portfolio is a seller of protection and a credit event occurs, as defined under the terms of that particular swap agreement, the Portfolio will generally either i) Pay to the buyer an amount equal to the notional amount of the swap and take delivery of the referenced obligation, other deliverable obligations, or underlying securities comprising the referenced index or ii) Pay a net settlement amount in the form of cash or securities equal to the notional amount of the swap less the recovery value of the referenced obligation or underlying securities comprising the referenced index. |
| (2) | Payments received quarterly. |
| (3) | The maximum amount of future payments (undiscounted) that a Portfolio as seller of protection could be required to make or receive as a buyer of credit protection under a credit default swap agreement would be an amount equal to the notional amount of the agreement. |
| (4) | The fair values for credit default swap agreements serve as an indicator of the current status of the payment/performance risk and represent the likelihood or risk of default for the credit derivative. Increasing fair values, in absolute terms, when compared to the notional amount of the agreement, represent a deterioration of the referenced obligation’s credit soundness and a greater likelihood or risk of default or other credit event occurring. |
At June 30, 2024, the following centrally cleared interest rate swaps were outstanding for VY® BlackRock Inflation Protected Bond Portfolio:
| Pay/Receive Floating Rate | Floating Rate Index | Floating Rate Index Payment Frequency | Fixed Rate | Fixed Rate Payment Frequency | Maturity Date | Notional Amount | Fair Value | Unrealized Appreciation/ (Depreciation) | |||||||||||||||
| Pay | 6-month EUR-EURIBOR | Semi-Annual | 2.441 | % | Annual | 06/24/54 | EUR | 62,000 | $ | (1,431 | ) | $ | (1,431 | ) | |||||||||
| Pay | 1-day Overnight Tokyo Average Rate | Annual | 0.853 | Annual | 03/11/34 | JPY | 34,090,000 | (3,527 | ) | (3,527 | ) | ||||||||||||
| Pay | 1-day Overnight Tokyo Average Rate | Annual | 0.990 | Annual | 05/21/34 | JPY | 34,330,000 | (1,112 | ) | (1,112 | ) | ||||||||||||
| Pay | 1-day Secured Overnight Financing Rate | Annual | 3.782 | Annual | 06/18/34 | USD | 472,963 | (5,637 | ) | (5,637 | ) | ||||||||||||
| Pay | 1-day Secured Overnight Financing Rate | Annual | 4.839 | Annual | 10/19/26 | USD | 3,810,000 | 28,345 | 28,345 | ||||||||||||||
| Pay | 1-day Secured Overnight Financing Rate | Annual | 4.562 | Annual | 10/12/26 | USD | 3,850,000 | 5,114 | 5,115 | ||||||||||||||
| Pay | 1-day Secured Overnight Financing Rate | Annual | 3.917 | Annual | 01/08/27 | USD | 8,300,000 | (101,280 | ) | (101,280 | ) | ||||||||||||
| Pay | 1-day Secured Overnight Financing Rate | Annual | 5.324 | Annual | 09/18/24 | USD | 81,000,000 | 1,938 | 1,938 | ||||||||||||||
| Pay | 1-day Secured Overnight Financing Rate | Annual | 5.309 | Annual | 09/18/24 | USD | 82,530,000 | 310 | 310 | ||||||||||||||
| Pay | 1-day Secured Overnight Financing Rate | Annual | 5.319 | Annual | 09/18/24 | USD | 82,530,000 | 1,475 | 1,475 | ||||||||||||||
| Pay | 1-day Secured Overnight Financing Rate | Annual | 5.321 | Annual | 09/18/24 | USD | 82,530,000 | 1,725 | 1,725 | ||||||||||||||
| Pay | 1-day Secured Overnight Financing Rate | Annual | 5.321 | Annual | 09/18/24 | USD | 82,530,000 | 1,697 | 1,697 | ||||||||||||||
| Receive | 6-month EUR-EURIBOR | Semi-Annual | 2.439 | Annual | 06/19/54 | EUR | 80,000 | 1,895 | 1,895 | ||||||||||||||
| Receive | 6-month EUR-EURIBOR | Semi-Annual | 2.406 | Annual | 06/20/54 | EUR | 83,000 | 2,554 | 2,554 | ||||||||||||||
| Receive | 6-month EUR-EURIBOR | Semi-Annual | 2.456 | Annual | 03/22/54 | EUR | 99,000 | 2,110 | 2,110 | ||||||||||||||
| Receive | 6-month EUR-EURIBOR | Semi-Annual | 2.511 | Annual | 03/01/54 | EUR | 235,000 | 2,255 | 2,255 | ||||||||||||||
| Receive | 6-month EUR-EURIBOR | Semi-Annual | 2.513 | Annual | 02/20/54 | EUR | 251,000 | 2,328 | 2,328 | ||||||||||||||
| Receive | 6-month EUR-EURIBOR | Semi-Annual | 2.543 | Annual | 04/22/54 | EUR | 382,000 | 756 | 1,549 | ||||||||||||||
| Receive | 6-month EUR-EURIBOR | Semi-Annual | 2.490 | Annual | 02/19/54 | EUR | 460,350 | 6,588 | 6,588 | ||||||||||||||
| Receive | 6-month EUR-EURIBOR | Semi-Annual | 2.506 | Annual | 02/20/54 | EUR | 460,350 | 5,018 | 5,018 | ||||||||||||||
| Receive | 1-day Overnight Tokyo Average Rate | Annual | 0.270 | Annual | 03/11/26 | JPY | 162,320,000 | 1,977 | 1,977 | ||||||||||||||
| Receive | 1-day Overnight Tokyo Average Rate | Annual | 0.408 | Annual | 05/21/26 | JPY | 163,110,000 | 142 | 142 | ||||||||||||||
| Receive | 1-day Secured Overnight Financing Rate | Annual | 5.092 | Annual | 10/19/25 | USD | 5,570,000 | (13,158 | ) | (13,158 | ) | ||||||||||||
| Receive | 1-day Secured Overnight Financing Rate | Annual | 4.852 | Annual | 10/12/25 | USD | 5,625,000 | 4,155 | 4,154 | ||||||||||||||
| $ | (55,763 | ) | $ | (54,970 | ) | ||||||||||||||||||
At June 30, 2024, the following centrally cleared inflation-linked swaps were outstanding for VY® BlackRock Inflation Protected Bond Portfolio:
| Pay/Receive Floating Rate | Floating Rate Index | Floating Rate Index Payment Frequency | Fixed Rate | Fixed Rate Payment Frequency | Maturity Date | Notional Amount | Fair Value | Unrealized Appreciation/ (Depreciation) | |||||||||||||||
| Pay | Eurostat Eurozone HICP ex Tobacco NSA (CPTFEMU) | At Termination Date | 2.133 | % | At Termination Date | 06/15/29 | EUR | 1,030,000 | $ | (59 | ) | $ | (59 | ) | |||||||||
See Accompanying Notes to Financial Statements
35
| VY® BlackRock Inflation Protected Bond Portfolio | PORTFOLIO OF INVESTMENTS |
| as of June 30, 2024 (Unaudited) (continued) |
| Pay/Receive Floating Rate | Floating Rate Index | Floating Rate Index Payment Frequency | Fixed Rate | Fixed Rate Payment Frequency | Maturity Date | Notional Amount | Fair Value | Unrealized Appreciation/ (Depreciation) | |||||||||||||||
| Pay | Eurostat Eurozone HICP ex Tobacco NSA (CPTFEMU) | At Termination Date | 2.780 | % | At Termination Date | 08/15/53 | EUR | 35,000 | $ | 3,530 | $ | 3,508 | |||||||||||
| Pay | Eurostat Eurozone HICP ex Tobacco NSA (CPTFEMU) | At Termination Date | 2.529 | At Termination Date | 11/15/53 | EUR | 70,000 | 1,445 | 1,445 | ||||||||||||||
| Pay | Eurostat Eurozone HICP ex Tobacco NSA (CPTFEMU) | At Termination Date | 2.640 | At Termination Date | 11/15/53 | EUR | 35,000 | 1,982 | 1,800 | ||||||||||||||
| Receive | U.K. Retail Price Index | At Termination Date | 3.884 | At Termination Date | 06/15/29 | GBP | 420,000 | 837 | 837 | ||||||||||||||
| Receive | U.S. CPI Urban Consumers NSA (CPURNSA) | At Termination Date | 3.563 | At Termination Date | 06/24/25 | USD | 4,900,000 | (395 | ) | (395 | ) | ||||||||||||
| Receive | U.S. CPI Urban Consumers NSA (CPURNSA) | At Termination Date | 3.100 | At Termination Date | 08/08/25 | USD | 2,200,000 | 4,581 | 4,581 | ||||||||||||||
| Receive | U.S. CPI Urban Consumers NSA (CPURNSA) | At Termination Date | 2.315 | At Termination Date | 11/14/25 | USD | 1,000,000 | 5,954 | 5,954 | ||||||||||||||
| Receive | U.S. CPI Urban Consumers NSA (CPURNSA) | At Termination Date | 2.197 | At Termination Date | 12/19/25 | USD | 1,000,000 | 8,227 | 8,227 | ||||||||||||||
| Receive | U.S. CPI Urban Consumers NSA (CPURNSA) | At Termination Date | 2.129 | At Termination Date | 01/09/26 | USD | 810,000 | 8,260 | 8,260 | ||||||||||||||
| Receive | U.S. CPI Urban Consumers NSA (CPURNSA) | At Termination Date | 2.089 | At Termination Date | 01/10/26 | USD | 1,615,000 | 17,526 | 17,526 | ||||||||||||||
| Receive | U.S. CPI Urban Consumers NSA (CPURNSA) | At Termination Date | 3.526 | At Termination Date | 04/08/26 | USD | 13,500,000 | 76,672 | 76,672 | ||||||||||||||
| Receive | U.S. CPI Urban Consumers NSA (CPURNSA) | At Termination Date | 2.590 | At Termination Date | 05/02/26 | USD | 2,105,000 | (1,059 | ) | (1,059 | ) | ||||||||||||
| Receive | U.S. CPI Urban Consumers NSA (CPURNSA) | At Termination Date | 3.270 | At Termination Date | 06/24/26 | USD | 6,500,000 | 9,704 | 9,704 | ||||||||||||||
| Receive | U.S. CPI Urban Consumers NSA (CPURNSA) | At Termination Date | 2.453 | At Termination Date | 08/11/26 | USD | 360,000 | 3,063 | 3,063 | ||||||||||||||
| Receive | U.S. CPI Urban Consumers NSA (CPURNSA) | At Termination Date | 2.925 | At Termination Date | 02/02/27 | USD | 3,400,000 | 121,551 | 121,551 | ||||||||||||||
| Receive | U.S. CPI Urban Consumers NSA (CPURNSA) | At Termination Date | 3.000 | At Termination Date | 02/25/27 | USD | 5,540,000 | 160,228 | 160,228 | ||||||||||||||
| Receive | U.S. CPI Urban Consumers NSA (CPURNSA) | At Termination Date | 3.213 | At Termination Date | 03/02/27 | USD | 1,350,000 | 23,638 | 23,638 | ||||||||||||||
| Receive | U.S. CPI Urban Consumers NSA (CPURNSA) | At Termination Date | 3.290 | At Termination Date | 03/07/27 | USD | 2,200,000 | 28,238 | 28,238 | ||||||||||||||
| Receive | U.S. CPI Urban Consumers NSA (CPURNSA) | At Termination Date | 3.646 | At Termination Date | 05/04/27 | USD | 2,500,000 | (38,850 | ) | (38,850 | ) | ||||||||||||
| Receive | U.S. CPI Urban Consumers NSA (CPURNSA) | At Termination Date | 2.903 | At Termination Date | 07/05/27 | USD | 2,025,000 | 21,834 | 21,834 | ||||||||||||||
| Receive | U.S. CPI Urban Consumers NSA (CPURNSA) | At Termination Date | 3.030 | At Termination Date | 08/02/27 | USD | 1,100,000 | (3,524 | ) | (5,921 | ) | ||||||||||||
| Receive | U.S. CPI Urban Consumers NSA (CPURNSA) | At Termination Date | 2.765 | At Termination Date | 09/23/27 | USD | 485,000 | (238 | ) | (238 | ) | ||||||||||||
| Receive | U.S. CPI Urban Consumers NSA (CPURNSA) | At Termination Date | 2.607 | At Termination Date | 12/12/27 | USD | 8,245,000 | 63,861 | 63,861 | ||||||||||||||
| Receive | U.S. CPI Urban Consumers NSA (CPURNSA) | At Termination Date | 2.613 | At Termination Date | 12/12/27 | USD | 1,295,000 | 9,657 | 9,657 | ||||||||||||||
| Receive | U.S. CPI Urban Consumers NSA (CPURNSA) | At Termination Date | 2.304 | At Termination Date | 01/30/28 | USD | 1,560,000 | 18,319 | 18,319 | ||||||||||||||
| Receive | U.S. CPI Urban Consumers NSA (CPURNSA) | At Termination Date | 2.440 | At Termination Date | 01/30/28 | USD | 2,300,000 | 31,300 | 41,531 | ||||||||||||||
| Receive | U.S. CPI Urban Consumers NSA (CPURNSA) | At Termination Date | 2.396 | At Termination Date | 02/20/28 | USD | 1,700,000 | 14,999 | 14,999 | ||||||||||||||
| Receive | U.S. CPI Urban Consumers NSA (CPURNSA) | At Termination Date | 2.432 | At Termination Date | 02/21/28 | USD | 910,000 | 6,905 | 6,905 | ||||||||||||||
| Receive | U.S. CPI Urban Consumers NSA (CPURNSA) | At Termination Date | 2.443 | At Termination Date | 03/08/28 | USD | 1,150,000 | 8,003 | 8,003 | ||||||||||||||
| Receive | U.S. CPI Urban Consumers NSA (CPURNSA) | At Termination Date | 2.401 | At Termination Date | 03/12/28 | USD | 1,150,000 | 9,570 | 9,570 | ||||||||||||||
| Receive | U.S. CPI Urban Consumers NSA (CPURNSA) | At Termination Date | 2.496 | At Termination Date | 05/08/28 | USD | 1,150,000 | 1,564 | 1,564 | ||||||||||||||
| Receive | U.S. CPI Urban Consumers NSA (CPURNSA) | At Termination Date | 2.348 | At Termination Date | 05/15/28 | USD | 1,000,000 | 15,524 | 15,524 | ||||||||||||||
| Receive | U.S. CPI Urban Consumers NSA (CPURNSA) | At Termination Date | 2.374 | At Termination Date | 06/20/28 | USD | 1,150,000 | 4,896 | 4,896 | ||||||||||||||
| Receive | U.S. CPI Urban Consumers NSA (CPURNSA) | At Termination Date | 2.624 | At Termination Date | 08/02/28 | USD | 1,670,000 | 3,470 | 3,470 | ||||||||||||||
| Receive | U.S. CPI Urban Consumers NSA (CPURNSA) | At Termination Date | 2.650 | At Termination Date | 10/20/28 | USD | 2,250,000 | (5,246 | ) | (298 | ) | ||||||||||||
See Accompanying Notes to Financial Statements
36
| VY® BlackRock Inflation Protected Bond Portfolio | PORTFOLIO OF INVESTMENTS |
| as of June 30, 2024 (Unaudited) (continued) |
| Pay/Receive Floating Rate | Floating Rate Index | Floating Rate Index Payment Frequency | Fixed Rate | Fixed Rate Payment Frequency | Maturity Date | Notional Amount | Fair Value | Unrealized Appreciation/ (Depreciation) | |||||||||||||||
| Receive | U.S. CPI Urban Consumers NSA (CPURNSA) | At Termination Date | 2.583 | % | At Termination Date | 11/02/28 | USD | 4,000,000 | $ | (623 | ) | $ | (623 | ) | |||||||||
| Receive | U.S. CPI Urban Consumers NSA (CPURNSA) | At Termination Date | 2.329 | At Termination Date | 01/15/29 | USD | 2,115,000 | 25,643 | 25,643 | ||||||||||||||
| Receive | U.S. CPI Urban Consumers NSA (CPURNSA) | At Termination Date | 2.386 | At Termination Date | 02/02/29 | USD | 1,850,000 | 18,962 | 21,745 | ||||||||||||||
| Receive | U.S. CPI Urban Consumers NSA (CPURNSA) | At Termination Date | 2.506 | At Termination Date | 03/25/29 | USD | 370,000 | 1,520 | 1,573 | ||||||||||||||
| Receive | U.S. CPI Urban Consumers NSA (CPURNSA) | At Termination Date | 2.563 | At Termination Date | 05/07/29 | USD | 1,135,000 | (1,283 | ) | (1,445 | ) | ||||||||||||
| Receive | U.S. CPI Urban Consumers NSA (CPURNSA) | At Termination Date | 2.502 | At Termination Date | 05/20/29 | USD | 1,400,000 | 1,384 | 1,384 | ||||||||||||||
| Receive | U.S. CPI Urban Consumers NSA (CPURNSA) | At Termination Date | 2.458 | At Termination Date | 07/01/29 | USD | 568,000 | 1,211 | 1,211 | ||||||||||||||
| Receive | U.S. CPI Urban Consumers NSA (CPURNSA) | At Termination Date | 2.890 | At Termination Date | 08/02/29 | USD | 2,100,000 | (6,558 | ) | (11,950 | ) | ||||||||||||
| Receive | U.S. CPI Urban Consumers NSA (CPURNSA) | At Termination Date | 2.583 | At Termination Date | 11/03/29 | USD | 935,000 | (439 | ) | (439 | ) | ||||||||||||
| Receive | U.S. CPI Urban Consumers NSA (CPURNSA) | At Termination Date | 2.480 | At Termination Date | 01/30/30 | USD | 1,200,000 | 15,220 | 22,735 | ||||||||||||||
| Receive | U.S. CPI Urban Consumers NSA (CPURNSA) | At Termination Date | 2.524 | At Termination Date | 03/30/30 | USD | 2,500,000 | 21,501 | 21,501 | ||||||||||||||
| Receive | U.S. CPI Urban Consumers NSA (CPURNSA) | At Termination Date | 3.087 | At Termination Date | 04/08/30 | USD | 550,000 | 615 | 615 | ||||||||||||||
| Receive | U.S. CPI Urban Consumers NSA (CPURNSA) | At Termination Date | 2.535 | At Termination Date | 10/11/30 | USD | 2,240,000 | 8,721 | 8,721 | ||||||||||||||
| Receive | U.S. CPI Urban Consumers NSA (CPURNSA) | At Termination Date | 2.633 | At Termination Date | 11/02/30 | USD | 1,200,000 | (4,835 | ) | (4,835 | ) | ||||||||||||
| Receive | U.S. CPI Urban Consumers NSA (CPURNSA) | At Termination Date | 2.593 | At Termination Date | 11/06/30 | USD | 1,200,000 | (1,833 | ) | (1,833 | ) | ||||||||||||
| Receive | U.S. CPI Urban Consumers NSA (CPURNSA) | At Termination Date | 2.482 | At Termination Date | 11/17/30 | USD | 1,150,000 | 5,927 | 5,927 | ||||||||||||||
| Receive | U.S. CPI Urban Consumers NSA (CPURNSA) | At Termination Date | 2.430 | At Termination Date | 02/02/31 | USD | 1,800,000 | 17,985 | 17,539 | ||||||||||||||
| Receive | U.S. CPI Urban Consumers NSA (CPURNSA) | At Termination Date | 2.550 | At Termination Date | 05/07/49 | USD | 280,000 | (2,982 | ) | (2,982 | ) | ||||||||||||
| Receive | U.S. CPI Urban Consumers NSA (CPURNSA) | At Termination Date | 2.475 | At Termination Date | 12/18/53 | USD | 225,000 | 1,342 | 1,342 | ||||||||||||||
| $ | 737,445 | $ | 754,374 | ||||||||||||||||||||
At June 30, 2024, the following OTC purchased foreign currency options were outstanding for VY® BlackRock Inflation Protected Bond Portfolio:
| Description | Counterparty | Expiration Date | Exercise Price | Notional Amount | Cost | Fair Value | ||||||||||||||
| Call USD vs. Put CNH | Bank of America N.A. | 03/06/26 | 7.750 | USD | 5,978,000 | $ | 43,639 | $ | 44,442 | |||||||||||
| $ | 43,639 | $ | 44,442 | |||||||||||||||||
At June 30, 2024, the following OTC purchased interest rate swaptions were outstanding for VY® BlackRock Inflation Protected Bond Portfolio:
| Description | Counterparty | Pay/ Receive Exercise Rate | Exercise Rate | Floating Rate Index | Expiration Date | Notional Amount | Cost | Fair Value | |||||||||||||||
| Call on 1-Year Interest Rate Swap(1) | Barclays Bank PLC | Receive | 4.542 | % | 1-day Secured Overnight Financing Rate | 10/16/24 | USD | 46,330,000 | $ | 94,667 | $ | 59,913 | |||||||||||
| Call on 1-Year Interest Rate Swap(1) | Goldman Sachs International | Receive | 4.542 | % | 1-day Secured Overnight Financing Rate | 10/16/24 | USD | 23,229,000 | 47,416 | 30,039 | |||||||||||||
| Put on 10-Year Interest Rate Swap(2) | Goldman Sachs International | Pay | 4.430 | % | 1-day Secured Overnight Financing Rate | 10/17/24 | USD | 1,286,000 | 19,017 | 5,817 | |||||||||||||
| Put on 10-Year Interest Rate Swap(2) | Goldman Sachs International | Pay | 4.430 | % | 1-day Secured Overnight Financing Rate | 10/17/24 | USD | 2,572,000 | 41,581 | 12,604 | |||||||||||||
| Put on 30-Year Interest Rate Swap(2) | Citibank N.A. | Pay | 3.393 | % | 1-day Secured Overnight Financing Rate | 12/18/24 | USD | 1,134,000 | 23,273 | 29,907 | |||||||||||||
| $ | 225,954 | $ | 138,280 | ||||||||||||||||||||
See Accompanying Notes to Financial Statements
37
| VY® BlackRock Inflation Protected Bond Portfolio | PORTFOLIO OF INVESTMENTS |
| as of June 30, 2024 (Unaudited) (continued) |
At June 30, 2024, the following OTC written interest rate swaptions were outstanding for VY® BlackRock Inflation Protected Bond Portfolio:
| Description | Counterparty | Pay/Receive Exercise Rate | Exercise Rate | Floating Rate Index | Expiration Date | Notional Amount | Premiums Received | Fair Value | |||||||||||||||
| Call on 10-Year Interest Rate Swap(2) | Bank of America N.A. | Pay | 3.825 | % | 1-day Secured Overnight Financing Rate | 09/17/24 | USD | 639,000 | $ | 10,448 | $ | (8,382 | ) | ||||||||||
| Call on 10-Year Interest Rate Swap(2) | Citibank N.A. | Pay | 3.885 | % | 1-day Secured Overnight Financing Rate | 09/13/24 | USD | 1,277,000 | 19,410 | (19,141 | ) | ||||||||||||
| Call on 10-Year Interest Rate Swap(2) | Deutsche Bank AG | Pay | 3.858 | % | 1-day Secured Overnight Financing Rate | 09/12/24 | USD | 2,554,000 | 39,076 | (35,231 | ) | ||||||||||||
| Call on 1-Year Interest Rate Swap(2) | Barclays Bank PLC | Pay | 3.842 | % | 1-day Secured Overnight Financing Rate | 10/16/24 | USD | 46,330,000 | 38,410 | (12,853 | ) | ||||||||||||
| Call on 1-Year Interest Rate Swap(2) | Goldman Sachs International | Pay | 3.842 | % | 1-day Secured Overnight Financing Rate | 10/16/24 | USD | 23,229,000 | 19,280 | (6,444 | ) | ||||||||||||
| Put on 10-Year Interest Rate Swap(1) | Bank of America N.A. | Receive | 3.825 | % | 1-day Secured Overnight Financing Rate | 09/17/24 | USD | 639,000 | 10,448 | (11,483 | ) | ||||||||||||
| Put on 10-Year Interest Rate Swap(1) | Citibank N.A. | Receive | 3.885 | % | 1-day Secured Overnight Financing Rate | 09/13/24 | USD | 1,277,000 | 19,410 | (19,218 | ) | ||||||||||||
| Put on 10-Year Interest Rate Swap(1) | Deutsche Bank AG | Receive | 3.858 | % | 1-day Secured Overnight Financing Rate | 09/12/24 | USD | 2,554,000 | 39,076 | (41,097 | ) | ||||||||||||
| Put on 1-Year Interest Rate Swap(1) | Goldman Sachs International | Receive | 5.100 | % | 1-day Secured Overnight Financing Rate | 10/17/24 | USD | 21,608,000 | 37,985 | (10,058 | ) | ||||||||||||
| Put on 1-Year Interest Rate Swap(1) | Goldman Sachs International | Receive | 5.100 | % | 1-day Secured Overnight Financing Rate | 10/17/24 | USD | 10,804,000 | 17,744 | (5,029 | ) | ||||||||||||
| Put on 30-Year Interest Rate Swap(1) | Citibank N.A. | Receive | 3.860 | % | 1-day Secured Overnight Financing Rate | 09/18/24 | USD | 1,134,000 | 14,202 | (19,971 | ) | ||||||||||||
| $ | 265,489 | $ | (188,907 | ) | |||||||||||||||||||
| (1) | Portfolio pays the exercise rate semi-annually and receives the floating rate index quarterly. |
| (2) | Portfolio receives the exercise rate semi-annually and pays the floating rate index quarterly. |
The following sales commitments were held by the VY® BlackRock Inflation Protected Bond Portfolio at June 30, 2024:
| Contractual | ||||||||||
| Principal Amount | Description | Settlement Date | Fair Value | |||||||
| $ | (152,000 | ) | Uniform Mortgage-Backed Securities, 1.500%, due 07/15/39 | 07/18/24 | $ | (129,984 | ) | |||
| (157,200 | ) | Uniform Mortgage-Backed Securities, 1.500%, due 07/15/54 | 07/15/24 | (117,249 | ) | |||||
| (335,000 | ) | Uniform Mortgage-Backed Securities, 2.000%, due 07/15/39 | 07/18/24 | (294,433 | ) | |||||
| (617,290 | ) | Uniform Mortgage-Backed Securities, 2.000%, due 07/15/54 | 07/15/24 | (482,885 | ) | |||||
| (180,000 | ) | Uniform Mortgage-Backed Securities, 2.500%, due 07/15/39 | 07/18/24 | (162,562 | ) | |||||
| (350,600 | ) | Uniform Mortgage-Backed Securities, 2.500%, due 07/15/54 | 07/15/24 | (286,328 | ) | |||||
| (73,000 | ) | Uniform Mortgage-Backed Securities, 3.000%, due 07/15/39 | 07/18/24 | (67,537 | ) | |||||
| (212,000 | ) | Uniform Mortgage-Backed Securities, 3.000%, due 07/01/54 | 07/15/24 | (180,366 | ) | |||||
| (47,000 | ) | Uniform Mortgage-Backed Securities, 3.500%, due 07/15/39 | 07/18/24 | (44,443 | ) | |||||
| (11,000 | ) | Uniform Mortgage-Backed Securities, 3.500%, due 07/01/54 | 07/15/24 | (9,737 | ) | |||||
| (229,700 | ) | Uniform Mortgage-Backed Securities, 4.000%, due 07/01/54 | 07/15/24 | (210,202 | ) | |||||
| (84,200 | ) | Uniform Mortgage-Backed Securities, 4.500%, due 07/01/54 | 07/15/24 | (79,388 | ) | |||||
| (85,600 | ) | Uniform Mortgage-Backed Securities, 6.000%, due 07/01/54 | 07/15/24 | (85,851 | ) | |||||
| Total Sales Commitments | ||||||||||
| Proceeds receivable $(2,150,430) | $ | (2,150,965 | ) | |||||||
| Currency Abbreviations: | ||
| BRL | — | Brazilian Real |
| EUR | — | EU Euro |
| GBP | — | British Pound |
| Currency Abbreviations: | ||
| JPY | — | Japanese Yen |
| MXN | — | Mexican Peso |
| USD | — | United States Dollar |
See Accompanying Notes to Financial Statements
38
| VY® BlackRock Inflation Protected Bond Portfolio | PORTFOLIO OF INVESTMENTS |
| as of June 30, 2024 (Unaudited) (continued) |
A summary of derivative instruments by primary risk exposure is outlined in the following tables.
The fair value of derivative instruments as of June 30, 2024 was as follows:
| Derivatives not accounted for as hedging instruments | Location on Statement of Assets and Liabilities | Fair Value | ||||
| Asset Derivatives | ||||||
| Foreign exchange contracts | Investments in securities at value* | $ | 44,442 | |||
| Interest rate contracts | Investments in securities at value* | 138,280 | ||||
| Foreign exchange contracts | Unrealized appreciation on forward foreign currency contracts | 105,729 | ||||
| Interest rate contracts | Variation margin receivable on futures contracts** | 62,015 | ||||
| Interest rate contracts | Variation margin receivable on centrally cleared swaps** | 896,476 | ||||
| Credit contracts | Unrealized appreciation on OTC swap agreements | 13 | ||||
| Total Asset Derivatives | $ | 1,246,955 | ||||
| Liability Derivatives | ||||||
| Foreign exchange contracts | Unrealized depreciation on forward foreign currency contracts | $ | 10,337 | |||
| Interest rate contracts | Variation margin payable on futures contracts** | 149,944 | ||||
| Credit contracts | Variation margin payable on centrally cleared swaps** | 18,978 | ||||
| Interest rate contracts | Variation margin payable on centrally cleared swaps** | 197,072 | ||||
| Credit contracts | Upfront payments received on OTC swap agreements | 24,980 | ||||
| Credit contracts | Unrealized depreciation on OTC swap agreements | 996 | ||||
| Interest rate contracts | Written options, at fair value | 188,907 | ||||
| Total Liability Derivatives | $ | 591,214 | ||||
| * | Includes purchased options. |
| ** | The fair value presented above represents the cumulative unrealized appreciation (depreciation) on futures contracts and centrally cleared swaps as reported in the tables within the Portfolio of Investments. In the Statement of Assets and Liabilities, only current day’s unsettled variation margin is reported in receivables or payables on futures contracts and centrally cleared swaps and the net cumulative unrealized appreciation (depreciation) is included in total distributable earnings (loss). |
The effect of derivative instruments on the Portfolio's Statement of Operations for the period ended June 30, 2024 was as follows:
Amount of Realized Gain or (Loss) on Derivatives Recognized in Income
| Derivatives not accounted for as hedging instruments | Investments* | Forward foreign currency contracts | Futures | Swaps | Written options | Total | ||||||||||||||||||
| Credit contracts | $ | — | $ | — | $ | — | $ | 110,474 | $ | — | $ | 110,474 | ||||||||||||
| Foreign exchange contracts | (13,315 | ) | 129,654 | — | — | 7,926 | 124,265 | |||||||||||||||||
| Interest rate contracts | (436,473 | ) | — | (292,551 | ) | 359,062 | 280,604 | (89,358 | ) | |||||||||||||||
| Total | $ | (449,788 | ) | $ | 129,654 | $ | (292,551 | ) | $ | 469,536 | $ | 288,530 | $ | 145,381 | ||||||||||
Change in Unrealized Appreciation or (Depreciation) on Derivatives Recognized in Income
| Derivatives not accounted for as hedging instruments | Investments* | Forward foreign currency contracts | Futures | Swaps | Written options | Total | ||||||||||||||||||
| Credit contracts | $ | — | $ | — | $ | — | $ | (15,319 | ) | $ | — | $ | (15,319 | ) | ||||||||||
| Foreign exchange contracts | 803 | 94,107 | — | — | — | 94,910 | ||||||||||||||||||
| Interest rate contracts | (144,890 | ) | — | 2,097,538 | 721,684 | 145,879 | 2,820,212 | |||||||||||||||||
| Total | $ | (144,087 | ) | $ | 94,107 | $ | 2,097,538 | $ | 706,365 | $ | 145,879 | $ | 2,899,803 | |||||||||||
| * | Amounts recognized for purchased options are included in net realized gain (loss) on investments and net change in unrealized appreciation or depreciation on investments. |
See Accompanying Notes to Financial Statements
39
| VY® BlackRock Inflation Protected Bond Portfolio | PORTFOLIO OF INVESTMENTS |
| as of June 30, 2024 (Unaudited) (continued) |
The following is a summary by counterparty of the fair value of OTC derivative instruments subject to Master Netting Agreements and collateral pledged (received), if any, at June 30, 2024:
| Bank of America N.A. | Barclays Bank PLC | BNP Paribas | Citibank N.A. | Deutsche Bank AG | Goldman Sachs International | JPMorgan Chase Bank N.A. | Nomura Securities International, Inc. | Standard Chartered Bank | Westpac Banking Corp. | Total | ||||||||||||||||||||||||||||||||||
| Assets: | ||||||||||||||||||||||||||||||||||||||||||||
| Purchased options | $ | 44,442 | $ | 59,913 | $ | — | $ | 29,907 | $ | — | $ | 48,460 | $ | — | $ | — | $ | — | $ | — | $ | 182,722 | ||||||||||||||||||||||
| Forward foreign currency contracts | 9,865 | 52,248 | 8,765 | — | 5,065 | — | 795 | 3,104 | 25,887 | — | 105,729 | |||||||||||||||||||||||||||||||||
| Total Assets | $ | 54,307 | $ | 112,161 | $ | 8,765 | $ | 29,907 | $ | 5,065 | $ | 48,460 | $ | 795 | $ | 3,104 | $ | 25,887 | $ | — | $ | 288,451 | ||||||||||||||||||||||
| Liabilities: | ||||||||||||||||||||||||||||||||||||||||||||
| Forward foreign currency contracts | $ | 2,150 | $ | — | $ | — | $ | 4,589 | $ | — | $ | — | $ | — | $ | 3,203 | $ | — | $ | 395 | $ | 10,337 | ||||||||||||||||||||||
| OTC credit default swaps | — | — | — | — | — | 25,963 | — | — | — | — | 25,963 | |||||||||||||||||||||||||||||||||
| Written options | 19,865 | 12,853 | — | 58,330 | 76,328 | 21,531 | — | — | — | — | 188,907 | |||||||||||||||||||||||||||||||||
| Total Liabilities | $ | 22,015 | $ | 12,853 | $ | — | $ | 62,919 | $ | 76,328 | $ | 47,494 | $ | — | $ | 3,203 | $ | — | $ | 395 | $ | 225,207 | ||||||||||||||||||||||
| Net OTC derivative instruments by counterparty, at fair value | $ | 32,292 | $ | 99,308 | $ | 8,765 | $ | (33,012 | ) | $ | (71,263 | ) | $ | 966 | $ | 795 | $ | (99 | ) | $ | 25,887 | $ | (395 | ) | $ | 63,244 | ||||||||||||||||||
| Total collateral pledged by the Portfolio/(Received from counterparty) | $ | (20,000 | ) | $ | (50,000 | ) | $ | — | $ | — | $ | — | $ | (966 | ) | $ | — | $ | — | $ | — | $ | — | $ | (70,966 | ) | ||||||||||||||||||
| Net Exposure(1)(2) | $ | 12,292 | $ | 49,308 | $ | 8,765 | $ | (33,012 | ) | $ | (71,263 | ) | $ | — | $ | 795 | $ | (99 | ) | $ | 25,887 | $ | (395 | ) | $ | (7,722 | ) | |||||||||||||||||
| (1) | Positive net exposure represents amounts due from each respective counterparty. Negative exposure represents amounts due from the Portfolio. Please refer to Note 2 for additional details regarding counterparty credit risk and credit related contingent features. |
| (2) | At June 30, 2024, the Portfolio had received $10,000 in cash collateral from Goldman Sachs International. Excess cash collateral is not shown for financial reporting purposes. |
At June 30, 2024, the aggregate cost of securities and other investments and the composition of unrealized appreciation and depreciation of securities and other investments on a tax basis were:
| Cost for federal income tax purposes was $228,915,032. | ||||
| Net unrealized depreciation consisted of: | ||||
| Gross Unrealized Appreciation | $ | 1,627,356 | ||
| Gross Unrealized Depreciation | (16,508,107 | ) | ||
| Net Unrealized Depreciation | $ | (14,880,751 | ) | |
See Accompanying Notes to Financial Statements
40
| VY® BrandywineGLOBAL - Bond Portfolio | PORTFOLIO OF INVESTMENTS |
| as of June 30, 2024 (Unaudited) |
| Principal Amount† | Value | Percentage of Net Assets | |||||||||
| U.S. GOVERNMENT AGENCY OBLIGATIONS: 47.9% | |||||||||||
| Federal Home Loan Banks: 7.2% | |||||||||||
| 15,100,000 | 4.875%, 09/13/2024 | $ | 15,080,143 | 7.2 | |||||||
| Government National Mortgage Association: 19.7% | |||||||||||
| 5,437,987 | 5.000%, 02/20/2053 | 5,301,453 | 2.5 | ||||||||
| 3,421,093 | 5.000%, 06/20/2053 | 3,332,590 | 1.6 | ||||||||
| 3,105,715 | 5.500%, 02/20/2053 | 3,083,887 | 1.5 | ||||||||
| 5,053,598 | 5.500%, 04/20/2053 | 5,018,081 | 2.4 | ||||||||
| 6,407,529 | 5.500%, 05/20/2053 | 6,363,856 | 3.0 | ||||||||
| 2,804,439 | 5.500%, 06/20/2053 | 2,784,748 | 1.3 | ||||||||
| 5,692,869 | 5.500%, 09/20/2053 | 5,651,969 | 2.7 | ||||||||
| 6,200,850 | 5.500%, 10/20/2053 | 6,156,300 | 3.0 | ||||||||
| 3,513,416 | 5.500%, 02/20/2054 | 3,488,174 | 1.7 | ||||||||
| 41,181,058 | 19.7 | ||||||||||
| Uniform Mortgage-Backed Securities: 21.0% | |||||||||||
| 14,370,956 | 4.000%, 06/01/2052 | 13,165,960 | 6.3 | ||||||||
| 4,283,410 | 4.500%, 09/01/2052 | 4,042,664 | 1.9 | ||||||||
| 5,799,067 | 4.500%, 09/01/2052 | 5,473,797 | 2.6 | ||||||||
| 3,116,206 | 4.500%, 10/01/2052 | 2,941,358 | 1.4 | ||||||||
| 7,843,343 | 5.000%, 11/01/2052 | 7,603,392 | 3.6 | ||||||||
| 5,747,991 | 5.000%, 02/01/2053 | 5,563,025 | 2.7 | ||||||||
| 5,201,054 | 5.500%, 11/01/2052 | 5,150,301 | 2.5 | ||||||||
| 43,940,497 | 21.0 | ||||||||||
| Total U.S. Government Agency Obligations (Cost $102,073,489) | 100,201,698 | 47.9 | |||||||||
| U.S. TREASURY OBLIGATIONS: 45.1% | |||||||||||
| United States Treasury Bonds: 14.9% | |||||||||||
| 41,260,000 | 3.000%, 08/15/2052 | 31,048,150 | 14.9 | ||||||||
| United States Treasury Notes: 30.2% | |||||||||||
| 65,650,000 | 3.875%, 08/15/2033 | 63,172,738 | 30.2 | ||||||||
| Total U.S. Treasury Obligations (Cost $95,668,370) | 94,220,888 | 45.1 | |||||||||
| CORPORATE BONDS/NOTES: 2.7% | |||||||||||
| Consumer, Cyclical: 1.7% | |||||||||||
| 3,740,000 | Toyota Motor Credit Corp., 4.450%, 05/18/2026 | 3,693,661 | 1.7 | ||||||||
| Energy: 0.2% | |||||||||||
| 360,000 | Devon Energy Corp., 7.875%, 09/30/2031 | 407,060 | 0.2 | ||||||||
| Financial: 0.8% | |||||||||||
| 1,765,000 | Golub Capital BDC, Inc., 2.500%, 08/24/2026 | 1,624,002 | 0.8 | ||||||||
| Total Corporate Bonds/ Notes (Cost $5,871,589) | 5,724,723 | 2.7 | |||||||||
| Total Long-Term Investments (Cost $203,613,448) | 200,147,309 | 95.7 | |||||||||
| Shares | RA | Value | Percentage of Net Assets | ||||||||
| SHORT-TERM INVESTMENTS: 1.8% | |||||||||||
| Mutual Funds: 1.8% | |||||||||||
| 3,773,901 (1) | BlackRock Liquidity Funds, FedFund, Institutional Class, 5.210% (Cost $3,773,901) | $ | 3,773,901 | 1.8 | |||||||
| Total Short-Term Investments (Cost $3,773,901) | $ | 3,773,901 | 1.8 | ||||||||
| Total Investments in Securities (Cost $207,387,349) | $ | 203,921,210 | 97.5 | ||||||||
| Assets in Excess of Other Liabilities | 5,187,725 | 2.5 | |||||||||
| Net Assets | $ | 209,108,935 | 100.0 | ||||||||
| † | Unless otherwise indicated, principal amount is shown in USD. |
| (1) | Rate shown is the 7-day yield as of June 30, 2024. |
See Accompanying Notes to Financial Statements
41
| VY® BrandywineGLOBAL - Bond Portfolio | PORTFOLIO OF INVESTMENTS |
| as of June 30, 2024 (Unaudited) (continued) |
Fair Value Measurements^
The following is a summary of the fair valuations according to the inputs used as of June 30, 2024 in valuing the assets and liabilities:
| Quoted Prices in Active Markets for Identical Investments (Level 1) | Significant Other Observable Inputs (Level 2) | Significant Unobservable Inputs (Level 3) | Fair Value at June 30, 2024 | |||||||||||||
| Asset Table | ||||||||||||||||
| Investments, at fair value | ||||||||||||||||
| U.S. Government Agency Obligations | $ | — | $ | 100,201,698 | $ | — | $ | 100,201,698 | ||||||||
| U.S. Treasury Obligations | — | 94,220,888 | — | 94,220,888 | ||||||||||||
| Corporate Bonds/Notes | — | 5,724,723 | — | 5,724,723 | ||||||||||||
| Short-Term Investments | 3,773,901 | — | — | 3,773,901 | ||||||||||||
| Total Investments, at fair value | $ | 3,773,901 | $ | 200,147,309 | $ | — | $ | 203,921,210 | ||||||||
| Other Financial Instruments+ | ||||||||||||||||
| Futures | 1,349,004 | — | — | 1,349,004 | ||||||||||||
| Total Assets | $ | 5,122,905 | $ | 200,147,309 | $ | — | $ | 205,270,214 | ||||||||
| ^ | See Note 2, “Significant Accounting Policies” in the Notes to Financial Statements for additional information. |
| + | Other Financial Instruments may include open forward foreign currency contracts, futures, centrally cleared swaps, OTC swaps and written options. Forward foreign currency contracts, futures and centrally cleared swaps are fair valued at the unrealized appreciation (depreciation) on the instrument. OTC swaps and written options are valued at the fair value of the instrument. |
At June 30, 2024, the following futures contracts were outstanding for VY® BrandywineGLOBAL- Bond Portfolio:
| Description | Number of Contracts | Expiration Date | Notional Amount | Unrealized Appreciation | ||||||||||
| Long Contracts: | ||||||||||||||
| U.S. Treasury 5-Year Note | 1,044 | 09/30/24 | $ | 111,267,563 | $ | 1,129,189 | ||||||||
| U.S. Treasury Ultra 10-Year Note | 360 | 09/19/24 | 40,871,250 | 219,815 | ||||||||||
| $ | 152,138,813 | $ | 1,349,004 | |||||||||||
A summary of derivative instruments by primary risk exposure is outlined in the following tables.
The fair value of derivative instruments as of June 30, 2024 was as follows:
| Derivatives not accounted for as hedging instruments | Location on Statement of Assets and Liabilities | Fair Value | ||||
| Asset Derivatives | ||||||
| Interest rate contracts | Variation margin receivable on futures contracts* | $ | 1,349,004 | |||
| Total Asset Derivatives | $ | 1,349,004 | ||||
| * | The fair value presented above represents the cumulative unrealized appreciation (depreciation) on futures contracts as reported in the tables within the Portfolio of Investments. In the Statement of Assets and Liabilities, only current day’s unsettled variation margin is reported in receivables or payables on futures contracts and the net cumulative unrealized appreciation (depreciation) is included in total distributable earnings (loss). |
The effect of derivative instruments on the Portfolio's Statement of Operations for the period ended June 30, 2024 was as follows:
Amount of Realized Gain or (Loss) on Derivatives Recognized in Income
| Derivatives not accounted for as hedging instruments | Futures | |||
| Interest rate contracts | $ | (2,574,834 | ) | |
| Total | $ | (2,574,834 | ) | |
See Accompanying Notes to Financial Statements
42
| VY® BrandywineGLOBAL - Bond Portfolio | PORTFOLIO OF INVESTMENTS |
| as of June 30, 2024 (Unaudited) (continued) |
Change in Unrealized Appreciation or (Depreciation) on Derivatives Recognized in Income
| Derivatives not accounted for as hedging instruments | Futures | |||
| Interest rate contracts | $ | (2,159,120 | ) | |
| Total | $ | (2,159,120 | ) | |
At June 30, 2024, the aggregate cost of securities and other investments and the composition of unrealized appreciation and depreciation of securities and other investments on a tax basis were:
| Cost for federal income tax purposes was $209,480,380. | ||||
| Net unrealized depreciation consisted of: | ||||
| Gross Unrealized Appreciation | $ | 361,199 | ||
| Gross Unrealized Depreciation | (4,571,366 | ) | ||
| Net Unrealized Depreciation | $ | (4,210,167 | ) | |
See Accompanying Notes to Financial Statements
43
[This Page Intentionally Left Blank]
| Investment Adviser | Custodian |
Voya Investments, LLC 7337 East Doubletree Ranch Road, Suite 100 Scottsdale, Arizona 85258 | The Bank of New York Mellon 225 Liberty Street New York, New York 10286 |
| Distributor | Legal Counsel |
Voya Investments Distributor, LLC 7337 East Doubletree Ranch Road, Suite 100 Scottsdale, Arizona 85258 | Ropes & Gray LLP Prudential Tower 800 Boylston Street Boston, Massachusetts 02199 |
| Transfer Agent | |
BNY Mellon Investment Servicing (U.S.) Inc. 301 Bellevue Parkway Wilmington, Delaware 19809 | |
Before investing, carefully consider the investment objectives, risks, charges and expenses of the variable annuity contract or variable life insurance policy and the underlying variable investment options. This and other information is contained in the prospectus for the variable annuity contract or variable life insurance policy and the underlying variable investment options. Obtain these prospectuses from your agent/registered representative and read them carefully before investing.
VPSAR-VIT3AIS (0624)
Item 8. Changes in and Disagreements with Accountants for Open-End Management Investment Companies.
Included under Item 7.
Item 9. Proxy Disclosures for Open-End Management Investment Companies.
Included under Item 7.
Item 10. Remuneration Paid to Directors, Officers, and Others of Open-End Management Investment Companies.
Included under Item 7.
Item 11. Statement Regarding Basis for Approval of Investment Advisory Contract.
Included under Item 7.
Item 12. Disclosure of Proxy Voting Policies and Procedures for Closed-End Management Investment Companies.
Not applicable.
Item 13. Portfolio Managers of Closed-End Management Investment Companies.
Not applicable.
Item 14. Purchases of Equity Securities by Closed-End Management Investment Company and Affiliated Purchasers.
Not applicable.
Item 15. Submission of Matters to a Vote of Security Holders.
There have been no material changes to the procedures by which the shareholders may recommend nominees to the registrant’s board of directors, where those changes were implemented after the registrant last provided disclosure in response to the requirements of Item 407(c)(2)(iv) of Regulation S-K (17 CFR 229.407) (as required by Item 22(b)(15) of Schedule 14A (17 CFR 240.14a-101)), or this Item.
Item 16. Controls and Procedures.
| (a) | Based on our evaluation conducted within 90 days of the filing date, hereof, the design and operation of the registrant’s disclosure controls and procedures are effective to ensure that material information relating to the registrant is made known to the certifying officers by others within the appropriate entities, particularly during the period in which Forms N-CSR are being prepared, and the registrant’s disclosure controls and procedures allow timely preparation and review of the information for the registrant’s Form N-CSR and the officer certifications of such Form N-CSR. |
| (b) | There were no significant changes in the registrant’s internal controls that occurred during the period covered by this report that has materially affected, or is reasonably likely to materially affect, the registrant’s internal control over financial reporting. |
Item 17. Disclosure of Securities Lending Activities for Closed-End Management Investment Companies.
Not applicable.
Item 18. Recovery of Erroneously Awarded Compensation.
Not Applicable.
Item 19. Exhibits.
| (a)(1) | The Code of Ethics is not required for the semi-annual filing. |
| (a)(2) | Not applicable. |
| (a)(3)(1) | Not applicable. |
| (a)(3)(2) | Not applicable. |
| (b) | The officer certifications required by Section 906 of the Sarbanes-Oxley Act of 2002 are attached hereto as EX-99.906CERT. |
SIGNATURES
Pursuant to the requirements of the Securities Exchange Act of 1934 and the Investment Company Act of 1940, the registrant has duly caused this report to be signed on its behalf by the undersigned, thereunto duly authorized.
| (Registrant): Voya Variable Insurance Trust | ||
| By | /s/ Andy Simonoff | |
| Andy Simonoff | ||
| Chief Executive Officer | ||
| Date: September 5, 2024 | ||
Pursuant to the requirements of the Securities Exchange Act of 1934 and the Investment Company Act of 1940, this report has been signed below by the following persons on behalf of the registrant and in the capacities and on the dates indicated.
| By | /s/ Andy Simonoff | |
| Andy Simonoff | ||
| Chief Executive Officer | ||
| Date: September 5, 2024 | ||
| By | /s/ Todd Modic | |
| Todd Modic | ||
| Principal Financial Officer | ||
| Date: September 5, 2024 | ||