Exhibit 99.2
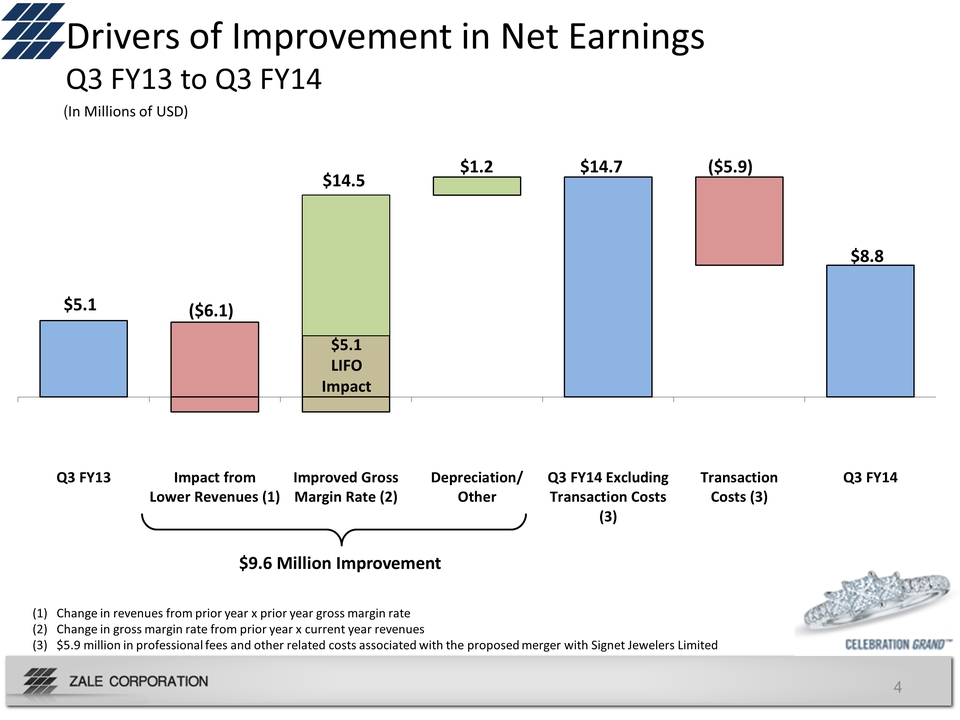
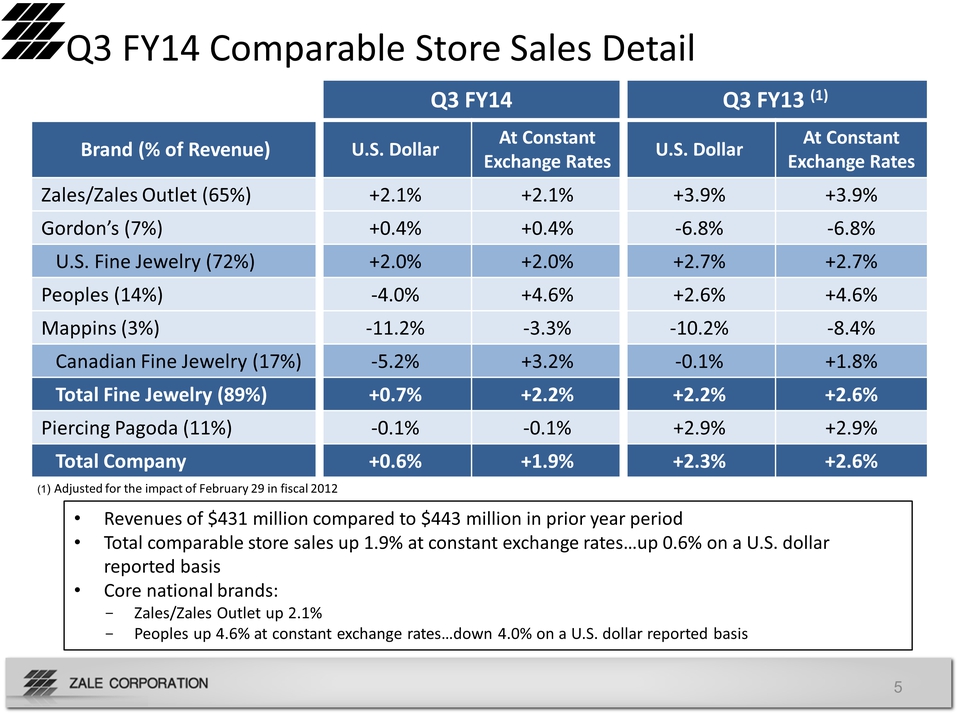
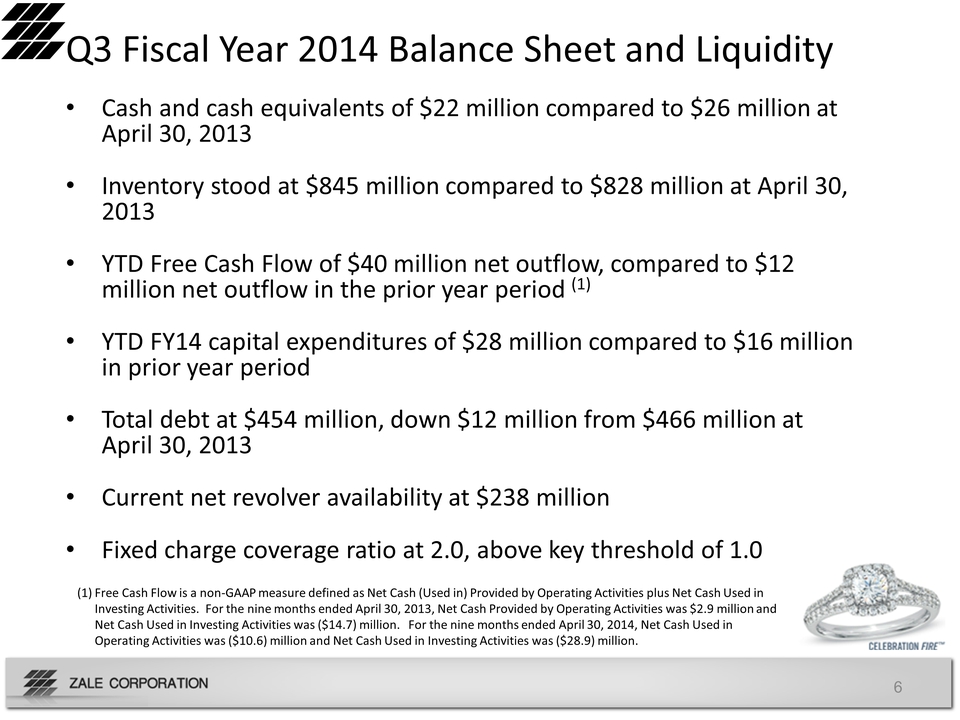
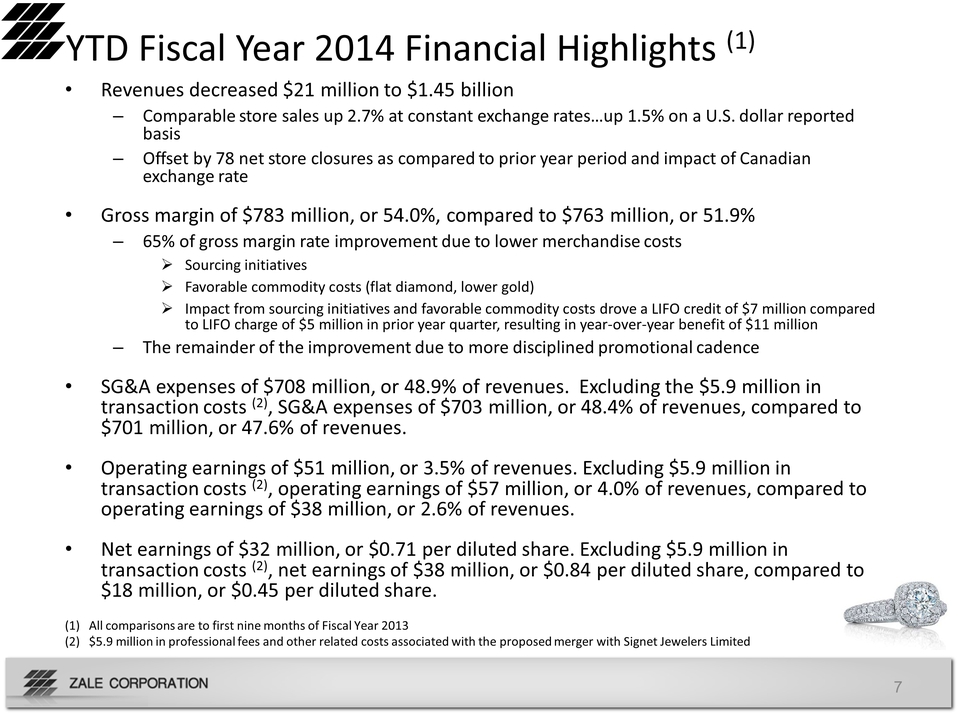
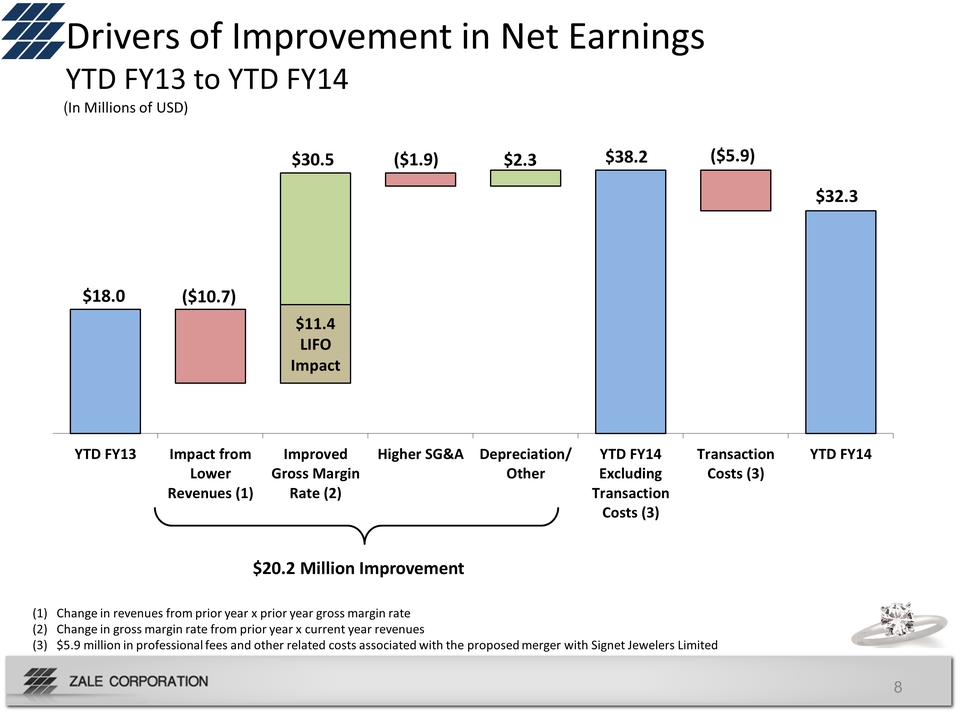

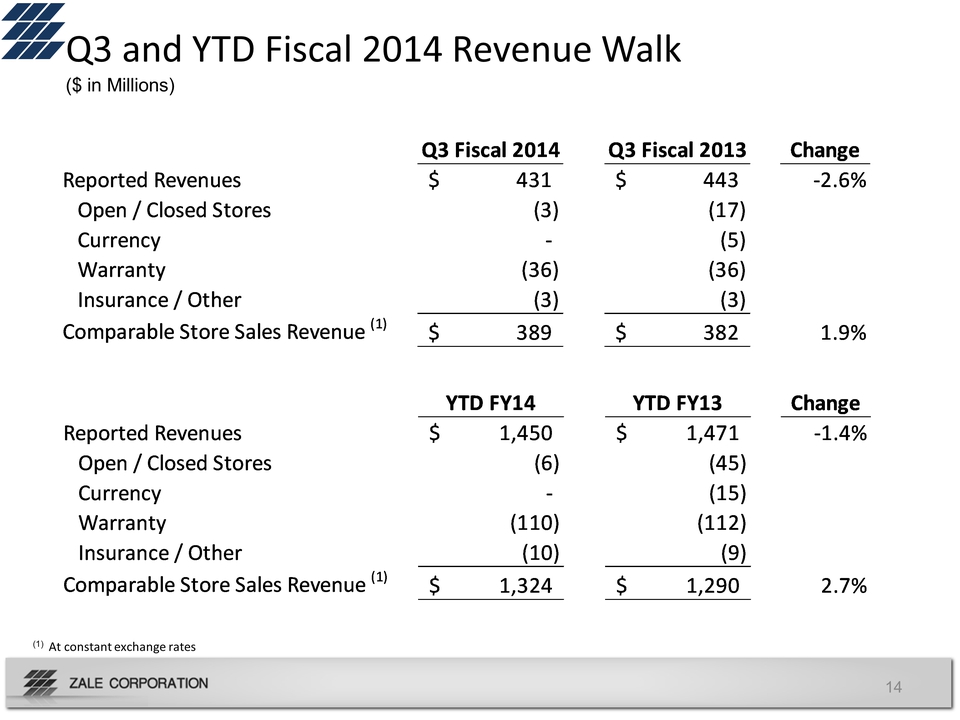
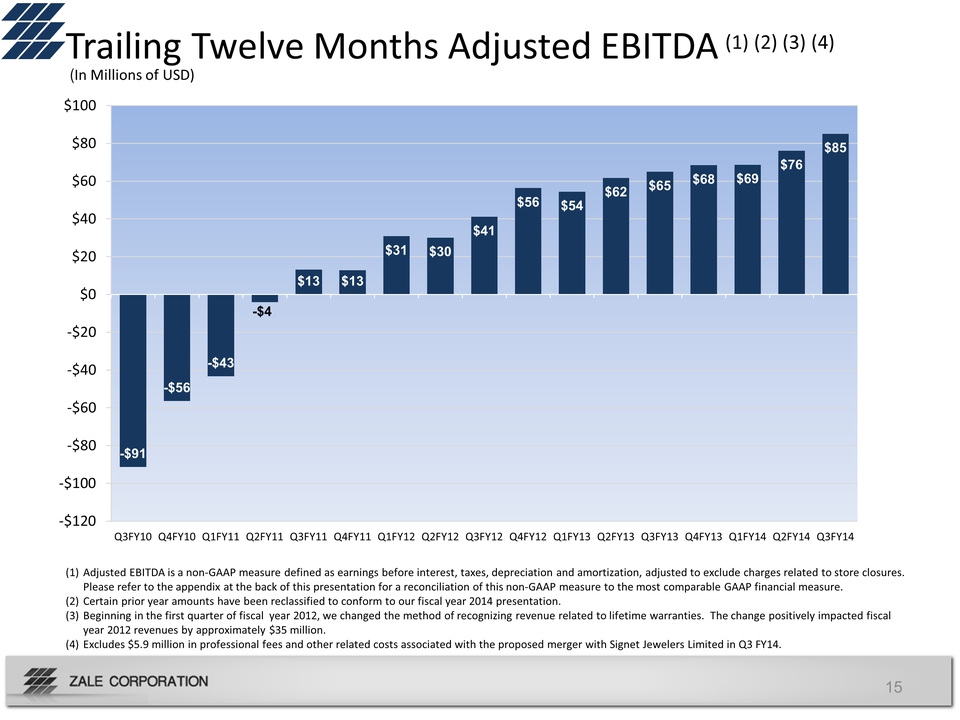
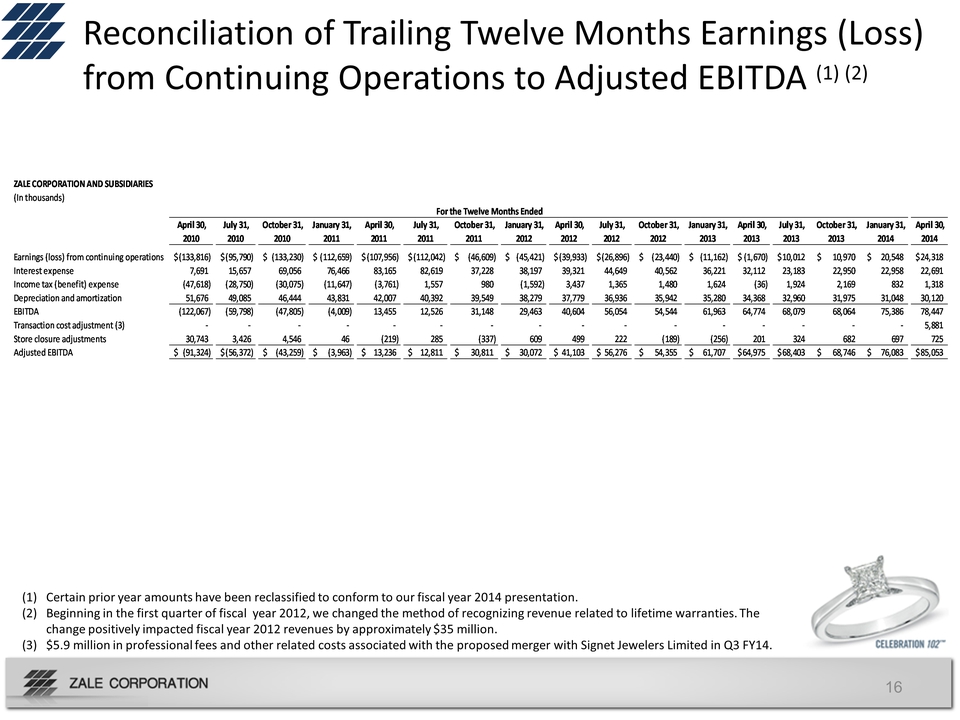
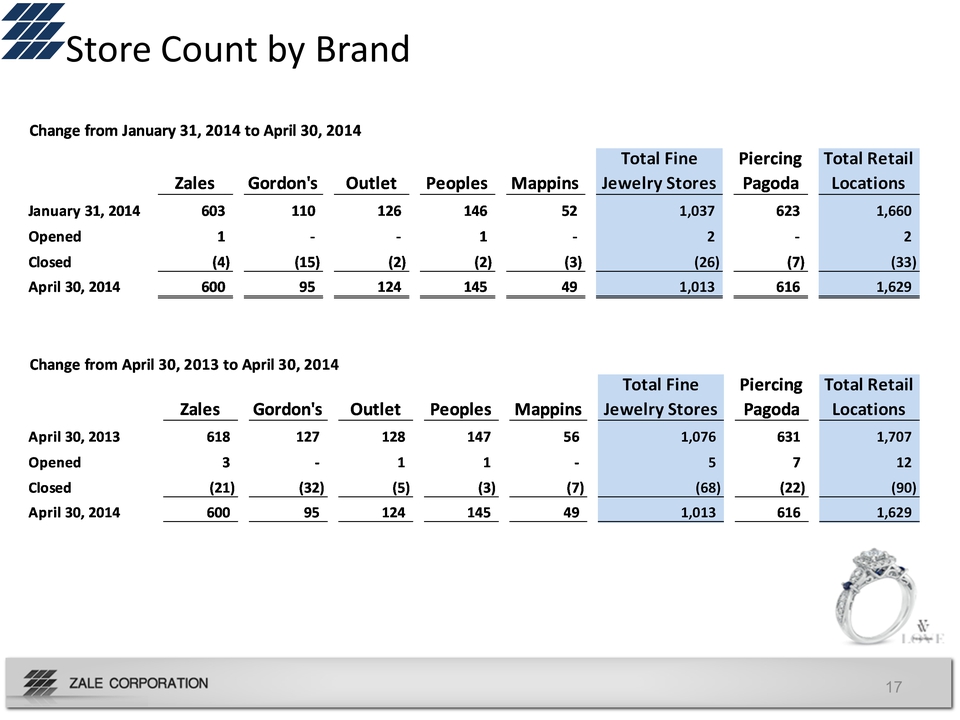
Slide: 1 Title: Third Quarter Fiscal Year 2014 Earnings May 20, 2014 Other Placeholder: 1 Slide: 2 Title: Forward-Looking Statements and Use of Non-GAAP Financial Measures Body: This presentation contains forward-looking statements, including statements regarding future sales, expected operating performance, expenses, margins, profitability, earnings, interest expense, effective tax rate, merchandising and marketing initiatives and industry growth forecasts. Forward-looking statements are not guarantees of future performance and a variety of factors could cause the Company's actual results to differ materially from the results expressed in the forward-looking statements. These factors include, but are not limited to: if the general economy performs poorly, discretionary spending on goods that are, or are perceived to be, “luxuries” may decrease; the concentration of a substantial portion of the Company’s sales in three, relatively brief selling seasons means that the Company’s performance is more susceptible to disruptions; if the Company does not achieve targeted sales growth its operating results and earnings will be adversely impacted; most of the Company’s sales are of products that include diamonds, precious metals and other commodities, and fluctuations in the availability and pricing of commodities could impact the Company’s ability to obtain and produce products at favorable prices; the Company’s sales are dependent upon mall traffic; the Company operates in a highly competitive industry; the financing market remains difficult, and if we are unable to meet the financial commitments in our current financing arrangements it will be difficult to replace or restructure these arrangements; changes in regulatory requirements may increase the cost or adversely affect the Company’s operations and its ability to provide consumer credit and write credit insurance; the Company's and Signet Jewelers Limited's ("Signet") ability to consummate the proposed acquisition of the Company by Signet; the conditions to the completion of the proposed transaction being satisfied, including the receipt of stockholder approval; operating costs, customer loss and business disruption (including difficulties in maintaining relationships with employees, customers, competitors or suppliers) may be greater than expected following the announcement of the proposed transaction; and the retention of certain key employees of the Company may be difficult. Additional information and other factors are contained in the Company's Annual Report on Form 10-K for the fiscal year ended July 31, 2013, and subsequent reports on Form 10-Q and 8-K filed with the Securities and Exchange Commission (“SEC”). Because the factors referred to above could cause actual results or outcomes to differ materially from those expressed or implied in any forward-looking statements made by the Company, you should not place undue reliance on any such forward-looking statements. Further, any forward-looking statement speaks only as of the date of this communication, and the Company undertakes no obligation to update any forward-looking statement to reflect events or circumstances after such date.This presentation contains certain non-GAAP measures as defined by SEC rules. One of these non-GAAP measures is EBITDA, which is defined as earnings before interest, taxes, depreciation and amortization. A second non-GAAP measure is adjusted EBITDA, which is further adjusted to exclude charges related to store closures. A third non-GAAP measure is free cash flow, which is defined as net cash (used in) provided by operating activities plus net cash used in investing activities. We use these measurements as part of our evaluation of the performance of the Company. In addition, we believe these measures provide useful information to investors. Please refer to the appendix at the back of this presentation for a reconciliation of these non-GAAP measures to the most comparable GAAP financial measures. Other Placeholder: 2 Slide: 3 Title: Q3 Fiscal Year 2014 Financial Highlights (1) Body: Revenues decreased $12 million to $431 millionComparable store sales up 1.9% at constant exchange rates…up 0.6% on a U.S. dollar basisOffset by 78 net store closures and impact of Canadian exchange rateGross margin of $241 million, or 56.0%, compared to $233 million, or 52.6%60% of gross margin rate improvement due to lower merchandise costs Sourcing initiativesFavorable commodity costs (flat diamond, lower gold)Impact from sourcing initiatives and favorable commodity costs drove a LIFO credit of $3 million compared to LIFO charge of $2 million in prior year quarter, resulting in year-over-year benefit of $5 millionThe remainder of the improvement due to more disciplined promotional cadenceReported SG&A expenses of $220 million, or 51.1% of revenues. Excluding the $5.9 million in transaction costs (2), SG&A expenses of $214 million, or 49.7% of revenues, compared to $215 million, or 48.6% of revenues.Reported operating earnings of $14 million, or 3.2% of revenues. Excluding the $5.9 million in transaction costs (2), operating earnings of $20 million, or 4.6% of revenues, compared to operating earnings of $10 million, or 2.2% of revenues.Reported net earnings of $9 million, or $0.19 per diluted share. Excluding the $5.9 million in transaction costs (2), net earnings of $15 million, or $0.32 per diluted share, compared to net earnings of $5 million, or $0.13 per diluted share. Other Placeholder: 3 All comparisons are to Q3 Fiscal Year 2013$5.9 million in professional fees and other related costs associated with the proposed merger with Signet Jewelers Limited Slide: 4 Other Placeholder: 4 Title: Drivers of Improvement in Net Earnings Q3 FY13 to Q3 FY14 $9.6 Million Improvement (In Millions of USD) Change in revenues from prior year x prior year gross margin rateChange in gross margin rate from prior year x current year revenues$5.9 million in professional fees and other related costs associated with the proposed merger with Signet Jewelers Limited Slide: 5 Other Placeholder: 5 Title: Q3 FY14 Comparable Store Sales Detail Revenues of $431 million compared to $443 million in prior year periodTotal comparable store sales up 1.9% at constant exchange rates…up 0.6% on a U.S. dollar reported basisCore national brands:Zales/Zales Outlet up 2.1%Peoples up 4.6% at constant exchange rates…down 4.0% on a U.S. dollar reported basis (1) Adjusted for the impact of February 29 in fiscal 2012 Slide: 6 Title: Q3 Fiscal Year 2014 Balance Sheet and Liquidity Body: Cash and cash equivalents of $22 million compared to $26 million at April 30, 2013Inventory stood at $845 million compared to $828 million at April 30, 2013YTD Free Cash Flow of $40 million net outflow, compared to $12 million net outflow in the prior year period (1)YTD FY14 capital expenditures of $28 million compared to $16 million in prior year periodTotal debt at $454 million, down $12 million from $466 million at April 30, 2013Current net revolver availability at $238 million Fixed charge coverage ratio at 2.0, above key threshold of 1.0 Other Placeholder: 6 Free Cash Flow is a non-GAAP measure defined as Net Cash (Used in) Provided by Operating Activities plus Net Cash Used in Investing Activities. For the nine months ended April 30, 2013, Net Cash Provided by Operating Activities was $2.9 million and Net Cash Used in Investing Activities was ($14.7) million. For the nine months ended April 30, 2014, Net Cash Used in Operating Activities was ($10.6) million and Net Cash Used in Investing Activities was ($28.9) million. Slide: 7 Title: YTD Fiscal Year 2014 Financial Highlights (1) Body: Revenues decreased $21 million to $1.45 billionComparable store sales up 2.7% at constant exchange rates…up 1.5% on a U.S. dollar reported basisOffset by 78 net store closures as compared to prior year period and impact of Canadian exchange rateGross margin of $783 million, or 54.0%, compared to $763 million, or 51.9%65% of gross margin rate improvement due to lower merchandise costs Sourcing initiativesFavorable commodity costs (flat diamond, lower gold)Impact from sourcing initiatives and favorable commodity costs drove a LIFO credit of $7 million compared to LIFO charge of $5 million in prior year quarter, resulting in year-over-year benefit of $11 millionThe remainder of the improvement due to more disciplined promotional cadenceSG&A expenses of $708 million, or 48.9% of revenues. Excluding the $5.9 million in transaction costs (2), SG&A expenses of $703 million, or 48.4% of revenues, compared to $701 million, or 47.6% of revenues.Operating earnings of $51 million, or 3.5% of revenues. Excluding $5.9 million in transaction costs (2), operating earnings of $57 million, or 4.0% of revenues, compared to operating earnings of $38 million, or 2.6% of revenues.Net earnings of $32 million, or $0.71 per diluted share. Excluding $5.9 million in transaction costs (2), net earnings of $38 million, or $0.84 per diluted share, compared to $18 million, or $0.45 per diluted share. Other Placeholder: 7 All comparisons are to first nine months of Fiscal Year 2013$5.9 million in professional fees and other related costs associated with the proposed merger with Signet Jewelers Limited Slide: 8 Other Placeholder: 8 Title: Drivers of Improvement in Net Earnings YTD FY13 to YTD FY14 $20.2 Million Improvement (In Millions of USD) Change in revenues from prior year x prior year gross margin rateChange in gross margin rate from prior year x current year revenues$5.9 million in professional fees and other related costs associated with the proposed merger with Signet Jewelers Limited Slide: 9 Other Placeholder: 9 Title: YTD FY14 Comparable Store Sales Detail Revenues of $1.45 billion compared to $1.47 billion in prior year periodTotal comparable store sales up 2.7% at constant exchange rates…up 1.5% on a U.S. dollar reported basisCore national brands:Zales/Zales Outlet up 4.2%Peoples up 4.6% at constant exchange rates (1) Adjusted for the impact of February 29 in fiscal 2012 Slide: 10 Title: May 2014 Month-To-Date Financial Update Body: For the first 18 days of May, which included the Mother’s Day Selling period:Comparable store sales down 2.2% on a constant currency basis; down 3.4% on a U.S. dollar reported basisGross margin rate performance is expected to be consistent with Q3 FY14 Other Placeholder: 10 Slide: 11 Title: Performance Assessment for Q3 YTD / FY14 Excludes Transaction Costs Other Placeholder: 11 Q3 YTDRevenue is trending below prior year and short of Plan due to:Lower Q3 comp salesThe unfavorable impact of Canadian Exchange RateLower store countEBITDA is trending in line with Plan and above prior year due to:Gross Margin rate expansion from sourcing initiatives, favorable commodity prices and disciplined promotional cadence (including an $11M benefit from LIFO vs. prior year) FY14To achieve FY14 Revenue Plan would require 10%+ comp sales growth in Q4 (vs. 2.7% for Q3 YTD)Given negative comp sales performance for May month-to-date, a meaningful shortfall to FY14 Plan for revenue is expectedTo achieve FY14 EBITDA Plan, Q4 comp sales performance would need to be consistent with YTD results (2.7%)Achieving FY14 EBITDA Plan is at risk given May month-to-date negative comp sales performance 2014 Plan per the Company’s Proxy Statement on schedule 14A, filed with the SEC on May 1, 2014.EBITDA is a non-GAAP measure defined as earnings before interest, taxes, depreciation and amortization. Please refer to the appendix at the back of this presentation for a reconciliation of this non-GAAP measure to the most comparable GAAP financial measure. ($ in Millions) Slide: 12 Title: Fiscal 2015 Considerations Body: Zale has several initiatives underway intended to accelerate revenue growth and improve overall margins. These initiatives include:Accelerating growth in exclusive merchandise, including our fashion assortmentGrowing store productivity through technology enhancements, training and improving our real estate portfolioContinuing to drive sourcing savings to improve marginsEach of these initiatives are subject to specific execution risks. In addition, the favorable impact from these initiatives could be mitigated by other factors, including:Potential increases in diamond and gold costsChanges in mall traffic patterns and volumesChanges to the competitive environmentChanges to general economic conditions related to our target market Other Placeholder: 12 Slide: 13 Title: Appendix Other Placeholder: 13 Slide: 14 Other Placeholder: 14 Title: Q3 and YTD Fiscal 2014 Revenue Walk ($ in Millions) (1) At constant exchange rates Slide: 15 Title: Trailing Twelve Months Adjusted EBITDA (1) (2) (3) (4) Adjusted EBITDA is a non-GAAP measure defined as earnings before interest, taxes, depreciation and amortization, adjusted to exclude charges related to store closures. Please refer to the appendix at the back of this presentation for a reconciliation of this non-GAAP measure to the most comparable GAAP financial measure. Certain prior year amounts have been reclassified to conform to our fiscal year 2014 presentation.Beginning in the first quarter of fiscal year 2012, we changed the method of recognizing revenue related to lifetime warranties. The change positively impacted fiscal year 2012 revenues by approximately $35 million.Excludes $5.9 million in professional fees and other related costs associated with the proposed merger with Signet Jewelers Limited in Q3 FY14. Other Placeholder: 15 (In Millions of USD) Slide: 16 Title: Reconciliation of Trailing Twelve Months Earnings (Loss) from Continuing Operations to Adjusted EBITDA (1) (2) Other Placeholder: 16 Certain prior year amounts have been reclassified to conform to our fiscal year 2014 presentation.Beginning in the first quarter of fiscal year 2012, we changed the method of recognizing revenue related to lifetime warranties. The change positively impacted fiscal year 2012 revenues by approximately $35 million.$5.9 million in professional fees and other related costs associated with the proposed merger with Signet Jewelers Limited in Q3 FY14. Slide: 17 Other Placeholder: 17 Title: Store Count by Brand