
CSFB 2004 Insurance Seminar
March 24, 2004
| | | | |
| |  | Safe Harbor Statement | |
| | | | |
Cautionary Statement under “Safe Harbor,” Provision of the Private Securities Litigation Act of 1995: This presentation contains various forward-looking statements and includes assumptions concerning our operations, future results and prospects. Statements included herein, as well as statements made by or on our behalf in press releases, written statements or other documents filed with the Securities and Exchange Commission (the “SEC”), or in our communications and discussions with investors and analysts at this conference or in the normal course of business through meetings, phone calls and conference calls, which are not historical in nature are intended to be, and are hereby identified as, “forward-looking statements” for purposes of the safe harbor provided by Section 21E of the Securities Exchange Act of 1934 as amended. These forward-looking statements, identified by words such as “intend,” “believe,” “anticipate,” or “expects” or variations of such words or similar expressions are based on current expectations and are subject to risk and uncertainties. In light of the risks and uncertainties inherent in all future projections, the inclusion of forward-looking statements in this presentation should not be considered as a representation by us or any other person that our objectives or plans will be achieved. We caution investors and analysts that actual results or events could differ materially from those set forth or implied by the forward-looking statements. For further information regarding cautionary statements and factors affecting future operating results, please refer to PXRE Group’s public filings with the SEC.
1
Business Overview
2
| | | | |
| |  | Highlights | |
| | | | |
 | High quality franchise with longstanding market presence |
| | | |
 | Growth and profitability in core cat and risk excess business |
| | | |
| |  | NPW growth of 46% for 2003 |
| | | |
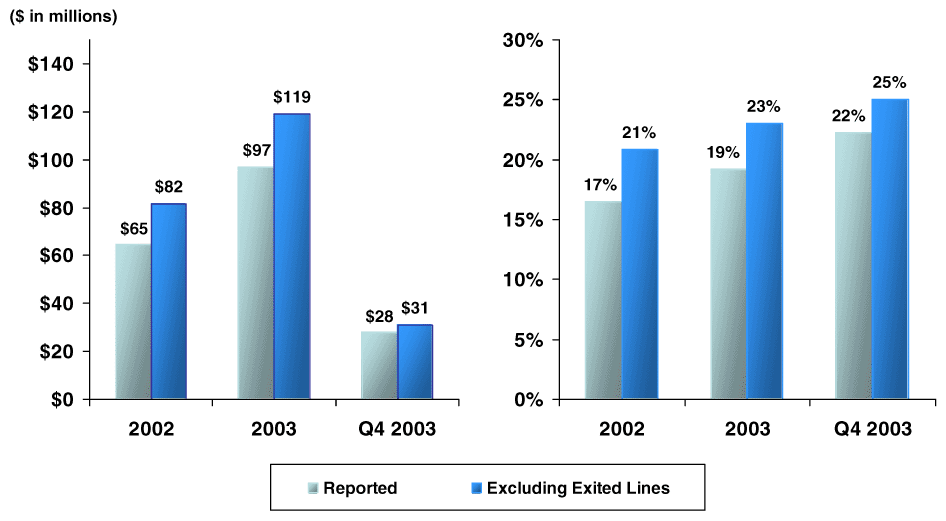
| |  | ROE of 23% for 2003 |
| | | |
| |  | Loss Ratio of 27% for 2003 |
| | | |
 | Overall ROE of 19.2% for 2003 |
| | | |
 | “A” ratings from S&P and A.M. Best |
| | | |
 | Attractive market fundamentals |
| | | |
 | Experienced and proven management team |
| | | |
 | Sound balance sheet, over $720 million of capital |
| | | |

| |
PXRE is highly profitable, focused and
growing faster than its competitors
|
| |
3
| | | | |
| |  | Strategy | |
| | | | |
 | Focus on core profitable short-tail segments |
| | |
 | Leverage status as leading reinsurer |
| | |
 | Maintain strict risk controls |
| | |
 | Apply extensive technical analysis to underwriting |
| | |
 | Disciplined use of capital across underwriting cycles |
| | |

| |
A proven strategy generating long-term profits
|
| |
4
| | | | |
| |  | Experienced Management Team | |
| | | | |
 | Underwriters have an average of 22 years of underwriting experience | |
| | | |
 | Interests are aligned with shareholders | |
| | | |
| | | | | Years of | |
| Officer | | Title / Responsibility | | Experience | |
| |
| |
| |
| Jeffrey Radke | | CEO and President | | 16 | |
| | | | | | |
| Gerald Radke | | Chairman | | 35 | |
| | | | | | |
| Guy Hengesbaugh | | Chief Operating Officer | | 19 | |
| | | | | | |
| John Daly | | EVP, International Operations | | 27 | |
| | | | | | |
| Peter Kiernan | | SVP, North America Operations | | 15 | |
| | | | | | |
| Andrew Stapleton | | SVP, Marine and Aerospace | | 16 | |
| | | | | | |
| John Modin | | EVP, CFO | | 17 | |
| | | | | | |
| Bruce Byrnes | | General Counsel | | 11 | |
5
| | | | |
| |  | Underwriting Philosophy | |
| | | | |
 | Focus on business we know |
| | | |
 | High severity / low frequency, broad spread of risk |
| | | |
 | Highly technical underwriting and portfolio analysis: Crucible |
| | | |
 | Team approach – utilize collective experience of underwriters |
| | | |
| |  | All transactions approved through underwriting committee |
| | | |
 | Gross line underwriters |
| | | |
 | Maintain strong reputation among clients and brokers |
| | | |
| |  | Depth of underwriters allows for superior service |
6
| | | | |
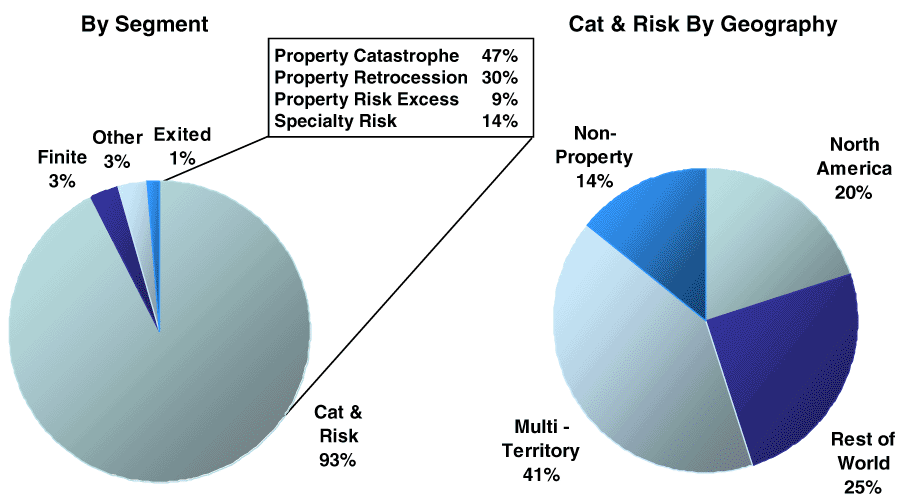
| |  | Composition of Business | |
| | | | |
| | | | |
| |
2003 Net Premiums Written = $278 million
|
| |
7
| | | | |
| |  | Performance Through the Cycle | |
| | | | |
| | | | |
| |
Cumulative Cat & Risk Loss Ratio 1987 to Present = 47%
|
| |

8
| | | | |
| |  | Growth | |
| | | | |
| | | | |
 | PXRE outperformed in the face of new competition, dramatically increasing market presence |
| | | |
| |  | Increased average line size per program 2002 to 2003: 53% |
| | | |
| |  | Increased number of programs led: 35 |
| | | |
| |  | Initial market impact of new players now concluded |
| | | |
 | Year over year growth rates in core short-tail business exceeded peers in 2002 and 2003 |
| | | |
 | Profitable growth: 2003 cat and risk excess combined ratio = 54% |
| | |

| |
PXRE’s client relationships and relatively smaller line sizes
enable us to continue to grow
|
| |
9
| | | | |
| |  | Business Summary | |
| | | | |
| | | | |
($ in millions)
| | | Property
Catastrophe | | Property
Retrocession | | Specialty
Risk | | Property
Risk Excess |
| |
|
|
|
|
|
|
|
|
| NPW 2003(1) | | $134 | | $86 | | $40 | | $25 |
|
|
|
|
|
|
|
|
|
Market
Commentary | • | Large international | • | Data quality improving | • | Marine
terms poor | • | Difficult
market |
| | | book, strong quoting
role | • | Proprietary models required | • | Aviation pricing strong | • | Loss leader for many insurers |
| | • | North American book growing, quotation role
increasing | • | Relationships and experience are critical | • | Capacity shortage insatellites | • | Information often suspect |
| • | Largest risk
premium | • | Large risk
premium | • | Low risk
premium |
| | • | Attractive risk
premium | • | Rates flat | • | Rates increasing insatellites; declining
(but still attractive),
in aviation | • | Rates down |
| | • | Rates flat to
down | | | | | |
| | | | | | | | |
| | | | | | | | |
| | | | | | | | |
| | | | | | | | |
| | | | | | | | |
| | | | | | | | |
(1) Before unallocated ceded excess of loss reinsurance.
10
| | | | |
| |  | Risk Management | |
| | | | |
| | | | |
 | Closely monitor and manage risk profile in order to maintain financial strength |
| | |
 | Aggregate exposure control system utilizing third party and proprietary information systems |
| | |
 | Measure impact of each program on overall portfolio through proprietary Crucible risk management system |
| | |
 | Model each and every transaction to determine appropriate risk adjusted pricing |
| | |
 | Apply experienced underwriting judgment through team approach |
| | |
 | Adjust underwriting commitments to reflect underwriting cycle |
11
Financial Overview
12
| | | | |
| |  | Financial Strategy | |
| | | | |
| | | | |
 | Maintain strong claims paying ratings |
| | |
 | Conservative investment strategy |
| | |
 | Manage capital to support growth |
| | |
 | Risk management – interest rate, credit |
| | |
 | Operating expense management |
| | |

| |
Target ROE of 15% over the cycle
|
| |
13
| | | | |
| |  | Financial Performance | |
| | | | |
| | | | |
($ in millions)
| | Year Ended | | | Year Ended | |
| | December 31, | | | December 31, | |
| | 2003 | | | 2002 | |
| |
| | |
| |
| Gross Premiums Written | $ | 339 | | | $ | 367 | |
| Net Premiums Earned | | 321 | | | | 269 | |
| Net Premiums Earned – Cat & Risk Excess | | 254 | | | | 176 | |
| Net Investment Income | | 27 | | | | 25 | |
| Underwriting Income – Cat & Risk Excess | | 156 | | | | 108 | |
| Net Income | | 97 | | | | 65 | |
| Earnings per Share | $ | 4.10 | | | $ | 3.28 | |
| Loss Ratio | 50 | % | | 47 | % |
| Expense Ratio | 25 | % | | 31 | % |
| |
| | |
| |
| Combined Ratio | 75 | % | | 78 | % |
| | | | | | |
| Loss Ratio on Cat & Risk Excess | 27 | % | | 30 | % |
14
| | | | |
| |  | Operating Metrics | |
| | | | |
| | | | |
| | | |
Net Income
| | Return on Equity
|
| | | |
 15
15
| | | | |
| |  | Strong Financial Position | |
| | | | |
| | | | |
($ in millions)
| | December 31, 2003 | | December 31, 2002 | |
| |
| |
| |
| Cash and Investments | | $1,012 | | | | $ 805 | |
| | | | | | | | |
| Reinsurance Recoverables | | 162 | | | | 237 | |
| | | | | | | | |
| Total Assets | | 1,360 | | | 1,237 | |
| | | | | | | |
| | | | | | | | |
| Loss and Loss Adjustment Expense Reserves | | 451 | | | | 448 | |
| | | | | | | | |
| Debt | | — | | | | — | |
| | | | | | | | |
| | | | | | | | |
| Trust Preferred Securities | | 157 | | | | 94 | |
| | | | | | | | |
| Mandatory Convertible Preferred | | 172 | | | | 159 | |
| | | | | | | | |
| Total Shareholders’ Equity | | 565 | | | | 453 | |
| | | | | | | | |
| | | | | | | | |
| Book Value per Share | | $22.24 | | | $20.33 | |
16
| | | | |
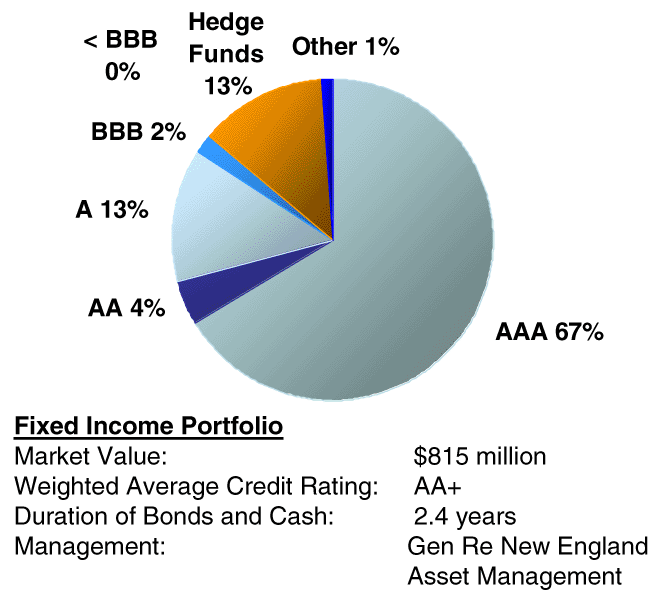
| |  | High Quality Investment Portfolio | |
| | | | |
| | | | |
17
| | | | |
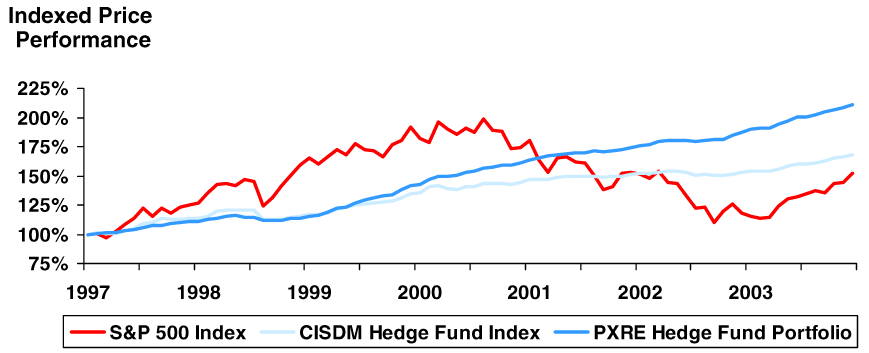
| |  | Diversified Hedge Fund Approach | |
| | | | |
| | | | |
 | Mariner Capital - Fund of funds approach - low correlation with investment indices |
| | |
 | Focused on strategies with better risk adjusted returns than fixed income or straight equity |
| | |
 | Only one down quarter (3rd quarter of 1998 - negative 2.2%) |
| | S&P 500 | CISDM
Index | PXRE
Portfolio |
| Average Annual Return | 8.57% | 7.99% | 11.56% |
| Standard Deviation | 22.22% | 6.02% | 6.94% |
18
| | | | |
| |  | Capital Structure | |
| | | | |
| | | | |
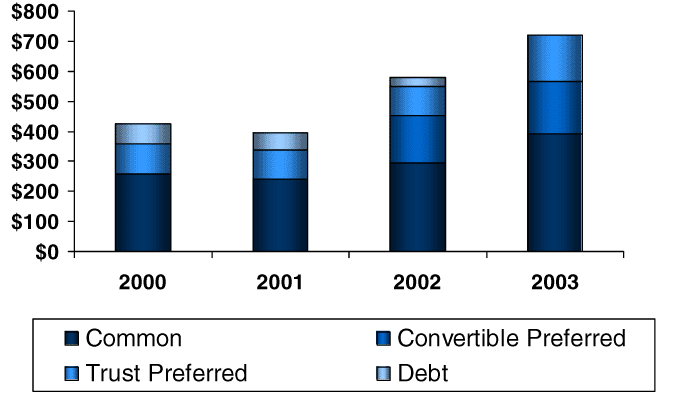
 | Raised $27 million (including shoe) in common equity during 2003 |
| | |
 | Issued $62.5 million of trust-preferred securities during 2003 |
| | |
 | Weighted average after-tax cost of debt is 6.67% |
| | |
 | Capital has grown 70% since year end 2000 |
| | |
| |
Growth and Composition of Capital (in $ millions)
|
| |
19
| | | | |
| |  | Summary | |
| | | | |
| | | | |
20


 15
15

