 1Q 2016 Investor Presentation May 2016 Exhibit 99.1 |
 Forward-Looking Statements 2. This presentation contains “forward-looking statements” which are made pursuant to the safe harbor provisions of the Private Securities Litigation Reform Act of 1995. The forward-looking statements are based on the Company's current expectations and beliefs concerning future developments and their potential effects on the Company. There can be no assurance that actual developments will be those anticipated by the Company. Actual results may differ materially from those projected as a result of significant risks and uncertainties, including non-receipt of the expected payments, changes in interest rates, effect of the performance of financial markets on investment income and fair values of investments, development of claims and the effect on loss reserves, accuracy in projecting loss reserves, the impact of competition and pricing environments, changes in the demand for the Company's products, the effect of general economic conditions, adverse state and federal legislation, regulations and regulatory investigations into industry practices, developments relating to existing agreements, heightened competition, changes in pricing environments, and changes in asset valuations. The Company undertakes no obligation to publicly update any forward-looking statements as a result of events or developments subsequent to the presentation. |
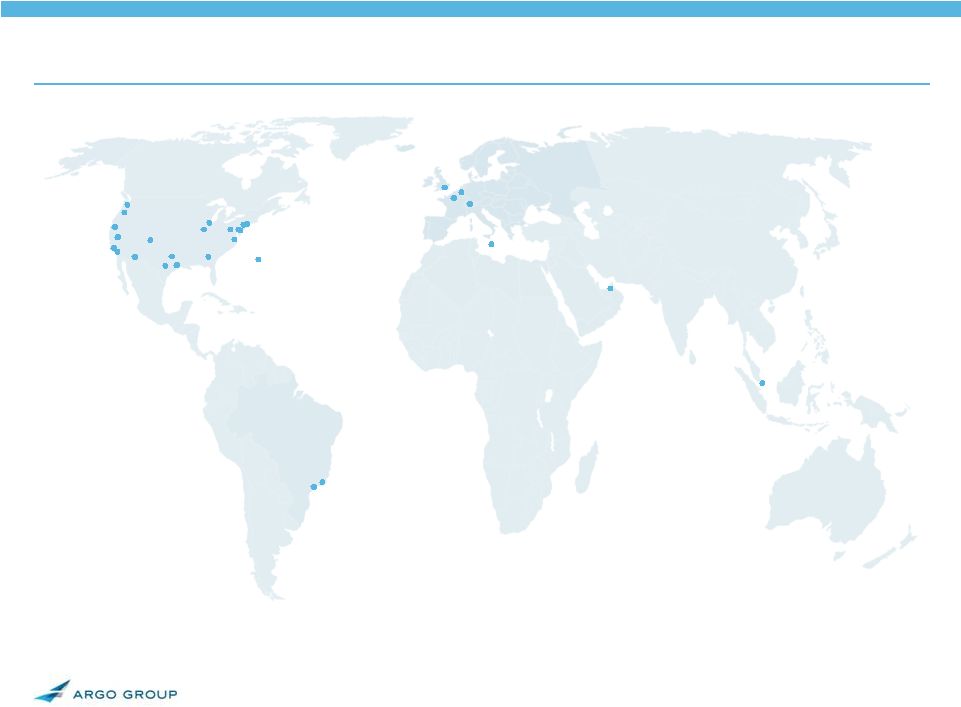 3. Argo Group at a Glance Exchange / Ticker: NASDAQ / “AGII” Share Price: $58.36 Market Capitalization: $1.6 billion Quarterly Dividend / Annual Yield: $0.22 per share / 1.5% Gross Written Premium: $2.1 billion Capital: $2.1 billion Analyst Coverage: Raymond James (Strong Buy) – Greg Peters Piper Jaffray (Overweight) – Dan Farrell Compass Point (Neutral) – Ken Billingsley Dowling & Partners (Neutral) – Aaron Woomer KBW (Market Perform) – Meyer Shields William Blair (Market Perform) – Adam Klauber Atlanta Bermuda Boston Brussels Chicago Dallas Denver Dubai Fresno Hamilton Township Houston Irvine Jersey City London Los Angeles Malta New York Paris Peoria Portland Richmond Rio de Janeiro Rockwood San Antonio San Francisco Sao Paulo Scottsdale Seattle Singapore Springfield Zurich Note: Market information as of May 12, 2016 and annual performance figures as of TTM March 31, 2016. • • • • • • • • • • • • • • • • • • • • • • • • • • • • |
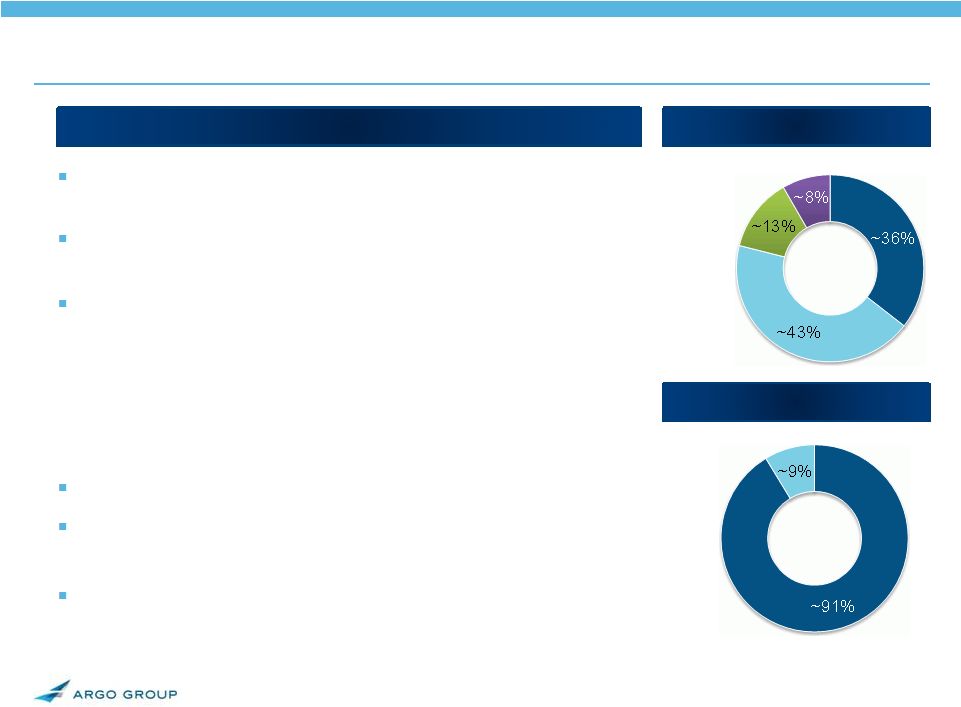 4. Leading Specialty Franchise Global underwriter of specialty insurance & reinsurance Strategically located in major insurance centers • U.S., Bermuda and London Established presence in attractive markets • Leader in U.S. Excess & Surplus Lines • Top Quartile Lloyd’s Syndicate by stamp • Strong core Commercial Specialty franchise • Leading Bermuda reinsurance & excess casualty platform Diversified by geography, product & distribution Broad and strong producer relationships • Agents, brokers, wholesalers, and coverholders “A” (excellent) A.M. Best rating Primary Insurance Reinsurance Property Casualty TTM GWP by Business Type TTM GWP by Business Mix Argo Franchise Overview Specialty Professional Liability TTM = trailing twelve months. |
 5. Maximize Shareholder Value through growth in Book Value per Share Sustainable competitive advantage • Niche markets • Underwriting expertise • Superior customer service • Product innovation Profitable organic & strategic growth • Profitable through cycles • Key underwriters/teams • Deals that meet stringent criteria Deep, tenured management team Active capital management Strategy Aligned Toward Shareholder Value |
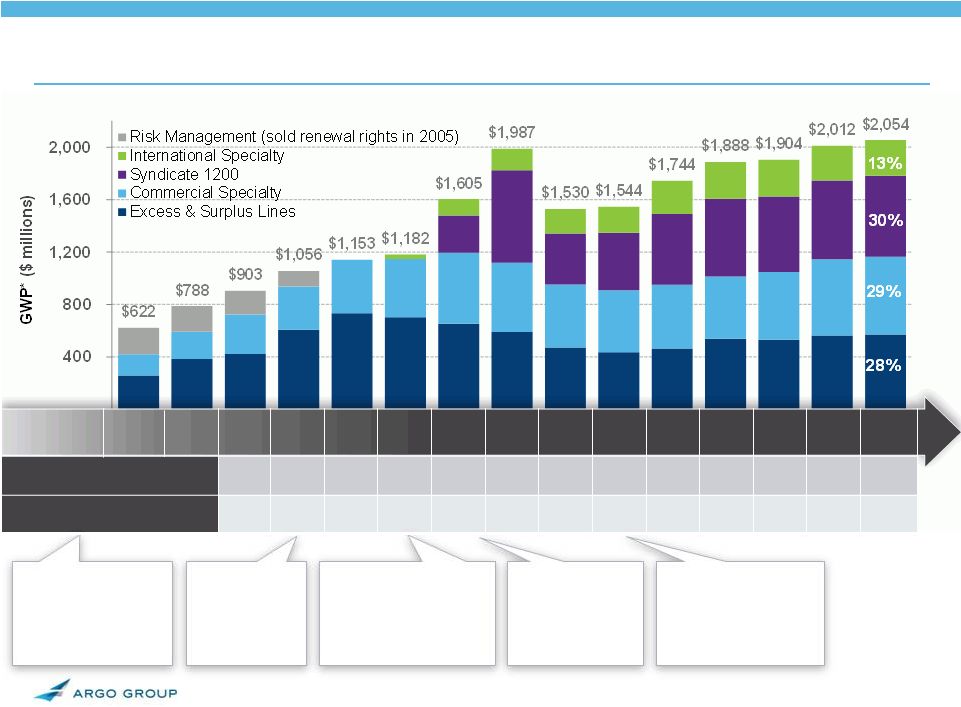 6. *Excludes GWP recorded in runoff and corporate & other. Reflects reclassification of Argo Pro from Excess & Surplus lines to Commercial Specialty. Note: BVPS (book value per common share) adjusted for June 2013 and March 2015 stock dividend. Evolution of Growth and Diversification 2001 • Acquired Colony and Rockwood • Founded Trident (Public Entity) 2005 • Sold Risk Management business 2007 • Rebranded Argo Group • Completed acquisition in Bermuda • Formed Argo Re 2008 • Acquired Lloyd’s Syndicate 1200 2011 • Established local presence in Brazil 2002 2003 2004 2005 2006 2007 2008 2009 2010 2011 2012 2013 2014 2015 ’16/1Q TTM BVPS $25.09 $27.69 $32.29 $37.32 $36.02 $42.73 $47.78 $45.95 $50.20 $53.60 $58.22 $59.74 $61.71 Total Capital (Millions) $717 $860 $992 $1,754 $1,763 $1,975 $1,986 $1,840 $1,915 $1,966 $2,025 $2,040 $2,078 6. |
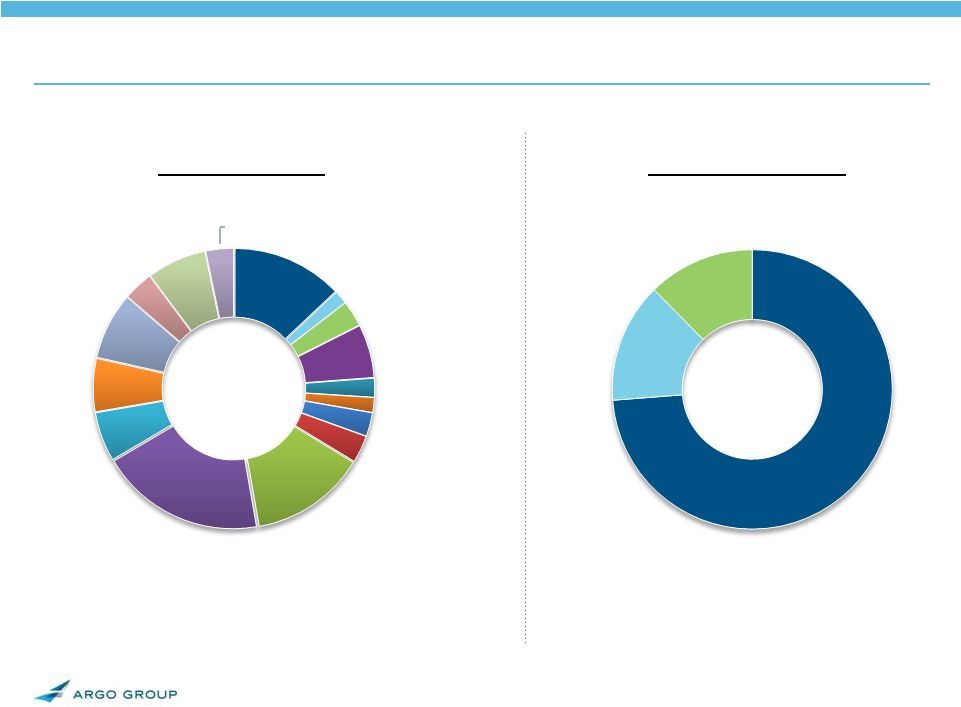 7. Argo Group Business Mix ($2.1b in GWP) GWP by Product 14% Other Commercial Specialty Property Public Entity 19% 6% 6% Marine & Aerospace Surety 3% Programs Mining Emerging Mkts & Bermuda Long Tail 8% 13% 6% 7% E&S Transport 2% E&S Property 3% E&S Contract E&S Environ 2% E&S Casualty E&S Allied Med 2% E&O 3% Mgmt Liab 3% 3% GWP by Geography United States 74% Rest of World 12% Europe 14% *Data is based on TTM as of March 31, 2016. Excludes GWP recorded in runoff and corporate & other. |
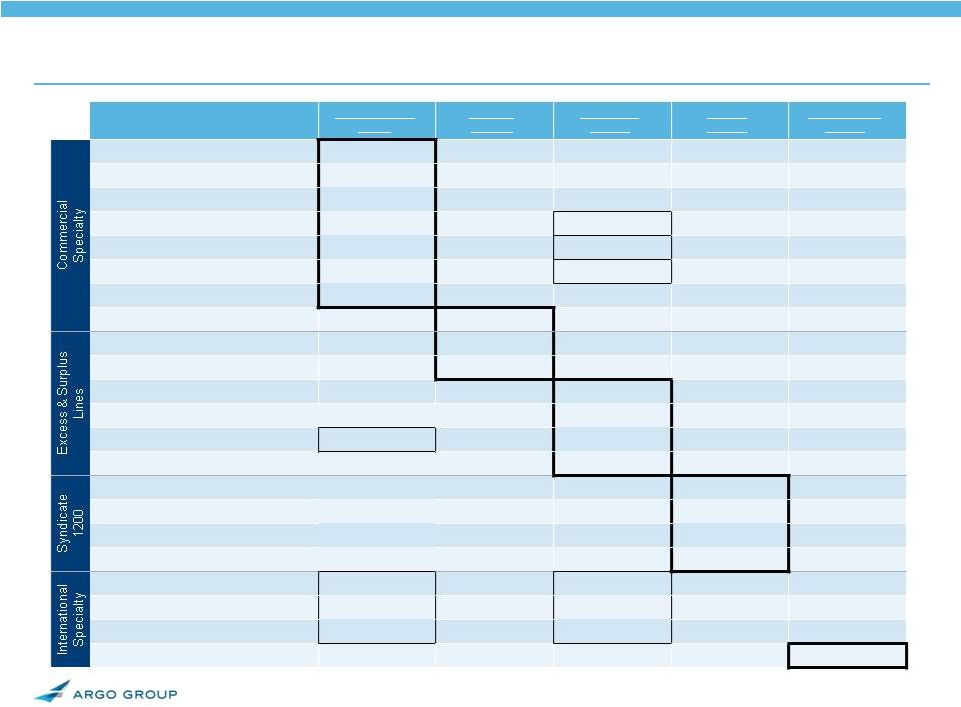 8. Multi-Channel Distribution Strategy Rockwood Argo Insurance Trident E&O D&O Surety Commercial Programs Alteris Contract Transportation Casualty Environmental Allied Medical Specialty Property Liability Property Aviation Marine Excess Casualty Professional Liability Emerging Markets Reinsurance Retail Broker / Agent General Agency Wholesale Broker Lloyd’s Market Reinsurance Broker X X X X X X X X X X X X X X X X X X X X X X X X X X X X X |
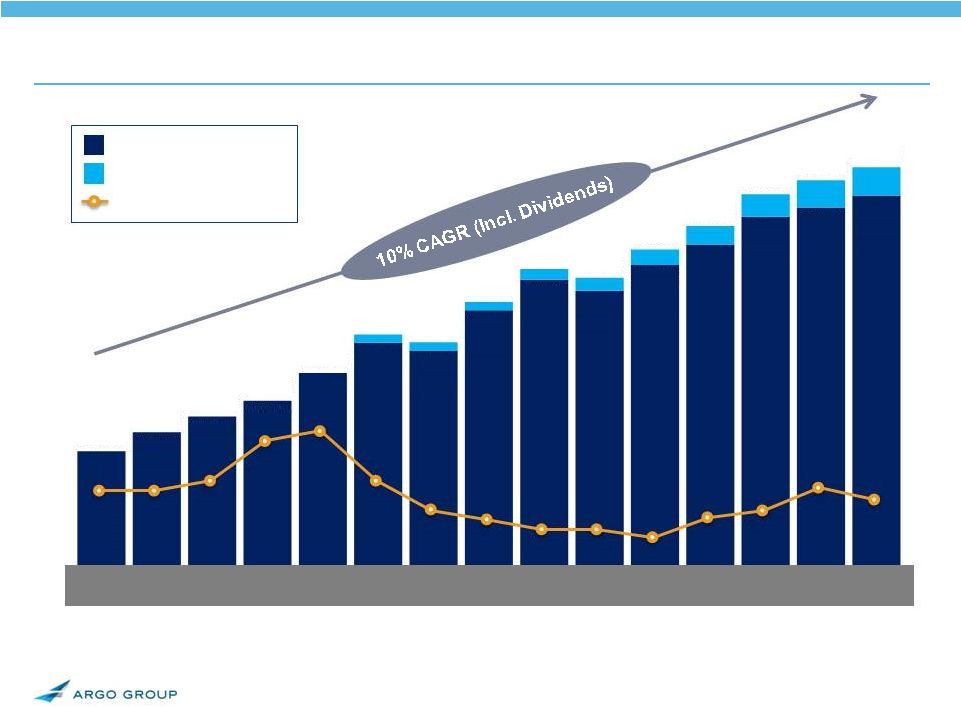 9. (1) Book value per common share: - Adjusted for June 2013 and March 2015 stock dividend - 2008-2011 restated to reflect adoption of ASU 2010-26 (related to accounting for costs associated with acquiring or renewing insurance contracts); 2007 and prior not restated - 2006 and prior years adjusted for PXRE merger - 2003-2006 includes impact of Series A Mandatory Convertible Preferred on an as-if converted basis. Preferred stock fully converted into common shares as of Dec. 31, 2007 (2) Price / book represents the high for the YTD period Maximizing Shareholder Value – BVPS Growth 2002 Reported Book Value 1 Cumulative Dividends Price/Book 2 2003 2004 2005 2006 2007 2008 2009 2010 2011 2012 2013 2015 2014 Q1 2016 $19.34 $22.50 $25.09 $27.69 $32.29 $37.32 $36.02 $42.73 $47.78 $45.95 $50.20 $53.60 $58.22 $59.74 $61.71 $19.34 $22.50 $25.09 $27.69 $32.29 $38.68 $37.38 $44.09 $49.54 $48.11 $52.76 $56.69 $61.94 $64.25 $66.44 1.1x 1.1x 1.2x 1.6x 1.7x 1.2x 0.9x 0.8x 0.7x 0.7x 0.6x 0.8x 0.9x 1.1x 1.0x |
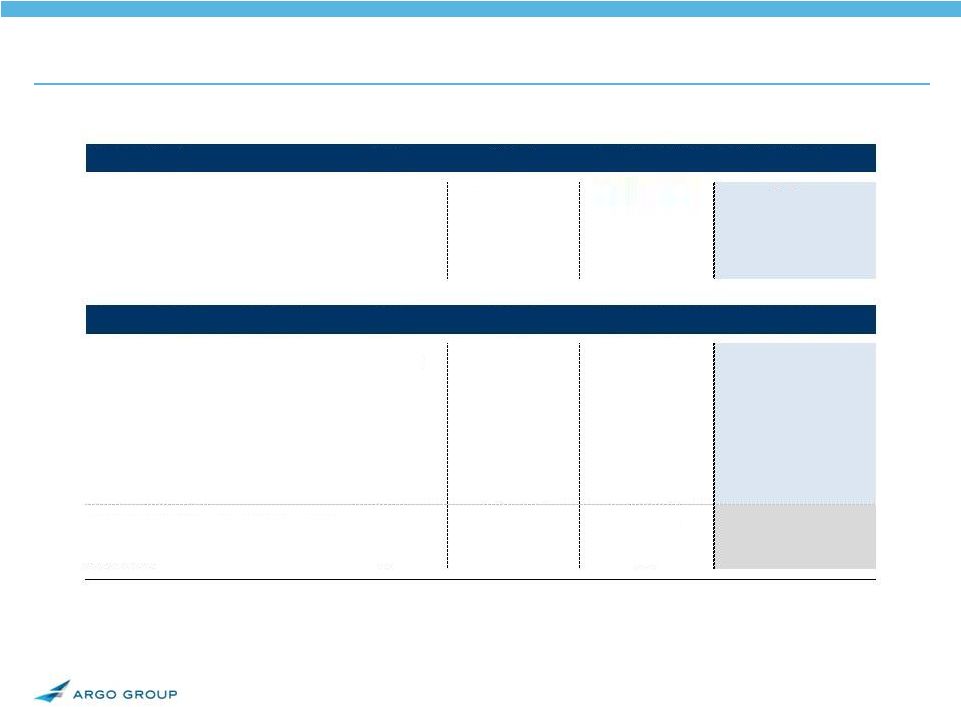 10. Substantial Growth and Financial Strength Scale ($m) 2002 2006 TTM 1Q '16 '02-1Q'16 Factor Gross Written Premiums $622.1 $1,155.6 $2,055.2 3.3x Net Written Premiums 484.0 847.0 1,409.5 2.9x Net Earned Premiums 378.4 813.0 1,382.2 3.7x Financial Strength ($m) 2002 2006 TTM 1Q '16 '02-1Q'16 Factor Total Assets $2,208.9 $3,721.5 $6,824.1 3.1x Total Investments 1,181.3 2,514.1 4,127.1 3.5x Shareholder's Equity 327.7 847.7 1,705.4 5.2x BVPS 1 $19.34 $32.29 $61.71 3.2x Total Capital $327.7 $992.0 $2,078.3 6.3x Debt+TRUPs / Total Capital 0.0% 14.5% 17.9% A.M. Best Rating A A A (1) Book value per common share: - Adjusted for June 2013 and March 2015 stock dividend - 2006 adjusted for PXRE merger and includes impact of Series A Mandatory Convertible Preferred on an as-if converted basis. Preferred stock fully converted into common shares as of Dec. 31, 2007 |
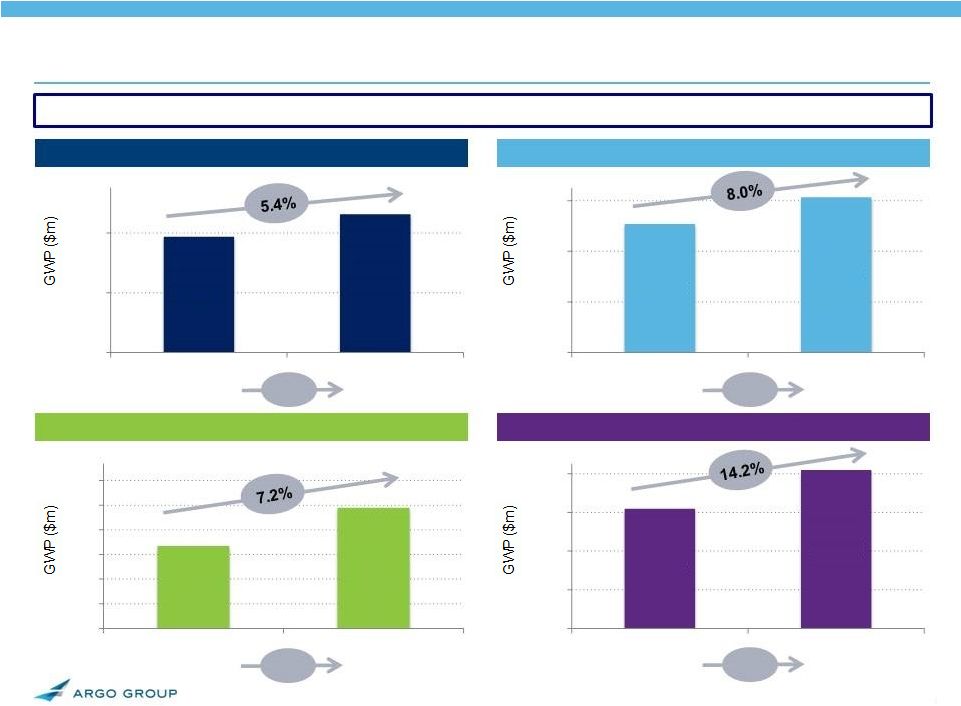 1Q YoY Gross Written Premium & Combined Ratio Consolidated GWP up 9.0% and Combined Ratio increased 0.4% in Q1 2016 vs. Q1 2015 Excess & Surplus Lines Commercial Specialty International Specialty Syndicate 1200 Combined Ratio 86.7% 1.8% 88.5% Combined Ratio 95.6% -7.6% 88.0% Combined Ratio 81.2% -1.5% 79.7% Combined Ratio 91.0% 4.8% 95.8% Reflects reclassification of Argo Pro from Excess & Surplus lines to Commercial Specialty. $65.5 $70.2 $56 $59 $62 $65 $68 $71 $74 Q1 2015 Q1 2016 $141.9 $162.0 $80 $100 $120 $140 $160 Q1 2015 Q1 2016 $138.7 $146.2 $100 $120 $140 Q1 2015 Q1 2016 $130.9 $141.4 $80 $100 $120 $140 Q1 2015 Q1 2016 11. |
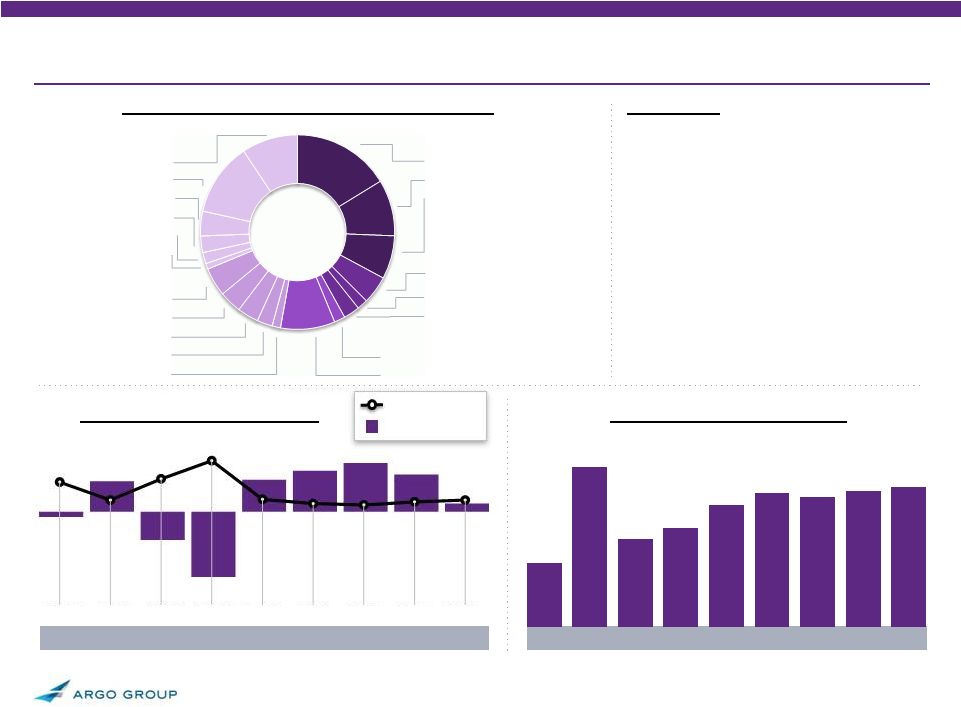
 12. Excess & Surplus Lines Segment (28% of TTM GWP) 88.9% 96.1% 95.9% 90.9% 90.9% 92.5% 85.1% 87.3% About Us • Leader in U.S. Excess & Surplus Lines • Strong relationships with national, local and regional wholesale brokers • Seasoned U/W expertise is a competitive advantage • Target all sizes of non-standard (hard-to-place) risks, with focus on small/medium accounts • Underwrites on largely non-admitted basis and across all business enterprises via the Colony Specialty brand GWP by Business Unit (TTM 3/31/16) Casualty 47% Transportation 6% Environmental 8% Allied Medical 6% Property 11% Contract 22% Gross Written Premium PTOI (1) & Combined Ratio 2011 2010 2009 2008 2012 2007 2013 88.4% 2013 2011 2010 2009 2008 2012 2007 2014 88.5% 2014 2015 1Q’16 (2) 2015 1Q’16 (3) All data in millions except for ratio calculations. TTM = trailing twelve months. Reflects reclassification of Argo Pro from Excess & Surplus lines to Commercial Specialty. (1) PTOI = Pre-Tax Operating Income. Excludes interest expense. (2) Data is based on year-to-date as of March 31, 2016. (3) Data is based on trailing twelve months as of March 31, 2016. $702.1 $653.3 $590.3 $472.1 $433.7 $464.9 $537.8 $530.4 $562.5 $570.0 $112.7 $101.4 $83.0 $73.1 $85.8 $80.8 $94.2 $101.4 $88.1 $22.6 Combined Ratio PTOI |
 13. Restructuring initiatives and strategy enhancement has enabled Argo to become an industry-leading E&S underwriter E&S Operating Platform Enhancement TTM = trailing twelve months. Reflects reclassification of Argo Pro from Excess & Surplus lines to Commercial Specialty. 95.9% 90.9% 90.9% 87.3% 85.1% 88.4% 88.8% 2010 2011 2012 2013 2014 2015 1Q '16 TTM Refreshed management Year of restructuring and strategy enhancement Year of execution on the newly restructured platform Continued execution and Combined Ratio improvement Discontinued Transportation Third consecutive year with combined ratio less than 90% |
 14. Commercial Specialty Segment (29% of TTM GWP) About Us • Business primarily placed through retail distribution partners • Argo Insurance – designs customized commercial insurance programs for retail grocery stores • Trident – One of the largest specialty commercial insurance providers for small to middle market public-sector entities in the U.S. • Rockwood – Leading provider of workers compensation for the coal mining industry • Surety – Top 25 surety writer • Programs – underwrites select specialty programs and provides fronting for State-sponsored funds • Argo Pro – Innovative D&O and E&O specialty platform GWP by Business Unit (TTM 3/31/16) U.S. Retail (Argo Insurance) 8% Restaurants 2% Grocery 3% Other Industries 1% Public Entity (Trident) 20% Surety 11% Mining (Rockwood) 12% Programs 27% Transportation <1% State Workers’ Comp Funds 24% Combined Ratio PTOI Gross Written Premium PTOI (1) & Combined Ratio 89.3% 97.4% 99.8% 111.4% 113.5% 98.0% 100.5% 91.3% 97.4% 88.0% Other 3% Risk Managed 2% Other 1% 2011 2010 2009 2008 2012 2007 2013 2013 2011 2010 2009 2008 2012 2007 2014 2014 2015 1Q’16 (2) 2015 1Q’16 (3) All data in millions except for ratio calculations. TTM = trailing twelve months. Reflects reclassification of Argo Pro from Excess & Surplus lines to Commercial Specialty. (1) PTOI = Pre-Tax Operating Income. Excludes interest expense. (2) Data is based on year-to-date as of March 31, 2016. (3) Data is based on trailing twelve months as of March 31, 2016. Argo Pro 21% Errors & Omissions 10% Management Liability 11% $61.3 $39.9 $27.5 $34.2 ($10.0) ($16.5) $27.3 $26.4 $47.0 $14.5 $445.1 $541.9 $527.7 $478.9 $474.0 $485.6 $475.5 $517.0 $582.7 $593.2 |
 15. 131.9% 115.2% Syndicate 1200 Segment (30% of TTM GWP) General Liability 9% Prof. Indemnity 12% Int’l Casualty Treaty 4% Directors & Officers 3% Medical Malpractice 2% Other 1% About Us • Well-established multi-class platform at Lloyd’s of London • Ranks among the largest Syndicates at Lloyd’s by Stamp Capacity • Lloyd’s market ratings: • ‘A’ (Excellent) by A.M. Best • ‘A+’ (Strong) by S&P • Regional offices in Dubai, Singapore and China GWP by Business Unit (TTM 3/31/16) Liability 31% Marine & Energy 16% 95.8% 112.3% 96.5% 92.6% Offshore Energy 5% Onshore Energy 4% Cargo 4% Yachts & Hulls 3% Marine Liability 1% 91.4% Combined Ratio PTOI Gross Written Premium PTOI & Combined Ratio 94.1% 2013 2011 2010 2009 2008 2012 2014 2015 1Q’16 (2) 95.8% 2013 2011 2010 2009 2008 2012 2014 2015 1Q’16 (3) All data in millions except for ratio calculations. TTM = trailing twelve months. (1) PTOI = Pre-Tax Operating Income. Excludes interest expense. (2) Data is based on year-to-date as of March 31, 2016. (3) Data is based on trailing twelve months as of March 31, 2016. ($5.2) $30.0 ($27.7) ($64.3) $31.2 $40.3 $47.7 $36.7 $8.0 $282.9 $706.0 $389.9 $439.2 $539.3 $593.7 $577.0 $600.2 $620.3 Asia 3% Aerospace 5% Specialty 11% PRI & Contingency 2% Personal Accident 9% MENA 2% Property 33% Property Fac 16% N. Am. & Int’l Binders 9% Other 7% |
 16. International Specialty Segment (13% of TTM GWP) About Us • Bermuda team underwrites: • Property cat, short tail per risk and proportional treaty reinsurance worldwide • Excess casualty and professional liability for Fortune 1000 accounts • Building diversity through international expansion: • Established primary operations in Brazil • Established operations in Eurozone • Distributes through brokers GWP by Business Unit (TTM 3/31/16) Excess Casualty 25% Professional Liability 10% Brazil 18% Marine Cargo 8% Property & Engineering 2% Motor 4% Financial Lines 5% Reinsurance 47% Other Assumed Re 3% Property Risk XS 4% Property Pro Rata 11% Property Cat 29% Combined Ratio PTOI Gross Written Premium PTOI (1) & Combined Ratio 177.2% 71.7% 52.3% 77.9% 96.9% 95.3% 89.2% 84.6% 2013 2011 2010 2009 2008 2012 2014 2015 1Q’16 (2) 79.7% 2013 2011 2010 2009 2008 2012 2014 2015 1Q’16 (3) All data in millions except for ratio calculations. TTM = trailing twelve months. (1) PTOI = Pre-Tax Operating Income. Excludes interest expense. (2) Data is based on year-to-date as of March 31, 2016. (3) Data is based on trailing twelve months as of March 31, 2016. $23.6 $50.3 $36.7 ($67.2) $16.3 $14.9 $23.8 $34.0 $11.0 $126.4 $162.9 $188.9 $197.5 $254.3 $280.8 $279.4 $266.2 $270.9 |
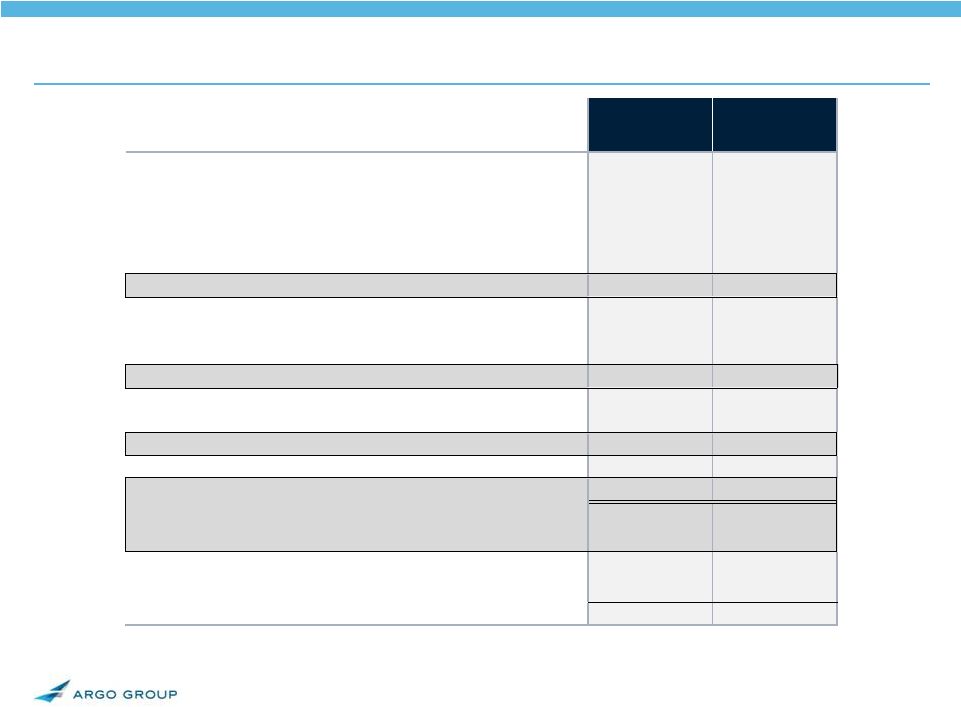 17. All data in millions except for per share data and ratio calculations. (1) Calculated using an assumed tax rate of 20%. (2) Defined as Losses and Loss Adjustment Expenses / Earned Premiums. (3) Defined as Underwriting, Acquisition and Insurance Expenses / Earned Premiums. 1Q 2016 Operating Results 1Q 2016 1Q 2015 Gross Written Premiums $519.8 $476.7 Net Written Premiums 303.4 296.0 Earned Premiums 344.9 334.6 Losses and Loss Adjustment Expenses 191.6 183.7 Underwriting, Acquisition and Insurance Expenses 132.6 129.6 Underwriting Income $20.7 $21.3 Net Investment Income 21.2 25.7 Fee and other income (expense), net 0.3 (0.4) Interest Expense 4.8 4.9 Operating Income $37.4 $41.7 Net Realized Investment and Other Gains (2.8) 11.1 Foreign Currency Exchange Gain (Loss) (1.5) 9.6 Income Before Taxes $33.1 $62.4 Income Tax Provision 5.4 3.6 Net Income $27.7 $58.8 Operating Income per Common Share (Diluted) 1 1.06 1.16 Net Income per Common Share (Diluted) $0.98 $2.05 Loss Ratio 2 55.5% 54.9% Expense Ratio 3 38.5% 38.7% Combined Ratio 94.0% 93.6% |
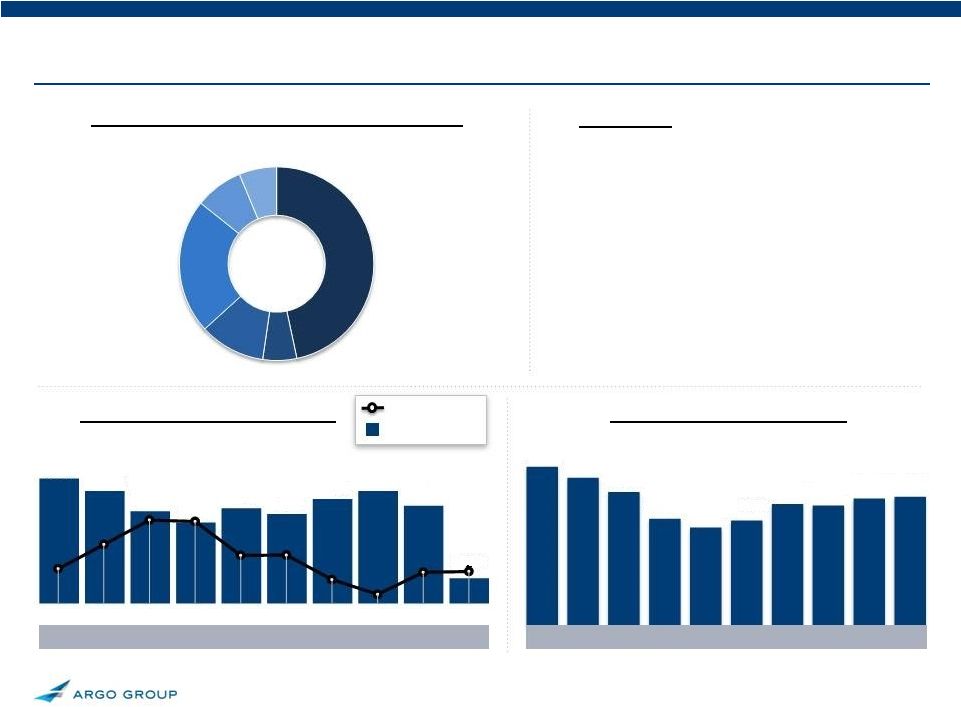
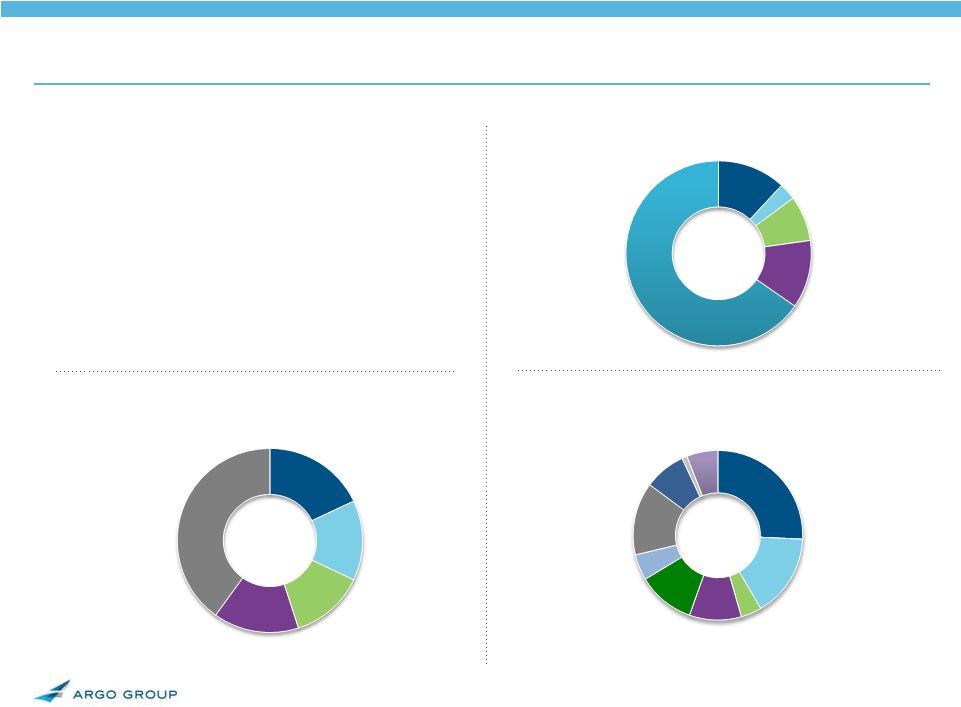 18. As of March 31, 2016 Conservative Investment Strategy 17% • Duration of 2.3 years • Average rating of ‘A1/A+’ • Book yield of 2.9%* • Very liquid • Conservatively managed Portfolio Characteristics *Book yield is pre-tax & includes all fixed maturities 18. Fixed Maturities by Type 12% Short Term & Cash Corporate 40%. 13% Gov. 22% Structured State/Muni 13%. Total: $3.3b* *$2.9 billion in fixed maturities, $0.4 billion in short term & cash *Duration includes cash & equivalents Asset Allocation 12% Other Fixed 69% Maturities. 6% Short Term 10% Equities Total: $4.2b 3% Cash Equity Investments by Sector 10% Health Care 16% Energy 14% Financials 8% Industrials 11% Technology 4% Funds 1% Materials 5% Discretionary 26% Consumer Staples Total: $0.4b 6% Utilities & TMT |
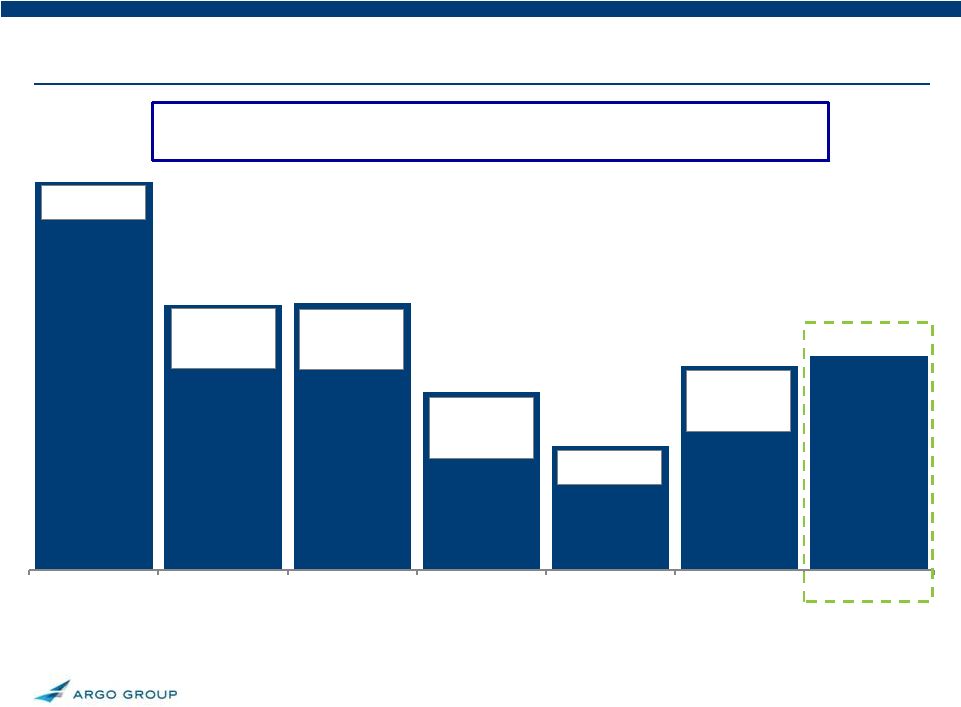
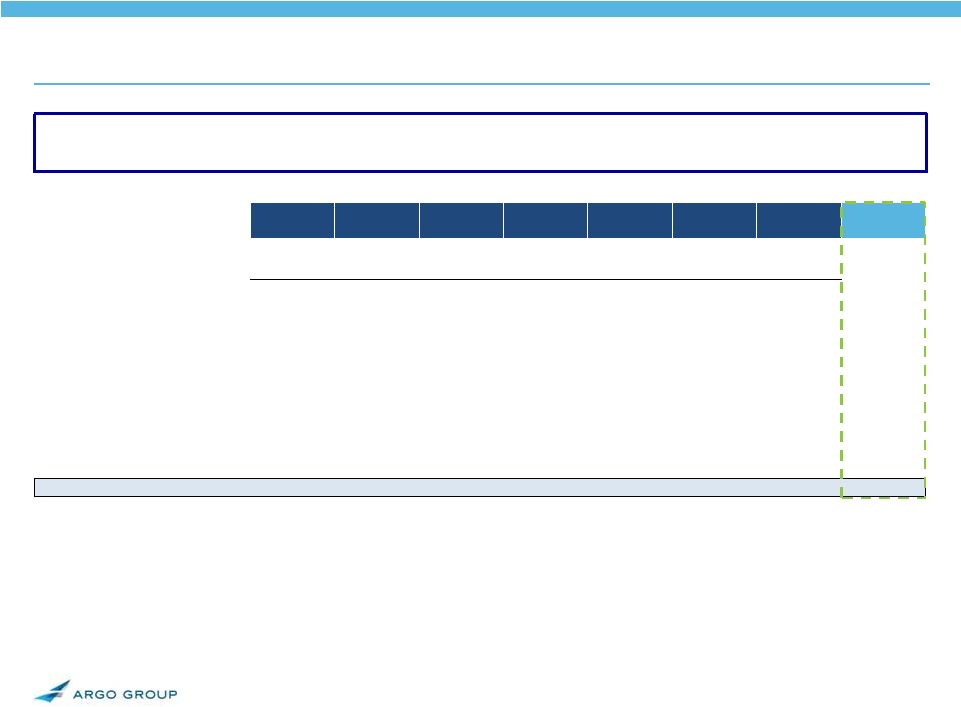  19. 2010-Q1'16 2010 2011 2012 2013 2014 2015 1Q 2016 Total Total Shares Outstanding 31,206,796 31,285,469 31,384,271 34,066,889 34,318,224 37,105,922 37,162,077 Less: Treasury Shares 3,363,560 4,971,305 6,459,613 7,558,345 8,606,489 9,181,644 9,525,296 Net Shares 27,843,236 26,314,164 24,924,658 26,508,544 25,711,735 27,924,278 27,636,781 Shares Repurchased 3,217,561 1,607,745 1,488,308 1,098,732 1,048,144 575,155 343,652 9,379,297 As % of Beg. Net Shares 10% 6% 6% 4% 4% 2% 1% 30% Avg. Repurchase Price per Share $33.05 $30.69 $29.89 $42.32 $48.45 $51.55 $55.29 $36.77 Total Repurchased ($m) $105.2 $49.5 $44.2 $46.5 $50.8 $29.7 $19.0 $344.8 Dividends per Share $0.48 $0.48 $0.48 $0.60 $0.69 $0.82 $0.22 $3.77 Dividend Payments ($m) $14.2 $13.1 $12.3 $15.8 $18.2 $22.7 $6.2 $102.5 Repurchases + Dividends ($m) $119.4 $62.6 $56.5 $62.3 $68.9 $52.4 $25.2 $447.3 Note: Not adjusted for June 2013 or March 2015 stock dividend. Active Capital Management Through share repurchases and dividends, we have returned $447 million of capital and repurchased 30% of shares outstanding from 2010 through 1Q 2016 |
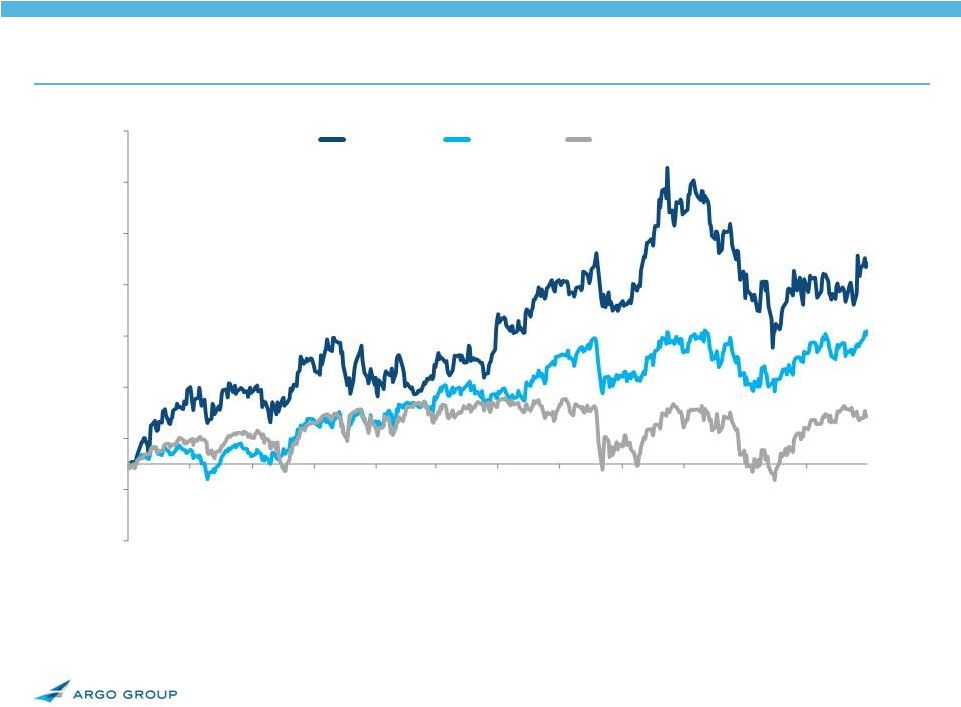 20. Stock Price Performance – Last 2 Years Source: SNL Financial (as of 5/12/16). Note: Peer Group consists of: Allied World, American Financial, Arch Capital, Aspen, AXIS Capital, Endurance, Global Indemnity, Markel, Navigators, OneBeacon, RLI Corp, Selective Group, W.R. Berkley. (15.0%) (5.0%) +5.0% +15.0% +25.0% +35.0% +45.0% +55.0% +65.0% May-14 Jul-14 Sep-14 Nov-14 Jan-15 Mar-15 May-15 Jul-15 Sep-15 Nov-15 Jan-16 Mar-16 +9% +39% +26% Argo Group Peer Group S&P 500 |
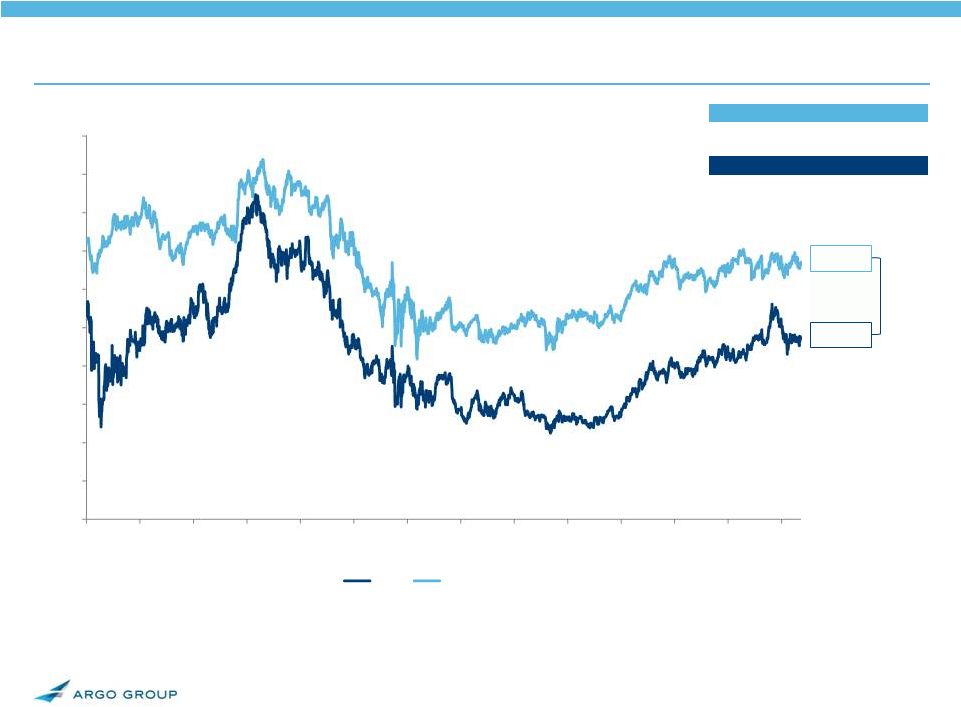 21. Compelling Valuation vs. Peer Group Source: SNL Financial (as of 5/12/16). Note: Price to book is average price/book across all peer companies based on latest reported book value. Peer Group consists of: Allied World, American Financial, Arch Capital, Aspen, AXIS Capital, Endurance, Global Indemnity, Markel, Navigators, OneBeacon, RLI Corp, Selective Group, W.R. Berkley. 0.95x 1.34x 0.39x Difference Price/Book Jan-03 May-16 Argo 1.09x 0.95x Peer Avg. 1.46x 1.34x Difference 0.37x 0.39x - 0.2x 0.4x 0.6x 0.8x 1.0x 1.2x 1.4x 1.6x 1.8x 2.0x Jan-03 Jan-04 Jan-05 Jan-06 Jan-07 Jan-08 Jan-09 Jan-10 Jan-11 Jan-12 Jan-13 Jan-14 Jan-15 Jan-16 Argo Peer Group |
 22. We believe that Argo Group has potential to generate substantial value for new and existing investors Well Positioned for Value Creation in 2016 and Beyond • Moderate financial leverage • Strong balance sheet with adequate reserves and excellent asset quality • Significant changes to premium composition completed • Results of underwriting initiatives evident in financials • Continue to employ and attract some of the best talent in the industry • Incremental yield improvements can have a favorable impact on ROE • Compelling investment case • Stock trading at a discount to peers • Upside potential as past and ongoing efforts continue |