Exhibit (a)(10)
Important Information
The following is an internal presentation prepared by KPN and delivered to iBasis in June, 2009. The presentation sets forth certain projections with respect to iBasis (the “KPN June Projections”). Such projections do not contain definitions for any of its line items or otherwise expressly indicate the method by which certain of the projected information provided therein, such as EBITDA and free cash flow (which are non-GAAP items), was calculated.
iBasis is making available the KPN June Projections for the limited purpose of giving stockholders of iBasis access to financial projections that were prepared by KPN and delivered to iBasis, such that they can compare that information with alternative earlier-dated projections prepared by KPN and disclosed by KPN in its Offer to Purchase dated July 28, 2009. We believe the KPN June Projections were not prepared by KPN with a view to public disclosure or compliance with guidelines of the SEC, the American Institute of Certified Public Accountants, the Public Company Accounting Oversight Board or any other similar body regarding projections or forecasts. The disclosure of the KPN June Projections should not be regarded as an indication that iBasis or any of its affiliates or representatives considers such projections to be a reliable prediction of future events, and the information should not be relied upon as such.
Strategic scenario's iBasis 2009-2012 12th June 2009 KPN IBasis-office forward looking scenario’s/eliminations |
Description scenario's Number of minutes (x mrd) Gross margin %(%) Revenu (x $mln) Ebitda (x $mln) 2009 2010 2009 2010 2009 2010 2009 2010 Annual Plan iBasis 24,1 n/a 9,8% n/a 1.313 n/a 37,4 n/a Scenario Scenario description Scenario 1 iBasis is underperforming the market • iBasis' minutes turning point (from decreasing minutes to increasing minutes) takes place a quarter later in time than in the market • Once minutes start growing, iBasis' minutes growth is half the market growth • Gross margin% slight growing from 12% in 2009 to 12,3% in 2012 • Price decrease (ARPM) of 5% = equal to price decrease in the marketplace Scenario 2 iBasis is on par with the market • iBasis' minutes turning point (from decreasing minutes to increasing minutes) takes place is equal as in the marketplace • Once minutes start growing, iBasis' minutes growth is equal to the market growth • Gross margin% 12% flat between 2009 and 2012 • Price decrease (ARPM) of 5% = equal to price decrease in the marketplace Scenario 3 iBasis is outperforming the market • iBasis' minutes turning point (from decreasing minutes to increasing minutes) takes place is equal as in the market • Once minutes start growing, iBasis' minutes growth is 1,5 times the market growth • Gross margin% decreasing from 12% in 2009 to 11,4% in 2012 • Price decrease (ARPM) of 5% = equal to price decrease in the marketplace • Margin-strategy will be less strict than at present and is brought in more balance with the other KPI's Scenario 4 Scenario 3 including outsourcing deals • iBasis' minutes turning point (from decreasing minutes to increasing minutes) takes place is equal as in the marketplace • Once minutes start growing, iBasis' minutes growth is 1,5 times the market growth • Gross margin% decreasing from 12% in 2009 to 10,0% in 2012 • 2,5 mrd minutes extra per year due to outsource deals • Price decrease (ARPM) of 5% = equal to price decrease in the marketplace • Margin-strategy will be less strict than at present and is brought in more balance with the other KPI's Assumptions market development * Minutes turning point (from decreasing minutes to increasing minutes) takes place up from Q3 2009 * Once minutes start growing, market minutes growth will be 6% per year * Price decrease (ARPM) of 5% KPN IBasis-office forward looking scenario’s/eliminations 1 |
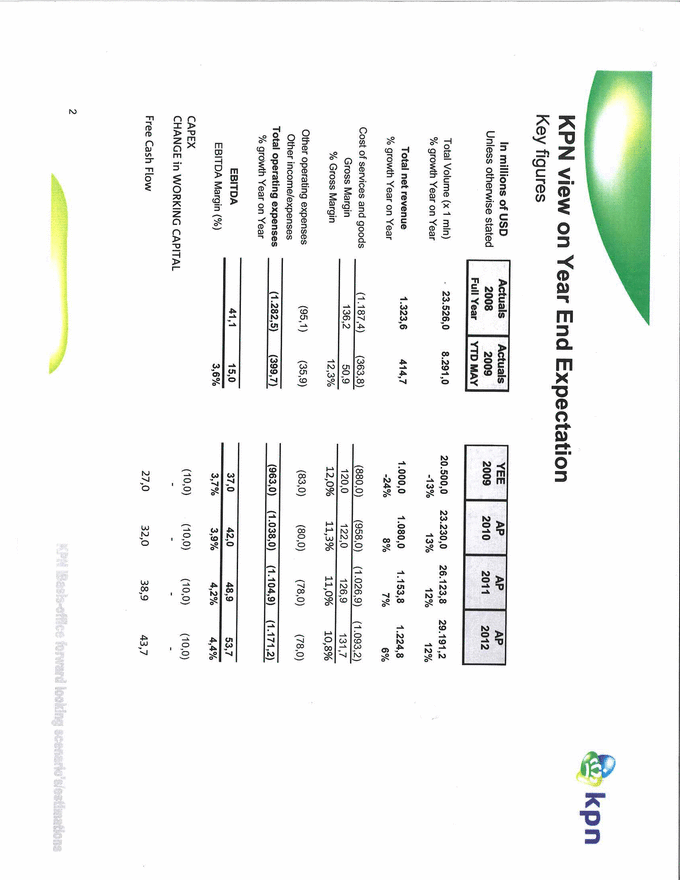
KPN view on Year End Expectation Key figures In millions of USD Actuals Actuals YEE AP AP AP Unless otherwise stated 2008 Full Year 2009 YTD MAY 2009 2010 2011 2012 Total Volume (x 1 mln) 23.526,0 8.291,0 20.500,0 23.230,0 26.123,8 29.191,2 % growth Year on Year -13% 13% 12% 12% Total net revenue 1.323,6 414,7 1.000,0 1.080,0 1.153,8 1.224,8 % growth Year on Year -24% 8% 7% 6% Cost of services and goods (1.187,4) (363,8) (880,0) (958,0) (1.026,9) (1.093,2) Gross Margin 136,2 50,9 120,0 122,0 126,9 131,7 % Gross Margin 12,3% 12,0% 11,3% 11,0% 10,8% Other operating expenses (95,1) (35,9) (83,0) (80,0) (78,0) (78,0) Other income/expenses Total operating expenses (1.282,5) (399,7) (963,0) (1.038,0) (1.104,9) (1.171,2) % growth Year on Year EBITDA 41,1 15,0 37,0 42,0 48,9 53,7 EBITDA Margin (%) 3,6% 3,7% 3,9% 4,2% 4,4% CAPEX (10,0) (10,0) (10,0) (10,0) CHANGE in WORKING CAPITAL - - - - Free Cash Flow 27,0 32,0 38,9 43,7 KPN IBasis-office forward looking scenario’s/eliminations 2 |
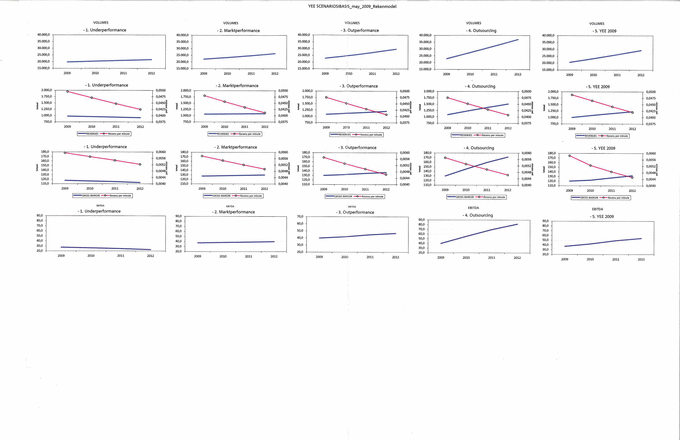
Summary scenario's + YEE Key figures REVENUES 2009J 2010 2011 2012 -1. Underperformance 977,4 956,3 935,8 915,7 - 2. Marktperformance 1.059,1 1.066,5 1.074,0 1.081,5 - 3. Outperformance 1.081,6 1.120,0 1.159,8 1.200,9 - 4. Outsourcing 1.081,6 1.232,8 1.374,1 1.506,4 -5. YEE 2009 1.000,0 1.080,0 1.153,8 1.224,8 Revenu per minute 1 2009 2010 2011 2012 -1. Underperformance per minute 0,0495 0,0470 0,0447 0,0424 - 2. Marktperformance per minute 0,0480 0,0456 0,0433 0,0412 - 3. Outperformance per minute 0,0475 0,0451 0,0429 0,0407 - 4. Outsourcing per minute 0,0475 0,0451 0,0429 0,0407 - 5. YEE 2009 per minute 0,0488 0,0465 0,0442 0,0420 [GROSS MARGIN 2009 2010 2011 2012 -1. Underperformance 117,3 115,9 114,6 112,6 - 2. Marktperformance 127,1 128,0 128,9 129,8 - 3. Outperformance 129,8 131,7 134,5 136,5 - 4. Outsourcing 129,8 145,0 159,4 171,2 - 5. YEE 2009 120,0 122,0 126,9 131,7 Gross margin per minute 1 2009J 2010 2011 2012 -1. Underperformance per minute 0,0059 0,0057 0,0055 0,0052 - 2. Marktperformance per minute 0,0058 0,0055 0,0052 0,0049 - 3. Outperformance per minute 0,0057 0,0053 0,0050 0,0046 - 4. Outsourcing per minute 0,0057 0,0053 0,0050 0,0046 - 5. YEE 2009 per minute 0,0059 0,0053 0,0049 0,0045 EBITDA 1 2009 2010 2011 2012 -1. Underperformance 27,3 25,9 24,6 22,6 - 2. Marktperformance 37,1 38,0 38,9 39,8 - 3. Outperformance 39,8 41,7 44,5 46,5 - 4. Outsourcing 39,8 55,0 69,4 81,2 - 5. YEE 2009 37,0 42,0 48,9 53,7 KPN IBasis-office forward looking scenario’s/eliminations 3 |
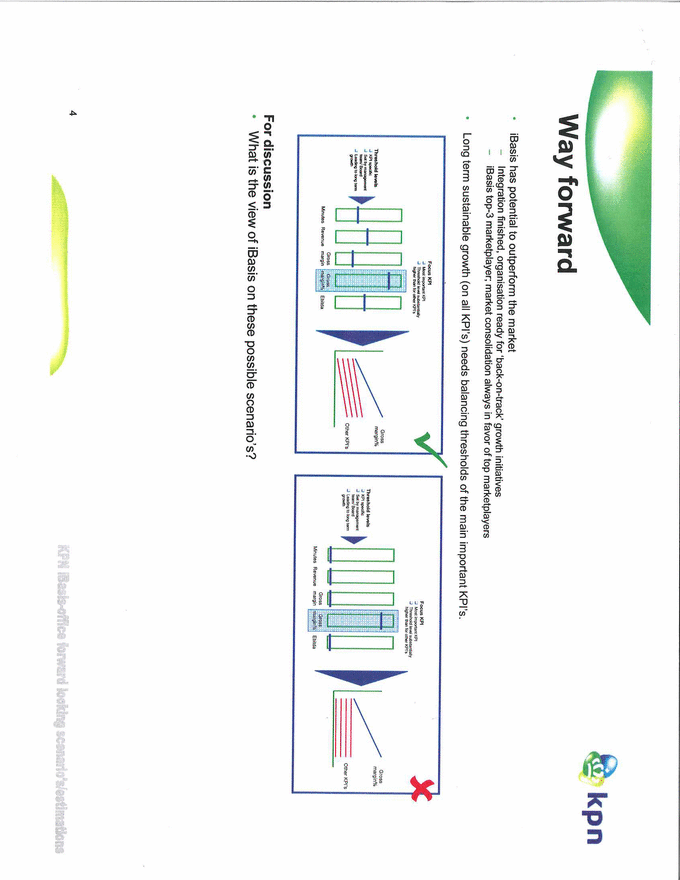
Way forward • iBasis has potential to outperform the market * Integration finished, organisation ready for 'back-on-track' growth initiatives * iBasis top-3 marketplayer; market consolidation always in favor of top marketplayers • Long term sustainable growth (on all KPI's) needs balancing thresholds of the main important KPI's. For discussion • What is the view of iBasis on these possible scenario's? KPN IBasis-office forward looking scenario’s/eliminations 4 |
YEE SCENARIOSIBASlS_may_2009_Rekenmodel VOLUMES VOLUMES VOLUMES - 1. Underperformance - 2. Marktperformance - 3. Outperformance VOLUMES VOLUMES - 4. Outsourcing - 5. YEE 2009 -1. Underperformance - 2. Marktperformance - 3. Outperformance - 4. Outsourcing - 5. YEE 2009 - 1. Underperformance - 2. Marktperformance - 3. Outperformance - 4. Outsourcing - 5. YEE 2009 - 1. Underperformance - 2. Marktperformance - 3. Outperformance - 4. Outsourcing - 5. YEE 2009 |