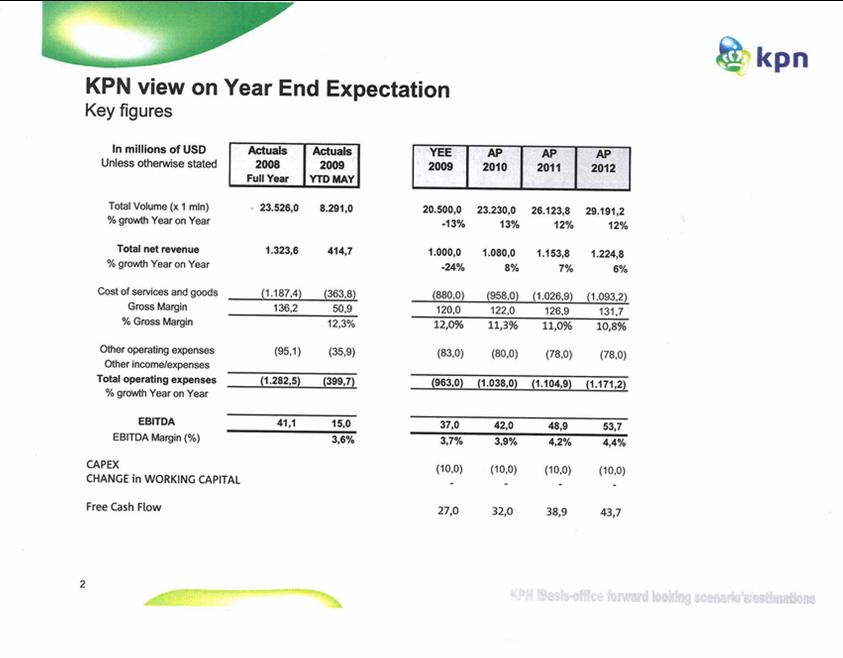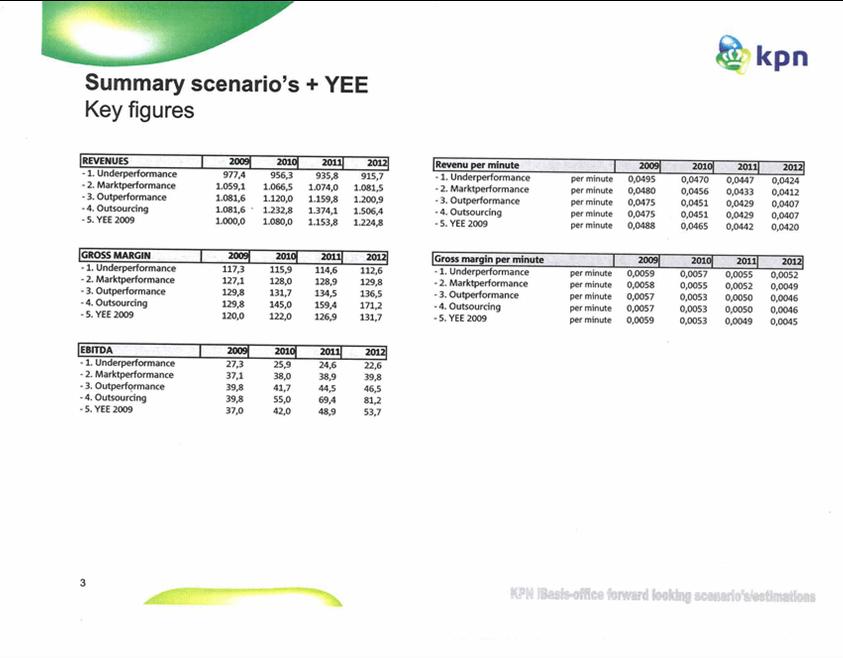
| Summary scenario's + YEE Key figures REVENUES 2009J 2010 2011 2012 -1. Underperformance 977,4 956,3 935,8 915,7 - 2. Marktperformance 1.059,1 1.066,5 1.074,0 1.081,5 - 3. Outperformance 1.081,6 1.120,0 1.159,8 1.200,9 - 4. Outsourcing 1.081,6 1.232,8 1.374,1 1.506,4 -5. YEE 2009 1.000,0 1.080,0 1.153,8 1.224,8 Revenu per minute 1 2009 2010 2011 2012 -1. Underperformance per minute 0,0495 0,0470 0,0447 0,0424 - 2. Marktperformance per minute 0,0480 0,0456 0,0433 0,0412 - 3. Outperformance per minute 0,0475 0,0451 0,0429 0,0407 - 4. Outsourcing per minute 0,0475 0,0451 0,0429 0,0407 - 5. YEE 2009 per minute 0,0488 0,0465 0,0442 0,0420 [GROSS MARGIN 2009 2010 2011 2012 -1. Underperformance 117,3 115,9 114,6 112,6 - 2. Marktperformance 127,1 128,0 128,9 129,8 - 3. Outperformance 129,8 131,7 134,5 136,5 - 4. Outsourcing 129,8 145,0 159,4 171,2 - 5. YEE 2009 120,0 122,0 126,9 131,7 Gross margin per minute 1 2009J 2010 2011 2012 -1. Underperformance per minute 0,0059 0,0057 0,0055 0,0052 - 2. Marktperformance per minute 0,0058 0,0055 0,0052 0,0049 - 3. Outperformance per minute 0,0057 0,0053 0,0050 0,0046 - 4. Outsourcing per minute 0,0057 0,0053 0,0050 0,0046 - 5. YEE 2009 per minute 0,0059 0,0053 0,0049 0,0045 EBITDA 1 2009 2010 2011 2012 -1. Underperformance 27,3 25,9 24,6 22,6 - 2. Marktperformance 37,1 38,0 38,9 39,8 - 3. Outperformance 39,8 41,7 44,5 46,5 - 4. Outsourcing 39,8 55,0 69,4 81,2 - 5. YEE 2009 37,0 42,0 48,9 53,7 KPN IBasis-office forward looking scenario’s/eliminations 3 |