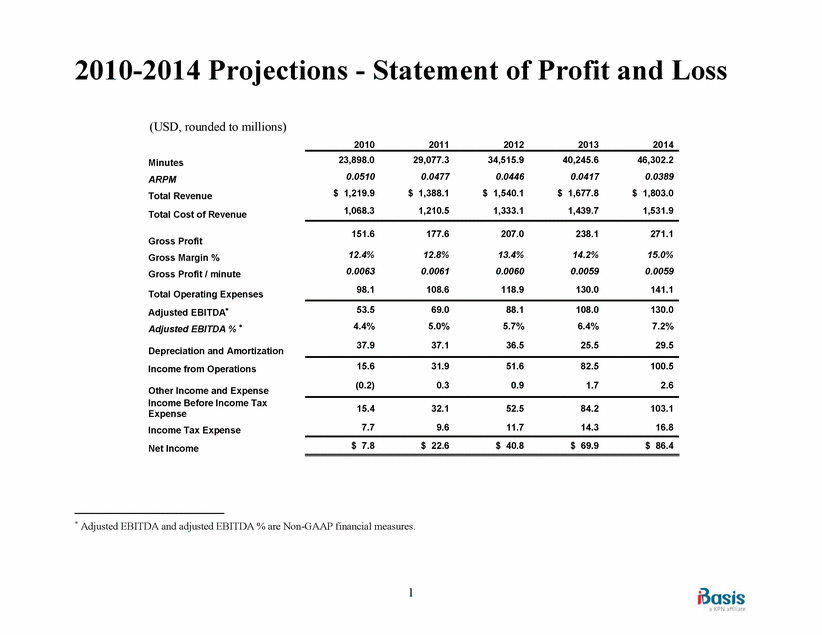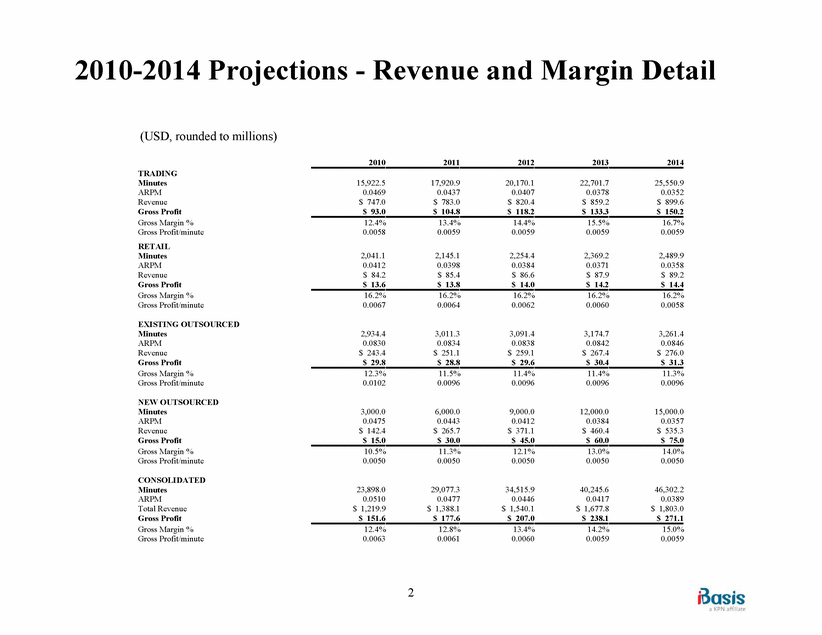
| 2010-2014 Projections - Revenue and Margin Detail (USD, rounded to millions) TRADING Minutes ARPMRevenue Gross Profit Gross Margin % Gross Profit/minute RETAIL Minutes ARPMRevenue Gross Profit Gross Margin % Gross Profit/minute EXISTING OUTSOURCED Minutes ARPMRevenue Gross Profit Gross Margin % Gross Profit/minute NEW OUTSOURCED Minutes ARPMRevenue Gross Profit Gross Margin % Gross Profit/minute CONSOLIDATED Minutes ARPMTotal Revenue Gross Profit Gross Margin % Gross Profit/minute 2010 2011 2012 2013 2014 15,922.5 17,920.9 20,170.1 22,701.7 25,550.9 0.0469 0.0437 0.0407 0.0378 0.0352 $ 747.0 $ 783.0 $ 820.4 $ 859.2 $ 899.6 $ 93.0 $ 104.8 $ 118.2 $ 133.3 $ 150.2 12.4% 13.4% 0.0058 0.0059 2,041.1 2,145.1 0.0412 0.0398 $ 84.2 $ 85.4 $ 13.6 $ 13.8 14.4% 0.0059 2,254.4 0.0384 $ 86.6 $ 14.0 15.5% 0.0059 2,369.2 0.0371 $ 87.9 $ 14.2 16.7% 0.0059 2,489.9 0.0358 $ 89.2 $ 14.4 16.2% 16.2% 0.0067 0.0064 2,934.4 3,011.3 0.0830 0.0834 $ 243.4 $ 251.1 $ 29.8 $ 28.8 16.2% 0.0062 3,091.4 0.0838 $ 259.1 $ 29.6 16.2% 0.0060 3,174.7 0.0842 $ 267.4 $ 30.4 16.2% 0.0058 3,261.4 0.0846 $ 276.0 $ 31.3 12.3% 11.5% 0.0102 0.0096 3,000.0 6,000.0 0.0475 0.0443 $ 142.4 $ 265.7 $ 15.0 $ 30.0 11.4% 0.0096 9,000.0 0.0412 $ 371.1 $ 45.0 11.4% 0.0096 12,000.0 0.0384 $ 460.4 $ 60.0 11.3% 0.0096 15,000.0 0.0357 $ 535.3 $ 75.0 10.5% 11.3% 0.0050 0.0050 23,898.0 29,077.3 0.0510 0.0477 $ 1,219.9 $ 1,388.1 $ 151.6 $ 177.6 12.1% 0.0050 34,515.9 0.0446 $ 1,540.1 $ 207.0 13.0% 0.0050 40,245.6 0.0417 $ 1,677.8 $ 238.1 14.0% 0.0050 46,302.2 0.0389 $ 1,803.0 $ 271.1 12.4% 12.8% 13.4% 14.2% 15.0% 0.0063 0.0061 0.0060 0.0059 0.0059 2 |
