EXHIBIT 99.1
CIRCOR Reports Second-Quarter 2014 Financial Results
Burlington, MA - August 1, 2014 - CIRCOR International, Inc. (NYSE: CIR), a leading provider of valves and other highly engineered products for markets including oil & gas, power generation and aerospace & defense, today announced financial results for the second quarter ended June 29, 2014.
Second-Quarter 2014 Highlights
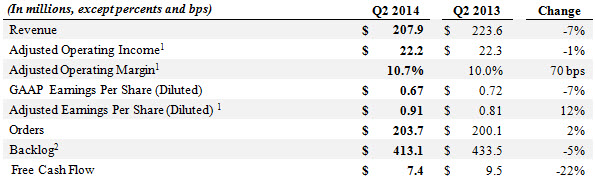
| • | Adjusted operating margin expanded 70 basis points to 10.7% |
| • | Adjusted EPS grew 12% to $0.91 |
| • | Year-to-date free cash flow was $21.8 million, 82% of net income |
| • | Orders up 2% |
| • | Growth and restructuring initiatives remain on track |
“CIRCOR continued to demonstrate strong bottom-line improvement during the second quarter,” said Scott Buckhout, CIRCOR President and Chief Executive Officer. “We achieved a 70 basis point increase in adjusted operating margin to 10.7% largely driven by restructuring and cost control initiatives.”
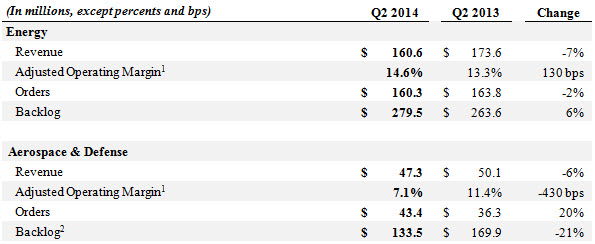
“Similar to the first quarter, second-quarter quoting activity remained strong in upstream oil and gas, as well as in power generation; however, actual bookings continue to be slow. In our Aerospace & Defense business, bookings were up over the prior year.”
“Our ability to meet our bottom-line expectations is a result of our focus on expanding margins through operational excellence and the CIRCOR simplification program. We expect that our margin expansion initiatives will gain further traction throughout the year. ”
“We continue to make investments in transforming CIRCOR into a growth company. We are increasing our sales and engineering capacity in key international growth markets while we focus more resources on developing innovative new products,” concluded Buckhout.
Third-Quarter 2014 Guidance
For the third quarter of 2014, the Company expects:
| • | Revenues in the range of $200 million to $215 million; |
| • | Adjusted earnings per share, excluding restructuring and special charges, in the range of $0.87 to $0.94; and, |
| • | Restructuring and special related charges of approximately $1.6 million to $2.0 million. |
1
Selected Consolidated Results
Segment Results
1. Consolidated and Segment Results exclude special and restructuring charges. $1.3 million and $2.3 million related to restructuring actions during Q2 2014 and Q2 2013, respectively, as well as $5.1 million in inventory charges related to the exit of certain landing gear product lines recorded during Q2 2014. Refer to reconciliation to commonly used US GAAP terms.
2. Consolidated and Aerospace & Defense Segment Backlog reflects a Q2 2014 reduction of $28.6 million associated with the exit of certain landing gear product lines.
Conference Call Information
CIRCOR International will hold a conference call to review its financial results today, August 1, 2014, at 10:00 a.m. ET. To listen to the conference call and view the accompanying presentation slides, visit “Webcasts & Presentations” in the “Investors” section of the CIRCOR website. The live call also can be accessed by dialing (877) 407-5790 or (201) 689-8328. The webcast will be archived for one year on the Company’s website.
Use of Non-GAAP Financial Measures
Adjusted net income, adjusted earnings per diluted share, adjusted operating income, adjusted operating margin, and free cash flow are non-GAAP financial measures and are intended to serve as a complement to results provided in accordance with accounting principles generally accepted in the United States. CIRCOR believes that such information provides an additional measurement and consistent historical
2
comparison of the Company’s performance. A reconciliation of the non-GAAP financial measures to the most directly comparable GAAP measures is available in this news release.
Safe Harbor Statement
This press release contains forward-looking statements within the meaning of Section 27A of the Securities Act of 1933, as amended, and Section 21E of the Securities Exchange Act of 1934, as amended. Reliance should not be placed on forward-looking statements because they involve unknown risks, uncertainties and other factors, which are, in some cases, beyond the control of CIRCOR. Any statements in this press release that are not statements of historical fact are forward-looking statements, including, but not limited to, those relating to CIRCOR’s future performance, including third-quarter revenue and earnings guidance and estimated total annualized pre-tax savings from restructuring actions. Actual events, performance or results could differ materially from the anticipated events, performance or results expressed or implied by such forward-looking statements. BEFORE MAKING ANY INVESTMENT DECISIONS REGARDING OUR COMPANY, WE STRONGLY ADVISE YOU TO READ THE SECTION ENTITLED "RISK FACTORS" IN OUR MOST RECENT ANNUAL REPORT ON FORM 10-K AND SUBSEQUENT REPORTS ON FORMS 10-Q, WHICH CAN BE ACCESSED UNDER THE "INVESTORS" LINK OF OUR WEBSITE AT WWW.CIRCOR.COM. We undertake no obligation to publicly update or revise any forward-looking statement, whether as a result of new information, future events or otherwise.
About CIRCOR International, Inc.
CIRCOR International, Inc. designs, manufactures and markets highly engineered products and sub-systems for markets including oil & gas, power generation and aerospace & defense. With more than 7,000 customers in over 100 countries, CIRCOR has a diversified product portfolio with recognized, market-leading brands that fulfill its customers’ unique application needs. The Company’s strategy is to grow organically and through complementary acquisitions; simplify CIRCOR’s operations; achieve world class operational excellence; and attract and retain top industry talent. For more information, visit the Company’s investor relations website at http://investors.circor.com.
Contact:
Rajeev Bhalla
Executive Vice President & Chief Financial Officer
CIRCOR International
(781) 270-1200
3
CIRCOR INTERNATIONAL, INC. CONSOLIDATED STATEMENT OF INCOME (in thousands, except share data) UNAUDITED | |||||||||||||||
| Three Months Ended | Six Months Ended | ||||||||||||||
| June 29, 2014 | June 30, 2013 | June 29, 2014 | June 30, 2013 | ||||||||||||
| Net revenues | $ | 207,884 | $ | 223,644 | $ | 419,070 | $ | 429,042 | |||||||
| Cost of revenues | 148,184 | 153,538 | 294,731 | 299,086 | |||||||||||
| GROSS PROFIT | 59,700 | 70,106 | 124,339 | 129,956 | |||||||||||
| Selling, general and administrative expenses | 42,609 | 47,596 | 87,498 | 93,168 | |||||||||||
| Special charges, net | 1,257 | 2,254 | 100 | 3,632 | |||||||||||
| OPERATING INCOME | 15,834 | 20,256 | 36,741 | 33,156 | |||||||||||
| Other (income) expense: | |||||||||||||||
| Interest expense, net | 891 | 838 | 1,809 | 1,625 | |||||||||||
| Other (income) expense, net | (384 | ) | 626 | (853 | ) | 1,239 | |||||||||
| TOTAL OTHER EXPENSE, NET | 507 | 1,464 | 956 | 2,864 | |||||||||||
| INCOME BEFORE INCOME TAXES | 15,328 | 18,792 | 35,785 | 30,292 | |||||||||||
| Provision for income taxes | 3,402 | 6,124 | 9,227 | 9,715 | |||||||||||
| NET INCOME | $ | 11,926 | $ | 12,667 | $ | 26,558 | $ | 20,577 | |||||||
| Earnings per common share: | |||||||||||||||
| Basic | $ | 0.68 | $ | 0.72 | $ | 1.51 | $ | 1.17 | |||||||
| Diluted | $ | 0.67 | $ | 0.72 | $ | 1.50 | $ | 1.17 | |||||||
| Weighted average number of common shares outstanding: | |||||||||||||||
| Basic | 17,665 | 17,565 | 17,643 | 17,539 | |||||||||||
| Diluted | 17,767 | 17,607 | 17,754 | 17,569 | |||||||||||
| Dividends paid per common share | $ | 0.0375 | $ | 0.0375 | $ | 0.0750 | $ | 0.0750 | |||||||
4
CIRCOR INTERNATIONAL, INC. CONSOLIDATED STATEMENTS OF CASH FLOWS (in thousands) (UNAUDITED) | |||||||
| Six Months Ended | |||||||
| June 29, 2014 | June 30, 2013 | ||||||
| OPERATING ACTIVITIES | |||||||
| Net income | $ | 26,558 | $ | 20,577 | |||
| Adjustments to reconcile net income to net cash provided by operating activities: | |||||||
| Depreciation | 8,185 | 8,035 | |||||
| Amortization | 1,591 | 1,509 | |||||
| Compensation expense of share-based plans | 4,020 | 2,156 | |||||
| Tax effect of share-based plan compensation | (971 | ) | (422 | ) | |||
| (Gain) on disposal of property, plant and equipment | (54 | ) | (129 | ) | |||
| Changes in operating assets and liabilities: | |||||||
| Trade accounts receivable, net | (23,705 | ) | (9,406 | ) | |||
| Inventories, net | 3,600 | (4,059 | ) | ||||
| Prepaid expenses and other assets | 143 | (2,412 | ) | ||||
| Accounts payable, accrued expenses and other liabilities | 7,988 | 3,583 | |||||
| Net cash provided by operating activities | 27,355 | 19,432 | |||||
| INVESTING ACTIVITIES | |||||||
| Additions to property, plant and equipment | (5,603 | ) | (8,808 | ) | |||
| Proceeds from the sale of property, plant and equipment | 32 | 314 | |||||
| Net cash used in investing activities | (5,571 | ) | (8,494 | ) | |||
| FINANCING ACTIVITIES | |||||||
| Proceeds from long-term debt | 81,910 | 74,255 | |||||
| Payments of long-term debt | (88,776 | ) | (84,679 | ) | |||
| Dividends paid | (1,341 | ) | (1,340 | ) | |||
| Proceeds from the exercise of stock options | 237 | 1,498 | |||||
| Tax effect of share-based compensation | 971 | 422 | |||||
| Net cash used in financing activities | (6,999 | ) | (9,844 | ) | |||
| Effect of exchange rate changes on cash and cash equivalents | (639 | ) | (2,002 | ) | |||
| INCREASE (DECREASE) IN CASH AND CASH EQUIVALENTS | 14,146 | (907 | ) | ||||
| Cash and cash equivalents at beginning of year | 102,180 | 61,738 | |||||
| CASH AND CASH EQUIVALENTS AT END OF PERIOD | $ | 116,326 | $ | 60,831 | |||
| Cash paid during the year for: | |||||||
| Income taxes | $ | 6,375 | $ | 3,464 | |||
| Interest | $ | 1,358 | $ | 1,054 | |||
5
CIRCOR INTERNATIONAL, INC. CONSOLIDATED BALANCE SHEETS (in thousands) | |||||||
| June 29, 2014 | December 31, 2013 | ||||||
| ASSETS | (unaudited) | ||||||
| CURRENT ASSETS: | |||||||
| Cash and cash equivalents | $ | 116,326 | $ | 102,180 | |||
| Short-term investments | 95 | 95 | |||||
| Trade accounts receivable, less allowance for doubtful accounts of $2,832 and $2,449, respectively | 168,541 | 144,742 | |||||
| Inventories, net | 196,389 | 199,404 | |||||
| Prepaid expenses and other current assets | 19,817 | 19,815 | |||||
| Deferred income tax asset | 19,476 | 17,686 | |||||
| Total Current Assets | 520,644 | 483,922 | |||||
| PROPERTY, PLANT AND EQUIPMENT, NET | 105,461 | 107,724 | |||||
| OTHER ASSETS: | |||||||
| Goodwill | 76,860 | 75,876 | |||||
| Intangibles, net | 34,476 | 35,656 | |||||
| Deferred income tax asset | 16,779 | 18,579 | |||||
| Other assets | 4,866 | 4,893 | |||||
| TOTAL ASSETS | $ | 759,086 | $ | 726,650 | |||
| LIABILITIES AND SHAREHOLDERS’ EQUITY | |||||||
| CURRENT LIABILITIES: | |||||||
| Accounts payable | $ | 81,886 | $ | 70,589 | |||
| Accrued expenses and other current liabilities | 63,023 | 57,507 | |||||
| Accrued compensation and benefits | 24,369 | 31,289 | |||||
| Income taxes payable | 6,396 | 3,965 | |||||
| Notes payable and current portion of long-term debt | 3,642 | 7,203 | |||||
| Total Current Liabilities | 179,316 | 170,553 | |||||
| LONG-TERM DEBT, NET OF CURRENT PORTION | 39,797 | 42,435 | |||||
| DEFERRED INCOME TAXES | 9,236 | 9,666 | |||||
| OTHER NON-CURRENT LIABILITIES | 23,375 | 27,109 | |||||
| SHAREHOLDERS’ EQUITY: | |||||||
| Common stock | 170 | 176 | |||||
| Additional paid-in capital | 274,580 | 269,884 | |||||
| Retained earnings | 227,868 | 202,930 | |||||
| Accumulated other comprehensive gain, net of taxes | 4,744 | 3,897 | |||||
| Total Shareholders’ Equity | 507,362 | 476,887 | |||||
| TOTAL LIABILITIES AND SHAREHOLDERS’ EQUITY | $ | 759,086 | $ | 726,650 | |||
6
CIRCOR INTERNATIONAL, INC. SUMMARY OF ORDERS AND BACKLOG (in millions) UNAUDITED | |||||||||||||||
| Three Months Ended | Six Months Ended | ||||||||||||||
| June 29, 2014 | June 30, 2013 | June 29, 2014 | June 30, 2013 | ||||||||||||
ORDERS (1) | |||||||||||||||
| Energy | $ | 160.3 | $ | 163.8 | $ | 319.9 | $ | 337.3 | |||||||
| Aerospace & Defense | 43.4 | 36.3 | 83.7 | 89.6 | |||||||||||
| Total orders | $ | 203.7 | $ | 200.1 | $ | 403.6 | $ | 426.9 | |||||||
BACKLOG (2) | June 29, 2014 | June 30, 2013 | |||||||||||||
| Energy | $ | 279.5 | $ | 263.6 | |||||||||||
Aerospace & Defense (3) | 133.5 | 169.9 | |||||||||||||
| Total backlog | $ | 413.1 | $ | 433.5 | |||||||||||
| Note 1: Orders do not include the foreign exchange impact due to the re-measurement of customer order backlog amounts denominated in foreign currencies. | |||||||||||||||
| Note 2: Backlog includes all unshipped customer orders. | |||||||||||||||
| Note 3: Aerospace & Defense backlog reflects a reduction of $28.6 million associated with the exit of certain landing gear product lines recorded in the second quarter of 2014. | |||||||||||||||
7
CIRCOR INTERNATIONAL, INC. SUMMARY REPORT BY SEGMENT (in thousands, except earnings per share) UNAUDITED | ||||||||||||||||||||||||
| 2013 | 2014 | |||||||||||||||||||||||
| 1ST QTR | 2ND QTR | 3RD QTR | 4TH QTR | TOTAL | 1ST QTR | 2ND QTR | TOTAL | |||||||||||||||||
| NET REVENUES | ||||||||||||||||||||||||
| Energy | $ | 157,104 | $ | 173,557 | $ | 167,660 | $ | 162,649 | $ | 660,970 | $ | 162,587 | $ | 160,580 | $ | 323,167 | ||||||||
| Aerospace & Defense | 48,294 | 50,087 | 47,071 | 51,386 | 196,838 | 48,599 | 47,304 | 95,903 | ||||||||||||||||
| Total | $ | 205,398 | $ | 223,644 | $ | 214,731 | $ | 214,035 | $ | 857,808 | $ | 211,186 | $ | 207,884 | $ | 419,070 | ||||||||
| ADJUSTED OPERATING MARGIN | ||||||||||||||||||||||||
| Energy | 10.8 | % | 13.3 | % | 15.2 | % | 17.1 | % | 14.1 | % | 13.8 | % | 14.6 | % | 14.2 | % | ||||||||
| Aerospace & Defense | 5.9 | % | 11.4 | % | 12.1 | % | 8.4 | % | 9.5 | % | 9.1 | % | 7.1 | % | 8.1 | % | ||||||||
| Segment operating margin | 9.6 | % | 12.9 | % | 14.5 | % | 15.0 | % | 13.0 | % | 12.7 | % | 12.9 | % | 12.8 | % | ||||||||
| Corporate expenses | (2.6 | )% | (2.9 | )% | (3.4 | )% | (3.5 | )% | (3.1 | )% | (3.4 | )% | (2.2 | )% | (2.8 | )% | ||||||||
| Adjusted operating margin | 7.1 | % | 10.0 | % | 11.1 | % | 11.6 | % | 9.9 | % | 9.4 | % | 10.7 | % | 10.0 | % | ||||||||
| Restructuring inventory charges | 0.1 | % | (0.1 | )% | — | % | 0.3 | % | 0.1 | % | — | % | 2.5 | % | 1.2 | % | ||||||||
| Impairment charges | — | % | — | % | — | % | 3.2 | % | 0.8 | % | — | % | — | % | — | % | ||||||||
| Special (recoveries) | — | % | — | % | (1.5 | )% | — | % | (0.4 | )% | (1.1 | )% | — | % | (0.5 | )% | ||||||||
| Special charges | 0.7 | % | 1.0 | % | 1.4 | % | 2.4 | % | 1.4 | % | 0.5 | % | 0.6 | % | 0.6 | % | ||||||||
| Total GAAP operating margin | 6.3 | % | 9.1 | % | 11.1 | % | 5.6 | % | 8.1 | % | 9.9 | % | 7.6 | % | 8.8 | % | ||||||||
8
CIRCOR INTERNATIONAL, INC. SUMMARY REPORT BY SEGMENT (in thousands, except earnings per share) UNAUDITED | ||||||||||||||||||||||||
| 2013 | 2014 | |||||||||||||||||||||||
| 1ST QTR | 2ND QTR | 3RD QTR | 4TH QTR | TOTAL | 1ST QTR | 2ND QTR | TOTAL | |||||||||||||||||
| ADJUSTED OPERATING INCOME | ||||||||||||||||||||||||
| Energy | $ | 16,940 | $ | 23,114 | $ | 25,441 | $ | 27,809 | $ | 93,304 | $ | 22,462 | $ | 23,502 | $ | 45,964 | ||||||||
| Aerospace & Defense | 2,864 | 5,724 | 5,705 | 4,342 | 18,635 | 4,426 | 3,362 | 7,788 | ||||||||||||||||
| Segment operating income | 19,804 | 28,838 | 31,146 | 32,151 | 111,939 | 26,888 | 26,864 | 53,752 | ||||||||||||||||
| Corporate expenses | (5,277 | ) | (6,570 | ) | (7,400 | ) | (7,400 | ) | (26,646 | ) | (7,137 | ) | (4,634 | ) | (11,771 | ) | ||||||||
| Adjusted operating income | 14,528 | 22,268 | 23,746 | 24,751 | 85,293 | 19,750 | 22,231 | 41,981 | ||||||||||||||||
| Restructuring inventory charges | 250 | (242 | ) | — | 638 | 646 | — | 5,139 | 5,139 | |||||||||||||||
| Impairment charges | — | — | — | 6,872 | 6,872 | — | — | — | ||||||||||||||||
| Special (recoveries) | — | — | (3,151 | ) | — | (3,151 | ) | (2,243 | ) | — | (2,243 | ) | ||||||||||||
| Special charges | 1,378 | 2,254 | 2,961 | 5,160 | 11,752 | 1,086 | 1,257 | 2,343 | ||||||||||||||||
| Total GAAP operating income | 12,900 | 20,256 | 23,936 | 12,081 | 69,174 | 20,907 | 15,834 | 36,741 | ||||||||||||||||
| INTEREST EXPENSE, NET | (787 | ) | (838 | ) | (745 | ) | (792 | ) | (3,162 | ) | (918 | ) | (891 | ) | (1,809 | ) | ||||||||
| OTHER (EXPENSE) INCOME, NET | (612 | ) | (626 | ) | (568 | ) | (167 | ) | (1,974 | ) | 468 | 384 | 853 | |||||||||||
| PRETAX INCOME | 11,501 | 18,792 | 22,623 | 11,122 | 64,038 | 20,457 | 15,328 | 35,785 | ||||||||||||||||
| PROVISION FOR INCOME TAXES | (3,592 | ) | (6,124 | ) | (4,903 | ) | (2,297 | ) | (16,916 | ) | (5,825 | ) | (3,402 | ) | (9,227 | ) | ||||||||
| EFFECTIVE TAX RATE | 31.2 | % | 32.6 | % | 21.7 | % | 20.7 | % | 26.4 | % | 28.5 | % | 22.2 | % | 25.8 | % | ||||||||
| NET INCOME | $ | 7,908 | $ | 12,668 | $ | 17,720 | $ | 8,825 | $ | 47,121 | $ | 14,632 | $ | 11,926 | $ | 26,558 | ||||||||
| Weighted Average Common Shares Outstanding (Diluted) | 17,529 | 17,607 | 17,667 | 17,710 | 17,629 | 17,741 | 17,767 | 17,754 | ||||||||||||||||
| EARNINGS PER COMMON SHARE (Diluted) | $ | 0.45 | $ | 0.72 | $ | 1.00 | $ | 0.50 | $ | 2.67 | $ | 0.82 | $ | 0.67 | $ | 1.50 | ||||||||
| ADJUSTED EBITDA | $ | 18,682 | $ | 26,419 | $ | 27,850 | $ | 29,441 | $ | 102,392 | $ | 27,387 | $ | 14,744 | $ | 42,131 | ||||||||
| ADJUSTED EBITDA AS A % OF SALES | 9.1 | % | 11.8 | % | 13.0 | % | 13.8 | % | 11.9 | % | 13.0 | % | 7.1 | % | 10.1 | % | ||||||||
| CAPITAL EXPENDITURES | $ | 4,707 | $ | 4,100 | $ | 4,772 | $ | 3,749 | $ | 17,328 | $ | 2,670 | $ | 2,933 | $ | 5,603 | ||||||||
9
CIRCOR INTERNATIONAL, INC. RECONCILIATION OF KEY PERFORMANCE MEASURES TO COMMONLY USED GENERALLY ACCEPTED ACCOUNTING PRINCIPLE TERMS (in thousands, except earnings per share) UNAUDITED | ||||||||||||||||||||||||
| 2013 | 2014 | |||||||||||||||||||||||
| 1ST QTR | 2ND QTR | 3RD QTR | 4TH QTR | TOTAL | 1ST QTR | 2ND QTR | TOTAL | |||||||||||||||||
| FREE CASH FLOW AS % OF NET INCOME | 14 | % | 75 | % | 167 | % | 167 | % | 116 | % | 98 | % | 62 | % | 82 | % | ||||||||
| FREE CASH FLOW | $ | 1,100 | $ | 9,525 | $ | 29,557 | $ | 14,696 | $ | 54,878 | $ | 14,387 | $ | 7,365 | $ | 21,752 | ||||||||
| ADD: | ||||||||||||||||||||||||
| Capital Expenditures | 4,707 | 4,100 | 4,772 | 3,749 | 17,328 | 2,670 | 2,933 | 5,603 | ||||||||||||||||
| NET CASH PROVIDED BY OPERATING ACTIVITIES | $ | 5,807 | $ | 13,625 | $ | 34,329 | $ | 18,445 | $ | 72,206 | $ | 17,057 | $ | 10,298 | $ | 27,355 | ||||||||
| NET DEBT (CASH) | $ | 8,814 | $ | (1,376 | ) | $ | (36,466 | ) | $ | (52,637 | ) | $ | (52,637 | ) | $ | (66,056 | ) | $ | (72,982 | ) | $ | (72,982 | ) | |
| ADD: | ||||||||||||||||||||||||
| Cash & Cash Equivalents | 57,633 | 60,831 | 86,285 | 102,180 | 102,180 | 122,097 | 116,326 | 116,326 | ||||||||||||||||
| Investments | 99 | 96 | 98 | 95 | 95 | 92 | 95 | 95 | ||||||||||||||||
| TOTAL DEBT | $ | 66,546 | $ | 59,551 | $ | 49,917 | $ | 49,638 | $ | 49,638 | $ | 56,133 | $ | 43,439 | $ | 43,439 | ||||||||
| DEBT AS % OF EQUITY | 16 | % | 14 | % | 11 | % | 10 | % | 10 | % | 11 | % | 9 | % | 9 | % | ||||||||
| TOTAL DEBT | 66,546 | 59,551 | 49,917 | 49,638 | 49,638 | 56,133 | 43,439 | 43,439 | ||||||||||||||||
| TOTAL SHAREHOLDERS' EQUITY | 418,819 | 432,151 | 459,058 | 476,887 | 476,887 | 492,601 | 507,363 | 507,363 | ||||||||||||||||
10
CIRCOR INTERNATIONAL, INC. RECONCILIATION OF KEY PERFORMANCE MEASURES TO COMMONLY USED GENERALLY ACCEPTED ACCOUNTING PRINCIPLE TERMS (in thousands, except earnings per share) UNAUDITED | ||||||||||||||||||||||||
| 2013 | 2014 | |||||||||||||||||||||||
| 1ST QTR | 2ND QTR | 3RD QTR | 4TH QTR | TOTAL | 1ST QTR | 2ND QTR | TOTAL | |||||||||||||||||
| ADJUSTED OPERATING INCOME | $ | 14,528 | $ | 22,268 | $ | 23,746 | $ | 24,751 | $ | 85,293 | $ | 19,750 | $ | 22,230 | $ | 41,980 | ||||||||
| LESS: | ||||||||||||||||||||||||
| Inventory restructuring charges | 250 | (242 | ) | — | 638 | 646 | — | 5,139 | 5,139 | |||||||||||||||
| Impairment charges | — | — | — | 6,872 | 6,872 | — | — | — | ||||||||||||||||
| Special (recoveries) | — | — | (3,151 | ) | — | (3,151 | ) | (2,243 | ) | — | (2,243 | ) | ||||||||||||
| Special charges | 1,378 | 2,254 | 2,961 | 5,160 | 11,753 | 1,086 | 1,257 | 2,343 | ||||||||||||||||
| OPERATING INCOME | $ | 12,900 | $ | 20,256 | $ | 23,936 | $ | 12,081 | $ | 69,173 | $ | 20,907 | $ | 15,834 | $ | 36,741 | ||||||||
| ADJUSTED NET INCOME | $ | 9,043 | $ | 14,044 | $ | 16,439 | $ | 16,773 | $ | 56,299 | $ | 13,916 | $ | 16,090 | $ | 30,006 | ||||||||
| LESS: | ||||||||||||||||||||||||
| Inventory restructuring charges, net of tax | 174 | (165 | ) | — | 396 | 405 | — | 3,316 | 3,316 | |||||||||||||||
| Impairment charges, net of tax | — | — | — | 4,261 | 4,261 | — | — | — | ||||||||||||||||
| Special (recoveries), net of tax | — | — | (3,151 | ) | — | (3,151 | ) | (1,391 | ) | — | (1,391 | ) | ||||||||||||
| Special charges, net of tax | 961 | 1,541 | 1,870 | 3,291 | 7,663 | 675 | 848 | 1,523 | ||||||||||||||||
| NET INCOME | $ | 7,908 | $ | 12,668 | $ | 17,720 | $ | 8,825 | $ | 47,121 | $ | 14,632 | $ | 11,926 | $ | 26,558 | ||||||||
| ADJUSTED EARNINGS PER SHARE | $ | 0.52 | $ | 0.81 | $ | 0.93 | $ | 0.95 | $ | 3.21 | $ | 0.78 | $ | 0.91 | $ | 1.70 | ||||||||
| LESS: | ||||||||||||||||||||||||
| Inventory restructuring charges, net of tax | 0.01 | (0.01 | ) | — | 0.02 | 0.02 | — | 0.19 | 0.19 | |||||||||||||||
| Impairment charges, net of tax | — | — | — | 0.24 | 0.24 | — | — | — | ||||||||||||||||
| Special (recoveries), net of tax | — | — | (0.18 | ) | — | (0.18 | ) | (0.08 | ) | — | (0.08 | ) | ||||||||||||
| Special charges, net of tax | 0.06 | 0.10 | 0.11 | 0.19 | 0.46 | 0.04 | 0.05 | 0.09 | ||||||||||||||||
| EARNINGS PER COMMON SHARE (Diluted) | $ | 0.45 | $ | 0.72 | $ | 1.00 | $ | 0.50 | $ | 2.67 | $ | 0.82 | $ | 0.67 | $ | 1.50 | ||||||||
11
CIRCOR INTERNATIONAL, INC. RECONCILIATION OF KEY PERFORMANCE MEASURES TO COMMONLY USED GENERALLY ACCEPTED ACCOUNTING PRINCIPLE TERMS (in thousands, except earnings per share) UNAUDITED | ||||||||||||||||||||||||
| 2013 | 2014 | |||||||||||||||||||||||
| 1ST QTR | 2ND QTR | 3RD QTR | 4TH QTR | TOTAL | 1ST QTR | 2ND QTR | TOTAL | |||||||||||||||||
| EBITDA | $ | 17,054 | $ | 24,407 | $ | 23,368 | $ | 11,914 | $ | 86,272 | $ | 26,230 | $ | 21,140 | $ | 47,370 | ||||||||
| LESS: | ||||||||||||||||||||||||
| Interest expense, net | (787 | ) | (838 | ) | (745 | ) | (792 | ) | (3,162 | ) | (918 | ) | (891 | ) | (1,809 | ) | ||||||||
| Depreciation | (4,009 | ) | (4,026 | ) | (3,908 | ) | (4,091 | ) | (16,034 | ) | (4,069 | ) | (4,116 | ) | (8,185 | ) | ||||||||
| Amortization | (758 | ) | (751 | ) | (764 | ) | (766 | ) | (3,039 | ) | (786 | ) | (805 | ) | (1,591 | ) | ||||||||
| Provision for income taxes | (3,592 | ) | (6,124 | ) | (4,903 | ) | (2,297 | ) | (16,916 | ) | (5,825 | ) | (3,402 | ) | (9,227 | ) | ||||||||
| NET INCOME | $ | 7,908 | $ | 12,668 | $ | 17,720 | $ | 8,825 | $ | 47,121 | $ | 14,632 | $ | 11,926 | $ | 26,558 | ||||||||
| ADJUSTED EBITDA | $ | 18,682 | $ | 26,419 | $ | 27,850 | $ | 29,441 | $ | 102,392 | $ | 27,387 | $ | 14,744 | $ | 42,131 | ||||||||
| Inventory restructuring charges | (250 | ) | 242 | — | (638 | ) | (646 | ) | — | 5,139 | 5,139 | |||||||||||||
| Impairment charges | — | — | — | (6,872 | ) | (6,872 | ) | — | — | — | ||||||||||||||
| Special (recoveries) | — | — | 3,151 | — | 3,151 | (2,243 | ) | — | (2,243 | ) | ||||||||||||||
| Special charges | (1,378 | ) | (2,254 | ) | (2,961 | ) | (5,160 | ) | (11,753 | ) | 1,086 | 1,257 | 2,343 | |||||||||||
| Interest expense, net | (787 | ) | (838 | ) | (745 | ) | (792 | ) | (3,162 | ) | (918 | ) | (891 | ) | (1,809 | ) | ||||||||
| Depreciation | (4,009 | ) | (4,026 | ) | (3,908 | ) | (4,091 | ) | (16,034 | ) | (4,069 | ) | (4,116 | ) | (8,185 | ) | ||||||||
| Amortization | (758 | ) | (751 | ) | (764 | ) | (766 | ) | (3,039 | ) | (786 | ) | (805 | ) | (1,591 | ) | ||||||||
| Provision for income taxes | (3,592 | ) | (6,124 | ) | (4,903 | ) | (2,297 | ) | (16,916 | ) | (5,825 | ) | (3,402 | ) | (9,227 | ) | ||||||||
| NET INCOME | $ | 7,908 | $ | 12,668 | $ | 17,720 | $ | 8,825 | $ | 47,121 | $ | 14,632 | $ | 11,926 | $ | 26,558 | ||||||||
12
CIRCOR INTERNATIONAL, INC. RECONCILIATION OF FUTURE PERFORMANCE MEASURES TO COMMONLY USED GENERALLY ACCEPTED ACCOUNTING PRINCIPLE TERMS UNAUDITED | ||||||||
| 3rd Quarter 2014 | ||||||||
| Low | High | |||||||
| REVENUE (in millions) | $ | 200 | $ | 215 | ||||
| EXPECTED ADJUSTED EARNINGS PER SHARE (DILUTIVE) | $ | 0.87 | $ | 0.94 | ||||
| LESS: | ||||||||
| Restructuring related charges | } | $ | 0.08 | $ | 0.06 | |||
| Special charges | ||||||||
| EXPECTED EARNINGS PER COMMON SHARE (Diluted) | $ | 0.79 | $ | 0.88 | ||||
| Note: Assumes 26% to 27% tax rate and exchange rates at present values. | ||||||||
13