INDUSTRIAL AEROSPACE & DEFENSE Third-Quarter 2022 Earnings Call November 14, 2022 EXHIBIT 99.2
Forward-Looking Statements This presentation contains “forward-looking statements” within the meaning of the safe harbor provisions of the U.S. Private Securities Litigation Reform Act of 1995. All statements that address expectations or projections about the future, including with respect to our expectations for our performance in fiscal year 2022 or business outlook for fiscal year 2023 are forward looking statements. Actual results may differ materially from the expectations the Company describes in its forward-looking statements. Substantial reliance should not be placed on forward-looking statements because they involve unknown risks, uncertainties and other factors, which are, in some cases, beyond the control of CIRCOR. Important factors that could cause actual results to differ materially from expectations include, but are not limited to the Company’s ability to achieve expected results in pricing and cost out actions and the related impact on margins and cash flow; the effectiveness of the Company’s internal control over financial reporting and disclosure controls and procedures; the remediation of the material weaknesses in the Company’s internal control over financial reporting or other potential weaknesses of which the Company is not currently aware or which have not been detected; the timing and outcome, if any, of the Company’s strategic alternatives review; the impact on the Company of the situation in Russia and Ukraine; uncertainty associated with the current worldwide economic conditions and the continuing impact on economic and financial conditions in the United States and around the world, including as a result of the COVID-19 pandemic, rising inflation, increasing interest rates, natural disasters, military conflicts, including the conflict between Russia and Ukraine, terrorist attacks and other similar matters and the risks detailed from time to time in the Company’s periodic reports filed with the SEC. Before making any investment decisions regarding CIRCOR, the Company strongly advises you to read the section entitled “Risk Factors” in its 2021 Annual Report on Form 10-K, which can be accessed under the “Investors” link of the Company’s website at www.circor.com. The Company undertakes no obligation to publicly update or revise any forward-looking statement, whether as a result of new information, future events or otherwise. 2
Use of Non-GAAP Financial Measures Within this presentation, the Company uses the non-GAAP financial measures organic revenue, adjusted net income, adjusted EBITDA, adjusted operating income, adjusted operating margin, adjusted earnings per share, net debt and adjusted free cash flow. Non-GAAP financial measures are used by management in our financial and operating decision making because we believe they reflect our ongoing business and facilitate period-to-period comparisons. We believe that these non-GAAP financial measures provide useful information to investors and others in understanding and evaluating CIRCOR’s current operating performance and future prospects in the same manner as management does if they so choose. These non-GAAP financial measures also allow investors and others to compare CIRCOR’s current financial results with CIRCOR’s past financial results in a consistent manner. Specifically: • We exclude the FX impact on revenue as FX can materially change. We believe the FX impact are not indicative to our normal operating revenue. • We exclude costs and tax effects associated with special and restructuring activities, such as reducing overhead and consolidating facilities. We believe that the costs related to special and restructuring activities are not indicative of our normal operating costs. • We exclude certain acquisition-related costs, including significant transaction costs and amortization of inventory and fixed-asset step-ups and the related tax effects. We exclude these costs because we do not believe they are indicative of our normal operating costs. • We exclude the expense and tax effects associated with the non-cash amortization of acquisition-related intangible assets because a significant portion of the purchase price for acquisitions may be allocated to intangible assets that have lives up to 25 years. Exclusion of the non-cash amortization expense allows comparisons of operating results that are consistent over time for both our newly acquired and long-held businesses and with both acquisitive and non-acquisitive peer companies. • We exclude certain gains/losses and related tax effects, which are either isolated or cannot be expected to occur again with any predictability, and that we believe are not indicative of our normal operating gains and losses. For example, we exclude gains/losses from items such as the sale of a business, significant litigation-related matters and lump-sum pension plan settlements. • We exclude the results of discontinued operations. We exclude goodwill impairment charges. We exclude these costs because we do not believe they are indicative of our normal operating costs. • Due to the significance of recently sold or exited businesses and to provide a comparison of changes in our revenue and orders (an operating measure), we also discuss these changes on an “organic” basis. Organic is calculated assuming the divestitures and/or exited businesses are completed prior to July 3, 2022, were completed on January 1, 2021, and excluding the impact of changes in foreign currency exchange rates. 3
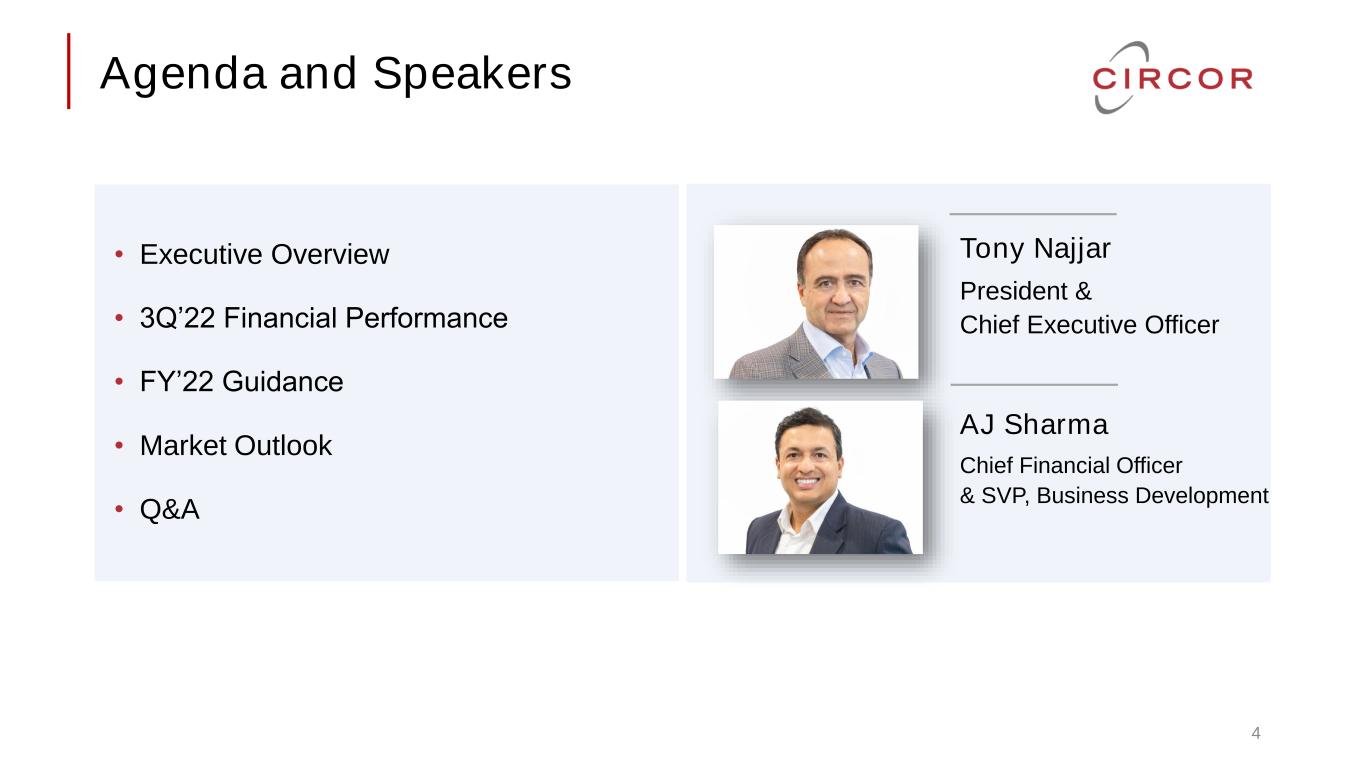
Agenda and Speakers • Executive Overview • 3Q’22 Financial Performance • FY’22 Guidance • Market Outlook • Q&A Tony Najjar President & Chief Executive Officer AJ Sharma Chief Financial Officer & SVP, Business Development 4
CEO Commentary 5 • People. Our teams demonstrated strong focus on execution and on our customers, and resilience delivering a great quarter, exceeding expectations. • Performance. We delivered 26% organic orders growth and 550 bps of margin expansion in the quarter, navigating ongoing supply chain and macroeconomic challenges. • Progress. We continued to make measurable progress on our strategic priorities: margin expansion, growth, and de-levering our balance sheet.
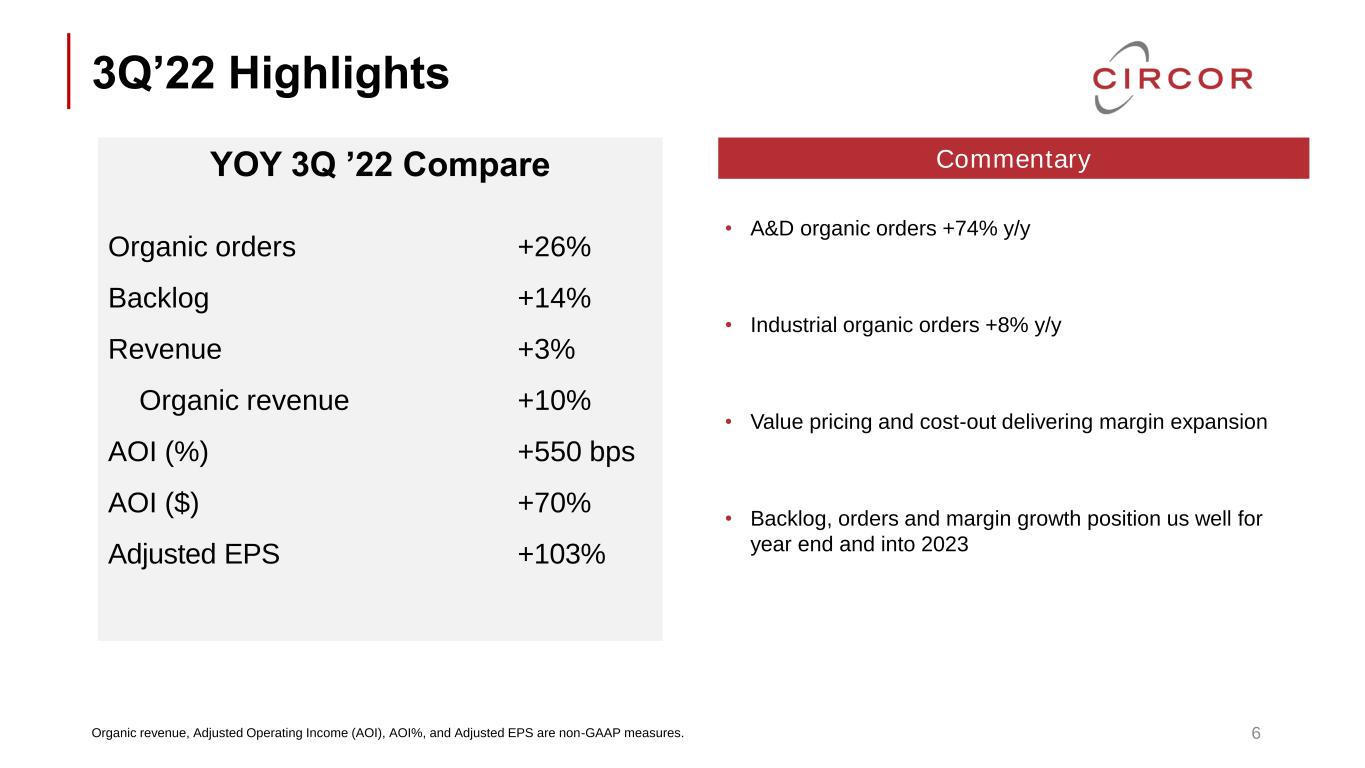
3Q’22 Highlights 6 • A&D organic orders +74% y/y • Industrial organic orders +8% y/y • Value pricing and cost-out delivering margin expansion • Backlog, orders and margin growth position us well for year end and into 2023 YOY 3Q ’22 Compare Organic orders +26% Backlog +14% Revenue +3% Organic revenue +10% AOI (%) +550 bps AOI ($) +70% Adjusted EPS +103% Commentary Organic revenue, Adjusted Operating Income (AOI), AOI%, and Adjusted EPS are non-GAAP measures.
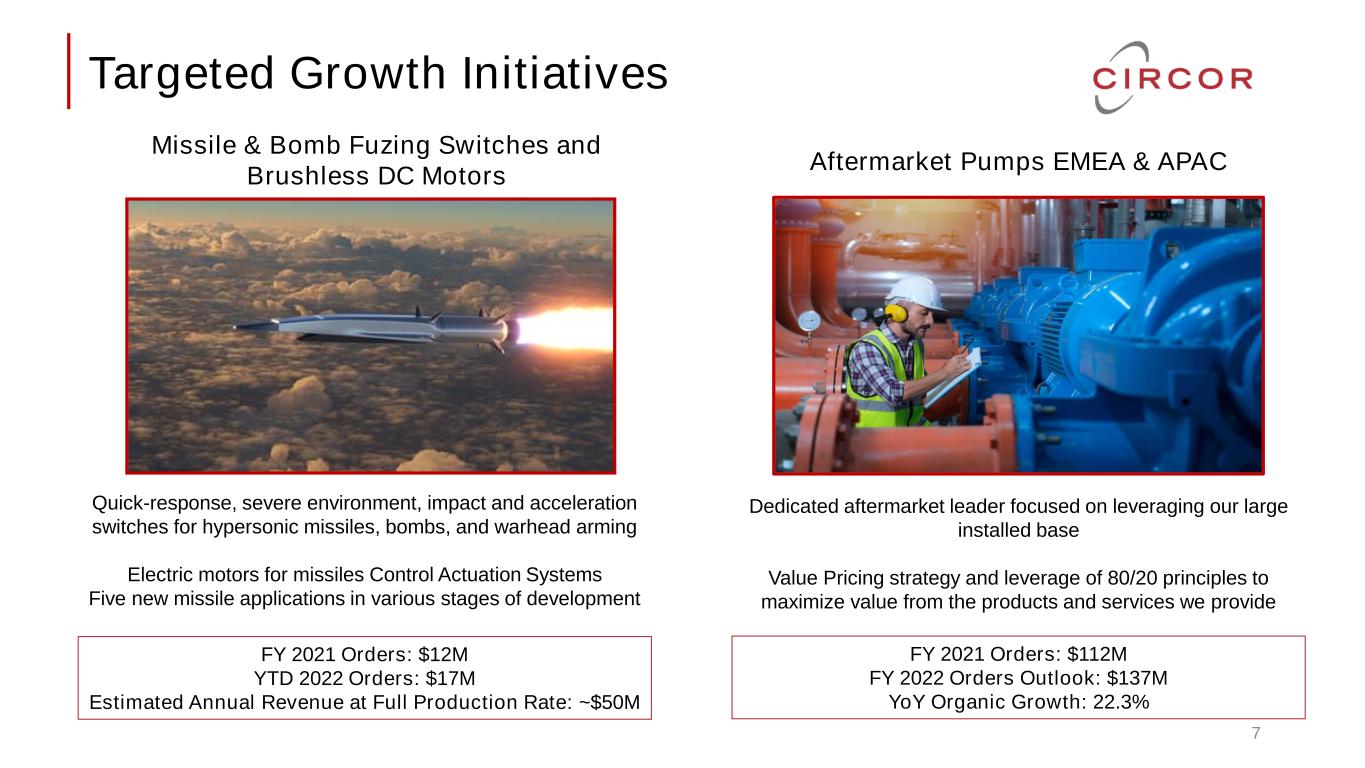
Aftermarket Pumps EMEA & APAC 7 Missile & Bomb Fuzing Switches and Brushless DC Motors Quick-response, severe environment, impact and acceleration switches for hypersonic missiles, bombs, and warhead arming Electric motors for missiles Control Actuation Systems Five new missile applications in various stages of development FY 2021 Orders: $12M YTD 2022 Orders: $17M Estimated Annual Revenue at Full Production Rate: ~$50M FY 2021 Orders: $112M FY 2022 Orders Outlook: $137M YoY Organic Growth: 22.3% Dedicated aftermarket leader focused on leveraging our large installed base Value Pricing strategy and leverage of 80/20 principles to maximize value from the products and services we provide Targeted Growth Initiatives
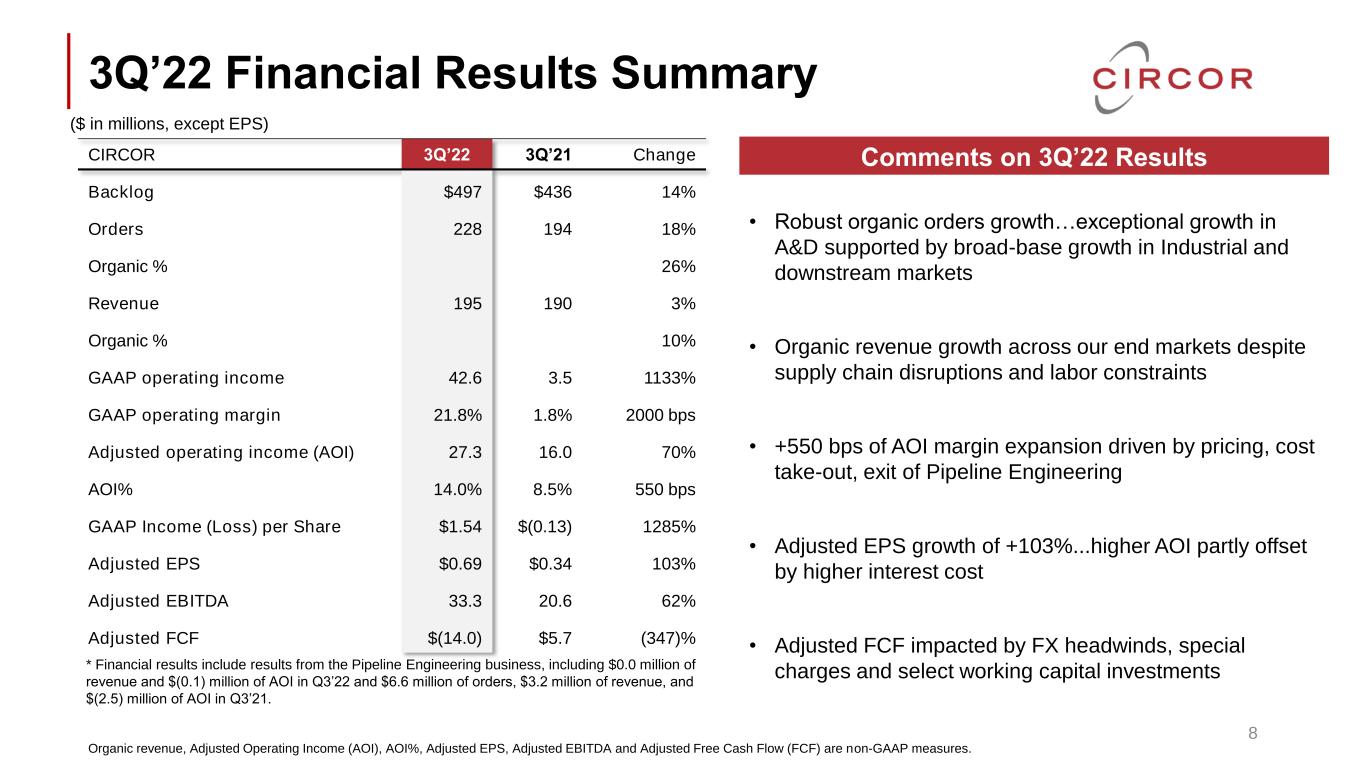
3Q’22 Financial Results Summary CIRCOR 3Q’22 3Q’21 Change Backlog $497 $436 14% Orders 228 194 18% Organic % 26% Revenue 195 190 3% Organic % 10% GAAP operating income 42.6 3.5 1133% GAAP operating margin 21.8% 1.8% 2000 bps Adjusted operating income (AOI) 27.3 16.0 70% AOI% 14.0% 8.5% 550 bps GAAP Income (Loss) per Share $1.54 $(0.13) 1285% Adjusted EPS $0.69 $0.34 103% Adjusted EBITDA 33.3 20.6 62% Adjusted FCF $(14.0) $5.7 (347)% 8 Comments on 3Q’22 Results • Robust organic orders growth…exceptional growth in A&D supported by broad-base growth in Industrial and downstream markets • Organic revenue growth across our end markets despite supply chain disruptions and labor constraints • +550 bps of AOI margin expansion driven by pricing, cost take-out, exit of Pipeline Engineering • Adjusted EPS growth of +103%...higher AOI partly offset by higher interest cost • Adjusted FCF impacted by FX headwinds, special charges and select working capital investments Organic revenue, Adjusted Operating Income (AOI), AOI%, Adjusted EPS, Adjusted EBITDA and Adjusted Free Cash Flow (FCF) are non-GAAP measures. ($ in millions, except EPS) * Financial results include results from the Pipeline Engineering business, including $0.0 million of revenue and $(0.1) million of AOI in Q3’22 and $6.6 million of orders, $3.2 million of revenue, and $(2.5) million of AOI in Q3’21.
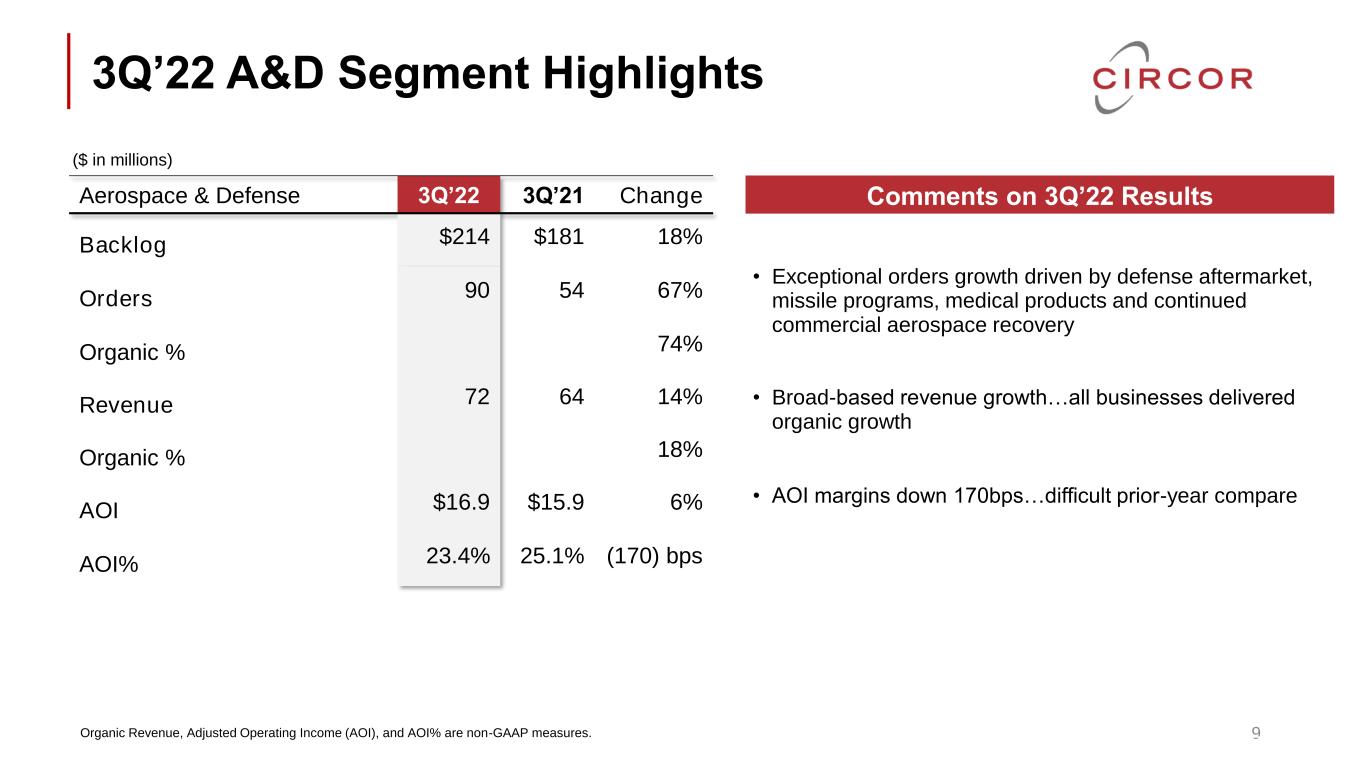
3Q’22 A&D Segment Highlights 9 Aerospace & Defense 3Q’22 3Q’21 Change Backlog $214 $181 18% Orders 90 54 67% Organic % 74% Revenue 72 64 14% Organic % 18% AOI $16.9 $15.9 6% AOI% 23.4% 25.1% (170) bps Comments on 3Q’22 Results • Exceptional orders growth driven by defense aftermarket, missile programs, medical products and continued commercial aerospace recovery • Broad-based revenue growth…all businesses delivered organic growth • AOI margins down 170bps…difficult prior-year compare Organic Revenue, Adjusted Operating Income (AOI), and AOI% are non-GAAP measures. ($ in millions)
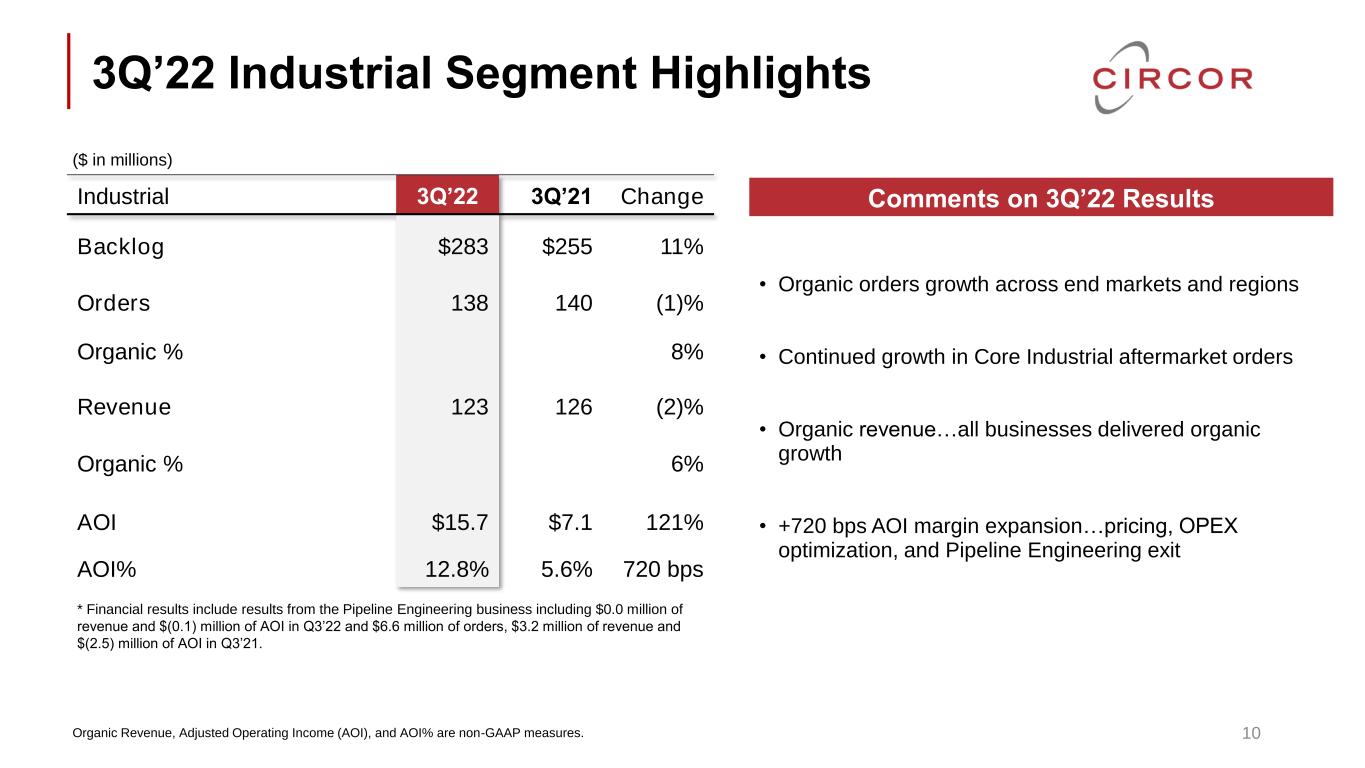
3Q’22 Industrial Segment Highlights Industrial 3Q’22 3Q’21 Change Backlog $283 $255 11% Orders 138 140 (1)% Organic % 8% Revenue 123 126 (2)% Organic % 6% AOI $15.7 $7.1 121% AOI% 12.8% 5.6% 720 bps 10 Comments on 3Q’22 Results • Organic orders growth across end markets and regions • Continued growth in Core Industrial aftermarket orders • Organic revenue…all businesses delivered organic growth • +720 bps AOI margin expansion…pricing, OPEX optimization, and Pipeline Engineering exit * Financial results include results from the Pipeline Engineering business including $0.0 million of revenue and $(0.1) million of AOI in Q3’22 and $6.6 million of orders, $3.2 million of revenue and $(2.5) million of AOI in Q3’21. ($ in millions) Organic Revenue, Adjusted Operating Income (AOI), and AOI% are non-GAAP measures.
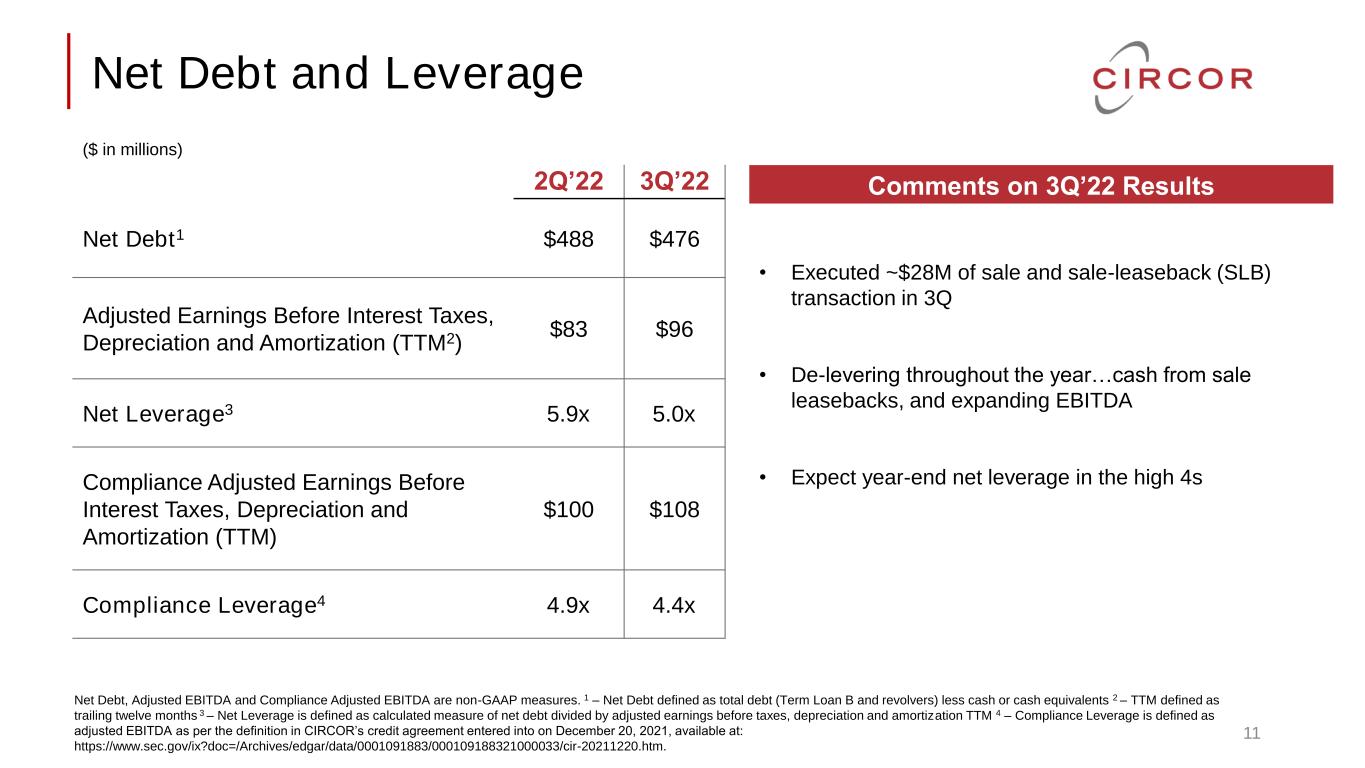
Net Debt and Leverage 11 Net Debt, Adjusted EBITDA and Compliance Adjusted EBITDA are non-GAAP measures. 1 – Net Debt defined as total debt (Term Loan B and revolvers) less cash or cash equivalents 2 – TTM defined as trailing twelve months 3 – Net Leverage is defined as calculated measure of net debt divided by adjusted earnings before taxes, depreciation and amortization TTM 4 – Compliance Leverage is defined as adjusted EBITDA as per the definition in CIRCOR’s credit agreement entered into on December 20, 2021, available at: https://www.sec.gov/ix?doc=/Archives/edgar/data/0001091883/000109188321000033/cir-20211220.htm. 2Q’22 3Q’22 Net Debt1 $488 $476 Adjusted Earnings Before Interest Taxes, Depreciation and Amortization (TTM2) $83 $96 Net Leverage3 5.9x 5.0x Compliance Adjusted Earnings Before Interest Taxes, Depreciation and Amortization (TTM) $100 $108 Compliance Leverage4 4.9x 4.4x Comments on 3Q’22 Results • Executed ~$28M of sale and sale-leaseback (SLB) transaction in 3Q • De-levering throughout the year…cash from sale leasebacks, and expanding EBITDA • Expect year-end net leverage in the high 4s ($ in millions)
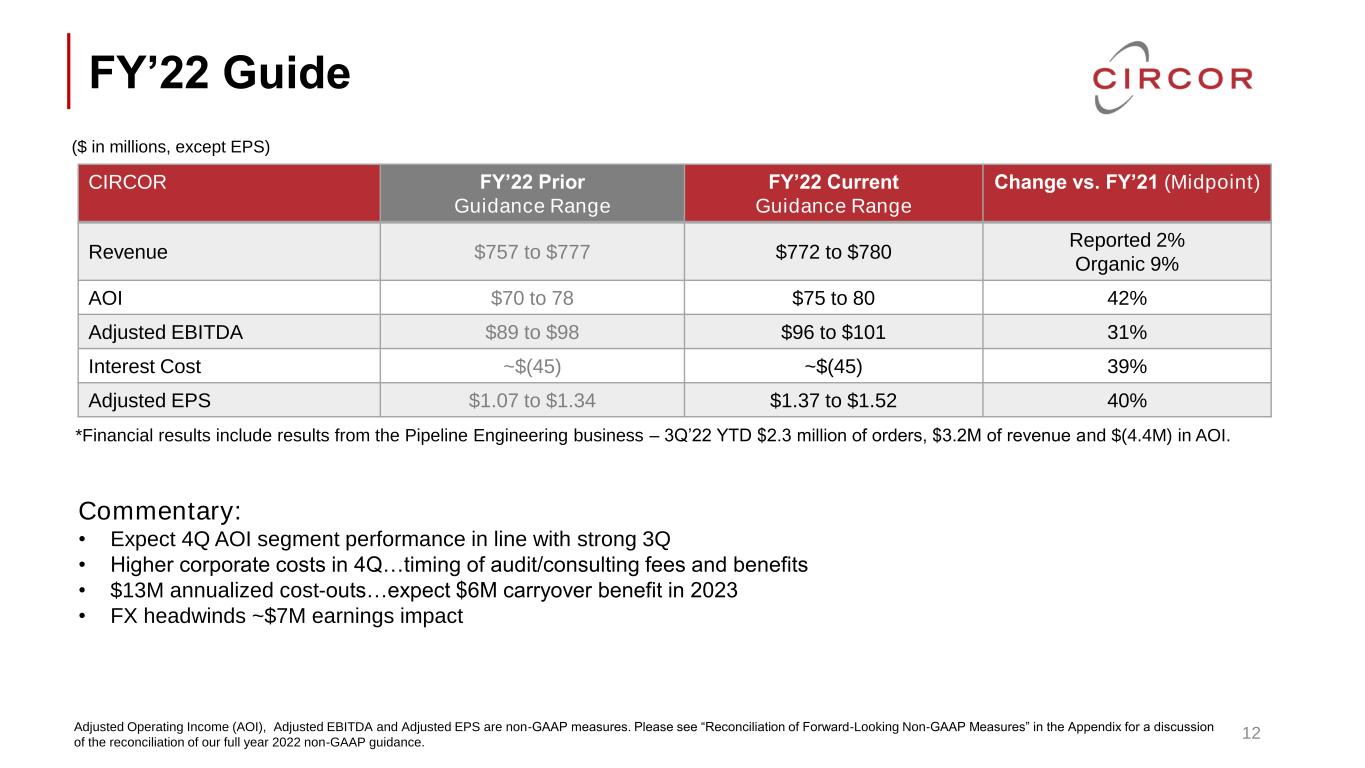
FY’22 Guide 12 CIRCOR FY’22 Prior Guidance Range FY’22 Current Guidance Range Change vs. FY’21 (Midpoint) Revenue $757 to $777 $772 to $780 Reported 2% Organic 9% AOI $70 to 78 $75 to 80 42% Adjusted EBITDA $89 to $98 $96 to $101 31% Interest Cost ~$(45) ~$(45) 39% Adjusted EPS $1.07 to $1.34 $1.37 to $1.52 40% Commentary: • Expect 4Q AOI segment performance in line with strong 3Q • Higher corporate costs in 4Q…timing of audit/consulting fees and benefits • $13M annualized cost-outs…expect $6M carryover benefit in 2023 • FX headwinds ~$7M earnings impact Adjusted Operating Income (AOI), Adjusted EBITDA and Adjusted EPS are non-GAAP measures. Please see “Reconciliation of Forward-Looking Non-GAAP Measures” in the Appendix for a discussion of the reconciliation of our full year 2022 non-GAAP guidance. *Financial results include results from the Pipeline Engineering business – 3Q’22 YTD $2.3 million of orders, $3.2M of revenue and $(4.4M) in AOI. ($ in millions, except EPS)
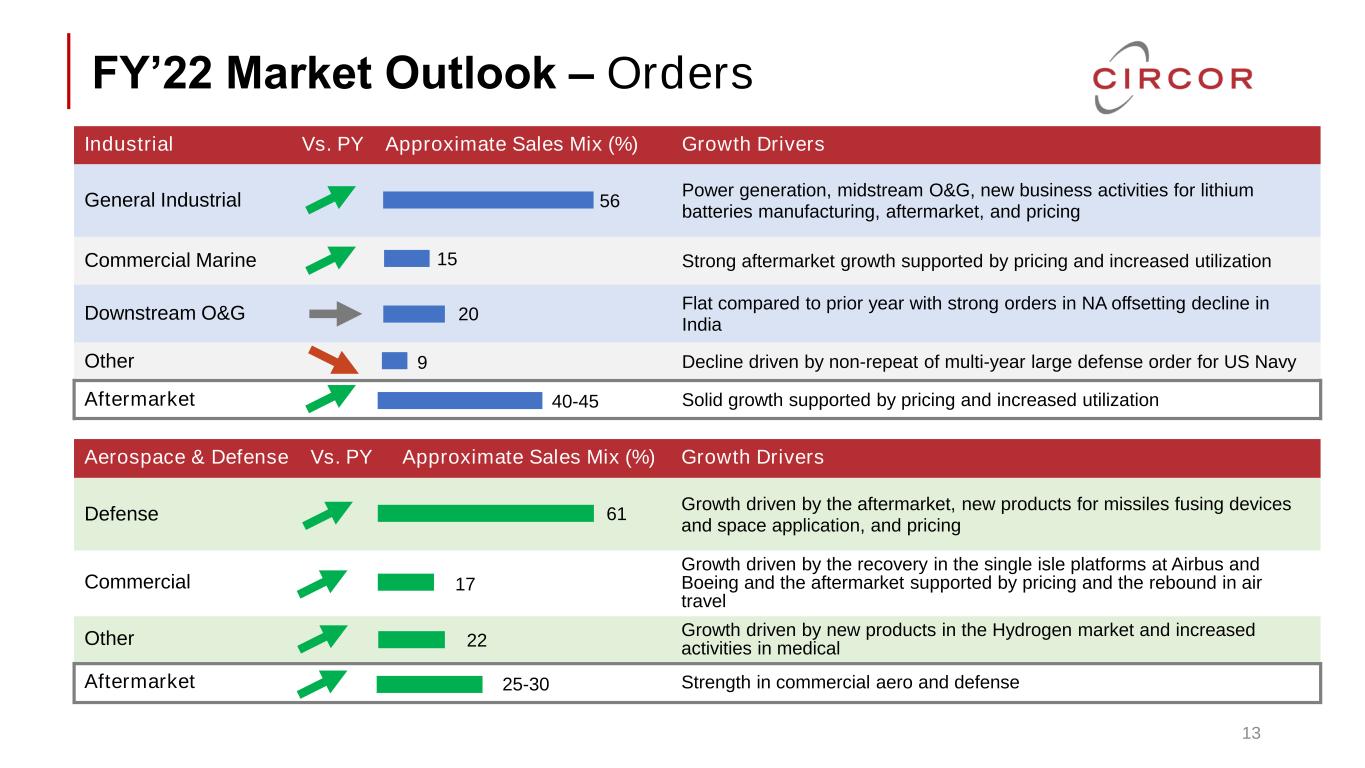
FY’22 Market Outlook – Orders 13 Industrial Vs. PY Approximate Sales Mix (%) Growth Drivers General Industrial Power generation, midstream O&G, new business activities for lithium batteries manufacturing, aftermarket, and pricing Commercial Marine Strong aftermarket growth supported by pricing and increased utilization Downstream O&G Flat compared to prior year with strong orders in NA offsetting decline in India Other Decline driven by non-repeat of multi-year large defense order for US Navy Aftermarket Solid growth supported by pricing and increased utilization 56 15 20 9 40-45 Aerospace & Defense Vs. PY Approximate Sales Mix (%) Growth Drivers Defense Growth driven by the aftermarket, new products for missiles fusing devices and space application, and pricing Commercial Growth driven by the recovery in the single isle platforms at Airbus and Boeing and the aftermarket supported by pricing and the rebound in air travel Other Growth driven by new products in the Hydrogen market and increased activities in medical Aftermarket Strength in commercial aero and defense 61 17 22 25-30
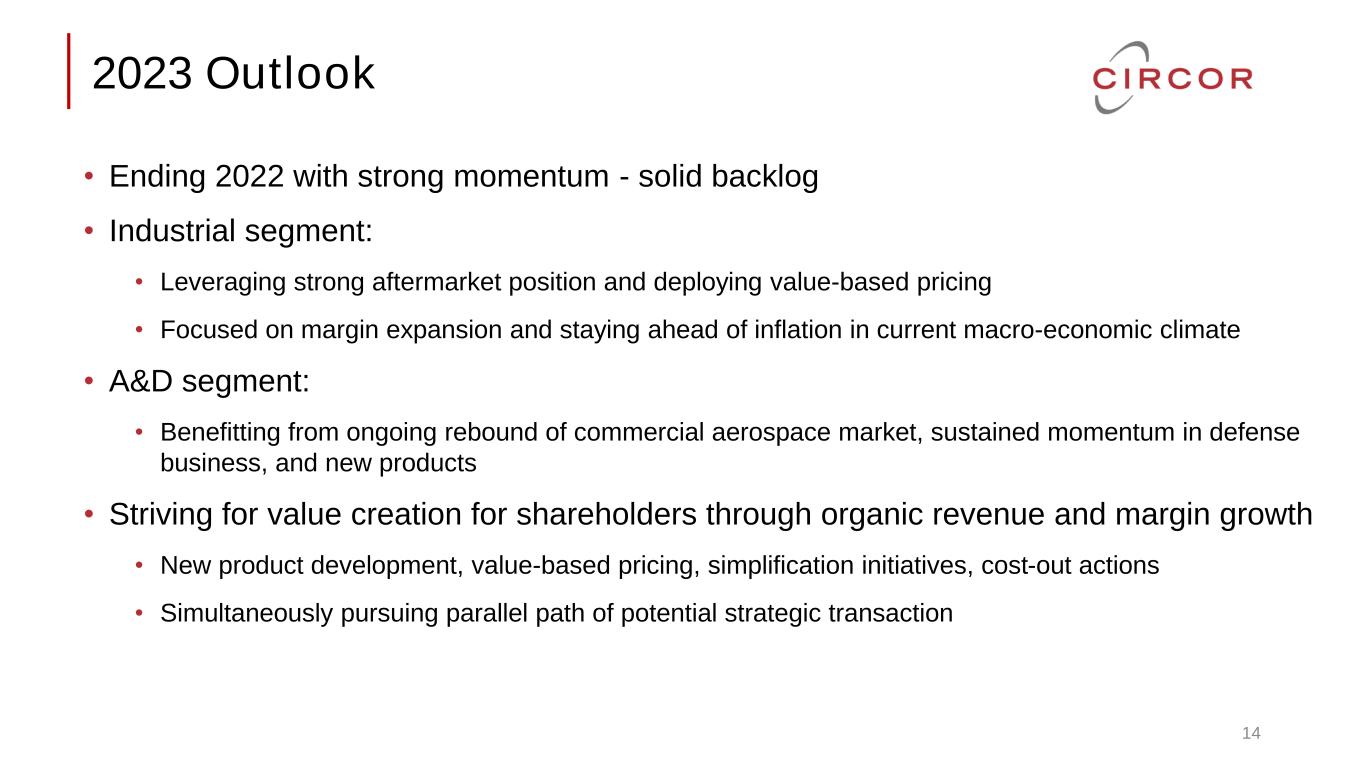
2023 Outlook • Ending 2022 with strong momentum - solid backlog • Industrial segment: • Leveraging strong aftermarket position and deploying value-based pricing • Focused on margin expansion and staying ahead of inflation in current macro-economic climate • A&D segment: • Benefitting from ongoing rebound of commercial aerospace market, sustained momentum in defense business, and new products • Striving for value creation for shareholders through organic revenue and margin growth • New product development, value-based pricing, simplification initiatives, cost-out actions • Simultaneously pursuing parallel path of potential strategic transaction 14
INDUSTRIAL AEROSPACE & DEFENSE Appendix
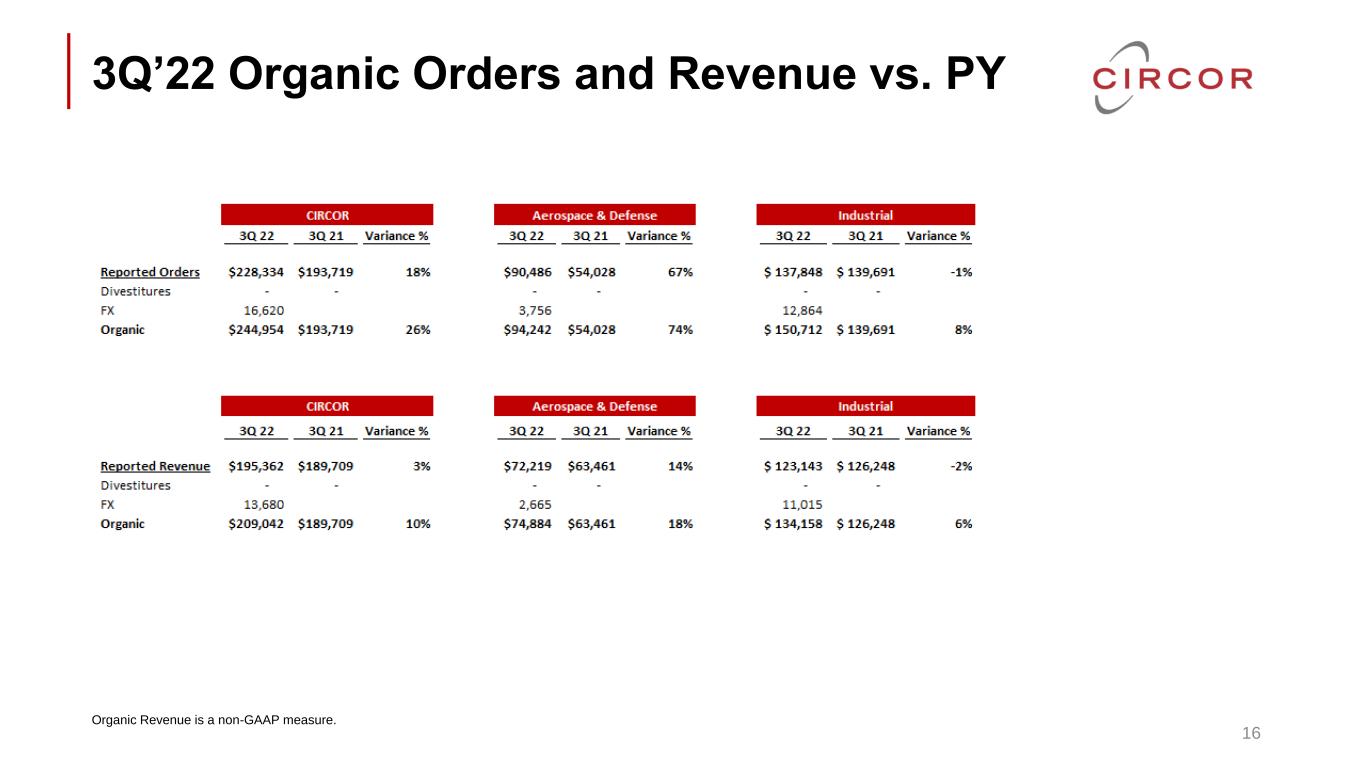
3Q’22 Organic Orders and Revenue vs. PY 16 Organic Revenue is a non-GAAP measure.
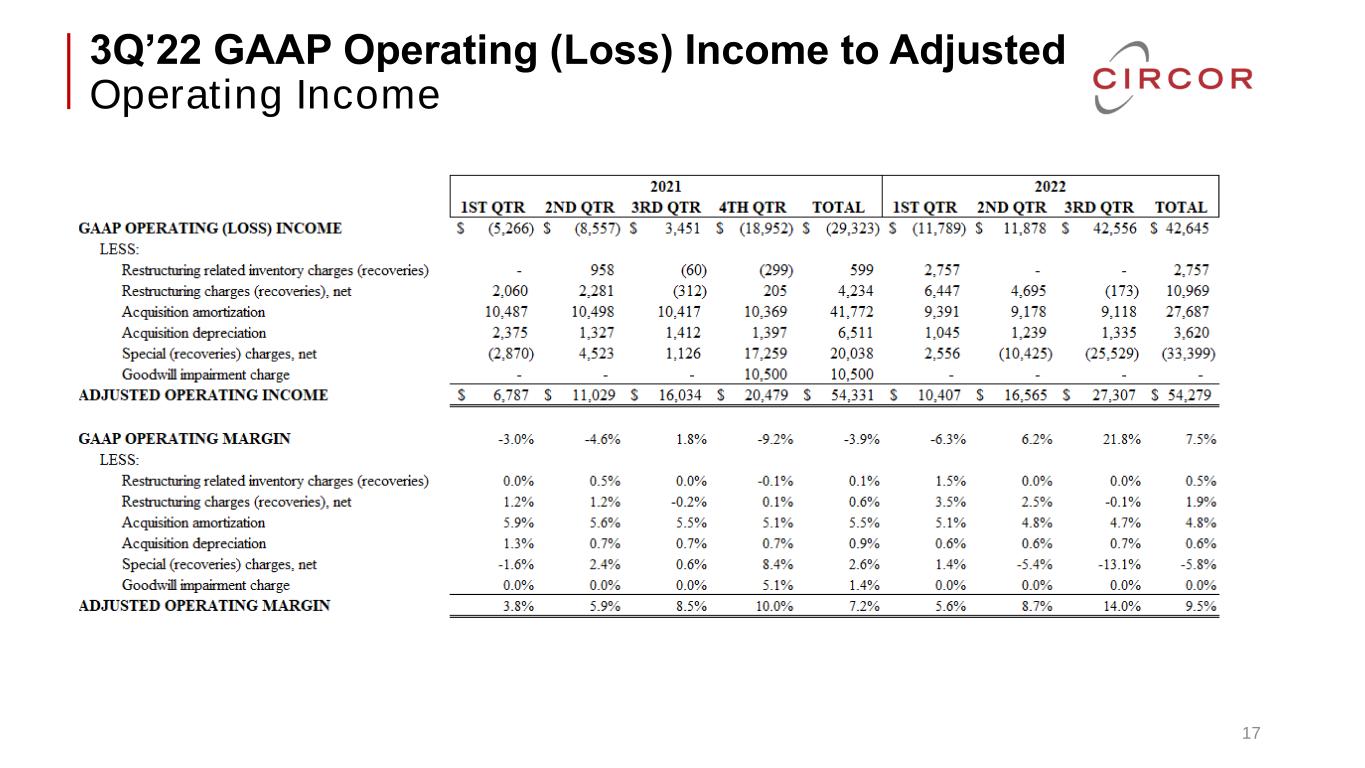
3Q’22 GAAP Operating (Loss) Income to Adjusted Operating Income 17
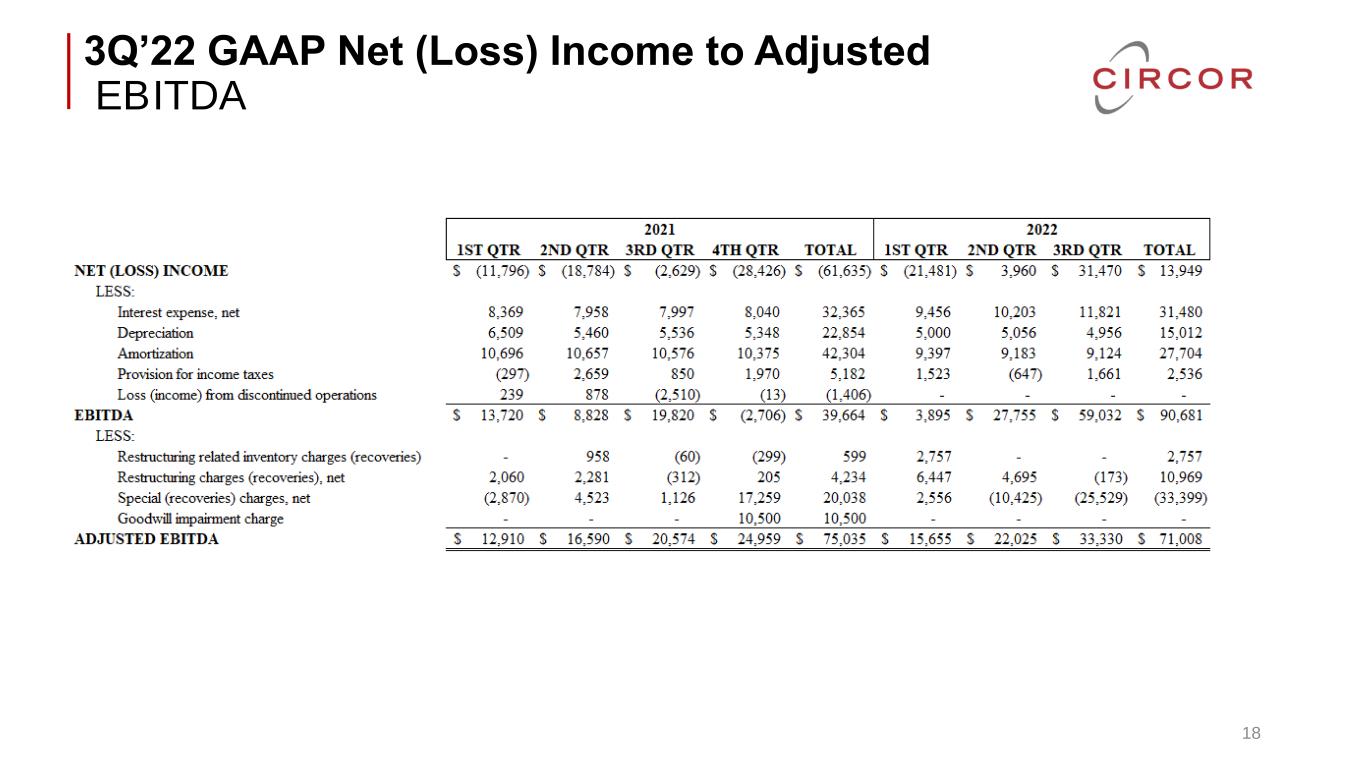
3Q’22 GAAP Net (Loss) Income to Adjusted EBITDA 18
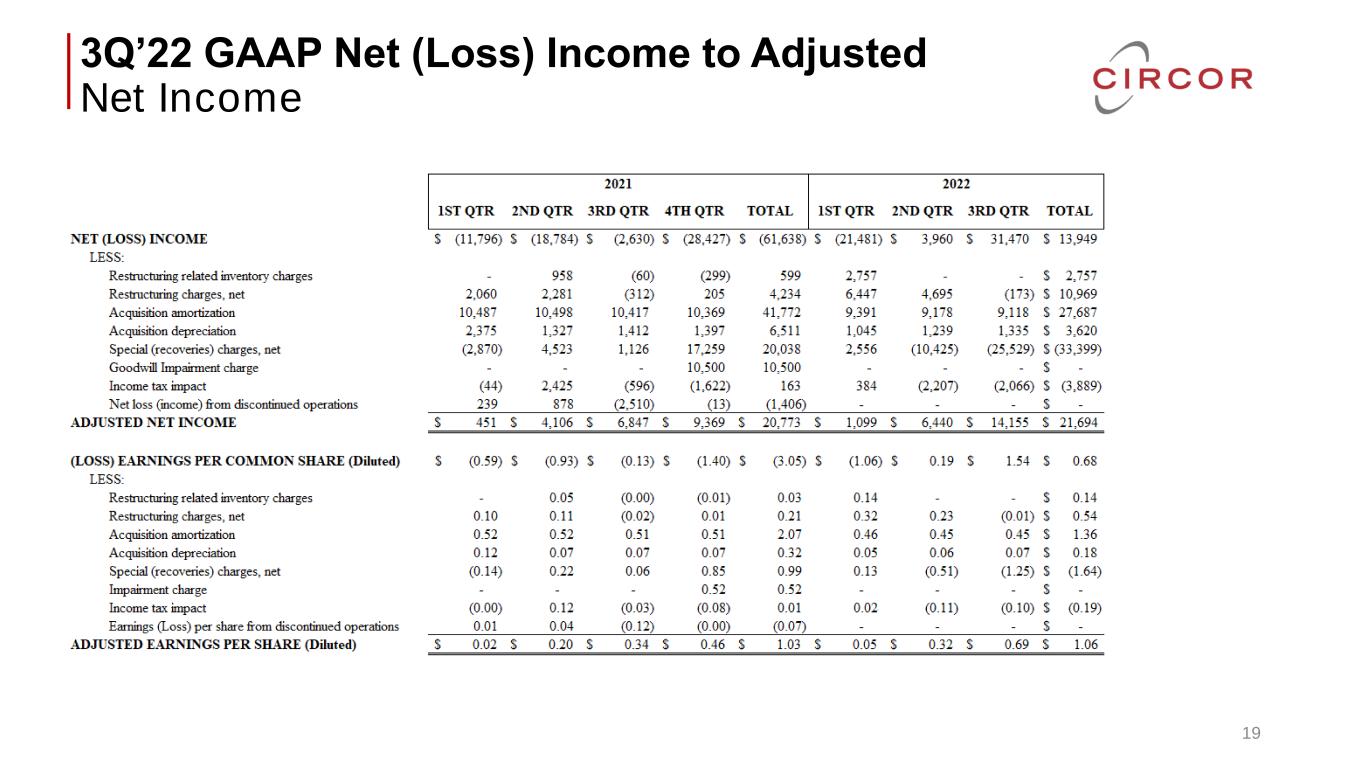
3Q’22 GAAP Net (Loss) Income to Adjusted Net Income 19
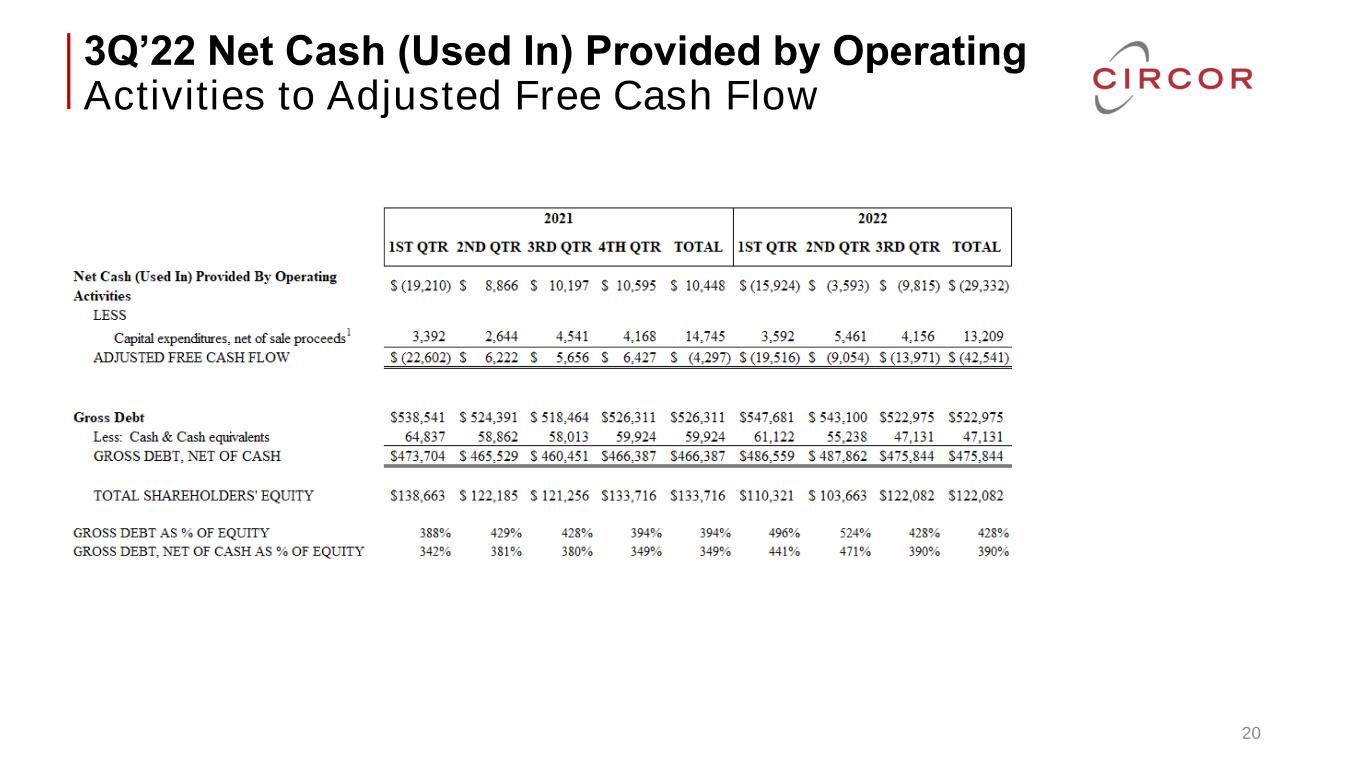
3Q’22 Net Cash (Used In) Provided by Operating Activities to Adjusted Free Cash Flow 20
Reconciliation of Forward-Looking Non-GAAP Measures 21 This presentation contains forward-looking estimates of organic revenue growth, AOI, adjusted EBITDA and adjusted EPS for full year 2022. We provide these non-GAAP measures to investors on a prospective basis for the same reasons (set forth on slide 3 (“Use of Non-GAAP Financial Measures”)) that we provide to investors on a historical basis. We are unable to provide a reconciliation of our forward-looking estimate of full year 2022 organic revenue growth, AOI, adjusted EBITDA and adjusted EPS to a forward-looking estimate of full year 2022 GAAP revenue growth, GAAP operating income (loss), GAAP net income (loss) and GAAP EPS because certain information needed to make a reasonable forward-looking estimate of such non-GAAP measures for full year 2022 is difficult to predict and estimate and is often dependent on future events that may be uncertain or outside of our control. Such events may include unanticipated changes in currency exchange rates, our GAAP effective tax rate, unanticipated gains or losses, and other unanticipated non-recurring items not reflective of ongoing operations. Our forward-looking estimates of both GAAP and non-GAAP measures of our financial performance may differ materially from our actual results and should not be relied upon as statements of fact.


