** * 156% $27.84 $10.88 Stock Price 77% 10% 43% Debt-to-capitalization 74% $33 $129 Debt 58% 19% 45% Working Capital % of Sales 41% $85 $143 Working Capital 93% $20.5 $10.6 Net Income 6.2% CAGR 43% $450 $315 Sales Improvement CY 2005E CY 1999 * At Spin-off Oct. 19, 1999 ** At close of Feb. 1, 2006 Improvements Since Spin-off 29 |
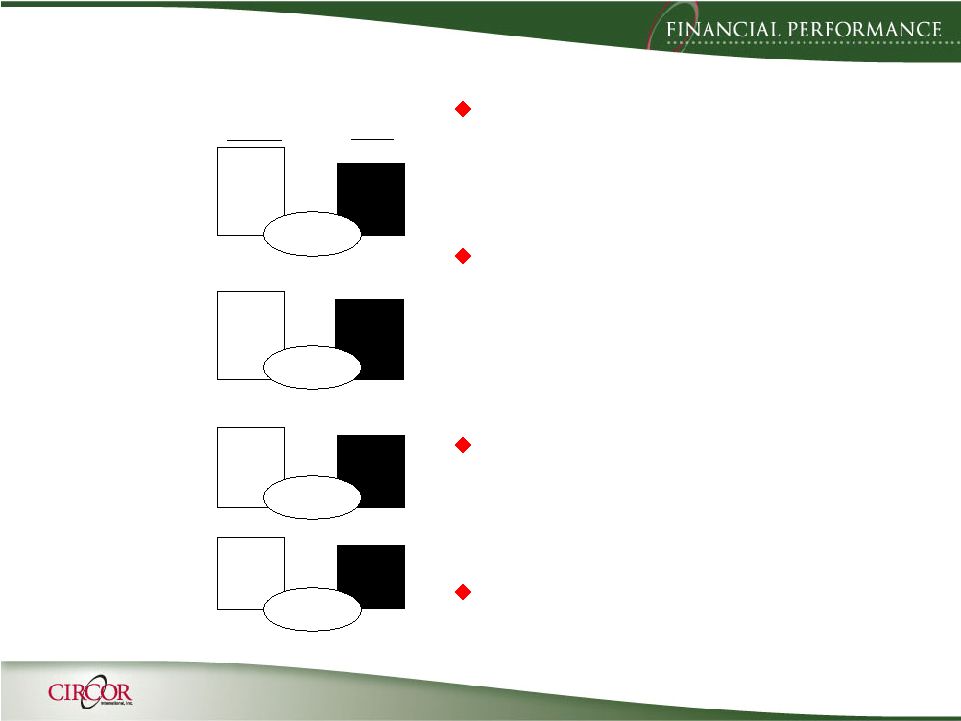
2 FY 2005E Revenues Operating Income Diluted EPS Free Cash Flow FCF = Cash from Operations less Capital Expenditures less Dividends paid $450.5 $33.5 $1.27 $28.0 $381.8 $21.9 $0.74 $21.6 +53% +72% $6.4 FY 2004 Revenues • Positives: shipment volume & pricing for nearly every business. • Large international oil & gas project shipments very strong. • Acquisitions +7% FY Operating Income • Positives: sales volume, customer pricing, and acquisitions. • Partial offsets: higher raw material costs, lower supplier performance & manufacturing productivity, and higher special charges. • Q404 included a $7.2 charge primarily for slow-moving inventory. EPS • US GAAP • Operating income improvement. • Q404 included 29¢ charge for the $7.2 slow-moving inventory. • Includes special charge of $0.06 in 2005; $0.01in 2004. FCF • 2005 used $7.4 for two new facilities. +18% |
CIRCOR INTERNATIONAL, INC.
RECONCILIATION OF KEY PERFORMANCE MEASURES TO COMMONLY USED
GENERALLY ACCEPTED ACCOUNTING PRINCIPLE TERMS
(in millions)
UNAUDITED
| | | | |
| | | FY 2005E
| |
FREE CASH FLOW [NET CASH PROVIDED BY OPERATING ACTIVITIES LESS CAPITAL EXPENDITURES LESS DIVIDENDS PAID] | | $ | 28.0 | |
ADD: Capital expenditures | | | 15.3 | |
Dividends paid | | | 2.4 | |
| | |
|
|
|
NET CASH PROVIDED BY OPERATING ACTIVITIES | | | 45.7 | |
| | |
|
|
|
WORKING CAPITAL [CURRENT ASSETS LESS CASH AND CURRENT LIABILITIES] | | $ | 85.0 | |
ADD: Cash and cash equivalents | | | 31.2 | |
Current Liabilities | | | 109.6 | |
| | |
|
|
|
CURRENT ASSETS | | $ | 225.8 | |
| | |
|
|
|
WORKING CAPITAL AS % OF SALES | | | 19 | % |
| | |
|
|
|
NET CAPITALIZATION [TOTAL DEBT PLUS SHAREHOLDERS’ EQUITY LESSCASH AND CASH EQUIVALENTS, LESS INVESTMENTS] | | $ | 313.2 | |
| | |
|
|
|
LESS: Total debt | | | (33.5 | ) |
ADD: Cash and cash equivalents | | | 31.2 | |
Investments | | | 0.1 | |
| | |
|
|
|
TOTAL SHAREHOLDERS’ EQUITY | | | 310.90 | |
ADD: Total debt | | | 33.50 | |
| | |
|
|
|
TOTAL CAPITAL | | $ | 344.40 | |
| | |
|
|
|
TOTAL DEBT / TOTAL CAPITAL | | | 10 | % |