Company Update February 2014
FORWARD LOOKING STATEMENTS Outlooks, projections, estimates, targets and business plans in this presentation or any related subsequent discussions are forward - looking statements . Actual future results, including TransAtlantic Petroleum Ltd . ’s own production growth and mix ; financial results ; the amount and mix of capital expenditures ; resource additions and recoveries ; finding and development costs ; project and drilling plans, timing, costs, and capacities ; revenue enhancements and cost efficiencies ; industry margins ; margin enhancements and integration benefits ; and the impact of technology could differ materially due to a number of factors . These include market prices for natural gas, natural gas liquids and oil products ; estimates of reserves and economic assumptions ; the ability to produce and transport natural gas, natural gas liquids and oil ; the results of exploration and development drilling and related activities ; economic conditions in the countries and provinces in which we carry on business, especially economic slowdowns ; actions by governmental authorities, receipt of required approvals, increases in taxes, legislative and regulatory initiatives relating to fracture stimulation activities, changes in environmental and other regulations, and renegotiations of contracts ; political uncertainty, including actions by insurgent groups or other conflict ; the negotiation and closing of material contracts ; shortages of drilling rigs, equipment or oilfield services ; and other factors discussed here and under the heading “Risk Factors" in our Annual Report on Form 10 - K for the year ended December 31 , 2012 and our Quarterly Report on Form 10 - Q for the three and nine months ended September 30 , 2013 , which are available on our website at www . transatlanticpetroleum . com and www . sec . gov . See also TransAtlantic’s audited financial statements and the accompanying management discussion and analysis . Forward - looking statements are based on management’s knowledge and reasonable expectations on the date hereof, and we assume no duty to update these statements as of any future date . The information set forth in this presentation does not constitute an offer, solicitation or recommendation to sell or an offer to buy any securities of the Company . The information published herein is provided for informational purposes only . The Company makes no representation that the information and opinions expressed herein are accurate, complete or current . The information contained herein is current as of the date hereof, but may become outdated or subsequently may change . Nothing contained herein constitutes financial, legal, tax, or other advice . The SEC has generally permitted oil and gas companies, in their filings with the SEC, to disclose only proved reserves that a company has demonstrated by actual production or conclusive formation tests to be economically and legally producible under existing economic and operating conditions . We may use the terms “estimated ultimate recovery,” “EUR,” “probable,” “possible,” and “non - proven” reserves, “prospective resources” or “upside” or other descriptions of volumes of resources or reserves potentially recoverable through additional drilling or recovery techniques that the SEC’s guidelines may prohibit us from including in filings with the SEC . These estimates are by their nature more speculative than estimates of proved reserves and accordingly are subject to substantially greater risk of actually being realized by the Company . There is no certainty that any portion of estimated prospective resources will be discovered . If discovered, there is no certainty that it will be commercially viable to produce any portion of the estimated prospective resources . BOE (barrel of oil equivalent) is derived by converting natural gas to oil in the ratio of six thousand cubic feet (Mcf) of natural gas to one barrel (bbl) of oil . BOE may be misleading, particularly if used in isolation . A BOE conversion ratio of 6 Mcf : 1 bbl is based on an energy equivalency conversion method primarily applicable at the burner tip and does not represent a value equivalency at the wellhead . 2
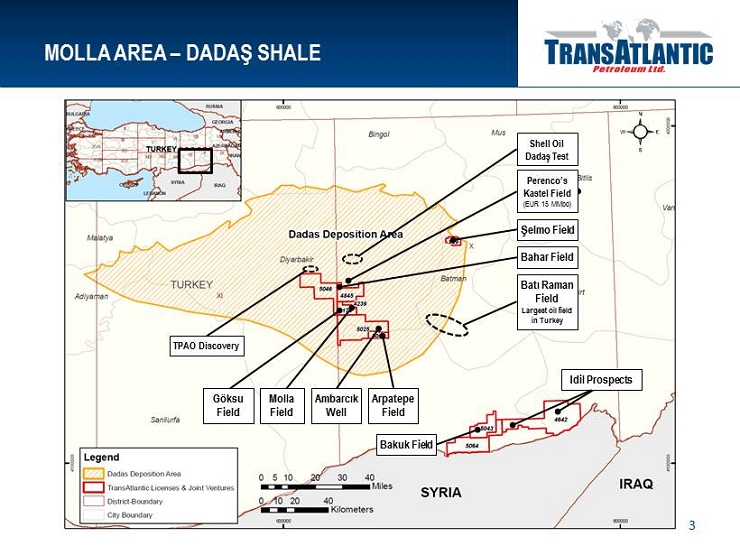
MOLLA AREA – DADAŞ SHALE 3 Ş elmo Field Idil Prospects Bakuk Field Arpatepe Field TPAO Discovery Bahar Field Ambarcık Well Göksu Field Molla Field Perenco’s Kastel Field (EUR 15 MMbo) Batı Raman Field Largest oil field in Turkey Shell Oil Dadaş Test
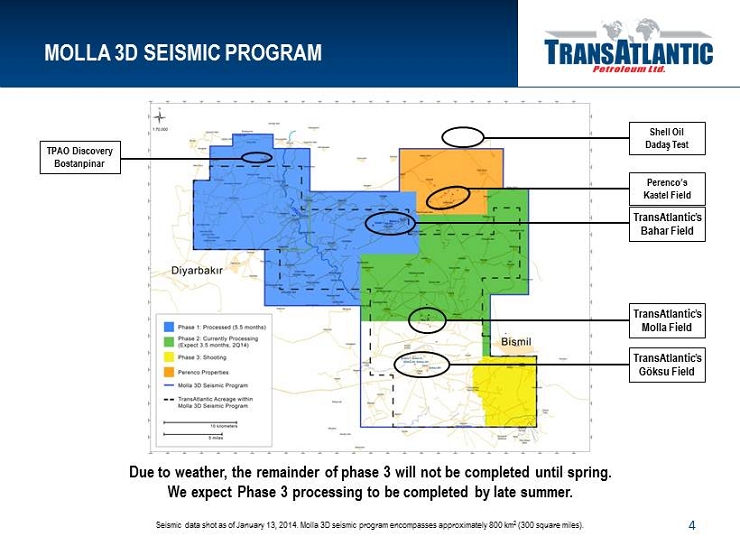
MOLLA 3D SEISMIC PROGRAM 4 Seismic data shot as of January 13, 2014. Molla 3D seismic program encompasses approximately 800 km 2 (300 square miles). TransAtlantic’s Molla Field TransAtlantic’s Göksu Field Perenco’s Kastel Field TransAtlantic’s Bahar Field TPAO Discovery Bostanpinar Shell Oil Dadaş Test Due to weather, the remainder of phase 3 will not be completed until spring. We expect Phase 3 processing to be completed by late summer.
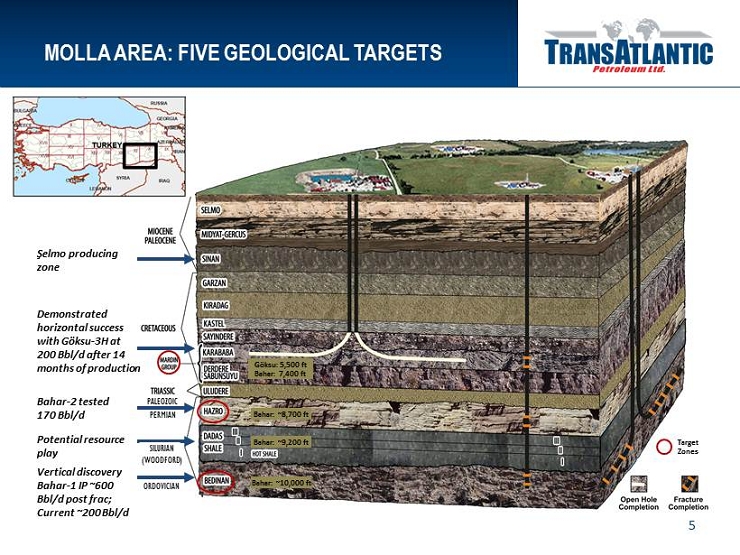
Demonstrated horizontal success with Göksu - 3H at 200 Bbl/d after 14 months of production Vertical discovery Bahar - 1 IP ~600 Bbl/d post frac; Current ~200 Bbl/d Bahar - 2 tested 170 Bbl/d Potential resource play MOLLA AREA: FIVE GEOLOGICAL TARGETS 5 Target Zones Şelmo producing zone Göksu: 5,500 ft Bahar: 7,400 ft Bahar: ~10,000 ft Bahar: ~9,200 ft Bahar: ~8,700 ft PALEOZOIC PERMIAN SILURIAN (WOODFORD) ORDOVICIAN
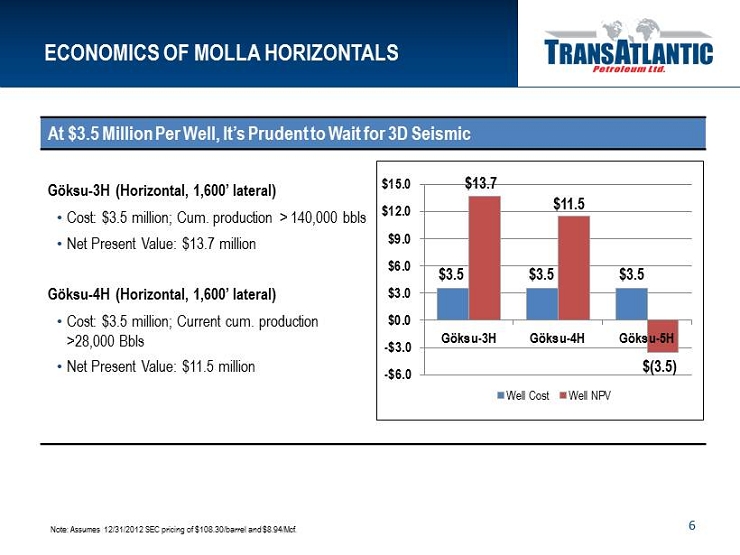
ECONOMICS OF MOLLA HORIZONTALS 6 At $3.5 Million Per Well, It’s Prudent to Wait for 3D Seismic Göksu - 3H (Horizontal, 1,600’ lateral) • Cost: $3.5 million; Cum. production > 140,000 bbls • Net Present Value: $13.7 million Göksu - 4H (Horizontal, 1,600’ lateral) • Cost: $3.5 million; Current cum. production >28,000 Bbls • Net Present Value: $11.5 million $3.5 $3.5 $3.5 $13.7 $11.5 $(3.5) -$6.0 -$3.0 $0.0 $3.0 $6.0 $9.0 $12.0 $15.0 Göksu-3H Göksu-4H Göksu-5H Well Cost Well NPV Note: Assumes 12/31/2012 SEC pricing of $108.30/barrel and $8.94/Mcf .

Overview • Conventional Permian and Ordovician sandstone targets immediately above and below Dadaş (Silurian – Woodford) • Arpatepe discovery in 2008 • Arpatepe - 1 vertical well has produced > 300 Mbo in five years • Drilled Bahar discovery in 2012 from 2D seismic • Bahar - 1 vertical well has produced > 100 Mbo in 13 months • Appraisal well in Bahar did not conform to seismic in Bedinan • Shot 3D seismic in 2013 • 12/31/12 1P reserves: 1.4 MMbbls (1) ; 2P reserves: 2.5 MMbbls (1) • Plan to drill sidetrack on Bahar - 2 to confirm 3D seismic, then drill Bahar - 3 vertically to confirm structure prior to drilling horizontal wells (1) DeGolyer and MacNaughton reserves as of 12/31/2012, based on $ 108.30/barrel and $8.94/Mcf. Payback period assumes oil price of $100.00/barrel. MOLLA HAZRO AND BEDINAN FORMATIONS 7 Bahar - 1 well in the Molla area in southeastern Turkey.
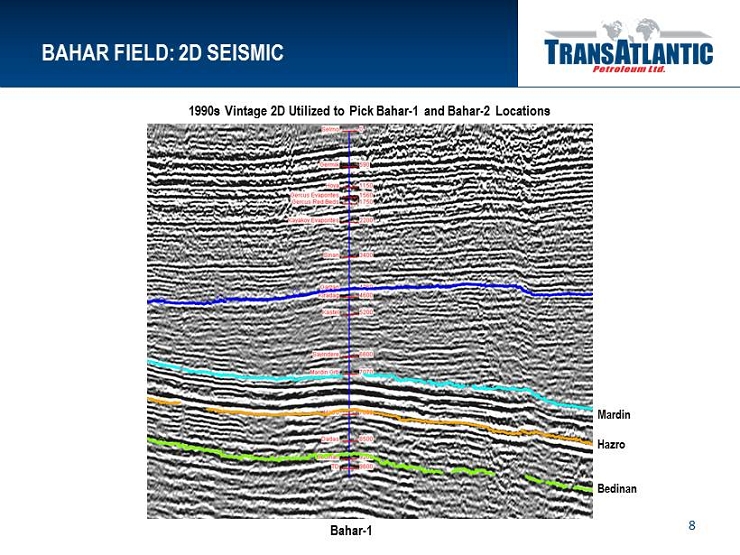
BAHAR FIELD: 2D SEISMIC 8 Bahar - 1 Mardin Hazro Bedinan 1990s Vintage 2D Utilized to Pick Bahar - 1 and Bahar - 2 Locations

BAHAR FIELD: 2D SEISMIC 9 P ı nar - 1 Çatak - 1 Bahar - 1 Mardin Hazro Bedinan 2,167 m / 7,110 ft 3,976 m / 13,045 ft 2012 2D Utilized to Pick Çatak - 1 Location and Identify P ı nar Structure

BAHAR FIELD: IMPROVED MAPPING WITH 3D SEISMIC 10
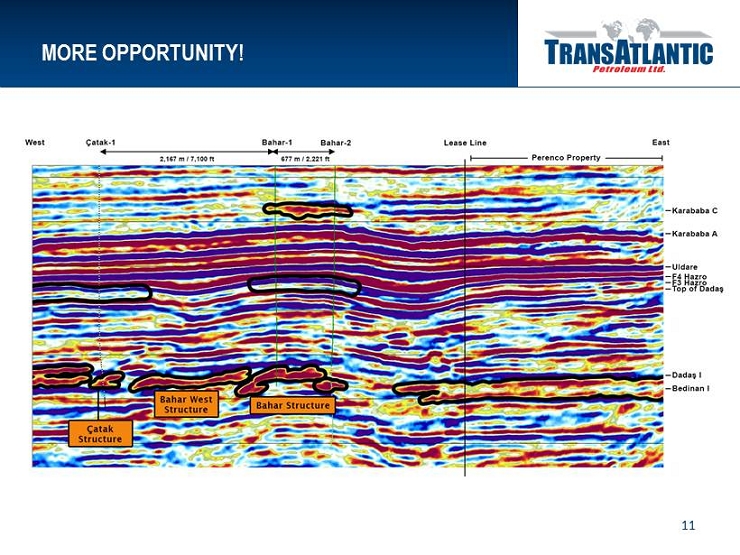
MORE OPPORTUNITY! 11
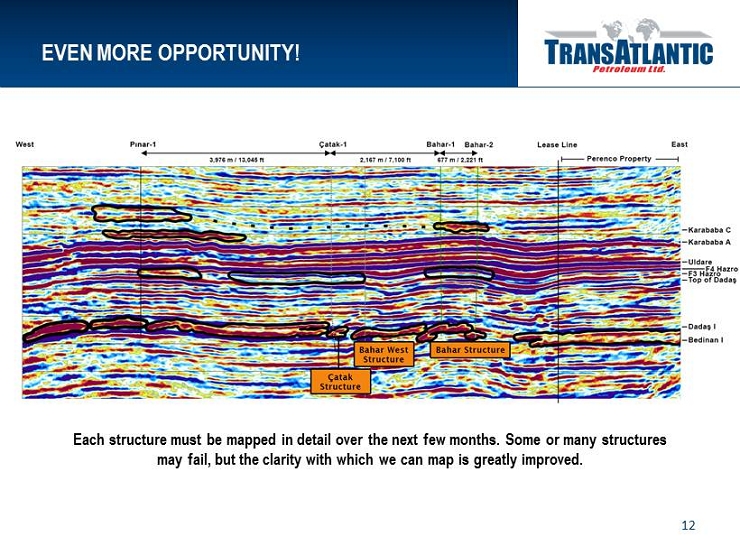
EVEN MORE OPPORTUNITY! 12 Each structure must be mapped in detail over the next few months. Some or many structures may fail, but the clarity with which we can map is greatly improved.
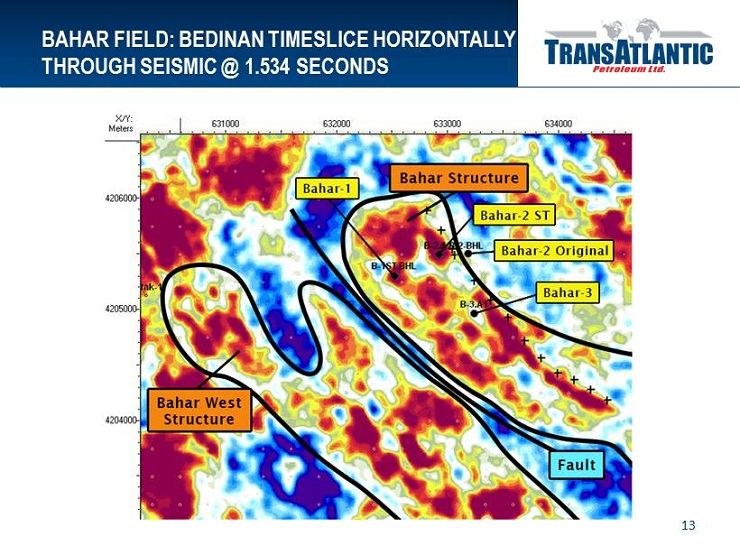
BAHAR FIELD: BEDINAN TIMESLICE HORIZONTALLY THROUGH SEISMIC @ 1.534 SECONDS 13

Bedinan Formation Looks Radically Different With New 3D Seismic Data BAHAR FIELD: BEDINAN ZONE DELINEATION 14 Bahar - 1 Bahar - 2 Bahar - 1 Bahar - 2 Bahar Structure Map from 2012 2D Seismic Bahar Structure Map from 2013 3D Seismic Assumes 71 - acre spacing Ç atak - 1

BAHAR - 1 BEDINAN TARGETS 15 Dadaş 1 Oil & gas shows Bedinan H1 Sand 600 Bbl/d – Bahar - 1 Cored – Ç atak - 1 Gamma Ray Porosity Resistivity Pay Indicator Hydrocarbon Type Lithology Limestone Shale Sandstone
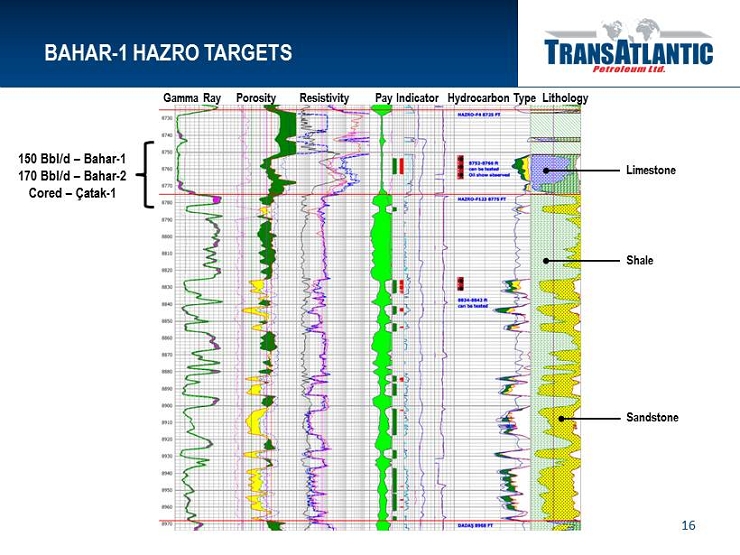
BAHAR - 1 HAZRO TARGETS 16 150 Bbl/d – Bahar - 1 170 Bbl/d – Bahar - 2 Cored – Çatak - 1 Gamma Ray Porosity Resistivity Pay Indicator Hydrocarbon Type Lithology Limestone Shale Sandstone
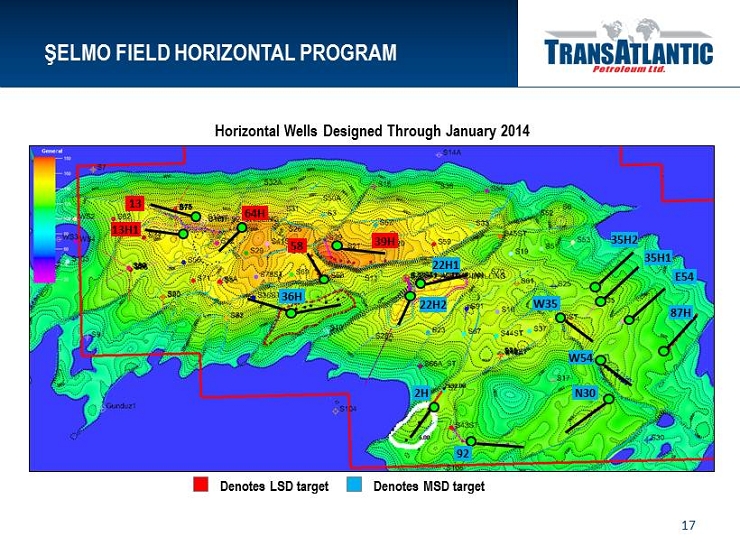
ŞELMO FIELD HORIZONTAL PROGRAM 17 13 13H1 36H 64H 58 39H Denotes LSD target Denotes MSD target 92 2H N30 W54 E 54 35H1 35H2 W35 87H 22H1 22H2 Horizontal Wells Designed Through January 2014
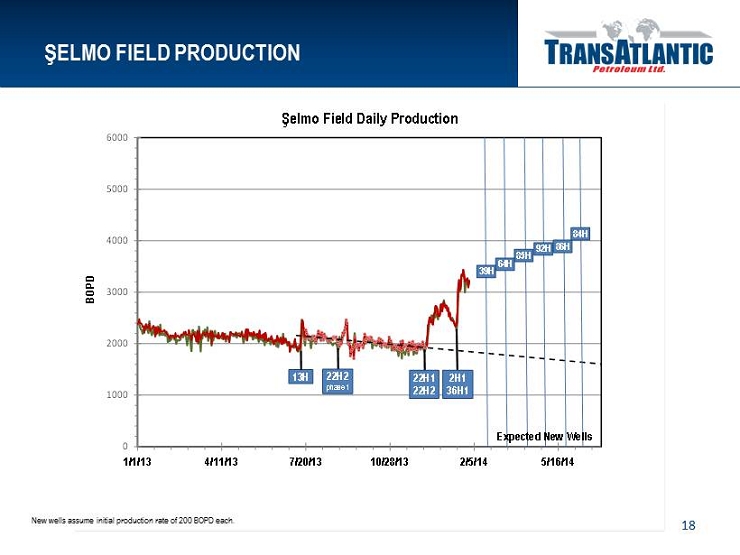
ŞELMO FIELD PRODUCTION 18 0 1000 2000 3000 4000 5000 6000 1/1/13 4/11/13 7/20/13 10/28/13 2/5/14 5/16/14 BOPD Şelmo Field Daily Production 13H 22H2 phase 1 22H1 22H2 2H1 36H1 84H 86H 92H 85H 64H 39H Expected New Wells New wells assume initial production rate of 200 BOPD each.
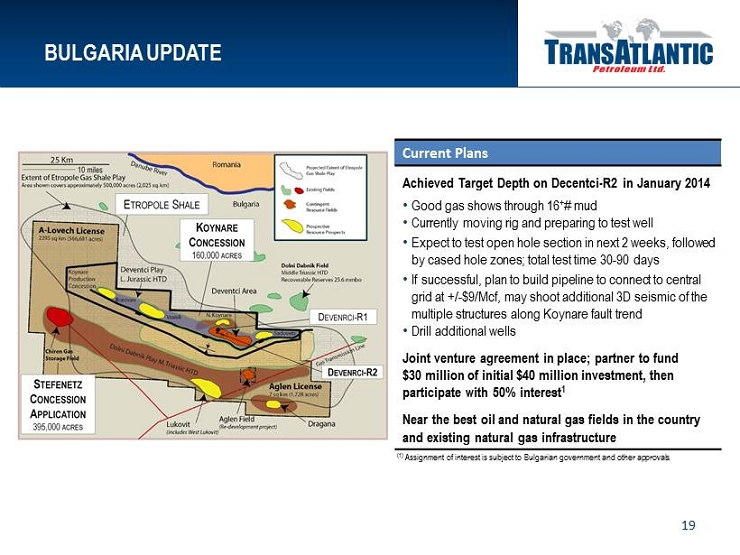
BULGARIA UPDATE 19 Current Plans Achieved Target Depth on Decentci - R2 in January 2014 • Good gas shows through 16 + # mud • Currently moving rig and preparing to test well • Expect to test open hole section in next 2 weeks, followed by cased hole zones; total test time 30 - 90 days • If successful, plan to build pipeline to connect to central grid at +/ - $9/Mcf, may shoot additional 3D seismic of the multiple structures along Koynare fault trend • Drill additional wells Joint venture agreement in place; partner to fund $30 million of initial $40 million investment, then participate with 50% interest 1 Near the best oil and natural gas fields in the country and existing natural gas infrastructure (1) Assignment of interest is subject to Bulgarian government and other approvals.
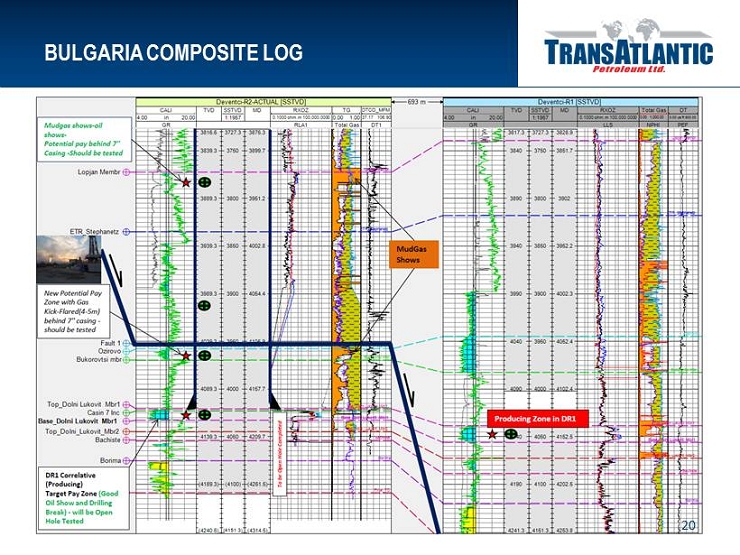
BULGARIA COMPOSITE LOG 20

SUMMARY • Three - part strategy in Turkey to monetize asset • Delivered 24% production growth in 2H 2013; guided 20 - 25% production growth in 2014 • Expert team in place to execute capital plan • Capital deployed on projects with highest yields 21
CONTACT INFORMATION Taylor B. Miele Director of Investor Relations (214) 265 - 4746 taylor.miele@tapcor.com Wil F. Saqueton VP - Chief Financial Officer (214) 265 - 4743 wil.saqueton@tapcor.com Ian J. Delahunty President (214) 265 - 4780 i an.delahunty@tapcor.com 22
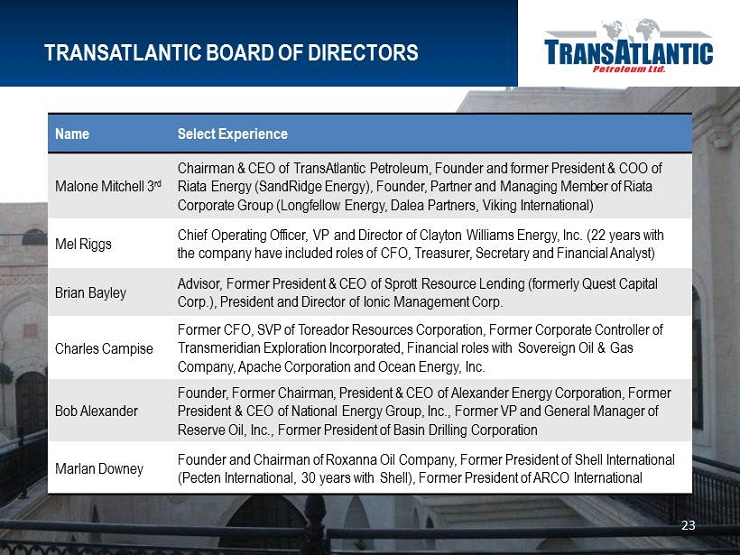
TRANSATLANTIC BOARD OF DIRECTORS 23 Name Select Experience Malone Mitchell 3 rd Chairman & CEO of TransAtlantic Petroleum, Founder and former President & COO of Riata Energy (SandRidge Energy), Founder, Partner and Managing Member of Riata Corporate Group (Longfellow Energy, Dalea Partners, Viking International) Mel Riggs Chief Operating Officer, VP and Director of Clayton Williams Energy, Inc. (22 years with the company have included roles of CFO, Treasurer, Secretary and Financial Analyst) Brian Bayley Advisor, Former President & CEO of Sprott Resource Lending (formerly Quest Capital Corp.), President and Director of Ionic Management Corp. Charles Campise Former CFO, SVP of Toreador Resources Corporation, Former Corporate Controller of Transmeridian Exploration Incorporated, Financial roles with Sovereign Oil & Gas Company, Apache Corporation and Ocean Energy, Inc. Bob Alexander Founder, Former Chairman, President & CEO of Alexander Energy Corporation , Former President & CEO of National Energy Group, Inc., Former VP and General Manager of Reserve Oil, Inc., Former President of Basin Drilling Corporation Marlan Downey Founder and Chairman of Roxanna Oil Company, Former President of Shell International ( Pecten International, 30 years with Shell), Former President of ARCO International
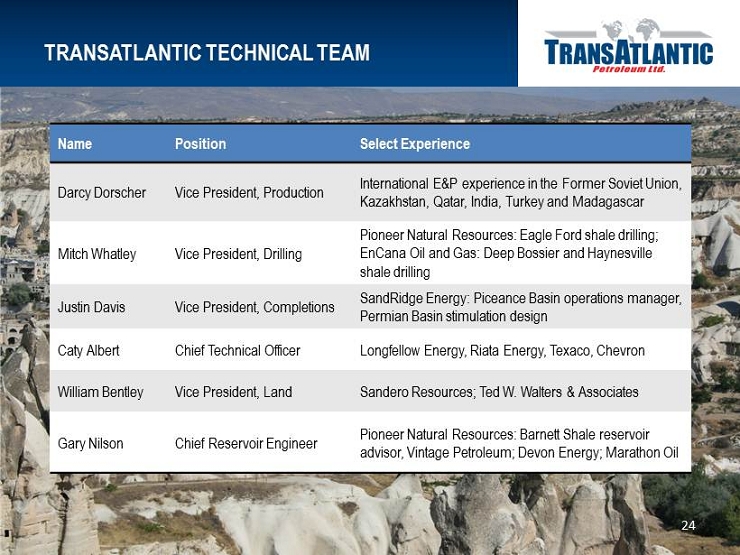
TRANSATLANTIC TECHNICAL TEAM 24 Name Position Select Experience Darcy Dorscher Vice President, Production International E&P experience in the Former Soviet Union , Kazakhstan, Qatar, India, Turkey and Madagascar Mitch Whatley Vice President, Drilling Pioneer Natural Resources: Eagle Ford shale drilling; EnCana Oil and Gas: Deep Bossier and Haynesville shale drilling Justin Davis Vice President, Completions SandRidge Energy: Piceance Basin operations manager, Permian Basin stimulation design Caty Albert Chief Technical Officer Longfellow Energy, Riata Energy, Texaco, Chevron William Bentley Vice President, Land Sandero Resources; Ted W. Walters & Associates Gary Nilson Chief Reservoir Engineer Pioneer Natural Resources: Barnett Shale reservoir advisor, Vintage Petroleum; Devon Energy; Marathon Oil

OPERATING AND FINANCIAL HIGHLIGHTS 25 Results for three months ended: 9/30/2013 6/30/2013 9/30/2012 Net p roduction Oil (BBLD) Natural Gas (MCFD) BOED % Oil 2,500 9,435 4,076 61% 2,527 8,967 4,022 63% 2,489 10,087 4,174 60% Prices, unhedged Oil (BBL) Natural Gas (MCF) $103.04 9.16 $94.13 9.57 $105.81 8.14 Average Netback BOED $73.67 $72.52 $74.53 Financial ($ millions) EBITDAX (1) Net income (1) Capital Expenditures Net debt Net debt/book capitalization $20.4 (4.8) 34.0 37.5 16% $17.6 2.9 28.1 23.8 10% $22.1 0.5 24.5 6.6 3% (1) EBITDAX and net income are for continuing operations. Note: Netbacks are calculated as average price per BOE less average lease operating expenses per BOE on a working interest ba sis .
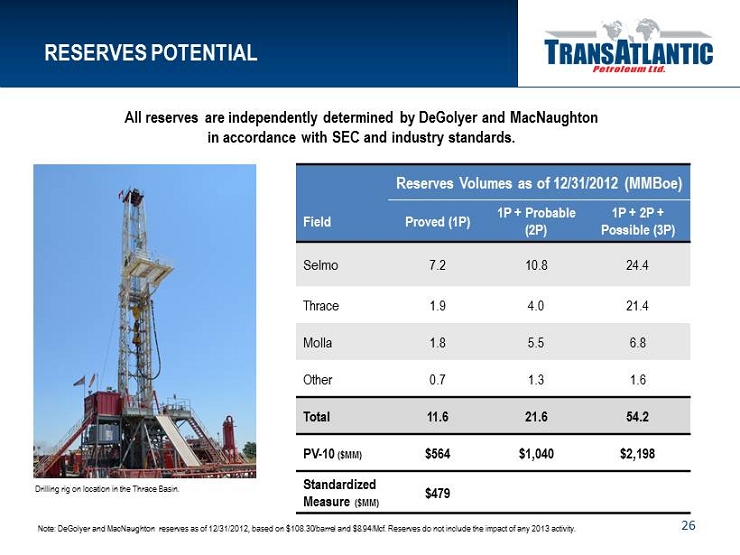
Reserves Volumes as of 12/31/2012 (MMBoe) Field Proved (1P) 1P + Probable ( 2P) 1P + 2P + Possible ( 3P) Selmo 7.2 10.8 24.4 Thrace 1.9 4.0 21.4 Molla 1.8 5.5 6.8 Other 0.7 1.3 1.6 Total 11.6 21.6 54.2 PV - 10 ($MM) $564 $1,040 $2,198 Standardized Measure ($MM) $479 RESERVES POTENTIAL 26 Drilling rig on location in the Thrace Basin. Note: DeGolyer and MacNaughton reserves as of 12/31/2012, based on $ 108.30/barrel and $8.94/Mcf. Reserves do not include the impact of any 2013 activity. All reserves are independently determined by DeGolyer and MacNaughton in accordance with SEC and industry standards.
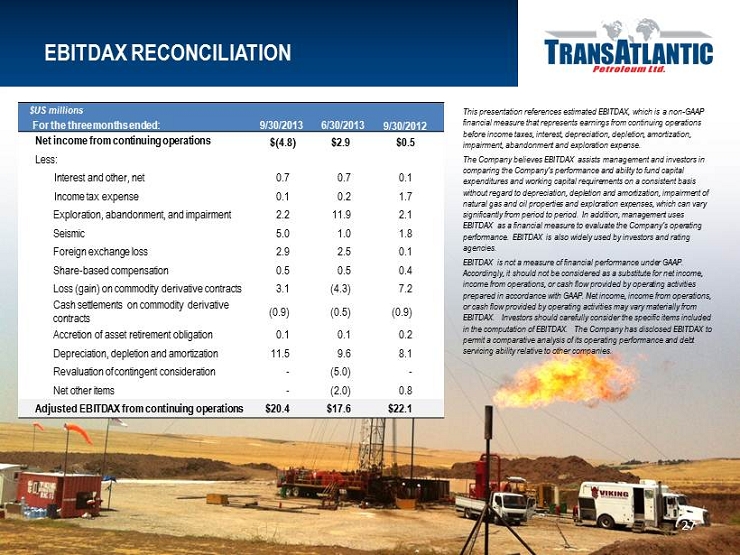
EBITDAX RECONCILIATION 27 $US millions For the three months ended: 9/30/2013 6/30/2013 9/30/2012 Net income from continuing operations $(4.8) $2.9 $0.5 Less : Interest and other, net 0.7 0.7 0.1 Income tax expense 0.1 0.2 1.7 Exploration, abandonment, and impairment 2.2 11.9 2.1 Seismic 5.0 1.0 1.8 Foreign exchange loss 2.9 2.5 0.1 Share - based compensation 0.5 0.5 0.4 Loss (gain) on commodity derivative contracts 3.1 (4.3) 7.2 Cash settlements on commodity derivative contracts (0.9) (0.5) (0.9) Accretion of asset retirement obligation 0.1 0.1 0.2 Depreciation, depletion and amortization 11.5 9.6 8.1 Revaluation of contingent consideration - (5.0) - Net o ther items - (2.0) 0.8 Adjusted EBITDAX from continuing operations $20.4 $17.6 $22.1 This presentation references estimated EBITDAX, which is a non - GAAP financial measure that represents earnings from continuing operations before income taxes, interest, depreciation, depletion, amortization, impairment, abandonment and exploration expense. The Company believes EBITDAX assists management and investors in comparing the Company’s performance and ability to fund capital expenditures and working capital requirements on a consistent basis without regard to depreciation, depletion and amortization, impairment of natural gas and oil properties and exploration expenses, which can vary significantly from period to period. In addition, management uses EBITDAX as a financial measure to evaluate the Company’s operating performance. EBITDAX is also widely used by investors and rating agencies. EBITDAX is not a measure of financial performance under GAAP. Accordingly, it should not be considered as a substitute for net income, income from operations, or cash flow provided by operating activities prepared in accordance with GAAP. Net income, income from operations, or cash flow provided by operating activities may vary materially from EBITDAX. Investors should carefully consider the specific items included in the computation of EBITDAX. The Company has disclosed EBITDAX to permit a comparative analysis of its operating performance and debt servicing ability relative to other companies.
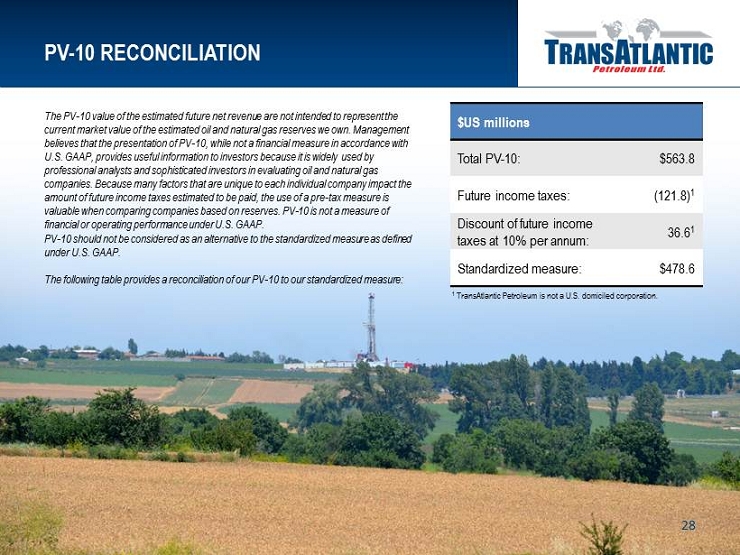
PV - 10 RECONCILIATION 28 The PV - 10 value of the estimated future net revenue are not intended to represent the current market value of the estimated oil and natural gas reserves we own. Management believes that the presentation of PV - 10, while not a financial measure in accordance with U.S. GAAP, provides useful information to investors because it is widely used by professional analysts and sophisticated investors in evaluating oil and natural gas companies. Because many factors that are unique to each individual company impact the amount of future income taxes estimated to be paid, the use of a pre - tax measure is valuable when comparing companies based on reserves. PV - 10 is not a measure of financial or operating performance under U.S. GAAP. PV - 10 should not be considered as an alternative to the standardized measure as defined under U.S. GAAP. The following table provides a reconciliation of our PV - 10 to our standardized measure: $US millions Total PV - 10: $563.8 Future income taxes: (121.8) 1 Discount of future income taxes at 10% per annum: 36.6 1 Standardized measure: $478.6 1 TransAtlantic Petroleum is not a U.S. domiciled corporation.